UNITED STATES
SECURITIES AND EXCHANGE COMMISSION
Washington, D.C. 20549
FORM N-CSR
CERTIFIED SHAREHOLDER REPORT OF REGISTERED MANAGEMENT
INVESTMENT COMPANIES
Investment Company Act file number | 811-05125 |
| |
| BNY Mellon Variable Investment Fund | |
| (Exact name of Registrant as specified in charter) | |
| | |
| c/o BNY Mellon Investment Adviser, Inc. 240 Greenwich Street New York, New York 10286 | |
| (Address of principal executive offices) (Zip code) | |
| | |
| Bennett A. MacDougall, Esq. 240 Greenwich Street New York, New York 10286 | |
| (Name and address of agent for service) | |
|
Registrant's telephone number, including area code: | (212) 922-6400 |
| |
Date of fiscal year end: | 12/31 | |
Date of reporting period: | 12/31/2019 | |
| | | | | | | |
The following N-CSR relates only to the Registrant's series listed below and does not relate to any series of the Registrant with a different fiscal year end and, therefore, different N-CSR reporting requirements. A separate N-CSR will be filed for any series with a different fiscal year end, as appropriate.
Appreciation Portfolio
Government Money Market Portfolio
Growth and Income Portfolio
International Equity Portfolio
International Value Portfolio
Opportunistic Small Cap Portfolio
Quality Bond Portfolio
FORM N-CSR
Item 1. Reports to Stockholders.
BNY Mellon Variable Investment Fund, Appreciation Portfolio
| |
ANNUAL REPORT December 31, 2019 |

| |
The views expressed in this report reflect those of the portfolio manager(s) only through the end of the period covered and do not necessarily represent the views of BNY Mellon Investment Adviser, Inc. or any other person in the BNY Mellon Investment Adviser, Inc. organization. Any such views are subject to change at any time based upon market or other conditions and BNY Mellon Investment Adviser, Inc. disclaims any responsibility to update such views. These views may not be relied on as investment advice and, because investment decisions for a fund in the BNY Mellon Family of Funds are based on numerous factors, may not be relied on as an indication of trading intent on behalf of any fund in the BNY Mellon Family of Funds. |
| |
Not FDIC-Insured • Not Bank-Guaranteed • May Lose Value |
Contents
THE FUND
FOR MORE INFORMATION
Back Cover
| | | | |
| |
BNY Mellon Variable Investment Fund, Appreciation Portfolio
| | The Fund |
A LETTER FROM THE PRESIDENT OF BNY MELLON INVESTMENT ADVISER, INC.
Dear Shareholder:
We are pleased to present this annual report for BNY Mellon Variable Investment Fund, Appreciation Portfolio (formerly, Dreyfus Variable Investment Fund, Appreciation Portfolio), covering the 12-month period from January 1, 2019 through December 31, 2019. For information about how the fund performed during the reporting period, as well as general market perspectives, we provide a Discussion of Fund Performance on the pages that follow.
In January 2019, a pivot in stance from the U.S. Federal Reserve (the “Fed”) helped stimulate a rebound across equity markets that continued into the second quarter of the year. However, escalating trade tensions disrupted equity markets in May. The dip was short-lived, as markets rose once again in June and July of 2019, when a trade deal appeared more likely and the pace of U.S. economic growth remained steady. Nevertheless, concerns continued to emerge over slowing global growth, resulting in bouts of market volatility in August 2019. Stocks rebounded in September and continued an upward path through most of October 2019, bolstered by central bank policy and consistent consumer spending. The rally generally continued through the end of the period, supported in part by an announcement from President Trump that the first phase of a trade deal with China was in process. U.S. equity markets reached new highs during the final months of the period.
In fixed-income markets, the year began with a recovery from the prior months’ volatility. After the Fed’s supportive statements in January 2019, other developed-market central banks followed suit and reiterated their abilities to buttress flagging growth rates by continuing accommodative policies. The Fed cut rates in July, September and October 2019, for a total 75 basis point reduction in the federal funds rate during the 12 months. Rates across much of the Treasury curve saw a slight increase during the month of November, and the long end of the curve rose in December. The yield curve steepened during the latter portion of the period. However, demand for fixed-income instruments during the year was strong, which helped to support positive bond market returns.
We believe that over the near term, the outlook for the U.S. remains positive, but we will monitor relevant data for any signs of a change. As always, we encourage you to discuss the risks and opportunities in today’s investment environment with your financial advisor.
Thank you for your continued confidence and support.
Sincerely,

Renee LaRoche-Morris
President
BNY Mellon Investment Adviser, Inc.
January 15, 2020
2
DISCUSSION OF FUND PERFORMANCE(Unaudited)
For the period from January 1, 2019 through December 31, 2019, as provided by portfolio managers Catherine P. Crain, Gentry Lee, Christopher Sarofim, Fayez S. Sarofim and Charles Sheedy of Fayez Sarofim& Co., Sub-Investment Adviser
Market and Fund Performance Overview
For the 12-month period ended December 31, 2019, BNY Mellon Variable Investment Fund, Appreciation Portfolio’s (formerly, Dreyfus Variable Investment Fund, Appreciation Portfolio) Initial shares achieved a total return of 36.10%, and its Service shares achieved a total return of 35.78%.1 In comparison, the fund’s benchmark, the S&P 500® Index (the “Index”), produced a total return of 31.46% for the same period.2
U.S. stocks posted strong gains during the reporting period amid sustained economic growth, shifting U.S. Federal Reserve (“Fed”) policy and intensifying trade tensions. The fund outperformed its benchmark, largely due to favorable asset allocation as well as good stock selection in several sectors, including information technology, communication services and industrials.
The Fund’s Investment Approach
The fund seeks long-term capital growth consistent with the preservation of capital. Its secondary goal is current income. To pursue these goals, the fund normally invests at least 80% of its net assets in common stocks. The fund focuses on blue-chip companies with total market capitalizations of more than $5 billion at the time of purchase, including multinational companies. These are established companies that have demonstrated sustained patterns of profitability, strong balance sheets, an expanding global presence and the potential to achieve predictable, above-average earnings growth.
In choosing stocks, we identify economic sectors we believe will expand over the next three to five years or longer. Using fundamental analysis, we then seek companies within these sectors that have proven track records and dominant positions in their industries. The fund employs a “buy-and-hold” investment strategy, which generally has resulted in an annual portfolio turnover rate of below 15%. A low portfolio turnover rate helps reduce the fund’s trading costs and can help limit the distribution of capital gains generated due to portfolio turnover.3
Stocks Surge on Easing Monetary Policy, Steady Economic Growth and Progress on Trade
Positive developments in the ongoing trade disputes, accommodative monetary policy and better-than-expected earnings propelled the markets to new heights during the reporting period, with the Index posting its best annual performance since 2013. Gains were broad, as all eleven sectors delivered positive returns for the year. The information technology, communication services and financial sectors led the way, with information technology delivering an impressive 50% return for the year. Progress in the trade negotiations with China was incremental throughout the year but culminated with the announcement of a “Phase 1” deal in the fourth quarter of 2019, easing tensions between the world’s two largest economies. The U.S. House of Representatives
3
DISCUSSION OF FUND PERFORMANCE(Unaudited) (continued)
approved the new U.S.-Mexico-Canada Trade Agreement, removing trade uncertainty with America’s neighbors. Corporate earnings throughout the year exceeded expectations, providing relief to the markets, and U.S. consumer confidence remained resilient, with record low unemployment, rising wages and a tight labor market. Throughout the year, the Fed lowered the federal funds rate three times to accommodate continued U.S. economic expansion. The year concluded with cautious optimism on the back of these positive developments—a stark reversal from the recession fears that gripped the markets in 2018.
Asset Allocation and Stock Selection Drove Performance
The dual effects of favorable sector allocation and stock selection contributed positively to results. Strategic, underweight positions in the utilities and real estate sectors, in particular, added value to relative results. Within the health care sector, the fund’s relative results also benefited from an underweight allocation, as the sector faced political headwinds. As for stock selection, in the information technology sector, Apple demonstrated growth in the services and wearables categories, while Microsoft’s cloud computing offering continued its momentum with the Pentagon’s JEDI contract win. In the industrial sector, strategic holdings in United Technologies and Canadian Pacific Railway contributed positively to results for the period. Selectively focused stock selection in the overweight allocation to the communication services sector also contributed positively, as Facebook and Alphabet continued to grow their market share in digital advertising. In addition to Apple, Microsoft and Facebook, the largest positive contributors to relative performance included The Estee Lauder Companies and Visa.
On the other hand, the overweight allocation in the consumer staples sector penalized performance relative to the Index. Stock selection in the overweight energy sector also negatively impacted relative results, as the sector struggled with low oil prices throughout the year. The largest detractors to relative results included AbbVie,Fox, The Progressive,Infineon Technologies and Broadridge Financial Solutions.
Industry Leaders Should Benefit from Favorable Conditions
The global outlook has pivoted from pessimism to optimism, as stable global growth, reduced uncertainty and low interest rates continue to create a favorable environment for businesses and consumers alike. While economic growth has slowed in the U.S., synchronized policies around the world to ease monetary conditions helped keep it from falling into recession. Supportive central banks and reduced trade tensions are contributing to a brighter outlook, as the economic expansion enters its eleventh year.
Against this cautiously optimistic backdrop, we believe the markets will reward high-quality companies that can expand market share, grow earnings and provide a degree of defense against market volatility. The fund’s long-practiced investment approach focuses on such companies. Our strategy targets global industry leaders with solid balance sheets and strong pricing power that have the capability to consistently deliver revenue and earnings growth across business cycles. Financial strength and ample free cash flow also enable our portfolio companies to consolidate market share and bolster their competitive positioning over time. Furthermore, we aim to invest with seasoned
4
management teams, who have strong records of returning cash to shareholders and are well-equipped to extend those records in difficult and volatile times, providing a ballast to the portfolio as market conditions change.
January 15, 2020
1 Total return includes reinvestment of dividends and any capital gains paid. Past performance is no guarantee of future results. Share price and investment return fluctuate such that upon redemption, fund shares may be worth more or less than their original cost. The fund’s performance does not reflect the deduction of additional charges and expenses imposed in connection with investing in variable insurance contracts, which will reduce returns.
2 Source: Lipper Inc. — The S&P 500® Index is widely regarded as the best single gauge of large-cap U.S. equities. The index includes 500 leading companies and captures approximately 80% coverage of available market capitalization. Investors cannot invest directly in any index.
3 Achieving tax efficiency is not a part of the fund’s investment objective, and there can be no guarantee that the fund will achieve any particular level of taxable distributions in future years. In periods when the manager has to sell significant amounts of securities (e.g., during periods of significant net redemptions or changes in index components), the fund can be expected to be less tax efficient than during periods of more stable market conditions and asset flows.
Please note: the position in any security highlighted with italicized typeface was sold during the reporting period.
Equities are subject generally to market, market sector, market liquidity, issuer and investment style risks, among other factors, to varying degrees, all of which are more fully described in the fund’s prospectus.
The fund is only available as a funding vehicle under variable life insurance policies or variable annuity contracts issued by insurance companies. Individuals may not purchase shares of the fund directly. A variable annuity is an insurance contract issued by an insurance company that enables investors to accumulate assets on a tax-deferred basis for retirement or other long-term goals. The investment objective and policies of BNY Mellon Variable Investment Fund, Appreciation Portfolio made available through insurance products may be similar to those of other funds managed by BNY Mellon Investment Adviser, Inc. However, the investment results of the fund may be higher or lower than, and may not be comparable to, those of any other BNY Mellon fund.
5
FUND PERFORMANCE(Unaudited)

Comparison of change in value of a $10,000 investment in Initial shares and Service shares of BNY Mellon Variable Investment Fund, Appreciation Portfolio with a hypothetical investment of $10,000 in the S&P 500® Index (the “Index”)
† Source: Lipper Inc.
Past performance is not predictive of future performance. The fund’s performance does not reflect the deduction of additional charges and expenses imposed in connection with investing in variable insurance contracts which will reduce returns.
The above graph compares a hypothetical investment of $10,000 made in each Initial and Service shares of BNY Mellon Variable Investment Fund, Appreciation Portfolio on 12/31/09 to a hypothetical investment of $10,000 made in the Index on that date.
The fund’s performance shown in the line graph above takes into account all applicable fund fees and expenses for Initial and Service shares. The Index is widely regarded as the best single gauge of large-cap U.S. equities. The Index includes 500 leading companies and captures approximately 80% coverage of available market capitalization. Unlike a mutual fund, the Index is not subject to charges, fees and other expenses. Investors cannot invest directly in any index. Further information relating to fund performance, including expense reimbursements, if applicable, is contained in the Financial Highlights section of the prospectus and elsewhere in this report.
| | | | |
Average Annual Total Returns as of 12/31/19 |
| 1 Year | 5 Years | 10 Years |
Initial shares | 36.10% | 11.18% | 11.93% |
Service shares | 35.78% | 10.90% | 11.65% |
S&P 500® Index | 31.46% | 11.69% | 13.55% |
The performance data quoted represents past performance, which is no guarantee of future results. Share price and investment return fluctuate and an investor’s shares may be worth more or less than original cost upon redemption. Current performance may be lower or higher than the performance quoted. Go towww.bnymellonim.com/us for the fund’s most recent month-end returns.
The fund’s Initial shares are not subject to a Rule 12b-1 fee. The fund’s Service shares are subject to a 0.25% annual Rule 12b-1 fee. All dividends and capital gain distributions are reinvested.
The fund’s performance shown in the graph and table does not reflect the deduction of taxes that a shareholder would pay on fund distributions or the redemption of fund shares.
6
UNDERSTANDING YOUR FUND’S EXPENSES(Unaudited)
As a mutual fund investor, you pay ongoing expenses, such as management fees and other expenses. Using the information below, you can estimate how these expenses affect your investment and compare them with the expenses of other funds. You also may pay one-time transaction expenses, including sales charges (loads), redemption fees and expenses associated with variable annuity or insurance contracts, which are not shown in this section and would have resulted in higher total expenses. For more information, see your fund’s prospectus or talk to your financial adviser.
Review your fund’s expenses
The table below shows the expenses you would have paid on a $1,000 investment in BNY Mellon Variable Investment Fund, Appreciation Portfolio from July 1, 2019 to December 31, 2019. It also shows how much a $1,000 investment would be worth at the close of the period, assuming actual returns and expenses.
| | | | | |
Expenses and Value of a $1,000 Investment | |
Assume actual returns for the six months ended December 31, 2019 | |
| | | | |
| | Initial Shares | Service Shares | |
Expense paid per $1,000† | $4.33 | $5.66 | |
Ending value (after expenses) | $1,121.60 | $1,120.20 | |
COMPARING YOUR FUND’S EXPENSES
WITH THOSE OF OTHER FUNDS(Unaudited)
Using the SEC’s method to compare expenses
The Securities and Exchange Commission (“SEC”) has established guidelines to help investors assess fund expenses. Per these guidelines, the table below shows your fund’s expenses based on a $1,000 investment, assuming a hypothetical 5% annualized return. You can use this information to compare the ongoing expenses (but not transaction expenses or total cost) of investing in the fund with those of other funds. All mutual fund shareholder reports will provide this information to help you make this comparison. Please note that you cannot use this information to estimate your actual ending account balance and expenses paid during the period.
| | | | | |
Expenses and Value of a $1,000 Investment | |
Assuming a hypothetical 5% annualized return for the six months ended December 31, 2019 | |
| | | | |
| | Initial Shares | Service Shares | |
Expense paid per $1,000† | $4.13 | $5.40 | |
Ending value (after expenses) | $1,021.12 | $1,019.86 | |
† Expenses are equal to the fund’s annualized expense ratio of .81% for Initial Shares and 1.06% for Service Shares, multiplied by the average account value over the period, multiplied by 184/365 (to reflect the one-half year period). |
7
STATEMENT OF INVESTMENTS
December 31, 2019
| | | | | | | | |
| |
Description | | | | Shares | | Value ($) | |
Common Stocks - 99.6% | | | | | |
Banks - 3.7% | | | | | |
JPMorgan Chase & Co. | | | | 105,475 | | 14,703,215 | |
Capital Goods - 1.7% | | | | | |
United Technologies | | | | 46,750 | | 7,001,280 | |
Commercial & Professional Services - .9% | | | | | |
Verisk Analytics | | | | 23,440 | | 3,500,530 | |
Consumer Durables & Apparel - 3.6% | | | | | |
Hermes International | | | | 2,677 | | 2,000,459 | |
LVMH Moet Hennessy Louis Vuitton | | | | 15,200 | | 7,062,044 | |
NIKE, Cl. B | | | | 53,165 | | 5,386,146 | |
| | | | | 14,448,649 | |
Consumer Services - 1.6% | | | | | |
McDonald's | | | | 33,150 | | 6,550,772 | |
Diversified Financials - 7.4% | | | | | |
American Express | | | | 58,475 | | 7,279,553 | |
BlackRock | | | | 17,975 | | 9,036,032 | |
Intercontinental Exchange | | | | 45,275 | | 4,190,201 | |
S&P Global | | | | 33,375 | | 9,113,044 | |
| | | | | 29,618,830 | |
Energy - 5.3% | | | | | |
Chevron | | | | 71,875 | | 8,661,656 | |
ConocoPhillips | | | | 65,400 | | 4,252,962 | |
Exxon Mobil | | | | 121,114 | | 8,451,335 | |
| | | | | 21,365,953 | |
Food, Beverage & Tobacco - 10.0% | | | | | |
Altria Group | | | | 123,025 | | 6,140,178 | |
Nestle, ADR | | | | 65,800 | | 7,123,508 | |
PepsiCo | | | | 53,625 | | 7,328,929 | |
Philip Morris International | | | | 113,650 | | 9,670,478 | |
The Coca-Cola Company | | | | 177,825 | | 9,842,614 | |
| | | | | 40,105,707 | |
Health Care Equipment & Services - 6.1% | | | | | |
Abbott Laboratories | | | | 86,900 | | 7,548,134 | |
Intuitive Surgical | | | | 13,950 | a | 8,246,542 | |
UnitedHealth Group | | | | 29,875 | | 8,782,652 | |
| | | | | 24,577,328 | |
Household & Personal Products - 3.2% | | | | | |
The Estee Lauder Companies, Cl. A | | | | 61,850 | | 12,774,499 | |
Insurance - 2.5% | | | | | |
Chubb | | | | 38,150 | | 5,938,429 | |
The Progressive | | | | 56,000 | | 4,053,840 | |
| | | | | 9,992,269 | |
8
| | | | | | | | |
| |
Description | | | | Shares | | Value ($) | |
Common Stocks - 99.6% (continued) | | | | | |
Materials - 3.4% | | | | | |
Air Products & Chemicals | | | | 9,725 | | 2,285,278 | |
Linde | | | | 32,325 | | 6,881,993 | |
The Sherwin-Williams Company | | | | 7,975 | | 4,653,732 | |
| | | | | 13,821,003 | |
Media & Entertainment - 14.0% | | | | | |
Alphabet, Cl. C | | | | 12,744 | a | 17,038,983 | |
Comcast, Cl. A | | | | 236,890 | | 10,652,943 | |
Facebook, Cl. A | | | | 103,060 | a | 21,153,065 | |
The Walt Disney Company | | | | 51,905 | | 7,507,020 | |
| | | | | 56,352,011 | |
Pharmaceuticals Biotechnology & Life Sciences - 4.6% | | | | | |
AbbVie | | | | 67,325 | | 5,960,955 | |
Novo Nordisk, ADR | | | | 118,825 | b | 6,877,591 | |
Roche Holding, ADR | | | | 142,775 | b | 5,805,232 | |
| | | | | 18,643,778 | |
Retailing - 3.4% | | | | | |
Amazon.com | | | | 6,400 | a | 11,826,176 | |
Booking Holdings | | | | 1,000 | a | 2,053,730 | |
| | | | | 13,879,906 | |
Semiconductors & Semiconductor Equipment - 5.5% | | | | | |
ASML Holding | | | | 30,500 | b | 9,026,170 | |
Texas Instruments | | | | 102,650 | | 13,168,968 | |
| | | | | 22,195,138 | |
Software & Services - 13.0% | | | | | |
Automatic Data Processing | | | | 15,815 | | 2,696,458 | |
Broadridge Financial Solutions | | | | 16,000 | | 1,976,640 | |
Mastercard, Cl. A | | | | 5,000 | | 1,492,950 | |
Microsoft | | | | 189,235 | | 29,842,359 | |
Visa, Cl. A | | | | 87,100 | b | 16,366,090 | |
| | | | | 52,374,497 | |
Technology Hardware & Equipment - 6.2% | | | | | |
Apple | | | | 84,950 | | 24,945,567 | |
Transportation - 3.5% | | | | | |
Canadian Pacific Railway | | | | 24,250 | | 6,182,538 | |
Union Pacific | | | | 42,750 | | 7,728,772 | |
| | | | | 13,911,310 | |
Total Investments(cost $153,125,537) | | 99.6% | | 400,762,242 | |
Cash and Receivables (Net) | | .4% | | 1,473,276 | |
Net Assets | | 100.0% | | 402,235,518 | |
ADR—American Depository Receipt
aNon-income producing security.
bSecurity, or portion thereof, on loan. At December 31, 2019, the value of the fund’s securities on loan was $29,284,604 and the value of the collateral was $29,837,007, consisting of U.S. Government & Agency securities.
9
STATEMENT OF INVESTMENTS (continued)
| | |
Portfolio Summary (Unaudited)† | Value (%) |
Information Technology | 24.7 |
Communication Services | 14.0 |
Financials | 13.5 |
Consumer Staples | 13.2 |
Health Care | 10.7 |
Consumer Discretionary | 8.7 |
Industrials | 6.1 |
Energy | 5.3 |
Materials | 3.4 |
| | 99.6 |
† Based on net assets.
See notes to financial statements.
10
STATEMENT OF INVESTMENTS IN AFFILIATED ISSUERS
| | | | | | | |
Investment Companies | Value
12/31/18($) | Purchases($) | Sales ($) | Value
12/31/19($) | Net
Assets(%) | Dividends/
Distributions($) |
Registered
Investment
Companies; | | | | |
Dreyfus Institutional Preferred Government Plus Money Market Fund | 1,633,898 | 34,971,488 | 36,605,386 | - | - | 26,898 |
Investment
of Cash
Collateral
for Securities
Loaned; | | |
Dreyfus Institutional Preferred Government Plus Money Market Fund | 2,043,845 | 42,121,780 | 44,165,625 | - | - | - |
Total | 3,677,743 | 77,093,268 | 80,771,011 | - | - | 26,898 |
See notes to financial statements.
11
STATEMENT OF ASSETS AND LIABILITIES
December 31, 2019
| | | | | | | |
| | | | | | |
| | | Cost | | Value | |
Assets ($): | | | | |
Investments in securities—See Statement of Investments
(including securities on loan, valued at $29,284,604)
—Note 1(c): | 153,125,537 | | 400,762,242 | |
Cash denominated in foreign currency | | | 31,472 | | 31,883 | |
Receivable for investment securities sold | | 2,858,337 | |
Dividends, interest and securities lending income receivable | | 424,909 | |
Tax reclaim receivable | | 236,330 | |
Receivable for shares of Beneficial Interest subscribed | | 24,753 | |
Prepaid expenses | | | | | 6,022 | |
| | | | | 404,344,476 | |
Liabilities ($): | | | | |
Due to BNY Mellon Investment Adviser, Inc. and affiliates—Note 3(b) | | 216,139 | |
Due to Fayez Sarofim & Co. | | | | | 73,731 | |
Cash overdraft due to Custodian | | | | | 468,798 | |
Payable for investment securities purchased | | 1,030,494 | |
Payable for shares of Beneficial Interest redeemed | | 250,417 | |
Trustees’ fees and expenses payable | | 2,107 | |
Other accrued expenses | | | | | 67,272 | |
| | | | | 2,108,958 | |
Net Assets ($) | | | 402,235,518 | |
Composition of Net Assets ($): | | | | |
Paid-in capital | | | | | 122,253,381 | |
Total distributable earnings (loss) | | | | | 279,982,137 | |
Net Assets ($) | | | 402,235,518 | |
| | | | |
Net Asset Value Per Share | Initial Shares | Service Shares | |
Net Assets ($) | 273,831,591 | 128,403,927 | |
Shares Outstanding | 6,403,793 | 3,036,258 | |
Net Asset Value Per Share ($) | 42.76 | 42.29 | |
| | | |
See notes to financial statements. | | | |
12
STATEMENT OF OPERATIONS
Year Ended December 31, 2019
| | | | | | | |
| | | | | | |
| | | | | | |
Investment Income ($): | | | | |
Income: | | | | |
Cash dividends (net of $176,578 foreign taxes withheld at source): | |
Unaffiliated issuers | | | 7,156,809 | |
Affiliated issuers | | | 26,898 | |
Income from securities lending—Note 1(c) | | | 28,748 | |
Total Income | | | 7,212,455 | |
Expenses: | | | | |
Investment advisory fee—Note 3(a) | | | 2,015,718 | |
Sub-investment advisory fee—Note 3(a) | | | 823,322 | |
Distribution fees—Note 3(b) | | | 309,045 | |
Professional fees | | | 90,642 | |
Prospectus and shareholders’ reports | | | 38,968 | |
Trustees’ fees and expenses—Note 3(c) | | | 35,046 | |
Custodian fees—Note 3(b) | | | 16,357 | |
Chief Compliance Officer fees—Note 3(b) | | | 11,793 | |
Loan commitment fees—Note 2 | | | 8,978 | |
Shareholder servicing costs—Note 3(b) | | | 2,067 | |
Registration fees | | | 55 | |
Miscellaneous | | | 13,511 | |
Total Expenses | | | 3,365,502 | |
Investment Income—Net | | | 3,846,953 | |
Realized and Unrealized Gain (Loss) on Investments—Note 4 ($): | | |
Net realized gain (loss) on investments and foreign currency transactions | 32,180,579 | |
Net change in unrealized appreciation (depreciation) on investments
and foreign currency transactions | 78,909,309 | |
Net Realized and Unrealized Gain (Loss) on Investments | | | 111,089,888 | |
Net Increase in Net Assets Resulting from Operations | | 114,936,841 | |
| | | | | | |
See notes to financial statements. | | | | | |
13
STATEMENT OF CHANGES IN NET ASSETS
| | | | | | | | | | |
| | | | Year Ended December 31, |
| | | | 2019 | | 2018 | |
Operations ($): | | | | | | | | |
Investment income—net | | | 3,846,953 | | | | 4,777,397 | |
Net realized gain (loss) on investments | | 32,180,579 | | | | 42,632,807 | |
Net change in unrealized appreciation
(depreciation) on investments | | 78,909,309 | | | | (71,694,542) | |
Net Increase (Decrease) in Net Assets
Resulting from Operations | 114,936,841 | | | | (24,284,338) | |
Distributions ($): | |
Distributions to shareholders: | | | | | | | | |
Initial Shares | | | (31,343,479) | | | | (36,501,235) | |
Service Shares | | | (15,388,567) | | | | (18,803,539) | |
Total Distributions | | | (46,732,046) | | | | (55,304,774) | |
Beneficial Interest Transactions ($): | |
Net proceeds from shares sold: | | | | | | | | |
Initial Shares | | | 5,039,499 | | | | 6,205,656 | |
Service Shares | | | 8,181,769 | | | | 7,827,922 | |
Distributions reinvested: | | | | | | | | |
Initial Shares | | | 31,343,479 | | | | 36,501,235 | |
Service Shares | | | 15,388,567 | | | | 18,803,539 | |
Cost of shares redeemed: | | | | | | | | |
Initial Shares | | | (34,228,478) | | | | (36,212,750) | |
Service Shares | | | (29,712,974) | | | | (32,792,813) | |
Increase (Decrease) in Net Assets
from Beneficial Interest Transactions | (3,988,138) | | | | 332,789 | |
Total Increase (Decrease) in Net Assets | 64,216,657 | | | | (79,256,323) | |
Net Assets ($): | |
Beginning of Period | | | 338,018,861 | | | | 417,275,184 | |
End of Period | | | 402,235,518 | | | | 338,018,861 | |
Capital Share Transactions (Shares): | |
Initial Shares | | | | | | | | |
Shares sold | | | 129,829 | | | | 151,190 | |
Shares issued for distributions reinvested | | | 858,978 | | | | 957,001 | |
Shares redeemed | | | (880,695) | | | | (891,681) | |
Net Increase (Decrease) in Shares Outstanding | 108,112 | | | | 216,510 | |
Service Shares | | | | | | | | |
Shares sold | | | 216,261 | | | | 194,324 | |
Shares issued for distributions reinvested | | | 427,087 | | | | 497,903 | |
Shares redeemed | | | (773,381) | | | | (807,266) | |
Net Increase (Decrease) in Shares Outstanding | (130,033) | | | | (115,039) | |
| | | | | | | | | |
See notes to financial statements. | | | | | | | | |
14
FINANCIAL HIGHLIGHTS
The following tables describe the performance for each share class for the fiscal periods indicated. All information (except portfolio turnover rate) reflects financial results for a single fund share. Total return shows how much your investment in the fund would have increased (or decreased) during each period, assuming you had reinvested all dividends and distributions. The fund’s total returns do not reflect expenses associated with variable annuity or insurance contracts. These figures have been derived from the fund’s financial statements.
| | | | | | | | | | | | | |
| | | | | | | |
| | | |
Initial Shares | | | Year Ended December 31, |
| | | 2019 | 2018 | 2017 | 2016 | 2015 |
Per Share Data ($): | | | | | | |
Net asset value, beginning of period | | 35.84 | 44.71 | 41.01 | 45.23 | 49.51 |
Investment Operations: | | | | | | |
Investment income—neta | | .43 | .53 | .56 | .68 | .80 |
Net realized and unrealized
gain (loss) on investments | | 11.58 | (3.27) | 9.55 | 2.48 | (1.97) |
Total from Investment Operations | | 12.01 | (2.74) | 10.11 | 3.16 | (1.17) |
Distributions: | | | | | | |
Dividends from
investment income—net | | (.46) | (.52) | (.57) | (.69) | (.81) |
Dividends from net realized
gain on investments | | (4.63) | (5.61) | (5.84) | (6.69) | (2.30) |
Total Distributions | | (5.09) | (6.13) | (6.41) | (7.38) | (3.11) |
Net asset value, end of period | | 42.76 | 35.84 | 44.71 | 41.01 | 45.23 |
Total Return (%) | | 36.10 | (6.86) | 27.33 | 7.91 | (2.47) |
Ratios/Supplemental Data (%): | | | | | | |
Ratio of total expenses
to average net assets | | .81 | .81 | .81 | .82 | .80 |
Ratio of net expenses
to average net assets | | .81 | .81 | .81 | .82 | .80 |
Ratio of net investment income
to average net assets | | 1.10 | 1.30 | 1.35 | 1.64 | 1.70 |
Portfolio Turnover Rate | | 6.71 | 6.50 | 3.97 | 4.19 | 11.97 |
Net Assets, end of period ($ x 1,000) | | 273,832 | 225,631 | 271,790 | 238,340 | 256,828 |
a Based on average shares outstanding.
See notes to financial statements.
15
FINANCIAL HIGHLIGHTS (continued)
| | | | | | | | | | | |
| | | | | | | |
| | | |
Service Shares | | | Year Ended December 31, |
| | | 2019 | 2018 | 2017 | 2016 | 2015 |
Per Share Data ($): | | | | | | |
Net asset value, beginning of period | | 35.49 | 44.34 | 40.72 | 44.96 | 49.23 |
Investment Operations: | | | | | | |
Investment income—neta | | .33 | .42 | .46 | .57 | .68 |
Net realized and unrealized
gain (loss) on investments | | 11.46 | (3.25) | 9.46 | 2.46 | (1.96) |
Total from Investment Operations | | 11.79 | (2.83) | 9.92 | 3.03 | (1.28) |
Distributions: | | | | | | |
Dividends from
investment income—net | | (.36) | (.41) | (.46) | (.58) | (.69) |
Dividends from net realized
gain on investments | | (4.63) | (5.61) | (5.84) | (6.69) | (2.30) |
Total Distributions | | (4.99) | (6.02) | (6.30) | (7.27) | (2.99) |
Net asset value, end of period | | 42.29 | 35.49 | 44.34 | 40.72 | 44.96 |
Total Return (%) | | 35.78 | (7.10) | 27.00 | 7.64 | (2.72) |
Ratios/Supplemental Data (%): | | | | | | |
Ratio of total expenses
to average net assets | | 1.06 | 1.06 | 1.06 | 1.07 | 1.05 |
Ratio of net expenses
to average net assets | | 1.06 | 1.06 | 1.06 | 1.07 | 1.05 |
Ratio of net investment income
to average net assets | | .85 | 1.05 | 1.11 | 1.41 | 1.45 |
Portfolio Turnover Rate | | 6.71 | 6.50 | 3.97 | 4.19 | 11.97 |
Net Assets, end of period ($ x 1,000) | | 128,404 | 112,387 | 145,485 | 161,440 | 231,421 |
a Based on average shares outstanding.
See notes to financial statements.
16
NOTES TO FINANCIAL STATEMENTS
NOTE 1—Significant Accounting Policies:
Appreciation Portfolio (the “fund”) is a separate diversified series of BNY Mellon Variable Investment Fund (the “Company”), which is registered under the Investment Company Act of 1940, as amended (the “Act”), as an open-end management investment company and operates as a series company currently offering seven series, including the fund. The fund is only offered to separate accounts established by insurance companies to fund variable annuity contracts and variable life insurance policies. The fund’s investment objective is to seek long-term capital growth consistent with the preservation of capital. BNY Mellon Investment Adviser, Inc. (the “Adviser”), a wholly-owned subsidiary of The Bank of New York Mellon Corporation (“BNY Mellon”), serves as the fund’s investment adviser. Fayez Sarofim & Co. (the “Sub-Adviser”), serves as the fund’s sub–investment adviser.
Effective June 3, 2019, the Company changed its name from Dreyfus Variable Investment Fund to BNY Mellon Variable Investment Fund. In addition, The Dreyfus Corporation, the fund’s investment adviser, changed its name to “BNY Mellon Investment Adviser, Inc.”, MBSC Securities Corporation, the fund’s distributor, changed its name to “BNY Mellon Securities Corporation” and Dreyfus Transfer, Inc., the fund’s transfer agent, changed its name to “BNY Mellon Transfer, Inc.”
BNY Mellon Securities Corporation (the “Distributor”), a wholly-owned subsidiary of the Adviser, is the distributor of the fund’s shares, which are sold without a sales charge. The fund is authorized to issue an unlimited number of $.001 par value shares of Beneficial Interest in each of the following classes of shares: Initial and Service. Each class of shares has identical rights and privileges, except with respect to the Distribution Plan, and the expenses borne by each class, the allocation of certain transfer agency costs, and certain voting rights. Income, expenses (other than expenses attributable to a specific class), and realized and unrealized gains or losses on investments are allocated to each class of shares based on its relative net assets.
The Company accounts separately for the assets, liabilities and operations of each series. Expenses directly attributable to each series are charged to that series’ operations; expenses which are applicable to all series are allocated among them on a pro rata basis.
The Financial Accounting Standards Board (“FASB”) Accounting Standards Codification (“ASC”) is the exclusive reference of authoritative U.S. generally accepted accounting principles (“GAAP”) recognized by the FASB to be applied by nongovernmental entities. Rules and interpretive
17
NOTES TO FINANCIAL STATEMENTS(continued)
releases of the Securities and Exchange Commission (“SEC”) under authority of federal laws are also sources of authoritative GAAP for SEC registrants. The fund is an investment company and applies the accounting and reporting guidance of the FASB ASC Topic 946 Financial Services-Investment Companies. The fund’s financial statements are prepared in accordance with GAAP, which may require the use of management estimates and assumptions. Actual results could differ from those estimates.
The Companyenters into contracts that contain a variety of indemnifications. The fund’s maximum exposure under these arrangements is unknown. The fund does not anticipate recognizing any loss related to these arrangements.
(a) Portfolio valuation: The fair value of a financial instrument is the amount that would be received to sell an asset or paid to transfer a liability in an orderly transaction between market participants at the measurement date (i.e., the exit price). GAAP establishes a fair value hierarchy that prioritizes the inputs of valuation techniques used to measure fair value. This hierarchy gives the highest priority to unadjusted quoted prices in active markets for identical assets or liabilities (Level 1 measurements) and the lowest priority to unobservable inputs (Level 3 measurements).
Additionally, GAAP provides guidance on determining whether the volume and activity in a market has decreased significantly and whether such a decrease in activity results in transactions that are not orderly. GAAP requires enhanced disclosures around valuation inputs and techniques used during annual and interim periods.
Various inputs are used in determining the value of the fund’s investments relating to fair value measurements. These inputs are summarized in the three broad levels listed below:
Level 1—unadjusted quoted prices in active markets for identical investments.
Level 2—other significant observable inputs (including quoted prices for similar investments, interest rates, prepayment speeds, credit risk, etc.).
Level 3—significant unobservable inputs (including the fund’s own assumptions in determining the fair value of investments).
The inputs or methodology used for valuing securities are not necessarily an indication of the risk associated with investing in those securities.
18
Changes in valuation techniques may result in transfers in or out of an assigned level within the disclosure hierarchy. Valuation techniques used to value the fund’s investments are as follows:
Investments in equity securities are valued at the last sales price on the securities exchange or national securities market on which such securities are primarily traded. Securities listed on the National Market System for which market quotations are available are valued at the official closing price or, if there is no official closing price that day, at the last sales price. For open short positions, asked prices are used for valuation purposes. Bid price is used when no asked price is available. Registered investment companies that are not traded on an exchange are valued at their net asset value. All of the preceding securities are generally categorized within Level 1 of the fair value hierarchy.
Securities not listed on an exchange or the national securities market, or securities for which there were no transactions, are valued at the average of the most recent bid and asked prices. These securities are generally categorized within Level 2 of the fair value hierarchy.
Fair valuing of securities may be determined with the assistance of a pricing service using calculations based on indices of domestic securities and other appropriate indicators, such as prices of relevant ADRs and futures. Utilizing these techniques may result in transfers between Level 1 and Level 2 of the fair value hierarchy.
When market quotations or official closing prices are not readily available, or are determined not to accurately reflect fair value, such as when the value of a security has been significantly affected by events after the close of the exchange or market on which the security is principally traded (for example, a foreign exchange or market), but before the fund calculates its net asset value, the fund may value these investments at fair value as determined in accordance with the procedures approved by the Company’s Board of Trustees (the “Board”). Certain factors may be considered when fair valuing investments such as: fundamental analytical data, the nature and duration of restrictions on disposition, an evaluation of the forces that influence the market in which the securities are purchased and sold, and public trading in similar securities of the issuer or comparable issuers. These securities are either categorized within Level 2 or 3 of the fair value hierarchy depending on the relevant inputs used.
For restricted securities where observable inputs are limited, assumptions about market activity and risk are used and such securities are generally categorized within Level 3 of the fair value hierarchy.
19
NOTES TO FINANCIAL STATEMENTS(continued)
Investments denominated in foreign currencies are translated to U.S. dollars at the prevailing rates of exchange.
The following is a summary of the inputs used as of December 31, 2019in valuing the fund’s investments:
| | | | | | |
| | Level 1 -
Unadjusted
Quoted Prices | Level 2 - Other
Significant
Observable Inputs | Level 3 –
Significant
Unobservable
Inputs | Total |
Assets ($) | | | |
Investments in Securities:† | | | |
Equity Securities - Common Stocks | 400,762,242 | - | - | 400,762,242 |
† See Statement of Investments for additional detailed categorizations, if any.
(b) Foreign currency transactions: The fund does not isolate that portion of the results of operations resulting from changes in foreign exchange rates on investments from the fluctuations arising from changes in the market prices of securities held. Such fluctuations are included with the net realized and unrealized gain or loss on investments.
Net realized foreign exchange gains or losses arise from sales of foreign currencies, currency gains or losses realized on securities transactions between trade and settlement date, and the difference between the amounts of dividends, interest and foreign withholding taxes recorded on the fund’s books and the U.S. dollar equivalent of the amounts actually received or paid. Net unrealized foreign exchange gains and losses arise from changes in the value of assets and liabilities other than investments resulting from changes in exchange rates. Foreign currency gains and losses on foreign currency transactions are also included with net realized and unrealized gain or loss on investments.
(c)Securities transactions and investment income: Securities transactions are recorded on a trade date basis. Realized gains and losses from securities transactions are recorded on the identified cost basis. Dividend income is recognized on the ex-dividend date and interest income, including, where applicable, accretion of discount and amortization of premium on investments, is recognized on the accrual basis.
Pursuant to a securities lending agreement with The Bank of New York Mellon, a subsidiary of BNY Mellon and an affiliate of the Adviser, the fund may lend securities to qualified institutions. It is the fund’s policy that, at origination, all loans are secured by collateral of at least 102% of the value of U.S. securities loaned and 105% of the value of foreign
20
securities loaned. Collateral equivalent to at least 100% of the market value of securities on loan is maintained at all times. Collateral is either in the form of cash, which can be invested in certain money market mutual funds managed by the Adviser, or U.S. Government and Agency securities. The fund is entitled to receive all dividends, interest and distributions on securities loaned, in addition to income earned as a result of the lending transaction. Should a borrower fail to return the securities in a timely manner, The Bank of New York Mellon is required to replace the securities for the benefit of the fund or credit the fund with the market value of the unreturned securities and is subrogated to the fund’s rights against the borrower and the collateral. Additionally, the contractual maturity of security lending transactions are on an overnight and continuous basis. During the period ended December 31, 2019, The Bank of New York Mellon earned $5,744 from the lending of the fund’s portfolio securities, pursuant to the securities lending agreement.
(d) Affiliated issuers: Investments in other investment companies advised by the Adviser are considered “affiliated” under the Act.
(e) Dividends and distributions to shareholders:Dividends and distributions are recorded on the ex-dividend date. Dividends from investment income-net are normally declared and paid quarterly. Dividends from net realized capital gains, if any, are normally declared and paid annually, but the fund may make distributions on a more frequent basis to comply with the distribution requirements of the Internal Revenue Code of 1986, as amended (the “Code”). To the extent that net realized capital gains can be offset by capital loss carryovers, it is the policy of the fund not to distribute such gains. Income and capital gain distributions are determined in accordance with income tax regulations, which may differ from GAAP.
(f) Federal income taxes: It is the policy of the fund to continue to qualify as a regulated investment company, if such qualification is in the best interests of its shareholders, by complying with the applicable provisions of the Code, and to make distributions of taxable income and net realized capital gain sufficient to relieve it from substantially all federal income and excise taxes.
As of and during the period ended December 31, 2019, the fund did not have any liabilities for any uncertain tax positions. The fund recognizes interest and penalties, if any, related to uncertain tax positions as income tax expense in the Statement of Operations. During the period ended December 31, 2019, the fund did not incur any interest or penalties.
21
NOTES TO FINANCIAL STATEMENTS(continued)
Each tax year in the four-year period ended December 31, 2019 remains subject to examination by the Internal Revenue Service and state taxing authorities.
At December 31, 2019, the components of accumulated earnings on a tax basis were as follows: undistributed ordinary income $232,424, undistributed capital gains $32,170,850 and unrealized appreciation $247,578,863.
The tax character of distributions paid to shareholders during the fiscal periods ended December 31, 2019 and December 31, 2018 were as follows: ordinary income $4,291,330 and $4,703,453, and long-term capital gains $42,440,716 and $50,601,321, respectively.
(g) New Accounting Pronouncements: Effective June 1, 2019, the fund adopted Accounting Standards Update 2018-13, Fair Value Measurement (Topic 820): Disclosure Framework—Changes to the Disclosure Requirements for Fair Value Measurement (“ASU 2018-13”). The update provides guidance that eliminates, adds and modifies certain disclosure requirements for fair value measurements. The adoption of ASU 2018-13 had no impact on the operations of the fund for the period ended December 31, 2019.
NOTE 2—Bank Lines of Credit:
The fund participates with other long-term open-end funds managed by the Adviser in a $1.030 billion unsecured credit facility led by Citibank, N.A. (the “Citibank Credit Facility”) and a $300 million unsecured credit facility provided by The Bank of New York Mellon (the “BNYM Credit Facility”), each to be utilized primarily for temporary or emergency purposes, including the financing of redemptions (each, a “Facility”). The Citibank Credit Facility is available in two tranches: (i) Tranche A is in an amount equal to $830 million and is available to all long-term open-ended funds, including the fund, and (ii) Tranche B is in amount equal to $200 million and is available only to BNY Mellon Floating Rate Income Fund, a series of BNY Mellon Investment Funds IV, Inc. In connection therewith, the fund has agreed to pay its pro rata portion of commitment fees for Tranche A of the Citibank Credit Facility and the BNYM Credit Facility. Interest is charged to the fund based on rates determined pursuant to the terms of the respective Facility at the time of borrowing. During the period ended December 31, 2019, the fund did not borrow under the Facilities.
22
NOTE 3—Investment Advisory Fee, Sub-Investment Advisory Fee and Other Transactions with Affiliates:
(a)Pursuant to an investment advisory agreement with the Adviser, the investment advisory fee is computed at the annual rate of .5325% of the value of the fund’s average daily net assets. Pursuant to a sub-investment advisory agreement with the Sub-Adviser, the fund pays the Sub-Adviser a monthly sub-investment advisory fee at the annual rate of .2175% of the value of the fund’s average daily net assets. Both fees are payable monthly.
(b)Under the Distribution Plan adopted pursuant to Rule 12b-1 under the Act, Service shares pay the Distributor for distributing its shares, for servicing and/or maintaining Service shares’ shareholder accounts and for advertising and marketing for Service shares. The Distribution Plan provides for payments to be made at an annual rate of .25% of the value of the Service shares’ average daily net assets. The Distributor may make payments to Participating Insurance Companies and to brokers and dealers acting as principal underwriter for their variable insurance products. The fees payable under the Distribution Plan are payable without regard to actual expenses incurred. During the period ended December 31, 2019,Service shares were charged $309,045 pursuant to the Distribution Plan.
The fund has an arrangement with the transfer agent whereby the fund may receive earnings credits when positive cash balances are maintained, which are used to offset transfer agency fees. The fund had an arrangement with the custodian to receive earnings credits when positive cash balances were maintained, which were used to offset custody fees. Effective February 1, 2019, the arrangement with the custodian changed whereby the fund will no longer receive earnings credits to offset its custody fees and will receive interest income or overdraft fees going forward. For financial reporting purposes, the fund includes net earnings credits, if any, as an expense offset in the Statement of Operations.
The fund compensates BNY Mellon Transfer, Inc., a wholly-owned subsidiary of the Adviser, under a transfer agency agreement for providing transfer agency and cash management services for the fund. The majority of transfer agency fees are comprised of amounts paid on a per account basis, while cash management fees are related to fund subscriptions and redemptions. During the period ended December 31, 2019, the fund was charged $1,777 for transfer agency services. These fees are included in Shareholder servicing costs in the Statement of Operations.
The fund compensates The Bank of New York Mellon under a custody agreement for providing custodial services for the fund. These fees are determined based on net assets, geographic region and transaction activity.
23
NOTES TO FINANCIAL STATEMENTS(continued)
During the period ended December 31, 2019, the fund was charged $16,357 pursuant to the custody agreement.
During the period ended December 31, 2019, the fund was charged $11,793 for services performed by the Chief Compliance Officer and his staff. These fees are included in Chief Compliance Officer fees in the Statement of Operations.
The components of “Due to BNY Mellon Investment Adviser, Inc. and affiliates” in the Statement of Assets and Liabilities consist of: investment advisory fees of $180,513, Distribution Plan fees of $27,193, custodian fees of $4,800, Chief Compliance Officer fees of $3,261 and transfer agency fees of $372.
(c) Each Board member also serves as a Board member of other funds in the BNY Mellon Family of Funds complex. Annual retainer fees and attendance fees are allocated to each fund based on net assets.
NOTE 4—Securities Transactions:
The aggregate amount of purchases and sales of investment securities, excluding short-term securities, during the period ended December 31, 2019, amounted to $25,209,584 and $71,357,433, respectively.
At December 31, 2019, the cost of investments for federal income tax purposes was $153,182,772; accordingly, accumulated net unrealized appreciation on investments was $247,579,470, consisting of $247,794,427 gross unrealized appreciation and $214,957 gross unrealized depreciation.
24
REPORT OF INDEPENDENT REGISTERED PUBLIC ACCOUNTING FIRM
To the Shareholders and the Board of Trustees of Appreciation Portfolio
Opinion on the Financial Statements
We have audited the accompanying statement of assets and liabilities of Appreciation Portfolio (the “Fund”) (one of the funds constituting BNY Mellon Variable Investment Fund), including the statements of investments and investments in affiliated issuers, as of December 31, 2019, and the related statement of operations for the year then ended, the statements of changes in net assets for each of the two years in the period then ended, the financial highlights for each of the five years in the period then ended and the related notes (collectively referred to as the “financial statements”). In our opinion, the financial statements present fairly, in all material respects, the financial position of the Fund (one of the funds constituting BNY Mellon Variable Investment Fund) at December 31, 2019, the results of its operations for the year then ended, the changes in its net assets for each of the two years in the period then ended and its financial highlights for each of the five years in the period then ended, in conformity with U.S. generally accepted accounting principles.
Basis for Opinion
These financial statements are the responsibility of the Fund’s management. Our responsibility is to express an opinion on the Fund’s financial statements based on our audits. We are a public accounting firm registered with the Public Company Accounting Oversight Board (United States) (“PCAOB”) and are required to be independent with respect to the Fund in accordance with the U.S. federal securities laws and the applicable rules and regulations of the Securities and Exchange Commission and the PCAOB.
We conducted our audits in accordance with the standards of the PCAOB. Those standards require that we plan and perform the audit to obtain reasonable assurance about whether the financial statements are free of material misstatement, whether due to error or fraud. The Fund is not required to have, nor were we engaged to perform, an audit of the Fund’s internal control over financial reporting. As part of our audits, we are required to obtain an understanding of internal control over financial reporting, but not for the purpose of expressing an opinion on the effectiveness of the Fund’s internal control over financial reporting. Accordingly, we express no such opinion.
Our audits included performing procedures to assess the risks of material misstatement of the financial statements, whether due to error or fraud, and performing procedures that respond to those risks. Such procedures included examining, on a test basis, evidence regarding the amounts and disclosures in the financial statements. Our procedures included confirmation of securities owned as of December 31, 2019, by correspondence with the custodian and others or by other appropriate auditing procedures where replies from others were not received. Our audits also included evaluating the accounting principles used and significant estimates made by management, as well as evaluating the overall presentation of the financial statements. We believe that our audits provide a reasonable basis for our opinion.

We have served as the auditor of one or more investment companies in the BNY Mellon Family of Funds since at least 1957, but we are unable to determine the specific year.
New York, New York
February 10, 2020
25
IMPORTANT TAX INFORMATION(Unaudited)
For federal tax purposes, the fund hereby reports 100% of the ordinary dividends paid during the fiscal year ended December 31, 2019 as qualifying for the corporate dividends received deduction. Shareholders will receive notification in early 2020 of the percentage applicable to the preparation of their 2019 income tax returns. Also, the fund hereby reports $.0207 per share as a short-term capital gain distribution and $4.6141 per share as a long-term capital gain distribution paid on March 29, 2019.
26
BOARD MEMBERS INFORMATION(Unaudited)
NDEPENDENT BOARD MEMBERS
Joseph S. DiMartino (76)
Chairman of the Board (1995)
Principal Occupation During Past 5 Years:
· Corporate Director and Trustee (1995-Present)
Other Public Company Board Memberships During Past 5 Years:
· CBIZ, Inc., a public company providing professional business services, products and solutions,Director (1997-Present)
No. of Portfolios for which Board Member Serves:118
———————
Peggy C. Davis (76)
Board Member (2006)
Principal Occupation During Past 5 Years:
· Shad Professor of Law, New York University School of Law (1983-present)
No. of Portfolios for which Board Member Serves: 43
———————
Gina D. France (61)
Board Member (2019)
Principal Occupation During Past 5 Years:
· Founder, President and Chief Executive Officer, France Strategic Partners, a strategy and advisory firm serving corporate clients across the United States (2003 –Present)
· Corporate Director and Trustee (2004 – Present)
Other Public Company Board Memberships During Past 5 Years:
· Huntington Bancshares, a bank holding company headquartered in Columbus, Ohio,Director(2016 – Present)
· Cedar Fair, L.P., a publicly-traded partnership that owns and operates amusement parks and hotels in the U.S. and Canada,Director (2011 – Present)
· CBIZ (formerly, Century Business Services, Inc.), a provider of outsourcing functions for small and medium size companies,Director(2015 – Present)
· Baldwin Wallace University,Trustee (2013- Present)
· FirstMerit Corporation, a diversified financial services company,Director (2004 – 2016)
No. of Portfolios for which Board Member Serves:29
———————
27
BOARD MEMBERS INFORMATION (Unaudited) (continued)
INDEPENDENT BOARD MEMBERS (continued)
Joan Gulley (72)
Board Member (2017)
Principal Occupation During Past 5 Years:
· PNC Financial Services Group, Inc.(1993-2014), Executive Vice President and Chief Human Resources Officer and Executive Committee Member (2008-2014)
· Director, Nantucket Library (2015-Present)
No. of Portfolios for which Board Member Serves:49
———————
Ehud Houminer (79)
Board Member (2006)
Principal Occupation During Past 5 Years:
· Board of Overseers at the Columbia Business School, Columbia University (1992-Present)
· Trustee, Ben Gurion University (2012-2018)
No. of Portfolios for which Board Member Serves:49
———————
Robin A. Melvin (56)
Board Member (2012)
Principal Occupation During Past 5 Years:
· Co-chairman, Mentor Illinois, a non-profit organization dedicated to increasing the quantity and quality of mentoring services in Illinois; (2014-Present); Board member (2013-Present)
No. of Portfolios for which Board Member Serves:96
———————
Once elected all Board Members serve for an indefinite term, but achieve Emeritus status upon reaching age 80. The address of the Board Members and Officers is c/o BNY Mellon Investment Adviser, Inc. 240 Greenwich Street, New York, New York 10286. Additional information about the Board Members is available in the fund’s Statement of Additional Information which can be obtained from the Adviser free of charge by calling this toll free number: 1-800-373-9387.
David P. Feldman, Emeritus Board Member
James F. Henry, Emeritus Board Member
Lynn Martin, Emeritus Board Member
Dr. Martin Peretz, Emeritus Board Member
Philip L. Toia, Emeritus Board Member
28
OFFICERS OF THE FUND(Unaudited)
RENEE LAROCHE-MORRIS, President since May 2019.
President and a director of BNY Mellon Investment Adviser, Inc. since January 2018. She is an officer of 62 investment companies (comprised of 118 portfolios) managed by the Adviser. She is 48 years old and has been an employee of BNY Mellon since 2003.
JAMES WINDELS, Treasurer since November 2001.
Director- BNY Mellon Fund Administration, and an officer of 63 investment companies (comprised of 141 portfolios) managed by the Adviser. He is 61 years old and has been an employee of the Adviser since April 1985.
BENNETT A. MACDOUGALL, Chief Legal Officer since October 2015.
Chief Legal Officer of the Adviser and Associate General Counsel and Managing Director of BNY Mellon since June 2015; Director and Associate General Counsel of Deutsche Bank – Asset & Wealth Management Division from June 2005 to June 2015, and as Chief Legal Officer of Deutsche Investment Management Americas Inc. from June 2012 to May 2015. He is an officer of 63 investment companies (comprised of 141 portfolios) managed by the Adviser. He is 48 years old and has been an employee of the Adviser since June 2015.
DAVID DIPETRILLO, Vice President since May 2019.
Head of North America Product, BNY Mellon Investment Management since January 2018, Director of Product Strategy, BNY Mellon Investment Management from January 2016 to December 2017; Head of US Retail Product and Channel Marketing, BNY Mellon Investment Management from January 2014 to December 2015. He is an officer of 62 investment companies (comprised of 118 portfolios) managed by the Adviser. He is 41 years old and has been an employee of BNY Mellon since 2005.
JAMES BITETTO, Vice President since August 2005 and Secretary since February 2018.
Senior Managing Counsel of BNY Mellon since December 2019; Managing Counsel of BNY Mellon from April 2014 to December 2019; Secretary of the Adviser, and an officer of 63 investment companies (comprised of 141 portfolios) managed by the Adviser. He is 53 years old and has been an employee of the Adviser since December 1996.
SONALEE CROSS, Vice President and Assistant Secretary since March 2018.
Counsel of BNY Mellon since October 2016; Associate at Proskauer Rose LLP from April 2016 to September 2016; Attorney at EnTrust Capital from August 2015 to February 2016; Associate at Sidley Austin LLP from September 2013 to August 2015. She is an officer of 63 investment companies (comprised of 141 portfolios) managed by the Adviser. She is 32 years old and has been an employee of the Adviser since October 2016.
DEIRDRE CUNNANE, Vice President and Assistant Secretary since March 2019.
Counsel of BNY Mellon since August 2018; Senior Regulatory Specialist at BNY Mellon Investment Management Services from February 2016 to August 2018; Trustee Associate at BNY Mellon Trust Company (Ireland) Limited from August 2013 to February 2016. She is an officer of 63 investment companies (comprised of 141 portfolios) managed by the Adviser. She is 29 years old and has been an employee of the Adviser since August 2018.
SARAH S. KELLEHER, Vice President and Assistant Secretary since April 2014.
Managing Counsel of BNY Mellon since December 2017, Senior Counsel of BNY Mellon from March 2013 to December 2017. She is an officer of 63 investment companies (comprised of 141 portfolios) managed by the Adviser. She is 44 years old and has been an employee of the Adviser since March 2013.
JEFF PRUSNOFSKY, Vice President and Assistant Secretary since August 2005.
Senior Managing Counsel of BNY Mellon, and an officer of 63 investment companies (comprised of 141 portfolios) managed by the Adviser. He is 54 years old and has been an employee of the Adviser since October 1990.
PETER M. SULLIVAN, Vice President and Assistant Secretary since March 2019.
Managing Counsel of BNY Mellon, and an officer of 63 investment companies (comprised of 141 portfolios) managed by the Adviser. He is 51 years old and has been an employee of the Adviser since April 2004.
29
OFFICERS OF THE FUND (Unaudited)(continued)
NATALYA ZELENSKY, Vice President and Assistant Secretary since March 2017.
Managing Counsel of BNY Mellon since December 2019; Counsel of BNY Mellon from May 2016 to December 2019; Attorney at Wildermuth Endowment Strategy Fund/Wildermuth Advisory, LLC from November 2015 to May 2016 and Assistant General Counsel at RCS Advisory Services from July 2014 to November 2015. She is an officer of 63 investment companies (comprised of 141 portfolios) managed by the Adviser. She is 34 years old and has been an employee of the Adviser since May 2016.
GAVIN C. REILLY, Assistant Treasurer since December 2005.
Tax Manager - BNY Mellon Fund Administration, and an officer of 63 investment companies (comprised of 141 portfolios) managed by the Adviser. He is 51 years old and has been an employee of the Adviser since April 1991.
ROBERT S. ROBOL, Assistant Treasurer since August 2005.
Senior Accounting Manager- BNY Mellon Fund Administration, and an officer of 63 investment companies (comprised of 141 portfolios) managed by the Adviser. He is 55 years old and has been an employee of the Adviser since October 1988.
ROBERT SALVIOLO, Assistant Treasurer since July 2007.
Senior Accounting Manager – BNY Mellon Fund Administration, and an officer of 63 investment companies (comprised of 141 portfolios) managed by the Adviser. He is 52 years old and has been an employee of the Adviser since June 1989.
ROBERT SVAGNA, Assistant Treasurer since December 2002.
Senior Accounting Manager – BNY Mellon Fund Administration, and an officer of 63 investment companies (comprised of 141 portfolios) managed by the Adviser. He is 52 years old and has been an employee of the Adviser since November 1990.
JOSEPH W. CONNOLLY, Chief Compliance Officer since October 2004.
Chief Compliance Officer of the Adviser, the BNY Mellon Family of Funds and BNY Mellon Funds Trust (63 investment companies, comprised of 141 portfolios). He is 62 years old and has served in various capacities with the Adviser since 1980, including manager of the firm’s Fund Accounting Department from 1997 through October 2001.
CARIDAD M. CAROSELLA, Anti-Money Laundering Compliance Officer since January 2016.
Anti-Money Laundering Compliance Officer of the BNY Mellon Family of Funds and BNY Mellon Funds Trust since January 2016; from May 2015 to December 2015, Interim Anti-Money Laundering Compliance Officer of the BNY Mellon Family of Funds and BNY Mellon Funds Trust and the Distributor; from January 2012 to May 2015, AML Surveillance Officer of the Distributor. She is an officer of 56 investment companies (comprised of 134 portfolios) managed by the Adviser. She is 51 years old and has been an employee of the Distributor since 1997.
30
NOTES
31
NOTES
32
NOTES
33
BNY Mellon Variable Investment Fund, Appreciation Portfolio
240 Greenwich Street
New York, NY 10286
Adviser
BNY Mellon Investment Adviser, Inc.
240 Greenwich Street
New York, NY 10286
Sub-Adviser
Fayez Sarofim & Co.
Two Houston Center
Suite 2907
Houston, TX 77010
Custodian
The Bank of New York Mellon
240 Greenwich Street
New York, NY 10286
Transfer Agent &
Dividend Disbursing Agent
BNY Mellon Transfer, Inc.
240 Greenwich Street
New York, NY 10286
Distributor
BNY Mellon Securities Corporation
240 Greenwich Street
New York, NY 10286
Telephone 1-800-258-4260 or 1-800-258-4261
Mail The BNY Mellon Family of Funds, 144 Glenn Curtiss Boulevard, Uniondale, NY 11556-0144 Attn: Institutional Services Department
E-mailSend your request to info@bnymellon.com
InternetInformation can be viewed online or downloaded atwww.bnymellonim.com/us
The fund files its complete schedule of portfolio holdings with the Securities and Exchange Commission (“SEC”) for the first and third quarters of each fiscal year on Form N-PORT. The fund’s Forms N-PORT are available on the SEC’s website atwww.sec.gov.
A description of the policies and procedures that the fund uses to determine how to vote proxies relating to portfolio securities and information regarding how the fund voted these proxies for the most recent 12-month period ended June 30 is available atwww.bnymellonim.com/us and on the SEC’s website at www.sec.gov and without charge, upon request, by calling 1-800-373-9387.
| | |
© 2020 BNY Mellon Securities Corporation
0112AR1219 | 
|
BNY Mellon Variable Investment Fund, Government Money Market Portfolio
| |
ANNUAL REPORT December 31, 2019 |

| |
The views expressed in this report reflect those of the portfolio manager(s) only through the end of the period covered and do not necessarily represent the views of BNY Mellon Investment Adviser, Inc. or any other person in the BNY Mellon Investment Adviser, Inc. organization. Any such views are subject to change at any time based upon market or other conditions and BNY Mellon Investment Adviser, Inc. disclaims any responsibility to update such views. These views may not be relied on as investment advice and, because investment decisions for a fund in the BNY Mellon Family of Funds are based on numerous factors, may not be relied on as an indication of trading intent on behalf of any fund in the BNY Mellon Family of Funds. |
| |
Not FDIC-Insured • Not Bank-Guaranteed • May Lose Value |
Contents
THE FUND
FOR MORE INFORMATION
Back Cover
| | | | |
| |
BNY Mellon Variable Investment Fund, Government Money Market Portfolio
| | The Fund |
A LETTER FROM THE PRESIDENT OF BNY MELLON INVESTMENT ADVISER, INC.
Dear Shareholder:
We are pleased to present this annual report for BNY Mellon Variable Investment Fund, Government Money Market Portfolio (formerly, Dreyfus Variable Investment Fund, Government Money Market Portfolio), covering the 12-month period from January 1, 2019 through December 31, 2019. For information about how the fund performed during the reporting period, as well as general market perspectives, we provide a Discussion of Fund Performance on the pages that follow.
In January 2019, a pivot in stance from the U.S. Federal Reserve (the “Fed”) helped stimulate a rebound across equity markets that continued into the second quarter of the year. However, escalating trade tensions disrupted equity markets in May. The dip was short-lived, as markets rose once again in June and July of 2019, when a trade deal appeared more likely and the pace of U.S. economic growth remained steady. Nevertheless, concerns continued to emerge over slowing global growth, resulting in bouts of market volatility in August 2019. Stocks rebounded in September and continued an upward path through most of October 2019, bolstered by central bank policy and consistent consumer spending. The rally generally continued through the end of the period, supported in part by an announcement from President Trump that the first phase of a trade deal with China was in process. U.S. equity markets reached new highs during the final months of the period.
In fixed-income markets, the year began with a recovery from the prior months’ volatility. After the Fed’s supportive statements in January 2019, other developed-market central banks followed suit and reiterated their abilities to buttress flagging growth rates by continuing accommodative policies. The Fed cut rates in July, September and October 2019, for a total 75 basis point reduction in the federal funds rate during the 12 months. Rates across much of the Treasury curve saw a slight increase during the month of November, and the long end of the curve rose in December. The yield curve steepened during the latter portion of the period. However, demand for fixed-income instruments during the year was strong, which helped to support positive bond market returns.
We believe that over the near term, the outlook for the U.S. remains positive, but we will monitor relevant data for any signs of a change. As always, we encourage you to discuss the risks and opportunities in today’s investment environment with your financial advisor.
Thank you for your continued confidence and support.
Sincerely,

Renee LaRoche-Morris
President
BNY Mellon Investment Adviser, Inc.
January 15, 2020
2
DISCUSSION OF FUND PERFORMANCE(Unaudited)
For the period from January 1, 2019 through December 31, 2019, as provided by Bernard W. Kiernan, Jr., Senior Portfolio Manager
Market and Fund Performance Overview
For the 12-month period ended December 31, 2019, BNY Mellon Variable Investment Fund, Government Money Market Portfolio (formerly, the Dreyfus Variable Investment Fund, Government Money Market Portfolio) produced a yield of 1.65%. Taking into account the effects of compounding, the portfolio provided an effective yield of 1.66% for the same period.1
Yields of money market instruments declined over the reporting period in response to a dovish shift in policy by the U.S. Federal Reserve (the “Fed”).
The Fund’s Investment Approach
The fund seeks as high a level of current income as is consistent with the preservation of capital and the maintenance of liquidity. To pursue its goal, the fund normally invests at least 99.5% of its total assets in securities issued or guaranteed as to principal and interest by the U.S. government or its agencies or instrumentalities, repurchase agreements collateralized solely by cash and/or government securities, and cash (including tri-party repurchase agreements). The securities in which the fund invests include those backed by the full faith and credit of the U.S. government and those that are neither insured nor guaranteed by the U.S. government.
Federal Reserve Cuts Interest Rates to Extend the Expansion
At the beginning of the reporting period, the U.S. economy was relatively strong, and labor markets were healthy, while core inflation, which excludes food and energy prices, remained subdued. By the end of the period, concerns about the global economy and its possible effect on U.S. growth had prompted the Fed to cut the federal funds rate three times, bringing it to a range of 1.50%–1.75%, and expectations of an imminent slowdown waned.
After the rate hike in December 2018, Fed Chairman Jerome Powell made it clear in January 2019 that the Fed would alter its tightening plans if the outlook for growth were to weaken. While the U.S. economy continued to expand, global growth became sluggish, with particular weakness appearing in the manufacturing sector in Europe, as indicated by purchasing managers’ indexes.
By March 2019, a slowing global economy and mixed domestic economic data led the Fed to back off plans for further rate hikes during the year. But concerns about trade tensions with China caused stocks to move sideways until later in the year.
Major central banks in other developed markets also implemented supportive policies. Late in 2019, the European Central Bank reduced short-term interest rates and reimplemented quantitative easing, while the Bank of Japan remained dovish. China also continued to add stimulus to their economy. As a result, these factors led to signs of improvement in the global economy, especially in the manufacturing sector in Europe. Geopolitical concerns also waned somewhat later in the year, as the election in the UK resolved the Brexit issue,
3
DISCUSSION OF FUND PERFORMANCE(Unaudited) (continued)
and trade tensions eased with the December 2019 announcement of a “Phase 1” deal between the U.S. and China.
Despite trade tensions with China, the U.S. economy remained strong relative to other developed economies but slowed relative to its pace in 2018. Gross domestic product grew by 2.0% in the second quarter of 2019 and 2.1% in the third quarter. This followed growth rates of 3.1% in the first quarter and 2.9% for full-year 2018.
The labor market generally remained strong throughout the reporting period, though somewhat weaker than in 2018. Job creation averaged 180,000 during the period, down from 223,000 for full-year 2018. The high occurred in January 2019, with 312,000, and the low came in February 2019, with 56,000. The unemployment rate remained steady, varying between 3.5% and 4.0%. Wage growth continued to be relatively strong, remaining at or above 3.0%, year-over-year, during the reporting period.
Despite steady economic growth, a strong labor market and rising wages, inflation remained subdued. The “core” Personal Consumption Expenditure Price Index (“core PCE Price Index”), which excludes volatile food and energy prices, stayed below the Fed’s 2.0% target until the third quarter of 2019. As prospects brightened for an interim U.S.-China trade agreement, and the Fed cut interest rates, fears of a growth slowdown eased, economic data became more positive, and the core PCE Price Index hit 2.1%, the highest since the first quarter of 2018.
Additional Rate Cuts Unlikely
With core inflation remaining near the Fed’s target rate and the economy continuing to expand, the Fed announced that it will leave rates unchanged for an extended period. Given this environment, we have maintained the fund’s weighted-average maturity in a range that is modestly shorter than industry averages. As always, we have retained our longstanding focus on quality and liquidity.
January 15, 2020
1 Effective yield is based upon dividends declared daily and reinvested monthly. Past performance is no guarantee of future results. Yields fluctuate. The fund’s performance does not reflect the deduction of additional charges and expenses imposed in connection with investing in variable insurance contracts, which will reduce returns.
You could lose money by investing in a money market fund. Although the fund seeks to preserve the value of your investment at $1.00 per share, it cannot guarantee it will do so. An investment in the fund is not insured or guaranteed by the Federal Deposit Insurance Corporation or any other government agency. The fund’s sponsor has no legal obligation to provide financial support to the fund, and you should not expect that the sponsor will provide financial support to the fund at any time.
Although the fund’s board has no current intention to impose a fee upon the sale of shares or temporarily suspend redemptions if the fund’s liquidity falls below certain levels, the board reserves the ability to do so after providing at least 60 days’ prior written notice to shareholders.
The fund is only available as a funding vehicle under variable life insurance policies or variable annuity contracts issued by insurance companies. Individuals may not purchase shares of the fund directly. A variable annuity is an insurance contract issued by an insurance company that enables investors to accumulate assets on a tax-deferred basis for retirement or other long-term goals. The investment objective and policies of BNY Mellon Variable Investment Fund, Government Money Market Portfolio made available through insurance products may be similar to those of other funds managed or advised by BNY Mellon Investment Adviser, Inc. However, the investment results of the fund may be higher or lower than, and may not be comparable to, those of any other BNY Mellon fund.
4
UNDERSTANDING YOUR FUND’S EXPENSES(Unaudited)
As a mutual fund investor, you pay ongoing expenses, such as management fees and other expenses. Using the information below, you can estimate how these expenses affect your investment and compare them with the expenses of other funds. You also may pay one-time transaction expenses, including sales charges (loads), redemption fees and expenses associated with variable annuity or insurance contracts, which are not shown in this section and would have resulted in higher total expenses. For more information, see your fund’s prospectus or talk to your financial adviser.
Review your fund’s expenses
The table below shows the expenses you would have paid on a $1,000 investment in BNY Mellon Variable Investment Fund, Government Money Market Portfolio from July 1, 2019 to December 31, 2019. It also shows how much a $1,000 investment would be worth at the close of the period, assuming actual returns and expenses.
| | | | |
Expenses and Value of a $1,000 Investment | |
Assume actual returns for the six months ended December 31, 2019 | |
| | | |
| | | |
Expense paid per $1,000† | $2.93 | |
Ending value (after expenses) | $1,007.40 | |
COMPARING YOUR FUND’S EXPENSES
WITH THOSE OF OTHER FUNDS(Unaudited)
Using the SEC’s method to compare expenses
The Securities and Exchange Commission (“SEC”) has established guidelines to help investors assess fund expenses. Per these guidelines, the table below shows your fund’s expenses based on a $1,000 investment, assuming a hypothetical 5% annualized return. You can use this information to compare the ongoing expenses (but not transaction expenses or total cost) of investing in the fund with those of other funds. All mutual fund shareholder reports will provide this information to help you make this comparison. Please note that you cannot use this information to estimate your actual ending account balance and expenses paid during the period.
| | | | |
Expenses and Value of a $1,000 Investment | |
Assuming a hypothetical 5% annualized return for the six months ended December 31, 2019 | |
| | | |
| | | |
Expense paid per $1,000† | $2.96 | |
Ending value (after expenses) | $1,022.28 | |
† Expenses are equal to the fund’s annualized expense ratio of .58%, multiplied by the average account value over the period, multiplied by 184/365 (to reflect the one-half year period). |
5
STATEMENT OF INVESTMENTS
December 31, 2019
| | | | | | | |
| |
U.S. Government Agencies - 19.2% | Annualized
Yield (%) | | Principal
Amount ($) | | Value ($) | |
Federal Farm Credit Banks: | | | | | |
1/6/2020, 1 Month LIBOR -.09% | 1.63 | | 10,000,000 | a | 9,999,716 | |
1/1/2020, 3 Month SOFR +.12% | 1.66 | | 3,000,000 | a | 3,000,168 | |
Federal Home Loan Banks: | | | | | |
1/2/2020, 3 Month SOFR +.02% | 1.56 | | 5,000,000 | a | 5,000,000 | |
3/25/2020, 3 Month LIBOR -.21% | 1.74 | | 10,000,000 | a | 10,000,000 | |
1/2/2020, 3 Month SOFR +.10% | 1.64 | | 5,000,000 | a | 5,000,000 | |
1/1/2020, 3 Month SOFR +.12% | 1.66 | | 2,000,000 | a | 2,000,000 | |
Total U.S. Government Agencies (cost $34,999,884) | | | | | 34,999,884 | |
U.S. Treasury Notes - 27.5% |
| |
| | | |
1/31/2020
(cost $50,001,503) | 2.00 | | 50,000,000 | | 50,001,503 | |
U.S. Treasury Floating Rate Notes - 6.6% |
| |
| | | |
1/7/2020, 3 Month U.S. T-BILL +.05% | 1.57 | | 7,000,000 | a | 6,999,931 | |
1/7/2020, 3 Month U.S. T-BILL +.22% | 1.75 | | 5,000,000 | a | 5,000,195 | |
Total U.S. Treasury Floating Rate Notes (cost $12,000,126) | | | | | 12,000,126 | |
Repurchase Agreements - 31.9% |
| |
| | | |
Barclays Bank, Tri-Party Agreement thru BNY Mellon, dated 12/31/2019, due at 1/2/2020 in the amount of $35,003,014 (fully collateralized by: original par of $28,956,800, U.S. Treasuries (including strips), 1.75%-3.38%, due 12/31/24-4/15/32, valued at $35,700,071) | 1.55 | | 35,000,000 | | 35,000,000 | |
BNP Paribas, Tri-Party Agreement thru BNY Mellon, dated 12/31/2019, due at 1/2/2020 in the amount of $20,001,722 (fully collateralized by: original par of $20,982,761, U.S. Treasuries (including strips), 0.00%-3.38%, due 2/15/23-11/15/48, valued at $20,400,000) | 1.55 | | 20,000,000 | | 20,000,000 | |
6
| | | | | | | |
| |
Repurchase Agreements - 31.9% (continued) | Annualized
Yield (%) | | Principal
Amount ($) | | Value ($) | |
Credit Agricole CIB, Tri-Party Agreement thru BNY Mellon, dated 12/31/2019, due at 1/2/2020 in the amount of $3,000,258 (fully collateralized by: original par of $2,865,796, U.S. Treasuries (including strips), 0.13%-3.00%, due 8/31/20-8/15/48, valued at $3,060,000) | 1.55 | | 3,000,000 | | 3,000,000 | |
Total Repurchase Agreements (cost $58,000,000) | | | | | 58,000,000 | |
Total Investments(cost $155,001,513) | | 85.2% | | 155,001,513 | |
Cash and Receivables (Net) | | 14.8% | | 26,932,669 | |
Net Assets | | 100.0% | | 181,934,182 | |
LIBOR—London Interbank Offered Rate
SOFR—Secured Overnight Financing Rate
a Variable rate security—rate shown is the interest rate in effect at period end. Date shown represents the earlier of the next interest reset date or ultimate maturity date.
| | |
Portfolio Summary (Unaudited)† | Value (%) |
U.S. Treasury Securities | 34.1 |
Repurchase Agreements | 31.9 |
U.S. Government Agencies | 19.2 |
| | 85.2 |
† Based on net assets.
See notes to financial statements.
7
STATEMENT OF ASSETS AND LIABILITIES
December 31, 2019
| | | | | | | |
| | | | | | |
| | | Cost | | Value | |
Assets ($): | | | | |
Investments in securities—See Statement of Investments
(including repurchase agreements of $58,000,000)
—Note 1(b) | 155,001,513 | | 155,001,513 | |
Cash | | | | | 1,637,102 | |
Receivable for shares of Beneficial Interest subscribed | | 24,931,598 | |
Interest receivable | | 495,346 | |
Prepaid expenses | | | | | 553 | |
| | | | | 182,066,112 | |
Liabilities ($): | | | | |
Due to BNY Mellon Investment Adviser, Inc. and affiliates—Note 2(b) | | 79,533 | |
Payable for shares of Beneficial Interest redeemed | | 885 | |
Trustees’ fees and expenses payable | | 328 | |
Other accrued expenses | | | | | 51,184 | |
| | | | | 131,930 | |
Net Assets ($) | | | 181,934,182 | |
Composition of Net Assets ($): | | | | |
Paid-in capital | | | | | 181,935,780 | |
Total distributable earnings (loss) | | | | | (1,598) | |
Net Assets ($) | | | 181,934,182 | |
| | | | | |
Shares Outstanding | | |
(unlimited number of $.001 par value shares of Beneficial Interest authorized) | 181,904,506 | |
Net Asset Value Per Share ($) | | 1.00 | |
| | | | |
See notes to financial statements. | | | | |
8
STATEMENT OF OPERATIONS
Year Ended December 31, 2019
| | | | | | | |
| | | | | | |
| | | | | | |
Investment Income ($): | | | | |
Interest Income | | | 4,112,439 | |
Expenses: | | | | |
Investment advisory fee—Note 2(a) | | | 923,121 | |
Professional fees | | | 83,655 | |
Trustees’ fees and expenses—Note 2(c) | | | 16,582 | |
Chief Compliance Officer fees—Note 2(b) | | | 11,793 | |
Prospectus and shareholders’ reports | | | 10,144 | |
Custodian fees—Note 2(b) | | | 9,436 | |
Shareholder servicing costs—Note 2(b) | | | 418 | |
Miscellaneous | | | 7,091 | |
Total Expenses | | | 1,062,240 | |
Less—reduction in fees due to earnings credits—Note 2(b) | | | (1,181) | |
Net Expenses | | | 1,061,059 | |
Investment Income—Net, representing net increase in
net assets resulting from operations | | | 3,051,380 | |
| | | | | | |
See notes to financial statements. | | | | | |
9
STATEMENT OF CHANGES IN NET ASSETS
| | | | | | | | | | |
| | | | Year Ended December 31, |
| | | | 2019 | | 2018 | |
Operations ($): | | | | | | | | |
Investment income—net | | | 3,051,380 | | | | 2,210,044 | |
Net realized gain (loss) on investments | | - | | | | (1,598) | |
Net Increase (Decrease) in Net Assets
Resulting from Operations | 3,051,380 | | | | 2,208,446 | |
Distributions ($): | |
Distributions to shareholders | | | (3,051,380) | | | | (2,217,870) | |
Beneficial Interest Transactions ($1.00 per share): | |
Net proceeds from shares sold | | | 726,180,919 | | | | 606,814,742 | |
Distributions reinvested | | | 3,051,380 | | | | 2,217,870 | |
Cost of shares redeemed | | | (728,894,164) | | | | (623,774,319) | |
Increase (Decrease) in Net Assets
from Beneficial Interest Transactions | 338,135 | | | | (14,741,707) | |
Total Increase (Decrease) in Net Assets | 338,135 | | | | (14,751,131) | |
Net Assets ($): | |
Beginning of Period | | | 181,596,047 | | | | 196,347,178 | |
End of Period | | | 181,934,182 | | | | 181,596,047 | |
| | | | | | | | | |
See notes to financial statements. | | | | | | | | |
10
FINANCIAL HIGHLIGHTS
The following table describes the performance for the fiscal periods indicated. Total return shows how much your investment in the fund would have increased (or decreased) during each period, assuming you had reinvested all dividends and distributions. The fund’s total returns do not reflect expenses associated with variable annuity or insurance contracts. These figures have been derived from the fund’s financial statements.
| | | | | | | | | | | |
| | | | | |
| | |
| | Year Ended December 31, |
| | 2019 | 2018 | 2017 | 2016 | 2015 |
Per Share Data ($): | | | | | | |
Net asset value, beginning of period | | 1.00 | 1.00 | 1.00 | 1.00 | 1.00 |
Investment Operations: | | | | | | |
Investment income—net | | .017 | .013 | .003 | .000a | .000a |
Distributions: | | | | | | |
Dividends from
investment income—net | | (.017) | (.013) | (.003) | (.000)a | (.000)a |
Net asset value, end of period | | 1.00 | 1.00 | 1.00 | 1.00 | 1.00 |
Total Return (%) | | 1.67 | 1.28 | .34 | .02 | .00b |
Ratios/Supplemental Data (%): | | | | | | |
Ratio of total expenses
to average net assets | | .58 | .58 | .58 | .62 | .62 |
Ratio of net expenses
to average net assets | | .57 | .58 | .57 | .39 | .23 |
Ratio of net investment income
to average net assets | | 1.65 | 1.26 | .37 | .01 | .00b |
Net Assets, end of period ($ x 1,000) | | 181,934 | 181,596 | 196,347 | 148,659 | 152,576 |
a Amount represents less than $.001 per share.
b Amount represents less than .01%.
See notes to financial statements.
11
NOTES TO FINANCIAL STATEMENTS
NOTE 1—Significant Accounting Policies:
Government Money Market Portfolio (the “fund”) is a separate diversified series of BNY Mellon Variable Investment Fund (the “Company”), which is registered under the Investment Company Act of 1940, as amended (the “Act”), as an open-end management investment company and operates as a series company currently offering seven series, including the fund. The fund is only offered to separate accounts established by insurance companies to fund variable annuity contracts and variable life insurance policies. The fund’s investment objective is to seek as high a level of current income as is consistent with the preservaton of capital and the maintenance of liquidity. The fund is managed by Dreyfus Cash Investment Strategies, a division of BNY Mellon Investment Adviser, Inc. (the “Adviser”), the fund’s investment adviser and a wholly-owned subsidiary of The Bank of New York Mellon Corporation (“BNY Mellon”). BNY Mellon Securities Corporation (the “Distributor”), a wholly-owned subsidiary of BNY Mellon, is the distributor of the fund’s shares, which are sold without a sales charge.
Effective June 3, 2019, the Company changed its name from Dreyfus Variable Investment Fund to BNY Mellon Variable Investment Fund. In addition, The Dreyfus Corporation, the fund’s investment adviser, changed its name to “BNY Mellon Investment Adviser, Inc.”, MBSC Securities Corporation, the fund’s distributor, changed its name to “BNY Mellon Securities Corporation” and Dreyfus Transfer, Inc., the fund’s transfer agent, changed its name to “BNY Mellon Transfer, Inc.”
The fund operates as a “government money market fund” as that term is defined in Rule 2a-7 under the Act. It is the fund’s policy to maintain a constant net asset value (“NAV”) per share of $1.00 and the fund has adopted certain investment, portfolio valuation and dividend and distribution policies to enable it to do so. There is no assurance, however, that the fund will be able to maintain a constant NAV per share of $1.00.
The Company accounts separately for the assets, liabilities and operations of each series. Expenses directly attributable to each series are charged to that series’ operations; expenses which are applicable to all series are allocated among them on a pro rata basis.
The Financial Accounting Standards Board (“FASB”) Accounting Standards Codification (“ASC”) is the exclusive reference of authoritative U.S. generally accepted accounting principles (“GAAP”) recognized by the FASB to be applied by nongovernmental entities. Rules and interpretive releases of the Securities and Exchange Commission (“SEC”) under authority of federal laws are also sources of authoritative GAAP for SEC
12
registrants. The fund is an investment company and applies the accounting and reporting guidance of the FASB ASC Topic 946 Financial Services-Investment Companies. The fund’s financial statements are prepared in accordance with GAAP, which may require the use of management estimates and assumptions. Actual results could differ from those estimates.
The Companyenters into contracts that contain a variety of indemnifications. The fund’s maximum exposure under these arrangements is unknown. The fund does not anticipate recognizing any loss related to these arrangements.
(a) Portfolio valuation:Investments in securities are valued at amortized cost in accordance with Rule 2a-7 under the Act. If amortized cost is determined not to approximate fair market value, the fair value of the portfolio securities will be determined by procedures established by and under the general oversight of the Company’s Board of Trustees (the “Board”).
The fair value of a financial instrument is the amount that would be received to sell an asset or paid to transfer a liability in an orderly transaction between market participants at the measurement date (i.e., the exit price). GAAP establishes a fair value hierarchy that prioritizes the inputs of valuation techniques used to measure fair value. This hierarchy gives the highest priority to unadjusted quoted prices in active markets for identical assets or liabilities (Level 1 measurements) and the lowest priority to unobservable inputs (Level 3 measurements).
Additionally, GAAP provides guidance on determining whether the volume and activity in a market has decreased significantly and whether such a decrease in activity results in transactions that are not orderly. GAAP requires enhanced disclosures around valuation inputs and techniques used during annual and interim periods.
Various inputs are used in determining the value of the fund’s investments relating to fair value measurements. These inputs are summarized in the three broad levels listed below:
Level 1—unadjusted quoted prices in active markets for identical investments.
Level 2—other significant observable inputs (including quoted prices for similar investments, interest rates, prepayment speeds, credit risk, etc.).
Level 3—significant unobservable inputs (including the fund’s own assumptions in determining the fair value of investments).
13
NOTES TO FINANCIAL STATEMENTS(continued)
The inputs or methodology used for valuing securities are not necessarily an indication of the risk associated with investing in those securities. For example, money market securities are valued using amortized cost, in accordance with rules under the Act. Generally, amortized cost approximates the current fair value of a security, but since the value is not obtained from a quoted price in an active market, such securities are reflected within Level 2 of the fair value hierarchy.
The following is a summary of the inputs used as of December 31, 2019in valuing the fund’s investments:
| | |
Valuation Inputs | Short-Term Investments ($)† |
Level 1 - Unadjusted Quoted Prices | - |
Level 2 - Other Significant Observable Inputs | 155,001,513 |
Level 3 - Significant Unobservable Inputs | - |
Total | 155,001,513 |
† See Statement of Investments for additional detailed categorizations, if any.
(b) Securities transactions and investment income:Securities transactions are recorded on a trade date basis. Interest income, adjusted for accretion of discount and amortization of premium on investments, is earned from settlement date and is recognized on the accrual basis. Realized gains and losses from securities transactions are recorded on the identified cost basis.
The fund may enter into repurchase agreements with financial institutions, deemed to be creditworthy by the Adviser, subject to the seller’s agreement to repurchase and the fund’s agreement to resell such securities at a mutually agreed upon price. Pursuant to the terms of the repurchase agreement, such securities must have an aggregate market value greater than or equal to the terms of the repurchase price plus accrued interest at all times. If the value of the underlying securities falls below the value of the repurchase price plus accrued interest, the fund will require the seller to deposit additional collateral by the next business day. If the request for additional collateral is not met, or the seller defaults on its repurchase obligation, the fund maintains its right to sell the underlying securities at market value and may claim any resulting loss against the seller. The collateral is held on behalf of the fund by the tri-party administrator with respect to any tri-party agreement. The fund may also jointly enter into one or more repurchase agreements with other funds managed by the Adviser in accordance with an exemptive order granted by the SEC pursuant to section 17(d) and Rule 17d-1 under the Act. Any joint repurchase agreements must be collateralized fully by U.S. Government securities.
(c) Dividends and distributions to shareholders:It is the policy of the fund to declare dividends daily from investment income-net. Such
14
dividends are paid monthly. Dividends from net realized capital gains, if any, are normally declared and paid annually, but the fund may make distributions on a more frequent basis to comply with the distribution requirements of the Internal Revenue Code of 1986, as amended (the “Code”). To the extent that net realized capital gains can be offset by capital loss carryovers, it is the policy of the fund not to distribute such gains.
(d) Federal income taxes: It is the policy of the fund to continue to qualify as a regulated investment company, if such qualification is in the best interests of its shareholders, by complying with the applicable provisions of the Code, and to make distributions of taxable income and net realized capital gain sufficient to relieve it from substantially all federal income and excise taxes.
As of and during the period ended December 31, 2019, the fund did not have any liabilities for any uncertain tax positions. The fund recognizes interest and penalties, if any, related to uncertain tax positions as income tax expense in the Statement of Operations. During the period ended December 31, 2019, the fund did not incur any interest or penalties.
Each tax year in the four-year period ended December 31, 2019 remains subject to examination by the Internal Revenue Service and state taxing authorities.
At December 31, 2019, the components of accumulated earnings on a tax basis were substantially the same as for financial reporting purposes.
The fund is permitted to carry forward capital losses for an unlimited period. Furthermore, capital loss carryovers retain their character as either short-term or long-term capital losses.
The accumulated capital loss carryover is available for federal income tax purposes to be applied against future netrealized capital gains, if any, realized subsequent to December 31, 2019. The fund has $1,598 of short-term capital losses which can be carried forward for an unlimited period.
The tax character of distributions paid to shareholders during the fiscal periods ended December 31, 2019 and December 31, 2018 were all ordinary income.
At December 31, 2019, the cost of investments for federal income tax purposes was substantially the same as the cost for financial reporting purposes (see the Statement of Investments).
(e) New Accounting Pronouncements: Effective June 1, 2019, the fund adopted Accounting Standards Update 2017-08, Receivables—
15
NOTES TO FINANCIAL STATEMENTS(continued)
Nonrefundable Fees and Other Costs (Subtopic 310-20): Premium Amortization On Purchased Callable Debt Securities (“ASU 2017-08”). The update shortens the amortization period for the premium on certain purchased callable debt securities to the earliest call date.
Also effective June 1, 2019, the fund adopted Accounting Standards Update 2018-13, Fair Value Measurement (Topic 820): Disclosure Framework—Changes to the Disclosure Requirements for Fair Value Measurement (“ASU 2018-13”). The update provides guidance that modifies certain disclosure requirements for fair value measurements. The adoption of ASU 2017-08 and ASU 2018-13 had no impact on the operations of the fund for the period ended December 31, 2019.
NOTE 2―Investment Adivsory Fee and Other Transactions with Affiliates:
(a)Pursuant to an investment advisory agreement with the Adviser, the investment advisory fee is computed at the annual rate of .50% of the value of the fund’s average daily net assets and is payable monthly.
(b)The fund has an arrangement with the transfer agent whereby the fund may receive earnings credits when positive cash balances are maintained, which are used to offset transfer agency fees. The fund had an arrangement with the custodian to receive earnings credits when positive cash balances were maintained, which were used to offset custody fees. Effective February 1, 2019, the arrangement with the custodian changed whereby the fund will no longer receive earnings credits to offset its custody fees and will receive interest income or overdraft fees going forward. For financial reporting purposes, the fund includes net earnings credits, if any, as an expense offset in the Statement of Operations.
The fund compensates BNY Mellon Transfer, Inc., a wholly-owned subsidiary of the Adviser, under a transfer agency agreement for providing transfer agency and cash management services for the fund. The majority of transfer agency fees are comprised of amounts paid on a per account basis, while cash management fees are related to fund subscriptions and redemptions. During the period ended December 31, 2019, the fund was charged $379 for transfer agency services. These fees are included in Shareholder servicing costs in the Statement of Operations.
The fund compensates The Bank of New York Mellon, a subsidiary of BNY Mellon and an affiliate of the Adviser, under a custody agreement for providing custodial services for the fund. These fees are determined based on net assets, geographic region and transaction activity. During the period ended December 31, 2019, the fund was charged $9,436 pursuant to the
16
custody agreement. These fees were partially offset by earnings credits of $1,181.
During the period ended December 31, 2019, the fund was charged $11,793 for services performed by the Chief Compliance Officer and his staff. These fees are included in Chief Compliance Officer fees in the Statement of Operations.
The components of “Due to BNY Mellon Investment Adviser, Inc. and affiliates” in the Statement of Assets and Liabilities consist of: investment advisory fees of $72,985, custodian fees of $3,200, Chief Compliance Officer fees of $3,261 and transfer agency fees of $87.
(c) Each Board member also serves as a Board member of other funds in the BNY Mellon Family of Funds complex. Annual retainer fees and attendance fees are allocated to each fund based on net assets.
17
REPORT OF INDEPENDENT REGISTERED PUBLIC ACCOUNTING FIRM
To the Shareholders and the Board of Trustees of Government Money Market Portfolio
Opinion on the Financial Statements
We have audited the accompanying statement of assets and liabilities of Government Money Market Portfolio (the “Fund”) (one of the funds constituting BNY Mellon Variable Investment Fund), including the statement of investments, as of December 31, 2019, and the related statement of operations for the year then ended, the statements of changes in net assets for each of the two years in the period then ended, the financial highlights for each of the five years in the period then ended and the related notes (collectively referred to as the “financial statements”). In our opinion, the financial statements present fairly, in all material respects, the financial position of the Fund (one of the funds constituting BNY Mellon Variable Investment Fund) at December 31, 2019, the results of its operations for the year then ended, the changes in its net assets for each of the two years in the period then ended and its financial highlights for each of the five years in the period then ended, in conformity with U.S. generally accepted accounting principles.
Basis for Opinion
These financial statements are the responsibility of the Fund’s management. Our responsibility is to express an opinion on the Fund’s financial statements based on our audits. We are a public accounting firm registered with the Public Company Accounting Oversight Board (United States) (“PCAOB”) and are required to be independent with respect to the Fund in accordance with the U.S. federal securities laws and the applicable rules and regulations of the Securities and Exchange Commission and the PCAOB.
We conducted our audits in accordance with the standards of the PCAOB. Those standards require that we plan and perform the audit to obtain reasonable assurance about whether the financial statements are free of material misstatement, whether due to error or fraud. The Fund is not required to have, nor were we engaged to perform, an audit of the Fund’s internal control over financial reporting. As part of our audits, we are required to obtain an understanding of internal control over financial reporting, but not for the purpose of expressing an opinion on the effectiveness of the Fund’s internal control over financial reporting. Accordingly, we express no such opinion.
Our audits included performing procedures to assess the risks of material misstatement of the financial statements, whether due to error or fraud, and performing procedures that respond to those risks. Such procedures included examining, on a test basis, evidence regarding the amounts and disclosures in the financial statements. Our procedures included confirmation of securities owned as of December 31, 2019, by correspondence with the custodian and others or by other appropriate auditing procedures where replies from others were not received. Our audits also included evaluating the accounting principles used and significant estimates made by management, as well as evaluating the overall presentation of the financial statements. We believe that our audits provide a reasonable basis for our opinion.

We have served as the auditor of one or more investment companies in the BNY Mellon Family of Funds since at least 1957, but we are unable to determine the specific year.
New York, New York
February 10, 2020
18
BOARD MEMBERS INFORMATION(Unaudited)
INDEPENDENT BOARD MEMBERS
Joseph S. DiMartino (76)
Chairman of the Board (1995)
Principal Occupation During Past 5 Years:
· Corporate Director and Trustee (1995-Present)
Other Public Company Board Memberships During Past 5 Years:
· CBIZ, Inc., a public company providing professional business services, products and solutions,Director (1997-Present)
No. of Portfolios for which Board Member Serves:118
———————
Peggy C. Davis (76)
Board Member (2006)
Principal Occupation During Past 5 Years:
· Shad Professor of Law, New York University School of Law (1983-present)
No. of Portfolios for which Board Member Serves: 43
———————
Gina D. France (61)
Board Member (2019)
Principal Occupation During Past 5 Years:
· Founder, President and Chief Executive Officer, France Strategic Partners, a strategy and advisory firm serving corporate clients across the United States (2003 –Present)
· Corporate Director and Trustee (2004 – Present)
Other Public Company Board Memberships During Past 5 Years:
· Huntington Bancshares, a bank holding company headquartered in Columbus, Ohio,Director(2016 – Present)
· Cedar Fair, L.P., a publicly-traded partnership that owns and operates amusement parks and hotels in the U.S. and Canada,Director (2011 – Present)
· CBIZ (formerly, Century Business Services, Inc.), a provider of outsourcing functions for small and medium size companies,Director(2015 – Present)
· Baldwin Wallace University,Trustee (2013- Present)
· FirstMerit Corporation, a diversified financial services company,Director (2004 – 2016)
No. of Portfolios for which Board Member Serves:29
———————
19
BOARD MEMBERS INFORMATION (Unaudited) (continued)
INDEPENDENT BOARD MEMBERS (continued)
Joan Gulley (72)
Board Member (2017)
Principal Occupation During Past 5 Years:
· PNC Financial Services Group, Inc.(1993-2014), Executive Vice President and Chief Human Resources Officer and Executive Committee Member (2008-2014)
· Director, Nantucket Library (2015-Present)
No. of Portfolios for which Board Member Serves:49
———————
Ehud Houminer (79)
Board Member (2006)
Principal Occupation During Past 5 Years:
· Board of Overseers at the Columbia Business School, Columbia University (1992-Present)
· Trustee, Ben Gurion University (2012-2018)
No. of Portfolios for which Board Member Serves:49
———————
Robin A. Melvin (56)
Board Member (2012)
Principal Occupation During Past 5 Years:
· Co-chairman, Mentor Illinois, a non-profit organization dedicated to increasing the quantity and quality of mentoring services in Illinois; (2014-Present); Board member (2013-Present)
No. of Portfolios for which Board Member Serves:96
———————
Once elected all Board Members serve for an indefinite term, but achieve Emeritus status upon reaching age 80. The address of the Board Members and Officers is c/o BNY Mellon Investment Adviser, Inc. 240 Greenwich Street, New York, New York 10286. Additional information about the Board Members is available in the fund’s Statement of Additional Information which can be obtained from the Adviser free of charge by calling this toll free number: 1-800-373-9387.
David P. Feldman, Emeritus Board Member
James F. Henry, Emeritus Board Member
Lynn Martin, Emeritus Board Member
Dr. Martin Peretz, Emeritus Board Member
Philip L. Toia, Emeritus Board Member
20
OFFICERS OF THE FUND(Unaudited)
RENEE LAROCHE-MORRIS, President since May 2019.
President and a director of BNY Mellon Investment Adviser, Inc. since January 2018. She is an officer of 62 investment companies (comprised of 118 portfolios) managed by the Adviser. She is 48 years old and has been an employee of BNY Mellon since 2003.
JAMES WINDELS, Treasurer since November 2001.
Director- BNY Mellon Fund Administration, and an officer of 63 investment companies (comprised of 141 portfolios) managed by the Adviser. He is 61 years old and has been an employee of the Adviser since April 1985.
BENNETT A. MACDOUGALL, Chief Legal Officer since October 2015.
Chief Legal Officer of the Adviser and Associate General Counsel and Managing Director of BNY Mellon since June 2015; Director and Associate General Counsel of Deutsche Bank – Asset & Wealth Management Division from June 2005 to June 2015, and as Chief Legal Officer of Deutsche Investment Management Americas Inc. from June 2012 to May 2015. He is an officer of 63 investment companies (comprised of 141 portfolios) managed by the Adviser. He is 48 years old and has been an employee of the Adviser since June 2015.
DAVID DIPETRILLO, Vice President since May 2019.
Head of North America Product, BNY Mellon Investment Management since January 2018, Director of Product Strategy, BNY Mellon Investment Management from January 2016 to December 2017; Head of US Retail Product and Channel Marketing, BNY Mellon Investment Management from January 2014 to December 2015. He is an officer of 62 investment companies (comprised of 118 portfolios) managed by the Adviser. He is 41 years old and has been an employee of BNY Mellon since 2005.
JAMES BITETTO, Vice President since August 2005 and Secretary since February 2018.
Senior Managing Counsel of BNY Mellon since December 2019; Managing Counsel of BNY Mellon from April 2014 to December 2019; Secretary of the Adviser, and an officer of 63 investment companies (comprised of 141 portfolios) managed by the Adviser. He is 53 years old and has been an employee of the Adviser since December 1996.
SONALEE CROSS, Vice President and Assistant Secretary since March 2018.
Counsel of BNY Mellon since October 2016; Associate at Proskauer Rose LLP from April 2016 to September 2016; Attorney at EnTrust Capital from August 2015 to February 2016; Associate at Sidley Austin LLP from September 2013 to August 2015. She is an officer of 63 investment companies (comprised of 141 portfolios) managed by the Adviser. She is 32 years old and has been an employee of the Adviser since October 2016.
DEIRDRE CUNNANE, Vice President and Assistant Secretary since March 2019.
Counsel of BNY Mellon since August 2018; Senior Regulatory Specialist at BNY Mellon Investment Management Services from February 2016 to August 2018; Trustee Associate at BNY Mellon Trust Company (Ireland) Limited from August 2013 to February 2016. She is an officer of 63 investment companies (comprised of 141 portfolios) managed by the Adviser. She is 29 years old and has been an employee of the Adviser since August 2018.
SARAH S. KELLEHER, Vice President and Assistant Secretary since April 2014.
Managing Counsel of BNY Mellon since December 2017, Senior Counsel of BNY Mellon from March 2013 to December 2017. She is an officer of 63 investment companies (comprised of 141 portfolios) managed by the Adviser. She is 44 years old and has been an employee of the Adviser since March 2013.
JEFF PRUSNOFSKY, Vice President and Assistant Secretary since August 2005.
Senior Managing Counsel of BNY Mellon, and an officer of 63 investment companies (comprised of 141 portfolios) managed by the Adviser. He is 54 years old and has been an employee of the Adviser since October 1990.
PETER M. SULLIVAN, Vice President and Assistant Secretary since March 2019.
Managing Counsel of BNY Mellon, and an officer of 63 investment companies (comprised of 141 portfolios) managed by the Adviser. He is 51 years old and has been an employee of the Adviser since April 2004.
21
OFFICERS OF THE FUND (Unaudited)(continued)
NATALYA ZELENSKY, Vice President and Assistant Secretary since March 2017.
Managing Counsel of BNY Mellon since December 2019; Counsel of BNY Mellon from May 2016 to December 2019; Attorney at Wildermuth Endowment Strategy Fund/Wildermuth Advisory, LLC from November 2015 to May 2016 and Assistant General Counsel at RCS Advisory Services from July 2014 to November 2015. She is an officer of 63 investment companies (comprised of 141 portfolios) managed by the Adviser. She is 34 years old and has been an employee of the Adviser since May 2016.
GAVIN C. REILLY, Assistant Treasurer since December 2005.
Tax Manager - BNY Mellon Fund Administration, and an officer of 63 investment companies (comprised of 141 portfolios) managed by the Adviser. He is 51 years old and has been an employee of the Adviser since April 1991.
ROBERT S. ROBOL, Assistant Treasurer since August 2005.
Senior Accounting Manager- BNY Mellon Fund Administration, and an officer of 63 investment companies (comprised of 141 portfolios) managed by the Adviser. He is 55 years old and has been an employee of the Adviser since October 1988.
ROBERT SALVIOLO, Assistant Treasurer since July 2007.
Senior Accounting Manager – BNY Mellon Fund Administration, and an officer of 63 investment companies (comprised of 141 portfolios) managed by the Adviser. He is 52 years old and has been an employee of the Adviser since June 1989.
ROBERT SVAGNA, Assistant Treasurer since December 2002.
Senior Accounting Manager – BNY Mellon Fund Administration, and an officer of 63 investment companies (comprised of 141 portfolios) managed by the Adviser. He is 52 years old and has been an employee of the Adviser since November 1990.
JOSEPH W. CONNOLLY, Chief Compliance Officer since October 2004.
Chief Compliance Officer of the Adviser, the BNY Mellon Family of Funds and BNY Mellon Funds Trust (63 investment companies, comprised of 141 portfolios). He is 62 years old and has served in various capacities with the Adviser since 1980, including manager of the firm’s Fund Accounting Department from 1997 through October 2001.
CARIDAD M. CAROSELLA, Anti-Money Laundering Compliance Officer since January 2016.
Anti-Money Laundering Compliance Officer of the BNY Mellon Family of Funds and BNY Mellon Funds Trust since January 2016; from May 2015 to December 2015, Interim Anti-Money Laundering Compliance Officer of the BNY Mellon Family of Funds and BNY Mellon Funds Trust and the Distributor; from January 2012 to May 2015, AML Surveillance Officer of the Distributor. She is an officer of 56 investment companies (comprised of 134 portfolios) managed by the Adviser. She is 51 years old and has been an employee of the Distributor since 1997.
22
NOTES
23
NOTES
24
NOTES
25
BNY Mellon Variable Investment Fund, Government Money Market Portfolio
240 Greenwich Street
New York, NY 10286
Adviser
BNY Mellon Investment Adviser, Inc.
240 Greenwich Street
New York, NY 10286
Custodian
The Bank of New York Mellon
240 Greenwich Street
New York, NY 10286
Transfer Agent &
Dividend Disbursing Agent
BNY Mellon Transfer, Inc.
240 Greenwich Street
New York, NY 10286
Distributor
BNY Mellon Securities Corporation
240 Greenwich Street
New York, NY 10286
Telephone Call your representative or 1-800-373-9387
Mail BNY Mellon Family of Funds to: BNY Mellon Institutional Services, 144 Glenn Curtiss Boulevard, Uniondale, NY 11556-0144
E-mail Send your request to instserv@bnymellon.com
Internet Access Dreyfus Money Market Funds at www.dreyfus.com
The fund will disclose daily, onwww.dreyfus.com, the fund’s complete schedule of holdings as of the end of the previous business day. The schedule of holdings will remain on the website for a period of five months. The fund files a monthly schedule of portfolio holdings with the Securities and Exchange Commission (“SEC”) on Form N-MFP. The fund’s Forms N-MFP are available on the SEC’s website at www.sec.gov.
Information regarding how the fund voted proxies related to portfolio securities for the most recent 12-month period ended June 30 is available atwww.dreyfus.com and on the SEC’s website at www.sec.gov and without charge, upon request, by calling 1-800-373-9387
| | |
© 2020 BNY Mellon Securities Corporation
0117AR1219 
| 
|
BNY Mellon Variable Investment Fund, Growth and Income Portfolio
| |
ANNUAL REPORT December 31, 2019 |

| |
The views expressed in this report reflect those of the portfolio manager(s) only through the end of the period covered and do not necessarily represent the views of BNY Mellon Investment Adviser, Inc. or any other person in the BNY Mellon Investment Adviser, Inc. organization. Any such views are subject to change at any time based upon market or other conditions and BNY Mellon Investment Adviser, Inc. disclaims any responsibility to update such views. These views may not be relied on as investment advice and, because investment decisions for a fund in the BNY Mellon Family of Funds are based on numerous factors, may not be relied on as an indication of trading intent on behalf of any fund in the BNY Mellon Family of Funds. |
| |
Not FDIC-Insured • Not Bank-Guaranteed • May Lose Value |
Contents
THE FUND
FOR MORE INFORMATION
Back Cover
| | | | |
| |
BNY Mellon Variable Investment Fund, Growth and Income Portfolio
| | The Fund |
A LETTER FROM THE PRESIDENT OF BNY MELLON INVESTMENT ADVISER, INC.
Dear Shareholder:
We are pleased to present this annual report for BNY Mellon Variable Investment Fund, Growth and Income Portfolio (formerly, Dreyfus Variable Investment Fund, Growth and Income Portfolio), covering the 12-month period from January 1, 2019 through December 31, 2019. For information about how the fund performed during the reporting period, as well as general market perspectives, we provide a Discussion of Fund Performance on the pages that follow.
In January 2019, a pivot in stance from the U.S. Federal Reserve (the “Fed”) helped stimulate a rebound across equity markets that continued into the second quarter of the year. However, escalating trade tensions disrupted equity markets in May. The dip was short-lived, as markets rose once again in June and July of 2019, when a trade deal appeared more likely and the pace of U.S. economic growth remained steady. Nevertheless, concerns continued to emerge over slowing global growth, resulting in bouts of market volatility in August 2019. Stocks rebounded in September and continued an upward path through most of October 2019, bolstered by central bank policy and consistent consumer spending. The rally generally continued through the end of the period, supported in part by an announcement from President Trump that the first phase of a trade deal with China was in process. U.S. equity markets reached new highs during the final months of the period.
In fixed-income markets, the year began with a recovery from the prior months’ volatility. After the Fed’s supportive statements in January 2019, other developed-market central banks followed suit and reiterated their abilities to buttress flagging growth rates by continuing accommodative policies. The Fed cut rates in July, September and October 2019, for a total 75 basis point reduction in the federal funds rate during the 12 months. Rates across much of the Treasury curve saw a slight increase during the month of November, and the long end of the curve rose in December. The yield curve steepened during the latter portion of the period. However, demand for fixed-income instruments during the year was strong, which helped to support positive bond market returns.
We believe that over the near term, the outlook for the U.S. remains positive, but we will monitor relevant data for any signs of a change. As always, we encourage you to discuss the risks and opportunities in today’s investment environment with your financial advisor.
Thank you for your continued confidence and support.
Sincerely,

Renee LaRoche-Morris
President
BNY Mellon Investment Adviser, Inc.
January 15, 2020
2
DISCUSSION OF FUND PERFORMANCE(Unaudited)
For the period from January 1, 2019 through December 31, 2019, as provided by John Bailer, David Intoppa and Leigh N. Todd, Portfolio Managers
Market and Fund Performance Overview
For the 12-month period ended December 31, 2019, BNY Mellon Variable Investment Fund, Growth and Income Portfolio’s (formerly, Dreyfus Variable Investment Fund, Growth and Income Portfolio) Initial shares achieved a total return of 29.12%, and its Service shares achieved a total return of 28.79%.1 In comparison, the fund’s benchmark, the S&P 500® Index (the “Index”), produced a total return of 31.46% for the same period.2
U.S. stocks posted strong gains during the reporting period, amid sustained economic growth, supportive central bank policy and international trade tensions. The fund lagged the Index largely due to unsuccessful security selections in the communication services, health care and information technology sectors.
The Fund’s Investment Approach
The fund seeks long-term capital growth, current income and growth of income, consistent with reasonable investment risk. To pursue its goal, the fund normally invests primarily in stocks of domestic and foreign issuers. We seek to create a portfolio that includes a blend of growth and dividend-paying stocks, as well as other investments that provide income. We choose stocks through a disciplined investment process that combines computer-modeling techniques, “bottom-up” fundamental analysis and risk management. The investment process is designed to provide investors with investment exposure to sector weightings and risk characteristics similar to those of the Index.
In selecting securities, we seek companies that possess some or all of the following characteristics: growth of earnings potential; operating margin improvement; revenue growth prospects; business improvement; good business fundamentals; dividend yield consistent with the fund’s strategy pertaining to income; value, or how a stock is priced relative to its perceived intrinsic worth; and healthy financial profile, which measures the financial well-being of the company.
The fund may use listed equity options to seek to enhance and/or mitigate risk. The fund will engage in “covered” option transactions where the fund has in its possession, for the duration of the strategy, the underlying physical asset or cash to satisfy any obligation the fund may have with respect to the option strategy.
Stocks Surge on Supportive Federal Reserve Policy and Reduced Trade Tensions
The reporting period began with widespread expectations of interest rate cuts, as the U.S. Federal Reserve (the “Fed”) had earlier moved from a tightening policy to one that was “data dependent.” With this shift, stocks rallied late in 2018 and continued to rise early in 2019. In the second quarter, however, stocks generally moved sideways, weighed down at times by concerns about trade tensions and global growth.
Three quarter-point rate cuts in the second half of the period provided an additional boost to equity markets. The Fed announced an initial reduction at its July 2019 meeting and
3
DISCUSSION OF FUND PERFORMANCE(Unaudited) (continued)
followed up with two additional rate cuts in September and October 2019. These reductions brought the federal funds rate to 1.50-1.75%, as trade tensions and other geopolitical concerns appeared to be weighing on economic growth. Other major central banks were also supportive.
In the third quarter of 2019, interest rate cuts and the prospect of a U.S.-China trade agreement led investors to anticipate a pickup in global growth. Investors’ concerns about trade tensions and the global economy hindered performance at times, but stocks finished up strong later in the reporting period, when the “Phase 1” U.S.-China trade deal was announced.
Sector Allocation and Stock Selection Drove Fund Performance
The fund’s relative performance was driven largely by unsuccessful stock selection in three sectors. An overweight position in the materials sector also hindered relative returns. Stock selection in the communication services, health care and information technology sectors were primarily responsible for the underperformance. In communication services, the fund’s lack of exposure to Facebook, which performed well, detracted from relative returns. The fund’s overweight position inNetflix also hindered relative performance, as it lagged the Index due to disappointing subscriber growth. In the health care sector, a position in Anthem, a managed care company, hampered performance, as shares were pressured by investors’ concerns about Medicare-For-All and other proposals to reduce health care costs. A position inSage Therapeutics also detracted from performance, as the company’s depression drug failed clinical trials. In the information technology sector, an underweight position in Apple hurt performance; the company reported strong results related to the iPhone 11, wearables and services. The fund’s performance was also hindered by a lack of exposure to Mastercard, which has been enjoying success in the global payments business. An overweight position in Corning detracted from performance as well; the company’s results were hurt by display overcapacity and optical spending weakness. Other detractors included Mosaic, an agricultural chemicals company, Marathon Petroleum andOccidental Petroleum.
On the other hand, the fund’s performance was helped by sector allocations, including an overweight position in the information technology sector and underweight positions in the utilities, real estate and consumer staples sectors. Also beneficial was stock selection in the industrials, financial, utilities and energy sectors. In the industrial sector, a decision to avoid shares of Boeing proved advantageous, as the company continued to experience trouble with its 737 Max airliner. A position inCoStar Group also benefited relative performance; the company has been reporting strong results for its real estate management software product and services. Several positions in the financial sector were also helpful, as the sector benefited broadly from strong earnings and capital returns. Positions inAmeriprise Financial, Progressive, Citigroup and Voya Financial were particularly beneficial. In the utilities sector, the fund’s position in NextEra Energy, which focuses on renewable energy, proved advantageous. In the energy sector, the fund did not own ExxonMobil, which has been struggling with production, and it did own Hess, which has benefited from a new find in Guyana. Other positive contributors included Chipotle Mexican Grill, a restaurant company, and Qualcomm, a leader in 5G technology.
4
Positioned for Further Gains
Given supportive monetary policy, resolution of Brexit uncertainty, improving economic data and progress on trade relations with China, we are optimistic about the economy and the prospect for stronger corporate earnings in 2020. We have emphasized stocks in the information technology, financial, materials, energy and industrial sectors and have underweight positions in the communication services, consumer staples, real estate, consumer discretionary, health care and utilities sectors.
January 15, 2020
1 Total return includes reinvestment of dividends and any capital gains paid. Past performance is no guarantee of future results. Share price and investment return fluctuate such that upon redemption, fund shares may be worth more or less than their original cost. The fund’s performance does not reflect the deduction of additional charges and expenses imposed in connection with investing in variable insurance contracts, which will reduce returns.
2 Source: Lipper Inc. — The S&P 500® Index is widely regarded as the best single gauge of large-cap U.S. equities. The index includes 500 leading companies and captures approximately 80% coverage of available market capitalization. Investors cannot invest directly in any index.
Please note: the position in any security highlighted with italicized typeface was sold during the reporting period.
Equities are subject generally to market, market sector, market liquidity, issuer and investment style risks, among other factors, to varying degrees, all of which are more fully described in the fund’s prospectus.
The fund is only available as a funding vehicle under variable life insurance policies or variable annuity contracts issued by insurance companies. Individuals may not purchase shares of the fund directly. A variable annuity is an insurance contract issued by an insurance company that enables investors to accumulate assets on a tax-deferred basis for retirement or other long-term goals. The investment objective and policies of BNY Mellon Variable Investment Fund, Growth and Income Portfolio made available through insurance products may be similar to those of other funds managed or advised by BNY Mellon Investment Adviser, Inc. However, the investment results of the fund may be higher or lower than, and may not be comparable to, those of any other fund.
5
FUND PERFORMANCE(Unaudited)

Comparison of change in value of a $10,000 investment in Initial shares and Service shares of BNY Mellon Variable Investment Fund, Growth and Income Portfolio with a hypothetical investment of $10,000 in S&P 500® Index (the “Index”)
† Source: Lipper Inc.
Past performance is not predictive of future performance. The fund’s performance does not reflect the deduction of additional charges and expenses imposed in connection with investing in variable insurance contracts which will reduce returns.
The above graph compares a hypothetical $10,000 investment made in Initial and Service shares of BNY Mellon Variable Investment Fund, Growth and Income Portfolio on 12/31/09 to a hypothetical investment of $10,000 made in the Index on that date.
The fund’s performance shown in the line graph above takes into account all applicable fees and expenses. The Index is widely regarded as the best single gauge of large-cap U.S. equities. The Index includes 500 leading companies and captures approximately 80% coverage of available market capitalization. Unlike a mutual fund, the Index is not subject to charges, fees and other expenses. Investors cannot invest directly in any index. Further information relating to fund performance, including expense reimbursements, if applicable, is contained in the Financial Highlights section of the prospectus and elsewhere in this report.
| | | | |
Average Annual Total Returns as of 12/31/19 | |
| 1 Year | 5 Years | 10 Years |
Initial shares | 29.12% | 10.49% | 12.94% |
Service shares | 28.79% | 10.22% | 12.66% |
S&P 500® Index | 31.46% | 11.69% | 13.55% |
The performance data quoted represents past performance, which is no guarantee of future results. Share price and investment return fluctuate and an investor’s shares may be worth more or less than original cost upon redemption. Current performance may be lower or higher than the performance quoted. Go to www.bnymellonim.com/us for the fund’s most recent month-end returns.
The fund’s Initial shares are not subject to a Rule 12b-1 fee. The fund’s Service shares are subject to a 0.25% annual Rule 12b-1 fee. All dividends and capital gain distributions are reinvested.
The fund’s performance shown in the graph and table does not reflect the deduction of taxes that a shareholder would pay on fund distributions or the redemption of fund shares.
6
UNDERSTANDING YOUR FUND’S EXPENSES(Unaudited)
As a mutual fund investor, you pay ongoing expenses, such as management fees and other expenses. Using the information below, you can estimate how these expenses affect your investment and compare them with the expenses of other funds. You also may pay one-time transaction expenses, including sales charges (loads), redemption fees and expenses associated with variable annuity or insurance contracts, which are not shown in this section and would have resulted in higher total expenses. For more information, see your fund’s prospectus or talk to your financial adviser.
Review your fund’s expenses
The table below shows the expenses you would have paid on a $1,000 investment in BNY Mellon Variable Investment Fund, Growth and Income Portfolio from July 1, 2019 to December 31, 2019. It also shows how much a $1,000 investment would be worth at the close of the period, assuming actual returns and expenses.
| | | | | |
Expenses and Value of a $1,000 Investment | |
Assume actual returns for the six months ended December 31, 2019 | |
| | | | |
| | Initial Shares | Service Shares | |
Expense paid per $1,000† | $4.95 | $6.26 | |
Ending value (after expenses) | $1,087.70 | $1,086.60 | |
COMPARING YOUR FUND’S EXPENSES
WITH THOSE OF OTHER FUNDS(Unaudited)
Using the SEC’s method to compare expenses
The Securities and Exchange Commission (“SEC”) has established guidelines to help investors assess fund expenses. Per these guidelines, the table below shows your fund’s expenses based on a $1,000 investment, assuming a hypothetical 5% annualized return. You can use this information to compare the ongoing expenses (but not transaction expenses or total cost) of investing in the fund with those of other funds. All mutual fund shareholder reports will provide this information to help you make this comparison. Please note that you cannot use this information to estimate your actual ending account balance and expenses paid during the period.
| | | | | |
Expenses and Value of a $1,000 Investment | |
Assuming a hypothetical 5% annualized return for the six months ended December 31, 2019 | |
| | | | |
| | Initial Shares | Service Shares | |
Expense paid per $1,000† | $4.79 | $6.06 | |
Ending value (after expenses) | $1,020.47 | $1,019.21 | |
† Expenses are equal to the fund’s annualized expense ratio of .94% for Initial Shares and 1.19% for Service Shares, multiplied by the average account value over the period, multiplied by 184/365 (to reflect the one-half year period). |
7
STATEMENT OF INVESTMENTS
December 31, 2019
| | | | | | | | |
| |
Description | | | | Shares | | Value ($) | |
Common Stocks - 98.4% | | | | | |
Automobiles & Components - .5% | | | | | |
General Motors | | | | 12,771 | | 467,419 | |
Banks - 5.8% | | | | | |
Bank of America | | | | 35,089 | | 1,235,835 | |
Citigroup | | | | 14,830 | | 1,184,769 | |
JPMorgan Chase & Co. | | | | 13,438 | | 1,873,257 | |
U.S. Bancorp | | | | 12,075 | | 715,927 | |
| | | | | 5,009,788 | |
Capital Goods - 7.7% | | | | | |
AMETEK | | | | 5,505 | | 549,069 | |
Gardner Denver Holdings | | | | 19,940 | a | 731,399 | |
Honeywell International | | | | 1,382 | | 244,614 | |
Ingersoll-Rand | | | | 6,716 | | 892,691 | |
L3Harris Technologies | | | | 2,489 | | 492,498 | |
Northrop Grumman | | | | 490 | | 168,545 | |
Quanta Services | | | | 9,608 | | 391,142 | |
Rockwell Automation | | | | 3,401 | | 689,281 | |
United Technologies | | | | 13,470 | | 2,017,267 | |
W.W. Grainger | | | | 1,427 | | 483,068 | |
| | | | | 6,659,574 | |
Consumer Durables & Apparel - .6% | | | | | |
Lennar, Cl. A | | | | 8,931 | | 498,260 | |
Consumer Services - 2.2% | | | | | |
Chipotle Mexican Grill | | | | 501 | a | 419,392 | |
McDonald's | | | | 3,556 | | 702,701 | |
Wynn Resorts | | | | 5,403 | | 750,315 | |
| | | | | 1,872,408 | |
Diversified Financials - 6.9% | | | | | |
Berkshire Hathaway, Cl. B | | | | 8,071 | a | 1,828,081 | |
Capital One Financial | | | | 2,908 | | 299,262 | |
E*TRADE Financial | | | | 10,723 | | 486,502 | |
LPL Financial Holdings | | | | 3,748 | | 345,753 | |
Morgan Stanley | | | | 16,257 | | 831,058 | |
Raymond James Financial | | | | 2,040 | | 182,498 | |
The Charles Schwab | | | | 4,360 | | 207,362 | |
The Goldman Sachs Group | | | | 4,431 | | 1,018,820 | |
Voya Financial | | | | 13,366 | b | 815,059 | |
| | | | | 6,014,395 | |
Energy - 5.3% | | | | | |
Apergy | | | | 9,544 | a | 322,396 | |
ConocoPhillips | | | | 9,548 | | 620,906 | |
Hess | | | | 11,068 | | 739,453 | |
8
| | | | | | | | |
| |
Description | | | | Shares | | Value ($) | |
Common Stocks - 98.4% (continued) | | | | | |
Energy - 5.3% (continued) | | | | | |
Marathon Petroleum | | | | 22,067 | | 1,329,537 | |
Phillips 66 | | | | 6,582 | | 733,301 | |
Pioneer Natural Resources | | | | 2,281 | | 345,275 | |
Schlumberger | | | | 6,856 | | 275,611 | |
Valero Energy | | | | 2,132 | | 199,662 | |
| | | | | 4,566,141 | |
Food & Staples Retailing - .6% | | | | | |
Walmart | | | | 4,118 | | 489,383 | |
Food, Beverage & Tobacco - 2.8% | | | | | |
Archer-Daniels-Midland | | | | 10,396 | | 481,855 | |
Conagra Brands | | | | 13,944 | | 477,443 | |
PepsiCo | | | | 10,861 | | 1,484,373 | |
| | | | | 2,443,671 | |
Health Care Equipment & Services - 7.5% | | | | | |
Alcon | | | | 6,607 | a | 373,758 | |
Anthem | | | | 3,961 | | 1,196,341 | |
Becton Dickinson and Co. | | | | 2,281 | | 620,364 | |
Boston Scientific | | | | 19,764 | a | 893,728 | |
CVS Health | | | | 4,665 | | 346,563 | |
Danaher | | | | 3,623 | b | 556,058 | |
Humana | | | | 880 | | 322,538 | |
Intuitive Surgical | | | | 1,157 | a | 683,961 | |
Masimo | | | | 2,086 | a | 329,713 | |
Medtronic | | | | 10,727 | | 1,216,978 | |
| | | | | 6,540,002 | |
Household & Personal Products - .4% | | | | | |
Colgate-Palmolive | | | | 5,520 | | 379,997 | |
Insurance - 3.5% | | | | | |
American International Group | | | | 25,692 | | 1,318,770 | |
Assurant | | | | 3,712 | | 486,569 | |
Chubb | | | | 3,851 | | 599,447 | |
The Hartford Financial Services Group | | | | 3,365 | | 204,491 | |
Willis Towers Watson | | | | 2,127 | | 429,526 | |
| | | | | 3,038,803 | |
Materials - 5.0% | | | | | |
CF Industries Holdings | | | | 19,323 | | 922,480 | |
Dow | | | | 5,502 | | 301,125 | |
Freeport-McMoRan | | | | 34,406 | | 451,407 | |
Louisiana-Pacific | | | | 7,643 | | 226,768 | |
Martin Marietta Materials | | | | 3,039 | | 849,826 | |
Newmont Goldcorp | | | | 9,843 | | 427,678 | |
The Mosaic Company | | | | 15,928 | | 344,682 | |
9
STATEMENT OF INVESTMENTS (continued)
| | | | | | | | |
| |
Description | | | | Shares | | Value ($) | |
Common Stocks - 98.4% (continued) | | | | | |
Materials - 5.0% (continued) | | | | | |
Vulcan Materials | | | | 5,515 | | 794,105 | |
| | | | | 4,318,071 | |
Media & Entertainment - 5.2% | | | | | |
Alphabet, Cl. A | | | | 642 | a | 859,888 | |
Alphabet, Cl. C | | | | 1,450 | a | 1,938,679 | |
Comcast, Cl. A | | | | 6,685 | | 300,624 | |
Electronic Arts | | | | 3,233 | a | 347,580 | |
Omnicom Group | | | | 2,475 | | 200,524 | |
Pinterest, Cl. A | | | | 17,980 | a | 335,147 | |
Twitter | | | | 16,752 | a | 536,902 | |
| | | | | 4,519,344 | |
Pharmaceuticals Biotechnology & Life Sciences - 5.6% | | | | | |
Charles River Laboratories International | | | | 2,239 | a | 342,030 | |
Eli Lilly & Co. | | | | 5,886 | | 773,597 | |
Merck & Co. | | | | 17,508 | | 1,592,353 | |
Pfizer | | | | 16,781 | | 657,480 | |
Sarepta Therapeutics | | | | 3,783 | a,b | 488,158 | |
Vertex Pharmaceuticals | | | | 1,745 | a | 382,068 | |
Zoetis | | | | 4,490 | | 594,251 | |
| | | | | 4,829,937 | |
Real Estate - .9% | | | | | |
American Tower | | | | 2,389 | c | 549,040 | |
Outfront Media | | | | 10,485 | c | 281,208 | |
| | | | | 830,248 | |
Retailing - 4.5% | | | | | |
Amazon.com | | | | 1,544 | a | 2,853,065 | |
O'Reilly Automotive | | | | 1,735 | a | 760,381 | |
Target | | | | 2,352 | | 301,550 | |
| | | | | 3,914,996 | |
Semiconductors & Semiconductor Equipment - 6.3% | | | | | |
Advanced Micro Devices | | | | 15,424 | a,b | 707,345 | |
Applied Materials | | | | 8,239 | | 502,909 | |
Broadcom | | | | 1,100 | | 347,622 | |
Microchip Technology | | | | 8,904 | b | 932,427 | |
NVIDIA | | | | 4,128 | | 971,318 | |
Qualcomm | | | | 20,283 | | 1,789,569 | |
Texas Instruments | | | | 1,481 | | 189,997 | |
| | | | | 5,441,187 | |
Software & Services - 14.0% | | | | | |
HubSpot | | | | 2,214 | a | 350,919 | |
International Business Machines | | | | 1,453 | | 194,760 | |
Microsoft | | | | 25,550 | | 4,029,235 | |
PayPal Holdings | | | | 7,691 | a | 831,935 | |
10
| | | | | | | | |
| |
Description | | | | Shares | | Value ($) | |
Common Stocks - 98.4% (continued) | | | | | |
Software & Services - 14.0% (continued) | | | | | |
Proofpoint | | | | 3,323 | a | 381,414 | |
Salesforce.com | | | | 7,613 | a | 1,238,178 | |
ServiceNow | | | | 2,842 | a | 802,353 | |
Shopify, Cl. A | | | | 1,626 | a | 646,465 | |
Splunk | | | | 5,509 | a | 825,083 | |
Square, Cl. A | | | | 8,773 | a | 548,839 | |
Twilio, Cl. A | | | | 3,533 | a,b | 347,223 | |
Visa, Cl. A | | | | 10,471 | b | 1,967,501 | |
| | | | | 12,163,905 | |
Technology Hardware & Equipment - 6.7% | | | | | |
Apple | | | | 11,979 | | 3,517,633 | |
Cisco Systems | | | | 6,054 | | 290,350 | |
Cognex | | | | 12,763 | | 715,239 | |
Corning | | | | 18,202 | | 529,860 | |
Western Digital | | | | 5,681 | | 360,573 | |
Zebra Technologies, Cl. A | | | | 1,612 | a | 411,769 | |
| | | | | 5,825,424 | |
Telecommunication Services - 1.6% | | | | | |
AT&T | | | | 34,803 | | 1,360,101 | |
Transportation - 1.8% | | | | | |
Delta Air Lines | | | | 8,117 | | 474,682 | |
Union Pacific | | | | 6,282 | | 1,135,723 | |
| | | | | 1,610,405 | |
Utilities - 3.0% | | | | | |
Clearway Energy, Cl. C | | | | 10,319 | b | 205,864 | |
Edison International | | | | 8,112 | | 611,726 | |
NextEra Energy | | | | 2,768 | | 670,299 | |
PPL | | | | 32,152 | | 1,153,614 | |
| | | | | 2,641,503 | |
Total Common Stocks(cost $62,247,566) | | | | 85,434,962 | |
| | | | | | | | |
Exchange-Traded Funds - .5% | | | | | |
Registered Investment Companies - .5% | | | | | |
iShares Russell 1000 Value ETF
(cost $413,678) | | | | 3,038 | | 414,626 | |
| | | 1-Day
Yield (%) | | | | | |
Investment Companies - .6% | | | | | |
Registered Investment Companies - .6% | | | | | |
Dreyfus Institutional Preferred Government Plus Money Market Fund
(cost $543,727) | | 1.60 | | 543,727 | d | 543,727 | |
11
STATEMENT OF INVESTMENTS (continued)
| | | | | | | | |
| |
Description | | 1-Day
Yield (%) | | Shares | | Value ($) | |
Investment of Cash Collateral for Securities Loaned - .1% | | | | | |
Registered Investment Companies - .1% | | | | | |
Dreyfus Institutional Preferred Government Plus Money Market Fund
(cost $41,828) | | 1.60 | | 41,828 | d | 41,828 | |
Total Investments(cost $63,246,799) | | 99.6% | | 86,435,143 | |
Cash and Receivables (Net) | | .4% | | 376,923 | |
Net Assets | | 100.0% | | 86,812,066 | |
ETF—Exchange-Traded Fund
aNon-income producing security.
bSecurity, or portion thereof, on loan. At December 31, 2019, the value of the fund’s securities on loan was $5,632,917 and the value of the collateral was $5,732,622, consisting of cash collateral of $41,828 and U.S. Government & Agency securities valued at $5,690,794.
cInvestment in real estate investment trust within the United States.
dInvestment in affiliated issuer. The investment objective of this investment company is publicly available and can be found within the investment company’s prospectus.
| | |
Portfolio Summary (Unaudited)† | Value (%) |
Information Technology | 27.0 |
Financials | 16.1 |
Health Care | 13.1 |
Industrials | 9.5 |
Consumer Discretionary | 7.8 |
Communication Services | 6.8 |
Energy | 5.3 |
Materials | 5.0 |
Consumer Staples | 3.8 |
Utilities | 3.0 |
Investment Companies | 1.2 |
Real Estate | 1.0 |
| | 99.6 |
† Based on net assets.
See notes to financial statements.
12
STATEMENT OF INVESTMENTS IN AFFILIATED ISSUERS
| | | | | | | |
Investment Companies | Value
12/31/18 ($) | Purchases ($) | Sales ($) | Value
12/31/19 ($) | Net
Assets (%) | Dividends/
Distributions ($) |
Registered Investment Companies; | | | | | |
Dreyfus Institutional Preferred Government Plus Money Market Fund | 605,949 | 17,163,830 | 17,226,052 | 543,727 | .6 | 26,256 |
Investment of Cash Collateral for Securities Loaned; | | | | | |
Dreyfus Institutional Preferred Government Plus Money Market Fund | - | 4,288,970 | 4,247,142 | 41,828 | .1 | - |
Total | 605,949 | 21,452,800 | 21,473,194 | 585,555 | .7 | 26,256 |
See notes to financial statements.
13
STATEMENT OF ASSETS AND LIABILITIES
December 31, 2019
| | | | | | | |
| | | | | | |
| | | Cost | | Value | |
Assets ($): | | | | |
Investments in securities—See Statement of Investments
(including securities on loan, valued at $5,632,917)—Note 1(b): | | | |
Unaffiliated issuers | 62,661,244 | | 85,849,588 | |
Affiliated issuers | | 585,555 | | 585,555 | |
Receivable for investment securities sold | | 1,189,994 | |
Dividends, interest and securities lending income receivable | | 72,584 | |
Receivable for shares of Beneficial Interest subscribed | | 2,187 | |
Prepaid expenses | | | | | 1,286 | |
| | | | | 87,701,194 | |
Liabilities ($): | | | | |
Due to BNY Mellon Investment Adviser, Inc. and affiliates—Note 3(b) | | 61,753 | |
Payable for investment securities purchased | | 661,573 | |
Payable for shares of Beneficial Interest redeemed | | 64,051 | |
Liability for securities on loan—Note 1(b) | | 41,828 | |
Trustees’ fees and expenses payable | | 661 | |
Other accrued expenses | | | | | 59,262 | |
| | | | | 889,128 | |
Net Assets ($) | | | 86,812,066 | |
Composition of Net Assets ($): | | | | |
Paid-in capital | | | | | 57,784,938 | |
Total distributable earnings (loss) | | | | | 29,027,128 | |
Net Assets ($) | | | 86,812,066 | |
| | | | |
Net Asset Value Per Share | Initial Shares | Service Shares | |
Net Assets ($) | 82,327,792 | 4,484,274 | |
Shares Outstanding | 2,587,422 | 140,677 | |
Net Asset Value Per Share ($) | 31.82 | 31.88 | |
| | | |
See notes to financial statements. | | | |
14
STATEMENT OF OPERATIONS
Year Ended December 31, 2019
| | | | | | | |
| | | | | | |
| | | | | | |
Investment Income ($): | | | | |
Income: | | | | |
Cash dividends: | |
Unaffiliated issuers | | | 1,552,958 | |
Affiliated issuers | | | 26,256 | |
Income from securities lending—Note 1(b) | | | 9,272 | |
Interest | | | 13 | |
Total Income | | | 1,588,499 | |
Expenses: | | | | |
Investment advisory fee—Note 3(a) | | | 618,076 | |
Professional fees | | | 84,799 | |
Prospectus and shareholders’ reports | | | 13,307 | |
Chief Compliance Officer fees—Note 3(b) | | | 11,793 | |
Distribution fees—Note 3(b) | | | 11,048 | |
Trustees’ fees and expenses—Note 3(c) | | | 7,604 | |
Custodian fees—Note 3(b) | | | 7,049 | |
Loan commitment fees—Note 2 | | | 1,893 | |
Shareholder servicing costs—Note 3(b) | | | 717 | |
Miscellaneous | | | 17,076 | |
Total Expenses | | | 773,362 | |
Investment Income—Net | | | 815,137 | |
Realized and Unrealized Gain (Loss) on Investments—Note 4 ($): | | |
Net realized gain (loss) on investments | 6,116,807 | |
Net change in unrealized appreciation (depreciation) on investments | 13,770,294 | |
Net Realized and Unrealized Gain (Loss) on Investments | | | 19,887,101 | |
Net Increase in Net Assets Resulting from Operations | | 20,702,238 | |
| | | | | | |
See notes to financial statements. | | | | | |
15
STATEMENT OF CHANGES IN NET ASSETS
| | | | | | | | | | |
| | | | Year Ended December 31, |
| | | | 2019 | | 2018 | |
Operations ($): | | | | | | | | |
Investment income—net | | | 815,137 | | | | 733,653 | |
Net realized gain (loss) on investments | | 6,116,807 | | | | 9,174,467 | |
Net change in unrealized appreciation
(depreciation) on investments | | 13,770,294 | | | | (13,144,415) | |
Net Increase (Decrease) in Net Assets
Resulting from Operations | 20,702,238 | | | | (3,236,295) | |
Distributions ($): | |
Distributions to shareholders: | | | | | | | | |
Initial Shares | | | (9,496,804) | | | | (8,070,416) | |
Service Shares | | | (534,779) | | | | (479,210) | |
Total Distributions | | | (10,031,583) | | | | (8,549,626) | |
Beneficial Interest Transactions ($): | |
Net proceeds from shares sold: | | | | | | | | |
Initial Shares | | | 2,453,424 | | | | 2,953,110 | |
Service Shares | | | 33,603 | | | | 219,876 | |
Distributions reinvested: | | | | | | | | |
Initial Shares | | | 9,496,804 | | | | 8,070,416 | |
Service Shares | | | 534,779 | | | | 479,210 | |
Cost of shares redeemed: | | | | | | | | |
Initial Shares | | | (9,502,967) | | | | (12,182,314) | |
Service Shares | | | (686,807) | | | | (1,318,092) | |
Increase (Decrease) in Net Assets
from Beneficial Interest Transactions | 2,328,836 | | | | (1,777,794) | |
Total Increase (Decrease) in Net Assets | 12,999,491 | | | | (13,563,715) | |
Net Assets ($): | |
Beginning of Period | | | 73,812,575 | | | | 87,376,290 | |
End of Period | | | 86,812,066 | | | | 73,812,575 | |
Capital Share Transactions (Shares): | |
Initial Shares | | | | | | | | |
Shares sold | | | 83,060 | | | | 92,133 | |
Shares issued for distributions reinvested | | | 335,162 | | | | 273,936 | |
Shares redeemed | | | (319,680) | | | | (385,558) | |
Net Increase (Decrease) in Shares Outstanding | 98,542 | | | | (19,489) | |
Service Shares | | | | | | | | |
Shares sold | | | 1,119 | | | | 6,747 | |
Shares issued for distributions reinvested | | | 18,860 | | | | 16,250 | |
Shares redeemed | | | (23,125) | | | | (41,128) | |
Net Increase (Decrease) in Shares Outstanding | (3,146) | | | | (18,131) | |
| | | | | | | | | |
See notes to financial statements. | | | | | | | | |
16
FINANCIAL HIGHLIGHTS
The following tables describe the performance for each share class for the fiscal periods indicated. All information (except portfolio turnover rate) reflects financial results for a single fund share. Total return shows how much your investment in the fund would have increased (or decreased) during each period, assuming you had reinvested all dividends and distributions. The fund’s total returns do not reflect expenses associated with variable annuity or insurance contracts. These figures have been derived from the fund’s financial statements.
| | | | | | | | | | |
| | | | | |
| | |
| | Year Ended December 31, |
Initial Shares | | 2019 | 2018 | 2017 | 2016 | 2015 |
Per Share Data ($): | | | | | | |
Net asset value,
beginning of period | | 28.03 | 32.72 | 28.81 | 29.98 | 32.68 |
Investment Operations: | | | | | | |
Investment income—neta | | .30 | .27 | .26 | .33 | .26 |
Net realized and unrealized
gain (loss) on investments | | 7.36 | (1.66) | 5.22 | 2.27 | .28 |
Total from Investment Operations | | 7.66 | (1.39) | 5.48 | 2.60 | .54 |
Distributions: | | | | | | |
Dividends from
investment income—net | | (.33) | (.26) | (.23) | (.34) | (.27) |
Dividends from net realized
gain on investments | | (3.54) | (3.04) | (1.34) | (3.43) | (2.97) |
Total Distributions | | (3.87) | (3.30) | (1.57) | (3.77) | (3.24) |
Net asset value, end of period | | 31.82 | 28.03 | 32.72 | 28.81 | 29.98 |
Total Return (%) | | 29.12 | (4.68) | 19.71 | 10.04 | 1.59 |
Ratios/Supplemental Data (%): | | | | | | |
Ratio of total expenses
to average net assets | | .93 | .93 | .90 | .90 | .88 |
Ratio of net expenses
to average net assets | | .93 | .93 | .90 | .90 | .88 |
Ratio of net investment income
to average net assets | | 1.00 | .87 | .85 | 1.17 | .84 |
Portfolio Turnover Rate | | 61.08 | 63.89 | 61.00 | 64.41 | 62.03 |
Net Assets, end of period ($ x 1,000) | | 82,328 | 69,774 | 82,070 | 74,797 | 78,296 |
a Based on average shares outstanding.
See notes to financial statements.
17
FINANCIAL HIGHLIGHTS (continued)
| | | | | | | | | | | |
| | | | | |
| | |
| | Year Ended December 31, |
Service Shares | | 2019 | 2018 | 2017 | 2016 | 2015 |
Per Share Data ($): | | | | | | |
Net asset value,
beginning of period | | 28.08 | 32.76 | 28.85 | 30.01 | 32.71 |
Investment Operations: | | | | | | |
Investment income—neta | | .22 | .19 | .18 | .25 | .18 |
Net realized and unrealized
gain (loss) on investments | | 7.37 | (1.65) | 5.22 | 2.29 | .27 |
Total from Investment Operations | | 7.59 | (1.46) | 5.40 | 2.54 | .45 |
Distributions: | | | | | | |
Dividends from
investment income—net | | (.25) | (.18) | (.15) | (.27) | (.18) |
Dividends from net
realized gain on investments | | (3.54) | (3.04) | (1.34) | (3.43) | (2.97) |
Total Distributions | | (3.79) | (3.22) | (1.49) | (3.70) | (3.15) |
Net asset value, end of period | | 31.88 | 28.08 | 32.76 | 28.85 | 30.01 |
Total Return (%) | | 28.79 | (4.90) | 19.38 | 9.78 | 1.32 |
Ratios/Supplemental Data (%): | | | | | | |
Ratio of total expenses
to average net assets | | 1.18 | 1.18 | 1.15 | 1.15 | 1.13 |
Ratio of net expenses
to average net assets | | 1.18 | 1.18 | 1.15 | 1.15 | 1.13 |
Ratio of net investment income
to average net assets | | .76 | .62 | .60 | .92 | .59 |
Portfolio Turnover Rate | | 61.08 | 63.89 | 61.00 | 64.41 | 62.03 |
Net Assets, end of period ($ x 1,000) | | 4,484 | 4,039 | 5,306 | 5,283 | 5,739 |
a Based on average shares outstanding.
See notes to financial statements.
18
NOTES TO FINANCIAL STATEMENTS
NOTE 1—Significant Accounting Policies:
Growth and Income Portfolio (the “fund”) is a separate non-diversified series of BNY Mellon Variable Investment Fund (the “Company”), which is registered under the Investment Company Act of 1940, as amended (the “Act”), as an open-end management investment company and operates as a series company currently offering seven series, including the fund. The fund is only offered to separate accounts established by insurance companies to fund variable annuity contracts and variable life insurance policies. The fund’s investment objective is to seek long-term capital growth, current income and growth of income consistent with reasonable investment risk. BNY Mellon Investment Adviser, Inc. (the “Adviser”), a wholly-owned subsidiary of The Bank of New York Mellon Corporation (“BNY Mellon”), serves as the fund’s investment adviser.
Effective June 3, 2019, the Company changed its name from Dreyfus Variable Investment Fund to BNY Mellon Variable Investment Fund. In addition, The Dreyfus Corporation, the fund’s investment adviser, changed its name to “BNY Mellon Investment Adviser, Inc.”, MBSC Securities Corporation, the fund’s distributor, changed its name to “BNY Mellon Securities Corporation” and Dreyfus Transfer, Inc., the fund’s transfer agent, changed its name to “BNY Mellon Transfer, Inc.”
BNY Mellon Securities Corporation (the “Distributor”), a wholly-owned subsidiary of the Adviser, is the distributor of the fund’s shares, which are sold without a sales charge. The fund is authorized to issue an unlimited number of $.001 par value shares of Beneficial Interest in each of the following classes of shares: Initial and Service. Each class of shares has identical rights and privileges, except with respect to the Distribution Plan, and the expenses borne by each class, the allocation of certain transfer agency costs, and certain voting rights. Income, expenses (other than expenses attributable to a specific class), and realized and unrealized gains or losses on investments are allocated to each class of shares based on its relative net assets.
The Company accounts separately for the assets, liabilities and operations of each series. Expenses directly attributable to each series are charged to that series’ operations; expenses which are applicable to all series are allocated among them on a pro rata basis.
The Financial Accounting Standards Board (“FASB”) Accounting Standards Codification (“ASC”) is the exclusive reference of authoritative U.S. generally accepted accounting principles (“GAAP”) recognized by the FASB to be applied by nongovernmental entities. Rules and interpretive releases of the Securities and Exchange Commission (“SEC”) under
19
NOTES TO FINANCIAL STATEMENTS(continued)
authority of federal laws are also sources of authoritative GAAP for SEC registrants. The fund is an investment company and applies the accounting and reporting guidance of the FASB ASC Topic 946 Financial Services-Investment Companies. The fund’s financial statements are prepared in accordance with GAAP, which may require the use of management estimates and assumptions. Actual results could differ from those estimates.
The Companyenters into contracts that contain a variety of indemnifications. The fund’s maximum exposure under these arrangements is unknown. The fund does not anticipate recognizing any loss related to these arrangements.
(a) Portfolio valuation: The fair value of a financial instrument is the amount that would be received to sell an asset or paid to transfer a liability in an orderly transaction between market participants at the measurement date (i.e., the exit price). GAAP establishes a fair value hierarchy that prioritizes the inputs of valuation techniques used to measure fair value. This hierarchy gives the highest priority to unadjusted quoted prices in active markets for identical assets or liabilities (Level 1 measurements) and the lowest priority to unobservable inputs (Level 3 measurements).
Additionally, GAAP provides guidance on determining whether the volume and activity in a market has decreased significantly and whether such a decrease in activity results in transactions that are not orderly. GAAP requires enhanced disclosures around valuation inputs and techniques used during annual and interim periods.
Various inputs are used in determining the value of the fund’s investments relating to fair value measurements. These inputs are summarized in the three broad levels listed below:
Level 1—unadjusted quoted prices in active markets for identical investments.
Level 2—other significant observable inputs (including quoted prices for similar investments, interest rates, prepayment speeds, credit risk, etc.).
Level 3—significant unobservable inputs (including the fund’s own assumptions in determining the fair value of investments).
The inputs or methodology used for valuing securities are not necessarily an indication of the risk associated with investing in those securities.
20
Changes in valuation techniques may result in transfers in or out of an assigned level within the disclosure hierarchy. Valuation techniques used to value the fund’s investments are as follows:
Investments in equity securities are valued at the last sales price on the securities exchange or national securities market on which such securities are primarily traded. Securities listed on the National Market System for which market quotations are available are valued at the official closing price or, if there is no official closing price that day, at the last sales price. For open short positions, asked prices are used for valuation purposes. Bid price is used when no asked price is available. Registered investment companies that are not traded on an exchange are valued at their net asset value. All of the preceding securities are generally categorized within Level 1 of the fair value hierarchy.
Securities not listed on an exchange or the national securities market, or securities for which there were no transactions, are valued at the average of the most recent bid and asked prices. These securities are generally categorized within Level 2 of the fair value hierarchy.
Fair valuing of securities may be determined with the assistance of a pricing service using calculations based on indices of domestic securities and other appropriate indicators, such as prices of relevant American Depository Receipts and futures. Utilizing these techniques may result in transfers between Level 1 and Level 2 of the fair value hierarchy.
When market quotations or official closing prices are not readily available, or are determined not to accurately reflect fair value, such as when the value of a security has been significantly affected by events after the close of the exchange or market on which the security is principally traded (for example, a foreign exchange or market), but before the fund calculates its net asset value, the fund may value these investments at fair value as determined in accordance with the procedures approved by the Company’s Board of Trustees (the “Board”). Certain factors may be considered when fair valuing investments such as: fundamental analytical data, the nature and duration of restrictions on disposition, an evaluation of the forces that influence the market in which the securities are purchased and sold, and public trading in similar securities of the issuer or comparable issuers. These securities are either categorized within Level 2 or 3 of the fair value hierarchy depending on the relevant inputs used.
For restricted securities where observable inputs are limited, assumptions about market activity and risk are used and such securities are generally categorized within Level 3 of the fair value hierarchy.
21
NOTES TO FINANCIAL STATEMENTS(continued)
The following is a summary of the inputs used as of December 31, 2019in valuing the fund’s investments:
| | | | | |
| | Level 1-Unadjusted Quoted Prices | Level 2-Other Significant Observable Inputs | Level 3-Significant Unobservable Inputs | Total |
Assets ($) | | | | |
Investments in Securities:† | | |
Equity Securities—Common Stocks | 85,434,962 | – | – | 85,434,962 |
Exchange-Traded Funds | 414,626 | – | – | 414,626 |
Investment Companies | 585,555 | – | – | 585,555 |
† See Statement of Investments for additional detailed categorizations, if any.
(b)Securities transactions and investment income: Securities transactions are recorded on a trade date basis. Realized gains and losses from securities transactions are recorded on the identified cost basis. Dividend income is recognized on the ex-dividend date and interest income, including, where applicable, accretion of discount and amortization of premium on investments, is recognized on the accrual basis.
Pursuant to a securities lending agreement with The Bank of New York Mellon, a subsidiary of BNY Mellon and an affiliate of the Adviser, the fund may lend securities to qualified institutions. It is the fund’s policy that, at origination, all loans are secured by collateral of at least 102% of the value of U.S. securities loaned and 105% of the value of foreign securities loaned. Collateral equivalent to at least 100% of the market value of securities on loan is maintained at all times. Collateral is either in the form of cash, which can be invested in certain money market mutual funds managed by the Adviser, or U.S. Government and Agency securities. The fund is entitled to receive all dividends, interest and distributions on securities loaned, in addition to income earned as a result of the lending transaction. Should a borrower fail to return the securities in a timely manner, The Bank of New York Mellon is required to replace the securities for the benefit of the fund or credit the fund with the market value of the unreturned securities and is subrogated to the fund’s rights against the borrower and the collateral. Additionally, the contractual maturity of security lending transactions are on an overnight and continuous basis. During the period ended December 31, 2019, The Bank of New York Mellon earned $1,972 from the lending of the fund’s portfolio securities, pursuant to the securities lending agreement.
22
(c) Affiliated issuers: Investments in other investment companies advised by the Adviser are considered “affiliated” under the Act.
(d) Dividends and distributions to shareholders:Dividends and distributions are recorded on the ex-dividend date. Dividends from investment income-net are normally declared and paid quarterly. Dividends from net realized capital gains, if any, are normally declared and paid annually, but the fund may make distributions on a more frequent basis to comply with the distribution requirements of the Internal Revenue Code of 1986, as amended (the “Code”). To the extent that net realized capital gains can be offset by capital loss carryovers, it is the policy of the fund not to distribute such gains. Income and capital gain distributions are determined in accordance with income tax regulations, which may differ from GAAP.
(e) Federal income taxes: It is the policy of the fund to continue to qualify as a regulated investment company, if such qualification is in the best interests of its shareholders, by complying with the applicable provisions of the Code, and to make distributions of taxable income and net realized capital gain sufficient to relieve it from substantially all federal income and excise taxes.
As of and during the period ended December 31, 2019, the fund did not have any liabilities for any uncertain tax positions. The fund recognizes interest and penalties, if any, related to uncertain tax positions as income tax expense in the Statement of Operations. During the period ended December 31, 2019, the fund did not incur any interest or penalties.
Each tax year in the four year period ended December 31, 2019 remains subject to examination by the Internal Revenue Service and state taxing authorities.
At December 31, 2019, the components of accumulated earnings on a tax basis were as follows: undistributed ordinary income $106,647 undistributed capital gains $6,113,799 and unrealized appreciation $22,806,682.
The tax character of distributions paid to shareholders during the fiscal periods ended December 31, 2019 and December 31, 2018 were as follows: ordinary income $951,352 and $2,574,824, and long-term capital gains $9,080,231 and $5,974,802, respectively.
(f) New Accounting Pronouncements: Effective June 1, 2019, the fund adopted Accounting Standards Update 2018-13, Fair Value Measurement (Topic 820): Disclosure Framework—Changes to the Disclosure Requirements for Fair Value Measurement (“ASU 2018-13”). The update
23
NOTES TO FINANCIAL STATEMENTS(continued)
provides guidance that eliminates, adds and modifies certain disclosure requirements for fair value measurements. The adoption of ASU 2018-13 had no impact on the operations of the fund for the period ended December 31, 2019.
NOTE 2—Bank Lines of Credit:
The fund participates with other long-term open-end funds managed by the Adviser in a $1.030 billion unsecured credit facility led by Citibank, N.A. (the “Citibank Credit Facility”) and a $300 million unsecured credit facility provided by The Bank of New York Mellon (the “BNYM Credit Facility”), each to be utilized primarily for temporary or emergency purposes, including the financing of redemptions (each, a “Facility”). The Citibank Credit Facility is available in two tranches: (i) Tranche A is in an amount equal to $830 million and is available to all long-term open-ended funds, including the fund, and (ii) Tranche B is in amount equal to $200 million and is available only to BNY Mellon Floating Rate Income Fund, a series of BNY Mellon Investment Funds IV, Inc. In connection therewith, the fund has agreed to pay its pro rata portion of commitment fees for Tranche A of the Citibank Credit Facility and the BNYM Credit Facility. Interest is charged to the fund based on rates determined pursuant to the terms of the respective Facility at the time of borrowing. During the period ended December 31, 2019, the fund did not borrow under the Facilities.
NOTE 3—Investment Advisory Fee and Other Transactions with Affiliates:
(a)Pursuant to an investment advisory agreement with the Adviser, the investment advisory fee is computed at the annual rate of .75% of the value of the fund’s average daily net assets and is payable monthly.
(b)Under the Distribution Plan adopted pursuant to Rule 12b-1 under the Act, Service shares pay the Distributor for distributing its shares, for servicing and/or maintaining Service shares’ shareholder accounts and for advertising and marketing for Service shares. The Distribution Plan provides for payments to be made at an annual rate of .25% of the value of the Service shares’ average daily net assets. The Distributor may make payments to Participating Insurance Companies and to brokers and dealers acting as principal underwriter for their variable insurance products. The fees payable under the Distribution Plan are payable without regard to actual expenses incurred. During the period ended December 31, 2019,Service shares were charged $11,048 pursuant to the Distribution Plan.
The fund has an arrangement with the transfer agent whereby the fund may receive earnings credits when positive cash balances are maintained, which are used to offset transfer agency fees. The fund had an
24
arrangement with the custodian to receive earnings credits when positive cash balances were maintained, which were used to offset custody fees. Effective February 1, 2019, the arrangement with the custodian changed whereby the fund will no longer receive earnings credits to offset its custody fees and will receive interest income or overdraft fees going forward. For financial reporting purposes, the fund includes net earnings credits, if any, as an expense offset in the Statement of Operations.
The fund compensates BNY Mellon Transfer, Inc., a wholly-owned subsidiary of the Adviser, under a transfer agency agreement for providing transfer agency and cash management services for the fund. The majority of transfer agency fees are comprised of amounts paid on a per account basis, while cash management fees are related to fund subscriptions and redemptions. During the period ended December 31, 2019, the fund was charged $580 for transfer agency services. These fees are included in Shareholder servicing costs in the Statement of Operations.
The fund compensates The Bank of New York Mellon under a custody agreement for providing custodial services for the fund. These fees are determined based on net assets, geographic region and transaction activity. During the period ended December 31, 2019, the fund was charged $7,049 pursuant to the custody agreement.
During the period ended December 31, 2019, the fund was charged $11,793 for services performed by the Chief Compliance Officer and his staff. These fees are included in Chief Compliance Officer fees in the Statement of Operations.
The components of “Due to BNY Mellon Investment Adviser, Inc. and affiliates” in the Statement of Assets and Liabilities consist of: investment advisory fees of $54,635, Distribution Plan fees of $937, custodian fees of $2,800, Chief Compliance Officer fees of $3,261 and transfer agency fees of $120.
(c) Each Board member also serves as a Board member of other funds in the BNY Mellon Family of Funds complex. Annual retainer fees and attendance fees are allocated to each fund based on net assets.
NOTE 4—Securities Transactions:
The aggregate amount of purchases and sales of investment securities, excluding short-term securities, during the period ended December 31, 2019, amounted to $49,506,280 and $56,669,546, respectively.
At December 31, 2019, the cost of investments for federal income tax purposes was $63,628,461; accordingly, accumulated net unrealized
25
NOTES TO FINANCIAL STATEMENTS(continued)
appreciation on investments was $22,806,682, consisting of $23,890,016 gross unrealized appreciation and $1,083,334 gross unrealized depreciation.
26
REPORT OF INDEPENDENT REGISTERED PUBLIC ACCOUNTING FIRM
To the Shareholders and the Board of Trustees of Growth and Income Portfolio
Opinion on the Financial Statements
We have audited the accompanying statement of assets and liabilities of Growth and Income Portfolio (the “Fund”) (one of the funds constituting BNY Mellon Variable Investment Fund), including the statements of investments and investments in affiliated issuers, as of December 31, 2019, and the related statement of operations for the year then ended, the statements of changes in net assets for each of the two years in the period then ended, the financial highlights for each of the five years in the period then ended and the related notes (collectively referred to as the “financial statements”). In our opinion, the financial statements present fairly, in all material respects, the financial position of the Fund (one of the funds constituting BNY Mellon Variable Investment Fund) at December 31, 2019, the results of its operations for the year then ended, the changes in its net assets for each of the two years in the period then ended and its financial highlights for each of the five years in the period then ended, in conformity with U.S. generally accepted accounting principles.
Basis for Opinion
These financial statements are the responsibility of the Fund’s management. Our responsibility is to express an opinion on the Fund’s financial statements based on our audits. We are a public accounting firm registered with the Public Company Accounting Oversight Board (United States) (“PCAOB”) and are required to be independent with respect to the Fund in accordance with the U.S. federal securities laws and the applicable rules and regulations of the Securities and Exchange Commission and the PCAOB.
We conducted our audits in accordance with the standards of the PCAOB. Those standards require that we plan and perform the audit to obtain reasonable assurance about whether the financial statements are free of material misstatement, whether due to error or fraud. The Fund is not required to have, nor were we engaged to perform, an audit of the Fund’s internal control over financial reporting. As part of our audits, we are required to obtain an understanding of internal control over financial reporting, but not for the purpose of expressing an opinion on the effectiveness of the Fund’s internal control over financial reporting. Accordingly, we express no such opinion.
Our audits included performing procedures to assess the risks of material misstatement of the financial statements, whether due to error or fraud, and performing procedures that respond to those risks. Such procedures included examining, on a test basis, evidence regarding the amounts and disclosures in the financial statements. Our procedures included confirmation of securities owned as of December 31, 2019, by correspondence with the custodian and others or by other appropriate auditing procedures where replies from others were not received. Our audits also included evaluating the accounting principles used and significant estimates made by management, as well as evaluating the overall presentation of the financial statements. We believe that our audits provide a reasonable basis for our opinion.

We have served as the auditor of one or more investment companies in the BNY Mellon Family of Funds since at least 1957, but we are unable to determine the specific year.
New York, New York
February 10, 2020
27
IMPORTANT TAX INFORMATION(Unaudited)
For federal tax purposes, the portfolio hereby reports 100% of the ordinary dividends paid during the fiscal year ended December 31, 2019 as qualifying for the corporate dividends received deduction. Shareholders will receive notification in early 2020 of the percentage applicable to the preparation of their 2019 income tax returns. Also, the portfolio hereby reports $.0294 per share as a short-term capital gain distribution and $3.5122 per share as a long-term capital gain distribution paid on March 29, 2019.
28
BOARD MEMBERS INFORMATION(Unaudited)
INDEPENDENT BOARD MEMBERS
Joseph S. DiMartino (76)
Chairman of the Board (1995)
Principal Occupation During Past 5 Years:
· Corporate Director and Trustee (1995-Present)
Other Public Company Board Memberships During Past 5 Years:
· CBIZ, Inc., a public company providing professional business services, products and solutions,Director (1997-Present)
No. of Portfolios for which Board Member Serves:118
———————
Peggy C. Davis (76)
Board Member (2006)
Principal Occupation During Past 5 Years:
· Shad Professor of Law, New York University School of Law (1983-present)
No. of Portfolios for which Board Member Serves: 43
———————
Gina D. France (61)
Board Member (2019)
Principal Occupation During Past 5 Years:
· Founder, President and Chief Executive Officer, France Strategic Partners, a strategy and advisory firm serving corporate clients across the United States (2003 –Present)
· Corporate Director and Trustee (2004 – Present)
Other Public Company Board Memberships During Past 5 Years:
· Huntington Bancshares, a bank holding company headquartered in Columbus, Ohio,Director(2016 – Present)
· Cedar Fair, L.P., a publicly-traded partnership that owns and operates amusement parks and hotels in the U.S. and Canada,Director (2011 – Present)
· CBIZ (formerly, Century Business Services, Inc.), a provider of outsourcing functions for small and medium size companies,Director(2015 – Present)
· Baldwin Wallace University,Trustee (2013- Present)
· FirstMerit Corporation, a diversified financial services company,Director (2004 – 2016)
No. of Portfolios for which Board Member Serves:29
———————
29
BOARD MEMBERS INFORMATION (Unaudited) (continued)
INDEPENDENT BOARD MEMBERS (continued)
Joan Gulley (72)
Board Member (2017)
Principal Occupation During Past 5 Years:
· PNC Financial Services Group, Inc.(1993-2014), Executive Vice President and Chief Human Resources Officer and Executive Committee Member (2008-2014)
· Director, Nantucket Library (2015-Present)
No. of Portfolios for which Board Member Serves:49
———————
Ehud Houminer (79)
Board Member (2006)
Principal Occupation During Past 5 Years:
· Board of Overseers at the Columbia Business School, Columbia University (1992-Present)
· Trustee, Ben Gurion University (2012-2018)
No. of Portfolios for which Board Member Serves:49
———————
Robin A. Melvin (56)
Board Member (2012)
Principal Occupation During Past 5 Years:
· Co-chairman, Mentor Illinois, a non-profit organization dedicated to increasing the quantity and quality of mentoring services in Illinois; (2014-Present); Board member (2013-Present)
No. of Portfolios for which Board Member Serves:96
———————
Once elected all Board Members serve for an indefinite term, but achieve Emeritus status upon reaching age 80. The address of the Board Members and Officers is c/o BNY Mellon Investment Adviser, Inc. 240 Greenwich Street, New York, New York 10286. Additional information about the Board Members is available in the fund’s Statement of Additional Information which can be obtained from the Adviser free of charge by calling this toll free number: 1-800-373-9387.
David P. Feldman, Emeritus Board Member
James F. Henry, Emeritus Board Member
Lynn Martin, Emeritus Board Member
Dr. Martin Peretz, Emeritus Board Member
Philip L. Toia, Emeritus Board Member
30
OFFICERS OF THE FUND(Unaudited)
RENEE LAROCHE-MORRIS, President since May 2019.
President and a director of BNY Mellon Investment Adviser, Inc. since January 2018. She is an officer of 62 investment companies (comprised of 118 portfolios) managed by the Adviser. She is 48 years old and has been an employee of BNY Mellon since 2003.
JAMES WINDELS, Treasurer since November 2001.
Director- BNY Mellon Fund Administration, and an officer of 63 investment companies (comprised of 141 portfolios) managed by the Adviser. He is 61 years old and has been an employee of the Adviser since April 1985.
BENNETT A. MACDOUGALL, Chief Legal Officer since October 2015.
Chief Legal Officer of the Adviser and Associate General Counsel and Managing Director of BNY Mellon since June 2015; Director and Associate General Counsel of Deutsche Bank – Asset & Wealth Management Division from June 2005 to June 2015, and as Chief Legal Officer of Deutsche Investment Management Americas Inc. from June 2012 to May 2015. He is an officer of 63 investment companies (comprised of 141 portfolios) managed by the Adviser. He is 48 years old and has been an employee of the Adviser since June 2015.
DAVID DIPETRILLO, Vice President since May 2019.
Head of North America Product, BNY Mellon Investment Management since January 2018, Director of Product Strategy, BNY Mellon Investment Management from January 2016 to December 2017; Head of US Retail Product and Channel Marketing, BNY Mellon Investment Management from January 2014 to December 2015. He is an officer of 62 investment companies (comprised of 118 portfolios) managed by the Adviser. He is 41 years old and has been an employee of BNY Mellon since 2005.
JAMES BITETTO, Vice President since August 2005 and Secretary since February 2018.
Senior Managing Counsel of BNY Mellon since December 2019; Managing Counsel of BNY Mellon from April 2014 to December 2019; Secretary of the Adviser, and an officer of 63 investment companies (comprised of 141 portfolios) managed by the Adviser. He is 53 years old and has been an employee of the Adviser since December 1996.
SONALEE CROSS, Vice President and Assistant Secretary since March 2018.
Counsel of BNY Mellon since October 2016; Associate at Proskauer Rose LLP from April 2016 to September 2016; Attorney at EnTrust Capital from August 2015 to February 2016; Associate at Sidley Austin LLP from September 2013 to August 2015. She is an officer of 63 investment companies (comprised of 141 portfolios) managed by the Adviser. She is 32 years old and has been an employee of the Adviser since October 2016.
DEIRDRE CUNNANE, Vice President and Assistant Secretary since March 2019.
Counsel of BNY Mellon since August 2018; Senior Regulatory Specialist at BNY Mellon Investment Management Services from February 2016 to August 2018; Trustee Associate at BNY Mellon Trust Company (Ireland) Limited from August 2013 to February 2016. She is an officer of 63 investment companies (comprised of 141 portfolios) managed by the Adviser. She is 29 years old and has been an employee of the Adviser since August 2018.
SARAH S. KELLEHER, Vice President and Assistant Secretary since April 2014.
Managing Counsel of BNY Mellon since December 2017, Senior Counsel of BNY Mellon from March 2013 to December 2017. She is an officer of 63 investment companies (comprised of 141 portfolios) managed by the Adviser. She is 44 years old and has been an employee of the Adviser since March 2013.
JEFF PRUSNOFSKY, Vice President and Assistant Secretary since August 2005.
Senior Managing Counsel of BNY Mellon, and an officer of 63 investment companies (comprised of 141 portfolios) managed by the Adviser. He is 54 years old and has been an employee of the Adviser since October 1990.
PETER M. SULLIVAN, Vice President and Assistant Secretary since March 2019.
Managing Counsel of BNY Mellon, and an officer of 63 investment companies (comprised of 141 portfolios) managed by the Adviser. He is 51 years old and has been an employee of the Adviser since April 2004.
31
OFFICERS OF THE FUND (Unaudited)(continued)
NATALYA ZELENSKY, Vice President and Assistant Secretary since March 2017.
Managing Counsel of BNY Mellon since December 2019; Counsel of BNY Mellon from May 2016 to December 2019; Attorney at Wildermuth Endowment Strategy Fund/Wildermuth Advisory, LLC from November 2015 to May 2016 and Assistant General Counsel at RCS Advisory Services from July 2014 to November 2015. She is an officer of 63 investment companies (comprised of 141 portfolios) managed by the Adviser. She is 34 years old and has been an employee of the Adviser since May 2016.
GAVIN C. REILLY, Assistant Treasurer since December 2005.
Tax Manager - BNY Mellon Fund Administration, and an officer of 63 investment companies (comprised of 141 portfolios) managed by the Adviser. He is 51 years old and has been an employee of the Adviser since April 1991.
ROBERT S. ROBOL, Assistant Treasurer since August 2005.
Senior Accounting Manager- BNY Mellon Fund Administration, and an officer of 63 investment companies (comprised of 141 portfolios) managed by the Adviser. He is 55 years old and has been an employee of the Adviser since October 1988.
ROBERT SALVIOLO, Assistant Treasurer since July 2007.
Senior Accounting Manager – BNY Mellon Fund Administration, and an officer of 63 investment companies (comprised of 141 portfolios) managed by the Adviser. He is 52 years old and has been an employee of the Adviser since June 1989.
ROBERT SVAGNA, Assistant Treasurer since December 2002.
Senior Accounting Manager – BNY Mellon Fund Administration, and an officer of 63 investment companies (comprised of 141 portfolios) managed by the Adviser. He is 52 years old and has been an employee of the Adviser since November 1990.
JOSEPH W. CONNOLLY, Chief Compliance Officer since October 2004.
Chief Compliance Officer of the Adviser, the BNY Mellon Family of Funds and BNY Mellon Funds Trust (63 investment companies, comprised of 141 portfolios). He is 62 years old and has served in various capacities with the Adviser since 1980, including manager of the firm’s Fund Accounting Department from 1997 through October 2001.
CARIDAD M. CAROSELLA, Anti-Money Laundering Compliance Officer since January 2016.
Anti-Money Laundering Compliance Officer of the BNY Mellon Family of Funds and BNY Mellon Funds Trust since January 2016; from May 2015 to December 2015, Interim Anti-Money Laundering Compliance Officer of the BNY Mellon Family of Funds and BNY Mellon Funds Trust and the Distributor; from January 2012 to May 2015, AML Surveillance Officer of the Distributor. She is an officer of 56 investment companies (comprised of 134 portfolios) managed by the Adviser. She is 51 years old and has been an employee of the Distributor since 1997.
32
NOTES
33
BNY Mellon Variable Investment Fund, Growth and Income Portfolio
240 Greenwich Street
New York, NY 10286
Adviser
BNY Mellon Investment Adviser, Inc.
240 Greenwich Street
New York, NY 10286
Custodian
The Bank of New York Mellon
240 Greenwich Street
New York, NY 10286
Transfer Agent &
Dividend Disbursing Agent
BNY Mellon Transfer, Inc.
240 Greenwich Street
New York, NY 10286
Distributor
BNY Mellon Securities Corporation
240 Greenwich Street
New York, NY 10286
Telephone 1-800-258-4260 or 1-800-258-4261
Mail The BNY Mellon Family of Funds, 144 Glenn Curtiss Boulevard, Uniondale, NY 11556-0144 Attn: Institutional Services Department
E-mailSend your request to info@bnymellon.com
InternetInformation can be viewed online or downloaded atwww.bnymellonim.com/us
The fund files its complete schedule of portfolio holdings with the Securities and Exchange Commission (“SEC”) for the first and third quarters of each fiscal year on Form N-PORT. The fund’s Forms N-PORT are available on the SEC’s website atwww.sec.gov.
A description of the policies and procedures that the fund uses to determine how to vote proxies relating to portfolio securities and information regarding how the fund voted these proxies for the most recent 12-month period ended June 30 is available atwww.bnymellonim.com/us and on the SEC’s website at www.sec.gov and without charge, upon request, by calling 1-800-373-9387.
| | |
© 2020 BNY Mellon Securities Corporation
0108AR1219 | 
|
BNY Mellon Variable Investment Fund, International Equity Portfolio
| |
ANNUAL REPORT December 31, 2019 |

| |
The views expressed in this report reflect those of the portfolio manager(s) only through the end of the period covered and do not necessarily represent the views of BNY Mellon Investment Adviser, Inc. or any other person in the BNY Mellon Investment Adviser, Inc. organization. Any such views are subject to change at any time based upon market or other conditions and BNY Mellon Investment Adviser, Inc. disclaims any responsibility to update such views. These views may not be relied on as investment advice and, because investment decisions for a fund in the BNY Mellon Family of Funds are based on numerous factors, may not be relied on as an indication of trading intent on behalf of any fund in the BNY Mellon Family of Funds. |
| |
Not FDIC-Insured • Not Bank-Guaranteed • May Lose Value |
Contents
THE FUND
FOR MORE INFORMATION
Back Cover
| | | | |
| |
BNY Mellon Variable Investment Fund, International Equity Portfolio
| | The Fund |
A LETTER FROM THE PRESIDENT OF BNY MELLON INVESTMENT ADVISER, INC.
Dear Shareholder:
We are pleased to present this annual report for BNY Mellon Variable Investment Fund, International Equity Portfolio (formerly, Dreyfus Variable Investment Fund, International Equity Portfolio), covering the 12-month period from January 1, 2019 through December 31, 2019. For information about how the fund performed during the reporting period, as well as general market perspectives, we provide a Discussion of Fund Performance on the pages that follow.
In January 2019, a pivot in stance from the U.S. Federal Reserve (the “Fed”) helped stimulate a rebound across equity markets that continued into the second quarter of the year. However, escalating trade tensions disrupted equity markets in May. The dip was short-lived, as markets rose once again in June and July of 2019, when a trade deal appeared more likely and the pace of U.S. economic growth remained steady. Nevertheless, concerns continued to emerge over slowing global growth, resulting in bouts of market volatility in August 2019. Stocks rebounded in September and continued an upward path through most of October 2019, bolstered by central bank policy and consistent consumer spending. The rally generally continued through the end of the period, supported in part by an announcement from President Trump that the first phase of a trade deal with China was in process. U.S. equity markets reached new highs during the final months of the period.
In fixed-income markets, the year began with a recovery from the prior months’ volatility. After the Fed’s supportive statements in January 2019, other developed-market central banks followed suit and reiterated their abilities to buttress flagging growth rates by continuing accommodative policies. The Fed cut rates in July, September and October 2019, for a total 75 basis point reduction in the federal funds rate during the 12 months. Rates across much of the Treasury curve saw a slight increase during the month of November, and the long end of the curve rose in December. The yield curve steepened during the latter portion of the period. However, demand for fixed-income instruments during the year was strong, which helped to support positive bond market returns.
We believe that over the near term, the outlook for the U.S. remains positive, but we will monitor relevant data for any signs of a change. As always, we encourage you to discuss the risks and opportunities in today’s investment environment with your financial advisor.
Thank you for your continued confidence and support.
Sincerely,

Renee LaRoche-Morris
President
BNY Mellon Investment Adviser, Inc.
January 15, 2020
2
DISCUSSION OF FUND PERFORMANCE(Unaudited)
For the period from January 1, 2019 through December 31, 2019, as provided by the fund’s primary portfolio managers, Paul Markham, Jeff Munroe and Yuko Takano of Newton Investment Management Limited (“Newton”), Sub-Investment Adviser
Market and Fund Performance Overview
For the 12-month period ended December 31, 2019, BNY Mellon Variable Investment Fund, International Equity Portfolio’s (formerly, Dreyfus Variable Investment Fund, International Equity Portfolio) Initial Shares produced a total return of 20.06%, and its Service Shares produced a total return of 19.77%.1 This compares with a 22.01% return produced by the fund’s benchmark, the MSCI EAFE Index (the “Index”), for the same period.2
International equities posted strong gains over the reporting period, amid supportive central bank policies and a challenging geopolitical landscape. Underperformance was driven by stock selection in information technology, communication services and each of the consumer sectors.
The Fund’s Investment Approach
The fund seeks capital growth by investing at least 80% of its net assets, plus any borrowings for investment purposes, in stocks of foreign companies and depositary receipts evidencing ownership in such securities. At least 75% of the fund’s net assets will be invested in countries represented in the Index. The fund may invest up to 25% of its net assets in stocks of companies located in countries (other than the United States) not represented in the Index, including up to 20% in emerging-market countries.
The core of the investment philosophy of Newton, an affiliate of BNY Mellon Investment Adviser, Inc., the fund’s investment adviser, is the belief that no company, market or economy can be considered in isolation; each must be understood within a global context. Newton believes that a global comparison of companies is the most effective method of stock analysis, and Newton’s global analysts research investment opportunities by global sector rather than by region. The process begins by identifying a core list of investment themes that Newton believes will positively or negatively affect certain sectors or industries and cause stocks within these sectors or industries to outperform or underperform others. Newton then identifies specific companies using these investment themes to help focus on areas where thematic and strategic research indicates superior returns are likely to be achieved.
Sell decisions for individual stocks will typically be a result of one or more of the following: a change in investment theme or strategy; profit-taking; a significant change in the prospects of the company; price movement and market activity have created an extreme valuation; or the valuation of a company has become expensive against its peers.
Markets Pivot on Central Bank Statements and Trade Policy
International equity markets were challenged by an array of geopolitical developments in 2019. These ranged from civil protests in Hong Kong and attacks on Saudi Arabia’s oil infrastructure, to an impeachment inquiry against the U.S. president and the seemingly interminable Brexit saga in the U.K. However, greater certainty as to the timing, and the
3
DISCUSSION OF FUND PERFORMANCE(Unaudited) (continued)
ultimate nature, of Brexit was eventually reached, as Boris Johnson’s government negotiated a revised withdrawal agreement, and then gained a meaningful parliamentary majority following December’s general election. It was, however, the continuing trade tensions between the U.S. and China that remained the key variable shaping investor sentiment for much of the period. Alternating signs of progress and deterioration in the trade dispute between the two nations persistently fueled volatility in equity markets, although the year concluded with President Trump indicating that he would sign the first phase of a deal.
Although a pivot away from the U.S. Federal Reserve’s (the “Fed”) prior course of monetary policy normalization heralded a rebound in equities over the start of the year, mounting cyclical and geopolitical concerns ensured that market volatility was never far away. The Fed moved to cut interest rates in July, September and October to support weak inflation and flagging growth. During the 12 months, the European Central Bank announced yet another phase of quantitative easing as well. This monetary stimulus, in tandem with an apparent easing of short-term, trade-war tensions, bolstered sentiment and enabled international equities to deliver a positive return.
Security Selections Dampened Fund Results
During the 12 months, underperformance was driven by some disappointing stock selection in information technology, communication services and each of the consumer sectors. Concerns around domestic demand in India continued to weigh on Suzuki Motor. Despite some initial optimism around a good Indian recovery over the second half, investor concern grew that a slowdown in the country’s automobile market may persist. After a strong year of performance in 2018, Thales, which provides electrical systems and services for the aerospace, defense, transportation and security markets, struggled, as the prospect of a global economic slowdown contributed to a downbeat start to the year. With some investors having adopted a more cautious view on its aerospace and transport divisions, the company subsequently announced a cut to its full-year, organic growth forecast and a decline in order intake over the first nine months of the year. Given a downturn in commercial satellite markets and delays in the signing of some defense contracts, as well as some production concerns, we believe the issues being experienced by Thales are predominantly cyclical in nature.
Conversely, stock picking aided relative returns in financials and industrials. Although the market has the potential to become jittery over acquisition risk at times, TechnoPro Holdings contributed positively to relative returns over the year, as its staffing business continued to benefit from its position at the confluence between general labor shortages in Japan and a global lack of information technology professionals. Indeed, it remains particularly attractive from a thematic perspective and, given its sustainable, low-teens earnings growth, does not appear unduly valued in our view. M3 performed strongly over 2019, as shares continued to march higher. It is a Japanese company that offers digital solutions and real-life services to various customers within the health care space, and it is benefiting from a shift to digital and the need to drive greater efficiency across the industry.
Finding Opportunities in a Challenging Environment
We believe political risks are likely to remain elevated over the coming year, as global trade tensions continue, the U.S. gears up for a presidential election, and Brexit trade discussions remain at an early stage. Furthermore, long-term structural factors remain, which present a
4
threat to global growth. Debt in the world’s major economies is at historically high levels, while the changing climate and technological innovation have the potential to disrupt industries across the world. The Chinese economy, widely viewed as the engine driving global growth, has continued to lose momentum, and the country faces significant debt and liquidity challenges. Thus, it is not difficult to envisage a scenario where the headwinds facing equity markets persist.
In this uncertain environment, we continue to focus the portfolio on stocks with a visible growth trajectory, with a distinctive product or positioning advantage and the tailwind of thematic support. As we noted at the end of the third quarter, we think the portfolio is positioned well for the current environment and we believe this has been borne out in recent performance.
January 15, 2020
1 Total return includes reinvestment of dividends and any capital gains paid. Past performance is no guarantee of future results. Share price and investment return fluctuate such that upon redemption, fund shares may be worth more or less than their original cost. The fund’s performance does not reflect the deduction of additional charges and expenses imposed in connection with investing in variable insurance contracts, which will reduce returns.
2 Source: Lipper Inc. — The MSCI EAFE Index (Europe, Australasia, Far East) is a free float-adjusted, market capitalization-weighted index that is designed to measure the equity market performance of developed markets, excluding the U.S. and Canada. It reflects reinvestment of net dividends and, where applicable, capital gain distributions. Investors cannot invest directly in any index.
Equities are subject generally to market, market sector, market liquidity, issuer and investment style risks, among other factors, to varying degrees, all of which are more fully described in the fund’s prospectus.
The fund’s performance will be influenced by political, social and economic factors affecting investments in foreign companies. Special risks associated with investments in foreign companies include exposure to currency fluctuations, less liquidity, less developed or less efficient trading markets, lack of comprehensive company information, political instability and differing auditing and legal standards. These risks are enhanced in emerging-market countries.
The fund may, but is not required to, use derivative instruments. A small investment in derivatives could have a potentially large impact on the fund's performance. The use of derivatives involves risks different from, or possibly greater than, the risks associated with investing directly in the underlying assets.
The fund is only available as a funding vehicle under variable life insurance policies or variable annuity contracts issued by insurance companies. Individuals may not purchase shares of the fund directly. A variable annuity is an insurance contract issued by an insurance company that enables investors to accumulate assets on a tax-deferred basis for retirement or other long-term goals. The investment objective and policies of BNY Mellon Variable Investment Fund, International Equity Portfolio, made available through insurance products, may be similar to those of other funds managed or advised by BNY Mellon Investment Adviser, Inc. However, the investment results of the fund may be higher or lower than, and may not be comparable to, those of any other BNY Mellon Investment Adviser, Inc. fund.
5
FUND PERFORMANCE(Unaudited)
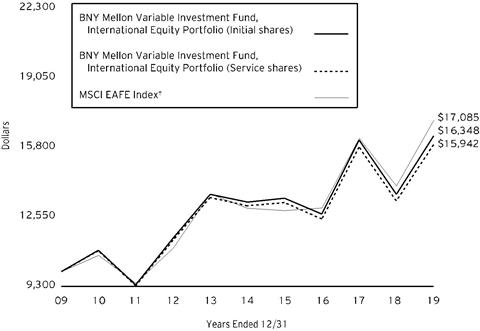
Comparison of change in value of a $10,000 investment in Initial shares and Service shares of BNY Mellon Variable Investment Fund, International Equity Portfolio with a hypothetical investment of $10,000 in the MSCI EAFE Index (the “Index”)
† Source: Lipper Inc.
Past performance is not predictive of future performance. The fund’s performance does not reflect the deduction of additional charges and expenses imposed in connection with investing in variable insurance contracts which will reduce returns.
The above graph compares a hypothetical $10,000 investment made in Initial and Service shares of BNY Mellon Variable Investment Fund, International Equity Portfolio on 12/31/09 to a hypothetical investment of $10,000 made in the Index on that date.
The fund’s performance shown in the line graph above takes into account all applicable fund fees and expenses for Initial and Service shares. The Index (Europe, Australasia, Far East) is a free float-adjusted market capitalization-weighted index that is designed to measure the equity market performance of developed markets, excluding the U.S. and Canada. Unlike a mutual fund, the Index is not subject to charges, fees and other expenses. Investors cannot invest directly in any index. Further information relating to fund performance, including expense reimbursements, if applicable, is contained in the Financial Highlights section of the prospectus and elsewhere in this report.
6
| | | | |
Average Annual Total Returns as of 12/31/19 |
| 1 Year | 5 Years | 10 Years |
Initial shares | 20.06% | 4.29% | 5.04% |
Service shares | 19.77% | 4.04% | 4.77% |
MSCI EAFE Index | 22.01% | 5.67% | 5.50% |
The performance data quoted represents past performance, which is no guarantee of future results. Share price and investment return fluctuate and an investor’s shares may be worth more or less than original cost upon redemption. Current performance may be lower or higher than the performance quoted. Go to www.bnymellonim.com/us for the fund’s most recent month-end returns.
The fund’s Initial shares are not subject to a Rule 12b-1 fee. The fund’s Service shares are subject to a 0.25% annual Rule 12b-1 fee. All dividends and capital gain distributions are reinvested.
The fund’s performance shown in the graph and table does not reflect the deduction of taxes that a shareholder would pay on fund distributions or the redemption of fund shares.
7
UNDERSTANDING YOUR FUND’S EXPENSES(Unaudited)
As a mutual fund investor, you pay ongoing expenses, such as management fees and other expenses. Using the information below, you can estimate how these expenses affect your investment and compare them with the expenses of other funds. You also may pay one-time transaction expenses, including sales charges (loads), redemption fees and expenses associated with variable annuity or insurance contracts, which are not shown in this section and would have resulted in higher total expenses. For more information, see your fund’s prospectus or talk to your financial adviser.
Review your fund’s expenses
The table below shows the expenses you would have paid on a $1,000 investment in BNY Mellon Variable Investment Fund, International Equity Portfolio from July 1, 2019 to December 31, 2019. It also shows how much a $1,000 investment would be worth at the close of the period, assuming actual returns and expenses.
| | | | | |
Expenses and Value of a $1,000 Investment | |
Assume actual returns for the six months ended December 31, 2019 | |
| | | | |
| | Initial Shares | Service Shares | |
Expense paid per $1,000† | $7.29 | $8.59 | |
Ending value (after expenses) | $1,067.00 | $1,065.90 | |
COMPARING YOUR FUND’S EXPENSES
WITH THOSE OF OTHER FUNDS(Unaudited)
Using the SEC’s method to compare expenses
The Securities and Exchange Commission (“SEC”) has established guidelines to help investors assess fund expenses. Per these guidelines, the table below shows your fund’s expenses based on a $1,000 investment, assuming a hypothetical 5% annualized return. You can use this information to compare the ongoing expenses (but not transaction expenses or total cost) of investing in the fund with those of other funds. All mutual fund shareholder reports will provide this information to help you make this comparison. Please note that you cannot use this information to estimate your actual ending account balance and expenses paid during the period.
| | | | | |
Expenses and Value of a $1,000 Investment | |
Assuming a hypothetical 5% annualized return for the six months ended December 31, 2019 | |
| | | | |
| | Initial Shares | Service Shares | |
Expense paid per $1,000† | $7.12 | $8.39 | |
Ending value (after expenses) | $1,018.15 | $1,016.89 | |
† Expenses are equal to the fund’s annualized expense ratio of 1.40% for Initial Shares and 1.65% for Service Shares, multiplied by the average account value over the period, multiplied by 184/365 (to reflect the one-half year period). |
8
STATEMENT OF INVESTMENTS
December 31, 2019
| | | | | | | | |
| |
Description | | | | Shares | | Value ($) | |
Common Stocks - 99.8% | | | | | |
China - 2.4% | | | | | |
Alibaba Group Holding, ADR | | | | 1,857 | a | 393,870 | |
Tencent Holdings | | | | 6,779 | | 326,757 | |
| | | | | 720,627 | |
Denmark - 1.3% | | | | | |
Chr. Hansen Holding | | | | 5,002 | | 397,496 | |
France - 10.2% | | | | | |
AXA | | | | 14,377 | | 404,941 | |
Bureau Veritas | | | | 13,778 | | 359,478 | |
L'Oreal | | | | 1,837 | | 543,989 | |
Thales | | | | 5,800 | | 601,922 | |
Total | | | | 5,610 | | 309,603 | |
Valeo | | | | 6,085 | | 214,390 | |
Vivendi | | | | 20,084 | | 581,679 | |
| | | | | 3,016,002 | |
Germany - 11.1% | | | | | |
Bayer | | | | 6,781 | | 553,811 | |
Deutsche Post | | | | 13,455 | | 513,295 | |
Deutsche Wohnen | | | | 5,015 | | 204,874 | |
HELLA GmbH & Co. | | | | 3,895 | | 215,568 | |
Infineon Technologies | | | | 11,071 | | 252,216 | |
LEG Immobilien | | | | 4,428 | | 524,255 | |
SAP | | | | 7,607 | | 1,026,663 | |
| | | | | 3,290,682 | |
Hong Kong - 3.0% | | | | | |
AIA Group | | | | 84,000 | | 881,794 | |
Ireland - .8% | | | | | |
AIB Group | | | | 68,297 | | 237,947 | |
Japan - 22.4% | | | | | |
Ebara | | | | 5,100 | | 156,067 | |
FANUC | | | | 1,600 | | 299,370 | |
Japan Airlines | | | | 9,336 | | 291,882 | |
Japan Tobacco | | | | 11,500 | | 257,455 | |
M3 | | | | 8,600 | | 261,589 | |
Pan Pacific International Holdings | | | | 30,500 | | 508,357 | |
Recruit Holdings | | | | 18,505 | | 698,099 | |
Seven & i Holdings | | | | 9,900 | | 364,730 | |
Sony | | | | 11,700 | | 796,942 | |
Sugi Holdings | | | | 7,700 | | 408,191 | |
Suntory Beverage & Food | | | | 8,500 | | 355,552 | |
Suzuki Motor | | | | 15,200 | | 638,888 | |
TechnoPro Holdings | | | | 12,400 | | 873,038 | |
9
STATEMENT OF INVESTMENTS (continued)
| | | | | | | | |
| |
Description | | | | Shares | | Value ($) | |
Common Stocks - 99.8% (continued) | | | | | |
Japan - 22.4% (continued) | | | | | |
Topcon | | | | 25,800 | | 337,890 | |
Toyota Industries | | | | 7,100 | | 413,630 | |
| | | | | 6,661,680 | |
Netherlands - 4.9% | | | | | |
Royal Dutch Shell, Cl. B | | | | 23,629 | | 700,940 | |
Wolters Kluwer | | | | 10,145 | | 739,905 | |
| | | | | 1,440,845 | |
Norway - 2.2% | | | | | |
DNB | | | | 18,944 | | 353,880 | |
Mowi | | | | 12,097 | | 314,437 | |
| | | | | 668,317 | |
South Korea - 1.3% | | | | | |
Samsung SDI | | | | 1,902 | | 388,146 | |
Sweden - 1.3% | | | | | |
Swedbank, Cl. A | | | | 26,693 | | 397,416 | |
Switzerland - 13.1% | | | | | |
Alcon | | | | 4,536 | a | 256,843 | |
Credit Suisse Group | | | | 25,075 | | 339,541 | |
Lonza Group | | | | 643 | | 234,664 | |
Novartis | | | | 11,676 | | 1,108,725 | |
Roche Holding | | | | 3,497 | | 1,134,592 | |
Zurich Insurance Group | | | | 1,972 | | 809,135 | |
| | | | | 3,883,500 | |
Taiwan - 1.9% | | | | | |
Taiwan Semiconductor Manufacturing, ADR | | | | 9,913 | | 575,945 | |
United Kingdom - 23.9% | | | | | |
Anglo American | | | | 7,369 | | 212,106 | |
Associated British Foods | | | | 9,638 | | 331,674 | |
B&M European Value Retail | | | | 34,973 | | 189,748 | |
Barclays | | | | 313,082 | | 744,982 | |
Diageo | | | | 15,169 | | 643,072 | |
Ferguson | | | | 4,852 | | 440,247 | |
GlaxoSmithKline | | | | 44,373 | | 1,045,633 | |
Informa | | | | 42,271 | | 479,853 | |
M&G | | | | 15,578 | a | 48,945 | |
Persimmon | | | | 11,109 | | 396,569 | |
Prudential | | | | 15,578 | | 298,996 | |
RELX | | | | 30,532 | | 769,204 | |
Royal Bank of Scotland Group | | | | 148,959 | | 474,139 | |
St. James's Place | | | | 27,703 | | 427,318 | |
10
| | | | | | | | |
| |
Description | | | | Shares | | Value ($) | |
Common Stocks - 99.8% (continued) | | | | | |
United Kingdom - 23.9% (continued) | | | | | |
Unilever | | | | 10,193 | | 585,738 | |
| | | | | 7,088,224 | |
Total Common Stocks(cost $26,715,844) | | | | 29,648,621 | |
| | | 1-Day
Yield (%) | | | | | |
Investment Companies - .3% | | | | | |
Registered Investment Companies - .3% | | | | | |
Dreyfus Institutional Preferred Government Plus Money Market Fund
(cost $87,105) | | 1.60 | | 87,105 | b | 87,105 | |
Total Investments(cost $26,802,949) | | 100.1% | | 29,735,726 | |
Liabilities, Less Cash and Receivables | | (.1%) | | (29,452) | |
Net Assets | | 100.0% | | 29,706,274 | |
ADR—American Depository Receipt
aNon-income producing security.
bInvestment in affiliated issuer. The investment objective of this investment company is publicly available and can be found within the investment company’s prospectus.
| | |
Portfolio Summary (Unaudited)† | Value (%) |
Pharmaceuticals Biotechnology & Life Sciences | 13.7 |
Commercial & Professional Services | 11.6 |
Insurance | 8.1 |
Banks | 7.4 |
Food, Beverage & Tobacco | 6.4 |
Capital Goods | 5.0 |
Automobiles & Components | 5.0 |
Media & Entertainment | 4.7 |
Consumer Durables & Apparel | 4.0 |
Household & Personal Products | 3.8 |
Retailing | 3.7 |
Software & Services | 3.5 |
Energy | 3.4 |
Semiconductors & Semiconductor Equipment | 2.8 |
Diversified Financials | 2.7 |
Transportation | 2.7 |
Food & Staples Retailing | 2.6 |
Real Estate | 2.5 |
Technology Hardware & Equipment | 2.4 |
Materials | 2.1 |
Health Care Equipment & Services | 1.7 |
Investment Companies | .3 |
| | 100.1 |
† Based on net assets.
See notes to financial statements.
11
STATEMENT OF INVESTMENTS IN AFFILIATED ISSUERS
| | | | | | | |
Investment Companies | Value
12/31/18($) | Purchases($) | Sales($) | Value
12/31/2019($) | Net
Assets(%) | Dividends/
Distributions($) |
Registered Investment Companies; | | | |
Dreyfus Institutional Preferred Government Plus Money Market Fund | 313,118 | 8,253,691 | 8,479,704 | 87,105 | .3 | 13,197 |
See notes to financial statements.
12
STATEMENT OF FORWARD FOREIGN CURRENCY EXCHANGE CONTRACTSDecember 31, 2019
| | | | | | |
Counterparty/ Purchased
Currency | Purchased Currency
Amounts | Currency
Sold | Sold
Currency
Amounts | Settlement Date | Unrealized Appreciation (Depreciation)($) |
State Street Bank and Trust Company | | | |
Swiss Franc | 4,263 | United States Dollar | 4,401 | 1/3/2020 | 5 |
UBS Securities | | | |
British Pound | 453,000 | United States Dollar | 597,482 | 1/15/2020 | 2,821 |
United States Dollar | 557,124 | British Pound | 453,000 | 1/15/2020 | (43,179) |
Gross Unrealized Appreciation | | | 2,826 |
Gross Unrealized Depreciation | | | (43,179) |
See notes to financial statements.
13
STATEMENT OF ASSETS AND LIABILITIES
December 31, 2019
| | | | | | | |
| | | | | | |
| | | Cost | | Value | |
Assets ($): | | | | |
Investments in securities—See Statement of Investments | | | |
Unaffiliated issuers | 26,715,844 | | 29,648,621 | |
Affiliated issuers | | 87,105 | | 87,105 | |
Cash denominated in foreign currency | | | 4,434 | | 4,446 | |
Tax reclaim receivable | | 91,675 | |
Dividends and interest receivable | | 36,062 | |
Receivable for shares of Beneficial Interest subscribed | | 17,279 | |
Unrealized appreciation on forward foreign
currency exchange contracts—Note 4 | | 2,826 | |
Prepaid expenses | | | | | 1,778 | |
| | | | | 29,889,792 | |
Liabilities ($): | | | | |
Due to BNY Mellon Investment Adviser, Inc. and affiliates—Note 3(b) | | 27,899 | |
Unrealized depreciation on forward foreign
currency exchange contracts—Note 4 | | 43,179 | |
Payable for shares of Beneficial Interest redeemed | | 27,979 | |
Payable for investment securities purchased | | 4,399 | |
Trustees’ fees and expenses payable | | 200 | |
Other accrued expenses | | | | | 79,862 | |
| | | | | 183,518 | |
Net Assets ($) | | | 29,706,274 | |
Composition of Net Assets ($): | | | | |
Paid-in capital | | | | | 26,330,416 | |
Total distributable earnings (loss) | | | | | 3,375,858 | |
Net Assets ($) | | | 29,706,274 | |
| | | | |
Net Asset Value Per Share | Initial Shares | Service Shares | |
Net Assets ($) | 24,321,266 | 5,385,008 | |
Shares Outstanding | 1,262,719 | 279,762 | |
Net Asset Value Per Share ($) | 19.26 | 19.25 | |
| | | |
See notes to financial statements. | | | |
14
STATEMENT OF OPERATIONS
Year Ended December 31, 2019
| | | | | | | |
| | | | | | |
| | | | | | |
Investment Income ($): | | | | |
Income: | | | | |
Cash dividends (net of $75,556 foreign taxes withheld at source): | |
Unaffiliated issuers | | | 744,782 | |
Affiliated issuers | | | 13,197 | |
Income from securities lending—Note 1(c) | | | 5 | |
Total Income | | | 757,984 | |
Expenses: | | | | |
Investment advisory fee—Note 3(a) | | | 221,297 | |
Professional fees | | | 106,687 | |
Prospectus and shareholders’ reports | | | 18,617 | |
Custodian fees—Note 3(b) | | | 14,492 | |
Distribution fees—Note 3(b) | | | 13,943 | |
Chief Compliance Officer fees—Note 3(b) | | | 11,793 | |
Trustees’ fees and expenses—Note 3(c) | | | 2,775 | |
Loan commitment fees—Note 2 | | | 673 | |
Shareholder servicing costs—Note 3(b) | | | 333 | |
Miscellaneous | | | 16,329 | |
Total Expenses | | | 406,939 | |
Investment Income—Net | | | 351,045 | |
Realized and Unrealized Gain (Loss) on Investments—Note 4 ($): | | |
Net realized gain (loss) on investments and foreign currency transactions | 104,691 | |
Net realized gain (loss) on forward foreign currency exchange contracts | 85,132 | |
Net Realized Gain (Loss) | | | 189,823 | |
Net change in unrealized appreciation (depreciation) on investments
and foreign currency transactions | 4,825,841 | |
Net change in unrealized appreciation (depreciation) on
forward foreign currency exchange contracts | (50,482) | |
Net Change in Unrealized Appreciation (Depreciation) | | | 4,775,359 | |
Net Realized and Unrealized Gain (Loss) on Investments | | | 4,965,182 | |
Net Increase in Net Assets Resulting from Operations | | 5,316,227 | |
| | | | | | |
See notes to financial statements. | | | | | |
15
STATEMENT OF CHANGES IN NET ASSETS
| | | | | | | | | | |
| | | | Year Ended December 31, |
| | | | 2019 | | 2018 | |
Operations ($): | | | | | | | | |
Investment income—net | | | 351,045 | | | | 382,397 | |
Net realized gain (loss) on investments | | 189,823 | | | | 2,490,370 | |
Net change in unrealized appreciation
(depreciation) on investments | | 4,775,359 | | | | (8,317,693) | |
Net increase from payment by affiliate | | - | | | | 198 | |
Net Increase (Decrease) in Net Assets
Resulting from Operations | 5,316,227 | | | | (5,444,728) | |
Distributions ($): | |
Distributions to shareholders: | | | | | | | | |
Initial Shares | | | (2,304,862) | | | | (343,225) | |
Service Shares | | | (533,241) | | | | (73,009) | |
Total Distributions | | | (2,838,103) | | | | (416,234) | |
Beneficial Interest Transactions ($): | |
Net proceeds from shares sold: | | | | | | | | |
Initial Shares | | | 1,538,570 | | | | 2,198,806 | |
Service Shares | | | 256,553 | | | | 531,637 | |
Distributions reinvested: | | | | | | | | |
Initial Shares | | | 2,304,862 | | | | 343,225 | |
Service Shares | | | 533,241 | | | | 73,009 | |
Cost of shares redeemed: | | | | | | | | |
Initial Shares | | | (4,433,126) | | | | (3,974,146) | |
Service Shares | | | (1,425,294) | | | | (1,654,823) | |
Increase (Decrease) in Net Assets
from Beneficial Interest Transactions | (1,225,194) | | | | (2,482,292) | |
Total Increase (Decrease) in Net Assets | 1,252,930 | | | | (8,343,254) | |
Net Assets ($): | |
Beginning of Period | | | 28,453,344 | | | | 36,796,598 | |
End of Period | | | 29,706,274 | | | | 28,453,344 | |
Capital Share Transactions (Shares): | |
Initial Shares | | | | | | | | |
Shares sold | | | 85,082 | | | | 107,479 | |
Shares issued for distributions reinvested | | | 128,980 | | | | 16,383 | |
Shares redeemed | | | (246,980) | | | | (196,958) | |
Net Increase (Decrease) in Shares Outstanding | (32,918) | | | | (73,096) | |
Service Shares | | | | | | | | |
Shares sold | | | 14,301 | | | | 25,709 | |
Shares issued for distributions reinvested | | | 29,807 | | | | 3,481 | |
Shares redeemed | | | (79,200) | | | | (80,525) | |
Net Increase (Decrease) in Shares Outstanding | (35,092) | | | | (51,335) | |
| | | | | | | | | |
See notes to financial statements. | | | | | | | | |
16
FINANCIAL HIGHLIGHTS
The following tables describe the performance for each share class for the fiscal periods indicated. All information (except portfolio turnover rate) reflects financial results for a single fund share. Total return shows how much your investment in the fund would have increased (or decreased) during each period, assuming you had reinvested all dividends and distributions. The fund’s total returns do not reflect expenses associated with variable annuity or insurance contracts. These figures have been derived from the fund’s financial statements.
| | | | | | | |
| | | |
| | | Year Ended December 31, |
Initial Shares | | 2019 | 2018 | 2017 | 2016 | 2015 |
Per Share Data ($): | | | | | | |
Net asset value, beginning of period | | 17.67 | 21.21 | 16.85 | 18.00 | 18.35 |
Investment Operations: | | | | | | |
Investment income—neta | | .22 | .24 | .19 | .22 | .21 |
Net realized and unrealized
gain (loss) on investments | | 3.19 | (3.52) | 4.37 | (1.23) | .07 |
Total from Investment Operations | | 3.41 | (3.28) | 4.56 | (1.01) | .28 |
Distributions: | | | | | | |
Dividends from
investment income—net | | (.25) | (.26) | (.20) | (.16) | (.63) |
Dividends from
net realized capital gains | | (1.57) | - | - | - | - |
Total Distributions | | (1.82) | (.26) | (.20) | (.16) | (.63) |
Payment by affiliate | | - | .00b,c | .00b,c | .02c | - |
Net asset value, end of period | | 19.26 | 17.67 | 21.21 | 16.85 | 18.00 |
Total Return (%) | | 20.06 | (15.72)c | 27.32c | (5.54)c | 1.38 |
Ratios/Supplemental Data (%): | | | | | | |
Ratio of total expenses
to average net assets | | 1.33 | 1.31 | 1.14 | 1.17 | 1.14 |
Ratio of net expenses
to average net assets | | 1.33 | 1.31 | 1.14 | 1.17 | 1.14 |
Ratio of net investment income
to average net assets | | 1.23 | 1.17 | .97 | 1.28 | 1.13 |
Portfolio Turnover Rate | | 34.20 | 35.83 | 28.36 | 36.91 | 32.28 |
Net Assets, end of period ($ x 1,000) | | 24,321 | 22,896 | 29,037 | 24,574 | 28,330 |
a Based on average shares outstanding.
b Amount represents less than $.01 per share.
c In 2018, 2017 and 2016, the fund received proceeds from a class action settlement from The Bank of New York Mellon Corporation. In 2018 and 2017, this payment had no impact on total return. In 2016, the total return would have been (5.65%) had payment not been made by The Bank of New York Mellon Corporation.
See notes to financial statements.
17
FINANCIAL HIGHLIGHTS (continued)
| | | | | | | |
| | | |
| | | Year Ended December 31, |
Service Shares | | 2019 | 2018 | 2017 | 2016 | 2015 |
Per Share Data ($): | | | | | | |
Net asset value, beginning of period | | 17.65 | 21.19 | 16.82 | 17.97 | 18.31 |
Investment Operations: | | | | | | |
Investment income—neta | | .18 | .19 | .14 | .18 | .17 |
Net realized and unrealized
gain (loss) on investments | | 3.18 | (3.53) | 4.38 | (1.24) | .07 |
Total from Investment Operations | | 3.36 | (3.34) | 4.52 | (1.06) | .24 |
Distributions: | | | | | | |
Dividends from
investment income—net | | (.19) | (.20) | (.15) | (.11) | (.58) |
Dividends from
net realized capital gains | | (1.57) | - | - | - | - |
Total Distributions | | (1.76) | (.20) | (.15) | (.11) | (.58) |
Payment by affiliate | | - | .00b,c | .00b,c | .02c | - |
Net asset value, end of period | | 19.25 | 17.65 | 21.19 | 16.82 | 17.97 |
Total Return (%) | | 19.77 | (15.91)c | 27.02c | (5.83)c | 1.17 |
Ratios/Supplemental Data (%): | | | | | | |
Ratio of total expenses
to average net assets | | 1.58 | 1.56 | 1.39 | 1.42 | 1.39 |
Ratio of net expenses
to average net assets | | 1.58 | 1.56 | 1.39 | 1.42 | 1.39 |
Ratio of net investment income
to average net assets | | 1.00 | .94 | .73 | 1.05 | .90 |
Portfolio Turnover Rate | | 34.20 | 35.83 | 28.36 | 36.91 | 32.28 |
Net Assets, end of period ($ x 1,000) | | 5,385 | 5,558 | 7,760 | 7,454 | 9,389 |
a Based on average shares outstanding.
b Amount represents less than $.01 per share.
c In 2018, 2017 and 2016, the fund received proceeds from a class action settlement from The Bank of New York Mellon Corporation. In 2018 and 2017, this payment had no impact on total return. In 2016, the total return would have been (5.94%) had payment not been made by The Bank of New York Mellon Corporation.
See notes to financial statements.
18
NOTES TO FINANCIAL STATEMENTS
NOTE 1—Significant Accounting Policies:
International Equity Portfolio (the “fund”) is a separate non-diversified series of BNY Mellon Variable Investment Fund (the “Company”), which is registered under the Investment Company Act of 1940, as amended (the “Act”), as an open-end management investment company and operates as a series company currently offering seven series, including the fund. The fund is only offered to separate accounts established by insurance companies to fund variable annuity contracts and variable life insurance policies. The fund’s investment objective is to seek capital growth. BNY Mellon Investment Adviser, Inc. (the “Adviser”), a wholly-owned subsidiary of The Bank of New York Mellon Corporation (“BNY Mellon”), serves as the fund’s investment adviser. Effective December 31, 2019, Newton Investment Management (North America) Limited (“NIMNA”) reorganized into Newton Investment Management Limited (“NIM” or the “Sub-Adviser”), a wholly-owned subsidiary of BNY Mellon and an affiliate of the Adviser. Consequently, the sub-investment advisory agreement between the Adviser and NIMNA was terminated and NIM now serves as the fund’s sub-adviser pursuant to a sub-investment advisory agreement between the Adviser and NIM. There was no change to the fund’s investment objective, polices or strategies as a result of the reorganization of NIMNA into Sub-Adviser.
Effective June 3, 2019, the Company changed its name from Dreyfus Variable Investment Fund to BNY Mellon Variable Investment Fund. In addition, The Dreyfus Corporation, the fund’s investment adviser, changed its name to “BNY Mellon Investment Adviser, Inc.”, MBSC Securities Corporation, the fund’s distributor, changed its name to “BNY Mellon Securities Corporation” and Dreyfus Transfer, Inc., the fund’s transfer agent, changed its name to “BNY Mellon Transfer, Inc.”
BNY Mellon Securities Corporation (the “Distributor”), a wholly-owned subsidiary of the Adviser, is the distributor of the fund’s shares, which are sold without a sales charge. The fund is authorized to issue an unlimited number of $.001 par value shares of Beneficial Interest in each of the following classes of shares: Initial and Service. Each class of shares has identical rights and privileges, except with respect to the Distribution Plan, and the expenses borne by each class, the allocation of certain transfer agency costs and certain voting rights. Income, expenses (other than expenses attributable to a specific class), and realized and unrealized gains or losses on investments are allocated to each class of shares based on its relative net assets.
19
NOTES TO FINANCIAL STATEMENTS(continued)
The Company accounts separately for the assets, liabilities and operations of each series. Expenses directly attributable to each series are charged to that series’ operations; expenses which are applicable to all series are allocated among them on a pro rata basis.
The Financial Accounting Standards Board (“FASB”) Accounting Standards Codification (“ASC”) is the exclusive reference of authoritative U.S. generally accepted accounting principles (“GAAP”) recognized by the FASB to be applied by nongovernmental entities. Rules and interpretive releases of the Securities and Exchange Commission (“SEC”) under authority of federal laws are also sources of authoritative GAAP for SEC registrants. The fund is an investment company and applies the accounting and reporting guidance of the FASB ASC Topic 946 Financial Services-Investment Companies. The fund’s financial statements are prepared in accordance with GAAP, which may require the use of management estimates and assumptions. Actual results could differ from those estimates.
The Companyenters into contracts that contain a variety of indemnifications. The fund’s maximum exposure under these arrangements is unknown. The fund does not anticipate recognizing any loss related to these arrangements.
(a) Portfolio valuation: The fair value of a financial instrument is the amount that would be received to sell an asset or paid to transfer a liability in an orderly transaction between market participants at the measurement date (i.e., the exit price). GAAP establishes a fair value hierarchy that prioritizes the inputs of valuation techniques used to measure fair value. This hierarchy gives the highest priority to unadjusted quoted prices in active markets for identical assets or liabilities (Level 1 measurements) and the lowest priority to unobservable inputs (Level 3 measurements).
Additionally, GAAP provides guidance on determining whether the volume and activity in a market has decreased significantly and whether such a decrease in activity results in transactions that are not orderly. GAAP requires enhanced disclosures around valuation inputs and techniques used during annual and interim periods.
Various inputs are used in determining the value of the fund’s investments relating to fair value measurements. These inputs are summarized in the three broad levels listed below:
Level 1—unadjusted quoted prices in active markets for identical investments.
20
Level 2—other significant observable inputs (including quoted prices for similar investments, interest rates, prepayment speeds, credit risk, etc.).
Level 3—significant unobservable inputs (including the fund’s own assumptions in determining the fair value of investments).
The inputs or methodology used for valuing securities are not necessarily an indication of the risk associated with investing in those securities.
Changes in valuation techniques may result in transfers in or out of an assigned level within the disclosure hierarchy. Valuation techniques used to value the fund’s investments are as follows:
Investments in equity securities are valued at the last sales price on the securities exchange or national securities market on which such securities are primarily traded. Securities listed on the National Market System for which market quotations are available are valued at the official closing price or, if there is no official closing price that day, at the last sales price. For open short positions, asked prices are used for valuation purposes. Bid price is used when no asked price is available. Registered investment companies that are not traded on an exchange are valued at their net asset value. All of the preceding securities are generally categorized within Level 1 of the fair value hierarchy.
Securities not listed on an exchange or the national securities market, or securities for which there were no transactions, are valued at the average of the most recent bid and asked prices. These securities are generally categorized within Level 2 of the fair value hierarchy.
Fair valuing of securities may be determined with the assistance of a pricing service using calculations based on indices of domestic securities and other appropriate indicators, such as prices of relevant ADRs and futures. Utilizing these techniques may result in transfers between Level 1 and Level 2 of the fair value hierarchy.
When market quotations or official closing prices are not readily available, or are determined not to accurately reflect fair value, such as when the value of a security has been significantly affected by events after the close of the exchange or market on which the security is principally traded (for example, a foreign exchange or market), but before the fund calculates its net asset value, the fund may value these investments at fair value as determined in accordance with the procedures approved by the Company’s Board of Trustees (the “Board”). Certain factors may be considered when fair valuing investments such as: fundamental analytical data, the nature and duration of restrictions on disposition, an evaluation of the forces that
21
NOTES TO FINANCIAL STATEMENTS(continued)
influence the market in which the securities are purchased and sold, and public trading in similar securities of the issuer or comparable issuers. These securities are either categorized within Level 2 or 3 of the fair value hierarchy depending on the relevant inputs used.
For restricted securities where observable inputs are limited, assumptions about market activity and risk are used and such securities are generally categorized within Level 3 of the fair value hierarchy.
Investments denominated in foreign currencies are translated to U.S. dollars at the prevailing rates of exchange.
Forward foreign currency exchange contracts (“forward contracts”) are valued at the forward rate and are generally categorized within Level 2 of the fair value hierarchy.
The following is a summary of the inputs used as of December 31, 2019in valuing the fund’s investments:
| | | | | |
| | Level 1- Unadjusted Quoted Prices | Level 2 - Other Significant Observable Inputs | Level 3- Significant Unobservable Inputs | Total |
Assets ($) |
Investments in Securities: † |
Equity Securities - Common Stocks | 29,648,621 | - | - | 29,648,621 |
Investment Companies | 87,105 | - | - | 87,105 |
Other Financial Instruments: | | | | |
Forward Foreign Currency Exchange Contracts†† | - | 2,826 | - | 2,826 |
Liabilities ($) |
Other Financial Instruments: |
Forward Foreign Currency Exchange Contracts†† | - | (43,179) | - | (43,179) |
† See Statement of Investments for additional detailed categorizations, if any.
†† Amount shown represents unrealized appreciation (depreciation) at period end, but only variation margin on exchanged traded and centrally cleared derivatives, if any, are reported in the Statement of Assets and Liabilities.
(b) Foreign currency transactions: The fund does not isolate that portion of the results of operations resulting from changes in foreign exchange rates on investments from the fluctuations arising from changes in the market prices of securities held. Such fluctuations are included with the net realized and unrealized gain or loss on investments.
Net realized foreign exchange gains or losses arise from sales of foreign currencies, currency gains or losses realized on securities transactions
22
between trade and settlement date, and the difference between the amounts of dividends, interest and foreign withholding taxes recorded on the fund’s books and the U.S. dollar equivalent of the amounts actually received or paid. Net unrealized foreign exchange gains and losses arise from changes in the value of assets and liabilities other than investments resulting from changes in exchange rates. Foreign currency gains and losses on foreign currency transactions are also included with net realized and unrealized gain or loss on investments.
(c)Securities transactions and investment income: Securities transactions are recorded on a trade date basis. Realized gains and losses from securities transactions are recorded on the identified cost basis. Dividend income is recognized on the ex-dividend date and interest income, including, where applicable, accretion of discount and amortization of premium on investments, is recognized on the accrual basis.
Pursuant to a securities lending agreement with The Bank of New York Mellon, a subsidiary of BNY Mellon and an affiliate of the Adviser, the fund may lend securities to qualified institutions. It is the fund’s policy that, at origination, all loans are secured by collateral of at least 102% of the value of U.S. securities loaned and 105% of the value of foreign securities loaned. Collateral equivalent to at least 100% of the market value of securities on loan is maintained at all times. Collateral is either in the form of cash, which can be invested in certain money market mutual funds managed by the Adviser, or U.S. Government and Agency securities. The fund is entitled to receive all dividends, interest and distributions on securities loaned, in addition to income earned as a result of the lending transaction. Should a borrower fail to return the securities in a timely manner, The Bank of New York Mellon is required to replace the securities for the benefit of the fund or credit the fund with the market value of the unreturned securities and is subrogated to the fund’s rights against the borrower and the collateral. Additionally, the contractual maturity of security lending transactions are on an overnight and continuous basis. During the period ended December 31, 2019, The Bank of New York Mellon earned $1 from the lending of the fund’s portfolio securities, pursuant to the securities lending agreement.
(d) Affiliated issuers: Investments in other investment companies advised by the Adviser are considered “affiliated” under the Act.
(e) Risk: Investing in foreign markets may involve special risks and considerations not typically associated with investing in the U.S. These risks include revaluation of currencies, high rates of inflation, repatriation restrictions on income and capital, and adverse political and economic
23
NOTES TO FINANCIAL STATEMENTS(continued)
developments. Moreover, securities issued in these markets may be less liquid, subject to government ownership controls and delayed settlements, and their prices may be more volatile than those of comparable securities in the U.S.
(f) Dividends and distributions to shareholders: Dividends and distributions are recorded on the ex-dividend date. Dividends from investment income-net and dividends from net realized capital gains, if any, are normally declared and paid annually, but the fund may make distributions on a more frequent basis to comply with the distribution requirements of the Internal Revenue Code of 1986, as amended (the “Code”). To the extent that net realized capital gains can be offset by capital loss carryovers, it is the policy of the fund not to distribute such gains. Income and capital gain distributions are determined in accordance with income tax regulations, which may differ from GAAP.
(g) Federal income taxes: It is the policy of the fund to continue to qualify as a regulated investment company, if such qualification is in the best interests of its shareholders, by complying with the applicable provisions of the Code, and to make distributions of taxable income and net realized capital gain sufficient to relieve it from substantially all federal income and excise taxes.
As of and during the period ended December 31, 2019, the fund did not have any liabilities for any uncertain tax positions. The fund recognizes interest and penalties, if any, related to uncertain tax positions as income tax expense in the Statement of Operations. During the period ended December 31, 2019, the fund did not incur any interest or penalties.
Each tax year in the four-year period ended December 31, 2019 remains subject to examination by the Internal Revenue Service and state taxing authorities.
At December 31, 2019, the components of accumulated earnings on a tax basis were as follows: undistributed ordinary income $492,449, accumulated capital losses $25,410 and unrealized appreciation $2,908,819.
The fund is permitted to carry forward capital losses for an unlimited period. Furthermore, capital loss carryovers retain their character as either short-term or long-term capital losses.
The accumulated capital loss carryover is available for federal income tax purposes to be applied against future netrealized capital gains, if any, realized subsequent to December 31, 2019. The fund has $25,410 of short-term capital losses which can be carried forward for an unlimited period.
24
The tax character of distributions paid to shareholders during the fiscal periods ended December 31, 2019 and December 31, 2018 were as follows: ordinary income $374,168 and $416,234, and long-term capital gains $2,463,935 and $0, respectively.
(h) New Accounting Pronouncements: Effective June 1, 2019, the fund adopted Accounting Standards Update 2018-13, Fair Value Measurement (Topic 820): Disclosure Framework—Changes to the Disclosure Requirements for Fair Value Measurement (“ASU 2018-13”). The update provides guidance that eliminates, adds and modifies certain disclosure requirements for fair value measurements. The adoption of ASU 2018-13 had no impact on the operations of the fund for the period ended December 31, 2019.
NOTE 2—Bank Lines of Credit:
The fund participates with other long-term open-end funds managed by the Adviser in a $1.030 billion unsecured credit facility led by Citibank, N.A. (the “Citibank Credit Facility”) and a $300 million unsecured credit facility provided by The Bank of New York Mellon (the “BNYM Credit Facility”), a subsidiary of BNY Mellon and an affiliate of the Adviser, each to be utilized primarily for temporary or emergency purposes, including the financing of redemptions (each, a “Facility”). The Citibank Credit Facility is available in two tranches: (i) Tranche A is in an amount equal to $830 million and is available to all long-term open-ended funds, including the fund, and (ii) Tranche B is in amount equal to $200 million and is available only to BNY Mellon Floating Rate Income Fund, a series of BNY Mellon Investment Funds IV, Inc. In connection therewith, the fund has agreed to pay its pro rata portion of commitment fees for Tranche A of the Citibank Credit Facility and the BNYM Credit Facility. Interest is charged to the fund based on rates determined pursuant to the terms of the respective Facility at the time of borrowing. During the period ended December 31, 2019, the fund did not borrow under the Facilities.
NOTE 3—Investment Advisory Fee, Sub-Investment Advisory Fee and Other Transactions with Affiliates:
(a)Pursuant to an investment advisory agreement with the Adviser, the investment advisory fee is computed at the annual rate of .75% of the value of the fund’s average daily net assets and is payable monthly.
Pursuant to a sub-investment advisory agreement between the Adviser and the Sub-Adviser, the sub-investment advisory fee is payable monthly by the Adviser, and is based upon the value of the fund’s average daily net assets, computed at the following rates:
25
NOTES TO FINANCIAL STATEMENTS(continued)
Average Net Assets
0 up to $100 million ....................................... .35%
$100 million up to $1 billion .......................... .30%
$1 billion up to $1.5 billion ............................ .26%
In excess of $1.5 billion .................................. .20%
(b)Under the Distribution Plan adopted pursuant to Rule 12b-1 under the Act, Service shares pay the Distributor for distributing its shares, for servicing and/or maintaining Service shares’ shareholder accounts and for advertising and marketing for Service shares. The Distribution Plan provides for payments to be made at an annual rate of .25% of the value of the Service shares’ average daily net assets. The Distributor may make payments to Participating Insurance Companies and to brokers and dealers acting as principal underwriter for their variable insurance products. The fees payable under the Distribution Plan are payable without regard to actual expenses incurred. During the period ended December 31, 2019,Service shares were charged $13,943 pursuant to the Distribution Plan.
The fund has an arrangement with the transfer agent whereby the fund may receive earnings credits when positive cash balances are maintained, which are used to offset transfer agency fees. The fund had an arrangement with the custodian to receive earnings credits when positive cash balances were maintained, which were used to offset custody fees. Effective February 1, 2019, the arrangement with the custodian changed whereby the fund will no longer receive earnings credits to offset its custody fees and will receive interest income or overdraft fees going forward. For financial reporting purposes, the fund includes net earnings credits, if any, as an expense offset in the Statement of Operations.
The fund compensates BNY Mellon Transfer, Inc., a wholly-owned subsidiary of the Adviser, under a transfer agency agreement for providing transfer agency and cash management services for the fund. The majority of transfer agency fees are comprised of amounts paid on a per account basis, while cash management fees are related to fund subscriptions and redemptions. During the period ended December 31, 2019, the fund was charged $300 for transfer agency services. These fees are included in Shareholder servicing costs in the Statement of Operations.
The fund compensates The Bank of New York Mellon under a custody agreement for providing custodial services for the fund. These fees are determined based on net assets, geographic region and transaction activity. During the period ended December 31, 2019, the fund was charged $14,492 pursuant to the custody agreement.
26
During the period ended December 31, 2019, the fund was charged $11,793 for services performed by the Chief Compliance Officer and his staff. These fees are included in Chief Compliance Officer fees in the Statement of Operations.
The components of “Due to BNY Mellon Investment Adviser, Inc. and affiliates” in the Statement of Assets and Liabilities consist of: investment advisory fees of $18,661, Distribution Plan fees of $1,129, custodian fees of $4,800, Chief Compliance Officer fees of $3,261 and transfer agency fees of $48.
(c) Each Board member also serves as a Board member of other funds in the BNY Mellon Family of Funds complex. Annual retainer fees and attendance fees are allocated to each fund based on net assets.
NOTE 4—Securities Transactions:
The aggregate amount of purchases and sales of investment securities, excluding short-term securities and forward contracts, during the period ended December 31, 2019, amounted to $9,840,615 and $12,841,514, respectively.
Derivatives: A derivative is a financial instrument whose performance is derived from the performance of another asset. The fund enters into International Swaps and Derivatives Association, Inc. Master Agreements or similar agreements (collectively, “Master Agreements”) with its over-the counter (“OTC”) derivative contract counterparties in order to, among other things, reduce its credit risk to counterparties. Master Agreements include provisions for general obligations, representations, collateral and events of default or termination. Under a Master Agreement, the fund may offset with the counterparty certain derivative financial instruments’ payables and/or receivables with collateral held and/or posted and create one single net payment in the event of default or termination.
Each type of derivative instrument that was held by the fund during the period ended December 31, 2019 is discussed below.
Forward Foreign Currency Exchange Contracts: The fund enters into forward contracts in order to hedge its exposure to changes in foreign currency exchange rates on its foreign portfolio holdings, to settle foreign currency transactions or as a part of its investment strategy. When executing forward contracts, the fund is obligated to buy or sell a foreign currency at a specified rate on a certain date in the future. With respect to sales of forward contracts, the fund incurs a loss if the value of the contract increases between the date the forward contract is opened and the date the forward contract is closed. The fund realizes a gain if the value of
27
NOTES TO FINANCIAL STATEMENTS(continued)
the contract decreases between those dates. With respect to purchases of forward contracts, the fund incurs a loss if the value of the contract decreases between the date the forward contract is opened and the date the forward contract is closed. The fund realizes a gain if the value of the contract increases between those dates. Any realized or unrealized gains or losses which occurred during the period are reflected in the Statement of Operations. The fund is exposed to foreign currency risk as a result of changes in value of underlying financial instruments. The fund is also exposed to credit risk associated with counterparty nonperformance on these forward contracts, which is generally limited to the unrealized gain on each open contract. This risk may be mitigated by Master Agreements, if any, between the fund and the counterparty and the posting of collateral, if any, by the counterparty to the fund to cover the fund’s exposure to the counterparty. Forward contracts open at December 31, 2019 are set forth in the Statement of Forward Foreign Currency Exchange Contracts.
The provisions of ASC Topic 210 “Disclosures about Offsetting Assets and Liabilities” require disclosure on the offsetting of financial assets and liabilities. These disclosures are required for certain investments, including derivative financial instruments subject to Master Agreements which are eligible for offsetting in the Statement of Assets and Liabilities and require the fund to disclose both gross and net information with respect to such investments. For financial reporting purposes, the fund does not offset derivative assets and derivative liabilities that are subject to Master Agreements in the Statement of Assets and Liabilities.
At December 31, 2019, derivative assets and liabilities (by type) on a gross basis are as follows:
| | | | | | |
Derivative Financial Instruments: | | Assets ($) | | Liabilities ($) | |
Forward contracts | | 2,826 | | (43,179) | |
Total gross amount of derivative | | | | | |
assets and liabilities in the | | | | | |
Statement of Assets and Liabilities | | 2,826 | | (43,179) | |
Derivatives not subject to | | | | | |
Master Agreements | | - | | - | |
Total gross amount of assets | | | | | |
and liabilities subject to | | | | | |
Master Agreements | | 2,826 | | (43,179) | |
28
The following tables present derivative assets and liabilities net of amounts available for offsetting under Master Agreements and net of related collateral received or pledged, if any, as of December 31, 2019:
| | | | | | | |
| | | Financial | | | |
| | | Instruments | | | |
| | | and Derivatives | | | |
| Gross Amount of | | Available | Collateral | | Net Amount of |
Counterparty | Assets ($) | 1 | for Offset ($) | Received ($) | | Assets ($) |
State Street Bank
and Trust Company | 5 | | - | - | | 5 |
UBS Securities | 2,821 | | (2,821) | - | | - |
Total | 2,826 | | (2,821) | - | | 5 |
| | | | | | |
| | | Financial | | | |
| | | Instruments | | | |
| | | and Derivatives | | | |
| Gross Amount of | | Available | Collateral | | Net Amount of |
Counterparty | Liabilities ($) | 1 | for Offset ($) | Pledged ($) | | Liabilities ($) |
UBS Securities | (43,179) | | 2,821 | - | | (40,358) |
| | | | | | |
1 Absent a default event or early termination, OTC derivative assets and liabilities are presented at gross amounts and are not offset in the Statement of Assets and Liabilities. |
The following summarizes the average market value of derivatives outstanding duringthe period ended December 31, 2019:
| | | |
| | Average Market Value ($) |
Forward contracts | | 2,489,080 |
| | |
At December 31, 2019, the cost of investments for federal income tax purposes was $26,826,097; accordingly, accumulated net unrealized appreciation on investments inclusive of derivative contracts was $2,909,634, consisting of $4,781,953 gross unrealized appreciation and $1,872,319 gross unrealized depreciation.
NOTE 5—Plan of Liquidation:
On November 26, 2019, the Board approved a Plan of Liquidation (the “Plan”). The Plan provides for the liquidation of the fund, the pro rata distribution of the assets of the fund to its shareholders and the closing of fund shareholder accounts (the “Liquidation”). The Liquidation of the fund will occur on or about April 30, 2020. Accordingly, effective March 31, 2020, the fund will be closed to any investments for new accounts.
29
REPORT OF INDEPENDENT REGISTERED PUBLIC ACCOUNTING FIRM
To the Shareholders and the Board of Trustees of International Equity Portfolio
Opinion on the Financial Statements
We have audited the accompanying statement of assets and liabilities of International Equity Portfolio (the “Fund”) (one of the funds constituting BNY Mellon Variable Investment Fund), including the statements of investments, investments in affiliated issuers and forward foreign currency exchange contracts, as of December 31, 2019, and the related statement of operations for the year then ended, the statements of changes in net assets for each of the two years in the period then ended, the financial highlights for each of the five years in the period then ended and the related notes (collectively referred to as the “financial statements”). In our opinion, the financial statements present fairly, in all material respects, the financial position of the Fund (one of the funds constituting BNY Mellon Variable Investment Fund) at December 31, 2019, the results of its operations for the year then ended, the changes in its net assets for each of the two years in the period then ended and its financial highlights for each of the five years in the period then ended, in conformity with U.S. generally accepted accounting principles.
Basis for Opinion
These financial statements are the responsibility of the Fund’s management. Our responsibility is to express an opinion on the Fund’s financial statements based on our audits. We are a public accounting firm registered with the Public Company Accounting Oversight Board (United States) (“PCAOB”) and are required to be independent with respect to the Fund in accordance with the U.S. federal securities laws and the applicable rules and regulations of the Securities and Exchange Commission and the PCAOB.
We conducted our audits in accordance with the standards of the PCAOB. Those standards require that we plan and perform the audit to obtain reasonable assurance about whether the financial statements are free of material misstatement, whether due to error or fraud. The Fund is not required to have, nor were we engaged to perform, an audit of the Fund’s internal control over financial reporting. As part of our audits, we are required to obtain an understanding of internal control over financial reporting, but not for the purpose of expressing an opinion on the effectiveness of the Fund’s internal control over financial reporting. Accordingly, we express no such opinion.
Our audits included performing procedures to assess the risks of material misstatement of the financial statements, whether due to error or fraud, and performing procedures that respond to those risks. Such procedures included examining, on a test basis, evidence regarding the amounts and disclosures in the financial statements. Our procedures included confirmation of securities owned as of December 31, 2019, by correspondence with the custodian and others or by other appropriate auditing procedures where replies from others were not received. Our audits also included evaluating the accounting principles used and significant estimates made by management, as well as evaluating the overall presentation of the financial statements. We believe that our audits provide a reasonable basis for our opinion.

We have served as the auditor of one or more investment companies in the BNY Mellon Family of Funds since at least 1957, but we are unable to determine the specific year.
New York, New York
February 10, 2020
30
IMPORTANT TAX INFORMATION(Unaudited)
In accordance with federal tax law, the fund elects to provide each shareholder with their portion of the fund’s foreign taxes paid and the income sourced from foreign countries. Accordingly, the fund hereby reports the following information regarding its fiscal year ended December 31, 2019:
- the total amount of taxes paid to foreign countries was $75,556.
- the total amount of income sourced from foreign countries was $820,429.
Where required by federal tax law rules, shareholders will receive notification of their proportionate share of foreign taxes paid and foreign sourced income for the 2019 calendar year with Form 1099-DIV which will be mailed in early 2020. Also, the fund hereby reports $1.5658 per share as a long-term capital gain distribution paid on March 20, 2019.
31
INFORMATION ABOUT THE RENEWAL OF THE FUND’S SUB-INVESTMENT ADVISORY AGREEMENT (Unaudited)
At a meeting of the fund’s Board of Trustees (the “Board”) held on November 6, 2019 (the “Meeting”), the Board discussed with representatives of the Adviser (a) plans to wind down the operations of and dissolve the fund’s then-current sub-investment adviser, Newton Investment Management (North America) Limited (“NIMNA”); and (b) a proposal that Newton Investment Management Limited (“NIM”), an affiliate of NIMNA and the Adviser, assume the investment advisory responsibilities of NIMNA, pursuant to a sub-investment advisory agreement between the Adviser and NIM (the “New Sub-Advisory Agreement”), to be effective December 31, 2019 (the “Effective Date”).
At the Meeting, the Adviser recommended the approval of the New Sub-Advisory Agreement, pursuant to which NIM would serve as sub-adviser to the fund. The recommendation for the approval of the New Sub-Advisory Agreement was based on the following considerations, among others: (i) the transfer of the provision of sub-investment advisory services from NIMNA to NIM was not expected to have a material impact on the fund’s day-to-day operations, or the nature, extent or quality of the sub-investment advisory services currently provided to the fund; (ii) the personnel who have been principally responsible for managing the fund’s investment portfolio would continue to serve in that capacity following the Effective Date; and (iii) the substantive terms of the New Sub-Advisory Agreement were substantially similar to those of the current sub-investment advisory agreement between the Adviser and NIMNA (the “Current Agreement”). The Board also considered the fact that the Adviser expressed confidence in NIM and its investment management capabilities.
At the Meeting, the Board, including a majority of the Trustees who are not “interested persons” (as defined in the Investment Company Act of 1940, as amended (the “1940 Act”)) of the fund (the “Independent Trustees”), considered and approved the New Sub-Advisory Agreement. In determining whether to approve the New Sub-Advisory Agreement, the Board considered the materials prepared by the Adviser received in advance of the Meeting and other information presented at the Meeting, which included: (i) a form of the New Sub-Advisory Agreement; (ii) information regarding the transition of sub-investment advisory services from NIMNA to NIM; (iii) information regarding investment due diligence of NIM performed by the Adviser; (iv) information regarding NIM’s compliance program; and (v) an opinion of counsel that replacing NIMNA with NIM as the sub-investment adviser to the fund would not result in a “change of control” or an “assignment” of an advisory contract within the meaning of the 1940 Act, and, therefore, does not require the approval of fund shareholders. The Board also considered the substance of discussions with representatives of the Adviser at the Meeting and at a Board meeting on March 12-13, 2019 (the “March Meeting”) at which the Board re-approved the Current Agreement for the ensuing year until March 31, 2020.
Nature, Extent and Quality of Services to be Provided by NIM. In examining the nature, extent and quality of the services that had been furnished by NIMNA to the fund under the Current Agreement, and were expected to be provided by NIM to the
32
fund under the New Sub-Advisory Agreement, the Board considered: (i) NIM’s organization, qualification and background, as well as the qualifications of its personnel; (ii) the expertise of the personnel providing portfolio management services, which would remain the same after the Effective Date; (iii) the investment strategy for the fund, which would remain the same after the Effective Date; and (iv) NIM’s compliance program. The Board also considered the review process undertaken by the Adviser and the Adviser’s favorable assessment of the nature and quality of the sub-investment advisory services provided by NIMNA and expected to be provided to the fund by NIM after the Effective Date. Based on their consideration and review of the foregoing information, the Board concluded that the nature, extent and quality of the sub-investment advisory services to be provided by NIM under the New Sub-Advisory Agreement, as well as NIM’s ability to render such services based on its resources and the experience of the investment team, which will remain the same, were adequate and appropriate for the fund in light of the fund’s investment objective, and supported a decision to approve the New Sub-Advisory Agreement.
Investment Performance of NIM. The Board had considered NIMNA’s investment performance in managing the fund’s portfolio at the March Meeting (including comparative data provided by Broadridge Financial Solutions, Inc.). The Board considered the performance and that the same investment professionals would continue to manage the fund’s assets after the Effective Date, as factors in evaluating the services to be provided by NIM under the New Sub-Advisory Agreement after the Effective Date, and determined that these factors, when viewed together with the other factors considered by the Board, supported a decision to approve the New Sub-Advisory Agreement.
Costs of Services to be Provided and Profitability. The Board considered the proposed fee payable under the New Sub-Advisory Agreement (which was the same as that payable under the Current Agreement and had been considered at the March Meeting), noting that the proposed fee would be paid by the Adviser and, thus, would not impact the fees paid by the fund or the Adviser’s profitability. The Board recognized that, because NIM’s fee would be paid by the Adviser, and not the fund, an analysis of profitability was more appropriate in the context of the Board’s consideration of the fund’s Management Agreement, pursuant to which the Adviser provides the fund with investment management and administrative services (the “Management Agreement”), and, therefore, the Board had received and considered a profitability analysis of the Adviser and its affiliates, including NIMNA, at the March Meeting. The Board concluded that the proposed fee payable to NIM by the Adviser was appropriate and the Adviser’s profitability was not excessive in light of the nature, extent and quality of the services to be provided to the fund by the Adviser and NIM under the New Sub-Advisory Agreement.
Economies of Scale to be Realized. The Board recognized that, because NIM’s fee would continue to be paid by the Adviser, and not the fund, an analysis of economies of scale was more appropriate in the context of the Board’s consideration of the Management Agreement, which had been done at the March Meeting.
33
INFORMATION ABOUT THE RENEWAL OF THE FUND’S SUB-INVESTMENT ADVISORY AGREEMENT (Unaudited) (continued)
The Board also considered whether there were any ancillary benefits that would accrue to NIM as a result of NIM’s relationship with the fund. The Board concluded that NIM may direct fund brokerage transactions to certain brokers to obtain research and other services, but noted that NIMNA currently paid, and that, after the Effective Date, NIM would pay, for such research and other services, not the fund by way of brokerage commission costs.
In considering the materials and information described above, the Independent Trustees received assistance from, and met separately with, their independent legal counsel, and were provided with a written description of their statutory responsibilities and the legal standards that are applicable to the approval of investment advisory and sub-investment advisory agreements.
After full consideration of the factors discussed above, with no single factor identified as being of paramount importance, the Board, including a majority of the Independent Trustees, with the assistance of independent legal counsel, approved the New Sub-Advisory Agreement for the fund effective as of the Effective Date.
34
BOARD MEMBERS INFORMATION(Unaudited)
INDEPENDENT BOARD MEMBERS
Joseph S. DiMartino (76)
Chairman of the Board (1995)
Principal Occupation During Past 5 Years:
· Corporate Director and Trustee (1995-Present)
Other Public Company Board Memberships During Past 5 Years:
· CBIZ, Inc., a public company providing professional business services, products and solutions,Director (1997-Present)
No. of Portfolios for which Board Member Serves:118
———————
Peggy C. Davis (76)
Board Member (2006)
Principal Occupation During Past 5 Years:
· Shad Professor of Law, New York University School of Law (1983-present)
No. of Portfolios for which Board Member Serves: 43
———————
Gina D. France (61)
Board Member (2019)
Principal Occupation During Past 5 Years:
· Founder, President and Chief Executive Officer, France Strategic Partners, a strategy and advisory firm serving corporate clients across the United States (2003 –Present)
· Corporate Director and Trustee (2004 – Present)
Other Public Company Board Memberships During Past 5 Years:
· Huntington Bancshares, a bank holding company headquartered in Columbus, Ohio,Director(2016 – Present)
· Cedar Fair, L.P., a publicly-traded partnership that owns and operates amusement parks and hotels in the U.S. and Canada,Director (2011 – Present)
· CBIZ (formerly, Century Business Services, Inc.), a provider of outsourcing functions for small and medium size companies,Director(2015 – Present)
· Baldwin Wallace University,Trustee (2013- Present)
· FirstMerit Corporation, a diversified financial services company,Director (2004 – 2016)
No. of Portfolios for which Board Member Serves:29
———————
35
BOARD MEMBERS INFORMATION (Unaudited) (continued)
INDEPENDENT BOARD MEMBERS (continued)
Joan Gulley (72)
Board Member (2017)
Principal Occupation During Past 5 Years:
· PNC Financial Services Group, Inc.(1993-2014), Executive Vice President and Chief Human Resources Officer and Executive Committee Member (2008-2014)
· Director, Nantucket Library (2015-Present)
No. of Portfolios for which Board Member Serves:49
———————
Ehud Houminer (79)
Board Member (2006)
Principal Occupation During Past 5 Years:
· Board of Overseers at the Columbia Business School, Columbia University (1992-Present)
· Trustee, Ben Gurion University (2012-2018)
No. of Portfolios for which Board Member Serves:49
———————
Robin A. Melvin (56)
Board Member (2012)
Principal Occupation During Past 5 Years:
· Co-chairman, Mentor Illinois, a non-profit organization dedicated to increasing the quantity and quality of mentoring services in Illinois; (2014-Present); Board member (2013-Present)
No. of Portfolios for which Board Member Serves:96
———————
Once elected all Board Members serve for an indefinite term, but achieve Emeritus status upon reaching age 80. The address of the Board Members and Officers is c/o BNY Mellon Investment Adviser, Inc. 240 Greenwich Street, New York, New York 10286. Additional information about the Board Members is available in the fund’s Statement of Additional Information which can be obtained from the Adviser free of charge by calling this toll free number: 1-800-373-9387.
David P. Feldman, Emeritus Board Member
James F. Henry, Emeritus Board Member
Lynn Martin, Emeritus Board Member
Dr. Martin Peretz, Emeritus Board Member
Philip L. Toia, Emeritus Board Member
36
OFFICERS OF THE FUND(Unaudited)
RENEE LAROCHE-MORRIS, President since May 2019.
President and a director of BNY Mellon Investment Adviser, Inc. since January 2018. She is an officer of 62 investment companies (comprised of 118 portfolios) managed by the Adviser. She is 48 years old and has been an employee of BNY Mellon since 2003.
JAMES WINDELS, Treasurer since November 2001.
Director- BNY Mellon Fund Administration, and an officer of 63 investment companies (comprised of 141 portfolios) managed by the Adviser. He is 61 years old and has been an employee of the Adviser since April 1985.
BENNETT A. MACDOUGALL, Chief Legal Officer since October 2015.
Chief Legal Officer of the Adviser and Associate General Counsel and Managing Director of BNY Mellon since June 2015; Director and Associate General Counsel of Deutsche Bank – Asset & Wealth Management Division from June 2005 to June 2015, and as Chief Legal Officer of Deutsche Investment Management Americas Inc. from June 2012 to May 2015. He is an officer of 63 investment companies (comprised of 141 portfolios) managed by the Adviser. He is 48 years old and has been an employee of the Adviser since June 2015.
DAVID DIPETRILLO, Vice President since May 2019.
Head of North America Product, BNY Mellon Investment Management since January 2018, Director of Product Strategy, BNY Mellon Investment Management from January 2016 to December 2017; Head of US Retail Product and Channel Marketing, BNY Mellon Investment Management from January 2014 to December 2015. He is an officer of 62 investment companies (comprised of 118 portfolios) managed by the Adviser. He is 41 years old and has been an employee of BNY Mellon since 2005.
JAMES BITETTO, Vice President since August 2005 and Secretary since February 2018.
Senior Managing Counsel of BNY Mellon since December 2019; Managing Counsel of BNY Mellon from April 2014 to December 2019; Secretary of the Adviser, and an officer of 63 investment companies (comprised of 141 portfolios) managed by the Adviser. He is 53 years old and has been an employee of the Adviser since December 1996.
SONALEE CROSS, Vice President and Assistant Secretary since March 2018.
Counsel of BNY Mellon since October 2016; Associate at Proskauer Rose LLP from April 2016 to September 2016; Attorney at EnTrust Capital from August 2015 to February 2016; Associate at Sidley Austin LLP from September 2013 to August 2015. She is an officer of 63 investment companies (comprised of 141 portfolios) managed by the Adviser. She is 32 years old and has been an employee of the Adviser since October 2016.
DEIRDRE CUNNANE, Vice President and Assistant Secretary since March 2019.
Counsel of BNY Mellon since August 2018; Senior Regulatory Specialist at BNY Mellon Investment Management Services from February 2016 to August 2018; Trustee Associate at BNY Mellon Trust Company (Ireland) Limited from August 2013 to February 2016. She is an officer of 63 investment companies (comprised of 141 portfolios) managed by the Adviser. She is 29 years old and has been an employee of the Adviser since August 2018.
SARAH S. KELLEHER, Vice President and Assistant Secretary since April 2014.
Managing Counsel of BNY Mellon since December 2017, Senior Counsel of BNY Mellon from March 2013 to December 2017. She is an officer of 63 investment companies (comprised of 141 portfolios) managed by the Adviser. She is 44 years old and has been an employee of the Adviser since March 2013.
JEFF PRUSNOFSKY, Vice President and Assistant Secretary since August 2005.
Senior Managing Counsel of BNY Mellon, and an officer of 63 investment companies (comprised of 141 portfolios) managed by the Adviser. He is 54 years old and has been an employee of the Adviser since October 1990.
PETER M. SULLIVAN, Vice President and Assistant Secretary since March 2019.
Managing Counsel of BNY Mellon, and an officer of 63 investment companies (comprised of 141 portfolios) managed by the Adviser. He is 51 years old and has been an employee of the Adviser since April 2004.
37
OFFICERS OF THE FUND (Unaudited)(continued)
NATALYA ZELENSKY, Vice President and Assistant Secretary since March 2017.
Managing Counsel of BNY Mellon since December 2019; Counsel of BNY Mellon from May 2016 to December 2019; Attorney at Wildermuth Endowment Strategy Fund/Wildermuth Advisory, LLC from November 2015 to May 2016 and Assistant General Counsel at RCS Advisory Services from July 2014 to November 2015. She is an officer of 63 investment companies (comprised of 141 portfolios) managed by the Adviser. She is 34 years old and has been an employee of the Adviser since May 2016.
GAVIN C. REILLY, Assistant Treasurer since December 2005.
Tax Manager - BNY Mellon Fund Administration, and an officer of 63 investment companies (comprised of 141 portfolios) managed by the Adviser. He is 51 years old and has been an employee of the Adviser since April 1991.
ROBERT S. ROBOL, Assistant Treasurer since August 2005.
Senior Accounting Manager- BNY Mellon Fund Administration, and an officer of 63 investment companies (comprised of 141 portfolios) managed by the Adviser. He is 55 years old and has been an employee of the Adviser since October 1988.
ROBERT SALVIOLO, Assistant Treasurer since July 2007.
Senior Accounting Manager – BNY Mellon Fund Administration, and an officer of 63 investment companies (comprised of 141 portfolios) managed by the Adviser. He is 52 years old and has been an employee of the Adviser since June 1989.
ROBERT SVAGNA, Assistant Treasurer since December 2002.
Senior Accounting Manager – BNY Mellon Fund Administration, and an officer of 63 investment companies (comprised of 141 portfolios) managed by the Adviser. He is 52 years old and has been an employee of the Adviser since November 1990.
JOSEPH W. CONNOLLY, Chief Compliance Officer since October 2004.
Chief Compliance Officer of the Adviser, the BNY Mellon Family of Funds and BNY Mellon Funds Trust (63 investment companies, comprised of 141 portfolios). He is 62 years old and has served in various capacities with the Adviser since 1980, including manager of the firm’s Fund Accounting Department from 1997 through October 2001.
CARIDAD M. CAROSELLA, Anti-Money Laundering Compliance Officer since January 2016.
Anti-Money Laundering Compliance Officer of the BNY Mellon Family of Funds and BNY Mellon Funds Trust since January 2016; from May 2015 to December 2015, Interim Anti-Money Laundering Compliance Officer of the BNY Mellon Family of Funds and BNY Mellon Funds Trust and the Distributor; from January 2012 to May 2015, AML Surveillance Officer of the Distributor. She is an officer of 56 investment companies (comprised of 134 portfolios) managed by the Adviser. She is 51 years old and has been an employee of the Distributor since 1997.
38
NOTES
39
NOTES
40
NOTES
41
BNY Mellon Variable Investment Fund, International Equity Portfolio
240 Greenwich Street
New York, NY 10286
Adviser
BNY Mellon Investment Adviser, Inc.
240 Greenwich Street
New York, NY 10286
Sub-Adviser
Newton Investment
Management Limited
160 Queen Victoria Street
London, EC4V 4LA
UK
Custodian
The Bank of New York Mellon
240 Greenwich Street
New York, NY 10286
Transfer Agent &
Dividend Disbursing Agent
BNY Mellon Transfer, Inc.
240 Greenwich Street
New York, NY 10286
Distributor
BNY Mellon Securities Corporation
240 Greenwich Street
New York, NY 10286
Telephone 1-800-258-4260 or 1-800-258-4261
Mail The BNY Mellon Family of Funds, 144 Glenn Curtiss Boulevard, Uniondale, NY 11556-0144 Attn: Institutional Services Department
E-mailSend your request to info@bnymellon.com
InternetInformation can be viewed online or downloaded atwww.bnymellonim.com/us
The fund files its complete schedule of portfolio holdings with the Securities and Exchange Commission (“SEC”) for the first and third quarters of each fiscal year on Form N-PORT. The fund’s Forms N-PORT are available on the SEC’s website atwww.sec.gov.
A description of the policies and procedures that the fund uses to determine how to vote proxies relating to portfolio securities and information regarding how the fund voted these proxies for the most recent 12-month period ended June 30 is available atwww.bnymellonim.com/us and on the SEC’s website at www.sec.gov and without charge, upon request, by calling 1-800-373-9387.
| | |
© 2020 BNY Mellon Securities Corporation
0109AR1219 | 
|
BNY Mellon Variable Investment Fund, International Value Portfolio
| |
ANNUAL REPORT December 31, 2019 |

| |
The views expressed in this report reflect those of the portfolio manager(s) only through the end of the period covered and do not necessarily represent the views of BNY Mellon Investment Adviser, Inc. or any other person in the BNY Mellon Investment Adviser, Inc. organization. Any such views are subject to change at any time based upon market or other conditions and BNY Mellon Investment Adviser, Inc. disclaims any responsibility to update such views. These views may not be relied on as investment advice and, because investment decisions for a fund in the BNY Mellon Family of Funds are based on numerous factors, may not be relied on as an indication of trading intent on behalf of any fund in the BNY Mellon Family of Funds. |
| |
Not FDIC-Insured • Not Bank-Guaranteed • May Lose Value |
Contents
THE FUND
FOR MORE INFORMATION
Back Cover
| | | | |
| |
BNY Mellon Variable Investment Fund, International Value Portfolio
| | The Fund |
A LETTER FROM THE PRESIDENT OF BNY MELLON INVESTMENT ADVISER, INC.
Dear Shareholder:
We are pleased to present this annual report for BNY Mellon Variable Investment Fund, International Value Portfolio (formerly, Dreyfus Variable Investment Fund, International Value Portfolio), covering the 12-month period from January 1, 2019 through December 31, 2019. For information about how the fund performed during the reporting period, as well as general market perspectives, we provide a Discussion of Fund Performance on the pages that follow.
In January 2019, a pivot in stance from the U.S. Federal Reserve (the “Fed”) helped stimulate a rebound across equity markets that continued into the second quarter of the year. However, escalating trade tensions disrupted equity markets in May. The dip was short-lived, as markets rose once again in June and July of 2019, when a trade deal appeared more likely and the pace of U.S. economic growth remained steady. Nevertheless, concerns continued to emerge over slowing global growth, resulting in bouts of market volatility in August 2019. Stocks rebounded in September and continued an upward path through most of October 2019, bolstered by central bank policy and consistent consumer spending. The rally generally continued through the end of the period, supported in part by an announcement from President Trump that the first phase of a trade deal with China was in process. U.S. equity markets reached new highs during the final months of the period.
In fixed-income markets, the year began with a recovery from the prior months’ volatility. After the Fed’s supportive statements in January 2019, other developed-market central banks followed suit and reiterated their abilities to buttress flagging growth rates by continuing accommodative policies. The Fed cut rates in July, September and October 2019, for a total 75 basis point reduction in the federal funds rate during the 12 months. Rates across much of the Treasury curve saw a slight increase during the month of November, and the long end of the curve rose in December. The yield curve steepened during the latter portion of the period. However, demand for fixed-income instruments during the year was strong, which helped to support positive bond market returns.
We believe that over the near term, the outlook for the U.S. remains positive, but we will monitor relevant data for any signs of a change. As always, we encourage you to discuss the risks and opportunities in today’s investment environment with your financial advisor.
Thank you for your continued confidence and support.
Sincerely,

Renee LaRoche-Morris
President
BNY Mellon Investment Adviser, Inc.
January 15, 2020
2
DISCUSSION OF FUND PERFORMANCE(Unaudited)
For the period from January 1, 2019 through December 31, 2019, as provided by James A. Lydotes, CFA and Chris Yao, Portfolio Managers
Market and Fund Performance Overview
For the 12-month period ended December 31, 2019, BNY Mellon Variable Investment Fund, International Value Portfolio’s (formerly, Dreyfus Variable Investment Fund, International Value Portfolio) Initial Shares produced a total return of 22.39%, and its Service Shares produced a total return of 21.92%.1 This compares with a 22.01% return produced by the fund’s benchmark, the MSCI EAFE Index (the “Index”), for the same period.2
Despite concerns about international trade conflicts, international equities gained ground amid steady economic growth during the reporting period. The fund’s Initial Shares outperformed the Index, largely due to favorable stock selections in France, Australia and Hong Kong. Underperformance was due largely to selections in the Netherlands, Finland and Belgium.
The Fund’s Investment Approach
The fund seeks long-term capital growth. To pursue its goal, the fund normally invests at least 80% of its net assets, plus any borrowings for investment purposes, in stocks. The fund normally invests substantially all of its assets in the stocks of foreign companies, including those located in emerging-market countries. The fund’s investment approach is value-oriented and research-driven. In selecting stocks, the portfolio managers identify potential investments through extensive quantitative and fundamental research.
Emphasizing individual stock selection rather than economic and industry trends, the fund focuses on three key factors:value, or how a stock is valued relative to its intrinsic worth, based on traditional value measures;business health, or overall efficiency and profitability as measured by return on assets and return on equity; andbusiness momentum, or the presence of a catalyst (such as corporate restructuring, change in management or spin-off) that potentially will trigger a price increase in the near to medium term.
Stocks Surge on Supportive Federal Reserve Policy and Reduced Trade Tensions
The reporting period began with wide expectations of interest rate cuts, as the Federal Reserve (the “Fed”) had earlier moved from a tightening policy to one that was “data dependent.” With this shift, stocks began to rally the last week of 2018 and continued to rise early in 2019. In the second quarter, however, stocks generally moved sideways, weighed down at times by concerns about trade tensions and global growth.
Three, quarter-point rate cuts in the second half of the period provided an additional boost to equity markets. The Fed announced an initial reduction at its July 2019 meeting and followed up with two additional rate cuts in September and October 2019. These reductions brought the federal funds rate to 1.50%-1.75%, as trade tensions and other geopolitical concerns appeared to be weighing on economic growth. Other major central banks were also supportive.
3
DISCUSSION OF FUND PERFORMANCE(Unaudited) (continued)
In the third quarter of 2019, interest rate cuts and the prospect of a U.S.-China trade agreement led investors to anticipate a pickup in global growth. Investors’ concerns about trade tensions and the global economy hindered performance at times, but stocks finished up strong later in the reporting period, when the “Phase 1” U.S.-China trade deal was announced in December 2019.
Stock Selection Drove Relative Performance
The fund outperformed the Index most significantly in France, Australia and Hong Kong. In France, shares of luxury goods conglomerate LVMH Moet Hennessy Louis Vuitton rose 59%, despite some concerns about its sales in Hong Kong, and shares of money center bank BNP Paribas rose 38%, primarily late in the year on additional central bank stimulus and the prospect of stronger economic growth. In Australia, a position in Macquarie Group, an investment bank and asset manager, surged 33% on strong results, primarily in niche areas of asset management such as infrastructure, green energy and commodities. In addition, a position in Aristocrat Leisure, a casino game producer, rose 57% on the company’s continued success in transitioning to a digital platform. In Hong Kong,AIA Group, a global insurance company, climbed 29%, primarily due to strong growth in mainland China.
Among sectors, the materials and financial sectors were the fund’s leading performers. In the materials sector, Shin-Etsu Chemical, a Japanese company, posted gains on strong recent results and on its exposure to the semiconductor industry cycle, which is trending upward. Fortescue Metals Group, an Australian iron ore company, rose 28% due to stronger prices and marked improvements in their balance sheet. In the financial sector, the Australian financial services company Macquarie Group contributed positively, as did UK insurance company Legal & General Group, which rose 45% on strong annuity sales. The recent election results also benefited these shares, as the concern about nationalization of utility companies, in which Legal & General Group has invested on behalf of pension investors, was removed.
On a less positive note, the fund lagged in the Netherlands, Finland and Belgium. In the Netherlands, the fund’s lack of exposure to the information sector dragged on performance, as it rose 80% during the period. In addition, a position in NN Group, an insurance company and asset manager, lagged due to waning earnings results and the exit of its CEO. In Finland, shares of telecommunications giantNokia fell, as it experienced delays in upgrades to its 5G products. In Belgium,UCB, a biopharmaceutical company, reported weaker earnings due to higher spending on research and development.
As for sectors, communication services and consumer staples were the laggards. In the communication services sector, Deutsche Telekom cuts its dividend in the third quarter, and shares lagged due to concerns about T-Mobile, of which Deutsche Telekom is a majority owner. T-Mobile is awaiting final approval of its proposed merger with Sprint Corporation. While the FCC approved the deal in October, the deal still faces legal challenge by a group of state attorneys general. In consumer staples, the fund’s performance was hindered by its lack of exposure to Swiss food company Nestle, which posted a 36% gain. In addition, Seven & i Holdings declined, due to rising costs stemming from growing wage pressures.
4
Optimistic about an Improving Economy
We are optimistic about the economy in the near term, given supportive monetary policies, the announcement of a “Phase 1” trade agreement between the U.S. and China, and China’s ongoing economic stimulus efforts. Progress on a “Phase 2” agreement would also be a positive development. We anticipate that the global economy will reaccelerate over the near term, resulting in a broadening of opportunities in the market.
The fund has moved from an underweight position in the UK to a nearly neutral position and has increased its overweight position in Spain. The fund has also moved from an overweight to an underweight position in Hong Kong and from an overweight position to neutral in Italy. As for sectors, the fund has shifted from underweight to overweight positions in the industrial and materials sectors and has moved from overweight to underweight positions in the financial and information technology sectors.
January 15, 2020
1 Total return includes reinvestment of dividends and any capital gains paid. Past performance is no guarantee of future results. Share price and investment return fluctuate such that upon redemption, fund shares may be worth more or less than their original cost. The fund’s performance does not reflect the deduction of additional charges and expenses imposed in connection with investing in variable insurance contracts, which will reduce returns. Return figures for the fund reflect the absorption of certain fund expenses by BNY Mellon Investment Adviser Inc. pursuant to an undertaking in effect through May 1, 2020, at which time it may be extended, terminated, or modified. Had these expenses not been absorbed, the fund’s returns would have been lower.
2 Source: Lipper Inc. — The MSCI EAFE Index (Europe, Australasia, Far East) is a free float-adjusted market capitalization-weighted index that is designed to measure the equity market performance of developed markets, excluding the U.S. and Canada. Reflects reinvestment of net dividends and, where applicable, capital gain distributions. Investors cannot invest directly in any index.
Please note: the position in any security highlighted italicized typeface was sold during the reporting period.
Equities are subject generally to market, market sector, market liquidity, issuer and investment style risks, among other factors, to varying degrees, all of which are more fully described in the fund’s prospectus.
The fund’s performance will be influenced by political, social and economic factors affecting investments in foreign companies. Special risks associated with investments in foreign companies include exposure to currency fluctuations, less liquidity, less developed or less efficient trading markets, lack of comprehensive company information, political instability and differing auditing and legal standards. These risks are enhanced in emerging- market countries.
The fund is only available as a funding vehicle under variable life insurance policies or variable annuity contracts issued by insurance companies. Individuals may not purchase shares of the fund directly. A variable annuity is an insurance contract issued by an insurance company that enables investors to accumulate assets on a tax-deferred basis for retirement or other long-term goals. The investment objective and policies of BNY Mellon Variable Investment Fund, International Value Portfolio made available through insurance products may be similar to those of other funds managed or advised by BNY Mellon Investment Adviser Inc. However, the investment results of the fund may be higher or lower than, and may not be comparable to, those of any other BNY Mellon fund.
The fund may, but is not required to, use derivative instruments. A small investment in derivatives could have a potentially large impact on the fund’s performance. The use of derivatives involves risks different from, or possibly greater than, the risks associated with investing directly in the underlying assets.
5
FUND PERFORMANCE(Unaudited)

Comparison of change in value of a $10,000 investment in Initial shares and Service shares of BNY Mellon Variable Investment Fund, International Value Portfolio with a hypothetical investment of $10,000 in the MSCI EAFE Index (the “Index”)
† Source: Lipper Inc.
Past performance is not predictive of future performance. The fund’s performance does not reflect the deduction of additional charges and expenses imposed in connection with investing in variable insurance contracts which will reduce returns.
The above graph compares a hypothetical investment of $10,000 made in Initial and Service shares of BNY Mellon Variable Investment Fund, International Value Portfolio on 12/31/09 to a hypothetical investment of $10,000 made in the Index on that date.
The fund’s performance shown in the line graph above takes into account all applicable fees and expenses. The Index (Europe, Australasia, Far East) is a free float-adjusted market capitalization-weighted index that is designed to measure the equity market performance of developed markets, excluding the U.S. and Canada. Unlike a mutual fund, the Index is not subject to charges, fees and other expenses. Investors cannot invest directly in any index. Further information relating to fund performance, including expense reimbursements, if applicable, is contained in the Financial Highlights section of the prospectus and elsewhere in this report.
| | | | |
Average Annual Total Returns as of 12/31/19 |
| 1 Year | 5 Years | 10 Years |
Initial shares | 22.39% | 4.64% | 2.99% |
Service shares | 21.92% | 4.37% | 2.72% |
MSCI EAFE Index | 22.01% | 5.67% | 5.50% |
The performance data quoted represents past performance, which is no guarantee of future results. Share price and investment return fluctuate and an investor’s shares may be worth more or less than original cost upon redemption. Current performance may be lower or higher than the performance quoted. Go to www.bnymellonim.com/us for the fund’s most recent month-end returns.
The fund’s Initial shares are not subject to a Rule 12b-1 fee. The fund’s Service shares are subject to a 0.25% annual Rule 12b-1 fee. All dividends and capital gain distributions are reinvested.
The fund’s performance shown in the graph and table does not reflect the deduction of taxes that a shareholder would pay on fund distributions or the redemption of fund shares.
6
UNDERSTANDING YOUR FUND’S EXPENSES(Unaudited)
As a mutual fund investor, you pay ongoing expenses, such as management fees and other expenses. Using the information below, you can estimate how these expenses affect your investment and compare them with the expenses of other funds. You also may pay one-time transaction expenses, including sales charges (loads), redemption fees and expenses associated with variable annuity or insurance contracts, which are not shown in this section and would have resulted in higher total expenses. For more information, see your fund’s prospectus or talk to your financial adviser.
Review your fund’s expenses
The table below shows the expenses you would have paid on a $1,000 investment in BNY Mellon Variable Investment Fund, International Value Portfolio from July 1, 2019 to December 31, 2019. It also shows how much a $1,000 investment would be worth at the close of the period, assuming actual returns and expenses.
| | | | | |
Expenses and Value of a $1,000 Investment | |
Assume actual returns for the six months ended December 31, 2019 | |
| | | | |
| | Initial Shares | Service Shares | |
Expense paid per $1,000† | $4.49 | $5.78 | |
Ending value (after expenses) | $1,069.30 | $1,067.40 | |
COMPARING YOUR FUND’S EXPENSES
WITH THOSE OF OTHER FUNDS(Unaudited)
Using the SEC’s method to compare expenses
The Securities and Exchange Commission (“SEC”) has established guidelines to help investors assess fund expenses. Per these guidelines, the table below shows your fund’s expenses based on a $1,000 investment, assuming a hypothetical 5% annualized return. You can use this information to compare the ongoing expenses (but not transaction expenses or total cost) of investing in the fund with those of other funds. All mutual fund shareholder reports will provide this information to help you make this comparison. Please note that you cannot use this information to estimate your actual ending account balance and expenses paid during the period.
| | | | | |
Expenses and Value of a $1,000 Investment | |
Assuming a hypothetical 5% annualized return for the six months ended December 31, 2019 | |
| | | | |
| | Initial Shares | Service Shares | |
Expense paid per $1,000† | $4.38 | $5.65 | |
Ending value (after expenses) | $1,020.87 | $1,019.61 | |
† Expenses are equal to the fund’s annualized expense ratio of .86% for Initial Shares and 1.11% for Service Shares, multiplied by the average account value over the period, multiplied by 184/365 (to reflect the one-half year period). |
7
STATEMENT OF INVESTMENTS
December 31, 2019
| | | | | | | | |
| |
Description | | | | Shares | | Value ($) | |
Common Stocks - 98.0% | | | | | |
Australia - 6.2% | | | | | |
Aristocrat Leisure | | | | 21,115 | | 498,904 | |
Brambles | | | | 26,110 | | 214,742 | |
Fortescue Metals Group | | | | 144,747 | | 1,085,850 | |
Macquarie Group | | | | 9,570 | | 925,766 | |
Northern Star Resources | | | | 19,121 | | 151,759 | |
| | | | | 2,877,021 | |
Austria - 1.3% | | | | | |
OMV | | | | 10,442 | | 586,577 | |
Denmark - 1.5% | | | | | |
Vestas Wind Systems | | | | 6,678 | | 674,832 | |
France - 10.9% | | | | | |
Air Liquide | | | | 2,420 | | 342,572 | |
Atos | | | | 7,819 | | 651,829 | |
BNP Paribas | | | | 14,461 | | 856,950 | |
Cie Generale des Etablissements Michelin | | | | 2,314 | | 283,181 | |
LVMH Moet Hennessy Louis Vuitton | | | | 1,717 | | 797,732 | |
Sanofi | | | | 12,978 | | 1,304,636 | |
Teleperformance | | | | 1,479 | | 360,665 | |
Vinci | | | | 4,035 | | 448,080 | |
| | | | | 5,045,645 | |
Germany - 8.1% | | | | | |
Allianz | | | | 3,887 | | 952,234 | |
Deutsche Boerse | | | | 4,059 | | 638,100 | |
Deutsche Post | | | | 11,690 | | 445,962 | |
Deutsche Telekom | | | | 80,677 | | 1,318,518 | |
Evonik Industries | | | | 11,858 | | 361,923 | |
| | | | | 3,716,737 | |
Hong Kong - 2.0% | | | | | |
Galaxy Entertainment Group | | | | 54,000 | | 397,777 | |
Sun Hung Kai Properties | | | | 34,000 | | 520,540 | |
| | | | | 918,317 | |
Ireland - 1.0% | | | | | |
ICON | | | | 2,562 | a | 441,253 | |
Italy - 2.4% | | | | | |
Enel | | | | 81,653 | | 647,726 | |
Leonardo | | | | 37,654 | | 441,371 | |
| | | | | 1,089,097 | |
Japan - 21.8% | | | | | |
Asahi Kasei | | | | 31,600 | | 358,883 | |
Bandai Namco Holdings | | | | 6,700 | | 408,888 | |
8
| | | | | | | | |
| |
Description | | | | Shares | | Value ($) | |
Common Stocks - 98.0% (continued) | | | | | |
Japan - 21.8% (continued) | | | | | |
Casio Computer | | | | 13,800 | | 278,273 | |
Chubu Electric Power | | | | 52,200 | | 740,567 | |
Denso | | | | 15,300 | | 699,276 | |
Hitachi | | | | 17,100 | | 728,035 | |
ITOCHU | | | | 15,400 | | 359,222 | |
Minebea Mitsumi | | | | 17,500 | | 366,734 | |
Mitsubishi Electric | | | | 46,400 | | 639,919 | |
Recruit Holdings | | | | 13,200 | | 497,969 | |
Seven & i Holdings | | | | 12,100 | | 445,781 | |
Shin-Etsu Chemical | | | | 4,000 | | 443,974 | |
Shionogi & Co. | | | | 11,500 | | 716,216 | |
Shiseido | | | | 3,200 | | 229,188 | |
Showa Denko KK | | | | 12,500 | | 333,510 | |
Sony | | | | 18,900 | | 1,287,367 | |
Sumitomo Mitsui Financial Group | | | | 29,600 | | 1,100,040 | |
West Japan Railway | | | | 5,200 | | 451,826 | |
| | | | | 10,085,668 | |
Netherlands - 6.7% | | | | | |
Heineken | | | | 6,990 | | 744,238 | |
ING Groep | | | | 48,595 | | 582,592 | |
Koninklijke Ahold Delhaize | | | | 18,417 | | 460,578 | |
NN Group | | | | 13,799 | | 523,477 | |
Royal Dutch Shell, Cl. B | | | | 26,123 | | 774,924 | |
| | | | | 3,085,809 | |
Portugal - .9% | | | | | |
Galp Energia | | | | 25,270 | | 422,346 | |
Singapore - 1.0% | | | | | |
United Overseas Bank | | | | 23,000 | | 451,638 | |
Spain - 5.4% | | | | | |
ACS Actividades de Construccion y Servicios | | | | 10,755 | | 430,077 | |
Amadeus IT Group | | | | 7,163 | | 584,929 | |
Iberdrola | | | | 86,973 | | 895,579 | |
Industria de Diseno Textil | | | | 16,956 | | 598,165 | |
| | | | | 2,508,750 | |
Sweden - 4.5% | | | | | |
Epiroc, Cl. A | | | | 29,563 | | 360,923 | |
Essity, Cl. B | | | | 21,960 | | 707,589 | |
Lundin Petroleum | | | | 12,106 | | 411,403 | |
Swedish Match | | | | 11,971 | | 617,060 | |
| | | | | 2,096,975 | |
Switzerland - 9.4% | | | | | |
Julius Baer Group | | | | 11,695 | | 603,360 | |
9
STATEMENT OF INVESTMENTS (continued)
| | | | | | | | |
| |
Description | | | | Shares | | Value ($) | |
Common Stocks - 98.0% (continued) | | | | | |
Switzerland - 9.4% (continued) | | | | | |
Novartis | | | | 13,012 | | 1,235,589 | |
Roche Holding | | | | 5,190 | | 1,683,881 | |
STMicroelectronics | | | | 30,898 | | 830,759 | |
| | | | | 4,353,589 | |
United Kingdom - 14.9% | | | | | |
Anglo American | | | | 21,699 | | 624,574 | |
BAE Systems | | | | 74,722 | | 559,021 | |
Barclays | | | | 150,355 | | 357,771 | |
Bunzl | | | | 12,579 | | 344,073 | |
Centrica | | | | 213,515 | | 252,560 | |
Cineworld Group | | | | 76,911 | | 223,211 | |
Diageo | | | | 13,965 | | 592,030 | |
Ferguson | | | | 4,380 | | 397,420 | |
GlaxoSmithKline | | | | 32,034 | | 754,869 | |
Legal & General Group | | | | 209,489 | | 840,792 | |
Melrose Industries | | | | 97,863 | | 311,240 | |
Unilever | | | | 20,870 | | 1,202,670 | |
Vodafone Group | | | | 217,907 | | 423,607 | |
| | | | | 6,883,838 | |
Total Common Stocks(cost $41,917,948) | | | | 45,238,092 | |
| | | | | | | | |
Exchange-Traded Funds - .8% | | | | | |
United States - .8% | | | | | |
iShares MSCI EAFE ETF
(cost $366,092) | | | | 5,249 | | 364,491 | |
| | | 1-Day
Yield (%) | | | | | |
Investment Companies - .3% | | | | | |
Registered Investment Companies - .3% | | | | | |
Dreyfus Institutional Preferred Government Plus Money Market Fund
(cost $151,358) | | 1.60 | | 151,358 | b | 151,358 | |
Total Investments(cost $42,435,398) | | 99.1% | | 45,753,941 | |
Cash and Receivables (Net) | | .9% | | 423,240 | |
Net Assets | | 100.0% | | 46,177,181 | |
ETF—Exchange-Traded Fund
aNon-income producing security.
bInvestment in affiliated issuer. The investment objective of this investment company is publicly available and can be found within the investment company’s prospectus.
10
| | |
Portfolio Summary (Unaudited)† | Value (%) |
Pharmaceuticals Biotechnology & Life Sciences | 13.3 |
Capital Goods | 11.6 |
Materials | 8.0 |
Banks | 7.3 |
Consumer Durables & Apparel | 6.0 |
Utilities | 5.5 |
Insurance | 5.0 |
Energy | 4.8 |
Diversified Financials | 4.7 |
Household & Personal Products | 4.6 |
Food, Beverage & Tobacco | 4.2 |
Telecommunication Services | 3.8 |
Software & Services | 2.7 |
Commercial & Professional Services | 2.3 |
Automobiles & Components | 2.1 |
Food & Staples Retailing | 2.0 |
Transportation | 1.9 |
Consumer Services | 1.9 |
Semiconductors & Semiconductor Equipment | 1.8 |
Technology Hardware & Equipment | 1.6 |
Retailing | 1.3 |
Real Estate | 1.1 |
Investment Companies | 1.1 |
Media & Entertainment | .5 |
| | 99.1 |
† Based on net assets.
See notes to financial statements.
11
STATEMENT OF INVESTMENTS IN AFFILIATED ISSUERS
| | | | | | | |
Investment Companies | Value
12/31/18($) | Purchases($) | Sales ($) | Value
12/31/19($) | Net
Assets(%) | Dividends/
Distributions($) |
Registered Investment Companies; | | | | | | |
Dreyfus Institutional Preferred Government Plus Money Market Fund | - | 13,501,578 | 13,350,220 | 151,358 | .3 | 4,015 |
See notes to financial statements.
12
STATEMENT OF FORWARD FOREIGN CURRENCY EXCHANGE CONTRACTSDecember 31, 2019
| | | | | | |
Counterparty/ Purchased
Currency | Purchased Currency
Amounts | Currency
Sold | Sold
Currency
Amounts | Settlement Date | Unrealized Appreciation (Depreciation)($) |
Barclays Capital | | | |
United States Dollar | 26,266 | Swedish Krona | 244,814 | 1/2/2020 | 126 |
Citigroup | | | |
United States Dollar | 10,841 | Danish Krone | 72,196 | 1/2/2020 | 2 |
Deutsche Bank | | | |
United States Dollar | 42,899 | Australian Dollar | 61,274 | 1/2/2020 | (102) |
J.P. Morgan Securities | | | |
United States Dollar | 9,359 | Euro | 8,344 | 1/2/2020 | (2) |
UBS Securities | | | |
United States Dollar | 7,826 | Singapore Dollar | 10,552 | 1/2/2020 | (20) |
United States Dollar | 166,056 | Japanese Yen | 18,086,381 | 1/7/2020 | (470) |
Gross Unrealized Appreciation | | | 128 |
Gross Unrealized Depreciation | | | (594) |
See notes to financial statements.
13
STATEMENT OF ASSETS AND LIABILITIES
December 31, 2019
| | | | | | | |
| | | | | | |
| | | Cost | | Value | |
Assets ($): | | | | |
Investments in securities—See Statement of Investments | | | |
Unaffiliated issuers | 42,284,040 | | 45,602,583 | |
Affiliated issuers | | 151,358 | | 151,358 | |
Cash denominated in foreign currency | | | 125,183 | | 125,437 | |
Receivable for investment securities sold | | 262,942 | |
Tax reclaim receivable | | 110,021 | |
Dividends and interest receivable | | 33,220 | |
Receivable for shares of Beneficial Interest subscribed | | 10,752 | |
Unrealized appreciation on forward foreign
currency exchange contracts—Note 4 | | 128 | |
Prepaid expenses | | | | | 4,142 | |
| | | | | 46,300,583 | |
Liabilities ($): | | | | |
Due to BNY Mellon Investment Adviser, Inc. and affiliates—Note 3(b) | | 35,283 | |
Payable for shares of Beneficial Interest redeemed | | 8,028 | |
Unrealized depreciation on forward foreign
currency exchange contracts—Note 4 | | 594 | |
Trustees’ fees and expenses payable | | 300 | |
Other accrued expenses | | | | | 79,197 | |
| | | | | 123,402 | |
Net Assets ($) | | | 46,177,181 | |
Composition of Net Assets ($): | | | | |
Paid-in capital | | | | | 55,508,264 | |
Total distributable earnings (loss) | | | | | (9,331,083) | |
Net Assets ($) | | | 46,177,181 | |
| | | | |
Net Asset Value Per Share | Initial Shares | Service Shares | |
Net Assets ($) | 18,462,989 | 27,714,192 | |
Shares Outstanding | 1,535,112 | 2,302,883 | |
Net Asset Value Per Share ($) | 12.03 | 12.03 | |
| | | |
See notes to financial statements. | | | |
14
STATEMENT OF OPERATIONS
Year Ended December 31, 2019
| | | | | | | |
| | | | | | |
| | | | | | |
Investment Income ($): | | | | |
Income: | | | | |
Cash dividends (net of $132,269 foreign taxes withheld at source): | |
Unaffiliated issuers | | | 1,478,396 | |
Affiliated issuers | | | 4,015 | |
Income from securities lending—Note 1(c) | | | 9 | |
Total Income | | | 1,482,420 | |
Expenses: | | | | |
Investment advisory fee—Note 3(a) | | | 454,920 | |
Professional fees | | | 108,689 | |
Distribution fees—Note 3(b) | | | 69,630 | |
Custodian fees—Note 3(b) | | | 30,521 | |
Prospectus and shareholders’ reports | | | 25,139 | |
Chief Compliance Officer fees—Note 3(b) | | | 11,793 | |
Trustees’ fees and expenses—Note 3(c) | | | 2,373 | |
Loan commitment fees—Note 2 | | | 1,014 | |
Shareholder servicing costs—Note 3(b) | | | 689 | |
Miscellaneous | | | 16,041 | |
Total Expenses | | | 720,809 | |
Less—reduction in expenses due to undertaking—Note 3(a) | | | (258,892) | |
Net Expenses | | | 461,917 | |
Investment Income—Net | | | 1,020,503 | |
Realized and Unrealized Gain (Loss) on Investments—Note 4 ($): | | |
Net realized gain (loss) on investments and foreign currency transactions | (211,397) | |
Net realized gain (loss) on forward foreign currency exchange contracts | 3,336 | |
Net Realized Gain (Loss) | | | (208,061) | |
Net change in unrealized appreciation (depreciation) on investments
and foreign currency transactions | 8,227,471 | |
Net change in unrealized appreciation (depreciation) on
forward foreign currency exchange contracts | (361) | |
Net Change in Unrealized Appreciation (Depreciation) | | | 8,227,110 | |
Net Realized and Unrealized Gain (Loss) on Investments | | | 8,019,049 | |
Net Increase in Net Assets Resulting from Operations | | 9,039,552 | |
| | | | | | |
See notes to financial statements. | | | | | |
15
STATEMENT OF CHANGES IN NET ASSETS
| | | | | | | | | | |
| | | | Year Ended December 31, |
| | | | 2019 | | 2018 | |
Operations ($): | | | | | | | | |
Investment income—net | | | 1,020,503 | | | | 891,242 | |
Net realized gain (loss) on investments | | (208,061) | | | | 3,281,458 | |
Net change in unrealized appreciation
(depreciation) on investments | | 8,227,110 | | | | (13,160,351) | |
Net increase from payment by affiliate | | - | | | | 102 | |
Net Increase (Decrease) in Net Assets
Resulting from Operations | 9,039,552 | | | | (8,987,549) | |
Distributions ($): | |
Distributions to shareholders: | | | | | | | | |
Initial Shares | | | (375,494) | | | | (342,309) | |
Service Shares | | | (529,593) | | | | (500,324) | |
Total Distributions | | | (905,087) | | | | (842,633) | |
Beneficial Interest Transactions ($): | |
Net proceeds from shares sold: | | | | | | | | |
Initial Shares | | | 1,277,756 | | | | 2,634,951 | |
Service Shares | | | 4,536,907 | | | | 5,976,338 | |
Distributions reinvested: | | | | | | | | |
Initial Shares | | | 375,494 | | | | 342,309 | |
Service Shares | | | 529,593 | | | | 500,324 | |
Cost of shares redeemed: | | | | | | | | |
Initial Shares | | | (3,395,107) | | | | (4,135,642) | |
Service Shares | | | (7,956,285) | | | | (11,111,204) | |
Increase (Decrease) in Net Assets
from Beneficial Interest Transactions | (4,631,642) | | | | (5,792,924) | |
Total Increase (Decrease) in Net Assets | 3,502,823 | | | | (15,623,106) | |
Net Assets ($): | |
Beginning of Period | | | 42,674,358 | | | | 58,297,464 | |
End of Period | | | 46,177,181 | | | | 42,674,358 | |
Capital Share Transactions (Shares): | |
Initial Shares | | | | | | | | |
Shares sold | | | 115,489 | | | | 221,877 | |
Shares issued for distributions reinvested | | | 33,950 | | | | 28,313 | |
Shares redeemed | | | (308,564) | | | | (352,295) | |
Net Increase (Decrease) in Shares Outstanding | (159,125) | | | | (102,105) | |
Service Shares | | | | | | | | |
Shares sold | | | 418,208 | | | | 501,536 | |
Shares issued for distributions reinvested | | | 47,754 | | | | 41,315 | |
Shares redeemed | | | (716,631) | | | | (941,892) | |
Net Increase (Decrease) in Shares Outstanding | (250,669) | | | | (399,041) | |
| | | | | | | | | |
See notes to financial statements. | | | | | | | | |
16
FINANCIAL HIGHLIGHTS
The following tables describe the performance for each share class for the fiscal periods indicated. All information (except portfolio turnover rate) reflects financial results for a single fund share. Total return shows how much your investment in the fund would have increased (or decreased) during each period, assuming you had reinvested all dividends and distributions. The fund’s total returns do not reflect expenses associated with variable annuity or insurance contracts. These figures have been derived from the fund’s financial statements.
| | | | | | | | | | | | |
| | | | | | | |
| | | |
Initial Shares | | | Year Ended December 31, |
| | | 2019 | 2018 | 2017 | 2016 | 2015 |
Per Share Data ($): | | | | | | |
Net asset value, beginning of period | | 10.04 | 12.27 | 9.70 | 10.04 | 10.55 |
Investment Operations: | | | | | | |
Investment income—neta | | .26 | .21 | .19 | .18 | .18 |
Net realized and unrealized
gain (loss) on investments | | 1.97 | (2.24) | 2.54 | (.33) | (.45) |
Total from Investment Operations | | 2.23 | (2.03) | 2.73 | (.15) | (.27) |
Distributions: | | | | | | |
Dividends from
investment income—net | | (.24) | (.20) | (.16) | (.19) | (.24) |
Payment by affiliate | | - | .00b,c | .00b,c | .00b,c | - |
Net asset value, end of period | | 12.03 | 10.04 | 12.27 | 9.70 | 10.04 |
Total Return (%) | | 22.39 | (16.81)c | 28.52c | (1.45)c | (2.72) |
Ratios/Supplemental Data (%): | | | | | | |
Ratio of total expenses
to average net assets | | 1.43 | 1.42 | 1.37 | 1.38 | 1.38 |
Ratio of net expenses
to average net assets | | .86 | .86 | .86 | .85 | .83 |
Ratio of net investment income
to average net assets | | 2.34 | 1.82 | 1.75 | 1.87 | 1.66 |
Portfolio Turnover Rate | | 66.11 | 78.31 | 62.39 | 108.21 | 147.24 |
Net Assets, end of period ($ x 1,000) | | 18,463 | 17,018 | 22,045 | 17,241 | 21,814 |
a Based on average shares outstanding.
b Amount represents less than $.01.
c The fund received proceeds from a class action settlement from The Bank of New York Mellon Corporation. This payment had no impact on total return.
See notes to financial statements.
17
FINANCIAL HIGHLIGHTS (continued)
| | | | | | | | | | | | | |
| | | | | | | |
| | | | |
Service Shares | | | Year Ended December 31, |
| | | 2019 | 2018 | 2017 | 2016 | 2015 |
Per Share Data ($): | | | | | | |
Net asset value, beginning of period | | 10.05 | 12.28 | 9.72 | 10.04 | 10.55 |
Investment Operations: | | | | | | |
Investment income—neta | | .24 | .19 | .17 | .13 | .17 |
Net realized and unrealized
gain (loss) on investments | | 1.95 | (2.25) | 2.54 | (.29) | (.47) |
Total from Investment Operations | | 2.19 | (2.06) | 2.71 | (.16) | (.30) |
Distributions: | | | | | | |
Dividends from
investment income—net | | (.21) | (.17) | (.15) | (.16) | (.21) |
Payment by affiliate | | - | .00b,c | .00b,c | .00b,c | - |
Net asset value, end of period | | 12.03 | 10.05 | 12.28 | 9.72 | 10.04 |
Total Return (%) | | 21.92 | (16.98)c | 28.14c | (1.58)c | (2.98) |
Ratios/Supplemental Data (%): | | | | | | |
Ratio of total expenses
to average net assets | | 1.68 | 1.67 | 1.62 | 1.61 | 1.63 |
Ratio of net expenses
to average net assets | | 1.11 | 1.11 | 1.11 | 1.10 | 1.08 |
Ratio of net investment income
to average net assets | | 2.18 | 1.62 | 1.49 | 1.41 | 1.53 |
Portfolio Turnover Rate | | 66.11 | 78.31 | 62.39 | 108.21 | 147.24 |
Net Assets, end of period ($ x 1,000) | | 27,714 | 25,657 | 36,253 | 26,862 | 18,566 |
a Based on average shares outstanding.
b Amount represents less than $.01.
c The fund received proceeds from a class action settlement from The Bank of New York Mellon Corporation. This payment had no impact on total return.
See notes to financial statements.
18
NOTES TO FINANCIAL STATEMENTS
NOTE 1—Significant Accounting Policies:
International Value Portfolio (the “fund”) is a separate diversified series of BNY Mellon Variable Investment Fund (the “Company”), which is registered under the Investment Company Act of 1940, as amended (the “Act”), as an open-end management investment company and operates as a series company currently offering seven series, including the fund. The fund is only offered to separate accounts established by insurance companies to fund variable annuity contracts and variable life insurance policies. The fund’s investment objective is to seek long-term capital growth. BNY Mellon Investment Adviser, Inc. (the “Adviser”), a wholly-owned subsidiary of The Bank of New York Mellon Corporation (“BNY Mellon”), serves as the fund’s investment adviser.
Effective June 3, 2019, the Company changed its name from Dreyfus Variable Investment Fund to BNY Mellon Variable Investment Fund. In addition, The Dreyfus Corporation, the fund’s investment adviser, changed its name to “BNY Mellon Investment Adviser, Inc.”, MBSC Securities Corporation, the fund’s distributor, changed its name to “BNY Mellon Securities Corporation” and Dreyfus Transfer, Inc., the fund’s transfer agent, changed its name to “BNY Mellon Transfer, Inc.”
BNY Mellon Securities Corporation (the “Distributor”), a wholly-owned subsidiary of the Adviser, is the distributor of the fund’s shares, which are sold without a sales charge. The fund is authorized to issue an unlimited number of $.001 par value shares of Beneficial Interest in each of the following classes of shares: Initial and Service. Each class of shares has identical rights and privileges, except with respect to the Distribution Plan, and the expenses borne by each class, the allocation of certain transfer agency costs, and certain voting rights. Income, expenses (other than expenses attributable to a specific class), and realized and unrealized gains or losses on investments are allocated to each class of shares based on its relative net assets.
The Company accounts separately for the assets, liabilities and operations of each series. Expenses directly attributable to each series are charged to that series’ operations; expenses which are applicable to all series are allocated among them on a pro rata basis.
The Financial Accounting Standards Board (“FASB”) Accounting Standards Codification (“ASC”) is the exclusive reference of authoritative U.S. generally accepted accounting principles (“GAAP”) recognized by the FASB to be applied by nongovernmental entities. Rules and interpretive releases of the Securities and Exchange Commission (“SEC”) under authority of federal laws are also sources of authoritative GAAP for SEC
19
NOTES TO FINANCIAL STATEMENTS(continued)
registrants. The fund is an investment company and applies the accounting and reporting guidance of the FASB ASC Topic 946 Financial Services-Investment Companies. The fund’s financial statements are prepared in accordance with GAAP, which may require the use of management estimates and assumptions. Actual results could differ from those estimates.
The Companyenters into contracts that contain a variety of indemnifications. The fund’s maximum exposure under these arrangements is unknown. The fund does not anticipate recognizing any loss related to these arrangements.
(a) Portfolio valuation: The fair value of a financial instrument is the amount that would be received to sell an asset or paid to transfer a liability in an orderly transaction between market participants at the measurement date (i.e., the exit price). GAAP establishes a fair value hierarchy that prioritizes the inputs of valuation techniques used to measure fair value. This hierarchy gives the highest priority to unadjusted quoted prices in active markets for identical assets or liabilities (Level 1 measurements) and the lowest priority to unobservable inputs (Level 3 measurements).
Additionally, GAAP provides guidance on determining whether the volume and activity in a market has decreased significantly and whether such a decrease in activity results in transactions that are not orderly. GAAP requires enhanced disclosures around valuation inputs and techniques used during annual and interim periods.
Various inputs are used in determining the value of the fund’s investments relating to fair value measurements. These inputs are summarized in the three broad levels listed below:
Level 1—unadjusted quoted prices in active markets for identical investments.
Level 2—other significant observable inputs (including quoted prices for similar investments, interest rates, prepayment speeds, credit risk, etc.).
Level 3—significant unobservable inputs (including the fund’s own assumptions in determining the fair value of investments).
The inputs or methodology used for valuing securities are not necessarily an indication of the risk associated with investing in those securities.
Changes in valuation techniques may result in transfers in or out of an assigned level within the disclosure hierarchy. Valuation techniques used to value the fund’s investments are as follows:
20
Investments in equity securities are valued at the last sales price on the securities exchange or national securities market on which such securities are primarily traded. Securities listed on the National Market System for which market quotations are available are valued at the official closing price or, if there is no official closing price that day, at the last sales price. For open short positions, asked prices are used for valuation purposes. Bid price is used when no asked price is available. Registered investment companies that are not traded on an exchange are valued at their net asset value. All of the preceding securities are generally categorized within Level 1 of the fair value hierarchy.
Securities not listed on an exchange or the national securities market, or securities for which there were no transactions, are valued at the average of the most recent bid and asked prices. These securities are generally categorized within Level 2 of the fair value hierarchy.
Fair valuing of securities may be determined with the assistance of a pricing service using calculations based on indices of domestic securities and other appropriate indicators, such as prices of relevant American Depository Receipts and futures. Utilizing these techniques may result in transfers between Level 1 and Level 2 of the fair value hierarchy.
When market quotations or official closing prices are not readily available, or are determined not to accurately reflect fair value, such as when the value of a security has been significantly affected by events after the close of the exchange or market on which the security is principally traded (for example, a foreign exchange or market), but before the fund calculates its net asset value, the fund may value these investments at fair value as determined in accordance with the procedures approved by the Company’s Board of Trustees (the “Board”). Certain factors may be considered when fair valuing investments such as: fundamental analytical data, the nature and duration of restrictions on disposition, an evaluation of the forces that influence the market in which the securities are purchased and sold, and public trading in similar securities of the issuer or comparable issuers. These securities are either categorized within Level 2 or 3 of the fair value hierarchy depending on the relevant inputs used.
For restricted securities where observable inputs are limited, assumptions about market activity and risk are used and such securities are generally categorized within Level 3 of the fair value hierarchy.
Investments denominated in foreign currencies are translated to U.S. dollars at the prevailing rates of exchange.
21
NOTES TO FINANCIAL STATEMENTS(continued)
Forward foreign currency exchange contracts (“forward contracts”) are valued at the forward rate and are generally categorized within Level 2 of the fair value hierarchy.
The following is a summary of the inputs used as of December 31, 2019in valuing the fund’s investments:
| | | | | | | | |
| | Level 1 - Unadjusted Quoted Prices | Level 2 - Other Significant Observable Inputs | Level 3 -Significant Unobservable Inputs | Total |
Assets ($) | | | |
Investments in Securities:† | | | |
Equity Securities -
Common Stocks | 45,238,092 | - | | - | 45,238,092 |
Exchange-Traded Funds | 364,491 | - | - | 364,491 |
Investment Companies | 151,358 | - | - | 151,358 |
Other Financial Instruments: | | | |
Forward Foreign Currency
Exchange Contracts†† | - | 128 | | 128 |
Liabilities ($) | | | | |
Other Financial Instruments: | | | | |
Forward Foreign Currency
Exchange Contracts†† | - | (594) | | - | (594) |
† See Statement of Investments for additional detailed categorizations, if any.
†† Amount shown represents unrealized appreciation (depreciation) at period end, but only variation margin on exchanged traded and centrally cleared derivatives, if any, are reported in the Statement of Assets and Liabilities.
(b) Foreign currency transactions: The fund does not isolate that portion of the results of operations resulting from changes in foreign exchange rates on investments from the fluctuations arising from changes in the market prices of securities held. Such fluctuations are included with the net realized and unrealized gain or loss on investments.
Net realized foreign exchange gains or losses arise from sales of foreign currencies, currency gains or losses realized on securities transactions between trade and settlement date, and the difference between the amounts of dividends, interest and foreign withholding taxes recorded on the fund’s books and the U.S. dollar equivalent of the amounts actually received or paid. Net unrealized foreign exchange gains and losses arise from changes in the value of assets and liabilities other than investments resulting from changes in exchange rates. Foreign currency gains and losses on foreign currency transactions are also included with net realized and unrealized gain or loss on investments.
(c)Securities transactions and investment income: Securities transactions are recorded on a trade date basis. Realized gains and losses
22
from securities transactions are recorded on the identified cost basis. Dividend income is recognized on the ex-dividend date and interest income, including, where applicable, accretion of discount and amortization of premium on investments, is recognized on the accrual basis.
Pursuant to a securities lending agreement with The Bank of New York Mellon, a subsidiary of BNY Mellon and an affiliate of the Adviser, the fund may lend securities to qualified institutions. It is the fund’s policy that, at origination, all loans are secured by collateral of at least 102% of the value of U.S. securities loaned and 105% of the value of foreign securities loaned. Collateral equivalent to at least 100% of the market value of securities on loan is maintained at all times. Collateral is either in the form of cash, which can be invested in certain money market mutual funds managed by the Adviser, or U.S. Government and Agency securities. The fund is entitled to receive all dividends, interest and distributions on securities loaned, in addition to income earned as a result of the lending transaction. Should a borrower fail to return the securities in a timely manner, The Bank of New York Mellon is required to replace the securities for the benefit of the fund or credit the fund with the market value of the unreturned securities and is subrogated to the fund’s rights against the borrower and the collateral. Additionally, the contractual maturity of security lending transactions are on an overnight and continuous basis. During the period ended December 31, 2019, The Bank of New York Mellon earned $2 from the lending of the fund’s portfolio securities, pursuant to the securities lending agreement.
(d) Affiliated issuers: Investments in other investment companies advised by the Adviser are considered “affiliated” under the Act.
(e) Risk: Investing in foreign markets may involve special risks and considerations not typically associated with investing in the U.S. These risks include revaluation of currencies, high rates of inflation, repatriation restrictions on income and capital, and adverse political and economic developments. Moreover, securities issued in these markets may be less liquid, subject to government ownership controls and delayed settlements, and their prices may be more volatile than those of comparable securities in the U.S.
(f) Dividends and distributions to shareholders: Dividends and distributions are recorded on the ex-dividend date. Dividends from investment income-net and dividends from net realized capital gains, if any, are normally declared and paid annually, but the fund may make distributions on a more frequent basis to comply with the distribution requirements of the Internal Revenue Code of 1986, as amended (the
23
NOTES TO FINANCIAL STATEMENTS(continued)
“Code”). To the extent that net realized capital gains can be offset by capital loss carryovers, it is the policy of the fund not to distribute such gains. Income and capital gain distributions are determined in accordance with income tax regulations, which may differ from GAAP.
(g) Federal income taxes: It is the policy of the fund to continue to qualify as a regulated investment company, if such qualification is in the best interests of its shareholders, by complying with the applicable provisions of the Code, and to make distributions of taxable income and net realized capital gain sufficient to relieve it from substantially all federal income and excise taxes.
As of and during the period ended December 31, 2019, the fund did not have any liabilities for any uncertain tax positions. The fund recognizes interest and penalties, if any, related to uncertain tax positions as income tax expense in the Statement of Operations. During the period ended December 31, 2019, the fund did not incur any interest or penalties.
Each tax year in the four-year period ended December 31, 2019 remains subject to examination by the Internal Revenue Service and state taxing authorities.
At December 31, 2019, the components of accumulated earnings on a tax basis were as follows: undistributed ordinary income $1,200,750, accumulated capital losses $13,650,260 and unrealized appreciation $3,118,427.
The fund is permitted to carry forward capital losses for an unlimited period. Furthermore, capital loss carryovers retain their character as either short-term or long-term capital losses.
The accumulated capital loss carryover is available for federal income tax purposes to be applied against future netrealized capital gains, if any, realized subsequent to December 31, 2019. The fund has $371,279 of short-term capital losses and $13,278,981 of long-term capital losses which can be carried forward for an unlimited period.
The tax character of distributions paid to shareholders during the fiscal periods ended December 31, 2019 and December 31, 2018 were as follows: ordinary income $905,087 and $842,633, respectively.
(h) New Accounting Pronouncements: Effective June 1, 2019, the fund adopted Accounting Standards Update 2018-13, Fair Value Measurement (Topic 820): Disclosure Framework—Changes to the Disclosure Requirements for Fair Value Measurement (“ASU 2018-13”). The update provides guidance that eliminates, adds and modifies certain disclosure requirements for fair value measurements. The adoption of ASU 2018-13
24
had no impact on the operations of the fund for the period ended December 31, 2019.
NOTE 2—Bank Lines of Credit:
The fund participates with other long-term open-end funds managed by the Adviser in a $1.030 billion unsecured credit facility led by Citibank, N.A. (the “Citibank Credit Facility”) and a $300 million unsecured credit facility provided by The Bank of New York Mellon (the “BNYM Credit Facility”), a subsidiary of BNY Mellon and an affiliate of the Adviser, each to be utilized primarily for temporary or emergency purposes, including the financing of redemptions (each, a “Facility”). The Citibank Credit Facility is available in two tranches: (i) Tranche A is in an amount equal to $830 million and is available to all long-term open-ended funds, including the fund, and (ii) Tranche B is in amount equal to $200 million and is available only to BNY Mellon Floating Rate Income Fund, a series of BNY Mellon Investment Funds IV, Inc. In connection therewith, the fund has agreed to pay its pro rata portion of commitment fees for Tranche A of the Citibank Credit Facility and the BNYM Credit Facility. Interest is charged to the fund based on rates determined pursuant to the terms of the respective Facility at the time of borrowing. During the period ended December 31, 2019, the fund did not borrow under the Facilities.
NOTE 3—Investment Advisory Fee and Other Transactions with Affiliates:
(a)Pursuant to an investment advisory agreement with the Adviser, the investment advisory fee is computed at the annual rate of 1% of the value of the fund’s average daily net assets and is payable monthly. The Adviser has contractually agreed, from January 1, 2019 through May 1, 2020, to waive receipt of its fees and/or assume the direct expenses of the fund, so that the direct expenses of none of the classes (excluding Rule 12b-1 Distribution Plan fees, taxes, interest expense, brokerage commissions, commitment fees on borrowings and extraordinary expenses) exceed .86% of the value of the fund’s average daily net assets. On or after May 1, 2020, the Adviser may terminate this expense limitation agreement at any time. The reduction in expenses, pursuant to the undertaking, amounted to $258,892 during the period ended December 31, 2019.
(b)Under the Distribution Plan adopted pursuant to Rule 12b-1 under the Act, Service shares pay the Distributor for distributing its shares, for servicing and/or maintaining Service shares’ shareholder accounts and for advertising and marketing for Service shares. The Distribution Plan provides for payments to be made at an annual rate of .25% of the value of the Service shares’ average daily net assets. The Distributor may make
25
NOTES TO FINANCIAL STATEMENTS(continued)
payments to Participating Insurance Companies and to brokers and dealers acting as principal underwriter for their variable insurance products. The fees payable under the Distribution Plan are payable without regard to actual expenses incurred. During the period ended December 31, 2019,Service shares were charged $69,630 pursuant to the Distribution Plan.
The fund has an arrangement with the transfer agent whereby the fund may receive earnings credits when positive cash balances are maintained, which are used to offset transfer agency fees. The fund had an arrangement with the custodian to receive earnings credits when positive cash balances were maintained, which were used to offset custody fees. Effective February 1, 2019, the arrangement with the custodian changed whereby the fund will no longer receive earnings credits to offset its custody fees and will receive interest income or overdraft fees going forward. For financial reporting purposes, the fund includes net earnings credits, if any, as an expense offset in the Statement of Operations.
The fund compensates BNY Mellon Transfer, Inc., a wholly-owned subsidiary of the Adviser, under a transfer agency agreement for providing transfer agency and cash management services for the fund. The majority of transfer agency fees are comprised of amounts paid on a per account basis, while cash management fees are related to fund subscriptions and redemptions. During the period ended December 31, 2019, the fund was charged $605 for transfer agency services. These fees are included in Shareholder servicing costs in the Statement of Operations.
The fund compensates The Bank of New York Mellon under a custody agreement for providing custodial services for the fund. These fees are determined based on net assets, geographic region and transaction activity. During the period ended December 31, 2019, the fund was charged $30,521 pursuant to the custody agreement.
During the period ended December 31, 2019, the fund was charged $11,793 for services performed by the Chief Compliance Officer and his staff. These fees are included in Chief Compliance Officer fees in the Statement of Operations.
The components of “Due to BNY Mellon Investment Adviser, Inc. and affiliates” in the Statement of Assets and Liabilities consist of: investment advisory fees of $38,847, Distribution Plan fees of $5,838, custodian fees of $12,000, Chief Compliance Officer fees of $3,261 and transfer agency fees of $112, which are offset against an expense reimbursement currently in effect in the amount of $24,775.
26
(c) Each Board member also serves as a Board member of other funds in the BNY Mellon Family of Funds complex. Annual retainer fees and attendance fees are allocated to each fund based on net assets.
NOTE 4—Securities Transactions:
The aggregate amount of purchases and sales of investment securities, excluding short-term securities and forward contracts, during the period ended December 31, 2019, amounted to $29,682,233 and $34,185,906, respectively.
Derivatives: A derivative is a financial instrument whose performance is derived from the performance of another asset. The fund enters into International Swaps and Derivatives Association, Inc. Master Agreements or similar agreements (collectively, “Master Agreements”) with its over-the counter (“OTC”) derivative contract counterparties in order to, among other things, reduce its credit risk to counterparties. Master Agreements include provisions for general obligations, representations, collateral and events of default or termination. Under a Master Agreement, the fund may offset with the counterparty certain derivative financial instruments’ payables and/or receivables with collateral held and/or posted and create one single net payment in the event of default or termination.
Each type of derivative instrument that was held by the fund during the period ended December 31, 2019 is discussed below.
Forward Foreign Currency Exchange Contracts: The fund enters into forward contracts in order to hedge its exposure to changes in foreign currency exchange rates on its foreign portfolio holdings, to settle foreign currency transactions or as a part of its investment strategy. When executing forward contracts, the fund is obligated to buy or sell a foreign currency at a specified rate on a certain date in the future. With respect to sales of forward contracts, the fund incurs a loss if the value of the contract increases between the date the forward contract is opened and the date the forward contract is closed. The fund realizes a gain if the value of the contract decreases between those dates. With respect to purchases of forward contracts, the fund incurs a loss if the value of the contract decreases between the date the forward contract is opened and the date the forward contract is closed. The fund realizes a gain if the value of the contract increases between those dates. Any realized or unrealized gains or losses which occurred during the period are reflected in the Statement of Operations. The fund is exposed to foreign currency risk as a result of changes in value of underlying financial instruments. The fund is also exposed to credit risk associated with counterparty nonperformance on these forward contracts, which is generally limited to the unrealized gain
27
NOTES TO FINANCIAL STATEMENTS(continued)
on each open contract. This risk may be mitigated by Master Agreements, if any, between the fund and the counterparty and the posting of collateral, if any, by the counterparty to the fund to cover the fund’s exposure to the counterparty. Forward contracts open at December 31, 2019 are set forth in the Statement of Forward Foreign Currency Exchange Contracts.
The provisions of ASC Topic 210 “Disclosures about Offsetting Assets and Liabilities” require disclosure on the offsetting of financial assets and liabilities. These disclosures are required for certain investments, including derivative financial instruments subject to Master Agreements which are eligible for offsetting in the Statement of Assets and Liabilities and require the fund to disclose both gross and net information with respect to such investments. For financial reporting purposes, the fund does not offset derivative assets and derivative liabilities that are subject to Master Agreements in the Statement of Assets and Liabilities.
At December 31, 2019, derivative assets and liabilities (by type) on a gross basis are as follows:
| | | | | | |
Derivative Financial Instruments: | | Assets ($) | | Liabilities ($) | |
Forward contracts | | 128 | | (594) | |
Total gross amount of derivative | | | | | |
assets and liabilities in the | | | | | |
Statement of Assets and Liabilities | | 128 | | (594) | |
Derivatives not subject to | | | | | |
Master Agreements | | - | | - | |
Total gross amount of assets | | | | | |
and liabilities subject to | | | | | |
Master Agreements | | 128 | | (594) | |
The following table presents derivative assets net of amounts available for offsetting under Master Agreements and net of related collateral received or pledged, if any, as of December 31, 2019:
| | | | | | | |
| | | Financial | | | |
| | | Instruments | | | |
| | | and Derivatives | | | |
| Gross Amount of | | Available | Collateral | | Net Amount of |
Counterparty | Assets ($) | 1 | for Offset ($) | Received ($) | | Assets ($) |
Barclays Capital | 126 | | - | - | | 126 |
Citigroup | 2 | | - | - | | 2 |
Total | 128 | | - | - | | 128 |
| | | | | | |
28
| | | | | | | |
| | | Financial | | | |
| | | Instruments | | | |
| | | and Derivatives | | | |
| Gross Amount of | | Available | Collateral | | Net Amount of |
Counterparty | Liabilities ($) | 1 | for Offset ($) | Pledged ($) | | Liabilities ($) |
Deutsche Bank | (102) | | - | - | | (102) |
J.P. Morgan Securities | (2) | | - | - | | (2) |
UBS Securities | (490) | | - | - | | (490) |
Total | (594) | | - | - | | (594) |
| | | | | | |
1 Absent a default event or early termination, OTC derivative assets and liabilities are presented at gross amounts and are not offset in the Statement of Assets and Liabilities. |
The following summarizes the average market value of derivatives outstanding duringthe period ended December 31, 2019:
| | | |
| | Average Market Value ($) |
Forward contracts | | 110,475 |
| | |
At December 31, 2019, the cost of investments for federal income tax purposes was $42,634,479; accordingly, accumulated net unrealized appreciation on investments inclusive of derivative contracts was $3,118,996, consisting of $5,070,775 gross unrealized appreciation and $1,951,779 gross unrealized depreciation.
NOTE 5—Plan of Liquidation:
On November 26, 2019, the Board approved a Plan of Liquidation (the “Plan”). The Plan provides for the liquidation of the fund, the pro rata distribution of the assets of the fund to its shareholders and the closing of fund shareholder accounts (the “Liquidation”). The Liquidation of the fund will occur on or about April 30, 2020. Accordingly, effective March 31, 2020, the fund will be closed to any investments for new accounts.
29
REPORT OF INDEPENDENT REGISTERED PUBLIC ACCOUNTING FIRM
To the Shareholders and the Board of Trustees of International Value Portfolio
Opinion on the Financial Statements
We have audited the accompanying statement of assets and liabilities of International Value Portfolio (the “Fund”) (one of the funds constituting BNY Mellon Variable Investment Fund), including the statements of investments, investments in affiliated issuers and forward foreign currency exchange contracts, as of December 31, 2019, and the related statement of operations for the year then ended, the statements of changes in net assets for each of the two years in the period then ended, the financial highlights for each of the five years in the period then ended and the related notes (collectively referred to as the “financial statements”). In our opinion, the financial statements present fairly, in all material respects, the financial position of the Fund (one of the funds constituting BNY Mellon Variable Investment Fund) at December 31, 2019, the results of its operations for the year then ended, the changes in its net assets for each of the two years in the period then ended and its financial highlights for each of the five years in the period then ended, in conformity with U.S. generally accepted accounting principles.
Basis for Opinion
These financial statements are the responsibility of the Fund’s management. Our responsibility is to express an opinion on the Fund’s financial statements based on our audits. We are a public accounting firm registered with the Public Company Accounting Oversight Board (United States) (“PCAOB”) and are required to be independent with respect to the Fund in accordance with the U.S. federal securities laws and the applicable rules and regulations of the Securities and Exchange Commission and the PCAOB.
We conducted our audits in accordance with the standards of the PCAOB. Those standards require that we plan and perform the audit to obtain reasonable assurance about whether the financial statements are free of material misstatement, whether due to error or fraud. The Fund is not required to have, nor were we engaged to perform, an audit of the Fund’s internal control over financial reporting. As part of our audits, we are required to obtain an understanding of internal control over financial reporting, but not for the purpose of expressing an opinion on the effectiveness of the Fund’s internal control over financial reporting. Accordingly, we express no such opinion.
Our audits included performing procedures to assess the risks of material misstatement of the financial statements, whether due to error or fraud, and performing procedures that respond to those risks. Such procedures included examining, on a test basis, evidence regarding the amounts and disclosures in the financial statements. Our procedures included confirmation of securities owned as of December 31, 2019, by correspondence with the custodian and others or by other appropriate auditing procedures where replies from others were not received. Our audits also included evaluating the accounting principles used and significant estimates made by management, as well as evaluating the overall presentation of the financial statements. We believe that our audits provide a reasonable basis for our opinion.

We have served as the auditor of one or more investment companies in the BNY Mellon Family of Funds since at least 1957, but we are unable to determine the specific year.
New York, New York
February 10, 2020
30
IMPORTANT TAX INFORMATION(Unaudited)
In accordance with federal tax law, the fund elects to provide each shareholder with their portion of the fund’s foreign taxes paid and the income sourced from foreign countries. Accordingly, the fund hereby reports the following information regarding its fiscal year ended December 31, 2019:
- the total amount of taxes paid to foreign countries was $132,269.
- the total amount of income sourced from foreign countries was $1,766,439.
Where required by federal tax law rules, shareholders will receive notification of their proportionate share of foreign taxes paid and foreign sourced income for the 2019 calendar year with Form 1099-DIV which will be mailed in early 2020.
31
BOARD MEMBERS INFORMATION(Unaudited)
INDEPENDENT BOARD MEMBERS
Joseph S. DiMartino (76)
Chairman of the Board (1995)
Principal Occupation During Past 5 Years:
· Corporate Director and Trustee (1995-Present)
Other Public Company Board Memberships During Past 5 Years:
· CBIZ, Inc., a public company providing professional business services, products and solutions,Director (1997-Present)
No. of Portfolios for which Board Member Serves:118
———————
Peggy C. Davis (76)
Board Member (2006)
Principal Occupation During Past 5 Years:
· Shad Professor of Law, New York University School of Law (1983-present)
No. of Portfolios for which Board Member Serves: 43
———————
Gina D. France (61)
Board Member (2019)
Principal Occupation During Past 5 Years:
· Founder, President and Chief Executive Officer, France Strategic Partners, a strategy and advisory firm serving corporate clients across the United States (2003 –Present)
· Corporate Director and Trustee (2004 – Present)
Other Public Company Board Memberships During Past 5 Years:
· Huntington Bancshares, a bank holding company headquartered in Columbus, Ohio,Director(2016 – Present)
· Cedar Fair, L.P., a publicly-traded partnership that owns and operates amusement parks and hotels in the U.S. and Canada,Director (2011 – Present)
· CBIZ (formerly, Century Business Services, Inc.), a provider of outsourcing functions for small and medium size companies,Director(2015 – Present)
· Baldwin Wallace University,Trustee (2013- Present)
· FirstMerit Corporation, a diversified financial services company,Director (2004 – 2016)
No. of Portfolios for which Board Member Serves:29
———————
32
Joan Gulley (72)
Board Member (2017)
Principal Occupation During Past 5 Years:
· PNC Financial Services Group, Inc.(1993-2014), Executive Vice President and Chief Human Resources Officer and Executive Committee Member (2008-2014)
· Director, Nantucket Library (2015-Present)
No. of Portfolios for which Board Member Serves:49
———————
Ehud Houminer (79)
Board Member (2006)
Principal Occupation During Past 5 Years:
· Board of Overseers at the Columbia Business School, Columbia University (1992-Present)
· Trustee, Ben Gurion University (2012-2018)
No. of Portfolios for which Board Member Serves:49
———————
Robin A. Melvin (56)
Board Member (2012)
Principal Occupation During Past 5 Years:
· Co-chairman, Mentor Illinois, a non-profit organization dedicated to increasing the quantity and quality of mentoring services in Illinois; (2014-Present); Board member (2013-Present)
No. of Portfolios for which Board Member Serves:96
———————
Once elected all Board Members serve for an indefinite term, but achieve Emeritus status upon reaching age 80. The address of the Board Members and Officers is c/o BNY Mellon Investment Adviser, Inc. 240 Greenwich Street, New York, New York 10286. Additional information about the Board Members is available in the fund’s Statement of Additional Information which can be obtained from the Adviser free of charge by calling this toll free number: 1-800-373-9387.
David P. Feldman, Emeritus Board Member
James F. Henry, Emeritus Board Member
Lynn Martin, Emeritus Board Member
Dr. Martin Peretz, Emeritus Board Member
Philip L. Toia, Emeritus Board Member
33
OFFICERS OF THE FUND(Unaudited)
RENEE LAROCHE-MORRIS, President since May 2019.
President and a director of BNY Mellon Investment Adviser, Inc. since January 2018. She is an officer of 62 investment companies (comprised of 118 portfolios) managed by the Adviser. She is 48 years old and has been an employee of BNY Mellon since 2003.
JAMES WINDELS, Treasurer since November 2001.
Director- BNY Mellon Fund Administration, and an officer of 63 investment companies (comprised of 141 portfolios) managed by the Adviser. He is 61 years old and has been an employee of the Adviser since April 1985.
BENNETT A. MACDOUGALL, Chief Legal Officer since October 2015.
Chief Legal Officer of the Adviser and Associate General Counsel and Managing Director of BNY Mellon since June 2015; Director and Associate General Counsel of Deutsche Bank – Asset & Wealth Management Division from June 2005 to June 2015, and as Chief Legal Officer of Deutsche Investment Management Americas Inc. from June 2012 to May 2015. He is an officer of 63 investment companies (comprised of 141 portfolios) managed by the Adviser. He is 48 years old and has been an employee of the Adviser since June 2015.
DAVID DIPETRILLO, Vice President since May 2019.
Head of North America Product, BNY Mellon Investment Management since January 2018, Director of Product Strategy, BNY Mellon Investment Management from January 2016 to December 2017; Head of US Retail Product and Channel Marketing, BNY Mellon Investment Management from January 2014 to December 2015. He is an officer of 62 investment companies (comprised of 118 portfolios) managed by the Adviser. He is 41 years old and has been an employee of BNY Mellon since 2005.
JAMES BITETTO, Vice President since August 2005 and Secretary since February 2018.
Senior Managing Counsel of BNY Mellon since December 2019; Managing Counsel of BNY Mellon from April 2014 to December 2019; Secretary of the Adviser, and an officer of 63 investment companies (comprised of 141 portfolios) managed by the Adviser. He is 53 years old and has been an employee of the Adviser since December 1996.
SONALEE CROSS, Vice President and Assistant Secretary since March 2018.
Counsel of BNY Mellon since October 2016; Associate at Proskauer Rose LLP from April 2016 to September 2016; Attorney at EnTrust Capital from August 2015 to February 2016; Associate at Sidley Austin LLP from September 2013 to August 2015. She is an officer of 63 investment companies (comprised of 141 portfolios) managed by the Adviser. She is 32 years old and has been an employee of the Adviser since October 2016.
DEIRDRE CUNNANE, Vice President and Assistant Secretary since March 2019.
Counsel of BNY Mellon since August 2018; Senior Regulatory Specialist at BNY Mellon Investment Management Services from February 2016 to August 2018; Trustee Associate at BNY Mellon Trust Company (Ireland) Limited from August 2013 to February 2016. She is an officer of 63 investment companies (comprised of 141 portfolios) managed by the Adviser. She is 29 years old and has been an employee of the Adviser since August 2018.
SARAH S. KELLEHER, Vice President and Assistant Secretary since April 2014.
Managing Counsel of BNY Mellon since December 2017, Senior Counsel of BNY Mellon from March 2013 to December 2017. She is an officer of 63 investment companies (comprised of 141 portfolios) managed by the Adviser. She is 44 years old and has been an employee of the Adviser since March 2013.
JEFF PRUSNOFSKY, Vice President and Assistant Secretary since August 2005.
Senior Managing Counsel of BNY Mellon, and an officer of 63 investment companies (comprised of 141 portfolios) managed by the Adviser. He is 54 years old and has been an employee of the Adviser since October 1990.
PETER M. SULLIVAN, Vice President and Assistant Secretary since March 2019.
Managing Counsel of BNY Mellon, and an officer of 63 investment companies (comprised of 141 portfolios) managed by the Adviser. He is 51 years old and has been an employee of the Adviser since April 2004.
34
NATALYA ZELENSKY, Vice President and Assistant Secretary since March 2017.
Managing Counsel of BNY Mellon since December 2019; Counsel of BNY Mellon from May 2016 to December 2019; Attorney at Wildermuth Endowment Strategy Fund/Wildermuth Advisory, LLC from November 2015 to May 2016 and Assistant General Counsel at RCS Advisory Services from July 2014 to November 2015. She is an officer of 63 investment companies (comprised of 141 portfolios) managed by the Adviser. She is 34 years old and has been an employee of the Adviser since May 2016.
GAVIN C. REILLY, Assistant Treasurer since December 2005.
Tax Manager - BNY Mellon Fund Administration, and an officer of 63 investment companies (comprised of 141 portfolios) managed by the Adviser. He is 51 years old and has been an employee of the Adviser since April 1991.
ROBERT S. ROBOL, Assistant Treasurer since August 2005.
Senior Accounting Manager- BNY Mellon Fund Administration, and an officer of 63 investment companies (comprised of 141 portfolios) managed by the Adviser. He is 55 years old and has been an employee of the Adviser since October 1988.
ROBERT SALVIOLO, Assistant Treasurer since July 2007.
Senior Accounting Manager – BNY Mellon Fund Administration, and an officer of 63 investment companies (comprised of 141 portfolios) managed by the Adviser. He is 52 years old and has been an employee of the Adviser since June 1989.
ROBERT SVAGNA, Assistant Treasurer since December 2002.
Senior Accounting Manager – BNY Mellon Fund Administration, and an officer of 63 investment companies (comprised of 141 portfolios) managed by the Adviser. He is 52 years old and has been an employee of the Adviser since November 1990.
JOSEPH W. CONNOLLY, Chief Compliance Officer since October 2004.
Chief Compliance Officer of the Adviser, the BNY Mellon Family of Funds and BNY Mellon Funds Trust (63 investment companies, comprised of 141 portfolios). He is 62 years old and has served in various capacities with the Adviser since 1980, including manager of the firm’s Fund Accounting Department from 1997 through October 2001.
CARIDAD M. CAROSELLA, Anti-Money Laundering Compliance Officer since January 2016.
Anti-Money Laundering Compliance Officer of the BNY Mellon Family of Funds and BNY Mellon Funds Trust since January 2016; from May 2015 to December 2015, Interim Anti-Money Laundering Compliance Officer of the BNY Mellon Family of Funds and BNY Mellon Funds Trust and the Distributor; from January 2012 to May 2015, AML Surveillance Officer of the Distributor. She is an officer of 56 investment companies (comprised of 134 portfolios) managed by the Adviser. She is 51 years old and has been an employee of the Distributor since 1997.
35
NOTES
36
NOTES
37
BNY Mellon Variable Investment Fund, International Value Portfolio
240 Greenwich Street
New York, NY 10286
Adviser
BNY Mellon Investment Adviser, Inc.
240 Greenwich Street
New York, NY 10286
Custodian
The Bank of New York Mellon
240 Greenwich Street
New York, NY 10286
Transfer Agent &
Dividend Disbursing Agent
BNY Mellon Transfer, Inc.
240 Greenwich Street
New York, NY 10286
Distributor
BNY Mellon Securities Corporation
240 Greenwich Street
New York, NY 10286
Telephone 1-800-258-4260 or 1-800-258-4261
Mail The BNY Mellon Family of Funds, 144 Glenn Curtiss Boulevard, Uniondale, NY 11556-0144 Attn: Institutional Services Department
E-mailSend your request to info@bnymellon.com
InternetInformation can be viewed online or downloaded atwww.bnymellonim.com/us
The fund files its complete schedule of portfolio holdings with the Securities and Exchange Commission (“SEC”) for the first and third quarters of each fiscal year on Form N-PORT. The fund’s Forms N-PORT are available on the SEC’s website atwww.sec.gov.
A description of the policies and procedures that the fund uses to determine how to vote proxies relating to portfolio securities and information regarding how the fund voted these proxies for the most recent 12-month period ended June 30 is available atwww.bnymellonim.com/us and on the SEC’s website at www.sec.gov and without charge, upon request, by calling 1-800-373-9387.
| | |
© 2020 BNY Mellon Securities Corporation
0152AR1219 | 
|
BNY Mellon Variable Investment Fund, Opportunistic Small Cap Portfolio
| |
ANNUAL REPORT December 31, 2019 |

| |
The views expressed in this report reflect those of the portfolio manager(s) only through the end of the period covered and do not necessarily represent the views of BNY Mellon Investment Adviser, Inc. or any other person in the BNY Mellon Investment Adviser, Inc. organization. Any such views are subject to change at any time based upon market or other conditions and BNY Mellon Investment Adviser, Inc. disclaims any responsibility to update such views. These views may not be relied on as investment advice and, because investment decisions for a fund in the BNY Mellon Family of Funds are based on numerous factors, may not be relied on as an indication of trading intent on behalf of any fund in the BNY Mellon Family of Funds. |
| |
Not FDIC-Insured • Not Bank-Guaranteed • May Lose Value |
Contents
THE FUND
FOR MORE INFORMATION
Back Cover
| | | | |
| |
BNY Mellon Variable Investment Fund, Opportunistic Small Cap Portfolio
| | The Fund |
A LETTER FROM THE PRESIDENT OF BNY MELLON INVESTMENT ADVISER, INC.
Dear Shareholder:
We are pleased to present this annual report for BNY Mellon Variable Investment Fund, Opportunistic Small Cap Portfolio (formerly, Dreyfus Variable Investment Fund, Opportunistic Small Cap Portfolio), covering the 12-month period from January 1, 2019 through December 31, 2019. For information about how the fund performed during the reporting period, as well as general market perspectives, we provide a Discussion of Fund Performance on the pages that follow.
In January 2019, a pivot in stance from the U.S. Federal Reserve (the “Fed”) helped stimulate a rebound across equity markets that continued into the second quarter of the year. However, escalating trade tensions disrupted equity markets in May. The dip was short-lived, as markets rose once again in June and July of 2019, when a trade deal appeared more likely and the pace of U.S. economic growth remained steady. Nevertheless, concerns continued to emerge over slowing global growth, resulting in bouts of market volatility in August 2019. Stocks rebounded in September and continued an upward path through most of October 2019, bolstered by central bank policy and consistent consumer spending. The rally generally continued through the end of the period, supported in part by an announcement from President Trump that the first phase of a trade deal with China was in process. U.S. equity markets reached new highs during the final months of the period.
In fixed-income markets, the year began with a recovery from the prior months’ volatility. After the Fed’s supportive statements in January 2019, other developed-market central banks followed suit and reiterated their abilities to buttress flagging growth rates by continuing accommodative policies. The Fed cut rates in July, September and October 2019, for a total 75 basis point reduction in the federal funds rate during the 12 months. Rates across much of the Treasury curve saw a slight increase during the month of November, and the long end of the curve rose in December. The yield curve steepened during the latter portion of the period. However, demand for fixed-income instruments during the year was strong, which helped to support positive bond market returns.
We believe that over the near term, the outlook for the U.S. remains positive, but we will monitor relevant data for any signs of a change. As always, we encourage you to discuss the risks and opportunities in today’s investment environment with your financial advisor.
Thank you for your continued confidence and support.
Sincerely,

Renee LaRoche-Morris
President
BNY Mellon Investment Adviser, Inc.
January 15, 2020
2
DISCUSSION OF FUND PERFORMANCE(Unaudited)
For the period from January 1, 2019 through December 31, 2019, as provided by Patrick Kent, CFA and James Boyd, Portfolio Managers
Market and Fund Performance Overview
For the 12-month period ended December 31, 2019, BNY Mellon Variable Investment Fund, Opportunistic Small Cap Portfolio’s (formerly, Dreyfus Variable Investment Fund, Opportunistic Small Cap Portfolio) Initial shares produced a total return of 21.78%, and its Service shares produced a total return of 21.49%.1 In comparison, the Russell 2000® Index (the “Index”), the fund’s benchmark, produced a total return of 25.52% for the same period.2
Small-cap stocks produced strong gains over the reporting period, amid sustained economic growth and an accommodative shift in Federal Reserve (“Fed”) policy. The fund lagged the Index, mainly due to security selection shortfalls in the health care and information technology sectors.
The Fund’s Investment Approach
The fund seeks capital growth. To pursue its goal, the fund normally invests at least 80% of its net assets, plus any borrowings for investment purposes, in the stocks of small-cap companies. The fund currently considers small-cap companies to be those companies with market capitalizations that fall within the range of the companies in the Index. Stocks are selected for the fund’s portfolio based primarily on bottom-up, fundamental analysis. The fund’s portfolio managers use a disciplined investment process that relies, in general, on proprietary fundamental research and valuation.
Generally, elements of the process include analysis of mid-cycle business prospects, estimation of the intrinsic value of the company and the identification of a revaluation trigger catalyst. In general, the fund seeks exposure to securities and sectors that are perceived to be attractive from a valuation and fundamental standpoint.
Stocks Surge on Supportive Federal Reserve Policy and Reduced Trade Tensions
The reporting period began with wide expectations of interest rate cuts, as the Fed had earlier moved from a tightening policy to one that was “data dependent.” With this shift, stocks rallied late in 2018 and continued to rise early in 2019. In the second quarter, however, stocks generally moved sideways, weighed down at times by concerns about trade tensions and global growth.
Three quarter-point rate cuts in the second half of the period provided an additional boost to equities markets. The Fed announced an initial reduction at its July 2019 meeting and followed up with two additional rate cuts in September and October 2019. These reductions brought the federal funds rate to 1.50%-1.75%, as trade tensions and other geopolitical concerns appeared to be weighing on economic growth. Other major central banks were also supportive.
In the third quarter of 2019, interest rate cuts and the prospect of a U.S.-China trade agreement led investors to anticipate a pickup in global growth. Investors’ concerns about
3
DISCUSSION OF FUND PERFORMANCE(Unaudited) (continued)
trade tensions and the global economy hindered performance at times, but stocks finished up strong later in the reporting period, when “Phase 1” of the U.S.-China trade deal was announced in December 2019. In this environment, small-cap stocks underperformed large-cap stocks.
Security Selections Constrained Fund Performance
The fund’s underperformance versus the Index was primarily the result of stock selection shortfalls in the health care and information technology sectors. In the health care sector, three holdings, Aerie Pharmaceuticals,Revance Therapeutics and TherapeuticsMD, experienced slower than expected sales for new product launches. Subsequent sales have been more encouraging. In the information technology sector,CommVault Systems, a data management company, declined because it experienced difficulties implementing its long-term plan, and the fund exited its position. In addition, Cloudera, a cloud computing company, witnessed delayed benefits from its 2018 merger with a rival company. The synergies appeared later in the year and helped drive a share price recovery. The company’s outlook remains positive, and well-known investor Carl Icahn has announced an ownership stake.
The fund achieved better relative results in the energy, consumer discretionary and utilities sectors. In the energy sector, oil tanker companies Scorpio Tankers, Ardmore Shipping and Euronav all benefited from strong demand for tankers, which led to higher pricing. Demand was driven by concerns about Middle East supply disruption and by new regulations taking effect in 2020. In the consumer discretionary sector, our housing investment thesis anticipated homebuilders would benefit from favorable demographics and lower interest rates. During the period, housing-related companies Skyline Champion, KB Home and Taylor Morrison Home posted strong fundamentals and stock price performance.TopBuild, an installer of insulation, also contributed positively to the fund’s results. In the utilities sector, the fund’s position in AquaVenture Holdings, a water supply company, performed well and was capped off by the acquisition of the company by Culligan Holdings.
An Optimistic Outlook for Small-Cap Stocks
During the period, the fund increased its weighting in the industrial, real estate and utilities sectors. The fund also reduced its weighting in the health care, energy, materials and communications services sectors.
4
Many factors drive the team’s constructive outlook for small- and mid-cap equities. World money supply is growing at a healthy rate and continues to provide a liquidity cushion for financial assets around the globe. Profit growth for small- and mid-cap companies is positioned to accelerate for a number of industries and themes outside of the information technology and health care sectors. We anticipate a slow but sustained, growth path for corporate profits for the next six to twelve months.
January 15, 2020
¹ Total return includes reinvestment of dividends and any capital gains paid. Past performance is no guarantee of future results. Share price and investment return fluctuate such that upon redemption, fund shares may be worth more or less than their original cost. The fund’s performance does not reflect the deduction of additional charges and expenses imposed in connection with investing in variable insurance contracts, which will reduce returns.
² Source: Lipper Inc. — The Russell 2000®Index measures the performance of the small-cap segment of the U.S. equity universe. The Russell 2000 Index is a subset of the Russell 3000® Index representing approximately 10% of the total market capitalization of that index. It includes approximately 2,000 of the smallest securities based on a combination of their market cap and current index membership. The Russell 2000 is constructed to provide a comprehensive and unbiased small-cap barometer and is completely reconstituted annually to ensure larger stocks do not distort the performance and characteristics of the true small-cap opportunity set. Investors cannot invest directly in any index.
Please note: the position in any security highlighted with italicized typeface was sold during the reporting period.
Equities are subject generally to market, market sector, market liquidity, issuer and investment style risks, among other factors, to varying degrees, all of which are more fully described in the fund’s prospectus.
Stocks of small- and/or mid-cap companies often experience sharper price fluctuations than stocks of large-cap companies.
The fund is only available as a funding vehicle under variable life insurance policies or variable annuity contracts issued by insurance companies. Individuals may not purchase shares of the fund directly. A variable annuity is an insurance contract issued by an insurance company that enables investors to accumulate assets on a tax-deferred basis for retirement or other long-term goals. The investment objective and policies of BNY Mellon Variable Investment Fund, Opportunistic Small Cap Portfolio made available through insurance products may be similar to those of other funds managed or advised by BNY Mellon Investment Adviser, Inc. However, the investment results of the fund may be higher or lower than, and may not be comparable to, those of any other BNY Mellon fund.
5
FUND PERFORMANCE(Unaudited)

Comparison of change in value of a $10,000 investment inInitial shares and Service shares of BNY Mellon Variable Investment Fund, Opportunistic Small Cap Portfoliowith a hypothetical investment of $10,000 in the Russell 2000® Index (the “Index”)
† Source: Lipper Inc.
Past performance is not predictive of future performance. The fund’s performance does not reflect the deduction of additional charges and expenses imposed in connection with investing in variable insurance contracts which will reduce returns.
The above graph compares a hypothetical investment of $10,000 made in Initial and Service shares of BNY Mellon Variable Investment Fund, Opportunistic Small Cap Portfolio on 12/31/09 to a hypothetical investment of $10,000 made in the Index on that date.
The fund’s performance shown in the line graph above takes into account all applicable fees and expenses. The Index measures the performance of the small-cap segment of the U.S. equity universe. The Index is a subset of the Russell 3000® Index representing approximately 10% of the total market capitalization of that index. It includes approximately 2,000 of the smallest securities based on a combination of their market cap and current index membership. The Index is constructed to provide a comprehensive and unbiased small-cap barometer and is completely reconstituted annually to ensure larger stocks do not distort the performance and characteristics of the true small-cap opportunity set. Unlike a mutual fund, the Index is not subject to charges, fees and other expenses. Investors cannot invest directly in any index. Further information relating to fund performance, including expense reimbursements, if applicable, is contained in the Financial Highlights section of the prospectus and elsewhere in this report.
| | | | |
Average Annual Total Returns as of 12/31/19 |
| 1 Year | 5 Years | 10 Years |
Initial shares | 21.78% | 7.05% | 11.20% |
Service shares | 21.49% | 6.78% | 10.92% |
Russell 2000® Index | 25.52% | 8.23% | 11.83% |
The performance data quoted represents past performance, which is no guarantee of future results. Share price and investment return fluctuate and an investor’s shares may be worth more or less than original cost upon redemption. Current performance may be lower or higher than the performance quoted. Go to www.bnymellonim.com/us for the fund’s most recent month-end returns.
The fund’s Initial shares are not subject to a Rule 12b-1 fee. The fund’s Service shares are subject to a 0.25% annual Rule 12b-1 fee. All dividends and capital gain distributions are reinvested.
The fund’s performance shown in the graph and table does not reflect the deduction of taxes that a shareholder would pay on fund distributions or the redemption of fund shares.
6
UNDERSTANDING YOUR FUND’S EXPENSES(Unaudited)
As a mutual fund investor, you pay ongoing expenses, such as management fees and other expenses. Using the information below, you can estimate how these expenses affect your investment and compare them with the expenses of other funds. You also may pay one-time transaction expenses, including sales charges (loads), redemption fees and expenses associated with variable annuity or insurance contracts, which are not shown in this section and would have resulted in higher total expenses. For more information, see your fund’s prospectus or talk to your financial adviser.
Review your fund’s expenses
The table below shows the expenses you would have paid on a $1,000 investment in BNY Mellon Variable Investment Fund, Opportunistic Small Cap Portfolio from July 1, 2019 to December 31, 2019. It also shows how much a $1,000 investment would be worth at the close of the period, assuming actual returns and expenses.
| | | | | |
Expenses and Value of a $1,000 Investment | |
Assume actual returns for the six months ended December 31, 2019 | |
| | | | |
| | Initial Shares | Service Shares | |
Expense paid per $1,000† | $4.35 | $5.65 | |
Ending value (after expenses) | $1,077.30 | $1,076.30 | |
COMPARING YOUR FUND’S EXPENSES
WITH THOSE OF OTHER FUNDS(Unaudited)
Using the SEC’s method to compare expenses
The Securities and Exchange Commission (“SEC”) has established guidelines to help investors assess fund expenses. Per these guidelines, the table below shows your fund’s expenses based on a $1,000 investment, assuming a hypothetical 5% annualized return. You can use this information to compare the ongoing expenses (but not transaction expenses or total cost) of investing in the fund with those of other funds. All mutual fund shareholder reports will provide this information to help you make this comparison. Please note that you cannot use this information to estimate your actual ending account balance and expenses paid during the period.
| | | | | |
Expenses and Value of a $1,000 Investment | |
Assuming a hypothetical 5% annualized return for the six months ended December 31, 2019 | |
| | | | |
| | Initial Shares | Service Shares | |
Expense paid per $1,000† | $4.23 | $5.50 | |
Ending value (after expenses) | $1,021.02 | $1,019.76 | |
† Expenses are equal to the fund’s annualized expense ratio of .83% for Initial Shares and 1.08% for Service Shares, multiplied by the average account value over the period, multiplied by 184/365 (to reflect the one-half year period). |
7
STATEMENT OF INVESTMENTS
December 31, 2019
| | | | | | | | |
| |
Description | | | | Shares | | Value ($) | |
Common Stocks - 97.4% | | | | | |
Banks - 7.0% | | | | | |
Ameris Bancorp | | | | 53,914 | | 2,293,502 | |
Atlantic Union Bankshares | | | | 80,070 | | 3,006,628 | |
Essent Group | | | | 50,215 | | 2,610,678 | |
First BanCorp | | | | 483,791 | | 5,123,347 | |
First Interstate BancSystem, Cl. A | | | | 89,756 | | 3,762,571 | |
First Merchants | | | | 64,476 | | 2,681,557 | |
| | | | | 19,478,283 | |
Capital Goods - 8.9% | | | | | |
Advanced Drainage Systems | | | | 50,569 | | 1,964,100 | |
Aerojet Rocketdyne Holdings | | | | 82,706 | a,b | 3,776,356 | |
American Woodmark | | | | 21,556 | b | 2,252,818 | |
Builders FirstSource | | | | 109,338 | b | 2,778,279 | |
Harsco | | | | 64,859 | b | 1,492,406 | |
Masonite International | | | | 52,325 | b | 3,778,388 | |
Nesco Holdings | | | | 202,536 | b | 832,423 | |
Quanta Services | | | | 65,685 | | 2,674,036 | |
Tennant | | | | 36,867 | a | 2,872,677 | |
Valmont Industries | | | | 14,681 | | 2,198,920 | |
| | | | | 24,620,403 | |
Commercial & Professional Services - 4.3% | | | | | |
Clarivate Analytics | | | | 351,714 | b | 5,908,795 | |
Covanta Holding | | | | 320,548 | | 4,756,932 | |
Interface | | | | 81,023 | | 1,344,172 | |
| | | | | 12,009,899 | |
Consumer Durables & Apparel - 3.9% | | | | | |
Century Communities | | | | 85,211 | a,b | 2,330,521 | |
KB Home | | | | 81,491 | | 2,792,697 | |
Skyline Champion | | | | 79,139 | b | 2,508,706 | |
Taylor Morrison Home | | | | 152,400 | b | 3,331,464 | |
| | | | | 10,963,388 | |
Consumer Services - 4.4% | | | | | |
Adtalem Global Education | | | | 68,488 | b | 2,395,025 | |
Dave & Buster's Entertainment | | | | 28,357 | a | 1,139,101 | |
Houghton Mifflin Harcourt | | | | 364,147 | b | 2,275,919 | |
OneSpaWorld Holdings | | | | 147,556 | a | 2,484,843 | |
Penn National Gaming | | | | 154,538 | a,b | 3,949,991 | |
| | | | | 12,244,879 | |
Diversified Financials - 4.3% | | | | | |
FirstCash | | | | 31,070 | | 2,505,174 | |
OneMain Holdings | | | | 100,368 | | 4,230,511 | |
8
| | | | | | | | |
| |
Description | | | | Shares | | Value ($) | |
Common Stocks - 97.4% (continued) | | | | | |
Diversified Financials - 4.3% (continued) | | | | | |
PJT Partners, Cl. A | | | | 115,124 | a | 5,195,546 | |
| | | | | 11,931,231 | |
Energy - 6.5% | | | | | |
Ardmore Shipping | | | | 183,129 | b | 1,657,317 | |
Euronav | | | | 123,143 | | 1,544,213 | |
Laredo Petroleum | | | | 508,902 | a,b | 1,460,549 | |
PBF Energy, Cl. A | | | | 226,314 | | 7,099,470 | |
Scorpio Tankers | | | | 86,859 | a | 3,417,033 | |
Select Energy Services, Cl. A | | | | 308,059 | b | 2,858,788 | |
| | | | | 18,037,370 | |
Food, Beverage & Tobacco - 2.2% | | | | | |
Darling Ingredients | | | | 214,513 | b | 6,023,525 | |
Health Care Equipment & Services - 2.3% | | | | | |
Acadia Healthcare | | | | 92,826 | a,b | 3,083,680 | |
AxoGen | | | | 187,426 | b | 3,353,051 | |
| | | | | 6,436,731 | |
Insurance - 2.4% | | | | | |
Argo Group International Holdings | | | | 38,662 | | 2,542,026 | |
The Hanover Insurance Group | | | | 30,958 | | 4,231,030 | |
| | | | | 6,773,056 | |
Materials - 11.9% | | | | | |
Alamos Gold, Cl. A | | | | 1,017,311 | | 6,124,212 | |
Cabot | | | | 159,353 | | 7,572,455 | |
Eagle Materials | | | | 38,582 | | 3,497,844 | |
IAMGOLD | | | | 953,073 | b | 3,554,962 | |
Louisiana-Pacific | | | | 233,319 | | 6,922,575 | |
Norbord | | | | 67,278 | a | 1,798,341 | |
US Concrete | | | | 87,148 | b | 3,630,586 | |
| | | | | 33,100,975 | |
Media & Entertainment - 4.2% | | | | | |
Cardlytics | | | | 44,222 | a,b | 2,779,795 | |
Criteo, ADR | | | | 202,790 | b | 3,514,351 | |
Nexstar Media Group, Cl. A | | | | 29,662 | | 3,477,869 | |
Sinclair Broadcast Group, Cl. A | | | | 60,510 | a | 2,017,403 | |
| | | | | 11,789,418 | |
Pharmaceuticals Biotechnology & Life Sciences - 6.7% | | | | | |
Aerie Pharmaceuticals | | | | 151,406 | a,b | 3,659,483 | |
Flexion Therapeutics | | | | 214,113 | a,b | 4,432,139 | |
Sage Therapeutics | | | | 18,629 | a,b | 1,344,827 | |
Syneos Health | | | | 56,884 | a,b | 3,383,176 | |
TherapeuticsMD | | | | 1,622,875 | a,b | 3,927,357 | |
uniQure | | | | 24,274 | a,b | 1,739,475 | |
| | | | | 18,486,457 | |
9
STATEMENT OF INVESTMENTS (continued)
| | | | | | | | |
| |
Description | | | | Shares | | Value ($) | |
Common Stocks - 97.4% (continued) | | | | | |
Real Estate - 3.1% | | | | | |
Colliers International Group | | | | 51,002 | | 3,976,626 | |
Redfin | | | | 223,967 | a,b | 4,734,662 | |
| | | | | 8,711,288 | |
Software & Services - 10.5% | | | | | |
Cardtronics, Cl. A | | | | 106,832 | a,b | 4,770,049 | |
Cloudera | | | | 334,009 | a,b | 3,884,525 | |
Everbridge | | | | 59,092 | b | 4,613,903 | |
Evertec | | | | 117,080 | | 3,985,403 | |
InterXion Holding | | | | 76,398 | b | 6,402,916 | |
Talend, ADR | | | | 139,882 | a,b | 5,470,785 | |
| | | | | 29,127,581 | |
Technology Hardware & Equipment - 3.1% | | | | | |
Ciena | | | | 139,671 | b | 5,962,555 | |
Itron | | | | 31,319 | b | 2,629,230 | |
| | | | | 8,591,785 | |
Transportation - 8.6% | | | | | |
Knight-Swift Transportation Holdings | | | | 174,383 | a | 6,249,887 | |
Scorpio Bulkers | | | | 344,110 | | 2,191,981 | |
SkyWest | | | | 132,583 | | 8,568,839 | |
Werner Enterprises | | | | 186,146 | a | 6,773,853 | |
| | | | | 23,784,560 | |
Utilities - 3.1% | | | | | |
AquaVenture Holdings | | | | 183,799 | b | 4,984,629 | |
Clearway Energy, Cl. C | | | | 185,202 | a | 3,694,780 | |
| | | | | 8,679,409 | |
Total Common Stocks(cost $246,802,485) | | | | 270,790,238 | |
| | | | | | | | |
Exchange-Traded Funds - 1.3% | | | | | |
Registered Investment Companies - 1.3% | | | | | |
iShares Russell 2000 ETF
(cost $3,257,846) | | | | 21,740 | a | 3,601,666 | |
| | | Maturity
Date | | Number of Warrants | | | |
Warrants - .0% | | | | | |
Capital Goods - .0% | | | | | |
Nesco Holdings
(cost $81,518) | | 1/01/25 | | 67,512 | | 31,731 | |
| | | 1-Day
Yield (%) | | Shares | | | |
Investment Companies - 1.3% | | | | | |
Registered Investment Companies - 1.3% | | | | | |
Dreyfus Institutional Preferred Government Plus Money Market Fund
(cost $3,648,797) | | 1.60 | | 3,648,797 | c | 3,648,797 | |
10
| | | | | | | | |
| |
Description | | 1-Day
Yield (%) | | Shares | | Value ($) | |
Investment of Cash Collateral for Securities Loaned - 6.0% | | | | | |
Registered Investment Companies - 6.0% | | | | | |
Dreyfus Institutional Preferred Government Plus Money Market Fund
(cost $16,610,089) | | 1.60 | | 16,610,089 | c | 16,610,089 | |
Total Investments(cost $270,400,735) | | 106.0% | | 294,682,521 | |
Liabilities, Less Cash and Receivables | | (6.0%) | | (16,733,017) | |
Net Assets | | 100.0% | | 277,949,504 | |
ADR—American Depository Receipt
ETF—Exchange-Traded Fund
aSecurity, or portion thereof, on loan. At December 31, 2019, the value of the fund’s securities on loan was $56,390,723 and the value of the collateral was $57,309,359, consisting of cash collateral of $16,610,089 and U.S. Government & Agency securities valued at $40,699,270.
bNon-income producing security.
cInvestment in affiliated issuer. The investment objective of this investment company is publicly available and can be found within the investment company’s prospectus.
| | |
Portfolio Summary (Unaudited)† | Value (%) |
Industrials | 21.7 |
Financials | 13.7 |
Information Technology | 13.6 |
Materials | 11.9 |
Health Care | 9.0 |
Investment Companies | 8.6 |
Consumer Discretionary | 8.4 |
Energy | 6.5 |
Communication Services | 4.2 |
Real Estate | 3.1 |
Utilities | 3.1 |
Consumer Staples | 2.2 |
| | 106.0 |
† Based on net assets.
See notes to financial statements.
11
STATEMENT OF INVESTMENTS IN AFFILIATED ISSUERS
| | | | | | | |
Investment Companies | Value
12/31/18($) | Purchases($) | Sales($) | Value
12/31/19($) | Net
Assets(%) | Dividends/
Distributions($) |
Registered Investment Companies; |
Dreyfus Institutional Preferred Government Plus Money Market Fund | 982,326 | 136,254,940 | 133,588,469 | 3,648,797 | 1.3 | 90,552 |
Investment of Cash Collateral for Securities Loaned; |
Dreyfus Institutional Preferred Government Plus Money Market Fund | 3,449,708 | 134,223,323 | 121,062,942 | 16,610,089 | 6.0 | - |
Total | 4,432,034 | 270,478,263 | 254,651,411 | 20,258,886 | 7.3 | 90,552 |
See notes to financial statements.
12
STATEMENT OF ASSETS AND LIABILITIES
December 31, 2019
| | | | | | | |
| | | | | | |
| | | Cost | | Value | |
Assets ($): | | | | |
Investments in securities—See Statement of Investments
(including securities on loan, valued at $56,390,723)—Note 1(b): | | | |
Unaffiliated issuers | 250,141,849 | | 274,423,635 | |
Affiliated issuers | | 20,258,886 | | 20,258,886 | |
Dividends, interest and securities lending income receivable | | 140,276 | |
Receivable for shares of Beneficial Interest subscribed | | 32,930 | |
Tax reclaim receivable | | 920 | |
Prepaid expenses | | | | | 5,693 | |
| | | | | 294,862,340 | |
Liabilities ($): | | | | |
Due to BNY Mellon Investment Adviser, Inc. and affiliates—Note 3(b) | | 184,782 | |
Liability for securities on loan—Note 1(b) | | 16,610,089 | |
Payable for shares of Beneficial Interest redeemed | | 64,604 | |
Trustees’ fees and expenses payable | | 2,900 | |
Other accrued expenses | | | | | 50,461 | |
| | | | | 16,912,836 | |
Net Assets ($) | | | 277,949,504 | |
Composition of Net Assets ($): | | | | |
Paid-in capital | | | | | 258,770,944 | |
Total distributable earnings (loss) | | | | | 19,178,560 | |
Net Assets ($) | | | 277,949,504 | |
| | | | |
Net Asset Value Per Share | Initial Shares | Service Shares | |
Net Assets ($) | 260,321,135 | 17,628,369 | |
Shares Outstanding | 6,230,964 | 444,651 | |
Net Asset Value Per Share ($) | 41.78 | 39.65 | |
| | | |
See notes to financial statements. | | | |
13
STATEMENT OF OPERATIONS
Year Ended December 31, 2019
| | | | | | | |
| | | | | | |
| | | | | | |
Investment Income ($): | | | | |
Income: | | | | |
Cash dividends (net of $18,675 foreign taxes withheld at source): | |
Unaffiliated issuers | | | 2,971,502 | |
Affiliated issuers | | | 90,552 | |
Income from securities lending—Note 1(b) | | | 288,515 | |
Total Income | | | 3,350,569 | |
Expenses: | | | | |
Investment advisory fee—Note 3(a) | | | 1,696,332 | |
Professional fees | | | 82,916 | |
Prospectus and shareholders’ reports | | | 47,765 | |
Distribution fees—Note 3(b) | | | 42,065 | |
Trustees’ fees and expenses—Note 3(c) | | | 21,712 | |
Custodian fees—Note 3(b) | | | 20,729 | |
Chief Compliance Officer fees—Note 3(b) | | | 11,793 | |
Loan commitment fees—Note 2 | | | 5,465 | |
Shareholder servicing costs—Note 3(b) | | | 1,234 | |
Registration fees | | | 282 | |
Miscellaneous | | | 16,469 | |
Total Expenses | | | 1,946,762 | |
Investment Income—Net | | | 1,403,807 | |
Realized and Unrealized Gain (Loss) on Investments—Note 4 ($): | | |
Net realized gain (loss) on investments | (5,993,372) | |
Net change in unrealized appreciation (depreciation) on investments | 48,833,624 | |
Net Realized and Unrealized Gain (Loss) on Investments | | | 42,840,252 | |
Net Increase in Net Assets Resulting from Operations | | 44,244,059 | |
| | | | | | |
See notes to financial statements. | | | | | |
14
STATEMENT OF CHANGES IN NET ASSETS
| | | | | | | | | | |
| | | | Year Ended December 31, |
| | | | 2019 | | 2018 | |
Operations ($): | | | | | | | | |
Investment income (loss)—net | | | 1,403,807 | | | | (288,714) | |
Net realized gain (loss) on investments | | (5,993,372) | | | | 31,450,070 | |
Net change in unrealized appreciation
(depreciation) on investments | | 48,833,624 | | | | (69,036,111) | |
Net Increase (Decrease) in Net Assets
Resulting from Operations | 44,244,059 | | | | (37,874,755) | |
Distributions ($): | |
Distributions to shareholders: | | | | | | | | |
Initial Shares | | | (28,402,234) | | | | (31,237,676) | |
Service Shares | | | (3,065,222) | | | | (3,518,843) | |
Total Distributions | | | (31,467,456) | | | | (34,756,519) | |
Beneficial Interest Transactions ($): | |
Net proceeds from shares sold: | | | | | | | | |
Initial Shares | | | 92,678,116 | | | | 14,974,835 | |
Service Shares | | | 1,188,417 | | | | 1,651,834 | |
Distributions reinvested: | | | | | | | | |
Initial Shares | | | 28,402,234 | | | | 31,237,676 | |
Service Shares | | | 3,065,222 | | | | 3,518,843 | |
Cost of shares redeemed: | | | | | | | | |
Initial Shares | | | (20,097,158) | | | | (23,537,641) | |
Service Shares | | | (2,084,925) | | | | (3,097,274) | |
Increase (Decrease) in Net Assets
from Beneficial Interest Transactions | 103,151,906 | | | | 24,748,273 | |
Total Increase (Decrease) in Net Assets | 115,928,509 | | | | (47,883,001) | |
Net Assets ($): | |
Beginning of Period | | | 162,020,995 | | | | 209,903,996 | |
End of Period | | | 277,949,504 | | | | 162,020,995 | |
Capital Share Transactions (Shares): | |
Initial Shares | | | | | | | | |
Shares sold | | | 2,456,530 | | | | 280,806 | |
Shares issued for distributions reinvested | | | 710,411 | | | | 603,626 | |
Shares redeemed | | | (497,256) | | | | (435,423) | |
Net Increase (Decrease) in Shares Outstanding | 2,669,685 | | | | 449,009 | |
Service Shares | | | | | | | | |
Shares sold | | | 30,881 | | | | 31,795 | |
Shares issued for distributions reinvested | | | 80,621 | | | | 70,731 | |
Shares redeemed | | | (53,631) | | | | (60,283) | |
Net Increase (Decrease) in Shares Outstanding | 57,871 | | | | 42,243 | |
| | | | | | | | | |
See notes to financial statements. | | | | | | | | |
15
FINANCIAL HIGHLIGHTS
The following tables describe the performance for each share class for the fiscal periods indicated. All information (except portfolio turnover rate) reflects financial results for a single fund share. Total return shows how much your investment in the fund would have increased (or decreased) during each period, assuming you had reinvested all dividends and distributions. The fund’s total returns do not reflect expenses associated with variable annuity or insurance contracts. These figures have been derived from the fund’s financial statements.
| | | | | | | |
| | | |
| | | |
| | | Year Ended December 31, |
Initial Shares | | 2019 | 2018 | 2017 | 2016 | 2015 |
Per Share Data ($): | | | | | | |
Net asset value, beginning of period | | 41.20 | 60.91 | 49.44 | 46.02 | 47.78 |
Investment Operations: | | | | | | |
Investment income (loss)—neta | | .26 | (.06) | (.12) | (.02) | (.13) |
Net realized and unrealized
gain (loss) on investments | | 8.35 | (9.48) | 12.21 | 7.07 | (.91) |
Total from Investment Operations | | 8.61 | (9.54) | 12.09 | 7.05 | (1.04) |
Distributions: | | | | | | |
Dividends from net realized
gain on investments | | (8.03) | (10.17) | (.62) | (3.63) | (.72) |
Net asset value, end of period | | 41.78 | 41.20 | 60.91 | 49.44 | 46.02 |
Total Return (%) | | 21.78 | (19.08) | 24.69 | 17.07 | (2.28) |
Ratios/Supplemental Data (%): | | | | | | |
Ratio of total expenses
to average net assets | | .84 | .84 | .85 | .86 | .85 |
Ratio of net expenses
to average net assets | | .84 | .84 | .85 | .86 | .85 |
Ratio of net investment income
(loss) to average net assets | | .64 | (.12) | (.22) | (.05) | (.27) |
Portfolio Turnover Rate | | 65.42 | 67.90 | 70.11 | 88.08 | 65.26 |
Net Assets, end of period ($ x 1,000) | | 260,321 | 146,730 | 189,582 | 162,171 | 151,992 |
a Based on average shares outstanding.
See notes to financial statements.
16
| | | | | | | |
| | | |
| | | |
| | | Year Ended December 31, |
Service Shares | | 2019 | 2018 | 2017 | 2016 | 2015 |
Per Share Data ($): | | | | | | |
Net asset value, beginning of period | | 39.53 | 58.98 | 48.01 | 44.90 | 46.75 |
Investment Operations: | | | | | | |
Investment income (loss)—neta | | .16 | (.19) | (.25) | (.13) | (.24) |
Net realized and unrealized
gain (loss) on investments | | 7.99 | (9.09) | 11.84 | 6.87 | (.89) |
Total from Investment Operations | | 8.15 | (9.28) | 11.59 | 6.74 | (1.13) |
Distributions: | | | | | | |
Dividends from net realized
gain on investments | | (8.03) | (10.17) | (.62) | (3.63) | (.72) |
Net asset value, end of period | | 39.65 | 39.53 | 58.98 | 48.01 | 44.90 |
Total Return (%) | | 21.49 | (19.29) | 24.37 | 16.79 | (2.52) |
Ratios/Supplemental Data (%): | | | | | | |
Ratio of total expenses
to average net assets | | 1.09 | 1.09 | 1.10 | 1.11 | 1.10 |
Ratio of net expenses
to average net assets | | 1.09 | 1.09 | 1.10 | 1.11 | 1.10 |
Ratio of net investment income
(loss) to average net assets | | .41 | (.37) | (.47) | (.30) | (.52) |
Portfolio Turnover Rate | | 65.42 | 67.90 | 70.11 | 88.08 | 65.26 |
Net Assets, end of period ($ x 1,000) | | 17,628 | 15,291 | 20,322 | 17,353 | 16,528 |
a Based on average shares outstanding.
See notes to financial statements.
17
NOTES TO FINANCIAL STATEMENTS
NOTE 1—Significant Accounting Policies:
Opportunistic Small Cap Portfolio (the “fund”) is a separate diversified series of BNY Mellon Variable Investment Fund (the “Company”), which is registered under the Investment Company Act of 1940, as amended (the “Act”), as an open-end management investment company and operates as a series company currently offering seven series, including the fund. The fund is only offered to separate accounts established by insurance companies to fund variable annuity contracts and variable life insurance policies. The fund’s investment objective is to seek capital growth. BNY Mellon Investment Adviser, Inc. (the “Adviser”), a wholly-owned subsidiary of The Bank of New York Mellon Corporation (“BNY Mellon”), serves as the fund’s investment adviser.
Effective June 3, 2019, the Company changed its name from Dreyfus Variable Investment Fund to BNY Mellon Variable Investment Fund. In addition, The Dreyfus Corporation, the fund’s investment adviser, changed its name to “BNY Mellon Investment Adviser, Inc.”, MBSC Securities Corporation, the fund’s distributor, changed its name to “BNY Mellon Securities Corporation” and Dreyfus Transfer, Inc., the fund’s transfer agent, changed its name to “BNY Mellon Transfer, Inc.”
BNY Mellon Securities Corporation (the “Distributor”), a wholly-owned subsidiary of the Adviser, is the distributor of the fund’s shares, which are sold without a sales charge. The fund is authorized to issue an unlimited number of $.001 par value shares of Beneficial Interest in each of the following classes of shares: Initial and Service. Each class of shares has identical rights and privileges, except with respect to the Distribution Plan, and the expenses borne by each class, the allocation of certain transfer agency costs, and certain voting rights. Income, expenses (other than expenses attributable to a specific class), and realized and unrealized gains or losses on investments are allocated to each class of shares based on its relative net assets.
The Company accounts separately for the assets, liabilities and operations of each series. Expenses directly attributable to each series are charged to that series’ operations; expenses which are applicable to all series are allocated among them on a pro rata basis.
The Financial Accounting Standards Board (“FASB”) Accounting Standards Codification (“ASC”) is the exclusive reference of authoritative U.S. generally accepted accounting principles (“GAAP”) recognized by the FASB to be applied by nongovernmental entities. Rules and interpretive releases of the Securities and Exchange Commission (“SEC”) under authority of federal laws are also sources of authoritative GAAP for SEC
18
registrants. The fund is an investment company and applies the accounting and reporting guidance of the FASB ASC Topic 946 Financial Services-Investment Companies. The fund’s financial statements are prepared in accordance with GAAP, which may require the use of management estimates and assumptions. Actual results could differ from those estimates.
The Companyenters into contracts that contain a variety of indemnifications. The fund’s maximum exposure under these arrangements is unknown. The fund does not anticipate recognizing any loss related to these arrangements.
(a) Portfolio valuation: The fair value of a financial instrument is the amount that would be received to sell an asset or paid to transfer a liability in an orderly transaction between market participants at the measurement date (i.e., the exit price). GAAP establishes a fair value hierarchy that prioritizes the inputs of valuation techniques used to measure fair value. This hierarchy gives the highest priority to unadjusted quoted prices in active markets for identical assets or liabilities (Level 1 measurements) and the lowest priority to unobservable inputs (Level 3 measurements).
Additionally, GAAP provides guidance on determining whether the volume and activity in a market has decreased significantly and whether such a decrease in activity results in transactions that are not orderly. GAAP requires enhanced disclosures around valuation inputs and techniques used during annual and interim periods.
Various inputs are used in determining the value of the fund’s investments relating to fair value measurements. These inputs are summarized in the three broad levels listed below:
Level 1—unadjusted quoted prices in active markets for identical investments.
Level 2—other significant observable inputs (including quoted prices for similar investments, interest rates, prepayment speeds, credit risk, etc.).
Level 3—significant unobservable inputs (including the fund’s own assumptions in determining the fair value of investments).
The inputs or methodology used for valuing securities are not necessarily an indication of the risk associated with investing in those securities.
Changes in valuation techniques may result in transfers in or out of an assigned level within the disclosure hierarchy. Valuation techniques used to value the fund’s investments are as follows:
19
NOTES TO FINANCIAL STATEMENTS(continued)
Investments in equity securities are valued at the last sales price on the securities exchange or national securities market on which such securities are primarily traded. Securities listed on the National Market System for which market quotations are available are valued at the official closing price or, if there is no official closing price that day, at the last sales price. For open short positions, asked prices are used for valuation purposes. Bid price is used when no asked price is available. Registered investment companies that are not traded on an exchange are valued at their net asset value. All of the preceding securities are generally categorized within Level 1 of the fair value hierarchy.
Securities not listed on an exchange or the national securities market, or securities for which there were no transactions, are valued at the average of the most recent bid and asked prices. These securities are generally categorized within Level 2 of the fair value hierarchy.
Fair valuing of securities may be determined with the assistance of a pricing service using calculations based on indices of domestic securities and other appropriate indicators, such as prices of relevant ADRs and futures. Utilizing these techniques may result in transfers between Level 1 and Level 2 of the fair value hierarchy.
When market quotations or official closing prices are not readily available, or are determined not to accurately reflect fair value, such as when the value of a security has been significantly affected by events after the close of the exchange or market on which the security is principally traded (for example, a foreign exchange or market), but before the fund calculates its net asset value, the fund may value these investments at fair value as determined in accordance with the procedures approved by the Company’s Board of Trustees (the “Board”). Certain factors may be considered when fair valuing investments such as: fundamental analytical data, the nature and duration of restrictions on disposition, an evaluation of the forces that influence the market in which the securities are purchased and sold, and public trading in similar securities of the issuer or comparable issuers. These securities are either categorized within Level 2 or 3 of the fair value hierarchy depending on the relevant inputs used.
For restricted securities where observable inputs are limited, assumptions about market activity and risk are used and such securities are generally categorized within Level 3 of the fair value hierarchy.
The following is a summary of the inputs used as of December 31, 2019in valuing the fund’s investments:
20
| | | | | |
| | Level 1-
Unadjusted
Quoted
Prices | Level 2 – Other
Significant
Observable
Inputs | Level 3 -
Significant
Unobservable
Inputs | Total |
Assets ($) | | | |
Investments in Securities:† | | | |
Equity Securities - Common Stocks | 270,790,238 | - | - | 270,790,238 |
Exchange-Traded Funds | 3,601,666 | - | - | 3,601,666 |
Investment Companies | 20,258,886 | - | - | 20,258,886 |
Warrants | 31,731 | - | - | 31,731 |
† See Statement of Investments for additional detailed categorizations, if any.
(b)Securities transactions and investment income: Securities transactions are recorded on a trade date basis. Realized gains and losses from securities transactions are recorded on the identified cost basis. Dividend income is recognized on the ex-dividend date and interest income, including, where applicable, accretion of discount and amortization of premium on investments, is recognized on the accrual basis.
Pursuant to a securities lending agreement with The Bank of New York Mellon, a subsidiary of BNY Mellon and an affiliate of the Adviser, the fund may lend securities to qualified institutions. It is the fund’s policy that, at origination, all loans are secured by collateral of at least 102% of the value of U.S. securities loaned and 105% of the value of foreign securities loaned. Collateral equivalent to at least 100% of the market value of securities on loan is maintained at all times. Collateral is either in the form of cash, which can be invested in certain money market mutual funds managed by the Adviser, or U.S. Government and Agency securities. The fund is entitled to receive all dividends, interest and distributions on securities loaned, in addition to income earned as a result of the lending transaction. Should a borrower fail to return the securities in a timely manner, The Bank of New York Mellon is required to replace the securities for the benefit of the fund or credit the fund with the market value of the unreturned securities and is subrogated to the fund’s rights against the borrower and the collateral. Additionally, the contractual maturity of security lending transactions are on an overnight and continuous basis. During the period ended December 31, 2019, The Bank of New York Mellon earned $52,364 from the lending of the fund’s portfolio securities, pursuant to the securities lending agreement.
(c) Affiliated issuers: Investments in other investment companies advised by the Adviser are considered “affiliated” under the Act.
21
NOTES TO FINANCIAL STATEMENTS(continued)
(d) Dividends and distributions to shareholders: Dividends and distributions are recorded on the ex-dividend date. Dividends from investment income-net and dividends from net realized capital gains, if any, are normally declared and paid annually, but the fund may make distributions on a more frequent basis to comply with the distribution requirements of the Internal Revenue Code of 1986, as amended (the “Code”). To the extent that net realized capital gains can be offset by capital loss carryovers, it is the policy of the fund not to distribute such gains. Income and capital gain distributions are determined in accordance with income tax regulations, which may differ from GAAP.
(e) Federal income taxes: It is the policy of the fund to continue to qualify as a regulated investment company, if such qualification is in the best interests of its shareholders, by complying with the applicable provisions of the Code, and to make distributions of taxable income and net realized capital gain sufficient to relieve it from substantially all federal income and excise taxes.
As of and during the period ended December 31, 2019, the fund did not have any liabilities for any uncertain tax positions. The fund recognizes interest and penalties, if any, related to uncertain tax positions as income tax expense in the Statement of Operations. During the period ended December 31, 2019, the fund did not incur any interest or penalties.
Each tax year in the four-year period ended December 31, 2019 remains subject to examination by the Internal Revenue Service and state taxing authorities.
At December 31, 2019, the components of accumulated earnings on a tax basis were as follows: undistributed ordinary income $1,531,473, accumulated capital losses $5,363,505 and unrealized appreciation $23,010,592.
The fund is permitted to carry forward capital losses for an unlimited period. Furthermore, capital loss carryovers retain their character as either short-term or long-term capital losses.
The accumulated capital loss carryover is available for federal income tax purposes to be applied against future netrealized capital gains, if any, realized subsequent to December 31, 2019. The fund has $5,363,505 of short-term capital losses which can be carried forward for an unlimited period.
The tax character of distributions paid to shareholders during the fiscal periods ended December 31, 2019 and December 31, 2018 were as
22
follows: ordinary income $6,559,931 and $10,670,292, and long-term capital gains $24,907,525 and $24,086,227, respectively.
(f) New Accounting Pronouncements: Effective June 1, 2019, the fund adopted Accounting Standards Update 2018-13, Fair Value Measurement (Topic 820): Disclosure Framework—Changes to the Disclosure Requirements for Fair Value Measurement (“ASU 2018-13”). The update provides guidance that eliminates, adds and modifies certain disclosure requirements for fair value measurements. The adoption of ASU 2018-13 had no impact on the operations of the fund for the period ended December 31, 2019.
NOTE 2—Bank Lines of Credit:
The fund participates with other long-term open-end funds managed by the Adviser in a $1.030 billion unsecured credit facility led by Citibank, N.A. (the “Citibank Credit Facility”) and a $300 million unsecured credit facility provided by The Bank of New York Mellon (the “BNYM Credit Facility”), each to be utilized primarily for temporary or emergency purposes, including the financing of redemptions (each, a “Facility”). The Citibank Credit Facility is available in two tranches: (i) Tranche A is in an amount equal to $830 million and is available to all long-term open-ended funds, including the fund, and (ii) Tranche B is in amount equal to $200 million and is available only to BNY Mellon Floating Rate Income Fund, a series of BNY Mellon Investment Funds IV, Inc. In connection therewith, the fund has agreed to pay its pro rata portion of commitment fees for Tranche A of the Citibank Credit Facility and the BNYM Credit Facility. Interest is charged to the fund based on rates determined pursuant to the terms of the respective Facility at the time of borrowing. During the period ended December 31, 2019, the fund did not borrow under the Facilities.
NOTE 3—Investment Advisory Fee and Other Transactions with Affiliates:
(a)Pursuant to an investment advisory agreement with the Adviser, the investment advisory fee is computed at the annual rate of .75% of the value of the fund’s average daily net assets and is payable monthly.
(b)Under the Distribution Plan adopted pursuant to Rule 12b-1 under the Act, Service shares pay the Distributor for distributing its shares, for servicing and/or maintaining Service shares’ shareholder accounts and for advertising and marketing for Service shares. The Distribution Plan provides for payments to be made at an annual rate of .25% of the value of the Service shares’ average daily net assets. The Distributor may make payments to Participating Insurance Companies and to brokers and dealers acting as principal underwriter for their variable insurance products. The
23
NOTES TO FINANCIAL STATEMENTS(continued)
fees payable under the Distribution Plan are payable without regard to actual expenses incurred. During the period ended December 31, 2019,Service shares were charged $42,065 pursuant to the Distribution Plan.
The fund has an arrangement with the transfer agent whereby the fund may receive earnings credits when positive cash balances are maintained, which are used to offset transfer agency fees. The fund had an arrangement with the custodian to receive earnings credits when positive cash balances were maintained, which were used to offset custody fees. Effective February 1, 2019, the arrangement with the custodian changed whereby the fund will no longer receive earnings credits to offset its custody fees and will receive interest income or overdraft fees going forward. For financial reporting purposes, the fund includes net earnings credits, if any, as an expense offset in the Statement of Operations.
The fund compensates BNY Mellon Transfer, Inc., a wholly-owned subsidiary of the Adviser, under a transfer agency agreement for providing transfer agency and cash management services for the fund. The majority of transfer agency fees are comprised of amounts paid on a per account basis, while cash management fees are related to fund subscriptions and redemptions. During the period ended December 31, 2019, the fund was charged $1,074 for transfer agency services. These fees are included in Shareholder servicing costs in the Statement of Operations.
The fund compensates The Bank of New York Mellon under a custody agreement for providing custodial services for the fund. These fees are determined based on net assets, geographic region and transaction activity. During the period ended December 31, 2019, the fund was charged $20,729 pursuant to the custody agreement.
During the period ended December 31, 2019, the fund was charged $11,793 for services performed by the Chief Compliance Officer and his staff. These fees are included in Chief Compliance Officer fees in the Statement of Operations.
The components of “Due to BNY Mellon Investment Adviser, Inc. and affiliates” in the Statement of Assets and Liabilities consist of: investment advisory fees of $173,663, Distribution Plan fees of $3,672, custodian fees of $4,000, Chief Compliance Officer fees of $3,261 and transfer agency fees of $186.
(c) Each Board member also serves as a Board member of other funds in the BNY Mellon Family of Funds complex. Annual retainer fees and attendance fees are allocated to each fund based on net assets.
24
NOTE 4—Securities Transactions:
The aggregate amount of purchases and sales of investment securities, excluding short-term securities, during the period ended December 31, 2019, amounted to $216,140,741 and $145,506,488, respectively.
At December 31, 2019, the cost of investments for federal income tax purposes was $271,671,929; accordingly, accumulated net unrealized appreciation on investments was $23,010,592, consisting of $39,665,638 gross unrealized appreciation and $16,655,046 gross unrealized depreciation.
25
REPORT OF INDEPENDENT REGISTERED PUBLIC ACCOUNTING FIRM
To the Shareholders and the Board of Trustees of Opportunistic Small Cap Portfolio
Opinion on the Financial Statements
We have audited the accompanying statement of assets and liabilities of Opportunistic Small Cap Portfolio (the “Fund”) (one of the funds constituting BNY Mellon Variable Investment Fund), including the statements of investments and investments in affiliated issuers, as of December 31, 2019, and the related statement of operations for the year then ended, the statements of changes in net assets for each of the two years in the period then ended, the financial highlights for each of the five years in the period then ended and the related notes (collectively referred to as the “financial statements”). In our opinion, the financial statements present fairly, in all material respects, the financial position of the Fund (one of the funds constituting BNY Mellon Variable Investment Fund) at December 31, 2019, the results of its operations for the year then ended, the changes in its net assets for each of the two years in the period then ended and its financial highlights for each of the five years in the period then ended, in conformity with U.S. generally accepted accounting principles.
Basis for Opinion
These financial statements are the responsibility of the Fund’s management. Our responsibility is to express an opinion on the Fund’s financial statements based on our audits. We are a public accounting firm registered with the Public Company Accounting Oversight Board (United States) (“PCAOB”) and are required to be independent with respect to the Fund in accordance with the U.S. federal securities laws and the applicable rules and regulations of the Securities and Exchange Commission and the PCAOB.
We conducted our audits in accordance with the standards of the PCAOB. Those standards require that we plan and perform the audit to obtain reasonable assurance about whether the financial statements are free of material misstatement, whether due to error or fraud. The Fund is not required to have, nor were we engaged to perform, an audit of the Fund’s internal control over financial reporting. As part of our audits, we are required to obtain an understanding of internal control over financial reporting, but not for the purpose of expressing an opinion on the effectiveness of the Fund’s internal control over financial reporting. Accordingly, we express no such opinion.
Our audits included performing procedures to assess the risks of material misstatement of the financial statements, whether due to error or fraud, and performing procedures that respond to those risks. Such procedures included examining, on a test basis, evidence regarding the amounts and disclosures in the financial statements. Our procedures included confirmation of securities owned as of December 31, 2019, by correspondence with the custodian and others or by other appropriate auditing procedures where replies from others were not received. Our audits also included evaluating the accounting principles used and significant estimates made by management, as well as evaluating the overall presentation of the financial statements. We believe that our audits provide a reasonable basis for our opinion.

We have served as the auditor of one or more investment companies in the BNY Mellon Family of Funds since at least 1957, but we are unable to determine the specific year.
New York, New York
February 10, 2020
26
IMPORTANT TAX INFORMATION(Unaudited)
For federal tax purposes, the portfolio hereby reports 19.26% of the ordinary dividends paid during the fiscal year ended December 31, 2019 as qualifying for the corporate dividends received deduction. Shareholders will receive notification in early 2020 of the percentage applicable to the preparation of their 2019 income tax returns. Also, the portfolio hereby reports $1.673 per share as a short-term capital gain distribution and $6.358 per share as a long-term capital gain distribution paid on March 8, 2019.
27
BOARD MEMBERS INFORMATION(Unaudited)
INDEPENDENT BOARD MEMBERS
Joseph S. DiMartino (76)
Chairman of the Board (1995)
Principal Occupation During Past 5 Years:
· Corporate Director and Trustee (1995-Present)
Other Public Company Board Memberships During Past 5 Years:
· CBIZ, Inc., a public company providing professional business services, products and solutions,Director (1997-Present)
No. of Portfolios for which Board Member Serves:118
———————
Peggy C. Davis (76)
Board Member (2006)
Principal Occupation During Past 5 Years:
· Shad Professor of Law, New York University School of Law (1983-present)
No. of Portfolios for which Board Member Serves: 43
———————
Gina D. France (61)
Board Member (2019)
Principal Occupation During Past 5 Years:
· Founder, President and Chief Executive Officer, France Strategic Partners, a strategy and advisory firm serving corporate clients across the United States (2003 –Present)
· Corporate Director and Trustee (2004 – Present)
Other Public Company Board Memberships During Past 5 Years:
· Huntington Bancshares, a bank holding company headquartered in Columbus, Ohio,Director(2016 – Present)
· Cedar Fair, L.P., a publicly-traded partnership that owns and operates amusement parks and hotels in the U.S. and Canada,Director (2011 – Present)
· CBIZ (formerly, Century Business Services, Inc.), a provider of outsourcing functions for small and medium size companies,Director(2015 – Present)
· Baldwin Wallace University,Trustee (2013- Present)
· FirstMerit Corporation, a diversified financial services company,Director (2004 – 2016)
No. of Portfolios for which Board Member Serves:29
———————
28
Joan Gulley (72)
Board Member (2017)
Principal Occupation During Past 5 Years:
· PNC Financial Services Group, Inc.(1993-2014), Executive Vice President and Chief Human Resources Officer and Executive Committee Member (2008-2014)
· Director, Nantucket Library (2015-Present)
No. of Portfolios for which Board Member Serves:49
———————
Ehud Houminer (79)
Board Member (2006)
Principal Occupation During Past 5 Years:
· Board of Overseers at the Columbia Business School, Columbia University (1992-Present)
· Trustee, Ben Gurion University (2012-2018)
No. of Portfolios for which Board Member Serves:49
———————
Robin A. Melvin (56)
Board Member (2012)
Principal Occupation During Past 5 Years:
· Co-chairman, Mentor Illinois, a non-profit organization dedicated to increasing the quantity and quality of mentoring services in Illinois; (2014-Present); Board member (2013-Present)
No. of Portfolios for which Board Member Serves:96
———————
Once elected all Board Members serve for an indefinite term, but achieve Emeritus status upon reaching age 80. The address of the Board Members and Officers is c/o BNY Mellon Investment Adviser, Inc. 240 Greenwich Street, New York, New York 10286. Additional information about the Board Members is available in the fund’s Statement of Additional Information which can be obtained from the Adviser free of charge by calling this toll free number: 1-800-373-9387.
David P.Feldman, Emeritus Board Member
James F. Henry, Emeritus Board Member
Lynn Martin, Emeritus Board Member
Dr. Martin Peretz, Emeritus Board Member
Philip L. Toia, Emeritus Board Member
29
OFFICERS OF THE FUND(Unaudited)
RENEE LAROCHE-MORRIS, President since May 2019.
President and a director of BNY Mellon Investment Adviser, Inc. since January 2018. She is an officer of 62 investment companies (comprised of 118 portfolios) managed by the Adviser. She is 48 years old and has been an employee of BNY Mellon since 2003.
JAMES WINDELS, Treasurer since November 2001.
Director- BNY Mellon Fund Administration, and an officer of 63 investment companies (comprised of 141 portfolios) managed by the Adviser. He is 61 years old and has been an employee of the Adviser since April 1985.
BENNETT A. MACDOUGALL, Chief Legal Officer since October 2015.
Chief Legal Officer of the Adviser and Associate General Counsel and Managing Director of BNY Mellon since June 2015; Director and Associate General Counsel of Deutsche Bank – Asset & Wealth Management Division from June 2005 to June 2015, and as Chief Legal Officer of Deutsche Investment Management Americas Inc. from June 2012 to May 2015. He is an officer of 63 investment companies (comprised of 141 portfolios) managed by the Adviser. He is 48 years old and has been an employee of the Adviser since June 2015.
DAVID DIPETRILLO, Vice President since May 2019.
Head of North America Product, BNY Mellon Investment Management since January 2018, Director of Product Strategy, BNY Mellon Investment Management from January 2016 to December 2017; Head of US Retail Product and Channel Marketing, BNY Mellon Investment Management from January 2014 to December 2015. He is an officer of 62 investment companies (comprised of 118 portfolios) managed by the Adviser. He is 41 years old and has been an employee of BNY Mellon since 2005.
JAMES BITETTO, Vice President since August 2005 and Secretary since February 2018.
Senior Managing Counsel of BNY Mellon since December 2019; Managing Counsel of BNY Mellon from April 2014 to December 2019; Secretary of the Adviser, and an officer of 63 investment companies (comprised of 141 portfolios) managed by the Adviser. He is 53 years old and has been an employee of the Adviser since December 1996.
SONALEE CROSS, Vice President and Assistant Secretary since March 2018.
Counsel of BNY Mellon since October 2016; Associate at Proskauer Rose LLP from April 2016 to September 2016; Attorney at EnTrust Capital from August 2015 to February 2016; Associate at Sidley Austin LLP from September 2013 to August 2015. She is an officer of 63 investment companies (comprised of 141 portfolios) managed by the Adviser. She is 32 years old and has been an employee of the Adviser since October 2016.
DEIRDRE CUNNANE, Vice President and Assistant Secretary since March 2019.
Counsel of BNY Mellon since August 2018; Senior Regulatory Specialist at BNY Mellon Investment Management Services from February 2016 to August 2018; Trustee Associate at BNY Mellon Trust Company (Ireland) Limited from August 2013 to February 2016. She is an officer of 63 investment companies (comprised of 141 portfolios) managed by the Adviser. She is 29 years old and has been an employee of the Adviser since August 2018.
SARAH S. KELLEHER, Vice President and Assistant Secretary since April 2014.
Managing Counsel of BNY Mellon since December 2017, Senior Counsel of BNY Mellon from March 2013 to December 2017. She is an officer of 63 investment companies (comprised of 141 portfolios) managed by the Adviser. She is 44 years old and has been an employee of the Adviser since March 2013.
JEFF PRUSNOFSKY, Vice President and Assistant Secretary since August 2005.
Senior Managing Counsel of BNY Mellon, and an officer of 63 investment companies (comprised of 141 portfolios) managed by the Adviser. He is 54 years old and has been an employee of the Adviser since October 1990.
PETER M. SULLIVAN, Vice President and Assistant Secretary since March 2019.
Managing Counsel of BNY Mellon, and an officer of 63 investment companies (comprised of 141 portfolios) managed by the Adviser. He is 51 years old and has been an employee of the Adviser since April 2004.
30
NATALYA ZELENSKY, Vice President and Assistant Secretary since March 2017.
Managing Counsel of BNY Mellon since December 2019; Counsel of BNY Mellon from May 2016 to December 2019; Attorney at Wildermuth Endowment Strategy Fund/Wildermuth Advisory, LLC from November 2015 to May 2016 and Assistant General Counsel at RCS Advisory Services from July 2014 to November 2015. She is an officer of 63 investment companies (comprised of 141 portfolios) managed by the Adviser. She is 34 years old and has been an employee of the Adviser since May 2016.
GAVIN C. REILLY, Assistant Treasurer since December 2005.
Tax Manager - BNY Mellon Fund Administration, and an officer of 63 investment companies (comprised of 141 portfolios) managed by the Adviser. He is 51 years old and has been an employee of the Adviser since April 1991.
ROBERT S. ROBOL, Assistant Treasurer since August 2005.
Senior Accounting Manager- BNY Mellon Fund Administration, and an officer of 63 investment companies (comprised of 141 portfolios) managed by the Adviser. He is 55 years old and has been an employee of the Adviser since October 1988.
ROBERT SALVIOLO, Assistant Treasurer since July 2007.
Senior Accounting Manager – BNY Mellon Fund Administration, and an officer of 63 investment companies (comprised of 141 portfolios) managed by the Adviser. He is 52 years old and has been an employee of the Adviser since June 1989.
ROBERT SVAGNA, Assistant Treasurer since December 2002.
Senior Accounting Manager – BNY Mellon Fund Administration, and an officer of 63 investment companies (comprised of 141 portfolios) managed by the Adviser. He is 52 years old and has been an employee of the Adviser since November 1990.
JOSEPH W. CONNOLLY, Chief Compliance Officer since October 2004.
Chief Compliance Officer of the Adviser, the BNY Mellon Family of Funds and BNY Mellon Funds Trust (63 investment companies, comprised of 141 portfolios). He is 62 years old and has served in various capacities with the Adviser since 1980, including manager of the firm’s Fund Accounting Department from 1997 through October 2001.
CARIDAD M. CAROSELLA, Anti-Money Laundering Compliance Officer since January 2016.
Anti-Money Laundering Compliance Officer of the BNY Mellon Family of Funds and BNY Mellon Funds Trust since January 2016; from May 2015 to December 2015, Interim Anti-Money Laundering Compliance Officer of the BNY Mellon Family of Funds and BNY Mellon Funds Trust and the Distributor; from January 2012 to May 2015, AML Surveillance Officer of the Distributor. She is an officer of 56 investment companies (comprised of 134 portfolios) managed by the Adviser. She is 51 years old and has been an employee of the Distributor since 1997.
31
NOTES
32
NOTES
33
BNY Mellon Variable Investment Fund, Opportunistic Small Cap Portfolio
240 Greenwich Street
New York, NY 10286
Adviser
BNY Mellon Investment Adviser, Inc.
240 Greenwich Street
New York, NY 10286
Custodian
The Bank of New York Mellon
240 Greenwich Street
New York, NY 10286
Transfer Agent &
Dividend Disbursing Agent
BNY Mellon Transfer, Inc.
240 Greenwich Street
New York, NY 10286
Distributor
BNY Mellon Securities Corporation
240 Greenwich Street
New York, NY 10286
Telephone 1-800-258-4260 or 1-800-258-4261
Mail The BNY Mellon Family of Funds, 144 Glenn Curtiss Boulevard, Uniondale, NY 11556-0144 Attn: Institutional Services Department
E-mailSend your request to info@bnymellon.com
InternetInformation can be viewed online or downloaded atwww.bnymellonim.com/us
The fund files its complete schedule of portfolio holdings with the Securities and Exchange Commission (“SEC”) for the first and third quarters of each fiscal year on Form N-PORT. The fund’s Forms N-PORT are available on the SEC’s website atwww.sec.gov.
A description of the policies and procedures that the fund uses to determine how to vote proxies relating to portfolio securities and information regarding how the fund voted these proxies for the most recent 12-month period ended June 30 is available atwww.bnymellonim.com/us and on the SEC’s website at www.sec.gov and without charge, upon request, by calling 1-800-373-9387.
| | |
© 2020 BNY Mellon Securities Corporation
0121AR1219 | 
|
BNY Mellon Variable Investment Fund, Quality Bond Portfolio
| |
ANNUAL REPORT December 31, 2019 |

| |
The views expressed in this report reflect those of the portfolio manager(s) only through the end of the period covered and do not necessarily represent the views of BNY Mellon Investment Adviser, Inc. or any other person in the BNY Mellon Investment Adviser, Inc. organization. Any such views are subject to change at any time based upon market or other conditions and BNY Mellon Investment Adviser, Inc. disclaims any responsibility to update such views. These views may not be relied on as investment advice and, because investment decisions for a fund in the BNY Mellon Family of Funds are based on numerous factors, may not be relied on as an indication of trading intent on behalf of any fund in the BNY Mellon Family of Funds. |
| |
Not FDIC-Insured • Not Bank-Guaranteed • May Lose Value |
Contents
THE FUND
FOR MORE INFORMATION
Back Cover
| | | | |
| |
BNY Mellon Variable Investment Fund, Quality Bond Portfolio
| | The Fund |
A LETTER FROM THE PRESIDENT OF BNY MELLON INVESTMENT ADVISER, INC.
Dear Shareholder:
We are pleased to present this annual report for BNY Mellon Variable Investment Fund, Quality Bond Portfolio (formerly, Dreyfus Variable Investment Fund, Quality Bond Portfolio), covering the 12-month period from January 1, 2019 through December 31, 2019. For information about how the fund performed during the reporting period, as well as general market perspectives, we provide a Discussion of Fund Performance on the pages that follow.
In January 2019, a pivot in stance from the U.S. Federal Reserve (the “Fed”) helped stimulate a rebound across equity markets that continued into the second quarter of the year. However, escalating trade tensions disrupted equity markets in May. The dip was short-lived, as markets rose once again in June and July of 2019, when a trade deal appeared more likely and the pace of U.S. economic growth remained steady. Nevertheless, concerns continued to emerge over slowing global growth, resulting in bouts of market volatility in August 2019. Stocks rebounded in September and continued an upward path through most of October 2019, bolstered by central bank policy and consistent consumer spending. The rally generally continued through the end of the period, supported in part by an announcement from President Trump that the first phase of a trade deal with China was in process. U.S. equity markets reached new highs during the final months of the period.
In fixed-income markets, the year began with a recovery from the prior months’ volatility. After the Fed’s supportive statements in January 2019, other developed-market central banks followed suit and reiterated their abilities to buttress flagging growth rates by continuing accommodative policies. The Fed cut rates in July, September and October 2019, for a total 75 basis point reduction in the federal funds rate during the 12 months. Rates across much of the Treasury curve saw a slight increase during the month of November, and the long end of the curve rose in December. The yield curve steepened during the latter portion of the period. However, demand for fixed-income instruments during the year was strong, which helped to support positive bond market returns.
We believe that over the near term, the outlook for the U.S. remains positive, but we will monitor relevant data for any signs of a change. As always, we encourage you to discuss the risks and opportunities in today’s investment environment with your financial advisor.
Thank you for your continued confidence and support.
Sincerely,

Renee LaRoche-Morris
President
BNY Mellon Investment Adviser, Inc.
January 15, 2020
2
DISCUSSION OF FUND PERFORMANCE(Unaudited)
For the period from January 1, 2019 through December 31, 2019, as provided by David Bowser, CFA, and Nathaniel Hyde, Portfolio Managers
Market and Fund Performance Overview
For the 12-month period ended December 31, 2019, BNY Mellon Variable Investment Fund, Quality Bond Portfolio’s (formerly, Dreyfus Variable Investment Fund, Quality Bond Portfolio) Initial shares produced a total return of 8.06%, and its Service shares produced a total return of 7.91%.1 In comparison, the Bloomberg Barclays U.S. Aggregate Bond Index (the “Index”), the fund’s benchmark, achieved a total return of 8.72% for the same period.2
Fixed-income securities had positive returns during the period, due to falling rates and tightening spreads. The fund underperformed the Index, mainly due to underweight duration positioning and an allocation to commercial mortgage-backed securities and asset-backed securities.
The Fund’s Investment Approach
The fund seeks to maximize total return, consisting of capital appreciation and current income. To pursue its goal, the fund normally invests at least 80% of its net assets, plus any borrowings for investment purposes, in bonds. The fund’s investments include corporate bonds, debentures, notes, mortgage-related securities, collateralized mortgage obligations and asset-backed securities, convertible debt obligations, preferred stocks, convertible preferred stocks, municipal obligations, and zero coupon bonds that, when purchased, typically are rated A or better or are the unrated equivalent as determined by BNY Mellon Investment Adviser, Inc., and in securities issued or guaranteed by the U.S. government or its agencies or instrumentalities, including treasury inflation-protected securities (TIPS).
The fund also may invest up to 10% of its net assets in bonds issued by foreign issuers that are denominated in foreign currencies, and up to 20% of its net assets in bonds issued by foreign issuers, whether denominated in U.S. dollars or in a foreign currency.
The fund has no limit with respect to its portfolio maturity or duration.
Supportive Central Bank Activity Bolsters Returns
Bonds produced strong returns over the reporting period in an environment of moderate economic growth and supportive policies from the U.S. Federal Reserve (the “Fed”). In January, Chairman Powell commented that the Fed would be patient and flexible with the pace of future interest-rate increases. This reassured investors, as did progress toward a trade resolution between the U.S. and China. Rates generally fell during the twelve-month period, supporting Treasury returns. After significant widening of spreads at the end of 2018, tightening occurred across many asset classes during the period, allowing risk assets to perform well, with corporate debt leading the broader market. In May, equity markets sputtered due to resurfacing trade issues, causing investors to seek safe-haven assets, depressing yields, and providing an additional boost
3
DISCUSSION OF FUND PERFORMANCE(Unaudited) (continued)
to fixed-income market values. The Fed reiterated its patient stance regarding future rate hikes and its willingness to take action to support economic growth rates during its May meeting.
However, concerns over slowing economic growth continued, and inflation floundered. The Fed decided to provide additional stimulus by cutting the federal funds rate. It did so three times during the period, each time by 25 basis points. These cuts occurred in July, September and October. Rates across the Treasury curve fell, and the curve continued its flattening trend with portions of the yield curve inverting during the middle of the period. After the cuts, the Fed signaled it would pause, and expectations for better growth prospects in 2020 emerged due to progress in U.S./China trade negotiations and stronger forward-looking economic data. Rates at the long end of the curve began to rise, and the yield curve steepened during the last months of the year.
Duration Positioning Constrains Fund Performance
The fund’s performance compared to the Index was constrained during the reporting period by underweight duration positioning. This positioning was not beneficial in the falling rate environment. In addition, the portfolio’s allocation to commercial mortgage-backed securities and asset-backed securities provided a headwind to results. While these spread sectors generally produced positive results and outperformed Treasuries during the 12 months, they lagged corporate bonds. Since the Index contains a generous amount of corporate bonds, these allocations contributed to relative underperformance when compared to the benchmark. Lastly, the fund’s position in Japanese Inflation Protected Bonds also detracted.
Conversely, other strategies added value. Most notably, an overweight allocation to, and security selection within, corporate debt helped returns. Credit issued by midstream pipeline companies was particularly beneficial. The fund also held bonds issued by industrial conglomerate General Electric, which increased in value during the period. From a credit rating perspective, BBB rated debt bolstered results. In addition, long-dated European government bonds, particularly those issued by Italy, Greece, France and Spain, contributed positively to returns. Towards the end of the period, TIPS performed well, contributing another net positive to the year’s results.
A Constructive Investment Posture
We expect continued moderate economic growth in the near future. As of right now, we believe there is an additional rate cut priced into the market that will dissipate, eliminating its influence on the Treasury curve. It is our opinion that one of the risks in the market is that the rate of inflation will increase more than expected. To hedge against this, we are maintaining our underweight duration positioning and our TIPS position.
During the period, we adjusted our position in mortgage-backed securities from underweight to overweight. It is now our largest active position. We still maintain a small overweight position in corporate debt, as we believe valuations will hold in the
4
near term, although we think they are not terribly attractive from a historical perspective.
January 15, 2020
1 Total return includes reinvestment of dividends and any capital gains paid. Past performance is no guarantee of future results. Share price and investment return fluctuate such that upon redemption, fund shares may be worth more or less than their original cost. The fund’s return reflects the absorption of certain fund expenses by BNY Mellon Investment Adviser, Inc. pursuant to an agreement in effect through May 1, 2020, at which time it may be extended, modified, or terminated. Had these expenses not been absorbed, returns would have been lower.
2 Source: Lipper Inc. — The Bloomberg Barclays U.S. Aggregate Bond Index is a broad-based, flagship benchmark that measures the investment-grade, U.S. dollar-denominated, fixed-rate, taxable bond market. The index includes Treasuries, government-related and corporate securities, MBS (agency fixed-rate and hybrid ARM pass-throughs), ABS and CMBS (agency and nonagency). Investors cannot invest directly in any index.
Bonds are subject generally to interest-rate, credit, liquidity and market risks, to varying degrees, all of which are more fully described in the fund’s prospectus. Generally, all other factors being equal, bond prices are inversely related to interest-rate changes, and rate increases can cause price declines.
Investments in foreign currencies are subject to the risk that those currencies will decline in value relative to the U.S. dollar, or, in the case of hedged positions, that the U.S. dollar will decline relative to the currency being hedged. Each of these risks could increase the fund’s volatility.
High-yield bonds are subject to increased credit risk and are considered speculative in terms of the issuer’s perceived ability to continue making interest payments on a timely basis and to repay principal upon maturity.
The fund may, but is not required to, use derivative instruments. A small investment in derivatives could have a potentially large impact on the fund's performance. The use of derivatives involves risks different from, or possibly greater than, the risks associated with investing directly in the underlying assets.
The fund is only available as a funding vehicle under variable life insurance policies or variable annuity contracts issued by insurance companies. Individuals may not purchase shares of the fund directly. A variable annuity is an insurance contract issued by an insurance company that enables investors to accumulate assets on a tax-deferred basis for retirement or other long-term goals. The investment objective and policies of BNY Mellon Variable Investment Fund, Quality Bond Portfolio made available through insurance products may be similar to those of other funds managed or advised by BNY Mellon Investment Adviser, Inc. However, the investment results of the fund may be higher or lower than, and may not be comparable to, those of any other BNY Mellon Investment Adviser, Inc. fund.
5
FUND PERFORMANCE(Unaudited)
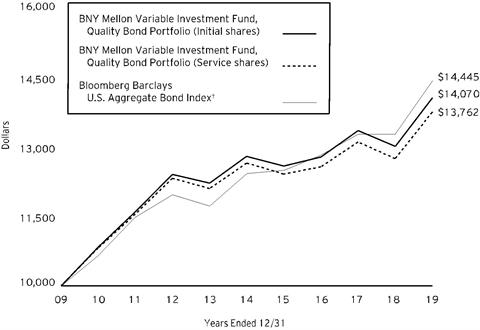
Comparison of change in value of a $10,000 investment inInitial shares and Service shares of BNY Mellon Variable Investment Fund, Quality Bond Portfoliowith a hypothetical investment of $10,000 in the Bloomberg Barclays U.S. Aggregate Bond Index (the “Index”)
† Source: Lipper Inc.
Past performance is not predictive of future performance. The fund’s performance does not reflect the deduction of additional charges and expenses imposed in connection with investing in variable insurance contracts which will reduce returns.
The above graph compares a hypothetical investment of $10,000 made in each Initial and Service shares of BNY Mellon Variable Investment Fund, Quality Bond Portfolio on 12/31/09 to a hypothetical investment of $10,000 made in the Index on that date.
The fund’s performance shown in the line graph above takes into account all applicable fund fees and expenses for Initial and Service shares. The Index is a broad-based flagship benchmark that measures the investment-grade, U.S. dollar-denominated, fixed-rate taxable bond market. The Index includes Treasuries, government-related and corporate securities, MBS (agency fixed-rate and hybrid ARM pass-throughs), ABS and CMBS (agency and nonagency). Unlike a mutual fund, the Index is not subject to charges, fees and other expenses. Investors cannot invest directly in any index. Further information relating to fund performance, including expense reimbursements, if applicable, is contained in the Financial Highlights section of the prospectus and elsewhere in this report.
6
| | | | |
Average Annual Total Returns as of 12/31/19 |
| | 1 Year | 5 Years | 10 Years |
Initial shares | 8.06% | 1.90% | 3.47% |
Service shares | 7.91% | 1.69% | 3.25% |
Bloomberg Barclays U. S. Aggregate Bond Index | 8.72% | 3.05% | 3.75% |
The performance data quoted represents past performance, which is no guarantee of future results. Share price and investment return fluctuate and an investor’s shares may be worth more or less than original cost upon redemption. Current performance may be lower or higher than the performance quoted. Go to www.bnymellonim.com/us for the fund’s most recent month-end returns.
The fund’s Initial shares are not subject to a Rule 12b-1 fee. The fund’s Service shares are subject to a 0.25% annual Rule 12b-1 fee. All dividends and capital gain distributions are reinvested.
The fund’s performance shown in the graph and table does not reflect the deduction of taxes that a shareholder would pay on fund distributions or the redemption of fund shares.
7
UNDERSTANDING YOUR FUND’S EXPENSES(Unaudited)
As a mutual fund investor, you pay ongoing expenses, such as management fees and other expenses. Using the information below, you can estimate how these expenses affect your investment and compare them with the expenses of other funds. You also may pay one-time transaction expenses, including sales charges (loads), redemption fees and expenses associated with variable annuity or insurance contracts, which are not shown in this section and would have resulted in higher total expenses. For more information, see your fund’s prospectus or talk to your financial adviser.
Review your fund’s expenses
The table below shows the expenses you would have paid on a $1,000 investment in BNY Mellon Variable Investment Fund, Quality Bond Portfolio from July 1, 2019 to December 31, 2019. It also shows how much a $1,000 investment would be worth at the close of the period, assuming actual returns and expenses.
| | | | | |
Expenses and Value of a $1,000 Investment | |
Assume actual returns for the six months ended December 31, 2019 | |
| | | | |
| | Initial Shares | Service Shares | |
Expense paid per $1,000† | $4.12 | $5.39 | |
Ending value (after expenses) | $1,019.90 | $1,018.70 | |
COMPARING YOUR FUND’S EXPENSES
WITH THOSE OF OTHER FUNDS(Unaudited)
Using the SEC’s method to compare expenses
The Securities and Exchange Commission (“SEC”) has established guidelines to help investors assess fund expenses. Per these guidelines, the table below shows your fund’s expenses based on a $1,000 investment, assuming a hypothetical 5% annualized return. You can use this information to compare the ongoing expenses (but not transaction expenses or total cost) of investing in the fund with those of other funds. All mutual fund shareholder reports will provide this information to help you make this comparison. Please note that you cannot use this information to estimate your actual ending account balance and expenses paid during the period.
| | | | | |
Expenses and Value of a $1,000 Investment | |
Assuming a hypothetical 5% annualized return for the six months ended December 31, 2019 | |
| | | | |
| | Initial Shares | Service Shares | |
Expense paid per $1,000† | $4.13 | $5.40 | |
Ending value (after expenses) | $1,021.12 | $1,019.86 | |
† Expenses are equal to the fund’s annualized expense ratio of .81% for Initial Shares and 1.06% for Service Shares, multiplied by the average account value over the period, multiplied by 184/365 (to reflect the one-half year period). |
8
STATEMENT OF INVESTMENTS
December 31, 2019
| | | | | | | | | | |
| |
Description | Coupon
Rate (%) | | Maturity
Date | | Principal
Amount ($) | a | Value ($) | |
Bonds and Notes - 98.4% | | | | | |
Aerospace & Defense - .6% | | | | | |
The Boeing Company, Sr. Unscd. Notes | | 3.20 | | 3/1/2029 | | 100,000 | | 104,237 | |
United Technologies, Sr. Unscd. Notes | | 4.13 | | 11/16/2028 | | 75,000 | | 84,485 | |
| | 188,722 | |
Agriculture - .2% | | | | | |
Reynolds American, Gtd. Notes | | 4.85 | | 9/15/2023 | | 60,000 | | 65,049 | |
Asset-Backed Certificates - .8% | | | | | |
Cascade Funding Mortgage Trust, Ser. 2019-HB1, Cl. A | | 2.39 | | 12/25/2029 | | 110,000 | b | 110,000 | |
Dell Equipment Finance Trust, Ser. 2017-2, Cl. A3 | | 2.19 | | 10/24/2022 | | 37,673 | b | 37,681 | |
HPEFS Equipment Trust, Ser. 2019-1A, Cl. A3 | | 2.21 | | 9/20/2029 | | 100,000 | b | 100,185 | |
| | 247,866 | |
Asset-Backed Ctfs./Auto Receivables - 3.2% | | | | | |
CarMax Auto Owner Trust, Ser. 2017-4, Cl. A4 | | 2.33 | | 5/15/2023 | | 85,000 | | 85,347 | |
CarMax Auto Owner Trust, Ser. 2018-1, Cl. A4 | | 2.64 | | 6/15/2023 | | 180,000 | | 182,110 | |
Enterprise Fleet Financing, Ser. 2017-3, Cl. A2 | | 2.13 | | 5/22/2023 | | 37,472 | b | 37,464 | |
Nissan Auto Receivables Owner Trust, Ser. 2017-B, Cl. A4 | | 1.95 | | 10/16/2023 | | 190,000 | | 190,138 | |
Oscar US Funding Trust IX, Ser. 2018-2A, Cl. A4 | | 3.63 | | 9/10/2025 | | 130,000 | b | 133,992 | |
Oscar US Funding Trust VII, Ser. 2017-2A, Cl. A3 | | 2.45 | | 12/10/2021 | | 31,697 | b | 31,740 | |
Oscar US Funding Trust VII, Ser. 2017-2A, Cl. A4 | | 2.76 | | 12/10/2024 | | 50,000 | b | 50,508 | |
Oscar US Funding Trust VIII, Ser. 2018-1A, Cl. A4 | | 3.50 | | 5/12/2025 | | 190,000 | b | 195,326 | |
Oscar US Funding XI, Ser. 2019-2A, Cl. A4 | | 2.68 | | 9/10/2026 | | 145,000 | b | 146,209 | |
| | 1,052,834 | |
Asset-Backed Ctfs./Credit Cards - .5% | | | | | |
Delamare Cards MTN Issuer, Ser. 2018-1A, Cl. A1, 1 Month LIBOR +.70% | | 2.46 | | 11/19/2025 | | 175,000 | b,c | 175,279 | |
Banks - 6.8% | | | | | |
Bank of America, Sr. Unscd. Notes | | 3.00 | | 12/20/2023 | | 43,000 | | 44,057 | |
Bank of America, Sr. Unscd. Notes | | 3.42 | | 12/20/2028 | | 74,000 | | 77,665 | |
Bank of America, Sr. Unscd. Notes | | 3.50 | | 4/19/2026 | | 125,000 | | 132,915 | |
9
STATEMENT OF INVESTMENTS (continued)
| | | | | | | | | | |
| |
Description | Coupon
Rate (%) | | Maturity
Date | | Principal
Amount ($) | a | Value ($) | |
Bonds and Notes - 98.4% (continued) | | | | | |
Banks - 6.8% (continued) | | | | | |
Bank of America, Sr. Unscd. Notes | | 4.00 | | 4/1/2024 | | 122,000 | | 130,713 | |
Barclays, Sr. Unscd. Notes | | 4.38 | | 1/12/2026 | | 200,000 | | 216,668 | |
Citigroup, Sr. Unscd. Bonds | | 3.40 | | 5/1/2026 | | 205,000 | | 215,313 | |
Citigroup, Sr. Unscd. Notes | | 4.65 | | 7/30/2045 | | 40,000 | | 49,619 | |
JPMorgan Chase & Co., Sr. Unscd. Notes | | 4.45 | | 12/5/2029 | | 150,000 | | 170,614 | |
Keybank, Sr. Unscd. Bonds | | 2.50 | | 11/22/2021 | | 250,000 | | 252,828 | |
Morgan Stanley, Sr. Unscd. Notes | | 3.75 | | 2/25/2023 | | 65,000 | | 68,093 | |
Morgan Stanley, Sr. Unscd. Notes | | 5.50 | | 7/28/2021 | | 100,000 | | 105,365 | |
Royal Bank of Canada, Sr. Unscd. Notes | | 2.55 | | 7/16/2024 | | 90,000 | | 91,362 | |
Santander Holdings USA, Sr. Unscd. Notes | | 4.45 | | 12/3/2021 | | 85,000 | | 88,356 | |
The Goldman Sachs Group, Sr. Unscd. Notes | | 2.75 | | 9/15/2020 | | 105,000 | | 105,504 | |
The Goldman Sachs Group, Sr. Unscd. Notes | | 3.81 | | 4/23/2029 | | 50,000 | | 53,599 | |
The Goldman Sachs Group, Sr. Unscd. Notes, 3 Month LIBOR +1.60% | | 3.51 | | 11/29/2023 | | 55,000 | c | 57,004 | |
Truist Financial, Sr. Unscd. Notes | | 2.50 | | 8/1/2024 | | 105,000 | | 106,326 | |
U.S. Bancorp, Sr. Unscd. Notes | | 2.40 | | 7/30/2024 | | 80,000 | | 81,071 | |
Wells Fargo & Co., Sr. Unscd. Notes | | 3.07 | | 1/24/2023 | | 110,000 | | 112,305 | |
Wells Fargo & Co., Sub. Notes | | 4.30 | | 7/22/2027 | | 60,000 | | 65,738 | |
| | 2,225,115 | |
Beverage Products - .5% | | | | | |
Anheuser-Busch Inbev Worldwide, Gtd. Notes | | 4.00 | | 4/13/2028 | | 35,000 | | 38,503 | |
Anheuser-Busch Inbev Worldwide, Gtd. Notes | | 4.90 | | 2/1/2046 | | 90,000 | | 106,602 | |
Keurig Dr Pepper, Gtd. Notes | | 4.06 | | 5/25/2023 | | 20,000 | | 21,093 | |
| | 166,198 | |
Chemicals - .4% | | | | | |
Nutrien, Sr. Unscd. Notes | | 4.20 | | 4/1/2029 | | 25,000 | | 27,557 | |
The Dow Chemical Company, Sr. Unscd. Notes | | 3.50 | | 10/1/2024 | | 85,000 | d | 89,248 | |
| | 116,805 | |
Collateralized Municipal-Backed Securities - 2.4% | | | | | |
Federal Home Loan Mortgage Corp. Multifamily Structured Pass Through Certificates, Ser. K026, Cl. A2 | | 2.51 | | 11/25/2022 | | 30,000 | e | 30,422 | |
10
| | | | | | | | | | |
| |
Description | Coupon
Rate (%) | | Maturity
Date | | Principal
Amount ($) | a | Value ($) | |
Bonds and Notes - 98.4% (continued) | | | | | |
Collateralized Municipal-Backed Securities - 2.4% (continued) | | | | | |
Federal Home Loan Mortgage Corp. Multifamily Structured Pass Through Certificates, Ser. K029, Cl. A2 | | 3.32 | | 2/25/2023 | | 85,000 | e | 88,191 | |
Federal Home Loan Mortgage Corp. Multifamily Structured Pass Through Certificates, Ser. K030, Cl. A2 | | 3.25 | | 4/25/2023 | | 25,000 | e | 25,898 | |
Federal Home Loan Mortgage Corp. Multifamily Structured Pass Through Certificates, Ser. K089, Cl. A2 | | 3.56 | | 1/25/2029 | | 205,000 | e | 222,483 | |
Federal Home Loan Mortgage Corp. Multifamily Structured Pass Through Certificates, Ser. K095, Cl. A2 | | 2.79 | | 6/25/2029 | | 275,000 | e | 283,944 | |
Federal Home Loan Mortgage Corp. Multifamily Structured Pass Through Certificates, Ser. K096, Cl. A2 | | 2.52 | | 7/25/2029 | | 140,000 | e | 141,883 | |
| | 792,821 | |
Commercial & Professional Services - .4% | | | | | |
ERAC USA Finance, Gtd. Notes | | 3.85 | | 11/15/2024 | | 60,000 | b | 63,511 | |
PayPal Holdings, Sr. Unscd. Notes | | 2.65 | | 10/1/2026 | | 60,000 | | 60,866 | |
| | 124,377 | |
Commercial Mortgage Pass-Through Ctfs. - 5.3% | | | | | |
Commercial Mortgage Trust, Ser. 2014-UBS2, Cl. AM | | 4.20 | | 3/10/2047 | | 70,000 | | 73,674 | |
Commercial Mortgage Trust, Ser. 2015-DC1, Cl. A5 | | 3.35 | | 2/10/2048 | | 170,000 | | 177,185 | |
Commercial Mortgage Trust, Ser. 2017-CD3, Cl. A4 | | 3.63 | | 2/10/2050 | | 290,000 | | 310,824 | |
Houston Galleria Mall Trust, Ser. 2015-HGLR, Cl. A1A2 | | 3.09 | | 3/5/2037 | | 100,000 | b | 102,486 | |
NYT Mortgage Trust, Ser. 2019-NYT, Cl. A, 1 Month LIBOR +1.20% | | 2.94 | | 11/15/2035 | | 175,000 | b,c | 175,739 | |
Seasoned Credit Risk Transfer Trust, Ser. 2019-1, Cl. M55D | | 4.00 | | 7/25/2058 | | 152,593 | | 160,594 | |
Seasoned Credit Risk Transfer Trust, Ser. 2019-1, Cl. MA | | 3.50 | | 7/25/2058 | | 76,433 | | 78,897 | |
Seasoned Loans Structured Transaction, Ser. 2019-1, Cl. A2 | | 3.50 | | 5/25/2029 | | 60,000 | | 62,419 | |
Seasoned Loans Structured Transaction Trust, Ser. 2019-2, Cl. A2C | | 2.75 | | 9/25/2029 | | 100,000 | | 99,902 | |
11
STATEMENT OF INVESTMENTS (continued)
| | | | | | | | | | |
| |
Description | Coupon
Rate (%) | | Maturity
Date | | Principal
Amount ($) | a | Value ($) | |
Bonds and Notes - 98.4% (continued) | | | | | |
Commercial Mortgage Pass-Through Ctfs. - 5.3% (continued) | | | | | |
Seasoned Loans Structured Transaction Trust, Ser. 2019-3, Cl. A2C | | 2.75 | | 11/25/2029 | | 90,000 | | 91,038 | |
Starwood Waypoint Homes Trust, Ser. 2017-1, Cl. A, 1 Month LIBOR +.95% | | 2.69 | | 1/17/2035 | | 178,341 | b,c | 178,166 | |
Tricon American Homes Trust, Ser. 2017-SFR2, Cl. A | | 2.93 | | 1/17/2036 | | 124,646 | b | 125,583 | |
Wells Fargo Commercial Mortgage Trust, Ser. 2014-LC18, Cl. A4 | | 3.15 | | 12/15/2047 | | 100,000 | | 103,589 | |
| | 1,740,096 | |
Consumer Staples - .1% | | | | | |
The Estee Lauder Companies, Sr. Unscd. Notes | | 2.38 | | 12/1/2029 | | 40,000 | | 39,978 | |
Diversified Financials - .7% | | | | | |
American Express, Sr. Unscd. Notes | | 3.40 | | 2/22/2024 | | 130,000 | | 135,968 | |
Visa, Sr. Unscd. Notes | | 3.15 | | 12/14/2025 | | 75,000 | | 79,267 | |
| | 215,235 | |
Energy - 3.8% | | | | | |
Cameron LNG, Sr. Scd. Notes | | 3.30 | | 1/15/2035 | | 90,000 | b | 90,859 | |
Cheniere Corpus Christi Holdings, Sr. Scd. Notes | | 3.70 | | 11/15/2029 | | 95,000 | b | 96,994 | |
Concho Resources, Gtd. Notes | | 4.88 | | 10/1/2047 | | 30,000 | | 34,999 | |
Diamondback Energy, Gtd. Notes | | 2.88 | | 12/1/2024 | | 65,000 | | 65,742 | |
Diamondback Energy, Gtd. Notes | | 5.38 | | 5/31/2025 | | 25,000 | | 26,249 | |
Energy Transfer Operating, Gtd. Notes | | 5.15 | | 2/1/2043 | | 65,000 | | 66,784 | |
Energy Transfer Operating, Jr. Sub. Debs., Ser. A | | 6.25 | | 2/15/2023 | | 10,000 | | 9,415 | |
Equinor, Gtd. Notes | | 3.25 | | 11/18/2049 | | 45,000 | | 45,341 | |
Kinder Morgan, Gtd. Notes | | 7.75 | | 1/15/2032 | | 160,000 | | 220,025 | |
MPLX, Sr. Unscd. Notes | | 3.50 | | 12/1/2022 | | 40,000 | b | 41,187 | |
MPLX, Sr. Unscd. Notes | | 4.13 | | 3/1/2027 | | 70,000 | | 73,512 | |
MPLX, Sr. Unscd. Notes | | 5.20 | | 3/1/2047 | | 60,000 | | 64,792 | |
Petrobras Global Finance, Gtd. Notes | | 5.09 | | 1/15/2030 | | 10,000 | b | 10,728 | |
Plains All American Pipeline, Sr. Unscd. Notes | | 3.55 | | 12/15/2029 | | 85,000 | | 83,836 | |
The Williams Companies, Sr. Unscd. Notes | | 4.50 | | 11/15/2023 | | 130,000 | | 139,201 | |
The Williams Companies, Sr. Unscd. Notes | | 6.30 | | 4/15/2040 | | 65,000 | | 80,593 | |
Western Midstream Operating, Sr. Unscd. Notes | | 4.50 | | 3/1/2028 | | 35,000 | | 34,543 | |
12
| | | | | | | | | | |
| |
Description | Coupon
Rate (%) | | Maturity
Date | | Principal
Amount ($) | a | Value ($) | |
Bonds and Notes - 98.4% (continued) | | | | | |
Energy - 3.8% (continued) | | | | | |
Western Midstream Operating, Sr. Unscd. Notes | | 4.65 | | 7/1/2026 | | 55,000 | d | 56,310 | |
| | 1,241,110 | |
Environmental Control - .5% | | | | | |
Republic Services, Sr. Unscd. Notes | | 2.50 | | 8/15/2024 | | 40,000 | | 40,465 | |
Waste Management, Gtd. Notes | | 4.10 | | 3/1/2045 | | 110,000 | | 123,456 | |
| | 163,921 | |
Food Products - .5% | | | | | |
Conagra Brands, Sr. Unscd. Notes | | 3.80 | | 10/22/2021 | | 85,000 | | 87,715 | |
Kraft Heinz Foods, Gtd. Notes | | 3.95 | | 7/15/2025 | | 50,000 | | 52,932 | |
Kraft Heinz Foods, Gtd. Notes | | 6.88 | | 1/26/2039 | | 10,000 | | 12,512 | |
| | 153,159 | |
Foreign Governmental - 5.5% | | | | | |
Hungary, Sr. Unscd. Notes | | 5.38 | | 3/25/2024 | | 40,000 | | 45,161 | |
Japan, Sr. Unscd. Bonds, Ser. 21 | JPY | 0.10 | | 3/10/2026 | | 145,155,392 | f | 1,365,320 | |
Romania, Sr. Unscd. Notes | EUR | 2.50 | | 2/8/2030 | | 30,000 | b | 36,447 | |
Russia, Bonds, Ser. 6212 | RUB | 7.05 | | 1/19/2028 | | 16,305,000 | | 277,480 | |
Singapore, Sr. Unscd. Bonds | SGD | 2.63 | | 5/1/2028 | | 120,000 | | 95,641 | |
| | 1,820,049 | |
Health Care - 3.4% | | | | | |
Abbott Laboratories, Sr. Unscd. Notes | | 4.90 | | 11/30/2046 | | 120,000 | | 157,664 | |
AbbVie, Sr. Unscd. Notes | | 3.20 | | 11/21/2029 | | 80,000 | b | 81,435 | |
AmerisourceBergen, Sr. Unscd. Notes | | 3.25 | | 3/1/2025 | | 95,000 | | 98,787 | |
Bristol-Myers Squibb, Sr. Unscd. Notes | | 3.20 | | 6/15/2026 | | 50,000 | b | 52,474 | |
Bristol-Myers Squibb, Sr. Unscd. Notes | | 3.40 | | 7/26/2029 | | 30,000 | b | 32,086 | |
Cigna, Gtd. Notes | | 3.05 | | 11/30/2022 | | 60,000 | b | 61,339 | |
CVS Health, Sr. Unscd. Notes | | 4.30 | | 3/25/2028 | | 80,000 | | 87,370 | |
DH Europe Finance II, Gtd. Notes | | 2.60 | | 11/15/2029 | | 65,000 | | 64,804 | |
Gilead Sciences, Sr. Unscd. Notes | | 3.65 | | 3/1/2026 | | 55,000 | | 59,189 | |
Gilead Sciences, Sr. Unscd. Notes | | 4.75 | | 3/1/2046 | | 30,000 | | 36,025 | |
Medtronic, Gtd. Notes | | 4.63 | | 3/15/2045 | | 13,000 | | 16,347 | |
Merck & Co., Sr. Unscd. Notes | | 2.90 | | 3/7/2024 | | 40,000 | | 41,633 | |
Merck & Co., Sr. Unscd. Notes | | 3.40 | | 3/7/2029 | | 20,000 | | 21,655 | |
Pfizer, Sr. Unscd. Notes | | 2.95 | | 3/15/2024 | | 15,000 | | 15,574 | |
Pfizer, Sr. Unscd. Notes | | 3.20 | | 9/15/2023 | | 15,000 | | 15,645 | |
Pfizer, Sr. Unscd. Notes | | 3.45 | | 3/15/2029 | | 20,000 | d | 21,541 | |
Shire Acquisitions Investments Ireland, Gtd. Notes | | 2.88 | | 9/23/2023 | | 100,000 | | 101,892 | |
13
STATEMENT OF INVESTMENTS (continued)
| | | | | | | | | | |
| |
Description | Coupon
Rate (%) | | Maturity
Date | | Principal
Amount ($) | a | Value ($) | |
Bonds and Notes - 98.4% (continued) | | | | | |
Health Care - 3.4% (continued) | | | | | |
UnitedHealth Group, Sr. Unscd. Notes | | 4.75 | | 7/15/2045 | | 115,000 | | 141,384 | |
| | 1,106,844 | |
Industrial - .5% | | | | | |
General Electric, Jr. Sub. Debs., Ser. D | | 5.00 | | 1/21/2021 | | 10,000 | | 9,810 | |
General Electric, Sr. Unscd. Bonds | EUR | 0.38 | | 5/17/2022 | | 100,000 | | 112,343 | |
John Deere Capital, Sr. Unscd. Notes | | 1.95 | | 6/13/2022 | | 55,000 | | 55,110 | |
| | 177,263 | |
Information Technology - .4% | | | | | |
Oracle, Sr. Unscd. Notes | | 2.65 | | 7/15/2026 | | 140,000 | | 143,182 | |
Insurance - 1.5% | | | | | |
American International Group, Sr. Unscd. Notes | | 4.20 | | 4/1/2028 | | 85,000 | | 93,524 | |
Jackson National Life Global Funding, Scd. Notes | | 3.30 | | 2/1/2022 | | 50,000 | b | 51,411 | |
New York Life Global Funding, Scd. Notes | | 2.88 | | 4/10/2024 | | 90,000 | b | 92,839 | |
Pricoa Global Funding I, Scd. Notes | | 2.40 | | 9/23/2024 | | 150,000 | b | 150,939 | |
Principal Financial Group, Gtd. Notes | | 4.30 | | 11/15/2046 | | 90,000 | | 101,698 | |
| | 490,411 | |
Internet Software & Services - .4% | | | | | |
Amazon.com, Sr. Unscd. Notes | | 4.05 | | 8/22/2047 | | 105,000 | | 123,348 | |
Media - 1.6% | | | | | |
Charter Communications Operating, Sr. Scd. Notes | | 5.38 | | 5/1/2047 | | 50,000 | | 56,030 | |
Comcast, Gtd. Notes | | 2.65 | | 2/1/2030 | | 145,000 | | 145,586 | |
Comcast, Gtd. Notes | | 3.15 | | 3/1/2026 | | 105,000 | | 110,059 | |
Comcast, Gtd. Notes | | 4.70 | | 10/15/2048 | | 45,000 | | 55,468 | |
The Walt Disney Company, Gtd. Notes | | 4.00 | | 10/1/2023 | | 90,000 | | 96,484 | |
The Walt Disney Company, Gtd. Notes | | 4.75 | | 11/15/2046 | | 55,000 | | 70,181 | |
| | 533,808 | |
Metals & Mining - .2% | | | | | |
Southern Copper, Sr. Unscd. Notes | | 5.88 | | 4/23/2045 | | 25,000 | | 31,341 | |
Steel Dynamics, Sr. Unscd. Notes | | 3.45 | | 4/15/2030 | | 25,000 | | 25,312 | |
| | 56,653 | |
Municipal Securities - 4.0% | | | | | |
California, GO (Build America Bonds) | | 7.30 | | 10/1/2039 | | 340,000 | | 519,772 | |
Honolulu City & County Wastewater System, Revenue Bonds, Refunding, Ser. B | | 2.50 | | 7/1/2027 | | 10,000 | | 10,149 | |
14
| | | | | | | | | | |
| |
Description | Coupon
Rate (%) | | Maturity
Date | | Principal
Amount ($) | a | Value ($) | |
Bonds and Notes - 98.4% (continued) | | | | | |
Municipal Securities - 4.0% (continued) | | | | | |
Massachusetts School Building Authority, Revenue Bonds, Refunding, Ser. B | | 2.44 | | 10/15/2027 | | 40,000 | | 39,848 | |
Massachusetts Water Resources Authority, Revenue Bonds, Refunding, Ser. F | | 2.16 | | 8/1/2026 | | 95,000 | | 93,716 | |
Miami-Dade County Water & Sewer System, Revenue Bonds, Refunding, Ser. C | | 2.55 | | 10/1/2028 | | 95,000 | | 95,390 | |
New Jersey Economic Development Authority, Revenue Bonds, Refunding, Ser. YY | | 4.45 | | 6/15/2020 | | 305,000 | | 308,306 | |
New York City, GO (Build America Bonds) Ser. D | | 5.99 | | 12/1/2036 | | 200,000 | | 259,938 | |
| | 1,327,119 | |
Real Estate - .2% | | | | | |
SBA Tower Trust, Scd. Notes | | 2.84 | | 1/15/2025 | | 80,000 | b | 80,883 | |
Retailing - .7% | | | | | |
Dollar Tree, Sr. Unscd. Notes | | 4.20 | | 5/15/2028 | | 25,000 | | 26,808 | |
Target, Sr. Unscd. Notes | | 3.38 | | 4/15/2029 | | 90,000 | | 97,788 | |
Walmart, Sr. Unscd. Notes | | 3.05 | | 7/8/2026 | | 95,000 | | 100,172 | |
| | 224,768 | |
Supranational Bank - .2% | | | | | |
Corp. Andina de Fomento, Sr. Unscd. Notes | | 3.25 | | 2/11/2022 | | 60,000 | | 61,069 | |
Technology Hardware & Equipment - 1.1% | | | | | |
Apple, Sr. Unscd. Notes | | 2.05 | | 9/11/2026 | | 160,000 | | 158,831 | |
Dell International, Sr. Scd. Notes | | 6.02 | | 6/15/2026 | | 110,000 | b | 126,607 | |
Hewlett Packard Enterprise, Sr. Unscd. Notes | | 3.50 | | 10/5/2021 | | 5,000 | | 5,126 | |
Hewlett Packard Enterprise, Sr. Unscd. Notes | | 4.40 | | 10/15/2022 | | 75,000 | | 79,231 | |
| | 369,795 | |
Telecommunication Services - 1.6% | | | | | |
AT&T, Sr. Unscd. Bonds | | 4.90 | | 8/15/2037 | | 75,000 | | 86,297 | |
AT&T, Sr. Unscd. Notes | | 4.25 | | 3/1/2027 | | 50,000 | | 54,903 | |
AT&T, Sr. Unscd. Notes | | 5.35 | | 12/15/2043 | | 110,000 | | 130,549 | |
Cisco Systems, Sr. Unscd. Notes | | 2.50 | | 9/20/2026 | | 35,000 | | 35,675 | |
Corning, Sr. Unscd. Notes | | 4.38 | | 11/15/2057 | | 40,000 | | 41,161 | |
Verizon Communications, Sr. Unscd. Notes | | 3.38 | | 2/15/2025 | | 22,000 | | 23,295 | |
Verizon Communications, Sr. Unscd. Notes | | 4.02 | | 12/3/2029 | | 138,000 | | 154,270 | |
| | 526,150 | |
15
STATEMENT OF INVESTMENTS (continued)
| | | | | | | | | | |
| |
Description | Coupon
Rate (%) | | Maturity
Date | | Principal
Amount ($) | a | Value ($) | |
Bonds and Notes - 98.4% (continued) | | | | | |
Transportation - .6% | | | | | |
CSX, Sr. Unscd. Notes | | 2.60 | | 11/1/2026 | | 75,000 | | 76,265 | |
FedEx, Gtd. Notes | | 4.40 | | 1/15/2047 | | 125,000 | | 125,420 | |
| | 201,685 | |
U.S. Government Agencies Mortgage-Backed - 36.9% | | | | | |
Federal Home Loan Mortgage Corp., REMIC, Ser. 3910, Cl. JB | | 3.00 | | 12/15/2037 | | 67,618 | e | 68,259 | |
Government National Mortgage Association, Ser. 2015-H17, Cl. HA | | 2.50 | | 5/20/2065 | | 69,506 | | 69,499 | |
Federal Home Loan Mortgage Corp.: | | | |
3.00%, 6/1/2031-5/1/2049 | | | 563,171 | e | 575,573 | |
3.50%, 8/1/2045 | | | 149,160 | e | 156,739 | |
5.50%, 5/1/2040 | | | 2,069 | e | 2,230 | |
Federal National Mortgage Association: | | | |
2.50% | | | 425,000 | e,g | 428,624 | |
2.50%, 9/1/2028-12/1/2031 | | | 324,271 | e | 327,944 | |
3.00% | | | 770,000 | e,g | 780,495 | |
3.00%, 6/1/2028-1/1/2059 | | | 1,377,472 | e | 1,412,755 | |
3.50%, 5/1/2030-8/1/2056 | | | 2,471,599 | e | 2,590,537 | |
3.50% | | | 760,000 | e,g | 782,769 | |
4.00%, 9/1/2042-6/1/2047 | | | 700,296 | e | 745,995 | |
4.00% | | | 1,100,000 | e,g | 1,143,922 | |
4.50%, 10/1/2040-9/1/2049 | | | 1,084,215 | e | 1,163,909 | |
5.00%, 3/1/2021-12/1/2048 | | | 254,992 | e | 280,032 | |
7.00%, 6/1/2029-9/1/2029 | | | 5,084 | e | 5,272 | |
Government National Mortgage Association I: | | | |
5.50%, 4/15/2033 | | | 182,657 | | 204,928 | |
Government National Mortgage Association II: | | | |
3.00%, 11/20/2045 | | | 680,355 | | 702,483 | |
4.00%, 10/20/2047-1/20/2048 | | | 393,598 | | 409,353 | |
4.50%, 7/20/2048 | | | 244,423 | | 257,486 | |
7.00%, 9/20/2028-7/20/2029 | | | 2,407 | | 2,758 | |
| | 12,111,562 | |
U.S. Treasury Securities - 9.4% | | | | | |
U.S. Treasury Bonds | | 2.88 | | 5/15/2049 | | 420,000 | | 462,545 | |
U.S. Treasury Bonds | | 3.00 | | 2/15/2049 | | 280,000 | | 315,607 | |
U.S. Treasury Bonds | | 4.50 | | 2/15/2036 | | 380,000 | | 503,518 | |
U.S. Treasury Floating Rate Notes, 3 Month U.S. T-BILL +.05% | | 1.57 | | 10/31/2020 | | 1,355,000 | c,d | 1,354,462 | |
U.S. Treasury Inflation Indexed Bonds, US CPI Urban Consumers Not Seasonally Adjusted | | 0.88 | | 2/15/2047 | | 63,965 | f | 68,607 | |
16
| | | | | | | | | | |
| |
Description | Coupon
Rate (%) | | Maturity
Date | | Principal
Amount ($) | a | Value ($) | |
Bonds and Notes - 98.4% (continued) | | | | | |
U.S. Treasury Securities - 9.4% (continued) | | | | | |
U.S. Treasury Inflation Indexed Notes, US CPI Urban Consumers Not Seasonally Adjusted | | 0.50 | | 4/15/2024 | | 377,537 | d,f | 383,701 | |
| | 3,088,440 | |
Utilities - 3.5% | | | | | |
Dominion Energy, Sr. Unscd. Notes, Ser. D | | 2.85 | | 8/15/2026 | | 165,000 | | 166,691 | |
DPL, Sr. Unscd. Notes | | 4.35 | | 4/15/2029 | | 85,000 | b | 82,005 | |
Duke Energy Progress, First Mortgage Bonds | | 3.45 | | 3/15/2029 | | 135,000 | | 144,627 | |
Edison International, Sr. Unscd. Notes | | 4.13 | | 3/15/2028 | | 25,000 | | 25,645 | |
Edison International, Sr. Unscd. Notes | | 5.75 | | 6/15/2027 | | 15,000 | | 16,849 | |
Exelon Generation, Sr. Unscd. Notes | | 6.25 | | 10/1/2039 | | 85,000 | | 102,513 | |
Kentucky Utilities, First Mortgage Bonds | | 4.38 | | 10/1/2045 | | 80,000 | | 93,049 | |
Louisville Gas & Electric, First Mortgage Bonds | | 4.38 | | 10/1/2045 | | 90,000 | | 104,120 | |
Nevada Power, Mortgage Notes, Ser. R | | 6.75 | | 7/1/2037 | | 150,000 | | 211,980 | |
Southern California Edison, First Mortgage Bonds, Ser. A | | 4.20 | | 3/1/2029 | | 85,000 | | 94,116 | |
Xcel Energy, Sr. Unscd. Notes | | 2.60 | | 12/1/2029 | | 95,000 | | 94,095 | |
| | 1,135,690 | |
TotalBonds and Notes
(cost $31,170,177) | | 32,287,284 | |
Description /Number of Contracts/Counterparty | Exercise
Price | | Expiration Date | | Notional Amount ($) | | Value ($) | |
Options Purchased - .0% | | | | | |
Put Options - .0% | | | | | |
South African Rand, Contracts 80,000 Morgan Stanley
(cost $921) | | 14.60 | | 1/30/2020 | | 80,000 | | 3,302 | |
Description | Annualized
Yield (%) | | Maturity Date | | Principal Amount ($) | | Value ($) | |
Short-Term Investments - 9.2% | | | | | |
U.S. Government Securities | | | | | |
U.S. Treasury Bills | | 1.56 | | 4/16/2020 | | 400,000 | h,i | 398,235 | |
U.S. Treasury Bills | | 1.55 | | 2/27/2020 | | 2,640,000 | i | 2,633,819 | |
TotalShort-Term Investments
(cost $3,031,815) | | 3,032,054 | |
17
STATEMENT OF INVESTMENTS (continued)
| | | | | | | | | | |
| |
Description | 1-Day
Yield (%) | | | | Shares | | Value ($) | |
Investment Companies - 1.6% | | | | | |
Registered Investment Companies - 1.6% | | | | | |
Dreyfus Institutional Preferred Government Plus Money Market Fund
(cost $535,669) | | 1.60 | | | | 535,669 | j | 535,669 | |
| | | | | | | | | |
Investment of Cash Collateral for Securities Loaned - .4% | | | | | |
Registered Investment Companies - .4% | | | | | |
Dreyfus Institutional Preferred Government Plus Money Market Fund
(cost $114,200) | | 1.60 | | | | 114,200 | j | 114,200 | |
Total Investments(cost $34,852,782) | | 109.6% | 35,972,509 | |
Liabilities, Less Cash and Receivables | | (9.6%) | (3,146,328) | |
Net Assets | | 100.0% | 32,826,181 | |
LIBOR—London Interbank Offered Rate
REMIC—Real Estate Mortgage Investment Conduit
EUR—Euro
JPY—Japanese Yen
RUB—Russian Ruble
SGD—Singapore Dollar
a Amount stated in U.S. Dollars unless otherwise noted above.
b Security exempt from registration pursuant to Rule 144A under the Securities Act of 1933. These securities may be resold in transactions exempt from registration, normally to qualified institutional buyers. At December 31, 2019, these securities were valued at $2,752,102 or 8.38% of net assets.
c Variable rate security—rate shown is the interest rate in effect at period end.
d Security, or portion thereof, on loan. At December 31, 2019, the value of the fund’s securities on loan was $935,648 and the value of the collateral was $957,228, consisting of cash collateral of $114,200 and U.S. Government & Agency securities valued at $843,028.
e The Federal Housing Finance Agency (“FHFA”) placed the Federal Home Loan Mortgage Corporation and Federal National Mortgage Association into conservatorship with FHFA as the conservator. As such, the FHFA oversees the continuing affairs of these companies.
f Principal amount for accrual purposes is periodically adjusted based on changes in the Consumer Price Index.
g Purchased on a forward commitment basis.
h Held by a counterparty for open exchange traded derivative contracts.
i Security is a discount security. Income is recognized through the accretion of discount.
j Investment in affiliated issuer. The investment objective of this investment company is publicly available and can be found within the investment company’s prospectus.
18
| | |
Portfolio Summary (Unaudited)† | Value (%) |
Mortgage Securities | 44.6 |
Government | 28.4 |
Financial | 8.9 |
Consumer, Non-cyclical | 4.9 |
Asset Backed Securities | 4.5 |
Energy | 3.8 |
Communications | 3.6 |
Utilities | 3.5 |
Industrial | 2.2 |
Investment Companies | 2.0 |
Technology | 1.6 |
Consumer, Cyclical | .7 |
Basic Materials | .5 |
Insurance | .3 |
Beverages | .1 |
Options Purchased | .0 |
| | 109.6 |
† Based on net assets.
See notes to financial statements.
19
STATEMENT OF INVESTMENTS IN AFFILIATED ISSUERS
| | | | | | | |
Investment Companies | Value
12/31/18($) | Purchases($) | Sales($) | Value
12/31/19($) | Net
Assets(%) | Dividends/
Distributions($) |
Registered Investment Companies: | | | |
Dreyfus Institutional Preferred Government Plus Money Market Fund | 534,430 | 17,961,706 | 17,960,467 | 535,669 | 1.6 | 14,915 |
Investment of Cash Collateral for Securities Loaned; | | | |
Dreyfus Institutional Preferred Government Plus Money Market Fund | 34,650 | 2,659,495 | 2,579,945 | 114,200 | .4 | - |
Total | 569,080 | 20,621,201 | 20,540,412 | 649,869 | 2.0 | 14,915 |
See notes to financial statements.
20
STATEMENT OF FUTURES
December 31, 2019
| | | | | | | |
Description | Number of
Contracts | Expiration | Notional
Value ($) | Value ($) | Unrealized Appreciation (Depreciation) ($) | |
Futures Long | | |
U.S. Treasury 2 Year Notes | 12 | 3/31/2020 | 2,588,549 | 2,586,000 | (2,549) | |
U.S. Treasury 5 Year Notes | 2 | 3/31/2020 | 238,206 | 237,219 | (987) | |
U.S. Treasury Ultra Long Bond | 7 | 3/20/2020 | 1,308,136 | 1,271,594 | (36,542) | |
Futures Short | | |
Japanese 10 Year Bond | 1 | 3/13/2020 | 1,401,681a | 1,400,580 | 1,101 | |
Ultra 10 Year U.S. Treasury Notes | 6 | 3/20/2020 | 851,272 | 844,219 | 7,053 | |
Gross Unrealized Appreciation | | 8,154 | |
Gross Unrealized Depreciation | | (40,078) | |
a Notional amounts in foreign currency have been converted to USD using relevant foreign exchange rates.
See notes to financial statements.
21
STATEMENT OF OPTIONS WRITTEN
December 31, 2019
| | | | | | | |
Description/ Contracts/ Counterparties | Exercise Price | Expiration Date | Notional Amount | | Value ($) | |
Call Options: | | | | | | |
South African Rand,
Contracts 80,000, Morgan Stanley | 16 | 1/30/2020 | 80,000 | | (11) | |
Total Options Written
(premiums received $924) | | | | (11) | |
See notes to financial statements.
22
STATEMENT OF FORWARD FOREIGN CURRENCY EXCHANGE CONTRACTSDecember 31, 2019
| | | | | | |
Counterparty/ Purchased
Currency | Purchased Currency
Amounts | Currency
Sold | Sold
Currency
Amounts | Settlement Date | Unrealized Appreciation (Depreciation)($) |
Citigroup | | | |
Hong Kong Dollar | 860,000 | United States Dollar | 110,063 | 4/14/2020 | 222 |
United States Dollar | 39,907 | Chilean Peso | 30,000,000 | 1/14/2020 | 2 |
South Korean Won | 50,000,000 | United States Dollar | 42,486 | 1/14/2020 | 764 |
United States Dollar | 277,595 | Euro | 249,000 | 1/31/2020 | (2,246) |
Brazilian Real | 175,000 | United States Dollar | 41,608 | 2/4/2020 | 1,849 |
HSBC | | | |
Russian Ruble | 15,945,000 | United States Dollar | 247,816 | 1/14/2020 | 8,643 |
United States Dollar | 244,402 | Russian Ruble | 15,720,000 | 1/14/2020 | (8,438) |
J.P. Morgan Securities | | | |
United States Dollar | 110,426 | Hong Kong Dollar | 860,000 | 4/14/2020 | 141 |
United States Dollar | 124,659 | Hong Kong Dollar | 970,000 | 1/3/2020 | 184 |
United States Dollar | 280,652 | Russian Ruble | 18,015,000 | 1/14/2020 | (9,101) |
United States Dollar | 42,999 | South Korean Won | 50,000,000 | 1/14/2020 | (251) |
United States Dollar | 95,646 | Singapore Dollar | 130,000 | 1/14/2020 | (1,020) |
Merrill Lynch, Pierce, Fenner & Smith | | | |
Polish Zloty | 175,000 | United States Dollar | 45,503 | 1/14/2020 | 625 |
United States Dollar | 45,794 | Polish Zloty | 175,000 | 1/14/2020 | (334) |
Morgan Stanley | | | |
Chilean Peso | 30,000,000 | United States Dollar | 41,431 | 1/14/2020 | (1,526) |
Mexican Peso | 800,000 | United States Dollar | 40,996 | 1/14/2020 | 1,229 |
United States Dollar | 42,967 | Brazilian Real | 175,000 | 2/4/2020 | (490) |
Euro | 60,000 | United States Dollar | 66,645 | 1/31/2020 | 787 |
Indian Rupee | 2,800,000 | United States Dollar | 38,964 | 1/14/2020 | 210 |
United States Dollar | 39,337 | Indian Rupee | 2,800,000 | 1/14/2020 | 163 |
United States Dollar | 1,366,798 | Japanese Yen | 149,350,000 | 1/31/2020 | (10,070) |
23
STATEMENT OF FORWARD FOREIGN CURRENCY EXCHANGE CONTRACTS (continued)
| | | | | | |
Counterparty/ Purchased
Currency | Purchased Currency
Amounts | Currency
Sold | Sold
Currency
Amounts | Settlement Date | Unrealized Appreciation (Depreciation)($) |
UBS Securities | | | |
Hong Kong Dollar | 970,000 | United States Dollar | 124,098 | 1/3/2020 | 377 |
Euro | 50,000 | United States Dollar | 55,780 | 1/31/2020 | 413 |
United States Dollar | 42,151 | Mexican Peso | 800,000 | 1/14/2020 | (74) |
Gross Unrealized Appreciation | | | 15,609 |
Gross Unrealized Depreciation | | | (33,550) |
See notes to financial statements.
24
STATEMENT OF SWAP AGREEMENTS
December 31, 2019
| | | | | | |
Centrally Cleared Credit Default Swaps | |
| | | | | | |
Reference
Obligation | Maturity
Date | Notional
Amount ($)1 | Market
Value ($) | Upfront
Payments/
Receipts ($) | Unrealized Appreciation ($) |
Sold Contracts:2 | |
Markit CDX North America High Yield Index Series 33 Received Fixed Rate of 5.00 3 Month | 12/20/24 | 158,400 | 15,263 | 9,829 | 5,699 |
Markit CDX North America High Yield Index Series 33 Received Fixed Rate of 5.00 3 Month | 12/20/24 | 158,400 | 15,264 | 11,454 | 4,074 |
Gross Unrealized Appreciation | 9,773 |
1 The maximum potential amount the fund could be required to pay as a seller of credit protection or receive as a buyer of credit protection if a credit event occurs as defined under the terms of the swap agreement.
2 If the fund is a seller of protection and a credit event occurs, as defined under the terms of the swap agreement, the fund will either (i) pay to the buyer of protection an amount equal to the notional amount of the swap and take delivery of the reference obligation or (ii) pay a net settlement amount in the form of cash or securities equal to the notional amount of the swap less the recovery value of the reference obligation.
See notes to financial statements.
25
STATEMENT OF ASSETS AND LIABILITIES
December 31, 2019
| | | | | | | |
| | | | | | |
| | | Cost | | Value | |
Assets ($): | | | | |
Investments in securities—See Statement of Investments
(including securities on loan, valued at $935,648)—Note 1(c): | | | |
Unaffiliated issuers | 34,202,913 | | 35,322,640 | |
Affiliated issuers | | 649,869 | | 649,869 | |
Cash | | | | | 3,181 | |
Cash denominated in foreign currency | | | 20,253 | | 20,662 | |
Interest and securities lending income receivable | | 166,093 | |
Swap upfront payments—Note 4 | | 21,283 | |
Receivable for investment securities sold | | 19,647 | |
Unrealized appreciation on forward foreign
currency exchange contracts—Note 4 | | 15,609 | |
Receivable for shares of Beneficial Interest subscribed | | 5,306 | |
Receivable for swap variation margin—Note 4 | | 81 | |
Prepaid expenses | | | | | 1,168 | |
| | | | | 36,225,539 | |
Liabilities ($): | | | | |
Due to BNY Mellon Investment Adviser, Inc. and affiliates—Note 3(b) | | 13,203 | |
Payable for investment securities purchased | | 3,135,717 | |
Liability for securities on loan—Note 1(c) | | 114,200 | |
Unrealized depreciation on forward foreign
currency exchange contracts—Note 4 | | 33,550 | |
Payable for shares of Beneficial Interest redeemed | | 27,741 | |
Payable for futures variation margin—Note 4 | | 6,547 | |
Cash collateral payable to broker—Note 4 | | 6,029 | |
Trustees’ fees and expenses payable | | 77 | |
Outstanding options written, at value
(premiums received $924)—Note 4 | | 11 | |
Other accrued expenses | | | | | 62,283 | |
| | | | | 3,399,358 | |
Net Assets ($) | | | 32,826,181 | |
Composition of Net Assets ($): | | | | |
Paid-in capital | | | | | 32,489,785 | |
Total distributable earnings (loss) | | | | | 336,396 | |
Net Assets ($) | | | 32,826,181 | |
| | | | |
Net Asset Value Per Share | Initial Shares | Service Shares | |
Net Assets ($) | 29,349,508 | 3,476,673 | |
Shares Outstanding | 2,440,617 | 290,189 | |
Net Asset Value Per Share ($) | 12.03 | 11.98 | |
| | | |
See notes to financial statements. | | | |
26
STATEMENT OF OPERATIONS
Year Ended December 31, 2019
| | | | | | | |
| | | | | | |
| | | | | | |
Investment Income ($): | | | | |
Income: | | | | |
Interest | | | 1,020,371 | |
Dividends from affiliated issuers | | | 14,915 | |
Income from securities lending—Note 1(c) | | | 870 | |
Total Income | | | 1,036,156 | |
Expenses: | | | | |
Investment advisory fee—Note 3(a) | | | 224,282 | |
Professional fees | | | 85,712 | |
Chief Compliance Officer fees—Note 3(b) | | | 11,793 | |
Prospectus and shareholders’ reports | | | 8,481 | |
Distribution fees—Note 3(b) | | | 8,261 | |
Custodian fees—Note 3(b) | | | 5,908 | |
Trustees’ fees and expenses—Note 3(c) | | | 2,978 | |
Shareholder servicing costs—Note 3(b) | | | 585 | |
Loan commitment fees—Note 2 | | | 223 | |
Registration fees | | | 33 | |
Miscellaneous | | | 25,285 | |
Total Expenses | | | 373,541 | |
Less—reduction in expenses due to undertaking—Note 3(a) | | | (71,195) | |
Net Expenses | | | 302,346 | |
Investment Income—Net | | | 733,810 | |
Realized and Unrealized Gain (Loss) on Investments—Note 4 ($): | | |
Net realized gain (loss) on investments and foreign currency transactions | 383,496 | |
Net realized gain (loss) on options transactions | (32,801) | |
Net realized gain (loss) on futures | (16,685) | |
Net realized gain (loss) on swap agreements | (49,782) | |
Net realized gain (loss) on forward foreign currency exchange contracts | (22,365) | |
Net Realized Gain (Loss) | | | 261,863 | |
Net change in unrealized appreciation (depreciation) on investments
and foreign currency transactions | 1,684,522 | |
Net change in unrealized appreciation (depreciation) on
options transactions | 16,229 | |
Net change in unrealized appreciation (depreciation) on futures | (51,938) | |
Net change in unrealized appreciation (depreciation) on swap agreements | 9,773 | |
Net change in unrealized appreciation (depreciation) on
forward foreign currency exchange contracts | 32,989 | |
Net Change in Unrealized Appreciation (Depreciation) | | | 1,691,575 | |
Net Realized and Unrealized Gain (Loss) on Investments | | | 1,953,438 | |
Net Increase in Net Assets Resulting from Operations | | 2,687,248 | |
| | | | | | |
See notes to financial statements. | | | | | |
27
STATEMENT OF CHANGES IN NET ASSETS
| | | | | | | | | | |
| | | | Year Ended December 31, |
| | | | 2019 | | 2018 | |
Operations ($): | | | | | | | | |
Investment income—net | | | 733,810 | | | | 876,517 | |
Net realized gain (loss) on investments | | 261,863 | | | | (636,404) | |
Net change in unrealized appreciation
(depreciation) on investments | | 1,691,575 | | | | (1,258,673) | |
Net Increase (Decrease) in Net Assets
Resulting from Operations | 2,687,248 | | | | (1,018,560) | |
Distributions ($): | |
Distributions to shareholders: | | | | | | | | |
Initial Shares | | | (604,029) | | | | (950,428) | |
Service Shares | | | (55,029) | | | | (79,645) | |
Total Distributions | | | (659,058) | | | | (1,030,073) | |
Beneficial Interest Transactions ($): | |
Net proceeds from shares sold: | | | | | | | | |
Initial Shares | | | 1,798,322 | | | | 2,291,682 | |
Service Shares | | | 655,490 | | | | 314,608 | |
Distributions reinvested: | | | | | | | | |
Initial Shares | | | 604,029 | | | | 950,428 | |
Service Shares | | | 55,029 | | | | 79,645 | |
Cost of shares redeemed: | | | | | | | | |
Initial Shares | | | (7,503,957) | | | | (6,337,684) | |
Service Shares | | | (397,205) | | | | (585,297) | |
Increase (Decrease) in Net Assets
from Beneficial Interest Transactions | (4,788,292) | | | | (3,286,618) | |
Total Increase (Decrease) in Net Assets | (2,760,102) | | | | (5,335,251) | |
Net Assets ($): | |
Beginning of Period | | | 35,586,283 | | | | 40,921,534 | |
End of Period | | | 32,826,181 | | | | 35,586,283 | |
Capital Share Transactions (Shares): | |
Initial Shares | | | | | | | | |
Shares sold | | | 153,414 | | | | 199,820 | |
Shares issued for distributions reinvested | | | 51,555 | | | | 82,633 | |
Shares redeemed | | | (637,743) | | | | (551,354) | |
Net Increase (Decrease) in Shares Outstanding | (432,774) | | | | (268,901) | |
Service Shares | | | | | | | | |
Shares sold | | | 56,262 | | | | 27,330 | |
Shares issued for distributions reinvested | | | 4,704 | | | | 6,953 | |
Shares redeemed | | | (33,873) | | | | (51,392) | |
Net Increase (Decrease) in Shares Outstanding | 27,093 | | | | (17,109) | |
| | | | | | | | | |
See notes to financial statements. | | | | | | | | |
28
FINANCIAL HIGHLIGHTS
The following tables describe the performance for each share class for the fiscal periods indicated. All information (except portfolio turnover rate) reflects financial results for a single fund share. Total return shows how much your investment in the fund would have increased (or decreased) during each period, assuming you had reinvested all dividends and distributions. The fund’s total returns do not reflect expenses associated with variable annuity or insurance contracts. These figures have been derived from the fund’s financial statements.
| | | | | | | |
| | | |
| | | Year Ended December 31, |
Initial Shares | | 2019 | 2018 | 2017 | 2016 | 2015 |
Per Share Data ($): | | | | | | |
Net asset value, beginning of period | | 11.35 | 11.96 | 11.69 | 11.72 | 12.16 |
Investment Operations: | | | | | | |
Investment income—neta | | .25 | .27 | .23 | .20 | .23 |
Net realized and unrealized
gain (loss) on investments | | .66 | (.56) | .29 | (.02)b | (.43) |
Total from Investment Operations | | .91 | (.29) | .52 | .18 | (.20) |
Distributions: | | | | | | |
Dividends from
investment income—net | | (.23) | (.32) | (.25) | (.21) | (.24) |
Net asset value, end of period | | 12.03 | 11.35 | 11.96 | 11.69 | 11.72 |
Total Return (%) | | 8.06 | (2.55) | 4.50 | 1.52 | (1.65) |
Ratios/Supplemental Data (%): | | | | | | |
Ratio of total expenses
to average net assets | | 1.06 | 1.21 | .98 | .94 | .92 |
Ratio of net expenses
to average net assets | | .85 | 1.21 | .98 | .94 | .92 |
Ratio of net investment income
to average net assets | | 2.15 | 2.36 | 1.97 | 1.65 | 1.91 |
Portfolio Turnover Ratec | | 124.37 | 109.04 | 161.74 | 227.98 | 314.50 |
Net Assets, end of period ($ x 1,000) | | 29,350 | 32,611 | 37,584 | 39,133 | 44,057 |
a Based on average shares outstanding.
b In addition to net realized and unrealized gains on investments, this amount includes a decrease in net asset value per share resulting from the timing of issuances and redemptions of shares in relation to fluctuating market values for the portfolio investments.
c The portfolio turnover rates excluding mortgage dollar roll transactions for the periods ended December 31, 2019, 2018, 2017, 2016 and 2015 were 99.04%, 98.22%, 106.51%, 172.50% and 120.54%, respectively.
See notes to financial statements.
29
FINANCIAL HIGHLIGHTS (continued)
| | | | | | | |
| | | |
| | | Year Ended December 31, |
Service Shares | | 2019 | 2018 | 2017 | 2016 | 2015 |
Per Share Data ($): | | | | | | |
Net asset value, beginning of period | | 11.31 | 11.91 | 11.64 | 11.67 | 12.11 |
Investment Operations: | | | | | | |
Investment income—neta | | .22 | .22 | .20 | .17 | .20 |
Net realized and unrealized
gain (loss) on investments | | .65 | (.53) | .29 | (.02)b | (.42) |
Total from Investment Operations | | .87 | (.31) | .49 | .15 | (.22) |
Distributions: | | | | | | |
Dividends from
investment income—net | | (.20) | (.29) | (.22) | (.18) | (.22) |
Net asset value, end of period | | 11.98 | 11.31 | 11.91 | 11.64 | 11.67 |
Total Return (%) | | 7.91 | (2.73) | 4.25 | 1.27 | (1.89) |
Ratios/Supplemental Data (%): | | | | | | |
Ratio of total expenses
to average net assets | | 1.31 | 1.46 | 1.23 | 1.19 | 1.17 |
Ratio of net expenses
to average net assets | | 1.10 | 1.46 | 1.23 | 1.19 | 1.17 |
Ratio of net investment income
to average net assets | | 1.87 | 1.94 | 1.64 | 1.40 | 1.66 |
Portfolio Turnover Ratec | | 124.37 | 109.04 | 161.74 | 227.98 | 314.50 |
Net Assets, end of period ($ x 1,000) | | 3,477 | 2,975 | 3,338 | 12,537 | 14,314 |
a Based on average shares outstanding.
b In addition to net realized and unrealized gains on investments, this amount includes a decrease in net asset value per share resulting from the timing of issuances and redemptions of shares in relation to fluctuating market values for the portfolio investments.
c The portfolio turnover rates excluding mortgage dollar roll transactions for the periods ended December 31, 2019, 2018, 2017, 2016 and 2015 were 99.04%, 98.22%, 106.51%, 172.50% and 120.54%, respectively.
See notes to financial statements.
30
NOTES TO FINANCIAL STATEMENTS
NOTE 1—Significant Accounting Policies:
Quality Bond Portfolio (the “fund”) is a separate diversified series of BNY Mellon Variable Investment Fund (the “Company”), which is registered under the Investment Company Act of 1940, as amended (the “Act”), as an open-end management investment company and operates as a series company currently offering seven series, including the fund. The fund is only offered to separate accounts established by insurance companies to fund variable annuity contracts and variable life insurance policies. The fund’s investment objective is to seek to maximize total return, consisting of capital appreciation and current income. BNY Mellon Investment Adviser, Inc. (the “Adviser”), a wholly-owned subsidiary of The Bank of New York Mellon Corporation (“BNY Mellon”), serves as the fund’s investment adviser.
Effective June 3, 2019, the Company changed its name from Dreyfus Variable Investment Fund to BNY Mellon Variable Investment Fund. In addition, The Dreyfus Corporation, the fund’s investment adviser, changed its name to “BNY Mellon Investment Adviser, Inc.”, MBSC Securities Corporation, the fund’s distributor, changed its name to “BNY Mellon Securities Corporation” and Dreyfus Transfer, Inc., the fund’s transfer agent, changed its name to “BNY Mellon Transfer, Inc.”
BNY Mellon Securities Corporation (the “Distributor”), a wholly-owned subsidiary of the Adviser, is the distributor of the fund’s shares, which are sold without a sales charge. The fund is authorized to issue an unlimited number of $.001 par value shares of Beneficial Interest in each of the following classes of shares: Initial and Service. Each class of shares has identical rights and privileges, except with respect to the Distribution Plan, and the expenses borne by each class, the allocation of certain transfer agency costs and certain voting rights. Income, expenses (other than expenses attributable to a specific class), and realized and unrealized gains or losses on investments are allocated to each class of shares based on its relative net assets.
The Company accounts separately for the assets, liabilities and operations of each series. Expenses directly attributable to each series are charged to that series’ operations; expenses which are applicable to all series are allocated among them on a pro rata basis.
The Financial Accounting Standards Board (“FASB”) Accounting Standards Codification (“ASC”) is the exclusive reference of authoritative U.S. generally accepted accounting principles (“GAAP”) recognized by the FASB to be applied by nongovernmental entities. Rules and interpretive releases of the Securities and Exchange Commission (“SEC”) under
31
NOTES TO FINANCIAL STATEMENTS(continued)
authority of federal laws are also sources of authoritative GAAP for SEC registrants. The fund is an investment company and applies the accounting and reporting guidance of the FASB ASC Topic 946 Financial Services-Investment Companies. The fund’s financial statements are prepared in accordance with GAAP, which may require the use of management estimates and assumptions. Actual results could differ from those estimates.
The Companyenters into contracts that contain a variety of indemnifications. The fund’s maximum exposure under these arrangements is unknown. The fund does not anticipate recognizing any loss related to these arrangements.
(a) Portfolio valuation: The fair value of a financial instrument is the amount that would be received to sell an asset or paid to transfer a liability in an orderly transaction between market participants at the measurement date (i.e., the exit price). GAAP establishes a fair value hierarchy that prioritizes the inputs of valuation techniques used to measure fair value. This hierarchy gives the highest priority to unadjusted quoted prices in active markets for identical assets or liabilities (Level 1 measurements) and the lowest priority to unobservable inputs (Level 3 measurements).
Additionally, GAAP provides guidance on determining whether the volume and activity in a market has decreased significantly and whether such a decrease in activity results in transactions that are not orderly. GAAP requires enhanced disclosures around valuation inputs and techniques used during annual and interim periods.
Various inputs are used in determining the value of the fund’s investments relating to fair value measurements. These inputs are summarized in the three broad levels listed below:
Level 1—unadjusted quoted prices in active markets for identical investments.
Level 2—other significant observable inputs (including quoted prices for similar investments, interest rates, prepayment speeds, credit risk, etc.).
Level 3—significant unobservable inputs (including the fund’s own assumptions in determining the fair value of investments).
The inputs or methodology used for valuing securities are not necessarily an indication of the risk associated with investing in those securities.
32
Changes in valuation techniques may result in transfers in or out of an assigned level within the disclosure hierarchy. Valuation techniques used to value the fund’s investments are as follows:
Registered investment companies that are not traded on an exchange are valued at their net asset value and are generally categorized within Level 1 of the fair value hierarchy.
Investments in debt securities, excluding short-term investments (other than U.S. Treasury Bills), futures, options and forward foreign currency exchange contracts (“forward contracts”) are valued each business day by one or more independent pricing services (each, a “Service”) approved by the Company’s Board of Trustees (the “Board”).Investments for which quoted bid prices are readily available and are representative of the bid side of the market in the judgment of a Service are valued at the mean between the quoted bid prices (as obtained by the Service from dealers in such securities) and asked prices (as calculated by a Service based upon its evaluation of the market for such securities). Securities are valued as determined by a Service, based on methods which include consideration of the following: yields or prices of securities of comparable quality, coupon, maturity and type; indications as to values from dealers; and general market conditions. These securities are generally categorized within Level 2 of the fair value hierarchy.
U.S. Treasury Bills are valued at the mean price between quoted bid prices and asked prices by the Service. These securities are generally categorized within Level 2 of the fair value hierarchy.
Each Service and independent valuation firm is engaged under the general oversight of the Board.
When market quotations or official closing prices are not readily available, or are determined not to accurately reflect fair value, such as when the value of a security has been significantly affected by events after the close of the exchange or market on which the security is principally traded (for example, a foreign exchange or market), but before the fund calculates its net asset value, the fund may value these investments at fair value as determined in accordance with the procedures approved by the Board. Certain factors may be considered when fair valuing investments such as: fundamental analytical data, the nature and duration of restrictions on disposition, an evaluation of the forces that influence the market in which the securities are purchased and sold, and public trading in similar securities of the issuer or comparable issuers. These securities are either categorized within Level 2 or 3 of the fair value hierarchy depending on the relevant inputs used.
33
NOTES TO FINANCIAL STATEMENTS(continued)
For restricted securities where observable inputs are limited, assumptions about market activity and risk are used and such securities are generally categorized within Level 3 of the fair value hierarchy.
Investments denominated in foreign currencies are translated to U.S. dollars at the prevailing rates of exchange.
Futures and options, which are traded on an exchange, are valued at the last sales price on the securities exchange on which such securities are primarily traded or at the last sales price on the national securities market on each business day and are generally categorized within Level 1 of the fair value hierarchy. Options traded over-the-counter (“OTC”) are valued at the mean between the bid and asked price and are generally categorized within Level 2 of the fair value hierarchy. Investments in swap agreements are valued each business day by the Service. Swaps are valued by the Service by using a swap pricing model which incorporates among otherfactors, default probabilities, recovery rates, credit curves of the underlying issuer and swap spreads on interest rates and are generally categorized within Level 2 of the fair value hierarchy. Forward contracts are valued at the forward rate and are generally categorized within Level 2 of the fair value hierarchy.
The following is a summary of the inputs used as of December 31, 2019in valuing the fund’s investments:
| | | | | |
| | Level 1 -Unadjusted Quoted Prices | Level 2 - Other Significant Observable Inputs | Level 3 -Significant Unobservable Inputs | Total |
Assets ($) |
Investments in Securities:† | | | |
Asset-Backed | - | 1,475,979 | - | 1,475,979 |
Collateralized Municipal-
Backed Securities | - | 792,821 | - | 792,821 |
Commercial
Mortgage-Backed | - | 1,740,096 | - | 1,740,096 |
Corporate Bonds | - | 9,931,218 | - | 9,931,218 |
Foreign Government | - | 1,820,049 | - | 1,820,049 |
Investment Companies | 649,869 | - | - | 649,869 |
Municipal Securities | - | 1,327,119 | - | 1,327,119 |
U.S. Government
Agencies
Mortgage-Backed | - | 12,111,562 | - | 12,111,562 |
U.S. Treasury Securities | - | 6,120,494 | - | 6,120,494 |
Other Financial Instruments: |
Futures†† | 8,154 | - | - | 8,154 |
Forward Foreign
Currency Exchange
Contracts†† | - | 15,609 | - | 15,609 |
34
| | | | | |
| | Level 1 -Unadjusted Quoted Prices | Level 2 - Other Significant Observable Inputs | Level 3 -Significant Unobservable Inputs | Total |
Assets ($)(continued) | | | | |
Options Purchased | - | 3,302 | - | 3,302 |
Swaps Agreements†† | - | 9,773 | - | 9,773 |
Liabilities ($) |
Other Financial Instruments: |
Futures†† | (40,078) | - | - | (40,078) |
Forward Foreign
Currency Exchange
Contracts†† | - | (33,550) | - | (33,550) |
Options Written | - | (11) | - | (11) |
† See Statement of Investments for additional detailed categorizations, if any.
†† Amount shown represents unrealized appreciation (depreciation) at period end, but only variation margin on exchanged traded and centrally cleared derivatives, if any, are reported in the Statement of Assets and Liabilities.
(b) Foreign currency transactions: The fund does not isolate that portion of the results of operations resulting from changes in foreign exchange rates on investments from the fluctuations arising from changes in the market prices of securities held. Such fluctuations are included with the net realized and unrealized gain or loss on investments.
Net realized foreign exchange gains or losses arise from sales of foreign currencies, currency gains or losses realized on securities transactions between trade and settlement date, and the difference between the amounts of dividends, interest and foreign withholding taxes recorded on the fund’s books and the U.S. dollar equivalent of the amounts actually received or paid. Net unrealized foreign exchange gains and losses arise from changes in the value of assets and liabilities other than investments resulting from changes in exchange rates. Foreign currency gains and losses on foreign currency transactions are also included with net realized and unrealized gain or loss on investments.
(c)Securities transactions and investment income: Securities transactions are recorded on a trade date basis. Realized gains and losses from securities transactions are recorded on the identified cost basis. Dividend income is recognized on the ex-dividend date and interest income, including, where applicable, accretion of discount and amortization of premium on investments, is recognized on the accrual basis.
Pursuant to a securities lending agreement with The Bank of New York Mellon, a subsidiary of BNY Mellon and an affiliate of the Adviser, the fund may lend securities to qualified institutions. It is the fund’s policy that, at origination, all loans are secured by collateral of at least 102% of
35
NOTES TO FINANCIAL STATEMENTS(continued)
the value of U.S. securities loaned and 105% of the value of foreign securities loaned. Collateral equivalent to at least 100% of the market value of securities on loan is maintained at all times. Collateral is either in the form of cash, which can be invested in certain money market mutual funds managed by the Adviser, or U.S. Government and Agency securities. The fund is entitled to receive all dividends, interest and distributions on securities loaned, in addition to income earned as a result of the lending transaction. Should a borrower fail to return the securities in a timely manner, The Bank of New York Mellon is required to replace the securities for the benefit of the fund or credit the fund with the market value of the unreturned securities and is subrogated to the fund’s rights against the borrower and the collateral. Additionally, the contractual maturity of security lending transactions are on an overnight and continuous basis. During the period ended December 31, 2019, The Bank of New York Mellon earned $163 from the lending of the fund’s portfolio securities, pursuant to the securities lending agreement.
(d) Affiliated issuers: Investments in other investment companies advised by the Adviser are considered “affiliated” under the Act.
(e) Dividends and distributions to shareholders: Dividends and distributions are recorded on the ex-dividend date. Dividends from investment income-net are normally declared and paid on a monthly basis. Dividends from net realized capital gains, if any, are normally declared and paid annually, but the fund may make distributions on a more frequent basis to comply with the distribution requirements of the Internal Revenue Code of 1986, as amended (the “Code”). To the extent that net realized capital gains can be offset by capital loss carryovers, it is the policy of the fund not to distribute such gains. Income and capital gain distributions are determined in accordance with income tax regulations, which may differ from GAAP.
On December 31, 2019, the Board declared a cash dividend of $.024 and $.021 per share for the Initial shares and Service shares, respectively, from undistributed investment income-net payable on January 2, 2020 (ex-dividend date) to shareholders of record as of the close of business on December 31, 2019.
(f) Federal income taxes: It is the policy of the fund to continue to qualify as a regulated investment company, if such qualification is in the best interests of its shareholders, by complying with the applicable provisions of the Code, and to make distributions of taxable income and net realized capital gain sufficient to relieve it from substantially all federal income and excise taxes.
36
As of and during the period ended December 31, 2019, the fund did not have any liabilities for any uncertain tax positions. The fund recognizes interest and penalties, if any, related to uncertain tax positions as income tax expense in the Statement of Operations. During the period ended December 31, 2019, the fund did not incur any interest or penalties.
Each tax year in the four-year period ended December 31, 2019 remains subject to examination by the Internal Revenue Service and state taxing authorities.
At December 31, 2019, the components of accumulated earnings on a tax basis were as follows: undistributed ordinary income $120,184, accumulated capital and other losses $853,304 and unrealized appreciation $1,069,516.
The fund is permitted to carry forward capital losses for an unlimited period. Furthermore, capital loss carryovers retain their character as either short-term or long-term capital losses.
The accumulated capital loss carryover is available for federal income tax purposes to be applied against future netrealized capital gains, if any, realized subsequent to December 31, 2019. The fund has $242,104 of short-term losses and $562,543 of long-term capital losses which can be carried forward for an unlimited period.
The tax character of distributions paid to shareholders during the fiscal periods ended December 31, 2019 and December 31, 2018 were as follows: ordinary income $659,058 and $1,030,073, respectively.
(g) New Accounting Pronouncements: Effective June 1, 2019, the fund adopted Accounting Standards Update 2017-08, Receivables—Nonrefundable Fees and Other Costs (Subtopic 310-20): Premium Amortization On Purchased Callable Debt Securities (“ASU 2017-08”). The update shortens the amortization period for the premium on certain purchased callable debt securities to the earliest call date.
Also effective June 1, 2019, the fund adopted Accounting Standards Update 2018-13, Fair Value Measurement (Topic 820): Disclosure Framework—Changes to the Disclosure Requirements for Fair Value Measurement (“ASU 2018-13”). The update provides guidance that modifies certain disclosure requirements for fair value measurements. The adoption of ASU 2017-08 and ASU 2018-13 had no impact on the operations of the fund for the period ended December 31, 2019.
37
NOTES TO FINANCIAL STATEMENTS(continued)
NOTE 2—Bank Lines of Credit:
The fund participates with other long-term open-end funds managed by the Adviser in a $1.030 billion unsecured credit facility led by Citibank, N.A. (the “Citibank Credit Facility”) and a $300 million unsecured credit facility provided by The Bank of New York Mellon (the “BNYM Credit Facility”), each to be utilized primarily for temporary or emergency purposes, including the financing of redemptions (each, a “Facility”). The Citibank Credit Facility is available in two tranches: (i) Tranche A is in an amount equal to $830 million and is available to all long-term open-ended funds, including the fund, and (ii) Tranche B is in amount equal to $200 million and is available only to BNY Mellon Floating Rate Income Fund, a series of BNY Mellon Investment Funds IV, Inc. In connection therewith, the fund has agreed to pay its pro rata portion of commitment fees for Tranche A of the Citibank Credit Facility and the BNYM Credit Facility. Interest is charged to the fund based on rates determined pursuant to the terms of the respective Facility at the time of borrowing. During the period ended December 31, 2019, the fund did not borrow under the Facilities.
NOTE 3—Investment Advisory Fee and Other Transactions with Affiliates:
(a)Pursuant to an investment advisory agreement with the Adviser, the investment advisory fee is computed at the annual rate of .65% of the value of the fund’s average daily net assets and is payable monthly. The Adviser had contractually agreed, from April 30, 2019through August 7, 2019, to waive receipt of its fees and/or assume the direct expenses of the fund, so that the expenses of none of the classes (excluding Rule 12b-1 Distribution Plan fees, taxes, interest expense, brokerage commissions, commitment fees on borrowings and extraordinary expenses) exceeded 1.00% of the value of the fund’s average daily net assets. The Adviser has also contractually agreed, from August 8, 2019 through May 1, 2020, to waive receipt of its fees and/or assume the direct expenses of the fund, so that the expenses of none of the classes (excluding certain expenses as described above) exceed .765% of the value of the fund’s average daily net assets. On or after May 1, 2020, the Adviser may terminate this expense limitation agreement at any time. The reduction in expenses, pursuant to the undertaking, amounted to $71,195 during the period ended December 31, 2019.
(b)Under the Distribution Plan adopted pursuant to Rule 12b-1 under the Act, Service shares pay the Distributor for distributing its shares, for servicing and/or maintaining Service shares’ shareholder accounts and for advertising and marketing for Service shares. The Distribution Plan provides for payments to be made at an annual rate of .25% of the value of
38
the Service shares’ average daily net assets. The Distributor may make payments to Participating Insurance Companies and to brokers and dealers acting as principal underwriter for their variable insurance products. The fees payable under the Distribution Plan are payable without regard to actual expenses incurred. During the period ended December 31, 2019,Service shares were charged $8,261 pursuant to the Distribution Plan.
The fund has an arrangement with the transfer agent whereby the fund may receive earnings credits when positive cash balances are maintained, which are used to offset transfer agency fees. The fund had an arrangement with the custodian to receive earnings credits when positive cash balances were maintained, which were used to offset custody fees. Effective February 1, 2019, the arrangement with the custodian changed whereby the fund will no longer receive earnings credits to offset its custody fees and will receive interest income or overdraft fees going forward. For financial reporting purposes, the fund includes net earnings credits, if any, as an expense offset in the Statement of Operations.
The fund compensates BNY Mellon Transfer, Inc., a wholly-owned subsidiary of the Adviser, under a transfer agency agreement for providing transfer agency and cash management services for the fund. The majority of transfer agency fees are comprised of amounts paid on a per account basis, while cash management fees are related to fund subscriptions and redemptions. During the period ended December 31, 2019, the fund was charged $494 for transfer agency services. These fees are included in Shareholder servicing costs in the Statement of Operations.
The fund compensates The Bank of New York Mellon under a custody agreement for providing custodial services for the fund. These fees are determined based on net assets, geographic region and transaction activity. During the period ended December 31, 2019, the fund was charged $5,908 pursuant to the custody agreement.
During the period ended December 31, 2019, the fund was charged $11,793 for services performed by the Chief Compliance Officer and his staff. These fees are included in Chief Compliance Officer fees in the Statement of Operations.
The components of “Due to BNY Mellon Investment Adviser, Inc. and affiliates” in the Statement of Assets and Liabilities consist of: Investment advisory fees of $18,310, Distribution Plan fees of $736, custodian fees of $2,400, Chief Compliance Officer fees of $3,261 and transfer agency fees of $101, which are offset against an expense reimbursement currently in effect in the amount of $11,605.
39
NOTES TO FINANCIAL STATEMENTS(continued)
(c) Each Board member also serves as a Board member of other funds in the BNY Mellon Family of Funds complex. Annual retainer fees and attendance fees are allocated to each fund based on net assets.
NOTE 4—Securities Transactions:
The aggregate amount of purchases and sales (including paydowns) of investment securities, excluding short-term securities, forward contracts, futures, options transactions and swap agreements, during the period ended December 31, 2019, amounted to $42,106,367 and $47,717,906, respectively, of which $8,574,430 in purchases and $8,571,266 in sales were from mortgage dollar roll transactions.
Mortgage Dollar Rolls:A mortgage dollar roll transaction involves a sale by the fund of mortgage related securities that it holds with an agreement by the fund to repurchase similar securities at an agreed upon price and date. The securities purchased will bear the same interest rate as those sold, but generally will be collateralized by pools of mortgages with different prepayment histories than those securities sold. The fund accounts for mortgage dollar rolls as purchases and sales transactions. The fund executes mortgage dollar rolls entirely in the To-Be-Announced (“TBA”) market.
Derivatives: A derivative is a financial instrument whose performance is derived from the performance of another asset. The fund enters into International Swaps and Derivatives Association, Inc. Master Agreements or similar agreements (collectively, “Master Agreements”) with its OTC derivative contract counterparties in order to, among other things, reduce its credit risk to counterparties. Master Agreements include provisions for general obligations, representations, collateral and events of default or termination. Under a Master Agreement, the fund may offset with the counterparty certain derivative financial instruments’ payables and/or receivables with collateral held and/or posted and create one single net payment in the event of default or termination.
Each type of derivative instrument that was held by the fund during the period ended December 31, 2019 is discussed below.
Futures:In the normal course of pursuing its investment objective, the fund is exposed to market risk, including interest rate risk,as a result of changes in value of underlying financial instruments. The fund invests in futures in order to manage its exposure to or protect against changes in the market. A futures contract represents a commitment for the future purchase or a sale of an asset at a specified date. Upon entering into such contracts, these investments require initial margin deposits with a counterparty, which consist of cash or cash equivalents. The amount of
40
these deposits is determined by the exchange or Board of Trade on which the contract is traded and is subject to change. Accordingly, variation margin payments are received or made to reflect daily unrealized gains or losses which are recorded in the Statement of Operations. When the contracts are closed, the fund recognizes a realized gain or loss which is reflected in the Statement of Operations. There is minimal counterparty credit risk to the fund with futures since they are exchange traded, and the exchange guarantees the futures against default. Futures open at December 31, 2019 are set forth in the Statement of Futures.
Options Transactions: The fund purchases and writes (sells) put and call options to hedge against changes in the values of foreign currencies or as a substitute for an investment. The fund is subject to market risk and currency risk in the course of pursuing its investment objectives through its investments in options contracts. A call option gives the purchaser of the option the right (but not the obligation) to buy, and obligates the writer to sell, the underlying financial instrument at the exercise price at any time during the option period, or at a specified date. Conversely, a put option gives the purchaser of the option the right (but not the obligation) to sell, and obligates the writer to buy the underlying financial instrument at the exercise price at any time during the option period, or at a specified date.
As a writer of call options, the fund receives a premium at the outset and then bears the market risk of unfavorable changes in the price of the financial instrument underlying the option. Generally, the fund realizes a gain, to the extent of the premium, if the price of the underlying financial instrument decreases between the date the option is written and the date on which the option is terminated. Generally, the fund incurs a loss if the price of the financial instrument increases between those dates.The maximum payout for those contracts is limited to the number of call option contracts written and the related strike prices, respectively.
As a writer of put options, the fund receives a premium at the outset and then bears the market risk of unfavorable changes in the price of the financial instrument underlying the option. Generally, the fund realizes a gain, to the extent of the premium, if the price of the underlying financial instrument increases between the date the option is written and the date on which the option is terminated. Generally, the fund incurs a loss if the price of the financial instrument decreases between those dates. The maximum payout for those contracts is limited to the number of put option contracts written and the related strike prices, respectively.
As a writer of an option, the fund has no control over whether the underlying financial instrument may be sold (call) or purchased (put) and as a result bears the market risk of an unfavorable change in the price of the
41
NOTES TO FINANCIAL STATEMENTS(continued)
financial instrument underlying the written option. There is a risk of loss from a change in value of such options which may exceed the related premiums received. This risk is mitigated by Master Agreements between the fund and the counterparty and the posting of collateral, if any, by the counterparty to the fund to cover the fund’s exposure to the counterparty. The Statement of Operations reflects any unrealized gains or losses which occurred during the period as well as any realized gains or losses which occurred upon the expiration or closing of the option transaction.Options written open at December 31, 2019 are set forth in the Statement of Options Written.
Forward Foreign Currency Exchange Contracts: The fund enters into forward contracts in order to hedge its exposure to changes in foreign currency exchange rates on its foreign portfolio holdings, to settle foreign currency transactions or as a part of its investment strategy. When executing forward contracts, the fund is obligated to buy or sell a foreign currency at a specified rate on a certain date in the future. With respect to sales of forward contracts, the fund incurs a loss if the value of the contract increases between the date the forward contract is opened and the date the forward contract is closed. The fund realizes a gain if the value of the contract decreases between those dates. With respect to purchases of forward contracts, the fund incurs a loss if the value of the contract decreases between the date the forward contract is opened and the date the forward contract is closed. The fund realizes a gain if the value of the contract increases between those dates. Any realized or unrealized gains or losses which occurred during the period are reflected in the Statement of Operations. The fund is exposed to foreign currency risk as a result of changes in value of underlying financial instruments. The fund is also exposed to credit risk associated with counterparty nonperformance on these forward contracts, which is generally limited to the unrealized gain on each open contract. This risk may be mitigated by Master Agreements, if any, between the fund and the counterparty and the posting of collateral, if any, by the counterparty to the fund to cover the fund’s exposure to the counterparty. Forward contracts open at December 31, 2019 are set forth in the Statement of Forward Foreign Currency Exchange Contracts.
Swap Agreements:The fund enters into swap agreements to exchange the interest rate on, or return generated by, one nominal instrument for the return generated by another nominal instrument. Swap agreements are privately negotiated in the OTC market or centrally cleared. The fund enters into these agreements to hedge certain market or interest rate risks, to manage the interest rate sensitivity (sometimes called duration) of fixed income securities, to provide a substitute for purchasing or selling particular securities or to increase potential returns.
42
For OTC swaps, the fund accrues for interim payments on a daily basis, with the net amount recorded within unrealized appreciation (depreciation) on swap agreements in the Statement of Assets and Liabilities. Once the interim payments are settled in cash, the net amount is recorded as a realized gain (loss) on swaps, in addition to realized gain (loss) recorded upon the termination of swap agreements in the Statement of Operations. Upfront payments made and/or received by the fund, are recorded as an asset and/or liability in the Statement of Assets and Liabilities and are recorded as a realized gain or loss ratably over the agreement’s term/event with the exception of forward starting interest rate swaps which are recorded as realized gains or losses on the termination date.
Upon entering into centrally cleared swap agreements, an initial margin deposit is required with a counterparty, which consists of cash or cash equivalents. The amount of these deposits is determined by the exchange on which the agreement is traded and is subject to change. The change in valuation of centrally cleared swaps is recorded as a receivable or payable for variation margin in the Statement of Assets and Liabilities. Payments received from (paid to) the counterparty, including upon termination, are recorded as realized gain (loss) in the Statement of Operations.
Fluctuations in the value of swap agreements are recorded for financial statement purposes as unrealized appreciation or depreciation on swap agreements.
Interest Rate Swaps: Interest rate swaps involve the exchange of commitments to pay and receive interest based on a notional principal amount. The fund may elect to pay a fixed rate and receive a floating rate, or receive a fixed rate and pay a floating rate on a notional principal amount. The net interest received or paid on interest rate swap agreements is included within realized gain (loss) on swap agreements in the Statement of Operations. Interest rate swap agreements are subject to general market risk, liquidity risk, counterparty risk and interest rate risk. At December 31, 2019, there were no outstanding interest rate swaps.
Credit Default Swaps: Credit default swaps involve commitments to pay a fixed interest rate in exchange for payment if a credit event affecting a third party (the referenced obligation or index) occurs. Credit events may include a failure to pay interest or principal, bankruptcy, or restructuring. The fund enters into these agreements to manage its exposure to the market or certain sectors of the market, to reduce its risk exposure to defaults of corporate and sovereign issuers, or to create exposure to corporate or sovereign issuers to which it is not otherwise exposed. For those credit default swaps in which the fund is paying a fixed rate, the fund is buying credit protection on the instrument. In the event of a credit
43
NOTES TO FINANCIAL STATEMENTS(continued)
event, the fund would receive the full notional amount for the reference obligation. For those credit default swaps in which the fund is receiving a fixed rate, the fund is selling credit protection on the underlying instrument. The maximum payouts for these agreements are limited to the notional amount of each swap. Credit default swaps may involve greater risks than if the fund had invested in the reference obligation directly and are subject to general market risk, liquidity risk, counterparty risk and credit risk. This risk may be mitigated by Master Agreements, if any, between the fund and the counterparty and the posting of collateral, if any, by the counterparty to the fund to cover the fund’s exposure to the counterparty. Credit default swaps open at December 31, 2019 are set forth in the Statement of Swap Agreements.
The maximum potential amount of future payments (undiscounted) that a fund as a seller of protection could be required to make under a credit default swap agreement would be an amount equal to the notional amount of the agreement which may exceed the amount of unrealized appreciation or depreciation reflected in the Statement of Assets and Liabilities. Notional amounts of all credit default swap agreements are disclosed in the Statement of Swap Agreements, which summarizes open credit default swaps entered into by the fund. These potential amounts would be partially offset by any recovery values of the respective referenced obligations, underlying securities comprising the referenced index, upfront payments received upon entering into the agreement, or net amounts received from the settlement of buy protection credit default swap agreements entered into by the fund for the same referenced entity or entities. Credit default swaps open at December 31, 2019 are set forth in the Statement of Swap Agreements.
GAAP requires disclosure for (i) the nature and terms of the credit derivative, reasons for entering into the credit derivative, the events or circumstances that would require the seller to perform under the credit derivative, and the current status of the payment/performance risk of the credit derivative, (ii) the maximum potential amount of future payments (undiscounted) the seller could be required to make under the credit derivative, (iii) the fair value of the credit derivative, and (iv) the nature of any recourse provisions and assets held either as collateral or by third parties. All required disclosures have been made and are incorporated within the current period as part of the Notes to the Statement of Investments and disclosures within this Note.
The following tables show the fund’s exposure to different types of market risk as it relates to the Statement of Assets and Liabilities and the Statement of Operations, respectively.
44
Fair value of derivative instruments as of December 31, 2019 is shown below:
| | | | | | | | |
| | Derivative
Assets ($) | | | | Derivative
Liabilities ($) | |
Interest rate risk | 8,154 | 1 | Interest rate risk | (40,078) | 1 |
Foreign exchange risk | 18,911 | 2,3 | Foreign exchange risk | (33,561) | 3,4 |
Credit risk | 9,773 | 5 | Credit risk | - | |
Gross fair value of
derivative contracts | 36,838 | | | | (73,639) | |
| | | | | | |
Statement of Assets and Liabilities location: | |
1 Includes cumulative appreciation (depreciation) on futures as reported in the Statement of Futures, but only the unpaid variation margin is reported in the Statement of Assets and Liabilities. |
2 Options purchased are included in Investments in securities—Unaffiliated issuers, at value. |
3 Unrealized appreciation (depreciation) on forward foreign currency exchange contracts. |
4 Outstanding options written, at value. | |
5 Includes cumulative appreciation (depreciation) on swap agreements as reported in the Statement of Swap Agreements. Unrealized appreciation (depreciation) on OTC swap agreements and only unpaid variation margin on cleared swap agreements, are reported in the Statement of Assets and Liabilities. |
The effect of derivative instruments in the Statement of Operations during the period ended December 31, 2019 is shown below:
| | | | | | | | | | | | |
Amount of realized gain (loss) on derivatives recognized in income ($) | |
Underlying
risk | Futures | 1 | Options
Transactions | 2 | Forward
Contracts | 3 | Swap
Agreements | 4 | Total | |
Interest rate | (16,685) | | - | | - | | (38,373) | | (55,058) | |
Foreign
exchange | - | | (32,801) | | (22,365) | | - | | (55,166) | |
Credit | - | | - | | - | | (11,409) | | (11,409) | |
Total | (16,685) | | (32,801) | | (22,365) | | (49,782) | | (121,633) | |
| | | | | | | | | | |
Net change in unrealized appreciation (depreciation)
on derivatives recognized in income ($) | |
Underlying
risk | Futures | 5 | Options
Transactions | 6 | Forward
Contracts | 7 | Swap
Agreements | 8 | Total | |
Interest rate | (51,938) | | - | | - | | - | | (51,938) | |
Foreign
exchange | - | | 16,229 | | 32,989 | | - | | 49,218 | |
Credit | - | | - | | - | | 9,773 | | 9,773 | |
Total | (51,938) | | 16,229 | | 32,989 | | 9,773 | | 7,053 | |
| | | | | | | | | | | |
Statement of Operations location: | |
1 Net realized gain (loss) on futures. | | |
2 Net realized gain (loss) on options transactions. |
3 Net realized gain (loss) on forward foreign currency exchange contracts. | | |
4 Net realized gain (loss) on swap agreements. | | |
5 Net change in unrealized appreciation (depreciation) on futures. | | |
6 Net change in unrealized appreciation (depreciation) on options transactions. | | |
7 Net change in unrealized appreciation (depreciation) on forward foreign currency exchange contracts. | |
8 Net change in unrealized appreciation (depreciation) on swap agreements. | | |
45
NOTES TO FINANCIAL STATEMENTS(continued)
The provisions of ASC Topic 210 “Disclosures about Offsetting Assets and Liabilities” require disclosure on the offsetting of financial assets and liabilities. These disclosures are required for certain investments, including derivative financial instruments subject to Master Agreements which are eligible for offsetting in the Statement of Assets and Liabilities and require the fund to disclose both gross and net information with respect to such investments. For financial reporting purposes, the fund does not offset derivative assets and derivative liabilities that are subject to Master Agreements in the Statement of Assets and Liabilities.
At December 31, 2019, derivative assets and liabilities (by type) on a gross basis are as follows:
| | | | | | |
Derivative Financial Instruments: | | Assets ($) | | Liabilities ($) | |
Futures | | 8,154 | | (40,078) | |
Options | | 3,302 | | (11) | |
Forward contracts | | 15,609 | | (33,550) | |
Swaps | | 9,773 | | - | |
Total gross amount of derivative | | | | | |
assets and liabilities in the | | | | | |
Statement of Assets and Liabilities | | 36,838 | | (73,639) | |
Derivatives not subject to | | | | | |
Master Agreements | | (17,927) | | 40,078 | |
Total gross amount of assets | | | | | |
and liabilities subject to | | | | | |
Master Agreements | | 18,911 | | (33,561) | |
The following tables present derivative assets and liabilities net of amounts available for offsetting under Master Agreements and net of related collateral received or pledged, if any, as of December 31, 2019:†
| | | | | | | |
| | | Financial | | | |
| | | Instruments | | | |
| | | and Derivatives | | | |
| Gross Amount of | | Available | Collateral | | Net Amount of |
Counterparty | Assets ($) | 1 | for Offset ($) | Received ($) | | Assets ($) |
Citigroup | 2,837 | | (2,246) | - | | 591 |
HSBC | 8,643 | | (8,438) | - | | 205 |
J.P. Morgan Securities | 325 | | (325) | - | | - |
Merrill Lynch, Pierce, Fenner & Smith | 625 | | (334) | - | | 291 |
Morgan Stanley | 5,691 | | (5,691) | - | | - |
UBS Securities | 790 | | (74) | - | | 716 |
Total | 18,911 | | (17,108) | - | | 1,803 |
| | | | | | |
46
| | | | | | | |
| | | Financial | | | |
| | | Instruments | | | |
| | | and Derivatives | | | |
| Gross Amount of | | Available | Collateral | | Net Amount of |
Counterparty | Liabilities ($) | 1 | for Offset ($) | Pledged ($) | | Liabilities ($) |
Citigroup | (2,246) | | 2,246 | - | | - |
HSBC | (8,438) | | 8,438 | - | | - |
J.P. Morgan Securities | (10,372) | | 325 | - | | (10,047) |
Merrill Lynch, Pierce, Fenner & Smith | (334) | | 334 | - | | - |
Morgan Stanley | (12,097) | | 5,691 | - | | (6,406) |
UBS Securities | (74) | | 74 | - | | - |
Total | (33,561) | | 17,108 | - | | (16,453) |
| | | | | | |
1 Absent a default event or early termination, OTC derivative assets and liabilities are presented at gross amounts and are not offset in the Statement of Assets and Liabilities. |
† See Statement of Investments for detailed information regarding collateral held for open exchange traded derivative contracts. |
The following summarizes the average market value of derivatives outstanding duringthe period ended December 31, 2019:
| | | |
| | Average Market Value ($) |
Interest rate futures | | 6,800,741 |
Foreign currency options contracts | | 11,988 |
Forward contracts | | 5,508,241 |
| | |
The following summarizes the average notional value of swap agreements outstanding during the period ended December 31, 2019:
| | | |
| | Average Notional Value ($) |
Interest rate swap agreements | | 160,271 |
Credit default swap agreements | | 222,309 |
| | |
At December 31, 2019, the cost of investments for federal income tax purposes was $34,905,643; accordingly, accumulated net unrealized appreciation on investments inclusive of derivative contracts was $1,069,313, consisting of $1,187,120 gross unrealized appreciation and $117,807 gross unrealized depreciation.
NOTE 5—Plan of Liquidation:
On November 26, 2019, the Board approved a Plan of Liquidation (the “Plan”). The Plan provides for the liquidation of the fund, the pro rata distribution of the assets of the fund to its shareholders and the closing of fund shareholder accounts (the “Liquidation”). The Liquidation of the
47
NOTES TO FINANCIAL STATEMENTS(continued)
fund will occur on or about April 30, 2020. Accordingly, effective March 31, 2020, the fund will be closed to any investments for new accounts.
48
REPORT OF INDEPENDENT REGISTERED PUBLIC ACCOUNTING FIRM
To the Shareholders and the Board of Trustees of Quality Bond Portfolio
Opinion on the Financial Statements
We have audited the accompanying statement of assets and liabilities of Quality Bond Portfolio (the “Fund”) (one of the funds constituting BNY Mellon Variable Investment Fund), including the statements of investments, investments in affiliated issuers, futures, options written, forward foreign currency exchange contracts and swap agreements, as of December 31, 2019, and the related statement of operations for the year then ended, the statements of changes in net assets for each of the two years in the period then ended, the financial highlights for each of the five years in the period then ended and the related notes (collectively referred to as the “financial statements”). In our opinion, the financial statements present fairly, in all material respects, the financial position of the Fund (one of the funds constituting BNY Mellon Variable Investment Fund) at December 31, 2019, the results of its operations for the year then ended, the changes in its net assets for each of the two years in the period then ended and its financial highlights for each of the five years in the period then ended, in conformity with U.S. generally accepted accounting principles.
Basis for Opinion
These financial statements are the responsibility of the Fund’s management. Our responsibility is to express an opinion on the Fund’s financial statements based on our audits. We are a public accounting firm registered with the Public Company Accounting Oversight Board (United States) (“PCAOB”) and are required to be independent with respect to the Fund in accordance with the U.S. federal securities laws and the applicable rules and regulations of the Securities and Exchange Commission and the PCAOB.
We conducted our audits in accordance with the standards of the PCAOB. Those standards require that we plan and perform the audit to obtain reasonable assurance about whether the financial statements are free of material misstatement, whether due to error or fraud. The Fund is not required to have, nor were we engaged to perform, an audit of the Fund’s internal control over financial reporting. As part of our audits, we are required to obtain an understanding of internal control over financial reporting, but not for the purpose of expressing an opinion on the effectiveness of the Fund’s internal control over financial reporting. Accordingly, we express no such opinion.
Our audits included performing procedures to assess the risks of material misstatement of the financial statements, whether due to error or fraud, and performing procedures that respond to those risks. Such procedures included examining, on a test basis, evidence regarding the amounts and disclosures in the financial statements. Our procedures included confirmation of securities owned as of December 31, 2019, by correspondence with the custodian and others or by other appropriate auditing procedures where replies from others were not received. Our audits also included evaluating the accounting principles used and significant estimates made by management, as well as evaluating the overall presentation of the financial statements. We believe that our audits provide a reasonable basis for our opinion.

We have served as the auditor of one or more investment companies in the BNY Mellon Family of Funds since at least 1957, but we are unable to determine the specific year.
New York, New York
February 10, 2020
49
INFORMATION ABOUT THE RENEWAL OF THE FUND’S INVESTMENT ADVISORY AGREEMENTS (Unaudited)
At a meeting of the fund’s Board of Trustees held on July 30, 2019, the Board considered the renewal of the fund’s Investment Advisory Agreement pursuant to which the Adviser provides the fund with investment advisory and administrative services (the “Agreement”). The Board members, none of whom are “interested persons” (as defined in the Investment Company Act of 1940, as amended) of the fund, were assisted in their review by independent legal counsel and met with counsel in executive session separate from representatives of the Adviser. In considering the renewal of the Agreement, the Board considered several factors that it believed to be relevant, including those discussed below. The Board did not identify any one factor as dispositive, and each Board member may have attributed different weights to the factors considered.
Analysis of Nature, Extent, and Quality of Services Provided to the Fund. The Board considered information provided to it at the meeting and in previous presentations from representatives of the Adviser regarding the nature, extent, and quality of the services provided to funds in the BNY Mellon fund complex, including the fund. The Adviser provided the number of open accounts in the fund, the fund’s asset size and the allocation of fund assets among distribution channels. The Adviser also had previously provided information regarding the diverse intermediary relationships and distribution channels of funds in the BNY Mellon fund complex (such as retail direct or intermediary, in which intermediaries typically are paid by the fund and/or the Adviser) and the Adviser’s corresponding need for broad, deep, and diverse resources to be able to provide ongoing shareholder services to each intermediary or distribution channel, as applicable to the fund.
The Board also considered research support available to, and portfolio management capabilities of, the fund’s portfolio management personnel and that the Adviser also provides oversight of day-to-day fund operations, including fund accounting and administration and assistance in meeting legal and regulatory requirements. The Board also considered the Adviser’s extensive administrative, accounting and compliance infrastructures.
Comparative Analysis of the Fund’s Performance and Management Fee and Expense Ratio. The Board reviewed reports prepared by Broadridge Financial Solutions, Inc. (“Broadridge”), an independent provider of investment company data, which included information comparing (1) the fund’s performance with the performance of a group of A-rated corporate debt funds (i.e., funds investing at least 65% of their assets in corporate debt rated A or better or government securities) underlying variable insurance products (the “Performance Group”) and with a broader group of funds consisting of all A-rated corporate debt funds underlying variable insurance products (the “Performance Universe”), all for various periods ended June 30, 2019, and (2) the fund’s actual and contractual management fees and total expenses with those of the same group of funds in the Performance Group (the “Expense Group”) and with a broader group of funds consisting of all A-rated corporate debt funds underlying variable
50
insurance products, excluding outliers (the “Expense Universe”), the information for which was derived in part from fund financial statements available to Broadridge as of the date of its analysis. The Adviser previously had furnished the Board with a description of the methodology Broadridge used to select the Performance Group and Performance Universe and the Expense Group and Expense Universe.
Representatives of the Adviser stated that the usefulness of performance comparisons may be affected by a number of factors, including different investment limitations and policies that may be applicable to the fund and comparison funds. The Board discussed with representatives of the Adviser the results of the comparisons and considered that the fund’s total return performance was below the Performance Group and Performance Universe medians for all periods. The Board discussed with representatives of the Adviser the portfolio management strategy of the fund’s portfolio managers and the reasons for the fund’s underperformance versus the Performance Group and Performance Universe during the periods under review. The Board also considered that the fund’s yield performance was below the Performance Group median for seven of the ten one-year periods ended June 30th and at or above the Performance Group median for three of the periods. The fund’s yield performance was below the Performance Universe median for eight of the ten one-year periods ended June 30th and at or above the Performance Universe median for two of the periods. The Adviser also provided a comparison of the fund’s calendar year total returns to the returns of the fund’s benchmark index, and it was noted that the fund’s returns were above the returns of the index in five of the ten calendar years shown.
The Board reviewed and considered the contractual management fee rate paid by the fund to the Adviser over the fund’s last fiscal year in light of the nature, extent and quality of the management services provided by the Adviser.
The Board also reviewed the range of actual and contractual management fees and total expenses as a percentage of average net assets of the Expense Group and Expense Universe funds and discussed the results of the comparisons. The Board considered that the fund’s contractual management fee was higher than the Expense Group contractual management fee median and the fund’s actual management fee and total expenses were higher than the Expense Group and Expense Universe medians.
Representatives of the Adviser stated that the Adviser has contractually agreed, until May 1, 2020, to waive receipt of its fees and/or assume the direct expenses of the fund so that the direct expenses of none of its classes (excluding Rule 12b-1 fees, interest, brokerage commissions, commitment fees on borrowings and extraordinary expenses) exceed 0.765% of the fund’s average daily net assets. In addition, representatives of the Adviser noted that the fund’s asset size is relatively small and that the fund’s assets have generally declined over time. Representatives of the Adviser stated that, as a result, fund management would carefully review the viability of the fund and report its conclusions to the Board at a future Board meeting.
Analysis of Profitability and Economies of Scale. Representatives of the Adviser reviewed the expenses allocated and profit received by the Adviser and its affiliates and
51
INFORMATION ABOUT THE RENEWAL OF THE FUND’S INVESTMENT ADVISORY AGREEMENTS (Unaudited) (continued)
the resulting profitability percentage for managing the fund and the aggregate profitability percentage to the Adviser and its affiliates for managing the funds in the BNY Mellon fund complex, and the method used to determine the expenses and profit. The Board concluded that the profitability results were not excessive, given the services rendered and service levels provided by the Adviser and its affiliates. The Board also had been provided with information prepared by an independent consulting firm regarding the Adviser’s approach to allocating costs to, and determining the profitability of, individual funds and the entire BNY Mellon fund complex. The consulting firm also had analyzed where any economies of scale might emerge in connection with the management of a fund.
The Board considered, on the advice of its counsel, the profitability analysis (1) as part of its evaluation of whether the fees under the Agreement, considered in relation to the mix of services provided by the Adviser, including the nature, extent and quality of such services, supported the renewal of the Agreement and (2) in light of the relevant circumstances for the fund and the extent to which economies of scale would be realized if the fund grows and whether fee levels reflect these economies of scale for the benefit of fund shareholders. Representatives of the Adviser stated that a discussion of economies of scale is predicated on a fund having achieved a substantial size with increasing assets and that, if a fund’s assets had been stable or decreasing, the possibility that the Adviser may have realized any economies of scale would be less. Representatives of the Adviser also stated that, as a result of shared and allocated costs among funds in the BNY Mellon fund complex, the extent of economies of scale could depend substantially on the level of assets in the complex as a whole, so that increases and decreases in complex-wide assets can affect potential economies of scale in a manner that is disproportionate to, or even in the opposite direction from, changes in the fund’s asset level. The Board also considered potential benefits to the Adviser from acting as investment adviser and took into consideration that there were no soft dollar arrangements in effect for trading the fund’s investments.
At the conclusion of these discussions, the Board agreed that it had been furnished with sufficient information to make an informed business decision with respect to the renewal of the Agreement. Based on the discussions and considerations as described above, the Board concluded and determined as follows.
· The Board concluded that the nature, extent and quality of the services provided by the Adviser are adequate and appropriate.
· The Board agreed to closely monitor performance and determined to approve renewal of the Agreement for the remainder of the one-year term.
· The Board concluded that the fee paid to the Adviser continued to be appropriate under the circumstances and in light of the factors and the totality of the services provided as discussed above.
· The Board determined that the economies of scale which may accrue to the Adviser and its affiliates in connection with the management of the fund had
52
been adequately considered by the Adviser in connection with the fee rate charged to the fund pursuant to the Agreement and that, to the extent in the future it were determined that material economies of scale had not been shared with the fund, the Board would seek to have those economies of scale shared with the fund.
In evaluating the Agreement, the Board considered these conclusions and determinations and also relied on its previous knowledge, gained through meetings and other interactions with the Adviser and its affiliates, of the Adviser and the services provided to the fund by the Adviser. The Board also relied on information received on a routine and regular basis throughout the year relating to the operations of the fund and the investment management and other services provided under the Agreement, including information on the investment performance of the fund in comparison to similar mutual funds and benchmark performance indices; general market outlook as applicable to the fund; and compliance reports. In addition, the Board’s consideration of the contractual fee arrangements for this fund had the benefit of a number of years of reviews of the Agreement for the fund, or substantially similar agreements for other BNY Mellon funds that the Board oversees, during which lengthy discussions took place between the Board and representatives of the Adviser. Certain aspects of the arrangements may receive greater scrutiny in some years than in others, and the Board’s conclusions may be based, in part, on their consideration of the fund’s arrangements, or substantially similar arrangements for other BNY Mellon funds that the Board oversees, in prior years. The Board determined to renew the Agreement for the remainder of the one-year term.
53
BOARD MEMBERS INFORMATION(Unaudited)
INDEPENDENT BOARD MEMBERS
Joseph S. DiMartino (76)
Chairman of the Board (1995)
Principal Occupation During Past 5 Years:
· Corporate Director and Trustee (1995-Present)
Other Public Company Board Memberships During Past 5 Years:
· CBIZ, Inc., a public company providing professional business services, products and solutions,Director (1997-Present)
No. of Portfolios for which Board Member Serves:118
———————
Peggy C. Davis (76)
Board Member (2006)
Principal Occupation During Past 5 Years:
· Shad Professor of Law, New York University School of Law (1983-present)
No. of Portfolios for which Board Member Serves: 43
———————
Gina D. France (61)
Board Member (2019)
Principal Occupation During Past 5 Years:
· Founder, President and Chief Executive Officer, France Strategic Partners, a strategy and advisory firm serving corporate clients across the United States (2003 –Present)
· Corporate Director and Trustee (2004 – Present)
Other Public Company Board Memberships During Past 5 Years:
· Huntington Bancshares, a bank holding company headquartered in Columbus, Ohio,Director(2016 – Present)
· Cedar Fair, L.P., a publicly-traded partnership that owns and operates amusement parks and hotels in the U.S. and Canada,Director (2011 – Present)
· CBIZ (formerly, Century Business Services, Inc.), a provider of outsourcing functions for small and medium size companies,Director(2015 – Present)
· Baldwin Wallace University,Trustee (2013- Present)
· FirstMerit Corporation, a diversified financial services company,Director (2004 – 2016)
No. of Portfolios for which Board Member Serves:29
———————
54
Joan Gulley (72)
Board Member (2017)
Principal Occupation During Past 5 Years:
· PNC Financial Services Group, Inc.(1993-2014), Executive Vice President and Chief Human Resources Officer and Executive Committee Member (2008-2014)
· Director, Nantucket Library (2015-Present)
No. of Portfolios for which Board Member Serves:49
———————
Ehud Houminer (79)
Board Member (2006)
Principal Occupation During Past 5 Years:
· Board of Overseers at the Columbia Business School, Columbia University (1992-Present)
· Trustee, Ben Gurion University (2012-2018)
No. of Portfolios for which Board Member Serves:49
———————
Robin A. Melvin (56)
Board Member (2012)
Principal Occupation During Past 5 Years:
· Co-chairman, Mentor Illinois, a non-profit organization dedicated to increasing the quantity and quality of mentoring services in Illinois; (2014-Present); Board member (2013-Present)
No. of Portfolios for which Board Member Serves:96
———————
Once elected all Board Members serve for an indefinite term, but achieve Emeritus status upon reaching age 80. The address of the Board Members and Officers is c/o BNY Mellon Investment Adviser, Inc. 240 Greenwich Street, New York, New York 10286. Additional information about the Board Members is available in the fund’s Statement of Additional Information which can be obtained from the Adviser free of charge by calling this toll free number: 1-800-373-9387.
David P. Feldman, Emeritus Board Member
James F. Henry, Emeritus Board Member
Lynn Martin, Emeritus Board Member
Dr. Martin Peretz, Emeritus Board Member
Philip L. Toia, Emeritus Board Member
55
OFFICERS OF THE FUND(Unaudited)
RENEE LAROCHE-MORRIS, President since May 2019.
President and a director of BNY Mellon Investment Adviser, Inc. since January 2018. She is an officer of 62 investment companies (comprised of 118 portfolios) managed by the Adviser. She is 48 years old and has been an employee of BNY Mellon since 2003.
JAMES WINDELS, Treasurer since November 2001.
Director- BNY Mellon Fund Administration, and an officer of 63 investment companies (comprised of 141 portfolios) managed by the Adviser. He is 61 years old and has been an employee of the Adviser since April 1985.
BENNETT A. MACDOUGALL, Chief Legal Officer since October 2015.
Chief Legal Officer of the Adviser and Associate General Counsel and Managing Director of BNY Mellon since June 2015; Director and Associate General Counsel of Deutsche Bank – Asset & Wealth Management Division from June 2005 to June 2015, and as Chief Legal Officer of Deutsche Investment Management Americas Inc. from June 2012 to May 2015. He is an officer of 63 investment companies (comprised of 141 portfolios) managed by the Adviser. He is 48 years old and has been an employee of the Adviser since June 2015.
DAVID DIPETRILLO, Vice President since May 2019.
Head of North America Product, BNY Mellon Investment Management since January 2018, Director of Product Strategy, BNY Mellon Investment Management from January 2016 to December 2017; Head of US Retail Product and Channel Marketing, BNY Mellon Investment Management from January 2014 to December 2015. He is an officer of 62 investment companies (comprised of 118 portfolios) managed by the Adviser. He is 41 years old and has been an employee of BNY Mellon since 2005.
JAMES BITETTO, Vice President since August 2005 and Secretary since February 2018.
Senior Managing Counsel of BNY Mellon since December 2019; Managing Counsel of BNY Mellon from April 2014 to December 2019; Secretary of the Adviser, and an officer of 63 investment companies (comprised of 141 portfolios) managed by the Adviser. He is 53 years old and has been an employee of the Adviser since December 1996.
SONALEE CROSS, Vice President and Assistant Secretary since March 2018.
Counsel of BNY Mellon since October 2016; Associate at Proskauer Rose LLP from April 2016 to September 2016; Attorney at EnTrust Capital from August 2015 to February 2016; Associate at Sidley Austin LLP from September 2013 to August 2015. She is an officer of 63 investment companies (comprised of 141 portfolios) managed by the Adviser. She is 32 years old and has been an employee of the Adviser since October 2016.
DEIRDRE CUNNANE, Vice President and Assistant Secretary since March 2019.
Counsel of BNY Mellon since August 2018; Senior Regulatory Specialist at BNY Mellon Investment Management Services from February 2016 to August 2018; Trustee Associate at BNY Mellon Trust Company (Ireland) Limited from August 2013 to February 2016. She is an officer of 63 investment companies (comprised of 141 portfolios) managed by the Adviser. She is 29 years old and has been an employee of the Adviser since August 2018.
SARAH S. KELLEHER, Vice President and Assistant Secretary since April 2014.
Managing Counsel of BNY Mellon since December 2017, Senior Counsel of BNY Mellon from March 2013 to December 2017. She is an officer of 63 investment companies (comprised of 141 portfolios) managed by the Adviser. She is 44 years old and has been an employee of the Adviser since March 2013.
JEFF PRUSNOFSKY, Vice President and Assistant Secretary since August 2005.
Senior Managing Counsel of BNY Mellon, and an officer of 63 investment companies (comprised of 141 portfolios) managed by the Adviser. He is 54 years old and has been an employee of the Adviser since October 1990.
PETER M. SULLIVAN, Vice President and Assistant Secretary since March 2019.
Managing Counsel of BNY Mellon, and an officer of 63 investment companies (comprised of 141 portfolios) managed by the Adviser. He is 51 years old and has been an employee of the Adviser since April 2004.
56
NATALYA ZELENSKY, Vice President and Assistant Secretary since March 2017.
Managing Counsel of BNY Mellon since December 2019; Counsel of BNY Mellon from May 2016 to December 2019; Attorney at Wildermuth Endowment Strategy Fund/Wildermuth Advisory, LLC from November 2015 to May 2016 and Assistant General Counsel at RCS Advisory Services from July 2014 to November 2015. She is an officer of 63 investment companies (comprised of 141 portfolios) managed by the Adviser. She is 34 years old and has been an employee of the Adviser since May 2016.
GAVIN C. REILLY, Assistant Treasurer since December 2005.
Tax Manager - BNY Mellon Fund Administration, and an officer of 63 investment companies (comprised of 141 portfolios) managed by the Adviser. He is 51 years old and has been an employee of the Adviser since April 1991.
ROBERT S. ROBOL, Assistant Treasurer since August 2005.
Senior Accounting Manager- BNY Mellon Fund Administration, and an officer of 63 investment companies (comprised of 141 portfolios) managed by the Adviser. He is 55 years old and has been an employee of the Adviser since October 1988.
ROBERT SALVIOLO, Assistant Treasurer since July 2007.
Senior Accounting Manager – BNY Mellon Fund Administration, and an officer of 63 investment companies (comprised of 141 portfolios) managed by the Adviser. He is 52 years old and has been an employee of the Adviser since June 1989.
ROBERT SVAGNA, Assistant Treasurer since December 2002.
Senior Accounting Manager – BNY Mellon Fund Administration, and an officer of 63 investment companies (comprised of 141 portfolios) managed by the Adviser. He is 52 years old and has been an employee of the Adviser since November 1990.
JOSEPH W. CONNOLLY, Chief Compliance Officer since October 2004.
Chief Compliance Officer of the Adviser, the BNY Mellon Family of Funds and BNY Mellon Funds Trust (63 investment companies, comprised of 141 portfolios). He is 62 years old and has served in various capacities with the Adviser since 1980, including manager of the firm’s Fund Accounting Department from 1997 through October 2001.
CARIDAD M. CAROSELLA, Anti-Money Laundering Compliance Officer since January 2016.
Anti-Money Laundering Compliance Officer of the BNY Mellon Family of Funds and BNY Mellon Funds Trust since January 2016; from May 2015 to December 2015, Interim Anti-Money Laundering Compliance Officer of the BNY Mellon Family of Funds and BNY Mellon Funds Trust and the Distributor; from January 2012 to May 2015, AML Surveillance Officer of the Distributor. She is an officer of 56 investment companies (comprised of 134 portfolios) managed by the Adviser. She is 51 years old and has been an employee of the Distributor since 1997.
57
BNY Mellon Variable Investment Fund, Quality Bond Portfolio
240 Greenwich Street
New York, NY 10286
Adviser
BNY Mellon Investment Adviser, Inc.
240 Greenwich Street
New York, NY 10286
Custodian
The Bank of New York Mellon
240 Greenwich Street
New York, NY 10286
Transfer Agent &
Dividend Disbursing Agent
BNY Mellon Transfer, Inc.
240 Greenwich Street
New York, NY 10286
Distributor
BNY Mellon Securities Corporation
240 Greenwich Street
New York, NY 10286
Telephone 1-800-258-4260 or 1-800-258-4261
Mail The BNY Mellon Family of Funds, 144 Glenn Curtiss Boulevard, Uniondale, NY 11556-0144 Attn: Institutional Services Department
E-mailSend your request to info@bnymellon.com
InternetInformation can be viewed online or downloaded atwww.bnymellonim.com/us
The fund files its complete schedule of portfolio holdings with the Securities and Exchange Commission (“SEC”) for the first and third quarters of each fiscal year on Form N-PORT. The fund’s Forms N-PORT are available on the SEC’s website atwww.sec.gov.
A description of the policies and procedures that the fund uses to determine how to vote proxies relating to portfolio securities and information regarding how the fund voted these proxies for the most recent 12-month period ended June 30 is available atwww.bnymellonim.com/us and on the SEC’s website at www.sec.gov and without charge, upon request, by calling 1-800-373-9387.
| | |
© 2020 BNY Mellon Securities Corporation
0120AR1219 | 
|
Item 2. Code of Ethics.
The Registrant has adopted a code of ethics that applies to the Registrant's principal executive officer, principal financial officer, principal accounting officer or controller, or persons performing similar functions. There have been no amendments to, or waivers in connection with, the Code of Ethics during the period covered by this Report.
Item 3. Audit Committee Financial Expert.
The Registrant's Board has determined that Joseph DiMartino , a member of the Audit Committee of the Board, is an audit committee financial expert as defined by the Securities and Exchange Commission (the "SEC"). Mr. DiMartino is "independent" as defined by the SEC for purposes of audit committee financial expert determinations.
Item 4. Principal Accountant Fees and Services.
(a) Audit Fees. The aggregate fees billed for each of the last two fiscal years (the "Reporting Periods") for professional services rendered by the Registrant's principal accountant (the "Auditor") for the audit of the Registrant's annual financial statements or services that are normally provided by the Auditor in connection with the statutory and regulatory filings or engagements for the Reporting Periods, were $278,115 in 2018 and $286,481 in 2019.
(b) Audit-Related Fees. The aggregate fees billed in the Reporting Periods for assurance and related services by the Auditor that are reasonably related to the performance of the audit of the Registrant's financial statements and are not reported under paragraph (a) of this Item 4 were $89,579 in 2018 and $82,843 in 2019. These services consisted of one or more of the following: (i) agreed upon procedures related to compliance with Internal Revenue Code section 817(h), (ii) security counts required by Rule 17f-2 under the Investment Company Act of 1940, as amended, (iii) advisory services as to the accounting or disclosure treatment of Registrant transactions or events and (iv) advisory services to the accounting or disclosure treatment of the actual or potential impact to the Registrant of final or proposed rules, standards or interpretations by the Securities and Exchange Commission, the Financial Accounting Standards Boards or other regulatory or standard-setting bodies.
The aggregate fees billed in the Reporting Periods for non-audit assurance and related services by the Auditor to the Registrant's investment adviser (not including any sub-investment adviser whose role is primarily portfolio management and is subcontracted with or overseen by another investment adviser), and any entity controlling, controlled by or under common control with the investment adviser that provides ongoing services to the Registrant ("Service Affiliates"), that were reasonably related to the performance of the annual audit of the Service Affiliate, which required pre-approval by the Audit Committee were $0 in 2018 and $0 in 2019.
(c) Tax Fees. The aggregate fees billed in the Reporting Periods for professional services rendered by the Auditor for tax compliance, tax advice, and tax planning ("Tax Services") were $34,833 in 2018 and $25,884 in 2019. These services consisted of: (i) review or preparation of U.S. federal, state, local and excise tax returns; (ii) U.S. federal, state and local tax planning, advice and assistance regarding statutory, regulatory or administrative developments; (iii) tax advice regarding tax qualification matters and/or treatment of various financial instruments held or proposed to be acquired or held, and (iv) determination of Passive Foreign Investment Companies. The aggregate fees billed in the Reporting Periods for Tax Services by the Auditor to Service Affiliates, which required pre-approval by the Audit Committee were $0 in 2018 and $0 in 2019.
(d) All Other Fees. The aggregate fees billed in the Reporting Periods for products and services provided by the Auditor, other than the services reported in paragraphs (a) through (c) of this Item, were $93 in 2018 and $108 in 2019. These services consisted of a review of the Registrant's anti-money laundering program.
The aggregate fees billed in the Reporting Periods for Non-Audit Services by the Auditor to Service Affiliates, other than the services reported in paragraphs (b) through (c) of this Item, which required pre-approval by the Audit Committee, were $0 in 2018 and $0 in 2019.
(e)(1) Audit Committee Pre-Approval Policies and Procedures. The Registrant's Audit Committee has established policies and procedures (the "Policy") for pre-approval (within specified fee limits) of the Auditor's engagements for non-audit services to the Registrant and Service Affiliates without specific case-by-case consideration. The pre-approved services in the Policy can include pre-approved audit services, pre-approved audit-related services, pre-approved tax services and pre-approved all other services. Pre-approval considerations include whether the proposed services are compatible with maintaining the Auditor's independence. Pre-approvals pursuant to the Policy are considered annually.
(e)(2) Note. None of the services described in paragraphs (b) through (d) of this Item 4 were approved by the Audit Committee pursuant to paragraph (c)(7)(i)(C) of Rule 2-01 of Regulation S-X.
(f) None of the hours expended on the principal accountant's engagement to audit the registrant's financial statements for the most recent fiscal year were attributed to work performed by persons other than the principal accountant's full-time, permanent employees.
Non-Audit Fees. The aggregate non-audit fees billed by the Auditor for services rendered to the Registrant, and rendered to Service Affiliates, for the Reporting Periods were $744,219 in 2018 and $605,259 in 2019.
Auditor Independence. The Registrant's Audit Committee has considered whether the provision of non-audit services that were rendered to Service Affiliates, which were not pre-approved (not requiring pre-approval), is compatible with maintaining the Auditor's independence.
Item 5. Audit Committee of Listed Registrants.
Not applicable.
Item 6. Investments.
(a) Not applicable.
Item 7. Disclosure of Proxy Voting Policies and Procedures for Closed-End Management Investment Companies.
Not applicable.
Item 8. Portfolio Managers of Closed-End Management Investment Companies.
Not applicable.
Item 9. Purchases of Equity Securities by Closed-End Management Investment Companies and Affiliated Purchasers.
Not applicable.
Item 10. Submission of Matters to a Vote of Security Holders.
There have been no material changes to the procedures applicable to Item 10.
Item 11. Controls and Procedures.
(a) The Registrant's principal executive and principal financial officers have concluded, based on their evaluation of the Registrant's disclosure controls and procedures as of a date within 90 days of the filing date of this report, that the Registrant's disclosure controls and procedures are reasonably designed to ensure that information required to be disclosed by the Registrant on Form N-CSR is recorded, processed, summarized and reported within the required time periods and that information required to be disclosed by the Registrant in the reports that it files or submits on Form N-CSR is accumulated and communicated to the Registrant's management, including its principal executive and principal financial officers, as appropriate to allow timely decisions regarding required disclosure.
(b) There were no changes to the Registrant's internal control over financial reporting that occurred during the second fiscal quarter of the period covered by this report that have materially affected, or are reasonably likely to materially affect, the Registrant's internal control over financial reporting.
Item 12. Disclosure of Securities Lending Activities for Closed-End Management Investment Companies.
Not applicable.
Item 13. Exhibits.
(a)(1) Code of ethics referred to in Item 2.
(a)(2) Certifications of principal executive and principal financial officers as required by Rule 30a-2(a) under the Investment Company Act of 1940.
(a)(3) Not applicable.
(b) Certification of principal executive and principal financial officers as required by Rule 30a-2(b) under the Investment Company Act of 1940.
SIGNATURES
Pursuant to the requirements of the Securities Exchange Act of 1934 and the Investment Company Act of 1940, the Registrant has duly caused this Report to be signed on its behalf by the undersigned, thereunto duly authorized.
BNY Mellon Variable Investment Fund
By: /s/ Renee LaRoche-Morris
Renee LaRoche-Morris
President (Principal Executive Officer)
Date: February 10, 2020
Pursuant to the requirements of the Securities Exchange Act of 1934 and the Investment Company Act of 1940, this Report has been signed below by the following persons on behalf of the Registrant and in the capacities and on the dates indicated.
By: /s/ Renee LaRoche-Morris
Renee LaRoche-Morris
President (Principal Executive Officer)
Date: February 10, 2020
By: /s/ James Windels
James Windels
Treasurer (Principal Financial Officer)
Date: February 7, 2020
EXHIBIT INDEX
(a)(1) Code of ethics referred to in Item 2.
(a)(2) Certifications of principal executive and principal financial officers as required by Rule 30a-2(a) under the Investment Company Act of 1940. (EX-99.CERT)
(b) Certification of principal executive and principal financial officers as required by Rule 30a-2(b) under the Investment Company Act of 1940. (EX-99.906CERT)