| UNITED STATES |
| SECURITIES AND EXCHANGE COMMISSION |
| Washington, D.C. 20549 |
| |
| |
| FORM N-CSR |
| |
| CERTIFIED SHAREHOLDER REPORT OF REGISTERED MANAGEMENT |
| INVESTMENT COMPANIES |
| |
| Investment Company Act file number 811- 5125 |
| |
| Dreyfus Variable Investment Fund |
| (Exact name of Registrant as specified in charter) |
| |
| |
| c/o The Dreyfus Corporation |
| 200 Park Avenue |
| New York, New York 10166 |
| (Address of principal executive offices) (Zip code) |
| |
| Michael A. Rosenberg, Esq. |
| 200 Park Avenue |
| New York, New York 10166 |
| (Name and address of agent for service) |
Registrant's telephone number, including area code: (212) 922-6000
| Date of fiscal year end: | | 12/31 |
| Date of reporting period: | | 12/31/07 |
FORM N-CSR
Item 1. Reports to Stockholders.
The views expressed in this report reflect those of the portfolio manager only through the end of the period covered and do not necessarily represent the views of Dreyfus or any other person in the Dreyfus organization.Any such views are subject to change at any time based upon market or other conditions and Dreyfus disclaims any responsibility to update such views. These views may not be relied on as investment advice and, because investment decisions for a Dreyfus portfolio are based on numerous factors, may not be relied on as an indication of trading intent on behalf of any Dreyfus portfolio.
Not FDIC-Insured • Not Bank-Guaranteed • May Lose Value
| | | Contents |
| |
| | | THE PORTFOLIO |
| |
|
| 2 | | A Letter from the CEO |
| 3 | | Discussion of Performance |
| 6 | | Portfolio Performance |
| 8 | | Understanding Your Portfolio’s Expenses |
| 8 | | Comparing Your Portfolio’s Expenses |
| | | With Those of Other Funds |
| 9 | | Statement of Investments |
| 12 | | Statement of Assets and Liabilities |
| 13 | | Statement of Operations |
| 14 | | Statement of Changes in Net Assets |
| 16 | | Financial Highlights |
| 18 | | Notes to Financial Statements |
| 26 | | Report of Independent Registered |
| | | Public Accounting Firm |
| 27 | | Important Tax Information |
| 28 | | Board Members Information |
| 31 | | Officers of the Fund |
| FOR MORE INFORMATION |
|
| | | Back Cover |
The Portfolio
| Dreyfus Variable Investment Fund, |
| Appreciation Portfolio |

A LETTER FROM THE CEO
Dear Shareholder:
We are pleased to present this annual report for Dreyfus Variable Investment Fund,Appreciation Portfolio, covering the 12-month period from January 1, 2007, through December 31, 2007.
Looking back, 2007 was a year of significant change for the stock market.Turmoil in the sub-prime mortgage market, declining housing values and soaring energy prices sparked a “flight to quality”in which investors reassessed their attitudes toward risk. As a result, smaller, more speculative companies that had led the stock market over the past several years lost value over the second half of the year, while shares of larger, multinational growth companies returned to favor. Many financial services and consumer discretionary companies were hurt by repercussions from the sub-prime lending crisis and economic downturn, but energy and basic materials producers generally moved higher along with underlying commodity prices.
The turbulence of 2007 reinforced a central principle of successful investing: diversification. Investors with broad exposure to the world’s stock and bond markets were better protected from the full impact of market volatility in areas that, earlier in the year, were among the bright spots at the time. As we look ahead, we believe that now is the perfect time to meet with your financial advisor, who can help you plan and diversify your investment portfolio in a way that manages the potential opportunities and risks that may continue to arise in 2008.
For information about how the portfolio performed during the reporting period, as well as market perspectives, we have provided a Discussion of Performance given by the Portfolio Manager.
Thank you for your continued confidence and support.

| Thomas F. Eggers |
| Chief Executive Officer |
| The Dreyfus Corporation |
| January 15, 2008 |
2

DISCUSSION OF PERFORMANCE
For the period of January 1, 2007, through December 31, 2007, as provided by Fayez Sarofim, of Fayez Sarofim & Co., Sub-Investment Adviser
Portfolio and Market Performance
After posting gains during the first half of 2007, stocks generally moved lower over the second half of the year when the U.S. economy weakened and a credit crunch spread from the sub-prime mortgage sector of the bond market to other areas of the financial markets. As investors grew more risk averse,they began to turn toward the types of large-cap growth stocks in which the portfolio invests. As a result, the portfolio produced higher returns than its benchmark for the reporting period overall.
For the 12-month period ended December 31, 2007, Dreyfus Variable Investment Fund, Appreciation Portfolio’s Initial shares produced a total return of 7.14%, and its Service shares produced a total return of 6.85% ..1 In comparison, the total return of the portfolio’s benchmark, the Standard & Poor’s 500 Composite Stock Price Index (“S&P 500 Index”), was 5.49% for the same period.2
The Portfolio’s Investment Approach
The portfolio normally invests at least 80% of its assets in common stocks. The portfolio focuses on large, well-established multinational growth companies that have demonstrated sustained patterns of profitability, strong balance sheets, an expanding global presence and the potential to achieve predictable above-average earnings growth. We focus on purchasing reasonably priced growth stocks of fundamentally sound companies in economic sectors that we believe will expand over the next three to five years or longer.
Large-Cap Growth Stocks Returned to Favor in 2007
U.S. stocks, as defined by the S&P 500 Index, posted positive absolute returns in 2007 despite a downturn in the U.S. economy and the effects of a credit crunch emanating from the sub-prime mortgage market over the second half of the year. Concerns regarding declining housing prices, higher energy costs and their potential influence on
The Portfolio 3
D I S C U S S I O N O F P E R F O R M A N C E (continued)
consumer spending weighed on the U.S. economy and parts of the stock market. The Federal Reserve Board attempted to promote greater market liquidity and forestall a potential recession by reducing the overnight federal funds rate three times between September and December, driving its target for short-term interest rates from 5.25% to 4.25% by the reporting period’s end.
In contrast to the flagging U.S. economy, global economic growth remained robust. Consequently, some of the year’s stronger gains stemmed from large domestic companies with overseas operations. For example, energy stocks ranked among the top contributors to the S&P 500 Index’s results for 2007, with major energy producers benefiting from powerful overseas demand and rising commodity prices. Similarly, materials stocks advanced amid persistently high demand for construction materials in emerging markets, such as China and India. Conversely, U.S. banks, broker-dealers and bond insurers posted sharp declines as they announced substantial sub-prime-related losses. Consumer discretionary stocks also suffered as investors shied away from companies that might be sensitive to slower consumer spending.
Stock Selection Strategy Produced Positive Results
As investors grew increasingly risk averse, they turned away from the smaller, more speculative stocks that led in the market in previous reporting periods. Instead, they began to favor multinational growth companies with a track record of consistent earnings growth across full economic cycles. The portfolio was well positioned for this development. The portfolio’s consumer staples stocks, which historically have tended to hold up well when the economy slows, fared particularly well. For example, tobacco giant Altria Group benefited from its spin-off of Kraft Foods and plans to separate from its international tobacco division. Beverage leaders Coca-Cola and PepsiCo achieved robust growth in overseas markets, as did household goods provider Procter & Gamble. Overweighted exposure to energy stocks, such as Exxon Mobil, also boosted the portfolio’s relative performance.
Disappointments during 2007 proved to be relatively mild. An underweighted position in information technology stocks prevented the portfolio from participating as fully as the benchmark in the sector’s
gains, but strong stock selections helped offset a portion of any allocation-related weakness. Similarly, the portfolio held no utilities and missed out on that relatively small sector’s advance. Although financial stocks — including some of the banks and brokers ensnared in the sub-prime mortgage debacle — produced negative absolute returns, our stock selection strategy enabled the portfolio’s financial holdings to outperform the benchmark’s financials component.
New Holdings Expected to Benefit from Ongoing Trends
We added a number of new positions to the portfolio during the reporting period that we believe will help it participate more fully in certain secular growth trends. For example, we added global energy services provider Haliburton to complement existing holdings of integrated oil producers as the major energy companies intensify their search for new sources of production. In the information technology area, Cisco Systems, QUALCOMM and Texas Instruments may give the portfolio greater exposure to rising demand for Internet bandwidth and the rising popularity of wireless “smartphone” products. Among industrial companies, Caterpillar and United Technologies are expected to benefit from the construction boom in overseas markets. In our judgment, economic and market conditions currently are ripe for large-cap growth stocks such as these.
January 15, 2008
| | | The portfolio is only available as a funding vehicle under variable life insurance policies or variable |
| | | annuity contracts issued by insurance companies. Individuals may not purchase shares of the |
| | | portfolio directly. A variable annuity is an insurance contract issued by an insurance company that |
| | | enables investors to accumulate assets on a tax-deferred basis for retirement or other long-term |
| | | goals.The investment objective and policies of Dreyfus Variable Investment Fund, Appreciation |
| | | Portfolio made available through insurance products may be similar to other funds/portfolios |
| | | managed or advised by Dreyfus. However, the investment results of the portfolio may be higher or |
| | | lower than, and may not be comparable to, those of any other Dreyfus fund/portfolio. |
| 1 | | Total return includes reinvestment of dividends and any capital gains paid. Past performance is no |
| | | guarantee of future results. Share price and investment return fluctuate such that upon redemption, |
| | | portfolio shares may be worth more or less than their original cost.The portfolio’s performance does |
| | | not reflect the deduction of additional charges and expenses imposed in connection with investing |
| | | in variable insurance contracts, which will reduce returns. |
| 2 | | SOURCE: LIPPER INC. — Reflects monthly reinvestment of dividends and, where |
| | | applicable, capital gain distributions.The Standard & Poor’s 500 Composite Stock Price Index is |
| | | a widely accepted, unmanaged index of U.S. stock market performance. |
The Portfolio 5
PORTFOLIO PERFORMANCE

| Average Annual Total Returns | | as of 12/31/07 | | | | | | |
| | | | | 1 Year | | 5 Years | | 10 Years |
| |
| |
| |
| |
|
| Initial shares | | | | 7.14% | | 10.64% | | 6.09% |
| Service shares | | | | 6.85% | | 10.36% | | 5.89% |
| The data for Service shares includes the results of Initial shares for the period prior to December 31, 2000 |
| (inception date of Service shares). Actual Service shares’ average annual total return and hypothetical growth |
| results would have been lower. See notes below. |
| † Source: Lipper Inc. |
| Past performance is not predictive of future performance.The portfolio’s performance shown in the graph and table does not |
| reflect the deduction of taxes that a shareholder would pay on portfolio distributions or the redemption of portfolio shares. |
| The portfolio’s performance does not reflect the deduction of additional charges and expenses imposed in |
| connection with investing in variable insurance contracts which will reduce returns. |
| The above graph compares a $10,000 investment made in Initial and Service shares of Dreyfus Variable Investment |
| Fund, Appreciation Portfolio on 12/31/97 to a $10,000 investment made in the Standard & Poor’s 500 Composite |
| Stock Price Index (the “Index”) on that date. |
6
The portfolio’s Initial shares are not subject to a Rule 12b-1 fee.The portfolio’s Service shares are subject to a 0.25% annual Rule 12b-1 fee.The performance figures for Service shares reflect the performance of the portfolio’s Initial shares from their inception date through December 30, 2000, and the performance of the portfolio’s Service shares from December 31, 2000 (inception date of Service shares) to December 31, 2007 (blended performance figures).The blended performance figures have not been adjusted to reflect the higher operating expenses of the Service shares. If these expenses had been reflected, the blended performance figures would have been lower. All dividends and capital gain distributions are reinvested.
The portfolio’s performance shown in the line graph takes into account all applicable portfolio fees and expenses.The Index is a widely accepted, unmanaged index of U.S. stock market performance. Unlike a mutual fund, the Index is not subject to charges, fees and other expenses. Investors cannot invest directly in any index. Further information relating to portfolio performance, including expense reimbursements, if applicable, is contained in the Financial Highlights section of the prospectus and elsewhere in this report.
The Portfolio 7
| UNDERSTANDING YOUR |
| PORTFOLIO’S EXPENSES (Unaudited) |
As a mutual fund investor,you pay ongoing expenses,such as management fees and other expenses.Using the information below,you can estimate how these expenses affect your investment and compare them with the expenses of other funds.You also may pay one-time transaction expenses,including sales charges (loads) and redemption fees, which are not shown in this section and would have resulted in higher total expenses. For more information, see your portfolio’s prospectus or talk to your financial adviser.
Review your portfolio’s expenses
The table below shows the expenses you would have paid on a $1,000 investment in Dreyfus Variable Investment Fund,Appreciation Portfolio from July 1, 2007 to December 31, 2007. It also shows how much a $1,000 investment would be worth at the close of the period, assuming actual returns and expenses.
| Expenses and Value of a $1,000 Investment | | |
| assuming actual returns for the six months ended December 31, 2007 |
| | | Initial Shares | | Service Shares |
| |
| |
|
| Expenses paid per $1,000 † | | $ 4.07 | | $ 5.34 |
| Ending value (after expenses) | | $1,017.30 | | $1,015.90 |
| COMPARING YOUR PORTFOLIO’S EXPENSES |
| WITH THOSE OF OTHER FUNDS (Unaudited) |
Using the SEC’s method to compare expenses
The Securities and Exchange Commission (SEC) has established guidelines to help investors assess fund expenses. Per these guidelines, the table below shows your portfolio’s expenses based on a $1,000 investment, assuming a hypothetical 5% annualized return. You can use this information to compare the ongoing expenses (but not transaction expenses or total cost) of investing in the portfolio with those of other funds. All mutual fund shareholder reports will provide this information to help you make this comparison. Please note that you cannot use this information to estimate your actual ending account balance and expenses paid during the period.
| Expenses and Value of a $1,000 Investment | | |
| assuming a hypothetical 5% annualized return for the six months ended December 31, 2007 |
| | | Initial Shares | | Service Shares |
| |
| |
|
| Expenses paid per $1,000 † | | $ 4.08 | | $ 5.35 |
| Ending value (after expenses) | | $1,021.17 | | $1,019.91 |
| † Expenses are equal to the portfolio’s annualized expense ratio of .80% for Initial shares and 1.05% for Service shares, |
| multiplied by the average account value over the period, multiplied by 184/365 (to reflect the one-half year period). |
8
| STATEMENT OF INVESTMENTS |
| D e c e m b e r 3 1 , 2 0 0 7 |
| Common Stocks—99.4% | | Shares | | Value ($) |
| |
| |
|
| Agriculture—6.8% | | | | |
| Altria Group | | 620,400 | | 46,889,832 |
| Consumer Discretionary—9.4% | | | | |
| Christian Dior | | 72,700 a | | 9,540,859 |
| McDonald’s | | 204,500 | | 12,047,095 |
| McGraw-Hill Cos. | | 403,600 | | 17,681,716 |
| News, Cl. A | | 606,436 | | 12,425,874 |
| News, Cl. B | | 9,800 | | 208,250 |
| Polo Ralph Lauren | | 40,000 | | 2,471,600 |
| Target | | 216,900 | | 10,845,000 |
| | | | | 65,220,394 |
| Consumer Staples—23.4% | | | | |
| Anheuser-Busch Cos. | | 130,100 | | 6,809,434 |
| Coca-Cola | | 610,500 | | 37,466,385 |
| Estee Lauder Cos., Cl. A | | 65,000 | | 2,834,650 |
| Nestle, ADR | | 217,000 | | 24,894,240 |
| PepsiCo | | 318,900 | | 24,204,510 |
| Procter & Gamble | | 410,000 | | 30,102,200 |
| SYSCO | | 100,000 | | 3,121,000 |
| Wal-Mart Stores | | 115,700 | | 5,499,221 |
| Walgreen | | 624,900 | | 23,796,192 |
| Whole Foods Market | | 70,000 a | | 2,856,000 |
| | | | | 161,583,832 |
| Energy—20.0% | | | | |
| BP, ADR | | 75,000 | | 5,487,750 |
| Chevron | | 303,300 | | 28,306,989 |
| ConocoPhillips | | 215,000 | | 18,984,500 |
| Exxon Mobil | | 530,064 | | 49,661,696 |
| Halliburton | | 100,000 | | 3,791,000 |
| Occidental Petroleum | | 140,000 | | 10,778,600 |
| Royal Dutch Shell, ADR | | 59,800 | | 5,035,160 |
| Total, ADR | | 120,000 | | 9,912,000 |
| Transocean | | 41,975 a,b | | 6,008,721 |
| | | | | 137,966,416 |
The Portfolio 9
| | S TAT E M E N T O F I N V E S T M E N T S (continued)
|
| Common Stocks (continued) | | Shares | | Value ($) |
| |
| |
|
| Financial—11.3% | | | | |
| American Express | | 145,500 | | 7,568,910 |
| American International Group | | 90,920 | | 5,300,636 |
| Ameriprise Financial | | 61,500 | | 3,389,265 |
| Bank of America | | 291,216 | | 12,015,572 |
| Citigroup | | 521,524 | | 15,353,666 |
| HSBC Holdings, ADR | | 50,000 a | | 4,185,500 |
| JPMorgan Chase & Co. | | 345,100 | | 15,063,615 |
| Merrill Lynch & Co. | | 145,500 | | 7,810,440 |
| SunTrust Banks | | 116,600 | | 7,286,334 |
| | | | | 77,973,938 |
| Health Care—9.1% | | | | |
| Abbott Laboratories | | 284,100 | | 15,952,215 |
| Eli Lilly & Co. | | 80,000 | | 4,271,200 |
| Johnson & Johnson | | 355,000 | | 23,678,500 |
| Medtronic | | 65,000 | | 3,267,550 |
| Merck & Co. | | 180,000 | | 10,459,800 |
| Roche Holding, ADR | | 64,000 | | 5,523,200 |
| | | | | 63,152,465 |
| Industrial—8.4% | | | | |
| Caterpillar | | 50,000 | | 3,628,000 |
| Emerson Electric | | 279,800 | | 15,853,468 |
| Fluor | | 40,000 a | | 5,828,800 |
| General Electric | | 745,700 | | 27,643,099 |
| United Technologies | | 64,000 | | 4,898,560 |
| | | | | 57,851,927 |
| Information Technology—9.4% | | | | |
| Automatic Data Processing | | 120,000 | | 5,343,600 |
| Cisco Systems | | 185,000 b | | 5,007,950 |
| Intel | | 1,054,700 | | 28,118,302 |
| Microsoft | | 477,300 | | 16,991,880 |
| QUALCOMM | | 90,000 | | 3,541,500 |
| Texas Instruments | | 188,500 | | 6,295,900 |
| | | | | 65,299,132 |
10
| Common Stocks (continued) | | Shares | | Value ($) |
| |
| |
|
| Materials—1.6% | | | | |
| Praxair | | 121,000 | | 10,733,910 |
| Total Common Stocks | | | | |
| (cost $442,085,497) | | | | 686,671,846 |
| |
| |
|
| |
| Other Investment—.1% | | | | |
| |
| |
|
| Registered Investment Company; | | | | |
| Dreyfus Institutional Preferred | | | | |
| Plus Money Market Fund | | | | |
| (cost $416,000) | | 416,000 c | | 416,000 |
| |
| |
|
| |
| Investment of Cash Collateral | | | | |
| for Securities Loaned—3.8% | | | | |
| |
| |
|
| Registered Investment Company; | | | | |
| Dreyfus Institutional Cash | | | | |
| Advantage Fund | | | | |
| (cost $26,302,278) | | 26,302,278 c | | 26,302,278 |
| |
| |
|
| |
| Total Investments (cost $468,803,775) | | 103.3% | | 713,390,124 |
| Liabilities, Less Cash and Receivables | | (3.3%) | | (22,962,107) |
| Net Assets | | 100.0% | | 690,428,017 |
| ADR—American Depository Receipts |
| a All or a portion of these securities are on loan. At December 31, 2007, the total market value of the portfolio’s |
| securities on loan is $25,274,401 and the total market value of the collateral held by the portfolio is $26,302,278. |
| b Non-income producing security. |
| c Investment in affiliated money market mutual fund. |
| Portfolio Summary | | (Unaudited) † | | | | |
| |
| | | Value (%) | | | | Value (%) |
| |
| |
| |
|
| Consumer Staples | | 23.4 | | Industrial | | 8.4 |
| Energy | | 20.0 | | Agriculture | | 6.8 |
| Financial | | 11.3 | | Money Market Investments | | 3.9 |
| Information Technology | | 9.4 | | Materials | | 1.6 |
| Consumer Discretionary | | 9.4 | | | | |
| Health Care | | 9.1 | | | | 103.3 |
| † Based on net assets. |
| See notes to financial statements. |
The Portfolio 11
| STATEMENT OF ASSETS AND LIABILITIES |
| D e c e m b e r 3 1 , 2 0 0 7 |
| | | Cost | | Value |
| |
| |
|
| Assets ($): | | | | |
| Investments in securities—See Statement of | | |
| Investments (including securities on loan, | | |
| valued at $25,274,401)—Note 1(c): | | |
| Unaffiliated issuers | | 442,085,497 | | 686,671,846 |
| Affiliated issuers | | 26,718,278 | | 26,718,278 |
| Cash | | | | 223,253 |
| Receivable for investment securities sold | | 11,882,974 |
| Receivable for shares of Beneficial Interest subscribed | | 1,223,884 |
| Dividends and interest receivable | | | | 1,076,603 |
| Prepaid expenses | | | | 25,506 |
| | | | | 727,822,344 |
| |
| |
|
| Liabilities ($): | | | | |
| Due to The Dreyfus Corporation and affiliates—Note 3(b) | | 321,814 |
| Due to Fayez Sarofim & Co. | | | | 188,039 |
| Liability for securities on loan—Note 1(c) | | 26,302,278 |
| Payable for shares of Beneficial Interest redeemed | | 10,460,372 |
| Interest payable—Note 2 | | | | 55,160 |
| Accrued expenses | | | | 66,664 |
| | | | | 37,394,327 |
| |
| |
|
| Net Assets ($) | | | | 690,428,017 |
| |
| |
|
| Composition of Net Assets ($): | | | | |
| Paid-in capital | | | | 392,225,623 |
| Accumulated undistributed investment income—net | | 11,117,042 |
| Accumulated net realized gain (loss) on investments | | 42,499,024 |
| Accumulated net unrealized appreciation (depreciation) | | |
| on investments and foreign currency transactions | | 244,586,328 |
| |
|
| Net Assets ($) | | | | 690,428,017 |
| Net Asset Value Per Share | | | | |
| | | Initial Shares | | Service Shares |
| |
| |
|
| Net Assets ($) | | 569,422,233 | | 121,005,784 |
| Shares Outstanding | | 12,694,451 | | 2,713,772 |
| |
| |
|
| Net Asset Value Per Share ($) | | 44.86 | | 44.59 |
See notes to financial statements.
12
| STATEMENT OF OPERATIONS |
| Ye a r E n d e d D e c e m b e r 3 1 , 2 0 0 7 |
| Investment Income ($): | | |
| Income: | | |
| Cash dividends (net of $206,896 foreign taxes withheld at source): |
| Unaffiliated issuers | | 17,263,293 |
| Affiliated issuers | | 51,114 |
| Income from securities lending | | 88,253 |
| Total Income | | 17,402,660 |
| Expenses: | | |
| Investment advisory fee—Note 3(a) | | 3,265,105 |
| Sub-investment advisory fee—Note 3(a) | | 2,365,105 |
| Distribution fees—Note 3(b) | | 297,138 |
| Prospectus and shareholders’ reports | | 107,379 |
| Custodian fees—Note 3(b) | | 61,027 |
| Interest expense—Note 2 | | 58,307 |
| Professional fees | | 52,990 |
| Trustees’ fees and expenses—Note 3(c) | | 39,642 |
| Loan commitment fees—Note 2 | | 5,925 |
| Shareholder servicing costs—Note 3(b) | | 5,693 |
| Miscellaneous | | 25,809 |
| Total Expenses | | 6,284,120 |
| Investment Income—Net | | 11,118,540 |
| |
|
| Realized and Unrealized Gain (Loss) on Investments—Note 4 ($): |
| Net realized gain (loss) on investments | | 56,502,140 |
| Net unrealized appreciation (depreciation) on | | |
| investments and foreign currency transactions | | (16,029,486) |
| Net Realized and Unrealized Gain (Loss) on Investments | | 40,472,654 |
| Net Increase in Net Assets Resulting from Operations | | 51,591,194 |
See notes to financial statements.
The Portfolio 13
STATEMENT OF CHANGES IN NET ASSETS
| | | Year Ended December 31, |
| |
|
| | | 2007 | | 2006 |
| |
| |
|
| Operations ($): | | | | |
| Investment income—net | | 11,118,540 | | 11,899,481 |
| Net realized gain (loss) on investments | | 56,502,140 | | 26,807,980 |
| Net unrealized appreciation | | | | |
| (depreciation) on investments | | (16,029,486) | | 78,292,140 |
| Net Increase (Decrease) in Net Assets | | | | |
| Resulting from Operations | | 51,591,194 | | 116,999,601 |
| |
| |
|
| Dividends to Shareholders from ($): | | | | |
| Investment income—net: | | | | |
| Initial Shares | | (10,305,011) | | (10,501,808) |
| Service Shares | | (1,592,630) | | (1,443,242) |
| Total Dividends | | (11,897,641) | | (11,945,050) |
| |
| |
|
| Beneficial Interest Transactions ($): | | | | |
| Net proceeds from shares sold: | | | | |
| Initial Shares | | 41,265,860 | | 69,395,793 |
| Service Shares | | 33,395,223 | | 40,577,961 |
| Dividends reinvested: | | | | |
| Initial Shares | | 10,305,011 | | 10,501,808 |
| Service Shares | | 1,592,630 | | 1,443,242 |
| Cost of shares redeemed: | | | | |
| Initial Shares | | (197,317,992) | | (174,553,296) |
| Service Shares | | (34,288,008) | | (41,477,673) |
| Increase (Decrease) in Net Assets from | | | | |
| Beneficial Interest Transactions | | (145,047,276) | | (94,112,165) |
| Total Increase (Decrease) in Net Assets | | (105,353,723) | | 10,942,386 |
| |
| |
|
| Net Assets ($): | | | | |
| Beginning of Period | | 795,781,740 | | 784,839,354 |
| End of Period | | 690,428,017 | | 795,781,740 |
| Undistributed investment income—net | | 11,117,042 | | 11,896,886 |
14
| | | Year Ended December 31, |
| |
|
| | | 2007 | | 2006 |
| |
| |
|
| Capital Share Transactions: | | | | |
| Initial Shares | | | | |
| Shares sold | | 948,930 | | 1,796,884 |
| Shares issued for dividends reinvested | | 247,360 | | 280,272 |
| Shares redeemed | | (4,506,835) | | (4,494,201) |
| Net Increase (Decrease) in Shares Outstanding | | (3,310,545) | | (2,417,045) |
| |
| |
|
| Service Shares | | | | |
| Shares sold | | 754,362 | | 1,029,879 |
| Shares issued for dividends reinvested | | 38,386 | | 38,651 |
| Shares redeemed | | (790,386) | | (1,097,163) |
| Net Increase (Decrease) in Shares Outstanding | | 2,362 | | (28,633) |
See notes to financial statements.
The Portfolio 15
FINANCIAL HIGHLIGHTS
The following tables describe the performance for each share class for the fiscal periods indicated.All information (except portfolio turnover rate) reflects financial results for a single portfolio share.Total return shows how much your investment in the portfolio would have increased (or decreased) during each period, assuming you had reinvested all dividends and distributions.These figures have been derived from the portfolio’s financial statements.
| | | | | Year Ended December 31, | | |
| |
| |
| |
|
| Initial Shares | | 2007 | | 2006 | | 2005 | | 2004 | | 2003 |
| |
| |
| |
| |
| |
|
| Per Share Data ($): | | | | | | | | | | |
| Net asset value, beginning of period | | 42.55 | | 37.11 | | 35.56 | | 34.42 | | 28.79 |
| Investment Operations: | | | | | | | | | | |
| Investment income—net a | | .66 | | .61 | | .54 | | .56 | | .43 |
| Net realized and unrealized | | | | | | | | | | |
| gain (loss) on investments | | 2.32 | | 5.42 | | 1.02 | | 1.18 | | 5.64 |
| Total from Investment Operations | | 2.98 | | 6.03 | | 1.56 | | 1.74 | | 6.07 |
| Distributions: | | | | | | | | | | |
| Dividends from investment income—net | | (.67) | | (.59) | | (.01) | | (.60) | | (.44) |
| Net asset value, end of period | | 44.86 | | 42.55 | | 37.11 | | 35.56 | | 34.42 |
| |
| |
| |
| |
| |
|
| Total Return (%) | | 7.14 | | 16.48 | | 4.38 | | 5.05 | | 21.17 |
| |
| |
| |
| |
| |
|
| Ratios/Supplemental Data (%): | | | | | | | | | | |
| Ratio of total expenses | | | | | | | | | | |
| to average net assets | | .80 | | .82 | | .80 | | .79 | | .80 |
| Ratio of net investment income | | | | | | | | | | |
| to average net assets | | 1.52 | | 1.58 | | 1.48 | | 1.60 | | 1.41 |
| Portfolio Turnover Rate | | 5.17 | | 3.86 | | 2.67 | | 1.64 | | 4.60 |
| |
| |
| |
| |
| |
|
| Net Assets, end of period ($ x 1,000) | | 569,422 | | 681,035 | | 683,667 | | 766,169 | | 821,319 |
| a Based on average shares outstanding at each month end. |
| See notes to financial statements. |
16
| | | | | Year Ended December 31, | | |
| |
| |
| |
|
| Service Shares | | 2007 | | 2006 | | 2005 | | 2004 | | 2003 |
| |
| |
| |
| |
| |
|
| Per Share Data ($): | | | | | | | | | | |
| Net asset value, beginning of period | | 42.32 | | 36.92 | | 35.46 | | 34.31 | | 28.71 |
| Investment Operations: | | | | | | | | | | |
| Investment income—net a | | .56 | | .51 | | .45 | | .46 | | .36 |
| Net realized and unrealized | | | | | | | | | | |
| gain (loss) on investments | | 2.30 | | 5.41 | | 1.01 | | 1.19 | | 5.61 |
| Total from Investment Operations | | 2.86 | | 5.92 | | 1.46 | | 1.65 | | 5.97 |
| Distributions: | | | | | | | | | | |
| Dividends from investment income—net | | (.59) | | (.52) | | — | | (.50) | | (.37) |
| Net asset value, end of period | | 44.59 | | 42.32 | | 36.92 | | 35.46 | | 34.31 |
| |
| |
| |
| |
| |
|
| Total Return (%) | | 6.85 | | 16.21 | | 4.12 | | 4.80 | | 20.83 |
| |
| |
| |
| |
| |
|
| Ratios/Supplemental Data (%): | | | | | | | | | | |
| Ratio of total expenses | | | | | | | | | | |
| to average net assets | | 1.05 | | 1.07 | | 1.05 | | 1.04 | | 1.05 |
| Ratio of net investment income | | | | | | | | | | |
| to average net assets | | 1.27 | | 1.33 | | 1.24 | | 1.34 | | 1.16 |
| Portfolio Turnover Rate | | 5.17 | | 3.86 | | 2.67 | | 1.64 | | 4.60 |
| |
| |
| |
| |
| |
|
| Net Assets, end of period ($ x 1,000) | | 121,006 | | 114,746 | | 101,172 | | 80,529 | | 89,121 |
| a Based on average shares outstanding at each month end. |
| See notes to financial statements. |
The Portfolio 17
NOTES TO FINANCIAL STATEMENTS
NOTE 1—Significant Accounting Policies:
Dreyfus Variable Investment Fund (the “fund”) is registered under the Investment Company Act of 1940, as amended (the “Act”), as an open-end management investment company, operating as a series company currently offering seven series, including the Appreciation Portfolio (the “portfolio”). The portfolio is only offered to separate accounts established by insurance companies to fund variable annuity contracts and variable life insurance policies.The portfolio is a diversified series.The portfolio’s investment objective is to provide long-term capital growth consistent with the preservation of capital. The Dreyfus Corporation (“the Manager” or “Dreyfus”) serves as the portfolio’s investment adviser. Fayez Sarofim & Co. (“Sarofim & Co.”) serves as the portfolio’s sub-investment adviser.
On July 1, 2007, Mellon Financial Corporation and The Bank of New York Company, Inc. merged, forming The Bank of New York Mellon Corporation (“BNY Mellon”). As part of this transaction, Dreyfus became a wholly-owned subsidiary of BNY Mellon.
MBSC Securities Corporation (the “Distributor”), a wholly-owned subsidiary of Dreyfus, is the distributor of the portfolio’s shares, which are sold without a sales charge.The portfolio is authorized to issue an unlimited number of $.001 par value shares of Beneficial Interest in each of the following classes of shares: Initial and Service. Each class of shares has identical rights and privileges, except with respect to the distribution plan and the expenses borne by each class, the allocation of certain transfer agency costs and certain voting rights. Income, expenses (other than expenses attributable to a specific class), and realized and unrealized gains or losses on investments are allocated to each class of shares based on its relative net assets.
The fund accounts separately for the assets, liabilities and operations of each series. Expenses directly attributable to each series are charged to that series’ operations; expenses which are applicable to all series are allocated among them on a pro rata basis.
18
The portfolio’s financial statements are prepared in accordance with U.S. generally accepted accounting principles, which may require the use of management estimates and assumptions.Actual results could differ from those estimates.
The fund enters into contracts that contain a variety of indemnifica-tions.The portfolio’s maximum exposure under these arrangements is unknown. The portfolio does not anticipate recognizing any loss related to these arrangements.
(a) Portfolio valuation: Investments in securities are valued at the last sales price on the securities exchange or national securities market on which such securities are primarily traded. Securities listed on the National Market System for which market quotations are available are valued at the official closing price or, if there is no official closing price that day, at the last sales price. Securities not listed on an exchange or the national securities market, or securities for which there were no transactions, are valued at the average of the most recent bid and asked prices, except for open short positions, where the asked price is used for valuation purposes. Bid price is used when no asked price is available. Registered open-end investment companies that are not traded on an exchange are valued at their net asset value.When market quotations or official closing prices are not readily available, or are determined not to reflect accurately fair value, such as when the value of a security has been significantly affected by events after the close of the exchange or market on which the security is principally traded (for example, a foreign exchange or market), but before the portfolio calculates its net asset value, the portfolio may value these investments at fair value as determined in accordance with the procedures approved by the Board of Trustees. Fair valuing of securities may be determined with the assistance of a pricing service using calculations based on indices of domestic securities and other appropriate indicators, such as prices of relevant ADRs and futures contracts. For other securities that are fair valued by the Board of Trustees, certain factors may be considered such
The Portfolio 19
N O T E S T O F I N A N C I A L S TAT E M E N T S (continued)
as: fundamental analytical data, the nature and duration of restrictions on disposition, an evaluation of the forces that influence the market in which the securities are purchased and sold and public trading in similar securities of the issuer or comparable issuers. Financial futures are valued at the last sales price. Investments denominated in foreign currencies are translated to U.S. dollars at the prevailing rates of exchange. Forward currency exchange contracts are valued at the forward rate.
The Financial Accounting Standards Board (“FASB”) released Statement of Financial Accounting Standards No. 157 “Fair Value Measurements” (“FAS 157”). FAS 157 establishes an authoritative definition of fair value, sets out a framework for measuring fair value, and requires additional disclosures about fair-value measurements.The application of FAS 157 is required for fiscal years beginning after November 15, 2007 and interim periods within those fiscal years. Management does not believe that the application of this standard will have a material impact on the financial statements of the portfolio.
(b) Foreign currency transactions: The portfolio does not isolate that portion of the results of operations resulting from changes in foreign exchange rates on investments from the fluctuations arising from changes in market prices of securities held. Such fluctuations are included with the net realized and unrealized gains or losses on investments.
Net realized foreign exchange gains or losses arise from sales and maturities of short-term securities, sales of foreign currencies, currency gains or losses realized on securities transactions and the difference between the amounts of dividends, interest and foreign withholding taxes recorded on the portfolio’s books and the U.S. dollar equivalent of the amounts actually received or paid. Net unrealized foreign exchange gains and losses arise from changes in the value of assets and liabilities other than investments in securities, resulting from changes in exchange rates. Such gains and losses are included with net realized and unrealized gains or losses on investments.
(c) Securities transactions and investment income: Securities transactions are recorded on a trade date basis. Realized gains and losses from securities transactions are recorded on the identified cost basis.
20
Dividend income is recognized on the ex-dividend date and interest income, including, where applicable, accretion of discount and amortization of premium on investments, is recognized on the accrual basis.
The portfolio has an arrangement with the custodian bank whereby the portfolio receives earnings credits from the custodian when positive cash balances are maintained, which are used to offset custody fees. For financial reporting purposes, the portfolio includes net earnings credits, if any, as an expense offset in the Statement of Operations.
Pursuant to a securities lending agreement with Mellon Bank, N.A. (“Mellon Bank”), an affiliate of Dreyfus, the portfolio may lend securities to qualified institutions. It is the portfolio’s policy, that at origination, all loans are secured by collateral of at least 102% of the value of U.S. securities loaned and 105% of the value of foreign securities loaned. Collateral equivalent to at least 100% of the market value of securities on loan is maintained at all times. Collaterals are either in the form of cash, which can be invested in certain money market mutual funds managed by Dreyfus, U.S. Government and Agency securities or Letters of Credit. The portfolio is entitled to receive all income on securities loaned, in addition to income earned as a result of the lending transaction. Although each security loaned is fully collateralized, the portfolio bears the risk of delay in recovery of, or loss of rights in, the securities loaned should a borrower fail to return the securities in a timely manner. During the period ended December 31, 2007, Mellon Bank earned $37,823 from lending portfolio securities, pursuant to the securities lending agreement.
(d) Affiliated issuers: Investments in other investment companies advised by Dreyfus are defined as “affiliated” in the Act.
(e) Dividends to shareholders: Dividends are recorded on the ex-dividend date. Dividends from investment income-net and dividends from net realized capital gains, if any, are normally declared and paid annually,
The Portfolio 21
N O T E S T O F I N A N C I A L S TAT E M E N T S (continued)
but the portfolio may make distributions on a more frequent basis to comply with the distribution requirements of the Internal Revenue Code of 1986, as amended (the “Code”).To the extent that net realized capital gains can be offset by capital loss carryovers, it is the policy of the portfolio not to distribute such gains. Income and capital gain distributions are determined in accordance with income tax regulations, which may differ from U.S. generally accepted accounting principles.
(f) Federal income taxes: It is the policy of the portfolio to continue to qualify as a regulated investment company, if such qualification is in the best interests of its shareholders, by complying with the applicable provisions of the Code, and to make distributions of taxable income sufficient to relieve it from substantially all federal income and excise taxes.
During the current year, the portfolio adopted FASB Interpretation No. 48 “Accounting for Uncertainty in Income Taxes” (“FIN 48”). FIN 48 provides guidance for how uncertain tax positions should be recognized, measured, presented and disclosed in the financial statements. FIN 48 requires the evaluation of tax positions taken or expected to be taken in the course of preparing the portfolio’s tax returns to determine whether the tax positions are “more-likely-than-not” of being sustained by the applicable tax authority. Tax positions not deemed to meet the more-likely-than-not threshold would be recorded as a tax benefit or expense in the current year.The adoption of FIN 48 had no impact on the operations of the portfolio for the period ended December 31, 2007.
The portfolio is not subject to examination by U.S. Federal, State and City tax authorities for the tax years before 2004.
At December 31, 2007, the components of accumulated earnings on a tax basis were as follows: undistributed ordinary income $11,212,115, undistributed capital gains $42,403,965 and unrealized appreciation $244,586,314.
22
The tax characters of distributions paid to shareholders during the fiscal periods ended December 31, 2007 and December 31, 2006 were as follows: ordinary income $11,897,641 and $11,945,050, respectively.
During the period ended December 31, 2007, as a result of permanent book to tax differences, primarily due to the tax treatment for foreign currency exchange gains and losses, the portfolio decreased accumulated undistributed investment income-net by $743 and increased accumulated net realized gain (loss) on investments by the same amount.Net assets and net asset value per share were not affected by this reclassification.
NOTE 2—Bank Line of Credit:
The portfolio participates with other Dreyfus-managed funds in a $350 million redemption credit facility (the “Facility”) to be utilized for temporary or emergency purposes, including the financing of redemptions. In connection therewith, the portfolio has agreed to pay commitment fees on its pro rata portion of the Facility. Interest is charged to the portfolio at rates based on prevailing market rates in effect at the time of borrowing.
The average daily amount of borrowings outstanding under the Facility during the period ended December 31, 2007 was approximately $1,027,500, with a related weighted average annualized interest rate of 5.67% .
NOTE 3—Investment Advisory Fee, Sub-Investment Advisory Fee and Other Transactions With Affiliates:
(a) Pursuant to an Investment Advisory Agreement with Dreyfus, the investment advisory fee is based on the value of the portfolio’s average daily net assets and is computed at the following annual rates: .55% of the first $150 million; .50% of the next $150 million; and .375% over $300 million.The fee is payable monthly. Pursuant to a Sub-Investment Advisory Agreement with Sarofim & Co., the sub-investment advisory fee is based upon the value of the portfolio’s average daily net assets and
The Portfolio 23
N O T E S T O F I N A N C I A L S TAT E M E N T S (continued)
is computed at the following annual rates: .20% of the first $150 million; .25% of the next $150 million; and .375% over $300 million.The fee is payable monthly.
(b) Under the Distribution Plan (the “Plan”) adopted pursuant to Rule 12b-1 under the Act, Service shares pay the Distributor for distributing their shares, for servicing and/or maintaining Service shares shareholder accounts and for advertising and marketing for Service shares.The Plan provides for payments to be made at an annual rate of .25% of the value of the Service shares’ average daily net assets.The Distributor may make payments to Participating Insurance Companies and to brokers and dealers acting as principal underwriter for their variable insurance products.The fees payable under the Plan are payable without regard to actual expenses incurred. During the period ended December 31, 2007, Service shares were charged $297,138 pursuant to the Plan.
The portfolio compensates Dreyfus Transfer, Inc., a wholly-owned subsidiary of Dreyfus, under a transfer agency agreement for providing personnel and facilities to perform transfer agency services for the portfolio. During the period ended December 31, 2007, the portfolio was charged $1,265 pursuant to the transfer agency agreement.
The portfolio compensates Mellon Bank, an affiliate of Dreyfus, under a custody agreement for providing custodial services for the portfolio. During the period ended December 31, 2007, the portfolio was charged $61,027 pursuant to the custody agreement.
During the period ended December 31, 2007, the portfolio was charged $4,821 for services performed by the Chief Compliance Officer.
The components of “Due to The Dreyfus Corporation and affiliates” in the Statement of Assets and Liabilities consist of: investment advisory fees $264,477, Rule 12b-1 distribution plan fees $27,878, custodian fees $25,648, chief compliance officer fees $3,616 and transfer agency per account fees $195.
24
(c) Each Board member also serves as a Board member of other funds within the Dreyfus complex. Annual retainer fees and attendance fees are allocated to each fund based on net assets.
NOTE 4—Securities Transactions:
The aggregate amount of purchases and sales of investment securities, excluding short-term securities, during the period ended December 31, 2007, amounted to $38,697,804 and $186,205,298, respectively.
At December 31, 2007, the cost of investments for federal income tax purposes was $468,803,789; accordingly, accumulated net unrealized appreciation on investments was $244,586,335, consisting of $251,391,508 gross unrealized appreciation and $6,805,173 gross unrealized depreciation.
The Portfolio 25
| REPORT OF INDEPENDENT REGISTERED |
| PUBLIC ACCOUNTING FIRM |
| Shareholders and Board of Trustees |
| Dreyfus Variable Investment Fund, Appreciation Portfolio |
We have audited the accompanying statement of assets and liabilities, including the statement of investments, of Dreyfus Variable Investment Fund, Appreciation Portfolio (one of the funds comprising Dreyfus Variable Investment Fund) as of December 31, 2007, and the related statement of operations for the year then ended, the statement of changes in net assets for each of the two years in the period then ended, and financial highlights for each of the years indicated therein. These financial statements and financial highlights are the responsibility of the Fund’s management. Our responsibility is to express an opinion on these financial statements and financial highlights based on our audits.
We conducted our audits in accordance with the standards of the Public Company Accounting Oversight Board (United States).Those standards require that we plan and perform the audit to obtain reasonable assurance about whether the financial statements and financial highlights are free of material misstatement.We were not engaged to perform an audit of the Fund’s internal control over financial reporting.Our audits included consideration of internal control over financial reporting as a basis for designing audit procedures that are appropriate in the circumstances,but not for the purpose of expressing an opinion on the effectiveness of the Fund’s internal control over financial reporting.Accordingly, we express no such opinion.An audit also includes examining, on a test basis, evidence supporting the amounts and disclosures in the financial statements and financial highlights, assessing the accounting principles used and significant estimates made by management, and evaluating the overall financial statement presentation. Our procedures included confirmation of securities owned as of December 31, 2007 by correspondence with the custodian. We believe that our audits provide a reasonable basis for our opinion.
In our opinion, the financial statements and financial highlights referred to above present fairly, in all material respects, the financial position of Dreyfus Variable Investment Fund, Appreciation Portfolio at December 31,2007,the results of its operations for the year then ended,the changes in its net assets for each of the two years in the period then ended, and the financial highlights for each of the indicated years, in conformity with U. S. generally accepted accounting principles.

| New York, New York |
| February 8, 2008 |
26
IMPORTANT TAX INFORMATION (Unaudited)
For federal tax purposes, the portfolio hereby designates 100% of the ordinary dividends paid during the fiscal year ended December 31, 2007 as qualifying for the corporate dividends received deduction. Shareholders will receive notification in January 2008 of the percentage applicable to the preparation of their 2007 income tax returns.
The Portfolio 27
BOARD MEMBERS INFORMATION (Unaudited)
| Joseph S. DiMartino (64) |
| Chairman of the Board (1995) |
| Principal Occupation During Past 5 Years: |
| • Corporate Director and Trustee |
Other Board Memberships and Affiliations:
- The Muscular Dystrophy Association, Director
- Century Business Services, Inc., a provider of outsourcing functions for small and medium size companies, Director
- The Newark Group, a provider of a national market of paper recovery facilities, paperboard mills and paperboard converting plants, Director
- Sunair Services Corporation, a provider of certain outdoor-related services to homes and businesses, Director
No. of Portfolios for which Board Member Serves: 163 ———————
| Peggy C. Davis (64) |
| Board Member (2006) |
Principal Occupation During Past 5 Years:
- Shad Professor of Law, New York University School of Law (1983-present)
- Writer and teacher in the fields of evidence, constitutional theory, family law, social sciences and the law, legal process and professional methodology and training
No. of Portfolios for which Board Member Serves: 64 ———————
| David P. Feldman (68) |
| Board Member (1994) |
| Principal Occupation During Past 5 Years: |
| • Corporate Director and Trustee |
Other Board Memberships and Affiliations:
- BBH Mutual Funds Group (11 funds), Director
- The Jeffrey Company, a private investment company, Director
No. of Portfolios for which Board Member Serves: 50
28
| James F. Henry (77) |
| Board Member (1990) |
- President,The International Institute for Conflict Prevention and Resolution, a non- profit organization principally engaged in the development of alternatives to business litigation (Retired 2003)
- Advisor to The Elaw Forum, a consultant on managing corporate legal costs
- Advisor to John Jay Homestead (the restored home of the first U.S. Chief Justice)
- Individual Trustee of several trusts
Other Board Memberships and Affiliations:
- Director, advisor and mediator involved in several non-profit organizations, primarily engaged in domestic and international dispute resolution, and historic preservation
No. of Portfolios for which Board Member Serves: 41 ———————
| Ehud Houminer (67) |
| Board Member (2006) |
| Principal Occupation During Past 5 Years: |
| • Executive-in-Residence at the Columbia Business School, Columbia University |
Other Board Memberships and Affiliations:
- Avnet Inc., an electronics distributor, Director
- International Advisory Board to the MBA Program School of Management, Ben Gurion University, Chairman
No. of Portfolios for which Board Member Serves: 67 ———————
| Gloria Messinger (78) |
| Board Member (2006) |
Principal Occupation During Past 5 Years:
- Arbitrator for American Arbitration Association and National Association of Securities Dealers, Inc.
- Consultant in Intellectual Property
Other Board Memberships and Affiliations:
- Theater for a New Audience, Inc., Director
- Brooklyn Philharmonic, Director
No. of Portfolios for which Board Member Serves: 41
The Portfolio 29
B O A R D M E M B E R S I N F O R M AT I O N ( U n a u d i t e d ) (continued)
| Dr. Martin Peretz (68) |
| Board Member (1990) |
Principal Occupation During Past 5 Years:
- Editor-in-Chief of The New Republic Magazine
- Lecturer in Social Studies at Harvard University (1965-2002)
- Director of TheStreet.com, a financial information service on the web
Other Board Memberships and Affiliations:
- American Council of Trustees and Alumni, Director
- Pershing Square Capital Management, Advisor
- Montefiore Ventures, General Partner
- Harvard Center for Blood Research,Trustee
- Bard College,Trustee
- Board of Overseers of YIVO Institute for Jewish Research, Chairman
No. of Portfolios for which Board Member Serves: 41 ———————
| Anne Wexler (77) |
| Board Member (2006) |
Principal Occupation During Past 5 Years:
- Chairman of the Wexler & Walker Public Policy Associates, consultants specializing in government relations and public affairs from January 1981 to present
Other Board Memberships and Affiliations:
- Wilshire Mutual Funds (5 funds), Director
- The Community Foundation for the National Capital Region, Director
- Member of the Council of Foreign Relations
- Member of the National Park Foundation
No. of Portfolios for which Board Member Serves: 50 ———————
Once elected all Board Members serve for an indefinite term, but achieve Emeritus status upon reaching age 80.The address of the Board Members and Officers is in c/o The Dreyfus Corporation, 200 Park Avenue, New York, New York 10166. Additional information about the Board Members is available in the fund’s Statement of Additional Information which can be obtained from Dreyfus free of charge by calling this toll free number: 1-800-554-4611.
| John M. Fraser, Jr., Emeritus Board Member |
| Rosalind G. Jacobs, Emeritus Board Member |
| Dr. Paul A. Marks, Emeritus Board Member |
30
OFFICERS OF THE FUND (Unaudited)
| J. DAVID OFFICER, President since |
| December 2006. |
Chief Operating Officer,Vice Chairman and a Director of the Manager, and an officer of 78 investment companies (comprised of 163 portfolios) managed by the Manager. He is 59 years old and has been an employee of the Manager since April 1998.
| PHILLIP N. MAISANO, Executive Vice |
| President since July 2007. |
Chief Investment Officer,Vice Chair and a director of the Manager, and an officer of 78 investment companies (comprised of 163 portfolios) managed by the Manager. Mr. Maisano also is an officer and/or Board member of certain other investment management subsidiaries of The Bank of New York Mellon Corporation, each of which is an affiliate of the Manager. He is 60 years old and has been an employee of the Manager since November 2006. Prior to joining the Manager, Mr. Maisano served as Chairman and Chief Executive Officer of EACM Advisors, an affiliate of the Manager, since August 2004, and served as Chief Executive Officer of Evaluation Associates, a leading institutional investment consulting firm, from 1988 until 2004.
| MICHAEL A. ROSENBERG, Vice President |
| and Secretary since August 2005. |
Associate General Counsel of the Manager, and an officer of 79 investment companies (comprised of 180 portfolios) managed by the Manager. He is 47 years old and has been an employee of the Manager since October 1991.
| JAMES BITETTO, Vice President and |
| Assistant Secretary since August 2005. |
Associate General Counsel and Secretary of the Manager, and an officer of 79 investment companies (comprised of 180 portfolios) managed by the Manager. He is 41 years old and has been an employee of the Manager since December 1996.
| JONI LACKS CHARATAN, Vice President |
| and Assistant Secretary since |
| August 2005. |
Associate General Counsel of the Manager, and an officer of 79 investment companies (comprised of 180 portfolios) managed by the Manager. She is 52 years old and has been an employee of the Manager since October 1988.
| JOSEPH M. CHIOFFI, Vice President and |
| Assistant Secretary since August 2005. |
Associate General Counsel of the Manager, and an officer of 79 investment companies (comprised of 180 portfolios) managed by the Manager. He is 46 years old and has been an employee of the Manager since June 2000.
| JANETTE E. FARRAGHER, Vice President |
| and Assistant Secretary since |
| August 2005. |
Associate General Counsel of the Manager, and an officer of 79 investment companies (comprised of 180 portfolios) managed by the Manager. She is 45 years old and has been an employee of the Manager since February 1984.
| JOHN B. HAMMALIAN, Vice President and |
| Assistant Secretary since August 2005. |
Associate General Counsel of the Manager, and an officer of 79 investment companies (comprised of 180 portfolios) managed by the Manager. He is 44 years old and has been an employee of the Manager since February 1991.
| ROBERT R. MULLERY, Vice President and |
| Assistant Secretary since August 2005. |
Associate General Counsel of the Manager, and an officer of 79 investment companies (comprised of 180 portfolios) managed by the Manager. He is 55 years old and has been an employee of the Manager since May 1986.
The Portfolio 31
O F F I C E R S O F T H E F U N D ( U n a u d i t e d ) (continued)
| JEFF PRUSNOFSKY, Vice President and |
| Assistant Secretary since August 2005. |
Associate General Counsel of the Manager, and an officer of 79 investment companies (comprised of 180 portfolios) managed by the Manager. He is 42 years old and has been an employee of the Manager since October 1990.
| JAMES WINDELS, Treasurer since |
| November 2001. |
Director – Mutual Fund Accounting of the Manager, and an officer of 79 investment companies (comprised of 180 portfolios) managed by the Manager. He is 49 years old and has been an employee of the Manager since April 1985.
| ROBERT ROBOL, Assistant Treasurer |
| since August 2003. |
Senior Accounting Manager – Money Market and Municipal Bond Funds of the Manager, and an officer of 79 investment companies (comprised of 180 portfolios) managed by the Manager. He is 43 years old and has been an employee of the Manager since October 1988.
| ROBERT SALVIOLO, Assistant Treasurer |
| since July 2007. |
Senior Accounting Manager – Equity Funds of the Manager, and an officer of 79 investment companies (comprised of 180 portfolios) managed by the Manager. He is 40 years old and has been an employee of the Manager since June 1989.
| ROBERT SVAGNA, Assistant Treasurer |
| since December 2002. |
Senior Accounting Manager – Equity Funds of the Manager, and an officer of 79 investment companies (comprised of 180 portfolios) managed by the Manager. He is 40 years old and has been an employee of the Manager since November 1990.
| GAVIN C. REILLY, Assistant Treasurer |
| since December 2005. |
Tax Manager of the Investment Accounting and Support Department of the Manager, and an officer of 79 investment companies (comprised of 180 portfolios) managed by the Manager. He is 39 years old and has been an employee of the Manager since April 1991.
| JOSEPH W. CONNOLLY, Chief Compliance |
| Officer since October 2004. |
Chief Compliance Officer of the Manager and The Dreyfus Family of Funds (79 investment companies, comprised of 180 portfolios). From November 2001 through March 2004, Mr. Connolly was first Vice-President, Mutual Fund Servicing for Mellon Global Securities Services. In that capacity, Mr. Connolly was responsible for managing Mellon’s Custody, Fund Accounting and Fund Administration services to third-party mutual fund clients. He is 50 years old and has served in various capacities with the Manager since 1980, including manager of the firm’s Fund Accounting Department from 1997 through October 2001.
| WILLIAM GERMENIS, Anti-Money |
| Laundering Compliance Officer since |
| September 2002. |
Vice President and Anti-Money Laundering Compliance Officer of the Distributor, and the Anti-Money Laundering Compliance Officer of 75 investment companies (comprised of 176 portfolios) managed by the Manager. He is 37 years old and has been an employee of the Distributor since October 1998.
32
Telephone 1-800-554-4611 or 516-338-3300
| Mail | | The Dreyfus Family of Funds, 144 Glenn Curtiss Boulevard, Uniondale, NY 11556-0144 |
| | | Attn: Investments Division |
The portfolio files its complete schedule of portfolio holdings with the Securities and Exchange Commission (“SEC”) for the first and third quarters of each fiscal year on Form N-Q. The portfolio’s Forms N-Q are available on the SEC’s website at http://www.sec.gov and may be reviewed and copied at the SEC’s Public Reference Room in Washington, DC. Information on the operation of the Public Reference Room may be obtained by calling 1-202-551-8090.
A description of the policies and procedures that the portfolio uses to determine how to vote proxies relating to portfolio securities, and information regarding how the portfolio voted these proxies for the 12-month period ended June 30, 2007, is available at http://www.dreyfus.com and on the SEC’s website at http://www.sec.gov. The description of the policies and procedures is also available without charge, upon request, by calling 1-800-645-6561.
© 2008 MBSC Securities Corporation


The views expressed in this report reflect those of the portfolio manager only through the end of the period covered and do not necessarily represent the views of Dreyfus or any other person in the Dreyfus organization.Any such views are subject to change at any time based upon market or other conditions and Dreyfus disclaims any responsibility to update such views. These views may not be relied on as investment advice and, because investment decisions for a Dreyfus portfolio are based on numerous factors, may not be relied on as an indication of trading intent on behalf of any Dreyfus portfolio.
Not FDIC-Insured • Not Bank-Guaranteed • May Lose Value
| | | Contents |
| |
| | | THE PORTFOLIO |
| |
|
| 2 | | A Letter from the CEO |
| 3 | | Discussion of Performance |
| 6 | | Portfolio Performance |
| 8 | | Understanding Your Portfolio’s Expenses |
| 8 | | Comparing Your Portfolio’s Expenses |
| | | With Those of Other Funds |
| 9 | | Statement of Investments |
| 17 | | Statement of Assets and Liabilities |
| 18 | | Statement of Operations |
| 19 | | Statement of Changes in Net Assets |
| 21 | | Financial Highlights |
| 23 | | Notes to Financial Statements |
| 30 | | Report of Independent Registered |
| | | Public Accounting Firm |
| 31 | | Important Tax Information |
| 32 | | Board Members Information |
| 35 | | Officers of the Fund |
| FOR MORE INFORMATION |
|
| | | Back Cover |
The Portfolio
| Dreyfus Variable Investment Fund, |
| Developing Leaders Portfolio |

A LETTER FROM THE CEO
Dear Shareholder:
We are pleased to present this annual report for Dreyfus Variable Investment Fund, Developing Leaders Portfolio, covering the 12-month period from January 1, 2007, through December 31, 2007.
Looking back, 2007 was a year of significant change for the stock market.Turmoil in the sub-prime mortgage market, declining housing values and soaring energy prices sparked a “flight to quality” in which investors reassessed their attitudes toward risk. As a result, smaller, more speculative companies that had led the stock market over the past several years lost value over the second half of the year, while shares of larger, multinational growth companies returned to favor. Many financial services and consumer discretionary companies were hurt by repercussions from the sub-prime lending crisis and economic downturn, but energy and basic materials producers generally moved higher along with underlying commodity prices.
The turbulence of 2007 reinforced a central principle of successful investing: diversification. Investors with broad exposure to the world’s stock and bond markets were better protected from the full impact of market volatility in areas that, earlier in the year, were among the bright spots at the time. As we look ahead, we believe that now is the perfect time to meet with your financial advisor, who can help you plan and diversify your investment portfolio in a way that manages the potential opportunities and risks that may continue to arise in 2008.
For information about how the portfolio performed during the reporting period, as well as market perspectives, we have provided a Discussion of Performance given by the Portfolio Managers.
Thank you for your continued confidence and support.
Thomas F. Eggers
Chief Executive Officer
The Dreyfus Corporation
January 15, 2008
|

DISCUSSION OF PERFORMANCE
For the reporting period of January 1, 2007, through December 31, 2007, as provided by Franklin Portfolio Associates Smallcap Team, Portfolio Managers
Market and Portfolio Performance Overview
Shifting economic conditions led to heightened market volatility in 2007. Stocks generally rose during the first half of the year in response to global economic expansion, but declined over the second half under pressure from slowing U.S. growth and a credit crunch emanating from the troubled subprime mortgage market. Small-cap stocks generally underperformed their large-cap counterparts as market strength rotated from small-cap and value-oriented stocks toward larger, more growth-oriented shares.The portfolio underperformed its benchmark, primarily due to the weak performance of several stocks that ranked high on our valuation-related metrics.
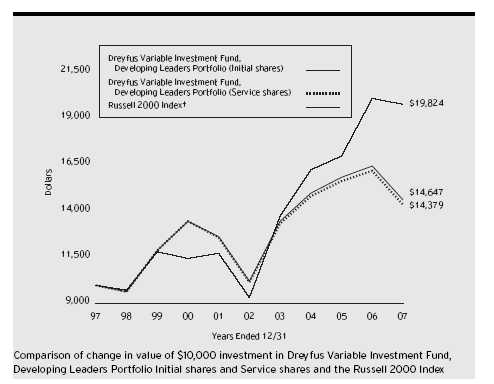
For the 12-month period ended December 31, 2007, Dreyfus Variable Investment Fund, Developing Leaders Portfolio produced total returns of –11.06% for its Initial shares and –11.28% for its Service shares.1 In comparison, the Russell 2000 Index (the “Index”), the portfolio’s benchmark, produced a total return of –1.57% for the same period.2
The Portfolio’s Investment Approach
We select small-cap stocks through a “bottom-up” approach that seeks to identify undervalued securities using a quantitative screening process. This process is driven by a proprietary quantitative model, which measures more than 40 stock characteristics to identify and rank stocks based on fundamental momentum, relative value, future value, long-term growth and other factors. Over time, we attempt to construct a portfolio that has exposure to industries and market capitalizations generally similar to the portfolio’s benchmark. Within each sector, we seek to overweight the most attractive stocks and underweight or not hold the stocks that have been ranked least attractive.
The Portfolio 3
DISCUSSION OF PERFORMANCE (continued)
Our Valuation Metrics Underperformed Market Averages
During the reporting period, the market tended to reward relatively high-priced stocks that exhibited strong growth characteristics, while disregarding many of the valuation metrics on which the portfolio relies. As a result, several holdings that appeared to us to be attractively valued significantly underperformed the benchmark. In some cases, these stocks suffered as a direct result of clear economic trends. For example, financial services providers Ocwen Financial, BankUnited Financial and Fremont General declined as a result of their exposure to the sub-prime loan market. Similarly, consumer-related holdings, such as restaurant chain Ruby Tuesday and discount retailer Big Lots, were hurt by declining consumer confidence. Other firms, such as plastics maker Spartech, suffered from the decline in residential construction during the reporting period.
In other instances, company-specific issues were primarily responsible for a holding’s negative performance. Cosmetic laser system developer Palomar Medical Technologies slipped after reporting disappointing earnings and revenues. Independent oil refiner Western Refining lost ground during the second half of 2007 due to rising operational and maintenance costs. Digital media products and services provider RealNetworks was undermined by broad economic weakness and the highly competitive environment in which it operates.
On the other hand, the portfolio benefited from certain investments in global companies with a significant presence in overseas markets.Two of the portfolio’s top performers, agricultural basic materials producers CF Industries Holdings and Terra Industries, each advanced by roughly 300%, primarily on the strength of higher agricultural commodity prices and strong global demand for fertilizers. GrafTech International, a producer of graphite and carbon-based products used in a wide range of industries around the world, rose after announcing sharply higher earnings per share for the first quarter of 2007 than for the same period in 2006, and significantly increasing its forward-looking sales growth guidance. Internet-based travel services provider Priceline.com climbed throughout the reporting period, bolstered by impressive European growth and improving domestic performance.
Staying the Course in a Turbulent Market
The market’s recent shift from value toward growth/momentum may have been exacerbated by negative developments in the sub-prime lending market. Nevertheless, we believe these developments represent the kind of cyclical market shift we have seen many times in the past and will no doubt encounter again. During such turbulent times, we think it more important than ever to maintain a consistent, disciplined investment approach. We also believe it is important to maintain a blend of holdings that appear attractive from both valuation and momentum perspectives, as we believe that over the long run it is these stocks that have the best opportunity to outperform, regardless of whether we return to a more value-led market or whether we move into a broader, more traditional growth cycle. Accordingly, as of the end of the reporting period, we have remained fully committed to our disciplined, quantitative investment approach, which balances growth and value factors to identify the most attractive opportunities in the small-cap market.
January 15, 2008
| | | The portfolio is only available as a funding vehicle under various life insurance policies or variable |
| | | annuity contracts issued by insurance companies. Individuals may not purchase shares of the |
| | | portfolio directly. A variable annuity is an insurance contract issued by an insurance company that |
| | | enables investors to accumulate assets on a tax-deferred basis for retirement or other long-term |
| | | goals.The investment objective and policies of Dreyfus Variable Investment Fund, Developing |
| | | Leaders Portfolio made available through insurance products may be similar to other |
| | | funds/portfolios managed or advised by Dreyfus. However, the investment results of the portfolio |
| | | may be higher or lower than, and may not be comparable to, those of any other Dreyfus |
| | | fund/portfolio. |
| 1 | | Total return includes reinvestment of dividends and any capital gains paid. Past performance is no |
| | | guarantee of future results. Share price and investment return fluctuate such that upon redemption, |
| | | portfolio shares may be worth more or less than their original cost.The portfolio’s performance does |
| | | not reflect the deduction of additional charges and expenses imposed in connection with investing |
| | | in variable insurance contracts, which will reduce returns. |
| 2 | | SOURCE: LIPPER INC. — Reflects reinvestment of dividends and, where applicable, capital |
| | | gain distributions.The Russell 2000 Index is an unmanaged index of small-cap stock |
| | | performance and is composed of the 2,000 smallest companies in the Russell 3000 Index.The |
| | | Russell 3000 Index is composed of the 3,000 largest U.S. companies based on total market |
| | | capitalization. |
| | | Franklin Portfolio Associates is a wholly-owned subsidiary of The Bank of New York Mellon |
| | | Corporation. Franklin Portfolio Associates has no affiliation to the Franklin Templeton Group of |
| | | Funds or Franklin Resources, Inc.The portfolio’s managers are dual employees of Franklin |
| | | Portfolio Associates and Dreyfus. |
The Portfolio 5
PORTFOLIO PERFORMANCE
| Average Annual Total Returns | | as of 12/31/07 | | | | | | |
| | | | | 1 Year | | 5 Years | | 10 Years |
| |
| |
| |
| |
|
| Initial shares | | | | (11.06)% | | 7.44% | | 3.89% |
| Service shares | | | | (11.28)% | | 7.18% | | 3.70% |
| The data for Service shares includes the results of Initial shares for the period prior to December 31, 2000 |
| (inception date of Service shares). Actual Service shares’ average annual total return and hypothetical growth |
| results would have been lower. See notes below. |
| † Source: Lipper Inc. |
| Past performance is not predictive of future performance.The portfolio’s performance shown in the graph and table does not |
| reflect the deduction of taxes that a shareholder would pay on portfolio distributions or the redemption of portfolio shares. |
| The portfolio’s performance does not reflect the deduction of additional charges and expenses imposed in |
| connection with investing in variable insurance contracts which will reduce returns. |
| The above graph compares a $10,000 investment made in Initial and Service shares of Dreyfus Variable Investment |
| Fund, Developing Leaders Portfolio on 12/31/97 to a $10,000 investment made in the Russell 2000 Index (the |
| “Index”) on that date. |
6
| The portfolio’s Initial shares are not subject to a Rule 12b-1 fee.The portfolio’s Service shares are subject to a 0.25% |
| annual Rule 12b-1 fee.The performance figures for Service shares reflect the performance of the portfolio’s Initial shares |
| from their inception date through December 30, 2000, and the performance of the portfolio’s Service shares from |
| December 31, 2000 (inception date of Service shares) to December 31, 2007 (blended performance figures).The |
| blended performance figures have not been adjusted to reflect the higher operating expenses of the Service shares. If these |
| expenses had been reflected, the blended performance figures would have been lower. All dividends and capital gain |
| distributions are reinvested. |
| The portfolio’s performance shown in the line graph takes into account all applicable portfolio fees and expenses.The Index |
| is an unmanaged index and is composed of the 2,000 smallest companies in the Russell 3000 Index.The Russell 3000 |
| Index is composed of 3,000 of the largest U.S. companies by market capitalization. Unlike a mutual fund, the Index is |
| not subject to charges, fees and other expenses. Investors cannot invest directly in any index. Further information relating to |
| portfolio performance, including expense reimbursements, if applicable, is contained in the Financial Highlights section of |
| the prospectus and elsewhere in this report. |
The Portfolio 7
UNDERSTANDING YOUR
PORTFOLIO’S EXPENSES (Unaudited)
As a mutual fund investor,you pay ongoing expenses,such as management fees and other expenses.Using the information below,you can estimate how these expenses affect your investment and compare them with the expenses of other funds.You also may pay one-time transaction expenses, including sales charges (loads) and redemption fees, which are not shown in this section and would have resulted in higher total expenses. For more information, see your portfolio’s prospectus or talk to your financial adviser.
Review your portfolio’s expenses
The table below shows the expenses you would have paid on a $1,000 investment in Dreyfus Variable Investment Fund, Developing Leaders Portfolio from July 1, 2007 to December 31, 2007. It also shows how much a $1,000 investment would be worth at the close of the period, assuming actual returns and expenses.
| Expenses and Value of a $1,000 Investment | | |
| assuming actual returns for the six months ended December 31, 2007 |
| | | Initial Shares | | Service Shares |
| |
| |
|
| Expenses paid per $1,000 † | | $ 3.93 | | $ 5.10 |
| Ending value (after expenses) | | $856.20 | | $855.20 |
COMPARING YOUR PORTFOLIO’S EXPENSES WITH THOSE OF OTHER FUNDS (Unaudited)
Using the SEC’s method to compare expenses
The Securities and Exchange Commission (SEC) has established guidelines to help investors assess fund expenses. Per these guidelines, the table below shows your portfolio’s expenses based on a $1,000 investment, assuming a hypothetical 5% annualized return. You can use this information to compare the ongoing expenses (but not transaction expenses or total cost) of investing in the portfolio with those of other funds. All mutual fund shareholder reports will provide this information to help you make this comparison. Please note that you cannot use this information to estimate your actual ending account balance and expenses paid during the period.
| Expenses and Value of a $1,000 Investment | | |
| assuming a hypothetical 5% annualized return for the six months ended December 31, 2007 |
| | | Initial Shares | | Service Shares |
| |
| |
|
| Expenses paid per $1,000 † | | $ 4.28 | | $ 5.55 |
| Ending value (after expenses) | | $1,020.97 | | $1,019.71 |
† Expenses are equal to the portfolio’s annualized expense ratio of .84% for Initial shares and 1.09% for Service shares, multiplied by the average account value over the period, multiplied by 184/365 (to reflect the one-half year period).
STATEMENT OF INVESTMENTS
December 31, 2007
|
| Common Stocks—99.3% | | Shares | | Value ($) |
| |
| |
|
| Commercial & Professional Services—10.9% | | |
| Anixter International | | 67,300 a | | 4,190,771 |
| Applied Industrial Technologies | | 36,700 | | 1,065,034 |
| CDI | | 14,900 | | 361,474 |
| COMSYS IT Partners | | 208,900 a,b | | 3,296,442 |
| Concur Technologies | | 43,900 b | | 1,589,619 |
| Deluxe | | 73,500 a | | 2,417,415 |
| IKON Office Solutions | | 378,100 | | 4,922,862 |
| Kelly Services, Cl. A | | 42,100 a | | 785,586 |
| Kforce | | 124,500 a,b | | 1,213,875 |
| MPS Group | | 225,900 a,b | | 2,471,346 |
| Perficient | | 25,100 b | | 395,074 |
| Performance Food Group | | 148,000 a,b | | 3,976,760 |
| Portfolio Recovery Associates | | 38,600 a | | 1,531,262 |
| PSS World Medical | | 25,700 b | | 502,949 |
| Rush Enterprises, Cl. A | | 151,500 a,b | | 2,754,270 |
| ScanSource | | 83,800 a,b | | 2,710,930 |
| School Specialty | | 56,900 b | | 1,965,895 |
| Spherion | | 395,300 b | | 2,877,784 |
| TeleTech Holdings | | 185,600 b | | 3,947,712 |
| United Stationers | | 83,200 a,b | | 3,844,672 |
| Viad | | 125,200 | | 3,953,816 |
| | | | | 50,775,548 |
| Communications—1.5% | | | | |
| Alaska Communications Systems Group | | 259,700 a | | 3,895,500 |
| Centennial Communications | | 72,500 a,b | | 673,525 |
| NTELOS Holdings | | 76,100 | | 2,259,409 |
| | | | | 6,828,434 |
| Consumer Durables—2.8% | | | | |
| Avatar Holdings | | 44,300 a,b | | 1,852,626 |
| Cooper Tire & Rubber | | 22,500 a | | 373,050 |
| Fossil | | 124,300 a,b | | 5,218,114 |
| LoJack | | 204,377 a,b | | 3,435,577 |
| Polaris Industries | | 49,500 a | | 2,364,615 |
| | | | | 13,243,982 |
The Portfolio 9
STATEMENT OF INVESTMENTS (continued)
| Common Stocks (continued) | | Shares | | | | Value ($) |
| |
| |
| |
|
| Consumer Non-Durables—4.5% | | | | | | |
| American Greetings, Cl. A | | 156,200 | | | | 3,170,860 |
| Cal-Maine Foods | | 88,700 a | | | | 2,353,211 |
| Central European Distribution | | 17,900 b | | | | 1,039,632 |
| Central Garden & Pet, Cl. A | | 67,200 b | | | | 360,192 |
| Flowers Foods | | 38,400 a | | | | 898,944 |
| Imperial Sugar | | 180,300 a | | | | 3,384,231 |
| NBTY | | 51,400 b | | | | 1,408,360 |
| Perry Ellis International | | 142,900 a,b | | | | 2,197,802 |
| Sanderson Farms | | 30,900 a | | | | 1,043,802 |
| Universal | | 44,900 a | | | | 2,299,778 |
| USANA Health Sciences | | 58,800 a,b | | | | 2,180,304 |
| Warnaco Group | | 21,200 b | | | | 737,760 |
| | | | | | | 21,074,876 |
| Consumer Services—5.8% | | | | | | |
| Belo, Cl. A | | 161,600 a | | | | 2,818,304 |
| Entercom Communications, Cl. A | | 49,100 a | | | | 672,179 |
| Jack in the Box | | 163,000 a,b | | | | 4,200,510 |
| Lee Enterprises | | 53,100 a | | | | 777,915 |
| Monarch Casino & Resort | | 48,600 b | | | | 1,170,288 |
| Pre-Paid Legal Services | | 36,900 a,b | | | | 2,042,415 |
| Premier Exhibitions | | 131,800 a,b | | | | 1,441,892 |
| Priceline.com | | 53,500 a,b | | | | 6,145,010 |
| Ruby Tuesday | | 194,400 a | | | | 1,895,400 |
| Sinclair Broadcast Group, Cl. A | | 334,500 a | | | | 2,746,245 |
| Sotheby’s | | 87,000 a | | | | 3,314,700 |
| | | | | | | 27,224,858 |
| Electronic Technology—10.9% | | | | | | |
| Advanced Energy Industries | | 177,200 a,b | | | | 2,317,776 |
| Amkor Technology | | 252,400 a,b | | | | 2,152,972 |
| Anaren | | 54,800 a,b | | | | 903,652 |
| Arris Group | | 95,400 a,b | | | | 952,092 |
| Baldor Electric | | 34,500 | | | | 1,161,270 |
| Blue Coat Systems | | 65,800 b | | | | 2,162,846 |
| Ceradyne | | 82,300 b | | | | 3,862,339 |
| Comtech Telecommunications | | 57,200 b | | | | 3,089,372 |
| CTS | | 130,000 | | | | 1,290,900 |
10
| Common Stocks (continued) | | Shares | | Value ($) |
| |
| |
|
| Electronic Technology (continued) | | | | |
| Cubic | | 15,700 | | 615,440 |
| Cymer | | 36,100 a,b | | 1,405,373 |
| Dionex | | 10,300 b | | 853,458 |
| EMS Technologies | | 37,200 a,b | | 1,124,928 |
| Exar | | 325,666 a,b | | 2,595,558 |
| FARO Technologies | | 17,200 b | | 467,496 |
| FEI | | 35,200 a,b | | 874,016 |
| GeoEye | | 17,200 b | | 578,780 |
| Immersion | | 242,500 a,b | | 3,140,375 |
| Intevac | | 250,500 a,b | | 3,642,270 |
| Methode Electronics | | 66,500 | | 1,093,260 |
| MIPS Technologies | | 185,100 a,b | | 918,096 |
| Novatel Wireless | | 214,500 a,b | | 3,474,900 |
| ON Semiconductor | | 218,300 a,b | | 1,938,504 |
| Oplink Communications | | 131,100 a,b | | 2,012,385 |
| Orbital Sciences | | 211,200 a,b | | 5,178,624 |
| Power Integrations | | 55,500 b | | 1,910,865 |
| Sigma Designs | | 19,800 b | | 1,092,960 |
| | | | | 50,810,507 |
| Energy Minerals—4.4% | | | | |
| Atlas America | | 82,900 | | 4,906,022 |
| Bois d’Arc Energy | | 187,000 a,b | | 3,711,950 |
| Mariner Energy | | 222,900 a,b | | 5,099,952 |
| PetroHawk Energy | | 181,400 b | | 3,140,034 |
| Resource America, Cl. A | | 49,200 a | | 721,764 |
| Western Refining | | 110,700 a | | 2,680,047 |
| | | | | 20,259,769 |
| Finance—13.4% | | | | |
| Amerisafe | | 61,700 b | | 956,967 |
| AmTrust Financial Services | | 72,100 a | | 992,817 |
| Apollo Investment | | 76,400 | | 1,302,620 |
| Aspen Insurance Holdings | | 25,900 | | 746,956 |
| BankUnited Financial, Cl. A | | 68,400 a | | 471,960 |
| Cathay General Bancorp | | 59,400 a | | 1,573,506 |
| Commerce Group | | 119,400 a | | 4,296,012 |
| Community Bank System | | 26,000 a | | 516,620 |
The Portfolio 11
STATEMENT OF INVESTMENTS (continued)
| Common Stocks (continued) | | Shares | | Value ($) |
| |
| |
|
| Finance (continued) | | | | |
| Corus Bankshares | | 234,600 a | | 2,503,182 |
| Financial Federal | | 32,000 | | 713,280 |
| First Financial Bancorp | | 107,100 | | 1,220,940 |
| First Midwest Bancorp | | 33,800 a | | 1,034,280 |
| FirstFed Financial | | 74,800 a,b | | 2,679,336 |
| FirstMerit | | 170,200 a | | 3,405,702 |
| Frontier Financial | | 96,400 a | | 1,790,148 |
| Great Southern Bancorp | | 24,800 a | | 544,608 |
| Greenhill & Co. | | 48,900 a | | 3,250,872 |
| KNBT Bancorp | | 32,600 a | | 502,692 |
| Max Capital Group | | 44,000 | | 1,231,560 |
| National Penn Bancshares | | 101,352 a | | 1,534,469 |
| NYMAGIC | | 29,800 a | | 689,274 |
| Ocwen Financial | | 347,100 a,b | | 1,922,934 |
| Odyssey Re Holdings | | 119,200 | | 4,375,832 |
| Pacific Capital Bancorp | | 212,400 a | | 4,275,612 |
| Phoenix Cos. | | 350,600 a | | 4,161,622 |
| RLI | | 77,600 a | | 4,406,904 |
| RSC Holdings | | 156,200 a,b | | 1,960,310 |
| Susquehanna Bancshares | | 154,100 a | | 2,841,604 |
| SVB Financial Group | | 35,300 a,b | | 1,779,120 |
| SWS Group | | 29,700 | | 376,299 |
| Trustmark | | 19,500 a | | 494,520 |
| UMB Financial | | 13,900 | | 533,204 |
| WesBanco | | 27,900 a | | 574,740 |
| WSFS Financial | | 23,100 | | 1,159,620 |
| Zenith National Insurance | | 31,500 a | | 1,408,995 |
| | | | | 62,229,117 |
| Health Care Technology—10.4% | | | | |
| American Oriental Bioengineering | | 241,300 a,b | | 2,673,604 |
| Analogic | | 26,700 | | 1,808,124 |
| Auxilium Pharmaceuticals | | 145,500 a,b | | 4,363,545 |
| Bruker BioSciences | | 217,800 a,b | | 2,896,740 |
| CONMED | | 150,400 b | | 3,475,744 |
| Cubist Pharmaceuticals | | 215,100 a,b | | 4,411,701 |
| Cutera | | 45,100 a,b | | 708,070 |
| Cynosure, Cl. A | | 120,572 a,b | | 3,190,335 |
12
| Common Stocks (continued) | | Shares | | Value ($) |
| |
| |
|
| Health Care Technology (continued) | | | | |
| Exelixis | | 43,200 a,b | | 372,816 |
| Geron | | 53,300 a,b | | 302,744 |
| GTX | | 105,500 a,b | | 1,513,925 |
| Hologic | | 41,200 b | | 2,827,968 |
| Immucor | | 138,300 b | | 4,700,817 |
| Integra LifeSciences Holdings | | 16,000 a,b | | 670,880 |
| Lifecell | | 69,200 a,b | | 2,983,212 |
| Martek Biosciences | | 18,800 b | | 556,104 |
| Onyx Pharmaceuticals | | 26,600 b | | 1,479,492 |
| OSI Pharmaceuticals | | 61,800 a,b | | 2,997,918 |
| Par Pharmaceutical Cos. | | 21,400 b | | 513,600 |
| PharmaNet Development Group | | 18,700 b | | 733,227 |
| Sciele Pharma | | 176,800 a,b | | 3,615,560 |
| ViroPharma | | 145,700 a,b | | 1,156,858 |
| XenoPort | | 11,500 b | | 642,620 |
| | | | | 48,595,604 |
| Industrial Services—3.7% | | | | |
| Dycom Industries | | 88,600 b | | 2,361,190 |
| EMCOR Group | | 61,500 b | | 1,453,245 |
| Grey Wolf | | 381,300 a,b | | 2,032,329 |
| MarkWest Hydrocarbon | | 13,100 a | | 820,715 |
| Michael Baker | | 96,500 b | | 3,966,150 |
| Perini | | 83,600 b | | 3,462,712 |
| Trico Marine Services | | 90,700 b | | 3,357,714 |
| | | | | 17,454,055 |
| Non-Energy Minerals—2.1% | | | | |
| Kaiser Aluminum | | 55,200 | | 4,387,296 |
| Olin | | 184,500 a | | 3,566,385 |
| Quanex | | 26,100 | | 1,354,590 |
| Worthington Industries | | 23,600 a | | 421,968 |
| | | | | 9,730,239 |
| Process Industries—6.7% | | | | |
| AptarGroup | | 74,300 a | | 3,039,613 |
| Buckeye Technologies | | 40,900 b | | 511,250 |
| CF Industries Holdings | | 69,900 a | | 7,693,194 |
| GrafTech International | | 309,100 a,b | | 5,486,525 |
| Headwaters | | 107,200 a,b | | 1,258,528 |
The Portfolio 13
STATEMENT OF INVESTMENTS (continued)
| Common Stocks (continued) | | Shares | | Value ($) |
| |
| |
|
| Process Industries (continued) | | | | |
| Landec | | 90,400 b | | 1,211,360 |
| Mercer International | | 93,600 a,b | | 732,888 |
| Schulman (A.) | | 30,800 a | | 663,740 |
| Sensient Technologies | | 45,000 a | | 1,272,600 |
| Spartech | | 142,300 a | | 2,006,430 |
| Terra Industries | | 153,400 a,b | | 7,326,384 |
| | | | | 31,202,512 |
| Producer Manufacturing—5.3% | | | | |
| Aaon | | 45,900 | | 909,738 |
| Ampco-Pittsburgh | | 15,500 | | 591,015 |
| Apogee Enterprises | | 134,200 | | 2,296,162 |
| Astec Industries | | 26,400 a,b | | 981,816 |
| Chart Industries | | 129,500 b | | 4,001,550 |
| Encore Wire | | 48,600 a | | 773,712 |
| FuelCell Energy | | 268,400 a,b | | 2,662,528 |
| Genlyte Group | | 12,800 a,b | | 1,218,560 |
| Goodman Global | | 60,400 a,b | | 1,482,216 |
| Kadant | | 25,500 a,b | | 756,585 |
| Knoll | | 235,900 a | | 3,875,837 |
| Mueller Industries | | 16,800 | | 487,032 |
| Regal-Beloit | | 28,600 a | | 1,285,570 |
| Wabtec | | 92,400 a | | 3,182,256 |
| | | | | 24,504,577 |
| Retail Trade—4.6% | | | | |
| Aeropostale | | 171,800 a,b | | 4,552,700 |
| Asbury Automotive Group | | 195,200 | | 2,937,760 |
| Big Lots | | 181,000 a,b | | 2,894,190 |
| Ingles Markets, Cl. A | | 59,300 | | 1,505,627 |
| JoS. A. Bank Clothiers | | 95,600 a,b | | 2,719,820 |
| Men’s Wearhouse | | 25,900 | | 698,782 |
| Systemax | | 228,500 a | | 4,643,120 |
| Winn-Dixie Stores | | 86,000 a,b | | 1,450,820 |
| | | | | 21,402,819 |
| Technology Services—8.1% | | | | |
| Air Methods | | 8,700 b | | 432,129 |
| Common Stocks (continued) | | Shares | | Value ($) |
| |
| |
|
| Technology Services (continued) | | | | |
| Albany Molecular Research | | 132,000 a,b | | 1,898,160 |
| AMERIGROUP | | 72,700 a,b | | 2,649,915 |
| Ansoft | | 84,800 b | | 2,192,080 |
| Apria Healthcare Group | | 176,000 a,b | | 3,796,320 |
| CSG Systems International | | 113,700 a,b | | 1,673,664 |
| HealthSpring | | 20,600 b | | 392,430 |
| Heartland Payment Systems | | 18,700 a | | 501,160 |
| Interwoven | | 201,900 b | | 2,871,018 |
| JDA Software Group | | 127,100 b | | 2,600,466 |
| Level 3 Communications | | 1 b | | 3 |
| LHC Group | | 26,000 a,b | | 649,480 |
| Macrovision | | 24,600 b | | 450,918 |
| Manhattan Associates | | 181,000 b | | 4,771,160 |
| SPSS | | 51,500 b | | 1,849,365 |
| SRA International, Cl. A | | 16,100 a,b | | 474,145 |
| Sunrise Senior Living | | 22,300 a,b | | 684,164 |
| Sykes Enterprises | | 238,900 b | | 4,300,200 |
| VASCO Data Security International | | 51,000 a,b | | 1,423,920 |
| Vignette | | 291,400 b | | 4,257,354 |
| | | | | 37,868,051 |
| Transportation—.9% | | | | |
| Pacer International | | 172,800 a | | 2,522,880 |
| Pinnacle Airlines | | 67,100 a,b | | 1,023,275 |
| Saia | | 44,200 b | | 587,860 |
| | | | | 4,134,015 |
| Utilities—3.3% | | | | |
| CH Energy Group | | 61,100 a | | 2,721,394 |
| El Paso Electric | | 194,200 b | | 4,965,694 |
| MGE Energy | | 18,200 a | | 645,554 |
| New Jersey Resources | | 48,500 a | | 2,425,970 |
| Piedmont Natural Gas | | 89,200 a | | 2,333,472 |
| Portland General Electric | | 78,600 | | 2,183,508 |
| | | | | 15,275,592 |
| Total Common Stocks | | | | |
| (cost $492,248,233) | | | | 462,614,555 |
The Portfolio 15
STATEMENT OF INVESTMENTS (continued)
| Other Investment—.7% | | Shares | | Value ($) |
| |
| |
|
| Registered Investment Company; | | | | |
| Dreyfus Institutional Preferred | | | | |
| Plus Money Market Fund | | | | |
| (cost $3,050,000) | | 3,050,000 c | | 3,050,000 |
| |
| |
|
| |
| Investment of Cash Collateral | | | | |
| for Securities Loaned—35.3% | | | | |
| |
| |
|
| Registered Investment Company; | | | | |
| Dreyfus Institutional Cash | | | | |
| Advantage Fund | | | | |
| (cost $164,481,878) | | 164,481,878 c | | 164,481,878 |
| |
| |
|
| |
| Total Investments (cost $659,780,111) | | 135.3% | | 630,146,433 |
| Liabilities, Less Cash and Receivables | | (35.3%) | | (164,401,144) |
| Net Assets | | 100.0% | | 465,745,289 |
| a All or a portion of these securities are on loan. At December 31, 2007, the total market value of the portfolio’s |
| securities on loan is $160,211,742 and the total market value of the collateral held by the portfolio is |
| $168,940,817, consisting of cash collateral of $164,481,878 and U.S. Government and agency securities valued at |
| $4,458,939. |
| b Non-income producing security. |
| c Investment in affiliated money market mutual fund. |
| Portfolio Summary (Unaudited) † | | | | |
| |
| | | Value (%) | | | | Value (%) |
| |
| |
| |
|
| Money Market Investments | | 36.0 | | Consumer Non-Durables | | 4.5 |
| Finance | | 13.4 | | Energy Minerals | | 4.4 |
| Electronic Technology | | 10.9 | | Industrial Services | | 3.7 |
| Commercial & Professional Services | | 10.9 | | Utilities | | 3.3 |
| Health Care Technology | | 10.4 | | Consumer Durables | | 2.8 |
| Technology Services | | 8.1 | | Non-Energy Minerals | | 2.1 |
| Process Industries | | 6.7 | | Communications | | 1.5 |
| Consumer Services | | 5.8 | | Transportation | | .9 |
| Producer Manufacturing | | 5.3 | | | | |
| Retail Trade | | 4.6 | | | | 135.3 |
| |
| † Based on net assets. | | | | | | |
| See notes to financial statements. | | | | | | |
16
STATEMENT OF ASSETS AND LIABILITIES
December 31, 2007
| | | Cost | | Value |
| |
| |
|
| Assets ($): | | | | |
| Investments in securities—See Statement | | |
| of Investments (including securities on loan, | | |
| valued at $160,211,742)—Note 1(c): | | |
| Unaffiliated issuers | | 492,248,233 | | 462,614,555 |
| Affiliated issuers | | 167,531,878 | | 167,531,878 |
| Cash | | | | 111,941 |
| Dividends and interest receivable | | | | 991,984 |
| Receivable for shares of Beneficial Interest subscribed | | 22,064 |
| Prepaid expenses | | | | 37,759 |
| | | | | 631,310,181 |
| |
| |
|
| Liabilities ($): | | | | |
| Due to The Dreyfus Corporation and affiliates—Note 3(b) | | 330,782 |
| Liability for securities on loan—Note 1(c) | | 164,481,878 |
| Payable for shares of Beneficial Interest redeemed | | 584,600 |
| Interest payable—Note 2 | | | | 7,028 |
| Accrued expenses | | | | 160,604 |
| | | | | 165,564,892 |
| |
| |
|
| Net Assets ($) | | | | 465,745,289 |
| |
| |
|
| Composition of Net Assets ($): | | | | |
| Paid-in capital | | | | 487,689,027 |
| Accumulated undistributed investment income—net | | 3,313,210 |
| Accumulated net realized gain (loss) on investments | | 4,376,730 |
| Accumulated net unrealized appreciation | | |
| (depreciation) on investments | | | | (29,633,678) |
| |
| |
|
| Net Assets ($) | | | | 465,745,289 |
| |
| |
|
| |
| |
| Net Asset Value Per Share | | | | |
| | | Initial Shares | | Service Shares |
| |
| |
|
| Net Assets ($) | | 447,446,581 | | 18,298,708 |
| Shares Outstanding | | 13,833,947 | | 572,905 |
| |
| |
|
| Net Asset Value Per Share ($) | | 32.34 | | 31.94 |
| |
| See notes to financial statements. | | | | |
The Portfolio 17
STATEMENT OF OPERATIONS
Year Ended December 31, 2007
|
| Investment Income ($): | | |
| Income: | | |
| Cash dividends (net of $1,395 foreign taxes withheld at source): | | |
| Unaffiliated issuers | | 7,188,165 |
| Affiliated issuers | | 109,378 |
| Income from securities lending | | 1,109,682 |
| Total Income | | 8,407,225 |
| Expenses: | | |
| Investment advisory fee—Note 3(a) | | 4,301,798 |
| Prospectus and shareholders’ reports | | 182,650 |
| Custodian fees—Note 3(b) | | 52,733 |
| Distribution fees—Note 3(b) | | 51,882 |
| Professional fees | | 40,940 |
| Trustees’ fees and expenses—Note 3(c) | | 27,421 |
| Interest expense—Note 2 | | 7,028 |
| Loan commitment fees—Note 2 | | 5,633 |
| Shareholder servicing costs—Note 3(b) | | 5,569 |
| Miscellaneous | | 24,150 |
| Total Expenses | | 4,699,804 |
| Investment Income—Net | | 3,707,421 |
| |
|
| Realized and Unrealized Gain (Loss) on Investments—Note 4 ($): |
| Net realized gain (loss) on investments | | 3,676,310 |
| Net unrealized appreciation (depreciation) on investments | | (66,170,150) |
| Net Realized and Unrealized Gain (Loss) on Investments | | (62,493,840) |
| Net (Decrease) in Net Assets Resulting from Operations | | (58,786,419) |
See notes to financial statements.
|
STATEMENT OF CHANGES IN NET ASSETS
| | | Year Ended December 31, |
| |
|
| | | 2007 | | 2006 |
| |
| |
|
| Operations ($): | | | | |
| Investment income—net | | 3,707,421 | | 5,325,720 |
| Net realized gain (loss) on investments | | 3,676,310 | | 76,395,773 |
| Net unrealized appreciation | | | | |
| (depreciation) on investments | | (66,170,150) | | (57,945,192) |
| Net Increase (Decrease) in Net Assets | | | | |
| Resulting from Operations | | (58,786,419) | | 23,776,301 |
| |
| |
|
| Dividends to Shareholders from ($): | | | | |
| Investment income—net: | | | | |
| Initial shares | | (4,284,675) | | (2,859,929) |
| Service shares | | (97,644) | | (36,703) |
| Net realized gain on investments: | | | | |
| Initial shares | | (74,911,573) | | (59,143,340) |
| Service shares | | (2,697,864) | | (1,897,570) |
| Total Dividends | | (81,991,756) | | (63,937,542) |
| |
| |
|
| Beneficial Interest Transactions ($): | | | | |
| Net proceeds from shares sold: | | | | |
| Initial shares | | 16,144,677 | | 28,698,627 |
| Service shares | | 3,462,954 | | 3,755,306 |
| Dividends reinvested: | | | | |
| Initial shares | | 79,196,248 | | 62,003,269 |
| Service shares | | 2,795,508 | | 1,934,273 |
| Cost of shares redeemed: | | | | |
| Initial shares | | (145,698,313) | | (162,998,146) |
| Service shares | | (4,503,858) | | (5,485,460) |
| Increase (Decrease) in Net Assets from | | | | |
| Beneficial Interest Transactions | | (48,602,784) | | (72,092,131) |
| Total Increase (Decrease) in Net Assets | | (189,380,959) | | (112,253,372) |
| |
| |
|
| Net Assets ($): | | | | |
| Beginning of Period | | 655,126,248 | | 767,379,620 |
| End of Period | | 465,745,289 | | 655,126,248 |
| Undistributed investment income—net | | 3,313,210 | | 5,173,339 |
The Portfolio 19
STATEMENT OF CHANGES IN NET ASSETS (continued)
|
| | | Year Ended December 31, |
| |
|
| | | 2007 | | 2006 |
| |
| |
|
| Capital Share Transactions: | | | | |
| Initial Shares | | | | |
| Shares sold | | 442,684 | | 684,422 |
| Shares issued for dividends reinvested | | 2,190,161 | | 1,394,899 |
| Shares redeemed | | (3,870,813) | | (3,947,455) |
| Net Increase (Decrease) in Shares Outstanding | | (1,237,968) | | (1,868,134) |
| |
| |
|
| Service Shares | | | | |
| Shares sold | | 96,977 | | 89,868 |
| Shares issued for dividends reinvested | | 78,131 | | 43,931 |
| Shares redeemed | | (123,606) | | (135,519) |
| Net Increase (Decrease) in Shares Outstanding | | 51,502 | | (1,720) |
See notes to financial statements.
|
FINANCIAL HIGHLIGHTS
The following tables describe the performance for each share class for the fiscal periods indicated.All information (except portfolio turnover rate) reflects financial results for a single portfolio share. Total return shows how much your investment in the portfolio would have increased (or decreased) during each period, assuming you had reinvested all dividends and distributions.These figures have been derived from the portfolio’s financial statements.
| | | | | Year Ended December 31, | | |
| |
| |
| |
|
| Initial Shares | | 2007 | | 2006 | | 2005 | | 2004 | | 2003 |
| |
| |
| |
| |
| |
|
| Per Share Data ($): | | | | | | | | | | |
| Net asset value, beginning of period | | 42.03 | | 43.96 | | 41.55 | | 37.39 | | 28.40 |
| Investment Operations: | | | | | | | | | | |
| Investment income—net a | | .24 | | .31 | | .18 | | .08 | | .01 |
| Net realized and unrealized | | | | | | | | | | |
| gain (loss) on investments | | (4.29) | | 1.56 | | 2.23 | | 4.16 | | 8.99 |
| Total from Investment Operations | | (4.05) | | 1.87 | | 2.41 | | 4.24 | | 9.00 |
| Distributions: | | | | | | | | | | |
| Dividends from investment | | | | | | | | | | |
| income—net | | (.31) | | (.18) | | — | | (.08) | | (.01) |
| Dividends from net realized | | | | | | | | | | |
| gain on investments | | (5.33) | | (3.62) | | — | | — | | — |
| Total Distributions | | (5.64) | | (3.80) | | — | | (.08) | | (.01) |
| Net asset value, end of period | | 32.34 | | 42.03 | | 43.96 | | 41.55 | | 37.39 |
| |
| |
| |
| |
| |
|
| Total Return (%) | | (11.06) | | 3.77 | | 5.80 | | 11.34 | | 31.69 |
| |
| |
| |
| |
| |
|
| Ratios/Supplemental Data (%): | | | | | | | | | | |
| Ratio of total expenses | | | | | | | | | | |
| to average net assets | | .81 | | .82 | | .81 | | .79 | | .82 |
| Ratio of net investment income | | | | | | | | | | |
| to average net assets | | .66 | | .75 | | .43 | | .20 | | .03 |
| Portfolio Turnover Rate | | 90.75 | | 97.52 | | 67.11 | | 56.06 | | 69.34 |
| |
| |
| |
| |
| |
|
| Net Assets, end of period ($ x 1,000) | | 447,447 | | 633,459 | | 744,621 | | 788,943 | | 744,866 |
| | a Based on average shares outstanding at each month end.
See notes to financial statements.
|
The Portfolio 21
FINANCIAL HIGHLIGHTS (continued)
|
| | | | | Year Ended December 31, | | |
| |
| |
| |
|
| Service Shares | | 2007 | | 2006 | | 2005 | | 2004 | | 2003 |
| |
| |
| |
| |
| |
|
| Per Share Data ($): | | | | | | | | | | |
| Net asset value, beginning of period | | 41.56 | | 43.51 | | 41.22 | | 37.12 | | 28.26 |
| Investment Operations: | | | | | | | | | | |
| Investment income (loss)—net a | | .15 | | .21 | | .07 | | (.02) | | (.07) |
| Net realized and unrealized | | | | | | | | | | |
| gain (loss) on investments | | (4.25) | | 1.53 | | 2.22 | | 4.12 | | 8.93 |
| Total from Investment Operations | | (4.10) | | 1.74 | | 2.29 | | 4.10 | | 8.86 |
| Distributions: | | | | | | | | | | |
| Dividends from investment | | | | | | | | | | |
| income—net | | (.19) | | (.07) | | — | | — | | — |
| Dividends from net realized | | | | | | | | | | |
| gain on investments | | (5.33) | | (3.62) | | — | | — | | — |
| Total Distributions | | (5.52) | | (3.69) | | — | | — | | — |
| Net asset value, end of period | | 31.94 | | 41.56 | | 43.51 | | 41.22 | | 37.12 |
| |
| |
| |
| |
| |
|
| Total Return (%) | | (11.28) | | 3.52 | | 5.56 | | 11.05 | | 31.35 |
| |
| |
| |
| |
| |
|
| Ratios/Supplemental Data (%): | | | | | | | | | | |
| Ratio of total expenses | | | | | | | | | | |
| to average net assets | | 1.06 | | 1.08 | | 1.06 | | 1.04 | | 1.07 |
| Ratio of net investment income | | | | | | | | | | |
| (loss) to average net assets | | .42 | | .51 | | .18 | | (.04) | | (.22) |
| Portfolio Turnover Rate | | 90.75 | | 97.52 | | 67.11 | | 56.06 | | 69.34 |
| |
| |
| |
| |
| |
|
| Net Assets, end of period ($ x 1,000) | | 18,299 | | 21,667 | | 22,759 | | 22,061 | | 17,523 |
| |
| a Based on average shares outstanding at each month end. | | | | | | | | |
| See notes to financial statements. | | | | | | | | | | |
NOTES TO FINANCIAL STATEMENTS
NOTE 1—Significant Accounting Policies:
Dreyfus Variable Investment Fund (the “fund”) is registered under the Investment Company Act of 1940, as amended (the “Act”), as an open-end management investment company, operating as a series company currently offering seven series, including the Developing Leaders Portfolio (the “portfolio”). The portfolio is only offered to separate accounts established by insurance companies to fund variable annuity contracts and variable life insurance policies.The portfolio is a diversified series. The portfolio’s investment objective is capital growth.The Dreyfus Corporation (the “Manager” or “Dreyfus”) serves as the portfolio’s investment adviser.
On July 1, 2007, Mellon Financial Corporation and The Bank of New York Company, Inc. merged, forming The Bank of New York Mellon Corporation (“BNY Mellon”). As part of this transaction, Dreyfus became a wholly-owned subsidiary of BNY Mellon.
MBSC Securities Corporation (the “Distributor”), a wholly-owned subsidiary of the Manager, is the distributor of the portfolio’s shares, which are sold without a sales charge. The portfolio is authorized to issue an unlimited number of $.001 par value shares of Beneficial Interest in the following classes of shares: Initial and Service. Each class of shares has identical rights and privileges,except with respect to the distribution plan and the expenses borne by each class, the allocation of certain transfer agency costs and certain voting rights. Income, expenses (other than expenses attributable to a specific class), and realized and unrealized gains or losses on investments are allocated to each class of shares based on its relative net assets.
The fund accounts separately for the assets, liabilities and operations of each series. Expenses directly attributable to each series are charged to that series’ operations; expenses which are applicable to all series are allocated among them on a pro rata basis.
The portfolio’s financial statements are prepared in accordance with U.S. generally accepted accounting principles, which may require the use of management estimates and assumptions.Actual results could differ from those estimates.
The Portfolio 23
NOTES TO FINANCIAL STATEMENTS (continued)
|
The fund enters into contracts that contain a variety of indemnifica-tions.The portfolio’s maximum exposure under these arrangements is unknown. The portfolio does not anticipate recognizing any loss related to these arrangements.
(a) Portfolio valuation: Investments in securities are valued at the last sales price on the securities exchange or national securities market on which such securities are primarily traded. Securities listed on the National Market System for which market quotations are available are valued at the official closing price or, if there is no official closing price that day, at the last sale price. Securities not listed on an exchange or the national securities market, or securities for which there were no transactions, are valued at the average of the most recent bid and asked prices, except for open short positions, where the asked price is used for valuation purposes. Bid price is used when no asked price is available. Registered open-end investment companies that are not traded on an exchange are valued at their net asset value.When market quotations or official closing prices are not readily available, or are determined not to reflect accurately fair value, such as when the value of a security has been significantly affected by events after the close of the exchange or market on which the security is principally traded (for example, a foreign exchange or market), but before the portfolio calculates its net asset value, the portfolio may value these investments at fair value as determined in accordance with the procedures approved by the Board of Trustees. Fair valuing of securities may be determined with the assistance of a pricing service using calculations based on indices of domestic securities and other appropriate indicators, such as prices of relevant ADRs and futures contracts. For other securities that are fair valued by the Board of Trustees, certain factors may be considered such as: fundamental analytical data, the nature and duration of restrictions on disposition, an evaluation of the forces that influence the market in which the securities are purchased and sold, and public trading in similar securities of the issuer or comparable issuers. Financial futures are valued at the last sales price. Investments denominated in foreign currencies are translated to U.S. dollars at the prevailing rates of exchange. Forward currency exchange contracts are valued at the forward rate.
The Financial Accounting Standards Board (“FASB”) released Statement of Financial Accounting Standards No. 157 “Fair Value Measurements” (“FAS 157”). FAS 157 establishes an authoritative definition of fair value, sets out a framework for measuring fair value, and requires additional disclosures about fair-value measurements.The application of FAS 157 is required for fiscal years beginning after November 15, 2007 and interim periods within those fiscal years. Management does not believe that the application of this standard will have a material impact on the financial statements of the fund.
(b) Foreign currency transactions: The portfolio does not isolate that portion of the results of operations resulting from changes in foreign exchange rates on investments from the fluctuations arising from changes in market prices of securities held. Such fluctuations are included with the net realized and unrealized gains or losses on investments.
Net realized foreign exchange gains or losses arise from sales and maturities of short-term securities, sales of foreign currencies, currency gains or losses realized on securities transactions and the difference between the amounts of dividends, interest and foreign withholding taxes recorded on the portfolio’s books and the U.S. dollar equivalent of the amounts actually received or paid. Net unrealized foreign exchange gains or losses arise from changes in the value of assets and liabilities other than investments in securities resulting from changes in exchange rates. Such gains and losses are included with net realized and unrealized gains or losses on investments.
(c) Securities transactions and investment income: Securities transactions are recorded on a trade date basis. Realized gains and losses from securities transactions are recorded on the identified cost basis. Dividend income is recognized on the ex-dividend date and interest income, including, where applicable, accretion of discount and amortization of premium on investments, is recognized on the accrual basis.
The portfolio has an arrangement with the custodian bank whereby the portfolio receives earnings credits from the custodian when positive cash balances are maintained, which are used to offset custody fees.
The Portfolio 25
NOTES TO FINANCIAL STATEMENTS (continued)
|
For financial reporting purposes, the portfolio includes net earnings credits, if any, as an expense offset in the Statement of Operations.
Pursuant to a securities lending agreement with Mellon Bank, N.A. (“Mellon Bank”), an affiliate of the Manager, the portfolio may lend securities to qualified institutions. It is the portfolio’s policy, that at origination, all loans are secured by collateral of at least 102% of the value of U.S. securities loaned and 105% of the value of foreign securities loaned. Collateral equivalent to at least 100% of the market value of securities on loan is maintained at all times. Collaterals are either in the form of cash, which can be invested in certain money market mutual funds managed by the Manager, U.S. Government and Agency securities or Letters of Credit. The portfolio is entitled to receive all income on securities loaned, in addition to income earned as a result of the lending transaction. Although each security loaned is fully collateralized, the portfolio bears the risk of delay in recovery of, or loss of rights in, the securities loaned should a borrower fail to return the securities in a timely manner. During the period ended December 31, 2007, Mellon Bank earned $475,578, from lending portfolio securities, pursuant to the securities lending agreement.
(d) Affiliated issuers: Investments in other investment companies advised by the Manager are defined as “affiliated” in the Act.
(e) Dividends to shareholders: Dividends are recorded on the ex-dividend date. Dividends from investment income-net and dividends from net realized capital gains, if any, are normally declared and paid annually, but the portfolio may make distributions on a more frequent basis to comply with the distribution requirements of the Internal Revenue Code of 1986,as amended (the “Code”).To the extent that net realized capital gains can be offset by capital loss carryovers, it is the policy of the portfolio not to distribute such gains. Income and capital gain distributions are determined in accordance with income tax regulations, which may differ from U.S. generally accepted accounting principles.
(f) Federal income taxes: It is the policy of the portfolio to continue to qualify as a regulated investment company, if such qualification is in
the best interests of its shareholders, by complying with the applicable provisions of the Code, and to make distributions of taxable income sufficient to relieve it from substantially all federal income and excise taxes.
During the current year, the portfolio adopted FASB Interpretation No. 48 “Accounting for Uncertainty in Income Taxes” (“FIN 48”). FIN 48 provides guidance for how uncertain tax positions should be recognized, measured, presented and disclosed in the financial statements. FIN 48 requires the evaluation of tax positions taken or expected to be taken in the course of preparing the portfolio’s tax returns to determine whether the tax positions are “more-likely-than-not” of being sustained by the applicable tax authority. Tax positions not deemed to meet the more-likely-than-not threshold would be recorded as a tax benefit or expense in the current year.The adoption of FIN 48 had no impact on the operations of the portfolio for the period ended December 31, 2007.
The portfolio is not subject to examination by U.S. Federal, State and City tax authorities for the tax years before 2004.
At December 31, 2007, the components of accumulated earnings on a tax basis were as follows: undistributed ordinary income $9,803,398, undistributed capital gains $13,691,340 and unrealized depreciation $29,953,981. In addition, the portfolio had $15,484,495 of capital losses realized after October 31, 2007 which were deferred for tax purposes to the first day of the following fiscal year.
The tax character of all distributions paid to shareholders during the fiscal periods ended December 31, 2007 and December 31, 2006 were as follows: ordinary income $4,382,319 and $2,896,632, and long-term capital gains $77,609,437 and $61,040,910, respectively.
During the period ended December 31, 2007, as a result of permanent book to tax differences, primarily due to the tax treatment for real
The Portfolio 27
NOTES TO FINANCIAL STATEMENTS (continued)
|
estate investment trusts, the portfolio decreased accumulated undistributed investment income-net by $1,185,231 and increased accumulated net realized gain (loss) on investments by the same amount. Net assets and net asset value per share were not affected by this reclassification.
NOTE 2—Bank Line of Credit:
The portfolio participates with other Dreyfus-managed funds in a $350 million redemption credit facility (the “Facility”) to be utilized for temporary or emergency purposes, including the financing of redemptions. In connection therewith, the portfolio has agreed to pay commitment fees on its pro rata portion of the Facility. Interest is charged to the portfolio based on prevailing market rates in effect at the time of borrowing.
The average daily amount of borrowings outstanding under the Facility during the period ended December 31, 2007, was approximately $125,700 with a related weighted average annualized interest rate of 5.59% .
NOTE 3—Investment Advisory Fee and Other Transactions With Affiliates:
(a) Pursuant to an Investment Advisory Agreement with the Manager, the investment advisory fee is computed at the annual rate of .75% of the value of the portfolio’s average daily net assets and is payable monthly.
(b) Under the Distribution Plan (the “Plan”) adopted pursuant to Rule 12b-1 under the Act, Service shares pay the Distributor for distributing their shares, for servicing and/or maintaining Service shares shareholder accounts and for advertising and marketing for Service shares.The Plan provides for payments to be made at an annual rate of .25% of the value of the Service shares’ average daily net assets.The Distributor may make payments to Participating Insurance Companies and to brokers and dealers acting as principal underwriter for their variable insurance products.The fees payable under the Plan are payable without regard to actual expenses incurred. During the period ended December 31, 2007, Service shares were charged $51,882 pursuant to the Plan.
The portfolio compensates Dreyfus Transfer, Inc., a wholly-owned subsidiary of the Manager, under a transfer agency agreement for providing personnel and facilities to perform transfer agency services for the portfolio. During the period ended December 31, 2007, the portfolio was charged $897 pursuant to the transfer agency agreement.
The portfolio compensates Mellon Bank, an affiliate of the Manager, under a custody agreement for providing custodial services for the portfolio. During the period ended December 31, 2007, the portfolio was charged $52,733 pursuant to the custody agreement.
During the period ended December 31, 2007, the portfolio was charged $4,821 for services performed by the Chief Compliance Officer.
The components of “Due to The Dreyfus Corporation and affiliates” in the Statement of Assets and Liabilities consist of: investment advisory fees $301,484, Rule 12b-1 distribution plan fees $3,952, custodian fees $21,580, chief compliance officer fees $3,616 and transfer agency per account fees $150.
(c) Each Board member also serves as a Board member of other funds within the Dreyfus complex. Annual retainer fees and attendance fees are allocated to each fund based on net assets.
NOTE 4—Securities Transactions:
The aggregate amount of purchases and sales of investment securities, excluding short-term securities, during the period ended December 31, 2007, amounted to $517,287,086 and $645,061,062, respectively.
At December 31, 2007, the cost of investments for federal income tax purposes was $660,100,414; accordingly, accumulated net unrealized depreciation on investments was $29,953,981, consisting of $44,448,050 gross unrealized appreciation and $74,402,031 gross unrealized depreciation.
The Portfolio 29
REPORT OF INDEPENDENT REGISTERED PUBLIC ACCOUNTING FIRM
| Shareholders and Board of Trustees |
| Dreyfus Variable Investment Fund, Developing Leaders Portfolio |
We have audited the accompanying statement of assets and liabilities, including the statement of investments, of Dreyfus Variable Investment Fund, Developing Leaders Portfolio (one of the funds comprising Dreyfus Variable Investment Fund) as of December 31, 2007, and the related statement of operations for the year then ended, the statement of changes in net assets for each of the two years in the period then ended, and financial highlights for each of the years indicated therein. These financial statements and financial highlights are the responsibility of the Fund’s management. Our responsibility is to express an opinion on these financial statements and financial highlights based on our audits.
We conducted our audits in accordance with the standards of the Public Company Accounting Oversight Board (United States).Those standards require that we plan and perform the audit to obtain reasonable assurance about whether the financial statements and financial highlights are free of material misstatement.We were not engaged to perform an audit of the Fund’s internal control over financial reporting. Our audits included consideration of internal control over financial reporting as a basis for designing audit procedures that are appropriate in the circumstances,but not for the purpose of expressing an opinion on the effectiveness of the Fund’s internal control over financial reporting.Accordingly, we express no such opinion.An audit also includes examining, on a test basis, evidence supporting the amounts and disclosures in the financial statements and financial highlights, assessing the accounting principles used and significant estimates made by management, and evaluating the overall financial statement presentation. Our procedures included confirmation of securities owned as of December 31, 2007 by correspondence with the custodian. We believe that our audits provide a reasonable basis for our opinion.
In our opinion, the financial statements and financial highlights referred to above present fairly, in all material respects, the financial position of Dreyfus Variable Investment Fund, Developing Leaders Portfolio at December 31, 2007, the results of its operations for the year then ended, the changes in its net assets for each of the two years in the period then ended, and the financial highlights for each of the indicated years, in conformity with U.S. generally accepted accounting principles.
New York, New York
February 8, 2008
|
IMPORTANT TAX INFORMATION (Unaudited)
For federal tax purposes, the portfolio hereby designates $5.3325 per share as a long-term capital gain distribution paid on March 28, 2007 and also the portfolio hereby designates 99.94% of the ordinary dividends paid during the fiscal year ended December 31, 2007 as qualifying for the corporate dividends received deduction. Shareholders will receive notification in January 2008 of the percentage applicable to the preparation of their 2007 income tax returns.
The Portfolio 31
BOARD MEMBERS INFORMATION ( U n a u d i t e d )
Joseph S. DiMartino (64)
Chairman of the Board (1995)
|
Principal Occupation During Past 5 Years:
• Corporate Director and Trustee
|
Other Board Memberships and Affiliations:
|
- The Muscular Dystrophy Association, Director
- Century Business Services, Inc., a provider of outsourcing functions for small and medium size companies, Director
- The Newark Group, a provider of a national market of paper recovery facilities, paperboard mills and paperboard converting plants, Director
- Sunair Services Corporation, a provider of certain outdoor-related services to homes and businesses, Director
| No. of Portfolios for which Board Member Serves: 163 |
| ——————— |
| Peggy C. Davis (64) |
| Board Member (2006) |
Principal Occupation During Past 5 Years:
|
- Shad Professor of Law, New York University School of Law (1983-present)
- Writer and teacher in the fields of evidence, constitutional theory, family law, social sciences and the law, legal process and professional methodology and training
| No. of Portfolios for which Board Member Serves: 64 |
| ——————— |
| David P. Feldman (68) |
| Board Member (1994) |
Principal Occupation During Past 5 Years:
• Corporate Director and Trustee
|
Other Board Memberships and Affiliations:
|
- BBH Mutual Funds Group (11 funds), Director
- The Jeffrey Company, a private investment company, Director
No. of Portfolios for which Board Member Serves: 50
James F. Henry (77)
Board Member (1990)
|
Principal Occupation During Past 5 Years:
|
- President,The International Institute for Conflict Prevention and Resolution, a non- profit organization principally engaged in the development of alternatives to business litigation (Retired 2003)
- Advisor to The Elaw Forum, a consultant on managing corporate legal costs
- Advisor to John Jay Homestead (the restored home of the first U.S. Chief Justice)
- Individual Trustee of several trusts
Other Board Memberships and Affiliations:
|
- Director, advisor and mediator involved in several non-profit organizations, primarily engaged in domestic and international dispute resolution, and historic preservation
| No. of Portfolios for which Board Member Serves: 41 |
| ——————— |
| Ehud Houminer (67) |
| Board Member (2006) |
| Principal Occupation During Past 5 Years: |
| • Executive-in-Residence at the Columbia Business School, Columbia University |
Other Board Memberships and Affiliations:
|
- Avnet Inc., an electronics distributor, Director
- International Advisory Board to the MBA Program School of Management, Ben Gurion University, Chairman
| No. of Portfolios for which Board Member Serves: 67 |
| ——————— |
| Gloria Messinger (78) |
| Board Member (2006) |
Principal Occupation During Past 5 Years:
|
- Arbitrator for American Arbitration Association and National Association of Securities Dealers, Inc.
- Consultant in Intellectual Property
Other Board Memberships and Affiliations:
|
- Theater for a New Audience, Inc., Director
- Brooklyn Philharmonic, Director
No. of Portfolios for which Board Member Serves: 41
|
The Portfolio 33
BOARD MEMBERS INFORMATION (Unaudited) (continued)
Dr. Martin Peretz (68)
Board Member (1990)
|
Principal Occupation During Past 5 Years:
|
- Editor-in-Chief of The New Republic Magazine
- Lecturer in Social Studies at Harvard University (1965-2002)
- Director of TheStreet.com, a financial information service on the web
Other Board Memberships and Affiliations:
|
- American Council of Trustees and Alumni, Director
- Pershing Square Capital Management, Advisor
- Montefiore Ventures, General Partner
- Harvard Center for Blood Research,Trustee
- Bard College,Trustee
- Board of Overseers of YIVO Institute for Jewish Research, Chairman
| No. of Portfolios for which Board Member Serves: 41 |
| ——————— |
| Anne Wexler (77) |
| Board Member (2006) |
Principal Occupation During Past 5 Years:
|
- Chairman of the Wexler & Walker Public Policy Associates, consultants specializing in government relations and public affairs from January 1981 to present
Other Board Memberships and Affiliations:
|
- Wilshire Mutual Funds (5 funds), Director
- The Community Foundation for the National Capital Region, Director
- Member of the Council of Foreign Relations
- Member of the National Park Foundation
| No. of Portfolios for which Board Member Serves: 50 |
| ——————— |
Once elected all Board Members serve for an indefinite term, but achieve Emeritus status upon reaching age 80.The address of the Board Members and Officers is in c/o The Dreyfus Corporation, 200 Park Avenue, New York, New York 10166. Additional information about the Board Members is available in the fund’s Statement of Additional Information which can be obtained from Dreyfus free of charge by calling this toll free number: 1-800-554-4611.
John M. Fraser, Jr., Emeritus Board Member
Rosalind G. Jacobs, Emeritus Board Member
Dr. Paul A. Marks, Emeritus Board Member
OFFICERS OF THE FUND (Unaudited)
| J. DAVID OFFICER, President since |
| December 2006. |
Chief Operating Officer,Vice Chairman and a Director of the Manager, and an officer of 78 investment companies (comprised of 163 portfolios) managed by the Manager. He is 59 years old and has been an employee of the Manager since April 1998.
| PHILLIP N. MAISANO, Executive Vice |
| President since July 2007. |
Chief Investment Officer,Vice Chair and a director of the Manager, and an officer of 78 investment companies (comprised of 163 portfolios) managed by the Manager. Mr. Maisano also is an officer and/or Board member of certain other investment management subsidiaries of The Bank of New York Mellon Corporation, each of which is an affiliate of the Manager. He is 60 years old and has been an employee of the Manager since November 2006. Prior to joining the Manager, Mr. Maisano served as Chairman and Chief Executive Officer of EACM Advisors, an affiliate of the Manager, since August 2004, and served as Chief Executive Officer of Evaluation Associates, a leading institutional investment consulting firm, from 1988 until 2004.
| MICHAEL A. ROSENBERG, Vice President |
| and Secretary since August 2005. |
Associate General Counsel of the Manager, and an officer of 79 investment companies (comprised of 180 portfolios) managed by the Manager. He is 47 years old and has been an employee of the Manager since October 1991.
| JAMES BITETTO, Vice President and |
| Assistant Secretary since August 2005. |
Associate General Counsel and Secretary of the Manager, and an officer of 79 investment companies (comprised of 180 portfolios) managed by the Manager. He is 41 years old and has been an employee of the Manager since December 1996.
| JONI LACKS CHARATAN, Vice President |
| and Assistant Secretary since |
| August 2005. |
Associate General Counsel of the Manager, and an officer of 79 investment companies (comprised of 180 portfolios) managed by the Manager. She is 52 years old and has been an employee of the Manager since October 1988.
| JOSEPH M. CHIOFFI, Vice President and |
| Assistant Secretary since August 2005. |
Associate General Counsel of the Manager, and an officer of 79 investment companies (comprised of 180 portfolios) managed by the Manager. He is 46 years old and has been an employee of the Manager since June 2000.
| JANETTE E. FARRAGHER, Vice President |
| and Assistant Secretary since |
| August 2005. |
Associate General Counsel of the Manager, and an officer of 79 investment companies (comprised of 180 portfolios) managed by the Manager. She is 45 years old and has been an employee of the Manager since February 1984.
| JOHN B. HAMMALIAN, Vice President and |
| Assistant Secretary since August 2005. |
Associate General Counsel of the Manager, and an officer of 79 investment companies (comprised of 180 portfolios) managed by the Manager. He is 44 years old and has been an employee of the Manager since February 1991.
| ROBERT R. MULLERY, Vice President and |
| Assistant Secretary since August 2005. |
Associate General Counsel of the Manager, and an officer of 79 investment companies (comprised of 180 portfolios) managed by the Manager. He is 55 years old and has been an employee of the Manager since May 1986.
The Portfolio 35
OFFICERS OF THE FUND (Unaudited) (continued)
| JEFF PRUSNOFSKY, Vice President and |
| Assistant Secretary since August 2005. |
Associate General Counsel of the Manager, and an officer of 79 investment companies (comprised of 180 portfolios) managed by the Manager. He is 42 years old and has been an employee of the Manager since October 1990.
| JAMES WINDELS, Treasurer since |
| November 2001. |
Director – Mutual Fund Accounting of the Manager, and an officer of 79 investment companies (comprised of 180 portfolios) managed by the Manager. He is 49 years old and has been an employee of the Manager since April 1985.
| ROBERT ROBOL, Assistant Treasurer |
| since August 2003. |
Senior Accounting Manager – Money Market and Municipal Bond Funds of the Manager, and an officer of 79 investment companies (comprised of 180 portfolios) managed by the Manager. He is 43 years old and has been an employee of the Manager since October 1988.
| ROBERT SALVIOLO, Assistant Treasurer |
| since July 2007. |
Senior Accounting Manager – Equity Funds of the Manager, and an officer of 79 investment companies (comprised of 180 portfolios) managed by the Manager. He is 40 years old and has been an employee of the Manager since June 1989.
| ROBERT SVAGNA, Assistant Treasurer |
| since December 2002. |
Senior Accounting Manager – Equity Funds of the Manager, and an officer of 79 investment companies (comprised of 180 portfolios) managed by the Manager. He is 40 years old and has been an employee of the Manager since November 1990.
| GAVIN C. REILLY, Assistant Treasurer |
| since December 2005. |
Tax Manager of the Investment Accounting and Support Department of the Manager, and an officer of 79 investment companies (comprised of 180 portfolios) managed by the Manager. He is 39 years old and has been an employee of the Manager since April 1991.
| JOSEPH W. CONNOLLY, Chief Compliance |
| Officer since October 2004. |
Chief Compliance Officer of the Manager and The Dreyfus Family of Funds (79 investment companies, comprised of 180 portfolios). From November 2001 through March 2004, Mr. Connolly was first Vice-President, Mutual Fund Servicing for Mellon Global Securities Services. In that capacity, Mr. Connolly was responsible for managing Mellon’s Custody, Fund Accounting and Fund Administration services to third-party mutual fund clients. He is 50 years old and has served in various capacities with the Manager since 1980, including manager of the firm’s Fund Accounting Department from 1997 through October 2001.
| WILLIAM GERMENIS, Anti-Money |
| Laundering Compliance Officer since |
| September 2002. |
Vice President and Anti-Money Laundering Compliance Officer of the Distributor, and the Anti-Money Laundering Compliance Officer of 75 investment companies (comprised of 176 portfolios) managed by the Manager. He is 37 years old and has been an employee of the Distributor since October 1998.

| Telephone 1-800-554-4611 or 516-338-3300 |
| Mail | | The Dreyfus Family of Funds, 144 Glenn Curtiss Boulevard, Uniondale, NY 11556-0144 |
| | | Attn: Investments Division |
The portfolio files its complete schedule of portfolio holdings with the Securities and Exchange Commission (“SEC”) for the first and third quarters of each fiscal year on Form N-Q. The portfolio’s Forms N-Q are available on the SEC’s website at http://www.sec.gov and may be reviewed and copied at the SEC’s Public Reference Room in Washington, DC. Information on the operation of the Public Reference Room may be obtained by calling 1-202-551-8090.
A description of the policies and procedures that the portfolio uses to determine how to vote proxies relating to portfolio securities, and information regarding how the portfolio voted these proxies for the 12-month period ended June 30, 2007, is available at http://www.dreyfus.com and on the SEC’s website at http://www.sec.gov. The description of the policies and procedures is also available without charge, upon request, by calling 1-800-645-6561.

The views expressed in this report reflect those of the portfolio manager only through the end of the period covered and do not necessarily represent the views of Dreyfus or any other person in the Dreyfus organization.Any such views are subject to change at any time based upon market or other conditions and Dreyfus disclaims any responsibility to update such views. These views may not be relied on as investment advice and, because investment decisions for a Dreyfus portfolio are based on numerous factors, may not be relied on as an indication of trading intent on behalf of any Dreyfus portfolio.
Not FDIC-Insured • Not Bank-Guaranteed • May Lose Value
| | | Contents |
| |
| | | THE PORTFOLIO |
| |
|
| 2 | | A Letter from the CEO |
| 3 | | Discussion of Performance |
| 6 | | Portfolio Performance |
| 8 | | Understanding Your Portfolio’s Expenses |
| 8 | | Comparing Your Portfolio’s Expenses |
| | | With Those of Other Funds |
| 9 | | Statement of Investments |
| 13 | | Statement of Assets and Liabilities |
| 14 | | Statement of Operations |
| 15 | | Statement of Changes in Net Assets |
| 17 | | Financial Highlights |
| 19 | | Notes to Financial Statements |
| 26 | | Report of Independent Registered |
| | | Public Accounting Firm |
| 27 | | Important Tax Information |
| 28 | | Board Members Information |
| 31 | | Officers of the Fund |
| FOR MORE INFORMATION |
|
| | | Back Cover |
The Portfolio
| Dreyfus Variable Investment Fund, |
| Growth and Income Portfolio |

A LETTER FROM THE CEO
Dear Shareholder:
We are pleased to present this annual report for Dreyfus Variable Investment Fund, Growth and Income Portfolio, covering the 12-month period from January 1, 2007, through December 31, 2007.
Looking back, 2007 was a year of significant change for the stock market.Turmoil in the sub-prime mortgage market, declining housing values and soaring energy prices sparked a “flight to quality” in which investors reassessed their attitudes toward risk. As a result, smaller, more speculative companies that had led the stock market over the past several years lost value over the second half of the year, while shares of larger, multinational growth companies returned to favor. Many financial services and consumer discretionary companies were hurt by repercussions from the sub-prime lending crisis and economic downturn, but energy and basic materials producers generally moved higher along with underlying commodity prices.
The turbulence of 2007 reinforced a central principle of successful investing: diversification. Investors with broad exposure to the world’s stock and bond markets were better protected from the full impact of market volatility in areas that, earlier in the year, were among the bright spots at the time. As we look ahead, we believe that now is the perfect time to meet with your financial advisor, who can help you plan and diversify your investment portfolio in a way that manages the potential opportunities and risks that may continue to arise in 2008.
For information about how the portfolio performed during the reporting period, as well as market perspectives, we have provided a Discussion of Performance given by the Portfolio Manager.
Thank you for your continued confidence and support.

Thomas F. Eggers
Chief Executive Officer
The Dreyfus Corporation
January 15, 2008
|

DISCUSSION OF PERFORMANCE
For the period of January 1, 2007, through December 31, 2007, as provided by John B. Jares, CFA, Portfolio Manager
Portfolio and Market Performance Overview
Stifled consumer spending, a slowing U.S. economy and turmoil in the subprime mortgage market weighed on stocks during the second half of the reporting period, offsetting many first-half gains. However, large-capitalization stocks posted better returns than other capitalization ranges over the final six months of the year, generally due to decent corporate earnings and robust global economic growth. The portfolio produced higher returns than its benchmark, primarily due to the success of our sector allocation and stock selection strategies.
For the 12-month period ended December 31, 2007, Dreyfus Variable Investment Fund, Growth and Income Portfolio achieved an 8.44% total return for its Initial shares and an 8.19% total return for its Service shares.1 The portfolio’s benchmark, the Standard & Poor’s 500 Composite Stock Price Index (“S&P 500 Index”), returned 5.49% for the same period.2
The Portfolio’s Investment Approach
To pursue the portfolio’s goal of seeking long-term capital growth, current income and growth of income consistent with reasonable investment risk, the portfolio invests primarily in stocks of domestic and foreign issuers.We employ a “growth style” of investing, seeking companies whose fundamental strengths suggest the potential to provide superior earnings growth over time.We follow a consistent “bottom-up” approach that emphasizes individual stock selection. Income is generated primarily from dividend-paying stocks in which the portfolio may invest.
Financial, Consumer and Technology Stocks Bolstered the Portfolio’s Performance
Despite the headwinds of slowing U.S. economic growth, higher energy costs and a credit crisis that originated in the sub-prime mortgage market, numerous large-cap companies benefited from greater pricing power amid moderate inflation. In addition, a weak U.S. dollar
The Portfolio 3
DISCUSSION OF PERFORMANCE (continued)
and a robust global economy spurred growing demand for products and services from U.S.-based multinational companies.
The portfolio’s stock selection strategy, paired with strong sector allocations, produced relatively attractive returns in this environment. An underweighted position in the financials sector helped shelter the portfolio from ongoing problems experienced by many financial firms in the deteriorating sub-prime mortgage market. In addition, we steered away from those companies directly exposed to the mortgage industry, and we focused instead on companies such as brokerage house Charles Schwab, which benefited from strong asset inflows and a successful restructuring plan. Financial exchange CME Group also provided notably positive results, as its merger with the Chicago Board of Trade is expected to produce higher trade volumes, technology upgrades and product enhancements.
Despite a generally lackluster consumer spending environment, the portfolio’s selections of consumer discretionary stocks were a boon to performance. For example, apparel retailer Gap, Inc. gained as a result of solid execution in the midst of a corporate turnaround. Relatively heavy exposure to the information technology sector also benefited the portfolio. Apple’s share price was driven higher by the popularity of its products, while increased sales volumes of gaming platforms and software supported Microsoft’s stock price. Google garnered a larger share of the search-engine market, and computer hardware manufacturer Hewlett-Packard captured a greater percentage of personal computer sales.
Energy, Materials and Industrials Lagged the Averages
Robust demand from the world’s emerging markets was a primary driver of performance for the energy, industrials and materials sectors. Although the portfolio invested in winners such as Exxon Mobil, its lack of exposure to other top performers in these sectors detracted from relative performance. In addition, relatively light allocations to these strong-performing areas hampered returns compared to the benchmark. A lack of exposure to utilities companies,where we found no compelling growth opportunities,also held back returns during the reporting period.
Despite the positive contributions provided by the financials, consumer discretionary and information technology sectors, several stocks in these
economic segments weighed on the portfolio’s return. Banking giant Citigroup fell victim to sub-prime mortgage turmoil, and retailer Home Depot suffered from lackluster consumer spending as well as decreased activity in the housing industry. Semiconductor manufacturer Marvell Technology Group reported sub-par profitability in a newly purchased processor line.Broadcom Corporation,another semiconductor firm,was bridled by increased research-and-development expenditures for its venture into “baseband” solutions for cell phone usage.
Watching the Signs of Recession
As of year-end, a number of economic obstacles, such as rising unemployment and a housing recession, have depressed investor sentiment. Volatility caused by the anticipation of changes in government policy that typically occur during an election year may also weigh on the market. However, we believe that steps taken by the Chinese government to slow its economy may, in turn, reduce inflation in the U.S., contributing to improved domestic economic progress. We also expect the Federal Reserve Board to reduce short-term interest rates further, and we believe that the Bush administration may adopt a fiscal stimulus package in an effort to bolster the U.S. economy.We believe the portfolio is well positioned in this environment, and we have continued to identify what we believe to be attractive opportunities for growth.
January 15, 2008
| | | The portfolio is only available as a funding vehicle under variable life insurance policies or variable |
| | | annuity contracts issued by insurance companies. Individuals may not purchase shares of the |
| | | portfolio directly. A variable annuity is an insurance contract issued by an insurance company that |
| | | enables investors to accumulate assets on a tax-deferred basis for retirement or other long-term |
| | | goals.The investment objective and policies of Dreyfus Variable Investment Fund, Growth and |
| | | Income Portfolio made available through insurance products may be similar to other |
| | | funds/portfolios managed or advised by Dreyfus. However, the investment results of the portfolio |
| | | may be higher or lower than, and may not be comparable to, those of any other Dreyfus |
| | | fund/portfolio. |
| 1 | | Total return includes reinvestment of dividends and any capital gains paid. Past performance is no |
| | | guarantee of future results. Share price and investment return fluctuate such that upon redemption, |
| | | portfolio shares may be worth more or less than their original cost.The portfolio’s performance does |
| | | not reflect the deduction of additional charges and expenses imposed in connection with investing |
| | | in variable insurance contracts, which will reduce returns. |
| 2 | | SOURCE: LIPPER, INC. – Reflects reinvestment of net dividends and, where applicable, |
| | | capital gain distributions.The Standard & Poor’s 500 Composite Stock Price Index is a widely |
| | | accepted, unmanaged index of U.S. stock market performance. |
The Portfolio 5
PORTFOLIO PERFORMANCE
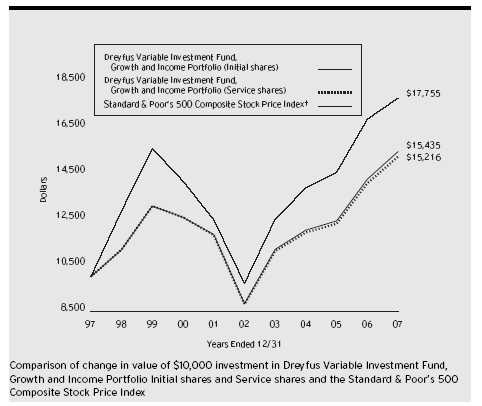
| Average Annual Total Returns | | as of | | 12/31/07 | | | | | | |
| | | | | | | 1 Year | | 5 Years | | 10 Years |
| |
| |
| |
| |
| |
|
| Initial shares | | | | | | 8.44% | | 11.79% | | 4.44% |
| Service shares | | | | | | 8.19% | | 11.58% | | 4.29% |
| The data for Service shares includes the results of Initial shares for the period prior to December 31, 2000 |
| (inception date of Service shares). Actual Service shares’ average annual total return and hypothetical growth |
| results would have been lower. See notes below. |
| † Source: Lipper Inc. |
| Past performance is not predictive of future performance.The portfolio’s performance shown in the graph and table does not |
| reflect the deduction of taxes that a shareholder would pay on portfolio distributions or the redemption of portfolio shares. |
| The portfolio’s performance does not reflect the deduction of additional charges and expenses imposed in |
| connection with investing in variable insurance contracts which will reduce returns. |
| The above graph compares a $10,000 investment made in Initial and Service shares of Dreyfus Variable Investment |
| Fund, Growth and Income Portfolio on 12/31/97 to a $10,000 investment made in the Standard & Poor’s 500 |
| Composite Stock Price Index (the “Index”) on that date. |
6
| The portfolio’s Initial shares are not subject to a Rule 12b-1 fee.The portfolio’s Service shares are subject to a 0.25% |
| annual Rule 12b-1 fee.The performance figures for Service shares reflect the performance of the portfolio’s Initial shares |
| from their inception date through December 30, 2000, and the performance of the portfolio’s Service shares from |
| December 31, 2000 (inception date of Service shares) to December 31, 2007 (blended performance figures).The |
| performance figures for each share class reflect certain expense reimbursements, without which the performance of each |
| share class would have been lower. In addition, the blended performance figures have not been adjusted to reflect the |
| higher operating expenses of the Service shares. If these expenses had been reflected, the blended performance figures would |
| have been lower. All dividends and capital gain distributions are reinvested. |
| The portfolio’s performance shown in the line graph takes into account all applicable portfolio fees and expenses (after any |
| expense reimbursements).The Index is a widely accepted, unmanaged index of U.S. stock market performance. Unlike a |
| mutual fund, the Index is not subject to charges, fees and other expenses. Investors cannot invest directly in any index. |
| Further information relating to portfolio performance, including expense reimbursements, if applicable, is contained in the |
| Financial Highlights section of the prospectus and elsewhere in this report. |
The Portfolio 7
UNDERSTANDING YOUR
PORTFOLIO’S EXPENSES (Unaudited)
As a mutual fund investor,you pay ongoing expenses,such as management fees and other expenses.Using the information below,you can estimate how these expenses affect your investment and compare them with the expenses of other funds.You also may pay one-time transaction expenses,including sales charges (loads) and redemption fees, which are not shown in this section and would have resulted in higher total expenses. For more information, see your portfolio’s prospectus or talk to your financial adviser.
Review your portfolio’s expenses
The table below shows the expenses you would have paid on a $1,000 investment in Dreyfus Variable Investment Fund, Growth and Income Portfolio from July 1, 2007 to December 31, 2007. It also shows how much a $1,000 investment would be worth at the close of the period, assuming actual returns and expenses.
| Expenses and Value of a $1,000 Investment | | |
| assuming actual returns for the six months ended December 31, 2007 |
| | | Initial Shares | | Service Shares |
| |
| |
|
| Expenses paid per $1,000 † | | $ 4.14 | | $ 5.11 |
| Ending value (after expenses) | | $1,029.00 | | $1,028.00 |
COMPARING YOUR PORTFOLIO’S EXPENSES WITH THOSE OF OTHER FUNDS (Unaudited)
Using the SEC’s method to compare expenses
The Securities and Exchange Commission (SEC) has established guidelines to help investors assess fund expenses. Per these guidelines, the table below shows your portfolio’s expenses based on a $1,000 investment, assuming a hypothetical 5% annualized return. You can use this information to compare the ongoing expenses (but not transaction expenses or total cost) of investing in the portfolio with those of other funds. All mutual fund shareholder reports will provide this information to help you make this comparison. Please note that you cannot use this information to estimate your actual ending account balance and expenses paid during the period.
Expenses and Value of a $1,000 Investment
assuming a hypothetical 5% annualized return for the six months ended December 31, 2007
| | | Initial Shares | | Service Shares |
| |
| |
|
| Expenses paid per $1,000 † | | $ 4.13 | | $ 5.09 |
| Ending value (after expenses) | | $1,021.12 | | $1,020.16 |
† Expenses are equal to the portfolio’s annualized expense ratio of .81% for Initial shares and 1.00% for Service shares, multiplied by the average account value over the period, multiplied by 184/365 (to reflect the one-half year period).
STATEMENT OF INVESTMENTS
December 31, 2007
|
| Common Stocks—99.9% | | Shares | | Value ($) |
| |
| |
|
| Consumer Discretionary—14.0% | | | | |
| Advance Auto Parts | | 77,929 | | 2,960,523 |
| Amazon.com | | 8,727 a | | 808,469 |
| Best Buy | | 48,701 b | | 2,564,108 |
| DeVry | | 21,454 | | 1,114,750 |
| Discovery Holding, Cl. A | | 35,275 a | | 886,813 |
| Gap | | 196,337 | | 4,178,051 |
| Home Depot | | 49,313 | | 1,328,492 |
| International Game Technology | | 29,377 | | 1,290,532 |
| Nordstrom | | 36,559 b | | 1,342,812 |
| Omnicom Group | | 33,605 | | 1,597,246 |
| Royal Caribbean Cruises | | 32,378 b | | 1,374,122 |
| Starbucks | | 56,058 a | | 1,147,507 |
| Urban Outfitters | | 76,075 a | | 2,073,804 |
| Walt Disney | | 36,711 | | 1,185,031 |
| | | | | 23,852,260 |
| Consumer Staples—13.9% | | | | |
| Altria Group | | 32,434 | | 2,451,362 |
| Avon Products | | 62,815 | | 2,483,077 |
| Cadbury Schweppes, ADR | | 36,112 | | 1,782,849 |
| Colgate-Palmolive | | 19,563 | | 1,525,132 |
| Costco Wholesale | | 21,351 | | 1,489,446 |
| Dean Foods | | 65,072 | | 1,682,762 |
| Estee Lauder Cos., Cl. A | | 28,877 | | 1,259,326 |
| Kraft Foods, Cl. A | | 53,249 | | 1,737,515 |
| Procter & Gamble | | 20,541 | | 1,508,120 |
| Wal-Mart Stores | | 97,580 | | 4,637,977 |
| Whole Foods Market | | 76,366 b | | 3,115,733 |
| | | | | 23,673,299 |
| Energy—8.4% | | | | |
| Chevron | | 19,560 | | 1,825,535 |
| Exxon Mobil | | 59,906 | | 5,612,593 |
| Halliburton | | 36,403 | | 1,380,038 |
| Schlumberger | | 21,067 | | 2,072,361 |
| Sunoco | | 12,858 | | 931,434 |
The Portfolio 9
STATEMENT OF INVESTMENTS (continued)
| Common Stocks (continued) | | Shares | | Value ($) |
| |
| |
|
| Energy (continued) | | | | |
| Tesoro | | 19,022 | | 907,349 |
| Ultra Petroleum | | 22,226 a | | 1,589,159 |
| | | | | 14,318,469 |
| Exchange Traded Funds—2.1% | | | | |
| iShares Russell 1000 Growth Index Fund | | 21,140 | | 1,284,889 |
| Powershares QQQ | | 26,716 | | 1,368,928 |
| Standard & Poor’s Depository Receipts (Tr. Ser. 1) | | 6,740 b | | 985,455 |
| | | | | 3,639,272 |
| Financial—8.3% | | | | |
| Bank of America | | 1 | | 41 |
| Charles Schwab | | 137,359 | | 3,509,522 |
| Citigroup | | 57,003 | | 1,678,168 |
| CME Group | | 2,095 | | 1,437,170 |
| Goldman Sachs Group | | 7,506 | | 1,614,165 |
| Janus Capital Group | | 40,850 | | 1,341,922 |
| MBIA | | 23,759 b | | 442,630 |
| State Street | | 18,271 | | 1,483,605 |
| Unum Group | | 114,035 | | 2,712,893 |
| | | | | 14,220,116 |
| Health Care—13.7% | | | | |
| Allergan | | 45,284 | | 2,909,044 |
| Amylin Pharmaceuticals | | 55,444 a,b | | 2,051,428 |
| Covance | | 8,611 a,b | | 745,885 |
| Genentech | | 28,361 a | | 1,902,172 |
| Gilead Sciences | | 65,685 a | | 3,022,167 |
| Johnson & Johnson | | 13,580 | | 905,786 |
| Medtronic | | 16,718 | | 840,414 |
| Merck & Co. | | 42,344 | | 2,460,610 |
| Pfizer | | 51,841 | | 1,178,346 |
| Pharmaceutical Product Development | | 49,710 | | 2,006,793 |
| Schering-Plough | | 73,319 | | 1,953,218 |
| Thermo Fisher Scientific | | 60,364 a | | 3,481,796 |
| | | | | 23,457,659 |
| Industrial—5.7% | | | | |
| Canadian National Railway | | 26,133 | | 1,226,422 |
| FedEx | | 11,612 b | | 1,035,442 |
10
| Common Stocks (continued) | | Shares | | Value ($) |
| |
| |
|
| Industrial (continued) | | | | |
| General Electric | | 138,569 | | 5,136,753 |
| Waste Management | | 73,258 | | 2,393,339 |
| | | | | 9,791,956 |
| Information Technology—19.4% | | | | |
| Accenture, Cl. A | | 33,898 | | 1,221,345 |
| Apple | | 22,795 a | | 4,515,234 |
| Broadcom, Cl. A | | 72,740 a | | 1,901,424 |
| Corning | | 79,393 | | 1,904,638 |
| eBay | | 64,382 a | | 2,136,839 |
| EMC | | 96,181 a | | 1,782,234 |
| Google, Cl. A | | 6,483 a | | 4,482,865 |
| Hewlett-Packard | | 62,791 | | 3,169,690 |
| Intersil, Cl. A | | 32,325 | | 791,316 |
| Juniper Networks | | 67,288 a | | 2,233,962 |
| KLA-Tencor | | 29,977 | | 1,443,692 |
| Marvell Technology Group | | 94,787 a | | 1,325,122 |
| Maxim Integrated Products | | 55,842 | | 1,478,696 |
| MEMC Electronic Materials | | 21,973 a | | 1,944,391 |
| Teradata | | 34,858 a | | 955,458 |
| Yahoo! | | 79,351 a | | 1,845,704 |
| | | | | 33,132,610 |
| Materials—1.3% | | | | |
| E.I. du Pont de Nemours & Co. | | 29,478 | | 1,299,685 |
| Ecolab | | 18,866 | | 966,128 |
| | | | | 2,265,813 |
| Software—12.3% | | | | |
| Adobe Systems | | 66,102 a | | 2,824,538 |
| Autodesk | | 19,221 a | | 956,437 |
| Cisco Systems | | 167,171 a | | 4,525,319 |
| Electronic Arts | | 64,058 a | | 3,741,628 |
| Microsoft | | 253,002 | | 9,006,871 |
| | | | | 21,054,793 |
| Telecommunication Services—.8% | | | | |
| Verizon Communications | | 29,495 | | 1,288,637 |
| Total Common Stocks | | | | |
| (cost $153,041,508) | | | | 170,694,884 |
The Portfolio 11
STATEMENT OF INVESTMENTS (continued)
| Other Investment—.2% | | Shares | | Value ($) |
| |
| |
|
| Registered Investment Company; | | | | |
| Dreyfus Institutional Preferred | | | | |
| Plus Money Market Fund | | | | |
| (cost $389,000) | | 389,000 c | | 389,000 |
| |
| |
|
| |
| Investment of Cash Collateral | | | | |
| for Securities Loaned—7.1% | | | | |
| |
| |
|
| Registered Investment Company; | | | | �� |
| Dreyfus Institutional Cash | | | | |
| Advantage Fund | | | | |
| (cost $12,031,197) | | 12,031,197 c | | 12,031,197 |
| |
| |
|
| |
| Total Investments (cost $165,461,705) | | 107.2% | | 183,115,081 |
| Liabilities, Less Cash and Receivables | | (7.2%) | | (12,375,298) |
| Net Assets | | 100.0% | | 170,739,783 |
| ADR—American Depository Receipts |
| a Non-income producing security. |
| b All or a portion of these securities are on loan. At December 31, 2007, the total market value of the portfolio’s |
| securities on loan is $11,583,434 and the total market value of the collateral held by the portfolio is $12,031,197. |
| c Investment in affiliated money market mutual fund. |
| Portfolio Summary | | (Unaudited) † | | | | |
| |
| | | Value (%) | | | | Value (%) |
| |
| |
| |
|
| Information Technology | | 19.4 | | Money Market Investments | | 7.3 |
| Consumer Discretionary | | 14.0 | | Industrial | | 5.7 |
| Consumer Staples | | 13.9 | | Exchange Traded Funds | | 2.1 |
| Health Care | | 13.7 | | Materials | | 1.3 |
| Software | | 12.3 | | Telecommunication Services | | .8 |
| Energy | | 8.4 | | | | |
| Financial | | 8.3 | | | | 107.2 |
| |
| † Based on net assets. | | | | | | |
| See notes to financial statements. | | | | |
STATEMENT OF ASSETS AND LIABILITIES
December 31, 2007
|
| | | Cost | | Value |
| |
| |
|
| Assets ($): | | | | |
| Investments in securities—See Statement of | | |
| Investments (including securities on loan, | | |
| valued at $11,583,434)—Note 1(b): | | |
| Unaffiliated issuers | | 153,041,508 | | 170,694,884 |
| Affiliated issuers | | 12,420,197 | | 12,420,197 |
| Cash | | | | 51,740 |
| Dividends and interest receivable | | | | 201,172 |
| Receivable for shares of Beneficial Interest subscribed | | 1,022 |
| Prepaid expenses | | | | 6,249 |
| | | | | 183,375,264 |
| |
| |
|
| Liabilities ($): | | | | |
| Due to The Dreyfus Corporation and affiliates—Note 3(b) | | 127,717 |
| Liability for securities on loan—Note 1(b) | | 12,031,197 |
| Payable for shares of Beneficial Interest redeemed | | 430,890 |
| Interest payable—Note 2 | | | | 3,897 |
| Accrued expenses | | | | 41,780 |
| | | | | 12,635,481 |
| |
| |
|
| Net Assets ($) | | | | 170,739,783 |
| |
| |
|
| Composition of Net Assets ($): | | | | |
| Paid-in capital | | | | 136,481,949 |
| Accumulated undistributed investment income—net | | 45,337 |
| Accumulated net realized gain (loss) on investments | | 16,559,121 |
| Accumulated net unrealized appreciation | | |
| (depreciation) on investments | | | | 17,653,376 |
| |
| |
|
| Net Assets ($) | | | | 170,739,783 |
| |
| |
|
| |
| |
| Net Asset Value Per Share | | | | |
| | | Initial Shares | | Service Shares |
| |
| |
|
| Net Assets ($) | | 149,445,498 | | 21,294,285 |
| Shares Outstanding | | 5,878,312 | | 837,433 |
| |
| |
|
| Net Asset Value Per Share ($) | | 25.42 | | 25.43 |
See notes to financial statements.
|
The Portfolio 13
STATEMENT OF OPERATIONS
Year Ended December 31, 2007
|
| Investment Income ($): | | |
| Income: | | |
| Cash dividends (net of $9,137 foreign taxes withheld at source): | | |
| Unaffiliated issuers | | 2,712,706 |
| Affiliated issuers | | 101,398 |
| Income from securities lending | | 26,393 |
| Total Income | | 2,840,497 |
| Expenses: | | |
| Investment advisory fee—Note 3(a) | | 1,363,348 |
| Distribution fees—Note 3(b) | | 52,694 |
| Professional fees | | 32,961 |
| Prospectus and shareholders’ reports | | 23,358 |
| Custodian fees—Note 3(b) | | 22,673 |
| Trustees’ fees and expenses—Note 3(c) | | 9,745 |
| Interest expense—Note 2 | | 3,897 |
| Loan commitment fees—Note 2 | | 1,821 |
| Shareholder servicing costs—Note 3(b) | | 213 |
| Miscellaneous | | 12,412 |
| Total Expenses | | 1,523,122 |
| Less—waiver of fees due to | | |
| undertaking—Note 3(a) | | (12,485) |
| Net Expenses | | 1,510,637 |
| Investment Income—Net | | 1,329,860 |
| |
|
| Realized and Unrealized Gain (Loss) on Investments—Note 4 ($): |
| Net realized gain (loss) on investments | | 16,655,032 |
| Net unrealized appreciation (depreciation) on investments | | (3,165,150) |
| Net Realized and Unrealized Gain (Loss) on Investments | | 13,489,882 |
| Net Increase in Net Assets Resulting from Operations | | 14,819,742 |
See notes to financial statements.
|
STATEMENT OF CHANGES IN NET ASSETS
| | | Year Ended December 31, |
| |
|
| | | 2007 | | 2006 |
| |
| |
|
| Operations ($): | | | | |
| Investment income—net | | 1,329,860 | | 1,456,246 |
| Net realized gain (loss) on investments | | 16,655,032 | | 28,379,489 |
| Net unrealized appreciation | | | | |
| (depreciation) on investments | | (3,165,150) | | (4,315,702) |
| Net Increase (Decrease) in Net Assets | | | | |
| Resulting from Operations | | 14,819,742 | | 25,520,033 |
| |
| |
|
| Dividends to Shareholders from ($): | | | | |
| Investment income—net: | | | | |
| Initial Shares | | (1,208,144) | | (1,339,148) |
| Service Shares | | (123,297) | | (119,237) |
| Net realized gain on investments: | | | | |
| Initial Shares | | (7,523,230) | | — |
| Service Shares | | (929,607) | | — |
| Total Dividends | | (9,784,278) | | (1,458,385) |
| |
| |
|
| Beneficial Interest Transactions ($): | | | | |
| Net proceeds from shares sold: | | | | |
| Initial Shares | | 6,208,358 | | 4,919,305 |
| Service Shares | | 3,743,238 | | 674,062 |
| Dividends reinvested: | | | | |
| Initial Shares | | 8,731,374 | | 1,339,148 |
| Service Shares | | 1,052,904 | | 119,237 |
| Cost of shares redeemed: | | | | |
| Initial Shares | | (38,914,721) | | (42,821,205) |
| Service Shares | | (3,294,844) | | (4,257,500) |
| Increase (Decrease) in Net Assets from | | | | |
| Beneficial Interest Transactions | | (22,473,691) | | (40,026,953) |
| Total Increase (Decrease) in Net Assets | | (17,438,227) | | (15,965,305) |
| |
| |
|
| Net Assets ($): | | | | |
| Beginning of Period | | 188,178,010 | | 204,143,315 |
| End of Period | | 170,739,783 | | 188,178,010 |
| Undistributed investment income—net | | 45,337 | | 46,918 |
The Portfolio 15
STATEMENT OF CHANGES IN NET ASSETS (continued)
|
| | | Year Ended December 31, |
| |
|
| | | 2007 | | 2006 |
| |
| |
|
| Capital Share Transactions: | | | | |
| Initial Shares | | | | |
| Shares sold | | 247,822 | | 213,279 |
| Shares issued for dividends reinvested | | 366,739 | | 58,910 |
| Shares redeemed | | (1,551,713) | | (1,884,013) |
| Net Increase (Decrease) in Shares Outstanding | | (937,152) | | (1,611,824) |
| |
| |
|
| Service Shares | | | | |
| Shares sold | | 149,883 | | 29,800 |
| Shares issued for dividends reinvested | | 44,252 | | 5,257 |
| Shares redeemed | | (131,541) | | (187,578) |
| Net Increase (Decrease) in Shares Outstanding | | 62,594 | | (152,521) |
See notes to financial statements.
|
FINANCIAL HIGHLIGHTS
The following tables describe the performance for each share class for the fiscal periods indicated.All information (except portfolio turnover rate) reflects financial results for a single portfolio share. Total return shows how much your investment in the fund would have increased (or decreased) during each period, assuming you had reinvested all dividends and distributions.These figures have been derived from the portfolio’s financial statements.
| | | | | Year Ended December 31, | | |
| |
| |
| |
|
| Initial Shares | | 2007 | | 2006 | | 2005 | | 2004 | | 2003 |
| |
| |
| |
| |
| |
|
| Per Share Data ($): | | | | | | | | | | |
| Net asset value, beginning of period | | 24.79 | | 21.82 | | 21.40 | | 20.16 | | 16.06 |
| Investment Operations: | | | | | | | | | | |
| Investment income—net a | | .19 | | .18 | | .28 | | .24 | | .14 |
| Net realized and unrealized | | | | | | | | | | |
| gain (loss) on investments | | 1.79 | | 2.97 | | .43 | | 1.25 | | 4.11 |
| Total from Investment Operations | | 1.98 | | 3.15 | | .71 | | 1.49 | | 4.25 |
| Distributions: | | | | | | | | | | |
| Dividends from investment income—net | | (.19) | | (.18) | | (.29) | | (.25) | | (.15) |
| Dividends from net realized | | | | | | | | | | |
| gain on investments | | (1.16) | | — | | — | | — | | — |
| Total Distributions | | (1.35) | | (.18) | | (.29) | | (.25) | | (.15) |
| Net asset value, end of period | | 25.42 | | 24.79 | | 21.82 | | 21.40 | | 20.16 |
| |
| |
| |
| |
| |
|
| Total Return (%) | | 8.44 | | 14.51 | | 3.35 | | 7.47 | | 26.57 |
| |
| |
| |
| |
| |
|
| Ratios/Supplemental Data (%): | | | | | | | | | | |
| Ratio of total expenses | | | | | | | | | | |
| to average net assets | | .81 | | .84 | | .81 | | .82 | | .82 |
| Ratio of net expenses | | | | | | | | | | |
| to average net assets b | | .81 | | .83 | | .81 | | .82 | | .82 |
| Ratio of net investment income | | | | | | | | | | |
| to average net assets | | .76 | | .78 | | 1.33 | | 1.21 | | .81 |
| Portfolio Turnover Rate | | 71.85 | | 124.50 | | 65.91 | | 52.74 | | 40.68 |
| |
| |
| |
| |
| |
|
| Net Assets, end of period ($ x 1,000) | | 149,445 | | 168,965 | | 183,903 | | 220,447 | | 243,973 |
| a | | Based on average shares outstanding at each month end. |
| b | | The differences for periods represents less than .01%. |
| See notes to financial statements. |
The Portfolio 17
FINANCIAL HIGHLIGHTS (continued)
|
| | | | | Year Ended December 31, | | |
| |
| |
| |
|
| Service Shares | | 2007 | | 2006 | | 2005 | | 2004 | | 2003 |
| |
| |
| |
| |
| |
|
| Per Share Data ($): | | | | | | | | | | |
| Net asset value, beginning of period | | 24.80 | | 21.83 | | 21.40 | | 20.15 | | 16.03 |
| Investment Operations: | | | | | | | | | | |
| Investment income—net a | | .14 | | .14 | | .24 | | .21 | | .11 |
| Net realized and unrealized | | | | | | | | | | |
| gain (loss) on investments | | 1.79 | | 2.97 | | .44 | | 1.24 | | 4.10 |
| Total from Investment Operations | | 1.93 | | 3.11 | | .68 | | 1.45 | | 4.21 |
| Distributions: | | | | | | | | | | |
| Dividends from investment income—net | | (.14) | | (.14) | | (.25) | | (.20) | | (.09) |
| Dividends from net realized | | | | | | | | | | |
| gain on investments | | (1.16) | | — | | — | | — | | — |
| Total Distributions | | (1.30) | | (.14) | | (.25) | | (.20) | | (.09) |
| Net asset value, end of period | | 25.43 | | 24.80 | | 21.83 | | 21.40 | | 20.15 |
| |
| |
| |
| |
| |
|
| Total Return (%) | | 8.19 | | 14.31 | | 3.21 | | 7.22 | | 26.36 |
| |
| |
| |
| |
| |
|
| Ratios/Supplemental Data (%): | | | | | | | | | | |
| Ratio of total expenses | | | | | | | | | | |
| to average net assets | | 1.06 | | 1.09 | | 1.07 | | 1.07 | | 1.07 |
| Ratio of net expenses | | | | | | | | | | |
| to average net assets | | 1.00 | | 1.00 | | 1.00 | | 1.00 | | 1.01 |
| Ratio of net investment income | | | | | | | | | | |
| to average net assets | | .55 | | .61 | | 1.14 | | 1.05 | | .63 |
| Portfolio Turnover Rate | | 71.85 | | 124.50 | | 65.91 | | 52.74 | | 40.68 |
| |
| |
| |
| |
| |
|
| Net Assets, end of period ($ x 1,000) | | 21,294 | | 19,213 | | 20,241 | | 23,473 | | 24,188 |
| |
| a Based on average shares outstanding at each month end. | | | | | | | | |
| See notes to financial statements. | | | | | | | | | | |
NOTES TO FINANCIAL STATEMENTS
NOTE 1—Significant Accounting Policies:
Dreyfus Variable Investment Fund (the “fund”) is registered under the Investment Company Act of 1940, as amended (the “Act”), as an open end management investment company, operating as a series company currently offering seven series, including the Growth and Income Portfolio (the “portfolio”). The portfolio is only offered to separate accounts established by insurance companies to fund variable annuity contracts and variable life insurance policies. The portfolio is a non-diversified series. The portfolio’s investment objective is to provide long-term capital growth, current income and growth of income, consistent with reasonable investment risk. The Dreyfus Corporation (the “Manager” or “Dreyfus”) serves as the portfolio’s investment adviser.
On July 1, 2007, Mellon Financial Corporation and The Bank of New York Company, Inc. merged, forming The Bank of New York Mellon Corporation (“BNY Mellon”). As part of this transaction, Dreyfus became a wholly-owned subsidiary of BNY Mellon.
MBSC Securities Corporation (the “Distributor”), a wholly-owned subsidiary of the Manager served as the distributor of the portfolio’s shares, which are sold without a sales charge.The portfolio is authorized to issue an unlimited number of $.001 par value shares of Beneficial Interest in each of the following classes of shares: Initial and Service. Each class of shares has identical rights and privileges, except with respect to the distribution plan and the expenses borne by each class and certain voting rights. Income, expenses (other than expenses attributable to a specific class), and realized and unrealized gains or losses on investments are allocated to each class of shares based on its relative net assets.
The fund accounts separately for the assets, liabilities and operations of each series. Expenses directly attributable to each series are charged to that series’ operations; expenses which are applicable to all series are allocated among them on a pro rata basis.
The Portfolio 19
NOTES TO FINANCIAL STATEMENTS (continued)
|
The portfolio’s financial statements are prepared in accordance with U.S. generally accepted accounting principles, which may require the use of management estimates and assumptions.Actual results could differ from those estimates.
The fund enters into contracts that contain a variety of indemnifica-tions.The portfolio’s maximum exposure under these arrangements is unknown. The portfolio does not anticipate recognizing any loss related to these arrangements.
(a) Portfolio valuation: Investments in securities are valued at the last sales price on the securities exchange or national securities market on which such securities are primarily traded. Securities listed on the National Market System for which market quotations are available are valued at the official closing price or, if there is no official closing price that day, at the last sale price. Securities not listed on an exchange or the national securities market, or securities for which there were no transactions, are valued at the average of the most recent bid and asked prices, except for open short positions, where the asked price is used for valuation purposes. Bid price is used when no asked price is available. Registered open-ended investment companies that are not traded on an exchange are valued at their net asset value.When market quotations or official closing prices are not readily available, or are determined not to reflect accurately fair value, such as when the value of a security has been significantly affected by events after the close of the exchange or market on which the security is principally traded (for example, a foreign exchange or market), but before the portfolio calculates its net asset value, the portfolio may value these investments at fair value as determined in accordance with the procedures approved by the Board of Trustees. Fair valuing of securities may be determined with the assistance of a pricing service using calculations based on indices of domestic securities and other appropriate indicators, such as prices of relevant ADRs and futures contracts. For other securities that are fair valued by the Board of Trustees, certain factors may be considered such as: fundamental analytical data, the nature and duration of restrictions
on disposition, an evaluation of the forces that influence the market in which the securities are purchased and sold, and public trading in similar securities of the issuer or comparable issuers. Financial futures are valued at the last sales price. Investments denominated in foreign currencies are translated to U.S. dollars at the prevailing rates of exchange. Forward currency exchange contracts are valued at the forward rate.
The Financial Accounting Standards Board (“FASB”) released Statement of Financial Accounting Standards No. 157 “Fair Value Measurements” (“FAS 157”). FAS 157 establishes an authoritative definition of fair value, sets out a framework for measuring fair value, and requires additional disclosures about fair-value measurements.The application of FAS 157 is required for fiscal years beginning after November 15, 2007 and interim periods within those fiscal years. Management does not believe that the application of this standard will have a material impact on the financial statements of the portfolio.
(b) Securities transactions and investment income: Securities transactions are recorded on a trade date basis. Realized gains and losses from securities transactions are recorded on the identified cost basis. Dividend income is recognized on the ex-dividend date and interest income, including, where applicable, accretion of discount and amortization of premium on investments, is recognized on the accrual basis.
The portfolio has an arrangement with the custodian bank whereby the portfolio receives earnings credits from the custodian when positive cash balances are maintained, if any, which are used to offset custody fees. For financial reporting purposes, the portfolio includes net earnings credits, if any, as an expense offset in the Statement of Operations.
Pursuant to a securities lending agreement with Mellon Bank, N.A. (“Mellon Bank”), an affiliate of the Manager, the portfolio may lend securities to qualified institutions. It is the portfolio’s policy, that at origination, all loans are secured by collateral of at least 102% of the value of U.S. securities loaned and 105% of the value of foreign securities loaned. It is the portfolio’s policy that collateral equivalent to at least
The Portfolio 21
NOTES TO FINANCIAL STATEMENTS (continued)
|
100% of the market value of securities on loan is maintained at all times. Collaterals are either in the form of cash, which can be invested in certain money market mutual funds managed by the Manager, U.S. Government and Agency securities or Letters of Credit.The portfolio is entitled to receive all income on securities loaned, in addition to income earned as a result of the lending transaction. Although each security loaned is fully collateralized, the portfolio bears the risk of delay in recovery of, or loss of rights in, the securities loaned should a borrower fail to return the securities in a timely manner. During the period ended December 31, 2007, Mellon Bank earned $11,311 from lending portfolio securities, pursuant to the securities lending agreement.
(c) Affiliated issuers: Investments in other investment companies advised by the Manager are defined as “affiliated” in the Act.
(d) Dividends to shareholders: Dividends are recorded on the ex-dividend date.The portfolio declares and pays dividends from investment income-net on a quarterly basis. Dividends from net realized capital gains, if any, are normally declared and paid annually, but the portfolio may make distributions on a more frequent basis to comply with the distribution requirements of the Internal Revenue Code of 1986, as amended (the “Code”).To the extent that net realized capital gains can be offset by capital loss carryovers, it is the policy of the portfolio not to distribute such gains. Income and capital gain distributions are determined in accordance with income tax regulations, which may differ from U.S. generally accepted accounting principles.
(e) Federal income taxes: It is the policy of the portfolio to continue to qualify as a regulated investment company, if such qualification is in the best interests of its shareholders, by complying with the applicable provisions of the Code and to make distributions of taxable income sufficient to relieve it from substantially all federal income and excise taxes.
During the current year, the portfolio adopted FASB Interpretation No. 48 “Accounting for Uncertainty in Income Taxes” (“FIN 48”). FIN 48 provides guidance for how uncertain tax positions should be recognized, measured, presented and disclosed in the financial statements. FIN 48 requires the evaluation of tax positions taken or expected to be taken in the course of preparing the portfolio’s tax returns to determine whether the tax positions are “more-likely-than-not” of being sustained by the applicable tax authority. Tax positions not deemed to meet the more-likely-than-not threshold would be recorded as a tax benefit or expense in the current year.The adoption of FIN 48 had no impact on the operations of the portfolio for the period ended December 31, 2007.
The portfolio is not subject to examination by U.S. Federal, State and City tax authorities for the tax years before 2004.
At December 31, 2007, the components of accumulated earnings on a tax basis were as follows: undistributed ordinary income $9,053,914, undistributed capital gains $7,650,843 and unrealized appreciation $17,553,077.
The tax characters of distributions paid to shareholders during the fiscal periods ended December 31, 2007 and December 31, 2006 were as follows: ordinary income $1,331,441 and $1,458,385 and long term capital gains $8,452,837 and $0, respectively.
NOTE 2—Bank Line of Credit:
The portfolio participates with other Dreyfus-managed funds in a $350 million redemption credit facility (the “Facility”) to be utilized for temporary or emergency purposes, including the financing of redemptions. In connection therewith, the portfolio has agreed to pay commitment
The Portfolio 23
NOTES TO FINANCIAL STATEMENTS (continued)
|
fees on its pro rata portion of the Facility. Interest is charged to the portfolio based on prevailing market rates in effect at the time of borrowing.
The average daily amount of borrowings outstanding under the Facility during the period ended December 31, 2007 was approximately $75,600, with a related weighted average annualized interest rate of 5.15% .
NOTE 3—Investment Advisory Fee and Other Transactions With Affiliates:
(a) Pursuant to an Investment Advisory Agreement with the Manager, the investment advisory fee is computed at the annual rate of .75% of the value of the portfolios’average daily net assets and is payable monthly.The Manager has agreed, from January 1, 2007 to December 31, 2007 to waive receipt of its fees and/or assume the expenses of the portfolio so that the expenses of neither class, exclusive of taxes, brokerage fees, interest on borrowings, commitment fees and extraordinary expenses, exceed 1% of the value of the average daily net assets of their class. During the period ended December 31, 2007, the Manager waived receipt of fees of $12,485, pursuant to the undertaking.
(b) Under the Distribution Plan (the “Plan”) adopted pursuant to Rule 12b-1 under the Act, Service shares pay the Distributor for distributing their shares, for servicing and/or maintaining Service shares shareholder accounts and for advertising and marketing for Service shares.The Plan provides for payments to be made at an annual rate of .25% of the value of the Service shares’ average daily net assets.The Distributor may make payments to Participating Insurance Companies and to brokers and dealers acting as principal underwriter for their variable insurance products.The fees payable under the Plan are payable without regard to actual expenses incurred. During the period ended December 31, 2007, Service shares were charged $52,694 pursuant to the Plan.
The portfolio compensates Dreyfus Transfer, Inc., a wholly-owned subsidiary of the Manager, under a transfer agency agreement for providing personnel and facilities to perform transfer agency services for
the portfolio. During the period ended December 31, 2007, the portfolio was charged $407 pursuant to the transfer agency agreement.
The portfolio compensates Mellon Bank, an affiliate of the Manager, under a custody agreement for providing custodial services for the portfolio. During the period ended December 31, 2007, the portfolio was charged $22,673 pursuant to the custody agreement.
During the period ended December 31, 2007, the portfolio was charged $4,821 for services performed by the Chief Compliance Officer.
The components of “Due to The Dreyfus Corporation and affiliates” in the Statement of Assets and Liabilities consist of: investment advisory fees $110,292, Rule 12b-1 distribution plan fees $4,561, custodian fees $9,431, chief compliance officer fees $3,616 and transfer agency per account fees $67, which are offset against an expense reimbursement currently in effect in the amount of $250.
(c) Each Board member also serves as a Board member of other funds within the Dreyfus complex. Annual retainer fees and attendance fees are allocated to each fund based on net assets.
NOTE 4—Securities Transactions:
The aggregate amount of purchases and sales of investment securities, excluding short-term securities, during the period ended December 31, 2007, amounted to $128,943,946 and $154,745,215, respectively.
At December 31, 2007, the cost of investments for federal income tax purposes was $165,562,004; accordingly, accumulated net unrealized appreciation on investments was $17,553,077, consisting of $25,459,241 gross unrealized appreciation and $7,906,164 gross unrealized depreciation.
The Portfolio 25
REPORT OF INDEPENDENT REGISTERED PUBLIC ACCOUNTING FIRM
Shareholders and Board of Trustees
Dreyfus Variable Investment Fund, Growth and Income Portfolio
We have audited the accompanying statement of assets and liabilities, including the statement of investments, of Dreyfus Variable Investment Fund, Growth and Income Portfolio (one of the funds comprising the Dreyfus Variable Investment Fund) as of December 31, 2007 and the related statement of operations for the year then ended, the statement of changes in net assets for each of the two years in the period then ended, and financial highlights for each of the years indicated therein. These financial statements and financial highlights are the responsibility of the Fund’s management. Our responsibility is to express an opinion on these financial statements and financial highlights based on our audits.
We conducted our audits in accordance with the standards of the Public Company Accounting Oversight Board (United States).Those standards require that we plan and perform the audit to obtain reasonable assurance about whether the financial statements and financial highlights are free of material misstatement.We were not engaged to perform an audit of the Fund’s internal control over financial reporting. Our audits included consideration of internal control over financial reporting as a basis for designing audit procedures that are appropriate in the circumstances, but not for the purpose of expressing an opinion on the effectiveness of the Fund’s internal control over financial reporting. Accordingly, we express no such opinion.An audit also includes examining, on a test basis, evidence supporting the amounts and disclosures in the financial statements and the financial highlights assessing the accounting principles used and significant estimates made by management, and evaluating the overall financial statement presentation. Our procedures included confirmation of securities owned as of December 31, 2007 by correspondence with the custodian. We believe that our audits provide a reasonable basis for our opinion.
In our opinion, the financial statements and financial highlights referred to above present fairly, in all material respects, the financial position of Dreyfus Variable Investment Fund, Growth and Income Portfolio at December 31, 2007, the results of its operations for the year then ended, the changes in its net assets for each of the two years in the period then ended, and the financial highlights for each of the indicated years, in conformity with U.S. generally accepted accounting principles.
New York, New York
February 8, 2008
|
IMPORTANT TAX INFORMATION (Unaudited)
For federal tax purposes, the portfolio hereby designates $1.1620 per share as a long-term capital gain distribution paid on March 30, 2007 and also the portfolio hereby designates 28.08% of the ordinary dividends paid during the fiscal year ended December 31, 2007 as qualifying for the corporate dividends received deduction. Shareholders will receive notification in January 2008 of the percentage applicable to the preparation of their 2007 income tax returns.
The Portfolio 27
BOARD MEMBERS INFORMATION (Unaudited)
Joseph S. DiMartino (64)
Chairman of the Board (1995)
|
Principal Occupation During Past 5 Years:
• Corporate Director and Trustee
|
Other Board Memberships and Affiliations:
|
- The Muscular Dystrophy Association, Director
- Century Business Services, Inc., a provider of outsourcing functions for small and medium size companies, Director
- The Newark Group, a provider of a national market of paper recovery facilities, paperboard mills and paperboard converting plants, Director
- Sunair Services Corporation, a provider of certain outdoor-related services to homes and businesses, Director
| No. of Portfolios for which Board Member Serves: 163 |
| ——————— |
| Peggy C. Davis (64) |
| Board Member (2006) |
Principal Occupation During Past 5 Years:
|
- Shad Professor of Law, New York University School of Law (1983-present)
- Writer and teacher in the fields of evidence, constitutional theory, family law, social sciences and the law, legal process and professional methodology and training
| No. of Portfolios for which Board Member Serves: 64 |
| ——————— |
| David P. Feldman (68) |
| Board Member (1994) |
Principal Occupation During Past 5 Years:
• Corporate Director and Trustee
|
Other Board Memberships and Affiliations:
|
- BBH Mutual Funds Group (11 funds), Director
- The Jeffrey Company, a private investment company, Director
No. of Portfolios for which Board Member Serves: 50
James F. Henry (77)
Board Member (1990)
|
Principal Occupation During Past 5 Years:
|
- President,The International Institute for Conflict Prevention and Resolution, a non- profit organization principally engaged in the development of alternatives to business litigation (Retired 2003)
- Advisor to The Elaw Forum, a consultant on managing corporate legal costs
- Advisor to John Jay Homestead (the restored home of the first U.S. Chief Justice)
- Individual Trustee of several trusts
Other Board Memberships and Affiliations:
|
- Director, advisor and mediator involved in several non-profit organizations, primarily engaged in domestic and international dispute resolution, and historic preservation
| No. of Portfolios for which Board Member Serves: 41 |
| ——————— |
| Ehud Houminer (67) |
| Board Member (2006) |
| Principal Occupation During Past 5 Years: |
| • Executive-in-Residence at the Columbia Business School, Columbia University |
Other Board Memberships and Affiliations:
|
- Avnet Inc., an electronics distributor, Director
- International Advisory Board to the MBA Program School of Management, Ben Gurion University, Chairman
| No. of Portfolios for which Board Member Serves: 67 |
| ——————— |
| Gloria Messinger (78) |
| Board Member (2006) |
Principal Occupation During Past 5 Years:
|
- Arbitrator for American Arbitration Association and National Association of Securities Dealers, Inc.
- Consultant in Intellectual Property
Other Board Memberships and Affiliations:
|
- Theater for a New Audience, Inc., Director
- Brooklyn Philharmonic, Director
No. of Portfolios for which Board Member Serves: 41
|
The Portfolio 29
BOARD MEMBERS INFORMATION (Unaudited) (continued)
Dr. Martin Peretz (68)
Board Member (1990)
|
Principal Occupation During Past 5 Years:
|
- Editor-in-Chief of The New Republic Magazine
- Lecturer in Social Studies at Harvard University (1965-2002)
- Director of TheStreet.com, a financial information service on the web
Other Board Memberships and Affiliations:
|
- American Council of Trustees and Alumni, Director
- Pershing Square Capital Management, Advisor
- Montefiore Ventures, General Partner
- Harvard Center for Blood Research,Trustee
- Bard College,Trustee
- Board of Overseers of YIVO Institute for Jewish Research, Chairman
| No. of Portfolios for which Board Member Serves: 41 |
| ——————— |
| Anne Wexler (77) |
| Board Member (2006) |
Principal Occupation During Past 5 Years:
|
- Chairman of the Wexler & Walker Public Policy Associates, consultants specializing in government relations and public affairs from January 1981 to present
Other Board Memberships and Affiliations:
|
- Wilshire Mutual Funds (5 funds), Director
- The Community Foundation for the National Capital Region, Director
- Member of the Council of Foreign Relations
- Member of the National Park Foundation
| No. of Portfolios for which Board Member Serves: 50 |
| ——————— |
Once elected all Board Members serve for an indefinite term, but achieve Emeritus status upon reaching age 80.The address of the Board Members and Officers is in c/o The Dreyfus Corporation, 200 Park Avenue, New York, New York 10166. Additional information about the Board Members is available in the fund’s Statement of Additional Information which can be obtained from Dreyfus free of charge by calling this toll free number: 1-800-554-4611.
John M. Fraser, Jr., Emeritus Board Member
Rosalind G. Jacobs, Emeritus Board Member
Dr. Paul A. Marks, Emeritus Board Member
OFFICERS OF THE FUND (Unaudited)
J. DAVID OFFICER, President since December 2006.
Chief Operating Officer,Vice Chairman and a Director of the Manager, and an officer of 78 investment companies (comprised of 163 portfolios) managed by the Manager. He is 59 years old and has been an employee of the Manager since April 1998.
PHILLIP N. MAISANO, Executive Vice President since July 2007.
Chief Investment Officer,Vice Chair and a director of the Manager, and an officer of 78 investment companies (comprised of 163 portfolios) managed by the Manager. Mr. Maisano also is an officer and/or Board member of certain other investment management subsidiaries of The Bank of New York Mellon Corporation, each of which is an affiliate of the Manager. He is 60 years old and has been an employee of the Manager since November 2006. Prior to joining the Manager, Mr. Maisano served as Chairman and Chief Executive Officer of EACM Advisors, an affiliate of the Manager, since August 2004, and served as Chief Executive Officer of Evaluation Associates, a leading institutional investment consulting firm, from 1988 until 2004.
| MICHAEL A. ROSENBERG, Vice President |
| and Secretary since August 2005. |
Associate General Counsel of the Manager, and an officer of 79 investment companies (comprised of 180 portfolios) managed by the Manager. He is 47 years old and has been an employee of the Manager since October 1991.
| JAMES BITETTO, Vice President and |
| Assistant Secretary since August 2005. |
Associate General Counsel and Secretary of the Manager, and an officer of 79 investment companies (comprised of 180 portfolios) managed by the Manager. He is 41 years old and has been an employee of the Manager since December 1996.
| JONI LACKS CHARATAN, Vice President |
| and Assistant Secretary since |
| August 2005. |
Associate General Counsel of the Manager, and an officer of 79 investment companies (comprised of 180 portfolios) managed by the Manager. She is 52 years old and has been an employee of the Manager since October 1988.
| JOSEPH M. CHIOFFI, Vice President and |
| Assistant Secretary since August 2005. |
Associate General Counsel of the Manager, and an officer of 79 investment companies (comprised of 180 portfolios) managed by the Manager. He is 46 years old and has been an employee of the Manager since June 2000.
| JANETTE E. FARRAGHER, Vice President |
| and Assistant Secretary since |
| August 2005. |
Associate General Counsel of the Manager, and an officer of 79 investment companies (comprised of 180 portfolios) managed by the Manager. She is 45 years old and has been an employee of the Manager since February 1984.
| JOHN B. HAMMALIAN, Vice President and |
| Assistant Secretary since August 2005. |
Associate General Counsel of the Manager, and an officer of 79 investment companies (comprised of 180 portfolios) managed by the Manager. He is 44 years old and has been an employee of the Manager since February 1991.
| ROBERT R. MULLERY, Vice President and |
| Assistant Secretary since August 2005. |
Associate General Counsel of the Manager, and an officer of 79 investment companies (comprised of 180 portfolios) managed by the Manager. He is 55 years old and has been an employee of the Manager since May 1986.
The Portfolio 31
OFFICERS OF THE FUND (Unaudited) (continued)
| JEFF PRUSNOFSKY, Vice President and |
| Assistant Secretary since August 2005. |
Associate General Counsel of the Manager, and an officer of 79 investment companies (comprised of 180 portfolios) managed by the Manager. He is 42 years old and has been an employee of the Manager since October 1990.
| JAMES WINDELS, Treasurer since |
| November 2001. |
Director – Mutual Fund Accounting of the Manager, and an officer of 79 investment companies (comprised of 180 portfolios) managed by the Manager. He is 49 years old and has been an employee of the Manager since April 1985.
| ROBERT ROBOL, Assistant Treasurer |
| since August 2003. |
Senior Accounting Manager – Money Market and Municipal Bond Funds of the Manager, and an officer of 79 investment companies (comprised of 180 portfolios) managed by the Manager. He is 43 years old and has been an employee of the Manager since October 1988.
| ROBERT SALVIOLO, Assistant Treasurer |
| since July 2007. |
Senior Accounting Manager – Equity Funds of the Manager, and an officer of 79 investment companies (comprised of 180 portfolios) managed by the Manager. He is 40 years old and has been an employee of the Manager since June 1989.
| ROBERT SVAGNA, Assistant Treasurer |
| since December 2002. |
Senior Accounting Manager – Equity Funds of the Manager, and an officer of 79 investment companies (comprised of 180 portfolios) managed by the Manager. He is 40 years old and has been an employee of the Manager since November 1990.
| GAVIN C. REILLY, Assistant Treasurer |
| since December 2005. |
Tax Manager of the Investment Accounting and Support Department of the Manager, and an officer of 79 investment companies (comprised of 180 portfolios) managed by the Manager. He is 39 years old and has been an employee of the Manager since April 1991.
| JOSEPH W. CONNOLLY, Chief Compliance |
| Officer since October 2004. |
Chief Compliance Officer of the Manager and The Dreyfus Family of Funds (79 investment companies, comprised of 180 portfolios). From November 2001 through March 2004, Mr. Connolly was first Vice-President, Mutual Fund Servicing for Mellon Global Securities Services. In that capacity, Mr. Connolly was responsible for managing Mellon’s Custody, Fund Accounting and Fund Administration services to third-party mutual fund clients. He is 50 years old and has served in various capacities with the Manager since 1980, including manager of the firm’s Fund Accounting Department from 1997 through October 2001.
| WILLIAM GERMENIS, Anti-Money |
| Laundering Compliance Officer since |
| September 2002. |
Vice President and Anti-Money Laundering Compliance Officer of the Distributor, and the Anti-Money Laundering Compliance Officer of 75 investment companies (comprised of 176 portfolios) managed by the Manager. He is 37 years old and has been an employee of the Distributor since October 1998.

| Telephone 1-800-554-4611 or 516-338-3300 |
| Mail | | The Dreyfus Family of Funds, 144 Glenn Curtiss Boulevard, Uniondale, NY 11556-0144 |
| | | Attn: Investments Division |
The portfolio files its complete schedule of portfolio holdings with the Securities and Exchange Commission (“SEC”) for the first and third quarters of each fiscal year on Form N-Q. The portfolio’s Forms N-Q are available on the SEC’s website at http://www.sec.gov and may be reviewed and copied at the SEC’s Public Reference Room in Washington, DC. Information on the operation of the Public Reference Room may be obtained by calling 1-202-551-8090.
A description of the policies and procedures that the portfolio uses to determine how to vote proxies relating to portfolio securities, and information regarding how the portfolio voted these proxies for the 12-month period ended June 30, 2007, is available at http://www.dreyfus.com and on the SEC’s website at http://www.sec.gov. The description of the policies and procedures is also available without charge, upon request, by calling 1-800-645-6561.

The views expressed in this report reflect those of the portfolio manager only through the end of the period covered and do not necessarily represent the views of Dreyfus or any other person in the Dreyfus organization.Any such views are subject to change at any time based upon market or other conditions and Dreyfus disclaims any responsibility to update such views. These views may not be relied on as investment advice and, because investment decisions for a Dreyfus portfolio are based on numerous factors, may not be relied on as an indication of trading intent on behalf of any Dreyfus portfolio.
Not FDIC-Insured • Not Bank-Guaranteed • May Lose Value
| | | Contents |
| |
| | | THE PORTFOLIO |
| |
|
| 2 | | A Letter from the CEO |
| 3 | | Discussion of Performance |
| 6 | | Portfolio Performance |
| 8 | | Understanding Your Portfolio’s Expenses |
| 8 | | Comparing Your Portfolio’s Expenses |
| | | With Those of Other Funds |
| 9 | | Statement of Investments |
| 14 | | Statement of Assets and Liabilities |
| 15 | | Statement of Operations |
| 16 | | Statement of Changes in Net Assets |
| 18 | | Financial Highlights |
| 20 | | Notes to Financial Statements |
| 28 | | Report of Independent Registered |
| | | Public Accounting Firm |
| 29 | | Important Tax Information |
| 30 | | Board Members Information |
| 33 | | Officers of the Fund |
| FOR MORE INFORMATION |
|
| | | Back Cover |
The Portfolio
| Dreyfus Variable Investment Fund, |
| International Equity Portfolio |

A LETTER FROM THE CEO
Dear Shareholder:
We are pleased to present this annual report for Dreyfus Variable Investment Fund, International Equity Portfolio, covering the 12-month period from January 1, 2007, through December 31, 2007.
Looking back, 2007 was a year of significant change for the financial markets worldwide. Turmoil in the U.S. sub-prime mortgage market, declining U.S.housing values and soaring energy prices caused significant challenges for international investors throughout the world.As a result, a number of asset classes lost value amid heightened volatility over the summer and fall. International equities generally proved to be a notable exception.As they have for several years, most major international equities indices outperformed their U.S. counterparts as global economic growth remained robust even as the U.S. economy entered a downturn.
The turbulence of 2007 reinforced a central principle of successful investing: diversification. Investors with broad exposure to the world’s stock and bond markets were better protected from the full impact of market volatility in areas that, earlier in the year, were among the bright spots at the time. As we look ahead, we believe that now is the perfect time to meet with your financial advisor, who can help you plan and diversify your investment portfolio in a way that manages the potential opportunities and risks that may continue to arise in 2008.
For information about how the portfolio performed during the reporting period, as well as market perspectives, we have provided a Discussion of Performance given by the Portfolio Manager.
Thank you for your continued confidence and support.

| Thomas F. Eggers |
| Chief Executive Officer |
| The Dreyfus Corporation |
| January 15, 2008 |

DISCUSSION OF PERFORMANCE
For the period of January 1, 2007, through December 31, 2007, as provided by Paul Butler, Portfolio Manager, Newton Capital Management Limited, Sub-Investment Adviser
Portfolio and Market Performance Overview
International stocks fared relatively well in 2007, as robust global economic growth generally offset the adverse effects of credit concerns stemming from turmoil due to the U.S. sub-prime mortgage crisis. The portfolio produced higher returns than its benchmark, mainly as a result of strong security selections in the energy, financials and telecommunications services sectors.
For the 12-month period ended December 31, 2007, Dreyfus Variable Investment Fund, International Equity Portfolio produced total returns of 17.12% for its Initial shares and 16.84% for its Service shares.1 This compares with a 11.17% total return from the portfolio’s benchmark, the Morgan Stanley Capital International Europe, Australasia, Far East Index (“MSCI EAFE Index”), for the same period.2
The Portfolio’s Investment Approach
The portfolio seeks capital growth by investing primarily in stocks of foreign companies.When choosing stocks, we consider global economic variables,such as gross domestic product,inflation and interest rates;invest-ment themes, such as new technologies and globalization; the relative values of equities, bonds and cash; company fundamentals and long-term trends in currency movements.Within markets and sectors determined to be relatively attractive, we seek what we believe are attractively priced companies that possess a sustainable competitive advantage in their market or sector. Securities are generally sold when themes or strategies change, when we determine that the company’s prospects have changed, or when a stock becomes fully valued by the market.
International Equities Advanced Despite Volatility
International stock markets posted generally strong returns during the first half of 2007, with gains fueled by corporate restructurings and robust mergers-and-acquisitions activity throughout much of Europe as well as strong global demand for energy and industrial commodities
The Portfolio 3
DISCUSSION OF PERFORMANCE (continued)
from emerging markets. Japan proved to be the laggard, as the country continued to struggle with economic issues despite efforts to reform its financial systems.
Market conditions worsened over the second half of the year, largely due to difficulties in the U.S. sub-prime mortgage sector and the subsequent repricing of risk in other financial markets.As credit concerns spread throughout the world, some highly leveraged institutional investors were compelled to sell their more liquid and creditworthy holdings to meet redemption requests and margin calls. As a result, even asset classes with no exposure to troubled sub-prime loans experienced downward pressure.The U.S. Federal Reserve Board and other central banks intervened by injecting liquidity into their financial systems, and stocks in many markets began to rebound.
Light Financial Holdings Bolstered Relative Performance
In this challenging market environment, the portfolio benefited from a substantially underweighted position in financial stocks. Due to our concerns regarding the extent of their exposure to the sub-prime lending crisis, the portfolio held no shares of banks in the United Kingdom, Japan and Australia, and maintained relatively light bank holdings in continental Europe.The portfolio achieved particularly strong relative performance by foregoing investment in the Royal Bank of Scotland, which weighed heavily on the benchmark’s financial component.
Instead, we allocated a relatively large portion of the portfolio’s assets to energy stocks, which continued to gain value as crude oil prices climbed to record levels.Within the energy area, we emphasized energy producers and oil services companies such as SIBIR Energy in the United Kingdom, Aker Kvaerner in Norway and Petróleo Brasileiro in Brazil.We generally de-emphasized “downstream” energy companies, including Total in France and BP in the United Kingdom. Also added were new positions in Canadian energy producers EnCana and Suncor Energy, which have access to large reserves of natural gas and oil shale, respectively.
Telecommunications stocks returned to favor in 2007 after languishing for several years as investors responded positively to the increasing popularity of “smartphone” devices that provide access to email and Internet over wireless telephone systems. Winners in the sector included Telefonica in Spain, France Telecom and Portugal Telecom, the last of which received a takeover offer that triggered “poison pill” measures designed to enhance shareholder value.
4
While disappointments during 2007 proved to be relatively mild, the portfolio’s information technology holdings generally detracted from relative performance, primarily due to its position in Swedish telecommunications equipment provider Ericsson, which fell short of earnings forecasts. We subsequently eliminated the portfolio’s position in Ericsson, avoiding further price declines. In addition, enterprise software producer SAP moved lower due to concerns regarding its efforts to penetrate mid-size companies, and Kazakh bank Kazkommertsbank suffered amid intensifying credit concerns.
Finding Opportunity in a Slower Growth Environment
As of year-end, we expect market conditions to be challenging in 2008 should the U.S. slowdown begin to dampen global economic growth. In industrialized markets, we have intensified our focus on traditionally defensive industry groups, such as consumer staples companies, utilities and telecommunications services providers. In emerging markets, where economic conditions have remained relatively robust, we have found opportunities among producers of industrial and agricultural commodities that appear poised to satisfy persistently high levels of customer demand.
January 15, 2008
| | | Investing in foreign companies involves special risks, including changes in currency rates, |
| | | political, economic and social instability, a lack of comprehensive company information, |
| | | differing auditing and legal standards and less market liquidity. An investment in this |
| | | portfolio should be considered only as a supplement to an overall investment program. |
| | | The portfolio is only available as a funding vehicle under variable life insurance policies or variable |
| | | annuity contracts issued by insurance companies. Individuals may not purchase shares of the |
| | | portfolio directly. A variable annuity is an insurance contract issued by an insurance company that |
| | | enables investors to accumulate assets on a tax-deferred basis for retirement or other long-term |
| | | goals.The investment objective and policies of Dreyfus Variable Investment Fund, International |
| | | Equity Portfolio made available through insurance products may be similar to other funds/ |
| | | portfolios managed or advised by Dreyfus. However, the investment results of the portfolio may be |
| | | higher or lower than, and may not be comparable to, those of any other Dreyfus fund/portfolio. |
| 1 | | Total return includes reinvestment of dividends and any capital gains paid. Past performance is no�� |
| | | guarantee of future results. Share price and investment return fluctuate such that upon redemption, |
| | | portfolio shares may be worth more or less than their original cost.The portfolio’s performance does |
| | | not reflect the deduction of additional charges and expenses imposed in connection with investing |
| | | in variable insurance contracts, which will reduce returns. |
| 2 | | SOURCE: LIPPER INC. — Reflects reinvestment of net dividends and, where applicable, |
| | | capital gain distributions.The Morgan Stanley Capital International Europe, Australasia, Far |
| | | East (MSCI EAFE) Index is an unmanaged index composed of a sample of companies |
| | | representative of the market structure of European and Pacific Basin countries. |
The Portfolio 5
PORTFOLIO PERFORMANCE
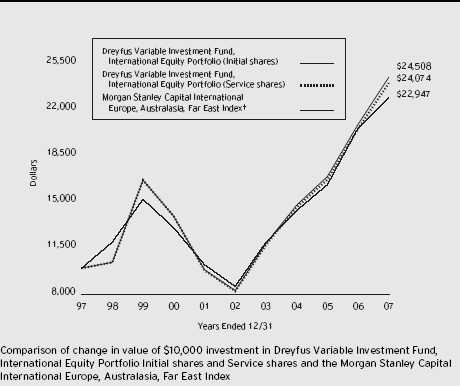
| Average Annual Total Returns as of | | 12/31/07 | | | | | | |
| | | | | 1 Year | | 5 Years | | 10 Years |
| |
| |
| |
| |
|
| Initial shares | | | | 17.12% | | 24.15% | | 9.38% |
| Service shares | | | | 16.84% | | 23.85% | | 9.18% |
| The data for Service shares includes the results of Initial shares for the period prior to December 31, 2000 |
| (inception date of Service shares). Actual Service shares’ average annual total return and hypothetical growth |
| results would have been lower. See notes below. |
| † Source: Lipper Inc. |
| Past performance is not predictive of future performance.The portfolio’s performance shown in the graph and table does not |
| reflect the deduction of taxes that a shareholder would pay on portfolio distributions or the redemption of portfolio shares. |
| The portfolio’s performance does not reflect the deduction of additional charges and expenses imposed in |
| connection with investing in variable insurance contracts which will reduce returns. |
| The above graph compares a $10,000 investment made in Initial and Service shares of Dreyfus Variable Investment |
| Fund, International Equity Portfolio on 12/31/97 to a $10,000 investment made in the Morgan Stanley Capital |
| International Europe, Australasia, Far East Index (the “Index”) on that date. |
6
The portfolio’s Initial shares are not subject to a Rule 12b-1 fee.The portfolio’s Service shares are subject to a 0.25% annual Rule 12b-1 fee.The performance figures for Service shares reflect the performance of the portfolio’s Initial shares from their inception date through December 30, 2000, and the performance of the portfolio’s Service shares from December 31, 2000 (inception date of Service shares) to December 31, 2007 (blended performance figures).The blended performance figures have not been adjusted to reflect the higher operating expenses of the Service shares. If these expenses had been reflected, the blended performance figures would have been lower. All dividends and capital gain distributions are reinvested.
The portfolio’s performance shown in the line graph takes into account all applicable portfolio fees and expenses.The Index is an unmanaged index composed of a sample of companies representative of the market structure of European and Pacific Basin countries and includes net dividends reinvested. Unlike a mutual fund, the Index is not subject to charges, fees and other expenses. Investors cannot invest directly in any index. Further information relating to portfolio performance, including expense reimbursements, if applicable, is contained in the Financial Highlights section of the prospectus and elsewhere in this report.
The Portfolio 7
| UNDERSTANDING YOUR |
| PORTFOLIO’S EXPENSES (Unaudited) |
As a mutual fund investor,you pay ongoing expenses,such as management fees and other expenses.Using the information below,you can estimate how these expenses affect your investment and compare them with the expenses of other funds.You also may pay one-time transaction expenses, including sales charges (loads) and redemption fees, which are not shown in this section and would have resulted in higher total expenses. For more information, see your portfolio’s prospectus or talk to your financial adviser.
Review your portfolio’s expenses
The table below shows the expenses you would have paid on a $1,000 investment in Dreyfus Variable Investment Fund, International Equity Portfolio from July 1, 2007 to December 31, 2007. It also shows how much a $1,000 investment would be worth at the close of the period, assuming actual returns and expenses.
| Expenses and Value of a $1,000 Investment | | |
| assuming actual returns for the six months ended December 31, 2007 |
| | | Initial Shares | | Service Shares |
| |
| |
|
| Expenses paid per $1,000 † | | $ 5.58 | | $ 6.88 |
| Ending value (after expenses) | | $1,069.90 | | $1,068.60 |
| COMPARING YOUR PORTFOLIO’S EXPENSES |
| WITH THOSE OF OTHER FUNDS (Unaudited) |
Using the SEC’s method to compare expenses
The Securities and Exchange Commission (SEC) has established guidelines to help investors assess fund expenses. Per these guidelines, the table below shows your portfolio’s expenses based on a $1,000 investment, assuming a hypothetical 5% annualized return. You can use this information to compare the ongoing expenses (but not transaction expenses or total cost) of investing in the portfolio with those of other funds. All mutual fund shareholder reports will provide this information to help you make this comparison. Please note that you cannot use this information to estimate your actual ending account balance and expenses paid during the period.
| Expenses and Value of a $1,000 Investment | | |
| assuming a hypothetical 5% annualized return for the six months ended December 31, 2007 |
| | | Initial Shares | | Service Shares |
| |
| |
|
| Expenses paid per $1,000 † | | $ 5.45 | | $ 6.72 |
| Ending value (after expenses) | | $1,019.81 | | $1,018.55 |
| † Expenses are equal to the portfolio’s annualized expense ratio of 1.07% for Initial shares and 1.32% for Service shares, |
| multiplied by the average account value over the period, multiplied by 184/365 (to reflect the one-half year period). |
8
| STATEMENT OF INVESTMENTS |
| December 31, 2007 |
| Common Stocks—97.6% | | Shares | | Value ($) |
| |
| |
|
| Argentina—.7% | | | | |
| Grupo Clarin, GDR, Cl. B | | 9,600 a | | 179,520 |
| Pampa Holding, GDR | | 11,988 a | | 238,801 |
| Telecom Argentina, ADR | | 8,120 a | | 180,670 |
| | | | | 598,991 |
| Australia—1.3% | | | | |
| Telstra (Installment Receipts) | | 411,454 | | 1,143,227 |
| Brazil—5.3% | | | | |
| All America Latina Logistica (Units) | | 45,155 | | 583,970 |
| Cia de Bebidas das Americas (AmBev), ADR (Preferred) | | 7,095 | | 503,958 |
| Cia Vale do Rio Doce, ADR | | 23,387 | | 654,368 |
| GVT Holding | | 23,900 a | | 478,671 |
| Petroleo Brasileiro, ADR (Preferred) | | 15,707 | | 1,511,328 |
| Porto Seguro | | 7,700 | | 282,283 |
| Tele Norte Leste Participacoes, ADR | | 35,908 | | 692,306 |
| | | | | 4,706,884 |
| Canada—3.6% | | | | |
| EnCana | | 20,418 | | 1,388,070 |
| Fording Canadian Coal Trust | | 22,118 | | 854,959 |
| Oncolytics Biotech | | 151,225 a | | 258,921 |
| Suncor Energy | | 6,837 | | 743,055 |
| | | | | 3,245,005 |
| Colombia—.6% | | | | |
| Suramericana de Inversiones | | 55,017 | | 544,172 |
| Denmark—.7% | | | | |
| AP Moller—Maersk, Cl. B | | 57 | | 606,976 |
| France—5.6% | | | | |
| Alstom | | 3,313 | | 710,939 |
| Electricite de France | | 1,840 | | 218,858 |
| France Telecom | | 30,007 | | 1,078,460 |
| Suez | | 20,590 | | 1,399,768 |
| Thales | | 15,103 | | 898,430 |
| Veolia Environnement | | 7,926 | | 722,570 |
| | | | | 5,029,025 |
| Germany—9.7% | | | | |
| Deutsche Boerse | | 9,252 | | 1,833,449 |
| E.ON | | 9,867 | | 2,097,056 |
| Gerry Weber International | | 17,776 | | 577,115 |
The Portfolio 9
STATEMENT OF INVESTMENTS (continued)
| Common Stocks (continued) | | Shares | | Value ($) |
| |
| |
|
| Germany (continued) | | | | |
| K+S | | 6,215 | | 1,476,575 |
| SAP | | 14,785 | | 766,849 |
| Siemens | | 6,742 | | 1,071,397 |
| Symrise | | 31,818 a | | 895,516 |
| | | | | 8,717,957 |
| Greece—1.3% | | | | |
| Public Power | | 21,326 | | 1,120,741 |
| Hong Kong—5.5% | | | | |
| Agile Property Holdings | | 376,000 | | 684,609 |
| Huabao International Holdings | | 355,000 | | 355,050 |
| Jardine Matheson Holdings | | 68,800 | | 1,905,760 |
| Shui On Land | | 92,500 | | 107,932 |
| SRE Group | | 1,608,000 | | 408,242 |
| Swire Pacific, Cl. A | | 104,000 | | 1,433,536 |
| | | | | 4,895,129 |
| Indonesia—1.9% | | | | |
| Astra International | | 216,000 | | 627,820 |
| Bank Central Asia | | 676,500 | | 525,787 |
| Indosat | | 590,000 | | 543,359 |
| | | | | 1,696,966 |
| Japan—10.4% | | | | |
| Asahi Breweries | | 64,500 | | 1,093,936 |
| Central Japan Railway | | 63 | | 538,201 |
| Japan Airport Terminal | | 48,000 | | 818,825 |
| Japan Tobacco | | 341 | | 2,041,934 |
| KDDI | | 99 | | 738,362 |
| Mitsubishi | | 30,000 | | 822,912 |
| Mitsui & Co | | 21,000 | | 445,206 |
| Nintendo | | 1,100 | | 659,675 |
| NTT Urban Development | | 640 | | 1,038,412 |
| Yamada Denki | | 9,770 | | 1,118,398 |
| | | | | 9,315,861 |
| Luxembourg—.6% | | | | |
| ArcelorMittal | | 7,324 | | 568,685 |
| Malaysia—1.6% | | | | |
| AMMB Holdings | | 21,425 | | 24,619 |
| Bursa Malaysia | | 131,700 | | 569,492 |
10
| Common Stocks (continued) | | Shares | | Value ($) |
| |
| |
|
| Malaysia (continued) | | | | |
| Genting | | 273,400 | | 653,118 |
| Telekom Malaysia | | 67,900 | | 229,961 |
| | | | | 1,477,190 |
| Netherlands—2.7% | | | | |
| Unilever | | 65,810 | | 2,416,146 |
| Norway—3.0% | | | | |
| Aker Kvaerner | | 19,635 | | 522,015 |
| StatoilHydro | | 69,820 | | 2,170,956 |
| | | | | 2,692,971 |
| Philippines—.6% | | | | |
| Ayala | | 41,155 | | 563,972 |
| Portugal—.9% | | | | |
| Portugal Telecom | | 63,644 | | 829,664 |
| Russia—2.6% | | | | |
| Evraz Group, GDR | | 11,016 | | 848,232 |
| Gazprom, ADR | | 13,206 | | 743,498 |
| Sistema JSFC, GDR | | 17,413 | | 726,993 |
| | | | | 2,318,723 |
| Singapore—2.1% | | | | |
| Indofood Agri Resources | | 710,000 a | | 1,192,946 |
| Singapore Airlines | | 57,000 | | 687,815 |
| | | | | 1,880,761 |
| South Africa—3.1% | | | | |
| Anglo Platinum | | 3,838 | | 564,317 |
| AngloGold Ashanti | | 14,610 | | 627,404 |
| ArcelorMittal South Africa | | 33,352 | | 663,884 |
| MTN Group | | 47,887 | | 916,263 |
| | | | | 2,771,868 |
| South Korea—2.8% | | | | |
| KT&G, GDR | | 16,360 b | | 696,445 |
| LG Telecom | | 64,611 a | | 679,244 |
| Samsung Fire & Marine Insurance | | 2,100 | | 567,628 |
| Shinsegae | | 730 | | 566,218 |
| | | | | 2,509,535 |
| Spain—2.3% | | | | |
| Iberdrola Renovables | | 72,500 a | | 597,971 |
| Telefonica | | 44,089 | | 1,430,104 |
| | | | | 2,028,075 |
The Portfolio 11
STATEMENT OF INVESTMENTS (continued)
| Common Stocks (continued) | | Shares | | Value ($) |
| |
| |
|
| Sweden—.7% | | | | |
| Tele2, Cl. B | | 33,515 | | 671,451 |
| Switzerland—7.5% | | | | |
| ABB | | 26,599 | | 765,672 |
| Bank Sarasin & Cie, Cl. B | | 127 | | 599,585 |
| Compagnie Financiere Richemont, Cl. A | | 12,947 | | 887,736 |
| Nestle | | 4,460 | | 2,046,594 |
| Nobel Biocare Holding | | 2,186 | | 584,502 |
| Novartis | | 17,576 | | 963,175 |
| Syngenta | | 3,491 | | 888,769 |
| | | | | 6,736,033 |
| Taiwan—.3% | | | | |
| Chunghwa Telecom, ADR | | 11,790 | | 248,887 |
| Thailand—1.4% | | | | |
| Advanced Info Service | | 245,000 | | 790,849 |
| Bank of Ayudhya | | 497,400 | | 434,501 |
| | | | | 1,225,350 |
| United Kingdom—18.8% | | | | |
| Admiral Group | | 39,123 | | 854,031 |
| Anglo American | | 29,603 | | 1,810,324 |
| BHP Billiton | | 23,458 | | 720,063 |
| British American Tobacco | | 53,607 | | 2,102,812 |
| Cable & Wireless | | 296,725 | | 1,100,341 |
| GlaxoSmithKline | | 38,788 | | 985,003 |
| ICAP | | 128,325 | | 1,851,044 |
| Old Mutual | | 229,092 | | 762,349 |
| Prudential | | 70,748 | | 1,000,148 |
| Sibir Energy | | 58,180 | | 657,644 |
| ST James’s Place | | 114,602 | | 628,017 |
| Tesco | | 110,368 | | 1,045,825 |
| Vodafone Group | | 495,182 | | 1,836,981 |
| Xstrata | | 20,728 | | 1,461,018 |
| | | | | 16,815,600 |
| Total Common Stocks | | | | |
| (cost $72,079,998) | | | | 87,375,845 |
12
| Preferred Stocks—.5% | | Shares | | Value ($) |
| |
| |
|
| Italy | | | | |
| Unipol Gruppo Finanziario | | | | |
| (cost $463,950) | | 133,997 | | 424,080 |
| |
| |
|
| Total Investments (cost $72,543,948) | | 98.1% | | 87,799,925 |
| Cash and Receivables (Net) | | 1.9% | | 1,729,100 |
| Net Assets | | 100.0% | | 89,529,025 |
| ADR—American Depository Receipts |
| GDR—Global Depository Receipts |
| a Non-income producing security. |
| b Securities exempt from registration under Rule 144A of the Securities Act of 1933.This security may be resold in |
| transactions exempt from registration, normally to qualified institutional buyers. At December 31, 2007, this security |
| amounted to $696,445 or .8% of net assets. |
| Portfolio Summary (Unaudited) † | | | | |
| |
| | | Value (%) | | | | Value (%) |
| |
| |
| |
|
| Consumer Goods | | 19.6 | | Utilities | | 8.0 |
| Financial | | 19.0 | | Oil & Gas | | 7.8 |
| Telecommunication Services | | 15.7 | | Health Care | | 3.1 |
| Materials | | 13.4 | | Technology | | 1.3 |
| Industrial | | 10.2 | | | | 98.1 |
| † Based on net assets. |
| See notes to financial statements. |
The Portfolio 13
| | STATEMENT OF ASSETS AND LIABILITIES
December 31, 2007
|
| | | Cost | | Value |
| |
| |
|
| Assets ($): | | | | |
| Investments in securities-See Statement of Investments | | 72,543,948 | | 87,799,925 |
| Cash | | | | 1,806,690 |
| Cash denominated in foreign currencies | | 32,506 | | 32,697 |
| Dividends receivable | | | | 161,431 |
| Unrealized appreciation on forward | | | | |
| currency exchange contracts—Note 4 | | | | 120,647 |
| Prepaid expenses | | | | 860 |
| | | | | 89,922,250 |
| |
| |
|
| Liabilities ($): | | | | |
| Due to The Dreyfus Corporation and affiliates—Note 3(b) | | | | 88,657 |
| Payable for shares of Beneficial Interest redeemed | | | | 240,474 |
| Interest payable—Note 2 | | | | 135 |
| Unrealized depreciation on forward | | | | |
| currency exchange contracts—Note 4 | | | | 31,643 |
| Accrued expenses | | | | 32,316 |
| | | | | 393,225 |
| |
| |
|
| Net Assets ($) | | | | 89,529,025 |
| |
| |
|
| Composition of Net Assets ($): | | | | |
| Paid-in capital | | | | 70,939,616 |
| Accumulated undistributed investment income—net | | | | 866,632 |
| Accumulated net realized gain (loss) on investments | | | | 2,377,659 |
| Accumulated net unrealized appreciation (depreciation) on | | |
| investments and foreign currency transactions | | | | 15,345,118 |
| |
| |
|
| Net Assets ($) | | | | 89,529,025 |
| Net Asset Value Per Share | | | | |
| | | Initial Shares | | Service Shares |
| |
| |
|
| Net Assets ($) | | 70,922,516 | | 18,606,509 |
| Shares Outstanding | | 3,068,239 | | 806,859 |
| |
| |
|
| Net Asset Value Per Share ($) | | 23.12 | | 23.06 |
See notes to financial statements.
14
STATEMENT OF OPERATIONS
Year Ended December 31, 2007
|
| Investment Income ($): | | |
| Income: | | |
| Cash dividends (net of $202,791 foreign taxes withheld at source) | | 1,857,266 |
| Expenses: | | |
| Investment advisory fee—Note 3(a) | | 598,201 |
| Custodian fees—Note 3(b) | | 127,694 |
| Professional fees | | 37,000 |
| Distribution fees—Note 3(b) | | 36,767 |
| Prospectus and shareholders’ reports | | 33,709 |
| Trustees’ fees and expenses—Note 3(c) | | 3,828 |
| Shareholder servicing costs—Note 3(b) | | 2,046 |
| Loan commitment fees—Note 2 | | 689 |
| Interest expense—Note 2 | | 135 |
| Registration fees | | 118 |
| Miscellaneous | | 20,195 |
| Total Expenses | | 860,382 |
| Less—reduction in custody fees | | |
| due to earnings credits—Note 1(c) | | (43,896) |
| Net Expenses | | 816,486 |
| Investment Income—Net | | 1,040,780 |
| |
|
| Realized and Unrealized Gain (Loss) on Investments—Note 4 ($): |
| Net realized gain (loss) on investments and foreign currency transactions | | 10,483,078 |
| Net realized gain (loss) on forward currency exchange contracts | | 123,483 |
| Net Realized Gain (Loss) | | 10,606,561 |
| Net unrealized appreciation (depreciation) | | |
| on investments and foreign currency transactions | | 953,023 |
| Net Realized and Unrealized Gain (Loss) on Investments | | 11,559,584 |
| Net Increase in Net Assets Resulting from Operations | | 12,600,364 |
See notes to financial statements.
The Portfolio 15
STATEMENT OF CHANGES IN NET ASSETS
| | | Year Ended December 31, |
| |
|
| | | 2007 | | 2006 |
| |
| |
|
| Operations ($): | | | | |
| Investment income—net | | 1,040,780 | | 691,054 |
| Net realized gain (loss) on investments | | 10,606,561 | | 6,254,718 |
| Net unrealized appreciation | | | | |
| (depreciation) on investments | | 953,023 | | 5,244,035 |
| Net Increase (Decrease) in Net Assets | | | | |
| Resulting from Operations | | 12,600,364 | | 12,189,807 |
| |
| |
|
| Dividends to Shareholders from ($): | | | | |
| Investment income—net: | | | | |
| Initial Shares | | (1,074,877) | | (397,562) |
| Service Shares | | (176,401) | | (41,615) |
| Total Dividends | | (1,251,278) | | (439,177) |
| |
| |
|
| Beneficial Interest Transactions ($): | | | | |
| Net proceeds from shares sold: | | | | |
| Initial Shares | | 28,845,262 | | 18,055,001 |
| Service Shares | | 8,610,473 | | 4,076,066 |
| Dividends reinvested: | | | | |
| Initial Shares | | 1,074,877 | | 397,562 |
| Service Shares | | 176,401 | | 41,615 |
| Cost of shares redeemed: | | | | |
| Initial Shares | | (27,780,728) | | (11,416,841) |
| Service Shares | | (2,023,562) | | (1,785,314) |
| Increase (Decrease) in Net Assets from | | | | |
| Beneficial Interest Transactions | | 8,902,723 | | 9,368,089 |
| Total Increase (Decrease) in Net Assets | | 20,251,809 | | 21,118,719 |
| |
| |
|
| Net Assets ($): | | | | |
| Beginning of Period | | 69,277,216 | | 48,158,497 |
| End of Period | | 89,529,025 | | 69,277,216 |
| Undistributed investment income—net | | 866,632 | | 829,555 |
16
| | | Year Ended December 31, |
| |
|
| | | 2007 | | 2006 |
| |
| |
|
| Capital Share Transactions: | | | | |
| Initial Shares | | | | |
| Shares sold | | 1,383,929 | | 994,470 |
| Shares issued for dividends reinvested | | 54,014 | | 21,630 |
| Shares redeemed | | (1,335,865) | | (627,671) |
| Net Increase (Decrease) in Shares Outstanding | | 102,078 | | 388,429 |
| |
| |
|
| Service Shares | | | | |
| Shares sold | | 407,840 | | 222,761 |
| Shares issued for dividends reinvested | | 8,869 | | 2,264 |
| Shares redeemed | | (94,486) | | (98,496) |
| Net Increase (Decrease) in Shares Outstanding | | 322,223 | | 126,529 |
See notes to financial statements.
The Portfolio 17
FINANCIAL HIGHLIGHTS
The following tables describe the performance for each share class for the fiscal periods indicated.All information (except portfolio turnover rate) reflects financial results for a single portfolio share.Total return shows how much your investment in the portfolio would have increased (or decreased) during each period, assuming you had reinvested all dividends and distributions.These figures have been derived from the portfolio’s financial statements.
| | | | | Year Ended December 31, | | |
| |
| |
| |
|
| Initial Shares | | 2007 | | 2006 | | 2005 | | 2004 | | 2003 |
| |
| |
| |
| |
| |
|
| Per Share Data ($): | | | | | | | | | | |
| Net asset value, beginning of period | | 20.08 | | 16.41 | | 14.36 | | 11.97 | | 8.75 |
| Investment Operations: | | | | | | | | | | |
| Investment income—net a | | .29 | | .22 | | .26 | | .27 | | .14 |
| Net realized and unrealized | | | | | | | | | | |
| gain (loss) on investments | | 3.10 | | 3.59 | | 1.85 | | 2.64 | | 3.55 |
| Total from Investment Operations | | 3.39 | | 3.81 | | 2.11 | | 2.91 | | 3.69 |
| Distributions: | | | | | | | | | | |
| Dividends from investment income—net | | (.35) | | (.14) | | (.06) | | (.52) | | (.47) |
| Net asset value, end of period | | 23.12 | | 20.08 | | 16.41 | | 14.36 | | 11.97 |
| |
| |
| |
| |
| |
|
| Total Return (%) | | 17.12 | | 23.31 | | 14.75 | | 24.57 | | 42.89 |
| |
| |
| |
| |
| |
|
| Ratios/Supplemental Data (%): | | | | | | | | | | |
| Ratio of total expenses | | | | | | | | | | |
| to average net assets | | 1.03 | | 1.03 | | 1.10 | | 1.04 | | 1.19 |
| Ratio of net expenses | | | | | | | | | | |
| to average net assets | | .98 | | .97 | | 1.09 | | 1.04 | | 1.19 |
| Ratio of net investment income | | | | | | | | | | |
| to average net assets b | | 1.37 | | 1.19 | | 1.76 | | 2.13 | | 1.42 |
| Portfolio Turnover Rate | | 113.77 | | 98.92 | | 92.82 | | 96.55 | | 101.02 |
| |
| |
| |
| |
| |
|
| Net Assets, end of period ($ x 1,000) | | 70,923 | | 59,561 | | 42,289 | | 38,874 | | 32,892 |
| a | | Based on average shares outstanding at each month end. |
| b | | The differences for periods represents less than .01%. |
| See notes to financial statements. |
18
| | | | | | | Year Ended December 31, | | |
| | | |
| |
| |
|
| Service Shares | | 2007 | | 2006 | | 2005 | | 2004 | | 2003 |
| |
| |
| |
| |
| |
|
| Per Share Data ($): | | | | | | | | | | |
| Net asset value, beginning of period | | 20.05 | | 16.39 | | 14.35 | | 11.95 | | 8.74 |
| Investment Operations: | | | | | | | | | | |
| Investment income—net a | | .22 | | .16 | | .22 | | .24 | | .12 |
| Net realized and unrealized | | | | | | | | | | |
| gain (loss) on investments | | 3.11 | | 3.61 | | 1.85 | | 2.63 | | 3.54 |
| Total from Investment Operations | | 3.33 | | 3.77 | | 2.07 | | 2.87 | | 3.66 |
| Distributions: | | | | | | | | | | |
| Dividends from investment income—net | | (.32) | | (.11) | | (.03) | | (.47) | | (.45) |
| Net asset value, end of period | | 23.06 | | 20.05 | | 16.39 | | 14.35 | | 11.95 |
| |
| |
| |
| |
| |
|
| Total Return (%) | | 16.84 | | 23.06 | | 14.45 | | 24.20 | | 42.56 |
| |
| |
| |
| |
| |
|
| Ratios/Supplemental Data (%): | | | | | | | | | | |
| Ratio of total expenses | | | | | | | | | | |
| to average net assets | | 1.28 | | 1.28 | | 1.34 | | 1.29 | | 1.44 |
| Ratio of net expenses | | | | | | | | | | |
| to average net assets | | 1.23 | | 1.21 | | 1.33 | | 1.29 | | 1.44 |
| Ratio of net investment income | | | | | | | | | | |
| to average net assets b | | 1.02 | | .90 | | 1.50 | | 1.89 | | 1.17 |
| Portfolio Turnover Rate | | 113.77 | | 98.92 | | 92.82 | | 96.55 | | 101.02 |
| |
| |
| |
| |
| |
|
| Net Assets, end of period ($ x 1,000) | | 18,607 | | 9,716 | | 5,870 | | 4,265 | | 3,375 |
| a | | Based on average shares outstanding at each month end. | | | | | | | | |
| b | | The differences for periods represents less than .01%. | | | | | | | | |
| See notes to financial statements. | | | | | | | | | | |
The Portfolio 19
NOTES TO FINANCIAL STATEMENTS
NOTE 1—Significant Accounting Policies:
Dreyfus Variable Investment Fund (the “fund”) is registered under the Investment Company Act of 1940, as amended (the “Act”), as an open-end management investment company, operating as a series company currently offering seven series, including the International Equity Portfolio (the “portfolio”). The portfolio is only offered to separate accounts established by insurance companies to fund variable annuity contracts and variable life insurance policies. The portfolio is a non-diversified series. The portfolio’s investment objective is to maximize capital growth.The Dreyfus Corporation (the “Manager” or “Dreyfus”) serves as the portfolio’s investment adviser.
On July 1, 2007, Mellon Financial Corporation and The Bank of New York Company, Inc. merged, forming The Bank of New York Mellon Corporation (“BNY Mellon”). As part of this transaction, Dreyfus became a wholly-owned subsidiary of BNY Mellon. Newton Capital Management Limited (“Newton”) is the portfolio’s sub-investment adviser. Newton is also a wholly-owned subsidiary of BNY Mellon, and an affiliate of Dreyfus.
MBSC Securities Corporation (the “Distributor”), a wholly-owned subsidiary of the Manager, is the distributor of the portfolio’s shares, which are sold without a sales charge. The portfolio is authorized to issue an unlimited number of $.001 par value shares of Beneficial Interest in each of the following classes of shares: Initial and Service. Each class of shares has identical rights and privileges, except with respect to the distribution plan and the expenses borne by each class, the allocation of certain transfer agency costs and certain voting rights. Income, expenses (other than expenses attributable to a specific class), and realized and unrealized gains or losses on investments are allocated to each class of shares based on its relative net assets.
The fund accounts separately for the assets, liabilities and operations of each series. Expenses directly attributable to each series are charged to that series’ operations; expenses which are applicable to all series are allocated among them on a pro rata basis.
20
The portfolio’s financial statements are prepared in accordance with U.S. generally accepted accounting principles, which may require the use of management estimates and assumptions.Actual results could differ from those estimates.
The fund enters into contracts that contain a variety of indemnifica-tions.The portfolio’s maximum exposure under these arrangements is unknown. The portfolio does not anticipate recognizing any loss related to these arrangements.
(a) Portfolio valuation: Investments in securities are valued at the last sales price on the securities exchange or national securities market on which such securities are primarily traded. Securities listed on the National Market System for which market quotations are available are valued at the official closing price or, if there is no official closing price that day, at the last sales price. Securities not listed on an exchange or the national securities market, or securities for which there were no transactions, are valued at the average of the most recent bid and asked prices, except for open short positions, where the asked price is used for valuation purposes. Bid price is used when no asked price is available. Registered open-end investment companies that are not traded on an exchange are valued at their net asset value.When market quotations or official closing prices are not readily available, or are determined not to reflect accurately fair value, such as when the value of a security has been significantly affected by events after the close of the exchange or market on which the security is principally traded (for example, a foreign exchange or market), but before the portfolio calculates its net asset value, the portfolio may value these investments at fair value as determined in accordance with the procedures approved by the Board of Trustees. Fair valuing of securities may be determined with the assistance of a pricing service using calculations based on indices of domestic securities and other appropriate indicators, such as prices of relevant ADRs and futures contracts. For other securities that are fair valued by the Board of Trustees, certain factors may be considered such as: fundamental analytical data, the nature and duration of restrictions
The Portfolio 21
NOTES TO FINANCIAL STATEMENTS (continued)
on disposition, an evaluation of the forces that influence the market in which the securities are purchased and sold and public trading in similar securities of the issuer or comparable issuers. Financial futures are valued at the last sales price. Investments denominated in foreign currencies are translated to U.S. dollars at the prevailing rates of exchange. Forward currency exchange contracts are valued at the forward rate.
The Financial Accounting Standards Board (“FASB”) released Statement of Financial Accounting Standards No. 157 “Fair Value Measurements” (“FAS 157”). FAS 157 establishes an authoritative definition of fair value, sets out a framework for measuring fair value, and requires additional disclosures about fair-value measurements. The application of FAS 157 is required for fiscal years beginning after November 15, 2007 and interim periods within those fiscal years. Management does not believe that the application of this standard will have a material impact on the financial statements of the portfolio.
(b) Foreign currency transactions: The portfolio does not isolate that portion of the results of operations resulting from changes in foreign exchange rates on investments from the fluctuations arising from changes in market prices of securities held. Such fluctuations are included with the net realized and unrealized gains or losses on investments.
Net realized foreign exchange gains or losses arise from sales and maturities of short-term securities, sales of foreign currencies, currency gains or losses realized on securities transactions and the difference between the amounts of dividends, interest and foreign withholding taxes recorded on the portfolio’s books and the U.S. dollar equivalent of the amounts actually received or paid. Net unrealized foreign exchange gains or losses arise from changes in the value of assets and liabilities other than investments in securities, resulting from changes in exchange rates. Such gains and losses are included with net realized and unrealized gains or losses on investments.
(c) Securities transactions and investment income: Securities transactions are recorded on a trade date basis. Realized gains and losses from securities transactions are recorded on the identified cost basis.
22
Dividend income is recognized on the ex-dividend date and interest income, including, where applicable, accretion of discount and amortization of premium on investments, is recognized on the accrual basis.
The portfolio has an arrangement with the custodian bank whereby the portfolio receives earnings credits from the custodian when positive cash balances are maintained, which are used to offset custody fees. For financial reporting purposes, the portfolio includes net earnings credits as an expense offset in the Statement of Operations.
(d) Dividends to shareholders: Dividends are recorded on the ex-dividend date. Dividends from investment income-net and dividends from net realized capital gain, if any, are normally declared and paid annually, but the portfolio may make distributions on a more frequent basis to comply with the distribution requirements of the Internal Revenue Code of 1986, as amended (the “Code”).To the extent that net realized capital gain can be offset by capital loss carryovers, it is the policy of the portfolio not to distribute such gain. Income and capital gain distributions are determined in accordance with income tax regulations, which may differ from U.S. generally accepted accounting principles.
(e) Federal income taxes: It is the policy of the portfolio to continue to qualify as a regulated investment company, if such qualification is in the best interests of its shareholders, by complying with the applicable provisions of the Code, and to make distributions of taxable income sufficient to relieve it from substantially all federal income and excise taxes.
During the current year, the portfolio adopted FASB Interpretation No. 48 “Accounting for Uncertainty in Income Taxes” (“FIN 48”). FIN 48 provides guidance for how uncertain tax positions should be recognized, measured, presented and disclosed in the financial statements. FIN 48 requires the evaluation of tax positions taken or expected to be taken in the course of preparing the portfolio’s tax returns to determine whether the tax positions are “more-likely-than-not” of being sustained by the applicable tax authority. Tax positions not deemed to meet the more-likely-than-not threshold would be recorded as a tax benefit or expense
The Portfolio 23
NOTES TO FINANCIAL STATEMENTS (continued)
in the current year.The adoption of FIN 48 had no impact on the operations of the portfolio for the period ended December 31, 2007.
The portfolio is not subject to examination by U.S. Federal, State and City tax authorities for the tax years before 2004.
At December 31, 2007, the components of accumulated earnings on a tax basis were as follows: undistributed ordinary income $1,274,384, undistributed capital gains $2,417,929 and unrealized appreciation $14,897,096.
The tax character of distributions paid to shareholders during the fiscal periods ended December 31,2007 and December 31, 2006 were as follows: ordinary income $1,251,278 and $439,177, respectively.
During the period ended December 31, 2007, as a result of permanent book to tax differences, primarily due to the tax treatment for foreign currency exchange gains and losses and passive foreign investment companies, the portfolio increased accumulated undistributed investment income-net by $247,575 and decreased accumulated net realized gains (losses) on investments by the same amount. Net assets and net asset value per share were not affected by this reclassification.
NOTE 2—Bank Line of Credit:
The portfolio participates with other Dreyfus-managed funds in a $350 million redemption credit facility (the “Facility”) to be utilized for temporary or emergency purposes, including the financing of redemptions. In connection therewith, the portfolio has agreed to pay commitment fees on its pro rata portion of the Facility. Interest is charged to the portfolio based on prevailing market rates in effect at the time of borrowing.
The average daily amount of borrowings outstanding under the Facility during the period ended December 31, 2007 was approximately $2,600, with a related weighted average annualized interest rate of 5.15% .
24
NOTE 3—Investment Advisory Fee, Sub-Investment Advisory Fee and Other Transactions with Affiliates:
(a) Pursuant to an Investment Advisory Agreement with Dreyfus, the investment advisory fee is computed at the annual rate of .75% of the value of the portfolio’s average daily net assets and is payable monthly.
Pursuant to a Sub-Investment Advisory Agreement between Dreyfus and Newton, the sub-investment advisory fee is payable monthly by Dreyfus, and is based upon the value of the portfolio’s average daily net assets, computed at the following annual rates:
| Average Net Assets | | |
| 0 to $100 million | | .35% |
| $100 million to $1 billion | | .30% |
| $1 billion to $1.5 billion | | .26% |
| In excess of $1.5 billion | | .20% |
(b) Under the Distribution Plan (the “Plan”) adopted pursuant to Rule 12b-1 under the Act, Service shares pay the Distributor for distributing their shares, for servicing and/or maintaining Service shares shareholder accounts and for advertising and marketing for Service shares.The Plan provides for payments to be made at an annual rate of .25% of the value of Service shares’ average daily net assets. The Distributor may make payments to Participating Insurance Companies and to brokers and dealers acting as principal underwriter for their variable insurance products.The fees payable under the Plan are payable without regard to actual expenses incurred. During the period ended December 31, 2007, Service shares were charged $36,767 pursuant to the Plan.
The portfolio compensates Dreyfus Transfer, Inc., a wholly-owned subsidiary of Dreyfus, under a transfer agency agreement for providing personnel and facilities to perform transfer agency services for the portfolio. During the period ended December 31, 2007, the portfolio was charged $205 pursuant to the transfer agency agreement.
Effective July 1, 2007, the portfolio’s custodian,The Bank of New York, became an affiliate of the Manager. Under the portfolio’s pre-existing
The Portfolio 25
NOTES TO FINANCIAL STATEMENTS (continued)
custody agreement with The Bank of New York, the portfolio was charged $82,007 for providing custodial services for the portfolio for the six months ended December 31, 2007. Prior to becoming an affil-iate,The Bank of New York was paid $45,687 for custody services to the portfolio for the six months ended June 30, 2007.
During the period ended December 31, 2007, the portfolio was charged $4,821 for services performed by the Chief Compliance Officer.
The components of “Due to The Dreyfus Corporation and affiliates” in the Statement of Assets and Liabilities consist of: investment advisory fees $56,963, Rule 12b-1 distribution plan fees $3,947, chief compliance officer fees $3,616, custodian fees $24,095 and transfer agency per account fees $36.
(c) Each Board member also serves as a Board member of other funds within the Dreyfus complex. Annual retainer fees and attendance fees are allocated to each portfolio based on net assets.
NOTE 4—Securities Transactions:
The aggregate amount of purchases and sales of investment securities, excluding short-term securities and forward currency exchange contracts, during the period ended December 31, 2007, amounted to $97,955,713 and $89,728,927, respectively.
The portfolio enters into forward currency exchange contracts in order to hedge its exposure to changes in foreign currency exchange rates on its foreign portfolio holdings and to settle foreign currency transactions. When executing forward currency exchange contracts, the portfolio is obligated to buy or sell a foreign currency at a specified rate on a certain date in the future. With respect to sales of forward currency exchange contracts, the portfolio would incur a loss if the value of the contract increases between the date the forward contract is opened and the date the forward contract is closed.The portfolio realizes a gain if the value of the contract decreases between those dates.With respect to purchases of forward currency exchange contracts, the portfolio would incur a loss if the value of the contract decreases between the date the
26
forward contract is opened and the date the forward contract is closed. The portfolio realizes a gain if the value of the contract increases between those dates.The portfolio is also exposed to credit risk associated with counterparty nonperformance on these forward currency exchange contracts which is typically limited to the unrealized gain on each open contract.The following summarizes open forward currency exchange contracts at December 31, 2007:
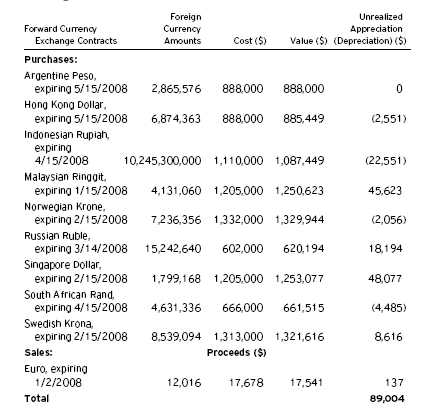
At December 31, 2007, the cost of investments for federal income tax purposes was $72,971,700; accordingly, accumulated net unrealized appreciation on investments was $14,828,225 consisting of $17,469,493 gross unrealized appreciation and $2,641,268 gross unrealized depreciation.
The Portfolio 27
| REPORT OF INDEPENDENT REGISTERED |
| PUBLIC ACCOUNTING FIRM |
Shareholders and Board of Trustees
Dreyfus Variable Investment Fund, International Equity Portfolio
We have audited the accompanying statement of assets and liabilities, including the statement of investments, of Dreyfus Variable Investment Fund, International Equity Portfolio (one of the funds comprising Dreyfus Variable Investment Fund) as of December 31, 2007, and the related statement of operations for the year then ended, the statement of changes in net assets for each of the two years in the period then ended, and financial highlights for each of the years indicated therein. These financial statements and financial highlights are the responsibility of the Fund’s management. Our responsibility is to express an opinion on these financial statements and financial highlights based on our audits.
We conducted our audits in accordance with the standards of the Public Company Accounting Oversight Board (United States).Those standards require that we plan and perform the audit to obtain reasonable assurance about whether the financial statements and financial highlights are free of material misstatement.We were not engaged to perform an audit of the Fund’s internal control over financial reporting. Our audits included consideration of internal control over financial reporting as a basis for designing audit procedures that are appropriate in the circumstances, but not for the purpose of expressing an opinion on the effectiveness of the Fund’s internal control over financial reporting. Accordingly, we express no such opinion.An audit also includes examining, on a test basis, evidence supporting the amounts and disclosures in the financial statements and financial highlights, assessing the accounting principles used and significant estimates made by management, and evaluating the overall financial statement presentation. Our procedures included confirmation of securities owned as of December 31, 2007 by correspondence with the custodian.We believe that our audits provide a reasonable basis for our opinion.
In our opinion, the financial statements and financial highlights referred to above present fairly, in all material respects, the financial position of Dreyfus Variable Investment Fund, International Equity Portfolio at December 31, 2007, the results of its operations for the year then ended, the changes in its net assets for each of the two years in the period then ended, and the financial highlights for each of the indicated years, in conformity with U.S. generally accepted accounting principles.

| New York, New York |
| February 8, 2008 |
28
IMPORTANT TAX INFORMATION (Unaudited)
In accordance with federal tax law, the portfolio elects to provide each shareholder with their portion of the portfolio’s foreign taxes paid and the income sourced from foreign countries.Accordingly, the portfolio hereby makes the following designations regarding its fiscal year ended December 31, 2007:
—the total amount of taxes paid to foreign countries was $177,316.
—the total amount of income sourced from foreign countries was $1,326,880.
As required by federal tax law rules, shareholders will receive notification of their proportionate share of foreign taxes paid and foreign source income for the 2007 calendar year with Form 1099-DIV which will be mailed by January 31, 2008.
The Portfolio 29
BOARD MEMBERS INFORMATION (Unaudited)
| Joseph S. DiMartino (64) |
| Chairman of the Board (1995) |
| Principal Occupation During Past 5 Years: |
| • Corporate Director and Trustee |
Other Board Memberships and Affiliations:
- The Muscular Dystrophy Association, Director
- Century Business Services, Inc., a provider of outsourcing functions for small and medium size companies, Director
- The Newark Group, a provider of a national market of paper recovery facilities, paperboard mills and paperboard converting plants, Director
- Sunair Services Corporation, a provider of certain outdoor-related services to homes and businesses, Director
No. of Portfolios for which Board Member Serves: 163 ———————
| Peggy C. Davis (64) |
| Board Member (2006) |
Principal Occupation During Past 5 Years:
- Shad Professor of Law, New York University School of Law (1983-present)
- Writer and teacher in the fields of evidence, constitutional theory, family law, social sciences and the law, legal process and professional methodology and training
No. of Portfolios for which Board Member Serves: 64 ———————
| David P. Feldman (68) |
| Board Member (1994) |
| Principal Occupation During Past 5 Years: |
| • Corporate Director and Trustee |
Other Board Memberships and Affiliations:
- BBH Mutual Funds Group (11 funds), Director
- The Jeffrey Company, a private investment company, Director
No. of Portfolios for which Board Member Serves: 50
30
| James F. Henry (77) |
| Board Member (1990) |
Principal Occupation During Past 5 Years:
- President,The International Institute for Conflict Prevention and Resolution, a non- profit organization principally engaged in the development of alternatives to business litigation (Retired 2003)
- Advisor to The Elaw Forum, a consultant on managing corporate legal costs
- Advisor to John Jay Homestead (the restored home of the first U.S. Chief Justice)
- Individual Trustee of several trusts
Other Board Memberships and Affiliations:
- Director, advisor and mediator involved in several non-profit organizations, primarily engaged in domestic and international dispute resolution, and historic preservation
No. of Portfolios for which Board Member Serves: 41 ———————
| Ehud Houminer (67) |
| Board Member (2006) |
| Principal Occupation During Past 5 Years: |
| • Executive-in-Residence at the Columbia Business School, Columbia University |
- Avnet Inc., an electronics distributor, Director
- International Advisory Board to the MBA Program School of Management, Ben Gurion University, Chairman
No. of Portfolios for which Board Member Serves: 67 ———————
| Gloria Messinger (78) |
| Board Member (2006) |
- Arbitrator for American Arbitration Association and National Association of Securities Dealers, Inc.
- Consultant in Intellectual Property
Other Board Memberships and Affiliations:
- Theater for a New Audience, Inc., Director
- Brooklyn Philharmonic, Director
No. of Portfolios for which Board Member Serves: 41
The Portfolio 31
BOARD MEMBERS INFORMATION (Unaudited) (continued)
| Dr. Martin Peretz (68) |
| Board Member (1990) |
Principal Occupation During Past 5 Years:
- Editor-in-Chief of The New Republic Magazine
- Lecturer in Social Studies at Harvard University (1965-2002)
- Director of TheStreet.com, a financial information service on the web
Other Board Memberships and Affiliations:
- American Council of Trustees and Alumni, Director
- Pershing Square Capital Management, Advisor
- Montefiore Ventures, General Partner
- Harvard Center for Blood Research,Trustee
- Bard College,Trustee
- Board of Overseers of YIVO Institute for Jewish Research, Chairman
No. of Portfolios for which Board Member Serves: 41 ———————
| Anne Wexler (77) |
| Board Member (2006) |
Principal Occupation During Past 5 Years:
- Chairman of the Wexler & Walker Public Policy Associates, consultants specializing in government relations and public affairs from January 1981 to present
Other Board Memberships and Affiliations:
- Wilshire Mutual Funds (5 funds), Director
- The Community Foundation for the National Capital Region, Director
- Member of the Council of Foreign Relations
- Member of the National Park Foundation
No. of Portfolios for which Board Member Serves: 50 ———————
Once elected all Board Members serve for an indefinite term, but achieve Emeritus status upon reaching age 80.The address of the Board Members and Officers is in c/o The Dreyfus Corporation, 200 Park Avenue, New York, New York 10166. Additional information about the Board Members is available in the fund’s Statement of Additional Information which can be obtained from Dreyfus free of charge by calling this toll free number: 1-800-554-4611.
| John M. Fraser, Jr., Emeritus Board Member |
| Rosalind G. Jacobs, Emeritus Board Member |
| Dr. Paul A. Marks, Emeritus Board Member |
32
OFFICERS OF THE FUND (Unaudited)
| J. DAVID OFFICER, President since |
| December 2006. |
Chief Operating Officer,Vice Chairman and a Director of the Manager, and an officer of 78 investment companies (comprised of 163 portfolios) managed by the Manager. He is 59 years old and has been an employee of the Manager since April 1998.
| PHILLIP N. MAISANO, Executive Vice |
| President since July 2007. |
Chief Investment Officer,Vice Chair and a director of the Manager, and an officer of 78 investment companies (comprised of 163 portfolios) managed by the Manager. Mr. Maisano also is an officer and/or Board member of certain other investment management subsidiaries of The Bank of New York Mellon Corporation, each of which is an affiliate of the Manager. He is 60 years old and has been an employee of the Manager since November 2006. Prior to joining the Manager, Mr. Maisano served as Chairman and Chief Executive Officer of EACM Advisors, an affiliate of the Manager, since August 2004, and served as Chief Executive Officer of Evaluation Associates, a leading institutional investment consulting firm, from 1988 until 2004.
| MICHAEL A. ROSENBERG, Vice President |
| and Secretary since August 2005. |
Associate General Counsel of the Manager, and an officer of 79 investment companies (comprised of 180 portfolios) managed by the Manager. He is 47 years old and has been an employee of the Manager since October 1991.
| JAMES BITETTO, Vice President and |
| Assistant Secretary since August 2005. |
Associate General Counsel and Secretary of the Manager, and an officer of 79 investment companies (comprised of 180 portfolios) managed by the Manager. He is 41 years old and has been an employee of the Manager since December 1996.
| JONI LACKS CHARATAN, Vice President |
| and Assistant Secretary since |
| August 2005. |
Associate General Counsel of the Manager, and an officer of 79 investment companies (comprised of 180 portfolios) managed by the Manager. She is 52 years old and has been an employee of the Manager since October 1988.
| JOSEPH M. CHIOFFI, Vice President and |
| Assistant Secretary since August 2005. |
Associate General Counsel of the Manager, and an officer of 79 investment companies (comprised of 180 portfolios) managed by the Manager. He is 46 years old and has been an employee of the Manager since June 2000.
| JANETTE E. FARRAGHER, Vice President |
| and Assistant Secretary since |
| August 2005. |
Associate General Counsel of the Manager, and an officer of 79 investment companies (comprised of 180 portfolios) managed by the Manager. She is 45 years old and has been an employee of the Manager since February 1984.
| JOHN B. HAMMALIAN, Vice President and |
| Assistant Secretary since August 2005. |
Associate General Counsel of the Manager, and an officer of 79 investment companies (comprised of 180 portfolios) managed by the Manager. He is 44 years old and has been an employee of the Manager since February 1991.
| ROBERT R. MULLERY, Vice President and |
| Assistant Secretary since August 2005. |
Associate General Counsel of the Manager, and an officer of 79 investment companies (comprised of 180 portfolios) managed by the Manager. He is 55 years old and has been an employee of the Manager since May 1986.
The Portfolio 33
OFFICERS OF THE FUND (Unaudited) (continued)
| JEFF PRUSNOFSKY, Vice President and |
| Assistant Secretary since August 2005. |
Associate General Counsel of the Manager, and an officer of 79 investment companies (comprised of 180 portfolios) managed by the Manager. He is 42 years old and has been an employee of the Manager since October 1990.
| JAMES WINDELS, Treasurer since |
| November 2001. |
Director – Mutual Fund Accounting of the Manager, and an officer of 79 investment companies (comprised of 180 portfolios) managed by the Manager. He is 49 years old and has been an employee of the Manager since April 1985.
| ROBERT ROBOL, Assistant Treasurer |
| since August 2003. |
Senior Accounting Manager – Money Market and Municipal Bond Funds of the Manager, and an officer of 79 investment companies (comprised of 180 portfolios) managed by the Manager. He is 43 years old and has been an employee of the Manager since October 1988.
| ROBERT SALVIOLO, Assistant Treasurer |
| since July 2007. |
Senior Accounting Manager – Equity Funds of the Manager, and an officer of 79 investment companies (comprised of 180 portfolios) managed by the Manager. He is 40 years old and has been an employee of the Manager since June 1989.
| ROBERT SVAGNA, Assistant Treasurer |
| since December 2002. |
Senior Accounting Manager – Equity Funds of the Manager, and an officer of 79 investment companies (comprised of 180 portfolios) managed by the Manager. He is 40 years old and has been an employee of the Manager since November 1990.
| GAVIN C. REILLY, Assistant Treasurer |
| since December 2005. |
Tax Manager of the Investment Accounting and Support Department of the Manager, and an officer of 79 investment companies (comprised of 180 portfolios) managed by the Manager. He is 39 years old and has been an employee of the Manager since April 1991.
| JOSEPH W. CONNOLLY, Chief Compliance |
| Officer since October 2004. |
Chief Compliance Officer of the Manager and The Dreyfus Family of Funds (79 investment companies, comprised of 180 portfolios). From November 2001 through March 2004, Mr. Connolly was first Vice-President, Mutual Fund Servicing for Mellon Global Securities Services. In that capacity, Mr. Connolly was responsible for managing Mellon’s Custody, Fund Accounting and Fund Administration services to third-party mutual fund clients. He is 50 years old and has served in various capacities with the Manager since 1980, including manager of the firm’s Fund Accounting Department from 1997 through October 2001.
| WILLIAM GERMENIS, Anti-Money |
| Laundering Compliance Officer since |
| September 2002. |
Vice President and Anti-Money Laundering Compliance Officer of the Distributor, and the Anti-Money Laundering Compliance Officer of 75 investment companies (comprised of 176 portfolios) managed by the Manager. He is 37 years old and has been an employee of the Distributor since October 1998.
34
NOTES
| Telephone 1-800-554-4611 or 516-338-3300 |
| Mail | | The Dreyfus Family of Funds, 144 Glenn Curtiss Boulevard, Uniondale, NY 11556-0144 |
| | | Attn: Investments Division |
The portfolio files its complete schedule of portfolio holdings with the Securities and Exchange Commission (“SEC”) for the first and third quarters of each fiscal year on Form N-Q. The portfolio’s Forms N-Q are available on the SEC’s website at http://www.sec.gov and may be reviewed and copied at the SEC’s Public Reference Room in Washington, DC. Information on the operation of the Public Reference Room may be obtained by calling 1-202-551-8090.
A description of the policies and procedures that the portfolio uses to determine how to vote proxies relating to portfolio securities, and information regarding how the portfolio voted these proxies for the 12-month period ended June 30, 2007, is available at http://www.dreyfus.com and on the SEC’s website at http://www.sec.gov. The description of the policies and procedures is also available without charge, upon request, by calling 1-800-645-6561.

| © 2008 MBSC Securities Corporation |

The views expressed in this report reflect those of the portfolio manager only through the end of the period covered and do not necessarily represent the views of Dreyfus or any other person in the Dreyfus organization.Any such views are subject to change at any time based upon market or other conditions and Dreyfus disclaims any responsibility to update such views. These views may not be relied on as investment advice and, because investment decisions for a Dreyfus portfolio are based on numerous factors, may not be relied on as an indication of trading intent on behalf of any Dreyfus portfolio.
Not FDIC-Insured • Not Bank-Guaranteed • May Lose Value
| | | Contents |
| |
| | | THE PORTFOLIO |
| |
|
| 2 | | A Letter from the CEO |
| 3 | | Discussion of Performance |
| 6 | | Portfolio Performance |
| 8 | | Understanding Your Portfolio’s Expenses |
| 8 | | Comparing Your Portfolio’s Expenses |
| | | With Those of Other Funds |
| 9 | | Statement of Investments |
| 15 | | Statement of Assets and Liabilities |
| 16 | | Statement of Operations |
| 17 | | Statement of Changes in Net Assets |
| 19 | | Financial Highlights |
| 21 | | Notes to Financial Statements |
| 29 | | Report of Independent Registered |
| | | Public Accounting Firm |
| 30 | | Important Tax Information |
| 31 | | Board Members Information |
| 34 | | Officers of the Fund |
| FOR MORE INFORMATION |
|
| | | Back Cover |
The Portfolio
| Dreyfus Variable Investment Fund, |
| International Value Portfolio |

A LETTER FROM THE CEO
Dear Shareholder:
We are pleased to present this annual report for Dreyfus Variable Investment Fund, International Value Portfolio, covering the 12-month period from January 1, 2007, through December 31, 2007.
Looking back, 2007 was a year of significant change for the financial markets worldwide. Turmoil in the U.S. sub-prime mortgage market, declining U.S.housing values and soaring energy prices caused significant challenges for international investors throughout the world.As a result, a number of asset classes lost value amid heightened volatility over the summer and fall. International equities generally proved to be a notable exception.As they have for several years, most major international equities indices outperformed their U.S. counterparts as global economic growth remained robust even as the U.S. economy entered a downturn.
The turbulence of 2007 reinforced a central principle of successful investing: diversification. Investors with broad exposure to the world’s stock and bond markets were better protected from the full impact of market volatility in areas that, earlier in the year, were among the bright spots at the time. As we look ahead, we believe that now is the perfect time to meet with your financial advisor, who can help you plan and diversify your investment portfolio in a way that manages the potential opportunities and risks that may continue to arise in 2008.
For information about how the portfolio performed during the reporting period, as well as market perspectives, we have provided a Discussion of Performance given by the Portfolio Manager.
Thank you for your continued confidence and support.

| Thomas F. Eggers |
| Chief Executive Officer |
| The Dreyfus Corporation |
| January 15, 2008 |

DISCUSSION OF PERFORMANCE
For the period of January 1, 2007, through December 31, 2007, as provided by D. Kirk Henry, Senior Portfolio Manager
Portfolio and Market Performance Overview
In 2007, the international stock markets posted robust gains, fueled largely by strong global economic growth, especially among emerging markets. In this generally favorable investment environment, the portfolio produced positive absolute returns in almost all of the countries in which it invested. However, its returns fell short of its benchmark, primarily due to overweighted exposure and disappointing stock selections in Japan as well as its limited exposure to Australian metals and mining stocks.
For the 12-month period ended December 31, 2007, Dreyfus Variable Investment Fund, International Value Portfolio produced total returns of 4.15% for its Initial shares and 3.92% for its Service shares.1 This compares with the 11.17% return for the portfolio’s benchmark, the Morgan Stanley Capital International Europe, Australasia, Far East Index (“MSCI EAFE Index”), for the same period.2
The Portfolio’s Investment Approach
The portfolio seeks long-term capital growth by investing in stocks of foreign companies that we consider to be value companies.The portfolio may invest in companies of any size, and may also invest in companies located in emerging markets.Our investment approach is value-oriented and research-driven. When selecting stocks, we conduct extensive quantitative and fundamental research that emphasizes individual stock selection rather than economic and industry trends.We focus on how a stock is valued relative to its intrinsic worth, the company’s underlying business health as measured by return on assets and return on equity, and the presence of a catalyst that may trigger an increase in the stock price.
International Equities Posted Solid Gains Despite Volatility
The international equity markets continued to provide generally strong returns during 2007 on the strength of high levels of business confidence, positive earnings reports, corporate restructurings and robust mergers-and-acquisitions activity throughout much of Europe.
The Portfolio 3
DISCUSSION OF PERFORMANCE (continued)
However, during the summer, international stocks encountered a period of heightened volatility in response to difficulties in the U.S. subprime mortgage market and the subsequent repricing of risk in other financial markets. By late August, international investors appeared to have regained their confidence, and many equity markets began to bounce back. However, the rebound proved to be short-lived, and in November and December investors turned their attention to relatively defensive companies with track records of steady earnings growth across full economic cycles. Still, for the year as a whole, the international stock markets posted generally strong returns.
Europe and the Emerging Markets Boosted Portfolio Returns
Some of portfolio’s stronger gains stemmed from its holdings in Greece, where the country’s dominant electric utility, Public Power Corporation, posted sharp gains due to what is widely believed to be the first of many tariff increases and fuel surcharges from the government. In the United Kingdom, metals and mining giant BHP Billiton advanced as commodity prices climbed. Consumer products maker Unilever also gained value, largely due to a new chairman who has intensified the company’s focus on “best in class” products, increased research-and-development efforts and initiated a stock buyback program. British Energy Group, which owns nuclear power plants in Scotland and England, has performed well as the markets have warmed up to its alternative energy source potential.
Overweighted exposure to a number of stocks in Germany also aided the portfolio’s performance, including Siemens AG, Europe’s largest electronics and electrical engineering firm. Under the leadership of a new CEO, Siemens has restructured its operations and improved profitability. Other positive contributors included adidas AG, the sporting goods firm that has begun to realize benefits from its acquisition of Reebok. The company also won sponsorship rights to the 2008 Olympic Games in Beijing, which is expected to increase brand aware-ness.Also in Europe, food giant Nestlé benefited from strong emerging markets sales and its recent acquisition of Gerber, the baby food brand.
Emerging markets stocks posted strong gains for the portfolio, driven largely by energy holding Petrobras in Brazil, Mexico’s bottling company
Coca-Cola FEMSA, and Teva Pharmaceutical Industries, the world’s leading generic pharmaceutical manufacturer and one of Israel’s larger stocks.
On the other hand, the bulk of the portfolio’s relative underperfor-mance can be traced to its relatively heavy exposure to Japanese financial and retail stocks, both of which sold off in favor of exporters.The portfolio also had limited exposure to Australian metals and mining companies, which advanced sharply due to continued growth in China and India and other developing countries.
Maintaining Our Value-Oriented Discipline
While we believe that international equities remain attractively valued relative to their historical norms, we have become more concerned with the potential influence that the ongoing credit crisis, U.S. housing recession and persistently high commodities and food prices could have on stock prices over the near term. However, we have remained true to our value discipline, and we intend to continue to seek investment opportunities in stocks of companies with solid fundamentals that are selling at attractive prices.
January 15, 2008
| | | Investing in foreign companies involves special risks, including changes in currency rates, |
| | | political, economic and social instability, a lack of comprehensive company information, |
| | | differing auditing and legal standards and less market liquidity. An investment in this fund |
| | | should be considered only as a supplement to an overall investment program. |
| | | The portfolio is only available as a funding vehicle under variable life insurance policies or variable |
| | | annuity contracts issued by insurance companies. Individuals may not purchase shares of the |
| | | portfolio directly. A variable annuity is an insurance contract issued by an insurance company that |
| | | enables investors to accumulate assets on a tax-deferred basis for retirement or other long-term |
| | | goals.The investment objective and policies of Dreyfus Variable Investment Fund, International |
| | | Value Portfolio made available through insurance products may be similar to other funds/portfolios |
| | | managed or advised by Dreyfus. However, the investment results of the portfolio may be higher or |
| | | lower than, and may not be comparable to, those of any other Dreyfus fund/portfolio. |
| 1 | | Total return includes reinvestment of dividends and any capital gains paid. Past performance is no |
| | | guarantee of future results. Share price and investment return fluctuate such that upon redemption, |
| | | portfolio shares may be worth more or less than their original cost.The portfolio’s performance does |
| | | not reflect the deduction of additional charges and expenses imposed in connection with investing |
| | | in variable insurance contracts, which will reduce returns. Return figures provided reflect the |
| | | absorption of certain portfolio expenses by The Dreyfus Corporation pursuant to an agreement in |
| | | effect through December 31, 2007, at which time it was terminated. Had these expenses not been |
| | | absorbed, the portfolio’s returns would have been lower. |
| 2 | | SOURCE: LIPPER INC. — Reflects reinvestment of net dividends and, where applicable, |
| | | capital gain distributions.The Morgan Stanley Capital International Europe, Australasia, Far |
| | | East (MSCI EAFE) Index is an unmanaged index composed of a sample of companies |
| | | representative of the market structure of European and Pacific Basin countries. |
The Portfolio 5
PORTFOLIO PERFORMANCE
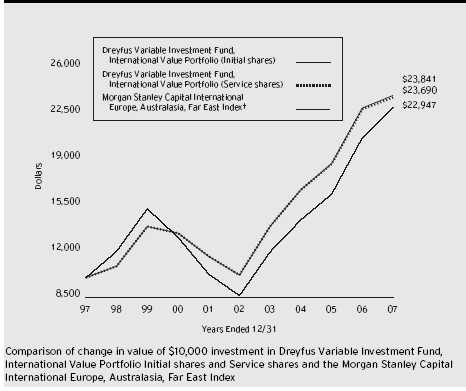
| Average Annual Total Returns as of | | 12/31/07 | | | | | | |
| | | | | 1 Year | | 5 Years | | 10 Years |
| |
| |
| |
| |
|
| Initial shares | | | | 4.15% | | 18.52% | | 9.08% |
| Service shares | | | | 3.92% | | 18.33% | | 9.01% |
| The data for Service shares includes the results of Initial shares for the period prior to December 31, 2000 |
| (inception date of Service shares). Actual Service shares’ average annual total return and hypothetical growth |
| results would have been lower. See notes below. |
| † Source: Lipper Inc. |
| Past performance is not predictive of future performance.The portfolio’s performance shown in the graph and table does not |
| reflect the deduction of taxes that a shareholder would pay on portfolio distributions or the redemption of portfolio shares. |
| The portfolio’s performance does not reflect the deduction of additional charges and expenses imposed in |
| connection with investing in variable insurance contracts which will reduce returns. |
| The above graph compares a $10,000 investment made in Initial and Service shares of Dreyfus Variable Investment |
| Fund, International Value Portfolio on 12/31/97 to a $10,000 investment made in the Morgan Stanley Capital |
| International Europe, Australasia, Far East Index (the “Index”) on that date. |
6
The portfolio’s Initial shares are not subject to a Rule 12b-1 fee.The portfolio’s Service shares are subject to a 0.25% annual Rule 12b-1 fee.The performance figures for Service shares reflect the performance of the portfolio’s Initial shares from their inception date through December 30, 2000, and the performance of the portfolio’s Service shares from December 31, 2000 (inception date of Service shares) to December 31, 2007 (blended performance figures).The performance figures for each share class reflect certain expense reimbursements, without which the performance of each share class would have been lower. In addition, the blended performance figures have not been adjusted to reflect the higher operating expenses of the Service shares. If these expenses had been reflected, the blended performance figures would have been lower. All dividends and capital gain distributions are reinvested.
The portfolio’s performance shown in the line graph takes into account all applicable portfolio fees and expenses (after any expense reimbursements).The Index is an unmanaged index composed of a sample of companies representative of the market structure of European and Pacific Basin countries and includes net dividends reinvested. Unlike a mutual fund, the Index is not subject to charges, fees and other expenses. Investors cannot invest directly in any index. Further information relating to portfolio performance, including expense reimbursements, if applicable, is contained in the Financial Highlights section of the prospectus and elsewhere in this report.
The Portfolio 7
| UNDERSTANDING YOUR |
| PORTFOLIO’S EXPENSES (Unaudited) |
As a mutual fund investor,you pay ongoing expenses,such as management fees and other expenses.Using the information below,you can estimate how these expenses affect your investment and compare them with the expenses of other funds.You also may pay one-time transaction expenses,including sales charges (loads) and redemption fees, which are not shown in this section and would have resulted in higher total expenses. For more information, see your portfolio’s prospectus or talk to your financial adviser.
Review your portfolio’s expenses
The table below shows the expenses you would have paid on a $1,000 investment in Dreyfus Variable Investment Fund, International Value Portfolio from July 1, 2007 to December 31, 2007. It also shows how much a $1,000 investment would be worth at the close of the period, assuming actual returns and expenses.
| Expenses and Value of a $1,000 Investment | | |
| assuming actual returns for the six months ended December 31, 2007 |
| | | Initial Shares | | Service Shares |
| |
| |
|
| Expenses paid per $1,000 † | | $ 5.95 | | $ 6.94 |
| Ending value (after expenses) | | $966.70 | | $966.10 |
| COMPARING YOUR PORTFOLIO’S EXPENSES |
| WITH THOSE OF OTHER FUNDS (Unaudited) |
Using the SEC’s method to compare expenses
The Securities and Exchange Commission (SEC) has established guidelines to help investors assess fund expenses. Per these guidelines, the table below shows your portfolio’s expenses based on a $1,000 investment, assuming a hypothetical 5% annualized return. You can use this information to compare the ongoing expenses (but not transaction expenses or total cost) of investing in the portfolio with those of other funds. All mutual fund shareholder reports will provide this information to help you make this comparison. Please note that you cannot use this information to estimate your actual ending account balance and expenses paid during the period.
| Expenses and Value of a $1,000 Investment | | |
| assuming a hypothetical 5% annualized return for the six months ended December 31, 2007 |
| | | Initial Shares | | Service Shares |
| |
| |
|
| Expenses paid per $1,000 † | | $ 6.11 | | $ 7.12 |
| Ending value (after expenses) | | $1,019.16 | | $1,018.15 |
| † Expenses are equal to the portfolio’s annualized expense ratio of 1.20% for Initial shares and 1.40% for Service shares, |
| multiplied by the average account value over the period, multiplied by 184/365 (to reflect the one-half year period). |
8
STATEMENT OF INVESTMENTS
December 31, 2007
|
| Common Stocks—95.7% | | Shares | | Value ($) |
| |
| |
|
| Australia—3.5% | | | | |
| Amcor | | 260,246 | | 1,576,210 |
| Insurance Australia Group | | 194,081 | | 700,861 |
| National Australia Bank | | 46,451 | | 1,538,594 |
| Suncorp-Metway | | 66,494 | | 986,131 |
| Tabcorp Holdings | | 108,000 | | 1,399,104 |
| Telstra | | 37,500 | | 154,154 |
| | | | | 6,355,054 |
| Belgium—2.0% | | | | |
| Delhaize Group | | 17,010 | | 1,494,838 |
| Fortis | | 78,636 | | 2,072,599 |
| Fortis (Strip) | | 27,946 a | | 408 |
| | | | | 3,567,845 |
| Brazil—.5% | | | | |
| Tele Norte Leste Participacoes, ADR | | 47,000 | | 906,160 |
| Finland—1.0% | | | | |
| UPM-Kymmene | | 85,778 | | 1,730,523 |
| France—8.5% | | | | |
| BNP Paribas | | 14,180 | | 1,536,351 |
| Credit Agricole | | 64,733 | | 2,180,051 |
| France Telecom | | 46,159 | | 1,658,967 |
| Lagardere | | 12,720 | | 952,386 |
| Sanofi-Aventis | | 52,160 | | 4,795,497 |
| Thomson | | 39,270 | | 557,785 |
| Total | | 46,030 | | 3,818,669 |
| | | | | 15,499,706 |
| Germany—9.5% | | | | |
| Adidas | | 8,340 | | 624,077 |
| Allianz | | 7,650 | | 1,652,227 |
| Bayerische Motoren Werke | | 30,170 | | 1,865,186 |
| Daimler | | 12,144 | | 1,178,899 |
| Deutsche Post | | 74,880 | | 2,569,874 |
| Deutsche Telekom | | 96,970 | | 2,126,183 |
| E.ON | | 4,709 | | 1,000,815 |
The Portfolio 9
STATEMENT OF INVESTMENTS (continued)
| Common Stocks (continued) | | Shares | | Value ($) |
| |
| |
|
| Germany (continued) | | | | |
| Heidelberger Druckmaschinen | | 34,050 | | 1,143,242 |
| Muenchener Rueckversicherungs | | 10,960 | | 2,126,961 |
| RWE | | 12,330 | | 1,727,936 |
| Siemens | | 8,130 | | 1,291,969 |
| | | | | 17,307,369 |
| Greece—.9% | | | | |
| Public Power | | 29,580 | | 1,554,512 |
| Hong Kong—3.2% | | | | |
| BOC Hong Kong Holdings | | 765,000 | | 2,143,283 |
| HongKong Electric Holdings | | 76,500 | | 439,937 |
| Hutchison Whampoa | | 157,900 | | 1,790,798 |
| Johnson Electric Holdings | | 1,130,500 | | 620,413 |
| Yue Yuen Industrial Holdings | | 204,000 | | 732,411 |
| | | | | 5,726,842 |
| Ireland—.3% | | | | |
| Bank of Ireland | | 37,529 | | 556,614 |
| Italy—6.2% | | | | |
| Banco Popolare Scarl | | 60,400 a | | 1,336,686 |
| ENI | | 39,555 | | 1,446,447 |
| Mediaset | | 170,620 | | 1,719,836 |
| Saras | | 239,370 | | 1,388,994 |
| Telecom Italia | | 737,780 | | 2,288,649 |
| UniCredito Italiano | | 199,840 | | 1,656,714 |
| Unipol Gruppo Finanziario | | 398,780 | | 1,370,937 |
| | | | | 11,208,263 |
| Japan—21.5% | | | | |
| 77 Bank | | 61,100 | | 382,851 |
| Aeon | | 141,100 | | 2,071,819 |
| Astellas Pharma | | 9,400 | | 410,363 |
| Canon | | 20,859 | | 972,317 |
| Central Japan Railway | | 162 | | 1,383,945 |
| Chiyoda | | 154,700 | | 1,765,345 |
| Chuo Mitsui Trust Holdings | | 96,700 | | 742,879 |
| Dentsu | | 225 | | 597,015 |
| INPEX Holdings | | 27 | | 292,860 |
| JS Group | | 88,300 | | 1,416,061 |
10
| Common Stocks (continued) | | Shares | | Value ($) |
| |
| |
|
| Japan (continued) | | | | |
| Kubota | | 236,000 | | 1,601,470 |
| Matsumotokiyoshi Holdings | | 5,540 | | 135,080 |
| Mitsubishi UFJ Financial Group | | 298,000 | | 2,796,880 |
| NGK Spark Plug | | 41,400 | | 725,906 |
| Nippon Express | | 365,500 | | 1,883,936 |
| Nippon Paper Group | | 310 | | 933,710 |
| Nissan Motor | | 149,000 | | 1,642,867 |
| NOK | | 32,400 | | 689,794 |
| Nomura Holdings | | 129,400 | | 2,198,135 |
| Obayashi | | 106,000 | | 534,015 |
| Ricoh | | 31,700 | | 586,800 |
| Rohm | | 13,500 | | 1,179,911 |
| Sekisui Chemical | | 108,300 | | 731,029 |
| Sekisui House | | 120,800 | | 1,308,112 |
| Seven & I Holdings | | 69,000 | | 2,016,404 |
| Shimamura | | 4,600 | | 392,972 |
| Sumitomo | | 63,500 | | 903,362 |
| Sumitomo Mitsui Financial Group | | 349 | | 2,618,556 |
| Taiheiyo Cement | | 169,500 | | 405,688 |
| Takeda Pharmaceutical | | 28,100 | | 1,654,942 |
| Teijin | | 224,200 | | 962,680 |
| THK | | 51,200 | | 1,039,559 |
| Tokyo Electron | | 11,800 | | 725,633 |
| Tokyo Gas | | 18,900 | | 88,608 |
| Toyota Motor | | 23,700 | | 1,283,206 |
| | | | | 39,074,710 |
| Malaysia—.6% | | | | |
| Malayan Banking | | 325,500 | | 1,131,917 |
| Netherlands—3.3% | | | | |
| Aegon | | 76,132 | | 1,343,652 |
| European Aeronautic Defence and Space | | 32,400 | | 1,032,505 |
| Koninklijke Philips Electronics | | 6,770 | | 291,742 |
| Royal Dutch Shell, Cl. A | | 77,429 | | 3,249,637 |
| | | | | 5,917,536 |
| Russia—.6% | | | | |
| Gazprom, ADR | | 20,740 | | 1,167,662 |
The Portfolio 11
STATEMENT OF INVESTMENTS (continued)
| Common Stocks (continued) | | Shares | | Value ($) |
| |
| |
|
| Singapore—1.2% | | | | |
| DBS Group Holdings | | 148,830 | | 2,138,986 |
| South Africa—.5% | | | | |
| Nedbank Group | | 44,950 | | 889,905 |
| South Korea—2.5% | | | | |
| Hyundai Motor | | 9,813 | | 750,653 |
| Korea Electric Power, ADR | | 32,410 | | 675,749 |
| KT, ADR | | 35,150 | | 906,870 |
| Samsung Electronics | | 2,194 | | 1,303,274 |
| SK Telecom, ADR | | 27,750 | | 828,060 |
| | | | | 4,464,606 |
| Spain—1.1% | | | | |
| Banco Santander | | 21,100 | | 455,558 |
| Repsol | | 44,530 | | 1,584,819 |
| | | | | 2,040,377 |
| Sweden—1.0% | | | | |
| Svenska Cellulosa, Cl. B | | 24,490 | | 433,810 |
| Telefonaktiebolaget LM Ericsson, Cl. B | | 604,900 | | 1,420,564 |
| | | | | 1,854,374 |
| Switzerland—7.6% | | | | |
| Ciba Specialty Chemicals | | 44,546 | | 2,063,771 |
| Clariant | | 87,170 | | 810,007 |
| Nestle | | 6,745 | | 3,095,129 |
| Novartis | | 86,430 | | 4,736,413 |
| Swiss Reinsurance | | 15,390 | | 1,092,592 |
| UBS | | 42,380 | | 1,959,682 |
| | | | | 13,757,594 |
| Taiwan—.9% | | | | |
| Compal Electronics | | 637,325 | | 697,658 |
| United Microelectronics, ADR | | 255,871 | | 885,314 |
| | | | | 1,582,972 |
12
| Common Stocks (continued) | | Shares | | Value ($) |
| |
| |
|
| United Kingdom—19.3% | | | | |
| Anglo American | | 35,900 | | 2,195,407 |
| BP | | 407,171 | | 4,971,894 |
| British Energy Group | | 94,004 | | 1,024,680 |
| Centrica | | 125,280 | | 892,367 |
| Debenhams | | 372,810 | | 594,587 |
| Friends Provident | | 314,189 | | 1,019,325 |
| GlaxoSmithKline | | 126,080 | | 3,201,744 |
| HBOS | | 70,198 | | 1,024,429 |
| HSBC Holdings | | 203,974 | | 3,410,019 |
| Kingfisher | | 447,138 | | 1,292,626 |
| Old Mutual | | 483,710 | | 1,609,641 |
| Punch Taverns | | 74,157 | | 1,125,640 |
| Reed Elsevier | | 102,172 | | 1,356,153 |
| Rentokil Initial | | 114,980 | | 276,006 |
| Royal Bank of Scotland Group | | 125,154 | | 1,103,310 |
| Royal Dutch Shell, Cl. A | | 2,223 | | 93,175 |
| Tesco | | 113,332 | | 1,073,910 |
| Trinity Mirror | | 88,790 | | 614,380 |
| Unilever | | 115,182 | | 4,322,314 |
| Vodafone Group | | 778,841 | | 2,889,273 |
| WPP Group | | 80,330 | | 1,028,396 |
| | | | | 35,119,276 |
| Total Common Stocks | | | | |
| (cost $168,517,847) | | | | 173,552,803 |
| |
| |
|
| |
| Preferred Stocks—1.0% | | | | |
| |
| |
|
| Germany | | | | |
| Henkel | | | | |
| (cost $1,552,376) | | 31,270 | | 1,754,251 |
The Portfolio 13
STATEMENT OF INVESTMENTS (continued)
| Other Investment—1.7% | | Shares | | Value ($) |
| |
| |
|
| Registered Investment Company; | | | | |
| Dreyfus Institutional Preferred | | | | |
| Plus Money Market Fund | | | | |
| (cost $3,100,000) | | 3,100,000 b | | 3,100,000 |
| |
| |
|
| Total Investments (cost $173,170,223) | | 98.4% | | 178,407,054 |
| Cash and Receivables (Net) | | 1.6% | | 2,982,333 |
| Net Assets | | 100.0% | | 181,389,387 |
| ADR—American Depository Receipts |
| a | | Non-income producing security. |
| b | | Investment in affiliated money market mutual fund. |
| Portfolio Summary (Unaudited) † | | | | |
| |
| | | Value (%) | | | | Value (%) |
| |
| |
| |
|
| Financial | | 20.4 | | Materials | | 6.4 |
| Consumer Discretionary | | 12.3 | | Insurance | | 6.0 |
| Industrial | | 10.2 | | Utilities | | 4.7 |
| Energy | | 9.3 | | Information Technology | | 3.1 |
| Consumer Staples | | 8.8 | | Money Market Investment | | 1.7 |
| Health Care | | 8.2 | | | | |
| Telecommunication Services | | 7.3 | | | | 98.4 |
| † Based on net assets. |
| See notes to financial statements. |
| STATEMENT OF ASSETS AND LIABILITIES |
| December 31, 2007 |
| | | Cost | | Value |
| |
| |
|
| Assets ($): | | | | |
| Investments in securities—See Statement of Investments: | | |
| Unaffiliated issuers | | 170,070,223 | | 175,307,054 |
| Affiliated issuers | | 3,100,000 | | 3,100,000 |
| Cash | | | | 1,229,721 |
| Cash denominated in foreign currencies | | 1,815,425 | | 1,836,043 |
| Receivable for investment securities sold | | | | 475,995 |
| Dividends and interest receivable | | | | 315,979 |
| Receivable for shares of Beneficial Interest subscribed | | 103,137 |
| Prepaid expenses | | | | 1,374 |
| | | | | 182,369,303 |
| |
| |
|
| Liabilities ($): | | | | |
| Due to The Dreyfus Corporation and affiliates—Note 3(b) | | 249,219 |
| Payable for investment securities purchased | | 645,529 |
| Payable for shares of Beneficial Interest redeemed | | 48,164 |
| Interest payable—Note 2 | | | | 6,736 |
| Unrealized depreciation on forward | | | | |
| currency exchange contracts—Note 4 | | | | 50 |
| Accrued expenses | | | | 30,218 |
| | | | | 979,916 |
| |
| |
|
| Net Assets ($) | | | | 181,389,387 |
| |
| |
|
| Composition of Net Assets ($): | | | | |
| Paid-in capital | | | | 146,458,097 |
| Accumulated undistributed investment income—net | | 3,331,717 |
| Accumulated net realized gain (loss) on investments | | 26,342,552 |
| Accumulated net unrealized appreciation (depreciation) on | | |
| investments and foreign currency transactions | | 5,257,021 |
| |
|
| Net Assets ($) | | | | 181,389,387 |
| Net Asset Value Per Share | | | | |
| | | Initial Shares | | Service Shares |
| |
| |
|
| Net Assets ($) | | 101,613,709 | | 79,775,678 |
| Shares Outstanding | | 5,829,640 | | 4,587,487 |
| |
| |
|
| Net Asset Value Per Share ($) | | 17.43 | | 17.39 |
See notes to financial statements.
The Portfolio 15
| STATEMENT OF OPERATIONS |
| Year Ended December 31, 2007 |
| Investment Income ($): | | |
| Income: | | |
| Cash dividends (net of $464,872 foreign taxes withheld at source): | | |
| Unaffiliated issuers | | 5,574,672 |
| Affiliated issuers | | 187,386 |
| Interest | | 27,402 |
| Total Income | | 5,789,460 |
| Expenses: | | |
| Investment advisory fee—Note 3(a) | | 2,016,651 |
| Custodian fees—Note 3(b) | | 251,634 |
| Distribution fees—Note 3(b) | | 216,032 |
| Professional fees | | 40,172 |
| Prospectus and shareholders’ reports | | 32,110 |
| Trustees’ fees and expenses—Note 3(c) | | 13,827 |
| Interest expense—Note 2 | | 6,736 |
| Shareholder servicing costs—Note 3(b) | | 3,848 |
| Loan commitment fees—Note 2 | | 1,848 |
| Registration fees | | 485 |
| Miscellaneous | | 25,380 |
| Total Expenses | | 2,608,723 |
| Less—waiver of fees due to undertaking—Note 3(a) | | (27,848) |
| Less—reduction in custody fees due to earnings credits—Note 1(c) | | (21,678) |
| Net Expenses | | 2,559,197 |
| Investment Income-Net | | 3,230,263 |
| |
|
| Realized and Unrealized Gain (Loss) on Investments—Note 4 ($): |
| Net realized gain (loss) on investments and foreign currency transactions | | 27,540,769 |
| Net realized gain (loss) on forward currency exchange contracts | | (188,654) |
| Net Realized Gain (Loss) | | 27,352,115 |
| Net unrealized appreciation (depreciation) on | | |
| investments and foreign currency transactions | | (22,437,896) |
| Net Realized and Unrealized Gain (Loss) on Investments | | 4,914,219 |
| Net Increase in Net Assets Resulting from Operations | | 8,144,482 |
See notes to financial statements.
16
STATEMENT OF CHANGES IN NET ASSETS
| | | Year Ended December 31, |
| |
|
| | | 2007 | | 2006 |
| |
| |
|
| Operations ($): | | | | |
| Investment income—net | | 3,230,263 | | 2,682,141 |
| Net realized gain (loss) on investments | | 27,352,115 | | 27,138,534 |
| Net unrealized appreciation | | | | |
| (depreciation) on investments | | (22,437,896) | | 6,084,187 |
| Net Increase (Decrease) in Net Assets | | | | |
| Resulting from Operations | | 8,144,482 | | 35,904,862 |
| |
| |
|
| Dividends to Shareholders from ($): | | | | |
| Investment income—net: | | | | |
| Initial Shares | | (1,825,090) | | (1,436,718) |
| Service Shares | | (1,249,526) | | (774,660) |
| Net realized gain on investments: | | | | |
| Initial Shares | | (14,659,613) | | (8,117,896) |
| Service Shares | | (11,179,479) | | (4,855,489) |
| Total Dividends | | (28,913,708) | | (15,184,763) |
| |
| |
|
| Beneficial Interest Transactions ($): | | | | |
| Net proceeds from shares sold: | | | | |
| Initial Shares | | 34,440,848 | | 44,686,930 |
| Service Shares | | 39,126,121 | | 41,187,469 |
| Dividends reinvested: | | | | |
| Initial Shares | | 16,484,703 | | 9,554,614 |
| Service Shares | | 12,429,005 | | 5,630,149 |
| Cost of shares redeemed: | | | | |
| Initial Shares | | (56,488,732) | | (42,990,171) |
| Service Shares | | (42,923,699) | | (28,941,578) |
| Increase (Decrease) in Net Assets from | | | | |
| Beneficial Interest Transactions | | 3,068,246 | | 29,127,413 |
| Total Increase (Decrease) in Net Assets | | (17,700,980) | | 49,847,512 |
| |
| |
|
| Net Assets ($): | | | | |
| Beginning of Period | | 199,090,367 | | 149,242,855 |
| End of Period | | 181,389,387 | | 199,090,367 |
| Undistributed investment income—net | | 3,331,717 | | 3,037,430 |
The Portfolio 17
STATEMENT OF CHANGES IN NET ASSETS (continued)
| | | Year Ended December 31, |
| |
|
| | | 2007 | | 2006 |
| |
| |
|
| Capital Share Transactions: | | | | |
| Initial Shares | | | | |
| Shares sold | | 1,871,197 | | 2,475,239 |
| Shares issued for dividends reinvested | | 963,454 | | 552,929 |
| Shares redeemed | | (3,094,678) | | (2,370,679) |
| Net Increase (Decrease) in Shares Outstanding | | (260,027) | | 657,489 |
| |
| |
|
| Service Shares | | | | |
| Shares sold | | 2,142,942 | | 2,273,307 |
| Shares issued for dividends reinvested | | 727,268 | | 325,819 |
| Shares redeemed | | (2,410,785) | | (1,576,522) |
| Net Increase (Decrease) in Shares Outstanding | | 459,425 | | 1,022,604 |
See notes to financial statements.
18
FINANCIAL HIGHLIGHTS
The following tables describe the performance for each share class for the fiscal periods indicated.All information (except portfolio turnover rate) reflects financial results for a single portfolio share. Total return shows how much your investment in the portfolio would have increased (or decreased) during each period, assuming you had reinvested all dividends and distributions.These figures have been derived from the portfolio’s financial statements.
| | | | | Year Ended December 31, | | |
| |
| |
| |
|
| Initial Shares | | 2007 | | 2006 | | 2005 | | 2004 | | 2003 |
| |
| |
| |
| |
| |
|
| Per Share Data ($): | | | | | | | | | | |
| Net asset value, beginning of period | | 19.50 | | 17.49 | | 15.85 | | 13.54 | | 10.04 |
| Investment Operations: | | | | | | | | | | |
| Investment income—net a | | .31 | | .29 | | .22 | | .16 | | .12 |
| Net realized and unrealized | | | | | | | | | | |
| gain (loss) on investments | | .44 | | 3.44 | | 1.64 | | 2.54 | | 3.51 |
| Total from Investment Operations | | .75 | | 3.73 | | 1.86 | | 2.70 | | 3.63 |
| Distributions: | | | | | | | | | | |
| Dividends from investment income—net | | (.31) | | (.26) | | — | | (.16) | | (.13) |
| Dividends from net realized | | | | | | | | | | |
| gain on investments | | (2.51) | | (1.46) | | (.22) | | (.23) | | — |
| Total Distributions | | (2.82) | | (1.72) | | (.22) | | (.39) | | (.13) |
| Net asset value, end of period | | 17.43 | | 19.50 | | 17.49 | | 15.85 | | 13.54 |
| |
| |
| |
| |
| |
|
| Total Return (%) | | 4.15 | | 22.60 | | 11.89 | | 20.02 | | 36.36 |
| |
| |
| |
| |
| |
|
| Ratios/Supplemental Data (%): | | | | | | | | | | |
| Ratio of total expenses | | | | | | | | | | |
| to average net assets | | 1.19 | | 1.19 | | 1.20 | | 1.25 | | 1.49 |
| Ratio of net expenses | | | | | | | | | | |
| to average net assets | | 1.18 | | 1.18 | | 1.17 | | 1.24 | | 1.41 |
| Ratio of net investment income | | | | | | | | | | |
| to average net assets | | 1.69 | | 1.59 | | 1.39 | | 1.08 | | 1.11 |
| Portfolio Turnover Rate | | 66.08 | | 60.27 | | 54.32 | | 44.05 | | 107.73 |
| |
| |
| |
| |
| |
|
| Net Assets, end of period ($ x 1,000) | | 101,614 | | 118,733 | | 94,988 | | 88,713 | | 58,849 |
| |
| a Based on average shares outstanding at each month end. | | | | | | | | |
| See notes to financial statements. | | | | | | | | | | |
The Portfolio 19
FINANCIAL HIGHLIGHTS (continued)
| | | | | Year Ended December 31, | | |
| |
| |
| |
|
| Service Shares | | 2007 | | 2006 | | 2005 | | 2004 | | 2003 |
| |
| |
| |
| |
| |
|
| Per Share Data ($): | | | | | | | | | | |
| Net asset value, beginning of period | | 19.47 | | 17.47 | | 15.86 | | 13.56 | | 10.06 |
| Investment Operations: | | | | | | | | | | |
| Investment income—net a | | .27 | | .24 | | .18 | | .06 | | .14 |
| Net realized and unrealized | | | | | | | | | | |
| gain (loss) on investments | | .44 | | 3.45 | | 1.65 | | 2.62 | | 3.49 |
| Total from Investment Operations | | .71 | | 3.69 | | 1.83 | | 2.68 | | 3.63 |
| Distributions: | | | | | | | | | | |
| Dividends from investment income—net | | (.28) | | (.23) | | — | | (.15) | | (.13) |
| Dividends from net realized | | | | | | | | | | |
| gain on investments | | (2.51) | | (1.46) | | (.22) | | (.23) | | — |
| Total Distributions | | (2.79) | | (1.69) | | (.22) | | (.38) | | (.13) |
| Net asset value, end of period | | 17.39 | | 19.47 | | 17.47 | | 15.86 | | 13.56 |
| |
| |
| |
| |
| |
|
| Total Return (%) | | 3.92 | | 22.39 | | 11.69 | | 19.83 | | 36.28 |
| |
| |
| |
| |
| |
|
| Ratios/Supplemental Data (%): | | | | | | | | | | |
| Ratio of total expenses | | | | | | | | | | |
| to average net assets | | 1.44 | | 1.44 | | 1.45 | | 1.49 | | 1.75 |
| Ratio of net expenses | | | | | | | | | | |
| to average net assets | | 1.39 | | 1.38 | | 1.36 | | 1.39 | | 1.41 |
| Ratio of net investment income | | | | | | | | | | |
| to average net assets | | 1.49 | | 1.33 | | 1.10 | | .44 | | 1.29 |
| Portfolio Turnover Rate | | 66.08 | | 60.27 | | 54.32 | | 44.05 | | 107.73 |
| |
| |
| |
| |
| |
|
| Net Assets, end of period ($ x 1,000) | | 79,776 | | 80,358 | | 54,255 | | 34,119 | | 6,713 |
| |
| a Based on average shares outstanding at each month end. | | | | | | | | |
| See notes to financial statements. | | | | | | | | | | |
20
NOTES TO FINANCIAL STATEMENTS
NOTE 1—Significant Accounting Policies:
Dreyfus Variable Investment Fund (the “fund”) is registered under the Investment Company Act of 1940, as amended (the “Act”), as an open-end management investment company, operating as a series company currently offering seven series, including the International Value Portfolio (the “portfolio”).The portfolio is only offered to separate accounts established by insurance companies to fund variable annuity contracts and variable life insurance policies.The portfolio is a diversified series. The portfolio’s investment objective is long-term capital growth. The Dreyfus Corporation (the “Manager” or “Dreyfus”) serves as the portfolio’s investment adviser.
On July 1, 2007, Mellon Financial Corporation and The Bank of New York Company, Inc. merged, forming The Bank of New York Mellon Corporation (“BNY Mellon”). As part of this transaction, Dreyfus became a wholly-owned subsidiary of BNY Mellon.
MBSC Securities Corporation (the “Distributor”), a wholly-owned subsidiary of the Manager, is the distributor of the portfolio’s shares, which are sold without a sales charge. The portfolio is authorized to issue an unlimited number of $.001 par value shares of Beneficial Interest in each of the following classes of shares: Initial and Service. Each class of shares has identical rights and privileges, except with respect to the distribution plan and the expenses borne by each class, the allocation of certain transfer agency costs and certain voting rights. Income, expenses (other than expenses attributable to a specific class), and realized and unrealized gains or losses on investments are allocated to each class of shares based on its relative net assets.
The fund accounts separately for the assets, liabilities and operations of each series. Expenses directly attributable to each series are charged to that series’ operations; expenses which are applicable to all series are allocated among them on a pro rata basis.
The portfolio’s financial statements are prepared in accordance with U.S. generally accepted accounting principles, which may require the use of management estimates and assumptions.Actual results could differ from those estimates.
The Portfolio 21
NOTES TO FINANCIAL STATEMENTS (continued)
The fund enters into contracts that contain a variety of indemnifica-tions.The portfolio’s maximum exposure under these arrangements is unknown. The portfolio does not anticipate recognizing any loss related to these arrangements.
(a) Portfolio valuation: Investments in securities are valued at the last sales price on the securities exchange or national securities market on which such securities are primarily traded. Securities listed on the National Market System for which market quotations are available are valued at the official closing price or, if there is no official closing price that day, at the last sales price. Securities not listed on an exchange or the national securities market, or securities for which there were no transactions, are valued at the average of the most recent bid and asked prices, except for open short positions, where the asked price is used for valuation purposes. Bid price is used when no asked price is available. Registered open-end investment companies that are not traded on an exchange are valued at their net asset value.When market quotations or official closing prices are not readily available, or are determined not to reflect accurately fair value, such as when the value of a security has been significantly affected by events after the close of the exchange or market on which the security is principally traded (for example, a foreign exchange or market), but before the portfolio calculates its net asset value, the portfolio may value these investments at fair value as determined in accordance with the procedures approved by the Board of Trustees. Fair valuing of securities may be determined with the assistance of a pricing service using calculations based on indices of domestic securities and other appropriate indicators, such as prices of relevant ADRs and futures contracts. For other securities that are fair valued by the Board of Trustees, certain factors may be considered such as: fundamental analytical data, the nature and duration of restrictions on disposition, an evaluation of the forces that influence the market in which the securities are purchased and sold and public trading in similar securities of the issuer or comparable issuers. Financial futures are valued at the last sales price. Investments denominated in foreign currencies are translated to U.S. dollars at the prevailing rates of exchange. Forward currency exchange contracts are valued at the forward rate.
22
The Financial Accounting Standards Board (“FASB”) released Statement of Financial Accounting Standards No. 157 “Fair Value Measurements” (“FAS 157”). FAS 157 establishes an authoritative definition of fair value, sets out a framework for measuring fair value, and requires additional disclosures about fair-value measurements. The application of FAS 157 is required for fiscal years beginning after November 15, 2007 and interim periods within those fiscal years. Management does not believe that the application of this standard will have a material impact on the financial statements of the portfolio.
(b) Foreign currency transactions: The portfolio does not isolate that portion of the results of operations resulting from changes in foreign exchange rates on investments from the fluctuations arising from changes in market prices of securities held. Such fluctuations are included with the net realized and unrealized gain or loss on investments.
Net realized foreign exchange gains or losses arise from sales and maturities of short-term securities, sales of foreign currencies, currency gains or losses realized on securities transactions and the difference between the amounts of dividends, interest and foreign withholding taxes recorded on the portfolio’s books and the U.S. dollar equivalent of the amounts actually received or paid. Net unrealized foreign exchange gains or losses arise from changes in the value of assets and liabilities other than investments in securities, resulting from changes in exchange rates. Such gains and losses are included with net realized and unrealized gain or loss on investments.
(c) Securities transactions and investment income: Securities transactions are recorded on a trade date basis. Realized gains and losses from securities transactions are recorded on the identified cost basis. Dividend income is recognized on the ex-dividend date and interest income, including, where applicable, accretion of discount and amortization of premium on investments, is recognized on the accrual basis.
The portfolio has an arrangement with the custodian bank whereby the portfolio receives earnings credits from the custodian when positive cash balances are maintained, which are used to offset custody fees.
The Portfolio 23
NOTES TO FINANCIAL STATEMENTS (continued)
For financial reporting purposes, the portfolio includes net earnings credits as an expense offset in the Statement of Operations.
(d) Affiliated issuers: Investments in other investment companies advised by the Manager are defined as “affiliated” in the Act.
(e) Dividends to shareholders: Dividends are recorded on the ex-dividend date. Dividends from investment income-net and dividends from net realized capital gains, if any, are normally declared and paid annually, but the portfolio may make distributions on a more frequent basis to comply with the distribution requirements of the Internal Revenue Code of 1986, as amended (the “Code”).To the extent that net realized capital gains can be offset by capital loss carryovers, it is the policy of the portfolio not to distribute such gains. Income and capital gain distributions are determined in accordance with income tax regulations, which may differ from U.S. generally accepted accounting principles.
(f) Federal income taxes: It is the policy of the portfolio to continue to qualify as a regulated investment company, if such qualification is in the best interests of its shareholders, by complying with the applicable provisions of the Code, and to make distributions of taxable income sufficient to relieve it from substantially all federal income and excise taxes.
During the current year, the portfolio adopted FASB Interpretation No. 48 “Accounting for Uncertainty in Income Taxes” (“FIN 48”). FIN 48 provides guidance for how uncertain tax positions should be recognized, measured, presented and disclosed in the financial statements. FIN 48 requires the evaluation of tax positions taken or expected to be taken in the course of preparing the portfolio’s tax returns to determine whether the tax positions are “more-likely-than-not” of being sustained by the applicable tax authority. Tax positions not deemed to meet the more-likely-than-not threshold would be recorded as a tax benefit or expense in the current year.The adoption of FIN 48 had no impact on the operations of the portfolio for the period ended December 31, 2007.
24
The portfolio is not subject to examination by U.S. Federal, State and City tax authorities for the tax years before 2004.
At December 31, 2007, the components of accumulated earnings on a tax basis were as follows: undistributed ordinary income $13,606,969, undistributed capital gains $16,670,616 and unrealized appreciation $4,653,705.
The tax characters of distributions paid to shareholders during fiscal periods ended December 31, 2007 and December 31, 2006 were as follows: ordinary income $8,109,647 and $5,532,131 and long-term capital gains $20,804,061 and $9,652,632, respectively.
During the period ended December 31, 2007, as a result of permanent book to tax differences, primarily due to the tax treatment for passive foreign investment companies and foreign currency exchange gains and losses, the portfolio increased accumulated undistributed investment income-net by $138,640 and decreased accumulated net realized gain (loss) on investments by the same amount. Net assets and net asset value per share were not affected by this reclassification.
NOTE 2—Bank Line of Credit:
The portfolio participates with other Dreyfus-managed funds in a $350 million redemption credit facility (the “Facility”) to be utilized for temporary or emergency purposes, including the financing of redemptions. In connection therewith, the portfolio has agreed to pay commitment fees on its pro rata portion of the Facility. Interest is charged to the portfolio based on prevailing market rates in effect at the time of borrowing.
The Portfolio 25
NOTES TO FINANCIAL STATEMENTS (continued)
The average daily amount of borrowings outstanding under the Facility during the period ended December 31, 2007, was approximately $133,600 with a related weighted average annualized interest rate of 5.04% .
NOTE 3—Investment Advisory Fee and Other Transactions With Affiliates:
(a) Pursuant to an Investment Advisory Agreement with the Manager, the investment advisory fee is computed at the annual rate of 1% of the value of the portfolio’s average daily net assets and is payable monthly.
The Manager has agreed, from January 1, 2007 to December 31, 2007, to waive receipt of its fees and/or assume the expenses of the portfolio so that the expenses of neither class, exclusive of taxes, brokerage fees, interest on borrowings, commitment fees and extraordinary expenses, exceed an annual rate of 1.40% of the value of the average daily net assets of their class. During the period ended December 31, 2007, the Manager waived receipt of fees of $27,848, pursuant to the undertaking.
(b) Under the Distribution Plan (the “Plan”) adopted pursuant to Rule 12b-1 under the Act, Service shares pay the Distributor for distributing their shares, for servicing and/or maintaining Service shares shareholder accounts and for advertising and marketing for Service shares.The Plan provides for payments to be made at an annual rate of .25% of the value of the Service shares’ average daily net assets.The Distributor may make payments to Participating Insurance Companies and to brokers and dealers acting as principal underwriter for their variable insurance products.The fees payable under the Plan are payable without regard to actual expenses incurred. During the period ended December 31, 2007, Service shares were charged $216,032 pursuant to the Plan.
The portfolio compensates Dreyfus Transfer, Inc., a wholly-owned subsidiary of the Manager, under a transfer agency agreement for providing personnel and facilities to perform transfer agency services for the portfolio. During the period ended December 31, 2007, the portfolio was charged $491 pursuant to the transfer agency agreement.
26
Effective July 1, 2007, the portfolio’s custodian,The Bank of New York, became an affiliate of the Manager. Under the portfolio’s pre-existing custody agreement with The Bank of New York, the portfolio was charged $138,545 for providing custodial services for the portfolio for the six months ended December 31, 2007. Prior to becoming an affil-iate,The Bank of New York was paid $113,089 for the custody services to the portfolio for the six months ended June 30, 2007.
During the period ended December 31, 2007, the portfolio was charged $4,821 for services performed by the Chief Compliance Officer.
The components of “Due to The Dreyfus Corporation and affiliates” in the Statement of Assets and Liabilities consist of: investment advisory fees $154,800, Rule 12b-1 distribution plan fees $17,278, chief compliance officer fees $3,616, custody fees $78,825 and transfer agency per account fees $76, which are offset against an expense reimbursement currently in effect in the amount of $5,376.
(c) Each Board member also serves as a Board member of other funds within the Dreyfus complex. Annual retainer fees and attendance fees are allocated to each fund based on net assets.
NOTE 4—Securities Transactions:
The aggregate amount of purchases and sales of investment securities, excluding short-term securities and forward currency exchange contracts, during the period ended December 31, 2007, amounted to $128,884,697 and $145,518,742, respectively.
The portfolio enters into forward currency exchange contracts in order to hedge its exposure to changes in foreign currency exchange rates on its foreign portfolio holdings and to settle foreign currency transactions. When executing forward currency exchange contracts, the portfolio is obligated to buy or sell a foreign currency at a specified rate on a certain date in the future. With respect to sales of forward currency exchange contracts, the portfolio would incur a loss if the value of the contract increases between the date the forward contract is opened and
The Portfolio 27
NOTES TO FINANCIAL STATEMENTS (continued)
the date the forward contract is closed.The portfolio realizes a gain if the value of the contract decreases between those dates.With respect to purchases of forward currency exchange contracts, the portfolio would incur a loss if the value of the contract decreases between the date the forward contract is opened and the date the forward contract is closed. The portfolio realizes a gain if the value of the contract increases between those dates.The portfolio is also exposed to credit risk associated with counterparty nonperformance on these forward currency exchange contracts which is typically limited to the unrealized gain on each open contract.The following summarizes open forward currency exchange contracts at December 31, 2007:
| | | Foreign | | | | | | |
| Forward Currency | | Currency | | | | | | Unrealized |
| Exchange Contracts | | Amounts | | Cost ($) | | Value ($) | | (Depreciation) ($) |
| |
| |
| |
| |
|
| Purchases; | | | | | | | | |
| Australian Dollar | | | | | | | | |
| expiring 1/2/2008 | | 55,711 | | 48,881 | | 48,831 | | (50) |
At December 31, 2007, the cost of investments for federal income tax purposes was $173,773,539; accordingly, accumulated net unrealized appreciation on investments was $4,633,515, consisting of $17,603,571 gross unrealized appreciation and $12,970,056 gross unrealized depreciation.
28
REPORT OF INDEPENDENT REGISTERED PUBLIC ACCOUNTING FIRM
Shareholders and Board of Trustees
Dreyfus Variable Investment Fund, International Value Portfolio
We have audited the accompanying statement of assets and liabilities, including the statement of investments, of Dreyfus Variable Investment Fund, International Value Portfolio (one of the funds comprising Dreyfus Variable Investment Fund) as of December 31, 2007, and the related statement of operations for the year then ended, the statement of changes in net assets for each of the two years in the period then ended, and financial highlights for each of the years indicated therein. These financial statements and financial highlights are the responsibility of the Fund’s management. Our responsibility is to express an opinion on these financial statements and financial highlights based on our audits.
We conducted our audit in accordance with the standards of the Public Company Accounting Oversight Board (United States). Those standards require that we plan and perform the audit to obtain reasonable assurance about whether the financial statements and financial highlights are free of material misstatement.We were not engaged to perform an audit of the Fund’s internal control over financial reporting. Our audits included consideration of internal control over financial reporting as a basis for designing audit procedures that are appropriate in the circumstances, but not for the purpose of expressing an opinion on the effectiveness of the Fund’s internal control over financial reporting. Accordingly, we express no such opinion. An audit also includes examining, on a test basis, evidence supporting the amounts and disclosures in the financial statements and financial highlights, assessing the accounting principles used and significant estimates made by management, and evaluating the overall financial statement presentation. Our procedures included confirmation of securities owned as of December 31, 2007, by correspondence with the custodian and others.We believe that our audits provide a reasonable basis for our opinion.
In our opinion, the financial statements and financial highlights referred to above present fairly, in all material respects, the financial position of Dreyfus Variable Investment Fund, International Value Portfolio at December 31, 2007, the results of its operations for the year then ended, the changes in its net assets for each of the two years in the period then ended, and the financial highlights for each of the indicated years, in conformity with U. S. generally accepted accounting principles.
| New York, New York |
| February 8, 2008 |
The Portfolio 29
IMPORTANT TAX INFORMATION ( U n a u d i t e d )
In accordance with federal tax law, the fund elects to provide each shareholder with their portion of the fund’s foreign taxes paid and the income sourced from foreign countries. Accordingly, the fund hereby makes the following designations regarding its fiscal year ended December 31, 2007:
As required by federal tax law rules, shareholders will receive notification of their proportionate share of foreign taxes paid and foreign sourced income for the 2007 calendar year with Form 1099-DIV which will be mailed by January 31, 2008. Also, the portfolio hereby designates $2.0242 per share as a long-term capital gain distribution paid on March 30, 2007.
30
BOARD MEMBERS INFORMATION (Unaudited)
| Joseph S. DiMartino (64) |
| Chairman of the Board (1995) |
| Principal Occupation During Past 5 Years: |
| • Corporate Director and Trustee |
Other Board Memberships and Affiliations:
- The Muscular Dystrophy Association, Director
- Century Business Services, Inc., a provider of outsourcing functions for small and medium size companies, Director
- The Newark Group, a provider of a national market of paper recovery facilities, paperboard mills and paperboard converting plants, Director
- Sunair Services Corporation, a provider of certain outdoor-related services to homes and businesses, Director
No. of Portfolios for which Board Member Serves: 163 ———————
| Peggy C. Davis (64) |
| Board Member (2006) |
Principal Occupation During Past 5 Years:
- Shad Professor of Law, New York University School of Law (1983-present)
- Writer and teacher in the fields of evidence, constitutional theory, family law, social sciences and the law, legal process and professional methodology and training
No. of Portfolios for which Board Member Serves: 64 ———————
| David P. Feldman (68) |
| Board Member (1994) |
| Principal Occupation During Past 5 Years: |
| • Corporate Director and Trustee |
Other Board Memberships and Affiliations:
- BBH Mutual Funds Group (11 funds), Director
- The Jeffrey Company, a private investment company, Director
No. of Portfolios for which Board Member Serves: 50
The Portfolio 31
BOARD MEMBERS INFORMATION (Unaudited) (continued)
| James F. Henry (77) |
| Board Member (1990) |
Principal Occupation During Past 5 Years:
- President,The International Institute for Conflict Prevention and Resolution, a non- profit organization principally engaged in the development of alternatives to business litigation (Retired 2003)
- Advisor to The Elaw Forum, a consultant on managing corporate legal costs
- Advisor to John Jay Homestead (the restored home of the first U.S. Chief Justice)
- Individual Trustee of several trusts
Other Board Memberships and Affiliations:
- Director, advisor and mediator involved in several non-profit organizations, primarily engaged in domestic and international dispute resolution, and historic preservation
No. of Portfolios for which Board Member Serves: 41 ———————
| Ehud Houminer (67) |
| Board Member (2006) |
| Principal Occupation During Past 5 Years: |
| • Executive-in-Residence at the Columbia Business School, Columbia University |
Other Board Memberships and Affiliations:
- Avnet Inc., an electronics distributor, Director
- International Advisory Board to the MBA Program School of Management, Ben Gurion University, Chairman
No. of Portfolios for which Board Member Serves: 67 ———————
| Gloria Messinger (78) |
| Board Member (2006) |
Principal Occupation During Past 5 Years:
- Arbitrator for American Arbitration Association and National Association of Securities Dealers, Inc.
- Consultant in Intellectual Property
Other Board Memberships and Affiliations:
- Theater for a New Audience, Inc., Director
- Brooklyn Philharmonic, Director
No. of Portfolios for which Board Member Serves: 41
32
| Dr. Martin Peretz (68) |
| Board Member (1990) |
Principal Occupation During Past 5 Years:
- Editor-in-Chief of The New Republic Magazine
- Lecturer in Social Studies at Harvard University (1965-2002)
- Director of TheStreet.com, a financial information service on the web
Other Board Memberships and Affiliations:
- American Council of Trustees and Alumni, Director
- Pershing Square Capital Management, Advisor
- Montefiore Ventures, General Partner
- Harvard Center for Blood Research,Trustee
- Bard College,Trustee
- Board of Overseers of YIVO Institute for Jewish Research, Chairman
No. of Portfolios for which Board Member Serves: 41 ———————
| Anne Wexler (77) |
| Board Member (2006) |
Principal Occupation During Past 5 Years:
- Chairman of the Wexler & Walker Public Policy Associates, consultants specializing in government relations and public affairs from January 1981 to present
Other Board Memberships and Affiliations:
- Wilshire Mutual Funds (5 funds), Director
- The Community Foundation for the National Capital Region, Director
- Member of the Council of Foreign Relations
- Member of the National Park Foundation
No. of Portfolios for which Board Member Serves: 50 ———————
Once elected all Board Members serve for an indefinite term, but achieve Emeritus status upon reaching age 80.The address of the Board Members and Officers is in c/o The Dreyfus Corporation, 200 Park Avenue, New York, New York 10166. Additional information about the Board Members is available in the fund’s Statement of Additional Information which can be obtained from Dreyfus free of charge by calling this toll free number: 1-800-554-4611.
| John M. Fraser, Jr., Emeritus Board Member |
| Rosalind G. Jacobs, Emeritus Board Member |
| Dr. Paul A. Marks, Emeritus Board Member |
The Portfolio 33
OFFICERS OF THE FUND (Unaudited)
| J. DAVID OFFICER, President since |
| December 2006. |
Chief Operating Officer,Vice Chairman and a Director of the Manager, and an officer of 78 investment companies (comprised of 163 portfolios) managed by the Manager. He is 59 years old and has been an employee of the Manager since April 1998.
| PHILLIP N. MAISANO, Executive Vice |
| President since July 2007. |
Chief Investment Officer,Vice Chair and a director of the Manager, and an officer of 78 investment companies (comprised of 163 portfolios) managed by the Manager. Mr. Maisano also is an officer and/or Board member of certain other investment management subsidiaries of The Bank of New York Mellon Corporation, each of which is an affiliate of the Manager. He is 60 years old and has been an employee of the Manager since November 2006. Prior to joining the Manager, Mr. Maisano served as Chairman and Chief Executive Officer of EACM Advisors, an affiliate of the Manager, since August 2004, and served as Chief Executive Officer of Evaluation Associates, a leading institutional investment consulting firm, from 1988 until 2004.
| MICHAEL A. ROSENBERG, Vice President |
| and Secretary since August 2005. |
Associate General Counsel of the Manager, and an officer of 79 investment companies (comprised of 180 portfolios) managed by the Manager. He is 47 years old and has been an employee of the Manager since October 1991.
| JAMES BITETTO, Vice President and |
| Assistant Secretary since August 2005. |
Associate General Counsel and Secretary of the Manager, and an officer of 79 investment companies (comprised of 180 portfolios) managed by the Manager. He is 41 years old and has been an employee of the Manager since December 1996.
| JONI LACKS CHARATAN, Vice President |
| and Assistant Secretary since |
| August 2005. |
Associate General Counsel of the Manager, and an officer of 79 investment companies (comprised of 180 portfolios) managed by the Manager. She is 52 years old and has been an employee of the Manager since October 1988.
| JOSEPH M. CHIOFFI, Vice President and |
| Assistant Secretary since August 2005. |
Associate General Counsel of the Manager, and an officer of 79 investment companies (comprised of 180 portfolios) managed by the Manager. He is 46 years old and has been an employee of the Manager since June 2000.
| JANETTE E. FARRAGHER, Vice President |
| and Assistant Secretary since |
| August 2005. |
Associate General Counsel of the Manager, and an officer of 79 investment companies (comprised of 180 portfolios) managed by the Manager. She is 45 years old and has been an employee of the Manager since February 1984.
| JOHN B. HAMMALIAN, Vice President and |
| Assistant Secretary since August 2005. |
Associate General Counsel of the Manager, and an officer of 79 investment companies (comprised of 180 portfolios) managed by the Manager. He is 44 years old and has been an employee of the Manager since February 1991.
| ROBERT R. MULLERY, Vice President and |
| Assistant Secretary since August 2005. |
Associate General Counsel of the Manager, and an officer of 79 investment companies (comprised of 180 portfolios) managed by the Manager. He is 55 years old and has been an employee of the Manager since May 1986.
| JEFF PRUSNOFSKY, Vice President and |
| Assistant Secretary since August 2005. |
Associate General Counsel of the Manager, and an officer of 79 investment companies (comprised of 180 portfolios) managed by the Manager. He is 42 years old and has been an employee of the Manager since October 1990.
| JAMES WINDELS, Treasurer since |
| November 2001. |
Director – Mutual Fund Accounting of the Manager, and an officer of 79 investment companies (comprised of 180 portfolios) managed by the Manager. He is 49 years old and has been an employee of the Manager since April 1985.
| ROBERT ROBOL, Assistant Treasurer |
| since August 2003. |
Senior Accounting Manager – Money Market and Municipal Bond Funds of the Manager, and an officer of 79 investment companies (comprised of 180 portfolios) managed by the Manager. He is 43 years old and has been an employee of the Manager since October 1988.
| ROBERT SALVIOLO, Assistant Treasurer |
| since July 2007. |
Senior Accounting Manager – Equity Funds of the Manager, and an officer of 79 investment companies (comprised of 180 portfolios) managed by the Manager. He is 40 years old and has been an employee of the Manager since June 1989.
| ROBERT SVAGNA, Assistant Treasurer |
| since December 2002. |
Senior Accounting Manager – Equity Funds of the Manager, and an officer of 79 investment companies (comprised of 180 portfolios) managed by the Manager. He is 40 years old and has been an employee of the Manager since November 1990.
| GAVIN C. REILLY, Assistant Treasurer |
| since December 2005. |
Tax Manager of the Investment Accounting and Support Department of the Manager, and an officer of 79 investment companies (comprised of 180 portfolios) managed by the Manager. He is 39 years old and has been an employee of the Manager since April 1991.
| JOSEPH W. CONNOLLY, Chief Compliance |
| Officer since October 2004. |
Chief Compliance Officer of the Manager and The Dreyfus Family of Funds (79 investment companies, comprised of 180 portfolios). From November 2001 through March 2004, Mr. Connolly was first Vice-President, Mutual Fund Servicing for Mellon Global Securities Services. In that capacity, Mr. Connolly was responsible for managing Mellon’s Custody, Fund Accounting and Fund Administration services to third-party mutual fund clients. He is 50 years old and has served in various capacities with the Manager since 1980, including manager of the firm’s Fund Accounting Department from 1997 through October 2001.
| WILLIAM GERMENIS, Anti-Money |
| Laundering Compliance Officer since |
| September 2002. |
Vice President and Anti-Money Laundering Compliance Officer of the Distributor, and the Anti-Money Laundering Compliance Officer of 75 investment companies (comprised of 176 portfolios) managed by the Manager. He is 37 years old and has been an employee of the Distributor since October 1998.
The Portfolio 35
NOTES

Telephone 1-800-554-4611 or 516-338-3300
| Mail | | The Dreyfus Family of Funds, 144 Glenn Curtiss Boulevard, Uniondale, NY 11556-0144 |
| | | Attn: Investments Division |
The portfolio files its complete schedule of portfolio holdings with the Securities and Exchange Commission (“SEC”) for the first and third quarters of each fiscal year on Form N-Q. The portfolio’s Forms N-Q are available on the SEC’s website at http://www.sec.gov and may be reviewed and copied at the SEC’s Public Reference Room in Washington, DC. Information on the operation of the Public Reference Room may be obtained by calling 1-202-551-8090.
A description of the policies and procedures that the portfolio uses to determine how to vote proxies relating to portfolio securities, and information regarding how the portfolio voted these proxies for the 12-month period ended June 30, 2007, is available at http://www.dreyfus.com and on the SEC’s website at http://www.sec.gov. The description of the policies and procedures is also available without charge, upon request, by calling 1-800-645-6561.
© 2008 MBSC Securities Corporation

| Dreyfus Variable |
| Investment Fund, |
| Money Market |
| Portfolio |
The views expressed in this report reflect those of the portfolio manager only through the end of the period covered and do not necessarily represent the views of Dreyfus or any other person in the Dreyfus organization.Any such views are subject to change at any time based upon market or other conditions and Dreyfus disclaims any responsibility to update such views. These views may not be relied on as investment advice and, because investment decisions for a Dreyfus portfolio are based on numerous factors, may not be relied on as an indication of trading intent on behalf of any Dreyfus portfolio.
Not FDIC-Insured • Not Bank-Guaranteed • May Lose Value
| | | Contents |
| |
| | | THE PORTFOLIO |
| |
|
| 2 | | A Letter from the CEO |
| 3 | | Discussion of Performance |
| 6 | | Understanding Your Portfolio’s Expenses |
| 6 | | Comparing Your Portfolio’s Expenses |
| | | With Those of Other Funds |
| 7 | | Statement of Investments |
| 11 | | Statement of Assets and Liabilities |
| 12 | | Statement of Operations |
| 13 | | Statement of Changes in Net Assets |
| 14 | | Financial Highlights |
| 15 | | Notes to Financial Statements |
| 20 | | Report of Independent Registered |
| | | Public Accounting Firm |
| 21 | | Board Members Information |
| 24 | | Officers of the Fund |
| FOR MORE INFORMATION |
|
| | | Back Cover |
| Dreyfus Variable Investment Fund, |
| Money Market Portfolio |
The Portfolio

A LETTER FROM THE CEO
Dear Shareholder:
We are pleased to present this annual report for Dreyfus Variable Investment Fund, Money Market Portfolio, covering the 12-month period from January 1, 2007, through December 31, 2007.
Looking back, 2007 was a year of significant change for the financial markets.Turmoil in the sub-prime mortgage market, declining housing values and soaring energy prices sparked a “flight to quality” among investors, in which prices of U.S.Treasury securities surged higher while more sophisticated fixed-income assets classes tumbled. Money market instruments proved to be a relatively safe haven from heightened volatility in the stock and bond markets, which led to record levels of assets coming into the money-market industry.
The turbulence of 2007 reinforced a central principle of successful investing: diversification. Investors with broad exposure to the world’s stock and bond markets were better protected from the full impact of market volatility in areas that, earlier in the year, were among the bright spots at the time. As we look ahead, we believe that now is the perfect time to meet with your financial advisor, who can help you plan and diversify your investment portfolio in a way that manages the potential opportunities and risks that may continue to arise in 2008.
For information about how the portfolio performed during the reporting period, as well as market perspectives, we have provided a Discussion of Performance given by the Portfolio Manager.
Thank you for your continued confidence and support.
Thomas F. Eggers
Chief Executive Officer
The Dreyfus Corporation
January 15, 2008
|

DISCUSSION OF PERFORMANCE
For the period of January 1, 2007, through December 31, 2007, as provided by Bernard W. Kiernan, Jr., Senior Portfolio Manager
Portfolio and Market Performance Overview
Although money market yields remained relatively stable early the first half of the reporting period, slowing economic growth and a credit crisis in U.S. fixed-income markets prompted the Federal Reserve Board (the “Fed”) to reduce short-term interest rates over the reporting period’s second half.
For the 12-month period ended December 31, 2007, Dreyfus Variable Investment Fund, Money Market Portfolio produced a yield of 4.73% . Taking into account the effects of compounding, the portfolio provided an effective yield of 4.83% for the same period.1
The Portfolio’s Investment Approach
The portfolio seeks as high a level of current income as is consistent with the preservation of capital and the maintenance of liquidity.To pursue this goal, the portfolio invests in a diversified selection of high-quality, short-term debt securities, including securities issued or guaranteed by the U.S. government or its agencies or instrumentalities, certificates of deposit, time deposits, bankers’ acceptances and other short-term securities issued by domestic or foreign banks, repurchase agreements, asset-backed securities, domestic and dollar-denominated foreign commercial paper and other short-term corporate and bank obligations of domestic and foreign issuers and dollar-denominated obligations issued or guaranteed by one or more foreign governments or their agencies, including obligations of supranational entities.
A Worsening Credit Crisis Prompted Fed Intervention
The U.S. economy showed signs of a moderate slowdown at the start of 2007 as housing markets softened. However, inflationary pressures were relatively mild, and the Fed appeared comfortable maintaining a target of 5.25% for the overnight federal funds rate.
The Portfolio 3
DISCUSSION OF PERFORMANCE (continued)
In the spring, however, new evidence suggested that inflation might be a more persistent problem than expected. By June, signs of stronger economic growth caused the Fed to state that it was not yet convinced of the sustainability of lower inflationary pressures.A U.S. GDP growth rate of 3.8% for the second quarter lent credence to the Fed’s inflation-fighting bias.
The summer of 2007 proved to be a difficult time for the financial markets, as intensifying housing and lending concerns sparked a sharp repricing of risk in July, as a result of credit concerns related to rising delinquencies and defaults from the sub-prime mortgage sector. Tightness in the credit markets created turmoil in the inter-bank lending market and the commercial paper and syndicated loan markets.
The Fed intervened in the credit crisis in mid-August, when it reduced the discount rate by 50 basis points.The Fed followed up in September with an additional reduction of 50 basis points in the discount rate and a reduction of 50 basis points in the federal funds rate to ease conditions in the money markets and prevent a spillover into the broader economy. These moves appeared to be warranted, as fallout from the subprime mortgage crisis included billions in subprime-related asset write-downs by financial institutions.
A More Severe Slowdown Led to Additional Rate Cuts
In October, the economy continued to show signs of weakness, including reports of a tepid September increase in consumer spending of 0.3% and record energy prices.Yet,U.S.GDP grew at a stronger-than-expected 4.9% annualized rate in the third quarter. Nonetheless, the Fed again cut the federal funds rate, this time by 25 basis points, with the Fed stating that it regarded the risks of recession and inflation as balanced.
November witnessed further deterioration in the financial markets as recession concerns intensified amid additional announcements of write-downs among major banks and brokerage firms. In addition, it was announced that sales of existing homes fell in October to its lowest level since recordkeeping began eight years earlier. In December, the Fed again reduced the federal funds rate by 25 basis points to 4.75%, but the markets appeared to be disappointed that the reduction was not larger.
4
Reports of lackluster retail sales during the holiday season, further deterioration of housing prices and a surge in foreclosures also contributed to investors’ economic concerns.As a result, in stark contrast to expectations of a moderate slowdown at the beginning of the year, 2007 ended with some analysts predicting the onset of a full-blown recession in 2008.
Caution Remains Warranted in Uncertain Markets
As the credit crisis unfolded and the Fed cut interest rates, yield differences widened along the market’s maturity range, creating more attractive opportunities among longer-dated money market instruments. Meanwhile, demand for money market instruments surged as investors shifted assets from riskier investments to money market funds. In this environment, we increased the portfolio’s weighted average maturity toward a position we considered slightly longer than industry averages.
While the likelihood of additional rate cuts in 2008 probably will depend on incoming data, the Fed has signaled that it is prepared to reduce rates further if the balance continues to shift away from evidence of persistent inflation risks and toward the possibility of further economic deterioration. Like other market participants, we intend to monitor developments closely.
January 15, 2008
| | | An investment in the portfolio is not insured or guaranteed by the FDIC or any other |
| | | government agency. Although the portfolio seeks to preserve the value of your investment at $1.00 |
| | | per share, it is possible to lose money by investing in the portfolio. |
| | | The portfolio is only available as a funding vehicle under variable life insurance policies or variable |
| | | annuity contracts issued by insurance companies. Individuals may not purchase shares of the |
| | | portfolio directly. A variable annuity is an insurance contract issued by an insurance company that |
| | | enables investors to accumulate assets on a tax-deferred basis for retirement or other long-term |
| | | goals.The investment objective and policies of Dreyfus Variable Investment Fund, Money Market |
| | | Portfolio made available through insurance products may be similar to other funds/portfolios |
| | | managed or advised by Dreyfus. However, the investment results of the portfolio may be higher or |
| | | lower than, and may not be comparable to, those of any other Dreyfus fund/portfolio. |
| 1 | | Annualized effective yield is based upon dividends declared daily and reinvested monthly. Past |
| | | performance is no guarantee of future results.Yields fluctuate.The portfolio’s performance does not |
| | | reflect the deduction of additional charges and expenses imposed in connection with investing in |
| | | variable insurance contracts, which will reduce returns. |
The Portfolio 5
| | UNDERSTANDING YOUR
PORTFOLIO’S EXPENSES (Unaudited)
|
As a mutual fund investor,you pay ongoing expenses,such as management fees and other expenses.Using the information below,you can estimate how these expenses affect your investment and compare them with the expenses of other funds.You also may pay one-time transaction expenses,including sales charges (loads) and redemption fees, which are not shown in this section and would have resulted in higher total expenses. For more information, see your portfolio’s prospectus or talk to your financial adviser.
Review your portfolio’s expenses
The table below shows the expenses you would have paid on a $1,000 investment in Dreyfus Variable Investment Fund,Money Market Portfolio from July 1,2007 to December 31,2007. It also shows how much a $1,000 investment would be worth at the close of the period, assuming actual returns and expenses.
| | Expenses and Value of a $1,000 Investment
assuming actual returns for the six months ended December 31, 2007
|
| Expenses paid per $1,000 † | | $ 2.81 |
| Ending value (after expenses) | | $1,023.80 |
| | COMPARING YOUR PORTFOLIO’S EXPENSES
WITH THOSE OF OTHER FUNDS (Unaudited)
|
Using the SEC’s method to compare expenses
The Securities and Exchange Commission (SEC) has established guidelines to help investors assess fund expenses. Per these guidelines, the table below shows your portfolio’s expenses based on a $1,000 investment, assuming a hypothetical 5% annualized return. You can use this information to compare the ongoing expenses (but not transaction expenses or total cost) of investing in the portfolio with those of other funds. All mutual fund shareholder reports will provide this information to help you make this comparison. Please note that you cannot use this information to estimate your actual ending account balance and expenses paid during the period.
| | Expenses and Value of a $1,000 Investment
assuming a hypothetical 5% annualized return for the six months ended December 31, 2007
|
| Expenses paid per $1,000 † | | $ 2.80 |
| Ending value (after expenses) | | $1,022.43 |
| † Expenses are equal to the portfolio’s annualized expense ratio of .55%, multiplied by the average account value over |
| the period, multiplied by 184/365 (to reflect the one-half year period). |
6
STATEMENT OF INVESTMENTS
December 31, 2007
|
| | | Principal | | |
| Negotiable Bank Certificates of Deposit—13.3% | | Amount ($) | | Value ($) |
| |
| |
|
| American Express Centurion Bank | | | | |
| 4.93%—5.20%, 1/4/08—6/3/08 | | 10,000,000 | | 10,000,000 |
| American Express Company | | | | |
| 4.85%, 5/22/08 | | 5,000,000 | | 5,000,000 |
| Comerica Inc. | | | | |
| 4.72%, 5/5/08 | | 10,000,000 | | 10,000,000 |
| Regions Bank | | | | |
| 4.65%, 5/9/08 | | 10,000,000 | | 10,000,000 |
| Union Bank of California, N.A. | | | | |
| 4.75%, 2/4/08 | | 5,000,000 | | 5,000,000 |
| Total Negotiable Bank Certificates of Deposit | | | | |
| (cost $40,000,000) | | | | 40,000,000 |
| |
| |
|
| |
| Commercial Paper—41.8% | | | | |
| |
| |
|
| Allied Irish Banks N.A. Inc. | | | | |
| 4.81%—4.90%, 5/21/08—6/11/08 | | 12,000,000 | | 11,747,858 |
| Atlantic Asset Securitization LLC | | | | |
| 5.60%, 3/11/08 | | 10,000,000 a | | 9,892,570 |
| Atlantis One Funding Corp. | | | | |
| 5.29%, 1/4/08 | | 5,000,000 a | | 4,997,825 |
| Barclays U.S. Funding Corp. | | | | |
| 5.16%, 4/3/08 | | 5,000,000 | | 4,935,029 |
| Canadian Imperial Bank of Commerce | | | | |
| 4.80%, 4/9/08 | | 10,000,000 | | 9,870,613 |
| Chariot Funding LLC | | | | |
| 5.27%, 2/22/08 | | 12,000,000 a | | 11,909,867 |
| JPMorgan Chase & Co. | | | | |
| 5.07%, 4/1/08 | | 10,000,000 | | 9,875,001 |
| Lehman Brothers Holdings Inc. | | | | |
| 5.00%, 4/25/08 | | 10,000,000 | | 9,844,271 |
| Old Line Funding LLC | | | | |
| 5.32%, 2/19/08 | | 13,584,000 a | | 13,486,931 |
| Santander Central Hispano Finance (Delaware) Inc. | | | | |
| 5.51%, 3/14/08 | | 5,000,000 | | 4,945,656 |
| Societe Generale N.A. Inc. | | | | |
| 5.23%, 1/8/08 | | 5,000,000 | | 4,994,983 |
The Portfolio 7
STATEMENT OF INVESTMENTS (continued)
| | | Principal | | |
| Commercial Paper (continued) | | Amount ($) | | Value ($) |
| |
| |
|
| Swedbank (ForeningsSparbanken AB) | | | | |
| 4.86%, 4/23/08 | | 10,000,000 | | 9,851,060 |
| Toronto-Dominion Holdings USA Inc. | | | | |
| 4.85%, 5/27/08 | | 10,000,000 | | 9,806,858 |
| Unicredit Delaware Inc. | | | | |
| 4.81%, 6/25/08 | | 10,000,000 | | 9,770,711 |
| Total Commercial Paper | | | | |
| (cost $125,929,233) | | | | 125,929,233 |
| |
| |
|
| |
| Corporate Notes—4.7% | | | | |
| |
| |
|
| General Electric Capital Corp. | | | | |
| 4.92%, 1/25/08 | | 5,000,000 b | | 5,000,000 |
| Harrier Finance Funding Ltd. | | | | |
| 4.32%, 2/27/08 | | 5,000,000 a,b | | 4,999,941 |
| Wells Fargo & Co. | | | | |
| 5.28%, 1/3/08 | | 4,000,000 b | | 4,000,000 |
| Total Corporate Notes | | | | |
| (cost $13,999,941) | | | | 13,999,941 |
| |
| |
|
| |
| Promissory Note—3.3% | | | | |
| |
| |
|
| Goldman Sachs Group Inc. | | | | |
| 5.07%, 6/17/08 | | | | |
| (cost $10,000,000) | | 10,000,000 c | | 10,000,000 |
| |
| |
|
| |
| Time Deposits—1.7% | | | | |
| |
| |
|
| Key Bank U.S.A., N.A. (Grand Cayman) | | | | |
| 2.00%, 1/2/08 | | | | |
| (cost $5,000,000) | | 5,000,000 | | 5,000,000 |
8
| | | Principal | | |
| Repurchase Agreements—37.2% | | Amount ($) | | Value ($) |
| |
| |
|
| Banc of America Securities LLC | | | | |
| 4.40%, dated 12/31/07, due 1/2/08 | | | | |
| in the amount of $14,003,422 (fully | | | | |
| collateralized by $15,380,615 Federal | | | | |
| National Mortgage Association, | | | | |
| 5.50%, due 4/25/37, value $14,280,000) | | 14,000,000 | | 14,000,000 |
| Bear Stearns Cos. Inc. | | | | |
| 4.70%, dated 12/31/07, due 1/2/08 in the | | | | |
| amount of $10,002,611 (fully collateralized by | | | | |
| $10,210,000 Federal Home Loan Mortgage Corp., | | | | |
| 5.50%, due 12/1/37, value $10,204,006) | | 10,000,000 | | 10,000,000 |
| Deutsche Bank Securities | | | | |
| 4.62%, dated 12/31/07, due 1/2/08 in the | | | | |
| amount of $10,002,567 (fully collateralized by | | | | |
| $11,924,423 Corporate Bonds, 6.14%, | | | | |
| due 5/25/33, value $10,300,000) | | 10,000,000 | | 10,000,000 |
| Greenwich Capital Markets | | | | |
| 4.60%-4.75%, dated 12/31/07, due 1/2/08 in the | | | | |
| amount of $24,006,250 (fully collateralized by | | | | |
| $351,219,304 Federal National Mortgage Association, | | | | |
| 0%-8.91%, due 4/25/09-8/25/37, value $24,484,031) | | 24,000,000 | | 24,000,000 |
| HSBC USA Inc | | | | |
| 4.60%, dated 12/31/07, due 1/2/08 in the | | | | |
| amount of $10,002,556 (fully collateralized by | | | | |
| $10,250,000 Corporate Bonds, 5.80%-7.75%, | | | | |
| due 9/15/10-8/15/13, value $10,500,187) | | 10,000,000 | | 10,000,000 |
| Merrill Lynch & Co. Inc. | | | | |
| 4.65%, dated 12/31/07, due 1/2/08 in the | | | | |
| amount of $10,002,583 (fully collateralized by | | | | |
| $10,710,000 Corporate Bonds, 5.40%, | | | | |
| due 3/1/16, value $10,300,557) | | 10,000,000 | | 10,000,000 |
The Portfolio 9
STATEMENT OF INVESTMENTS (continued)
| | | Principal | | |
| Repurchase Agreements (continued) | | Amount ($) | | Value ($) |
| |
| |
|
| Morgan Stanley | | | | |
| 4.65%, dated 12/31/07, due 1/2/08 in the | | | | |
| amount of $10,002,583 (fully collateralized by | | | | |
| $676,113,999 Corporate Bonds, 0%-5.056%, | | | | |
| due 8/14/16-6/10/44, value $10,314,410) | | 10,000,000 | | 10,000,000 |
| UBS Securities LLC | | | | |
| 4.50%-4.60%, dated 12/31/07, due | | | | |
| 1/2/08 in the amount of $24,006,056 | | | | |
| (fully collateralized by $12,880,000 | | | | |
| Corporate Bonds, 9.75%, due 10/24/37, | | | | |
| value $10,304,000 and $14,985,000 | | | | |
| Federal Home Loan Mortgage Corp., | | | | |
| Participation Certificates, 5.428%, | | | | |
| due 7/15/36, value $14,282,998) | | 24,000,000 | | 24,000,000 |
| Total Repurchase Agreements | | | | |
| (cost $112,000,000) | | | | 112,000,000 |
| |
| |
|
| |
| Total Investments (cost $306,929,174) | | 102.0% | | 306,929,174 |
| |
| Liabilities, Less Cash and Receivables | | (2.0%) | | (6,126,600) |
| |
| Net Assets | | 100.0% | | 300,802,574 |
| a Securities exempt from registration under Rule 144A of the Securities Act of 1933.These securities may be resold in |
| transactions exempt from registration, normally to qualified institutional buyers. At December 31, 2007, these |
| securities amounted to $45,287,134 or 15.1% of net assets. |
| b Variable rate security—interest rate subject to periodic change. |
| c This note was acquired for investment, and not with the intent to distribute or sell. Security restricted as to public |
| resale.This security was acquired on 9/21/07 at a cost of $10,000,000.At December 31, 2007, the aggregate |
| value of this security was $10,000,000 representing 3.3% of net assets and is valued at cost. |
| Portfolio Summary (Unaudited) † | | | | |
| |
| | | Value (%) | | | | Value (%) |
| |
| |
| |
|
| Banking | | 43.1 | | Asset-Backed/Certificates | | 3.9 |
| Repurchase Agreements | | 37.2 | | Asset-Backed/Structured | | |
| Asset-Backed/ | | | | Investment Vehicles | | 1.7 |
| Multi-Seller Programs | | 7.8 | | Finance | | 1.7 |
| Brokerage Firms | | 6.6 | | | | 102.0 |
| † Based on net assets. |
| See notes to financial statements. |
10
STATEMENT OF ASSETS AND LIABILITIES
December 31, 2007
|
| | | Cost | | Value |
| |
| |
|
| Assets ($): | | | | |
| Investments in securities-See Statement of | | | | |
| Investments (including repurchase | | | | |
| agreements of $112,000,000)—Note 1(b) | | 306,929,174 | | 306,929,174 |
| Cash | | | | 1,277,537 |
| Interest receivable | | | | 496,050 |
| Prepaid expenses | | | | 2,105 |
| | | | | 308,704,866 |
| |
| |
|
| Liabilities ($): | | | | |
| Due to The Dreyfus Corporation and affiliates—Note 2(a) | | 54,139 |
| Payable for shares of Beneficial Interest redeemed | | | | 7,812,417 |
| Accrued expenses | | | | 35,736 |
| | | | | 7,902,292 |
| |
| |
|
| Net Assets ($) | | | | 300,802,574 |
| |
| |
|
| Composition of Net Assets ($): | | | | |
| Paid-in capital | | | | 300,825,053 |
| Accumulated net realized gain (loss) on investments | | | | (22,479) |
| |
| |
|
| Net Assets ($) | | | | 300,802,574 |
| |
| |
|
| Shares Outstanding | | | | |
| (unlimited number of $.001 par value shares of Beneficial interest authorized) | | 300,824,984 |
| Net Asset Value, offering and redemption price per share ($) | | 1.00 |
See notes to financial statements.
The Portfolio 11
STATEMENT OF OPERATIONS
Year Ended December 31, 2007
|
| Investment Income ($): | | |
| Interest Income | | 14,897,655 |
| Expenses: | | |
| Investment advisory fee—Note 2(a) | | 1,405,431 |
| Custodian fees—Note 2(a) | | 65,819 |
| Professional fees | | 41,993 |
| Trustees’ fees and expenses—Note 2(b) | | 16,155 |
| Miscellaneous | | 4,633 |
| Total Expenses | | 1,534,031 |
| Less—reduction in custody fees due to | | |
| earnings credits—Note 1(b) | | (171) |
| Net Expenses | | 1,533,860 |
| Investment Income—Net | | 13,363,795 |
| |
|
| Net Realized Gain (Loss) on Investments—Note 1(b) ($) | | 1,134 |
| Net Increase in Net Assets Resulting from Operations | | 13,364,929 |
See notes to financial statements.
12
STATEMENT OF CHANGES IN NET ASSETS
| | | Year Ended December 31, |
| |
|
| | | 2007 | | 2006 |
| |
| |
|
| Operations ($): | | | | |
| Investment income—net | | 13,363,795 | | 7,163,234 |
| Net realized gain (loss) on investments | | 1,134 | | (715) |
| Net Increase (Decrease) in Net Assets | | | | |
| Resulting from Operations | | 13,364,929 | | 7,162,519 |
| |
| |
|
| Dividends to Shareholders from ($): | | | | |
| Investment income—net | | (13,403,840) | | (7,136,592) |
| |
| |
|
| Beneficial Interest Transactions ($1.00 per share): | | |
| Net proceeds from shares sold | | 723,408,303 | | 249,036,593 |
| Dividends reinvested | | 13,403,840 | | 7,136,592 |
| Cost of shares redeemed | | (587,271,974) | | (236,107,747) |
| Increase (Decrease) in Net Assets from | | | | |
| Beneficial Interest Transactions | | 149,540,169 | | 20,065,438 |
| Total Increase (Decrease) in Net Assets | | 149,501,258 | | 20,091,365 |
| |
| |
|
| Net Assets ($): | | | | |
| Beginning of Period | | 151,301,316 | | 131,209,951 |
| End of Period | | 300,802,574 | | 151,301,316 |
| Undistributed investment income—net | | — | | 40,045 |
See notes to financial statements.
The Portfolio 13
FINANCIAL HIGHLIGHTS
The following table describes the performance for the fiscal periods indicated.Total return shows how much your investment in the portfolio would have increased (or decreased) during each period, assuming you had reinvested all dividends and dis-tributions.These figures have been derived from the portfolio’s financial statements.
| | | | | Year Ended December 31, | | |
| |
| |
| |
|
| | | 2007 | | 2006 | | 2005 | | 2004 | | 2003 |
| |
| |
| |
| |
| |
|
| Per Share Data ($): | | | | | | | | | | |
| Net asset value, beginning of period | | 1.00 | | 1.00 | | 1.00 | | 1.00 | | 1.00 |
| Investment Operations: | | | | | | | | | | |
| Investment income—net | | .048 | | .045 | | .026 | | .008 | | .007 |
| Distributions: | | | | | | | | | | |
| Dividends from investment income—net | | (.048) | | (.045) | | (.026) | | (.008) | | (.007) |
| Net asset value, end of period | | 1.00 | | 1.00 | | 1.00 | | 1.00 | | 1.00 |
| |
| |
| |
| |
| |
|
| Total Return (%) | | 4.86 | | 4.58 | | 2.65 | | .80 | | .70 |
| |
| |
| |
| |
| |
|
| Ratios/Supplemental Data (%): | | | | | | | | | | |
| Ratio of total expenses | | | | | | | | | | |
| to average net assets | | .55 | | .57 | | .59 | | .60 | | .57 |
| Ratio of net expenses | | | | | | | | | | |
| to average net assets | | .55a | | .57a | | .59a | | .60a | | .57 |
| Ratio of net investment income | | | | | | | | | | |
| to average net assets | | 4.75 | | 4.56 | | 2.66 | | .77 | | .71 |
| |
| |
| |
| |
| |
|
| Net Assets, end of period ($ x 1,000) | | 300,803 | | 151,301 | | 131,210 | | 104,229 | | 152,559 |
| | a The difference for the period represents less than .01%.
See notes to financial statements.
|
14
NOTES TO FINANCIAL STATEMENTS
NOTE 1—Significant Accounting Policies:
Dreyfus Variable Investment Fund (the “fund”) is registered under the Investment Company Act of 1940, as amended (the “Act”), as an open-end management investment company, operating as a series company currently offering seven series, including the Money Market Portfolio (the “portfolio”). The portfolio is only offered to separate accounts established by insurance companies to fund variable annuity contracts and variable life insurance policies.The portfolio is a diversified series. The portfolio’s investment objective is to provide as high a level of current income as is consistent with the preservation of capital and the maintenance of liquidity. The Dreyfus Corporation (the “Manager” or “Dreyfus”) serves as the portfolio’s investment adviser. MBSC Securities Corporation (the “Distributor”), a wholly-owned subsidiary of the Manager, is the distributor of the portfolio’s shares, which are sold without a sales charge.
On July 1, 2007, Mellon Financial Corporation and The Bank of New York Company, Inc. merged, forming The Bank of New York Mellon Corporation (“BNY Mellon”). As part of this transaction, Dreyfus became a wholly-owned subsidiary of BNY Mellon.
It is the portfolio’s policy to maintain a continuous net asset value per share of $1.00; the portfolio has adopted certain investment, portfolio valuation and dividend and distribution policies to enable it to do so. There is no assurance, however, that the portfolio will be able to maintain a stable net asset value per share of $1.00.
The fund accounts separately for the assets, liabilities and operations of each series. Expenses directly attributable to each series are charged to that series’ operations; expenses which are applicable to all series are allocated among them on a pro rata basis.
The portfolio’s financial statements are prepared in accordance with U.S. generally accepted accounting principles, which may require the use of management estimates and assumptions.Actual results could differ from those estimates.
The Portfolio 15
NOTES TO FINANCIAL STATEMENTS (continued)
The fund enters into contracts that contain a variety of indemnifica-tions.The portfolio’s maximum exposure under these arrangements is unknown. The portfolio does not anticipate recognizing any loss related to these arrangements.
(a) Portfolio valuation: Investments in securities are valued at amortized cost in accordance with Rule 2a-7 of the Act, which has been determined by the fund’s Board of Trustees to represent the fair value of the portfolio’s investments.
The Financial Accounting Standards Board (“FASB”) released Statement of Financial Accounting Standards No. 157 “Fair Value Measurements” (“FAS 157”). FAS 157 establishes an authoritative definition of fair value, sets out a framework for measuring fair value, and requires additional disclosures about fair-value measurements.The application of FAS 157 is required for fiscal years beginning after November 15, 2007 and interim periods within those fiscal years. Management does not believe that the application of this standard will have a material impact on the financial statements of the portfolio.
(b) Securities transactions and investment income: Securities transactions are recorded on a trade date basis. Realized gains and losses from securities transactions are recorded on the identified cost basis. Interest income, adjusted for accretion of discount and amortization of premium on investments, is earned from settlement date and recognized on the accrual basis. Cost of investments represents amortized cost.
The portfolio has an arrangement with the custodian bank whereby the portfolio receives earnings credits from the custodian when positive cash balances are maintained, which are used to offset custody fees. For financial reporting purposes, the portfolio includes net earnings credits as an expense offset in the Statement of Operations.
The portfolio may enter into repurchase agreements with financial institutions, deemed to be creditworthy by the Manager, subject to the seller’s agreement to repurchase and the portfolio’s agreement to resell such securities at a mutually agreed upon price. Securities purchased
16
subject to repurchase agreements are deposited with the portfolio’s custodian and, pursuant to the terms of the repurchase agreement, must have an aggregate market value greater than or equal to the terms of the repurchase price plus accrued interest at all times. If the value of the underlying securities falls below the value of the repurchase price plus accrued interest, the portfolio will require the seller to deposit additional collateral by the next business day. If the request for additional collateral is not met, or the seller defaults on its repurchase obligation, the portfolio maintains its right to sell the underlying securities at market value and may claim any resulting loss against the seller.
(c) Dividends to shareholders: It is the policy of the portfolio to declare dividends daily from investment income-net. Such dividends are paid monthly. Dividends from net realized capital gains, if any, are normally declared and paid annually, but the portfolio may make distributions on a more frequent basis to comply with the distribution requirements of the Internal Revenue Code of 1986 as amended (the “Code”). To the extent that net realized capital gains can be offset by capital loss carryovers, it is the policy of the portfolio not to distribute such gain.
(d) Federal income taxes: It is the policy of the portfolio to continue to qualify as a regulated investment company, if such qualification is in the best interests of its shareholders, by complying with the applicable provisions of the Code, and to make distributions of taxable income sufficient to relieve it from substantially all federal income and excise taxes.
During the current year, the portfolio adopted FASB Interpretation No. 48 “Accounting for Uncertainty in Income Taxes” (“FIN 48”). FIN 48 provides guidance for how uncertain tax positions should be recognized, measured, presented and disclosed in the financial statements. FIN 48 requires the evaluation of tax positions taken or expected to be taken in the course of preparing the portfolio’s tax returns to determine whether the tax positions are “more-likely-than-not” of being sustained by the applicable tax authority. Tax positions not deemed to meet the more-likely-than-not threshold would be recorded as a tax benefit or expense
The Portfolio 17
NOTES TO FINANCIAL STATEMENTS (continued)
in the current year.The adoption of FIN 48 had no impact on the operations of the portfolio for the period ended December 31, 2007.
The portfolio is not subject to examination by U.S. Federal, State and City tax authorities for the tax years before 2004.
At December 31, 2007, the components of accumulated earnings on tax basis were substantially the same as for financial reporting purposes.
The accumulated capital loss carryover of $22,479 is available for federal income tax purposes to be applied against future net securities profits, if any, realized subsequent to December 31, 2007. If not applied, $10,709 of the carryover expires in fiscal 2008, $10,973 expires in fiscal 2010, $17 expires in fiscal 2011, $65 expires in fiscal 2013 and $715 expires in fiscal 2014.
The tax characters of distributions paid to shareholders during the fiscal periods ended December 31, 2007 and December 31, 2006, were all ordinary income.
During the period ended December 31, 2007, as a result of permanent book to tax differences, the fund decreased accumulated net realized gain (loss) on investments by $69 and increased paid-in capital by the same amount. Net assets were not affected by this reclassification.
At December 31, 2007, the cost of investments for federal income tax purposes was substantially the same as the cost for financial reporting purposes (see the Statement of Investments).
NOTE 2—Investment Advisory Fee and Other Transactions With Affiliates:
(a) Pursuant to an Investment Advisory Agreement with the Manager, the investment advisory fee is computed at the annual rate of .50% of the value of the portfolio’s average daily net assets and is payable monthly.
18
The portfolio compensates Dreyfus Transfer, Inc., a wholly-owned subsidiary of the Manager, under a transfer agency agreement for providing personnel and facilities to perform transfer agency services for the portfolio. During the period ended December 31, 2007, the portfolio was charged $326 pursuant to the transfer agency agreement.
Effective July 1, 2007, the portfolio’s custodian,The Bank of New York, became an affiliate of the Manager. Under the portfolio’s pre-existing custody agreement with The Bank of New York, the portfolio was charged $42,409 for providing custodial services for the portfolio for the six months ended December 31, 2007. Prior to becoming an affil-iate,The Bank of New York was paid $23,410 for custody services to the portfolio for the six month ended June 30, 2007.
During the period ended December 31, 2007, the portfolio was charged $4,821 for services performed by the Chief Compliance Officer.
The components of “Due to The Dreyfus Corporation and affiliates” in the Statement of Assets and Liabilities consist of: investment advisory fee $50,469, chief compliance officer fees $3,616 and transfer agency per account fees $54.
(b) Each Board member also serves as a Board member of other funds within the Dreyfus complex. Annual retainer fees and attendance fees are allocated to each fund based on net assets.
The Portfolio 19
| | REPORT OF INDEPENDENT REGISTERED
PUBLIC ACCOUNTING FIRM
|
Shareholders and Board of Trustees
Dreyfus Variable Investment Fund, Money Market Portfolio
We have audited the accompanying statement of assets and liabilities, including the statement of investments, of Dreyfus Variable Investment Fund, Money Market Portfolio (one of the funds comprising Dreyfus Variable Investment Fund) as of December 31, 2007, and the related statement of operations for the year then ended, the statement of changes in net assets for each of the two years in the period then ended, and financial highlights for each of the years indicated therein. These financial statements and financial highlights are the responsibility of the Fund’s management. Our responsibility is to express an opinion on these financial statements and financial highlights based on our audits.
We conducted our audits in accordance with the standards of the Public Company Accounting Oversight Board (United States).Those standards require that we plan and perform the audit to obtain reasonable assurance about whether the financial statements and financial highlights are free of material misstatement.We were not engaged to perform an audit of the Fund’s internal control over financial reporting. Our audits included consideration of internal control over financial reporting as a basis for designing audit procedures that are appropriate in the circumstances, but not for the purpose of expressing an opinion on the effectiveness of the Fund’s internal control over financial reporting. Accordingly, we express no such opinion.An audit also includes examining, on a test basis, evidence supporting the amounts and disclosures in the financial statements and financial highlights, assessing the accounting principles used and significant estimates made by management, and evaluating the overall financial statement presentation. Our procedures included confirmation of securities owned as of December 31, 2007 by correspondence with the custodian.We believe that our audits provide a reasonable basis for our opinion.
In our opinion, the financial statements and financial highlights referred to above present fairly, in all material respects, the financial position of Dreyfus Variable Investment Fund, Money Market Portfolio at December 31, 2007, the results of its operations for the year then ended, the changes in its net assets for each of the two years in the period then ended, and the financial highlights for each of the indicated years,in conformity with U.S. generally accepted accounting principles.
New York, New York
February 8, 2008
|
20
BOARD MEMBERS INFORMATION (Unaudited)
| | Joseph S. DiMartino (64)
Chairman of the Board (1995)
|
| | Principal Occupation During Past 5 Years:
• Corporate Director and Trustee
|
| | Other Board Memberships and Affiliations:
|
- The Muscular Dystrophy Association, Director
- Century Business Services, Inc., a provider of outsourcing functions for small and medium size companies, Director
- The Newark Group, a provider of a national market of paper recovery facilities, paperboard mills and paperboard converting plants, Director
- Sunair Services Corporation, a provider of certain outdoor-related services to homes and businesses, Director
No. of Portfolios for which Board Member Serves: 163
———————
Peggy C. Davis (64)
Board Member (2006)
|
| | Principal Occupation During Past 5 Years:
|
- Shad Professor of Law, New York University School of Law (1983-present)
- Writer and teacher in the fields of evidence, constitutional theory, family law, social sciences and the law, legal process and professional methodology and training
No. of Portfolios for which Board Member Serves: 64
———————
David P. Feldman (68)
Board Member (1994)
|
| | Principal Occupation During Past 5 Years:
• Corporate Director and Trustee
|
| | Other Board Memberships and Affiliations:
|
- BBH Mutual Funds Group (11 funds), Director
- The Jeffrey Company, a private investment company, Director
| | No. of Portfolios for which Board Member Serves: 50
|
The Portfolio 21
BOARD MEMBERS INFORMATION (Unaudited) (continued)
| | James F. Henry (77)
Board Member (1990)
|
| | Principal Occupation During Past 5 Years:
|
- President,The International Institute for Conflict Prevention and Resolution, a non- profit organization principally engaged in the development of alternatives to business litigation (Retired 2003)
- Advisor to The Elaw Forum, a consultant on managing corporate legal costs
- Advisor to John Jay Homestead (the restored home of the first U.S. Chief Justice)
- Individual Trustee of several trusts
| | Other Board Memberships and Affiliations:
|
- Director, advisor and mediator involved in several non-profit organizations, primarily engaged in domestic and international dispute resolution, and historic preservation
No. of Portfolios for which Board Member Serves: 41
———————
| | Ehud Houminer (67)
Board Member (2006)
|
| | Principal Occupation During Past 5 Years:
|
- Executive-in-Residence at the Columbia Business School, Columbia University
| | Other Board Memberships and Affiliations:
|
- Avnet Inc., an electronics distributor, Director
- International Advisory Board to the MBA Program School of Management, Ben Gurion University, Chairman
No. of Portfolios for which Board Member Serves: 67
———————
Gloria Messinger (78)
Board Member (2006)
|
| | Principal Occupation During Past 5 Years:
|
- Arbitrator for American Arbitration Association and National Association of Securities Dealers, Inc.
- Consultant in Intellectual Property
| | Other Board Memberships and Affiliations:
|
- Theater for a New Audience, Inc., Director
- Brooklyn Philharmonic, Director
No. of Portfolios for which Board Member Serves: 41
22
| | Dr. Martin Peretz (68)
Board Member (1990)
|
| | Principal Occupation During Past 5 Years:
|
- Editor-in-Chief of The New Republic Magazine
- Lecturer in Social Studies at Harvard University (1965-2002)
- Director of TheStreet.com, a financial information service on the web
| | Other Board Memberships and Affiliations:
|
- American Council of Trustees and Alumni, Director
- Pershing Square Capital Management, Advisor
- Montefiore Ventures, General Partner
- Harvard Center for Blood Research,Trustee
- Bard College,Trustee
- Board of Overseers of YIVO Institute for Jewish Research, Chairman
No. of Portfolios for which Board Member Serves: 41
———————
| | Anne Wexler (77)
Board Member (2006)
|
| | Principal Occupation During Past 5 Years:
|
- Chairman of the Wexler & Walker Public Policy Associates, consultants specializing in government relations and public affairs from January 1981 to present
| | Other Board Memberships and Affiliations:
|
- Wilshire Mutual Funds (5 funds), Director
- The Community Foundation for the National Capital Region, Director
- Member of the Council of Foreign Relations
- Member of the National Park Foundation
No. of Portfolios for which Board Member Serves: 50
———————
Once elected all Board Members serve for an indefinite term, but achieve Emeritus status upon reaching age 80.The address of the Board Members and Officers is in c/o The Dreyfus Corporation, 200 Park Avenue, New York, New York 10166.Additional information about the Board Members is available in the fund’s Statement of Additional Information which can be obtained from Dreyfus free of charge by calling this toll free number: 1-800-554-4611.
John M. Fraser, Jr., Emeritus Board Member
Rosalind G. Jacobs, Emeritus Board Member
Dr. Paul A. Marks, Emeritus Board Member
|
The Portfolio 23
OFFICERS OF THE FUND (Unaudited)
24
The Portfolio 25

Telephone 1-800-554-4611 or 516-338-3300
Mail The Dreyfus Family of Funds, 144 Glenn Curtiss Boulevard, Uniondale, NY 11556-0144
Attn: Investments Division
|
The portfolio files its complete schedule of portfolio holdings with the Securities and Exchange Commission (“SEC”) for the first and third quarters of each fiscal year on Form N-Q. The portfolio’s Forms N-Q are available on the SEC’s website at http://www.sec.gov and may be reviewed and copied at the SEC’s Public Reference Room in Washington, DC. Information on the operation of the Public Reference Room may be obtained by calling 1-202-551-8090.
Information regarding how the portfolio voted proxies relating to portfolio securities for the 12-month period ended June 30, 2007, is available on the SEC’s website at http://www.sec.gov and without charge, upon request, by calling 1-800-645-6561.
| © 2008 MBSC Securities Corporation |

The views expressed in this report reflect those of the portfolio manager only through the end of the period covered and do not necessarily represent the views of Dreyfus or any other person in the Dreyfus organization.Any such views are subject to change at any time based upon market or other conditions and Dreyfus disclaims any responsibility to update such views. These views may not be relied on as investment advice and, because investment decisions for a Dreyfus portfolio are based on numerous factors, may not be relied on as an indication of trading intent on behalf of any Dreyfus portfolio.
Not FDIC-Insured • Not Bank-Guaranteed • May Lose Value
| | | Contents |
| |
| | | THE PORTFOLIO |
| |
|
| 2 | | A Letter from the CEO |
| 3 | | Discussion of Performance |
| 6 | | Portfolio Performance |
| 8 | | Understanding Your Portfolio’s Expenses |
| 8 | | Comparing Your Portfolio’s Expenses |
| | | With Those of Other Funds |
| 9 | | Statement of Investments |
| 28 | | Statement of Financial Futures |
| 29 | | Statement of Assets and Liabilities |
| 30 | | Statement of Operations |
| 31 | | Statement of Changes in Net Assets |
| 33 | | Financial Highlights |
| 35 | | Notes to Financial Statements |
| 47 | | Report of Independent Registered |
| | | Public Accounting Firm |
| 48 | | Board Members Information |
| 51 | | Officers of the Fund |
| FOR MORE INFORMATION |
|
| | | Back Cover |
The Portfolio
| Dreyfus Variable Investment Fund, |
| Quality Bond Portfolio |

A LETTER FROM THE CEO
Dear Shareholder:
We are pleased to present this annual report for Dreyfus Variable Investment Fund, Quality Bond Portfolio, covering the 12-month period from January 1, 2007, through December 31, 2007.
Looking back, 2007 was a year of significant change for U.S. fixed-income markets.Turmoil in the sub-prime mortgage market, declining housing values and soaring energy prices sparked a “flight to quality” among investors in which prices of U.S.Treasury securities surged higher while virtually all other domestic fixed-income sectors tumbled, including highly rated corporate bonds. Still, strong performance over the first half of the year helped most fixed-income indices post positive absolute returns for the year. During the second half of the year, the Fed took action to forestall a potential recession by implementing several short-term interest rate cuts. By the end of 2007, these actions contributed to a relatively wider yield curve along the bond market’s maturity spectrum.
The turbulence of 2007 reinforced a central principle of successful investing: diversification. Investors with broad exposure to the world’s stock and bond markets were better protected from the full impact of market volatility in areas that, earlier in the year, were among the bright spots at the time. As we look ahead, we believe that now is the perfect time to meet with your financial advisor, who can help you plan and diversify your investment portfolio in a way that manages the potential opportunities and risks that may continue to arise in 2008.
For information about how the portfolio performed during the reporting period, as well as market perspectives, we have provided a Discussion of Performance given by the Portfolio Manager.
Thank you for your continued confidence and support.
Thomas F. Eggers
Chief Executive Officer
The Dreyfus Corporation
January 15, 2008
|

DISCUSSION OF PERFORMANCE
For the period of January 1, 2007, through December 31, 2007, as provided by Catherine Powers, Portfolio Manager
Portfolio and Market Performance Overview
While the U.S. bond market was relatively stable over the first half of the reporting period, the second half saw heightened market volatility as a credit crisis originating in the sub-prime mortgage sector sparked a “flight to quality” among investors. U.S. Treasury securities gained value in this environment, but other types of bonds declined in value. The portfolio underperformed its benchmark, due to sub-par performance among its holdings of corporate bonds, mortgage-backed securities and asset-backed securities as well as its underweight position in U.S.Treasuries relative to its benchmark.
For the 12-month period ended December 31, 2007, Dreyfus Variable Investment Fund, Quality Bond Portfolio’s Initial shares achieved a total return of 3.54%, and its Service shares achieved a total return of 3.31% ..1 The Lehman Brothers U.S. Aggregate Index (the “Index”), the portfolio’s benchmark, achieved a total return of 6.97% for the same period.2
The Portfolio’s Investment Approach
The portfolio seeks to maximize total return consisting of capital appreciation and current income.To achieve this objective, the portfolio normally invests at least 80% of its assets in bonds, including corporate bonds, mortgage-related securities, collateralized mortgage obligations and asset-backed securities that, when purchased, are A-rated or better or what we believe are the unrated equivalent, and in securities issued or guaranteed by the U.S. government or its agencies or its instrumentalities.The portfolio may also invest up to 10% of its net assets in non-dollar-denominated foreign securities and up to 20% of its assets in the securities of foreign issues collectively.
Fixed-Income Securities Produced Mixed Results in 2007
Most sectors of the U.S. bond market produced positive absolute returns in 2007, but those results were achieved in a more challenging market environment over the second half of the year, as a sharp
The Portfolio 3
DISCUSSION OF PERFORMANCE (continued)
|
increase in delinquencies and defaults among homeowners with sub-prime mortgages resulted in concerns that consumer spending and economic growth might slow. By July, weakness in the sub-prime lending sector had spread to other areas of the bond market, causing a flight to quality among fixed-income investors that created difficult liquidity conditions in a number of market sectors. Some highly leveraged institutional investors were forced to sell their more liquid and creditworthy bonds in order to raise cash for redemption requests and margin calls, which put downward pressure on prices of securities in market sectors with little or no exposure to sub-prime loans.
In an effort to promote greater liquidity and forestall a possible recession, the Federal Reserve Board (the “Fed”) reduced key short-term interest rates in August, September, October and December and pumped liquidity into the banking system. However, mounting losses among major financial institutions and intensifying concerns regarding a possible recession continued to weigh heavily on the bond market. Nonetheless, U.S. government securities fared relatively well during the flight to quality, with U.S. Treasury securities posting attractive gains. In contrast, higher yielding bonds, including most corporate-backed and mortgage-backed securities, lost value over the second half of the year as investors reassessed their attitudes toward risk.
Non-Treasury Holdings Hurt the Portfolio’s Performance Relative to the Benchmark
Strategies that had supported the portfolio’s performance relative to its benchmark in previous reporting periods proved to be less successful during the credit crunch. As the crisis unfolded, the portfolio’s relatively light holdings of U.S. Treasuries and overweight position in shorter-duration corporate bonds and asset-backed securities proved to be a drag on its relative performance. We had adopted a defensive investment posture with regard to investment-grade corporate bonds, including an emphasis on financial services companies that tend to be less vulnerable to risks associated with leveraged buyouts. However, this focus detracted from relative performance during the credit crisis. While the portfolio’s holdings of asset-backed securities were composed primarily of AAA-rated bonds and fixed-rate mortgages, their
underperformance had a negative impact on the portfolio’s returns. A modest position in high yield bonds also lagged the averages.
On a more positive note, the portfolio’s underweight exposure to mortgage-backed securities helped shield it from some of the sector’s weakness.The portfolio’s “bulleted” yield curve strategy benefited returns as the Fed cut interest rates and the yield curve steepened.The portfolio’s modest holdings of non-dollar securities and the purchase of call options on U.S.Treasuries also contributed positively to performance.
Maintaining Caution in a Changing Market
Despite the Fed’s attempts to calm the markets, uncertainty has persisted with regard to the future impact on the U.S. economy of elevated energy prices, the housing recession, ongoing sub-prime turmoil and mounting bank losses. Recent price dislocations have created opportunities to purchase high-quality corporate securities and other short-duration assets at what we believe to be more attractive valuations. However, we have not yet done so, as we currently prefer to maintain a cautious investment posture until the economic and market outlooks become clearer. In our view,these are prudent strategies in today’s uncertain market environment.
January 15, 2008
| | | The portfolio is only available as a funding vehicle under variable life insurance policies or variable |
| | | annuity contracts issued by insurance companies. Individuals may not purchase shares of the |
| | | portfolio directly. A variable annuity is an insurance contract issued by an insurance company that |
| | | enables investors to accumulate assets on a tax-deferred basis for retirement or other long-term |
| | | goals.The investment objective and policies of Dreyfus Variable Investment Fund, Quality Bond |
| | | Portfolio may be similar to other funds/portfolios managed or advised by Dreyfus. However, the |
| | | investment results of the portfolio may be higher or lower than, and may not be comparable to, |
| | | those of any other Dreyfus fund/portfolio. |
| 1 | | Total return includes reinvestment of dividends and any capital gains paid. Past performance is no |
| | | guarantee of future results. Share price and investment return fluctuate such that upon redemption, |
| | | portfolio shares may be worth more or less than their original cost.The portfolio’s performance does |
| | | not reflect the deduction of additional charges and expenses imposed in connection with investing |
| | | in variable insurance contracts, which will reduce returns. Return figures provided reflect the |
| | | absorption of certain portfolio expenses by The Dreyfus Corporation pursuant to an agreement in |
| | | effect through June 30, 2007, at which time it was terminated. Had these expenses not been |
| | | absorbed, the portfolio’s returns would have been lower. |
| 2 | | SOURCE: LIPPER INC. — Reflects reinvestment of dividends and, where applicable, capital |
| | | gain distributions.The Lehman Brothers U.S. Aggregate Index is a widely accepted, unmanaged |
| | | total return index of corporate, U.S. government and U.S. government agency debt instruments, |
| | | mortgage-backed securities and asset-backed securities with an average maturity of 1-10 years.The |
| | | Index does not include fees and expenses to which the portfolio is subject. |
The Portfolio 5
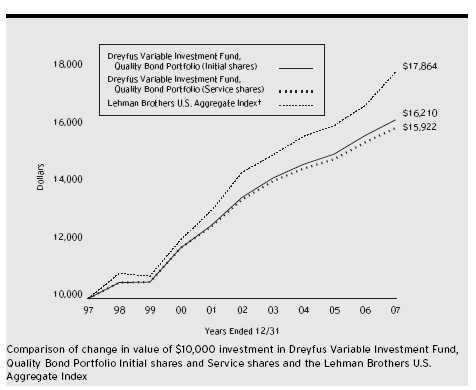
| Average Annual Total Returns | | as of 12/31/07 | | | | | | |
| | | | | 1 Year | | 5 Years | | 10 Years |
| |
| |
| |
| |
|
| Initial shares | | | | 3.54% | | 3.71% | | 4.95% |
| Service shares | | | | 3.31% | | 3.46% | | 4.76% |
| The data for Service shares primarily represents the results of Initial shares for the period prior to December 31, |
| 2000 (inception date of Service shares). Actual Service shares’ average annual total return and hypothetical |
| growth results would have been lower. See notes below. |
| † Source: Lipper Inc. |
| Past performance is not predictive of future performance.The portfolio’s performance shown in the graph and table does not |
| reflect the deduction of taxes that a shareholder would pay on portfolio distributions or the redemption of portfolio shares. |
| The portfolio’s performance does not reflect the deduction of additional charges and expenses imposed in |
| connection with investing in variable insurance contracts which will reduce returns. |
| The above graph compares a $10,000 investment made in Initial and Service shares of Dreyfus Variable Investment |
| Fund, Quality Bond Portfolio on 12/31/97 to a $10,000 investment made in the Lehman Brothers U.S.Aggregate |
| Index (the “Index”) on that date. |
6
| The portfolio’s Initial shares are not subject to a Rule 12b-1 fee.The portfolio’s Service shares are subject to a 0.25% |
| annual Rule 12b-1 fee.The performance figures for Service shares reflect the performance of the portfolio’s Initial shares |
| from their inception date through December 30, 2000, and the performance of the portfolio’s Service shares from |
| December 31, 2000 (inception date of Service shares) to December 31, 2007 (blended performance figures).The |
| blended performance figures have not been adjusted to reflect the higher operating expenses of the Service shares. If these |
| expenses had been reflected, the blended performance figures would have been lower. All dividends and capital gain |
| distributions are reinvested. |
| The portfolio’s performance shown in the line graph takes into account all applicable portfolio fees and expenses.The Index |
| is a widely accepted, unmanaged index of corporate, U.S. government and U.S. government agency debt instruments, |
| mortgage-backed securities and asset-backed securities. Unlike a mutual fund, the Index is not subject to charges, fees and |
| other expenses. Investors cannot invest directly in any index. Further information relating to portfolio performance, |
| including expense reimbursements, if applicable, is contained in the Financial Highlights section of the prospectus and |
| elsewhere in this report. |
The Portfolio 7
UNDERSTANDING YOUR
PORTFOLIO’S EXPENSES (Unaudited)
As a mutual fund investor,you pay ongoing expenses,such as management fees and other expenses.Using the information below,you can estimate how these expenses affect your investment and compare them with the expenses of other funds.You also may pay one-time transaction expenses,including sales charges (loads) and redemption fees, which are not shown in this section and would have resulted in higher total expenses. For more information, see your portfolio’s prospectus or talk to your financial adviser.
Review your portfolio’s expenses
The table below shows the expenses you would have paid on a $1,000 investment in Dreyfus Variable Investment Fund, Quality Bond Portfolio from July 1, 2007 to December 31, 2007. It also shows how much a $1,000 investment would be worth at the close of the period, assuming actual returns and expenses.
| Expenses and Value of a $1,000 Investment | | |
| assuming actual returns for the six months ended December 31, 2007 |
| | | Initial Shares | | Service Shares |
| |
| |
|
| Expenses paid per $1,000 † | | $ 3.93 | | $ 5.21 |
| Ending value (after expenses) | | $1,026.20 | | $1,025.10 |
COMPARING YOUR PORTFOLIO’S EXPENSES WITH THOSE OF OTHER FUNDS (Unaudited)
Using the SEC’s method to compare expenses
The Securities and Exchange Commission (SEC) has established guidelines to help investors assess fund expenses. Per these guidelines, the table below shows your portfolio’s expenses based on a $1,000 investment, assuming a hypothetical 5% annualized return. You can use this information to compare the ongoing expenses (but not transaction expenses or total cost) of investing in the portfolio with those of other funds. All mutual fund shareholder reports will provide this information to help you make this comparison. Please note that you cannot use this information to estimate your actual ending account balance and expenses paid during the period.
| Expenses and Value of a $1,000 Investment |
| assuming a hypothetical 5% annualized return for the six months ended December 31, 2007 |
| | | Initial Shares | | Service Shares |
| |
| |
|
| Expenses paid per $1,000 † | | $ 3.92 | | $ 5.19 |
| Ending value (after expenses) | | $1,021.32 | | $1,020.06 |
† Expenses are equal to the portfolio’s annualized expense ratio of .77% for Initial shares and 1.02% for Service shares, multiplied by the average account value over the period, multiplied by 184/365 (to reflect the one-half year period).
| | STATEMENT OF INVESTMENTS
December 31, 2007
|
| | | Coupon | | Maturity | | Principal | | |
| Bonds and Notes—118.7% | | Rate (%) | | Date | | Amount ($) | | Value ($) |
| |
| |
| |
| |
|
| Aerospace & Defense—.1% | | | | | | | | |
| Raytheon, | | | | | | | | |
| Sr. Unscd. Notes | | 5.50 | | 11/15/12 | | 210,000 | | 218,883 |
| Agricultural—.6% | | | | | | | | |
| Philip Morris, | | | | | | | | |
| Sr. Unscd. Notes | | 7.75 | | 1/15/27 | | 805,000 | | 1,040,013 |
| Asset-Backed Ctfs./ | | | | | | | | |
| Auto Receivables—2.6% | | | | | | | | |
| Americredit Prime Automobile | | | | | | | | |
| Receivables Trust, | | | | | | | | |
| Ser. 2007-1, Cl. E | | 6.96 | | 3/8/16 | | 270,000 a | | 245,530 |
| Capital One Auto Finance Trust, | | | | | | | | |
| Ser. 2007-C, Cl. A3A | | 5.13 | | 4/16/12 | | 895,000 | | 894,824 |
| Ford Credit Auto Owner Trust, | | | | | | | | |
| Ser. 2005-A, Cl. A4 | | 3.72 | | 10/15/09 | | 607,509 | | 604,490 |
| Ford Credit Auto Owner Trust, | | | | | | | | |
| Ser. 2005-B, Cl. B | | 4.64 | | 4/15/10 | | 650,000 | | 650,139 |
| Ford Credit Auto Owner Trust, | | | | | | | | |
| Ser 2005-C, Cl. C | | 4.72 | | 2/15/11 | | 240,000 | | 240,695 |
| Ford Credit Auto Owner Trust, | | | | | | | | |
| Ser. 2006-C, Cl. C | | 5.47 | | 9/15/12 | | 215,000 | | 211,567 |
| Ford Credit Auto Owner Trust, | | | | | | | | |
| Ser. 2007-A, Cl. D | | 7.05 | | 12/15/13 | | 250,000 a | | 239,197 |
| Hyundai Auto Receivables Trust, | | | | | | | | |
| Ser. 2007-A, Cl. A3A | | 5.04 | | 1/17/12 | | 300,000 | | 301,542 |
| Wachovia Auto Loan Owner Trust, | | | | | | | | |
| Ser. 2007-1, Cl. D | | 5.65 | | 2/20/13 | | 610,000 | | 573,449 |
| WFS Financial Owner Trust, | | | | | | | | |
| Ser. 2005-2, Cl. B | | 4.57 | | 11/19/12 | | 325,000 | | 324,844 |
| | | | | | | | | 4,286,277 |
| Asset-Backed Ctfs./Credit Cards—3.4% | | | | | | |
| American Express Credit Account | | | | | | | | |
| Master Trust, Ser. 2007-6, Cl. C | | 5.42 | | 1/15/13 | | 1,400,000 a,b | | 1,348,408 |
| BA Credit Card Trust, | | | | | | | | |
| Ser. 2007-C1, Cl. C1 | | 5.32 | | 6/15/14 | | 1,725,000 b | | 1,604,537 |
| Citibank Credit Card Issuance | | | | | | | | |
| Trust, Ser. 2006-C4, Cl. C4 | | 5.47 | | 1/9/12 | | 2,675,000 b | | 2,585,601 |
| | | | | | | | | 5,538,546 |
The Portfolio 9
| | STATEMENT OF INVESTMENTS (continued)
|
| | | Coupon | | Maturity | | Principal | | |
| Bonds and Notes (continued) | | Rate (%) | | Date | | Amount ($) | | Value ($) |
| |
| |
| |
| |
|
| Asset-Backed Ctfs./ | | | | | | | | |
| Home Equity Loans—3.7% | | | | | | | | |
| Accredited Mortgage Loan Trust, | | | | | | | | |
| Ser. 2006-1, Cl. A1 | | 4.93 | | 4/25/36 | | 72,089 b | | 71,849 |
| Ameriquest Mortgage Securities, | | | | | | | | |
| Ser. 2003-11, Cl. AF6 | | 5.14 | | 1/25/34 | | 525,000 b | | 495,701 |
| Carrington Mortgage Loan Trust, | | | | | | | | |
| Ser. 2006-RFC1, Cl. A1 | | 4.91 | | 5/25/36 | | 118,686 b | | 117,656 |
| Centex Home Equity, | | | | | | | | |
| Ser. 2006-A, Cl. AV1 | | 4.92 | | 6/25/36 | | 37,884 b | | 37,744 |
| Citicorp Residential Mortgage | | | | | | | | |
| Securities, Ser. 2006-2, Cl. A2 | | 5.56 | | 9/25/36 | | 950,000 b | | 938,429 |
| Citicorp Residential Mortgage | | | | | | | | |
| Securities, Ser. 2007-2, Cl. A1A | | 5.98 | | 6/25/37 | | 995,195 b | | 990,886 |
| Citicorp Residential Mortgage | | | | | | | | |
| Securities, Ser. 2007-2, Cl. M8 | | 7.00 | | 6/25/37 | | 100,000 b | | 18,642 |
| Citicorp Residential Mortgage | | | | | | | | |
| Securities, Ser. 2007-2, Cl. M9 | | 7.00 | | 6/25/37 | | 350,000 b | | 52,500 |
| Credit-Based Asset Servicing | | | | | | | | |
| and Securitization, | | | | | | | | |
| Ser. 2006-CB2,Cl. AF1 | | 5.72 | | 12/25/36 | | 36,134 b | | 35,850 |
| First NLC Trust, | | | | | | | | |
| Ser. 2005-3, Cl. AV2 | | 5.10 | | 12/25/35 | | 114,388 b | | 114,250 |
| GSAA Trust, | | | | | | | | |
| Ser. 2006-7, Cl. AV1 | | 4.95 | | 3/25/46 | | 301,416 b | | 300,956 |
| GSAMP Trust, | | | | | | | | |
| Ser. 2006-S4, Cl. A1 | | 4.96 | | 5/25/36 | | 152,385 b | | 122,995 |
| JP Morgan Mortgage Acquisition, | | | | | | | | |
| Ser. 2006-CW1, Cl. A2 | | 4.91 | | 5/25/36 | | 87,559 b | | 86,908 |
| JP Morgan Mortgage Acquisition, | | | | | | | | |
| Ser. 2007-HE1, Cl. AF1 | | 4.97 | | 4/1/37 | | 784,040 b | | 769,189 |
| Morgan Stanley ABS Capital I, | | | | | | | | |
| Ser. 2006-HE3, Cl. A2A | | 4.91 | | 4/25/36 | | 79,655 b | | 79,084 |
| Morgan Stanley Mortgage Loan | | | | | | | | |
| Trust, Ser. 2006-15XS, Cl. A6B | | 5.83 | | 11/25/36 | | 285,000 b | | 267,296 |
| Newcastle Mortgage Securities | | | | | | | | |
| Trust, Ser. 2006-1, Cl. A1 | | 4.94 | | 3/25/36 | | 140,863 b | | 139,813 |
| Ownit Mortgage Loan Asset Backed | | | | | | | | |
| Certificates, Ser. 2006-1, Cl. AF1 | | 5.42 | | 12/25/36 | | 339,180 b | | 334,056 |
| | | Coupon | | Maturity | | Principal | | |
| Bonds and Notes (continued) | | Rate (%) | | Date | | Amount ($) | | Value ($) |
| |
| |
| |
| |
|
| Asset-Backed Ctfs./ | | | | | | | | |
| Home Equity Loans (continued) | | | | | | |
| Renaissance Home Equity Loan | | | | | | | | |
| Trust, Ser. 2006-2, Cl. AF1 | | 6.00 | | 8/25/36 | | 92,589 b | | 92,195 |
| Residential Asset Securities, | | | | | | | | |
| Ser. 2006-EMX4, Cl. A1 | | 4.91 | | 6/25/36 | | 188,248 b | | 185,630 |
| Residential Asset Securities, | | | | | | | | |
| Ser. 2003-KS7, Cl. MI3 | | 5.75 | | 9/25/33 | | 137,207 b | | 103,726 |
| Residential Funding Mortgage | | | | | | | | |
| Securities II, Ser. 2006-HSA2, | | | | | | | | |
| Cl. AI2 | | 5.50 | | 3/25/36 | | 140,000 b | | 129,170 |
| Soundview Home Equity Loan Trust, | | | | | | |
| Ser. 2005-B, Cl. M3 | | 5.83 | | 5/25/35 | | 126,768 b | | 74,535 |
| Sovereign Commercial Mortgage | | | | | | | | |
| Securities Trust, | | | | | | | | |
| Ser. 2007-C1, Cl. D | | 5.78 | | 7/22/30 | | 270,000 a,b | | 216,240 |
| Specialty Underwriting & | | | | | | | | |
| Residential Finance, | | | | | | | | |
| Ser. 2006-BC2, Cl. A2A | | 4.93 | | 2/25/37 | | 259,058 b | | 257,419 |
| Wells Fargo Home Equity Trust, | | | | | | | | |
| Ser. 2006-1, Cl. A1 | | 4.90 | | 5/25/36 | | 39,040 b | | 38,958 |
| | | | | | | | | 6,071,677 |
| Asset-Backed Ctfs./ | | | | | | | | |
| Manufactured Housing—.2% | | | | | | | | |
| Green Tree Financial, | | | | | | | | |
| Ser. 1994-7, Cl. M1 | | 9.25 | | 3/15/20 | | 249,576 | | 258,725 |
| Origen Manufactured Housing, | | | | | | | | |
| Ser. 2005-B, Cl. A1 | | 5.25 | | 2/15/14 | | 112,842 | | 112,672 |
| | | | | | | | | 371,397 |
| Automobile Manufacturers—.1% | | | | | | |
| Daimler Finance North America, | | | | | | | | |
| Notes | | 4.88 | | 6/15/10 | | 175,000 | | 174,322 |
| Banks—8.0% | | | | | | | | |
| Barclays Bank, | | | | | | | | |
| Sub. Notes | | 5.93 | | 9/29/49 | | 155,000 a,b | | 144,469 |
| Barclays Bank, | | | | | | | | |
| Jr. Sub. Bonds | | 7.43 | | 9/29/49 | | 100,000 a,b | | 104,098 |
| Chevy Chase Bank, | | | | | | | | |
| Sub. Notes | | 6.88 | | 12/1/13 | | 260,000 | | 248,950 |
The Portfolio 11
| | STATEMENT OF INVESTMENTS (continued)
|
| | | Coupon | | Maturity | | Principal | | |
| Bonds and Notes (continued) | | Rate (%) | | Date | | Amount ($) | | Value ($) |
| |
| |
| |
| |
|
| Banks (continued) | | | | | | | | |
| Chuo Mitsui Trust & Banking, | | | | | | | | |
| Jr. Sub. Notes | | 5.51 | | 12/29/49 | | 245,000 a,b | | 225,604 |
| Colonial Bank, | | | | | | | | |
| Sub. Notes | | 6.38 | | 12/1/15 | | 500,000 | | 494,915 |
| Colonial Bank, | | | | | | | | |
| Sub. Notes | | 8.00 | | 3/15/09 | | 140,000 | | 144,709 |
| First Union, | | | | | | | | |
| Sub. Notes | | 6.38 | | 1/15/09 | | 610,000 | | 619,967 |
| Glitnir Banki, | | | | | | | | |
| Sub. Notes | | 6.69 | | 6/15/16 | | 270,000 a,b | | 272,201 |
| ICICI Bank, | | | | | | | | |
| Bonds | | 5.79 | | 1/12/10 | | 250,000 a,b | | 246,892 |
| M&T Bank, | | | | | | | | |
| Sr. Unscd. Bonds | | 5.38 | | 5/24/12 | | 190,000 | | 189,682 |
| Manufacturers & Traders Trust, | | | | | | | | |
| Sub. Notes | | 5.59 | | 12/28/20 | | 275,000 b | | 255,327 |
| Marshall & Ilsley Bank, | | | | | | | | |
| Sub. Notes, Ser. BN | | 5.40 | | 12/4/12 | | 1,750,000 b | | 1,652,520 |
| NB Capital Trust IV, | | | | | | | | |
| Gtd. Cap. Secs. | | 8.25 | | 4/15/27 | | 620,000 | | 643,870 |
| Northern Rock, | | | | | | | | |
| Sub. Notes | | 5.60 | | 4/29/49 | | 535,000 a,b | | 332,098 |
| Regions Financial, | | | | | | | | |
| Sr. Unscd. Notes | | 4.98 | | 8/8/08 | | 825,000 b | | 823,800 |
| Resona Bank, | | | | | | | | |
| Notes | | 5.85 | | 9/29/49 | | 255,000 a,b | | 237,440 |
| Royal Bank of Scotland Group, | | | | | | | | |
| Jr. Sub. Bonds | | 6.99 | | 10/29/49 | | 830,000 a,b | | 828,949 |
| Shinsei Finance Cayman, | | | | | | | | |
| Jr. Sub. Bonds | | 6.42 | | 1/29/49 | | 475,000 a,b | | 403,899 |
| Sovereign Bancorp, | | | | | | | | |
| Sr. Notes | | 4.80 | | 9/1/10 | | 525,000 b | | 523,363 |
| Sovereign Bancorp, | | | | | | | | |
| Sr. Unscd. Notes | | 5.11 | | 3/23/10 | | 370,000 b | | 367,346 |
| SunTrust Preferred Capital I, | | | | | | | | |
| Bank Gtd. Notes | | 5.85 | | 12/31/49 | | 435,000 b | | 384,213 |
| Wachovia Bank, | | | | | | | | |
| Sub. Notes | | 5.00 | | 8/15/15 | | 495,000 | | 468,820 |
| Washington Mutual, | | | | | | | | |
| Sr. Unscd. Notes | | 5.54 | | 1/15/10 | | 475,000 b | | 441,809 |
| | | Coupon | | Maturity | | Principal | | |
| Bonds and Notes (continued) | | Rate (%) | | Date | | Amount ($) | | Value ($) |
| |
| |
| |
| |
|
| Banks (continued) | | | | | | | | |
| Wells Fargo & Co., | | | | | | | | |
| Sub. Notes | | 6.38 | | 8/1/11 | | 290,000 | | 303,373 |
| Wells Fargo Bank, | | | | | | | | |
| Sub. Notes | | 7.55 | | 6/21/10 | | 1,910,000 | | 2,042,569 |
| Zions Bancorporation, | | | | | | | | |
| Sr. Unscd. Notes | | 5.36 | | 4/15/08 | | 365,000 b | | 362,363 |
| Zions Bancorporation, | | | | | | | | |
| Sub. Notes | | 6.00 | | 9/15/15 | | 465,000 | | 452,160 |
| | | | | | | | | 13,215,406 |
| Building & Construction—.1% | | | | | | | | |
| Masco, | | | | | | | | |
| Sr. Unscd. Notes | | 5.43 | | 3/12/10 | | 240,000 b | | 231,945 |
| Chemicals—.6% | | | | | | | | |
| ICI Wilmington, | | | | | | | | |
| Gtd. Notes | | 4.38 | | 12/1/08 | | 425,000 | | 424,508 |
| Lubrizol, | | | | | | | | |
| Gtd. Notes | | 4.63 | | 10/1/09 | | 445,000 | | 447,078 |
| Rohm & Haas, | | | | | | | | |
| Unsub. Notes | | 5.60 | | 3/15/13 | | 145,000 | | 150,839 |
| | | | | | | | | 1,022,425 |
| Commercial & | | | | | | | | |
| Professional Services—.4% | | | | | | | | |
| ERAC USA Finance, | | | | | | | | |
| Notes | | 5.23 | | 4/30/09 | | 110,000 a,b | | 109,539 |
| ERAC USA Finance, | | | | | | | | |
| Bonds | | 5.60 | | 5/1/15 | | 310,000 a | | 295,211 |
| ERAC USA Finance, | | | | | | | | |
| Notes | | 7.95 | | 12/15/09 | | 210,000 a | | 220,472 |
| | | | | | | | | 625,222 |
| Commercial Mortgage | | | | | | | | |
| Pass-Through Ctfs.—9.9% | | | | | | | | |
| Banc of America Commercial | | | | | | | | |
| Mortgage, Ser. 2005-2, Cl. A2 | | 4.25 | | 7/10/43 | | 812,817 | | 811,638 |
| Banc of America Commercial | | | | | | | | |
| Mortgage, Ser. 2002-2, Cl. A3 | | 5.12 | | 7/11/43 | | 190,000 | | 192,407 |
| Bayview Commercial Asset Trust, | | | | | | | | |
| Ser. 2006-SP1, Cl. A1 | | 5.14 | | 4/25/36 | | 90,458 a,b | | 87,673 |
| Bayview Commercial Asset Trust, | | | | | | | | |
| Ser. 2004-1, Cl. A | | 5.23 | | 4/25/34 | | 160,965 a,b | | 156,664 |
The Portfolio 13
| | STATEMENT OF INVESTMENTS (continued)
|
| | | Coupon | | Maturity | | Principal | | |
| Bonds and Notes (continued) | | Rate (%) | | Date | | Amount ($) | | Value ($) |
| |
| |
| |
| |
|
| Commercial Mortgage | | | | | | | | |
| Pass-Through Ctfs. (continued) | | | | | | | | |
| Bayview Commercial Asset Trust, | | | | | | | | |
| Ser. 2003-2, Cl. A | | 5.45 | | 12/25/33 | | 162,158 a,b | | 160,120 |
| Bayview Commercial Asset Trust, | | | | | | | | |
| Ser. 2006-2A, Cl. B2 | | 6.34 | | 7/25/36 | | 406,995 a,b | | 284,896 |
| Bayview Commercial Asset Trust, | | | | | | | | |
| Ser. 2006-1A, Cl. B2 | | 6.57 | | 4/25/36 | | 100,790 a,b | | 67,529 |
| Bayview Commercial Asset Trust, | | | | | | | | |
| Ser. 2005-3A, Cl. B3 | | 7.87 | | 11/25/35 | | 107,581 a,b | | 75,306 |
| Bayview Commercial Asset Trust, | | | | | | | | |
| Ser. 2005-4A, Cl. B3 | | 8.37 | | 1/25/36 | | 79,215 a,b | | 60,773 |
| Bear Stearns Commercial Mortgage | | | | | | | | |
| Securities, Ser. 2006-PW14, | | | | | | | | |
| Cl. AAB | | 5.17 | | 12/11/38 | | 605,000 | | 601,647 |
| Bear Stearns Commercial Mortgage | | | | | | | | |
| Securities, Ser. 2006-PW13, Cl. A3 | | 5.52 | | 9/11/41 | | 200,000 | | 201,496 |
| Bear Stearns Commercial Mortgage | | | | | | | | |
| Securities, Ser. 2006-T24, Cl. AAB | | 5.53 | | 10/12/41 | | 500,000 | | 506,094 |
| Bear Stearns Commercial Mortgage | | | | | | | | |
| Securities, Ser. 2006-PW12, | | | | | | | | |
| Cl. AAB | | 5.69 | | 9/11/38 | | 430,000 b | | 440,999 |
| Capco America Securitization, | | | | | | | | |
| Ser. 1998-D7, Cl. A1B | | 6.26 | | 10/15/30 | | 405,550 | | 407,565 |
| Citigroup/Deutsche Bank Commercial | | | | | | | | |
| Mortgage Trust, Ser. 2006-CD2, | | | | | | | | |
| Cl. A2 | | 5.41 | | 1/15/46 | | 340,000 | | 342,811 |
| Credit Suisse/Morgan Stanley | | | | | | | | |
| Commercial Mortgage Certificates, | | | | | | | | |
| Ser. 2006-HC1A, Cl. A1 | | 5.22 | | 5/15/23 | | 420,861 a,b | | 414,674 |
| Crown Castle Towers, | | | | | | | | |
| Ser. 2006-1A, Cl. B | | 5.36 | | 11/15/36 | | 190,000 a | | 186,561 |
| Crown Castle Towers, | | | | | | | | |
| Ser. 2006-1A, Cl. C | | 5.47 | | 11/15/36 | | 505,000 a | | 491,658 |
| Crown Castle Towers, | | | | | | | | |
| Ser. 2005-1A, Cl. D | | 5.61 | | 6/15/35 | | 240,000 a | | 237,742 |
| Crown Castle Towers, | | | | | | | | |
| Ser. 2006-1A, Cl. D | | 5.77 | | 11/15/36 | | 350,000 a | | 335,412 |
| Global Signal Trust, | | | | | | | | |
| Ser. 2006-1, Cl. D | | 6.05 | | 2/15/36 | | 340,000 a | | 331,153 |
| Global Signal Trust, | | | | | | | | |
| Ser. 2006-1, Cl. E | | 6.50 | | 2/15/36 | | 170,000 a | | 165,376 |
| | | Coupon | | Maturity | | Principal | | | | |
| Bonds and Notes (continued) | | Rate (%) | | Date | | Amount ($) | | Value ($) |
| |
| |
| |
| |
|
| Commercial Mortgage | | | | | | | | | | |
| Pass-Through Ctfs. (continued) | | | | | | | | | | |
| Goldman Sachs Mortgage Securities | | | | | | | | | | |
| Corporation II, Ser. 2007-EOP, Cl. B | | 5.50 | | 3/6/20 | | 1,065,000 a,b | | | | 1,020,367 |
| Goldman Sachs Mortgage Securities | | | | | | | | | | |
| Corporation II, Ser. 2007-EOP, Cl. E | | 5.69 | | 3/6/20 | | 395,000 a,b | | | | 379,243 |
| Goldman Sachs Mortgage Securities | | | | | | | | | | |
| Corporation II, Ser. 2007-EOP, Cl. K | | 6.30 | | 3/6/20 | | 225,000 a,b | | | | 204,554 |
| JP Morgan Chase Commercial | | | | | | | | | | |
| Mortgage Securities, | | | | | | | | | | |
| Ser. 2004-C1, Cl. A2 | | 4.30 | | 1/15/38 | | 340,000 | | | | 335,646 |
| JP Morgan Chase Commercial | | | | | | | | | | |
| Mortgage Securities, | | | | | | | | | | |
| Ser. 2005-LDP5, Cl. A2 | | 5.20 | | 12/15/44 | | 725,000 | | | | 727,122 |
| JP Morgan Chase Commercial | | | | | | | | | | |
| Mortgage Securities, | | | | | | | | | | |
| Ser. 2006-LDP7, Cl. ASB | | 5.88 | | 4/15/45 | | 425,000 b | | | | 439,170 |
| LB-UBS Commercial Mortgage Trust, | | | | | | | | | | |
| Ser. 2001-C3, Cl. A2 | | 6.37 | | 12/15/28 | | 610,000 | | | | 641,773 |
| Merrill Lynch Mortgage Trust, | | | | | | | | | | |
| Ser. 2005-CIP1, Cl. A2 | | 4.96 | | 7/12/38 | | 505,000 | | | | 504,260 |
| Merrill Lynch Mortgage Trust, | | | | | | | | | | |
| Ser. 2005-CKI1, Cl. A2 | | 5.22 | | 11/12/37 | | 165,000 b | | | | 165,992 |
| Merrill Lynch Mortgage Trust, | | | | | | | | | | |
| Ser. 2002-MW1, Cl. A3 | | 5.40 | | 7/12/34 | | 590,000 | | | | 599,737 |
| Morgan Stanley Capital I, | | | | | | | | | | |
| Ser. 2005-HQ5, Cl. A2 | | 4.81 | | 1/14/42 | | 515,000 | | | | 513,490 |
| Morgan Stanley Capital I, | | | | | | | | | | |
| Ser. 2006-T21, Cl. A2 | | 5.09 | | 10/12/52 | | 500,000 | | | | 500,438 |
| Morgan Stanley Capital I, | | | | | | | | | | |
| Ser. 2006-IQ12, Cl. AAB | | 5.33 | | 12/15/43 | | 385,000 | | | | 385,627 |
| Morgan Stanley Capital I, | | | | | | | | | | |
| Ser. 2007-T27, Cl. A2 | | 5.65 | | 6/13/42 | | 380,000 b | | | | 387,165 |
| Morgan Stanley Capital I, | | | | | | | | | | |
| Ser. 2006-HQ9, Cl. A3 | | 5.71 | | 7/12/44 | | 915,000 | | | | 930,767 |
| Nationslink Funding, | | | | | | | | | | |
| Ser. 1998-2, Cl. A2 | | 6.48 | | 8/20/30 | | 233,699 | | | | 233,852 |
| SBA CMBS Trust, | | | | | | | | | | |
| Ser. 2006-1A, Cl. D | | 5.85 | | 11/15/36 | | 135,000 a | | | | 128,967 |
| TIAA Seasoned Commercial Mortgage | | | | | | | | | | |
| Trust, Ser. 2007-C4, Cl. A3 | | 6.10 | | 8/15/39 | | 325,000 b | | | | 335,170 |
The Portfolio 15
| | STATEMENT OF INVESTMENTS (continued)
|
| | | Coupon | | Maturity | | Principal | | |
| Bonds and Notes (continued) | | Rate (%) | | Date | | Amount ($) | | Value ($) |
| |
| |
| |
| |
|
| Commercial Mortgage | | | | | | | | |
| Pass-Through Ctfs. (continued) | | | | | | |
| Washington Mutual Commercial | | | | | | | | |
| Mortgage Securities Trust, | | | | | | | | |
| Ser. 2003-C1A, Cl. A | | 3.83 | | 1/25/35 | | 1,059,737 a | | 1,045,309 |
| | | | | | | | | 16,038,843 |
| Diversified Financial Services—13.6% | | | | | | |
| American Express Credit, | | | | | | | | |
| Sr. Unscd. Notes | | 5.30 | | 11/9/09 | | 315,000 b | | 309,813 |
| Ameriprise Financial, | | | | | | | | |
| Jr. Sub. Notes | | 7.52 | | 6/1/66 | | 233,000 b | | 232,389 |
| Amvescap, | | | | | | | | |
| Gtd. Notes | | 5.38 | | 2/27/13 | | 250,000 | | 239,709 |
| Bear Stearns, | | | | | | | | |
| Notes | | 3.25 | | 3/25/09 | | 1,900,000 c | | 1,840,338 |
| Bear Stearns, | | | | | | | | |
| Sr. Unscd. Notes | | 5.50 | | 8/15/11 | | 475,000 | | 469,391 |
| Boeing Capital, | | | | | | | | |
| Sr. Unscd. Notes | | 7.38 | | 9/27/10 | | 490,000 | | 526,361 |
| Capmark Financial Group, | | | | | | | | |
| Gtd. Notes | | 5.88 | | 5/10/12 | | 550,000 a | | 435,754 |
| Citigroup, | | | | | | | | |
| Sr. Unscd. Notes | | 5.30 | | 10/17/12 | | 440,000 | | 446,192 |
| Countrywide Financial, | | | | | | | | |
| Gtd. Notes | | 5.80 | | 6/7/12 | | 355,000 | | 259,561 |
| Countrywide Home Loans, | | | | | | | | |
| Gtd. Notes, Ser. L | | 3.25 | | 5/21/08 | | 250,000 c | | 225,936 |
| Credit Suisse First Boston USA, | | | | | | | | |
| Gtd. Notes | | 4.13 | | 1/15/10 | | 1,910,000 | | 1,901,798 |
| Credit Suisse Guernsey, | | | | | | | | |
| Jr. Sub. Notes | | 5.86 | | 5/29/49 | | 426,000 b | | 382,017 |
| Credit Suisse USA, | | | | | | | | |
| Gtd. Notes | | 5.50 | | 8/16/11 | | 730,000 | | 750,704 |
| Ford Motor Credit, | | | | | | | | |
| Unscd. Notes | | 7.38 | | 10/28/09 | | 965,000 | | 908,675 |
| Fuji JGB Investment, | | | | | | | | |
| Sub. Bonds | | 9.87 | | 12/29/49 | | 425,000 a,b | | 428,932 |
| General Electric Capital, | | | | | | | | |
| Sr. Notes | | 5.28 | | 10/21/10 | | 945,000 b | | 945,206 |
| Goldman Sachs Capital II, | | | | | | | | |
| Gtd. Bonds | | 5.79 | | 12/29/49 | | 315,000 b | | 280,716 |
16
| | | Coupon | | Maturity | | Principal | | |
| Bonds and Notes (continued) | | Rate (%) | | Date | | Amount ($) | | Value ($) |
| |
| |
| |
| |
|
| Diversified Financial | | | | | | | | |
| Services (continued) | | | | | | | | |
| Goldman Sachs Group, | | | | | | | | |
| Sr. Sub. Notes | | 5.63 | | 1/15/17 | | 195,000 | | 190,765 |
| HSBC Finance Capital Trust IX, | | | | | | | | |
| Gtd. Notes | | 5.91 | | 11/30/35 | | 625,000 b | | 579,188 |
| HSBC Finance, | | | | | | | | |
| Notes | | 5.50 | | 1/19/16 | | 495,000 | | 483,862 |
| Janus Capital Group, | | | | | | | | |
| Notes | | 6.25 | | 6/15/12 | | 350,000 | | 358,701 |
| Jefferies Group, | | | | | | | | |
| Sr. Unscd. Debs. | | 6.25 | | 1/15/36 | | 680,000 | | 609,710 |
| John Deere Capital, | | | | | | | | |
| Notes | | 5.16 | | 9/1/09 | | 310,000 b | | 310,726 |
| JPMorgan Chase & Co., | | | | | | | | |
| Sub. Notes | | 5.13 | | 9/15/14 | | 780,000 | | 765,609 |
| Kaupthing Bank, | | | | | | | | |
| Sub. Notes | | 7.13 | | 5/19/16 | | 225,000 a | | 206,584 |
| Lehman Brothers Holdings, | | | | | | | | |
| Notes | | 4.25 | | 1/27/10 | | 1,905,000 | | 1,872,777 |
| Lehman Brothers Holdings, | | | | | | | | |
| Sr. Notes | | 5.08 | | 8/21/09 | | 620,000 b | | 602,718 |
| Lehman Brothers Holdings, | | | | | | | | |
| Sr. Notes | | 6.00 | | 7/19/12 | | 155,000 c | | 157,982 |
| MBNA, | | | | | | | | |
| Notes | | 6.13 | | 3/1/13 | | 750,000 | | 782,353 |
| Merrill Lynch, | | | | | | | | |
| Sub. Notes | | 5.70 | | 5/2/17 | | 740,000 | | 706,539 |
| Morgan Stanley, | | | | | | | | |
| Sub. Notes | | 4.75 | | 4/1/14 | | 1,097,000 | | 1,029,088 |
| Morgan Stanley, | | | | | | | | |
| Sr. Unscd. Notes | | 5.75 | | 10/18/16 | | 1,215,000 | | 1,200,964 |
| MUFG Capital Finance 1, | | | | | | | | |
| Bank Gtd. Bonds | | 6.35 | | 7/29/49 | | 350,000 b | | 332,031 |
| Pemex Project Funding Master | | | | | | | | |
| Trust, Gtd. Notes | | 5.75 | | 3/1/18 | | 405,000 a | | 406,013 |
| SB Treasury, | | | | | | | | |
| Jr. Sub. Bonds | | 9.40 | | 12/29/49 | | 180,000 a,b | | 183,566 |
| SMFG Preferred Capital, | | | | | | | | |
| Sub. Bonds | | 6.08 | | 1/29/49 | | 525,000 a,b | | 486,266 |
The Portfolio 17
| | STATEMENT OF INVESTMENTS (continued)
|
| | | Coupon | | Maturity | | Principal | | |
| Bonds and Notes (continued) | | Rate (%) | | Date | | Amount ($) | | Value ($) |
| |
| |
| |
| |
|
| Diversified Financial | | | | | | | | |
| Services (continued) | | | | | | | | |
| Tokai Preferred Capital, | | | | | | | | |
| Bonds | | 9.98 | | 12/29/49 | | 255,000 a,b | | 258,404 |
| Windsor Financing, | | | | | | | | |
| Gtd. Notes | | 5.88 | | 7/15/17 | | 109,739 a | | 115,595 |
| | | | | | | | | 22,222,933 |
| Electric Utilities—3.3% | | | | | | | | |
| Cleveland Electric Illumination, | | | | | | | | |
| Sr. Unscd. Notes | | 5.70 | | 4/1/17 | | 500,000 | | 489,113 |
| Consolidated Edison of NY, | | | | | | | | |
| Sr. Unscd. Debs., Ser. D | | 5.30 | | 12/1/16 | | 400,000 | | 394,155 |
| Consumers Energy, | | | | | | | | |
| First Mortgage Bonds, Ser. O | | 5.00 | | 2/15/12 | | 655,000 | | 650,788 |
| Enel Finance International, | | | | | | | | |
| Gtd. Notes | | 5.70 | | 1/15/13 | | 185,000 a | | 188,031 |
| FPL Group Capital, | | | | | | | | |
| Gtd. Debs. | | 5.63 | | 9/1/11 | | 950,000 | | 973,574 |
| Gulf Power, | | | | | | | | |
| Sr. Unsub. Notes, Ser. M | | 5.30 | | 12/1/16 | | 475,000 | | 473,010 |
| National Grid, | | | | | | | | |
| Sr. Unscd. Notes | | 6.30 | | 8/1/16 | | 605,000 | | 618,660 |
| Nevada Power, | | | | | | | | |
| Mortgage Notes, Ser. R | | 6.75 | | 7/1/37 | | 265,000 | | 275,254 |
| NiSource Finance, | | | | | | | | |
| Gtd. Notes | | 5.25 | | 9/15/17 | | 375,000 | | 345,380 |
| NiSource Finance, | | | | | | | | |
| Gtd. Notes | | 5.59 | | 11/23/09 | | 260,000 b | | 257,604 |
| Ohio Power, | | | | | | | | |
| Unscd. Notes | | 5.42 | | 4/5/10 | | 390,000 b | | 386,787 |
| Sierra Pacific Power, | | | | | | | | |
| Mortgage Notes, Ser. P | | 6.75 | | 7/1/37 | | 130,000 | | 135,030 |
| Southern, | | | | | | | | |
| Sr. Unsub. Notes, Ser. A | | 5.30 | | 1/15/12 | | 290,000 | | 295,528 |
| | | | | | | | | 5,482,914 |
| Environmental Control—.6% | | | | | | | | |
| Allied Waste North America, | | | | | | | | |
| Scd. Notes, Ser. B | | 5.75 | | 2/15/11 | | 175,000 | | 172,375 |
| Allied Waste North America, | | | | | | | | |
| Scd. Notes | | 6.38 | | 4/15/11 | | 140,000 | | 139,300 |
18
| | | Coupon | | Maturity | | Principal | | |
| Bonds and Notes (continued) | | Rate (%) | | Date | | Amount ($) | | Value ($) |
| |
| |
| |
| |
|
| Environmental Control (continued) | | | | | | | | |
| Republic Services, | | | | | | | | |
| Sr. Unsub. Notes | | 6.75 | | 8/15/11 | | 365,000 | | 382,923 |
| USA Waste Services, | | | | | | | | |
| Sr. Unscd. Notes | | 7.00 | | 7/15/28 | | 225,000 | | 239,366 |
| | | | | | | | | 933,964 |
| Food & Beverages—.3% | | | | | | | | |
| H.J. Heinz, | | | | | | | | |
| Notes | | 6.43 | | 12/1/20 | | 225,000 a | | 229,112 |
| Kraft Foods, | | | | | | | | |
| Sr. Unscd. Notes | | 6.00 | | 2/11/13 | | 100,000 | | 102,923 |
| Tyson Foods, | | | | | | | | |
| Sr. Unscd. Notes | | 6.85 | | 4/1/16 | | 200,000 b | | 206,231 |
| | | | | | | | | 538,266 |
| Foreign/Governmental—2.2% | | | | | | | | |
| Banco Nacional de Desenvolvimento | | | | | | | | |
| Economico e Social, Unsub. Notes | | 5.33 | | 6/16/08 | | 660,000 b | | 657,690 |
| Export-Import Bank of Korea, | | | | | | | | |
| Unsub. Notes | | 4.50 | | 8/12/09 | | 575,000 | | 569,196 |
| Federal Republic of Brazil, | | | | | | | | |
| Unscd. Bonds BRL | | 12.50 | | 1/5/16 | | 1,245,000 c,d | | 761,338 |
| Republic of Argentina, | | | | | | | | |
| Bonds | | 5.39 | | 8/3/12 | | 1,435,000 b | | 812,569 |
| Republic of Argentina, | | | | | | | | |
| Bonds, Ser. VII | | 7.00 | | 9/12/13 | | 425,000 | | 374,425 |
| Russian Federation, | | | | | | | | |
| Unsub. Bonds | | 8.25 | | 3/31/10 | | 491,688 a | | 511,356 |
| | | | | | | | | 3,686,574 |
| Health Care—1.1% | | | | | | | | |
| American Home Products, | | | | | | | | |
| Unscd. Notes | | 6.95 | | 3/15/11 | | 325,000 b | | 346,539 |
| Community Health Systems, | | | | | | | | |
| Gtd. Notes | | 8.88 | | 7/15/15 | | 205,000 | | 209,869 |
| Coventry Health Care, | | | | | | | | |
| Sr. Unscd. Notes | | 5.95 | | 3/15/17 | | 225,000 | | 221,000 |
| Medco Health Solutions, | | | | | | | | |
| Sr. Unscd. Notes | | 7.25 | | 8/15/13 | | 155,000 | | 169,992 |
| Teva Pharmaceutical Finance, | | | | | | | | |
| Gtd. Notes | | 6.15 | | 2/1/36 | | 325,000 | | 323,817 |
The Portfolio 19
| | STATEMENT OF INVESTMENTS (continued)
|
| | | Coupon | | Maturity | | Principal | | |
| Bonds and Notes (continued) | | Rate (%) | | Date | | Amount ($) | | Value ($) |
| |
| |
| |
| |
|
| Health Care (continued) | | | | | | | | |
| UnitedHealth Group, | | | | | | | | |
| Sr. Unscd. Notes | | 5.38 | | 3/15/16 | | 250,000 | | 245,436 |
| Wellpoint, | | | | | | | | |
| Sr. Unsub. Notes | | 5.88 | | 6/15/17 | | 255,000 | | 257,196 |
| | | | | | | | | 1,773,849 |
| Lodging & Entertainment—.1% | | | | | | | | |
| MGM Mirage, | | | | | | | | |
| Gtd. Notes | | 8.38 | | 2/1/11 | | 210,000 | | 215,775 |
| Machinery—.2% | | | | | | | | |
| Atlas Copco, | | | | | | | | |
| Bonds | | 5.60 | | 5/22/17 | | 185,000 a | | 185,402 |
| Case New Holland, | | | | | | | | |
| Gtd. Notes | | 7.13 | | 3/1/14 | | 190,000 | | 190,475 |
| | | | | | | | | 375,877 |
| Media—1.2% | | | | | | | | |
| AOL Time Warner, | | | | | | | | |
| Gtd. Notes | | 6.75 | | 4/15/11 | | 480,000 | | 500,304 |
| British Sky Broadcasting, | | | | | | | | |
| Gtd. Notes | | 6.88 | | 2/23/09 | | 510,000 | | 520,053 |
| Comcast, | | | | | | | | |
| Gtd. Notes | | 5.50 | | 3/15/11 | | 530,000 | | 535,454 |
| News America Holdings, | | | | | | | | |
| Gtd. Debs | | 7.70 | | 10/30/25 | | 425,000 | | 478,627 |
| | | | | | | | | 2,034,438 |
| Oil & Gas—1.1% | | | | | | | | |
| Chesapeake Energy, | | | | | | | | |
| Gtd. Notes | | 7.50 | | 6/15/14 | | 90,000 | | 92,025 |
| Enterprise Products Operating, | | | | | | | | |
| Gtd. Notes, Ser. B | | 5.60 | | 10/15/14 | | 810,000 | | 809,503 |
| Gazprom, | | | | | | | | |
| Sr. Unscd. Notes | | 6.51 | | 3/7/22 | | 420,000 a | | 400,344 |
| Hess, | | | | | | | | |
| Unscd. Notes | | 6.65 | | 8/15/11 | | 470,000 | | 496,452 |
| | | | | | | | | 1,798,324 |
| Packaging & Containers—.3% | | | | | | | | |
| Ball, | | | | | | | | |
| Gtd. Notes | | 6.88 | | 12/15/12 | | 120,000 | | 122,400 |
| Crown Americas, | | | | | | | | |
| Gtd. Notes | | 7.63 | | 11/15/13 | | 325,000 | | 333,938 |
| | | | | | | | | 456,338 |
20
| | | Coupon | | Maturity | | Principal | | |
| Bonds and Notes (continued) | | Rate (%) | | Date | | Amount ($) | | Value ($) |
| |
| |
| |
| |
|
| Property & Casualty Insurance—2.4% | | | | | | |
| Allstate, | | | | | | | | |
| Jr. Sub. Debs. | | 6.50 | | 5/15/67 | | 170,000 b | | 158,711 |
| American International Group, | | | | | | | | |
| Sr. Unscd. Notes | | 5.05 | | 10/1/15 | | 270,000 | | 261,157 |
| Chubb, | | | | | | | | |
| Sr. Unscd. Notes | | 5.47 | | 8/16/08 | | 950,000 | | 951,284 |
| Hartford Financial Services Group, | | | | | | |
| Sr. Unscd. Notes | | 5.55 | | 8/16/08 | | 450,000 | | 451,106 |
| Lincoln National, | | | | | | | | |
| Sr. Unscd. Notes | | 5.21 | | 3/12/10 | | 425,000 b | | 417,589 |
| MetLife, | | | | | | | | |
| Sr. Unscd. Notes | | 5.00 | | 6/15/15 | | 1,050,000 | | 1,017,689 |
| Nippon Life Insurance, | | | | | | | | |
| Notes | | 4.88 | | 8/9/10 | | 475,000 a | | 480,182 |
| Phoenix Cos., | | | | | | | | |
| Sr. Unscd. Notes | | 6.68 | | 2/16/08 | | 205,000 | | 205,248 |
| | | | | | | | | 3,942,966 |
| Real Estate Investment Trusts—4.4% | | | | | | |
| Arden Realty, | | | | | | | | |
| Sr. Unscd. Notes | | 5.25 | | 3/1/15 | | 350,000 | | 352,240 |
| Avalonbay Communities, | | | | | | | | |
| Sr. Unscd. Notes | | 6.63 | | 9/15/11 | | 245,000 | | 256,098 |
| Boston Properties, | | | | | | | | |
| Sr. Unscd. Notes | | 5.00 | | 6/1/15 | | 470,000 | | 436,059 |
| Duke Realty, | | | | | | | | |
| Sr. Notes | | 5.88 | | 8/15/12 | | 1,250,000 | | 1,264,043 |
| ERP Operating, | | | | | | | | |
| Notes | | 5.13 | | 3/15/16 | | 350,000 | | 326,172 |
| ERP Operating, | | | | | | | | |
| Notes | | 5.25 | | 9/15/14 | | 85,000 | | 81,101 |
| ERP Operating, | | | | | | | | |
| Unscd. Notes | | 5.38 | | 8/1/16 | | 145,000 | | 136,996 |
| ERP Operating, | | | | | | | | |
| Unscd. Notes | | 5.50 | | 10/1/12 | | 285,000 | | 282,813 |
| Federal Realty Investment Trust, | | | | | | | | |
| Sr. Unscd. Bonds | | 5.65 | | 6/1/16 | | 325,000 | | 313,366 |
| Federal Realty Investment Trust, | | | | | | | | |
| Notes | | 6.00 | | 7/15/12 | | 100,000 | | 102,736 |
| Healthcare Realty Trust, | | | | | | | | |
| Sr. Unscd. Notes | | 5.13 | | 4/1/14 | | 475,000 | | 452,153 |
The Portfolio 21
| | STATEMENT OF INVESTMENTS (continued)
|
| | | Coupon | | Maturity | | Principal | | |
| Bonds and Notes (continued) | | Rate (%) | | Date | | Amount ($) | | Value ($) |
| |
| |
| |
| |
|
| Real Estate Investment | | | | | | | | |
| Trusts (continued) | | | | | | | | |
| HRPT Properties Trust, | | | | | | | | |
| Sr. Unscd. Notes | | 5.59 | | 3/16/11 | | 238,000 b | | 229,946 |
| Istar Financial, | | | | | | | | |
| Sr. Unscd. Notes | | 5.50 | | 3/9/10 | | 650,000 b | | 583,169 |
| Liberty Property, | | | | | | | | |
| Sr. Unscd. Notes | | 5.50 | | 12/15/16 | | 185,000 | | 173,389 |
| Mack-Cali Realty, | | | | | | | | |
| Sr. Unscd. Notes | | 5.05 | | 4/15/10 | | 225,000 | | 228,137 |
| Mack-Cali Realty, | | | | | | | | |
| Notes | | 5.25 | | 1/15/12 | | 400,000 | | 405,988 |
| Mack-Cali Realty, | | | | | | | | |
| Sr. Unscd. Notes | | 5.80 | | 1/15/16 | | 400,000 | | 400,372 |
| National Retail Properties, | | | | | | | | |
| Sr. Unscd. Notes | | 6.15 | | 12/15/15 | | 210,000 | | 210,148 |
| Regency Centers, | | | | | | | | |
| Gtd. Notes | | 5.25 | | 8/1/15 | | 145,000 | | 137,645 |
| Regency Centers, | | | | | | | | |
| Gtd. Notes | | 5.88 | | 6/15/17 | | 120,000 | | 116,167 |
| Simon Property Group, | | | | | | | | |
| Unsub. Notes | | 5.00 | | 3/1/12 | | 550,000 | | 536,972 |
| Simon Property Group, | | | | | | | | |
| Unscd. Notes | | 5.75 | | 5/1/12 | | 150,000 | | 151,040 |
| | | | | | | | | 7,176,750 |
| Residential Mortgage | | | | | | | | |
| Pass-Through Ctfs.—4.3% | | | | | | | | |
| ChaseFlex Trust, | | | | | | | | |
| Ser. 2006-2, Cl. A1A | | 5.59 | | 9/25/36 | | 171,346 b | | 172,035 |
| Citigroup Mortgage Loan Trust, | | | | | | | | |
| Ser. 2005-WF2, Cl. AF2 | | 4.92 | | 8/25/35 | | 24,713 b | | 24,656 |
| Citigroup Mortgage Loan Trust, | | | | | | | | |
| Ser. 2005-WF2, Cl. AF7 | | 5.25 | | 8/25/35 | | 950,000 b | | 881,729 |
| Citigroup Mortgage Loan Trust, | | | | | | | | |
| Ser. 2006-WF1, Cl. A2A | | 5.70 | | 3/25/36 | | 1,793 b | | 1,793 |
| Credit Suisse Mortgage Capital | | | | | | | | |
| Certificates, Ser. 2007-1, | | | | | | | | |
| Cl. 1A6A | | 5.86 | | 2/25/37 | | 580,000 b | | 552,367 |
| CSAB Mortgage Backed Trust, | | | | | | | | |
| Ser. 2006-3, Cl. A1A | | 6.00 | | 11/25/36 | | 1,053,748 b | | 1,056,222 |
22
| | | Coupon | | Maturity | | Principal | | |
| Bonds and Notes (continued) | | Rate (%) | | Date | | Amount ($) | | Value ($) |
| |
| |
| |
| |
|
| Residential Mortgage | | | | | | | | |
| Pass-Through Ctfs. (continued) | | | | | | | | |
| First Horizon Alternative Mortgage | | | | | | | | |
| Securities, Ser. 2004-FA1, Cl. 1A1 | | 6.25 | | 10/25/34 | | 1,869,882 | | 1,871,431 |
| Impac Secured Assets CMN Owner | | | | | | | | |
| Trust, Ser. 2006-1, Cl. 2A1 | | 5.22 | | 5/25/36 | | 266,675 b | | 251,823 |
| IndyMac Index Mortgage Loan Trust, | | | | | | | | |
| Ser. 2006-AR9, Cl. B2 | | 6.05 | | 6/25/36 | | 69,840 b | | 47,987 |
| IndyMac Index Mortgage Loan Trust, | | | | | | | | |
| Ser. 2006-AR25, Cl. 4A2 | | 6.14 | | 9/25/36 | | 720,810 b | | 729,034 |
| Nomura Asset Acceptance, | | | | | | | | |
| Ser. 2005-AP2, Cl. A5 | | 4.98 | | 5/25/35 | | 425,000 b | | 406,002 |
| Nomura Asset Acceptance, | | | | | | | | |
| Ser. 2005-WF1, Cl. 2A5 | | 5.16 | | 3/25/35 | | 475,000 b | | 437,912 |
| Washington Mutual Pass-Through | | | | | | | | |
| Certificates, Ser. 2005-AR4, | | | | | | | | |
| Cl. A4B | | 4.67 | | 4/25/35 | | 575,000 b | | 570,872 |
| | | | | | | | | 7,003,863 |
| Retail—.5% | | | | | | | | |
| CVS Caremark, | | | | | | | | |
| Sr. Unscd. Notes | | 5.44 | | 6/1/10 | | 250,000 b | | 247,486 |
| CVS Caremark, | | | | | | | | |
| Sr. Unscd. Notes | | 5.75 | | 8/15/11 | | 155,000 | | 158,901 |
| Delhaize Group, | | | | | | | | |
| Sr. Unsub Notes | | 6.50 | | 6/15/17 | | 125,000 | | 128,103 |
| Federated Retail Holdings, | | | | | | | | |
| Gtd. Bonds | | 5.35 | | 3/15/12 | | 90,000 | | 87,768 |
| Federated Retail Holdings, | | | | | | | | |
| Gtd. Notes | | 5.90 | | 12/1/16 | | 160,000 | | 150,942 |
| Lowe’s Companies, | | | | | | | | |
| Sr. Unscd. Notes | | 5.60 | | 9/15/12 | | 110,000 | | 113,090 |
| | | | | | | | | 886,290 |
| Specialty Steel—.2% | | | | | | | | |
| Steel Dynamics, | | | | | | | | |
| Sr. Notes | | 7.38 | | 11/1/12 | | 270,000 a | | 272,700 |
| State/Territory | | | | | | | | |
| Gen Oblg—2.3% | | | | | | | | |
| Delaware Housing Authority, | | | | | | | | |
| SFMR | | 5.80 | | 7/1/16 | | 340,000 | | 346,440 |
The Portfolio 23
| | STATEMENT OF INVESTMENTS (continued)
|
| | | Coupon | | Maturity | | Principal | | |
| Bonds and Notes (continued) | | Rate (%) | | Date | | Amount ($) | | Value ($) |
| |
| |
| |
| |
|
| State/Territory | | | | | | | | |
| Gen Oblg (continued) | | | | | | | | |
| Erie Tobacco Asset | | | | | | | | |
| Securitization/NY, Tobacco | | | | | | | | |
| Settlement Asset-Backed Bonds | | 6.00 | | 6/1/28 | | 400,000 | | 368,568 |
| Michigan Tobacco Settlement | | | | | | | | |
| Finance Authority, Tobacco | | | | | | | | |
| Settlement Asset-Backed Bonds | | 7.05 | | 6/1/34 | | 375,000 b | | 355,538 |
| Michigan Tobacco Settlement | | | | | | | | |
| Finance Authority, Tobacco | | | | | | | | |
| Settlement Asset-Backed Bonds | | 7.31 | | 6/1/34 | | 1,425,000 | | 1,342,507 |
| Tobacco Settlement Authority of | | | | | | | | |
| Iowa, Tobacco Settlement | | | | | | | | |
| Asset-Backed Bonds | | 6.50 | | 6/1/23 | | 720,000 | | 686,916 |
| Tobacco Settlement Finance | | | | | | | | |
| Authority of West Virginia, | | | | | | | | |
| Tobacco Settlement | | | | | | | | |
| Asset-Backed Bonds | | 7.47 | | 6/1/47 | | 735,000 | | 706,813 |
| | | | | | | | | 3,806,782 |
| Telecommunications—1.5% | | | | | | | | |
| AT & T Wireless, | | | | | | | | |
| Sr. Unscd. Notes | | 8.75 | | 3/1/31 | | 235,000 | | 305,423 |
| AT & T, | | | | | | | | |
| Sr. Unscd. Notes | | 4.96 | | 5/15/08 | | 380,000 b | | 379,681 |
| AT & T, | | | | | | | | |
| Sr. Unscd. Notes | | 7.30 | | 11/15/11 | | 440,000 b | | 477,145 |
| Koninklijke KPN, | | | | | | | | |
| Sr. Unsub. Notes | | 8.00 | | 10/1/10 | | 115,000 | | 123,410 |
| Koninklijke KPN, | | | | | | | | |
| Sr. Unsub. Bonds | | 8.38 | | 10/1/30 | | 95,000 | | 114,225 |
| Qwest, | | | | | | | | |
| Sr. Unscd. Notes | | 7.50 | | 10/1/14 | | 331,000 | | 337,620 |
| Qwest, | | | | | | | | |
| Notes | | 8.88 | | 3/15/12 | | 30,000 b | | 32,250 |
| Telefonica Emisiones, | | | | | | | | |
| Gtd. Notes | | 5.98 | | 6/20/11 | | 375,000 | | 386,058 |
| Time Warner Cable, | | | | | | | | |
| Gtd. Notes | | 5.85 | | 5/1/17 | | 255,000 | | 256,085 |
| Verizon Global Funding, | | | | | | | | |
| Sr. Unscd. Notes | | 7.75 | | 6/15/32 | | 110,000 | | 129,184 |
| | | | | | | | | 2,541,081 |
24
| | | Coupon | | Maturity | | Principal | | |
| Bonds and Notes (continued) | | Rate (%) | | Date | | Amount ($) | | Value ($) |
| |
| |
| |
| |
|
| Textiles & Apparel—.2% | | | | | | | | |
| Mohawk Industries, | | | | | | | | |
| Sr. Unscd. Notes | | 5.75 | | 1/15/11 | | 400,000 | | 410,904 |
| U.S. Government Agencies/ | | | | | | | | |
| Mortgage-Backed—42.1% | | | | | | | | |
| Federal Home Loan Mortgage Corp.: | | | | | | |
| 5.00% | | | | | | 420,000 e | | 420,458 |
| 5.50% | | | | | | 15,995,000 e | | 15,962,370 |
| 3.50%, 9/1/10 | | | | | | 154,936 | | 151,526 |
| 6.00%, 11/1/37 | | | | | | 5,342,289 | | 5,422,905 |
| Multiclass Mortgage Participation Ctfs., | | | | | | |
| Ser. 2586, Cl. WE, 4.00%, 12/15/32 | | | | 688,951 | | 649,581 |
| Multiclass Mortgage Participation Ctfs. | | | | | | |
| (Interest Only), Ser. 2764, | | | | | | | | |
| Cl. IT, 5.00%, 6/15/27 | | | | | | 7,390,400 f | | 741,489 |
| Federal National Mortgage Association: | | | | | | |
| 5.00% | | | | | | 13,410,000 e | | 13,110,013 |
| 6.00% | | | | | | 4,195,000 e | | 4,258,246 |
| 4.00%, 5/1/10 | | | | | | 766,174 | | 759,463 |
| 5.00%, 11/1/20—11/1/21 | | | | | | 4,751,421 | | 4,758,250 |
| 5.50%, 9/1/34 | | | | | | 326,951 | | 327,020 |
| 6.00%, 9/1/22—11/1/37 | | | | | | 9,496,310 | | 9,675,810 |
| 7.00%, 6/1/29—9/1/29 | | | | | | 98,077 | | 103,471 |
| Government National Mortgage Association I: | | | | | | |
| 5.50%, 4/15/33—3/15/34 | | | | | | 2,615,258 | | 2,635,972 |
| 8.00%, 9/15/08 | | | | | | 178 | | 178 |
| Ser. 2004-23, Cl. B, 2.95%, 3/16/19 | | | | 1,372,675 | | 1,339,734 |
| Ser. 2007-46, Cl. A, 3.14%, 11/16/29 | | | | 410,363 | | 403,190 |
| Ser. 2005-90, Cl. A, 3.76%, 9/16/28 | | | | 775,464 | | 763,145 |
| Ser. 2006-67, Cl. A, 3.95%, 10/6/11 | | | | 978,985 | | 965,984 |
| Ser. 2005-29, Cl. A, 4.02%, 7/16/27 | | | | 450,582 | | 444,968 |
| Ser. 2006-6, Cl. A, 4.05%, 10/16/23 | | | | 109,660 | | 108,574 |
| Ser. 2007-52, Cl. A, 4.05%, 10/16/25 | | | | 574,021 | | 567,876 |
| Ser. 2006-66, Cl. A, 4.09%, 1/16/30 | | | | 920,225 | | 910,599 |
| Ser. 2006-3, Cl. A, 4.21%, 1/16/28 | | | | 937,560 | | 929,898 |
| Ser. 2006-5, Cl. A, 4.24%, 7/16/29 | | | | 661,276 | | 656,147 |
| Ser. 2006-55, Cl. A, 4.25%, 7/16/29 | | | | 844,462 | | 837,403 |
| Ser. 2005-32, Cl. B, 4.39%, 8/16/30 | | | | 665,654 | | 661,667 |
| Ser. 2005-87, Cl. A, 4.45%, 3/16/25 | | | | 537,348 | | 534,931 |
| Ser. 2004-39, Cl. LC, 5.50%, 12/20/29 | | | | 1,000,000 | | 1,012,865 |
| Government National Mortgage Association II | | | | | | |
| 7.00%, 9/20/28—7/20/29 | | | | | | 17,178 | | 18,180 |
| | | | | | | | | 69,131,913 |
The Portfolio 25
STATEMENT OF INVESTMENTS (continued)
|
| | | Principal | | |
| Bonds and Notes (continued) | | Amount ($) | | Value ($) |
| |
| |
|
| U.S. Government Securities—7.1% | | | | |
| U.S. Treasury Bonds: | | | | |
| 4.50%, 2/15/36 | | 923,000 c | | 927,976 |
| 5.00%, 5/15/37 | | 1,578,000 c | | 1,720,391 |
| U.S. Treasury Notes: | | | | |
| 3.38%, 9/15/09 | | 3,125,000 c | | 3,142,334 |
| 3.88%, 10/31/12 | | 255,000 c | | 260,080 |
| 4.25%, 9/30/12 | | 180,000 c | | 186,370 |
| 4.63%, 12/31/11 | | 370,000 c | | 388,211 |
| 4.63%, 11/15/16 | | 133,000 c | | 139,328 |
| 4.75%, 8/15/17 | | 260,000 c | | 274,686 |
| 4.88%, 6/30/12 | | 195,000 c | | 206,883 |
| 5.13%, 6/30/08 | | 4,454,000 c,g | | 4,492,278 |
| | | | | 11,738,537 |
| Total Bonds and Notes | | | | |
| (cost $197,125,494) | | | | 195,265,994 |
| |
| |
|
| |
| | | Face Amount | | |
| | | Covered by | | |
| Options—.0% | | Contracts ($) | | Value ($) |
| |
| |
|
| Call Options | | | | |
| 3-Month Floor USD Libor-BBA | | | | |
| Interest Rate, January 2009 @ 4 | | 9,250,000 | | 24,894 |
| U.S. Treasury 5 Year Note | | | | |
| January 2008 @ 112 | | 10,400,000 | | 30,875 |
| Total Options | | | | |
| (cost $75,980) | | | | 55,769 |
| |
| |
|
| |
| | | Principal | | |
| Short-Term Investments—1.2% | | Amount ($) | | Value ($) |
| |
| |
|
| U.S. Government Agencies—1.2% | | | | |
| Federal National Mortgage | | | | |
| Association, Discount Notes, 4.21%, 3/17/08 | | 1,840,000 | | 1,823,569 |
| U.S. Treasury Bills—.0% | | | | |
| 3.03%, 3/27/08 | | 80,000 | | 79,401 |
| Total Short-Term Investments | | | | |
| (cost $1,902,990) | | | | 1,902,970 |
| Other Investment—.4% | | Shares | | Value ($) |
| |
| |
|
| Registered Investment Company; | | | | |
| Dreyfus Institutional Preferred | | | | |
| Plus Money Market Fund | | | | |
| (cost $697,000) | | 697,000 h | | 697,000 |
| |
| |
|
| |
| Investment of Cash Collateral | | | | |
| for Securities Loaned—6.6% | | | | |
| |
| |
|
| Registered Investment Company; | | | | |
| Dreyfus Institutional Cash | | | | |
| Advantage Fund | | | | |
| (cost $10,873,567) | | 10,873,567 h | | 10,873,567 |
| |
| |
|
| |
| Total Investments (cost $210,675,031) | | 126.9% | | 208,795,300 |
| Liabilities, Less Cash and Receivables | | (26.9%) | | (44,313,645) |
| Net Assets | | 100.0% | | 164,481,655 |
| a Securities exempt from registration under Rule 144A of the Securities Act of 1933.These securities may be resold in |
| transactions exempt from registration, normally to qualified institutional buyers. At December 31, 2007, these |
| securities amounted to $16,092,465 or 9.8% of net assets. |
| b Variable rate security—interest rate subject to periodic change. |
| c All or a portion of these securities are on loan. At December 31, 2007, the total market value of the portfolio’s |
| securities on loan is $10,713,217 and the total market value of the collateral held by the portfolio is $11,052,214, |
| consisting of cash collateral of $10,873,567 and U.S. Government and agency securities valued $178,647. |
| d Principal amount stated in U.S. Dollars unless otherwise noted. |
| BRL—Brazilian Real |
| e Purchased on a forward commitment basis. |
| f Notional face amount shown. |
| g Partially held by the custodian in a segregated account as collateral for open financial futures positions. |
| h Investment in affiliated money market mutual fund. |
| Portfolio Summary (Unaudited) † | | | | |
| |
| | | Value (%) | | | | Value (%) |
| |
| |
| |
|
| U.S. Government & Agencies | | 49.2 | | State/Government | | |
| Corporate Bonds | | 40.9 | | General Obligations | | 2.3 |
| Asset/Mortgage-Backed | | 24.1 | | Foreign/Governmental | | 2.2 |
| Short-Term/Money | | | | Options | | .0 |
| Market Investments | | 8.2 | | | | 126.9 |
| |
| † Based on net assets. | | | | | | |
| See notes to financial statements. | | | | | | |
The Portfolio 27
STATEMENT OF FINANCIAL FUTURES
December 31, 2007
|
| | | | | | | | | Unrealized |
| | | | | Market Value | | | | Appreciation |
| | | | | Covered by | | | | (Depreciation) |
| | | Contracts | | Contracts ($) | | Expiration | | at 12/31/2007 ($) |
| |
| |
| |
| |
|
| Financial Futures Long | | | | | | | | |
| U.S. Treasury 2 year Notes | | 59 | | 12,404,750 | | March 2008 | | 32,281 |
| U.S. Treasury 5 year Notes | | 68 | | 7,499,125 | | March 2008 | | 30,547 |
| U.S. Treasury 30 year Bonds | | 79 | | 9,193,625 | | March 2008 | | (100,375) |
| Financial Futures Short | | | | | | | | |
| U.S. Treasury 10 year Notes | | 51 | | (5,782,922) | | March 2008 | | 6,779 |
| | | | | | | | | (30,768) |
See notes to financial statements.
|
| | STATEMENT OF ASSETS AND LIABILITIES
December 31, 2007
|
| | | Cost | | Value |
| |
| |
|
| Assets ($): | | | | |
| Investments in securities—See Statement of Investments (including | | |
| securities on loan, valued at $10,713,217)—Note 1(c): | | |
| Unaffiliated issuers | | 199,104,464 | | 197,224,733 |
| Affiliated issuers | | 11,570,567 | | 11,570,567 |
| Cash | | | | 9,779 |
| Cash denominated in foreign currencies | | 63 | | 62 |
| Receivable for investment securities sold | | | | 14,630,058 |
| Dividends and interest receivable | | | | 1,497,126 |
| Receivable for futures variation margin—Note 4 | | 267,824 |
| Receivable for shares of Beneficial Interest subscribed | | 19,695 |
| Receivable from broker for swap transactions—Note 4 | | 6,835 |
| Unrealized appreciation on swap contracts—Note 4 | | 1,304 |
| Prepaid expenses | | | | 9,406 |
| | | | | 225,237,389 |
| |
| |
|
| Liabilities ($): | | | | |
| Due to The Dreyfus Corporation and affiliates—Note 3(b) | | 126,390 |
| Payable for investment securities purchased | | 47,931,422 |
| Liability for securities on loan—Note 1(c) | | | | 10,873,567 |
| Payable for shares of Beneficial Interest redeemed | | 1,540,225 |
| Unrealized depreciation on swap contracts—Note 4 | | 166,678 |
| Payable to broker from swap transactions—Note 4 | | 70,566 |
| Swap discount received | | | | 4,788 |
| Accrued expenses | | | | 42,098 |
| | | | | 60,755,734 |
| |
| |
|
| Net Assets ($) | | | | 164,481,655 |
| |
| |
|
| Composition of Net Assets ($): | | | | |
| Paid-in capital | | | | 171,656,776 |
| Accumulated undistributed investment income—net | | 2,511,056 |
| Accumulated net realized gain (loss) on investments | | (7,613,136) |
| Accumulated net unrealized appreciation (depreciation) on investments | | |
| [including ($30,768) net unrealized (depreciation) on financial futures] | | (2,073,041) |
| |
|
| Net Assets ($) | | | | 164,481,655 |
| |
| |
|
| |
| |
| |
| Net Asset Value Per Share | | | | |
| | | Initial Shares | | Service Shares |
| |
| |
|
| Net Assets ($) | | 120,446,280 | | 44,035,375 |
| Shares Outstanding | | 10,870,861 | | 3,989,104 |
| |
| |
|
| Net Asset Value Per Share ($) | | 11.08 | | 11.04 |
See notes to financial statements.
The Portfolio 29
STATEMENT OF OPERATIONS
Year Ended December 31, 2007
|
| Investment Income ($): | | |
| Income: | | |
| Interest | | 9,704,422 |
| Dividends; | | |
| Affiliated issuers | | 356,609 |
| Income from securities lending | | 47,885 |
| Total Income | | 10,108,916 |
| Expenses: | | |
| Investment advisory fee—Note 3(a) | | 1,195,532 |
| Distribution fees—Note 3(b) | | 116,215 |
| Custodian fees—Note 3(b) | | 42,059 |
| Prospectus and shareholders’ reports | | 40,011 |
| Professional fees | | 39,532 |
| Trustees’ fees and expenses—Note 3(c) | | 9,806 |
| Shareholder servicing costs—Note 3(b) | | 2,841 |
| Miscellaneous | | 87,563 |
| Total Expenses | | 1,533,559 |
| Less—reduction in investment advisory fee due to undertaking—Note 3(a) | | (85,801) |
| Less—reduction in custody fees due to earnings credits—Note 1(c) | | (4,116) |
| Net Expenses | | 1,443,642 |
| Investment Income—Net | | 8,665,274 |
| |
|
| Realized and Unrealized Gain (Loss) on Investments—Note 4 ($): |
| Net realized gain (loss) on investments and foreign currency transactions | | 284,769 |
| Net realized gain (loss) on options transactions | | 22,860 |
| Net realized gain (loss) on financial futures | | (1,151,222) |
| Net realized gain (loss) on swap transactions | | (511,285) |
| Net realized gain (loss) on forward currency exchange contracts | | 200,947 |
| Net Realized Gain (Loss) | | (1,153,931) |
| Net unrealized appreciation (depreciation) on investments, options | | |
| transactions, swap transactions and foreign currency transactions | | |
| [including ($387,643) net unrealized (depreciation) on financial futures] | | (1,638,329) |
| Net Realized and Unrealized Gain (Loss) on Investments | | (2,792,260) |
| Net Increase in Net Assets Resulting from Operations | | 5,873,014 |
See notes to financial statements.
|
STATEMENT OF CHANGES IN NET ASSETS
| | | Year Ended December 31, |
| |
|
| | | 2007 | | 2006 |
| |
| |
|
| Operations ($): | | | | |
| Investment income—net | | 8,665,274 | | 8,500,507 |
| Net realized gain (loss) on investments | | (1,153,931) | | (1,065,029) |
| Net unrealized appreciation | | | | |
| (depreciation) on investments | | (1,638,329) | | 538,313 |
| Net Increase (Decrease) in Net Assets | | | | |
| Resulting from Operations | | 5,873,014 | | 7,973,791 |
| |
| |
|
| Dividends to Shareholders from ($): | | | | |
| Investment income—net: | | | | |
| Initial Shares | | (6,690,160) | | (6,935,072) |
| Service Shares | | (2,142,188) | | (1,909,726) |
| Total Dividends | | (8,832,348) | | (8,844,798) |
| |
| |
|
| Beneficial Interest Transactions ($): | | | | |
| Net proceeds from shares sold: | | | | |
| Initial Shares | | 17,904,773 | | 18,413,862 |
| Service Shares | | 21,736,487 | | 2,378,699 |
| Dividends reinvested: | | | | |
| Initial Shares | | 6,690,160 | | 6,935,072 |
| Service Shares | | 2,142,188 | | 1,909,726 |
| Cost of shares redeemed: | | | | |
| Initial Shares | | (47,387,185) | | (38,215,309) |
| Service Shares | | (20,498,808) | | (10,453,409) |
| Increase (Decrease) in Net Assets from | | | | |
| Beneficial Interest Transactions | | (19,412,385) | | (19,031,359) |
| Total Increase (Decrease) in Net Assets | | (22,371,719) | | (19,902,366) |
| |
| |
|
| Net Assets ($): | | | | |
| Beginning of Period | | 186,853,374 | | 206,755,740 |
| End of Period | | 164,481,655 | | 186,853,374 |
| Undistributed investment income—net | | 2,511,056 | | 2,098,366 |
The Portfolio 31
STATEMENT OF CHANGES IN NET ASSETS (continued)
|
| | | Year Ended December 31, |
| |
|
| | | 2007 | | 2006 |
| |
| |
|
| Capital Share Transactions: | | | | |
| Initial Shares | | | | |
| Shares sold | | 1,604,043 | | 1,656,604 |
| Shares issued for dividends reinvested | | 601,017 | | 624,164 |
| Shares redeemed | | (4,263,788) | | (3,437,427) |
| Net Increase (Decrease) in Shares Outstanding | | (2,058,728) | | (1,156,659) |
| |
| |
|
| Service Shares | | | | |
| Shares sold | | 1,961,886 | | 214,567 |
| Shares issued for dividends reinvested | | 193,322 | | 172,423 |
| Shares redeemed | | (1,854,465) | | (943,077) |
| Net Increase (Decrease) in Shares Outstanding | | 300,743 | | (556,087) |
See notes to financial statements.
|
FINANCIAL HIGHLIGHTS
The following tables describe the performance for each share class for the fiscal periods indicated.All information (except portfolio turnover rate) reflects financial results for a single portfolio share. Total return shows how much your investment in the portfolio would have increased (or decreased) during each period, assuming you had reinvested all dividends and distributions.These figures have been derived from the portfolio’s financial statements.
| | | | | Year Ended December 31, | | |
| |
| |
| |
|
| Initial Shares | | 2007 | | 2006 | | 2005 | | 2004 a | | 2003 |
| |
| |
| |
| |
| |
|
| Per Share Data ($): | | | | | | | | | | |
| Net asset value, beginning of period | | 11.25 | | 11.29 | | 11.42 | | 11.50 | | 11.65 |
| Investment Operations: | | | | | | | | | | |
| Investment income—net b | | .53 | | .49 | | .39 | | .37 | | .35 |
| Net realized and unrealized | | | | | | | | | | |
| gain (loss) on investments | | (.16) | | (.02) | | (.11) | | .01 | | .21 |
| Total from Investment Operations | | .37 | | .47 | | .28 | | .38 | | .56 |
| Distributions: | | | | | | | | | | |
| Dividends from investment income—net | | (.54) | | (.51) | | (.41) | | (.46) | | (.46) |
| Dividends from net realized | | | | | | | | | | |
| gain on investments | | — | | — | | — | | — | | (.25) |
| Total Distributions | | (.54) | | (.51) | | (.41) | | (.46) | | (.71) |
| Net asset value, end of period | | 11.08 | | 11.25 | | 11.29 | | 11.42 | | 11.50 |
| |
| |
| |
| |
| |
|
| Total Return (%) | | 3.54 | | 4.23 | | 2.48 | | 3.37 | | 4.94 |
| |
| |
| |
| |
| |
|
| Ratios/Supplemental Data (%): | | | | | | | | | | |
| Ratio of total expenses | | | | | | | | | | |
| to average net assets | | .77 | | .75 | | .75 | | .74 | | .74 |
| Ratio of net expenses | | | | | | | | | | |
| to average net assets c | | .72 | | .63 | | .60 | | .74 | | .74 |
| Ratio of net investment income | | | | | | | | | | |
| to average net assets | | 4.78 | | 4.43 | | 3.45 | | 3.30 | | 2.96 |
| Portfolio Turnover Rate d | | 446.13 | | 507.83 | | 504.21 | | 819.75 | | 898.18 |
| |
| |
| |
| |
| |
|
| Net Assets, end of period ($ x 1,000) | | 120,446 | | 145,490 | | 158,999 | | 171,424 | | 173,534 |
| a As of January 1, 2004, the portfolio has adopted the method of accounting for interim payments on swap contracts in |
| accordance with Financial Accounting Standards Board Statement No. 133.These interim payments are reflected |
| within net realized and unrealized gain (loss) on swap contracts, however, prior to January 1, 2004, these interim |
| payments were reflected within interest income/expense in the Statement of Operations.The effect of this change for |
| the period ended December 31, 2004, was to increase net investment income per share by less than $.01, decrease net |
| realized and unrealized gain (loss) on investments per share by less than $.01 and increase the ratio of net |
| investment income to average net assets from 3.28% to 3.30%. Per share data and ratios/supplemental data for |
| periods prior to January 1, 2004 have not been restated to reflect this change in presentation. |
| b Based on average shares outstanding at each month end. |
| c The differences for periods represents less than .01%. |
| d The portfolio turnover rates excluding mortgage dollar roll transactions for the period ended December 31, 2007, |
| December 31, 2006, December 31, 2005, December 31, 2004 and December 31, 2003, were 219.54%, |
| 262.26%, 393.37%, 761.92% and 755.08%, respectively. |
See notes to financial statements.
The Portfolio 33
| | FINANCIAL HIGHLIGHTS (continued)
|
| | | | | Year Ended December 31, | | |
| |
| |
| |
|
| Service Shares | | 2007 | | 2006 | | 2005 | | 2004a | | 2003 |
| |
| |
| |
| |
| |
|
| Per Share Data ($): | | | | | | | | | | |
| Net asset value, beginning of period | | 11.21 | | 11.25 | | 11.38 | | 11.48 | | 11.62 |
| Investment Operations: | | | | | | | | | | |
| Investment income—net b | | .51 | | .46 | | .36 | | .35 | | .31 |
| Net realized and unrealized | | | | | | | | | | |
| gain (loss) on investments | | (.17) | | (.02) | | (.11) | | (.01) | | .24 |
| Total from Investment Operations | | .34 | | .44 | | .25 | | .34 | | .55 |
| Distributions: | | | | | | | | | | |
| Dividends from investment | | | | | | | | | | |
| income—net | | (.51) | | (.48) | | (.38) | | (.44) | | (.44) |
| Dividends from net realized | | | | | | | | | | |
| gain on investments | | — | | — | | — | | — | | (.25) |
| Total Distributions | | (.51) | | (.48) | | (.38) | | (.44) | | (.69) |
| Net asset value, end of period | | 11.04 | | 11.21 | | 11.25 | | 11.38 | | 11.48 |
| |
| |
| |
| |
| |
|
| Total Return (%) | | 3.31 | | 3.90 | | 2.26 | | 3.05 | | 4.78 |
| |
| |
| |
| |
| |
|
| Ratios/Supplemental Data (%): | | | | | | | | | | |
| Ratio of total expenses | | | | | | | | | | |
| to average net assets | | 1.02 | | 1.00 | | .99 | | .99 | | .99 |
| Ratio of net expenses | | | | | | | | | | |
| to average net assets c | | .97 | | .88 | | .84 | | .99 | | .99 |
| Ratio of net investment income | | | | | | | | | | |
| to average net assets | | 4.51 | | 4.17 | | 3.21 | | 3.06 | | 2.66 |
| Portfolio Turnover Rate d | | 446.13 | | 507.83 | | 504.21 | | 819.75 | | 898.18 |
| |
| |
| |
| |
| |
|
| Net Assets, end of period ($ x 1,000) | | 44,035 | | 41,363 | | 47,757 | | 55,585 | | 60,561 |
| a | | As of January 1, 2004, the portfolio has adopted the method of accounting for interim payments on swap contracts in |
| | | accordance with Financial Accounting Standards Board Statement No. 133.These interim payments are reflected |
| | | within net realized and unrealized gain (loss) on swap contracts, however, prior to January 1, 2004, these interim |
| | | payments were reflected within interest income/expense in the Statement of Operations.The effect of this change for |
| | | the period ended December 31, 2004, was to increase net investment income per share by $.01, decrease net realized |
| | | and unrealized gain (loss) on investments per share by $.01 and increase the ratio of net investment income to |
| | | average net assets from 3.03% to 3.06%. Per share data and ratios/supplemental data for periods prior to January |
| | | 1, 2004 have not been restated to reflect these changes in presentation. |
| b | | Based on average shares outstanding at each month end. |
| c | | The differences for periods represents less than .01%. |
| d | | The portfolio turnover rates excluding mortgage dollar roll transactions for the period ended December 31, 2007, |
| | | December 31, 2006, December 31, 2005, December 31, 2004 and December 31, 2003, were 219.54%, |
| | | 262.26%, 393.37%, 761.92% and 755.08%, respectively. |
| See notes to financial statements. |
34
NOTES TO FINANCIAL STATEMENTS
NOTE 1—Significant Accounting Policies:
Dreyfus Variable Investment Fund (the “fund”) is registered under the Investment Company Act of 1940, as amended (the “Act”), as an open-end management investment company, operating as a series company currently offering seven series, including the Quality Bond Portfolio (the “portfolio”).The portfolio is only offered to separate accounts established by insurance companies to fund variable annuity contracts and variable life insurance policies.The portfolio is a diversified series.The portfolio’s investment objective will be to maximize total return, consisting of capital appreciation and current income. The Dreyfus Corporation (the “Manager” or “Dreyfus”) serves as the portfolio’s investment adviser.
On July 1, 2007, Mellon Financial Corporation and The Bank of New York Company, Inc. merged, forming The Bank of New York Mellon Corporation (“BNY Mellon”). As part of this transaction, Dreyfus became a wholly-owned subsidiary of BNY Mellon.
MBSC Securities Corporation (the “Distributor”), a wholly-owned subsidiary of the Manager served as the distributor of the portfolio’s shares, which are sold without a sales charge. The portfolio is authorized to issue an unlimited number of $.001 par value shares of Beneficial Interest in each of the following classes of shares: Initial and Service. Each class of shares has identical rights and privileges, except with respect to the distribution plan and the expenses borne by each class and certain voting rights. Income, expenses (other than expenses attributable to a specific class), and realized and unrealized gains or losses on investments are allocated to each class of shares based on its relative net assets.
The fund accounts separately for the assets, liabilities and operations of each series. Expenses directly attributable to each series are charged to that series’ operations, expenses which are applicable to all series are allocated among them on a pro rata basis.
The Portfolio 35
NOTES TO FINANCIAL STATEMENTS (continued)
|
The portfolio’s financial statements are prepared in accordance with U.S. generally accepted accounting principles, which may require the use of management estimates and assumptions.Actual results could differ from those estimates.
The fund enters into contracts that contain a variety of indemnifica-tions.The portfolio’s maximum exposure under these arrangements is unknown. The portfolio does not anticipate recognizing any loss related to these arrangements.
(a) Portfolio valuation: Investments in securities excluding short-term investments (other than U.S. Treasury Bills), financial futures, options, swap transactions and forward currency exchange contracts are valued each business day by an independent pricing service (the “Service”) approved by the Board of Trustees. Investments for which quoted bid prices are readily available and are representative of the bid side of the market in the judgment of the Service are valued at the mean between the quoted bid prices (as obtained by the Service from dealers in such securities) and asked prices (as calculated by the Service based upon its evaluation of the market for such securities). Other investments (which constitute a majority of the portfolio’s securities) are valued as determined by the Service, based on methods which include consideration of: yields or prices of securities of comparable quality, coupon, maturity and type; indications as to values from dealers; and general market conditions. Restricted securities, as well as securities or other assets for which recent market quotations are not readily available, not valued by a pricing service approved by the Board of Trustees, or determined by the fund not to reflect accurately fair value are valued at fair value as determined in good faith under the direction of the Board of Trustees. The factors that may be considered when fair valuing a security include fundamental analytical data, the nature and duration of restrictions on disposition, an evaluation of the forces that influence the market in which the securities are purchased and sold, and public trading in similar securities of the issuer or comparable issuers. Short-term investments, excluding U.S. Treasury Bills, are carried at amortized cost, which approximates value. Registered open-ended investment compa-
nies that are not traded on an exchange are valued at their net asset value. Financial futures and options, which are traded on an exchange, are valued at the last sales price on the securities exchange on which such securities are primarily traded or at the last sales price on the national securities market on each business day. Options traded over-the-counter are priced at the mean between the bid prices and asked prices. Investments in swap transactions are valued each business day by an independent pricing service approved by the Board of Trustees. Swaps are valued by the service by using a swap pricing model which incorporates among other factors, default probabilities, recovery rates, credit curves of the underlying issuers and swap spreads on interest rates. Investments denominated in foreign currencies are translated to U.S. dollars at the prevailing rates of exchange. Forward currency exchange contracts are valued at the forward rate.
The Financial Accounting Standards Board (“FASB”) released Statement of Financial Accounting Standards No. 157 “Fair Value Measurements” (“FAS 157”). FAS 157 establishes an authoritative definition of fair value, sets out a framework for measuring fair value, and requires additional disclosures about fair-value measurements. The application of FAS 157 is required for fiscal years beginning after November 15, 2007 and interim periods within those fiscal years. Management does not believe that the application of this standard will have a material impact on the financial statements of the portfolio.
(b) Foreign currency transactions: The portfolio does not isolate that portion of the results of operations resulting from changes in foreign exchange rates on investments from the fluctuations arising from changes in the market prices of securities held. Such fluctuations are included with the net realized and unrealized gain or loss on investments.
Net realized foreign exchange gains or losses arise from sales and maturities of short-term securities, sales of foreign currencies, currency gains or losses realized on securities transactions and the difference between the amounts of dividends, interest and foreign withholding taxes recorded on the portfolios’ books and the U.S. dollar equivalent of the
The Portfolio 37
NOTES TO FINANCIAL STATEMENTS (continued)
|
amounts actually received or paid. Net unrealized foreign exchange gains and losses arise from changes in the value of assets and liabilities other than investments in securities, resulting from changes in exchange rates. Such gains and losses are included with net realized and unrealized gain or loss on investments.
(c) Securities transactions and investment income: Securities transactions are recorded on a trade date basis. Realized gains and losses from securities transactions are recorded on the identified cost basis. Dividend income is recognized on the ex-dividend date and interest income, including, where applicable, accretion of discount and amortization of premium on investments, is recognized on the accrual basis.
The portfolio has an arrangement with the custodian bank whereby the portfolio receives earnings credits from the custodian when positive cash balances are maintained, which are used to offset custody fees. For financial reporting purposes, the portfolio includes net earnings credits, as an expense offset in the Statement of Operations.
Pursuant to a securities lending agreement with Mellon Bank, N.A. (“Mellon Bank”), an affiliate of the Manager, the portfolio may lend securities to qualified institutions. It is the portfolio’s policy, that at origination, all loans are secured by collateral of at least 102% of the value of U.S. securities loaned and 105% of the value of foreign securities loaned. It is the portfolio’s policy that collateral equivalent to at least 100% of the market value of securities on loan will be maintained at all times. Collaterals are either in the form of cash, which can be invested in certain money market mutual funds managed by the Manager, U.S. Government and Agency securities or Letters of Credit. The portfolio will be entitled to receive all income on securities loaned, in addition to income earned as a result of the lending transaction.Although each security loaned is fully collateralized, the fund would bear the risk of delay in recovery of, or loss of rights in, the securities loaned should a borrower fail to return the securities in a timely manner. During the period ended December 31, 2007, Mellon Bank earned $25,784 from lending fund portfolio securities, pursuant to the securities lending agreement.
(d) Affiliated issuers: Investments in other investment companies advised by the Manager are defined as “affiliated” in the Act.
(e) Dividends to shareholders: Dividends are recorded on the ex-dividend date. Dividends from investment income-net are declared and paid monthly. Dividends from net realized capital gains, if any, are normally declared and paid annually, but the portfolio may make distributions on a more frequent basis to comply with the distribution requirements of the Internal Revenue Code of 1986, as amended (the “Code”).To the extent that net realized capital gains can be offset by capital loss carryovers, if any, it is the policy of the portfolio not to distribute such gains. Income and capital gain distributions are determined in accordance with income tax regulations, which may differ from U.S. generally accepted accounting principles.
On December 31, 2007, the Board of Trustees declared a cash dividend of .046 and .044 per share for the Initial shares and Service shares, respectively, from undistributed investment income-net payable on January 2, 2008 (ex-dividend date) to shareholders of record as of the close of business on January 2, 2008.
(f) Federal income taxes: It is the policy of the portfolio to continue to qualify as a regulated investment company, if such qualification is in the best interests of its shareholders, by complying with the applicable provisions of the Code, and to make distributions of taxable income sufficient to relieve it from substantially all federal income and excise taxes.
During the current year, the portfolio adopted FASB Interpretation No. 48 “Accounting for Uncertainty in Income Taxes” (“FIN 48”). FIN 48 provides guidance for how uncertain tax positions should be recognized, measured, presented and disclosed in the financial statements. FIN 48
The Portfolio 39
NOTES TO FINANCIAL STATEMENTS (continued)
|
requires the evaluation of tax positions taken or expected to be taken in the course of preparing the portfolio’s tax returns to determine whether the tax positions are “more-likely-than-not” of being sustained by the applicable tax authority. Tax positions not deemed to meet the more-likely-than-not threshold would be recorded as a tax benefit or expense in the current year. The adoption of FIN 48 had no impact on the operations of the portfolio for the period ended December 31, 2007.
The portfolio is not subject to examination by U.S. Federal, State and City tax authorities for the tax years before 2004.
At December 31, 2007, the components of accumulated earnings on a tax basis were as follows: undistributed ordinary income $2,530,170, undistributed capital losses $6,482,942 and unrealized depreciation $2,540,442. In addition, the portfolio had $681,906 of capital losses realized after October 31, 2007, which were deferred for tax purposes to the first day of the following fiscal year.
The accumulated capital loss carryover is available for federal income tax purposes to be applied against future net securities profits, if any, realized subsequent to December 31, 2007. If not applied, $3,171,594 of the carryover expires in fiscal 2012, $61,980 expires in fiscal 2013, $1,624,385 expires in fiscal 2014 and $1,624,983 expires in fiscal 2015.
The tax characters of distributions paid to shareholders during the fiscal periods ended December 31, 2007 and December 31, 2006 were as follows: ordinary income $8,832,348 and $8,844,798, respectively.
During the period ended December 31, 2007, as a result of permanent book to tax differences, primarily due to the tax treatment of amortization of premiums, paydowns gains/losses, treatment of swap periodic payments and foreign currency transactions, the portfolio increased accumulated undistributed investment income-net by $579,764 and decreased accumulated net realized gain (loss) on investments by the same amount. Net assets were not affected by this reclassification.
NOTE 2—Bank Lines of Credit:
The portfolio may borrow up to $10 million for leveraging purposes under a short-term unsecured line of credit and participates with other Dreyfus-managed funds in a $100 million unsecured line of credit primarily to be utilized for temporary or emergency purposes, including the financing of redemptions. Interest is charged to the portfolio based on prevailing market rates in effect at the time of borrowings. During the period ended December 31, 2007, the portfolio did not borrow under either line of credit.
NOTE 3—Investment Advisory Fee and Other Transactions With Affiliates:
(a) Pursuant to an Investment Advisory Agreement with the Manager, the investment advisory fee is computed at the annual rate of .65% of the value of the portfolio’s average daily net assets and is payable monthly. The Manager had agreed from January 1, 2007 through June 30, 2007, to waive receipt of a portion of the portfolio’s investment advisory fee, in the amount of .10% of the value of the portfolio’s average net assets.The reduction in investment advisory fee, pursuant to the undertaking, amounted to $85,801 during the period ended December 31, 2007.
(b) Under the Distribution Plan (the “Plan”) adopted pursuant to Rule 12b-1 under the Act, Service shares pay the Distributor for distributing their shares, for servicing and/or maintaining Service shares shareholder accounts and for advertising and marketing for Service shares.The Plan provides for payments to be made at an annual rate of .25% of the value of the Service shares’ average daily net assets.The Distributor may make payments to Participating Insurance Companies and to brokers and dealers acting as principal underwriter for their variable insurance products.The fees payable under the Plan are payable without regard to actual expenses incurred. During the period ended December 31, 2007, Service shares were charged $116,215 pursuant to the Plan.
The portfolio compensates Dreyfus Transfer, Inc., a wholly-owned subsidiary of the Manager, under a transfer agency agreement for pro-
The Portfolio 41
NOTES TO FINANCIAL STATEMENTS (continued)
|
viding personnel and facilities to perform transfer agency services for the portfolio. During the period ended December 31, 2007, the portfolio was charged $529 pursuant to the transfer agency agreement.
The portfolio compensates Mellon Bank, an affiliate of the Manager, under a custody agreement to provide custodial services for the portfolio. During the period ended December 31, 2007, the portfolio was charged $42,059 pursuant to the custody agreement.
During the period ended December 31, 2007, the portfolio was charged $4,821 for services performed by the Chief Compliance Officer.
The components of “Due to The Dreyfus Corporation and affiliates” in the Statement of Assets and Liabilities consist of: investment advisory fees $92,902, Rule 12b-1 distribution plan fees $9,418, custodian fees $20,370, chief compliance officer fees $3,616 and transfer agency per account fees $84.
(c) Each Board member also serves as a Board member of other funds within the Dreyfus complex. Annual retainer fees and attendance fees are allocated to each fund based on net assets.
NOTE 4-Securities Transactions:
The aggregate amount of purchases and sales (including paydowns) of investment securities, excluding short-term securities, financial futures, forward currency exchange contracts, options transactions and swap transactions, during the period ended December 31, 2007, amounted to $1,097,261,175 and $1,158,422,708, respectively, of which $557,332,985 in purchases and $557,514,005 in sales were from mortgage dollar roll transactions.
A mortgage dollar roll transaction involves a sale by the portfolio of mortgage related securities that it holds with an agreement by the portfolio to repurchase similar securities at an agreed upon price and date.The securities purchased will bear the same interest rate as those sold, but generally will be collateralized by pools of mortgages with different prepayment histories than those securities sold.
The portfolio may invest in financial futures contracts in order to gain exposure to or protect against changes in the market.The portfolio is exposed to market risk as a result of changes in the value of the underlying financial instruments. Investments in financial futures require the portfolio to “mark to market” on a daily basis, which reflects the change in market value of the contracts at the close of each day’s trading. Accordingly, variation margin payments are received or made to reflect daily unrealized gains or losses.When the contracts are closed, the portfolio recognizes a realized gain or loss. These investments require initial margin deposits with a broker, which consist of cash or cash equivalents. The amount of these deposits is determined by the exchange or Board of Trade on which the contract is traded and is subject to change. Contracts open at December 31, 2007, are set forth in the Statement of Financial Futures.
The portfolio may purchase and write (sell) put and call options in order to gain exposure to or to protect against changes in the market.
As a writer of call options, the portfolio receives a premium at the outset and then bears the market risk of unfavorable changes in the price of the financial instrument underlying the option. Generally, the portfolio would incur a gain, to the extent of the premium if the price of the underlying financial instrument decreases between the date the option is written and the date on which the option is terminated. Generally, the portfolio would realize a loss if the price of the financial instrument increases between those dates.
As a writer of put options, the portfolio receives a premium at the outset and then bears the market risk of unfavorable changes in the price of the financial instrument underlying the option. Generally, the portfolio would incur a gain, to the extent of the premium if the price of the underlying financial instrument increases between the date the option is written and the date on which the option is terminated. Generally, the portfolio would realize a loss if the price of the financial instrument
The Portfolio 43
NOTES TO FINANCIAL STATEMENTS (continued)
decreases between those dates.The following summarizes the portfolio’s call/put options written for the period ended December 31, 2007.
| | | Face Amount | | | | Options Terminated |
| | | | | |
|
| | | Covered by | | Premiums | | | | Net Realized |
| Options Written: | | Contracts ($) | | Received ($) | | Cost ($) | | Gain (Loss) ($) |
| |
| |
| |
| |
|
| Contracts outstanding | | | | | | | | |
| December 31, 2006 | | | | | | | | |
| Contracts written | | 36,750,000 | | 71,134 | | | | |
| Contracts terminated: | | | | | | | | |
| Contracts closed | | 29,300,000 | | 64,243 | | 58,272 | | 5,971 |
| Contracts expired | | 7,450,000 | | 6,891 | | | | 6,891 |
| Contracts exercised | | | | | | | | |
| Total contracts terminated | | 36,750,000 | | 71,134 | | 58,272 | | 12,862 |
| Contracts Outstanding | | | | | | | | |
| December 31, 2007 | | — | | — | | | | |
The portfolio may enter into forward currency exchange contracts in order to hedge its exposure to changes in foreign currency exchange rates on its foreign portfolio holdings and to settle foreign currency transactions.When executing forward currency exchange contracts, the portfolio is obligated to buy or sell a foreign currency at a specified rate on a certain date in the future.With respect to sales of forward currency exchange contracts, the portfolio would incur a loss if the value of the contract increases between the date the forward contract is opened and the date the forward contract is closed.The portfolio realizes a gain if the value of the contract decreases between those dates.With respect to purchases of forward currency exchange contracts, the portfolio would incur a loss if the value of the contract decreases between the date the forward contract is opened and the date the forward contract is closed. The portfolio realizes a gain if the value of the contract increases between those dates.The portfolio is also exposed to credit risk associated with counterparty nonperformance on these forward currency exchange contracts which is typically limited to the unrealized gain on each open contract. At December 31, 2007 the portfolio did not have any open forward currency exchange contracts.
The portfolio may enter into swap agreements to exchange the interest rate on, or return generated by, one nominal instrument for the return generated by another nominal instrument.
The portfolio accrues for the interim payments on swap contracts on a daily basis, with the net amount recorded within unrealized appreciation (depreciation) of swap contracts in the Statement of Assets and Liabilities. Once the interim payments are settled in cash, the net amount is recorded as realized gain (loss) on swaps, in addition to realized gain (loss) recorded upon the termination of swap contracts in the Statement of Operations. Fluctuations in the value of swap contracts are recorded as a component of net change in unrealized appreciation (depreciation) on investments.
Credit default swaps involve commitments to pay a fixed interest rate in exchange for payment if a credit event affecting a third party (the referenced company) occurs. Credit events may include a failure to pay interest or principal, bankruptcy, or restructuring. For those credit default swaps in which the fund is receiving a fixed rate, the fund is providing credit protection on the underlying instrument.The maximum payouts for these contracts are limited to the notional amount of each swap.The following summarizes credit default swaps entered into by the portfolio at December 31, 2007:
| | | | | | | | | | | Unrealized |
| Notional | | Reference | | | | (Pay)/Receive | | Appreciation |
| Amount ($) | | Entity | | Counterparty | | Fixed Rate (%) Expiration (Depreciation)($) |
| |
| |
| |
|
| |
| 470,000 | | Auto Receivables | | | | | | | | |
| | | Asset Backed | | | | | �� | | | |
| | | Securities, | | Lehman | | | | | | |
| | | 2007-1, BBB Index | | Brothers | | 1.50 | | 2/18/2014 | | (49,759) |
| 925,000 | | Autozone, 5.875%, | | Goldman, S | | | | | | |
| | | 10/15/2012 | | Sachs & Co. | | (.62) | | 6/20/2017 | | (2,352) |
| 407,000 | | Century Tel, | | | | | | | | |
| | | 7.875%, 8/15/2012 | | Citibank | | (1.16) | | 9/20/2015 | | (11,030) |
| 118,000 | | Century Tel, | | Morgan | | | | | | |
| | | 7.875%, 8/15/2012 | | Stanley | | (1.15) | | 9/20/2015 | | (3,122) |
| 900,000 | | Century Tel, | | | | | | | | |
| | | 7.875%, 8/15/2012 | | Citibank | | (1.19) | | 9/20/2015 | | (26,142) |
| 925,000 | | Dow Jones | | Goldman, | | | | | | |
| | | CDX.NA.IG.8 Index | | Sachs & Co | | .60 | | 6/20/2017 | | (22,695) |
| 797,000 | | Dow Jones | | | | | | | | |
| | | CDX.NA.IG.9 Index | | Deutsche Bank | | .80 | | 12/20/2017 | | (8,189) |
| 1,880,000 | | Dow Jones | | Goldman, | | | | | | |
| | | CDX.NA.IG.9 Index | | Sachs & Co | | .35 | | 12/20/2008 | | (6,422) |
| 460,000 | | Georgia-Pacific, | | | | | | | | |
| | | 7.75%, | | | | | | | | |
| | | 11/15/2029 | | JPMorgan | | 1.75 | | 6/20/2012 | | (27,923) |
The Portfolio 45
NOTES TO FINANCIAL STATEMENTS (continued)
|
| | | | | | | | | | | Unrealized |
| Notional | | Reference | | | | (Pay)/Receive | | Appreciation |
| Amount ($) | | Entity | | Counterparty | | Fixed Rate (%) Expiration (Depreciation)($) |
| |
| |
| |
|
| |
| 1,880,000 | | Liberty Mutual | | | | | | | | |
| | | Insurance Company, | | Lehman | | | | | | |
| | | 7.875%, | | | | | | | | |
| | | 10/15/2026 | | Brothers | | (.35) | | 12/20/2014 | | 1,304 |
| 920,000 | | Meadwestvaco, | | | | | | | | |
| | | 6.85%, 2012 | | JPMorgan | | (1.10) | | 6/20/2017 | | (8,001) |
| 290,000 | | TurAnlem | | | | | | | | |
| | | Finance, 8%, | | | | | | | | |
| | | 3/24/2014 | | UBS AG | | 1.15 | | 1/20/2008 | | (1,043) |
| Total | | | | | | | | | | (165,374) |
The portfolio may enter into interest rate swaps which involve the exchange of commitments to pay and receive interest based on a notional principal amount. At December 31, 2007, the portfolio did not have any open interest rate swap.
Total return swaps involve commitments to pay interest in exchange for a market-linked return based on a national amount.To the extent the total return of the security or index underlying the transaction exceeds or falls short of the offsetting interest rate obligation, the portfolio will receive a payment from or make a payment to the counterparty, respec-tively.At December 31, 2007, there was no open total return swap.
Risks may arise upon entering into these agreements from the potential inability of the counterparties to meet the terms of the agreement and are generally limited to the amount of net payments to be received, if any, at the date of default.
At December 31, 2007, the cost of investments for federal income tax purposes was $211,093,640; accordingly, accumulated net unrealized depreciation on investments was $2,298,340, consisting of $1,899,133 gross unrealized appreciation and $4,197,473 gross unrealized depreciation.
REPORT OF INDEPENDENT REGISTERED PUBLIC ACCOUNTING FIRM
Shareholders and Board of Trustees
Dreyfus Variable Investment Fund, Quality Bond Portfolio
We have audited the accompanying statement of assets and liabilities, including the statements of investments and financial futures, of Dreyfus Variable Investment Fund, Quality Bond Portfolio (one of the funds comprising Dreyfus Variable Investment Fund) as of December 31, 2007, and the related statement of operations for the year then ended, the statement of changes in net assets for each of the two years in the period then ended and financial highlights for each of the years indicated therein. These financial statements and financial highlights are the responsibility of the Fund’s management. Our responsibility is to express an opinion on these financial statements and financial highlights based on our audits.
We conducted our audits in accordance with the standards of the Public Company Accounting Oversight Board (United States). Those standards require that we plan and perform the audit to obtain reasonable assurance about whether the financial statements and financial highlights are free of material misstatement. We were not engaged to perform an audit of the Fund’s internal control over financial reporting. Our audits included consideration of internal control over financial reporting as a basis for designing audit procedures that are appropriate in the circumstances, but not for the purpose of expressing an opinion on the effectiveness of the Fund’s internal control over financial reporting. Accordingly, we express no such opinion. An audit also includes examining, on a test basis, evidence supporting the amounts and disclosures in the financial statements and financial highlights, assessing the accounting principles used and significant estimates made by management, and evaluating the overall financial statement presentation. Our procedures included confirmation of securities owned as of December 31, 2007 by correspondence with the custodian and others. We believe that our audits provide a reasonable basis for our opinion.
In our opinion, the financial statements and financial highlights referred to above present fairly, in all material respects, the financial position of Dreyfus Variable Investment Fund, Quality Bond Portfolio at December 31,2007,the results of its operations for the year then ended,the changes in its net assets for each of the two years in the period then ended and the financial highlights for each of the indicated years, in conformity with U.S. generally accepted accounting principles.
| | New York, New York
February 8, 2008
|
The Portfolio 47
BOARD MEMBERS INFORMATION (Unaudited)
Joseph S. DiMartino (64)
Chairman of the Board (1995)
|
Principal Occupation During Past 5 Years:
• Corporate Director and Trustee
|
Other Board Memberships and Affiliations:
|
- The Muscular Dystrophy Association, Director
- Century Business Services, Inc., a provider of outsourcing functions for small and medium size companies, Director
- The Newark Group, a provider of a national market of paper recovery facilities, paperboard mills and paperboard converting plants, Director
- Sunair Services Corporation, a provider of certain outdoor-related services to homes and businesses, Director
| No. of Portfolios for which Board Member Serves: 163 |
| ——————— |
| Peggy C. Davis (64) |
| Board Member (2006) |
Principal Occupation During Past 5 Years:
|
- Shad Professor of Law, New York University School of Law (1983-present)
- Writer and teacher in the fields of evidence, constitutional theory, family law, social sciences and the law, legal process and professional methodology and training
| No. of Portfolios for which Board Member Serves: 64 |
| ——————— |
| David P. Feldman (68) |
| Board Member (1994) |
Principal Occupation During Past 5 Years:
• Corporate Director and Trustee
|
Other Board Memberships and Affiliations:
|
- BBH Mutual Funds Group (11 funds), Director
- The Jeffrey Company, a private investment company, Director
No. of Portfolios for which Board Member Serves: 50
James F. Henry (77)
Board Member (1990)
|
Principal Occupation During Past 5 Years:
|
- President,The International Institute for Conflict Prevention and Resolution, a non- profit organization principally engaged in the development of alternatives to business litigation (Retired 2003)
- Advisor to The Elaw Forum, a consultant on managing corporate legal costs
- Advisor to John Jay Homestead (the restored home of the first U.S. Chief Justice)
- Individual Trustee of several trusts
Other Board Memberships and Affiliations:
|
- Director, advisor and mediator involved in several non-profit organizations, primarily engaged in domestic and international dispute resolution, and historic preservation
| No. of Portfolios for which Board Member Serves: 41 |
| ——————— |
| Ehud Houminer (67) |
| Board Member (2006) |
| Principal Occupation During Past 5 Years: |
| • Executive-in-Residence at the Columbia Business School, Columbia University |
Other Board Memberships and Affiliations:
|
- Avnet Inc., an electronics distributor, Director
- International Advisory Board to the MBA Program School of Management, Ben Gurion University, Chairman
| No. of Portfolios for which Board Member Serves: 67 |
| ——————— |
| Gloria Messinger (78) |
| Board Member (2006) |
Principal Occupation During Past 5 Years:
|
- Arbitrator for American Arbitration Association and National Association of Securities Dealers, Inc.
- Consultant in Intellectual Property
Other Board Memberships and Affiliations:
|
- Theater for a New Audience, Inc., Director
- Brooklyn Philharmonic, Director
No. of Portfolios for which Board Member Serves: 41
|
The Portfolio 49
BOARD MEMBERS INFORMATION (Unaudited) (continued)
Dr. Martin Peretz (68)
Board Member (1990)
|
Principal Occupation During Past 5 Years:
|
- Editor-in-Chief of The New Republic Magazine
- Lecturer in Social Studies at Harvard University (1965-2002)
- Director of TheStreet.com, a financial information service on the web
Other Board Memberships and Affiliations:
|
- American Council of Trustees and Alumni, Director
- Pershing Square Capital Management, Advisor
- Montefiore Ventures, General Partner
- Harvard Center for Blood Research,Trustee
- Bard College,Trustee
- Board of Overseers of YIVO Institute for Jewish Research, Chairman
| No. of Portfolios for which Board Member Serves: 41 |
| ——————— |
| Anne Wexler (77) |
| Board Member (2006) |
Principal Occupation During Past 5 Years:
|
- Chairman of the Wexler & Walker Public Policy Associates, consultants specializing in government relations and public affairs from January 1981 to present
Other Board Memberships and Affiliations:
|
- Wilshire Mutual Funds (5 funds), Director
- The Community Foundation for the National Capital Region, Director
- Member of the Council of Foreign Relations
- Member of the National Park Foundation
| No. of Portfolios for which Board Member Serves: 50 |
| ——————— |
Once elected all Board Members serve for an indefinite term, but achieve Emeritus status upon reaching age 80.The address of the Board Members and Officers is in c/o The Dreyfus Corporation, 200 Park Avenue, New York, New York 10166. Additional information about the Board Members is available in the fund’s Statement of Additional Information which can be obtained from Dreyfus free of charge by calling this toll free number: 1-800-554-4611.
John M. Fraser, Jr., Emeritus Board Member
Dr. Paul A. Marks, Emeritus Board Member
Rosalind G. Jacobs, Emeritus Board Member
OFFICERS OF THE FUND (Unaudited)
| J. DAVID OFFICER, President since |
| December 2006. |
Chief Operating Officer,Vice Chairman and a Director of the Manager, and an officer of 78 investment companies (comprised of 163 portfolios) managed by the Manager. He is 59 years old and has been an employee of the Manager since April 1998.
| PHILLIP N. MAISANO, Executive Vice |
| President since July 2007. |
Chief Investment Officer,Vice Chair and a director of the Manager, and an officer of 78 investment companies (comprised of 163 portfolios) managed by the Manager. Mr. Maisano also is an officer and/or Board member of certain other investment management subsidiaries of The Bank of New York Mellon Corporation, each of which is an affiliate of the Manager. He is 60 years old and has been an employee of the Manager since November 2006. Prior to joining the Manager, Mr. Maisano served as Chairman and Chief Executive Officer of EACM Advisors, an affiliate of the Manager, since August 2004, and served as Chief Executive Officer of Evaluation Associates, a leading institutional investment consulting firm, from 1988 until 2004.
| MICHAEL A. ROSENBERG, Vice President |
| and Secretary since August 2005. |
Associate General Counsel of the Manager, and an officer of 79 investment companies (comprised of 180 portfolios) managed by the Manager. He is 47 years old and has been an employee of the Manager since October 1991.
JAMES BITETTO, Vice President and Assistant Secretary since August 2005.
Associate General Counsel and Secretary of the Manager, and an officer of 79 investment companies (comprised of 180 portfolios) managed by the Manager. He is 41 years old and has been an employee of the Manager since December 1996.
| JONI LACKS CHARATAN, Vice President |
| and Assistant Secretary since |
| August 2005. |
Associate General Counsel of the Manager, and an officer of 79 investment companies (comprised of 180 portfolios) managed by the Manager. She is 52 years old and has been an employee of the Manager since October 1988.
| JOSEPH M. CHIOFFI, Vice President and |
| Assistant Secretary since August 2005. |
Associate General Counsel of the Manager, and an officer of 79 investment companies (comprised of 180 portfolios) managed by the Manager. He is 46 years old and has been an employee of the Manager since June 2000.
| JANETTE E. FARRAGHER, Vice President |
| and Assistant Secretary since |
| August 2005. |
Associate General Counsel of the Manager, and an officer of 79 investment companies (comprised of 180 portfolios) managed by the Manager. She is 45 years old and has been an employee of the Manager since February 1984.
| JOHN B. HAMMALIAN, Vice President and |
| Assistant Secretary since August 2005. |
Associate General Counsel of the Manager, and an officer of 79 investment companies (comprised of 180 portfolios) managed by the Manager. He is 44 years old and has been an employee of the Manager since February 1991.
| ROBERT R. MULLERY, Vice President and |
| Assistant Secretary since August 2005. |
Associate General Counsel of the Manager, and an officer of 79 investment companies (comprised of 180 portfolios) managed by the Manager. He is 55 years old and has been an employee of the Manager since May 1986.
The Portfolio 51
OFFICERS OF THE FUND (Unaudited) (continued)
| JEFF PRUSNOFSKY, Vice President and |
| Assistant Secretary since August 2005. |
Associate General Counsel of the Manager, and an officer of 79 investment companies (comprised of 180 portfolios) managed by the Manager. He is 42 years old and has been an employee of the Manager since October 1990.
| JAMES WINDELS, Treasurer since |
| November 2001. |
Director – Mutual Fund Accounting of the Manager, and an officer of 79 investment companies (comprised of 180 portfolios) managed by the Manager. He is 49 years old and has been an employee of the Manager since April 1985.
| ROBERT ROBOL, Assistant Treasurer |
| since August 2003. |
Senior Accounting Manager – Money Market and Municipal Bond Funds of the Manager, and an officer of 79 investment companies (comprised of 180 portfolios) managed by the Manager. He is 43 years old and has been an employee of the Manager since October 1988.
| ROBERT SALVIOLO, Assistant Treasurer |
| since July 2007. |
Senior Accounting Manager – Equity Funds of the Manager, and an officer of 79 investment companies (comprised of 180 portfolios) managed by the Manager. He is 40 years old and has been an employee of the Manager since June 1989.
| ROBERT SVAGNA, Assistant Treasurer |
| since December 2002. |
Senior Accounting Manager – Equity Funds of the Manager, and an officer of 79 investment companies (comprised of 180 portfolios) managed by the Manager. He is 40 years old and has been an employee of the Manager since November 1990.
| GAVIN C. REILLY, Assistant Treasurer |
| since December 2005. |
Tax Manager of the Investment Accounting and Support Department of the Manager, and an officer of 79 investment companies (comprised of 180 portfolios) managed by the Manager. He is 39 years old and has been an employee of the Manager since April 1991.
| JOSEPH W. CONNOLLY, Chief Compliance |
| Officer since October 2004. |
Chief Compliance Officer of the Manager and The Dreyfus Family of Funds (79 investment companies, comprised of 180 portfolios). From November 2001 through March 2004, Mr. Connolly was first Vice-President, Mutual Fund Servicing for Mellon Global Securities Services. In that capacity, Mr. Connolly was responsible for managing Mellon’s Custody, Fund Accounting and Fund Administration services to third-party mutual fund clients. He is 50 years old and has served in various capacities with the Manager since 1980, including manager of the firm’s Fund Accounting Department from 1997 through October 2001.
| WILLIAM GERMENIS, Anti-Money |
| Laundering Compliance Officer since |
| September 2002. |
Vice President and Anti-Money Laundering Compliance Officer of the Distributor, and the Anti-Money Laundering Compliance Officer of 75 investment companies (comprised of 176 portfolios) managed by the Manager. He is 37 years old and has been an employee of the Distributor since October 1998.
| Telephone 1-800-554-4611 or 516-338-3300 |
| Mail | | The Dreyfus Family of Funds, 144 Glenn Curtiss Boulevard, Uniondale, NY 11556-0144 |
| | | Attn: Investments Division |
The portfolio files its complete schedule of portfolio holdings with the Securities and Exchange Commission (“SEC”) for the first and third quarters of each fiscal year on Form N-Q. The portfolio’s Forms N-Q are available on the SEC’s website at http://www.sec.gov and may be reviewed and copied at the SEC’s Public Reference Room in Washington, DC. Information on the operation of the Public Reference Room may be obtained by calling 1-202-551-8090.
A description of the policies and procedures that the portfolio uses to determine how to vote proxies relating to portfolio securities, and information regarding how the portfolio voted these proxies for the 12-month period ended June 30, 2007, is available at http://www.dreyfus.com and on the SEC’s website at http://www.sec.gov. The description of the policies and procedures is also available without charge, upon request, by calling 1-800-645-6561.

Item 2. Code of Ethics.
The Registrant has adopted a code of ethics that applies to the Registrant's principal executive officer, principal financial officer, principal accounting officer or controller, or persons performing similar functions. There have been no amendments to, or waivers in connection with, the Code of Ethics during the period covered by this Report.
Item 3. Audit Committee Financial Expert.
The Registrant's Board has determined that David P. Feldman, a member of the Audit Committee of the Board, is an audit committee financial expert as defined by the Securities and Exchange Commission (the "SEC"). David P. Feldman is "independent" as defined by the SEC for purposes of audit committee financial expert determinations.
Item 4. Principal Accountant Fees and Services
(a) Audit Fees. The aggregate fees billed for each of the last two fiscal years (the "Reporting Periods") for professional services rendered by the Registrant's principal accountant (the "Auditor") for the audit of the Registrant's annual financial statements, or services that are normally provided by the Auditor in connection with the statutory and regulatory filings or engagements for the Reporting Periods, were $254,905 in 2006 and $148,695 in 2007.
(b) Audit-Related Fees. The aggregate fees billed in the Reporting Periods for assurance and related services by the Auditor that are reasonably related to the performance of the audit of the Registrant's financial statements and are not reported under paragraph (a) of this Item 4 were $84,427 in 2006 and $91,494 in 2007. These services consisted of (i) agreed-upon procedures related to compliance with Internal Revenue Code section 817(h) and (ii) security counts required by Rule 17f-2 under the Investment Company Act of 1940, as amended.
The aggregate fees billed in the Reporting Periods for non-audit assurance and related services by the Auditor to the Registrant's investment adviser (not including any sub-investment adviser whose role is primarily portfolio management and is subcontracted with or overseen by another investment adviser), and any entity controlling, controlled by or under common control with the investment adviser that provides ongoing services to the Registrant ("Service Affiliates"), that were reasonably related to the performance of the annual audit of the Service Affiliate, which required pre-approval by the Audit Committee were $-0- in 2006 and $-0- in 2007.
Note: For the second paragraph in each of (b) through (d) of this Item 4, certain of such services were not pre-approved prior to May 6, 2003, when such services were required to be pre-approved. On and after May 6, 2003, 100% of all services provided by the Auditor were pre-approved as required. For comparative purposes, the fees shown assume that all such services were pre-approved, including services that were not pre-approved prior to the compliance date of the pre-approval requirement.
(c) Tax Fees. The aggregate fees billed in the Reporting Periods for professional services rendered by the Auditor for tax compliance, tax advice and tax planning ("Tax Services") were $52,913 in 2006 and $24,931 in 2007. These services consisted of (i) review or preparation of U.S. federal, state, local and excise tax returns; (ii) U.S. federal, state and local tax planning, advice and assistance regarding statutory, regulatory or administrative developments, (iii) tax advice regarding tax qualification matters and/or treatment of various financial instruments held or proposed to be acquired or held, and (iv) determination of Passive Foreign Investment Companies (as applicable).
The aggregate fees billed in the Reporting Periods for Tax Services by the Auditor to Service Affiliates which required pre-approval by the Audit Committee were $-0- in 2006 and $-0- in 2007.
(d) All Other Fees. The aggregate fees billed in the Reporting Periods for products and services provided by the Auditor, other than the services reported in paragraphs (a) through (c) of this Item, were $20 in 2006 and $-0- in 2007. These services consisted of a review of the Registrant's anti-money laundering program.
The aggregate fees billed in the Reporting Periods for Non-Audit Services by the Auditor to Service Affiliates, other than the services reported in paragraphs (b) through (c) of this Item, which required pre-approval by the Audit Committee were $-0- in 2006 and $-0- in 2007.
Audit Committee Pre-Approval Policies and Procedures. The Registrant's Audit Committee has established policies and procedures (the "Policy") for pre-approval (within specified fee limits) of the Auditor's engagements for non-audit services to the Registrant and Service Affiliates without specific case-by-case consideration. Pre-approval considerations include whether the proposed services are compatible with maintaining the Auditor's independence. Pre-approvals pursuant to the Policy are considered annually.
Non-Audit Fees. The aggregate non-audit fees billed by the Auditor for services rendered to the Registrant, and rendered to Service Affiliates, for the Reporting Periods were $383,726 in 2006 and $1,889,332 in 2007.
Auditor Independence. The Registrant's Audit Committee has considered whether the provision of non-audit services that were rendered to Service Affiliates which were not pre-approved (not requiring pre-approval) is compatible with maintaining the Auditor's independence.
| Item 5. | | Audit Committee of Listed Registrants. |
| | | Not applicable. [CLOSED-END FUNDS ONLY] |
| Item 6. | | Schedule of Investments. |
| | | Not applicable. |
| Item 7. | | Disclosure of Proxy Voting Policies and Procedures for Closed-End |
| | | Management Investment Companies. |
| | | Not applicable. [CLOSED-END FUNDS ONLY] |
| Item 8. | | Portfolio Managers of Closed-End Management Investment Companies. |
| | | Not applicable. [CLOSED-END FUNDS ONLY, beginning with reports for periods |
| | | ended on and after December 31, 2005] |
| Item 9. | | Purchases of Equity Securities by Closed-End Management Investment |
| | | Companies and Affiliated Purchasers. |
| | | Not applicable. [CLOSED-END FUNDS ONLY] |
| Item 10. | | Submission of Matters to a Vote of Security Holders. |
The Registrant has a Nominating Committee (the "Committee"), which is responsible for selecting and nominating persons for election or appointment by the Registrant's Board as Board members. The Committee has adopted a Nominating Committee Charter (the "Charter"). Pursuant to the Charter, the Committee will consider recommendations for nominees from shareholders submitted to the Secretary of the Registrant, c/o The Dreyfus Corporation Legal Department, 200 Park Avenue, 8th Floor East, New York, New York 10166. A nomination submission must include information regarding the recommended nominee as specified in the Charter. This information includes all information relating to a recommended nominee that is required to be disclosed in solicitations or proxy statements for the election of Board members, as well as information sufficient to evaluate the factors to be considered by the Committee, including character and integrity, business and professional experience, and whether the person has the ability to apply sound and independent business judgment and would act in the interests of the Registrant and its shareholders. Nomination submissions are required to be accompanied by a written consent of the individual to stand for election if nominated by the Board and to serve if elected by the shareholders, and such additional information must be provided regarding the recommended nominee as reasonably requested by the Committee.
Item 11. Controls and Procedures.
(a) The Registrant's principal executive and principal financial officers have concluded, based on their evaluation of the Registrant's disclosure controls and procedures as of a date within 90 days of the filing date of this report, that the Registrant's disclosure controls and procedures are reasonably designed to ensure that information required to be disclosed by the Registrant on Form N-CSR is recorded, processed, summarized and reported within the required time periods and that information required to be disclosed by the Registrant in the reports that it files or submits on Form N-CSR is accumulated and communicated to the Registrant's management, including its principal executive and principal financial officers, as appropriate to allow timely decisions regarding required disclosure.
(b) There were no changes to the Registrant's internal control over financial reporting that occurred during the second fiscal quarter of the period covered by this report that have materially affected, or are reasonably likely to materially affect, the Registrant's internal control over financial reporting.
Item 12. Exhibits.
| (a)(1) | | Code of ethics referred to in Item 2. |
| (a)(2) | | Certifications of principal executive and principal financial officers as required by Rule 30a- |
| 2(a) under the Investment Company Act of 1940. |
| (a)(3) | | Not applicable. |
| (b) | | Certification of principal executive and principal financial officers as required by Rule 30a- |
| 2(b) under the Investment Company Act of 1940. |
SIGNATURES
Pursuant to the requirements of the Securities Exchange Act of 1934 and the Investment Company Act of 1940, the Registrant has duly caused this Report to be signed on its behalf by the undersigned, thereunto duly authorized.
Dreyfus Variable Investment Fund
| By: | | /s/ J. David Officer |
| | | J. David Officer |
| | | President |
| |
| Date | | February 14, 2008 |
| : | | |
Pursuant to the requirements of the Securities Exchange Act of 1934 and the Investment Company Act of 1940, this Report has been signed below by the following persons on behalf of the Registrant and in the capacities and on the dates indicated.
| By: | | /s/ J. David Officer |
| | | J. David Officer |
| | | President |
| |
| Date | | February 14, 2008 |
| : | | |
| |
| By: | | /s/ James Windels |
| | | James Windels |
| | | Treasurer |
| |
| Date | | February 14, 2008 |
EXHIBIT INDEX
| (a)(1) | | Code of ethics referred to in Item 2. |
| |
| (a)(2) | | Certifications of principal executive and principal financial officers as required by |
| Rule 30a-2(a) under the Investment Company Act of 1940. (EX-99.CERT) |
| |
| (b) | | Certification of principal executive and principal financial officers as required by |
| Rule 30a-2(b) under the Investment Company Act of 1940. (EX-99.906CERT) |