| | | UNITED STATES |
| | | SECURITIES AND EXCHANGE COMMISSION |
| | | Washington, D.C. 20549 |
| |
| |
| | | FORM N-CSR |
| |
| CERTIFIED SHAREHOLDER REPORT OF REGISTERED MANAGEMENT |
| | | INVESTMENT COMPANIES |
| |
| Investment Company Act file number 811-5125 |
| |
| | | Dreyfus Variable Investment Fund |
| | | (Exact name of Registrant as specified in charter) |
| |
| |
| | | c/o The Dreyfus Corporation |
| | | 200 Park Avenue |
| | | New York, New York 10166 |
| | | (Address of principal executive offices) (Zip code) |
| |
| | | Mark N. Jacobs, Esq. |
| | | 200 Park Avenue |
| | | New York, New York 10166 |
| | | (Name and address of agent for service) |
| |
| Registrant's telephone number, including area code: (212) 922-6000 |
| |
| Date of fiscal year end: | | 12/31 |
| |
| Date of reporting period: | | 12/31/06 |
| | | | | FORM N-CSR |
| Item 1. | | Reports to Stockholders. | | |
The views expressed in this report reflect those of the portfolio manager only through the end of the period covered and do not necessarily represent the views of Dreyfus or any other person in the Dreyfus organization.Any such views are subject to change at any time based upon market or other conditions and Dreyfus disclaims any responsibility to update such views. These views may not be relied on as investment advice and, because investment decisions for a Dreyfus portfolio are based on numerous factors, may not be relied on as an indication of trading intent on behalf of any Dreyfus portfolio.
Not FDIC-Insured • Not Bank-Guaranteed • May Lose Value
| | | Contents |
| |
| | | T H E P O R T F O L I O |
| |
|
| 2 | | A Letter from the CEO |
| 3 | | Discussion of Performance |
| 6 | | Portfolio Performance |
| 8 | | Understanding Your Portfolio’s Expenses |
| 8 | | Comparing Your Portfolio’s Expenses |
| | | With Those of Other Funds |
| 9 | | Statement of Investments |
| 12 | | Statement of Assets and Liabilities |
| 13 | | Statement of Operations |
| 14 | | Statement of Changes in Net Assets |
| 16 | | Financial Highlights |
| 18 | | Notes to Financial Statements |
| 26 | | Report of Independent Registered |
| | | Public Accounting Firm |
| 27 | | Important Tax Information |
| 27 | | Proxy Results |
| 28 | | Board Members Information |
| 31 | | Officers of the Fund |
| | | F O R M O R E I N F O R M AT I O N |
| |
|
| | | Back Cover |
| Dreyfus Variable Investment Fund, |
| Appreciation Portfolio |
The Portfolio

A LETTER FROM THE CEO
Dear Shareholder:
We are pleased to present this annual report for Dreyfus Variable Investment Fund, Appreciation Portfolio, covering the 12-month period from January 1, 2006, through December 31, 2006.
2006 proved to be a good year for the financial markets.Virtually all sectors and capitalization ranges of the U.S. equity markets generated strong returns, especially over the second half of the year.A number of positive factors contributed to the markets’ gains in 2006, including an expanding domestic economy, subdued inflation, stabilizing interest rates, rising productivity and robust corporate profits.
In our analysis, 2006 provided an excellent reminder of the need for a long-term investment perspective. Adopting too short a time frame proved costly for some investors last year, as chasing recent winners often meant buying the next month’s losers. Indeed, history shows that reacting to near-term developments with extreme shifts in strategy rarely is the right decision.We believe that a better course of action is to set a portfolio mix to meet future goals, while attempting to ignore short term market fluctuations in favor of a longer-term view.
For information about how the portfolio performed during the reporting period, as well as market perspectives, we have provided a Discussion of Performance given by the portfolio manager.
Thank you for your continued confidence and support.We wish you good health and prosperity in 2007.

Thomas F. Eggers
Chief Executive Officer
The Dreyfus Corporation
January 16, 2007
|

DISCUSSION OF PERFORMANCE
Fayez Sarofim, Portfolio Manager
Fayez Sarofim & Co., Sub-Investment Adviser
|
How did Dreyfus Variable Investment Fund, Appreciation Portfolio perform relative to its benchmark?
For the 12-month period ended December 31, 2006, the portfolio’s Initial shares produced a total return of 16.48%, and its Service shares produced a total return of 16.21% .1 In comparison, the total return of the portfolio’s benchmark, the Standard & Poor’s 500 Composite Stock Price Index (“S&P 500 Index”), was 15.78% for the same period.2
After relatively lackluster performance during the first half of 2006, stocks rallied over the second half of the year, with particularly strong returns from the large, multinational corporations in which the portfolio primarily invests. Consequently, the portfolio produced higher returns than the S&P 500 Index. The portfolio’s returns were driven by especially attractive results in the energy sector, which has been an area of relatively heavy emphasis for some time.
What is the portfolio’s investment approach?
The portfolio normally invests at least 80% of its assets in common stocks. The portfolio focuses on large, well-established multinational growth companies that have demonstrated sustained patterns of profitability, strong balance sheets, an expanding global presence and the potential to achieve predictable above-average earnings growth. We focus on purchasing reasonably priced growth stocks of fundamentally sound companies in economic sectors that we believe will expand over the next three to five years or longer.
What other factors influenced the portfolio’s performance?
The U.S. stock market generally experienced two very different investment environments in 2006.The first six months of the year saw robust economic growth, intensifying inflation concerns and rising
DISCUSSION OF PERFORMANCE (continued)
|
interest rates. Against this backdrop, stocks encountered heightened volatility as investors first worried that a relatively accommodative monetary policy might rekindle inflationary pressures, and then grew concerned that an overly aggressive Federal Reserve Board (the “Fed”) could trigger an economic recession.
These concerns began to subside over the second half of the year, as housing markets cooled, labor gains moderated and energy prices fell. The Fed lent credence to a more benign inflation outlook when it refrained from raising interest rates over the final six months of the year, its first pause in more than two years. Easing inflation worries, expectations of an economic “soft landing” and strong corporate earnings helped fuel a sustained market rally over the second half of the year, enabling the S&P 500 Index to end the year with a respectable gain.The second half of the year also marked a fundamental change in market leadership. Investors grew more risk-averse as the economy slowed, and they began to favor high-quality corporate giants over the lower-quality, small-cap companies that had led the market over the past several years.
Relatively heavy exposure to energy companies and a successful security selection strategy within the energy sector were the primary drivers of the portfolio’s strong relative performance. As might be expected, energy stocks generally gained value when crude oil and natural gas prices climbed to record highs during the summer. Unlike many smaller energy companies, the portfolio’s holdings of major integrated oil companies continued to produce robust earnings even when commodity prices retreated in the fall, mainly because their diversified operations provided a degree of protection from fluctuating oil and gas prices.As a result, industry leader Exxon Mobil ranked as the portfolio’s top performer for 2006.
In addition, the portfolio achieved relatively attractive results in the health care area, where stocks of large pharmaceutical companies rebounded from earlier weakness. U.S. drug developers’ product-development and regulatory problems began to ease, enabling the stocks of portfolio holdings such as Pfizer and Merck & Co. to recover
from relatively low valuations. Finally, a number of the portfolio’s consumer discretionary holdings fared well. Publisher The McGraw-Hill Companies benefited from ongoing strength in its textbook and financial divisions, while media conglomerate News Corp. gained value after its acquisition of the popular “MySpace” Internet site.
What is the portfolio’s current strategy?
We have continued to focus on our longstanding strategy of investing in leading corporations and holding them for the long term. Nonetheless, we eliminated the portfolio’s positions in consumer products provider Colgate Palmolive and media giant Time Warner due to company-specific issues that made them less attractive to us than other alternatives. We added three new positions to the portfolio: construction services company Fluor, financial services company Capital One and lodging chain Hilton Hotels.We believe that the portfolio is well positioned to benefit from a slower-growth environment in 2007, which we expect to favor well-established companies that have demonstrated their ability to produce consistent earnings under a variety of economic conditions.
January 16, 2007
| | | The portfolio is only available as a funding vehicle under variable life insurance policies or variable |
| | | annuity contracts issued by insurance companies. Individuals may not purchase shares of the |
| | | portfolio directly. A variable annuity is an insurance contract issued by an insurance company that |
| | | enables investors to accumulate assets on a tax-deferred basis for retirement or other long-term |
| | | goals.The investment objective and policies of Dreyfus Variable Investment Fund, Appreciation |
| | | Portfolio made available through insurance products may be similar to other funds/portfolios |
| | | managed or advised by Dreyfus. However, the investment results of the portfolio may be higher or |
| | | lower than, and may not be comparable to, those of any other Dreyfus fund/portfolio. |
| 1 | | Total return includes reinvestment of dividends and any capital gains paid. Past performance is no |
| | | guarantee of future results. Share price and investment return fluctuate such that upon redemption, |
| | | portfolio shares may be worth more or less than their original cost.The portfolio’s performance does |
| | | not reflect the deduction of additional charges and expenses imposed in connection with investing |
| | | in variable insurance contracts, which will reduce returns. |
| 2 | | SOURCE: LIPPER INC. — Reflects monthly reinvestment of dividends and, where |
| | | applicable, capital gain distributions.The Standard & Poor’s 500 Composite Stock Price Index is |
| | | a widely accepted, unmanaged index of U.S. stock market performance. |
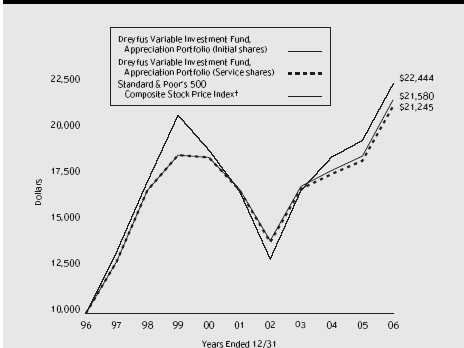
Comparison of change in value of $10,000 investment in Dreyfus Variable Investment Fund, Appreciation Portfolio Initial shares and Service shares and the Standard & Poor’s 500 Composite Stock Price Index
| Average Annual Total Returns as of | | 12/31/06 | | | | |
| |
| | | 1 Year | | 5 Years | | 10 Years |
| |
| |
| |
|
| Initial shares | | 16.48% | | 5.21% | | 8.00% |
| Service shares | | 16.21% | | 4.95% | | 7.83% |
| |
| The data for Service shares includes the results of Initial shares for the period prior to December 31, 2000 |
| (inception date of Service shares). Actual Service shares’ average annual total return and hypothetical growth |
| results would have been lower. See notes below. | | | | | | |
| † Source: Lipper Inc. | | | | | | |
| Past performance is not predictive of future performance.The portfolio’s performance shown in the graph and table does not |
| reflect the deduction of taxes that a shareholder would pay on portfolio distributions or the redemption of portfolio shares. |
| The portfolio’s performance does not reflect the deduction of additional charges and expenses imposed in |
| connection with investing in variable insurance contracts which will reduce returns. | | |
| The above graph compares a $10,000 investment made in Initial and Service shares of Dreyfus Variable Investment |
| Fund, Appreciation Portfolio on 12/31/96 to a $10,000 investment made in the Standard & Poor’s 500 Composite |
| Stock Price Index (the “Index”) on that date. | | | | | | |
| 6 | | | | | | |
The portfolio’s Initial shares are not subject to a Rule 12b-1 fee.The portfolio’s Service shares are subject to a 0.25% annual Rule 12b-1 fee.The performance figures for Service shares reflect the performance of the portfolio’s Initial shares from their inception date through December 30, 2000, and the performance of the portfolio’s Service shares from December 31, 2000 (inception date of Service shares) to December 31, 2006 (blended performance figures).The blended performance figures have not been adjusted to reflect the higher operating expenses of the Service shares. If these expenses had been reflected, the blended performance figures would have been lower. All dividends and capital gain distributions are reinvested.
The portfolio’s performance shown in the line graph takes into account all applicable portfolio fees and expenses.The Index is a widely accepted, unmanaged index of U.S. stock market performance, which does not take into account charges, fees and other expenses. Further information relating to portfolio performance, including expense reimbursements, if applicable, is contained in the Financial Highlights section of the prospectus and elsewhere in this report.
UNDERSTANDING YOUR
PORTFOLIO’S EXPENSES (Unaudited)
As a mutual fund investor,you pay ongoing expenses,such as management fees and other expenses.Using the information below,you can estimate how these expenses affect your investment and compare them with the expenses of other funds.You also may pay one-time transaction expenses,including sales charges (loads) and redemption fees, which are not shown in this section and would have resulted in higher total expenses. For more information, see your portfolio’s prospectus or talk to your financial adviser.
Review your portfolio’s expenses
The table below shows the expenses you would have paid on a $1,000 investment in Dreyfus Variable Investment Fund,Appreciation Portfolio from July 1, 2006 to December 31, 2006. It also shows how much a $1,000 investment would be worth at the close of the period, assuming actual returns and expenses.
| Expenses and Value of a $1,000 Investment | | |
| assuming actual returns for the six months ended December 31, 2006 |
| | | Initial Shares | | Service Shares |
| |
| |
|
| Expenses paid per $1,000 † | | $ 4.47 | | $ 5.87 |
| Ending value (after expenses) | | $1,136.20 | | $1,134.90 |
COMPARING YOUR PORTFOLIO’S EXPENSES WITH THOSE OF OTHER FUNDS (Unaudited)
Using the SEC’s method to compare expenses
The Securities and Exchange Commission (SEC) has established guidelines to help investors assess fund expenses. Per these guidelines, the table below shows your portfolio’s expenses based on a $1,000 investment, assuming a hypothetical 5% annualized return. You can use this information to compare the ongoing expenses (but not transaction expenses or total cost) of investing in the portfolio with those of other funds. All mutual fund shareholder reports will provide this information to help you make this comparison. Please note that you cannot use this information to estimate your actual ending account balance and expenses paid during the period.
Expenses and Value of a $1,000 Investment assuming a hypothetical 5% annualized return for the six months ended December 31, 2006
| | | Initial Shares | | Service Shares |
| |
| |
|
| Expenses paid per $1,000 † | | $ 4.23 | | $ 5.55 |
| Ending value (after expenses) | | $1,021.02 | | $1,019.71 |
† Expenses are equal to the portfolio’s annualized expense ratio of .83% for Initial shares and 1.09% for Service shares, multiplied by the average account value over the period, multiplied by 184/365 (to reflect the one-half year period).
STATEMENT OF INVESTMENTS
December 31, 2006
|
| Common Stocks—100.0% | | Shares | | Value ($) |
| |
| |
|
| Banks—3.9% | | | | |
| Bank of America | | 291,216 | | 15,548,022 |
| HSBC Holdings, ADR | | 50,000 a | | 4,582,500 |
| SunTrust Banks | | 128,600 | | 10,860,270 |
| | | | | 30,990,792 |
| Capital Goods—7.2% | | | | |
| Emerson Electric | | 329,800 | | 14,540,882 |
| Fluor | | 40,000 a | | 3,266,000 |
| General Electric | | 1,065,500 | | 39,647,255 |
| | | | | 57,454,137 |
| Consumer Durables & Apparel—1.4% | | |
| Christian Dior | | 72,700 a | | 7,746,745 |
| Polo Ralph Lauren | | 40,000 a | | 3,106,400 |
| | | | | 10,853,145 |
| Consumer Services—2.4% | | | | |
| Hilton Hotels | | 170,000 a | | 5,933,000 |
| McDonald’s | | 304,500 | | 13,498,485 |
| | | | | 19,431,485 |
| Diversified Financials—11.3% | | | | |
| American Express | | 250,500 | | 15,197,835 |
| Ameriprise Financial | | 61,500 | | 3,351,750 |
| Capital One Financial | | 85,000 | | 6,529,700 |
| Citigroup | | 601,524 | | 33,504,887 |
| JPMorgan Chase & Co. | | 365,100 | | 17,634,330 |
| Merrill Lynch & Co. | | 145,500 | | 13,546,050 |
| | | | | 89,764,552 |
| Energy—17.7% | | | | |
| BP, ADR | | 133,000 | | 8,924,300 |
| Chevron | | 432,800 | | 31,823,784 |
| ConocoPhillips | | 215,000 | | 15,469,250 |
| Exxon Mobil | | 840,064 | | 64,374,104 |
| Occidental Petroleum | | 150,000 | | 7,324,500 |
| Royal Dutch Shell, Cl. A, ADR | | 59,800 | | 4,233,242 |
| Total, ADR | | 120,000 | | 8,630,400 |
| | | | | 140,779,580 |
| Food & Staples Retailing—6.3% | | | | |
| SYSCO | | 100,000 | | 3,676,000 |
| Wal-Mart Stores | | 303,700 | | 14,024,866 |
The Portfolio 9
| | STATEMENT OF INVESTMENTS (continued)
|
| Common Stocks (continued) | | Shares | | Value ($) |
| |
| |
|
| Food & Staples Retailing (continued) | | | | |
| Walgreen | | 634,900 | | 29,135,561 |
| Whole Foods Market | | 70,000 a | | 3,285,100 |
| | | | | 50,121,527 |
| Food, Beverage & Tobacco—19.7% | | | | |
| Altria Group | | 720,400 | | 61,824,728 |
| Anheuser-Busch Cos. | | 185,100 | | 9,106,920 |
| Coca-Cola | | 661,500 | | 31,917,375 |
| Nestle, ADR | | 291,000 | | 25,843,710 |
| PepsiCo | | 443,900 | | 27,765,945 |
| | | | | 156,458,678 |
| Health Care Services—.4% | | | | |
| UnitedHealth Group | | 60,000 | | 3,223,800 |
| Household & Personal Products—4.6% | | | | |
| Estee Lauder Cos., Cl. A | | 108,000 | | 4,408,560 |
| Procter & Gamble | | 500,000 | | 32,135,000 |
| | | | | 36,543,560 |
| Insurance—.9% | | | | |
| American International Group | | 105,920 | | 7,590,227 |
| Materials—.9% | | | | |
| Praxair | | 121,000 | | 7,178,930 |
| Media—5.4% | | | | |
| McGraw-Hill Cos. | | 433,600 | | 29,493,472 |
| News, Cl. A | | 606,436 | | 13,026,245 |
| News, Cl. B | | 9,800 | | 218,148 |
| Viacom, Cl. B | | 10,150 b | | 416,455 |
| | | | | 43,154,320 |
| Pharmaceuticals & Biotechnology—8.8% | | |
| Abbott Laboratories | | 314,100 | | 15,299,811 |
| Eli Lilly & Co. | | 105,000 | | 5,470,500 |
| Johnson & Johnson | | 355,000 | | 23,437,100 |
| Merck & Co. | | 180,000 | | 7,848,000 |
| Pfizer | | 485,000 | | 12,561,500 |
| Roche Holding, ADR | | 64,000 | | 5,736,320 |
| | | | | 70,353,231 |
| Retailing—1.5% | | | | |
| Target | | 216,900 | | 12,374,145 |
| Semiconductors & Equipment—3.0% | | | | |
| Intel | | 1,164,700 | | 23,585,175 |
10
| Common Stocks (continued) | | Shares | | Value ($) |
| |
| |
|
| Software & Services—3.5% | | | | | | |
| Automatic Data Processing | | | | 120,000 | | 5,910,000 |
| Microsoft | | | | 722,300 | | 21,567,878 |
| | | | | | | | | 27,477,878 |
| Transportation—1.1% | | | | | | |
| United Parcel Service, Cl. B | | | | 116,800 | | 8,757,664 |
| Total Common Stocks | | | | | | |
| (cost $535,477,012) | | | | | | 796,092,826 |
| |
| |
| |
|
| |
| Investment of Cash Collateral | | | | |
| for Securities Loaned—1.7% | | | | |
| |
| |
|
| Registered Investment Company; | | | | |
| Dreyfus Institutional Cash | | | | | | |
| Advantage Fund | | | | | | |
| (cost $13,238,261) | | | | 13,238,261 c | | 13,238,261 |
| |
| |
| |
|
| |
| Total Investments (cost $548,715,273) | | 101.7% | | 809,331,087 |
| Liabilities, Less Cash and Receivables | | (1.7%) | | (13,549,347) |
| Net Assets | | | | 100.0% | | 795,781,740 |
| |
| ADR—American Depository Receipts | | | | | | |
| a | | All or a portion of these securities are on loan. At December 31, 2006, the total market value of the portfolio’s |
| | | securities on loan is $12,759,024 and the total market value of the collateral held by the portfolio is $13,238,261. |
| b | | Non-income producing security. | | | | | | |
| c | | Investment in affiliated money market mutual fund. | | | | |
| |
| |
| |
|
| |
| |
| |
| Portfolio Summary (Unaudited) † | | | | |
| | | | | Value (%) | | | | Value (%) |
| |
| |
| |
| |
|
| Food, Beverage & Tobacco | | 19.7 | | Household & Personal Products | | 4.6 |
| Energy | | 17.7 | | Banks | | 3.9 |
| Diversified Financials | | 11.3 | | Software & Services | | 3.5 |
| Pharmaceuticals & Biotechnology | | 8.8 | | Semiconductors & Equipment | | 3.0 |
| Capital Goods | | 7.2 | | Other | | 10.3 |
| Food & Staples Retailing | | 6.3 | | | | |
| Media | | 5.4 | | | | 101.7 |
| |
| † | | Based on net assets. | | | | | | |
| See notes to financial statements. | | | | | | |
The Portfolio 11
| STATEMENT OF ASSETS AND LIABILITIES |
| December 31, 2006 |
| | | Cost | | Value |
| |
| |
|
| Assets ($): | | | | |
| Investments in securities—See Statement of | | |
| Investments (including securities on loan, | | |
| valued at $12,759,024)—Note 1(c): | | |
| Unaffiliated issuers | | 535,477,012 | | 796,092,826 |
| Affiliated issuers | | 13,238,261 | | 13,238,261 |
| Cash | | | | 118,585 |
| Dividends and interest receivable | | | | 1,326,013 |
| Receivable for investment securities sold | | 226,817 |
| Receivable for shares of Beneficial Interest subscribed | | 85,247 |
| Prepaid expenses | | | | 47,039 |
| | | | | 811,134,788 |
| |
| |
|
| Liabilities ($): | | | | |
| Due to The Dreyfus Corporation and affiliates—Note 3(b) | | 328,482 |
| Due to Fayez Sarofim & Co. | | | | 214,836 |
| Liability for securities on loan—Note 1(c) | | 13,238,261 |
| Payable for shares of Beneficial Interest redeemed | | 764,353 |
| Bank note payable—Note 2 | | | | 710,000 |
| Interest payable—Note 2 | | | | 23,275 |
| Accrued expenses | | | | 73,841 |
| | | | | 15,353,048 |
| |
| |
|
| Net Assets ($) | | | | 795,781,740 |
| |
| |
|
| Composition of Net Assets ($): | | | | |
| Paid-in capital | | | | 537,272,899 |
| Accumulated undistributed investment income—net | | 11,896,886 |
| Accumulated net realized gain (loss) on investments | | (14,003,859) |
| Accumulated net unrealized appreciation | | |
| (depreciation) on investments | | | | 260,615,814 |
| |
| |
|
| Net Assets ($) | | | | 795,781,740 |
| |
| |
|
| |
| |
| Net Asset Value Per Share | | | | |
| | | Initial Shares | | Service Shares |
| |
| |
|
| Net Assets ($) | | 681,035,358 | | 114,746,382 |
| Shares Outstanding | | 16,004,996 | | 2,711,410 |
| |
| |
|
| Net Asset Value Per Share ($) | | 42.55 | | 42.32 |
See notes to financial statements.
|
STATEMENT OF OPERATIONS
Year Ended December 31, 2006
|
| Investment Income ($): | | |
| Income: | | |
| Cash dividends: | | |
| Unaffiliated issuers (net of $170,731 foreign taxes withheld at source) | | 18,301,799 |
| Affiliated issuers | | 62,322 |
| Income from securities lending | | 58,262 |
| Total Income | | 18,422,383 |
| Expenses: | | |
| Investment advisory fee—Note 3(a) | | 3,331,840 |
| Sub-investment advisory fee—Note 3(a) | | 2,431,839 |
| Distribution fees—Note 3(b) | | 237,160 |
| Prospectus and shareholders’ reports | | 222,354 |
| Trustees’ fees and expenses—Note 3(c) | | 77,470 |
| Interest expense—Note 2 | | 65,302 |
| Custodian fees—Note 3(b) | | 62,213 |
| Professional fees | | 52,112 |
| Shareholder servicing costs—Note 3(b) | | 10,372 |
| Loan commitment fees—Note 2 | | 6,194 |
| Miscellaneous | | 26,615 |
| Total Expenses | | 6,523,471 |
| Less—reduction in custody fees due | | |
| to earnings credits—Note 1(c) | | (569) |
| Net Expenses | | 6,522,902 |
| Investment Income—Net | | 11,899,481 |
| |
|
| Realized and Unrealized Gain (Loss) on Investments—Note 4 ($): |
| Net realized gain (loss) on investments and | | |
| foreign currency transactions | | 26,807,980 |
| Net unrealized appreciation (depreciation) | | |
| on investments and foreign currency transactions | | 78,292,140 |
| Net Realized and Unrealized Gain (Loss) on Investments | | 105,100,120 |
| Net Increase in Net Assets Resulting from Operations | | 116,999,601 |
See notes to financial statements.
|
STATEMENT OF CHANGES IN NET ASSETS
| | | Year Ended December 31, |
| |
|
| | | 2006 | | 2005 |
| |
| |
|
| Operations ($): | | | | |
| Investment income—net | | 11,899,481 | | 11,949,265 |
| Net realized gain (loss) on investments | | 26,807,980 | | 16,190,739 |
| Net unrealized appreciation | | | | |
| (depreciation) on investments | | 78,292,140 | | 6,752,030 |
| Net Increase (Decrease) in Net Assets | | | | |
| Resulting from Operations | | 116,999,601 | | 34,892,034 |
| |
| |
|
| Dividends to Shareholders from ($): | | | | |
| Investment income—net: | | | | |
| Initial shares | | (10,501,808) | | (135,857) |
| Service shares | | (1,443,242) | | — |
| Total Dividends | | (11,945,050) | | (135,857) |
| |
| |
|
| Beneficial Interest Transactions ($): | | | | |
| Net proceeds from shares sold: | | | | |
| Initial shares | | 69,395,793 | | 56,572,319 |
| Service shares | | 40,577,961 | | 29,036,589 |
| Dividends reinvested: | | | | |
| Initial shares | | 10,501,808 | | 135,857 |
| Service shares | | 1,443,242 | | — |
| Cost of shares redeemed: | | | | |
| Initial shares | | (174,553,296) | | (170,386,472) |
| Service shares | | (41,477,673) | | (11,972,455) |
| Increase (Decrease) in Net Assets from | | | | |
| Beneficial Interest Transactions | | (94,112,165) | | (96,614,162) |
| Total Increase (Decrease) in Net Assets | | 10,942,386 | | (61,857,985) |
| |
| |
|
| Net Assets ($): | | | | |
| Beginning of Period | | 784,839,354 | | 846,697,339 |
| End of Period | | 795,781,740 | | 784,839,354 |
| Undistributed investment income—net | | 11,896,886 | | 11,942,179 |
| | | Year Ended December 31, |
| |
|
| | | 2006 | | 2005 |
| |
| |
|
| Capital Share Transactions: | | | | |
| Initial Shares | | | | |
| Shares sold | | 1,796,884 | | 1,561,261 |
| Shares issued for dividends reinvested | | 280,272 | | 3,818 |
| Shares redeemed | | (4,494,201) | | (4,688,720) |
| Net Increase (Decrease) in Shares Outstanding | | (2,417,045) | | (3,123,641) |
| |
| |
|
| Service Shares | | | | |
| Shares sold | | 1,029,879 | | 799,853 |
| Shares issued for dividends reinvested | | 38,651 | | — |
| Shares redeemed | | (1,097,163) | | (330,659) |
| Net Increase (Decrease) in Shares Outstanding | | (28,633) | | 469,194 |
See notes to financial statements.
|
FINANCIAL HIGHLIGHTS
The following tables describe the performance for each share class for the fiscal periods indicated.All information (except portfolio turnover rate) reflects financial results for a single portfolio share.Total return shows how much your investment in the portfolio would have increased (or decreased) during each period, assuming you had reinvested all dividends and distributions.These figures have been derived from the portfolio’s financial statements.
| | | | | Year Ended December 31, | | |
| |
| |
| |
|
| Initial Shares | | 2006 | | 2005 | | 2004 | | 2003 | | 2002 |
| |
| |
| |
| |
| |
|
| Per Share Data ($): | | | | | | | | | | |
| Net asset value, beginning of period | | 37.11 | | 35.56 | | 34.42 | | 28.79 | | 34.98 |
| Investment Operations: | | | | | | | | | | |
| Investment income—net a | | .61 | | .54 | | .56 | | .43 | | .36 |
| Net realized and unrealized | | | | | | | | | | |
| gain (loss) on investments | | 5.42 | | 1.02 | | 1.18 | | 5.64 | | (6.19) |
| Total from Investment Operations | | 6.03 | | 1.56 | | 1.74 | | 6.07 | | (5.83) |
| Distributions: | | | | | | | | | | |
| Dividends from investment income—net | | (.59) | | (.01) | | (.60) | | (.44) | | (.36) |
| Net asset value, end of period | | 42.55 | | 37.11 | | 35.56 | | 34.42 | | 28.79 |
| |
| |
| |
| |
| |
|
| Total Return (%) | | 16.48 | | 4.38 | | 5.05 | | 21.17 | | (16.71) |
| |
| |
| |
| |
| |
|
| Ratios/Supplemental Data (%): | | | | | | | | | | |
| Ratio of total expenses | | | | | | | | | | |
| to average net assets | | .82 | | .80 | | .79 | | .80 | | .78 |
| Ratio of net expenses | | | | | | | | | | |
| to average net assets | | .82 | | .80 | | .79 | | .80 | | .78 |
| Ratio of net investment income | | | | | | | | | | |
| to average net assets | | 1.58 | | 1.48 | | 1.60 | | 1.41 | | 1.10 |
| Portfolio Turnover Rate | | 3.86 | | 2.67 | | 1.64 | | 4.60 | | 6.61 |
| |
| |
| |
| |
| |
|
| Net Assets, end of period ($ x 1,000) | | 681,035 | | 683,667 | | 766,169 | | 821,319 | | 722,706 |
| | a Based on average shares outstanding at each month end.
See notes to financial statements.
|
| | | | | Year Ended December 31, | | |
| |
| |
| |
|
| Service Shares | | 2006 | | 2005 | | 2004 | | 2003 | | 2002 |
| |
| |
| |
| |
| |
|
| Per Share Data ($): | | | | | | | | | | |
| Net asset value, beginning of period | | 36.92 | | 35.46 | | 34.31 | | 28.71 | | 34.89 |
| Investment Operations: | | | | | | | | | | |
| Investment income—net a | | .51 | | .45 | | .46 | | .36 | | .29 |
| Net realized and unrealized | | | | | | | | | | |
| gain (loss) on investments | | 5.41 | | 1.01 | | 1.19 | | 5.61 | | (6.17) |
| Total from Investment Operations | | 5.92 | | 1.46 | | 1.65 | | 5.97 | | (5.88) |
| Distributions: | | | | | | | | | | |
| Dividends from investment income—net | | (.52) | | — | | (.50) | | (.37) | | (.30) |
| Net asset value, end of period | | 42.32 | | 36.92 | | 35.46 | | 34.31 | | 28.71 |
| |
| |
| |
| |
| |
|
| Total Return (%) | | 16.21 | | 4.12 | | 4.80 | | 20.83 | | (16.89) |
| |
| |
| |
| |
| |
|
| Ratios/Supplemental Data (%): | | | | | | | | | | |
| Ratio of total expenses | | | | | | | | | | |
| to average net assets | | 1.07 | | 1.05 | | 1.04 | | 1.05 | | 1.02 |
| Ratio of net expenses | | | | | | | | | | |
| to average net assets | | 1.07 | | 1.05 | | 1.04 | | 1.05 | | 1.02 |
| Ratio of net investment income | | | | | | | | | | |
| to average net assets | | 1.33 | | 1.24 | | 1.34 | | 1.16 | | .91 |
| Portfolio Turnover Rate | | 3.86 | | 2.67 | | 1.64 | | 4.60 | | 6.61 |
| |
| |
| |
| |
| |
|
| Net Assets, end of period ($ x 1,000) | | 114,746 | | 101,172 | | 80,529 | | 89,121 | | 60,572 |
| |
| a Based on average shares outstanding at each month end. | | | | | | | | |
| See notes to financial statements. | | | | | | | | | | |
NOTES TO FINANCIAL STATEMENTS
NOTE 1—Significant Accounting Policies:
Dreyfus Variable Investment Fund (the “fund”) is registered under the Investment Company Act of 1940, as amended (the “Act”), as an open-end management investment company, operating as a series company currently offering twelve series, including the Appreciation Portfolio (the “portfolio”). The portfolio is only offered to separate accounts established by insurance companies to fund variable annuity contracts and variable life insurance policies.The portfolio is a diversified series. The portfolio’s investment objective is to provide long-term capital growth consistent with the preservation of capital. The Dreyfus Corporation (“the Manager” or “Dreyfus”) serves as the portfolio’s investment adviser. Dreyfus is a wholly-owned subsidiary of Mellon Financial Corporation (“Mellon Financial”). Fayez Sarofim & Co. (“Sarofim & Co.”) serves as the portfolio’s sub-investment adviser.
On December 4, 2006, Mellon Financial and The Bank of New York Company, Inc. announced that they had entered into a definitive agreement to merge. The new company will be called The Bank of New York Mellon Corporation. As part of this transaction, Dreyfus would become a wholly-owned subsidiary of The Bank of New York Mellon Corporation.The transaction is subject to certain regulatory approvals and the approval of The Bank of New York Company, Inc.’s and Mellon Financial’s shareholders, as well as other customary conditions to closing. Subject to such approvals and the satisfaction of the other conditions, Mellon Financial and The Bank of New York Company, Inc. expect the transaction to be completed in the third quarter of 2007.
Dreyfus Service Corporation (the “Distributor”), a wholly-owned subsidiary of Dreyfus, is the distributor of the portfolio’s shares, which are sold without a sales charge.The portfolio is authorized to issue an unlimited number of $.001 par value shares of Beneficial Interest in each of the following classes of shares: Initial and Service. Each class of shares has identical rights and privileges, except with respect to the distribution plan and the expenses borne by each class and certain voting rights. Income, expenses (other than expenses attributable to a specific
class), and realized and unrealized gains or losses on investments are allocated to each class of shares based on its relative net assets.
The fund accounts separately for the assets, liabilities and operations of each series. Expenses directly attributable to each series are charged to that series’ operations; expenses which are applicable to all series are allocated among them on a pro rata basis.
The portfolio’s financial statements are prepared in accordance with U.S. generally accepted accounting principles, which may require the use of management estimates and assumptions.Actual results could differ from those estimates.
The fund enters into contracts that contain a variety of indemnifica-tions.The portfolio’s maximum exposure under these arrangements is unknown. The portfolio does not anticipate recognizing any loss related to these arrangements.
(a) Portfolio valuation: Investments in securities are valued at the last sales price on the securities exchange or national securities market on which such securities are primarily traded. Securities listed on the National Market System for which market quotations are available are valued at the official closing price or, if there is no official closing price that day, at the last sales price. Securities not listed on an exchange or the national securities market, or securities for which there were no transactions, are valued at the average of the most recent bid and asked prices, except for open short positions, where the asked price is used for valuation purposes. Bid price is used when no asked price is available. Registered open-end investment companies that are not traded on an exchange are valued at their net asset value.When market quotations or official closing prices are not readily available, or are determined not to reflect accurately fair value, such as when the value of a security has been significantly affected by events after the close of the exchange or market on which the security is principally traded (for example, a foreign exchange or market), but before the portfolio calculates its net asset value, the portfolio may value these investments at fair value as deter-
NOTES TO FINANCIAL STATEMENTS (continued)
|
mined in accordance with the procedures approved by the Board of Trustees. Fair valuing of securities may be determined with the assistance of a pricing service using calculations based on indices of domestic securities and other appropriate indicators, such as prices of relevant ADR’s and futures contracts. For other securities that are fair valued by the Board of Trustees, certain factors may be considered such as: fundamental analytical data, the nature and duration of restrictions on disposition, an evaluation of the forces that influence the market in which the securities are purchased and sold and public trading in similar securities of the issuer or comparable issuers. Financial futures are valued at the last sales price. Investments denominated in foreign currencies are translated to U.S. dollars at the prevailing rates of exchange. Forward currency exchange contracts are valued at the forward rate.
On September 20, 2006, the Financial Accounting Standards Board (FASB) released Statement of Financial Accounting Standards No. 157 “Fair Value Measurements” (“FAS 157”). FAS 157 establishes an authoritative definition of fair value, sets out a framework for measuring fair value, and requires additional disclosures about fair-value measurements. The application of FAS 157 is required for fiscal years beginning after November 15, 2007 and interim periods within those fiscal years. Management does not believe that the application of this standard will have a material impact on the financial statements of the portfolio.
(b) Foreign currency transactions: The portfolio does not isolate that portion of the results of operations resulting from changes in foreign exchange rates on investments from the fluctuations arising from changes in market prices of securities held. Such fluctuations are included with the net realized and unrealized gain or loss on investments.
Net realized foreign exchange gains or losses arise from sales and maturities of short-term securities, sales of foreign currencies, currency gains or losses realized on securities transactions and the difference between the amounts of dividends, interest and foreign withholding taxes recorded on the portfolio’s books and the U.S. dollar equivalent of the
amounts actually received or paid. Net unrealized foreign exchange gains and losses arise from changes in the value of assets and liabilities other than investments in securities, resulting from changes in exchange rates. Such gains and losses are included with net realized and unrealized gain or loss on investments.
(c) Securities transactions and investment income: Securities transactions are recorded on a trade date basis. Realized gain and loss from securities transactions are recorded on the identified cost basis. Dividend income is recognized on the ex-dividend date and interest income, including, where applicable, accretion of discount and amortization of premium on investments, is recognized on the accrual basis.
The portfolio has an arrangement with the custodian bank whereby the portfolio receives earnings credits from the custodian when positive cash balances are maintained, which are used to offset custody fees. For financial reporting purposes, the portfolio includes net earnings credits as an expense offset in the Statement of Operations.
Pursuant to a securities lending agreement with Mellon Bank, N.A., an affiliate of Dreyfus, the portfolio may lend securities to qualified institutions. It is the portfolio’s policy, that at origination, all loans are secured by collateral of at least 102% of the value of U.S. securities loaned and 105% of the value of foreign securities loaned. Collateral equivalent to at least 100% of the market value of securities on loan is maintained at all times. Cash collateral is invested in certain money market mutual funds managed by Dreyfus.The portfolio is entitled to receive all income on securities loaned, in addition to income earned as a result of the lending transaction.Although each security loaned is fully collateralized, the portfolio bears the risk of delay in recovery of, or loss of rights in, the securities loaned should a borrower fail to return the securities in a timely manner.
(d) Affiliated issuers: Investments in other investment companies advised by Dreyfus are defined as “affiliated” in the Act.
NOTES TO FINANCIAL STATEMENTS (continued)
|
(e) Dividends to shareholders: Dividends are recorded on the ex-dividend date. Dividends from investment income-net and dividends from net realized capital gain, if any, are normally declared and paid annually, but the portfolio may make distributions on a more frequent basis to comply with the distribution requirements of the Internal Revenue Code of 1986, as amended (the “Code”).To the extent that net realized capital gain can be offset by capital loss carryovers, it is the policy of the portfolio not to distribute such gain. Income and capital gain distributions are determined in accordance with income tax regulations, which may differ from U.S. generally accepted accounting principles.
(f) Federal income taxes: It is the policy of the portfolio to continue to qualify as a regulated investment company, if such qualification is in the best interests of its shareholders, by complying with the applicable provisions of the Code, and to make distributions of taxable income sufficient to relieve it from substantially all federal income and excise taxes.
On July 13, 2006, the FASB released FASB Interpretation No. 48 “Accounting for Uncertainty in Income Taxes” (FIN 48). FIN 48 provides guidance for how uncertain tax positions should be recognized, measured, presented and disclosed in the financial statements. FIN 48 requires the evaluation of tax positions taken or expected to be taken in the course of preparing the portfolio’s tax returns to determine whether the tax positions are “more-likely-than-not” of being sustained by the applicable tax authority.Tax positions not deemed to meet the more-likely-than-not threshold would be recorded as a tax benefit or expense in the current year. Adoption of FIN 48 is required for fiscal years beginning after December 15, 2006 and is to be applied to all open tax years as of the effective date. Management does not believe that the application of this standard will have a material impact on the financial statements of the portfolio.
At December 31, 2006, the components of accumulated earnings on a tax basis were as follows: undistributed ordinary income $11,896,886,
accumulated capital losses $12,735,712 and unrealized appreciation $260,615,800. In addition, the portfolio had $1,268,133 of capital losses realized after October 31, 2006, which were deferred for tax purposes to the first day of the following fiscal year.
The accumulated capital loss carryover is available to be applied against future net securities profits, if any, realized subsequent to December 31, 2006. If not applied, $6,026,685 of the carryover expires in fiscal 2011 and $6,709,027 expires in fiscal 2012.
The tax character of distributions paid to shareholders during the fiscal periods ended December 31, 2006 and December 31, 2005 were as follows: ordinary income $11,945,050 and $135,857, respectively.
During the period ended December 31, 2006, as a result of permanent book to tax differences, primarily due to the tax treatment for foreign currency exchange gains and losses, the portfolio increased accumulated undistributed investment income-net by $276 and decreased accumulated net realized gain (loss) on investments by the same amount. Net assets were not affected by this reclassification.
NOTE 2—Bank Line of Credit:
The portfolio participates with other Dreyfus-managed funds in a $350 million redemption credit facility (the “Facility”) to be utilized for temporary or emergency purposes, including the financing of redemptions. In connection therewith, the portfolio has agreed to pay commitment fees on its pro rata portion of the Facility. Interest is charged to the portfolio at rates based on prevailing market rates in effect at the time of borrowing.
The average daily amount of borrowings outstanding under the Facility during the period ended December 31, 2006 was approximately $1,187,900, with a related weighted average annualized interest rate of 5.50% .
The Portfolio 23
NOTES TO FINANCIAL STATEMENTS (continued)
|
NOTE 3—Investment Advisory Fee, Sub-Investment Advisory Fee and Other Transactions With Affiliates:
(a) Pursuant to an Investment Advisory Agreement with Dreyfus, the investment advisory fee is based on the value of the portfolio’s average daily net assets and is computed at the following annual rates: .55% of the first $150 million; .50% of the next $150 million; and .375% over $300 million.The fee is payable monthly. Pursuant to a Sub-Investment Advisory Agreement with Sarofim & Co., the sub-investment advisory fee is based upon the value of the portfolio’s average daily net assets and is computed at the following annual rates: .20% of the first $150 million; .25% of the next $150 million; and .375% over $300 million.The fee is payable monthly.
(b) Under the Distribution Plan (the “Plan”) adopted pursuant to Rule 12b-1 under the Act, Service shares pay the Distributor for distributing their shares, for servicing and/or maintaining Service shares shareholder accounts and for advertising and marketing for Service shares.The Plan provides for payments to be made at an annual rate of .25% of the value of the Service shares’ average daily net assets.The Distributor may make payments to Participating Insurance Companies and to brokers and dealers acting as principal underwriter for their variable insurance products.The fees payable under the Plan are payable without regard to actual expenses incurred. During the period ended December 31, 2006, Service shares were charged $237,160 pursuant to the Plan.
The portfolio compensates Dreyfus Transfer, Inc., a wholly-owned subsidiary of Dreyfus, under a transfer agency agreement for providing personnel and facilities to perform transfer agency services for the portfolio. During the period ended December 31, 2006, the portfolio was charged $1,088 pursuant to the transfer agency agreement.
The portfolio compensates Mellon Bank, N.A., an affiliate of Dreyfus, under a custody agreement for providing custodial services for the portfolio. During the period ended December 31, 2006, the portfolio was charged $62,213 pursuant to the custody agreement.
During the period ended December 31, 2006, the portfolio was charged $4,204 for services performed by the Chief Compliance Officer.
The components of Due to The Dreyfus Corporation and affiliates in the Statement of Assets and Liabilities consist of: investment advisory fees $291,274, Rule 12b-1 distribution plan fees $24,225, custodian fees $10,754, chief compliance officer fees $2,044 and transfer agency per account fees $185.
(c) Each Board member also serves as a Board member of other funds within the Dreyfus complex. Annual retainer fees and attendance fees are allocated to each fund based on net assets.
(d) Pursuant to an exemptive order from the SEC, the portfolio may invest its available cash balances in affiliated money market mutual funds. Management fees of the underlying money market mutual funds have been waived by Dreyfus.
NOTE 4—Securities Transactions:
The aggregate amount of purchases and sales of investment securities, excluding short-term securities, during the period ended December 31, 2006, amounted to $29,695,060 and $119,532,300, respectively.
At December 31, 2006, the cost of investments for federal income tax purposes was $548,715,287; accordingly, accumulated net unrealized appreciation on investments was $260,615,800, consisting of $279,395,526 gross unrealized appreciation and $18,779,726 gross unrealized depreciation.
REPORT OF INDEPENDENT REGISTERED PUBLIC ACCOUNTING FIRM
Shareholders and Board of Trustees
Dreyfus Variable Investment Fund, Appreciation Portfolio
We have audited the accompanying statement of assets and liabilities, including the statement of investments, of Dreyfus Variable Investment Fund, Appreciation Portfolio (one of the funds comprising Dreyfus Variable Investment Fund) as of December 31, 2006, and the related statement of operations for the year then ended, the statement of changes in net assets for each of the two years in the period then ended, and financial highlights for each of the years indicated therein. These financial statements and financial highlights are the responsibility of the Fund’s management. Our responsibility is to express an opinion on these financial statements and financial highlights based on our audits.
We conducted our audits in accordance with the standards of the Public Company Accounting Oversight Board (United States).Those standards require that we plan and perform the audit to obtain reasonable assurance about whether the financial statements and financial highlights are free of material misstatement.We were not engaged to perform an audit of the Fund’s internal control over financial reporting.Our audits included consideration of internal control over financial reporting as a basis for designing audit procedures that are appropriate in the circumstances,but not for the purpose of expressing an opinion on the effectiveness of the Fund’s internal control over financial reporting.Accordingly, we express no such opinion.An audit also includes examining, on a test basis, evidence supporting the amounts and disclosures in the financial statements and financial highlights, assessing the accounting principles used and significant estimates made by management, and evaluating the overall financial statement presentation. Our procedures included confirmation of securities owned as of December 31, 2006 by correspondence with the custodian. We believe that our audits provide a reasonable basis for our opinion.
In our opinion, the financial statements and financial highlights referred to above present fairly, in all material respects, the financial position of Dreyfus Variable Investment Fund, Appreciation Portfolio at December 31,2006,the results of its operations for the year then ended,the changes in its net assets for each of the two years in the period then ended, and the financial highlights for each of the indicated years, in conformity with U. S. generally accepted accounting principles.

New York, New York
February 6, 2007
|
IMPORTANT TAX INFORMATION (Unaudited)
For federal tax purposes, the portfolio hereby designates 100% of the ordinary dividends paid during the fiscal year ended December 31, 2006 as qualifying for the corporate dividends received deduction. Shareholders will receive notification in January 2007 of the percentage applicable to the preparation of their 2006 income tax returns.
PROXY RESULTS (Unaudited)
Dreyfus Variable Investment Fund held a special meeting of shareholders on June 29, 2006.The proposal considered at the meeting, and the results, are as follows:
| | | | | Shares | | |
| |
| |
| |
|
| | | Votes For | | | | Authority Withheld |
| |
| |
| |
|
| To elect additional Board Members: | | | | | | |
| Peggy C. Davis † | | 171,078,927 | | | | 7,687,714 |
| Joseph S. DiMartino | | 170,946,484 | | | | 7,820,156 |
| David P. Feldman | | 170,959,921 | | | | 7,806,720 |
| Ehud Houminer † | | 170,132,087 | | | | 8,634,554 |
| Gloria Messinger † | | 170,187,241 | | | | 8,579,400 |
| Anne Wexler † | | 170,212,607 | | | | 8,554,033 |
† Each new Board member’s term commenced on September 26, 2006.
In addition to Joseph S. DiMartino and David P. Feldman, James F. Henry, Dr. Paul A. Marks and Dr. Martin Peretz continue as Board members of the fund.
BOARD MEMBERS INFORMATION (Unaudited)
Joseph S. DiMartino (63)
Chairman of the Board (1995)
|
Principal Occupation During Past 5 Years:
• Corporate Director and Trustee
|
Other Board Memberships and Affiliations:
|
- The Muscular Dystrophy Association, Director
- Century Business Services, Inc., a provider of outsourcing functions for small and medium size companies, Director
- The Newark Group, a provider of a national market of paper recovery facilities, paperboard mills and paperboard converting plants, Director
- Sunair Services Corporation, engaging in the design, manufacture and sale of high frequency systems for long-range voice and data communications, as well as providing certain outdoor-related services to homes and businesses, Director
No. of Portfolios for which Board Member Serves: 190
———————
Peggy C. Davis (63) Board Member (2006)
Principal Occupation During Past 5 Years:
|
- Shad Professor of Law, New York University School of Law (1983-present)
- Writer and teacher in the fields of evidence, constitutional theory, family law, social sciences and the law, legal process and professional methodology and training
No. of Portfolios for which Board Member Serves: 80
|
David P. Feldman (67)
Board Member (1994)
|
Principal Occupation During Past 5 Years:
• Corporate Director and Trustee
|
Other Board Memberships and Affiliations:
|
- BBH Mutual Funds Group (11 funds), Director
- The Jeffrey Company, a private investment company, Director
- QMED, a medical device company, Director
No. of Portfolios for which Board Member Serves: 57
|
James F. Henry (76)
Board Member (1990)
|
Principal Occupation During Past 5 Years:
|
- President,The International Institute for Conflict Prevention and Resolution, a non-profit organization principally engaged in the development of alternatives to business litigation (Retired 2003)
- Advisor to The Elaw Forum, a consultant on managing corporate legal costs
- Advisor to John Jay Homestead (the restored home of the first U.S. Chief Justice)
- Individual Trustee of several trusts
Other Board Memberships and Affiliations:
|
- Director, advisor and mediator involved in several non-profit organizations, primarily engaged in domestic and international dispute resolution, and historic preservation
No. of Portfolios for which Board Member Serves: 48
|
———————
Ehud Houminer (66) Board Member (2006)
Principal Occupation During Past 5 Years:
• Executive-in-Residence at the Columbia Business School, Columbia University
Other Board Memberships and Affiliations:
|
- Avnet Inc., an electronics distributor, Director
- International Advisory Board to the MBA Program School of Management, Ben Gurion University, Chairman
- Explore Charter School, Brooklyn, NY, Chairman
No. of Portfolios for which Board Member Serves: 78
———————
Gloria Messinger (77) Board Member (2006)
Principal Occupation During Past 5 Years:
|
- Arbitrator for American Arbitration Association and National Association of Securities Dealers, Inc.
- Consultant in Intellectual Property
Other Board Memberships and Affiliations:
|
- Theater for a New Audience, Inc., Director
- Brooklyn Philharmonic, Director
No. of Portfolios for which Board Member Serves: 48
|
BOARD MEMBERS INFORMATION (Unaudited) (continued)
Dr. Martin Peretz (67)
Board Member (1990)
|
Principal Occupation During Past 5 Years:
|
- Editor-in-Chief of The New Republic Magazine
- Lecturer in Social Studies at Harvard University (1965-2002)
- Director of TheStreet.com, a financial information service on the web
Other Board Memberships and Affiliations:
|
- American Council of Trustees and Alumni, Director
- Pershing Square Capital Management, Adviser
- Montefiore Ventures, General Partner
- Harvard Center for Blood Research,Trustee
- Bard College,Trustee
- Board of Overseers of YIVO Institute for Jewish Research, Chairman
No. of Portfolios for which Board Member Serves: 48
———————
Anne Wexler (76) Board Member (2006)
Principal Occupation During Past 5 Years:
|
- Chairman of the Wexler & Walker Public Policy Associates, consultants specializing in government relations and public affairs
Other Board Memberships and Affiliations:
|
- Wilshire Mutual Funds (5 funds), Director
- Methanex Corporation, a methanol producing company, Director
- Member of the Council of Foreign Relations
- Member of the National Park Foundation
No. of Portfolios for which Board Member Serves: 57
|
Once elected all Board Members serve for an indefinite term, but achieve Emeritus status on December 31st of the calendar year in which the Board Member reaches age 80.The address of the Board Members and Officers is in c/o The Dreyfus Corporation, 200 Park Avenue, New York, New York 10166. Additional information about the Board Members is available in the fund’s Statement of Additional Information which can be obtained from Dreyfus free of charge by calling this toll free number: 1-800-554-4611.
John M. Fraser, Jr., Emeritus Board Member Rosalind G. Jacobs, Emeritus Board Member Dr. Paul A. Marks, Emeritus Board Member
OFFICERS OF THE FUND (Unaudited)
J. DAVID OFFICER, President since December 2006.
Chief Operating Officer,Vice Chairman and a director of the Manager, and an officer of 90 investment companies (comprised of 190 portfolios) managed by the Manager. He is 58 years old and has been an employee of the Manager since April 1, 1998.
MARK N. JACOBS, Vice President since March 2000.
Executive Vice President, Secretary and General Counsel of the Manager, and an officer of 91 investment companies (comprised of 206 portfolios) managed by the Manager. He is 60 years old and has been an employee of the Manager since June 1977.
MICHAEL A. ROSENBERG, Vice President and Secretary since August 2005.
Associate General Counsel of the Manager, and an officer of 91 investment companies (comprised of 206 portfolios) managed by the Manager. He is 46 years old and has been an employee of the Manager since October 1991.
JAMES BITETTO, Vice President and Assistant Secretary since August 2005.
Associate General Counsel and Assistant Secretary of the Manager, and an officer of 91 investment companies (comprised of 206 portfolios) managed by the Manager. He is 40 years old and has been an employee of the Manager since December 1996.
JONI LACKS CHARATAN, Vice President and Assistant Secretary since August 2005.
Associate General Counsel of the Manager, and an officer of 91 investment companies (comprised of 206 portfolios) managed by the Manager. She is 51 years old and has been an employee of the Manager since October 1988.
JOSEPH M. CHIOFFI, Vice President and Assistant Secretary since August 2005.
Associate General Counsel of the Manager, and an officer of 91 investment companies (comprised of 206 portfolios) managed by the Manager. He is 45 years old and has been an employee of the Manager since June 2000.
JANETTE E. FARRAGHER, Vice President and Assistant Secretary since August 2005.
Associate General Counsel of the Manager, and an officer of 91 investment companies (comprised of 206 portfolios) managed by the Manager. She is 44 years old and has been an employee of the Manager since February 1984.
JOHN B. HAMMALIAN, Vice President and Assistant Secretary since August 2005.
Associate General Counsel of the Manager, and an officer of 91 investment companies (comprised of 206 portfolios) managed by the Manager. He is 43 years old and has been an employee of the Manager since February 1991.
ROBERT R. MULLERY, Vice President and Assistant Secretary since August 2005.
Associate General Counsel of the Manager, and an officer of 91 investment companies (comprised of 206 portfolios) managed by the Manager. He is 54 years old and has been an employee of the Manager since May 1986.
JEFF PRUSNOFSKY, Vice President and Assistant Secretary since August 2005.
Associate General Counsel of the Manager, and an officer of 91 investment companies (comprised of 206 portfolios) managed by the Manager. He is 41 years old and has been an employee of the Manager since October 1990.
OFFICERS OF THE FUND (Unaudited) (continued)
JAMES WINDELS, Treasurer since November 2001.
Director – Mutual Fund Accounting of the Manager, and an officer of 91 investment companies (comprised of 206 portfolios) managed by the Manager. He is 48 years old and has been an employee of the Manager since April 1985.
ERIK D. NAVILOFF, Assistant Treasurer since December 2002.
Senior Accounting Manager – Taxable Fixed Income Funds of the Manager, and an officer of 91 investment companies (comprised of 206 portfolios) managed by the Manager. He is 38 years old and has been an employee of the Manager since November 1992.
ROBERT ROBOL, Assistant Treasurer since August 2003.
Senior Accounting Manager – Money Market and Municipal Bond Funds of the Manager, and an officer of 91 investment companies (comprised of 206 portfolios) managed by the Manager. He is 42 years old and has been an employee of the Manager since October 1988.
ROBERT SVAGNA, Assistant Treasurer since December 2002.
Senior Accounting Manager – Equity Funds of the Manager, and an officer of 91 investment companies (comprised of 206 portfolios) managed by the Manager. He is 39 years old and has been an employee of the Manager since November 1990.
GAVIN C. REILLY, Assistant Treasurer since December 2005.
Tax Manager of the Investment Accounting and Support Department of the Manager, and an officer of 91 investment companies (comprised of 206 portfolios) managed by the Manager. He is 38 years old and has been an employee of the Manager since April 1991.
JOSEPH W. CONNOLLY, Chief Compliance Officer since October 2004.
Chief Compliance Officer of the Manager and The Dreyfus Family of Funds (91 investment companies, comprised of 206 portfolios). From November 2001 through March 2004, Mr. Connolly was first Vice-President, Mutual Fund Servicing for Mellon Global Securities Services. In that capacity, Mr. Connolly was responsible for managing Mellon’s Custody, Fund Accounting and Fund Administration services to third-party mutual fund clients. He is 49 years old and has served in various capacities with the Manager since 1980, including manager of the firm’s Fund Accounting Department from 1997 through October 2001.
WILLIAM GERMENIS, Anti-Money Laundering Compliance Officer since September 2002.
Vice President and Anti-Money Laundering Compliance Officer of the Distributor, and the Anti-Money Laundering Compliance Officer of 87 investment companies (comprised of 202 portfolios) managed by the Manager. He is 36 years old and has been an employee of the Distributor since October 1998.
| For More | | Information |
| |
|
| |
| |
| |
| Dreyfus Variable | | Custodian |
| |
| Investment Fund, | | |
| | | Mellon Bank, N.A. |
| Appreciation Portfolio | | |
| | | One Mellon Bank Center |
| 200 Park Avenue | | |
| | | Pittsburgh, PA 15258 |
| New York, NY 10166 | | |
| |
| | | Transfer Agent & |
| |
| Investment Adviser | | Dividend Disbursing Agent |
| |
| The Dreyfus Corporation | | |
| | | Dreyfus Transfer, Inc. |
| 200 Park Avenue | | |
| | | 200 Park Avenue |
| New York, NY 10166 | | |
| | | New York, NY 10166 |
| |
| |
| Sub-Investment Advisor | | Distributor |
| |
| Fayez Sarofim & Co. | | |
| | | Dreyfus Service Corporation |
| Two Houston Center | | |
| | | 200 Park Avenue |
| Suite 2907 | | |
| | | New York, NY 10166 |
| Houston,TX 77010 | | |
| Telephone 1-800-554-4611 or 516-338-3300 |
| Mail | | The Dreyfus Family of Funds, 144 Glenn Curtiss Boulevard, Uniondale, NY 11556-0144 |
| | | Attn: Investments Division |
The portfolio files its complete schedule of portfolio holdings with the Securities and Exchange Commission (“SEC”) for the first and third quarters of each fiscal year on Form N-Q. The portfolio’s Forms N-Q are available on the SEC’s website at http://www.sec.gov and may be reviewed and copied at the SEC’s Public Reference Room in Washington, DC. Information on the operation of the Public Reference Room may be obtained by calling 1-202-551-8090.
A description of the policies and procedures that the portfolio uses to determine how to vote proxies relating to portfolio securities, and information regarding how the portfolio voted these proxies for the 12-month period ended June 30, 2006, is available at http://www.dreyfus.com and on the SEC’s website at http://www.sec.gov. The description of the policies and procedures is also available without charge, upon request, by calling 1-800-645-6561.

The views expressed in this report reflect those of the portfolio manager only through the end of the period covered and do not necessarily represent the views of Dreyfus or any other person in the Dreyfus organization.Any such views are subject to change at any time based upon market or other conditions and Dreyfus disclaims any responsibility to update such views. These views may not be relied on as investment advice and, because investment decisions for a Dreyfus portfolio are based on numerous factors, may not be relied on as an indication of trading intent on behalf of any Dreyfus portfolio.
Not FDIC-Insured • Not Bank-Guaranteed • May Lose Value
| | | Contents |
| |
| | | THE PORTFOLIO |
| |
|
| 2 | | A Letter from the CEO |
| 3 | | Discussion of Performance |
| 6 | | Portfolio Performance |
| 8 | | Understanding Your Portfolio’s Expenses |
| 8 | | Comparing Your Portfolio’s Expenses |
| | | With Those of Other Funds |
| 9 | | Statement of Investments |
| 14 | | Statement of Assets and Liabilities |
| 15 | | Statement of Operations |
| 16 | | Statement of Changes in Net Assets |
| 18 | | Financial Highlights |
| 20 | | Notes to Financial Statements |
| 29 | | Report of Independent Registered |
| | | Public Accounting Firm |
| 30 | | Important Tax Information |
| 30 | | Proxy Results |
| 31 | | Board Members Information |
| 34 | | Officers of the Fund |
| |
| FOR MORE INFORMATION |
|
| | | Back Cover |
| Dreyfus Variable Investment Fund, |
| Balanced Portfolio |
The Portfolio

We are pleased to present this annual report for Dreyfus Variable Investment Fund, Balanced Portfolio, covering the 12-month period from January 1, 2006, through December 31, 2006.
2006 proved to be a good time for the financial markets, with rallies in the second half of the year propelling stock and bond prices higher.A number of factors contributed to the markets’ gains. Stocks benefited from an expanding domestic economy, an increase in mergers-and-acquisitions activity, strong investor demand and robust corporate profits. Bonds responded favorably to slower economic growth, subdued inflation, stabilizing short-term interest rates, a flat “yield curve” and persistently strong credit fundamentals.
In our analysis, 2006 provided an excellent reminder of the need for a long-term investment perspective. Adopting too short a time frame proved costly for some investors last year, as reducing allocations to stocks and bonds generally meant missing subsequent rallies. Indeed, history shows that reacting to near-term developments with extreme shifts in strategy rarely is the right decision. We believe that a better course is to set a portfolio mix to meet future goals, while attempting to ignore short term market fluctuations.
For information about how the portfolio performed during the reporting period, as well as market perspectives, we have provided a Discussion of Performance given by the portfolio manager.
Thank you for your continued confidence and support.We wish you good health and prosperity in 2007.

DISCUSSION OF PERFORMANCE
Thomas Plumb, Primary Portfolio Manager
Wisconsin Capital Management, LLC, Sub-Investment Adviser
How did Dreyfus Variable Investment Fund, Balanced Portfolio perform relative to its benchmarks?
For the 12-month period ended December 31, 2006, the portfolio’s total returns were 10.07% for its Initial shares and 9.87% for its Service shares.1 In comparison, the portfolio’s benchmark, a hybrid index composed of 60% Standard & Poor’s 500 Composite Stock Price Index (the “S&P 500 Index”) and 40% Lehman Brothers Intermediate Government/Credit Bond Index (the “Lehman Intermediate Bond Index”), achieved a total return of 11.10% for the reporting period.2 Separately, the S&P 500 Index and the Lehman Intermediate Bond Index achieved total returns of 15.78% and 4.08%, respectively, for the reporting period.
Stocks and bonds rallied over the second half of 2006 as short-term interest rates stabilized and prospects improved for an economic “soft landing.” Our duration management and security selection strategies helped the bond portfolio outperform its benchmark, but the stock portfolio lagged industry averages when our shift in focus to larger companies proved to be somewhat premature.
What is the portfolio’s investment approach?
The portfolio seeks high total return through a combination of capital appreciation and current income.To pursue this goal, the portfolio invests in a diversified mix of stocks and fixed-income securities.The portfolio will vary the mix of stocks and bonds from time to time, but normally the portfolio will allocate more than 50% of its assets to stocks and the remainder to bonds and other fixed-income securities.
In allocating portfolio assets between stocks and bonds, the portfolio manager assesses the relative return and risk of each asset class, analyzing several factors, including general economic conditions, anticipated future changes in interest rates and the outlook for stocks generally.
In choosing stocks for the portfolio, the manager looks for high-quality companies that possess most of the following characteristics: leading market positions, high barriers to market entry and other competitive
The Portfolio 3
DISCUSSION OF PERFORMANCE (continued)
|
or technological advantages, high returns on equity and assets, good growth prospects, strong management, and relatively low debt burdens.
The portfolio normally invests at least 25% of its assets in fixed-income securities.The fixed-income securities in which the portfolio may invest include corporate bonds and other debt instruments, mortgage-related securities, asset-backed securities, debt securities issued or guaranteed by the U.S. government (including its agencies and instrumentalities), convertible debt securities and preferred stock that is convertible into common stock.
What other factors influenced the portfolio’s performance?
Early in 2006, robust economic growth and low inflation supported investors’ continued preference for the stocks of smaller, lower-quality companies that they believed could achieve high growth rates.As a result, many large, well-established companies remained out of favor, and their valuations fell well below historical averages. Meanwhile, relatively low inflation expectations enabled bond prices to remain resilient even as short-term interest rates climbed.In the spring,however,surging oil prices and hawkish comments from members of the Federal Reserve Board (the “Fed”) sparked corrections in the stock and bond markets. Fortunately, investor sentiment improved over the summer and early fall, when the economy slowed and the Fed refrained from further interest rate hikes.As economic conditions changed,the stock and bond markets rallied strongly.
In this environment, we allocated roughly 70% of the portfolio’s assets to stocks and about 30% to bonds, enabling the portfolio to participate more fully in the equity market’s rally. However, we intensified our focus on large-cap stocks early in the reporting period, where valuations appeared particularly attractive. Nonetheless, smaller stocks continued to outperform their “mega-cap” counterparts through August, causing the portfolio’s equity returns to lag its benchmark for the year overall. In addition, a handful of holdings in the public education, software services and mortgage banking industries did not make as much progress in their turnarounds as we expected.
These disappointments were somewhat offset by better results in other areas. Sporting goods retailer Cabela’s continued to impress investors with its expansion plans. Software giant Microsoft gained value with the introduction of several new products. Large pharmaceutical com-
panies, such as Merck & Co., rebounded as litigation concerns eased. Mortgage agency Fannie Mae rallied when interest rates stabilized. And large integrated energy producers Exxon Mobil and Chevron gained strength late in the reporting period as commodity prices moderated and investors turned to higher-quality companies.
We reduced the average duration of the portfolio’s bond portfolio early in the reporting period, which helped protect it from bouts of heightened market volatility. In addition, competitive levels of income from short-term corporate bonds contributed positively to total return.
What is the portfolio’s current strategy?
As the U.S. economy slows, we have maintained our focus on large companies in non-cyclical industries, including some of the world’s better known brand names. Many of these holdings remain attractively valued and derive a substantial amount of revenue from overseas markets, which could help protect the portfolio in the event of an unexpectedly severe U.S. economic slowdown. Among bonds, we have maintained a relatively short average duration in anticipation of stable long-term yields, even if short-term rates begin to fall.
| | | The portfolio is only available as a funding vehicle under variable life insurance policies or variable |
| | | annuity contracts issued by insurance companies. Individuals may not purchase shares of the |
| | | portfolio directly. A variable annuity is an insurance contract issued by an insurance company that |
| | | enables investors to accumulate assets on a tax-deferred basis for retirement or other long-term |
| | | goals.The investment objective and policies of Dreyfus Variable Investment Fund, Balanced |
| | | Portfolio made available through insurance products may be similar to other funds/portfolios |
| | | managed or advised by Dreyfus. However, the investment results of the portfolio may be higher or |
| | | lower than, and may not be comparable to, those of any other Dreyfus fund/portfolio. |
| 1 | | Total return includes reinvestment of dividends and any capital gains paid. Past performance is no |
| | | guarantee of future results. Share price and investment return fluctuate such that upon redemption, |
| | | portfolio shares may be worth more or less than their original cost.The portfolio’s performance does |
| | | not reflect the deduction of additional charges and expenses imposed in connection with investing |
| | | in variable insurance contracts, which will reduce returns. Return figures provided reflect the |
| | | absorption of certain portfolio expenses by The Dreyfus Corporation pursuant to an agreement in |
| | | effect through December 31, 2007, at which time it may be extended, terminated or modified. |
| | | Had these expenses not been absorbed, the portfolio’s returns would have been lower. |
| 2 | | SOURCE: LIPPER, INC. — Reflects reinvestment of dividends and, where applicable, capital |
| | | gain distributions.The Standard & Poor’s 500 Composite Stock Price Index is a widely accepted, |
| | | unmanaged index of U.S. stock market performance.The Lehman Brothers Intermediate |
| | | Government/Credit Bond Index is a widely accepted, unmanaged index of government and |
| | | corporate bond market performance composed of U.S. government,Treasury and agency securities, |
| | | fixed-income securities and nonconvertible investment-grade corporate debt, with an average |
| | | maturity of 1-10 years. |
The Portfolio 5

| Average Annual Total Returns | | as of 12/31/06 | | | | |
| | | Inception | | | | | | From |
| | | Date | | 1 Year | | 5 Years | | Inception |
| |
| |
| |
| |
|
| Initial shares | | 5/1/97 | | 10.07% | | 2.78% | | 4.88% |
| Service shares | | 5/1/97 | | 9.87% | | 2.65% | | 4.79% |
| The data for Service shares includes the results of Initial shares for the period prior to December 31, 2000 |
| (inception date of Service shares). Actual Service shares’ average annual total return and hypothetical growth |
| results would have been lower. See notes below. |
| † Source: Lipper Inc. |
| Past performance is not predictive of future performance.The portfolio’s performance shown in the graph and table does not |
| reflect the deduction of taxes that a shareholder would pay on portfolio distributions or the redemption of portfolio shares. |
| The portfolio’s performance does not reflect the deduction of additional charges and expenses imposed in |
| connection with investing in variable insurance contracts which will reduce returns. |
| The above graph compares a $10,000 investment made in Initial and Service shares of Dreyfus Variable Investment |
| Fund, Balanced Portfolio on 5/1/97 (inception date of Initial shares) to a $10,000 investment made in each of the |
| 6 |
Standard & Poor’s 500 Composite Stock Price Index (the “S&P 500 Index”), the Lehman Brothers Intermediate Government/Credit Bond Index (the “Lehman Intermediate Bond Index”), a hybrid index composed of 60% S&P 500 Index and 40% Lehman Intermediate Bond Index (the “Hybrid Index”).The Hybrid Index is calculated on a year-to-year basis. For comparative purposes, the value of both indices on 4/30/97 is used as the beginning value on 5/1/97. The portfolio’s Initial shares are not subject to a Rule 12b-1 fee.The portfolio’s Service shares are subject to a 0.25% annual Rule 12b-1 fee.The performance figures for Service shares reflect the performance of the portfolio’s Initial shares from their inception date through December 30, 2000, and the performance of the portfolio’s Service shares from December 31, 2000 (inception date of Service shares) to December 31, 2006 (blended performance figures).The performance figures for each share class reflect certain expense reimbursements, without which the performance of each share class would have been lower. In addition, the blended performance figures have not been adjusted to reflect the higher operating expenses of the Service shares. If these expenses had been reflected, the blended performance figures would have been lower. All dividends and capital gain distributions are reinvested.
The portfolio’s performance shown in the line graph takes into account all applicable portfolio fees and expenses (after any expense reimbursements).The S&P 500 Index is a widely accepted, unmanaged index of U.S. stock market performance. The Lehman Intermediate Bond Index is a widely accepted, unmanaged index of government and corporate bond market performance composed of U.S. government,Treasury and agency securities, fixed-income securities and nonconvertible investment-grade corporate debt, with an average maturity of 1-10 years.The indices do not take into account charges, fees and other expenses. Further information relating to portfolio performance, including expense reimbursements, if applicable, is contained in the Financial Highlights section of the prospectus and elsewhere in this report.
The Portfolio 7
UNDERSTANDING YOUR
PORTFOLIO’S EXPENSES (Unaudited)
As a mutual fund investor,you pay ongoing expenses,such as management fees and other expenses.Using the information below,you can estimate how these expenses affect your investment and compare them with the expenses of other funds.You also may pay one-time transaction expenses,including sales charges (loads) and redemption fees, which are not shown in this section and would have resulted in higher total expenses. For more information, see your portfolio’s prospectus or talk to your financial adviser.
Review your portfolio’s expenses
|
The table below shows the expenses you would have paid on a $1,000 investment in Dreyfus Variable Investment Fund, Balanced Portfolio from July 1, 2006 to December 31, 2006. It also shows how much a $1,000 investment would be worth at the close of the period, assuming actual returns and expenses.
| Expenses and Value of a $1,000 Investment | | |
| assuming actual returns for the six months ended December 31, 2006 |
| | | Initial Shares | | Service Shares |
| |
| |
|
| Expenses paid per $1,000 † | | $ 4.84 | | $ 5.26 |
| Ending value (after expenses) | | $1,088.10 | | $1,087.60 |
COMPARING YOUR PORTFOLIO’S EXPENSES WITH THOSE OF OTHER FUNDS (Unaudited)
Using the SEC’s method to compare expenses
The Securities and Exchange Commission (SEC) has established guidelines to help investors assess fund expenses. Per these guidelines, the table below shows your portfolio’s expenses based on a $1,000 investment, assuming a hypothetical 5% annualized return. You can use this information to compare the ongoing expenses (but not transaction expenses or total cost) of investing in the portfolio with those of other funds. All mutual fund shareholder reports will provide this information to help you make this comparison. Please note that you cannot use this information to estimate your actual ending account balance and expenses paid during the period.
| Expenses and Value of a $1,000 Investment |
| assuming a hypothetical 5% annualized return for the six months ended December 31, 2006 |
| | | Initial Shares | | Service Shares |
| |
| |
|
| Expenses paid per $1,000 † | | $ 4.69 | | $ 5.09 |
| Ending value (after expenses) | | $1,020.57 | | $1,020.16 |
| † Expenses are equal to the portfolio’s annualized expense ratio of .92% for Initial shares and 1.00% for Service shares, |
| multiplied by the average account value over the period, multiplied by 184/365 (to reflect the one-half year period). |
STATEMENT OF INVESTMENTS
December 31, 2006
|
| Common Stocks—70.0% | | Shares | | | | Value ($) |
| |
| |
| |
|
| Consumer Discretionary—10.8% | | | | | | |
| Apollo Group, Cl. A | | 14,800 a | | | | 576,756 |
| Cabela’s | | 55,000 a,b | | | | 1,327,150 |
| Career Education | | 32,000 a | | | | 792,960 |
| Corinthian Colleges | | 123,700 a | | | | 1,686,031 |
| Cost Plus | | 44,800 a,b | | | | 461,440 |
| Home Depot | | 20,000 | | | | 803,200 |
| Interpublic Group of Cos. | | 22,800 a | | | | 279,072 |
| Kohl’s | | 5,700 a | | | | 390,051 |
| | | | | | | 6,316,660 |
| Consumer Staples—5.7% | | | | | | |
| Coca-Cola | | 18,900 | | | | 911,925 |
| CVS | | 22,800 | | | | 704,748 |
| Nestle, ADR | | 9,600 | | | | 852,576 |
| Wal-Mart Stores | | 19,200 | | | | 886,656 |
| | | | | | | 3,355,905 |
| Energy—4.7% | | | | | | |
| Chevron | | 18,700 | | | | 1,375,011 |
| Exxon Mobil | | 18,100 | | | | 1,387,003 |
| | | | | | | 2,762,014 |
| Financial—15.4% | | | | | | |
| American International Group | | 20,900 | | | | 1,497,694 |
| Bank of America | | 21,900 | | | | 1,169,241 |
| Berkshire Hathaway, Cl. A | | 10 a | | | | 1,099,900 |
| Citigroup | | 23,200 | | | | 1,292,240 |
| Doral Financial | | 115,000 | | | | 330,050 |
| Fannie Mae | | 20,800 | | | | 1,235,312 |
| Freddie Mac | | 7,400 | | | | 502,460 |
| JPMorgan Chase & Co. | | 25,500 | | | | 1,231,650 |
| Marsh & McLennan Cos. | | 21,300 | | | | 653,058 |
| | | | | | | 9,011,605 |
| Health Care—14.4% | | | | | | |
| Bausch & Lomb | | 11,000 | | | | 572,660 |
| Cardinal Health | | 21,700 | | | | 1,398,131 |
| Johnson & Johnson | | 13,500 | | | | 891,270 |
| Medtronic | | 25,300 | | | | 1,353,803 |
The Portfolio 9
STATEMENT OF INVESTMENTS (continued)
|
| Common Stocks (continued) | | Shares | | Value ($) |
| |
| |
|
| Health Care (continued) | | | | |
| Merck & Co. | | 13,300 | | 579,880 |
| Pfizer | | 65,900 | | 1,706,810 |
| Wyeth | | 14,300 | | 728,156 |
| Zimmer Holdings | | 15,000 a | | 1,175,700 |
| | | | | 8,406,410 |
| Industrial—4.4% | | | | |
| General Electric | | 33,400 | | 1,242,814 |
| Tyco International | | 43,000 | | 1,307,200 |
| | | | | 2,550,014 |
| Information Technology—14.6% | | | | |
| BISYS Group | | 48,800 a | | 630,008 |
| Dell | | 15,500 a | | 388,895 |
| Electronic Data Systems | | 42,600 | | 1,173,630 |
| First Data | | 26,700 | | 681,384 |
| Fiserv | | 22,100 a | | 1,158,482 |
| Hewitt Associates, Cl. A | | 42,600 a | | 1,096,950 |
| Microchip Technology | | 21,500 | | 703,050 |
| Microsoft | | 70,800 | | 2,114,088 |
| Western Union | | 28,000 | | 627,760 |
| | | | | 8,574,247 |
| Total Common Stocks | | | | |
| (cost $34,802,450) | | | | 40,976,855 |
| |
| |
|
| |
| Preferred Stocks—1.9% | | | | |
| |
| |
|
| Consumer Discretionary—.4% | | | | |
| General Motors, | | | | |
| Cum., $1.84 | | 12,000 | | 229,350 |
| Financial—.9% | | | | |
| Citigroup Capital VII, | | | | |
| Cum., $1.78 | | 22,300 | | 564,469 |
| Telecommunication Services—.6% | | | | |
| Verizon South, | | | | |
| Ser. F, Cum. $1.75 | | 12,800 | | 325,600 |
| Total Preferred Stocks | | | | |
| (cost $1,208,618) | | | | 1,119,419 |
| | | Coupon | | Maturity | | Principal | | |
| Bonds and Notes—26.4% | | Rate (%) | | Date | | Amount ($) | | Value ($) |
| |
| |
| |
| |
|
Consumer Discretionary—3.3%
|
| Tribune, | | | | | | | | |
| Unscd. Notes | | 4.88 | | 8/15/10 | | 2,000,000 | | 1,907,292 |
| Consumer Staples—1.7% | | | | | | | | |
| H.J. Heinz, | | | | | | | | |
| Notes | | 6.00 | | 3/15/08 | | 1,000,000 b | | 1,001,624 |
| Energy—.8% | | | | | | | | |
| Marathon Oil, | | | | | | | | |
| Notes | | 5.38 | | 6/1/07 | | 500,000 | | 499,867 |
| Financial—9.1% | | | | | | | | |
| Bank of America, | | | | | | | | |
| Sr. Notes | | 4.38 | | 12/1/10 | | 445,000 b | | 432,907 |
| Berkshire Hathaway Finance, | | | | | | | | |
| Notes | | 3.38 | | 10/15/08 | | 1,000,000 | | 969,584 |
| Countrywide Home Loan, | | | | | | | | |
| Notes, Ser. K | | 4.25 | | 12/19/07 | | 1,000,000 | | 989,576 |
| Ford Motor Credit, | | | | | | | | |
| Notes | | 5.56 | | 3/13/07 | | 35,000 c | | 34,781 |
| Ford Motor Credit, | | | | | | | | |
| Notes | | 6.19 | | 9/28/07 | | 105,000 c | | 104,881 |
| GMAC, | | | | | | | | |
| Notes | | 6.13 | | 2/1/07 | | 45,000 b | | 45,059 |
| GMAC, | | | | | | | | |
| Notes | | 6.75 | | 12/1/14 | | 135,000 b | | 138,874 |
| Hartford Life Insurance, | | | | | | | | |
| Sr. Unscd. Notes, Ser. incM | | 5.75 | | 9/15/13 | | 500,000 | | 494,630 |
| International Lease Finance, | | | | | | | | |
| Unsub. Notes | | 4.75 | | 7/1/09 | | 500,000 | | 494,176 |
| JPM Capital Trust I, | | | | | | | | |
| Gtd. Cap. Secs. | | 7.54 | | 1/15/27 | | 700,000 | | 726,287 |
| Marsh & McLennan Cos., | | | | | | | | |
| Sr. Notes | | 7.13 | | 6/15/09 | | 850,000 b | | 878,855 |
| | | | | | | | | 5,309,610 |
| Industrial—1.3% | | | | | | | | |
| Cardinal Health, | | | | | | | | |
| Notes | | 6.75 | | 2/15/11 | | 750,000 | | 786,426 |
The Portfolio 11
STATEMENT OF INVESTMENTS (continued)
|
| | | Coupon | | Maturity | | Principal | | |
| Bonds and Notes (continued) | | Rate (%) | | Date | | Amount ($) | | Value ($) |
| |
| |
| |
| |
|
Telecommunication Services—3.8%
|
| GTE Northwest, | | | | | | | | |
| Debs., Ser. C | | 6.30 | | 6/1/10 | | 1,700,000 | | 1,734,794 |
| New York Telephone, | | | | | | | | |
| Debs. | | 6.13 | | 1/15/10 | | 500,000 | | 504,731 |
| | | | | | | | | 2,239,525 |
| U.S. Government Agencies—4.3% | | | | | | |
| Federal Home Loan Banks, | | | | | | | | |
| Bonds | | 4.50 | | 7/12/10 | | 500,000 c | | 496,381 |
| Federal Home Loan Mortgage Corp., | | | | | | |
| Notes | | 2.38 | | 2/15/07 | | 1,000,000 | | 996,716 |
| Federal Home Loan Mortgage Corp., | | | | | | |
| Notes | | 3.75 | | 4/15/07 | | 500,000 | | 498,046 |
| Federal Home Loan Mortgage Corp., | | | | | | |
| Notes | | 4.75 | | 12/8/10 | | 500,000 | | 496,730 |
| | | | | | | | | 2,487,873 |
| U.S. Government Agencies/ | | | | | | | | |
| Mortgage-Backed—.4% | | | | | | | | |
| Federal Home Loan Mortgage Corp., | | | | | | |
| 5.50%, 9/1/34 | | | | | | 19,968 | | 19,774 |
| Federal National Mortgage Association: | | | | | | |
| 5.50%, 9/1/34 | | | | | | 79,214 | | 78,390 |
| 6.00%, 9/1/34 | | | | | | 132,209 | | 133,242 |
| | | | | | | | | 231,406 |
| U.S. Government Securities—1.7% | | | | | | |
| U.S. Treasury Notes | | 6.13 | | 8/15/07 | | 1,000,000 b | | 1,006,641 |
| Total Bonds and Notes | | | | | | | | |
| (cost $15,647,064) | | | | | | | | 15,470,264 |
| |
| |
| |
| |
|
| |
| Other Investment—.3% | | | | | | Shares | | Value ($) |
| |
| |
| |
| |
|
| Registered Investment Company; | | | | | | |
| Dreyfus Institutional Preferred | | | | | | | | |
| Plus Money Market Fund | | | | | | | | |
| (cost $151,000) | | | | | | 151,000 d | | 151,000 |
| Investment of Cash Collateral | | | | |
| for Securities Loaned—3.8% | | Shares | | Value ($) |
| |
| |
|
| Registered Investment Company; | | | | |
| Dreyfus Institutional Cash | | | | | | |
| Advantage Plus Fund | | | | | | |
| (cost $2,224,276) | | | | 2,224,276 d | | 2,224,276 |
| |
| |
| |
|
| |
| Total Investments (cost $54,033,408) | | 102.4% | | 59,941,814 |
| |
| Liabilities, Less Cash and Receivables | | (2.4%) | | (1,405,345) |
| |
| Net Assets | | | | 100.0% | | 58,536,469 |
| |
| ADR—American Depository Receipts | | | | |
| a | | Non-income producing security. | | | | | | |
| b | | All or a portion of these securities are on loan. At December 31, 2006, the total market value of the portfolio’s |
| | | securities on loan is $3,115,928 and the total market value of the collateral held by the portfolio is $3,275,526, |
| | | consisting of cash collateral of $2,224,276 and U.S. Government and agency securities valued at $1,051,250. |
| c | | Variable rate security—interest rate subject to periodic change. | | |
| d | | Investment in affiliated money market mutual fund. | | | | |
| |
| |
| |
|
| |
| |
| |
| |
| Portfolio Summary (Unaudited) † | | | | |
| |
| | | | | Value (%) | | | | Value (%) |
| |
| |
| |
| |
|
| Corporate Bonds | | 20.0 | | Consumer Staples | | 5.7 |
| Financial | | 16.3 | | Energy | | 4.7 |
| Information Technology | | 14.6 | | Industrial | | 4.4 |
| Health Care | | 14.4 | | Money Market Investments | | 4.1 |
| Consumer Discretionary | | 11.2 | | Telecommunication Services | | .6 |
| U.S. Government & Agencies | | 6.4 | | | | 102.4 |
| |
| † | | Based on net assets. | | | | | | |
| See notes to financial statements. | | | | | | |
The Portfolio 13
STATEMENT OF ASSETS AND LIABILITIES
December 31, 2006
| | | Cost | | Value |
| |
| |
|
| Assets ($): | | | | |
| Investments in securities—See Statement | | | | |
| of Investments (including securities on loan, | | |
| valued at $3,115,928)—Note 1(c): | | | | |
| Unaffiliated issuers | | 51,658,132 | | 57,566,538 |
| Affiliated issuers | | 2,375,276 | | 2,375,276 |
| Cash | | | | 2,217 |
| Receivable for investment securities sold | | | | 1,838,181 |
| Dividends and interest receivable | | | | 244,750 |
| Prepaid expenses and other assets | | | | 5,891 |
| | | | | 62,032,853 |
| |
| |
|
| Liabilities ($): | | | | |
| Due to The Dreyfus Corporation and affiliates—Note 3(b) | | 42,822 |
| Liability for securities on loan—Note 1(c) | | | | 2,224,276 |
| Payable for investment securities purchased | | 1,162,487 |
| Accrued expenses | | | | 66,799 |
| | | | | 3,496,384 |
| |
| |
|
| Net Assets ($) | | | | 58,536,469 |
| |
| |
|
| Composition of Net Assets ($): | | | | |
| Paid-in capital | | | | 69,050,308 |
| Accumulated undistributed investment income—net | | 324,074 |
| Accumulated net realized gain (loss) on investments | | (16,746,319) |
| Accumulated net unrealized appreciation | | | | |
| (depreciation) on investments | | | | 5,908,406 |
| |
| |
|
| Net Assets ($) | | | | 58,536,469 |
| |
| |
|
| |
| |
| Net Asset Value Per Share | | | | |
| | | Initial Shares | | Service Shares |
| |
| |
|
| Net Assets ($) | | 41,811,731 | | 16,724,738 |
| Shares Outstanding | | 3,004,722 | | 1,199,938 |
| |
| |
|
| Net Assets Value Per Share ($) | | 13.92 | | 13.94 |
See notes to financial statements.
|
STATEMENT OF OPERATIONS
Year Ended December 31, 2006
|
| Investment Income ($): | | |
| Income: | | |
| Cash dividends (net of $5,059 foreign taxes withheld at source): | | |
| Unaffiliated issuers | | 775,748 |
| Affiliated issuers | | 27,072 |
| Interest | | 779,279 |
| Income on securities lending | | 62,866 |
| Total Income | | 1,644,965 |
| Expenses: | | |
| Investment advisory fee—Note 3(a) | | 467,003 |
| Distribution fees—Note 3(b) | | 43,239 |
| Auditing fees | | 37,234 |
| Prospectus and shareholders’ reports | | 30,261 |
| Custodian fees—Note 3(b) | | 7,700 |
| Trustees’ fees and expenses—Note 3(c) | | 7,194 |
| Legal fees | | 1,975 |
| Loan commitment fees—Note 2 | | 504 |
| Interest expense—Note 2 | | 492 |
| Shareholder servicing costs—Note 3(b) | | 292 |
| Miscellaneous | | 12,924 |
| Total Expenses | | 608,818 |
| Less—waiver of fees due to undertaking—Note 3(a) | | (31,743) |
| Net Expenses | | 577,075 |
| Investment Income—Net | | 1,067,890 |
| |
|
| Realized and Unrealized Gain (Loss) on Investments—Note 4 ($): |
| Net realized gain (loss) on investments | | (176,543) |
| Net unrealized appreciation (depreciation) on investments | | 4,901,391 |
| Net Realized and Unrealized Gain (Loss) on Investments | | 4,724,848 |
| Net Increase in Net Assets Resulting from Operations | | 5,792,738 |
See notes to financial statements.
|
The Portfolio 15
STATEMENT OF CHANGES IN NET ASSETS
| | | Year Ended December 31, |
| |
|
| | | 2006 | | 2005 |
| |
| |
|
| Operations ($): | | | | |
| Investment income—net | | 1,067,890 | | 1,052,254 |
| Net realized gain (loss) on investments | | (176,543) | | 305,484 |
| Net unrealized appreciation | | | | |
| (depreciation) on investments | | 4,901,391 | | (2,479,092) |
| Net Increase (Decrease) in Net Assets | | | | |
| Resulting from Operations | | 5,792,738 | | (1,121,354) |
| |
| |
|
| Dividends to Shareholders from ($): | | | | |
| Investment income—net: | | | | |
| Initial shares | | (952,807) | | (933,459) |
| Service shares | | (338,384) | | (316,209) |
| Total Dividends | | (1,291,191) | | (1,249,668) |
| |
| |
|
| Beneficial Interest Transactions ($): | | | | |
| Net proceeds from shares sold: | | | | |
| Initial shares | | 802,344 | | 763,690 |
| Service shares | | 308,764 | | 588,316 |
| Dividends reinvested: | | | | |
| Initial shares | | 952,807 | | 933,459 |
| Service shares | | 338,384 | | 316,209 |
| Cost of shares redeemed: | | | | |
| Initial shares | | (12,264,890) | | (11,888,473) |
| Service shares | | (3,337,048) | | (4,057,658) |
| Increase (Decrease) in Net Assets from | | | | |
| Beneficial Interest Transactions | | (13,199,639) | | (13,344,457) |
| Total Increase (Decrease) in Net Assets | | (8,698,092) | | (15,715,479) |
| |
| |
|
| Net Assets ($): | | | | |
| Beginning of Period | | 67,234,561 | | 82,950,040 |
| End of Period | | 58,536,469 | | 67,234,561 |
| Undistributed investment income—net | | 324,074 | | 467,715 |
| | | Year Ended December 31, |
| |
|
| | | 2006 | | 2005 |
| |
| |
|
| Capital Share Transactions: | | | | |
| Initial Shares | | | | |
| Shares sold | | 60,004 | | 58,603 |
| Shares issued for dividends reinvested | | 71,476 | | 72,180 |
| Shares redeemed | | (925,609) | | (916,292) |
| Net Increase (Decrease) in Shares Outstanding | | (794,129) | | (785,509) |
| |
| |
|
| Service Shares | | | | |
| Shares sold | | 23,593 | | 45,287 |
| Shares issued for dividends reinvested | | 25,327 | | 24,427 |
| Shares redeemed | | (251,321) | | (311,605) |
| Net Increase (Decrease) in Shares Outstanding | | (202,401) | | (241,891) |
See notes to financial statements.
|
The Portfolio 17
The following tables describe the performance for each share class for the fiscal periods indicated. All information (except portfolio turnover rate) reflects financial results for a single portfolio share.Total return shows how much your investment in the portfolio would have increased (or decreased) during each period, assuming you had reinvested all dividends and distributions.These figures have been derived from the portfolio’s financial statements.
| | | | | | | Year Ended December 31, | | |
| | | |
| |
| |
|
| Initial Shares | | 2006 | | 2005 | | 2004 | | 2003 | | 2002 |
| |
| |
| |
| |
| |
|
| Per Share Data ($): | | | | | | | | | | |
| Net asset value, beginning of period | | 12.92 | | 13.31 | | 12.87 | | 11.09 | | 13.34 |
| Investment Operations: | | | | | | | | | | |
| Investment income—net a | | .23 | | .19 | | .22 | | .15 | | .19 |
| Net realized and unrealized | | | | | | | | | | |
| gain (loss) on investments | | 1.06 | | (.35) | | .50 | | 1.84 | | (2.25) |
| Total from Investment Operations | | 1.29 | | (.16) | | .72 | | 1.99 | | (2.06) |
| Distributions: | | | | | | | | | | |
| Dividends from investment income—net | | (.29) | | (.23) | | (.28) | | (.21) | | (.19) |
| Net asset value, end of period | | 13.92 | | 12.92 | | 13.31 | | 12.87 | | 11.09 |
| |
| |
| |
| |
| |
|
| Total Return (%) | | 10.07 | | (1.21) | | 5.64 | | 18.14 | | (15.48) |
| |
| |
| |
| |
| |
|
| Ratios/Supplemental Data (%): | | | | | | | | | | |
| Ratio of total expenses | | | | | | | | | | |
| to average net assets | | .91 | | .91 | | .88 | | .89 | | .85 |
| Ratio of net expenses | | | | | | | | | | |
| to average net assets | | .90 | | .90 | | .88 | | .89 | | .85 |
| Ratio of net investment income | | | | | | | | | | |
| to average net assets | | 1.74 | | 1.45 | | 1.73 | | 1.26 | | 1.58 |
| Portfolio Turnover Rate | | 33.34 | | 41.89 | | 281.51b | | 363.02b | | 388.26 |
| |
| |
| |
| |
| |
|
| Net Assets, end of period ($ x 1,000) | | 41,812 | | 49,094 | | 61,038 | | 67,239 | | 64,865 |
| |
| a | | Based on average shares outstanding at each month end. | | | | | | | | |
| b | | The portfolio turnover rate excluding mortgage dollar roll transactions for the years ended December 31, 2004 and |
| | | December 31, 2003 were 266.40% and 305.71%, respectively. | | | | | | |
| See notes to financial statements. | | | | | | | | | | |
| | | | | | | Year Ended December 31, | | |
| | | |
| |
| |
|
| Service Shares | | 2006 | | 2005 | | 2004 | | 2003 | | 2002 |
| |
| |
| |
| |
| |
|
| Per Share Data ($): | | | | | | | | | | |
| Net asset value, beginning of period | | 12.94 | | 13.33 | | 12.87 | | 11.08 | | 13.33 |
| Investment Operations: | | | | | | | | | | |
| Investment income—net a | | .22 | | .17 | | .21 | | .14 | | .17 |
| Net realized and unrealized | | | | | | | | | | |
| gain (loss) on investments | | 1.04 | | (.34) | | .50 | | 1.84 | | (2.24) |
| Total from Investment Operations | | 1.26 | | (.17) | | .71 | | 1.98 | | (2.07) |
| Distributions: | | | | | | | | | | |
| Dividends from investment income—net | | (.26) | | (.22) | | (.25) | | (.19) | | (.18) |
| Net asset value, end of period | | 13.94 | | 12.94 | | 13.33 | | 12.87 | | 11.08 |
| |
| |
| |
| |
| |
|
| Total Return (%) | | 9.87 | | (1.30) | | 5.57 | | 18.02 | | (15.63) |
| |
| |
| |
| |
| |
|
| Ratios/Supplemental Data (%): | | | | | | | | | | |
| Ratio of total expenses | | | | | | | | | | |
| to average net assets | | 1.16 | | 1.16 | | 1.13 | | 1.14 | | 1.09 |
| Ratio of net expenses | | | | | | | | | | |
| to average net assets | | 1.00 | | 1.00 | | 1.00 | | 1.00 | | 1.00 |
| Ratio of net investment income | | | | | | | | | | |
| to average net assets | | 1.64 | | 1.35 | | 1.62 | | 1.15 | | 1.45 |
| Portfolio Turnover Rate | | 33.34 | | 41.89 | | 281.51b | | 363.02b | | 388.26 |
| |
| |
| |
| |
| |
|
| Net Assets, end of period ($ x 1,000) | | 16,725 | | 18,141 | | 21,912 | | 23,313 | | 22,040 |
| a | | Based on average shares outstanding at each month end. | | | | | | | | |
| b | | The portfolio turnover rate excluding mortgage dollar roll transactions for the years ended December 31, 2004 and |
| | | December 31, 2003 were 266.40% and 305.71%, respectively. | | | | | | |
| See notes to financial statements. | | | | | | | | | | |
The Portfolio 19
NOTES TO FINANCIAL STATEMENTS
NOTE 1—Significant Accounting Policies:
Dreyfus Variable Investment Fund (the “fund”) is registered under the Investment Company Act of 1940, as amended (the “Act”), as an open-end management investment company, operating as a series company currently offering twelve series, including the Balanced Portfolio (the “portfolio”). The portfolio is only offered to separate accounts established by insurance companies to fund variable annuity contracts and variable life insurance policies.The portfolio is a diversified series. The portfolio’s investment objective seeks high total return through a combination of capital appreciation and current income. The Dreyfus Corporation (the “Manager” or “Dreyfus”) serves as the portfolio’s investment adviser. Dreyfus is a wholly-owned subsidiary of Mellon Financial Corporation (“Mellon Financial”). Wisconsin Capital Management LLC (“Wisconsin Capital”) serves as the portfolio’s sub-investment adviser.
On December 4, 2006, Mellon Financial and The Bank of New York Company, Inc. announced that they had entered into a definitive agreement to merge. The new company will be called The Bank of New York Mellon Corporation. As part of this transaction, Dreyfus would become a wholly-owned subsidiary of The Bank of New York Mellon Corporation.The transaction is subject to certain regulatory approvals and the approval of The Bank of New York Company, Inc.’s and Mellon Financial’s shareholders, as well as other customary conditions to closing. Subject to such approvals and the satisfaction of the other conditions, Mellon Financial and The Bank of New York Company, Inc. expect the transaction to be completed in the third quarter of 2007.
Dreyfus Service Corporation (the “Distributor”), a wholly-owned subsidiary of the Manager, is the distributor of the portfolio’s shares, which are sold without a sales charge.The portfolio is authorized to issue an unlimited number of $.001 par value shares of Beneficial Interest in each of the following classes of shares: Initial and Service. Each class of shares has identical rights and privileges, except with respect to the distribution plan and the expenses borne by each class and certain voting
rights. Income, expenses (other than expenses attributable to a specific class), and realized and unrealized gains or losses on investments are allocated to each class of shares based on its relative net assets.
The fund accounts separately for the assets, liabilities and operations of each series. Expenses directly attributable to each series are charged to that series’ operations; expenses which are applicable to all series are allocated among them on a pro rata basis.
The portfolio’s financial statements are prepared in accordance with U.S. generally accepted accounting principles, which may require the use of management estimates and assumptions.Actual results could differ from those estimates.
The fund enters into contracts that contain a variety of indemnifica-tions.The portfolio’s maximum exposure under these arrangements is unknown. The portfolio does not anticipate recognizing any loss related to these arrangements.
(a) Portfolio valuation: Most debt securities are valued each business day by an independent pricing service (the “Service”) approved by the Board of Trustees. Securities listed on the National Market System, for which market quotations are available are valued at the official closing price or, if there is no official closing price that day, at the last sale price. Debt securities for which quoted bid prices are readily available and are representative of the bid side of the market in the judgment of the Service are valued at the mean between the quoted bid prices (as obtained by the Service from dealers in such securities) and asked prices (as calculated by the Service based upon its evaluation of the market for such securities). Other debt securities are carried at fair value as determined by the Service, based on methods which include consideration of: yields or prices of securities of comparable quality, coupon, maturity and type; indications as to values from dealers; and general market conditions. Other securities are valued at the last sales price on the securities exchange or on the national securities market on which such securities are primarily traded. Securities listed on the National Market
The Portfolio 21
NOTES TO FINANCIAL STATEMENTS (continued)
|
System for which market quotations are available are valued at the official closing price or, if there is no official closing price that day, at the last sales price. Securities not listed on an exchange or the national securities market, or securities for which there were no transactions, are valued at the average of the most recent bid and asked prices, except for open short positions, where the asked price is used for valuation purposes. Bid price is used when no asked price is available. Registered open-end investment companies that are not traded on an exchange are valued at their net asset value.When market quotations or official closing prices are not readily available, or are determined not to reflect accurately fair value, such as when the value of a security has been significantly affected by events after the close of the exchange or market on which the security is principally traded (for example, a foreign exchange or market), but before the portfolio calculates its net asset value, the portfolio may value these investments at fair value as determined in accordance with the procedures approved by the Board of Trustees. Fair valuing of securities may be determined with the assistance of a pricing service using calculations based on indices of domestic securities and other appropriate indicators, such as prices of relevant ADR’s and futures contracts. For other securities that are fair valued by the Board of Trustees, certain factors may be considered such as: fundamental analytical data, the nature and duration of restrictions on disposition, an evaluation of the forces that influence the market in which the securities are purchased and sold, and public trading in similar securities of the issuer or comparable issuers. Financial futures are valued at the last sales price. Investments denominated in foreign currencies are translated to U.S. dollars at the prevailing rates of exchange. Forward currency exchange contracts are valued at the forward rate.
On September 20, 2006, the Financial Accounting Standards Board (FASB) released Statement of Financial Accounting Standards No. 157 “Fair Value Measurements” (“FAS 157”). FAS 157 establishes an authoritative definition of fair value, sets out a framework for measuring fair value, and requires additional disclosures about fair-value measurements. The application of FAS 157 is required for fiscal years beginning after
November 15, 2007 and interim periods within those fiscal years. Management does not believe that the application of this standard will have a material impact on the financial statements of the portfolio.
(b) Foreign currency transactions: The portfolio does not isolate that portion of the results of operations resulting from changes in foreign exchange rates on investments from the fluctuations arising from changes in market prices of securities held. Such fluctuations are included with the net realized and unrealized gain or loss on investments.
Net realized foreign exchange gains or losses arise from sales and maturities of short-term securities, sales of foreign currencies, currency gains or losses realized on securities transactions and the difference between the amounts of dividends, interest and foreign withholding taxes recorded on the portfolio’s books and the U.S. dollar equivalent of the amounts actually received or paid. Net unrealized foreign exchange gains or losses arise from changes in the value of assets and liabilities other than investments in securities, resulting from changes in exchange rates. Such gains and losses are included with net realized and unrealized gain or loss on investments.
(c) Securities transactions and investment income: Securities transactions are recorded on a trade date basis. Realized gain and loss from securities transactions are recorded on the identified cost basis. Dividend income is recognized on the ex-dividend date and interest income, including, where applicable, accretion of discount and amortization of premium on investments, is recognized on the accrual basis.
The portfolio has an arrangement with the custodian bank whereby the portfolio receives earnings credits from the custodian when positive cash balances are maintained, which are used to offset custody fees. For financial reporting purposes, the portfolio includes net earnings credits, if any, as an expense offset in the Statement of Operations.
Pursuant to a securities lending agreement with Mellon Bank, N.A., an affiliate of Dreyfus, the portfolio may lend securities to qualified institutions. It is the portfolio’s policy, that at origination, all loans are
The Portfolio 23
NOTES TO FINANCIAL STATEMENTS (continued)
|
secured by collateral of at least 102% of the value of U.S. securities loaned and 105% of the value of foreign securities loaned. Collateral equivalent to at least 100% of the market value of securities on loan is maintained at all times. Cash collateral is invested in certain money market mutual funds managed by Dreyfus.The portfolio is entitled to receive all income on securities loaned, in addition to income earned as a result of the lending transaction.Although each security loaned is fully collateralized, the portfolio bears the risk of delay in recovery of, or loss of rights in, the securities loaned should a borrower fail to return the securities in a timely manner.
(d) Affiliated issuers: Investments in other investment companies advised by Dreyfus are defined as “affiliated” in the Act.
(e) Dividends to shareholders: Dividends are recorded on the ex-dividend date. Dividends from investment income-net are declared and paid quarterly. Dividends from net realized capital gain, if any, are normally declared and paid annually, but the portfolio may make distributions on a more frequent basis to comply with the distribution requirements of the Internal Revenue Code of 1986, as amended (the “Code”).To the extent that net realized capital gain can be offset by capital loss carryovers, it is the policy of the portfolio not to distribute such gain. Income and capital gain distributions are determined in accordance with income tax regulations, which may differ from U.S. generally accepted accounting principles.
(f) Federal income taxes: It is the policy of the portfolio to continue to qualify as a regulated investment company, if such qualification is in the best interests of its shareholders, by complying with the applicable provisions of the Code, and to make distributions of taxable income sufficient to relieve it from substantially all federal income and excise taxes.
On July 13, 2006, the FASB released FASB Interpretation No. 48 “Accounting for Uncertainty in Income Taxes” (FIN 48). FIN 48 provides guidance for how uncertain tax positions should be recognized, measured, presented and disclosed in the financial statements. FIN 48 requires the evaluation of tax positions taken or expected to be taken
in the course of preparing the portfolio’s tax returns to determine whether the tax positions are “more-likely-than-not” of being sustained by the applicable tax authority. Tax positions not deemed to meet the more-likely-than-not threshold would be recorded as a tax benefit or expense in the current year.Adoption of FIN 48 is required for fiscal years beginning after December 15, 2006 and is to be applied to all open tax years as of the effective date. Management does not believe that the application of this standard will have a material impact on the financial statements of the portfolio.
At December 31, 2006, the components of accumulated earnings on a tax basis were as follows: undistributed ordinary income $324,074, accumulated capital losses $16,221,480 and unrealized appreciation $5,383,567.
The accumulated capital loss carryover is available to be applied against future net securities profits, if any, realized subsequent to December 31, 2006. If not applied, $2,741,702 of the carryover expires in fiscal 2009, $8,289,370 expires in fiscal 2010, $3,878,353 expires in fiscal 2011 and $1,312,055 of the carryover expires in fiscal 2014.
The tax character of distributions paid to shareholders during the fiscal period ended December 31, 2006 and December 31, 2005, were as follows: ordinary income $1,291,191 and $1,249,668, respectively.
During the period ended December 31, 2006, as a result of permanent book to tax differences primarily due to the tax treatment for amortization of premiums and paydown gains and losses on mortgage backed securities, the portfolio increased accumulated undistributed investment income-net by $79,660 and decreased accumulated net realized gain (loss) on investments by the same amount. Net assets were not affected by this reclassification.
NOTE 2—Bank Line of Credit:
|
The portfolio participates with other Dreyfus-managed funds in a $350 million redemption credit facility (the “Facility”) to be utilized for temporary or emergency purposes, including the financing of
The Portfolio 25
NOTES TO FINANCIAL STATEMENTS (continued)
|
redemptions. In connection therewith, the portfolio has agreed to pay commitment fees on its pro rata portion of the Facility. Interest is charged to the portfolio based on prevailing market rates in effect at the time of borrowing.
The average daily amount of borrowings outstanding under the Facility during the period ended December 31, 2006, was approximately $9,000, with a related weighted average annualized interested rate of 5.46% .
NOTE 3—Investment Advisory Fee and Other Transactions With Affiliates:
(a) Pursuant to an Investment Advisory Agreement with Dreyfus, the investment advisory fee is computed at the annual rate of .75% of the value of the portfolio’s average daily net assets and is payable monthly.
Dreyfus has agreed, from January 1, 2006 to December 31, 2007, to waive receipt of its fees and/or assume the expenses of the portfolio so that the expenses of neither class, exclusive of taxes, brokerage fees, interest on borrowings, commitment fees and extraordinary expenses, exceed 1% of the value of the average daily net assets of their class. During the period ended December 31, 2006, Dreyfus waived receipt of fees of $31,743 pursuant to the undertaking.
Pursuant to a Sub-Investment Advisory Agreement between Dreyfus and Wisconsin Capital, the sub-investment advisory fee is payable monthly by Dreyfus, and is based upon the value of the portfolio’s average daily net assets, computed at the following annual rates:
| Average Net Assets | | |
| 0 to $300 million | | .25% |
| In excess of $300 million | | .20% |
(b) Under the Distribution Plan (the “Plan”) adopted pursuant to Rule 12b-1 under the Act, Service shares pay the Distributor for distributing their shares, for servicing and/or maintaining Service shares
shareholder accounts and for advertising and marketing for Service shares.The Plan provides for payments to be made at an annual rate of .25% of the value of the Service shares’ average daily net assets. The Distributor may make payments to Participating Insurance Companies and to brokers and dealers acting as principal underwriter for their variable insurance products. The fees payable under the Plan are payable without regard to actual expenses incurred. During the period ended December 31, 2006, Service shares were charged $43,239 pursuant to the Plan.
The portfolio compensates Dreyfus Transfer, Inc., a wholly-owned subsidiary of Dreyfus, under a transfer agency agreement for providing personnel and facilities to perform transfer agency services for the portfolio. During the period ended December 31, 2006, the portfolio was charged $51 pursuant to the transfer agency agreement.
The portfolio compensates Mellon Bank, N.A., an affiliate of Dreyfus, under a custody agreement for providing custodial services for the portfolio. During the period ended December 31, 2006, the portfolio was charged $7,700 pursuant to the custody agreement.
During the period ended December 31, 2006, the portfolio was charged $4,204 for services performed by the Chief Compliance Officer.
The components of Due to The Dreyfus Corporation and affiliates in the Statement of Assets and Liabilities consist of: investment advisory fees $37,507, Rule 12b-1 distribution plan fees $3,559, custodian fees $1,788, chief compliance officer fees $2,044 and transfer agency per account fees $10, which are offset against an expense reimbursement currently in effect in the amount of $2,086.
(c) Each Board member also serves as a Board member of other funds within the Dreyfus complex. Annual retainer fees and attendance fees are allocated to each fund based on net assets.
The Portfolio 27
NOTES TO FINANCIAL STATEMENTS (continued)
|
(d) Pursuant to an exemptive order from the SEC, the portfolio may invest its available cash balances in affiliated money market mutual funds. Management fees of the underlying money market mutual fund have been waived by Dreyfus.
NOTE 4—Securities Transactions:
|
The aggregate amount of purchases and sales (including paydowns) of investment securities, excluding short-term securities, during the period ended December 31, 2006, amounted to $20,533,042 and $33,373,028, respectively.
At December 31, 2006, the cost of investments for federal income tax purposes was $54,558,247; accordingly, accumulated net unrealized appreciation on investments was $5,383,567, consisting of $7,766,074 gross unrealized appreciation and $2,382,507 gross unrealized depreciation.
REPORT OF INDEPENDENT REGISTERED PUBLIC ACCOUNTING FIRM
Shareholders and Board of Trustees
Dreyfus Variable Investment Fund, Balanced Portfolio
We have audited the accompanying statement of assets and liabilities, including the statement of investments, of Dreyfus Variable Investment Fund, Balanced Portfolio (one of the funds comprising the Dreyfus Variable Investment Fund) as of December 31, 2006, and the related statement of operations for the year then ended, the statement of changes in net assets for each of the two years in the period then ended, and financial highlights for each of the years indicated therein. These financial statements and financial highlights are the responsibility of the Fund’s management. Our responsibility is to express an opinion on these financial statements and financial highlights based on our audits.
We conducted our audits in accordance with the standards of the Public Company Accounting Oversight Board (United States).Those standards require that we plan and perform the audit to obtain reasonable assurance about whether the financial statements and financial highlights are free of material misstatement.We were not engaged to perform an audit of the Fund’s internal control over financial reporting. Our audits included consideration of internal control over financial reporting as a basis for designing audit procedures that are appropriate in the circumstances, but not for the purpose of expressing an opinion on the effectiveness of the Fund’s internal control over financial reporting. Accordingly, we express no such opinion.An audit also includes examining, on a test basis, evidence supporting the amounts and disclosures in the financial statements and financial highlights, assessing the accounting principles used and significant estimates made by management, and evaluating the overall financial statement presentation. Our procedures included confirmation of securities owned as of December 31, 2006 by correspondence with the custodian and others or by other appropriate auditing procedures where replies from others were not received. We believe that our audits provide a reasonable basis for our opinion.
In our opinion, the financial statements and financial highlights referred to above present fairly, in all material respects, the financial position of Dreyfus Variable Investment Fund, Balanced Portfolio at December 31, 2006, the results of its operations for the year then ended, the changes in its net assets for each of the two years in the period then ended, and the financial highlights for each of the indicated years, in conformity with U.S. generally accepted accounting principles.
| | New York, New York
February 6, 2007
|

The Portfolio 29
IMPORTANT TAX INFORMATION (Unaudited)
For federal tax purposes, the portfolio hereby designates 63.30% of the ordinary dividends paid during the fiscal year ended December 31, 2006 as qualifying for the corporate dividends received deduction. Shareholders will receive notification in January 2007 of the percentage applicable to the preparation of their 2006 income tax returns.
PROXY RESULTS (Unaudited)
|
Dreyfus Variable Investment Fund held a special meeting of shareholders on June 29, 2006.The proposal considered at the meeting, and the results, are as follows:
| | | | | Shares | | |
| |
| |
| |
|
| | | Votes For | | | | Authority Withheld |
| |
| |
| |
|
| To elect additional Board Members: | | | | | | |
| Peggy C. Davis † | | 171,078,927 | | | | 7,687,714 |
| Joseph S. DiMartino | | 170,946,484 | | | | 7,820,156 |
| David P. Feldman | | 170,959,921 | | | | 7,806,720 |
| Ehud Houminer † | | 170,132,087 | | | | 8,634,554 |
| Gloria Messinger † | | 170,187,241 | | | | 8,579,400 |
| Anne Wexler † | | 170,212,607 | | | | 8,554,033 |
| † Each new Board member’s term commenced on September 26, 2006. |
| In addition to Joseph S. DiMartino and David P. Feldman, James F. Henry, Dr. Paul A. Marks and Dr. Martin |
| Peretz continue as Board members of the fund. |
BOARD MEMBERS INFORMATION (Unaudited)
| Joseph S. DiMartino (63) |
| Chairman of the Board (1995) |
| Principal Occupation During Past 5 Years: |
| • Corporate Director and Trustee |
| Other Board Memberships and Affiliations: |
| • The Muscular Dystrophy Association, Director |
| • Century Business Services, Inc., a provider of outsourcing functions for small and medium size |
| companies, Director |
| • The Newark Group, a provider of a national market of paper recovery facilities, paperboard |
| mills and paperboard converting plants, Director |
| • Sunair Services Corporation, engaging in the design, manufacture and sale of high frequency |
| systems for long-range voice and data communications, as well as providing certain |
| outdoor-related services to homes and businesses, Director |
| No. of Portfolios for which Board Member Serves: 190 |
| ——————— |
| Peggy C. Davis (63) |
| Board Member (2006) |
| Principal Occupation During Past 5 Years: |
| • Shad Professor of Law, New York University School of Law (1983-present) |
| • Writer and teacher in the fields of evidence, constitutional theory, family law, social sciences |
| and the law, legal process and professional methodology and training |
| No. of Portfolios for which Board Member Serves: 80 |
| ——————— |
| David P. Feldman (67) |
| Board Member (1994) |
| Principal Occupation During Past 5 Years: |
| • Corporate Director and Trustee |
| Other Board Memberships and Affiliations: |
| • BBH Mutual Funds Group (11 funds), Director |
| • The Jeffrey Company, a private investment company, Director |
| • QMED, a medical device company, Director |
| No. of Portfolios for which Board Member Serves: 57 |
The Portfolio 31
BOARD MEMBERS INFORMATION (Unaudited) (continued)
| James F. Henry (76) |
| Board Member (1990) |
| Principal Occupation During Past 5 Years: |
| • President,The International Institute for Conflict Prevention and Resolution, a non-profit |
| organization principally engaged in the development of alternatives to business litigation |
| (Retired 2003) |
| • Advisor to The Elaw Forum, a consultant on managing corporate legal costs |
| • Advisor to John Jay Homestead (the restored home of the first U.S. Chief Justice) |
| • Individual Trustee of several trusts |
| Other Board Memberships and Affiliations: |
| • Director, advisor and mediator involved in several non-profit organizations, primarily engaged |
| in domestic and international dispute resolution, and historic preservation |
| No. of Portfolios for which Board Member Serves: 48 |
| ——————— |
| Ehud Houminer (66) |
| Board Member (2006) |
| Principal Occupation During Past 5 Years: |
| • Executive-in-Residence at the Columbia Business School, Columbia University |
| Other Board Memberships and Affiliations: |
| • Avnet Inc., an electronics distributor, Director |
| • International Advisory Board to the MBA Program School of Management, Ben Gurion |
| University, Chairman |
| • Explore Charter School, Brooklyn, NY, Chairman |
| No. of Portfolios for which Board Member Serves: 78 |
| ——————— |
| Gloria Messinger (77) |
| Board Member (2006) |
| Principal Occupation During Past 5 Years: |
| • Arbitrator for American Arbitration Association and National Association of Securities Dealers, Inc. |
| • Consultant in Intellectual Property |
| Other Board Memberships and Affiliations: |
| • Theater for a New Audience, Inc., Director |
| • Brooklyn Philharmonic, Director |
| No. of Portfolios for which Board Member Serves: 48 |
| Dr. Martin Peretz (67) |
| Board Member (1990) |
| Principal Occupation During Past 5 Years: |
| • Editor-in-Chief of The New Republic Magazine |
| • Lecturer in Social Studies at Harvard University (1965-2002) |
| • Director of TheStreet.com, a financial information service on the web |
| Other Board Memberships and Affiliations: |
| • American Council of Trustees and Alumni, Director |
| • Pershing Square Capital Management, Adviser |
| • Montefiore Ventures, General Partner |
| • Harvard Center for Blood Research,Trustee |
| • Bard College,Trustee |
| • Board of Overseers of YIVO Institute for Jewish Research, Chairman |
| No. of Portfolios for which Board Member Serves: 48 |
| ——————— |
| Anne Wexler (76) |
| Board Member (2006) |
| Principal Occupation During Past 5 Years: |
| • Chairman of the Wexler & Walker Public Policy Associates, consultants specializing in |
| government relations and public affairs |
| Other Board Memberships and Affiliations: |
| • Wilshire Mutual Funds (5 funds), Director |
| • Methanex Corporation, a methanol producing company, Director |
| • Member of the Council of Foreign Relations |
| • Member of the National Park Foundation |
| No. of Portfolios for which Board Member Serves: 57 |
| ——————— |
| Once elected all Board Members serve for an indefinite term, but achieve Emeritus status on December 31st of the |
| calendar year in which the Board Member reaches age 80.The address of the Board Members and Officers is in c/o The |
| Dreyfus Corporation, 200 Park Avenue, New York, New York 10166. Additional information about the Board Members |
| is available in the fund’s Statement of Additional Information which can be obtained from Dreyfus free of charge by |
| calling this toll free number: 1-800-554-4611. |
| John M. Fraser, Jr., Emeritus Board Member |
| Rosalind G. Jacobs, Emeritus Board Member |
| Dr. Paul A. Marks, Emeritus Board Member |
The Portfolio 33
OFFICERS OF THE FUND (Unaudited)
| J. DAVID OFFICER, President since |
| December 2006. |
Chief Operating Officer,Vice Chairman and a director of the Manager, and an officer of 90 investment companies (comprised of 190 portfolios) managed by the Manager. He is 58 years old and has been an employee of the Manager since April 1, 1998.
| MARK N. JACOBS, Vice President since |
| March 2000. |
Executive Vice President, Secretary and General Counsel of the Manager, and an officer of 91 investment companies (comprised of 206 portfolios) managed by the Manager. He is 60 years old and has been an employee of the Manager since June 1977.
| MICHAEL A. ROSENBERG, Vice President |
| and Secretary since August 2005. |
Associate General Counsel of the Manager, and an officer of 91 investment companies (comprised of 206 portfolios) managed by the Manager. He is 46 years old and has been an employee of the Manager since October 1991.
| JAMES BITETTO, Vice President and |
| Assistant Secretary since August 2005. |
Associate General Counsel and Assistant Secretary of the Manager, and an officer of 91 investment companies (comprised of 206 portfolios) managed by the Manager. He is 40 years old and has been an employee of the Manager since December 1996.
| JONI LACKS CHARATAN, Vice President |
| and Assistant Secretary since |
| August 2005. |
Associate General Counsel of the Manager, and an officer of 91 investment companies (comprised of 206 portfolios) managed by the Manager. She is 51 years old and has been an employee of the Manager since October 1988.
| JOSEPH M. CHIOFFI, Vice President and |
| Assistant Secretary since August 2005. |
Associate General Counsel of the Manager, and an officer of 91 investment companies (comprised of 206 portfolios) managed by the Manager. He is 45 years old and has been an employee of the Manager since June 2000.
| JANETTE E. FARRAGHER, Vice President |
| and Assistant Secretary since |
| August 2005. |
Associate General Counsel of the Manager, and an officer of 91 investment companies (comprised of 206 portfolios) managed by the Manager. She is 44 years old and has been an employee of the Manager since February 1984.
| JOHN B. HAMMALIAN, Vice President and |
| Assistant Secretary since August 2005. |
Associate General Counsel of the Manager, and an officer of 91 investment companies (comprised of 206 portfolios) managed by the Manager. He is 43 years old and has been an employee of the Manager since February 1991.
| ROBERT R. MULLERY, Vice President and |
| Assistant Secretary since August 2005. |
Associate General Counsel of the Manager, and an officer of 91 investment companies (comprised of 206 portfolios) managed by the Manager. He is 54 years old and has been an employee of the Manager since May 1986.
| JEFF PRUSNOFSKY, Vice President and |
| Assistant Secretary since August 2005. |
Associate General Counsel of the Manager, and an officer of 91 investment companies (comprised of 206 portfolios) managed by the Manager. He is 41 years old and has been an employee of the Manager since October 1990.
| JAMES WINDELS, Treasurer since |
| November 2001. |
Director – Mutual Fund Accounting of the Manager, and an officer of 91 investment companies (comprised of 206 portfolios) managed by the Manager. He is 48 years old and has been an employee of the Manager since April 1985.
| ERIK D. NAVILOFF, Assistant Treasurer |
| since December 2002. |
Senior Accounting Manager – Taxable Fixed Income Funds of the Manager, and an officer of 91 investment companies (comprised of 206 portfolios) managed by the Manager. He is 38 years old and has been an employee of the Manager since November 1992.
| ROBERT ROBOL, Assistant Treasurer |
| since August 2003. |
Senior Accounting Manager – Money Market and Municipal Bond Funds of the Manager, and an officer of 91 investment companies (comprised of 206 portfolios) managed by the Manager. He is 42 years old and has been an employee of the Manager since October 1988.
| ROBERT SVAGNA, Assistant Treasurer |
| since December 2002. |
Senior Accounting Manager – Equity Funds of the Manager, and an officer of 91 investment companies (comprised of 206 portfolios) managed by the Manager. He is 39 years old and has been an employee of the Manager since November 1990.
| GAVIN C. REILLY, Assistant Treasurer |
| since December 2005. |
Tax Manager of the Investment Accounting and Support Department of the Manager, and an officer of 91 investment companies (comprised of 206 portfolios) managed by the Manager. He is 38 years old and has been an employee of the Manager since April 1991.
| JOSEPH W. CONNOLLY, Chief Compliance |
| Officer since October 2004. |
Chief Compliance Officer of the Manager and The Dreyfus Family of Funds (91 investment companies, comprised of 206 portfolios). From November 2001 through March 2004, Mr. Connolly was first Vice-President, Mutual Fund Servicing for Mellon Global Securities Services. In that capacity, Mr. Connolly was responsible for managing Mellon’s Custody, Fund Accounting and Fund Administration services to third-party mutual fund clients. He is 49 years old and has served in various capacities with the Manager since 1980, including manager of the firm’s Fund Accounting Department from 1997 through October 2001.
| WILLIAM GERMENIS, Anti-Money |
| Laundering Compliance Officer since |
| September 2002. |
Vice President and Anti-Money Laundering Compliance Officer of the Distributor, and the Anti-Money Laundering Compliance Officer of 87 investment companies (comprised of 202 portfolios) managed by the Manager. He is 36 years old and has been an employee of the Distributor since October 1998.
The Portfolio 35
NOTES
| Dreyfus Variable |
| Investment Fund, |
| Balanced Portfolio |
| 200 Park Avenue |
| New York, NY 10166 |
| |
| Investment Adviser |
| The Dreyfus Corporation |
| 200 Park Avenue |
| New York, NY 10166 |
| |
| Sub-Investment Adviser |
| Wisconsin Capital Management LLC |
| 1200 John Q. Hammons Drive |
| Madison,Wisconsin 53717 |
| Custodian |
| Mellon Bank, N.A. |
| One Mellon Bank Center |
| Pittsburgh, PA 15258 |
| |
| Transfer Agent & |
| Dividend Disbursing Agent |
| Dreyfus Transfer, Inc. |
| 200 Park Avenue |
| New York, NY 10166 |
| |
| Distributor |
| Dreyfus Service Corporation |
| 200 Park Avenue |
| New York, NY 10166 |
Telephone 1-800-554-4611 or 516-338-3300
Mail The Dreyfus Family of Funds, 144 Glenn Curtiss Boulevard, Uniondale, NY 11556-0144 Attn: Investments Division
The portfolio files its complete schedule of portfolio holdings with the Securities and Exchange Commission (“SEC”) for the first and third quarters of each fiscal year on Form N-Q. The portfolio’s Forms N-Q are available on the SEC’s website at http://www.sec.gov and may be reviewed and copied at the SEC’s Public Reference Room in Washington, DC. Information on the operation of the Public Reference Room may be obtained by calling 1-202-551-8090.
A description of the policies and procedures that the portfolio uses to determine how to vote proxies relating to portfolio securities, and information regarding how the portfolio voted these proxies for the 12-month period ended June 30, 2006, is available at http://www.dreyfus.com and on the SEC’s website at http://www.sec.gov. The description of the policies and procedures is also available without charge, upon request, by calling 1-800-645-6561.
© 2007 Dreyfus Service Corporation

The views expressed in this report reflect those of the portfolio manager only through the end of the period covered and do not necessarily represent the views of Dreyfus or any other person in the Dreyfus organization.Any such views are subject to change at any time based upon market or other conditions and Dreyfus disclaims any responsibility to update such views. These views may not be relied on as investment advice and, because investment decisions for a Dreyfus portfolio are based on numerous factors, may not be relied on as an indication of trading intent on behalf of any Dreyfus portfolio.
Not FDIC-Insured • Not Bank-Guaranteed • May Lose Value
| | | Contents |
| |
| | | T H E P O R T F O L I O |
| |
|
| 2 | | A Letter from the CEO |
| 3 | | Discussion of Performance |
| 6 | | Portfolio Performance |
| 8 | | Understanding Your Portfolio’s Expenses |
| 8 | | Comparing Your Portfolio’s Expenses |
| | | With Those of Other Funds |
| 9 | | Statement of Investments |
| 17 | | Statement of Assets and Liabilities |
| 18 | | Statement of Operations |
| 19 | | Statement of Changes in Net Assets |
| 21 | | Financial Highlights |
| 23 | | Notes to Financial Statements |
| 31 | | Report of Independent Registered |
| | | Public Accounting Firm |
| 32 | | Important Tax Information |
| 32 | | Proxy Results |
| 33 | | Board Members Information |
| 36 | | Officers of the Fund |
| |
| | | F O R M O R E I N F O R M AT I O N |
| |
|
| | | Back Cover |
| Dreyfus Variable Investment Fund, |
| Developing Leaders Portfolio |
The Portfolio

A LETTER FROM THE CEO
Dear Shareholder:
We are pleased to present this annual report for Dreyfus Variable Investment Fund, Developing Leaders Portfolio, covering the 12-month period from January 1, 2006, through December 31, 2006.
2006 proved to be a good year for the financial markets.Virtually all sectors and capitalization ranges of the U.S. equity markets generated strong returns, especially over the second half of the year.A number of positive factors contributed to the markets’ gains in 2006, including an expanding domestic economy, subdued inflation, stabilizing interest rates, rising productivity and robust corporate profits.
In our analysis, 2006 provided an excellent reminder of the need for a long-term investment perspective. Adopting too short a time frame proved costly for some investors last year, as chasing recent winners often meant buying the next month’s losers. Indeed, history shows that reacting to near-term developments with extreme shifts in strategy rarely is the right decision.We believe that a better course of action is to set a portfolio mix to meet future goals, while attempting to ignore short term market fluctuations in favor of a longer-term view.
For information about how the portfolio performed during the reporting period, as well as market perspectives, we have provided a Discussion of Performance given by the portfolio managers.
Thank you for your continued confidence and support.We wish you good health and prosperity in 2007.
| | Thomas F. Eggers
Chief Executive Officer
The Dreyfus Corporation
January 16, 2007
|

DISCUSSION OF PERFORMANCE
Franklin Portfolio Associates Smallcap Team, Portfolio Managers
How did Dreyfus Variable Investment Fund, Developing Leaders Portfolio perform relative to its benchmark?
For the 12-month period ended December 31, 2006, the portfolio produced total returns of 3.77% for its Initial shares and 3.52% for its Service shares.1 In comparison, the Russell 2000 Index (the “Index”), the portfolio’s benchmark, produced a total return of 18.37% for the same period.2
The rise in the small-cap market during 2006 was driven primarily by unexpectedly strong U.S. economic growth despite higher short-term interest rates, volatile energy prices and weakening housing markets.A wide array of companies exceeded their earnings and revenue estimates, pushing stock prices broadly higher, especially among highly leveraged, less financially stable issues.The portfolio participated in the market’s rise to a degree. However, the portfolio’s emphasis on higher-quality companies with relatively strong balance sheets and lower leverage undermined its returns compared to the benchmark. In addition, company-specific disappointments took a toll on the portfolio’s performance, particularly in the technology sector. As a result, the portfolio’s returns substantially lagged the benchmark.
What is the portfolio’s investment approach?
The portfolio seeks to identify undervalued small-cap stocks using a quantitative screening process.This process is driven by a proprietary quantitative model, which uses more than 40 factors to identify and rank individual stocks. Next, we focus on “bottom-up” stock selection as opposed to making proactive decisions about industry or sector exposures. Over time, we attempt to construct a portfolio that has exposure to industries and market capitalizations generally similar to the portfolio’s benchmark.Within each sector, we seek to overweight the most attractive stocks and underweight or not hold the stocks that have been ranked least attractive.
What other factors influenced the portfolio’s performance?
The small-cap stock market experienced high levels of uncertainty throughout 2006 in response to conflicting economic forces and shifting investor sentiment. Stock prices rose strongly in the first quarter,
DISCUSSION OF PERFORMANCE (continued)
|
then declined sharply in the spring and early summer, setting new lows for the year in June and July as investors became more risk-averse in response to rising interest rates and increasing inflationary pressures. However, short-term interest rates stabilized in August and energy prices subsequently declined, easing investors’ inflation-related concerns and giving rise to expectations that the U.S. economy was headed for a “soft landing.”As a result, stocks rose during the final months of the year.
Stocks with favorable long-term growth estimates and strong relative price behavior, which are ranked highly within our quantitative stock ranking models, performed relatively worse this year than stocks with lower long-term growth estimates and less strong relative price behavior.Also, stocks with greater financial leverage and higher balance sheet risk, which our process tends to avoid, outperformed over the reporting period.
Unexpected company-specific financial difficulties proved to be another factor undermining the portfolio’s performance in 2006.The portfolio encountered a number of such difficulties in the technology sector. Notably weak holdings, which were eventually sold, included electronic component manufacturer Multi-Fineline Electronix, which missed revenue and sales targets; and media-related semiconductor maker PortalPlayer, which lost a key contract with a major customer and later was acquired by a competitor. Outside of the technology sector, returns also suffered from the portfolio’s exposure to temporary staffing company Spherion, which reduced its earnings and revenue estimates several times during the reporting period.
Additionally, rising commodity prices and interest rates took a heavy toll on housing-related stocks in the portfolio.Investments in home builders, such as Brookfield Homes, which was sold during the reporting period, reported growing revenues and better-than-expected earnings during the reporting period. However, financial markets discounted the prices of such stocks over concerns that financial pressures on home buyers would depress housing starts. Investments in other industry groups with exposure to the housing market also suffered declines. For example, the portfolio’s holdings in Conn’s, a retailer that focuses on home appliances and electronics, lost significant ground during the first nine months of the year. Similarly, in the financials sector, commercial and residential real estate lender Fremont General lost value from January through early September in response to investor misgivings regarding the sustainability of housing-related loan activity.
Better performing segments of the portfolio included positions in the energy and industrials areas, which enabled the portfolio to produce good returns compared to the benchmark in those sectors. In addition, the portfolio’s perennial tilt toward stocks that are cheaper as measured by earnings yield also added value. In the aggregate, however, these bright spots were unable to overcome the ineffectiveness of the growth/momentum factors, and the market’s bidding up of lower “quality” stocks in the small-cap universe during the reporting period.
What is the portfolio’s current strategy?
We remain committed to our disciplined approach to adding value through our bottom-up, quantitatively based investment process. Our effort to identify the market’s more promising small-cap investment opportunities within each sector and industry remains the hallmark of our investment strategy.At the same time, we have continued to focus on evenly balancing growth and value considerations as we strive to identify stocks that we consider reasonably valued and poised for above-average growth. We have continued to approximate both the sector and industry composition of the benchmark, maintaining the portfolio’s sector-neutral profile.
January 16, 2007
| | | The portfolio is only available as a funding vehicle under various life insurance policies or variable |
| | | annuity contracts issued by insurance companies. Individuals may not purchase shares of the |
| | | portfolio directly. A variable annuity is an insurance contract issued by an insurance company that |
| | | enables investors to accumulate assets on a tax-deferred basis for retirement or other long-term |
| | | goals.The investment objective and policies of Dreyfus Variable Investment Fund, Developing |
| | | Leaders Portfolio made available through insurance products may be similar to other |
| | | funds/portfolios managed or advised by Dreyfus. However, the investment results of the portfolio |
| | | may be higher or lower than, and may not be comparable to, those of any other Dreyfus |
| | | fund/portfolio. |
| 1 | | Total return includes reinvestment of dividends and any capital gains paid. Past performance is no |
| | | guarantee of future results. Share price and investment return fluctuate such that upon redemption, |
| | | portfolio shares may be worth more or less than their original cost.The portfolio’s performance does |
| | | not reflect the deduction of additional charges and expenses imposed in connection with investing |
| | | in variable insurance contracts, which will reduce returns. |
| 2 | | SOURCE: LIPPER INC. — Reflects reinvestment of dividends and, where applicable, capital |
| | | gain distributions.The Russell 2000 Index is an unmanaged index of small-cap stock |
| | | performance and is composed of the 2,000 smallest companies in the Russell 3000 Index.The |
| | | Russell 3000 Index is composed of the 3,000 largest U.S. companies based on total market |
| | | capitalization. |
| | | Franklin Portfolio Associates is an independently managed, wholly owned subsidiary of Mellon |
| | | Financial Corporation. Franklin Portfolio Associates has no affiliation to the Franklin Templeton |
| | | Group of Funds or Franklin Resources, Inc.The portfolio’s managers are dual employees of |
| | | Franklin Portfolio Associates and Dreyfus. |
The Portfolio 5

| Average Annual Total Returns as of | | 12/31/06 | | | | |
| |
| | | 1 Year | | 5 Years | | 10 Years |
| |
| |
| |
|
| Initial shares | | 3.77% | | 5.42% | | 6.76% |
| Service shares | | 3.52% | | 5.16% | | 6.59% |
| |
| The data for Service shares includes the results of Initial shares for the period prior to December 31, 2000 |
| (inception date of Service shares). Actual Service shares’ average annual total return and hypothetical growth |
| results would have been lower. See notes below. | | | | | | |
| † Source: Lipper Inc. | | | | | | |
| Past performance is not predictive of future performance.The portfolio’s performance shown in the graph and table does not |
| reflect the deduction of taxes that a shareholder would pay on portfolio distributions or the redemption of portfolio shares. |
| The portfolio’s performance does not reflect the deduction of additional charges and expenses imposed in |
| connection with investing in variable insurance contracts which will reduce returns. | | |
| The above graph compares a $10,000 investment made in Initial and Service shares of Dreyfus Variable Investment |
| Fund, Developing Leaders Portfolio on 12/31/96 to a $10,000 investment made in the Russell 2000 Index (the |
| “Index”) on that date. | | | | | | |
6
The portfolio’s Initial shares are not subject to a Rule 12b-1 fee.The portfolio’s Service shares are subject to a 0.25% annual Rule 12b-1 fee.The performance figures for Service shares reflect the performance of the portfolio’s Initial shares from their inception date through December 30, 2000, and the performance of the portfolio’s Service shares from December 31, 2000 (inception date of Service shares) to December 31, 2006 (blended performance figures).The blended performance figures have not been adjusted to reflect the higher operating expenses of the Service shares. If these expenses had been reflected, the blended performance figures would have been lower. All dividends and capital gain distributions are reinvested.
The portfolio’s performance shown in the line graph takes into account all applicable portfolio fees and expenses.The Index is an unmanaged index and is composed of the 2,000 smallest companies in the Russell 3000 Index.The Russell 3000 Index is composed of 3,000 of the largest U.S. companies by market capitalization.The Index does not take into account charges, fees and other expenses. Further information relating to portfolio performance, including expense reimbursements, if applicable, is contained in the Financial Highlights section of the prospectus and elsewhere in this report.
UNDERSTANDING YOUR
PORTFOLIO’S EXPENSES (Unaudited)
|
As a mutual fund investor,you pay ongoing expenses,such as management fees and other expenses.Using the information below, you can estimate how these expenses affect your investment and compare them with the expenses of other funds.You also may pay one-time transaction expenses, including sales charges (loads) and redemption fees, which are not shown in this section and would have resulted in higher total expenses. For more information, see your portfolio’s prospectus or talk to your financial adviser.
Review your portfolio’s expenses
The table below shows the expenses you would have paid on a $1,000 investment in Dreyfus Variable Investment Fund, Developing Leaders Portfolio from July 1, 2006 to December 31, 2006. It also shows how much a $1,000 investment would be worth at the close of the period, assuming actual returns and expenses.
| Expenses and Value of a $1,000 Investment | | |
| assuming actual returns for the six months ended December 31, 2006 |
| | | Initial Shares | | Service Shares |
| |
| |
|
| Expenses paid per $1,000 † | | $ 4.46 | | $ 5.75 |
| Ending value (after expenses) | | $1,056.10 | | $1,054.80 |
COMPARING YOUR PORTFOLIO’S EXPENSES WITH THOSE OF OTHER FUNDS (Unaudited)
Using the SEC’s method to compare expenses
The Securities and Exchange Commission (SEC) has established guidelines to help investors assess fund expenses. Per these guidelines, the table below shows your portfolio’s expenses based on a $1,000 investment, assuming a hypothetical 5% annualized return. You can use this information to compare the ongoing expenses (but not transaction expenses or total cost) of investing in the portfolio with those of other funds. All mutual fund shareholder reports will provide this information to help you make this comparison. Please note that you cannot use this information to estimate your actual ending account balance and expenses paid during the period.
Expenses and Value of a $1,000 Investment assuming a hypothetical 5% annualized return for the six months ended December 31, 2006
| | | Initial Shares | | Service Shares |
| |
| |
|
| Expenses paid per $1,000 † | | $ 4.38 | | $ 5.65 |
| Ending value (after expenses) | | $1,020.87 | | $1,019.61 |
† Expenses are equal to the portfolio’s annualized expense ratio of .86% for Initial shares and 1.11% for Service shares, multiplied by the average account value over the period, multiplied by 184/365 (to reflect the one-half year period).
| | STATEMENT OF INVESTMENTS
December 31, 2006
|
| Common Stocks—99.7% | | Shares | | Value ($) |
| |
| |
|
| Commercial & Professional Services—9.9% | | |
| Agilysys | | 201,400 | | 3,371,436 |
| Anixter International | | 100,900 a | | 5,478,870 |
| Brightpoint | | 262,080 a,b | | 3,524,976 |
| Cenveo | | 271,300 a | | 5,751,560 |
| COMSYS IT Partners | | 171,300 a | | 3,461,973 |
| Consolidated Graphics | | 30,800 a | | 1,819,356 |
| CRA International | | 29,200 a,b | | 1,530,080 |
| Forrester Research | | 31,500 a | | 853,965 |
| IKON Office Solutions | | 363,300 b | | 5,947,221 |
| John H. Harland | | 90,000 | | 4,518,000 |
| Kforce | | 205,600 a,b | | 2,502,152 |
| LECG | | 48,800 a | | 901,824 |
| MPS Group | | 220,500 a,b | | 3,126,690 |
| Portfolio Recovery Associates | | 102,100 a,b | | 4,767,049 |
| Ritchie Brothers Auctioneers | | 44,200 | | 2,366,468 |
| Rush Enterprises, Cl. A | | 113,200 a | | 1,915,344 |
| ScanSource | | 53,100 a | | 1,614,240 |
| Spherion | | 450,700 a | | 3,348,701 |
| Stamps.com | | 129,500 a | | 2,039,625 |
| Viad | | 149,200 | | 6,057,520 |
| | | | | 64,897,050 |
| Communications—1.6% | | | | |
| Centennial Communications | | 171,100 | | 1,230,209 |
| Commonwealth Telephone Enterprises | | 90,600 | | 3,792,516 |
| CT Communications | | 232,000 b | | 5,317,440 |
| | | | | 10,340,165 |
| Consumer Durables—.9% | | | | |
| Avatar Holdings | | 19,200 a,b | | 1,552,320 |
| Charles & Colvard | | 77,825 b | | 622,600 |
| Ethan Allen Interiors | | 60,000 b | | 2,166,600 |
| WMS Industries | | 45,100 a | | 1,572,186 |
| | | | | 5,913,706 |
| Consumer Non-Durables—2.9% | | | | |
| Imperial Sugar | | 215,300 | | 5,212,413 |
| K-Swiss, Cl. A | | 30,700 | | 943,718 |
| Kellwood | | 124,000 b | | 4,032,480 |
The Portfolio 9
STATEMENT OF INVESTMENTS (continued)
|
| Common Stocks (continued) | | Shares | | Value ($) |
| |
| |
|
| Consumer Non-Durables (continued) | | | | |
| Mannatech | | 198,400 b | | 2,922,432 |
| NBTY | | 35,800 a | | 1,488,206 |
| USANA Health Sciences | | 83,100 a,b | | 4,292,946 |
| | | | | 18,892,195 |
| Consumer Services—4.8% | | | | |
| Corinthian Colleges | | 130,600 a | | 1,780,078 |
| Great Wolf Resorts | | 75,300 a | | 1,051,188 |
| Jack in the Box | | 118,000 a | | 7,202,720 |
| Jackson Hewitt Tax Service | | 39,300 | | 1,335,021 |
| Lakes Entertainment | | 59,500 a,b | | 642,005 |
| Pinnacle Entertainment | | 189,800 a | | 6,289,972 |
| Priceline.com | | 65,700 a,b | | 2,865,177 |
| Ruby Tuesday | | 35,500 | | 974,120 |
| Sinclair Broadcast Group, Cl. A | | 362,200 | | 3,803,100 |
| Vail Resorts | | 73,000 a,b | | 3,271,860 |
| World Wrestling Entertainment | | 146,700 | | 2,391,210 |
| | | | | 31,606,451 |
| Electronic Technology—11.2% | | | | |
| Advanced Energy Industries | | 100,600 a,b | | 1,898,322 |
| Aeroflex | | 382,300 a | | 4,480,556 |
| American Science & Engineering | | 50,300 a,b | | 2,993,353 |
| Arris Group | | 264,200 a | | 3,305,142 |
| Broadwing | | 191,700 a,b | | 2,994,354 |
| Ceradyne | | 58,800 a,b | | 3,322,200 |
| Coherent | | 113,300 a | | 3,576,881 |
| Exar | | 301,766 a | | 3,922,958 |
| InterDigital Communications | | 190,400 a,b | | 6,387,920 |
| Intevac | | 191,600 a,b | | 4,972,020 |
| Methode Electronics | | 66,500 | | 720,195 |
| MIPS Technologies | | 231,000 a | | 1,917,300 |
| Newport | | 125,000 a | | 2,618,750 |
| OmniVision Technologies | | 276,900 a,b | | 3,779,685 |
| Orbital Sciences | | 232,700 a | | 4,290,988 |
| Power Integrations | | 135,600 a | | 3,179,820 |
| Common Stocks (continued) | | Shares | | | | Value ($) |
| |
| |
| |
|
| Electronic Technology (continued) | | | | | | |
| Semtech | | 88,100a | | | | 1,151,467 |
| Silicon Image | | 493,100a | | | | 6,272,232 |
| SpectraLink | | 172,300a | | | | 1,481,780 |
| Trident Microsystems | | 215,000a | | | | 3,908,700 |
| Triumph Group | | 84,400b | | | | 4,425,092 |
| Vicor | | 131,000 | | | | 1,455,410 |
| | | | | | | 73,055,125 |
| Energy Minerals—1.0% | | | | | | |
| EXCO Resources | | 67,800a | | | | 1,146,498 |
| Harvest Natural Resources | | 397,800a,b | | | | 4,228,614 |
| PetroHawk Energy | | 75,700a | | | | 870,550 |
| | | | | | | 6,245,662 |
| Finance—23.0% | | | | | | |
| 21st Century Insurance Group | | 44,200 | | | | 780,130 |
| Arbor Realty Trust | | 130,400 | | | | 3,923,736 |
| Argonaut Group | | 46,800a | | | | 1,631,448 |
| BankUnited Financial, Cl. A | | 193,900b | | | | 5,421,444 |
| Boston Private Financial Holdings | | 194,300b | | | | 5,481,203 |
| Citizens Banking | | 136,500b | | | | 3,617,250 |
| Commerce Group | | 113,500b | | | | 3,376,625 |
| Corus Bankshares | | 264,000b | | | | 6,090,480 |
| Deerfield Triarc Capital | | 178,200b | | | | 3,016,926 |
| Equity Inns | | 248,300b | | | | 3,962,868 |
| Equity One | | 70,600b | | | | 1,882,196 |
| Extra Space Storage | | 100,400 | | | | 1,833,304 |
| FelCor Lodging Trust | | 259,100 | | | | 5,658,744 |
| First BanCorp/Puerto Rico | | 80,900 | | | | 770,977 |
| First Community Bancorp/CA | | 37,700b | | | | 1,970,579 |
| First Midwest Bancorp/IL | | 122,900b | | | | 4,753,772 |
| First Niagara Financial Group | | 259,900 | | | | 3,862,114 |
| First Republic Bank/San Francisco, CA | | 40,800 | | | | 1,594,464 |
| FirstFed Financial | | 109,900a,b | | | | 7,360,003 |
| Fremont General | | 346,400b | | | | 5,615,144 |
| Getty Realty | | 86,100 | | | | 2,660,490 |
| | STATEMENT OF INVESTMENTS (continued)
|
| Common Stocks (continued) | | Shares | | Value ($) |
| |
| |
|
| Finance (continued) | | | | |
| Heritage Commerce | | 19,000 | | 506,160 |
| Highland Hospitality | | 172,000 | | 2,451,000 |
| HomeBanc/Atlanta, GA | | 236,800 b | | 1,001,664 |
| Inland Real Estate | | 234,000 b | | 4,380,480 |
| Innkeepers USA Trust | | 298,000 | | 4,619,000 |
| Knight Capital Group, Cl. A | | 404,600 a | | 7,756,182 |
| LaSalle Hotel Properties | | 109,600 | | 5,025,160 |
| MAF Bancorp | | 88,800 | | 3,968,472 |
| National Health Investors | | 45,300 | | 1,494,900 |
| National Retail Properties | | 161,000 b | | 3,694,950 |
| Ocwen Financial | | 336,900 a,b | | 5,343,234 |
| Ohio Casualty | | 155,200 b | | 4,626,512 |
| Omega Healthcare Investors | | 282,200 b | | 5,000,584 |
| Pacific Capital Bancorp | | 129,800 b | | 4,358,684 |
| PICO Holdings | | 20,800 a | | 723,216 |
| Ramco-Gershenson Properties | | 65,500 | | 2,498,170 |
| Republic Bancorp/MI | | 168,700 | | 2,270,702 |
| Spirit Finance | | 240,800 b | | 3,002,776 |
| Sunterra | | 47,500 a | | 572,375 |
| Trustco Bank NY | | 99,400 b | | 1,105,328 |
| UCBH Holdings | | 96,300 | | 1,691,028 |
| W Holding | | 261,600 | | 1,559,136 |
| Western Alliance Bancorp | | 65,800 a,b | | 2,287,866 |
| Wilshire Bancorp | | 44,600 b | | 846,062 |
| Wintrust Financial | | 69,900 | | 3,356,598 |
| Zenith National Insurance | | 29,400 | | 1,379,154 |
| | | | | 150,783,290 |
| Health Care Technology—8.0% | | | | |
| Alpharma, Cl. A | | 103,700 | | 2,499,170 |
| Aspect Medical Systems | | 196,400 a,b | | 3,694,284 |
| AtheroGenics | | 118,300 a,b | | 1,172,353 |
| Auxilium Pharmaceuticals | | 164,400 a,b | | 2,415,036 |
| BioMarin Pharmaceutical | | 153,700 a | | 2,519,143 |
| Diversa | | 77,500 a,b | | 843,200 |
| Exelixis | | 199,600 a,b | | 1,796,400 |
| Geron | | 394,300 a,b | | 3,461,954 |
12
| Common Stocks (continued) | | Shares | | Value ($) |
| |
| |
|
| Health Care Technology (continued) | | | | |
| Immucor | | 202,500 a | | 5,919,075 |
| IntraLase | | 253,700 a,b | | 5,677,806 |
| Lifecell | | 25,300 a | | 610,742 |
| Medicines | | 85,600 a | | 2,715,232 |
| Molecular Devices | | 53,500 a,b | | 1,127,245 |
| NeuroMetrix | | 48,300 a,b | | 720,153 |
| Palomar Medical Technologies | | 113,800 a,b | | 5,766,246 |
| Progenics Pharmaceuticals | | 104,900 a,b | | 2,700,126 |
| Sciele Pharma | | 231,400 a | | 5,553,600 |
| Telik | | 83,200 a,b | | 368,576 |
| United Therapeutics | | 52,200 a,b | | 2,838,114 |
| | | | | 52,398,455 |
| Industrial Services—2.6% | | | | |
| Grey Wolf | | 637,500 a,b | | 4,373,250 |
| Hornbeck Offshore Services | | 79,000 a,b | | 2,820,300 |
| Trico Marine Services | | 141,700 a,b | | 5,428,527 |
| W-H Energy Services | | 95,400 a | | 4,645,026 |
| | | | | 17,267,103 |
| Non-Energy Minerals—3.3% | | | | |
| Chaparral Steel | | 98,100 | | 4,342,887 |
| Metal Management | | 138,900 b | | 5,257,365 |
| Olin | | 354,100 | | 5,849,732 |
| Steel Dynamics | | 198,600 b | | 6,444,570 |
| | | | | 21,894,554 |
| Process Industries—5.7% | | | | |
| AEP Industries | | 48,400 a | | 2,580,204 |
| Delta & Pine Land | | 105,800 | | 4,279,610 |
| GrafTech International | | 729,100 a,b | | 5,045,372 |
| Headwaters | | 233,100 a,b | | 5,585,076 |
| Myers Industries | | 163,400 | | 2,558,844 |
| Pioneer Cos. | | 96,900 a | | 2,777,154 |
| PW Eagle | | 125,600 b | | 4,333,200 |
| Rogers | | 46,500 a | | 2,750,475 |
| Sensient Technologies | | 96,500 | | 2,373,900 |
| Spartech | | 188,400 | | 4,939,848 |
| | | | | 37,223,683 |
The Portfolio 13
STATEMENT OF INVESTMENTS (continued)
|
| Common Stocks (continued) | | Shares | | | | Value ($) |
| |
| |
| |
|
| Producer Manufacturing—5.7% | | | | | | |
| Actuant, Cl. A | | 111,900b | | | | 5,332,035 |
| American Woodmark | | 137,400b | | | | 5,750,190 |
| Dynamic Materials | | 102,100b | | | | 2,869,010 |
| Encore Wire | | 161,300b | | | | 3,550,213 |
| FreightCar America | | 44,200b | | | | 2,450,890 |
| Gardner Denver | | 30,800a | | | | 1,149,148 |
| Herman Miller | | 167,200b | | | | 6,079,392 |
| Regal-Beloit | | 33,900 | | | | 1,780,089 |
| Simpson Manufacturing | | 147,200b | | | | 4,658,880 |
| Wabtec | | 123,500 | | | | 3,751,930 |
| | | | | | | 37,371,777 |
| Retail Trade—6.0% | | | | | | |
| Aeropostale | | 81,600a | | | | 2,518,992 |
| Charlotte Russe Holding | | 174,800a,b | | | | 5,375,100 |
| Conn’s | | 107,000a,b | | | | 2,489,890 |
| Finish Line, Cl. A | | 293,400b | | | | 4,189,752 |
| Great Atlantic & Pacific Tea | | 36,100b | | | | 929,214 |
| Group 1 Automotive | | 95,700b | | | | 4,949,604 |
| Gymboree | | 127,100a,b | | | | 4,850,136 |
| Hibbett Sporting Goods | | 23,550a | | | | 718,982 |
| Insight Enterprises | | 234,100a | | | | 4,417,467 |
| Men’s Wearhouse | | 66,500b | | | | 2,544,290 |
| Sonic Automotive, Cl. A | | 91,100 | | | | 2,645,544 |
| Systemax | | 113,500a,b | | | | 1,980,575 |
| Wild Oats Markets | | 121,900a,b | | | | 1,752,922 |
| | | | | | | 39,362,468 |
| Technology Services—9.4% | | | | | | |
| Albany Molecular Research | | 196,900a | | | | 2,079,264 |
| AMERIGROUP | | 19,200a | | | | 689,088 |
| Ansoft | | 84,800a,b | | | | 2,357,440 |
| Apria Healthcare Group | | 132,400a,b | | | | 3,528,460 |
| CSG Systems International | | 129,000a | | | | 3,448,170 |
| eCollege.com | | 169,200a | | | | 2,647,980 |
| Internap Network Services | | 147,000a,b | | | | 2,920,890 |
| LHC Group | | 65,600a | | | | 1,870,256 |
| Common Stocks (continued) | | Shares | | Value ($) |
| |
| |
|
| Technology Services (continued) | | | | |
| Magellan Health Services | | 116,200 a | | 5,022,164 |
| Molina Healthcare | | 64,100 a | | 2,083,891 |
| Open Solutions | | 87,100 a,b | | 3,278,444 |
| Quest Software | | 206,700 a,b | | 3,028,155 |
| RealNetworks | | 538,000 a | | 5,885,720 |
| SPSS | | 162,300 a | | 4,880,361 |
| Sykes Enterprises | | 332,300 a | | 5,861,772 |
| Tyler Technologies | | 355,400 a | | 4,996,924 |
| United Online | | 142,600 | | 1,893,728 |
| Vignette | | 291,400 a | | 4,974,198 |
| | | | | 61,446,905 |
| Transportation—1.3% | | | | |
| Genesee & Wyoming, Cl. A | | 115,400 a,b | | 3,028,096 |
| Mesa Air Group | | 227,100 a,b | | 1,946,247 |
| Saia | | 158,400 a | | 3,676,464 |
| | | | | 8,650,807 |
| Utilities—2.4% | | | | |
| CH Energy Group | | 42,200 b | | 2,228,160 |
| IDACORP | | 76,200 | | 2,945,130 |
| Laclede Group | | 57,000 | | 1,996,710 |
| MGE Energy | | 18,200 | | 665,756 |
| New Jersey Resources | | 61,500 b | | 2,987,670 |
| UniSource Energy | | 32,200 | | 1,176,266 |
| Vectren | | 34,300 | | 970,004 |
| Westar Energy | | 112,600 | | 2,923,096 |
| | | | | 15,892,792 |
| Total Common Stocks | | | | |
| (cost $616,705,716) | | | | 653,242,188 |
| |
| |
|
| |
| Other Investment—.4% | | | | |
| |
| |
|
| Registered Investment Company; | | | | |
| Dreyfus Institutional Preferred | | | | |
| Plus Money Market Fund | | | | |
| (cost $2,360,000) | | 2,360,000 c | | 2,360,000 |
STATEMENT OF INVESTMENTS (continued)
|
| Investment of Cash Collateral | | | | |
| for Securities Loaned—20.7% | | Shares | | Value ($) |
| |
| |
|
| Registered Investment Company; | | | | | | |
| Dreyfus Institutional Cash | | | | | | |
| Advantage Fund | | | | | | |
| (cost $135,749,154) | | | | 135,749,154 c | | 135,749,154 |
| |
| |
| |
|
| |
| Total Investments (cost $754,814,870) | | 120.8% | | 791,351,342 |
| |
| Liabilities, Less Cash and Receivables | | (20.8%) | | (136,225,094) |
| |
| Net Assets | | | | 100.0% | | 655,126,248 |
| |
| a | | Non-income producing security. | | | | | | |
| b | | All or a portion of these securities are on loan. At December 31, 2006, the total market value of the portfolio’s |
| | | securities on loan is $130,607,400 and the total market value of the collateral held by the portfolio is |
| | | $137,160,574, consisting of cash collateral of $135,749,154 and U.S. Government and agency securities valued |
| | | at $1,411,420. | | | | | | |
| c | | Investment in affiliated money market mutual fund. | | | | |
| |
| |
| |
|
| |
| |
| |
| |
| Portfolio Summary (Unaudited) † | | | | |
| |
| | | | | Value (%) | | | | Value (%) |
| |
| |
| |
| |
|
| Finance | | 23.0 | | Retail Trade | | 6.0 |
| Money Market Investments | | 21.1 | | Producer Manufacturing | | 5.7 |
| Electronic Technology | | 11.2 | | Process Industries | | 5.7 |
| Commercial & Professional Services | | 9.9 | | Consumer Services | | 4.8 |
| Technology Services | | 9.4 | | Other | | 16.0 |
| Health Care Technology | | 8.0 | | | | 120.8 |
| |
| † | | Based on net assets. | | | | | | |
| See notes to financial statements. | | | | | | |
STATEMENT OF ASSETS AND LIABILITIES
December 31, 2006
|
| | | Cost | | Value |
| |
| |
|
| Assets ($): | | | | |
| Investments in securities—See Statement of | | |
| Investments (including securities on loan, | | |
| valued at $130,607,400)—Note 1(c): | | |
| Unaffiliated issuers | | 616,705,716 | | 653,242,188 |
| Affiliated issuers | | 138,109,154 | | 138,109,154 |
| Cash | | | | 4,105,419 |
| Dividends and interest receivable | | | | 1,632,713 |
| Prepaid expenses | | | | 20,399 |
| | | | | 797,109,873 |
| |
| |
|
| Liabilities ($): | | | | |
| Due to The Dreyfus Corporation and affiliates—Note 3(b) | | 426,094 |
| Liability for securities on loan—Note 1(c) | | 135,749,154 |
| Payable for investment securities purchased | | 5,140,391 |
| Payable for shares of Beneficial Interest redeemed | | 550,286 |
| Interest payable—Note 2 | | | | 1,791 |
| Accrued expenses | | | | 115,909 |
| | | | | 141,983,625 |
| |
| |
|
| Net Assets ($) | | | | 655,126,248 |
| |
| |
|
| Composition of Net Assets ($): | | | | |
| Paid-in capital | | | | 536,291,811 |
| Accumulated undistributed investment income—net | | 5,173,339 |
| Accumulated net realized gain (loss) on investments | | 77,124,626 |
| Accumulated net unrealized appreciation | | |
| (depreciation) on investments | | | | 36,536,472 |
| |
| |
|
| Net Assets ($) | | | | 655,126,248 |
| |
| |
|
| |
| |
| Net Asset Value Per Share | | | | |
| | | Initial Shares | | Service Shares |
| |
| |
|
| Net Assets ($) | | 633,458,955 | | 21,667,293 |
| Shares Outstanding | | 15,071,915 | | 521,403 |
| |
| |
|
| Net Asset Value Per Share ($) | | 42.03 | | 41.56 |
See notes to financial statements.
|
STATEMENT OF OPERATIONS
Year Ended December 31, 2006
|
| Investment Income ($): | | |
| Income: | | |
| Cash dividends (net of $19,218 foreign taxes withheld at source): | | |
| Unaffiliated issuers | | 9,899,120 |
| Affiliated issuers | | 154,355 |
| Income from securities lending | | 1,213,484 |
| Total Income | | 11,266,959 |
| Expenses: | | |
| Investment advisory fee—Note 3(a) | | 5,349,953 |
| Prospectus and shareholders’ reports | | 305,183 |
| Trustees’ fees and expenses—Note 3(c) | | 79,881 |
| Custodian fees—Note 3(b) | | 62,711 |
| Professional fees | | 56,765 |
| Distribution fees—Note 3(b) | | 51,823 |
| Interest expense—Note 2 | | 10,391 |
| Loan commitment fees—Note 2 | | 6,134 |
| Miscellaneous | | 22,462 |
| Total Expenses | | 5,945,303 |
| Less—reduction in custody fees | | |
| due to earnings credits—Note 1(c) | | (4,064) |
| Net Expenses | | 5,941,239 |
| Investment Income—Net | | 5,325,720 |
| |
|
| Realized and Unrealized Gain (Loss) on Investments—Note 4 ($): |
| Net realized gain (loss) on investments | | 76,395,773 |
| Net unrealized appreciation (depreciation) on investments | | (57,945,192) |
| Net Realized and Unrealized Gain (Loss) on Investments | | 18,450,581 |
| Net Increase in Net Assets Resulting from Operations | | 23,776,301 |
See notes to financial statements.
|
STATEMENT OF CHANGES IN NET ASSETS
| | | Year Ended December 31, |
| |
|
| | | 2006 | | 2005 |
| |
| |
|
| Operations ($): | | | | |
| Investment income—net | | 5,325,720 | | 3,227,022 |
| Net realized gain (loss) on investments | | 76,395,773 | | 118,134,175 |
| Net unrealized appreciation | | | | |
| (depreciation) on investments | | (57,945,192) | | (79,064,153) |
| Net Increase (Decrease) in Net Assets | | | | |
| Resulting from Operations | | 23,776,301 | | 42,297,044 |
| |
| |
|
| Dividends to Shareholders from ($): | | | | |
| Investment income—net: | | | | |
| Initial shares | | (2,859,929) | | — |
| Service shares | | (36,703) | | — |
| Net realized gain on investments: | | | | |
| Initial shares | | (59,143,340) | | — |
| Service shares | | (1,897,570) | | — |
| Total Dividends | | (63,937,542) | | — |
| |
| |
|
| Beneficial Interest Transactions ($): | | | | |
| Net proceeds from shares sold: | | | | |
| Initial shares | | 28,698,627 | | 33,642,117 |
| Service shares | | 3,755,306 | | 2,846,538 |
| Dividends reinvested: | | | | |
| Initial shares | | 62,003,269 | | — |
| Service shares | | 1,934,273 | | — |
| Cost of shares redeemed: | | | | |
| Initial shares | | (162,998,146) | | (119,050,790) |
| Service shares | | (5,485,460) | | (3,359,312) |
| Increase (Decrease) in Net Assets from | | | | |
| Beneficial Interest Transactions | | (72,092,131) | | (85,921,447) |
| Total Increase (Decrease) in Net Assets | | (112,253,372) | | (43,624,403) |
| |
| |
|
| Net Assets ($): | | | | |
| Beginning of Period | | 767,379,620 | | 811,004,023 |
| End of Period | | 655,126,248 | | 767,379,620 |
| Undistributed investment income—net | | 5,173,339 | | 3,606,472 |
STATEMENT OF CHANGES IN NET ASSETS (continued)
|
| | | Year Ended December 31, |
| |
|
| | | 2006 | | 2005 |
| |
| |
|
| Capital Share Transactions: | | | | |
| Initial Shares | | | | |
| Shares sold | | 684,422 | | 820,825 |
| Shares issued for dividends reinvested | | 1,394,899 | | — |
| Shares redeemed | | (3,947,455) | | (2,869,844) |
| Net Increase (Decrease) in Shares Outstanding | | (1,868,134) | | (2,049,019) |
| |
| |
|
| Service Shares | | | | |
| Shares sold | | 89,868 | | 69,052 |
| Shares issued for dividends reinvested | | 43,931 | | — |
| Shares redeemed | | (135,519) | | (81,086) |
| Net Increase (Decrease) in Shares Outstanding | | (1,720) | | (12,034) |
See notes to financial statements.
|
FINANCIAL HIGHLIGHTS
The following tables describe the performance for each share class for the fiscal periods indicated.All information (except portfolio turnover rate) reflects financial results for a single portfolio share. Total return shows how much your investment in the portfolio would have increased (or decreased) during each period, assuming you had reinvested all dividends and distributions.These figures have been derived from the portfolio’s financial statements.
| | | | | Year Ended December 31, | | |
| |
| |
| |
|
| Initial Shares | | 2006 | | 2005 | | 2004 | | 2003 | | 2002 |
| |
| |
| |
| |
| |
|
| Per Share Data ($): | | | | | | | | | | |
| Net asset value, beginning of period | | 43.96 | | 41.55 | | 37.39 | | 28.40 | | 35.13 |
| Investment Operations: | | | | | | | | | | |
| Investment income—net a | | .31 | | .18 | | .08 | | .01 | | .01 |
| Net realized and unrealized | | | | | | | | | | |
| gain (loss) on investments | | 1.56 | | 2.23 | | 4.16 | | 8.99 | | (6.73) |
| Total from Investment Operations | | 1.87 | | 2.41 | | 4.24 | | 9.00 | | (6.72) |
| Distributions: | | | | | | | | | | |
| Dividends from investment income—net | | (.18) | | — | | (.08) | | (.01) | | (.01) |
| Dividends from net realized | | | | | | | | | | |
| gain on investments | | (3.62) | | — | | — | | — | | — |
| Total Distributions | | (3.80) | | — | | (.08) | | (.01) | | (.01) |
| Net asset value, end of period | | 42.03 | | 43.96 | | 41.55 | | 37.39 | | 28.40 |
| |
| |
| |
| |
| |
|
| Total Return (%) | | 3.77 | | 5.80 | | 11.34 | | 31.69 | | (19.12) |
| |
| |
| |
| |
| |
|
| Ratios/Supplemental Data (%): | | | | | | | | | | |
| Ratio of total expenses | | | | | | | | | | |
| to average net assets | | .82 | | .81 | | .79 | | .82 | | .81 |
| Ratio of net expenses | | | | | | | | | | |
| to average net assets | | .82 | | .81 | | .79 | | .82 | | .81 |
| Ratio of net investment income | | | | | | | | | | |
| to average net assets | | .75 | | .43 | | .20 | | .03 | | .02 |
| Portfolio Turnover Rate | | 97.52 | | 67.11 | | 56.06 | | 69.34 | | 52.41 |
| |
| |
| |
| |
| |
|
| Net Assets, end of period ($ x 1,000) | | 633,459 | | 744,621 | | 788,943 | | 744,866 | | 577,468 |
| | a Based on average shares outstanding at each month end.
See notes to financial statements.
|
FINANCIAL HIGHLIGHTS (continued)
|
| | | | | Year Ended December 31, | | |
| |
| |
| |
|
| Service Shares | | 2006 | | 2005 | | 2004 | | 2003 | | 2002 |
| |
| |
| |
| |
| |
|
| Per Share Data ($): | | | | | | | | | | |
| Net asset value, beginning of period | | 43.51 | | 41.22 | | 37.12 | | 28.26 | | 35.02 |
| Investment Operations: | | | | | | | | | | |
| Investment income (loss)—net a | | .21 | | .07 | | (.02) | | (.07) | | (.03) |
| Net realized and unrealized | | | | | | | | | | |
| gain (loss) on investments | | 1.53 | | 2.22 | | 4.12 | | 8.93 | | (6.72) |
| Total from Investment Operations | | 1.74 | | 2.29 | | 4.10 | | 8.86 | | (6.75) |
| Distributions: | | | | | | | | | | |
| Dividends from investment income—net | | (.07) | | — | | — | | — | | (.01) |
| Dividends from net realized | | | | | | | | | | |
| gain on investments | | (3.62) | | — | | — | | — | | — |
| Total Distributions | | (3.69) | | — | | — | | — | | (.01) |
| Net asset value, end of period | | 41.56 | | 43.51 | | 41.22 | | 37.12 | | 28.26 |
| |
| |
| |
| |
| |
|
| Total Return (%) | | 3.52 | | 5.56 | | 11.05 | | 31.35 | | (19.31) |
| |
| |
| |
| |
| |
|
| Ratios/Supplemental Data (%): | | | | | | | | | | |
| Ratio of total expenses | | | | | | | | | | |
| to average net assets | | 1.08 | | 1.06 | | 1.04 | | 1.07 | | 1.05 |
| Ratio of net expenses | | | | | | | | | | |
| to average net assets | | 1.08 | | 1.06 | | 1.04 | | 1.07 | | 1.05 |
| Ratio of net investment income | | | | | | | | | | |
| (loss) to average net assets | | .51 | | .18 | | (.04) | | (.22) | | (.11) |
| Portfolio Turnover Rate | | 97.52 | | 67.11 | | 56.06 | | 69.34 | | 52.41 |
| |
| |
| |
| |
| |
|
| Net Assets, end of period ($ x 1,000) | | 21,667 | | 22,759 | | 22,061 | | 17,523 | | 10,896 |
| |
| a Based on average shares outstanding at each month end. | | | | | | | | |
| See notes to financial statements. | | | | | | | | | | |
NOTES TO FINANCIAL STATEMENTS
NOTE 1—Significant Accounting Policies:
Dreyfus Variable Investment Fund (the “fund”) is registered under the Investment Company Act of 1940, as amended (the “Act”), as an open-end management investment company, operating as a series company currently offering twelve series, including the Developing Leaders Portfolio (the “portfolio”). The portfolio is only offered to separate accounts established by insurance companies to fund variable annuity contracts and variable life insurance policies.The portfolio is a diversified series. The portfolio’s investment objective is capital growth.The Dreyfus Corporation (the “Manager” or “Dreyfus”) serves as the portfolio’s investment adviser.The Manager is a wholly-owned subsidiary of Mellon Financial Corporation (“Mellon Financial”).
On December 4, 2006, Mellon Financial and The Bank of New York Company, Inc. announced that they had entered into a definitive agreement to merge. The new company will be called The Bank of New York Mellon Corporation. As part of this transaction, Dreyfus would become a wholly-owned subsidiary of The Bank of New York Mellon Corporation.The transaction is subject to certain regulatory approvals and the approval of The Bank of New York Company, Inc.’s and Mellon Financial’s shareholders, as well as other customary conditions to closing. Subject to such approvals and the satisfaction of the other conditions, Mellon Financial and The Bank of New York Company, Inc. expect the transaction to be completed in the third quarter of 2007.
Dreyfus Service Corporation (the “Distributor”), a wholly-owned subsidiary of the Manager, is the distributor of the portfolio’s shares, which are sold without a sales charge.The portfolio is authorized to issue an unlimited number of $.001 par value shares of Beneficial Interest in the following classes of shares: Initial and Service. Each class of shares has identical rights and privileges, except with respect to the distribution plan and the expenses borne by each class and certain voting rights. Income, expenses (other than expenses attributable to a specific class), and realized and unrealized gains or losses on investments are allocated to each class of shares based on its relative net assets.
NOTES TO FINANCIAL STATEMENTS (continued)
|
The fund accounts separately for the assets, liabilities and operations of each series. Expenses directly attributable to each series are charged to that series’ operations; expenses which are applicable to all series are allocated among them on a pro rata basis.
The portfolio’s financial statements are prepared in accordance with U.S. generally accepted accounting principles, which may require the use of management estimates and assumptions.Actual results could differ from those estimates.
The fund enters into contracts that contain a variety of indemnifica-tions.The portfolio’s maximum exposure under these arrangements is unknown. The portfolio does not anticipate recognizing any loss related to these arrangements.
(a) Portfolio valuation: Investments in securities are valued at the last sales price on the securities exchange or national securities market on which such securities are primarily traded. Securities listed on the National Market System for which market quotations are available are valued at the official closing price or, if there is no official closing price that day, at the last sale price. Securities not listed on an exchange or the national securities market, or securities for which there were no transactions, are valued at the average of the most recent bid and asked prices, except for open short positions, where the asked price is used for valuation purposes. Bid price is used when no asked price is available. Registered open-end investment companies that are not traded on an exchange are valued at their net asset value.When market quotations or official closing prices are not readily available, or are determined not to reflect accurately fair value, such as when the value of a security has been significantly affected by events after the close of the exchange or market on which the security is principally traded (for example, a foreign exchange or market), but before the portfolio calculates its net asset value, the portfolio may value these investments at fair value as determined in accordance with the procedures approved by the Board of Trustees. Fair valuing of securities may be determined with the assistance of a pricing service using calculations based on indices of domestic securities and other appropriate indicators, such as prices of relevant
ADR’s and futures contracts. For other securities that are fair valued by the Board of Trustees, certain factors may be considered such as: fundamental analytical data, the nature and duration of restrictions on disposition, an evaluation of the forces that influence the market in which the securities are purchased and sold, and public trading in similar securities of the issuer or comparable issuers. Financial futures are valued at the last sales price. Investments denominated in foreign currencies are translated to U.S. dollars at the prevailing rates of exchange. Forward currency exchange contracts are valued at the forward rate.
On September 20, 2006, the Financial Accounting Standards Board (FASB) released Statement of Financial Accounting Standards No. 157 “Fair Value Measurements” (“FAS 157”). FAS 157 establishes an authoritative definition of fair value, sets out a framework for measuring fair value, and requires additional disclosures about fair-value measurements. The application of FAS 157 is required for fiscal years beginning after November 15, 2007 and interim periods within those fiscal years. Management does not believe that the application of this standard will have a material impact on the financial statements of the portfolio.
(b) Foreign currency transactions: The portfolio does not isolate that portion of the results of operations resulting from changes in foreign exchange rates on investments from the fluctuations arising from changes in market prices of securities held. Such fluctuations are included with the net realized and unrealized gain or loss on investments.
Net realized foreign exchange gains or losses arise from sales and maturities of short-term securities, sales of foreign currencies, currency gains or losses realized on securities transactions and the difference between the amounts of dividends, interest and foreign withholding taxes recorded on the portfolio’s books and the U.S. dollar equivalent of the amounts actually received or paid. Net unrealized foreign exchange gains or losses arise from changes in the value of assets and liabilities other than investments in securities resulting from changes in exchange rates. Such gains and losses are included with net realized and unrealized gain or loss on investments.
NOTES TO FINANCIAL STATEMENTS (continued)
|
(c) Securities transactions and investment income: Securities transactions are recorded on a trade date basis. Realized gain and loss from securities transactions are recorded on the identified cost basis. Dividend income is recognized on the ex-dividend date and interest income, including, where applicable, accretion of discount and amortization of premium on investments, is recognized on the accrual basis.
The portfolio has an arrangement with the custodian bank whereby the portfolio receives earnings credits from the custodian when positive cash balances are maintained, which are used to offset custody fees. For financial reporting purposes, the portfolio includes net earnings credits as an expense offset in the Statement of Operations.
Pursuant to a securities lending agreement with Mellon Bank, N.A., an affiliate of the Manager, the portfolio may lend securities to qualified institutions. It is the portfolio’s policy, that at origination, all loans are secured by collateral of at least 102% of the value of U.S. securities loaned and 105% of the value of foreign securities loaned. Collateral equivalent to at least 100% of the market value of securities on loan is maintained at all times. Cash collateral is invested in certain money market mutual funds managed by the Manager.The portfolio is entitled to receive all income on securities loaned, in addition to income earned as a result of the lending transaction. Although each security loaned is fully collateralized, the portfolio bears the risk of delay in recovery of, or loss of rights in, the securities loaned should a borrower fail to return the securities in a timely manner.
(d) Affiliated issuers: Investments in other investment companies advised by the Manager are defined as “affiliated” in the Act.
(e) Dividends to shareholders: Dividends are recorded on the ex-dividend date. Dividends from investment income-net and dividends from net realized capital gain, if any, are normally declared and paid annually, but the portfolio may make distributions on a more frequent basis to comply with the distribution requirements of the Internal Revenue Code of 1986, as amended (the “Code”).To the extent that net realized capital gain can be offset by capital loss carryovers, if any,
it is the policy of the portfolio not to distribute such gain. Income and capital gain distributions are determined in accordance with income tax regulations, which may differ from U.S. generally accepted accounting principles.
(f) Federal income taxes: It is the policy of the portfolio to continue to qualify as a regulated investment company, if such qualification is in the best interests of its shareholders, by complying with the applicable provisions of the Code, and to make distributions of taxable income sufficient to relieve it from substantially all federal income and excise taxes.
On July 13, 2006, the FASB released FASB Interpretation No. 48, “Accounting for Uncertainty in Income Taxes” (FIN 48). FIN 48 provides guidance for how uncertain tax positions should be recognized, measured, presented and disclosed in the financial statements. FIN 48 requires the evaluation of tax positions taken or expected to be taken in the course of preparing the portfolio’s tax returns to determine whether the tax positions are “more-likely-than-not” of being sustained by the applicable tax authority. Tax positions not deemed to meet the more-likely-than-not threshold would be recorded as a tax benefit or expense in the current year.Adoption of FIN 48 is required for fiscal years beginning after December 15, 2006 and is to be applied to all open tax years as of the effective date. Management does not believe that the application of this standard will have a material impact on the financial statements of the portfolio.
At December 31, 2006, the components of accumulated earnings on a tax basis were as follows: undistributed ordinary income $4,372,686, undistributed capital gains $77,607,603 and unrealized appreciation $36,854,148.
The tax character of distributions paid to shareholders during the fiscal periods ended December 31, 2006 and December 31, 2005, were as follows: ordinary income $2,896,632 and $0, and long-term capital gains $61,040,910 and $0, respectively.
NOTES TO FINANCIAL STATEMENTS (continued)
|
During the period ended December 31, 2006, as a result of permanent book to tax differences primarily due to the tax treatment for real estate investment trusts, the portfolio decreased accumulated undistributed investment income-net by $862,221 and increased accumulated net realized gain (loss) on investments by the same amount. Net assets were not affected by this reclassification.
NOTE 2—Bank Line of Credit:
The portfolio participates with other Dreyfus-managed funds in a $350 million redemption credit facility (the “Facility”) to be utilized for temporary or emergency purposes, including the financing of redemptions. In connection therewith, the portfolio has agreed to pay commitment fees on its pro rata portion of the Facility. Interest is charged to the portfolio based on prevailing market rates in effect at the time of borrowing.
The average daily amount of borrowings outstanding under the Facility during the period ended December 31, 2006, was $184,400 with a related weighted average annualized interest rate of 5.63% .
NOTE 3—Investment Advisory Fee and Other Transactions With Affiliates:
(a) Pursuant to an Investment Advisory Agreement with the Manager, the investment advisory fee is computed at the annual rate of .75% of the value of the portfolio’s average daily net assets and is payable monthly.
(b) Under the Distribution Plan (the “Plan”) adopted pursuant to Rule 12b-1 under the Act, Service shares pay the Distributor for distributing their shares, for servicing and/or maintaining Service shares shareholder accounts and for advertising and marketing for Service shares.The Plan provides for payments to be made at an annual rate of .25% of the value of the Service shares’ average daily net assets. The Distributor may make payments to Participating Insurance Companies
and to brokers and dealers acting as principal underwriter for their variable insurance products. The fees payable under the Plan are payable without regard to actual expenses incurred. During the period ended December 31, 2006, Service shares were charged $51,823 pursuant to the Plan.
The portfolio compensates Dreyfus Transfer, Inc., a wholly-owned subsidiary of the Manager, under a transfer agency agreement for providing personnel and facilities to perform transfer agency services for the portfolio. During the period ended December 31, 2006, the portfolio was charged $866 pursuant to the transfer agency agreement.
The portfolio compensates Mellon Bank, N.A., an affiliate of the Manager, under a custody agreement for providing custodial services for the portfolio. During the period ended December 31, 2006, the portfolio was charged $62,711 pursuant to the custody agreement.
During the period ended December 31, 2006, the portfolio was charged $4,204 for services performed by the Chief Compliance Officer.
The components of Due to The Dreyfus Corporation and affiliates in the Statement of Assets and Liabilities consist of: investment advisory fees $419,098, Rule 12b-1 distribution plan fees $4,620, custodian fees $189, chief compliance officer fees $2,044 and transfer agency per account fees $143.
(c) Each Board member also serves as a Board member of other funds within the Dreyfus complex. Annual retainer fees and attendance fees are allocated to each fund based on net assets.
(d) Pursuant to an exemptive order from the SEC, the portfolio invests its available cash balances in affiliated money market mutual funds. Management fees of the underlying money market mutual funds have been waived by the Manager.
NOTES TO FINANCIAL STATEMENTS (continued)
|
NOTE 4—Securities Transactions:
The aggregate amount of purchases and sales of investment securities, excluding short-term securities, during the period ended December 31, 2006, amounted to $696,601,045 and $827,499,287, respectively.
At December 31, 2006, the cost of investments for federal income tax purposes was $754,497,194; accordingly, accumulated net unrealized appreciation on investments was $36,854,148, consisting of $76,040,375 gross unrealized appreciation and $39,186,227 gross unrealized depreciation.
REPORT OF INDEPENDENT REGISTERED PUBLIC ACCOUNTING FIRM
Shareholders and Board of Trustees
Dreyfus Variable Investment Fund, Developing Leaders Portfolio
|
We have audited the accompanying statement of assets and liabilities, including the statement of investments, of Dreyfus Variable Investment Fund, Developing Leaders Portfolio (one of the funds comprising Dreyfus Variable Investment Fund) as of December 31, 2006, and the related statement of operations for the year then ended, the statement of changes in net assets for each of the two years in the period then ended, and financial highlights for each of the periods indicated therein.These financial statements and financial highlights are the responsibility of the Fund’s management. Our responsibility is to express an opinion on these financial statements and financial highlights based on our audits.
We conducted our audits in accordance with the standards of the Public Company Accounting Oversight Board (United States).Those standards require that we plan and perform the audit to obtain reasonable assurance about whether the financial statements and financial highlights are free of material misstatement.We were not engaged to perform an audit of the Fund’s internal control over financial reporting. Our audits included consideration of internal control over financial reporting as a basis for designing audit procedures that are appropriate in the circumstances, but not for the purpose of expressing an opinion on the effectiveness of the Fund’s internal control over financial reporting.Accordingly, we express no such opinion. An audit also includes examining, on a test basis, evidence supporting the amounts and disclosures in the financial statements and financial highlights, assessing the accounting principles used and significant estimates made by management, and evaluating the overall financial statement presentation. Our procedures included confirmation of securities owned as of December 31, 2006 by correspondence with the custodian and others or by other appropriate auditing procedures where replies from others were not received.We believe that our audits provide a reasonable basis for our opinion.
In our opinion, the financial statements and financial highlights referred to above present fairly, in all material respects, the financial position of Dreyfus Variable Investment Fund, Developing Leaders Portfolio at December 31, 2006, the results of its operations for the year then ended, the changes in its net assets for each of the two years in the period then ended, and the financial highlights for each of the indicated periods, in conformity with U.S. generally accepted accounting principles.

| | New York, New York
February 6, 2007
|
IMPORTANT TAX INFORMATION (Unaudited)
For federal tax purposes, the portfolio hereby designates $3.6190 per share as a long-term capital gain distribution paid on March 29, 2006 and also the portfolio hereby designates 100% of the ordinary dividends paid during the fiscal year ended December 31, 2006 as qualifying for the corporate dividends received deduction. Shareholders will receive notification in January 2007 of the percentage applicable to the preparation of their 2006 income tax returns.
PROXY RESULTS(Unaudited)
Dreyfus Variable Investment Fund held a special meeting of shareholders on June 29, 2006.The proposal considered at the meeting, and the results, are as follows:
| | | | | Shares | | |
| |
| |
| |
|
| | | Votes For | | | | Authority Withheld |
| |
| |
| |
|
| To elect additional Board Members: | | | | | | |
| Peggy C. Davis † | | 171,078,927 | | | | 7,687,714 |
| Joseph S. DiMartino | | 170,946,484 | | | | 7,820,156 |
| David P. Feldman | | 170,959,921 | | | | 7,806,720 |
| Ehud Houminer † | | 170,132,087 | | | | 8,634,554 |
| Gloria Messinger † | | 170,187,241 | | | | 8,579,400 |
| Anne Wexler † | | 170,212,607 | | | | 8,554,033 |
† Each new Board member’s term commenced on September 26, 2006.
In addition to Joseph S. DiMartino and David P. Feldman, James F. Henry, Dr. Paul A. Marks and Dr. Martin Peretz continue as Board members of the fund.
BOARD MEMBERS INFORMATION (Unaudited)
Joseph S. DiMartino (63)
Chairman of the Board (1995)
|
Principal Occupation During Past 5 Years:
• Corporate Director and Trustee
|
Other Board Memberships and Affiliations:
|
- The Muscular Dystrophy Association, Director
- Century Business Services, Inc., a provider of outsourcing functions for small and medium size companies, Director
- The Newark Group, a provider of a national market of paper recovery facilities, paperboard mills and paperboard converting plants, Director
- Sunair Services Corporation, engaging in the design, manufacture and sale of high frequency systems for long-range voice and data communications, as well as providing certain outdoor-related services to homes and businesses, Director
No. of Portfolios for which Board Member Serves: 190
———————
Peggy C. Davis (63) Board Member (2006)
Principal Occupation During Past 5 Years:
|
- Shad Professor of Law, New York University School of Law (1983-present)
- Writer and teacher in the fields of evidence, constitutional theory, family law, social sciences and the law, legal process and professional methodology and training
No. of Portfolios for which Board Member Serves: 80
|
David P. Feldman (67)
Board Member (1994)
|
Principal Occupation During Past 5 Years:
• Corporate Director and Trustee
|
Other Board Memberships and Affiliations:
|
- BBH Mutual Funds Group (11 funds), Director
- The Jeffrey Company, a private investment company, Director
- QMED, a medical device company, Director
No. of Portfolios for which Board Member Serves: 57
|
BOARD MEMBERS INFORMATION (Unaudited) (continued)
James F. Henry (76)
Board Member (1990)
|
Principal Occupation During Past 5 Years:
|
- President,The International Institute for Conflict Prevention and Resolution, a non-profit organization principally engaged in the development of alternatives to business litigation (Retired 2003)
- Advisor to The Elaw Forum, a consultant on managing corporate legal costs
- Advisor to John Jay Homestead (the restored home of the first U.S. Chief Justice)
- Individual Trustee of several trusts
Other Board Memberships and Affiliations:
|
- Director, advisor and mediator involved in several non-profit organizations, primarily engaged in domestic and international dispute resolution, and historic preservation
No. of Portfolios for which Board Member Serves: 48
|
———————
Ehud Houminer (66) Board Member (2006)
Principal Occupation During Past 5 Years:
• Executive-in-Residence at the Columbia Business School, Columbia University
Other Board Memberships and Affiliations:
|
- Avnet Inc., an electronics distributor, Director
- International Advisory Board to the MBA Program School of Management, Ben Gurion University, Chairman
- Explore Charter School, Brooklyn, NY, Chairman
No. of Portfolios for which Board Member Serves: 78
———————
Gloria Messinger (77) Board Member (2006)
Principal Occupation During Past 5 Years:
|
- Arbitrator for American Arbitration Association and National Association of Securities Dealers, Inc.
- Consultant in Intellectual Property
Other Board Memberships and Affiliations:
|
- Theater for a New Audience, Inc., Director
- Brooklyn Philharmonic, Director
No. of Portfolios for which Board Member Serves: 48
|
Dr. Martin Peretz (67)
Board Member (1990)
|
Principal Occupation During Past 5 Years:
|
- Editor-in-Chief of The New Republic Magazine
- Lecturer in Social Studies at Harvard University (1965-2002)
- Director of TheStreet.com, a financial information service on the web
Other Board Memberships and Affiliations:
|
- American Council of Trustees and Alumni, Director
- Pershing Square Capital Management, Adviser
- Montefiore Ventures, General Partner
- Harvard Center for Blood Research,Trustee
- Bard College,Trustee
- Board of Overseers of YIVO Institute for Jewish Research, Chairman
No. of Portfolios for which Board Member Serves: 48
———————
Anne Wexler (76) Board Member (2006)
Principal Occupation During Past 5 Years:
|
- Chairman of the Wexler & Walker Public Policy Associates, consultants specializing in government relations and public affairs
Other Board Memberships and Affiliations:
|
- Wilshire Mutual Funds (5 funds), Director
- Methanex Corporation, a methanol producing company, Director
- Member of the Council of Foreign Relations
- Member of the National Park Foundation
No. of Portfolios for which Board Member Serves: 57
|
Once elected all Board Members serve for an indefinite term, but achieve Emeritus status on December 31st of the calendar year in which the Board Member reaches age 80.The address of the Board Members and Officers is in c/o The Dreyfus Corporation, 200 Park Avenue, New York, New York 10166. Additional information about the Board Members is available in the fund's Statement of Additional Information which can be obtained from Dreyfus free of charge by calling this toll free number: 1-800-554-4611.
John M. Fraser, Jr., Emeritus Board Member Rosalind G. Jacobs, Emeritus Board Member Dr. Paul A. Marks, Emeritus Board Member
OFFICERS OF THE FUND (Unaudited)
J. DAVID OFFICER, President since December 2006.
Chief Operating Officer,Vice Chairman and a director of the Manager, and an officer of 90 investment companies (comprised of 190 portfolios) managed by the Manager. He is 58 years old and has been an employee of the Manager since April 1, 1998.
MARK N. JACOBS, Vice President since March 2000.
Executive Vice President, Secretary and General Counsel of the Manager, and an officer of 91 investment companies (comprised of 206 portfolios) managed by the Manager. He is 60 years old and has been an employee of the Manager since June 1977.
MICHAEL A. ROSENBERG, Vice President and Secretary since August 2005.
Associate General Counsel of the Manager, and an officer of 91 investment companies (comprised of 206 portfolios) managed by the Manager. He is 46 years old and has been an employee of the Manager since October 1991.
JAMES BITETTO, Vice President and Assistant Secretary since August 2005.
Associate General Counsel and Assistant Secretary of the Manager, and an officer of 91 investment companies (comprised of 206 portfolios) managed by the Manager. He is 40 years old and has been an employee of the Manager since December 1996.
JONI LACKS CHARATAN, Vice President and Assistant Secretary since August 2005.
Associate General Counsel of the Manager, and an officer of 91 investment companies (comprised of 206 portfolios) managed by the Manager. She is 51 years old and has been an employee of the Manager since October 1988.
JOSEPH M. CHIOFFI, Vice President and Assistant Secretary since August 2005.
Associate General Counsel of the Manager, and an officer of 91 investment companies (comprised of 206 portfolios) managed by the Manager. He is 45 years old and has been an employee of the Manager since June 2000.
JANETTE E. FARRAGHER, Vice President and Assistant Secretary since August 2005.
Associate General Counsel of the Manager, and an officer of 91 investment companies (comprised of 206 portfolios) managed by the Manager. She is 44 years old and has been an employee of the Manager since February 1984.
JOHN B. HAMMALIAN, Vice President and Assistant Secretary since August 2005.
Associate General Counsel of the Manager, and an officer of 91 investment companies (comprised of 206 portfolios) managed by the Manager. He is 43 years old and has been an employee of the Manager since February 1991.
ROBERT R. MULLERY, Vice President and Assistant Secretary since August 2005.
Associate General Counsel of the Manager, and an officer of 91 investment companies (comprised of 206 portfolios) managed by the Manager. He is 54 years old and has been an employee of the Manager since May 1986.
JEFF PRUSNOFSKY, Vice President and Assistant Secretary since August 2005.
Associate General Counsel of the Manager, and an officer of 91 investment companies (comprised of 206 portfolios) managed by the Manager. He is 41 years old and has been an employee of the Manager since October 1990.
JAMES WINDELS, Treasurer since November 2001.
Director – Mutual Fund Accounting of the Manager, and an officer of 91 investment companies (comprised of 206 portfolios) managed by the Manager. He is 48 years old and has been an employee of the Manager since April 1985.
ERIK D. NAVILOFF, Assistant Treasurer since December 2002.
Senior Accounting Manager – Taxable Fixed Income Funds of the Manager, and an officer of 91 investment companies (comprised of 206 portfolios) managed by the Manager. He is 38 years old and has been an employee of the Manager since November 1992.
ROBERT ROBOL, Assistant Treasurer since August 2003.
Senior Accounting Manager – Money Market and Municipal Bond Funds of the Manager, and an officer of 91 investment companies (comprised of 206 portfolios) managed by the Manager. He is 42 years old and has been an employee of the Manager since October 1988.
ROBERT SVAGNA, Assistant Treasurer since December 2002.
Senior Accounting Manager – Equity Funds of the Manager, and an officer of 91 investment companies (comprised of 206 portfolios) managed by the Manager. He is 39 years old and has been an employee of the Manager since November 1990.
GAVIN C. REILLY, Assistant Treasurer since December 2005.
Tax Manager of the Investment Accounting and Support Department of the Manager, and an officer of 91 investment companies (comprised of 206 portfolios) managed by the Manager. He is 38 years old and has been an employee of the Manager since April 1991.
JOSEPH W. CONNOLLY, Chief Compliance Officer since October 2004.
Chief Compliance Officer of the Manager and The Dreyfus Family of Funds (91 investment companies, comprised of 206 portfolios). From November 2001 through March 2004, Mr. Connolly was first Vice-President, Mutual Fund Servicing for Mellon Global Securities Services. In that capacity, Mr. Connolly was responsible for managing Mellon’s Custody, Fund Accounting and Fund Administration services to third-party mutual fund clients. He is 49 years old and has served in various capacities with the Manager since 1980, including manager of the firm’s Fund Accounting Department from 1997 through October 2001.
WILLIAM GERMENIS, Anti-Money Laundering Compliance Officer since September 2002.
Vice President and Anti-Money Laundering Compliance Officer of the Distributor, and the Anti-Money Laundering Compliance Officer of 87 investment companies (comprised of 202 portfolios) managed by the Manager. He is 36 years old and has been an employee of the Distributor since October 1998.
| For More | | Information |
| |
|
| |
| Dreyfus Variable | | Transfer Agent & |
| Investment Fund, | | Dividend Disbursing Agent |
| Developing Leaders Portfolio |
| | | Dreyfus Transfer, Inc. |
| 200 Park Avenue | | |
| | | 200 Park Avenue |
| New York, NY 10166 | | |
| | | New York, NY 10166 |
| |
| Investment Adviser | | Distributor |
| The Dreyfus Corporation | | |
| | | Dreyfus Service Corporation |
| 200 Park Avenue | | |
| | | 200 Park Avenue |
| New York, NY 10166 | | |
| | | New York, NY 10166 |
| Custodian | | |
| Mellon Bank, N.A. | | |
| One Mellon Bank Center | | |
| Pittsburgh, PA 15258 | | |
| Telephone 1-800-554-4611 or 516-338-3300 |
| Mail | | The Dreyfus Family of Funds, 144 Glenn Curtiss Boulevard, Uniondale, NY 11556-0144 |
| | | Attn: Investments Division |
The portfolio files its complete schedule of portfolio holdings with the Securities and Exchange Commission (“SEC”) for the first and third quarters of each fiscal year on Form N-Q. The portfolio’s Forms N-Q are available on the SEC’s website at http://www.sec.gov and may be reviewed and copied at the SEC’s Public Reference Room in Washington, DC. Information on the operation of the Public Reference Room may be obtained by calling 1-202-551-8090.
A description of the policies and procedures that the portfolio uses to determine how to vote proxies relating to portfolio securities, and information regarding how the portfolio voted these proxies for the 12-month period ended June 30, 2006, is available at http://www.dreyfus.com and on the SEC’s website at http://www.sec.gov. The description of the policies and procedures is also available without charge, upon request, by calling 1-800-645-6561.


The views expressed in this report reflect those of the portfolio manager only through the end of the period covered and do not necessarily represent the views of Dreyfus or any other person in the Dreyfus organization.Any such views are subject to change at any time based upon market or other conditions and Dreyfus disclaims any responsibility to update such views. These views may not be relied on as investment advice and, because investment decisions for a Dreyfus portfolio are based on numerous factors, may not be relied on as an indication of trading intent on behalf of any Dreyfus portfolio.
Not FDIC-Insured • Not Bank-Guaranteed • May Lose Value
| | | Contents |
| |
| | | T H E P O R T F O L I O |
| |
|
| 2 | | A Letter from the CEO |
| 3 | | Discussion of Performance |
| 6 | | Portfolio Performance |
| 8 | | Understanding Your Portfolio’s Expenses |
| 8 | | Comparing Your Portfolio’s Expenses |
| | | With Those of Other Funds |
| 9 | | Statement of Investments |
| 13 | | Statement of Assets and Liabilities |
| 14 | | Statement of Operations |
| 15 | | Statement of Changes in Net Assets |
| 17 | | Financial Highlights |
| 19 | | Notes to Financial Statements |
| 26 | | Report of Independent Registered |
| | | Public Accounting Firm |
| 27 | | Important Tax Information |
| 27 | | Proxy Results |
| 28 | | Board Members Information |
| 31 | | Officers of the Fund |
| | | F O R M O R E I N F O R M AT I O N |
| |
|
| | | Back Cover |
Dreyfus Variable Investment Fund,
Disciplined Stock Portfolio
The Portfolio

A LETTER FROM THE CEO
We are pleased to present this annual report for Dreyfus Variable Investment Fund, Disciplined Stock Portfolio, covering the 12-month period from January 1, 2006, through December 31, 2006.
2006 proved to be a good year for the financial markets.Virtually all sectors and capitalization ranges of the U.S. equity markets generated strong returns, especially over the second half of the year.A number of positive factors contributed to the markets’ gains in 2006, including an expanding domestic economy, subdued inflation, stabilizing interest rates, rising productivity and robust corporate profits.
In our analysis, 2006 provided an excellent reminder of the need for a long-term investment perspective. Adopting too short a time frame proved costly for some investors last year, as chasing recent winners often meant buying the next month’s losers. Indeed, history shows that reacting to near-term developments with extreme shifts in strategy rarely is the right decision.We believe that a better course of action is to set a portfolio mix to meet future goals, while attempting to ignore short term market fluctuations in favor of a longer-term view.
For information about how the portfolio performed during the reporting period, as well as market perspectives, we have provided a Discussion of Performance given by the portfolio manager.
Thank you for your continued confidence and support.We wish you good health and prosperity in 2007.

Thomas F. Eggers
Chief Executive Officer
The Dreyfus Corporation
January 16, 2007
|

DISCUSSION OF PERFORMANCE
Sean P. Fitzgibbon, Portfolio Manager
How did Dreyfus Variable Investment Fund, Disciplined Stock Portfolio perform relative to its benchmark?
For the 12-month period ended December 31, 2006, the portfolio achieved total returns of 15.81% for its Initial shares and 15.59% for its Service shares.1 For the same period, the Standard & Poor’s 500 Composite Stock Price Index (“S&P 500 Index”), the portfolio’s benchmark, produced a total return of 15.78% .2
Continued U.S. economic growth and rising corporate earnings drove stock prices higher, despite occasional uncertainties regarding inflationary pressures. The market’s advance proved to be broadly based, with every sector in the S&P 500 Index generating gains. The portfolio roughly matched the benchmark’s performance. Notably good returns in the telecommunications services, basic materials, industrials and consumer discretionary sectors were balanced by a few disappointments in the energy, financial and health care areas.
What is the portfolio’s investment approach?
The portfolio seeks returns that are consistently superior to those of the S&P 500 Index, primarily through investments in the stocks of large-cap companies.We invest in growth and value stocks, which are chosen through a disciplined investment process that combines computer modeling techniques, fundamental analysis and risk manage-ment.We use a computer model to identify and rank stocks within an industry or sector, followed by fundamental analysis to select the most attractive of the higher ranked securities.We attempt to manage risks by diversifying across companies and industries so that the portfolio’s sector weightings and risk characteristics generally are similar to those of the S&P 500 Index.
What other factors influenced the portfolio’s performance?
During the first half of the reporting period, high energy prices and rising short-term interest rates inhibited the market’s advance. After achieving narrow gains during the first five months of 2006, the
DISCUSSION OF PERFORMANCE (continued)
|
market declined from May through July. In August, the Federal Reserve Board declined to raise short-term interest rates for the first time in more than two years, signaling a potential reduction in inflationary pressures. Stocks responded positively to this development and to signs that the U.S. economy was headed for a “soft landing,” sparking a rally that generally persisted through the end of the year.
Telecommunications stocks produced some of the market’s and portfolio’s stronger returns.The portfolio made up for underweighted exposure to telecommunications companies with a substantial investment in AT&T, one of the sector’s top performers. In the basic materials area, another of the market’s stronger sectors, the portfolio outperformed its benchmark due to strong individual stock selections, such as metal mining and production company Phelps Dodge and steel manufacturer Steel Dynamics, which was sold at the end of the reporting period. Similarly, among industrials, the portfolio’s returns relative to its benchmark benefited from good individual stock selections, including aerospace contractor Lockheed Martin, which we sold before the end of the reporting period, and diversified equipment maker Emerson Electric, which delivered better-than-expected earnings.
Holdings in several other sectors also contributed positively to the portfolio’s relative performance. Among retailers, gains in J.C. Penney helped offset weakness in The Home Depot, which was sold during the reporting period, while other consumer discretionary holdings, such as McDonalds and Hilton Hotels, produced attractive returns. In the technology area, computer maker Hewlett-Packard increased market share, bolstering the portfolio’s performance. Among conglomerates, the portfolio benefited from the merger of two holdings,Thermo Electron and Fischer Scientific.
On the other hand, a handful of holdings proved to be disappointing in 2006. For example, while the portfolio generated strong returns with certain energy holdings such as Marathon Oil, the fund’s emphasis on oilfield services companies, such as Nabors Industries and National Oilwell Varco, undermined relative performance. Among financial stocks, gains in brokerage holdings, such as JPMorgan Chase & Co. and Morgan Stanley, were balanced by relatively weak returns from AmeriCredit and Capital One Financial, which suffered from
concerns over consumer credit quality. Finally, ocular device maker Advanced Medical Optics suffered declines when it announced a disappointing earnings outlook.
What is the portfolio’s current strategy?
As of year-end, we have allocated a greater percentage of the portfolio’s assets than the benchmark to technology stocks in light of favorable product cycles and expectations of a positive corporate spending envi-ronment.We also have placed modest emphasis on energy stocks, where we see strong, long-term fundamentals for drillers and oilfield services companies.At the same time, we have reduced the portfolio’s consumer discretionary exposure in response to the potential for weakening consumer spending.The portfolio also currently maintains underweighted exposure to banks, which appear vulnerable to declining profit margins.
Looking at the overall market, large-cap stocks currently appear to us to be trading at a discount to their smaller-cap counterparts. In addition, we see evidence of accelerating earnings growth among large-cap companies, while smaller companies appear to be experiencing decelerating growth. These factors lead us to believe that large-cap stocks continue to offer attractive investment opportunities.
January 16, 2007
| | | The portfolio is only available as a funding vehicle under variable life insurance policies or variable |
| | | annuity contracts issued by insurance companies. Individuals may not purchase shares of the |
| | | portfolio directly. A variable annuity is an insurance contract issued by an insurance company that |
| | | enables investors to accumulate assets on a tax-deferred basis for retirement or other long-term |
| | | goals.The investment objective and policies of Dreyfus Variable Investment Fund, Disciplined |
| | | Stock Portfolio made available through insurance products may be similar to other funds/portfolios |
| | | managed or advised by Dreyfus. However, the investment results of the portfolio may be higher or |
| | | lower than, and may not be comparable to, those of any other Dreyfus fund/portfolio. |
| 1 | | Total return includes reinvestment of dividends and any capital gains paid. Past performance is no |
| | | guarantee of future results. Share price and investment return fluctuate such that upon redemption, |
| | | portfolio shares may be worth more or less than their original cost.The portfolio’s performance does |
| | | not reflect the deduction of additional charges and expenses imposed in connection with investing |
| | | in variable insurance contracts, which will reduce returns. Return figures provided reflect the |
| | | absorption of certain portfolio expenses by The Dreyfus Corporation pursuant to an agreement in |
| | | effect through December 31, 2007, at which time it may be extended, terminated or modified. |
| | | Had these expenses not been absorbed, the portfolio’s returns would have been lower. |
| 2 | | SOURCE: LIPPER INC. — Reflects reinvestment of dividends and, where applicable, capital |
| | | gain distributions.The Standard & Poor’s 500 Composite Stock Price Index is a widely accepted, |
| | | unmanaged index of U.S. stock market performance. |
The Portfolio 5
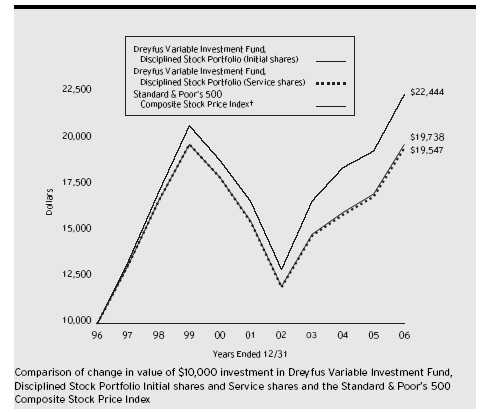
| Average Annual Total Returns as of | | 12/31/06 | | | | |
| |
| | | 1 Year | | 5 Years | | 10 Years |
| |
| |
| |
|
| Initial shares | | 15.81% | | 4.88% | | 7.04% |
| Service shares | | 15.59% | | 4.72% | | 6.93% |
| |
| The data for Service shares includes the results of Initial shares for the period prior to December 31, 2000 |
| (inception date of Service shares). Actual Service shares’ average annual total return and hypothetical growth |
| results would have been lower. See notes below. | | | | | | |
| † Source: Lipper Inc. | | | | | | |
| Past performance is not predictive of future performance.The portfolio’s performance shown in the graph and table does not |
| reflect the deduction of taxes that a shareholder would pay on portfolio distributions or the redemption of portfolio shares. |
| The portfolio’s performance does not reflect the deduction of additional charges and expenses imposed in |
| connection with investing in variable insurance contracts which will reduce returns. | | |
| The above graph compares a $10,000 investment made in Initial and Service shares of Dreyfus Variable Investment |
| Fund, Disciplined Stock Portfolio on 12/31/96 to a $10,000 investment made in the Standard & Poor’s 500 |
| Composite Stock Price Index (the “Index”) on that date. | | | | |
6
The portfolio’s Initial shares are not subject to a Rule 12b-1 fee.The portfolio’s Service shares are subject to a 0.25% annual Rule 12b-1 fee.The performance figures for Service shares reflect the performance of the portfolio’s Initial shares from their inception date through December 30, 2000, and the performance of the portfolio’s Service shares from December 31, 2000 (inception date of Service shares) to December 31, 2006 (blended performance figures).The performance figures for each share class reflect certain expense reimbursements, without which the performance of each share class would have been lower. In addition, the blended performance figures have not been adjusted to reflect the higher operating expenses of the Service shares. If these expenses had been reflected, the blended performance figures would have been lower. All dividends and capital gain distributions are reinvested.
The portfolio’s performance shown in the line graph takes into account all applicable portfolio fees and expenses (after any expense reimbursements).The Index is a widely accepted, unmanaged index of U.S. stock market performance, which does not take into account charges, fees and other expenses. Further information relating to portfolio performance, including expense reimbursements, if applicable, is contained in the Financial Highlights section of the prospectus and elsewhere in this report.
UNDERSTANDING YOUR
PORTFOLIO’S EXPENSES (Unaudited)
|
As a mutual fund investor,you pay ongoing expenses,such as management fees and other expenses.Using the information below,you can estimate how these expenses affect your investment and compare them with the expenses of other funds.You also may pay one-time transaction expenses, including sales charges (loads) and redemption fees, which are not shown in this section and would have resulted in higher total expenses. For more information, see your portfolio’s prospectus or talk to your financial adviser.
Review your portfolio’s expenses
The table below shows the expenses you would have paid on a $1,000 investment in Dreyfus Variable Investment Fund, Disciplined Stock Portfolio from July 1, 2006 to December 31, 2006. It also shows how much a $1,000 investment would be worth at the close of the period, assuming actual returns and expenses.
| Expenses and Value of a $1,000 Investment | | |
| assuming actual returns for the six months ended December 31, 2006 |
| | | Initial Shares | | Service Shares |
| |
| |
|
| Expenses paid per $1,000 † | | $ 4.89 | | $ 5.15 |
| Ending value (after expenses) | | $1,131.10 | | $1,130.00 |
COMPARING YOUR PORTFOLIO’S EXPENSES WITH THOSE OF OTHER FUNDS (Unaudited)
Using the SEC’s method to compare expenses
The Securities and Exchange Commission (SEC) has established guidelines to help investors assess fund expenses. Per these guidelines, the table below shows your portfolio’s expenses based on a $1,000 investment, assuming a hypothetical 5% annualized return. You can use this information to compare the ongoing expenses (but not transaction expenses or total cost) of investing in the portfolio with those of other funds. All mutual fund shareholder reports will provide this information to help you make this comparison. Please note that you cannot use this information to estimate your actual ending account balance and expenses paid during the period.
Expenses and Value of a $1,000 Investment assuming a hypothetical 5% annualized return for the six months ended December 31, 2006
| | | Initial Shares | | Service Shares |
| |
| |
|
| Expenses paid per $1,000 † | | $ 4.63 | | $ 4.89 |
| Ending value (after expenses) | | $1,020.62 | | $1,020.37 |
† Expenses are equal to the portfolio’s annualized expense ratio of .91% for Initial shares and .96% for Service shares, multiplied by the average account value over the period, multiplied by 184/365 (to reflect the one-half year period).
| | STATEMENT OF INVESTMENTS
December 31, 2006
|
| Common Stocks—99.6% | | Shares | | Value ($) |
| |
| |
|
| Consumer Discretionary—8.9% | | | | |
| Coach | | 11,120 a | | 477,715 |
| Fortune Brands | | 5,190 | | 443,174 |
| Hilton Hotels | | 31,010 | | 1,082,249 |
| J.C. Penney | | 7,990 | | 618,106 |
| McDonald's | | 29,634 | | 1,313,675 |
| Omnicom Group | | 14,200 | | 1,484,468 |
| Target | | 15,800 | | 901,390 |
| TJX Cos. | | 24,790 | | 707,011 |
| Walt Disney | | 35,210 | | 1,206,647 |
| | | | | 8,234,435 |
| Consumer Staples—9.6% | | | | |
| Altria Group | | 36,350 | | 3,119,557 |
| Cadbury Schweppes, ADR | | 32,550 b | | 1,397,372 |
| Kroger | | 47,090 | | 1,086,366 |
| PepsiCo | | 23,310 | | 1,458,040 |
| SUPERVALU | | 26,540 | | 948,805 |
| Wal-Mart Stores | | 20,200 | | 932,836 |
| | | | | 8,942,976 |
| Energy—11.0% | | | | |
| Chesapeake Energy | | 28,070 | | 815,433 |
| Chevron | | 10,090 | | 741,918 |
| ConocoPhillips | | 39,490 | | 2,841,305 |
| ENSCO International | | 19,350 | | 968,661 |
| Exxon Mobil | | 13,260 | | 1,016,114 |
| Hess | | 11,100 | | 550,227 |
| Marathon Oil | | 8,590 | | 794,575 |
| Nabors Industries | | 23,670 a | | 704,893 |
| National Oilwell Varco | | 14,920 a | | 912,806 |
| XTO Energy | | 19,260 | | 906,183 |
| | | | | 10,252,115 |
| Exchange Traded Funds—.8% | | | | |
| Standard & Poor's Depository | | | | |
| Receipts (Tr. Ser. 1) | | 5,160 b | | 731,120 |
| Financial—20.8% | | | | |
| Allstate | | 16,190 | | 1,054,131 |
| Ambac Financial Group | | 10,490 | | 934,344 |
The Portfolio 9
STATEMENT OF INVESTMENTS (continued)
|
| Common Stocks (continued) | | Shares | | Value ($) |
| |
| |
|
| Financial (continued) | | | | |
| American International Group | | 11,941 | | 855,692 |
| Bank of America | | 48,410 | | 2,584,610 |
| Chicago Mercantile Exchange Holdings | | 880 | | 448,580 |
| Chubb | | 16,510 | | 873,544 |
| CIT Group | | 16,740 | | 933,590 |
| Citigroup | | 31,190 | | 1,737,283 |
| E*TRADE FINANCIAL | | 25,720 a | | 576,642 |
| Hartford Financial Services Group | | 9,480 | | 884,579 |
| JPMorgan Chase & Co. | | 41,840 | | 2,020,872 |
| Lehman Brothers Holdings | | 10,490 | | 819,479 |
| Merrill Lynch & Co. | | 15,390 | | 1,432,809 |
| MetLife | | 13,500 | | 796,635 |
| Morgan Stanley | | 22,920 | | 1,866,376 |
| PNC Financial Services Group | | 6,110 | | 452,384 |
| U.S. Bancorp | | 27,050 | | 978,940 |
| | | | | 19,250,490 |
| Health Care—13.9% | | | | |
| AmerisourceBergen | | 18,030 | | 810,629 |
| Amgen | | 21,690 a | | 1,481,644 |
| Baxter International | | 29,990 | | 1,391,236 |
| Becton, Dickinson & Co. | | 6,930 | | 486,140 |
| CIGNA | | 5,620 | | 739,423 |
| Pfizer | | 66,274 | | 1,716,497 |
| Sanofi-Aventis, ADR | | 19,690 | | 909,087 |
| Schering-Plough | | 62,120 | | 1,468,517 |
| Thermo Fisher Scientific | | 36,550 a | | 1,655,350 |
| WellPoint | | 14,270 a | | 1,122,906 |
| Wyeth | | 22,520 | | 1,146,718 |
| | | | | 12,928,147 |
| Industrial—10.3% | | | | |
| Eaton | | 12,960 | | 973,814 |
| Emerson Electric | | 21,220 | | 935,590 |
| General Electric | | 66,790 | | 2,485,256 |
| Goodrich | | 12,940 | | 589,417 |
| Common Stocks (continued) | | Shares | | Value ($) |
| |
| |
|
| Industrial (continued) | | | | |
| L-3 Communications Holdings | | 12,570 | | 1,027,975 |
| Textron | | 15,160 | | 1,421,553 |
| Tyco International | | 46,950 | | 1,427,280 |
| US Airways Group | | 12,470 a,b | | 671,509 |
| | | | | 9,532,394 |
| Information Technology—17.4% | | | | |
| Accenture, Cl. A | | 17,610 | | 650,337 |
| Amphenol, Cl. A | | 7,490 | | 464,979 |
| Apple Computer | | 11,970 a | | 1,015,535 |
| Broadcom, Cl. A | | 14,270 a | | 461,064 |
| Cisco Systems | | 76,170 a | | 2,081,726 |
| Cognizant Technology Solutions, Cl. A | | 6,590 a | | 508,484 |
| Google, Cl. A | | 3,350 a | | 1,542,608 |
| Hewlett-Packard | | 38,820 | | 1,598,996 |
| International Business Machines | | 19,650 | | 1,908,998 |
| Microsoft | | 74,970 | | 2,238,604 |
| Motorola | | 37,310 | | 767,094 |
| National Semiconductor | | 35,350 | | 802,445 |
| Oracle | | 69,200 a | | 1,186,088 |
| Texas Instruments | | 30,720 | | 884,736 |
| | | | | 16,111,694 |
| Materials—2.1% | | | | |
| Phelps Dodge | | 10,320 | | 1,235,510 |
| Rohm & Haas | | 14,030 | | 717,214 |
| | | | | 1,952,724 |
| Telecommunication Services—1.5% | | | | |
| AT & T | | 39,510 | | 1,412,482 |
| Utilities—3.3% | | | | |
| PG & E | | 25,450 | | 1,204,549 |
| Sempra Energy | | 33,530 | | 1,879,021 |
| | | | | 3,083,570 |
| Total Common Stocks | | | | |
| (cost $74,217,205) | | | | 92,432,147 |
STATEMENT OF INVESTMENTS (continued)
|
| Other Investment—.2% | | Shares | | Value ($) |
| |
| |
|
| Registered Investment Company; | | | | |
| Dreyfus Institutional Preferred | | | | |
| Plus Money Market Fund | | | | |
| (cost $197,000) | | | | 197,000 c | | 197,000 |
| |
| |
| |
|
| |
| Investment of Cash Collateral | | | | |
| for Securities Loaned—3.2% | | | | |
| |
| |
|
| Registered Investment Company; | | | | |
| Dreyfus Institutional Cash | | | | |
| Advantage Plus Fund | | | | | | |
| (cost $2,928,900) | | | | 2,928,900 c | | 2,928,900 |
| |
| |
| |
|
| |
| Total Investments (cost $77,343,105) | | 103.0% | | 95,558,047 |
| |
| Liabilities, Less Cash and Receivables | | (3.0%) | | (2,764,844) |
| |
| Net Assets | | | | 100.0% | | 92,793,203 |
| |
| ADR—American Depository Receipts | | | | |
| a | | Non-income producing security. | | | | |
| b | | All or a portion of these securities are on loan. At December 31, 2006, the total market value of the portfolio's |
| | | securitieson loan is $2,800,001 and the total market value of the collateral held by the portfolio is $2,928,900. |
| c | | Investment in affiliated money market mutual fund. | | | | |
| |
| |
| |
|
| |
| |
| |
| |
| Portfolio Summary | | (Unaudited) † | | | | |
| | | | | Value (%) | | | | Value (%) |
| |
| |
| |
| |
|
| Financial | | 20.8 | | Money Market Investments | | 3.4 |
| Information Technology | | 17.4 | | Utilities | | 3.3 |
| Health Care | | 13.9 | | Materials | | 2.1 |
| Energy | | 11.0 | | Telecommunication Services | | 1.5 |
| Industrial | | 10.3 | | Exchange Traded Funds | | .8 |
| Consumer Staples | | 9.6 | | | | |
| Consumer Discretionary | | 8.9 | | | | 103.0 |
| |
| † | | Based on net assets. | | | | | | |
| See notes to financial statements. | | | | |
STATEMENT OF ASSETS AND LIABILITIES
December 31, 2006
| | | Cost | | Value |
| |
| |
|
| Assets ($): | | | | |
| Investments in securities—See Statement of | | |
| Investments (including securities on loan, | | |
| valued at $2,800,001)—Note 1(b): | | |
| Unaffiliated issuers | | 74,217,205 | | 92,432,147 |
| Affiliated issuers | | 3,125,900 | | 3,125,900 |
| Cash | | | | 4,176 |
| Receivable for investment securities sold | | 1,686,884 |
| Dividends and interest receivable | | | | 168,481 |
| Prepaid expenses | | | | 9,196 |
| | | | | 97,426,784 |
| |
| |
|
| Liabilities ($): | | | | |
| Due to The Dreyfus Corporation and affiliates—Note 3(b) | | 63,843 |
| Liability for securities on loan—Note 1(b) | | 2,928,900 |
| Payable for investment securities purchased | | 1,577,246 |
| Payable for shares of Beneficial Interest redeemed | | 8,908 |
| Interest Payable—Note 2 | | | | 128 |
| Accrued expenses | | | | 54,556 |
| | | | | 4,633,581 |
| |
| |
|
| Net Assets ($) | | | | 92,793,203 |
| |
| |
|
| Composition of Net Assets ($): | | | | |
| Paid-in capital | | | | 82,075,723 |
| Accumulated undistributed investment income—net | | 818,165 |
| Accumulated net realized gain (loss) on investments | | (8,315,627) |
| Accumulated net unrealized appreciation | | |
| (depreciation) on investments | | | | 18,214,942 |
| |
| |
|
| Net Assets ($) | | | | 92,793,203 |
| |
| |
|
| |
| |
| Net Asset Value Per Share | | | | |
| | | Initial Shares | | Service Shares |
| |
| |
|
| Net Assets ($) | | 83,689,495 | | 9,103,708 |
| Shares Outstanding | | 3,277,399 | | 357,487 |
| |
| |
|
| Net Asset Value Per Share ($) | | 25.54 | | 25.47 |
See notes to financial statements.
|
STATEMENT OF OPERATIONS
Year Ended December 31, 2006
|
| Investment Income ($): | | |
| Income: | | |
| Cash dividends (net of $5,888 foreign taxes withheld at source): | | |
| Unaffiliated issuers | | 1,612,157 |
| Affiliated issuers | | 12,840 |
| Interest | | 8,548 |
| Income from securities lending | | 2,317 |
| Total Income | | 1,635,862 |
| Expenses: | | |
| Investment advisory fee—Note 3(a) | | 703,009 |
| Professional fees | | 39,539 |
| Prospectus and shareholders’ reports | | 27,837 |
| Distribution fees—Note 3(b) | | 22,018 |
| Custodian fees—Note 3(b) | | 13,821 |
| Trustees’ fees and expenses—Note 3(c) | | 10,424 |
| Loan commitment fees—Note 2 | | 841 |
| Interest expense—Note 2 | | 526 |
| Miscellaneous | | 8,500 |
| Total Expenses | | 826,515 |
| Less—waiver of fees due to undertaking—Note 3(a) | | (11,257) |
| Net Expenses | | 815,258 |
| Investment Income—Net | | 820,604 |
| |
|
| Realized and Unrealized Gain (Loss) on Investments—Note 4 ($): |
| Net realized gain (loss) on investments | | 9,807,041 |
| Net unrealized appreciation (depreciation) on investments | | 2,961,879 |
| Net Realized and Unrealized Gain (Loss) on Investments | | 12,768,920 |
| Net Increase in Net Assets Resulting from Operations | | 13,589,524 |
See notes to financial statements.
|
STATEMENT OF CHANGES IN NET ASSETS
| | | Year Ended December 31, |
| |
|
| | | 2006 | | 2005 |
| |
| |
|
| Operations ($): | | | | |
| Investment income—net | | 820,604 | | 812,180 |
| Net realized gain (loss) on investments | | 9,807,041 | | 10,150,869 |
| Net unrealized appreciation | | | | |
| (depreciation) on investments | | 2,961,879 | | (4,868,955) |
| Net Increase (Decrease) in Net Assets | | | | |
| Resulting from Operations | | 13,589,524 | | 6,094,094 |
| |
| |
|
| Dividends to Shareholders from ($): | | | | |
| Investment income—net: | | | | |
| Initial shares | | (747,950) | | — |
| Service shares | | (66,669) | | — |
| Total Dividends | | (814,619) | | — |
| |
| |
|
| Beneficial Interest Transactions ($): | | | | |
| Net proceeds from shares sold: | | | | |
| Initial shares | | 2,030,851 | | 3,453,325 |
| Service shares | | 592,214 | | 300,528 |
| Dividends reinvested: | | | | |
| Initial shares | | 747,950 | | — |
| Service shares | | 66,669 | | — |
| Cost of shares redeemed: | | | | |
| Initial shares | | (19,244,624) | | (23,812,339) |
| Service shares | | (1,728,247) | | (1,646,452) |
| Increase (Decrease) in Net Assets from | | | | |
| Beneficial Interest Transactions | | (17,535,187) | | (21,704,938) |
| Total Increase (Decrease) in Net Assets | | (4,760,282) | | (15,610,844) |
| |
| |
|
| Net Assets ($): | | | | |
| Beginning of Period | | 97,553,485 | | 113,164,329 |
| End of Period | | 92,793,203 | | 97,553,485 |
| Undistributed investment income—net | | 818,165 | | 812,180 |
STATEMENT OF CHANGES IN NET ASSETS (continued)
|
| | | Year Ended December 31, |
| |
|
| | | 2006 | | 2005 |
| |
| |
|
| Capital Share Transactions: | | | | |
| Initial Shares | | | | |
| Shares sold | | 87,142 | | 164,137 |
| Shares issued for dividends reinvested | | 32,295 | | — |
| Shares redeemed | | (826,466) | | (1,121,420) |
| Net Increase (Decrease) in Shares Outstanding | | (707,029) | | (957,283) |
| |
| |
|
| Service Shares | | | | |
| Shares sold | | 25,819 | | 14,394 |
| Shares issued for dividends reinvested | | 2,883 | | — |
| Shares redeemed | | (74,435) | | (77,648) |
| Net Increase (Decrease) in Shares Outstanding | | (45,733) | | (63,254) |
See notes to financial statements.
|
FINANCIAL HIGHLIGHTS
The following tables describe the performance for each share class for the fiscal periods indicated. All information (except portfolio turnover rate) reflects financial results for a single portfolio share.Total return shows how much your investment in the portfolio would have increased (or decreased) during each period, assuming you had reinvested all dividends and distributions.These figures have been derived from the portfolio’s financial statements.
| | | | | Year Ended December 31, | | |
| |
| |
| |
|
| Initial Shares | | 2006 | | 2005 | | 2004 | | 2003 | | 2002 |
| |
| |
| |
| |
| |
|
| Per Share Data ($): | | | | | | | | | | |
| Net asset value, beginning of period | | 22.24 | | 20.93 | | 19.66 | | 16.04 | | 20.89 |
| Investment Operations: | | | | | | | | | | |
| Investment income—net a | | .21 | | .17 | | .21 | | .14 | | .12 |
| Net realized and unrealized | | | | | | | | | | |
| gain (loss) on investments | | 3.29 | | 1.14 | | 1.34 | | 3.63 | | (4.84) |
| Total from Investment Operations | | 3.50 | | 1.31 | | 1.55 | | 3.77 | | (4.72) |
| Distributions: | | | | | | | | | | |
| Dividends from investment income—net | | (.20) | | — | | (.28) | | (.15) | | (.13) |
| Net asset value, end of period | | 25.54 | | 22.24 | | 20.93 | | 19.66 | | 16.04 |
| |
| |
| |
| |
| |
|
| Total Return (%) | | 15.81 | | 6.26 | | 7.87 | | 23.53 | | (22.61) |
| |
| |
| |
| |
| |
|
| Ratios/Supplemental Data (%): | | | | | | | | | | |
| Ratio of total expenses | | | | | | | | | | |
| to average net assets | | .86 | | .90 | | .85 | | .85 | | .83 |
| Ratio of net expenses | | | | | | | | | | |
| to average net assets | | .86 | | .90 | | .85 | | .85 | | .83 |
| Ratio of net investment income | | | | | | | | | | |
| to average net assets | | .89 | | .79 | | 1.04 | | .81 | | .64 |
| Portfolio Turnover Rate | | 88.25 | | 74.33 | | 83.64 | | 52.74 | | 47.47 |
| |
| |
| |
| |
| |
|
| Net Assets, end of period ($ x 1,000) | | 83,689 | | 88,608 | | 103,417 | | 111,352 | | 106,404 |
| |
| a Based on average shares outstanding at each month end. | | | | | | | | |
| See notes to financial statements. | | | | | | | | | | |
FINANCIAL HIGHLIGHTS (continued)
|
| | | | | Year Ended December 31, | | |
| |
| |
| |
|
| Service Shares | | 2006 | | 2005 | | 2004 | | 2003 | | 2002 |
| |
| |
| |
| |
| |
|
| Per Share Data ($): | | | | | | | | | | |
| Net asset value, beginning of period | | 22.18 | | 20.90 | | 19.63 | | 16.02 | | 20.86 |
| Investment Operations: | | | | | | | | | | |
| Investment income—net a | | .18 | | .15 | | .18 | | .11 | | .09 |
| Net realized and unrealized | | | | | | | | | | |
| gain (loss) on investments | | 3.28 | | 1.13 | | 1.33 | | 3.62 | | (4.83) |
| Total from Investment Operations | | 3.46 | | 1.28 | | 1.51 | | 3.73 | | (4.74) |
| Distributions: | | | | | | | | | | |
| Dividends from investment income—net | | (.17) | | — | | (.24) | | (.12) | | (.10) |
| Net asset value, end of period | | 25.47 | | 22.18 | | 20.90 | | 19.63 | | 16.02 |
| |
| |
| |
| |
| |
|
| Total Return (%) | | 15.59 | | 6.22 | | 7.64 | | 23.31 | | (22.72) |
| |
| |
| |
| |
| |
|
| Ratios/Supplemental Data (%): | | | | | | | | | | |
| Ratio of total expenses | | | | | | | | | | |
| to average net assets | | 1.11 | | 1.15 | | 1.10 | | 1.09 | | 1.06 |
| Ratio of net expenses | | | | | | | | | | |
| to average net assets | | .98 | | 1.00 | | 1.00 | | 1.00 | | 1.00 |
| Ratio of net investment income | | | | | | | | | | |
| to average net assets | | .76 | | .69 | | .90 | | .65 | | .49 |
| Portfolio Turnover Rate | | 88.25 | | 74.33 | | 83.64 | | 52.74 | | 47.47 |
| |
| |
| |
| |
| |
|
| Net Assets, end of period ($ x 1,000) | | 9,104 | | 8,945 | | 9,748 | | 10,299 | | 9,150 |
| |
| a Based on average shares outstanding at each month end. | | | | | | | | |
| See notes to financial statements. | | | | | | | | | | |
NOTES TO FINANCIAL STATEMENTS
NOTE 1—Significant Accounting Policies:
Dreyfus Variable Investment Fund (the “fund”) is registered under the Investment Company Act of 1940, as amended (the “Act”), as an open-end management investment company, operating as a series company currently offering twelve series, including the Disciplined Stock Portfolio (the “portfolio”). The portfolio is only offered to separate accounts established by insurance companies to fund variable annuity contracts and variable life insurance policies.The portfolio is a diversified series.The portfolio’s investment objective is to provide investment returns (consisting of capital appreciation and income) that are consistently superior to the Standard & Poor’s 500 Composite Stock Price Index.The Dreyfus Corporation (the “Manager” or “Dreyfus”) serves as the portfolio’s investment adviser. The Manager is a wholly-owned subsidiary of Mellon Financial Corporation (“Mellon Financial”).
On December 4, 2006, Mellon Financial and The Bank of New York Company, Inc. announced that they had entered into a definitive agreement to merge. The new company will be called The Bank of New York Mellon Corporation. As part of this transaction, Dreyfus would become a wholly-owned subsidiary of The Bank of New York Mellon Corporation.The transaction is subject to certain regulatory approvals and the approval of The Bank of New York Company, Inc.’s and Mellon Financial’s shareholders, as well as other customary conditions to closing. Subject to such approvals and the satisfaction of the other conditions, Mellon Financial and The Bank of New York Company, Inc. expect the transaction to be completed in the third quarter of 2007.
Dreyfus Service Corporation (the “Distributor”), a wholly-owned subsidiary of the Manager, is the distributor of the portfolio’s shares, which are sold without a sales charge. The portfolio is authorized to issue an unlimited number of $.001 par value shares of Beneficial Interest in each of the following classes of shares: Initial and Service. Each class of shares has identical rights and privileges, except with respect to the distribution plan and the expenses borne by each class and certain voting rights. Income, expenses (other than expenses
NOTES TO FINANCIAL STATEMENTS (continued)
|
attributable to a specific class), and realized and unrealized gains or losses on investments are allocated to each class of shares based on its relative net assets.
The fund accounts separately for the assets, liabilities and operations of each series. Expenses directly attributable to each series are charged to that series’ operations; expenses which are applicable to all series are allocated among them on a pro rata basis.
The portfolio’s financial statements are prepared in accordance with U.S. generally accepted accounting principles, which may require the use of management estimates and assumptions.Actual results could differ from those estimates.
The fund enters into contracts that contain a variety of indemnifica-tions.The portfolio’s maximum exposure under these arrangements is unknown. The portfolio does not anticipate recognizing any loss related to these arrangements.
(a) Portfolio valuation: Investments in securities are valued at the last sales price on the securities exchange or national securities market on which such securities are primarily traded. Securities listed on the National Market System for which market quotations are available are valued at the official closing price or, if there is no official closing price that day, at the last sales price. Securities not listed on an exchange or the national securities market, or securities for which there were no transactions, are valued at the average of the most recent bid and asked prices, except for open short positions, where the asked price is used for valuation purposes. Bid price is used when no asked price is available. Registered open-end investment companies that are not traded on an exchange are valued at their net asset value.When market quotations or official closing prices are not readily available, or are determined not to reflect accurately fair value, such as when the value of a security has been significantly affected by events after the close of the exchange or market on which the security is principally traded (for example, a foreign exchange or market), but before the portfolio calculates its net asset value, the portfolio may value these investments at fair value as determined in accordance with the procedures approved
by the Board of Trustees. Fair valuing of securities may be determined with the assistance of a pricing service using calculations based on indices of domestic securities and other appropriate indicators, such as prices of relevant ADR’s and futures contracts. For other securities that are fair valued by the Board of Trustees, certain factors may be considered such as: fundamental analytical data, the nature and duration of restrictions on disposition, an evaluation of the forces that influence the market in which the securities are purchased and sold and public trading in similar securities of the issuer or comparable issuers. Financial futures are valued at the last sales price. Investments denominated in foreign currencies are translated to U.S. dollars at the prevailing rates of exchange. Forward currency exchange contracts are valued at the forward rate.
On September 20, 2006, the Financial Accounting Standards Board (FASB) released Statement of Financial Accounting Standards No. 157 “Fair Value Measurements” (“FAS 157”). FAS 157 establishes an authoritative definition of fair value, sets out a framework for measuring fair value, and requires additional disclosures about fair-value measurements. The application of FAS 157 is required for fiscal years beginning after November 15, 2007 and interim periods within those fiscal years. Management does not believe that the application of this standard will have a material impact on the financial statements of the portfolio.
(b) Securities transactions and investment income: Securities transactions are recorded on a trade date basis. Realized gain and loss from securities transactions are recorded on the identified cost basis. Dividend income is recognized on the ex-dividend date and interest income, including, where applicable, accretion of discount and amortization of premium on investments, is recognized on the accrual basis.
The portfolio has an arrangement with the custodian bank whereby the portfolio receives earnings credits from the custodian when positive cash balances are maintained, which are used to offset custody fees. For financial reporting purposes, the portfolio includes net earnings credits, if any, as an expense offset in the Statement of Operations.
NOTES TO FINANCIAL STATEMENTS (continued)
Pursuant to a securities lending agreement with Mellon Bank, N.A., an affiliate of the Manager, the portfolio may lend securities to qualified institutions. It is the portfolio’s policy, that at origination, all loans are secured by collateral of at least 102% of the value of U.S. securities loaned and 105% of the value of foreign securities loaned. . It is the portfolio’s policy that collateral equivalent to at least 100% of the market value of securities on loan will be maintained at all times. Cash collateral is invested in certain money market mutual funds managed by the Manager.The portfolio will be entitled to receive all income on securities loaned, in addition to income earned as a result of the lending transaction. Although each security loaned is fully collateralized, the portfolio would bear the risk of delay in recovery of, or loss of rights in, the securities loaned should a borrower fail to return the securities in a timely manner.
(c) Affiliated issuers: Investments in other investment companies advised by the Manager are defined as “affiliated” in the Act.
(d) Dividends to shareholders: Dividends are recorded on the ex-dividend date. Dividends from investment income-net and dividends from net realized capital gain, if any, are normally declared and paid annually, but the portfolio may make distributions on a more frequent basis to comply with the distribution requirements of the Internal Revenue Code of 1986, as amended (the “Code”).To the extent that net realized capital gain can be offset by capital loss carryovers, it is the policy of the portfolio not to distribute such gain. Income and capital gain distributions are determined in accordance with income tax regulations, which may differ from U.S. generally accepted accounting principles.
(e) Federal income taxes: It is the policy of the portfolio to continue to qualify as a regulated investment company, if such qualification is in the best interests of its shareholders, by complying with the applicable provisions of the Code, and to make distributions of taxable income sufficient to relieve it from substantially all federal income and excise taxes.
On July 13, 2006, the FASB released FASB Interpretation No. 48 “Accounting for Uncertainty in Income Taxes” (FIN 48). FIN 48 provides guidance for how uncertain tax positions should be recognized,
measured, presented and disclosed in the financial statements. FIN 48 requires the evaluation of tax positions taken or expected to be taken in the course of preparing the portfolio’s tax returns to determine whether the tax positions are “more-likely-than-not” of being sustained by the applicable tax authority. Tax positions not deemed to meet the more-likely-than-not threshold would be recorded as a tax benefit or expense in the current year.Adoption of FIN 48 is required for fiscal years beginning after December 15, 2006 and is to be applied to all open tax years as of the effective date. Management does not believe that the application of this standard will have a material impact on the financial statements of the portfolio.
At December 31, 2006, the components of accumulated earnings on a tax basis were as follows: undistributed ordinary income $818,165, accumulated capital losses $7,771,546 and unrealized appreciation $17,670,861.
The accumulated capital loss carryover is available to be applied against future net securities profits, if any, realized subsequent to December 31, 2006. If not applied, $3,686,178 of the carryover expires in fiscal 2010, and $4,085,368 expires in fiscal 2011.
The tax character of distributions paid to shareholders during the fiscal year ended December 31, 2006 and December 31, 2005 were as follows: ordinary income $814,619 and $0, respectively.
NOTE 2—Bank Line of Credit:
The portfolio participates with other Dreyfus-managed funds in a $350 million redemption credit facility (the “Facility”) to be utilized for temporary or emergency purposes, including the financing of redemptions. In connection therewith, the portfolio has agreed to pay commitment fees on its pro rata portion of the Facility. Interest is charged to the portfolio based on prevailing market rates in effect at the time of borrowing.
The average daily amount of borrowings outstanding under the Facility during the period ended December 31, 2006 was approximately $9,400, with a related weighted average annualized rate of 5.59% .
NOTES TO FINANCIAL STATEMENTS (continued)
|
NOTE 3—Investment Advisory Fee and Other Transactions With Affiliates:
(a) Pursuant to an Investment Advisory Agreement with the Manager, the investment advisory fee is computed at the annual rate of .75% of the value of the portfolio’s average daily net assets and is payable monthly.
The Manager has undertaken, from January 1, 2006, to December 31, 2007, to waive receipt of its fees and/or assume the expenses of the portfolio so that the expenses of neither class, exclusive of taxes, brokerage fees, interest on borrowings, commitment fees and extraordinary expenses, exceed an annual rate of 1% of the value of the average daily net assets of their class. During the period ended December 31, 2006, the Manager waived receipt of fees of $11,257 pursuant to the undertaking.
(b) Under the Distribution Plan (the “Plan”) adopted pursuant to Rule 12b-1 under the Act, Service shares pay the Distributor for distributing their shares, for servicing and/or maintaining Service shares shareholder accounts and for advertising and marketing for Service shares.The Plan provides for payments to be made at an annual rate of .25% of the value of the Service shares’ average daily net assets.The Distributor may make payments to Participating Insurance Companies and to brokers and dealers acting as principal underwriter for their variable insurance products.The fees payable under the Plan are payable without regard to actual expenses incurred. During the period ended December 31, 2006, Service shares were charged $22,018 pursuant to the Plan.
The portfolio compensates Dreyfus Transfer, Inc., a wholly-owned subsidiary of the Manager, under a transfer agency agreement for providing personnel and facilities to perform transfer agency services for the portfolio. During the period ended December 31, 2006, the portfolio was charged $211 pursuant to the transfer agency agreement.
The portfolio compensates Mellon Bank, N.A., an affiliate of the Manager, under a custody agreement to provide custodial services for the portfolio. During the period ended December 31, 2006, the portfolio was charged $13,821 pursuant to the custody agreement.
During the period ended December 31, 2006, the portfolio was charged $4,204 for services performed by the Chief Compliance Officer.
The components of Due to The Dreyfus Corporation and affiliates in the Statement of Assets and Liabilities consist of: investment advisory fees $59,385, Rule 12b-1 distribution plan fees $1,942, custodian fees $2,644, chief compliance officer fees $2,044 and transfer agency per account fees $36, which are offset against an expense reimbursement currently in effect in the amount of $2,208.
(c) Each Board member also serves as a Board member of other funds within the Dreyfus complex. Annual retainer fees and attendance fees are allocated to each fund based on net assets.
NOTE 4—Securities Transactions:
The aggregate amount of purchases and sales of investment securities, excluding short-term securities, during the period ended December 31, 2006, amounted to $82,490,775 and $99,244,069, respectively.
At December 31, 2006, the cost of investments for federal income tax purposes was $77,887,186; accordingly, accumulated net unrealized appreciation on investments was $17,670,861, consisting of $18,665,989 gross unrealized appreciation and $995,128 gross unrealized depreciation.
REPORT OF INDEPENDENT REGISTERED PUBLIC ACCOUNTING FIRM
Shareholders and Board of Trustees
Dreyfus Variable Investment Fund, Disciplined Stock Portfolio
We have audited the accompanying statement of assets and liabilities, including the statement of investments, of Dreyfus Variable Investment Fund, Disciplined Stock Portfolio (one of the funds comprising Dreyfus Variable Investment Fund) as of December 31, 2006, and the related statement of operations for the year then ended, the statement of changes in net assets for each of the two years in the period then ended, and financial highlights for each of the periods indicated therein.These financial statements and financial highlights are the responsibility of the Fund’s management. Our responsibility is to express an opinion on these financial statements and financial highlights based on our audits.
We conducted our audits in accordance with the standards of the Public Company Accounting Oversight Board (United States).Those standards require that we plan and perform the audit to obtain reasonable assurance about whether the financial statements and financial highlights are free of material misstatement.We were not engaged to perform an audit of the Fund’s internal control over financial reporting. Our audits included consideration of internal control over financial reporting as a basis for designing audit procedures that are appropriate in the circumstances, but not for the purpose of expressing an opinion on the effectiveness of the Fund’s internal control over financial reporting. Accordingly, we express no such opinion. An audit also includes examining, on a test basis, evidence supporting the amounts and disclosures in the financial statements and the financial highlights assessing the accounting principles used and significant estimates made by management, and evaluating the overall financial statement presentation. Our procedures included confirmation of securities owned as of December 31, 2006 by correspondence with the custodian and others or by other appropriate auditing procedures where replies from others were not received.We believe that our audits provide a reasonable basis for our opinion.
In our opinion, the financial statements and financial highlights referred to above present fairly, in all material respects, the financial position of Dreyfus Variable Investment Fund, Disciplined Stock Portfolio at December 31, 2006, the results of its operations for the year then ended, the changes in its net assets for each of the two years in the period then ended, and the financial highlights for each of the indicated periods, in conformity with U.S. generally accepted accounting principles.

New York, New York
February 6, 2007
|
IMPORTANT TAX INFORMATION (Unaudited)
For federal tax purposes, the portfolio hereby designates 100% of the ordinary dividends paid during the fiscal year ended December 31, 2006 as qualifying for the corporate dividends received deduction. Shareholders will receive notification in January 2007 of the percentage applicable to the preparation of their 2006 income tax returns.
PROXY RESULTS (Unaudited)
Dreyfus Variable Investment Fund held a special meeting of shareholders on June 29, 2006.The proposal considered at the meeting, and the results, are as follows:
| | | | | Shares | | |
| |
| |
| |
|
| | | Votes For | | | | Authority Withheld |
| |
| |
| |
|
| To elect additional Board Members: | | | | | | |
| Peggy C. Davis † | | 171,078,927 | | | | 7,687,714 |
| Joseph S. DiMartino | | 170,946,484 | | | | 7,820,156 |
| David P. Feldman | | 170,959,921 | | | | 7,806,720 |
| Ehud Houminer † | | 170,132,087 | | | | 8,634,554 |
| Gloria Messinger † | | 170,187,241 | | | | 8,579,400 |
| Anne Wexler † | | 170,212,607 | | | | 8,554,033 |
† Each new Board member’s term commenced on September 26, 2006.
In addition to Joseph S. DiMartino and David P. Feldman, James F. Henry, Dr. Paul A. Marks and Dr. Martin Peretz continue as Board members of the fund.
BOARD MEMBERS INFORMATION (Unaudited)
Joseph S. DiMartino (63)
Chairman of the Board (1995)
|
Principal Occupation During Past 5 Years:
• Corporate Director and Trustee
|
Other Board Memberships and Affiliations:
|
- The Muscular Dystrophy Association, Director
- Century Business Services, Inc., a provider of outsourcing functions for small and medium size companies, Director
- The Newark Group, a provider of a national market of paper recovery facilities, paperboard mills and paperboard converting plants, Director
- Sunair Services Corporation, engaging in the design, manufacture and sale of high frequency systems for long-range voice and data communications, as well as providing certain outdoor-related services to homes and businesses, Director
No. of Portfolios for which Board Member Serves: 190
———————
Peggy C. Davis (63) Board Member (2006)
Principal Occupation During Past 5 Years:
|
- Shad Professor of Law, New York University School of Law (1983-present)
- Writer and teacher in the fields of evidence, constitutional theory, family law, social sciences and the law, legal process and professional methodology and training
No. of Portfolios for which Board Member Serves: 80
|
David P. Feldman (67)
Board Member (1994)
|
Principal Occupation During Past 5 Years:
• Corporate Director and Trustee
|
Other Board Memberships and Affiliations:
|
- BBH Mutual Funds Group (11 funds), Director
- The Jeffrey Company, a private investment company, Director
- QMED, a medical device company, Director
No. of Portfolios for which Board Member Serves: 57
|
James F. Henry (76)
Board Member (1990)
|
Principal Occupation During Past 5 Years:
|
- President,The International Institute for Conflict Prevention and Resolution, a non-profit organization principally engaged in the development of alternatives to business litigation (Retired 2003)
- Advisor to The Elaw Forum, a consultant on managing corporate legal costs
- Advisor to John Jay Homestead (the restored home of the first U.S. Chief Justice)
- Individual Trustee of several trusts
Other Board Memberships and Affiliations:
|
- Director, advisor and mediator involved in several non-profit organizations, primarily engaged in domestic and international dispute resolution, and historic preservation
No. of Portfolios for which Board Member Serves: 48
|
———————
Ehud Houminer (66) Board Member (2006)
Principal Occupation During Past 5 Years:
• Executive-in-Residence at the Columbia Business School, Columbia University
Other Board Memberships and Affiliations:
|
- Avnet Inc., an electronics distributor, Director
- International Advisory Board to the MBA Program School of Management, Ben Gurion University, Chairman
- Explore Charter School, Brooklyn, NY, Chairman
No. of Portfolios for which Board Member Serves: 78
———————
Gloria Messinger (77) Board Member (2006)
Principal Occupation During Past 5 Years:
|
- Arbitrator for American Arbitration Association and National Association of Securities Dealers, Inc.
- Consultant in Intellectual Property
Other Board Memberships and Affiliations:
|
- Theater for a New Audience, Inc., Director
- Brooklyn Philharmonic, Director
No. of Portfolios for which Board Member Serves: 48
|
BOARD MEMBERS INFORMATION (Unaudited) (continued)
Dr. Martin Peretz (67)
Board Member (1990)
|
Principal Occupation During Past 5 Years:
|
- Editor-in-Chief of The New Republic Magazine
- Lecturer in Social Studies at Harvard University (1965-2002)
- Director of TheStreet.com, a financial information service on the web
Other Board Memberships and Affiliations:
|
- American Council of Trustees and Alumni, Director
- Pershing Square Capital Management, Adviser
- Montefiore Ventures, General Partner
- Harvard Center for Blood Research,Trustee
- Bard College,Trustee
- Board of Overseers of YIVO Institute for Jewish Research, Chairman
No. of Portfolios for which Board Member Serves: 48
———————
Anne Wexler (76) Board Member (2006)
Principal Occupation During Past 5 Years:
|
- Chairman of the Wexler & Walker Public Policy Associates, consultants specializing in government relations and public affairs
Other Board Memberships and Affiliations:
|
- Wilshire Mutual Funds (5 funds), Director
- Methanex Corporation, a methanol producing company, Director
- Member of the Council of Foreign Relations
- Member of the National Park Foundation
No. of Portfolios for which Board Member Serves: 57
|
Once elected all Board Members serve for an indefinite term, but achieve Emeritus status on December 31st of the calendar year in which the Board Member reaches age 80.The address of the Board Members and Officers is in c/o The Dreyfus Corporation, 200 Park Avenue, New York, New York 10166. Additional information about the Board Members is available in the fund’s Statement of Additional Information which can be obtained from Dreyfus free of charge by calling this toll free number: 1-800-554-4611.
John M. Fraser, Jr., Emeritus Board Member Rosalind G. Jacobs, Emeritus Board Member Dr. Paul A. Marks, Emeritus Board Member
OFFICERS OF THE FUND (Unaudited)
J. DAVID OFFICER, President since December 2006.
Chief Operating Officer,Vice Chairman and a director of the Manager, and an officer of 90 investment companies (comprised of 190 portfolios) managed by the Manager. He is 58 years old and has been an employee of the Manager since April 1, 1998.
MARK N. JACOBS, Vice President since March 2000.
Executive Vice President, Secretary and General Counsel of the Manager, and an officer of 91 investment companies (comprised of 206 portfolios) managed by the Manager. He is 60 years old and has been an employee of the Manager since June 1977.
MICHAEL A. ROSENBERG, Vice President and Secretary since August 2005.
Associate General Counsel of the Manager, and an officer of 91 investment companies (comprised of 206 portfolios) managed by the Manager. He is 46 years old and has been an employee of the Manager since October 1991.
JAMES BITETTO, Vice President and Assistant Secretary since August 2005.
Associate General Counsel and Assistant Secretary of the Manager, and an officer of 91 investment companies (comprised of 206 portfolios) managed by the Manager. He is 40 years old and has been an employee of the Manager since December 1996.
JONI LACKS CHARATAN, Vice President and Assistant Secretary since August 2005.
Associate General Counsel of the Manager, and an officer of 91 investment companies (comprised of 206 portfolios) managed by the Manager. She is 51 years old and has been an employee of the Manager since October 1988.
JOSEPH M. CHIOFFI, Vice President and Assistant Secretary since August 2005.
Associate General Counsel of the Manager, and an officer of 91 investment companies (comprised of 206 portfolios) managed by the Manager. He is 45 years old and has been an employee of the Manager since June 2000.
JANETTE E. FARRAGHER, Vice President and Assistant Secretary since August 2005.
Associate General Counsel of the Manager, and an officer of 91 investment companies (comprised of 206 portfolios) managed by the Manager. She is 44 years old and has been an employee of the Manager since February 1984.
JOHN B. HAMMALIAN, Vice President and Assistant Secretary since August 2005.
Associate General Counsel of the Manager, and an officer of 91 investment companies (comprised of 206 portfolios) managed by the Manager. He is 43 years old and has been an employee of the Manager since February 1991.
ROBERT R. MULLERY, Vice President and Assistant Secretary since August 2005.
Associate General Counsel of the Manager, and an officer of 91 investment companies (comprised of 206 portfolios) managed by the Manager. He is 54 years old and has been an employee of the Manager since May 1986.
JEFF PRUSNOFSKY, Vice President and Assistant Secretary since August 2005.
Associate General Counsel of the Manager, and an officer of 91 investment companies (comprised of 206 portfolios) managed by the Manager. He is 41 years old and has been an employee of the Manager since October 1990.
OFFICERS OF THE FUND (Unaudited) (continued)
JAMES WINDELS, Treasurer since November 2001.
Director – Mutual Fund Accounting of the Manager, and an officer of 91 investment companies (comprised of 206 portfolios) managed by the Manager. He is 48 years old and has been an employee of the Manager since April 1985.
ERIK D. NAVILOFF, Assistant Treasurer since December 2002.
Senior Accounting Manager – Taxable Fixed Income Funds of the Manager, and an officer of 91 investment companies (comprised of 206 portfolios) managed by the Manager. He is 38 years old and has been an employee of the Manager since November 1992.
ROBERT ROBOL, Assistant Treasurer since August 2003.
Senior Accounting Manager – Money Market and Municipal Bond Funds of the Manager, and an officer of 91 investment companies (comprised of 206 portfolios) managed by the Manager. He is 42 years old and has been an employee of the Manager since October 1988.
ROBERT SVAGNA, Assistant Treasurer since December 2002.
Senior Accounting Manager – Equity Funds of the Manager, and an officer of 91 investment companies (comprised of 206 portfolios) managed by the Manager. He is 39 years old and has been an employee of the Manager since November 1990.
GAVIN C. REILLY, Assistant Treasurer since December 2005.
Tax Manager of the Investment Accounting and Support Department of the Manager, and an officer of 91 investment companies (comprised of 206 portfolios) managed by the Manager. He is 38 years old and has been an employee of the Manager since April 1991.
JOSEPH W. CONNOLLY, Chief Compliance Officer since October 2004.
Chief Compliance Officer of the Manager and The Dreyfus Family of Funds (91 investment companies, comprised of 206 portfolios). From November 2001 through March 2004, Mr. Connolly was first Vice-President, Mutual Fund Servicing for Mellon Global Securities Services. In that capacity, Mr. Connolly was responsible for managing Mellon’s Custody, Fund Accounting and Fund Administration services to third-party mutual fund clients. He is 49 years old and has served in various capacities with the Manager since 1980, including manager of the firm’s Fund Accounting Department from 1997 through October 2001.
WILLIAM GERMENIS, Anti-Money Laundering Compliance Officer since September 2002.
Vice President and Anti-Money Laundering Compliance Officer of the Distributor, and the Anti-Money Laundering Compliance Officer of 87 investment companies (comprised of 202 portfolios) managed by the Manager. He is 36 years old and has been an employee of the Distributor since October 1998.
| For More | | Information |
| |
|
| |
| Dreyfus Variable | | Transfer Agent & |
| Investment Fund, | | Dividend Disbursing Agent |
| Disciplined Stock Portfolio | | |
| | | Dreyfus Transfer, Inc. |
| 200 Park Avenue | | |
| | | 200 Park Avenue |
| New York, NY 10166 | | |
| | | New York, NY 10166 |
| |
| Investment Adviser | | Distributor |
| The Dreyfus Corporation | | |
| | | Dreyfus Service Corporation |
| 200 Park Avenue | | |
| | | 200 Park Avenue |
| New York, NY 10166 | | |
| | | New York, NY 10166 |
| Custodian | | |
| Mellon Bank, N.A. | | |
| One Mellon Bank Center | | |
| Pittsburgh, PA 15258 | | |
| Telephone 1-800-554-4611 or 516-338-3300 |
| Mail | | The Dreyfus Family of Funds, 144 Glenn Curtiss Boulevard, Uniondale, NY 11556-0144 |
| | | Attn: Investments Division |
The portfolio files its complete schedule of portfolio holdings with the Securities and Exchange Commission (“SEC”) for the first and third quarters of each fiscal year on Form N-Q. The portfolio’s Forms N-Q are available on the SEC’s website at http://www.sec.gov and may be reviewed and copied at the SEC’s Public Reference Room in Washington, DC. Information on the operation of the Public Reference Room may be obtained by calling 1-202-551-8090.
A description of the policies and procedures that the portfolio uses to determine how to vote proxies relating to portfolio securities, and information regarding how the portfolio voted these proxies for the 12-month period ended June 30, 2006, is available at http://www.dreyfus.com and on the SEC’s website at http://www.sec.gov. The description of the policies and procedures is also available without charge, upon request, by calling 1-800-645-6561.


The views expressed in this report reflect those of the portfolio manager only through the end of the period covered and do not necessarily represent the views of Dreyfus or any other person in the Dreyfus organization.Any such views are subject to change at any time based upon market or other conditions and Dreyfus disclaims any responsibility to update such views. These views may not be relied on as investment advice and, because investment decisions for a Dreyfus portfolio are based on numerous factors, may not be relied on as an indication of trading intent on behalf of any Dreyfus portfolio.
Not FDIC-Insured • Not Bank-Guaranteed • May Lose Value
| | | Contents |
| |
| | | T H E P O R T F O L I O |
| |
|
| 2 | | A Letter from the CEO |
| 3 | | Discussion of Performance |
| 6 | | Portfolio Performance |
| 8 | | Understanding Your Portfolio’s Expenses |
| 8 | | Comparing Your Portfolio’s Expenses |
| | | With Those of Other Funds |
| 9 | | Statement of Investments |
| 13 | | Statement of Assets and Liabilities |
| 14 | | Statement of Operations |
| 15 | | Statement of Changes in Net Assets |
| 17 | | Financial Highlights |
| 19 | | Notes to Financial Statements |
| 27 | | Report of Independent Registered |
| | | Public Accounting Firm |
| 28 | | Important Tax Information |
| 28 | | Proxy Results |
| 29 | | Board Members Information |
| 32 | | Officers of the Fund |
| |
| | | F O R M O R E I N F O R M AT I O N |
| |
|
| | | Back Cover |
| Dreyfus Variable Investment Fund, |
| Growth and Income Portfolio |
The Portfolio

A LETTER FROM THE CEO
Dear Shareholder:
We are pleased to present this annual report for Dreyfus Variable Investment Fund, Growth and Income Portfolio, covering the 12-month period from January 1, 2006, through December 31, 2006.
2006 proved to be a good year for the financial markets.Virtually all sectors and capitalization ranges of the U.S. equity markets generated strong returns, especially over the second half of the year.A number of positive factors contributed to the markets’ gains in 2006, including an expanding domestic economy, subdued inflation, stabilizing interest rates, rising productivity and robust corporate profits.
In our analysis, 2006 provided an excellent reminder of the need for a long-term investment perspective. Adopting too short a time frame proved costly for some investors last year, as chasing recent winners often meant buying the next month’s losers. Indeed, history shows that reacting to near-term developments with extreme shifts in strategy rarely is the right decision.We believe that a better course of action is to set a portfolio mix to meet future goals, while attempting to ignore short term market fluctuations in favor of a longer-term view.
For information about how the portfolio performed during the reporting period, as well as market perspectives, we have provided a Discussion of Performance given by the portfolio manager.
Thank you for your continued confidence and support.We wish you good health and prosperity in 2007.

Thomas F. Eggers
Chief Executive Officer
The Dreyfus Corporation
January 16, 2007
|

DISCUSSION OF PERFORMANCE
John B. Jares, CFA, Portfolio Manager
How did Dreyfus Variable Investment Fund, Growth and Income Portfolio perform relative to its benchmark?
For the 12-month period ended December 31, 2006, the portfolio achieved a 14.51% total return for its Initial shares and 14.31% total return for its Service shares.1 The portfolio’s benchmark, the Standard & Poor’s 500 Composite Stock Price Index (“S&P 500 Index”), returned 15.78% for the same period.2
Although 2006 began with a market rally, investors’ inflation and interest-rate concerns intensified in the second quarter, causing stocks to sell off sharply in May and June. However, the third and fourth quarters of the year saw a sustained market recovery, as energy prices declined and the Federal Reserve Board (the “Fed”) halted its run of interest rate increases, relieving inflation fears. The portfolio underperformed the S&P 500 Index, primarily due to disappointing stock selections in the information technology, health care and consumer discretionary sectors over the first half of 2006.
As of July 31, 2006, John Jares became the portfolio’s primary portfolio manager.
What is the portfolio’s investment approach?
To pursue the portfolio’s goals of seeking long-term capital growth, current income and growth of income consistent with reasonable investment risk, the portfolio invests primarily in stocks, bonds and money market instruments of domestic and foreign issuers.
Prior to August 1, 2006, the portfolio employed fundamental analysis, generally seeking companies with strong positions in their industries, and companies with a catalyst that can trigger a price increase. The portfolio manager generally gave greater weight to sectors that were expected to outperform the overall market and less weight to sectors that were expected to underperform.The portfolio manager sought to create a broadly diversified core portfolio comprised of growth stocks, value stocks and stocks that exhibited characteristics of both investment styles. Income was generated primarily from dividend-paying stocks.
DISCUSSION OF PERFORMANCE (continued)
|
Since August 1, 2006, a new management team has employed a “growth style” of investing, seeking companies whose fundamental strengths suggest the potential to provide superior earnings growth over time.We follow a consistent, “bottom-up” approach that emphasizes individual stock selection. Income is generated primarily from dividend-paying stocks in which the portfolio may invest.
What other factors influenced the portfolio’s performance?
Mounting inflationary pressures, rising interest rates and sluggish consumer spending cast a shadow over stocks during the first half of the reporting period. Equity prices generally declined, with traditionally growth-oriented companies seeing the largest disappointments in performance. However, with a pause in the Fed’s rate hikes and expectations of an economic “soft landing”in place,investor sentiment improved over the second half of 2006, and the ensuing market rally more than offset previous weakness.
During the first half of the year,the portfolio’s relative performance in the information technology, health care and consumer discretionary sectors proved disappointing due to weak stock selection.Microsoft,which faced strong competition and rising development costs, and Broadcom, which encountered corporate governance problems and competitive pressures, were among the portfolio’s poorer-performing holdings.The health care area also saw disappointments, particularly in ocular product developer Alcon, which was sold during the reporting period, and which was hurt by high marketing costs and competitive pressures, and medical devices maker Medtronic, which faced unfavorable Medicare reimbursement trends. Finally, consumer discretionary stocks such as Advance Auto Parts, Home Depot and Target, which were sold during the reporting period, suffered drops in stock price caused by dampened consumer spending.
The first half of the year, however, did offer some successes both through solid stock picking and sector allocations, as energy stocks generated strong returns due to higher gas and oil prices.The industrials sector also outperformed, aided by individual holdings such as railway operator Burlington, which was sold during the reporting period, Northern Santa Fe and diversified industrial conglomerate, Danaher, which was also sold during the reporting period.
In the second half of the year, several of the portfolio’s information technology stocks produced strong results, with Microsoft ending the year
with a modest gain, Cisco Systems benefiting from its position in the integrated voice-and-data product market, and Hewlett-Packard advancing on the strength of new management and accretive acquisitions in the software industry.The energy sector also was a strong performer for the portfolio, with end-market oil corporations including Exxon Mobil posting substantial gains for the year. Continental Airlines, American Airlines and US Airways Group also boosted the portfolio’s performance, as infrastructure and cost efficiencies and industry consolidation prompted the beginning of a turnaround in this cyclical industry.
However, certain consumer discretionary stocks continued to weigh on the portfolio’s performance at year’s end, with Advance Auto Parts and Home Depot remaining among the portfolio’s more poorly performing stocks.
What is the portfolio’s current strategy?
We have continued to seek companies with businesses and products that, in our judgment, can support their growth. We have found a number of such opportunities in the information technology and health care sectors.We intend to continue to focus on our bottom-up investment process in our ongoing efforts to achieve investment rewards while managing risks.
January 16, 2007
| | | The portfolio is only available as a funding vehicle under variable life insurance policies or variable |
| | | annuity contracts issued by insurance companies. Individuals may not purchase shares of the |
| | | portfolio directly. A variable annuity is an insurance contract issued by an insurance company that |
| | | enables investors to accumulate assets on a tax-deferred basis for retirement or other long-term |
| | | goals.The investment objective and policies of Dreyfus Variable Investment Fund, Growth and |
| | | Income Portfolio made available through insurance products may be similar to other |
| | | funds/portfolios managed or advised by Dreyfus. However, the investment results of the portfolio |
| | | may be higher or lower than, and may not be comparable to, those of any other Dreyfus |
| | | fund/portfolio. |
| 1 | | Total return includes reinvestment of dividends and any capital gains paid. Past performance is no |
| | | guarantee of future results. Share price and investment return fluctuate such that upon redemption, |
| | | portfolio shares may be worth more or less than their original cost.The portfolio’s performance does |
| | | not reflect the deduction of additional charges and expenses imposed in connection with investing |
| | | in variable insurance contracts, which will reduce returns. Return figures provided reflect the |
| | | absorption of certain portfolio expenses by The Dreyfus Corporation pursuant to an agreement in |
| | | effect through December 31, 2007, at which time it may be extended, terminated or modified. |
| | | Had those expenses not be absorbed, the portfolio’s returns would have been lower. |
| 2 | | SOURCE: LIPPER, INC. – Reflects reinvestment of net dividends and, where applicable, |
| | | capital gain distributions.The Standard & Poor’s 500 Composite Stock Price Index is a widely |
| | | accepted, unmanaged index of U.S. Stock market performance. |
The Portfolio 5

Comparison of change in value of $10,000 investment in Dreyfus Variable Investment Fund, Growth and Income Portfolio Initial shares and Service shares and the Standard & Poor’s 500 Composite Stock Price Index
| Average Annual Total Returns as of | | 12/31/06 | | | | |
| |
| | | 1 Year | | 5 Years | | 10 Years |
| |
| |
| |
|
| Initial shares | | 14.51% | | 3.75% | | 5.16% |
| Service shares | | 14.31% | | 3.57% | | 5.04% |
| |
| The data for Service shares includes the results of Initial shares for the period prior to December 31, 2000 |
| (inception date of Service shares). Actual Service shares’ average annual total return and hypothetical growth |
| results would have been lower. See notes below. | | | | | | |
| † Source: Lipper Inc. | | | | | | |
| Past performance is not predictive of future performance.The portfolio’s performance shown in the graph and table does not |
| reflect the deduction of taxes that a shareholder would pay on portfolio distributions or the redemption of portfolio shares. |
| The portfolio’s performance does not reflect the deduction of additional charges and expenses imposed in |
| connection with investing in variable insurance contracts which will reduce returns. | | |
| The above graph compares a $10,000 investment made in Initial and Service shares of Dreyfus Variable Investment |
| Fund, Growth and Income Portfolio on 12/31/96 to a $10,000 investment made in the Standard & Poor’s 500 |
| Composite Stock Price Index (the “Index”) on that date. | | | | |
6
The portfolio’s Initial shares are not subject to a Rule 12b-1 fee.The portfolio’s Service shares are subject to a 0.25% annual Rule 12b-1 fee.The performance figures for Service shares reflect the performance of the portfolio’s Initial shares from their inception date through December 30, 2000, and the performance of the portfolio’s Service shares from December 31, 2000 (inception date of Service shares) to December 31, 2006 (blended performance figures).The performance figures for each share class reflect certain expense reimbursements, without which the performance of each share class would have been lower. In addition, the blended performance figures have not been adjusted to reflect the higher operating expenses of the Service shares. If these expenses had been reflected, the blended performance figures would have been lower. All dividends and capital gain distributions are reinvested.
The portfolio’s performance shown in the line graph takes into account all applicable portfolio fees and expenses (after any expense reimbursements).The Index is a widely accepted, unmanaged index of U.S. stock market performance.The Index does not take into account charges, fees and other expenses. Further information relating to portfolio performance, including expense reimbursements, if applicable, is contained in the Financial Highlights section of the prospectus and elsewhere in this report.
UNDERSTANDING YOUR
PORTFOLIO’S EXPENSES (Unaudited)
As a mutual fund investor,you pay ongoing expenses,such as management fees and other expenses.Using the information below,you can estimate how these expenses affect your investment and compare them with the expenses of other funds.You also may pay one-time transaction expenses,including sales charges (loads) and redemption fees, which are not shown in this section and would have resulted in higher total expenses. For more information, see your portfolio’s prospectus or talk to your financial adviser.
Review your portfolio’s expenses
The table below shows the expenses you would have paid on a $1,000 investment in Dreyfus Variable Investment Fund, Growth and Income Portfolio from July 1, 2006 to December 31, 2006. It also shows how much a $1,000 investment would be worth at the close of the period, assuming actual returns and expenses.
| Expenses and Value of a $1,000 Investment | | |
| assuming actual returns for the six months ended December 31, 2006 |
| | | Initial Shares | | Service Shares |
| |
| |
|
| Expenses paid per $1,000 † | | $ 4.60 | | $ 5.41 |
| Ending value (after expenses) | | $1,145.10 | | $1,144.70 |
COMPARING YOUR PORTFOLIO’S EXPENSES WITH THOSE OF OTHER FUNDS (Unaudited)
Using the SEC’s method to compare expenses
The Securities and Exchange Commission (SEC) has established guidelines to help investors assess fund expenses. Per these guidelines, the table below shows your portfolio’s expenses based on a $1,000 investment, assuming a hypothetical 5% annualized return. You can use this information to compare the ongoing expenses (but not transaction expenses or total cost) of investing in the portfolio with those of other funds. All mutual fund shareholder reports will provide this information to help you make this comparison. Please note that you cannot use this information to estimate your actual ending account balance and expenses paid during the period.
Expenses and Value of a $1,000 Investment assuming a hypothetical 5% annualized return for the six months ended December 31, 2006
| | | Initial Shares | | Service Shares |
| |
| |
|
| Expenses paid per $1,000 † | | $ 4.33 | | $ 5.09 |
| Ending value (after expenses) | | $1,020.92 | | $1,020.16 |
† Expenses are equal to the portfolio’s annualized expense ratio of .85% for Initial shares and 1.00% for Service shares, multiplied by the average account value over the period, multiplied by 184/365 (to reflect the one-half year period).
| | STATEMENT OF INVESTMENTS
December 31, 2006
|
| Common Stocks—97.4% | | Shares | | | | Value ($) |
| |
| |
| |
|
| Consumer Discretionary—8.3% | | | | | | |
| AutoZone | | 6,515 | | a | | 752,873 |
| Best Buy | | 38,916 | | | | 1,914,278 |
| Comcast, Cl. A (Special) | | 54,284 | | a | | 2,273,414 |
| Federated Department Stores | | 69,738 | | | | 2,659,110 |
| Gap | | 47,617 | | | | 928,532 |
| Harman International Industries | | 7,341 | | | | 733,439 |
| Limited Brands | | 36,391 | | | | 1,053,156 |
| Marriott International, Cl. A | | 16,419 | | | | 783,515 |
| Tiffany & Co. | | 50,360 | | | | 1,976,126 |
| Walt Disney | | 59,886 | | | | 2,052,293 |
| Williams-Sonoma | | 18,035 | | | | 567,020 |
| | | | | | | 15,693,756 |
| Consumer Staples—13.7% | | | | | | |
| Altria Group | | 33,940 | | | | 2,912,731 |
| Avon Products | | 92,895 | | | | 3,069,251 |
| Cadbury Schweppes, ADR | | 22,407 | | b | | 961,932 |
| Colgate-Palmolive | | 56,892 | | | | 3,711,634 |
| Dean Foods | | 33,420 | | a | | 1,412,998 |
| PepsiCo | | 43,273 | | | | 2,706,726 |
| Procter & Gamble | | 56,117 | | | | 3,606,640 |
| Safeway | | 39,721 | | | | 1,372,758 |
| SYSCO | | 31,778 | | | | 1,168,159 |
| Unilever (NY Shares) | | 36,343 | | | | 990,347 |
| Wal-Mart Stores | | 84,712 | | | | 3,912,000 |
| | | | | | | 25,825,176 |
| Energy—5.1% | | | | | | |
| Chevron | | 20,710 | | | | 1,522,806 |
| Exxon Mobil | | 64,909 | | | | 4,973,977 |
| Peabody Energy | | 18,497 | | | | 747,464 |
| Schlumberger | | 36,222 | | | | 2,287,782 |
| | | | | | | 9,532,029 |
| Exchange Traded Funds—4.6% | | | | | | |
| iShares Russell 1000 Growth Index Fund | | 51,886 | | b | | 2,855,287 |
| NASDAQ-100 Index Trust Series 1 | | 68,483 | | b | | 2,955,726 |
| Standard & Poor’s Depository | | | | | | |
| Receipts (Tr. Ser. 1) | | 20,288 | | b | | 2,874,607 |
| | | | | | | 8,685,620 |
The Portfolio 9
| | STATEMENT OF INVESTMENTS (continued)
|
| Common Stocks (continued) | | Shares | | Value ($) |
| |
| |
|
| Financial—10.6% | | | | |
| Allstate | | 39,216 | | 2,553,354 |
| American International Group | | 20,654 | | 1,480,066 |
| Bank of America | | 1 | | 53 |
| Charles Schwab | | 189,704 | | 3,668,875 |
| Chicago Mercantile Exchange Holdings | | 2,322 | | 1,183,640 |
| Citigroup | | 23,195 | | 1,291,962 |
| Goldman Sachs Group | | 13,293 | | 2,649,960 |
| JPMorgan Chase & Co. | | 59,500 | | 2,873,850 |
| Morgan Stanley | | 25,830 | | 2,103,337 |
| Nasdaq Stock Market | | 25,292 a | | 778,741 |
| State Street | | 20,477 | | 1,380,969 |
| | | | | 19,964,807 |
| Health Care—13.5% | | | | |
| Allergan | | 23,684 | | 2,835,922 |
| Amgen | | 31,415 a | | 2,145,959 |
| Bristol-Myers Squibb | | 36,212 | | 953,100 |
| Covance | | 16,044 a | | 945,152 |
| Eli Lilly & Co. | | 17,204 | | 896,328 |
| Genzyme | | 14,489 a | | 892,233 |
| Johnson & Johnson | | 56,124 | | 3,705,306 |
| MedImmune | | 61,466 a | | 1,989,654 |
| Pfizer | | 55,905 | | 1,447,940 |
| Schering-Plough | | 111,245 | | 2,629,832 |
| Thermo Fisher Scientific | | 42,287 a | | 1,915,178 |
| Wyeth | | 41,000 | | 2,087,720 |
| Zimmer Holdings | | 37,757 a | | 2,959,394 |
| | | | | 25,403,718 |
| Industrial—7.3% | | | | |
| AMR | | 39,602 a | | 1,197,168 |
| Continental Airlines, Cl. B | | 36,221 a,b | | 1,494,116 |
| Empresa Brasileira de Aeronautica, ADR | | 27,335 | | 1,132,489 |
| General Electric | | 163,931 | | 6,099,873 |
| Masco | | 46,371 | | 1,385,102 |
| US Airways Group | | 15,358 a,b | | 827,028 |
| Waste Management | | 42,512 | | 1,563,166 |
| | | | | 13,698,942 |
10
| Common Stocks (continued) | | Shares | | Value ($) |
| |
| |
|
| Information Technology—21.9% | | | | |
| Accenture, Cl. A | | 45,988 | | 1,698,337 |
| Apple Computer | | 43,393 a | | 3,681,462 |
| ASML Holding (NY Shares) | | 99,526 a | | 2,451,325 |
| Broadcom, Cl. A | | 28,293 a | | 914,147 |
| Cisco Systems | | 214,069 a | | 5,850,506 |
| Corning | | 84,754 a | | 1,585,747 |
| Diebold | | 55,443 | | 2,583,644 |
| EMC/Massachusetts | | 99,526 a | | 1,313,743 |
| Google, Cl. A | | 8,828 a | | 4,065,117 |
| Hewlett-Packard | | 100,454 | | 4,137,700 |
| KLA-Tencor | | 20,017 | | 995,846 |
| Linear Technology | | 41,277 | | 1,251,519 |
| Marvell Technology Group | | 39,165 a | | 751,576 |
| Motorola | | 54,112 | | 1,112,543 |
| Nokia, ADR | | 92,021 | | 1,869,867 |
| SanDisk | | 20,439 a | | 879,490 |
| Seagate Technology | | 67,740 | | 1,795,110 |
| Sun Microsystems | | 176,298 a | | 955,535 |
| Texas Instruments | | 56,033 | | 1,613,750 |
| Western Union | | 21,291 | | 477,344 |
| Yahoo! | | 50,542 a | | 1,290,843 |
| | | | | 41,275,151 |
| Materials—.8% | | | | |
| E.I. du Pont de Nemours & Co. | | 31,875 | | 1,552,631 |
| Software—11.6% | | | | |
| Adobe Systems | | 96,117 a | | 3,952,331 |
| Autodesk | | 43,080 a | | 1,743,017 |
| Automatic Data Processing | | 31,971 | | 1,574,572 |
| Cognos | | 30,716 a | | 1,304,201 |
| Electronic Arts | | 60,033 a | | 3,023,262 |
| Microsoft | | 272,004 | | 8,122,039 |
| Oracle | | 116,838 a | | 2,002,603 |
| | | | | 21,722,025 |
| Total Common Stocks | | | | |
| (cost $162,535,329) | | | | 183,353,855 |
The Portfolio 11
STATEMENT OF INVESTMENTS (continued)
|
| Other Investment—2.4% | | | | Shares | | Value ($) |
| |
| |
| |
|
| Registered Investment Company; | | | | |
| Dreyfus Institutional Preferred | | | | | | |
| Plus Money Market Fund | | | | | | |
| (cost $4,482,000) | | | | 4,482,000 c | | 4,482,000 |
| |
| |
| |
|
| |
| Investment of Cash Collateral | | | | |
| for Securities Loaned—4.9% | | | | |
| |
| |
|
| Registered Investment Company; | | | | |
| Dreyfus Institutional Cash Advantage Fund | | | | |
| (cost $9,239,341) | | | | 9,239,341 c | | 9,239,341 |
| |
| |
| |
|
| |
| Total Investments (cost $176,256,670) | | 104.7% | | 197,075,196 |
| Liabilities, Less Cash and Receivables | | (4.7%) | | (8,897,186) |
| Net Assets | | | | 100.0% | | 188,178,010 |
| |
| ADR—American Depository Receipts | | | | |
| a | | Non-income producing security. | | | | | | |
| b | | All or a portion of these securities are on loan. At December 31, 2006, the total market value of the portfolio’s |
| | | securities on loan is $8,944,922 and the total market value of the collateral held by the portfolio is $9,239,341. |
| c | | Investment in affiliated money market mutual fund. | | | | |
| |
| |
| |
|
| |
| |
| |
| Portfolio Summary (Unaudited) † | | | | |
| | | | | Value (%) | | | | Value (%) |
| |
| |
| |
| |
|
| Information Technology | | 21.9 | | Money Market Investments | | 7.3 |
| Consumer Staples | | 13.7 | | Industrial | | 7.3 |
| Health Care | | 13.5 | | Energy | | 5.1 |
| Software | | 11.6 | | Exchange Traded Funds | | 4.6 |
| Financial | | 10.6 | | Materials | | .8 |
| Consumer Discretionary | | 8.3 | | | | 104.7 |
| |
| † | | Based on net assets. | | | | | | |
| See notes to financial statements. | | | | | | |
STATEMENT OF ASSETS AND LIABILITIES
December 31, 2006
| | | Cost | | Value |
| |
| |
|
| Assets ($): | | | | |
| Investments in securities—See Statement | | | | |
| of Investments (including securities on loan, | | |
| valued at $8,944,922)—Note 1(c): | | | | |
| Unaffiliated issuers | | 162,535,329 | | 183,353,855 |
| Affiliated issuers | | 13,721,341 | | 13,721,341 |
| Cash | | | | 13,178 |
| Receivable for investment securities sold | | | | 2,143,169 |
| Dividends and interest receivable | | | | 231,032 |
| Prepaid expenses | | | | 15,416 |
| | | | | 199,477,991 |
| |
| |
|
| Liabilities ($): | | | | |
| Due to The Dreyfus Corporation and affiliates—Note 3(b) | | 129,006 |
| Liability for securities on loan—Note 1(c) | | | | 9,239,341 |
| Payable for investment securities purchased | | 1,863,911 |
| Payable for shares of Beneficial Interest redeemed | | 11,716 |
| Accrued expenses | | | | 56,007 |
| | | | | 11,299,981 |
| |
| |
|
| Net Assets ($) | | | | 188,178,010 |
| |
| |
|
| Composition of Net Assets ($): | | | | |
| Paid-in capital | | | | 158,955,640 |
| Accumulated undistributed investment income—net | | 46,918 |
| Accumulated net realized gain (loss) on investments | | 8,356,926 |
| Accumulated net unrealized appreciation | | | | |
| (depreciation) on investments | | | | 20,818,526 |
| |
| |
|
| Net Assets ($) | | | | 188,178,010 |
| |
| |
|
| |
| |
| Net Asset Value Per Share | | | | |
| | | Initial Shares | | Service Shares |
| |
| |
|
| Net Assets ($) | | 168,965,139 | | 19,212,871 |
| Shares Outstanding | | 6,815,464 | | 774,839 |
| |
| |
|
| Net Asset Value Per Share ($) | | 24.79 | | 24.80 |
See notes to financial statements.
|
STATEMENT OF OPERATIONS
Year Ended December 31, 2006
|
| Investment Income ($): | | |
| Income: | | |
| Cash dividends (net of $22,714 foreign taxes withheld at source): | | |
| Unaffiliated issuers | | 2,926,773 |
| Affiliated issuers | | 142,277 |
| Income from securities lending | | 14,156 |
| Total Income | | 3,083,206 |
| Expenses: | | |
| Investment advisory fee—Note 3(a) | | 1,433,231 |
| Prospectus and shareholders’ reports | | 54,968 |
| Professional fees | | 48,693 |
| Distribution fees—Note 3(b) | | 48,615 |
| Trustees’ fees and expenses—Note 3(c) | | 20,746 |
| Custodian fees—Note 3(b) | | 18,452 |
| Shareholder servicing costs—Note 3(b) | | 6,501 |
| Loan commitment fees—Note 2 | | 1,448 |
| Miscellaneous | | 12,255 |
| Total Expenses | | 1,644,909 |
| Less—waiver of fees due to undertaking—Note 3(a) | | (17,831) |
| Less—expense reduction in custody fees | | |
| due to earnings credits—Note 1(c) | | (118) |
| Net Expenses | | 1,626,960 |
| Investment Income—Net | | 1,456,246 |
| |
|
| Realized and Unrealized Gain (Loss) on Investments—Note 4 ($): |
| Net realized gain (loss) on investments | | 28,379,489 |
| Net unrealized appreciation (depreciation) on investments | | (4,315,702) |
| Net Realized and Unrealized Gain (Loss) on Investments | | 24,063,787 |
| Net Increase in Net Assets Resulting from Operations | | 25,520,033 |
See notes to financial statements.
|
STATEMENT OF CHANGES IN NET ASSETS
| | | Year Ended December 31, |
| |
|
| | | 2006 | | 2005 |
| |
| |
|
| Operations ($): | | | | |
| Investment income—net | | 1,456,246 | | 2,863,598 |
| Net realized gain (loss) on investments | | 28,379,489 | | 19,846,942 |
| Net unrealized appreciation | | | | |
| (depreciation) on investments | | (4,315,702) | | (16,388,140) |
| Net Increase (Decrease) in Net Assets | | | | |
| Resulting from Operations | | 25,520,033 | | 6,322,400 |
| |
| |
|
| Dividends to Shareholders from ($): | | | | |
| Investment income—net: | | | | |
| Initial shares | | (1,339,148) | | (2,613,010) |
| Service shares | | (119,237) | | (245,151) |
| Total Dividends | | (1,458,385) | | (2,858,161) |
| |
| |
|
| Beneficial Interest Transactions ($): | | | | |
| Net proceeds from shares sold: | | | | |
| Initial shares | | 4,919,305 | | 5,508,762 |
| Service shares | | 674,062 | | 684,376 |
| Dividends reinvested: | | | | |
| Initial shares | | 1,339,148 | | 2,613,010 |
| Service shares | | 119,237 | | 245,151 |
| Cost of shares redeemed: | | | | |
| Initial shares | | (42,821,205) | | (47,764,428) |
| Service shares | | (4,257,500) | | (4,528,127) |
| Increase (Decrease) in Net Assets from | | | | |
| Beneficial Interest Transactions | | (40,026,953) | | (43,241,256) |
| Total Increase (Decrease) in Net Assets | | (15,965,305) | | (39,777,017) |
| |
| |
|
| Net Assets ($): | | | | |
| Beginning of Period | | 204,143,315 | | 243,920,332 |
| End of Period | | 188,178,010 | | 204,143,315 |
| Undistributed investment income—net | | 46,918 | | 49,057 |
STATEMENT OF CHANGES IN NET ASSETS (continued)
|
| | | Year Ended December 31, |
| |
|
| | | 2006 | | 2005 |
| |
| |
|
| Capital Share Transactions: | | | | |
| Initial Shares | | | | |
| Shares sold | | 213,279 | | 261,996 |
| Shares issued for dividends reinvested | | 58,910 | | 123,642 |
| Shares redeemed | | (1,884,013) | | (2,260,103) |
| Net Increase (Decrease) in Shares Outstanding | | (1,611,824) | | (1,874,465) |
| |
| |
|
| Service Shares | | | | |
| Shares sold | | 29,800 | | 32,737 |
| Shares issued for dividends reinvested | | 5,257 | | 11,596 |
| Shares redeemed | | (187,578) | | (213,741) |
| Net Increase (Decrease) in Shares Outstanding | | (152,521) | | (169,408) |
See notes to financial statements.
|
FINANCIAL HIGHLIGHTS
The following tables describe the performance for each share class for the fiscal periods indicated.All information (except portfolio turnover rate) reflects financial results for a single portfolio share. Total return shows how much your investment in the portfolio would have increased (or decreased) during each period, assuming you had reinvested all dividends and distributions.These figures have been derived from the portfolio’s financial statements.
| | | | | Year Ended December 31, | | |
| |
| |
| |
|
| Initial Shares | | 2006 | | 2005 | | 2004 | | 2003 | | 2002 |
| |
| |
| |
| |
| |
|
| Per Share Data ($): | | | | | | | | | | |
| Net asset value, beginning of period | | 21.82 | | 21.40 | | 20.16 | | 16.06 | | 21.65 |
| Investment Operations: | | | | | | | | | | |
| Investment income—net a | | .18 | | .28 | | .24 | | .14 | | .11 |
| Net realized and unrealized | | | | | | | | | | |
| gain (loss) on investments | | 2.97 | | .43 | | 1.25 | | 4.11 | | (5.59) |
| Total from Investment Operations | | 3.15 | | .71 | | 1.49 | | 4.25 | | (5.48) |
| Distributions: | | | | | | | | | | |
| Dividends from investment income—net | | (.18) | | (.29) | | (.25) | | (.15) | | (.11) |
| Net asset value, end of period | | 24.79 | | 21.82 | | 21.40 | | 20.16 | | 16.06 |
| |
| |
| |
| |
| |
|
| Total Return (%) | | 14.51 | | 3.35 | | 7.47 | | 26.57 | | (25.33) |
| |
| |
| |
| |
| |
|
| Ratios/Supplemental Data (%): | | | | | | | | | | |
| Ratio of total expenses | | | | | | | | | | |
| to average net assets | | .84 | | .81 | | .82 | | .82 | | .80 |
| Ratio of net expenses | | | | | | | | | | |
| to average net assets | | .83 | | .81 | | .82 | | .82 | | .80 |
| Ratio of net investment income | | | | | | | | | | |
| to average net assets | | .78 | | 1.33 | | 1.21 | | .81 | | .58 |
| Portfolio Turnover Rate | | 124.50 | | 65.91 | | 52.74 | | 40.68 | | 34.61 |
| |
| |
| |
| |
| |
|
| Net Assets, end of period ($ x 1,000) | | 168,965 | | 183,903 | | 220,447 | | 243,973 | | 226,548 |
| | a Based on average shares outstanding at each month end.
See notes to financial statements.
|
FINANCIAL HIGHLIGHTS (continued)
|
| | | | | Year Ended December 31, | | |
| |
| |
| |
|
| Service Shares | | 2006 | | 2005 | | 2004 | | 2003 | | 2002 |
| |
| |
| |
| |
| |
|
| Per Share Data ($): | | | | | | | | | | |
| Net asset value, beginning of period | | 21.83 | | 21.40 | | 20.15 | | 16.03 | | 21.61 |
| Investment Operations: | | | | | | | | | | |
| Investment income—net a | | .14 | | .24 | | .21 | | .11 | | .08 |
| Net realized and unrealized | | | | | | | | | | |
| gain (loss) on investments | | 2.97 | | .44 | | 1.24 | | 4.10 | | (5.58) |
| Total from Investment Operations | | 3.11 | | .68 | | 1.45 | | 4.21 | | (5.50) |
| Distributions: | | | | | | | | | | |
| Dividends from investment income—net | | (.14) | | (.25) | | (.20) | | (.09) | | (.08) |
| Net asset value, end of period | | 24.80 | | 21.83 | | 21.40 | | 20.15 | | 16.03 |
| |
| |
| |
| |
| |
|
| Total Return (%) | | 14.31 | | 3.21 | | 7.22 | | 26.36 | | (25.46) |
| |
| |
| |
| |
| |
|
| Ratios/Supplemental Data (%): | | | | | | | | | | |
| Ratio of total expenses | | | | | | | | | | |
| to average net assets | | 1.09 | | 1.07 | | 1.07 | | 1.07 | | 1.03 |
| Ratio of net expenses | | | | | | | | | | |
| to average net assets | | 1.00 | | 1.00 | | 1.00 | | 1.01 | | .98 |
| Ratio of net investment income | | | | | | | | | | |
| to average net assets | | .61 | | 1.14 | | 1.05 | | .63 | | .43 |
| Portfolio Turnover Rate | | 124.50 | | 65.91 | | 52.74 | | 40.68 | | 34.61 |
| |
| |
| |
| |
| |
|
| Net Assets, end of period ($ x 1,000) | | 19,213 | | 20,241 | | 23,473 | | 24,188 | | 20,388 |
| |
| a Based on average shares outstanding at each month end. | | | | | | | | |
| See notes to financial statements. | | | | | | | | | | |
NOTES TO FINANCIAL STATEMENTS
NOTE 1—Significant Accounting Policies:
Dreyfus Variable Investment Fund (the “fund”) is registered under the Investment Company Act of 1940, as amended (the “Act”), as an open-end management investment company, operating as a series company currently offering twelve series, including the Growth and Income Portfolio (the “portfolio”). The portfolio is only offered to separate accounts established by insurance companies to fund variable annuity contracts and variable life insurance policies. The portfolio is a non-diversified series. The portfolio’s investment objective is to provide long-term capital growth, current income and growth of income, consistent with reasonable investment risk. The Dreyfus Corporation (the “Manager”or “Dreyfus”) serves as the portfolio’s investment adviser.The Manager is a wholly-owned subsidiary of Mellon Financial Corporation (“Mellon Financial”).
On December 4, 2006, Mellon Financial and The Bank of New York Company, Inc. announced that they had entered into a definitive agreement to merge. The new company will be called The Bank of New York Mellon Corporation. As part of this transaction, Dreyfus would become a wholly-owned subsidiary of The Bank of New York Mellon Corporation.The transaction is subject to certain regulatory approvals and the approval of The Bank of New York Company, Inc.’s and Mellon Financial’s shareholders, as well as other customary conditions to closing. Subject to such approvals and the satisfaction of the other conditions, Mellon Financial and The Bank of New York Company, Inc. expect the transaction to be completed in the third quarter of 2007.
Dreyfus Service Corporation (the “Distributor”), a wholly-owned subsidiary of the Manager, is the distributor of the portfolio’s shares, which are sold without a sales charge.The portfolio is authorized to issue an unlimited number of $.001 par value shares of Beneficial Interest in each of the following classes of shares: Initial and Service. Each class of shares has identical rights and privileges, except with respect to the distribution plan and the expenses borne by each class and certain voting
NOTES TO FINANCIAL STATEMENTS (continued)
|
rights. Income, expenses (other than expenses attributable to a specific class), and realized and unrealized gains or losses on investments are allocated to each class of shares based on its relative net assets.
The fund accounts separately for the assets, liabilities and operations of each series. Expenses directly attributable to each series are charged to that series’ operations; expenses which are applicable to all series are allocated among them on a pro rata basis.
The portfolio’s financial statements are prepared in accordance with U.S. generally accepted accounting principles, which may require the use of management estimates and assumptions.Actual results could differ from those estimates.
The fund enters into contracts that contain a variety of indemnifica-tions.The portfolio’s maximum exposure under these arrangements is unknown. The portfolio does not anticipate recognizing any loss related to these arrangements.
(a) Portfolio valuation: Investments in securities are valued at the last sales price on the securities exchange or national securities market on which such securities are primarily traded. Securities listed on the National Market System for which market quotations are available are valued at the official closing price or, if there is no official closing price that day, at the last sale price. Securities not listed on an exchange or the national securities market, or securities for which there were no transactions, are valued at the average of the most recent bid and asked prices, except for open short positions, where the asked price is used for valuation purposes. Bid price is used when no asked price is available. Registered open-end investment companies that are not traded on an exchange are valued at their net asset value.When market quotations or official closing prices are not readily available, or are determined not to reflect accurately fair value, such as when the value of a security has been significantly affected by events after the close of the exchange or market on which the security is principally traded (for example, a foreign exchange or market), but before the portfolio calculates its net asset value, the portfolio may value these investments at fair value as
determined in accordance with the procedures approved by the Board of Trustees. Fair valuing of securities may be determined with the assistance of a pricing service using calculations based on indices of domestic securities and other appropriate indicators, such as prices of relevant ADR’s and futures contracts. For other securities that are fair valued by the Board of Trustees, certain factors may be considered such as: fundamental analytical data, the nature and duration of restrictions on disposition, an evaluation of the forces that influence the market in which the securities are purchased and sold, and public trading in similar securities of the issuer or comparable issuers. Financial futures are valued at the last sales price. Investments denominated in foreign currencies are translated to U.S. dollars at the prevailing rates of exchange. Forward currency exchange contracts are valued at the forward rate.
On September 20, 2006, the Financial Accounting Standards Board (FASB) released Statement of Financial Accounting Standards No. 157 “Fair Value Measurements” (“FAS 157”). FAS 157 establishes an authoritative definition of fair value, sets out a framework for measuring fair value, and requires additional disclosures about fair-value mea-surements.The application of FAS 157 is required for fiscal years beginning after November 15, 2007 and interim periods within those fiscal years. Management does not believe that the application of this standard will have a material impact on the financial statements of the portfolio.
(b) Foreign currency transactions: The portfolio does not isolate that portion of the results of operations resulting from changes in foreign exchange rates on investments from the fluctuations arising from changes in the market prices of securities held. Such fluctuations are included with the net realized and unrealized gain or loss on investments.
Net realized foreign exchange gains or losses arise from sales and maturities of short-term securities, sales of foreign currencies, currency gains or losses realized on securities transactions and the difference between the amounts of dividends, interest and foreign withholding taxes recorded on the portfolios’ books and the U.S. dollar equivalent of the amounts actually received or paid. Net unrealized
NOTES TO FINANCIAL STATEMENTS (continued)
|
foreign exchange gains and losses arise from changes in the value of assets and liabilities other than investments in securities, resulting from changes in exchange rates. Such gains and losses are included with net realized and unrealized gain or loss on investments.
(c) Securities transactions and investment income: Securities transactions are recorded on a trade date basis. Realized gain and loss from securities transactions are recorded on the identified cost basis. Dividend income is recognized on the ex-dividend date and interest income, including, where applicable, accretion of discount and amortization of premium on investments, is recognized on the accrual basis.
The portfolio has an arrangement with the custodian bank whereby the portfolio receives earnings credits from the custodian when positive cash balances are maintained, if any, which are used to offset custody fees. For financial reporting purposes, the portfolio includes net earnings credits as an expense offset in the Statement of Operations.
Pursuant to a securities lending agreement with Mellon Bank, N.A., an affiliate of the Manager, the portfolio may lend securities to qualified institutions. It is the portfolio’s policy, that at origination, all loans are secured by collateral of at least 102% of the value of U.S. securities loaned and 105% of the value of foreign securities loaned. It is the portfolio’s policy that collateral equivalent to at least 100% of the market value of securities on loan is maintained at all times. Cash collateral is invested in certain money market mutual funds managed by the Manager.The portfolio is entitled to receive all income on securities loaned, in addition to income earned as a result of the lending transaction.Although each security loaned is fully collateralized, the portfolio bears the risk of delay in recovery of, or loss of rights in, the securities loaned should a borrower fail to return the securities in a timely manner.
(d) Affiliated issuers: Investments in other investment companies advised by the Manager are defined as “affiliated” in the Act.
(e) Dividends to shareholders: Dividends are recorded on the ex-dividend date.The portfolio declares and pays dividends from invest-
ment income-net on a quarterly basis. Dividends from net realized capital gain, if any, are normally declared and paid annually, but the portfolio may make distributions on a more frequent basis to comply with the distribution requirements of the Internal Revenue Code of 1986, as amended (the “Code”).To the extent that net realized capital gain can be offset by capital loss carryovers, it is the policy of the portfolio not to distribute such gain. Income and capital gain distributions are determined in accordance with income tax regulations, which may differ from U.S. generally accepted accounting principles.
(f) Federal income taxes: It is the policy of the portfolio to continue to qualify as a regulated investment company, if such qualification is in the best interests of its shareholders, by complying with the applicable provisions of the Code and to make distributions of taxable income sufficient to relieve it from substantially all federal income and excise taxes.
On July 13, 2006, the FASB released FASB Interpretation No. 48 “Accounting for Uncertainty in Income Taxes” (FIN 48). FIN 48 provides guidance for how uncertain tax positions should be recognized, measured, presented and disclosed in the financial statements. FIN 48 requires the evaluation of tax positions taken or expected to be taken in the course of preparing the portfolio ‘s tax returns to determine whether the tax positions are “more-likely-than-not” of being sustained by the applicable tax authority. Tax positions not deemed to meet the more-likely-than-not threshold would be recorded as a tax benefit or expense in the current year.Adoption of FIN 48 is required for fiscal years beginning after December 15, 2006 and is to be applied to all open tax years as of the effective date. Management does not believe that the application of this standard will have a material impact on the financial statements of the portfolio.
At December 31, 2006, the components of accumulated earnings on a tax basis were as follows: undistributed ordinary income $46,918, undistributed capital gains $8,447,219 and unrealized appreciation $20,728,233.
NOTES TO FINANCIAL STATEMENTS (continued)
|
The tax character of distributions paid to shareholders during the fiscal periods ended December 31, 2006 and December 31, 2005 were as follows: ordinary income $1,458,385 and $2,858,161, respectively.
NOTE 2—Bank Line of Credit:
The portfolio participates with other Dreyfus-managed funds in a $350 million redemption credit facility (the “Facility”) to be utilized for temporary or emergency purposes, including the financing of redemptions. In connection therewith, the portfolio has agreed to pay commitment fees on its pro rata portion of the Facility. Interest is charged to the portfolio based on prevailing market rates in effect at the time of borrowing. During the period ended December 31, 2006, the portfolio did not borrow under the Facility.
NOTE 3—Investment Advisory Fee and Other Transactions With Affiliates:
(a) Pursuant to an Investment Advisory Agreement with the Manager, the investment advisory fee is computed at the annual rate of .75% of the value of the portfolios’ average daily net assets and is payable monthly.
The Manager has agreed, from January 1, 2006 to December 31, 2007 to waive receipt of its fees and/or assume the expenses of the portfolio so that the expenses of neither class, exclusive of taxes, brokerage fees, interest on borrowings, commitment fees and extraordinary expenses, exceed 1% of the value of the average daily net assets of their class. During the period ended December 31, 2006, the Manager waived receipt of fees of $17,831 pursuant to the undertaking.
(b) Under the Distribution Plan (the “Plan”) adopted pursuant to Rule 12b-1 under the Act, Service shares pay the Distributor for distributing their shares, for servicing and/or maintaining Service shares shareholder accounts and for advertising and marketing for Service shares.The Plan provides for payments to be made at an annual rate of .25% of the value of the Service shares’ average daily net assets. The
Distributor may make payments to Participating Insurance Companies and to brokers and dealers acting as principal underwriter for their variable insurance products. The fees payable under the Plan are payable without regard to actual expenses incurred. During the period ended December 31, 2006, Service shares were charged $48,615 pursuant to the Plan.
The portfolio compensates Dreyfus Transfer, Inc., a wholly-owned subsidiary of the Manager, under a transfer agency agreement for providing personnel and facilities to perform transfer agency services for the portfolio. During the period ended December 31, 2006, the portfolio was charged $407 pursuant to the transfer agency agreement.
The portfolio compensates Mellon Bank, N.A., an affiliate of the Manager, under a custody agreement for providing custodial services for the portfolio. During the period ended December 31, 2006, the portfolio was charged $18,452 pursuant to the custody agreement.
During the period ended December 31, 2006, the portfolio was charged $4,204 for services performed by the Chief Compliance Officer.
The components of Due to The Dreyfus Corporation and affiliates in the Statement of Assets and Liabilities consist of: investment advisory fees $120,894, chief compliance officer fees $2,044, Rule 12b-1 distribution plan fees $4,113, custodian fees $3,108 and transfer agency per account fees $68, which are offset against an expense reimbursement currently in effect in the amount of $1,221.
(c) Each Board member also serves as a Board member of other funds within the Dreyfus complex. Annual retainer fees and attendance fees are allocated to each fund based on net assets.
(d) Pursuant to an exemptive order from the SEC, the portfolio may invest its available cash balances in affiliated money market mutual funds. Management fees of the underlying money market mutual funds have been waived by the Manager.
NOTES TO FINANCIAL STATEMENTS (continued)
|
NOTE 4—Securities Transactions:
The aggregate amount of purchases and sales of investment securities, excluding short-term securities, during the period ended December 31, 2006, amounted to $235,013,989 and $276,919,700, respectively.
At December 31, 2006, the cost of investments for federal income tax purposes was $176,346,963; accordingly, accumulated net unrealized appreciation on investments was $20,728,233 consisting of $22,589,576 gross unrealized appreciation and $1,861,343 gross unrealized depreciation.
REPORT OF INDEPENDENT REGISTERED PUBLIC ACCOUNTING FIRM
Shareholders and Board of Trustees
Dreyfus Variable Investment Fund, Growth and Income Portfolio
We have audited the accompanying statements of assets and liabilities, including the statements of investments, of Dreyfus Variable Investment Fund, Growth and Income Portfolio (one of the series comprising the Dreyfus Variable Investment Fund) as of December 31, 2006 and the related statement of operations for the year then ended, the statement of changes in net assets for each of the two years in the period then ended, and financial highlights for each of the years indicated therein. These financial statements and financial highlights are the responsibility of the Fund’s management. Our responsibility is to express an opinion on these financial statements and financial highlights based on our audits.
We conducted our audits in accordance with the standards of the Public Company Accounting Oversight Board (United States).Those standards require that we plan and perform the audit to obtain reasonable assurance about whether the financial statements and financial highlights are free of material misstatement.We were not engaged to perform an audit of the Fund’s internal control over financial reporting. Our audits included consideration of internal control over financial reporting as a basis for designing audit procedures that are appropriate in the circumstances, but not for the purpose of expressing an opinion on the effectiveness of the Fund’s internal control over financial reporting. Accordingly, we express no such opinion. An audit also includes examining, on a test basis, evidence supporting the amounts and disclosures in the financial statements and the financial highlights assessing the accounting principles used and significant estimates made by management, and evaluating the overall financial statement presentation. Our procedures included confirmation of securities owned as of December 31, 2006 by correspondence with the custodian and others or by other appropriate auditing procedures where replies from others were not received.We believe that our audits provide a reasonable basis for our opinion.
In our opinion, the financial statements and financial highlights referred to above present fairly, in all material respects, the financial position of Dreyfus Variable Investment Fund, Growth and Income Portfolio at December 31, 2006, the results of its operations for the year then ended, the changes in its net assets for each of the two years in the period then ended, and the financial highlights for each of the indicated years, in conformity with U.S. generally accepted accounting principles.

| | New York, New York
February 6, 2007
|
IMPORTANT TAX INFORMATION (Unaudited)
For federal tax purposes, the portfolio hereby designates 100% of the ordinary dividends paid during the fiscal year ended December 31, 2006 as qualifying for the corporate dividends received deduction. Shareholders will receive notification in January 2007 of the percentage applicable to the preparation of their 2006 income tax returns.
PROXY RESULTS (Unaudited)
Dreyfus Variable Investment Fund held a special meeting of shareholders on June 29, 2006.The proposal considered at the meeting, and the results, are as follows:
| | | | | Shares | | |
| |
| |
| |
|
| | | Votes For | | | | Authority Withheld |
| |
| |
| |
|
| To elect additional Board Members: | | | | | | |
| Peggy C. Davis † | | 171,078,927 | | | | 7,687,714 |
| Joseph S. DiMartino | | 170,946,484 | | | | 7,820,156 |
| David P. Feldman | | 170,959,921 | | | | 7,806,720 |
| Ehud Houminer† | | 170,132,087 | | | | 8,634,554 |
| Gloria Messinger † | | 170,187,241 | | | | 8,579,400 |
| Anne Wexler † | | 170,212,607 | | | | 8,554,033 |
† Each new Board member’s term commenced on September 26, 2006.
In addition to Joseph S. DiMartino and David P. Feldman, James F. Henry, Dr. Paul A. Marks and Dr. Martin Peretz continue as Board members of the fund.
BOARD MEMBERS INFORMATION (Unaudited)
Joseph S. DiMartino (63)
Chairman of the Board (1995)
|
Principal Occupation During Past 5 Years:
• Corporate Director and Trustee
|
Other Board Memberships and Affiliations:
|
- The Muscular Dystrophy Association, Director
- Century Business Services, Inc., a provider of outsourcing functions for small and medium size companies, Director
- The Newark Group, a provider of a national market of paper recovery facilities, paperboard mills and paperboard converting plants, Director
- Sunair Services Corporation, engaging in the design, manufacture and sale of high frequency systems for long-range voice and data communications, as well as providing certain outdoor-related services to homes and businesses, Director
No. of Portfolios for which Board Member Serves: 190
———————
Peggy C. Davis (63) Board Member (2006)
Principal Occupation During Past 5 Years:
|
- Shad Professor of Law, New York University School of Law (1983-present)
- Writer and teacher in the fields of evidence, constitutional theory, family law, social sciences and the law, legal process and professional methodology and training
No. of Portfolios for which Board Member Serves: 80
|
David P. Feldman (67)
Board Member (1994)
|
Principal Occupation During Past 5 Years:
• Corporate Director and Trustee
|
Other Board Memberships and Affiliations:
|
- BBH Mutual Funds Group (11 funds), Director
- The Jeffrey Company, a private investment company, Director
- QMED, a medical device company, Director
No. of Portfolios for which Board Member Serves: 57
|
BOARD MEMBERS INFORMATION (Unaudited) (continued)
James F. Henry (76)
Board Member (1990)
|
Principal Occupation During Past 5 Years:
|
- President,The International Institute for Conflict Prevention and Resolution, a non-profit organization principally engaged in the development of alternatives to business litigation (Retired 2003)
- Advisor to The Elaw Forum, a consultant on managing corporate legal costs
- Advisor to John Jay Homestead (the restored home of the first U.S. Chief Justice)
- Individual Trustee of several trusts
Other Board Memberships and Affiliations:
|
- Director, advisor and mediator involved in several non-profit organizations, primarily engaged in domestic and international dispute resolution, and historic preservation
No. of Portfolios for which Board Member Serves: 48
|
———————
Ehud Houminer (66) Board Member (2006)
Principal Occupation During Past 5 Years:
• Executive-in-Residence at the Columbia Business School, Columbia University
Other Board Memberships and Affiliations:
|
- Avnet Inc., an electronics distributor, Director
- International Advisory Board to the MBA Program School of Management, Ben Gurion University, Chairman
- Explore Charter School, Brooklyn, NY, Chairman
No. of Portfolios for which Board Member Serves: 78
———————
Gloria Messinger (77) Board Member (2006)
Principal Occupation During Past 5 Years:
|
- Arbitrator for American Arbitration Association and National Association of Securities Dealers, Inc.
- Consultant in Intellectual Property
Other Board Memberships and Affiliations:
|
- Theater for a New Audience, Inc., Director
- Brooklyn Philharmonic, Director
No. of Portfolios for which Board Member Serves: 48
|
Dr. Martin Peretz (67)
Board Member (1990)
|
Principal Occupation During Past 5 Years:
|
- Editor-in-Chief of The New Republic Magazine
- Lecturer in Social Studies at Harvard University (1965-2002)
- Director of TheStreet.com, a financial information service on the web
Other Board Memberships and Affiliations:
|
- American Council of Trustees and Alumni, Director
- Pershing Square Capital Management, Adviser
- Montefiore Ventures, General Partner
- Harvard Center for Blood Research,Trustee
- Bard College,Trustee
- Board of Overseers of YIVO Institute for Jewish Research, Chairman
No. of Portfolios for which Board Member Serves: 48
———————
Anne Wexler (76) Board Member (2006)
Principal Occupation During Past 5 Years:
|
- Chairman of the Wexler & Walker Public Policy Associates, consultants specializing in government relations and public affairs
Other Board Memberships and Affiliations:
|
- Wilshire Mutual Funds (5 funds), Director
- Methanex Corporation, a methanol producing company, Director
- Member of the Council of Foreign Relations
- Member of the National Park Foundation
No. of Portfolios for which Board Member Serves: 57
|
Once elected all Board Members serve for an indefinite term, but achieve Emeritus status on December 31st of the calendar year in which the Board Member reaches age 80.The address of the Board Members and Officers is in c/o The Dreyfus Corporation, 200 Park Avenue, New York, New York 10166. Additional information about the Board Members is available in the fund’s Statement of Additional Information which can be obtained from Dreyfus free of charge by calling this toll free number: 1-800-554-4611.
John M. Fraser, Jr., Emeritus Board Member Rosalind G. Jacobs, Emeritus Board Member Dr. Paul A. Marks, Emeritus Board Member
OFFICERS OF THE FUND (Unaudited)
J. DAVID OFFICER, President since December 2006.
Chief Operating Officer,Vice Chairman and a director of the Manager, and an officer of 90 investment companies (comprised of 190 portfolios) managed by the Manager. He is 58 years old and has been an employee of the Manager since April 1, 1998.
MARK N. JACOBS, Vice President since March 2000.
Executive Vice President, Secretary and General Counsel of the Manager, and an officer of 91 investment companies (comprised of 206 portfolios) managed by the Manager. He is 60 years old and has been an employee of the Manager since June 1977.
MICHAEL A. ROSENBERG, Vice President and Secretary since August 2005.
Associate General Counsel of the Manager, and an officer of 91 investment companies (comprised of 206 portfolios) managed by the Manager. He is 46 years old and has been an employee of the Manager since October 1991.
JAMES BITETTO, Vice President and Assistant Secretary since August 2005.
Associate General Counsel and Assistant Secretary of the Manager, and an officer of 91 investment companies (comprised of 206 portfolios) managed by the Manager. He is 40 years old and has been an employee of the Manager since December 1996.
JONI LACKS CHARATAN, Vice President and Assistant Secretary since August 2005.
Associate General Counsel of the Manager, and an officer of 91 investment companies (comprised of 206 portfolios) managed by the Manager. She is 51 years old and has been an employee of the Manager since October 1988.
JOSEPH M. CHIOFFI, Vice President and Assistant Secretary since August 2005.
Associate General Counsel of the Manager, and an officer of 91 investment companies (comprised of 206 portfolios) managed by the Manager. He is 45 years old and has been an employee of the Manager since June 2000.
JANETTE E. FARRAGHER, Vice President and Assistant Secretary since August 2005.
Associate General Counsel of the Manager, and an officer of 91 investment companies (comprised of 206 portfolios) managed by the Manager. She is 44 years old and has been an employee of the Manager since February 1984.
JOHN B. HAMMALIAN, Vice President and Assistant Secretary since August 2005.
Associate General Counsel of the Manager, and an officer of 91 investment companies (comprised of 206 portfolios) managed by the Manager. He is 43 years old and has been an employee of the Manager since February 1991.
ROBERT R. MULLERY, Vice President and Assistant Secretary since August 2005.
Associate General Counsel of the Manager, and an officer of 91 investment companies (comprised of 206 portfolios) managed by the Manager. He is 54 years old and has been an employee of the Manager since May 1986.
JEFF PRUSNOFSKY, Vice President and Assistant Secretary since August 2005.
Associate General Counsel of the Manager, and an officer of 91 investment companies (comprised of 206 portfolios) managed by the Manager. He is 41 years old and has been an employee of the Manager since October 1990.
JAMES WINDELS, Treasurer since November 2001.
Director – Mutual Fund Accounting of the Manager, and an officer of 91 investment companies (comprised of 206 portfolios) managed by the Manager. He is 48 years old and has been an employee of the Manager since April 1985.
ERIK D. NAVILOFF, Assistant Treasurer since December 2002.
Senior Accounting Manager – Taxable Fixed Income Funds of the Manager, and an officer of 91 investment companies (comprised of 206 portfolios) managed by the Manager. He is 38 years old and has been an employee of the Manager since November 1992.
ROBERT ROBOL, Assistant Treasurer since August 2003.
Senior Accounting Manager – Money Market and Municipal Bond Funds of the Manager, and an officer of 91 investment companies (comprised of 206 portfolios) managed by the Manager. He is 42 years old and has been an employee of the Manager since October 1988.
ROBERT SVAGNA, Assistant Treasurer since December 2002.
Senior Accounting Manager – Equity Funds of the Manager, and an officer of 91 investment companies (comprised of 206 portfolios) managed by the Manager. He is 39 years old and has been an employee of the Manager since November 1990.
GAVIN C. REILLY, Assistant Treasurer since December 2005.
Tax Manager of the Investment Accounting and Support Department of the Manager, and an officer of 91 investment companies (comprised of 206 portfolios) managed by the Manager. He is 38 years old and has been an employee of the Manager since April 1991.
JOSEPH W. CONNOLLY, Chief Compliance Officer since October 2004.
Chief Compliance Officer of the Manager and The Dreyfus Family of Funds (91 investment companies, comprised of 206 portfolios). From November 2001 through March 2004, Mr. Connolly was first Vice-President, Mutual Fund Servicing for Mellon Global Securities Services. In that capacity, Mr. Connolly was responsible for managing Mellon’s Custody, Fund Accounting and Fund Administration services to third-party mutual fund clients. He is 49 years old and has served in various capacities with the Manager since 1980, including manager of the firm’s Fund Accounting Department from 1997 through October 2001.
WILLIAM GERMENIS, Anti-Money Laundering Compliance Officer since September 2002.
Vice President and Anti-Money Laundering Compliance Officer of the Distributor, and the Anti-Money Laundering Compliance Officer of 87 investment companies (comprised of 202 portfolios) managed by the Manager. He is 36 years old and has been an employee of the Distributor since October 1998.
| For More | | Information |
| |
|
| |
| Dreyfus Variable | | Transfer Agent & |
| Investment Fund, | | Dividend Disbursing Agent |
| Growth and Income Portfolio |
| | | Dreyfus Transfer, Inc. |
| 200 Park Avenue | | |
| | | 200 Park Avenue |
| New York, NY 10166 | | |
| | | New York, NY 10166 |
| |
| Investment Adviser | | Distributor |
| The Dreyfus Corporation | | |
| | | Dreyfus Service Corporation |
| 200 Park Avenue | | |
| | | 200 Park Avenue |
| New York, NY 10166 | | |
| | | New York, NY 10166 |
| Custodian | | |
| Mellon Bank, N.A. | | |
| One Mellon Bank Center | | |
| Pittsburgh, PA 15258 | | |
| Telephone 1-800-554-4611 or 516-338-3300 |
| Mail | | The Dreyfus Family of Funds, 144 Glenn Curtiss Boulevard, Uniondale, NY 11556-0144 |
| | | Attn: Investments Division |
The portfolio files its complete schedule of portfolio holdings with the Securities and Exchange Commission (“SEC”) for the first and third quarters of each fiscal year on Form N-Q. The portfolio’s Forms N-Q are available on the SEC’s website at http://www.sec.gov and may be reviewed and copied at the SEC’s Public Reference Room in Washington, DC. Information on the operation of the Public Reference Room may be obtained by calling 1-202-551-8090.
A description of the policies and procedures that the portfolio uses to determine how to vote proxies relating to portfolio securities, and information regarding how the portfolio voted these proxies for the 12-month period ended June 30, 2006, is available at http://www.dreyfus.com and on the SEC’s website at http://www.sec.gov. The description of the policies and procedures is also available without charge, upon request, by calling 1-800-645-6561.

| Dreyfus Variable |
| Investment Fund, |
| International |
| Equity Portfolio |
The views expressed in this report reflect those of the portfolio manager only through the end of the period covered and do not necessarily represent the views of Dreyfus or any other person in the Dreyfus organization.Any such views are subject to change at any time based upon market or other conditions and Dreyfus disclaims any responsibility to update such views. These views may not be relied on as investment advice and, because investment decisions for a Dreyfus portfolio are based on numerous factors, may not be relied on as an indication of trading intent on behalf of any Dreyfus portfolio.
Not FDIC-Insured • Not Bank-Guaranteed • May Lose Value
| | | Contents |
| |
| | | T H E P O R T F O L I O |
| |
|
| 2 | | A Letter from the CEO |
| 3 | | Discussion of Performance |
| 6 | | Portfolio Performance |
| 8 | | Understanding Your Portfolio’s Expenses |
| 8 | | Comparing Your Portfolio’s Expenses |
| | | With Those of Other Funds |
| 9 | | Statement of Investments |
| 14 | | Statement of Assets and Liabilities |
| 15 | | Statement of Operations |
| 16 | | Statement of Changes in Net Assets |
| 18 | | Financial Highlights |
| 20 | | Notes to Financial Statements |
| 28 | | Report of Independent Registered |
| | | Public Accounting Firm |
| 29 | | Important Tax Information |
| 29 | | Proxy Results |
| 30 | | Board Members Information |
| 33 | | Officers of the Fund |
| | | F O R M O R E I N F O R M AT I O N |
| |
|
| | | Back Cover |
Dreyfus Variable Investment Fund,
International Equity Portfolio
|
The Portfolio

A L E T T E R F R O M T H E C E O
Dear Shareholder:
We are pleased to present this annual report for Dreyfus Variable Investment Fund, International Equity Portfolio, covering the 12-month period from January 1, 2006, through December 31, 2006.
2006 proved to be a good year for the financial markets, with most economic sectors and geographic regions of the global equity markets generating strong returns.A number of positive factors contributed to gains in international developed and developing markets, including an expanding global economy, rising commodity prices, financial reforms in key emerging markets, falling trade barriers, rising standards of living and robust corporate profits.
In our analysis, 2006 provided an excellent reminder of the need for a long-term investment perspective. Adopting too short a time frame proved costly for some investors last year, as chasing recent winners sometimes meant buying the next month’s losers. Indeed, history shows that reacting to near-term developments with extreme shifts in strategy rarely is the right decision.We believe that a better course of action is to set a portfolio mix to meet future goals, while attempting to ignore short term market fluctuations in favor of a longer-term view.
For information about how the portfolio performed during the reporting period, as well as market perspectives, we have provided a Discussion of Performance given by the portfolio manager.
Thank you for your continued confidence and support.We wish you good health and prosperity in 2007.
Thomas F. Eggers
Chief Executive Officer
The Dreyfus Corporation
January 16, 2007
|

D I S C U S S I O N O F P E R F O R M A N C E
Paul Butler, Portfolio Manager
Newton Capital Management Limited, Sub-Investment Adviser
How did Dreyfus Variable Investment Fund, International Equity Portfolio perform relative to its benchmark?
For the 12-month period ended December 31, 2006, the portfolio produced total returns of 23.31% for its Initial shares and 23.06% for its Service shares.1This compares with a 26.34% total return produced by the portfolio’s benchmark, the Morgan Stanley Capital International Europe, Australasia, Far East Index (“MSCI EAFE Index”), for the same period.2
International stock markets advanced strongly in 2006 on the strength of robust global economic growth and a surge of mergers-and-acquisitions (“M&A”) activity in Europe.The portfolio participated in most of the market’s gains, but returns fell short of the benchmark as we positioned the portfolio for certain economic and market trends that proved to be stronger or weaker than expected.
What is the portfolio’s investment approach?
The portfolio seeks capital growth by investing primarily in growth stocks of foreign companies.When choosing stocks, we consider global economic variables, such as gross domestic product, inflation and interest rates; investment themes, such as new technologies and globalization; the relative values of equities, bonds and cash; and long-term trends in currency movements.Within markets and sectors determined to be relatively attractive, we seek what we believe are attractively priced companies that possess a sustainable competitive advantage in their market or sector.We generally will sell securities when themes or strategies change, when we determine that the company’s prospects have changed, or when a stock becomes fully valued by the market.
What other factors influenced the portfolio’s performance?
Global economic growth remained strong during 2006, helping to support business conditions across most geographic regions and industry groups. The emerging markets continued to attract investment capital in the wake of widespread economic and fiscal reforms. In Europe,
| | T h e P o r t f o l i o 3
|
D I S C U S S I O N O F P E R F O R M A N C E (continued)
recovering economies and higher levels of M&A activity fueled rising equities markets. Conversely, Japan continued to fight its way out of a deflationary spiral, and its stock market generally lagged global averages.
The portfolio’s holdings benefited to a substantial degree in this generally favorable market environment. The portfolio’s investments in information technology companies fared particularly well, supported by rebounds in stocks rallying from low valuations, such as enterprise software provider SAP and South Korean electronics giant Samsung Electronics.Telecommunications companies Alcatel in France, Cable & Wireless in the United Kingdom and Telstra in Australia gained value due to a cross-border merger, the end of a rival’s U.K. broadband monopoly and corporate restructuring, respectively.
From a regional perspective, a number of Brazilian companies made substantially positive contributions to performance, including railroad operator All America Latina Logistica, cosmetics company Natura Cosmeticos and oil producer Petroleo Brasileiro. In the United Kingdom, British American Tobacco, which was sold during the reporting period, and Imperial Tobacco gained ground due to M&A activity and growing tobacco consumption in emerging markets.The portfolio’s emphasis on companies in Germany gained value as the nation’s economy began to recover after years of stagnation. Finally, wireless services provider Vodafone Group, one of the largest individual components of the MSCI EAFE Index, saw its share price rise after announcing a dividend increase and a share buyback program.
However, returns in other areas lagged the benchmark, primarily because we had positioned the portfolio for economic conditions that proved to be stronger or weaker than expected. For example, we had anticipated further weakness in the U.S. dollar relative to most major currencies, but the dollar strengthened over the second half of the year as expectations of a U.S. rate reduction diminished.We had expected a rebound in energy commodity prices in the fourth quarter after oil prices retreated sharply from record highs set in the summer, but energy prices stayed relatively low due to slackening demand. Consumer spending remained relatively robust despite higher interest rates and energy prices, and the portfolio missed part of the rally in retailers and other consumer-oriented stocks over the second half of the year.
The portfolio’s returns also were hindered somewhat by regional developments. Some of the portfolio’s holdings in the health care area lagged market averages when the sector sold off after the U.S. Congressional elections. Stock prices in Thailand suffered in the wake of a military coup and the adoption of measures, later rescinded, that were considered unfriendly to foreign investors. In Japan, a weak yen hurt financial stocks, an area of emphasis for the portfolio. Finally, we maintained relatively light exposure to the United Kingdom, where a surprisingly strong currency supported stock prices.
What is the portfolio’s current strategy?
As economic, geopolitical and market conditions evolved, we repositioned the portfolio to give greater emphasis to information technology stocks and consumer staples companies, but less exposure to energy companies and stocks that had appreciated to fuller valuations.These changes were designed, in part, to protect the portfolio from slowing economic growth in many developed markets while positioning it potentially to participate in continued strength in certain emerging markets.
| | | Investing in foreign companies involves special risks, including changes in currency rates, |
| | | political, economic and social instability, a lack of comprehensive company information, |
| | | differing auditing and legal standards and less market liquidity. An investment in this |
| | | portfolio should be considered only as a supplement to an overall investment program. |
| | | The portfolio is only available as a funding vehicle under variable life insurance policies or variable |
| | | annuity contracts issued by insurance companies. Individuals may not purchase shares of the |
| | | portfolio directly. A variable annuity is an insurance contract issued by an insurance company that |
| | | enables investors to accumulate assets on a tax-deferred basis for retirement or other long-term |
| | | goals.The investment objective and policies of Dreyfus Variable Investment Fund, International |
| | | Equity Portfolio made available through insurance products may be similar to other |
| | | funds/portfolios managed or advised by Dreyfus. However, the investment results of the portfolio |
| | | may be higher or lower than, and may not be comparable to, those of any other Dreyfus |
| | | fund/portfolio. |
| 1 | | Total return includes reinvestment of dividends and any capital gains paid. Past performance is no |
| | | guarantee of future results. Share price and investment return fluctuate such that upon redemption, |
| | | portfolio shares may be worth more or less than their original cost.The portfolio’s performance does |
| | | not reflect the deduction of additional charges and expenses imposed in connection with investing |
| | | in variable insurance contracts, which will reduce returns. |
| 2 | | SOURCE: LIPPER INC. — Reflects reinvestment of net dividends and, where applicable, |
| | | capital gain distributions.The Morgan Stanley Capital International Europe, Australasia, Far |
| | | East (MSCI EAFE) Index is an unmanaged index composed of a sample of companies |
| | | representative of the market structure of European and Pacific Basin countries. |
T h e P o r t f o l i o 5
P O R T F O L I O P E R F O R M A N C E
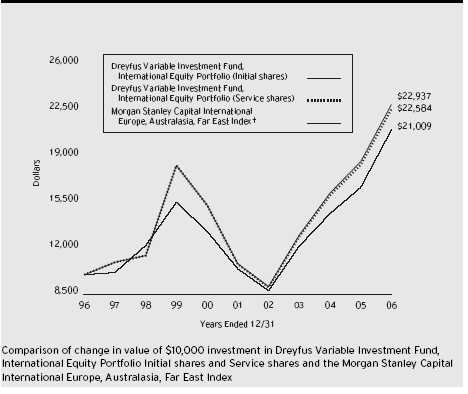
| Average Annual Total Returns | | as of 12/31/06 | | | | | | |
| | | | | 1 Year | | 5 Years | | 10 Years |
| |
| |
| |
| |
|
| Initial shares | | | | 23.31% | | 16.19% | | 8.66% |
| Service shares | | | | 23.06% | | 15.88% | | 8.49% |
| The data for Service shares includes the results of Initial shares for the period prior to December 31, 2000 |
| (inception date of Service shares). Actual Service shares’ average annual total return and hypothetical growth |
| results would have been lower. See notes below. |
| † Source: Lipper Inc. |
| Past performance is not predictive of future performance.The portfolio’s performance shown in the graph and table does not |
| reflect the deduction of taxes that a shareholder would pay on portfolio distributions or the redemption of portfolio shares. |
| The portfolio’s performance does not reflect the deduction of additional charges and expenses imposed in |
| connection with investing in variable insurance contracts which will reduce returns. |
| The above graph compares a $10,000 investment made in Initial and Service shares of Dreyfus Variable Investment |
| Fund, International Equity Portfolio on 12/31/96 to a $10,000 investment made in the Morgan Stanley Capital |
| International Europe, Australasia, Far East Index (the “Index”) on that date. |
6
The portfolio’s Initial shares are not subject to a Rule 12b-1 fee.The portfolio’s Service shares are subject to a 0.25% annual Rule 12b-1 fee.The performance figures for Service shares reflect the performance of the portfolio’s Initial shares from their inception date through December 30, 2000, and the performance of the portfolio’s Service shares from December 31, 2000 (inception date of Service shares) to December 31, 2006 (blended performance figures).The blended performance figures have not been adjusted to reflect the higher operating expenses of the Service shares. If these expenses had been reflected, the blended performance figures would have been lower. All dividends and capital gain distributions are reinvested.
The portfolio’s performance shown in the line graph takes into account all applicable portfolio fees and expenses.The Index is an unmanaged index composed of a sample of companies representative of the market structure of European and Pacific Basin countries and includes net dividends reinvested.The Index does not take into account charges, fees and other expenses. Further information relating to portfolio performance, including expense reimbursements, if applicable, is contained in the Financial Highlights section of the prospectus and elsewhere in this report.
| | T h e P o r t f o l i o 7
|
U N D E R S TA N D I N G Y O U R
P O R T F O L I O ’ S E X P E N S E S ( U n a u d i t e d )
As a mutual fund investor,you pay ongoing expenses,such as management fees and other expenses.Using the information below, you can estimate how these expenses affect your investment and compare them with the expenses of other funds.You also may pay one-time transaction expenses, including sales charges (loads) and redemption fees, which are not shown in this section and would have resulted in higher total expenses. For more information, see your portfolio’s prospectus or talk to your financial adviser.
Review your portfolio’s expenses
|
The table below shows the expenses you would have paid on a $1,000 investment in Dreyfus Variable Investment Fund, International Equity Portfolio from July 1, 2006 to December 31, 2006. It also shows how much a $1,000 investment would be worth at the close of the period, assuming actual returns and expenses.
| Expenses and Value of a $1,000 Investment | | |
| assuming actual returns for the six months ended December 31, 2006 |
| | | Initial Shares | | Service Shares |
| |
| |
|
| Expenses paid per $1,000 † | | $ 5.16 | | $ 6.44 |
| Ending value (after expenses) | | $1,131.30 | | $1,129.60 |
C O M P A R I N G Y O U R P O R T F O L I O ’ S E X P E N S E S W I T H T H O S E O F O T H E R F U N D S ( U n a u d i t e d )
Using the SEC’s method to compare expenses
The Securities and Exchange Commission (SEC) has established guidelines to help investors assess fund expenses. Per these guidelines, the table below shows your portfolio’s expenses based on a $1,000 investment, assuming a hypothetical 5% annualized return. You can use this information to compare the ongoing expenses (but not transaction expenses or total cost) of investing in the portfolio with those of other funds. All mutual fund shareholder reports will provide this information to help you make this comparison. Please note that you cannot use this information to estimate your actual ending account balance and expenses paid during the period.
Expenses and Value of a $1,000 Investment assuming a hypothetical 5% annualized return for the six months ended December 31, 2006
| | | Initial Shares | | Service Shares |
| |
| |
|
| Expenses paid per $1,000 † | | $ 4.89 | | $ 6.11 |
| Ending value (after expenses) | | $1,020.37 | | $1,019.16 |
† Expenses are equal to the portfolio’s annualized expense ratio of .96% for Initial shares and 1.20% for Service shares; multiplied by the average account value over the period, multiplied by 184/365 (to reflect the one-half year period).
| S TAT E M E N T O F I N V E S T M E N T S | | |
| D e c e m b e r 3 1 , 2 0 0 6 | | | | |
| |
| |
|
| |
| |
| |
| |
| Common Stocks—97.4% | | Shares | | Value ($) |
| |
| |
|
| Australia—2.9% | | | | |
| ABC Learning Centres | | 89,200 | | 591,557 |
| Telstra | | 219,322 | | 716,861 |
| Telstra (Installment Receipts) | | 109,661 a | | 232,893 |
| Transurban Group | | 79,513 | | 478,349 |
| | | | | 2,019,660 |
| Belgium—.9% | | | | |
| KBC Groep | | 5,090 | | 623,987 |
| Brazil—6.7% | | | | |
| All America Latina Logistica (Units) | | 101,237 | | 1,051,253 |
| Cia de Bebidas das Americas (AmBev), ADR (Preferred) | | 13,275 | | 647,820 |
| Diagnosticos da America | | 32,254 a | | 689,646 |
| Gafisa | | 38,098 a | | 569,953 |
| Natura Cosmeticos | | 56,500 | | 797,881 |
| Petroleo Brasileiro, ADR (Preferred) | | 9,595 | | 890,032 |
| | | | | 4,646,585 |
| Canada—.4% | | | | |
| Oncolytics Biotech | | 151,225 a | | 310,132 |
| Colombia—.7% | | | | |
| Suramericana de Inversiones | | 49,743 | | 454,844 |
| Finland—.7% | | | | |
| Elisa, Cl. A | | 16,773 | | 459,273 |
| France—8.4% | | | | |
| Alcatel-Lucent | | 69,037 | | 993,003 |
| AXA | | 10,055 | | 406,947 |
| L’Oreal | | 6,356 | | 636,602 |
| Sanofi-Aventis | | 12,996 | | 1,199,609 |
| Societe Generale | | 7,910 | | 1,342,331 |
| Veolia Environnement | | 5,038 | | 388,252 |
| Vivendi | | 21,426 | | 837,186 |
| | | | | 5,803,930 |
| Germany—12.1% | | | | |
| Allianz | | 4,026 | | 822,992 |
| Comdirect Bank | | 48,957 | | 596,292 |
| Deutsche Boerse | | 6,037 | | 1,110,679 |
| Deutsche Post | | 17,238 | | 520,912 |
| Deutsche Postbank | | 10,365 | | 874,960 |
T h e P o r t f o l i o 9
| | S TAT E M E N T O F I N V E S T M E N T S (continued)
|
| Common Stocks (continued) | | Shares | | Value ($) |
| |
| |
|
| Germany (continued) | | | | |
| Deutsche Wohnen | | 11,364 | | 727,003 |
| E.ON | | 7,618 | | 1,038,345 |
| K+S | | 3,931 | | 426,400 |
| Praktiker Bau-und | | | | |
| Heimwerkermaerkte Holding, Cl. A | | 21,310 | | 761,508 |
| SAP | | 21,124 | | 1,122,257 |
| Symrise | | 13,850 a | | 357,488 |
| | | | | 8,358,836 |
| Hong Kong—2.5% | | | | |
| Esprit Holdings | | 67,000 | | 749,852 |
| Shanghai Real Estate | | 2,786,000 | | 963,531 |
| | | | | 1,713,383 |
| India—.3% | | | | |
| Reliance Capital, GDR | | 830 a,b | | 11,409 |
| Reliance Communications, GDR | | 16,612 a,c | | 165,289 |
| Reliance Energy, GDR | | 415 a,c | | 14,940 |
| Reliance Natural Resources, GDR | | 8,306 a,c | | 7,808 |
| | | | | 199,446 |
| Indonesia—1.4% | | | | |
| Astra International | | 273,500 | | 477,450 |
| Bank Central Asia | | 900,500 | | 520,665 |
| | | | | 998,115 |
| Ireland—1.1% | | | | |
| Irish Life & Permanent | | 27,050 | | 746,029 |
| Italy—1.0% | | | | |
| UniCredito Italiano | | 79,585 | | 697,335 |
| Japan—12.6% | | | | |
| Canon | | 15,100 | | 849,918 |
| Daimaru | | 46,000 | | 623,329 |
| Japan Tobacco | | 172 | | 830,848 |
| Kao | | 17,000 | | 458,437 |
| Mitsubishi UFJ Financial Group | | 55 | | 679,212 |
| Mizuho Financial Group | | 85 | | 606,964 |
| Murata Manufacturing | | 6,800 | | 459,865 |
| Nikko Cordial | | 71,500 | | 819,906 |
| NSD | | 14,400 | | 457,277 |
10
| Common Stocks (continued) | | Shares | | | | Value ($) |
| |
| |
| |
|
| Japan (continued) | | | | | | |
| NTT Data | | 99 | | | | 495,686 |
| Toyota Motor | | 25,300 | | | | 1,691,839 |
| Yamada Denki | | 9,060 | | | | 768,732 |
| | | | | | | 8,742,013 |
| Kazakhstan—1.1% | | | | | | |
| Kazkimmertsbank, GDR | | 32,069a | | | | 740,794 |
| Malaysia—1.4% | | | | | | |
| AMMB Holdings | | 440,300 | | | | 396,644 |
| Bursa Malaysia | | 250,000 | | | | 570,113 |
| | | | | | | 966,757 |
| Mexico—.2% | | | | | | |
| Grupo FAMSA, Cl. A | | 28,500 a | | | | 127,951 |
| Netherlands—4.0% | | | | | | |
| ING Groep | | 8,908 | | | | 394,850 |
| Koninklijke Philips Electronics | | 14,242 | | | | 536,937 |
| Reed Elsevier | | 49,204 | | | | 838,890 |
| Royal Numico | | 18,767 | | | | 1,009,171 |
| | | | | | | 2,779,848 |
| Russia—2.3% | | | | | | |
| Gazprom, ADR | | 9,070 | | | | 417,220 |
| LUKOIL, ADR | | 3,121 | | | | 272,775 |
| Sistema JSFC, GDR | | 21,932 | | | | 701,824 |
| Sistema-Hals, GDR | | 15,600a | | | | 210,600 |
| | | | | | | 1,602,419 |
| Singapore—2.4% | | | | | | |
| DBS Group Holdings | | 50,000 | | | | 736,492 |
| Singapore Airlines | | 81,000 | | | | 923,874 |
| | | | | | | 1,660,366 |
| South Africa—.8% | | | | | | |
| MTN Group | | 48,300 | | | | 587,772 |
| South Korea—2.9% | | | | | | |
| Hana Financial Group | | 10,290 | | | | 541,055 |
| Lotte Shopping | | 478a | | | | 198,396 |
| Samsung Electronics, GDR (Common) | | 2,096c | | | | 689,584 |
| Samsung Fire & Marine Insurance | | 3,150 | | | | 547,016 |
| | | | | | | 1,976,051 |
| | T h e P o r t f o l i o 11
|
| | S TAT E M E N T O F I N V E S T M E N T S (continued)
|
| Common Stocks (continued) | | Shares | | Value ($) |
| |
| |
|
| Sweden—3.1% | | | | |
| Nordea Bank | | 34,726 | | 534,948 |
| Skandinaviska Enskilda Banken, Cl. A | | 16,800 | | 533,548 |
| Telefonaktiebolaget LM Ericsson, Cl. B | | 274,317 | | 1,107,522 |
| | | | | 2,176,018 |
| Switzerland—10.1% | | | | |
| Compagnie Financiere Richemont, Cl. A | | 9,764 | | 568,746 |
| Nestle | | 4,043 | | 1,436,229 |
| Nobel Biocare Holding | | 1,781 | | 526,381 |
| Novartis | | 24,213 | | 1,395,490 |
| Roche Holding | | 7,898 | | 1,415,795 |
| Syngenta | | 2,951 a | | 548,849 |
| Synthes | | 4,254 | | 507,102 |
| UBS | | 9,982 | | 606,421 |
| | | | | 7,005,013 |
| Taiwan—.7% | | | | |
| Fubon Financial Holding, GDR | | 56,837 | | 522,900 |
| Thailand—2.1% | | | | |
| Advanced Info Service | | 183,800 | | 401,820 |
| Bangkok Bank | | 143,900 | | 466,812 |
| Siam Commercial Bank | | 362,800 | | 593,580 |
| | | | | 1,462,212 |
| United Kingdom—14.6% | | | | |
| Anglo American | | 21,137 | | 1,031,300 |
| AstraZeneca | | 8,623 | | 463,458 |
| BHP Billiton | | 22,257 | | 407,393 |
| Cable & Wireless | | 175,157 | | 541,209 |
| GlaxoSmithKline | | 70,468 | | 1,855,065 |
| ICAP | | 111,730 | | 1,047,176 |
| Imperial Tobacco Group | | 11,066 | | 435,667 |
| Prudential | | 42,303 | | 579,598 |
| Reuters Group | | 96,100 | | 838,099 |
| Smith & Nephew | | 78,263 | | 817,056 |
| Standard Chartered | | 39,946 | | 1,167,374 |
| Vodafone Group | | 330,226 | | 915,241 |
| | | | | 10,098,636 |
| Total Common Stocks | | | | |
| (cost $53,555,833) | | | | 67,480,305 |
12
| Preferred Stocks—1.0% | | Shares | | Value ($) |
| |
| |
|
| Germany; | | | | |
| Henkel | | | | |
| (cost $395,327) | | 4,600 | | 677,430 |
| |
| |
|
| |
| Total Investments (cost $53,951,160) | | 98.4% | | 68,157,735 |
| |
| Cash and Receivables (Net) | | 1.6% | | 1,119,481 |
| |
| Net Assets | | 100.0% | | 69,277,216 |
| |
| ADR—American Depository Receipts | | | | |
| GDR—Global Depository Receipts | | | | |
| a Non-income producing security. | | | | |
| b The valuation this security has been determined in good faith under the direction of the Board of Trustees. |
| c Securities exempt from registration under Rule 144A of the Securities Act of 1933.These securities may be resold in |
| transactions exempt from registration, normally to qualified institutional buyers. At December 31, 2006, these |
| securities amounted to $877,621 or 1.3% of net assets. | | |
| Portfolio Summary (Unaudited) † | | | | |
| |
| | | Value (%) | | | | Value (%) |
| |
| |
| |
|
| Financial | | 23.4 | | Industrial | | 4.3 |
| Consumer Discretionary | | 14.7 | | Materials | | 4.0 |
| Health Care | | 13.3 | | Energy | | 2.3 |
| Consumer Staples | | 10.0 | | Utilities | | 2.1 |
| Information Technology | | 8.9 | | Forward Currency | | |
| Diversified Financial Services | | 8.6 | | Exchange Contracts | | .3 |
| Telecommunication Services | | 6.8 | | | | 98.7 |
† Based on net assets.
See notes to financial statements.
| | T h e P o r t f o l i o 13
|
S TAT E M E N T O F A S S E T S A N D L I A B I L I T I E S
| D e c e m b e r 3 1 , 2 0 0 6 | | | | |
| |
| |
|
| |
| |
| |
| |
| | | Cost | | Value |
| |
| |
|
| Assets ($): | | | | |
| Investments in securities—See Statement of Investments | | 53,951,160 | | 68,157,735 |
| Cash | | | | 960,405 |
| Unrealized appreciation on forward currency | | | | |
| exchange contracts—Note 4 | | | | 194,490 |
| Dividends receivable | | | | 127,891 |
| Receivable for shares of Beneficial Interest subscribed | | | | 1,564 |
| Prepaid expenses | | | | 12,806 |
| | | | | 69,454,891 |
| |
| |
|
| Liabilities ($): | | | | |
| Due to The Dreyfus Corporation and affiliates—Note 3(b) | | | | 47,342 |
| Payable for investment securities purchased | | | | 47,176 |
| Payable for shares of Beneficial Interest redeemed | | | | 13,470 |
| Unrealized depreciation on forward currency | | | | |
| exchange contracts—Note 4 | | | | 10,727 |
| Accrued expenses | | | | 58,960 |
| | | | | 177,675 |
| |
| |
|
| Net Assets ($) | | | | 69,277,216 |
| |
| |
|
| Composition of Net Assets ($): | | | | |
| Paid-in capital | | | | 62,036,893 |
| Accumulated undistributed investment income—net | | | | 829,555 |
| Accumulated net realized gain (loss) on investments | | | | (7,981,327) |
| Accumulated net unrealized appreciation (depreciation) | | | | |
| on investments and foreign currency transactions | | | | 14,392,095 |
| |
| |
|
| Net Assets ($) | | | | 69,277,216 |
| |
| |
|
| |
| |
| Net Asset Value Per Share | | | | |
| | | Initial Shares | | Service Shares |
| |
| |
|
| Net Assets ($) | | 59,561,473 | | 9,715,743 |
| Shares Outstanding | | 2,966,161 | | 484,636 |
| |
| |
|
| Net Asset Value Per Share ($) | | 20.08 | | 20.05 |
See notes to financial statements.
|
| S TAT E M E N T O F | | O P E R AT I O N S | | |
| Ye a r E n d e d D e c e m b e r 3 1 , | | 2 0 0 6 | | |
| |
| |
|
| |
| |
| |
| |
| Investment Income ($): | | | | |
| Income: | | | | |
| Cash dividends (net of $126,280 foreign taxes withheld at source) | | 1,287,188 |
| Interest | | | | 637 |
| Total Income | | | | 1,287,825 |
| Expenses: | | | | |
| Investment advisory fee—Note 3(a) | | 449,543 |
| Custodian fees | | | | 93,788 |
| Auditing fees | | | | 33,449 |
| Distribution fees—Note 3(b) | | | | 18,842 |
| Prospectus and shareholders’ reports | | 13,703 |
| Trustees’ fees and expenses—Note 3(c) | | 7,052 |
| Legal fees | | | | 1,818 |
| Loan commitment fees—Note 2 | | | | 405 |
| Registration fees | | | | 18 |
| Miscellaneous | | | | 16,424 |
| Total Expenses | | | | 635,042 |
| Less—reduction in custody fees due to | | |
| earnings credits—Note 1(c) | | | | (38,271) |
| Net Expenses | | | | 596,771 |
| Investment Income—Net | | | | 691,054 |
| |
| |
|
| Realized and Unrealized Gain (Loss) on Investments—Note 4 ($): |
| Net realized gain (loss) on investments and foreign currency transactions | | 6,227,612 |
| Net realized gain (loss) on forward currency exchange contracts | | 27,106 |
| Net Realized Gain (Loss) | | | | 6,254,718 |
| Net unrealized appreciation (depreciation) | | |
| on investments and foreign currency transactions | | 5,244,035 |
| Net Realized and Unrealized Gain (Loss) on Investments | | 11,498,753 |
| Net Increase in Net Assets Resulting from Operations | | 12,189,807 |
See notes to financial statements.
|
| | T h e P o r t f o l i o 15
|
S TAT E M E N T O F C H A N G E S I N N E T A S S E T S
| | | Year Ended December 31, |
| |
|
| | | 2006 | | 2005 |
| |
| |
|
| Operations ($): | | | | |
| Investment income—net | | 691,054 | | 767,342 |
| Net realized gain (loss) on investments | | 6,254,718 | | 7,725,069 |
| Net unrealized appreciation | | | | |
| (depreciation) on investments | | 5,244,035 | | (2,244,526) |
| Net Increase (Decrease) in Net Assets | | | | |
| Resulting from Operations | | 12,189,807 | | 6,247,885 |
| |
| |
|
| Dividends to Shareholders from ($): | | | | |
| Investment income—net: | | | | |
| Initial shares | | (397,562) | | (160,712) |
| Service shares | | (41,615) | | (9,235) |
| Total Dividends | | (439,177) | | (169,947) |
| |
| |
|
| Beneficial Interest Transactions ($): | | | | |
| Net proceeds from shares sold: | | | | |
| Initial shares | | 18,055,001 | | 5,791,282 |
| Service shares | | 4,076,066 | | 1,742,456 |
| Dividends reinvested: | | | | |
| Initial shares | | 397,562 | | 160,712 |
| Service shares | | 41,615 | | 9,235 |
| Cost of shares redeemed: | | | | |
| Initial shares | | (11,416,841) | | (7,886,743) |
| Service shares | | (1,785,314) | | (874,791) |
| Increase (Decrease) in Net Assets from | | | | |
| Beneficial Interest Transactions | | 9,368,089 | | (1,057,849) |
| Total Increase (Decrease) in Net Assets | | 21,118,719 | | 5,020,089 |
| |
| |
|
| Net Assets ($): | | | | |
| Beginning of Period | | 48,158,497 | | 43,138,408 |
| End of Period | | 69,277,216 | | 48,158,497 |
| Undistributed investment income—net | | 829,555 | | 484,206 |
| | | Year Ended December 31, |
| |
|
| | | 2006 | | 2005 |
| |
| |
|
| Capital Share Transactions: | | | | |
| Initial Shares | | | | |
| Shares sold | | 994,470 | | 391,336 |
| Shares issued for dividends reinvested | | 21,630 | | 11,334 |
| Shares redeemed | | (627,671) | | (531,886) |
| Net Increase (Decrease) in Shares Outstanding | | 388,429 | | (129,216) |
| |
| |
|
| Service Shares | | | | |
| Shares sold | | 222,761 | | 119,792 |
| Shares issued for dividends reinvested | | 2,264 | | 651 |
| Shares redeemed | | (98,496) | | (59,441) |
| Net Increase (Decrease) in Shares Outstanding | | 126,529 | | 61,002 |
See notes to financial statements.
|
| | T h e P o r t f o l i o 17
|
| | F I N A N C I A L H I G H L I G H T S
|
The following tables describe the performance for each share class for the fiscal periods indicated. All information (except portfolio turnover rate) reflects financial results for a single portfolio share.Total return shows how much your investment in the portfolio would have increased (or decreased) during each period, assuming you had reinvested all dividends and distributions.These figures have been derived from the portfolio’s financial statements.
| | | | | Year Ended December 31, | | |
| |
| |
| |
|
| Initial Shares | | 2006 | | 2005 | | 2004 | | 2003 | | 2002 |
| |
| |
| |
| |
| |
|
| Per Share Data ($): | | | | | | | | | | |
| Net asset value, beginning of period | | 16.41 | | 14.36 | | 11.97 | | 8.75 | | 10.76 |
| Investment Operations: | | | | | | | | | | |
| Investment income—net a | | .22 | | .26 | | .27 | | .14 | | .10 |
| Net realized and unrealized | | | | | | | | | | |
| gain (loss) on investments | | 3.59 | | 1.85 | | 2.64 | | 3.55 | | (1.81) |
| Total from Investment Operations | | 3.81 | | 2.11 | | 2.91 | | 3.69 | | (1.71) |
| Distributions: | | | | | | | | | | |
| Dividends from investment income—net | | (.14) | | (.06) | | (.52) | | (.47) | | (.30) |
| Net asset value, end of period | | 20.08 | | 16.41 | | 14.36 | | 11.97 | | 8.75 |
| |
| |
| |
| |
| |
|
| Total Return (%) | | 23.31 | | 14.75 | | 24.57 | | 42.89 | | (15.94) |
| |
| |
| |
| |
| |
|
| Ratios/Supplemental Data (%): | | | | | | | | | | |
| Ratio of total expenses | | | | | | | | | | |
| to average net assets | | 1.03 | | 1.10 | | 1.04 | | 1.19 | | 1.14 |
| Ratio of net expenses | | | | | | | | | | |
| to average net assets | | .97 | | 1.09 | | 1.04 | | 1.19 | | 1.14 |
| Ratio of net investment income | | | | | | | | | | |
| to average net assets | | 1.19 | | 1.76 | | 2.13 | | 1.42 | | .96 |
| Portfolio Turnover Rate | | 98.92 | | 92.82 | | 96.55 | | 101.02 | | 116.65 |
| |
| |
| |
| |
| |
|
| Net Assets, end of period ($ x 1,000) | | 59,561 | | 42,289 | | 38,874 | | 32,892 | | 27,117 |
a Based on average shares outstanding at each month end. See notes to financial statements.
| | | | | Year Ended December 31, | | |
| |
| |
| |
|
| Service Shares | | 2006 | | 2005 | | 2004 | | 2003 | | 2002 |
| |
| |
| |
| |
| |
|
| Per Share Data ($): | | | | | | | | | | |
| Net asset value, beginning of period | | 16.39 | | 14.35 | | 11.95 | | 8.74 | | 10.75 |
| Investment Operations: | | | | | | | | | | |
| Investment income—net a | | .16 | | .22 | | .24 | | .12 | | .07 |
| Net realized and unrealized | | | | | | | | | | |
| gain (loss) on investments | | 3.61 | | 1.85 | | 2.63 | | 3.54 | | (1.80) |
| Total from Investment Operations | | 3.77 | | 2.07 | | 2.87 | | 3.66 | | (1.73) |
| Distributions: | | | | | | | | | | |
| Dividends from investment income—net | | (.11) | | (.03) | | (.47) | | (.45) | | (.28) |
| Net asset value, end of period | | 20.05 | | 16.39 | | 14.35 | | 11.95 | | 8.74 |
| |
| |
| |
| |
| |
|
| Total Return (%) | | 23.06 | | 14.45 | | 24.20 | | 42.56 | | (16.20) |
| |
| |
| |
| |
| |
|
| Ratios/Supplemental Data (%): | | | | | | | | | | |
| Ratio of total expenses | | | | | | | | | | |
| to average net assets | | 1.28 | | 1.34 | | 1.29 | | 1.44 | | 1.41 |
| Ratio of net expenses | | | | | | | | | | |
| to average net assets | | 1.21 | | 1.33 | | 1.29 | | 1.44 | | 1.41 |
| Ratio of net investment income | | | | | | | | | | |
| to average net assets | | .90 | | 1.50 | | 1.89 | | 1.17 | | .74 |
| Portfolio Turnover Rate | | 98.92 | | 92.82 | | 96.55 | | 101.02 | | 116.65 |
| |
| |
| |
| |
| |
|
| Net Assets, end of period ($ x 1,000) | | 9,716 | | 5,870 | | 4,265 | | 3,375 | | 2,017 |
a Based on average shares outstanding at each month end. See notes to financial statements.
| | T h e P o r t f o l i o 19
|
N O T E S T O F I N A N C I A L S TAT E M E N T S
NOTE 1—Significant Accounting Policies:
Dreyfus Variable Investment Fund (the “fund”) is registered under the Investment Company Act of 1940, as amended (the “Act”), as an open-end management investment company, operating as a series company currently offering twelve series, including the International Equity Portfolio (the “portfolio”). The portfolio is only offered to separate accounts established by insurance companies to fund variable annuity contracts and variable life insurance policies. The portfolio is a non-diversified series. The portfolio’s investment objective is to maximize capital growth.The Dreyfus Corporation (the “Manager” or “Dreyfus”) serves as the portfolio’s investment adviser. Dreyfus is a wholly-owned subsidiary of Mellon Financial Corporation (“Mellon Financial”). Newton Capital Management Limited (“Newton”) is the portfolio’s sub-investment adviser. Newton is also a wholly-owned subsidiary of Mellon Bank, N.A., and an affiliate of Dreyfus.
On December 4, 2006, Mellon Financial and The Bank of New York Company, Inc. announced that they had entered into a definitive agreement to merge. The new company will be called The Bank of New York Mellon Corporation. As part of this transaction, Dreyfus would become a wholly-owned subsidiary of The Bank of New York Mellon Corporation.The transaction is subject to certain regulatory approvals and the approval of The Bank of New York Company, Inc.’s and Mellon Financial’s shareholders, as well as other customary conditions to closing. Subject to such approvals and the satisfaction of the other conditions, Mellon Financial and The Bank of New York Company, Inc. expect the transaction to be completed in the third quarter of 2007.
Dreyfus Service Corporation (the “Distributor”), a wholly-owned subsidiary of Dreyfus, is the distributor of the portfolio’s shares, which are sold without a sales charge.The portfolio is authorized to issue an unlimited number of $.001 par value shares of Beneficial Interest in each of the following classes of shares: Initial and Service. Each class of shares has identical rights and privileges, except with respect to the distribution plan and the expenses borne by each class and certain voting rights. Income, expenses (other than expenses attributable to a specific
class), and realized and unrealized gains or losses on investments are allocated to each class of shares based on its relative net assets.
The fund accounts separately for the assets, liabilities and operations of each series. Expenses directly attributable to each series are charged to that series’ operations; expenses which are applicable to all series are allocated among them on a pro rata basis.
The portfolio’s financial statements are prepared in accordance with U.S. generally accepted accounting principles, which may require the use of management estimates and assumptions.Actual results could differ from those estimates.
The fund enters into contracts that contain a variety of indemnifica-tions.The portfolio’s maximum exposure under these arrangements is unknown. The portfolio does not anticipate recognizing any loss related to these arrangements.
(a) Portfolio valuation: Investments in securities are valued at the last sales price on the securities exchange or national securities market on which such securities are primarily traded. Securities listed on the National Market System for which market quotations are available are valued at the official closing price or, if there is no official closing price that day, at the last sales price. Securities not listed on an exchange or the national securities market, or securities for which there were no transactions, are valued at the average of the most recent bid and asked prices, except for open short positions, where the asked price is used for valuation purposes. Bid price is used when no asked price is available. Registered open-end investment companies that are not traded on an exchange are valued at their net asset value.When market quotations or official closing prices are not readily available, or are determined not to reflect accurately fair value, such as when the value of a security has been significantly affected by events after the close of the exchange or market on which the security is principally traded (for example, a foreign exchange or market),but before the portfolio calculates its net asset value, the portfolio may value these investments at fair value as determined in accordance with the procedures approved by the Board of Trustees. Fair
| | T h e P o r t f o l i o 21
|
N O T E S T O F I N A N C I A L S TAT E M E N T S (continued)
valuing of securities may be determined with the assistance of a pricing service using calculations based on indices of domestic securities and other appropriate indicators, such as prices of relevant ADR’s and futures contracts. For other securities that are fair valued by the Board of Trustees, certain factors may be considered such as: fundamental analytical data, the nature and duration of restrictions on disposition, an evaluation of the forces that influence the market in which the securities are purchased and sold and public trading in similar securities of the issuer or comparable issuers. Financial futures are valued at the last sales price. Investments denominated in foreign currencies are translated to U.S. dollars at the prevailing rates of exchange. Forward currency exchange contracts are valued at the forward rate.
On September 20, 2006, the Financial Accounting Standards Board (FASB) released Statement of Financial Accounting Standards No. 157 “Fair Value Measurements” (“FAS 157”). FAS 157 establishes an authoritative definition of fair value, sets out a framework for measuring fair value, and requires additional disclosures about fair-value measurements. The application of FAS 157 is required for fiscal years beginning after November 15, 2007 and interim periods within those fiscal years. Management does not believe that the application of this standard will have a material impact on the financial statements of the portfolio.
(b) Foreign currency transactions: The portfolio does not isolate that portion of the results of operations resulting from changes in foreign exchange rates on investments from the fluctuations arising from changes in market prices of securities held. Such fluctuations are included with the net realized and unrealized gain or loss on investments.
Net realized foreign exchange gains or losses arise from sales and maturities of short-term securities, sales of foreign currencies, currency gains or losses realized on securities transactions and the difference between the amounts of dividends, interest and foreign withholding taxes recorded on the portfolio’s books and the U.S. dollar equivalent of the amounts actually received or paid. Net unrealized foreign exchange gains or losses arise from changes in the value of assets and liabilities
other than investments in securities, resulting from changes in exchange rates. Such gains and losses are included with net realized and unrealized gain or loss on investments.
(c) Securities transactions and investment income: Securities transactions are recorded on a trade date basis. Realized gain and loss from securities transactions are recorded on the identified cost basis. Dividend income is recognized on the ex-dividend date and interest income, including, where applicable, accretion of discount and amortization of premium on investments, is recognized on the accrual basis.
The portfolio has an arrangement with the custodian bank whereby the portfolio receives earnings credits from the custodian when positive cash balances are maintained, which are used to offset custody fees. For financial reporting purposes, the portfolio includes net earnings credits as an expense offset in the Statement of Operations.
(d) Dividends to shareholders: Dividends are recorded on the ex-dividend date. Dividends from investment income-net and dividends from net realized capital gain, if any, are normally declared and paid annually, but the portfolio may make distributions on a more frequent basis to comply with the distribution requirements of the Internal Revenue Code of 1986, as amended (the “Code”).To the extent that net realized capital gain can be offset by capital loss carryovers, it is the policy of the portfolio not to distribute such gain. Income and capital gain distributions are determined in accordance with income tax regulations, which may differ from U.S. generally accepted accounting principles.
(e) Federal income taxes: It is the policy of the portfolio to continue to qualify as a regulated investment company, if such qualification is in the best interests of its shareholders, by complying with the applicable provisions of the Code, and to make distributions of taxable income sufficient to relieve it from substantially all federal income and excise taxes.
On July 13, 2006, the FASB released FASB Interpretation No. 48 “Accounting for Uncertainty in Income Taxes” (FIN 48). FIN 48 provides guidance for how uncertain tax positions should be recognized,
| | T h e P o r t f o l i o 23
|
N O T E S T O F I N A N C I A L S TAT E M E N T S (continued)
measured, presented and disclosed in the financial statements. FIN 48 requires the evaluation of tax positions taken or expected to be taken in the course of preparing the portfolio ‘s tax returns to determine whether the tax positions are “more-likely-than-not” of being sustained by the applicable tax authority.Tax positions not deemed to meet the more-likely-than-not threshold would be recorded as a tax benefit or expense in the current year. Adoption of FIN 48 is required for fiscal years beginning after December 15, 2006 and is to be applied to all open tax years as of the effective date. Management does not believe that the application of this standard will have a material impact on the financial statements of the portfolio.
At December 31, 2006, the components of accumulated earnings on a tax basis were as follows: undistributed ordinary income $1,251,142, accumulated capital losses $7,960,106 and unrealized appreciation $13,949,287.
The accumulated capital loss carryover is available to be applied against future net securities profits, if any, realized subsequent to December 31, 2006. If not applied, $2,862,652 of the carryover expires in fiscal 2009, $3,933,328 expires in fiscal 2010 and $1,164,126 expires in fiscal 2011.
The tax character of distributions paid to shareholders during the fiscal periods ended December 31, 2006 and December 31, 2005 were as follows: ordinary income $439,177 and $169,947, respectively.
During the period ended December 31, 2006, as a result of permanent book to tax differences primarily due to the tax treatment for foreign currency transactions and passive foreign investment companies, the portfolio increased accumulated undistributed investment income-net by $93,472 and decreased accumulated net realized gain (loss) on investments by the same amount. Net assets were not affected by this reclassification.
NOTE 2—Bank Line of Credit:
|
The portfolio participates with other Dreyfus-managed funds in a $350 million redemption credit facility (the “Facility”) to be utilized
for temporary or emergency purposes, including the financing of redemptions. In connection therewith, the portfolio has agreed to pay commitment fees on its pro rata portion of the Facility. Interest is charged to the portfolio based on prevailing market rates in effect at the time of borrowing. During the period ended December 31, 2006, the portfolio did not borrow under the Facility.
NOTE 3—Investment Advisory Fee, Sub-Investment Advisory Fee and Other Transactions with Affiliates:
(a) Pursuant to an Investment Advisory Agreement with Dreyfus, the investment advisory fee is computed at the annual rate of .75% of the value of the portfolio’s average daily net assets and is payable monthly.
Pursuant to a Sub-Investment Advisory Agreement between Dreyfus and Newton, the sub-investment advisory fee is payable monthly by Dreyfus, and is based upon the value of the portfolio’s average daily net assets, computed at the following annual rates:
| Average Net Assets | | |
| 0 to $100 million | | 35% |
| $100 million to $1 billion | | 30% |
| $1 billion to $1.5 billion | | 26% |
| In excess of $1.5 billion | | 20% |
(b) Under the Distribution Plan (the “Plan”) adopted pursuant to Rule 12b-1 under the Act, Service shares pay the Distributor for distributing their shares, for servicing and/or maintaining Service shares shareholder accounts and for advertising and marketing for Service shares.The Plan provides for payments to be made at an annual rate of .25% of the value of Service shares’ average daily net assets. The Distributor may make payments to Participating Insurance Companies and to brokers and dealers acting as principal underwriter for their variable insurance products.The fees payable under the Plan are payable without regard to actual expenses incurred. During the period ended December 31, 2006, Service shares were charged $18,842 pursuant to the Plan.
| | T h e P o r t f o l i o 25
|
N O T E S T O F I N A N C I A L S TAT E M E N T S (continued)
The portfolio compensates Dreyfus Transfer, Inc., a wholly-owned subsidiary of Dreyfus, under a transfer agency agreement for providing personnel and facilities to perform transfer agency services for the portfolio. During the period ended December 31, 2006, the portfolio was charged $152 pursuant to the transfer agency agreement.
During the period ended December 31, 2006, the portfolio was charged $4,204 for services performed by the Chief Compliance Officer.
The components of Due to The Dreyfus Corporation and affiliates in the Statement of Assets and Liabilities consist of: investment advisory fees $43,269, Rule 12b-1 distribution plan fees $2,000, chief compliance officer fees $2,044 and transfer agency per account fees $29.
(c) Each Board member also serves as a Board member of other funds within the Dreyfus complex. Annual retainer fees and attendance fees are allocated to each portfolio based on net assets.
NOTE 4—Securities Transactions:
|
The aggregate amount of purchases and sales of investment securities, excluding short-term securities and forward currency exchange contracts, during the period ended December 31, 2006, amounted to $67,898,797 and $58,387,616, respectively.
The portfolio enters into forward currency exchange contracts in order to hedge its exposure to changes in foreign currency exchange rates on its foreign portfolio holdings and to settle foreign currency transactions. When executing forward currency exchange contracts, the portfolio is obligated to buy or sell a foreign currency at a specified rate on a certain date in the future. With respect to sales of forward currency exchange contracts, the portfolio would incur a loss if the value of the contract increases between the date the forward contract is opened and the date the forward contract is closed.The portfolio realizes a gain if the value of the contract decreases between those dates.With respect to
purchases of forward currency exchange contracts, the portfolio would incur a loss if the value of the contract decreases between the date the forward contract is opened and the date the forward contract is closed. The portfolio realizes a gain if the value of the contract increases between those dates.The portfolio is also exposed to credit risk associated with counterparty nonperformance on these forward currency exchange contracts which is typically limited to the unrealized gain on each open contract.The following summarizes open forward currency exchange contracts at December 31, 2006:
| | | Foreign | | | | | | Unrealized |
| Forward Currency | | Currency | | | | | | Appreciation |
| Exchange Contracts | | Amounts | | Cost ($) | | Value ($) | | (Depreciation) ($) |
| |
| |
| |
| |
|
| Purchases: | | | | | | | | |
| British Pound, | | | | | | | | |
| expiring 1/16/2007 | | 564,256 | | 1,049,000 | | 1,105,321 | | 56,321 |
| Euro, expiring | | | | | | | | |
| 5/15/2007 | | 1,567,921 | | 2,034,000 | | 2,080,161 | | 46,161 |
| Norwegian Krone, | | | | | | | | |
| expiring 4/13/2007 | | 8,000,260 | | 1,214,000 | | 1,287,893 | | 73,893 |
| Swedish Krona, | | | | | | | | |
| expiring 6/15/2007 | | 6,842,781 | | 990,000 | | 1,008,115 | | 18,115 |
| Swiss Franc, | | | | | | | | |
| expiring 6/15/2007 | | 585,605 | | 498,000 | | 487,273 | | (10,727) |
| Total | | | | | | | | 183,763 |
At December 31, 2006, the cost of investments for federal income tax purposes was $54,210,204; accordingly, accumulated net unrealized appreciation on investments was $13,947,531 consisting of $14,768,948 gross unrealized appreciation and $821,417 gross unrealized depreciation.
| | T h e P o r t f o l i o 27
|
R E P O R T O F I N D E P E N D E N T R E G I S T E R E D P U B L I C A C C O U N T I N G F I R M
Shareholders and Board of Trustees
Dreyfus Variable Investment Fund, International Equity Portfolio
We have audited the accompanying statement of assets and liabilities, including the statement of investments, of Dreyfus Variable Investment Fund, International Equity Portfolio (one of the funds comprising Dreyfus Variable Investment Fund) as of December 31, 2006, and the related statement of operations for the year then ended, the statement of changes in net assets for each of the two years in the period then ended, and financial highlights for each of the years indicated therein. These financial statements and financial highlights are the responsibility of the Fund’s management. Our responsibility is to express an opinion on these financial statements and financial highlights based on our audits. We conducted our audits in accordance with the standards of the Public Company Accounting Oversight Board (United States).Those standards require that we plan and perform the audit to obtain reasonable assurance about whether the financial statements and financial highlights are free of material misstatement.We were not engaged to perform an audit of the Fund’s internal control over financial reporting. Our audits included consideration of internal control over financial reporting as a basis for designing audit procedures that are appropriate in the circumstances, but not for the purpose of expressing an opinion on the effectiveness of the Fund’s internal control over financial reporting.Accordingly, we express no such opinion. An audit also includes examining, on a test basis, evidence supporting the amounts and disclosures in the financial statements and financial highlights, assessing the accounting principles used and significant estimates made by management, and evaluating the overall financial statement presentation. Our procedures included confirmation of securities owned as of December 31, 2006 by correspondence with the custodian and others or by other appropriate auditing procedures where replies from others were not received.We believe that our audits provide a reasonable basis for our opinion.
In our opinion, the financial statements and financial highlights referred to above present fairly, in all material respects, the financial position of Dreyfus Variable Investment Fund, International Equity Portfolio at December 31, 2006, the results of its operations for the year then ended, the changes in its net assets for each of the two years in the period then ended, and the financial highlights for each of the indicated years, in conformity with U.S. generally accepted accounting principles.
New York, New York
February 6, 2007
|
I M P O R TA N T TA X I N F O R M AT I O N ( U n a u d i t e d )
In accordance with federal tax law, the portfolio elects to provide each shareholder with their portion of the portfolio’s foreign taxes paid and the income sourced from foreign countries.Accordingly, the portfolio hereby makes the following designations regarding its fiscal year ended December 31, 2006:
—the total amount of taxes paid to foreign countries was $113,128.
—the total amount of income sourced from foreign countries was $986,209.
As required by federal tax law rules, shareholders will receive notification of their proportionate share of foreign taxes paid and foreign source income for the 2006 calendar year with Form 1099-DIV which will be mailed by January 31, 2007.
P R O X Y R E S U LT S ( U n a u d i t e d )
|
Dreyfus Variable Investment Fund held a special meeting of shareholders on June 29, 2006.The proposal considered at the meeting, and the results, are as follows:
| | | | | Shares | | |
| |
| |
| |
|
| | | Votes For | | | | Authority Withheld |
| |
| |
| |
|
| To elect additional Board Members: | | | | | | |
| Peggy C. Davis † | | 171,078,927 | | | | 7,687,714 |
| Joseph S. DiMartino | | 170,946,484 | | | | 7,820,156 |
| David P. Feldman | | 170,959,921 | | | | 7,806,720 |
| Ehud Houminer † | | 170,132,087 | | | | 8,634,554 |
| Gloria Messinger † | | 170,187,241 | | | | 8,579,400 |
| Anne Wexler † | | 170,212,607 | | | | 8,554,033 |
† Each new Board member’s term commenced on September 26, 2006.
In addition to Joseph S. DiMartino and David P. Feldman, James F. Henry, Dr. Paul A. Marks and Dr. Martin Peretz continue as Board members of the fund.
| | T h e P o r t f o l i o 29
|
B O A R D M E M B E R S I N F O R M AT I O N ( U n a u d i t e d )
Joseph S. DiMartino (63)
Chairman of the Board (1995)
|
Principal Occupation During Past 5 Years:
• Corporate Director and Trustee
|
Other Board Memberships and Affiliations:
|
- The Muscular Dystrophy Association, Director
- Century Business Services, Inc., a provider of outsourcing functions for small and medium size companies, Director
- The Newark Group, a provider of a national market of paper recovery facilities, paperboard mills and paperboard converting plants, Director
- Sunair Services Corporation, engaging in the design, manufacture and sale of high frequency systems for long-range voice and data communications, as well as providing certain outdoor-related services to homes and businesses, Director
No. of Portfolios for which Board Member Serves: 190
———————
Peggy C. Davis (63) Board Member (2006)
Principal Occupation During Past 5 Years:
|
- Shad Professor of Law, New York University School of Law (1983-present)
- Writer and teacher in the fields of evidence, constitutional theory, family law, social sciences and the law, legal process and professional methodology and training
No. of Portfolios for which Board Member Serves: 80
|
David P. Feldman (67)
Board Member (1994)
|
Principal Occupation During Past 5 Years:
• Corporate Director and Trustee
|
Other Board Memberships and Affiliations:
|
- BBH Mutual Funds Group (11 funds), Director
- The Jeffrey Company, a private investment company, Director
- QMED, a medical device company, Director
No. of Portfolios for which Board Member Serves: 57
|
James F. Henry (76)
Board Member (1990)
|
Principal Occupation During Past 5 Years:
|
- President,The International Institute for Conflict Prevention and Resolution, a non-profit organization principally engaged in the development of alternatives to business litigation (Retired 2003)
- Advisor to The Elaw Forum, a consultant on managing corporate legal costs
- Advisor to John Jay Homestead (the restored home of the first U.S. Chief Justice)
- Individual Trustee of several trusts
Other Board Memberships and Affiliations:
|
- Director, advisor and mediator involved in several non-profit organizations, primarily engaged in domestic and international dispute resolution, and historic preservation
No. of Portfolios for which Board Member Serves: 48
|
———————
Ehud Houminer (66) Board Member (2006)
Principal Occupation During Past 5 Years:
• Executive-in-Residence at the Columbia Business School, Columbia University
Other Board Memberships and Affiliations:
|
- Avnet Inc., an electronics distributor, Director
- International Advisory Board to the MBA Program School of Management, Ben Gurion University, Chairman
- Explore Charter School, Brooklyn, NY, Chairman
No. of Portfolios for which Board Member Serves: 78
———————
Gloria Messinger (77) Board Member (2006)
Principal Occupation During Past 5 Years:
|
- Arbitrator for American Arbitration Association and National Association of Securities Dealers, Inc.
- Consultant in Intellectual Property
Other Board Memberships and Affiliations:
|
- Theater for a New Audience, Inc., Director
- Brooklyn Philharmonic, Director
No. of Portfolios for which Board Member Serves: 48
|
| | T h e P o r t f o l i o 31
|
B O A R D M E M B E R S I N F O R M AT I O N ( U n a u d i t e d ) (continued)
Dr. Martin Peretz (67)
Board Member (1990)
|
Principal Occupation During Past 5 Years:
|
- Editor-in-Chief of The New Republic Magazine
- Lecturer in Social Studies at Harvard University (1965-2002)
- Director of TheStreet.com, a financial information service on the web
Other Board Memberships and Affiliations:
|
- American Council of Trustees and Alumni, Director
- Pershing Square Capital Management, Adviser
- Montefiore Ventures, General Partner
- Harvard Center for Blood Research,Trustee
- Bard College,Trustee
- Board of Overseers of YIVO Institute for Jewish Research, Chairman
No. of Portfolios for which Board Member Serves: 48
———————
Anne Wexler (76) Board Member (2006)
Principal Occupation During Past 5 Years:
|
- Chairman of the Wexler & Walker Public Policy Associates, consultants specializing in government relations and public affairs
Other Board Memberships and Affiliations:
|
- Wilshire Mutual Funds (5 funds), Director
- Methanex Corporation, a methanol producing company, Director
- Member of the Council of Foreign Relations
- Member of the National Park Foundation
No. of Portfolios for which Board Member Serves: 57
|
Once elected all Board Members serve for an indefinite term, but achieve Emeritus status on December 31st of the calendar year in which the Board Member reaches age 80.The address of the Board Members and Officers is in c/o The Dreyfus Corporation, 200 Park Avenue, New York, New York 10166. Additional information about the Board Members is available in the fund’s Statement of Additional Information which can be obtained from Dreyfus free of charge by calling this toll free number: 1-800-554-4611.
John M. Fraser, Jr., Emeritus Board Member Rosalind G. Jacobs, Emeritus Board Member Dr. Paul A. Marks, Emeritus Board Member
O F F I C E R S O F T H E F U N D ( U n a u d i t e d )
| J. DAVID OFFICER, President since | | JOSEPH M. CHIOFFI, Vice President and |
| December 2006. | | Assistant Secretary since August 2005. |
| Chief Operating Officer,Vice Chairman and a | | Associate General Counsel of the Manager, |
| director of the Manager, and an officer of 90 | | and an officer of 91 investment companies |
| investment companies (comprised of 190 | | (comprised of 206 portfolios) managed by the |
| portfolios) managed by the Manager. He is 58 | | Manager. He is 45 years old and has been an |
| years old and has been an employee of the | | employee of the Manager since June 2000. |
| |
| Manager since April 1, 1998. | | JANETTE E. FARRAGHER, Vice President |
| MARK N. JACOBS, Vice President since | | and Assistant Secretary since |
| March 2000. | | August 2005. |
| Executive Vice President, Secretary and | | Associate General Counsel of the Manager, |
| General Counsel of the Manager, and an | | and an officer of 91 investment companies |
| officer of 91 investment companies (comprised | | (comprised of 206 portfolios) managed by the |
| of 206 portfolios) managed by the Manager. | | Manager. She is 44 years old and has been an |
| He is 60 years old and has been an employee | | employee of the Manager since February 1984. |
| |
| of the Manager since June 1977. | | JOHN B. HAMMALIAN, Vice President and |
| MICHAEL A. ROSENBERG, Vice President | | Assistant Secretary since August 2005. |
| and Secretary since August 2005. | | Associate General Counsel of the Manager, |
| Associate General Counsel of the Manager, | | and an officer of 91 investment companies |
| and an officer of 91 investment companies | | (comprised of 206 portfolios) managed by the |
| (comprised of 206 portfolios) managed by the | | Manager. He is 43 years old and has been an |
| Manager. He is 46 years old and has been an | | employee of the Manager since February 1991. |
| |
| employee of the Manager since October 1991. | | ROBERT R. MULLERY, Vice President and |
| JAMES BITETTO, Vice President and | | Assistant Secretary since August 2005. |
| Assistant Secretary since August 2005. | | Associate General Counsel of the Manager, |
| Associate General Counsel and Assistant | | and an officer of 91 investment companies |
| Secretary of the Manager, and an officer of 91 | | (comprised of 206 portfolios) managed by the |
| investment companies (comprised of 206 | | Manager. He is 54 years old and has been an |
| portfolios) managed by the Manager. He is 40 | | employee of the Manager since May 1986. |
| |
| years old and has been an employee of the | | JEFF PRUSNOFSKY, Vice President and |
| Manager since December 1996. | | Assistant Secretary since August 2005. |
| JONI LACKS CHARATAN, Vice President | | Associate General Counsel of the Manager, |
| and Assistant Secretary since | | and an officer of 91 investment companies |
| August 2005. | | (comprised of 206 portfolios) managed by the |
| Associate General Counsel of the Manager, | | Manager. He is 41 years old and has been an |
| and an officer of 91 investment companies | | employee of the Manager since October 1990. |
| (comprised of 206 portfolios) managed by the | | |
| Manager. She is 51 years old and has been an | | |
| employee of the Manager since October 1988. | | |
T h e P o r t f o l i o 33
O F F I C E R S O F T H E F U N D ( U n a u d i t e d ) (continued)
| JAMES WINDELS, Treasurer since | | JOSEPH W. CONNOLLY, Chief Compliance |
| November 2001. | | Officer since October 2004. |
| Director – Mutual Fund Accounting of the | | Chief Compliance Officer of the Manager and |
| Manager, and an officer of 91 investment | | The Dreyfus Family of Funds (91 investment |
| companies (comprised of 206 portfolios) | | companies, comprised of 206 portfolios). From |
| managed by the Manager. He is 48 years old | | November 2001 through March 2004, Mr. |
| and has been an employee of the Manager | | Connolly was first Vice-President, Mutual |
| since April 1985. | | Fund Servicing for Mellon Global Securities |
| |
| ERIK D. NAVILOFF, Assistant Treasurer | | Services. In that capacity, Mr. Connolly was |
| since December 2002. | | responsible for managing Mellon’s Custody, |
| | | Fund Accounting and Fund Administration |
| Senior Accounting Manager – Taxable Fixed | | services to third-party mutual fund clients. He |
| Income Funds of the Manager, and an officer | | is 49 years old and has served in various |
| of 91 investment companies (comprised of 206 | | capacities with the Manager since 1980, |
| portfolios) managed by the Manager. He is 38 | | including manager of the firm’s Fund |
| years old and has been an employee of the | | Accounting Department from 1997 through |
| Manager since November 1992. | | October 2001. |
| |
| ROBERT ROBOL, Assistant Treasurer | | WILLIAM GERMENIS, Anti-Money |
| since August 2003. | | Laundering Compliance Officer since |
| Senior Accounting Manager – Money Market | | September 2002. |
| and Municipal Bond Funds of the Manager, | | Vice President and Anti-Money Laundering |
| and an officer of 91 investment companies | | Compliance Officer of the Distributor, and the |
| (comprised of 206 portfolios) managed by the | | Anti-Money Laundering Compliance Officer |
| Manager. He is 42 years old and has been an | | of 87 investment companies (comprised of 202 |
| employee of the Manager since October 1988. | | portfolios) managed by the Manager. He is 36 |
| ROBERT SVAGNA, Assistant Treasurer | | years old and has been an employee of the |
| since December 2002. | | Distributor since October 1998. |
| Senior Accounting Manager – Equity Funds of | | |
| the Manager, and an officer of 91 investment | | |
| companies (comprised of 206 portfolios) | | |
| managed by the Manager. He is 39 years old | | |
| and has been an employee of the Manager | | |
| since November 1990. | | |
| |
| GAVIN C. REILLY, Assistant Treasurer | | |
| since December 2005. | | |
| Tax Manager of the Investment Accounting | | |
| and Support Department of the Manager, and | | |
| an officer of 91 investment companies | | |
| (comprised of 206 portfolios) managed by the | | |
| Manager. He is 38 years old and has been an | | |
| employee of the Manager since April 1991. | | |
34
N O T E S
For More Information
| Dreyfus Variable Investment Fund, | | Custodian |
| |
| International Equity Portfolio | | |
| | | The Bank of New York |
| 200 Park Avenue | | |
| | | One Wall Street |
| New York, NY 10166 | | |
| | | New York, NY 10286 |
| |
| |
| Investment Adviser | | Transfer Agent & |
| |
| The Dreyfus Corporation | | Dividend Disbursing Agent |
| |
| 200 Park Avenue | | |
| | | Dreyfus Transfer, Inc. |
| New York, NY 10166 | | |
| | | 200 Park Avenue |
| |
| Sub-Investment Adviser | | New York, NY 10166 |
| |
| Newton Capital Management Limited | | Distributor |
| |
| 160 Queen Victoria Street | | |
| | | Dreyfus Service Corporation |
| London, EC4V 4LA | | |
| | | 200 Park Avenue |
| England | | |
| | | New York, NY 10166 |
Telephone 1-800-554-4611 or 516-338-3300
Mail The Dreyfus Family of Funds, 144 Glenn Curtiss Boulevard, Uniondale, NY 11556-0144 Attn: Investments Division
The portfolio files its complete schedule of portfolio holdings with the Securities and Exchange Commission (“SEC”) for the first and third quarters of each fiscal year on Form N-Q. The portfolio’s Forms N-Q are available on the SEC’s website at http://www.sec.gov and may be reviewed and copied at the SEC’s Public Reference Room in Washington, DC. Information on the operation of the Public Reference Room may be obtained by calling 1-202-551-8090.
A description of the policies and procedures that the portfolio uses to determine how to vote proxies relating to portfolio securities, and information regarding how the portfolio voted these proxies for the 12-month period ended June 30, 2006, is available at http://www.dreyfus.com and on the SEC’s website at http://www.sec.gov. The description of the policies and procedures is also available without charge, upon request, by calling 1-800-645-6561.
© 2007 Dreyfus Service Corporation

| Dreyfus Variable |
| Investment Fund, |
| International Value |
| Portfolio |

The views expressed in this report reflect those of the portfolio manager only through the end of the period covered and do not necessarily represent the views of Dreyfus or any other person in the Dreyfus organization.Any such views are subject to change at any time based upon market or other conditions and Dreyfus disclaims any responsibility to update such views. These views may not be relied on as investment advice and, because investment decisions for a Dreyfus portfolio are based on numerous factors, may not be relied on as an indication of trading intent on behalf of any Dreyfus portfolio.
Not FDIC-Insured • Not Bank-Guaranteed • May Lose Value
| | | Contents |
| |
| | | T H E P O R T F O L I O |
| |
|
| 2 | | A Letter from the CEO |
| 3 | | Discussion of Performance |
| 6 | | Portfolio Performance |
| 8 | | Understanding Your Portfolio’s Expenses |
| 8 | | Comparing Your Portfolio’s Expenses |
| | | With Those of Other Funds |
| 9 | | Statement of Investments |
| 15 | | Statement of Assets and Liabilities |
| 16 | | Statement of Operations |
| 17 | | Statement of Changes in Net Assets |
| 19 | | Financial Highlights |
| 21 | | Notes to Financial Statements |
| 29 | | Report of Independent Registered |
| | | Public Accounting Firm |
| 30 | | Important Tax Information |
| 30 | | Proxy Results |
| 31 | | Board Members Information |
| 34 | | Officers of the Fund |
| |
| | | F O R M O R E I N F O R M AT I O N |
| |
|
| | | Back Cover |
Dreyfus Variable Investment Fund,
International Value Portfolio
|
The Portfolio

We are pleased to present this annual report for Dreyfus Variable Investment Fund, International Value Portfolio, covering the 12-month period from January 1, 2006, through December 31, 2006.
2006 proved to be a good year for the financial markets, with most economic sectors and geographic regions of the global equity markets generating strong returns.A number of positive factors contributed to gains in international developed and developing markets, including an expanding global economy, rising commodity prices, financial reforms in key emerging markets, falling trade barriers, rising standards of living and robust corporate profits.
In our analysis, 2006 provided an excellent reminder of the need for a long-term investment perspective. Adopting too short a time frame proved costly for some investors last year, as chasing recent winners sometimes meant buying the next month’s losers. Indeed, history shows that reacting to near-term developments with extreme shifts in strategy rarely is the right decision.We believe that a better course of action is to set a portfolio mix to meet future goals, while attempting to ignore short term market fluctuations in favor of a longer-term view.
For information about how the portfolio performed during the reporting period, as well as market perspectives, we have provided a Discussion of Performance given by the portfolio manager.
Thank you for your continued confidence and support.We wish you good health and prosperity in 2007.

Thomas F. Eggers
Chief Executive Officer
The Dreyfus Corporation
January 16, 2007
|

DISCUSSION OF PERFORMANCE
D. Kirk Henry, Senior Portfolio Manager
How did Dreyfus Variable Investment Fund, International Value Portfolio perform relative to its benchmark?
For the 12-month period ended December 31, 2006, the portfolio produced total returns of 22.60% for its Initial shares and 22.39% for its Service shares.1 This compares with a 26.34% return for the portfolio’s benchmark, the Morgan Stanley Capital International Europe, Australasia, Far East Index (“MSCI EAFE Index”), for the same period.2
While strong global economic growth continued to drive international stock markets higher during the first half of 2006, intensifying concerns regarding a potential economic slowdown produced a brief period of heightened market volatility in the spring. However, those concerns proved short-lived, and most international stocks gained value over the second half of the year. Although the portfolio participated in the market’s rise to a significant degree, its returns lagged the benchmark, primarily due to disappointing individual stock selections in France, Japan and Switzerland.
What is the portfolio’s investment approach?
The portfolio seeks long-term capital growth by investing in stocks of foreign companies that we consider to be value companies. The portfolio may invest in companies of any size, and may also invest in companies located in emerging markets.Our investment approach is value-oriented and research-driven. When selecting stocks, we conduct extensive quantitative and fundamental research that emphasizes individual stock selection rather than economic and industry trends.We focus on how a stock is valued relative to its intrinsic worth, the company’s underlying business health as measured by return on assets and return on equity, and the presence of a catalyst that may trigger an increase in the stock price.
What other factors influenced the portfolio’s performance?
When the reporting period began, the international equity markets had completed their third calendar year of solid performance, as corporate restructuring efforts and positive earnings announcements overshad-
The Portfolio 3
DISCUSSION OF PERFORMANCE (continued)
|
owed concerns about potentially rising interest rates.However,beginning in May 2006, fears of a possible economic slowdown in the United States triggered a major sell-off in the global equity markets. Investors moved quickly to shed what they perceived to be riskier investments, particularly commodity stocks and emerging-markets equities. While the correction resulted in a modest retrenchment across countries and market sectors, it proved to be relatively short-lived, and stocks generally gained value through the balance of the reporting period. In fact, for the reporting period overall, the portfolio posted positive absolute returns in all of the countries in which it invests.
In this favorable market environment, our bottom-up security selection process proved to be successful across a wide array of holdings in Asia. In Hong Kong, Bank of East Asia, which was sold during the reporting period, and the BOC Hong Kong Holdings both posted solid gains due to their ability to help satisfy mainland China’s borrowing needs. Two Singapore banks, DBS Group Holdings and United Overseas Bank, also benefited from Asia’s general economic strength as well as increased lending activities stemming from a rally in its domestic real estate market.
In Europe, aggressive corporate restructuring efforts coupled with improving domestic economic conditions aided a number of the portfolio’s German holdings, most notably Volkswagen and airline Lufthansa, which we later sold after they reached our price targets. In the United Kingdom, an overweight in private gas supplier and distributor Centrica benefited from takeover speculation from Russian natural gas giant Gazprom. Additionally, our overweight position in Alliance Boots Group, the pharmacy-led health and beauty group which was sold during the reporting period, rallied due to efficiencies realized from a 2005 merger. Finally, U.K.-based global mining firm Anglo American posted strong results due to increased demand for commodities in worldwide markets.
However, the portfolio’s relative performance was hindered by a number of company-specific disappointments. For example, two Japanese consumer lenders,Takefuji and Aiful, fell sharply following the adoption of new government regulations designed to reform the lending practices of consumer finance companies. In France, consumer electronics and media conglomerate Thomson reported inconsistent earnings after a shift in the firm’s business mix. France Telecom also lagged due to com-
petitive pressures in its domestic fixed line business. In Switzerland, Ciba Specialty Chemicals was hurt by higher input oil prices during much of the reporting period, which it was unable to pass on to its customers.
What is the portfolio’s current strategy?
As of the end of 2006, many of the economic factors that have contributed to a strong international stock market in 2006 appear to still be in place. In our view, demand for a variety of goods and services in the emerging markets, particularly China and India, in conjunction with improving domestic economies in Europe, Japan and the United States have provided a solid foundation for strong equity market performance. However, we are also aware that market sentiment can change very quickly, as we witnessed in May and June of 2006. As value-oriented investors, we remain cognizant of price risks embedded in the portfolio’s holdings, and we intend to continue to adjust the portfolio’s composition as new opportunities arise.
| | | Investing in foreign companies involves special risks, including changes in currency rates, |
| | | political, economic and social instability, a lack of comprehensive company information, |
| | | differing auditing and legal standards and less market liquidity. An investment in this fund |
| | | should be considered only as a supplement to an overall investment program. |
| | | The portfolio is only available as a funding vehicle under variable life insurance policies or variable |
| | | annuity contracts issued by insurance companies. Individuals may not purchase shares of the |
| | | portfolio directly. A variable annuity is an insurance contract issued by an insurance company that |
| | | enables investors to accumulate assets on a tax-deferred basis for retirement or other long-term |
| | | goals.The investment objective and policies of Dreyfus Variable Investment Fund, International |
| | | Value Portfolio made available through insurance products may be similar to other funds/portfolios |
| | | managed or advised by Dreyfus. However, the investment results of the portfolio may be higher or |
| | | lower than, and may not be comparable to, those of any other Dreyfus fund/portfolio. |
| 1 | | Total return includes reinvestment of dividends and any capital gains paid. Past performance is no |
| | | guarantee of future results. Share price and investment return fluctuate such that upon redemption, |
| | | portfolio shares may be worth more or less than their original cost.The portfolio’s performance does |
| | | not reflect the deduction of additional charges and expenses imposed in connection with investing |
| | | in variable insurance contracts, which will reduce returns. Return figures provided reflect the |
| | | absorption of certain portfolio expenses by The Dreyfus Corporation pursuant to an agreement in |
| | | effect through December 31, 2007, at which time it may be extended, terminated or modified. |
| | | Had these expenses not been absorbed, the portfolio’s returns would have been lower. |
| 2 | | SOURCE: LIPPER INC. — Reflects reinvestment of net dividends and, where applicable, |
| | | capital gain distributions.The Morgan Stanley Capital International Europe, Australasia, Far |
| | | East (MSCI EAFE) Index is an unmanaged index composed of a sample of companies |
| | | representative of the market structure of European and Pacific Basin countries. |
The Portfolio 5
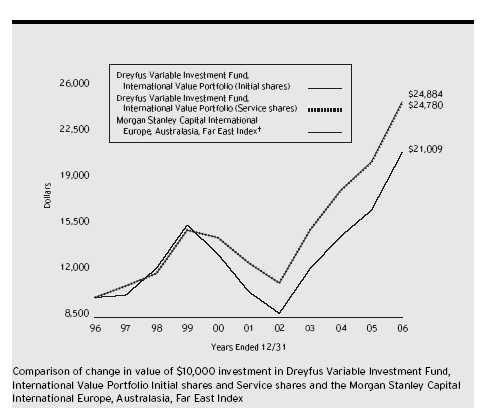
| Average Annual Total Returns as of | | 12/31/06 | | | | |
| |
| | | 1 Year | | 5 Years | | 10 Years |
| |
| |
| |
|
| Initial shares | | 22.60% | | 14.53% | | 9.55% |
| Service shares | | 22.39% | | 14.39% | | 9.50% |
| |
| The data for Service shares includes the results of Initial shares for the period prior to December 31, 2000 |
| (inception date of Service shares). Actual Service shares’ average annual total return and hypothetical growth |
| results would have been lower. See notes below. | | | | | | |
| † Source: Lipper Inc. | | | | | | |
| Past performance is not predictive of future performance.The portfolio’s performance shown in the graph and table does not |
| reflect the deduction of taxes that a shareholder would pay on portfolio distributions or the redemption of portfolio shares. |
| The portfolio’s performance does not reflect the deduction of additional charges and expenses imposed in |
| connection with investing in variable insurance contracts which will reduce returns. | | |
| The above graph compares a $10,000 investment made in Initial and Service shares of Dreyfus Variable Investment |
| Fund, International Value Portfolio on 12/31/96 to a $10,000 investment made in the Morgan Stanley Capital |
| International Europe, Australasia, Far East Index (the “Index”) on that date. | | | | |
| |
| 6 | | | | | | |
The portfolio’s Initial shares are not subject to a Rule 12b-1 fee.The portfolio’s Service shares are subject to a 0.25% annual Rule 12b-1 fee.The performance figures for Service shares reflect the performance of the portfolio’s Initial shares from their inception date through December 30, 2000, and the performance of the portfolio’s Service shares from December 31, 2000 (inception date of Service shares) to December 31, 2006 (blended performance figures).The performance figures for each share class reflect certain expense reimbursements, without which the performance of each share class would have been lower. In addition, the blended performance figures have not been adjusted to reflect the higher operating expenses of the Service shares. If these expenses had been reflected, the blended performance figures would have been lower. All dividends and capital gain distributions are reinvested.
The portfolio’s performance shown in the line graph takes into account all applicable portfolio fees and expenses (after any expense reimbursements).The Index is an unmanaged index composed of a sample of companies representative of the market structure of European and Pacific Basin countries and includes net dividends reinvested.The Index does not take into account charges, fees and other expenses. Further information relating to portfolio performance, including expense reimbursements, if applicable, is contained in the Financial Highlights section of the prospectus and elsewhere in this report.
The Portfolio 7
UNDERSTANDING YOUR
PORTFOLIO’S EXPENSES (Unaudited)
As a mutual fund investor,you pay ongoing expenses,such as management fees and other expenses.Using the information below,you can estimate how these expenses affect your investment and compare them with the expenses of other funds.You also may pay one-time transaction expenses, including sales charges (loads) and redemption fees, which are not shown in this section and would have resulted in higher total expenses. For more information, see your portfolio’s prospectus or talk to your financial adviser.
Review your portfolio’s expenses
|
The table below shows the expenses you would have paid on a $1,000 investment in Dreyfus Variable Investment Fund, International Value Portfolio from July 1, 2006 to December 31, 2006. It also shows how much a $1,000 investment would be worth at the close of the period, assuming actual returns and expenses.
| Expenses and Value of a $1,000 Investment | | |
| assuming actual returns for the six months ended December 31, 2006 |
| | | Initial Shares | | Service Shares |
| |
| |
|
| Expenses paid per $1,000 † | | $ 6.31 | | $ 7.43 |
| Ending value (after expenses) | | $1,121.30 | | $1,120.30 |
COMPARING YOUR PORTFOLIO’S EXPENSES WITH THOSE OF OTHER FUNDS (Unaudited)
Using the SEC’s method to compare expenses
The Securities and Exchange Commission (SEC) has established guidelines to help investors assess fund expenses. Per these guidelines, the table below shows your portfolio’s expenses based on a $1,000 investment, assuming a hypothetical 5% annualized return. You can use this information to compare the ongoing expenses (but not transaction expenses or total cost) of investing in the portfolio with those of other funds. All mutual fund shareholder reports will provide this information to help you make this comparison. Please note that you cannot use this information to estimate your actual ending account balance and expenses paid during the period.
Expenses and Value of a $1,000 Investment assuming a hypothetical 5% annualized return for the six months ended December 31, 2006
| | | Initial Shares | | Service Shares |
| |
| |
|
| Expenses paid per $1,000 † | | $ 6.01 | | $ 7.07 |
| Ending value (after expenses) | | $1,019.26 | | $1,018.20 |
† Expenses are equal to the portfolio’s annualized expense ratio of 1.18% for Initial shares and 1.39% for Service shares, multiplied by the average account value over the period, multiplied by 184/365 (to reflect the one-half year period).
STATEMENT OF INVESTMENTS
December 31, 2006
|
| Common Stocks—94.1% | | Shares | | Value ($) |
| |
| |
|
| Australia—3.5% | | | | |
| Amcor | | 252,907 | | 1,447,608 |
| Coca-Cola Amatil | | 141,386 | | 866,204 |
| Insurance Australia Group | | 141,541 | | 709,591 |
| National Australia Bank | | 47,030 | | 1,500,059 |
| Tabcorp Holdings | | 107,503 | | 1,430,120 |
| Telstra | | 317,670 | | 1,038,314 |
| | | | | 6,991,896 |
| Belgium—.8% | | | | |
| Fortis | | 36,620 | | 1,561,340 |
| Brazil—.4% | | | | |
| Petroleo Brasileiro, ADR | | 7,290 a | | 750,797 |
| Finland—1.6% | | | | |
| M-real, Cl. B | | 87,850 | | 555,290 |
| Nokia | | 55,120 | | 1,125,959 |
| Nokia, ADR | | 20,790 | | 422,453 |
| UPM-Kymmene | | 42,088 | | 1,061,912 |
| | | | | 3,165,614 |
| France—9.5% | | | | |
| BNP Paribas | | 13,430 | | 1,464,742 |
| Carrefour | | 16,380 | | 992,995 |
| Credit Agricole | | 42,830 | | 1,800,678 |
| France Telecom | | 95,570 | | 2,642,092 |
| Lagardere | | 13,780 | | 1,109,229 |
| Peugeot | | 13,270 | | 879,057 |
| Sanofi-Aventis | | 41,270 | | 3,809,469 |
| Thomson | | 68,860 | | 1,345,750 |
| Total | | 46,620 | | 3,362,054 |
| Total, ADR | | 2,690 | | 193,465 |
| Valeo | | 32,458 | | 1,350,480 |
| | | | | 18,950,011 |
| Germany—7.8% | | | | |
| Allianz | | 6,200 | | 1,267,399 |
| Deutsche Bank | | 5,110 | | 684,970 |
The Portfolio 9
STATEMENT OF INVESTMENTS (continued)
|
| Common Stocks (continued) | | Shares | | Value ($) |
| |
| |
|
| Germany (continued) | | | | |
| Deutsche Post | | 93,140 | | 2,814,583 |
| Deutsche Telekom | | 88,110 | | 1,614,990 |
| E.ON | | 7,929 | | 1,080,734 |
| Hannover Rueckversicherung | | 34,700 a | | 1,605,402 |
| Infineon Technologies | | 108,490 a | | 1,528,985 |
| Medion | | 9,600 | | 100,078 |
| Metro | | 24,230 | | 1,540,823 |
| Siemens | | 32,170 | | 3,209,336 |
| | | | | 15,447,300 |
| Greece—.9% | | | | |
| Public Power | | 69,050 | | 1,749,473 |
| Hong Kong—1.4% | | | | |
| BOC Hong Kong Holdings | | 373,000 | | 1,014,265 |
| CITIC Pacific | | 112,500 | | 388,355 |
| Hutchison Whampoa | | 126,900 | | 1,288,905 |
| | | | | 2,691,525 |
| Ireland—.4% | | | | |
| Bank of Ireland | | 36,236 | | 836,798 |
| Israel—.7% | | | | |
| Teva Pharmaceutical | | | | |
| Industries, ADR | | 43,270 | | 1,344,832 |
| Italy—4.6% | | | | |
| Enel | | 83,620 | | 862,346 |
| ENI | | 55,635 | | 1,870,638 |
| Mediaset | | 169,050 | | 2,005,475 |
| Saras | | 211,010 a | | 1,126,325 |
| UniCredito Italiano | | 213,110 | | 1,867,300 |
| Unipol | | 411,120 | | 1,481,063 |
| | | | | 9,213,147 |
| Japan—24.5% | | | | |
| 77 Bank | | 150,500 | | 954,572 |
| Aeon | | 111,200 | | 2,405,511 |
| Aiful | | 26,512 | | 746,127 |
| Astellas Pharma | | 29,200 | | 1,327,105 |
| Common Stocks (continued) | | Shares | | Value ($) |
| |
| |
|
| Japan (continued) | | | | |
| Canon | | 12,159 | | 684,381 |
| Dentsu | | 833 | | 2,442,282 |
| FUJIFILM Holdings | | 42,200 | | 1,733,591 |
| Funai Electric | | 12,900 | | 1,043,617 |
| Hino Motors | | 320,900 | | 1,649,858 |
| JS Group | | 63,100 | | 1,327,891 |
| Kao | | 64,500 | | 1,739,362 |
| Kuraray | | 56,900 | | 671,127 |
| Lawson | | 30,100 | | 1,077,213 |
| Mabuchi Motor | | 8,100 | | 481,774 |
| Matsumotokiyoshi | | 43,140 | | 958,586 |
| Mitsubishi | | 90,100 | | 1,695,501 |
| Mitsubishi UFJ Financial Group | | 182 | | 2,247,574 |
| Mitsui Trust Holdings | | 75,800 | | 869,852 |
| Nippon Express | | 479,100 | | 2,620,188 |
| Nippon Paper Group | | 377 | | 1,422,044 |
| Nissan Motor | | 155,800 | | 1,875,595 |
| NOK | | 14,300 | | 281,111 |
| Nomura Holdings | | 42,000 | | 792,120 |
| ORIX | | 740 | | 214,164 |
| Ricoh | | 97,300 | | 1,986,298 |
| Rinnai | | 7,800 | | 233,276 |
| Rohm | | 29,800 | | 2,966,606 |
| Sankyo | | 6,000 | | 332,171 |
| Sekisui Chemical | | 189,500 | | 1,510,778 |
| Sekisui House | | 125,000 | | 1,819,843 |
| SFCG | | 3,508 | | 544,906 |
| Shinsei Bank | | 213,200 | | 1,253,749 |
| Sumitomo Chemical | | 42,000 | | 325,669 |
| Sumitomo Mitsui Financial Group | | 310 | | 3,177,217 |
| Takefuji | | 39,890 | | 1,578,375 |
| TDK | | 15,500 | | 1,231,823 |
| Toyoda Gosei | | 22,400 | | 518,436 |
| | | | | 48,740,293 |
The Portfolio 11
STATEMENT OF INVESTMENTS (continued)
|
| Common Stocks (continued) | | Shares | | Value ($) |
| |
| |
|
| Mexico—.8% | | | | |
| Coca-Cola Femsa, ADR | | 21,800 | | 828,400 |
| Telefonos de Mexico, ADR, Ser. L | | 25,142 | | 710,513 |
| | | | | 1,538,913 |
| Netherlands—4.1% | | | | |
| ABN AMRO Holding | | 60,299 | | 1,937,543 |
| Aegon | | 79,355 | | 1,512,111 |
| Koninklijke Philips Electronics | | 50,470 | | 1,902,768 |
| Royal Dutch Shell, Cl. A | | 80,898 | | 2,852,440 |
| | | | | 8,204,862 |
| Singapore—2.0% | | | | |
| DBS Group Holdings | | 150,530 | | 2,217,283 |
| United Overseas Bank | | 137,000 | | 1,732,256 |
| | | | | 3,949,539 |
| South Africa—.5% | | | | |
| Nedbank Group | | 57,475 | | 1,094,645 |
| South Korea—1.4% | | | | |
| Korea Electric Power, ADR | | 39,620 | | 899,770 |
| KT, ADR | | 32,930 | | 834,775 |
| SK Telecom, ADR | | 36,150 | | 957,252 |
| | | | | 2,691,797 |
| Spain—1.7% | | | | |
| Banco Bilbao Vizcaya Argentaria | | 39,910 | | 960,614 |
| Banco Santander Central Hispano | | 43,800 | | 817,271 |
| Repsol YPF | | 33,740 | | 1,166,511 |
| Repsol YPF, ADR | | 14,670 | | 506,115 |
| | | | | 3,450,511 |
| Sweden—.4% | | | | |
| Svenska Cellulosa, Cl. B | | 14,930 | | 779,364 |
| Switzerland—6.6% | | | | |
| Ciba Specialty Chemicals | | 35,716 | | 2,374,913 |
| Clariant | | 53,860 a | | 806,420 |
| Credit Suisse Group | | 15,300 | | 1,070,084 |
| Common Stocks (continued) | | Shares | | Value ($) |
| |
| |
|
| Switzerland (continued) | | | | |
| Nestle | | 7,535 | | 2,676,721 |
| Novartis | | 51,150 | | 2,947,976 |
| Swiss Reinsurance | | 23,340 | | 1,983,776 |
| UBS | | 22,100 | | 1,342,608 |
| | | | | 13,202,498 |
| Taiwan—.6% | | | | |
| United Microelectronics, ADR | | 367,017 | | 1,280,889 |
| United Kingdom—19.9% | | | | |
| Anglo American | | 17,915 | | 874,095 |
| BHP Billiton | | 73,600 | | 1,347,178 |
| BP | | 292,368 | | 3,249,852 |
| Cadbury Schweppes | | 154,568 | | 1,654,542 |
| Carnival | | 13,878 | | 703,492 |
| Centrica | | 225,020 | | 1,562,447 |
| Debenhams | | 339,820 | | 1,262,986 |
| Friends Provident | | 193,680 | | 823,213 |
| GlaxoSmithKline | | 150,515 | | 3,962,297 |
| HBOS | | 63,094 | | 1,398,951 |
| HSBC Holdings | | 167,908 | | 3,061,886 |
| Old Mutual | | 281,870 | | 962,032 |
| Reed Elsevier | | 168,680 | | 1,851,856 |
| Rentokil Initial | | 641,770 | | 2,083,535 |
| Royal Bank of Scotland Group | | 92,649 | | 3,616,729 |
| Royal Dutch Shell, Cl. A | | 11,894 | | 415,847 |
| SABMiller | | 83,820 | | 1,929,094 |
| Smiths Group | | 93,710 | | 1,819,896 |
| Trinity Mirror | | 149,560 | | 1,375,368 |
| Unilever | | 110,242 | | 3,083,495 |
| Vodafone Group | | 965,715 | | 2,676,538 |
| | | | | 39,715,329 |
| Total Common Stocks | | | | |
| (cost $159,657,932) | | | | 187,351,373 |
The Portfolio 13
STATEMENT OF INVESTMENTS (continued)
|
| Other Investment—6.0% | | | | Shares | | Value ($) |
| |
| |
| |
|
| Registered Investment Company; | | | | |
| Dreyfus Institutional Preferred | | | | | | |
| Plus Money Market Fund | | | | | | |
| (cost $11,940,000) | | | | 11,940,000 b | | 11,940,000 |
| |
| |
| |
|
| |
| Total Investments (cost $171,597,932) | | 100.1% | | 199,291,373 |
| |
| Liabilities, Less Cash and Receivables | | (.1%) | | (201,006) |
| |
| Net Assets | | | | 100.0% | | 199,090,367 |
| |
| ADR—American Depository Receipts | | | | |
| a | | Non-income producing security. | | | | | | |
| b | | Investment in affiliated money market mutual fund. | | | | |
| |
| |
| |
|
| |
| |
| |
| |
| Portfolio Summary (Unaudited) † | | | | |
| |
| | | | | Value (%) | | | | Value (%) |
| |
| |
| |
| |
|
| Financial | | 21.2 | | Materials | | 5.9 |
| Consumer Discretionary | | 13.6 | | Telecommunication Services | | 5.3 |
| Consumer Staples | | 9.9 | | Insurance | | 5.2 |
| Industrials | | 9.5 | | Utilities | | 3.1 |
| Energy | | 7.8 | | Forward Currency | | |
| Health Care | | 6.7 | | Exchange Contracts | | .0 |
| Money Market Investment | | 6.0 | | | | |
| Information Technology | | 5.9 | | | | 100.1 |
| |
| † | | Based on net assets. | | | | | | |
| See notes to financial statements. | | | | | | |
STATEMENT OF ASSETS AND LIABILITIES
December 31, 2006
| | | Cost | | Value |
| |
| |
|
| Assets ($): | | | | |
| Investments in securities—See Statement of Investments: | | |
| Unaffiliated issuers | | 159,657,932 | | 187,351,373 |
| Affiliated issuers | | 11,940,000 | | 11,940,000 |
| Cash | | | | 1,275,260 |
| Cash denominated in foreign currencies | | 3,312,876 | | 3,319,744 |
| Receivable for shares of Beneficial Interest subscribed | | 561,953 |
| Receivable for investment securities sold | | | | 307,938 |
| Dividends and interest receivable | | | | 271,469 |
| Unrealized appreciation on forward | | | | |
| currency exchange contracts—Note 4 | | | | 1,807 |
| Prepaid expenses | | | | 15,203 |
| | | | | 205,044,747 |
| |
| |
|
| Liabilities ($): | | | | |
| Due to The Dreyfus Corporation and affiliates—Note 3(b) | | 184,516 |
| Payable for investment securities purchased | | 5,627,655 |
| Payable for shares of Beneficial Interest redeemed | | 6,498 |
| Accrued expenses | | | | 135,711 |
| | | | | 5,954,380 |
| |
| |
|
| Net Assets ($) | | | | 199,090,367 |
| |
| |
|
| Composition of Net Assets ($): | | | | |
| Paid-in capital | | | | 143,389,851 |
| Accumulated undistributed investment income—net | | 3,037,430 |
| Accumulated net realized gain (loss) on investments | | 24,968,169 |
| Accumulated net unrealized appreciation (depreciation) | | |
| on investments and foreign currency transactions | | 27,694,917 |
| |
|
| Net Assets ($) | | | | 199,090,367 |
| |
| |
|
| |
| |
| Net Asset Value Per Share | | | | |
| | | Initial Shares | | Service Shares |
| |
| |
|
| Net Assets ($) | | 118,732,861 | | 80,357,506 |
| Shares Outstanding | | 6,089,667 | | 4,128,062 |
| |
| |
|
| Net Asset Value Per Share ($) | | 19.50 | | 19.47 |
See notes to financial statements.
|
The Portfolio 15
STATEMENT OF OPERATIONS
Year Ended December 31, 2006
|
| Investment Income ($): | | |
| Income: | | |
| Cash dividends (net of $402,599 foreign taxes withheld at source): | | |
| Unaffiliated issuers | | 4,687,614 |
| Affiliated issuers | | 178,510 |
| Interest | | 73,645 |
| Total Income | | 4,939,769 |
| Expenses: | | |
| Investment advisory fee—Note 3(a) | | 1,796,030 |
| Custodian fees | | 237,404 |
| Distribution fees—Note 3(b) | | 173,268 |
| Professional fees | | 35,596 |
| Trustees’ fees and expenses—Note 3(c) | | 25,415 |
| Prospectus and shareholders’ reports | | 18,770 |
| Shareholder servicing costs—Note 3(b) | | 1,327 |
| Loan commitment fees—Note 2 | | 924 |
| Registration fees | | 664 |
| Miscellaneous | | 22,503 |
| Total Expenses | | 2,311,901 |
| Less—waiver of fees due to | | |
| undertaking—Note 3(a) | | (27,513) |
| Less—reduction in custody fees due | | |
| to earnings credits—Note 1(c) | | (26,760) |
| Net Expenses | | 2,257,628 |
| Investment Income—Net | | 2,682,141 |
| |
|
| Realized and Unrealized Gain (Loss) on Investments—Note 4 ($): |
| Net realized gain (loss) on investments and foreign currency transactions | | 27,199,800 |
| Net realized gain (loss) on forward currency exchange contracts | | (61,266) |
| Net Realized Gain (Loss) | | 27,138,534 |
| Net unrealized appreciation (depreciation) on investments | | |
| and foreign currency transactions | | 6,084,187 |
| Net Realized and Unrealized Gain (Loss) on Investments | | 33,222,721 |
| Net Increase in Net Assets Resulting from Operations | | 35,904,862 |
See notes to financial statements.
|
STATEMENT OF CHANGES IN NET ASSETS
| | | Year Ended December 31, |
| |
|
| | | 2006 | | 2005 |
| |
| |
|
| Operations ($): | | | | |
| Investment income—net | | 2,682,141 | | 1,757,635 |
| Net realized gain (loss) on investments | | 27,138,534 | | 14,093,737 |
| Net unrealized appreciation | | | | |
| (depreciation) on investments | | 6,084,187 | | (669,066) |
| Net Increase (Decrease) in Net Assets | | | | |
| Resulting from Operations | | 35,904,862 | | 15,182,306 |
| |
| |
|
| Dividends to Shareholders from ($): | | | | |
| Investment income—net: | | | | |
| Initial shares | | (1,436,718) | | — |
| Service shares | | (774,660) | | — |
| Net realized gain on investments: | | | | |
| Initial shares | | (8,117,896) | | (1,331,789) |
| Service shares | | (4,855,489) | | (527,874) |
| Total Dividends | | (15,184,763) | | (1,859,663) |
| |
| |
|
| Beneficial Interest Transactions ($): | | | | |
| Net proceeds from shares sold: | | | | |
| Initial shares | | 44,686,930 | | 37,251,329 |
| Service shares | | 41,187,469 | | 25,773,157 |
| Dividends reinvested: | | | | |
| Initial shares | | 9,554,614 | | 1,331,789 |
| Service shares | | 5,630,149 | | 527,874 |
| Cost of shares redeemed: | | | | |
| Initial shares | | (42,990,171) | | (40,886,960) |
| Service shares | | (28,941,578) | | (10,908,937) |
| Increase (Decrease) in Net Assets from | | | | |
| Beneficial Interest Transactions | | 29,127,413 | | 13,088,252 |
| Total Increase (Decrease) in Net Assets | | 49,847,512 | | 26,410,895 |
| |
| |
|
| Net Assets ($): | | | | |
| Beginning of Period | | 149,242,855 | | 122,831,960 |
| End of Period | | 199,090,367 | | 149,242,855 |
| Undistributed investment income—net | | 3,037,430 | | 1,875,213 |
The Portfolio 17
STATEMENT OF CHANGES IN NET ASSETS (continued)
|
| | | Year Ended December 31, |
| |
|
| | | 2006 | | 2005 |
| |
| |
|
| Capital Share Transactions: | | | | |
| Initial Shares | | | | |
| Shares sold | | 2,475,239 | | 2,332,353 |
| Shares issued for dividends reinvested | | 552,929 | | 85,481 |
| Shares redeemed | | (2,370,679) | | (2,584,421) |
| Net Increase (Decrease) in Shares Outstanding | | 657,489 | | (166,587) |
| |
| |
|
| Service Shares | | | | |
| Shares sold | | 2,273,307 | | 1,598,408 |
| Shares issued for dividends reinvested | | 325,819 | | 33,860 |
| Shares redeemed | | (1,576,522) | | (677,869) |
| Net Increase (Decrease) in Shares Outstanding | | 1,022,604 | | 954,399 |
See notes to financial statements.
|
The following tables describe the performance for each share class for the fiscal periods indicated.All information (except portfolio turnover rate) reflects financial results for a single portfolio share. Total return shows how much your investment in the portfolio would have increased (or decreased) during each period, assuming you had reinvested all dividends and distributions.These figures have been derived from the portfolio’s financial statements.
| | | | | Year Ended December 31, | | |
| |
| |
| |
|
| Initial Shares | | 2006 | | 2005 | | 2004 | | 2003 | | 2002 |
| |
| |
| |
| |
| |
|
| Per Share Data ($): | | | | | | | | | | |
| Net asset value, beginning of period | | 17.49 | | 15.85 | | 13.54 | | 10.04 | | 11.56 |
| Investment Operations: | | | | | | | | | | |
| Investment income—net a | | .29 | | .22 | | .16 | | .12 | | .12 |
| Net realized and unrealized | | | | | | | | | | |
| gain (loss) on investments | | 3.44 | | 1.64 | | 2.54 | | 3.51 | | (1.53) |
| Total from Investment Operations | | 3.73 | | 1.86 | | 2.70 | | 3.63 | | (1.41) |
| Distributions: | | | | | | | | | | |
| Dividends from investment income—net | | (.26) | | — | | (.16) | | (.13) | | (.11) |
| Dividends from net realized | | | | | | | | | | |
| gain on investments | | (1.46) | | (.22) | | (.23) | | — | | — |
| Total Distributions | | (1.72) | | (.22) | | (.39) | | (.13) | | (.11) |
| Net asset value, end of period | | 19.50 | | 17.49 | | 15.85 | | 13.54 | | 10.04 |
| |
| |
| |
| |
| |
|
| Total Return (%) | | 22.60 | | 11.89 | | 20.02 | | 36.36 | | (12.23) |
| |
| |
| |
| |
| |
|
| Ratios/Supplemental Data (%): | | | | | | | | | | |
| Ratio of total expenses | | | | | | | | | | |
| to average net assets | | 1.19 | | 1.20 | | 1.25 | | 1.49 | | 1.47 |
| Ratio of net expenses | | | | | | | | | | |
| to average net assets | | 1.18 | | 1.17 | | 1.24 | | 1.41 | | 1.40 |
| Ratio of net investment income | | | | | | | | | | |
| to average net assets | | 1.59 | | 1.39 | | 1.08 | | 1.11 | | 1.10 |
| Portfolio Turnover Rate | | 60.27 | | 54.32 | | 44.05 | | 107.73 | | 47.18 |
| |
| |
| |
| |
| |
|
| Net Assets, end of period ($ x 1,000) | | 118,733 | | 94,988 | | 88,713 | | 58,849 | | 27,549 |
| |
| a Based on average shares outstanding at each month end. | | | | | | | | |
| See notes to financial statements. | | | | | | | | | | |
The Portfolio 19
FINANCIAL HIGHLIGHTS (continued)
|
| | | | | Year Ended December 31, | | |
| |
| |
| |
|
| Service Shares | | 2006 | | 2005 | | 2004 | | 2003 | | 2002 |
| |
| |
| |
| |
| |
|
| Per Share Data ($): | | | | | | | | | | |
| Net asset value, beginning of period | | 17.47 | | 15.86 | | 13.56 | | 10.06 | | 11.58 |
| Investment Operations: | | | | | | | | | | |
| Investment income—net a | | .24 | | .18 | | .06 | | .14 | | .12 |
| Net realized and unrealized | | | | | | | | | | |
| gain (loss) on investments | | 3.45 | | 1.65 | | 2.62 | | 3.49 | | (1.54) |
| Total from Investment Operations | | 3.69 | | 1.83 | | 2.68 | | 3.63 | | (1.42) |
| Distributions: | | | | | | | | | | |
| Dividends from investment income—net | | (.23) | | — | | (.15) | | (.13) | | (.10) |
| Dividends from net realized | | | | | | | | | | |
| gain on investments | | (1.46) | | (.22) | | (.23) | | — | | — |
| Total Distributions | | (1.69) | | (.22) | | (.38) | | (.13) | | (.10) |
| Net asset value, end of period | | 19.47 | | 17.47 | | 15.86 | | 13.56 | | 10.06 |
| |
| |
| |
| |
| |
|
| Total Return (%) | | 22.39 | | 11.69 | | 19.83 | | 36.28 | | (12.25) |
| |
| |
| |
| |
| |
|
| Ratios/Supplemental Data (%): | | | | | | | | | | |
| Ratio of total expenses | | | | | | | | | | |
| to average net assets | | 1.44 | | 1.45 | | 1.49 | | 1.75 | | 1.66 |
| Ratio of net expenses | | | | | | | | | | |
| to average net assets | | 1.38 | | 1.36 | | 1.39 | | 1.41 | | 1.40 |
| Ratio of net investment income | | | | | | | | | | |
| to average net assets | | 1.33 | | 1.10 | | .44 | | 1.29 | | 1.07 |
| Portfolio Turnover Rate | | 60.27 | | 54.32 | | 44.05 | | 107.73 | | 47.18 |
| |
| |
| |
| |
| |
|
| Net Assets, end of period ($ x 1,000) | | 80,358 | | 54,255 | | 34,119 | | 6,713 | | 4,441 |
| |
| a Based on average shares outstanding at each month end. | | | | | | | | |
| See notes to financial statements. | | | | | | | | | | |
NOTES TO FINANCIAL STATEMENTS
NOTE 1—Significant Accounting Policies:
Dreyfus Variable Investment Fund (the “fund”) is registered under the Investment Company Act of 1940, as amended (the “Act”), as an open-end management investment company, operating as a series company currently offering twelve series, including the International Value Portfolio (the “portfolio”). The portfolio is only offered to separate accounts established by insurance companies to fund variable annuity contracts and variable life insurance policies.The portfolio is a diversified series. The portfolio’s investment objective is long-term capital growth.The Dreyfus Corporation (the “Manager” or “Dreyfus”) serves as the portfolio’s investment adviser.The Manager is a wholly-owned subsidiary of Mellon Financial Corporation (“Mellon Financial”).
On December 4, 2006, Mellon Financial and The Bank of New York Company, Inc. announced that they had entered into a definitive agreement to merge. The new company will be called The Bank of New York Mellon Corporation. As part of this transaction, Dreyfus would become a wholly-owned subsidiary of The Bank of New York Mellon Corporation.The transaction is subject to certain regulatory approvals and the approval of The Bank of New York Company, Inc.’s and Mellon Financial’s shareholders, as well as other customary conditions to closing. Subject to such approvals and the satisfaction of the other conditions, Mellon Financial and The Bank of New York Company, Inc. expect the transaction to be completed in the third quarter of 2007.
Dreyfus Service Corporation (the “Distributor”), a wholly-owned subsidiary of the Manager, is the distributor of the portfolio’s shares, which are sold without a sales charge.The portfolio is authorized to issue an unlimited number of $.001 par value shares of Beneficial Interest in each of the following classes of shares: Initial and Service. Each class of shares has identical rights and privileges, except with respect to the distribution plan and the expenses borne by each class and certain voting rights. Income, expenses (other than expenses attributable to a specific class), and realized and unrealized gains or losses on investments are allocated to each class of shares based on its relative net assets.
The Portfolio 21
NOTES TO FINANCIAL STATEMENTS (continued)
|
The fund accounts separately for the assets, liabilities and operations of each series. Expenses directly attributable to each series are charged to that series’ operations; expenses which are applicable to all series are allocated among them on a pro rata basis.
The portfolio’s financial statements are prepared in accordance with U.S. generally accepted accounting principles, which may require the use of management estimates and assumptions.Actual results could differ from those estimates.
The fund enters into contracts that contain a variety of indemnifica-tions.The portfolio’s maximum exposure under these arrangements is unknown. The portfolio does not anticipate recognizing any loss related to these arrangements.
(a) Portfolio valuation: Investments in securities are valued at the last sales price on the securities exchange or national securities market on which such securities are primarily traded. Securities listed on the National Market System for which market quotations are available are valued at the official closing price or, if there is no official closing price that day, at the last sales price. Securities not listed on an exchange or the national securities market, or securities for which there were no transactions, are valued at the average of the most recent bid and asked prices, except for open short positions, where the asked price is used for valuation purposes. Bid price is used when no asked price is available. Registered open-end investment companies that are not traded on an exchange are valued at their net asset value.When market quotations or official closing prices are not readily available, or are determined not to reflect accurately fair value, such as when the value of a security has been significantly affected by events after the close of the exchange or market on which the security is principally traded (for example, a foreign exchange or market), but before the portfolio calculates its net asset value, the portfolio may value these investments at fair value as determined in accordance with the procedures approved by the Board of Trustees. Fair valuing of securities may be determined
with the assistance of a pricing service using calculations based on indices of domestic securities and other appropriate indicators, such as prices of relevant ADR’s and futures contracts. For other securities that are fair valued by the Board of Trustees, certain factors may be considered such as: fundamental analytical data, the nature and duration of restrictions on disposition, an evaluation of the forces that influence the market in which the securities are purchased and sold and public trading in similar securities of the issuer or comparable issuers. Financial futures are valued at the last sales price. Investments denominated in foreign currencies are translated to U.S. dollars at the prevailing rates of exchange. Forward currency exchange contracts are valued at the forward rate.
On September 20, 2006, the Financial Accounting Standards Board (FASB) released Statement of Financial Accounting Standards No. 157 “Fair Value Measurements” (“FAS 157”). FAS 157 establishes an authoritative definition of fair value, sets out a framework for measuring fair value, and requires additional disclosures about fair-value measurements. The application of FAS 157 is required for fiscal years beginning after November 15, 2007 and interim periods within those fiscal years. Management does not believe that the application of this standard will have a material impact on the financial statements of the portfolio.
(b) Foreign currency transactions: The portfolio does not isolate that portion of the results of operations resulting from changes in foreign exchange rates on investments from the fluctuations arising from changes in market prices of securities held. Such fluctuations are included with the net realized and unrealized gain or loss on investments.
Net realized foreign exchange gains or losses arise from sales and maturities of short-term securities, sales of foreign currencies, currency gains or losses realized on securities transactions and the difference between the amounts of dividends, interest and foreign withholding taxes recorded on the portfolio’s books and the U.S. dollar equivalent of the
The Portfolio 23
NOTES TO FINANCIAL STATEMENTS (continued)
|
amounts actually received or paid. Net unrealized foreign exchange gains or losses arise from changes in the value of assets and liabilities other than investments in securities, resulting from changes in exchange rates. Such gains and losses are included with net realized and unrealized gain or loss on investments.
(c) Securities transactions and investment income: Securities transactions are recorded on a trade date basis. Realized gain and loss from securities transactions are recorded on the identified cost basis. Dividend income is recognized on the ex-dividend date and interest income, including, where applicable, accretion of discount and amortization of premium on investments, is recognized on the accrual basis.
The portfolio has an arrangement with the custodian bank whereby the portfolio receives earnings credits from the custodian when positive cash balances are maintained, which are used to offset custody fees. For financial reporting purposes, the portfolio includes net earnings credits as an expense offset in the Statement of Operations.
(d) Affiliated issuers: Investments in other investment companies advised by the Manager are defined as “affiliated” in the Act.
(e) Dividends to shareholders: Dividends are recorded on the ex-dividend date. Dividends from investment income-net and dividends from net realized capital gain, if any, are normally declared and paid annually, but the portfolio may make distributions on a more frequent basis to comply with the distribution requirements of the Internal Revenue Code of 1986, as amended (the “Code”).To the extent that net realized capital gain can be offset by capital loss carryovers, if any, it is the policy of the portfolio not to distribute such gain. Income and capital gain distributions are determined in accordance with income tax regulations, which may differ from U.S. generally accepted accounting principles.
(f) Federal income taxes: It is the policy of the portfolio to continue to qualify as a regulated investment company, if such qualification is in the best interests of its shareholders, by complying with the applicable
provisions of the Code, and to make distributions of taxable income sufficient to relieve it from substantially all federal income and excise taxes.
On July 13, 2006, the FASB released FASB Interpretation No. 48 “Accounting for Uncertainty in Income Taxes” (FIN 48). FIN 48 provides guidance for how uncertain tax positions should be recognized, measured, presented and disclosed in the financial statements. FIN 48 requires the evaluation of tax positions taken or expected to be taken in the course of preparing the portfolio’s tax returns to determine whether the tax positions are “more-likely-than-not” of being sustained by the applicable tax authority. Tax positions not deemed to meet the more-likely-than-not threshold would be recorded as a tax benefit or expense in the current year.Adoption of FIN 48 is required for fiscal years beginning after December 15, 2006 and is to be applied to all open tax years as of the effective date. Management does not believe that the application of this standard will have a material impact on the financial statements of the portfolio.
At December 31, 2006, the components of accumulated earnings on a tax basis were as follows: undistributed ordinary income $8,108,713, undistributed capital gains $20,803,977 and unrealized appreciation $26,787,826.
The tax character of distributions paid to shareholders during the fiscal periods ended December 31, 2006 and December 31, 2005 were as follows: ordinary income $5,532,131 and $639,526 and long-term capital gains $9,652,632 and $1,220,137, respectively.
During the period ended December 31, 2006, as a result of permanent book to tax differences, primarily due to the tax treatment for passive foreign investment companies and foreign currency exchange gains and losses, the portfolio increased accumulated undistributed investment income-net by $691,454 and decreased accumulated net realized gain (loss) on investments by the same amount. Net assets were not affected by this reclassification.
The Portfolio 25
NOTES TO FINANCIAL STATEMENTS (continued)
|
NOTE 2—Bank Line of Credit:
|
The portfolio participates with other Dreyfus-managed funds in a $350 million redemption credit facility (the “Facility”) to be utilized for temporary or emergency purposes, including the financing of redemptions. In connection therewith, the portfolio has agreed to pay commitment fees on its pro rata portion of the Facility. Interest is charged to the portfolio based on prevailing market rates in effect at the time of borrowing. During the period ended December 31, 2006, the portfolio did not borrow under the Facility.
NOTE 3—Investment Advisory Fee and Other Transactions With Affiliates:
(a) Pursuant to an Investment Advisory Agreement with the Manager, the investment advisory fee is computed at the annual rate of 1% of the value of the portfolio’s average daily net assets and is payable monthly.
The Manager has agreed, from January 1, 2006 to December 31, 2007, to waive receipt of its fees and/or assume the expenses of the portfolio so that the expenses of neither class, exclusive of taxes, brokerage fees, interest on borrowings, commitment fees and extraordinary expenses, exceed an annual rate of 1.40% of the value of the average daily net assets of their class. During the period ended December 31, 2006, the Manager waived receipt of fees of $27,513, pursuant to the undertaking.
(b) Under the Distribution Plan (the “Plan”) adopted pursuant to Rule 12b-1 under the Act, Service shares pay the Distributor for distributing their shares, for servicing and/or maintaining Service shares shareholder accounts and for advertising and marketing for Service shares.The Plan provides for payments to be made at an annual rate of .25% of the value of the Service shares’ average daily net assets.The Distributor may make payments to Participating Insurance Companies and to brokers and dealers acting as principal underwriter for their variable insurance products.The fees payable under the Plan are payable without regard to actual expenses incurred. During the period ended December 31, 2006, Service shares were charged $173,268 pursuant to the Plan.
The portfolio compensates Dreyfus Transfer, Inc., a wholly-owned subsidiary of the Manager, under a transfer agency agreement for providing personnel and facilities to perform transfer agency services for the portfolio. During the period ended December 31, 2006, the portfolio was charged $442 pursuant to the transfer agency agreement.
During the period ended December 31, 2006, the portfolio was charged $4,204 for services performed by the Chief Compliance Officer.
The components of Due to The Dreyfus Corporation and affiliates in the Statement of Assets and Liabilities consist of: investment advisory fees $166,738, Rule 12b-1 distribution plan fees $17,306, chief compliance officer fees $2,044 and transfer agency per account fees $72, which are offset against an expense reimbursement currently in effect in the amount of $1,644.
(c) Each Board member also serves as a Board member of other funds within the Dreyfus complex. Annual retainer fees and attendance fees are allocated to each fund based on net assets.
(d) Pursuant to an exemptive order from the SEC, the portfolio may invest its available cash balances in affiliated money market mutual funds. Management fees of the underlying money market mutual funds have been waived by the Manager.
NOTE 4—Securities Transactions:
The aggregate amount of purchases and sales of investment securities, excluding short-term securities and forward currency exchange contracts, during the period ended December 31, 2006, amounted to $112,945,813 and $103,067,230, respectively.
The portfolio enters into forward currency exchange contracts in order to hedge its exposure to changes in foreign currency exchange rates on its foreign portfolio holdings and to settle foreign currency transactions. When executing forward currency exchange contracts, the portfolio is obligated to buy or sell a foreign currency at a specified rate on a certain date in the future. With respect to sales of forward currency
The Portfolio 27
NOTES TO FINANCIAL STATEMENTS (continued)
|
exchange contracts, the portfolio would incur a loss if the value of the contract increases between the date the forward contract is opened and the date the forward contract is closed.The portfolio realizes a gain if the value of the contract decreases between those dates.With respect to purchases of forward currency exchange contracts, the portfolio would incur a loss if the value of the contract decreases between the date the forward contract is opened and the date the forward contract is closed. The portfolio realizes a gain if the value of the contract increases between those dates.The portfolio is also exposed to credit risk associated with counterparty nonperformance on these forward currency exchange contracts which is typically limited to the unrealized gain on each open contract.The following summarizes open forward currency exchange contracts at December 31, 2006:
| | | Foreign | | | | | | |
| Forward Currency | | Currency | | | | | | Unrealized |
| Exchange Contracts | | Amounts | | Cost ($) | | Value ($) | | Appreciation ($) |
| |
| |
| |
| |
|
| Purchases: | | | | | | | | |
| British Pound, | | | | | | | | |
| expiring 1/2/2007 | | 150,859 | | 295,471 | | 295,488 | | 17 |
| Euro, | | | | | | | | |
| expiring 1/2/2007 | | 1,154,398 | | 1,521,553 | | 1,523,343 | | 1,790 |
| Total | | | | | | | | 1,807 |
At December 31, 2006, the cost of investments for federal income tax purposes was $172,505,023; accordingly, accumulated net unrealized appreciation on investments was $26,786,350, consisting of $31,205,333 gross unrealized appreciation and $4,418,983 gross unrealized depreciation.
REPORT OF INDEPENDENT REGISTERED
PUBLIC ACCOUNTING FIRM
|
Shareholders and Board of Trustees
Dreyfus Variable Investment Fund, International Value Portfolio
We have audited the accompanying statement of assets and liabilities, including the statement of investments, of Dreyfus Variable Investment Fund, International Value Portfolio (one of the funds comprising Dreyfus Variable Investment Fund) as of December 31, 2006, and the related statement of operations for the year then ended, the statement of changes in net assets for each of the two years in the period then ended, and financial highlights for each of the years indicated therein. These financial statements and financial highlights are the responsibility of the Fund’s management. Our responsibility is to express an opinion on these financial statements and financial highlights based on our audits.
We conducted our audits in accordance with the standards of the Public Company Accounting Oversight Board (United States).Those standards require that we plan and perform the audit to obtain reasonable assurance about whether the financial statements and financial highlights are free of material misstatement.We were not engaged to perform an audit of the Fund’s internal control over financial reporting. Our audits included consideration of internal control over financial reporting as a basis for designing audit procedures that are appropriate in the circumstances, but not for the purpose of expressing an opinion on the effectiveness of the Fund’s internal control over financial reporting. Accordingly, we express no such opinion.An audit also includes examining, on a test basis, evidence supporting the amounts and disclosures in the financial statements and financial highlights, assessing the accounting principles used and significant estimates made by management, and evaluating the overall financial statement presentation. Our procedures included confirmation of securities owned as of December 31, 2006 by correspondence with the custodian and others or by other appropriate auditing procedures where replies from others were not received. We believe that our audits provide a reasonable basis for our opinion.
In our opinion, the financial statements and financial highlights referred to above present fairly, in all material respects, the financial position of Dreyfus Variable Investment Fund, International Value Portfolio at December 31, 2006, the results of its operations for the year then ended, the changes in its net assets for each of the two years in the period then ended, and the financial highlights for each of the indicated years, in conformity with U. S. generally accepted accounting principles.

| | New York, New York
February 6, 2007
|
The Portfolio 29
IMPORTANT TAX INFORMATION (Unaudited)
In accordance with federal tax law, the portfolio elects to provide each shareholder with their portion of the portfolio’s foreign taxes paid and the income sourced from foreign countries.Accordingly, the portfolio hereby makes the following designations regarding its fiscal year ended December 31, 2006:
- the total amount of taxes paid to foreign countries was $365,602.
- the total amount of income sourced from foreign countries was $4,023,177.
As required by federal tax law rules, shareholders will receive notification of their proportionate share of foreign taxes paid and foreign sourced income for the 2006 calendar year with Form 1099-DIV which will be mailed by January 31, 2007.
Also the portfolio hereby designates $1.0880 per share as a long-term capital gain distribution paid on March 31, 2006.
PROXY RESULTS (Unaudited)
|
Dreyfus Variable Investment Fund held a special meeting of shareholders on June 29, 2006.The proposal considered at the meeting, and the results, are as follows:
| | | | | Shares | | |
| |
| |
| |
|
| | | Votes For | | | | Authority Withheld |
| |
| |
| |
|
| To elect additional Board Members: | | | | | | |
| Peggy C. Davis † | | 171,078,927 | | | | 7,687,714 |
| Joseph S. DiMartino | | 170,946,484 | | | | 7,820,156 |
| David P. Feldman | | 170,959,921 | | | | 7,806,720 |
| Ehud Houminer † | | 170,132,087 | | | | 8,634,554 |
| Gloria Messinger † | | 170,187,241 | | | | 8,579,400 |
| Anne Wexler † | | 170,212,607 | | | | 8,554,033 |
† Each new Board member’s term commenced on September 26, 2006.
In addition to Joseph S. DiMartino and David P. Feldman, James F. Henry, Dr. Paul A. Marks and Dr. Martin Peretz continue as Board members of the fund.
BOARD MEMBERS INFORMATION (Unaudited)
Joseph S. DiMartino (63)
Chairman of the Board (1995)
|
Principal Occupation During Past 5 Years:
• Corporate Director and Trustee
|
Other Board Memberships and Affiliations:
|
- The Muscular Dystrophy Association, Director
- Century Business Services, Inc., a provider of outsourcing functions for small and medium size companies, Director
- The Newark Group, a provider of a national market of paper recovery facilities, paperboard mills and paperboard converting plants, Director
- Sunair Services Corporation, engaging in the design, manufacture and sale of high frequency systems for long-range voice and data communications, as well as providing certain outdoor-related services to homes and businesses, Director
No. of Portfolios for which Board Member Serves: 190
———————
Peggy C. Davis (63) Board Member (2006)
Principal Occupation During Past 5 Years:
|
- Shad Professor of Law, New York University School of Law (1983-present)
- Writer and teacher in the fields of evidence, constitutional theory, family law, social sciences and the law, legal process and professional methodology and training
No. of Portfolios for which Board Member Serves: 80
|
David P. Feldman (67)
Board Member (1994)
|
Principal Occupation During Past 5 Years:
• Corporate Director and Trustee
|
Other Board Memberships and Affiliations:
|
- BBH Mutual Funds Group (11 funds), Director
- The Jeffrey Company, a private investment company, Director
- QMED, a medical device company, Director
No. of Portfolios for which Board Member Serves: 57
|
The Portfolio 31
BOARD MEMBERS INFORMATION (Unaudited) (continued)
James F. Henry (76)
Board Member (1990)
|
Principal Occupation During Past 5 Years:
|
- President,The International Institute for Conflict Prevention and Resolution, a non-profit organization principally engaged in the development of alternatives to business litigation (Retired 2003)
- Advisor to The Elaw Forum, a consultant on managing corporate legal costs
- Advisor to John Jay Homestead (the restored home of the first U.S. Chief Justice)
- Individual Trustee of several trusts
Other Board Memberships and Affiliations:
|
- Director, advisor and mediator involved in several non-profit organizations, primarily engaged in domestic and international dispute resolution, and historic preservation
No. of Portfolios for which Board Member Serves: 48
|
———————
Ehud Houminer (66) Board Member (2006)
Principal Occupation During Past 5 Years:
• Executive-in-Residence at the Columbia Business School, Columbia University
Other Board Memberships and Affiliations:
|
- Avnet Inc., an electronics distributor, Director
- International Advisory Board to the MBA Program School of Management, Ben Gurion University, Chairman
- Explore Charter School, Brooklyn, NY, Chairman
No. of Portfolios for which Board Member Serves: 78
———————
Gloria Messinger (77) Board Member (2006)
Principal Occupation During Past 5 Years:
|
- Arbitrator for American Arbitration Association and National Association of Securities Dealers, Inc.
- Consultant in Intellectual Property
Other Board Memberships and Affiliations:
|
- Theater for a New Audience, Inc., Director
- Brooklyn Philharmonic, Director
No. of Portfolios for which Board Member Serves: 48
|
Dr. Martin Peretz (67)
Board Member (1990)
|
Principal Occupation During Past 5 Years:
|
- Editor-in-Chief of The New Republic Magazine
- Lecturer in Social Studies at Harvard University (1965-2002)
- Director of TheStreet.com, a financial information service on the web
Other Board Memberships and Affiliations:
|
- American Council of Trustees and Alumni, Director
- Pershing Square Capital Management, Adviser
- Montefiore Ventures, General Partner
- Harvard Center for Blood Research,Trustee
- Bard College,Trustee
- Board of Overseers of YIVO Institute for Jewish Research, Chairman
No. of Portfolios for which Board Member Serves: 48
———————
Anne Wexler (76) Board Member (2006)
Principal Occupation During Past 5 Years:
|
- Chairman of the Wexler & Walker Public Policy Associates, consultants specializing in government relations and public affairs
Other Board Memberships and Affiliations:
|
- Wilshire Mutual Funds (5 funds), Director
- Methanex Corporation, a methanol producing company, Director
- Member of the Council of Foreign Relations
- Member of the National Park Foundation
No. of Portfolios for which Board Member Serves: 57
|
Once elected all Board Members serve for an indefinite term, but achieve Emeritus status on December 31st of the calendar year in which the Board Member reaches age 80.The address of the Board Members and Officers is in c/o The Dreyfus Corporation, 200 Park Avenue, New York, New York 10166. Additional information about the Board Members is available in the fund’s Statement of Additional Information which can be obtained from Dreyfus free of charge by calling this toll free number: 1-800-554-4611.
John M. Fraser, Jr., Emeritus Board Member Rosalind G. Jacobs, Emeritus Board Member Dr. Paul A. Marks, Emeritus Board Member
The Portfolio 33
OFFICERS OF THE FUND (Unaudited)
| J. DAVID OFFICER, President since | | JOSEPH M. CHIOFFI, Vice President and |
| December 2006. | | Assistant Secretary since August 2005. |
| Chief Operating Officer,Vice Chairman and a | | Associate General Counsel of the Manager, |
| director of the Manager, and an officer of 90 | | and an officer of 91 investment companies |
| investment companies (comprised of 190 | | (comprised of 206 portfolios) managed by the |
| portfolios) managed by the Manager. He is 58 | | Manager. He is 45 years old and has been an |
| years old and has been an employee of the | | employee of the Manager since June 2000. |
| |
| Manager since April 1, 1998. | | JANETTE E. FARRAGHER, Vice President |
| MARK N. JACOBS, Vice President since | | and Assistant Secretary since |
| March 2000. | | August 2005. |
| Executive Vice President, Secretary and | | Associate General Counsel of the Manager, |
| General Counsel of the Manager, and an | | and an officer of 91 investment companies |
| officer of 91 investment companies (comprised | | (comprised of 206 portfolios) managed by the |
| of 206 portfolios) managed by the Manager. | | Manager. She is 44 years old and has been an |
| He is 60 years old and has been an employee | | employee of the Manager since February 1984. |
| |
| of the Manager since June 1977. | | JOHN B. HAMMALIAN, Vice President and |
| MICHAEL A. ROSENBERG, Vice President | | Assistant Secretary since August 2005. |
| and Secretary since August 2005. | | Associate General Counsel of the Manager, |
| Associate General Counsel of the Manager, | | and an officer of 91 investment companies |
| and an officer of 91 investment companies | | (comprised of 206 portfolios) managed by the |
| (comprised of 206 portfolios) managed by the | | Manager. He is 43 years old and has been an |
| Manager. He is 46 years old and has been an | | employee of the Manager since February 1991. |
| |
| employee of the Manager since October 1991. | | ROBERT R. MULLERY, Vice President and |
| JAMES BITETTO, Vice President and | | Assistant Secretary since August 2005. |
| Assistant Secretary since August 2005. | | Associate General Counsel of the Manager, |
| Associate General Counsel and Assistant | | and an officer of 91 investment companies |
| Secretary of the Manager, and an officer of 91 | | (comprised of 206 portfolios) managed by the |
| investment companies (comprised of 206 | | Manager. He is 54 years old and has been an |
| portfolios) managed by the Manager. He is 40 | | employee of the Manager since May 1986. |
| |
| years old and has been an employee of the | | JEFF PRUSNOFSKY, Vice President and |
| Manager since December 1996. | | Assistant Secretary since August 2005. |
| JONI LACKS CHARATAN, Vice President | | Associate General Counsel of the Manager, |
| and Assistant Secretary since | | and an officer of 91 investment companies |
| August 2005. | | (comprised of 206 portfolios) managed by the |
| Associate General Counsel of the Manager, | | Manager. He is 41 years old and has been an |
| and an officer of 91 investment companies | | employee of the Manager since October 1990. |
| (comprised of 206 portfolios) managed by the | | |
| Manager. She is 51 years old and has been an | | |
| employee of the Manager since October 1988. | | |
34
| JAMES WINDELS, Treasurer since | | JOSEPH W. CONNOLLY, Chief Compliance |
| November 2001. | | Officer since October 2004. |
| Director – Mutual Fund Accounting of the | | Chief Compliance Officer of the Manager and |
| Manager, and an officer of 91 investment | | The Dreyfus Family of Funds (91 investment |
| companies (comprised of 206 portfolios) | | companies, comprised of 206 portfolios). From |
| managed by the Manager. He is 48 years old | | November 2001 through March 2004, Mr. |
| and has been an employee of the Manager | | Connolly was first Vice-President, Mutual |
| since April 1985. | | Fund Servicing for Mellon Global Securities |
| |
| ERIK D. NAVILOFF, Assistant Treasurer | | Services. In that capacity, Mr. Connolly was |
| since December 2002. | | responsible for managing Mellon’s Custody, |
| | | Fund Accounting and Fund Administration |
| Senior Accounting Manager – Taxable Fixed | | services to third-party mutual fund clients. He |
| Income Funds of the Manager, and an officer | | is 49 years old and has served in various |
| of 91 investment companies (comprised of 206 | | capacities with the Manager since 1980, |
| portfolios) managed by the Manager. He is 38 | | including manager of the firm’s Fund |
| years old and has been an employee of the | | Accounting Department from 1997 through |
| Manager since November 1992. | | October 2001. |
| |
| ROBERT ROBOL, Assistant Treasurer | | WILLIAM GERMENIS, Anti-Money |
| since August 2003. | | Laundering Compliance Officer since |
| Senior Accounting Manager – Money Market | | September 2002. |
| and Municipal Bond Funds of the Manager, | | Vice President and Anti-Money Laundering |
| and an officer of 91 investment companies | | Compliance Officer of the Distributor, and the |
| (comprised of 206 portfolios) managed by the | | Anti-Money Laundering Compliance Officer |
| Manager. He is 42 years old and has been an | | of 87 investment companies (comprised of 202 |
| employee of the Manager since October 1988. | | portfolios) managed by the Manager. He is 36 |
| ROBERT SVAGNA, Assistant Treasurer | | years old and has been an employee of the |
| since December 2002. | | Distributor since October 1998. |
| Senior Accounting Manager – Equity Funds of | | |
| the Manager, and an officer of 91 investment | | |
| companies (comprised of 206 portfolios) | | |
| managed by the Manager. He is 39 years old | | |
| and has been an employee of the Manager | | |
| since November 1990. | | |
| |
| GAVIN C. REILLY, Assistant Treasurer | | |
| since December 2005. | | |
| Tax Manager of the Investment Accounting | | |
| and Support Department of the Manager, and | | |
| an officer of 91 investment companies | | |
| (comprised of 206 portfolios) managed by the | | |
| Manager. He is 38 years old and has been an | | |
| employee of the Manager since April 1991. | | |
The Portfolio 35
NOTES
| For More | | Information |
| |
|
| |
| Dreyfus Variable | | Transfer Agent & |
| Investment Fund, | | Dividend Disbursing Agent |
| International Value Portfolio |
| | | Dreyfus Transfer, Inc. |
| 200 Park Avenue | | |
| | | 200 Park Avenue |
| New York, NY 10166 | | |
| | | New York, NY 10166 |
| |
| Investment Adviser | | Distributor |
| The Dreyfus Corporation | | |
| | | Dreyfus Service Corporation |
| 200 Park Avenue | | |
| | | 200 Park Avenue |
| New York, NY 10166 | | |
| | | New York, NY 10166 |
| Custodian | | |
| The Bank of New York | | |
| One Wall Street | | |
| New York, NY 10286 | | |
Telephone 1-800-554-4611 or 516-338-3300
Mail The Dreyfus Family of Funds, 144 Glenn Curtiss Boulevard, Uniondale, NY 11556-0144
Attn: Investments Division
|
The portfolio files its complete schedule of portfolio holdings with the Securities and Exchange Commission (“SEC”) for the first and third quarters of each fiscal year on Form N-Q. The portfolio’s Forms N-Q are available on the SEC’s website at http://www.sec.gov and may be reviewed and copied at the SEC’s Public Reference Room in Washington, DC. Information on the operation of the Public Reference Room may be obtained by calling 1-202-551-8090.
A description of the policies and procedures that the portfolio uses to determine how to vote proxies relating to portfolio securities, and information regarding how the portfolio voted these proxies for the 12-month period ended June 30, 2006, is available at http://www.dreyfus.com and on the SEC’s website at http://www.sec.gov. The description of the policies and procedures is also available without charge, upon request, by calling 1-800-645-6561.
© 2007 Dreyfus Service Corporation


The views expressed in this report reflect those of the portfolio manager only through the end of the period covered and do not necessarily represent the views of Dreyfus or any other person in the Dreyfus organization.Any such views are subject to change at any time based upon market or other conditions and Dreyfus disclaims any responsibility to update such views. These views may not be relied on as investment advice and, because investment decisions for a Dreyfus portfolio are based on numerous factors, may not be relied on as an indication of trading intent on behalf of any Dreyfus portfolio.
Not FDIC-Insured • Not Bank-Guaranteed • May Lose Value
| | | Contents |
| |
| | | T H E P O R T F O L I O |
| |
|
| 2 | | A Letter from the CEO |
| 3 | | Discussion of Performance |
| 6 | | Portfolio Performance |
| 8 | | Understanding Your Portfolio’s Expenses |
| 8 | | Comparing Your Portfolio’s Expenses |
| | | With Those of Other Funds |
| 9 | | Statement of Investments |
| 25 | | Statement of Assets and Liabilities |
| 26 | | Statement of Operations |
| 27 | | Statement of Changes in Net Assets |
| 29 | | Financial Highlights |
| 31 | | Notes to Financial Statements |
| 41 | | Report of Independent Registered |
| | | Public Accounting Firm |
| 42 | | Important Tax Information |
| 42 | | Proxy Results |
| 43 | | Board Members Information |
| 46 | | Officers of the Fund |
| | | F O R M O R E I N F O R M AT I O N |
| |
|
| | | Back Cover |
| Dreyfus Variable Investment Fund, |
| Limited Term High Yield Portfolio |
The Portfolio

A LETTER FROM THE CEO
Dear Shareholder:
We are pleased to present this annual report for Dreyfus Variable Investment Fund, Limited Term High Yield Portfolio, covering the 12-month period from January 1, 2006, through December 31, 2006.
2006 proved to be a year of low volatility in the U.S. bond market.Yields of 10-year Treasury securities remained within a relatively narrow range of just 75 basis points, making 2006 the third least volatile bond market since 1970.Yet, a number of developments during the year might have suggested otherwise, including mounting economic uncertainty, volatile energy prices, softening real estate markets, a change in U.S. monetary policy and ongoing geopolitical turmoil.
Why did fixed-income investors appear to shrug off some of the year’s more negative influences? In our analysis, investors disregarded near-term concerns in favor of a longer view, looking to broader trends that showed moderately slower economic growth, subdued inflation, stabilizing short-term interest rates, a flat “yield curve” and persistently strong credit fundamentals. Indeed, 2006 confirmed that reacting to near-term influences with extreme shifts in investment strategy rarely is the right decision.We believe that a better course is to set a portfolio mix to meet long-term goals, while attempting to ignore short term market fluctuations.
For information about how the portfolio performed during the reporting period, as well as market perspectives, we have provided a Discussion of Performance given by the portfolio manager.
Thank you for your continued confidence and support.We wish you good health and prosperity in 2007.

| Thomas F. Eggers |
| Chief Executive Officer |
| The Dreyfus Corporation |
| January 16, 2007 |

DISCUSSION OF PERFORMANCE
David Bowser, Portfolio Manager
Note to Shareholders: On October 27, 2006, David Bowser replaced Jon Uhrig as the portfolio’s primary portfolio manager. Mr. Bowser has been a portfolio manager since July 2006.
How did Dreyfus Variable Investment Fund, Limited Term High Yield Portfolio perform during the period?
For the 12-month period ended December 31, 2006, the portfolio’s Initial shares achieved a total return of 8.70%, and its Service shares achieved a total return of 8.64% . The portfolio generated aggregate income dividends of $0.50 for both its Initial shares and Service shares.1 In comparison, the Merrill Lynch U.S. High Yield Master II Constrained Index (the “Index”), achieved a total return of 10.73% for the same period.2
High yield bonds produced attractive returns in 2006 due to sound credit fundamentals and generally positive supply-and-demand factors. The portfolio produced lower returns than its benchmark, primarily due to our emphasis on securities toward the higher end of the high yield market’s credit-rating spectrum, which generally underperformed more speculative investments.
What is the portfolio’s investment approach?
The portfolio seeks to maximize total return consisting of capital appreciation and current income. To pursue this goal, we normally invest at least 80% of the portfolio’s assets in fixed-income securities rated below investment grade (“high yield” or “junk” bonds).We may invest in various types of fixed-income securities, including corporate bonds and notes, mortgage-related securities, asset-backed securities, zero coupon securities, inflation-indexed bonds, convertible securities, preferred stocks and other debt securities of U.S. and foreign issuers.
In choosing securities, we seek to capture higher yields offered by junk bonds, while managing credit risk and the volatility caused by interest-rate movements.We seek to reduce interest-rate risk by maintaining an average effective portfolio maturity of 5.5 years or less, although there is no limit on the maturity of individual securities.
T h e P o r t f o l i o 3
DISCUSSION OF PERFORMANCE (continued)
Our investment process is based on fundamental credit research. We look at a variety of factors when assessing a potential investment, including the company’s financial strength, the state of the industry or sector it belongs to, the long-term fundamentals of that industry or sector, the company’s management, and whether there is sufficient equity value in the company.
What other factors influenced the portfolio’s performance?
The high yield market remained persistently strong in 2006, supported by domestic and international investors who maintained a relatively high tolerance for risk in their search for high levels of current income. Robust demand was met during much of the year with a relatively light supply of newly issued securities, as a number of issuers turned instead to bank loans for financing. However, several large leveraged buy-out transactions created a brief surge in supply at the end of the year, enabling 2006 to set a new record for high yield bond issuance.
In addition, the high yield market benefited from robust credit fundamentals, with defaults remaining near historical lows in the growing global economy. Although heightened inflation and interest-rate concerns sparked a temporary correction in the spring, the market bounced back when it became apparent that a gradual slowdown in U.S.economic growth was likely to keep inflation in check.The Federal Reserve Board lent credence to this view when it refrained from raising short-term interest rates over the second half of the year.
However, yield differences along the credit-rating spectrum continued to narrow as the market rallied, suggesting to us that a relatively defensive investment posture might be prudent. Accordingly, we focused on securities in the market’s upper and middle rating tiers, including bonds issued by regulated industries, such as utilities, banks and real estate investment trusts.This stance limited the portfolio’s participation in the rally among lower-tier credits, accounting for its lagging performance relative to its benchmark.
We also maintained an underweighted position in the financially troubled automotive sector, which proved to be among the market’s top performing areas in 2006.We also held comparatively few bonds from cable and media companies, some of which were distressed. Nonetheless, cable and media bonds generally performed well.
The portfolio achieved better results in other areas. In the wireline telecommunications industry, a number of the portfolio’s holdings received credit-rating upgrades during the fourth quarter. Tobacco companies also fared well in an improving legal environment.
What is the portfolio’s current strategy?
While we have seen little evidence of an end to the positive technical factors that have supported high yield bond prices, we remain cautious regarding the possibility that unexpected developments could trigger a sharp sell-off, especially after the market’s sustained rally in 2006. Indeed, new issues recently coming to market have tended to fall toward the low end of the credit range, which may be a sign of frothiness in the market. Therefore, we have continued to focus primarily on bonds from higher-quality issuers that, in our analysis, demonstrate relatively strong credit characteristics. At the same time, we have added opportunistically to some previously underexposed areas — including the wireless telecom-munications,gaming and theater industries — in an attempt to boost the portfolio’s yield without substantially reducing its credit profile.
January 16, 2007
| | | The portfolio is only available as a funding vehicle under variable life insurance policies or variable |
| | | annuity contracts issued by insurance companies. Individuals may not purchase shares of these |
| | | portfolios directly. A variable annuity is an insurance contract issued by an insurance company that |
| | | enables investors to accumulate assets on a tax-deferred basis for retirement or other long-term |
| | | goals.The investment objective and policies of Dreyfus Variable Investment Fund, Limited Term |
| | | High Yield Portfolio may be similar to other funds/portfolios managed or advised by Dreyfus. |
| | | However, the investment results of the portfolio may be higher or lower than, and may not be |
| | | comparable to, those of any other Dreyfus fund/portfolio. |
| 1 | | Total return includes reinvestment of dividends and any capital gains paid. Past performance is no |
| | | guarantee of future results. Share price and investment return fluctuate such that upon redemption, |
| | | portfolio shares may be worth more or less than their original cost.The portfolio’s performance does |
| | | not reflect the deduction of additional charges and expenses imposed in connection with investing |
| | | in variable insurance contracts, which will reduce returns. Return figures provided reflect the |
| | | absorption of certain portfolio expenses by The Dreyfus Corporation pursuant to an agreement |
| | | that is in effect through December 31, 2007, at which time it may be extended, modified or |
| | | terminated. Had these expenses not been absorbed, the portfolio’s returns would have been lower. |
| 2 | | SOURCE: BLOOMBERG — Reflects reinvestment of dividends and, where applicable, |
| | | capital gain distributions.The Merrill Lynch U.S. High Yield Master II Constrained Index is an |
| | | unmanaged performance benchmark composed of U.S. dollar-denominated domestic and Yankee |
| | | bonds rated below investment grade with at least $100 million par amount outstanding and at |
| | | least one year remaining to maturity. Bonds are capitalization-weighted.Total allocations to an |
| | | issuer are capped at 2%. |
T h e P o r t f o l i o 5
P O R T F O L I O P E R F O R M A N C E
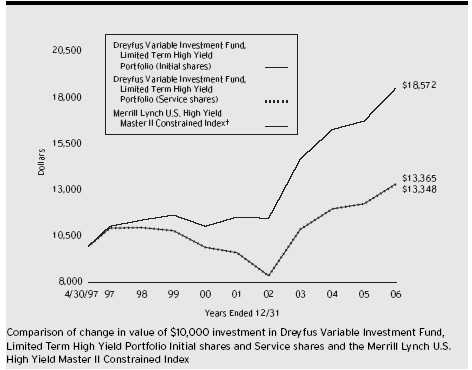
| Average Annual Total Returns | | as of 12/31/06 | | | | |
| | | Inception | | | | | | From |
| | | Date | | 1 Year | | 5 Years | | Inception |
| |
| |
| |
| |
|
| Initial shares | | 4/30/97 | | 8.70% | | 6.75% | | 3.05% |
| Service shares | | 4/30/97 | | 8.64% | | 6.73% | | 3.03% |
| The data for Service shares includes the results of Initial shares for the period prior to December 31, 2000 |
| (inception date of Service shares). Actual Service shares’ average annual total return and hypothetical growth |
| results would have been lower. See notes below. |
| † Source: Bloomberg L.P. |
| Past performance is not predictive of future performance.The portfolio’s performance shown in the graph and table does |
| not reflect the deduction of taxes that a shareholder would pay on portfolio distributions or the redemption of portfolio |
| shares. |
| The portfolio’s performance does not reflect the deduction of additional charges and expenses imposed in |
| connection with investing in variable insurance contracts which will reduce returns. |
| The above graph compares a $10,000 investment made in Initial and Service shares of Dreyfus Variable Investment |
| Fund, Limited Term High Yield Portfolio on 4/30/97 (inception date of Initial shares) to a $10,000 investment made |
| in the Merrill Lynch U.S. High Yield Master II Constrained Index (the “Index”) on that date. |
| The portfolio’s Initial shares are not subject to a Rule 12b-1 fee.The portfolio’s Service shares are subject to a 0.25% |
| annual Rule 12b-1 fee.The performance figures for Service shares reflect the performance of the portfolio’s Initial shares |
| from their inception date through December 30, 2000, and the performance of the portfolio’s Service shares from |
| December 31, 2000 (inception date of Service shares) to December 31, 2006 (blended performance figures).The |
| performance figures for each share class reflect certain expense reimbursements, without which the performance of each |
| share class would have been lower. In addition, the blended performance figures have not been adjusted to reflect the |
| higher operating expenses of the Service shares. If these expenses had been reflected, the blended performance figures would |
| have been lower. All dividends and capital gain distributions are reinvested. |
| The portfolio’s performance shown in the line graph takes into account all applicable portfolio fees and expenses (after any |
| expense reimbursements).The Index is an unmanaged performance benchmark composed of U.S. dollar-denominated |
| domestic and Yankee bonds rated below investment grade with at least $100 million par amount outstanding and at least |
| one year remaining to maturity. Bonds are capitalization-weighted.Total allocations to an issuer are capped at 2%.The |
| Index does not take into account charges, fees and other expenses. Further information relating to fund performance, |
| including expense reimbursements, if applicable, is contained in the Financial Highlights section of the prospectus and |
| elsewhere in this report. |
T h e P o r t f o l i o 7
U N D E R S TA N D I N G Y O U R
P O R T F O L I O ’ S E X P E N S E S ( U n a u d i t e d )
As a mutual fund investor,you pay ongoing expenses,such as management fees and other expenses.Using the information below,you can estimate how these expenses affect your investment and compare them with the expenses of other funds.You also may pay one-time transaction expenses,including sales charges (loads) and redemption fees, which are not shown in this section and would have resulted in higher total expenses. For more information, see your portfolio’s prospectus or talk to your financial adviser.
Review your portfolio’s expenses
The table below shows the expenses you would have paid on a $1,000 investment in Dreyfus Variable Investment Fund, Limited Term High Yield Portfolio from July 1, 2006 to December 31, 2006. It also shows how much a $1,000 investment would be worth at the close of the period, assuming actual returns and expenses.
| Expenses and Value of a $1,000 Investment | | |
| assuming actual returns for the six months ended December 31, 2006 |
| | | Initial Shares | | Service Shares |
| |
| |
|
| Expenses paid per $1,000 † | | $ 4.69 | | $ 4.69 |
| Ending value (after expenses) | | $1,065.40 | | $1,065.80 |
C O M P A R I N G Y O U R P O R T F O L I O ’ S E X P E N S E S W I T H T H O S E O F O T H E R F U N D S ( U n a u d i t e d )
Using the SEC’s method to compare expenses
The Securities and Exchange Commission (SEC) has established guidelines to help investors assess fund expenses. Per these guidelines, the table below shows your portfolio’s expenses based on a $1,000 investment, assuming a hypothetical 5% annualized return. You can use this information to compare the ongoing expenses (but not transaction expenses or total cost) of investing in the portfolio with those of other funds. All mutual fund shareholder reports will provide this information to help you make this comparison. Please note that you cannot use this information to estimate your actual ending account balance and expenses paid during the period.
Expenses and Value of a $1,000 Investment assuming a hypothetical 5% annualized return for the six months ended December 31, 2006
| | | Initial Shares | | Service Shares |
| |
| |
|
| Expenses paid per $1,000 † | | $ 4.58 | | $ 4.58 |
| Ending value (after expenses) | | $1,020.67 | | $1,020.67 |
† Expenses are equal to the portfolio’s annualized expense ratio of .90% for Initial shares and .90% for Service shares, multiplied by the average account value over the period, multiplied by 184/365 (to reflect the one-half year period).
| S TAT E M E N T O F | | I N V E S T M E N T S | | | | |
| D e c e m b e r 3 1 , 2 0 0 6 | | | | | | | | |
| |
| |
| |
| |
|
| |
| |
| |
| | | Coupon | | Maturity | | Principal | | |
| Bonds and Notes—95.0% | | Rate (%) | | Date | | Amount ($) | | Value ($) |
| |
| |
| |
| |
|
| Advertising—.3% | | | | | | | | |
| Lamar Media, | | | | | | | | |
| Gtd. Notes | | 6.63 | | 8/15/15 | | 35,000 | | 34,868 |
| R.H. Donnelley Finance I, | | | | | | | | |
| Gtd. Notes | | 10.88 | | 12/15/12 | | 39,000 a | | 42,705 |
| | | | | | | | | 77,573 |
| Aerospace & Defense—1.5% | | | | | | | | |
| Alliant Techsystems, | | | | | | | | |
| Gtd. Notes | | 6.75 | | 4/1/16 | | 30,000 | | 30,075 |
| Argo-Tech, | | | | | | | | |
| Sr. Notes | | 9.25 | | 6/1/11 | | 78,000 | | 84,630 |
| DRS Technologies, | | | | | | | | |
| Sr. Sub. Notes | | 6.88 | | 11/1/13 | | 29,000 | | 29,363 |
| L-3 Communications, | | | | | | | | |
| Bonds | | 3.00 | | 8/1/35 | | 35,000 a | | 36,925 |
| L-3 Communications, | | | | | | | | |
| Sr. Sub. Notes, Ser. B | | 6.38 | | 10/15/15 | | 100,000 | | 99,500 |
| L-3 Communications, | | | | | | | | |
| Gtd. Notes | | 7.63 | | 6/15/12 | | 75,000 b | | 78,000 |
| | | | | | | | | 358,493 |
| Agricultural—.2% | | | | | | | | |
| Alliance One International, | | | | | | | | |
| Gtd. Notes | | 11.00 | | 5/15/12 | | 55,000 | | 58,850 |
| Airlines—.3% | | | | | | | | |
| United AirLines, | | | | | | | | |
| Pass-Through Ctfs., Ser. 00-2 | | 7.81 | | 4/1/11 | | 73,641 c | | 81,419 |
| Automobile Manufacturers—.5% | | | | | | |
| Ford Motor, | | | | | | | | |
| Bonds | | 6.50 | | 8/1/18 | | 85,000 b | | 64,600 |
| Ford Motor, | | | | | | | | |
| Notes | | 7.45 | | 7/16/31 | | 70,000 b | | 55,300 |
| | | | | | | | | 119,900 |
| Automotive, Trucks & Parts—1.3% | | | | | | |
| Cooper-Standard Automotive, | | | | | | | | |
| Gtd. Notes | | 8.38 | | 12/15/14 | | 35,000 b | | 27,737 |
| Goodyear Tire & Rubber, | | | | | | | | |
| Sr. Notes | | 9.00 | | 7/1/15 | | 110,000 | | 115,775 |
| Tenneco Automotive, | | | | | | | | |
| Gtd. Note | | 8.63 | | 11/15/14 | | 75,000 | | 76,875 |
T h e P o r t f o l i o 9
| | S TAT E M E N T O F I N V E S T M E N T S (continued)
|
| | | Coupon | | Maturity | | Principal | | |
| Bonds and Notes (continued) | | Rate (%) | | Date | | Amount ($) | | Value ($) |
| |
| |
| |
| |
|
| Automotive, Trucks & | | | | | | | | |
| Parts (continued) | | | | | | | | |
| United Components, | | | | | | | | |
| Sr. Sub. Notes | | 9.38 | | 6/15/13 | | 83,000 | | 86,320 |
| | | | | | | | | 306,707 |
| Banks—1.9% | | | | | | | | |
| Chevy Chase Bank, | | | | | | | | |
| Sub. Notes | | 6.88 | | 12/1/13 | | 265,000 | | 266,325 |
| Colonial Bank N.A./Montgomery, AL, | | | | | | |
| Sub. Notes | | 9.38 | | 6/1/11 | | 75,000 | | 84,718 |
| Shinsei Finance Cayman, | | | | | | | | |
| Bonds | | 6.42 | | 1/29/49 | | 100,000 a,d | | 100,059 |
| | | | | | | | | 451,102 |
| Building & Construction—2.2% | | | | | | | | |
| Beazer Homes USA, | | | | | | | | |
| Gtd. Notes | | 6.88 | | 7/15/15 | | 125,000 | | 123,125 |
| D.R. Horton, | | | | | | | | |
| Gtd. Notes | | 8.50 | | 4/15/12 | | 65,000 | | 68,041 |
| Goodman Global Holdings, | | | | | | | | |
| Sr. Sub. Notes | | 7.88 | | 12/15/12 | | 29,000 b | | 28,637 |
| Goodman Global Holdings, | | | | | | | | |
| Sr. Notes, Ser. B | | 8.36 | | 6/15/12 | | 89,000 b,d | | 90,557 |
| Nortek, | | | | | | | | |
| Sr. Sub. Notes | | 8.50 | | 9/1/14 | | 85,000 b | | 83,725 |
| Standard-Pacific, | | | | | | | | |
| Sr. Notes | | 6.50 | | 8/15/10 | | 125,000 | | 122,813 |
| Texas Industries, | | | | | | | | |
| Sr. Unscd. Notes | | 7.25 | | 7/15/13 | | 15,000 | | 15,300 |
| | | | | | | | | 532,198 |
| Chemicals—4.3% | | | | | | | | |
| Airgas, | | | | | | | | |
| Sr. Sub. Notes | | 6.25 | | 7/15/14 | | 75,000 | | 72,750 |
| CPG International I, | | | | | | | | |
| Sr. Unscd. Notes | | 10.50 | | 7/1/13 | | 65,000 | | 66,543 |
| Huntsman, | | | | | | | | |
| Gtd. Notes | | 11.63 | | 10/15/10 | | 14,000 | | 15,365 |
| Huntsman International, | | | | | | | | |
| Gtd. Notes | | 9.88 | | 3/1/09 | | 17,000 | | 17,595 |
| Ineos Group Holdings, | | | | | | | | |
| Sr. Sub. Notes | | 8.50 | | 2/15/16 | | 165,000 a | | 158,400 |
10
| | | Coupon | | Maturity | | Principal | | |
| Bonds and Notes (continued) | | Rate (%) | | Date | | Amount ($) | | Value ($) |
| |
| |
| |
| |
|
| Chemicals (continued) | | | | | | | | |
| Lyondell Chemical, | | | | | | | | |
| Gtd. Notes | | 8.00 | | 9/15/14 | | 80,000 | | 83,400 |
| Nalco, | | | | | | | | |
| Sr. Sub. Notes | | 8.88 | | 11/15/13 | | 275,000 | | 292,531 |
| Rhodia, | | | | | | | | |
| Sr. Notes | | 10.25 | | 6/1/10 | | 170,000 | | 194,650 |
| Rockwood Specialties Group, | | | | | | | | |
| Sr. Sub. Notes | | 10.63 | | 5/15/11 | | 70,000 | | 74,900 |
| Westlake Chemical, | | | | | | | | |
| Gtd. Notes | | 6.63 | | 1/15/16 | | 40,000 | | 38,900 |
| | | | | | | | | 1,015,034 |
| Commercial & Professional | | | | | | | | |
| Services—1.9% | | | | | | | | |
| Brickman Group, | | | | | | | | |
| Gtd. Notes, Ser. B | | 11.75 | | 12/15/09 | | 62,000 | | 66,185 |
| Corrections Corp. of America, | | | | | | | | |
| Gtd. Notes | | 6.25 | | 3/15/13 | | 100,000 | | 99,625 |
| Education Management, | | | | | | | | |
| Sr. Notes | | 8.75 | | 6/1/14 | | 60,000 a | | 62,400 |
| Education Management, | | | | | | | | |
| Sr. Sub. Notes | | 10.25 | | 6/1/16 | | 85,000 a,b | | 90,312 |
| Hertz, | | | | | | | | |
| Sr. Notes | | 8.88 | | 1/1/14 | | 65,000 a | | 68,413 |
| Hertz, | | | | | | | | |
| Sr. Sub. Notes | | 10.50 | | 1/1/16 | | 30,000 a,b | | 33,150 |
| Williams Scotsman, | | | | | | | | |
| Gtd. Notes | | 8.50 | | 10/1/15 | | 35,000 | | 36,706 |
| | | | | | | | | 456,791 |
| Commercial Mortgage | | | | | | | | |
| Pass-Through Ctfs.—.4% | | | | | | | | |
| Global Signal Trust, | | | | | | | | |
| Ser. 2006-1, Cl. F | | 7.04 | | 2/15/36 | | 95,000 a | | 96,708 |
| Consumer Products—.9% | | | | | | | | |
| Chattem, | | | | | | | | |
| Sr. Sub. Notes | | 7.00 | | 3/1/14 | | 35,000 | | 34,650 |
| Playtex Products, | | | | | | | | |
| Gtd. Notes | | 9.38 | | 6/1/11 | | 160,000 | | 167,600 |
| | | | | | | | | 202,250 |
T h e P o r t f o l i o 11
S TAT E M E N T O F I N V E S T M E N T S (continued)
| | | | | Coupon | | Maturity | | Principal | | |
| Bonds and Notes (continued) | | Rate (%) | | Date | | Amount ($) | | Value ($) |
| |
| |
| |
| |
|
| Diversified Financial Services—8.3% | | | | | | | | |
| Basell AF SCA, | | | | | | | | | | |
| Gtd. Notes | | | | 8.38 | | 8/15/15 | | 75,000 a | | 77,438 |
| BCP Crystal U.S. Holdings, | | | | | | | | |
| Sr. Sub. Notes | | | | 9.63 | | 6/15/14 | | 155,000 b | | 172,050 |
| CCM Merger, | | | | | | | | | | |
| Notes | | | | 8.00 | | 8/1/13 | | 70,000 a | | 68,775 |
| Consolidated Communications | | | | | | | | |
| Illinois/Texas Holdings, Sr. Notes | | 9.75 | | 4/1/12 | | 65,000 | | 69,875 |
| E*TRADE FINANCIAL, | | | | | | | | | | |
| Sr. Notes | | | | 8.00 | | 6/15/11 | | 25,000 | | 26,250 |
| FCE Bank, | | | | | | | | | | |
| Notes | | EUR | | 4.72 | | 9/30/09 | | 185,000 d,e | | 238,896 |
| FINOVA Group, | | | | | | | | | | |
| Notes | | | | 7.50 | | 11/15/09 | | 132,000 | | 38,940 |
| Ford Motor Credit, | | | | | | | | | | |
| Notes | | | | 5.63 | | 10/1/08 | | 120,000 b | | 117,888 |
| Ford Motor Credit, | | | | | | | | | | |
| Notes | | | | 6.19 | | 9/28/07 | | 50,000 d | | 49,943 |
| Ford Motor Credit, | | | | | | | | | | |
| Sr. Unscd. Notes | | | | 9.75 | | 9/15/10 | | 101,000 a | | 107,528 |
| General Motors Acceptance | | | | | | | | |
| International | | | | | | | | | | |
| Finance, Gtd. Notes | | EUR | | 4.38 | | 10/31/07 | | 120,000 e | | 157,946 |
| GMAC, | | | | | | | | | | |
| Sr. Unsub. Notes | | EUR | | 5.38 | | 6/6/11 | | 80,000 e | | 106,714 |
| GMAC, | | | | | | | | | | |
| Notes | | | | 6.13 | | 1/22/08 | | 90,000 b | | 89,825 |
| GMAC, | | | | | | | | | | |
| Notes | | | | 7.75 | | 1/19/10 | | 230,000 | | 240,895 |
| Idearc, | | | | | | | | | | |
| Sr. Notes | | | | 8.00 | | 11/15/16 | | 155,000 a | | 158,100 |
| K & F Acquisition, | | | | | | | | | | |
| Gtd. Notes | | | | 7.75 | | 11/15/14 | | 35,000 | | 36,225 |
| Kansas City Southern Railway, | | | | | | | | |
| Gtd. Notes | | | | 7.50 | | 6/15/09 | | 35,000 | | 35,481 |
| Leucadia National, | | | | | | | | | | |
| Sr. Notes | | | | 7.00 | | 8/15/13 | | 75,000 | | 76,500 |
| Stena AB, | | | | | | | | | | |
| Sr. Notes | | | | 7.50 | | 11/1/13 | | 66,000 b | | 65,505 |
| | | Coupon | | Maturity | | Principal | | |
| Bonds and Notes (continued) | | Rate (%) | | Date | | Amount ($) | | Value ($) |
| |
| |
| |
| |
|
| Diversified Financial | | | | | | | | |
| Services (continued) | | | | | | | | |
| UCI Holdco, | | | | | | | | |
| Sr. Notes | | 12.37 | | 12/15/13 | | 50,000 a,d | | 48,875 |
| | | | | | | | | 1,983,649 |
| Diversified Metals & Mining—1.9% | | | | | | |
| Consol Energy, | | | | | | | | |
| Gtd. Notes | | 7.88 | | 3/1/12 | | 98,000 | | 103,880 |
| CSN Islands IX, | | | | | | | | |
| Gtd. Notes | | 10.50 | | 1/15/15 | | 85,000 a | | 99,450 |
| Freeport-McMoRan Copper & Gold, | | | | | | | | |
| Sr. Notes | | 6.88 | | 2/1/14 | | 90,000 b | | 92,250 |
| Gibraltar Industries, | | | | | | | | |
| Gtd. Notes, Ser. B | | 8.00 | | 12/1/15 | | 60,000 | | 59,475 |
| Southern Copper, | | | | | | | | |
| Sr. Notes | | 6.38 | | 7/27/15 | | 100,000 | | 102,255 |
| | | | | | | | | 457,310 |
| Electric Utilities—9.7% | | | | | | | | |
| AES, | | | | | | | | |
| Sr. Notes | | 8.88 | | 2/15/11 | | 450,000 | | 484,875 |
| AES, | | | | | | | | |
| Sr. Notes | | 9.38 | | 9/15/10 | | 75,000 | | 81,844 |
| Allegheny Energy Supply, | | | | | | | | |
| Sr. Unscd. Bonds | | 8.25 | | 4/15/12 | | 346,000 a | | 381,465 |
| Edison Mission Energy, | | | | | | | | |
| Sr. Unscd. Notes | | 7.50 | | 6/15/13 | | 80,000 b | | 84,000 |
| FPL Energy National Wind, | | | | | | | | |
| Scd. Bonds | | 6.13 | | 3/25/19 | | 136,780 a | | 132,747 |
| Mirant Americas Generation, | | | | | | | | |
| Sr. Notes | | 8.30 | | 5/1/11 | | 100,000 | | 103,000 |
| Mirant North America, | | | | | | | | |
| Gtd. Notes | | 7.38 | | 12/31/13 | | 260,000 b | | 265,200 |
| MSW Energy Holdings/Finance, | | | | | | | | |
| Scd. Notes | | 8.50 | | 9/1/10 | | 85,000 | | 88,825 |
| MSW Energy Holdings II/Finance II, | | | | | | | | |
| Gtd. Notes, Ser. B | | 7.38 | | 9/1/10 | | 40,000 | | 41,000 |
| Nevada Power, | | | | | | | | |
| Mortgage Notes | | 6.50 | | 4/15/12 | | 32,000 | | 33,010 |
| Nevada Power, | | | | | | | | |
| Mortgage Notes, Ser. A | | 8.25 | | 6/1/11 | | 70,000 | | 76,817 |
T h e P o r t f o l i o 13
S TAT E M E N T O F I N V E S T M E N T S (continued)
| | | Coupon | | Maturity | | Principal | | |
| Bonds and Notes (continued) | | Rate (%) | | Date | | Amount ($) | | Value ($) |
| |
| |
| |
| |
|
| Electric Utilities (continued) | | | | | | | | |
| NRG Energy, | | | | | | | | |
| Gtd. Notes | | 7.25 | | 2/1/14 | | 70,000 | | 70,700 |
| NRG Energy, | | | | | | | | |
| Gtd. Notes | | 7.38 | | 1/15/17 | | 35,000 | | 35,175 |
| Reliant Energy, | | | | | | | | |
| Scd. Notes | | 9.25 | | 7/15/10 | | 163,000 b | | 171,965 |
| Reliant Energy, | | | | | | | | |
| Scd. Notes | | 9.50 | | 7/15/13 | | 85,000 | | 91,588 |
| Sierra Pacific Resources, | | | | | | | | |
| Sr. Notes | | 8.63 | | 3/15/14 | | 119,000 b | | 128,360 |
| TECO Energy, | | | | | | | | |
| Sr. Notes | | 6.75 | | 5/1/15 | | 40,000 | | 42,000 |
| | | | | | | | | 2,312,571 |
| Environmental Control—.6% | | | | | | | | |
| Allied Waste North America, | | | | | | | | |
| Gtd. Notes, Ser. B | | 9.25 | | 9/1/12 | | 37,000 | | 39,497 |
| Geo Sub, | | | | | | | | |
| Sr. Notes | | 11.00 | | 5/15/12 | | 56,000 | | 54,320 |
| WCA Waste, | | | | | | | | |
| Gtd. Notes | | 9.25 | | 6/15/14 | | 35,000 | | 36,750 |
| | | | | | | | | 130,567 |
| Food & Beverages—2.2% | | | | | | | | |
| Dean Foods, | | | | | | | | |
| Gtd. Notes | | 7.00 | | 6/1/16 | | 65,000 | | 65,975 |
| Del Monte, | | | | | | | | |
| Sr. Sub. Notes | | 8.63 | | 12/15/12 | | 62,000 | | 65,720 |
| Dole Food, | | | | | | | | |
| Sr. Notes | | 8.63 | | 5/1/09 | | 49,000 | | 48,938 |
| Dole Food, | | | | | | | | |
| Debs | | 8.75 | | 7/15/13 | | 46,000 b | | 44,850 |
| Dole Food, | | | | | | | | |
| Sr. Notes | | 8.88 | | 3/15/11 | | 32,000 b | | 31,680 |
| Ingles Markets, | | | | | | | | |
| Gtd. Notes | | 8.88 | | 12/1/11 | | 25,000 | | 26,188 |
| Smithfield Foods, | | | | | | | | |
| Sr. Notes | | 7.00 | | 8/1/11 | | 60,000 | | 60,900 |
| Stater Brothers Holdings, | | | | | | | | |
| Sr. Notes | | 8.13 | | 6/15/12 | | 115,000 | | 117,300 |
14
| | | | | Coupon | | Maturity | | Principal | | |
| Bonds and Notes (continued) | | Rate (%) | | Date | | Amount ($) | | Value ($) |
| |
| |
| |
| |
|
| Food & Beverages (continued) | | | | | | | | |
| Stater Brothers Holdings, | | | | | | | | | | |
| Sr. Notes | | | | 8.86 | | 6/15/10 | | 50,000 d | | 50,875 |
| | | | | | | | | | | 512,426 |
| Health Care—4.0% | | | | | | | | | | |
| DaVita, | | | | | | | | | | |
| Gtd. Notes | | | | 7.25 | | 3/15/15 | | 100,000 b | | 102,500 |
| Fresenius Finance, | | | | | | | | | | |
| Gtd. Notes | | EUR | | 5.00 | | 1/31/13 | | 15,000 a,e | | 20,203 |
| HCA, | | | | | | | | | | |
| Sr. Unscd. Notes | | | | 6.95 | | 5/1/12 | | 115,000 b | | 109,250 |
| HCA, | | | | | | | | | | |
| Sr. Unscd. Notes | | | | 8.75 | | 9/1/10 | | 120,000 | | 125,400 |
| HCA, | | | | | | | | | | |
| Scd. Notes | | | | 9.13 | | 11/15/14 | | 20,000 a | | 21,425 |
| HCA, | | | | | | | | | | |
| Scd. Notes | | | | 9.25 | | 11/15/16 | | 85,000 a | | 91,268 |
| Psychiatric Solutions, | | | | | | | | | | |
| Gtd. Notes | | | | 7.75 | | 7/15/15 | | 35,000 | | 35,088 |
| Tenet Healthcare, | | | | | | | | | | |
| Sr. Notes | | | | 9.88 | | 7/1/14 | | 231,000 b | | 236,198 |
| Triad Hospitals, | | | | | | | | | | |
| Sr. Sub. Notes | | | | 7.00 | | 11/15/13 | | 201,000 | | 203,261 |
| | | | | | | | | | | 944,593 |
| Lodging & Entertainment—9.5% | | | | | | | | |
| AMC Entertainment, | | | | | | | | | | |
| Sr. Sub. Notes | | | | 9.88 | | 2/1/12 | | 45,000 b | | 47,475 |
| Cinemark, | | | | | | | | | | |
| Sr. Discount Notes | | | | 9.75 | | 3/15/14 | | 225,000 f | | 194,344 |
| Gaylord Entertainment, | | | | | | | | | | |
| Gtd. Notes | | | | 6.75 | | 11/15/14 | | 65,000 | | 64,837 |
| Isle of Capri Casinos, | | | | | | | | | | |
| Sr. Sub. Notes | | | | 7.00 | | 3/1/14 | | 34,000 | | 34,000 |
| Isle of Capri Casinos, | | | | | | | | | | |
| Gtd. Notes | | | | 9.00 | | 3/15/12 | | 57,000 b | | 59,850 |
| Leslie’s Poolmart, | | | | | | | | | | |
| Sr. Notes | | | | 7.75 | | 2/1/13 | | 55,000 | | 55,000 |
| Marquee Holdings, | | | | | | | | | | |
| Sr. Discount Notes | | | | 12.00 | | 8/15/14 | | 40,000 f | | 33,750 |
T h e P o r t f o l i o 15
S TAT E M E N T O F I N V E S T M E N T S (continued)
| | | Coupon | | Maturity | | Principal | | |
| Bonds and Notes (continued) | | Rate (%) | | Date | | Amount ($) | | Value ($) |
| |
| |
| |
| |
|
| Lodging & Entertainment (continued) | | | | | | |
| MGM Mirage, | | | | | | | | |
| Gtd. Notes | | 8.50 | | 9/15/10 | | 129,000 | | 138,675 |
| Mohegan Tribal Gaming Authority, | | | | | | | | |
| Sr. Notes | | 6.13 | | 2/15/13 | | 170,000 | | 169,575 |
| Mohegan Tribal Gaming Authority, | | | | | | | | |
| Sr. Sub. Notes | | 6.38 | | 7/15/09 | | 157,000 | | 157,785 |
| Mohegan Tribal Gaming Authority, | | | | | | | | |
| Sr. Sub. Notes | | 8.00 | | 4/1/12 | | 85,000 | | 88,931 |
| Park Place Entertainment, | | | | | | | | |
| Sr. Sub. Notes | | 7.88 | | 3/15/10 | | 79,000 | | 82,753 |
| Penn National Gaming, | | | | | | | | |
| Sr. Sub. Notes | | 6.75 | | 3/1/15 | | 35,000 | | 34,475 |
| Penn National Gaming, | | | | | | | | |
| Sr. Sub. Notes | | 6.88 | | 12/1/11 | | 80,000 | | 81,000 |
| Pokagon Gaming Authority, | | | | | | | | |
| Sr. Notes | | 10.38 | | 6/15/14 | | 185,000 a | | 203,500 |
| Resorts International Hotel & | | | | | | | | |
| Casino, Gtd. Notes | | 11.50 | | 3/15/09 | | 30,000 | | 31,088 |
| Royal Caribbean Cruises, | | | | | | | | |
| Sr. Notes | | 8.75 | | 2/2/11 | | 124,000 | | 136,146 |
| Scientific Games, | | | | | | | | |
| Gtd. Notes | | 6.25 | | 12/15/12 | | 130,000 | | 127,725 |
| Seneca Gaming, | | | | | | | | |
| Sr. Unscd. Notes, Ser. B | | 7.25 | | 5/1/12 | | 60,000 | | 61,350 |
| Speedway Motorsports, | | | | | | | | |
| Sr. Sub. Notes | | 6.75 | | 6/1/13 | | 150,000 | | 150,750 |
| Wimar Opco, | | | | | | | | |
| Sr. Sub. Notes | | 9.63 | | 12/15/14 | | 230,000 a | | 228,850 |
| Wynn Las Vegas/Capital, | | | | | | | | |
| First Mortgage Notes | | 6.63 | | 12/1/14 | | 85,000 b | | 84,894 |
| | | | | | | | | 2,266,753 |
| Machinery—2.8% | | | | | | | | |
| Case New Holland, | | | | | | | | |
| Gtd. Notes | | 9.25 | | 8/1/11 | | 209,000 | | 222,323 |
| Columbus McKinnon, | | | | | | | | |
| Sr. Sub. Notes | | 8.88 | | 11/1/13 | | 40,000 b | | 42,400 |
| Douglas Dynamics, | | | | | | | | |
| Gtd. Notes | | 7.75 | | 1/15/12 | | 215,000 a | | 203,175 |
| | | Coupon | | Maturity | | Principal | | |
| Bonds and Notes (continued) | | Rate (%) | | Date | | Amount ($) | | Value ($) |
| |
| |
| |
| |
|
| Machinery (continued) | | | | | | | | |
| Terex, | | | | | | | | |
| Gtd. Notes | | 7.38 | | 1/15/14 | | 190,000 | | 193,800 |
| | | | | | | | | 661,698 |
| Manufacturing—1.4% | | | | | | | | |
| Bombardier, | | | | | | | | |
| Notes | | 6.30 | | 5/1/14 | | 100,000 a | | 94,500 |
| J.B. Poindexter & Co., | | | | | | | | |
| Gtd. Notes | | 8.75 | | 3/15/14 | | 80,000 | | 68,400 |
| Polypore International, | | | | | | | | |
| Sr. Discount Notes | | 10.50 | | 10/1/12 | | 131,000 b,f | | 104,800 |
| RBS Global/Rexnord, | | | | | | | | |
| Sr. Sub. Notes | | 11.75 | | 8/1/16 | | 50,000 a,b | | 52,500 |
| | | | | | | | | 320,200 |
| Media—5.2% | | | | | | | | |
| Adelphia Communications, | | | | | | | | |
| Sr. Notes, Ser. B | | 7.75 | | 1/15/09 | | 103,000 c | | 95,018 |
| CCO Holdings/Capital, | | | | | | | | |
| Sr. Notes | | 8.75 | | 11/15/13 | | 154,000 | | 160,738 |
| CSC Holdings, | | | | | | | | |
| Sr. Notes | | 6.75 | | 4/15/12 | | 66,000 a | | 64,680 |
| CSC Holdings, | | | | | | | | |
| Sr. Notes, Ser. B | | 8.13 | | 7/15/09 | | 100,000 | | 104,125 |
| Dex Media East/Finance, | | | | | | | | |
| Gtd. Notes | | 9.88 | | 11/15/09 | | 11,000 | | 11,550 |
| Dex Media East/Finance, | | | | | | | | |
| Gtd. Notes | | 12.13 | | 11/15/12 | | 207,000 | | 228,476 |
| Dex Media West/Finance, | | | | | | | | |
| Sr. Sub. Notes, Ser. B | | 9.88 | | 8/15/13 | | 153,000 | | 167,535 |
| Entercom Radio/Capital, | | | | | | | | |
| Gtd. Notes | | 7.63 | | 3/1/14 | | 35,000 | | 35,175 |
| Kabel Deutschland, | | | | | | | | |
| Gtd. Notes | | 10.63 | | 7/1/14 | | 87,000 | | 96,896 |
| LBI Media, | | | | | | | | |
| Sr. Discount Notes | | 11.00 | | 10/15/13 | | 97,000 f | | 84,026 |
| Lodgenet Entertainment, | | | | | | | | |
| Sr. Sub. Debs | | 9.50 | | 6/15/13 | | 28,000 | | 30,310 |
| Nexstar Finance Holdings, | | | | | | | | |
| Sr. Discount Notes | | 11.38 | | 4/1/13 | | 63,000 f | | 56,779 |
T h e P o r t f o l i o 17
S TAT E M E N T O F I N V E S T M E N T S (continued)
| | | Coupon | | Maturity | | Principal | | |
| Bonds and Notes (continued) | | Rate (%) | | Date | | Amount ($) | | Value ($) |
| |
| |
| |
| |
|
| Media (continued) | | | | | | | | |
| Pegasus Communications, | | | | | | | | |
| Sr. Notes, Ser. B | | 12.50 | | 8/1/07 | | 123,996 c | | 11,315 |
| Radio One, | | | | | | | | |
| Gtd. Notes, Ser. B | | 8.88 | | 7/1/11 | | 90,000 | | 93,375 |
| | | | | | | | | 1,239,998 |
| Oil & Gas—7.4% | | | | | | | | |
| ANR Pipeline, | | | | | | | | |
| Notes | | 8.88 | | 3/15/10 | | 150,000 | | 158,113 |
| Chesapeake Energy, | | | | | | | | |
| Gtd. Notes | | 7.63 | | 7/15/13 | | 20,000 | | 21,175 |
| Colorado Interstate Gas, | | | | | | | | |
| Sr. Notes | | 5.95 | | 3/15/15 | | 75,000 | | 74,374 |
| Dynegy Holdings, | | | | | | | | |
| Sr. Unscd. Notes | | 8.38 | | 5/1/16 | | 165,000 b | | 174,075 |
| El Paso Production Holding, | | | | | | | | |
| Gtd. Notes | | 7.75 | | 6/1/13 | | 109,000 | | 114,586 |
| Hanover Compressor, | | | | | | | | |
| Gtd. Notes | | 8.63 | | 12/15/10 | | 66,000 | | 69,300 |
| Hanover Compressor, | | | | | | | | |
| Sr. Notes | | 9.00 | | 6/1/14 | | 84,000 | | 91,140 |
| Hanover Equipment Trust, | | | | | | | | |
| Scd. Notes, Ser. A | | 8.50 | | 9/1/08 | | 114,000 | | 115,995 |
| Hanover Equipment Trust, | | | | | | | | |
| Scd. Notes, Ser. B | | 8.75 | | 9/1/11 | | 11,000 | | 11,523 |
| McMoRan Exploration, | | | | | | | | |
| Sr. Notes | | 5.25 | | 10/6/11 | | 57,000 a | | 62,059 |
| Northwest Pipeline, | | | | | | | | |
| Gtd. Notes | | 8.13 | | 3/1/10 | | 155,000 | | 162,169 |
| Pogo Producing, | | | | | | | | |
| Sr. Sub. Notes | | 6.63 | | 3/15/15 | | 135,000 | | 129,263 |
| Southern Natural Gas, | | | | | | | | |
| Unsub. Notes | | 8.88 | | 3/15/10 | | 123,000 | | 129,653 |
| Whiting Petroleum, | | | | | | | | |
| Sr. Sub. Notes | | 7.25 | | 5/1/13 | | 155,000 | | 156,163 |
| Williams Cos., | | | | | | | | |
| Notes | | 7.13 | | 9/1/11 | | 100,000 | | 104,500 |
| Williams Cos., | | | | | | | | |
| Notes | | 7.37 | | 10/1/10 | | 100,000 a,b,d | | 102,500 |
| | | Coupon | | Maturity | | Principal | | |
| Bonds and Notes (continued) | | Rate (%) | | Date | | Amount ($) | | Value ($) |
| |
| |
| |
| |
|
| Oil & Gas (continued) | | | | | | | | |
| Williams Cos., | | | | | | | | |
| Notes | | 7.88 | | 9/1/21 | | 85,000 | | 91,588 |
| | | | | | | | | 1,768,176 |
| Packaging & Containers—6.0% | | | | | | | | |
| Berry Plastics Holding, | | | | | | | | |
| Scd. Notes | | 8.88 | | 9/15/14 | | 35,000 a | | 35,700 |
| Berry Plastics Holding, | | | | | | | | |
| Scd. Notes | | 9.24 | | 9/15/14 | | 15,000 a,d | | 15,262 |
| Crown Americas/Capital, | | | | | | | | |
| Gtd. Notes | | 7.63 | | 11/15/13 | | 270,000 | | 279,450 |
| Crown Americas/Capital, | | | | | | | | |
| Sr. Notes | | 7.75 | | 11/15/15 | | 255,000 | | 265,838 |
| Norampac, | | | | | | | | |
| Sr. Notes | | 6.75 | | 6/1/13 | | 75,000 | | 73,313 |
| Owens Brockway Glass Container, | | | | | | | | |
| Gtd. Notes | | 6.75 | | 12/1/14 | | 28,000 | | 27,300 |
| Owens Brockway Glass Container, | | | | | | | | |
| Gtd. Notes | | 7.75 | | 5/15/11 | | 60,000 | | 61,950 |
| Owens Brockway Glass Container, | | | | | | | | |
| Gtd. Notes | | 8.25 | | 5/15/13 | | 30,000 | | 31,163 |
| Owens Brockway Glass Container, | | | | | | | | |
| Scd. Notes | | 8.75 | | 11/15/12 | | 9,000 | | 9,585 |
| Owens Brockway Glass Container, | | | | | | | | |
| Gtd. Notes | | 8.88 | | 2/15/09 | | 44,000 | | 45,210 |
| Owens-Illinois, | | | | | | | | |
| Debs. | | 7.80 | | 5/15/18 | | 175,000 | | 175,219 |
| Plastipak Holdings, | | | | | | | | |
| Sr. Notes | | 8.50 | | 12/15/15 | | 150,000 a | | 156,750 |
| Solo Cup, | | | | | | | | |
| Sr. Sub. Notes | | 8.50 | | 2/15/14 | | 90,000 b | | 78,300 |
| Stone Container, | | | | | | | | |
| Sr. Notes | | 9.75 | | 2/1/11 | | 155,000 | | 160,619 |
| | | | | | | | | 1,415,659 |
| Paper & Forest Products—2.3% | | | | | | | | |
| Appleton Papers, | | | | | | | | |
| Sr. Sub. Notes, Ser. B | | 9.75 | | 6/15/14 | | 185,000 | | 191,475 |
| Buckeye Technologies, | | | | | | | | |
| Sr. Notes | | 8.50 | | 10/1/13 | | 30,000 | | 31,800 |
T h e P o r t f o l i o 19
S TAT E M E N T O F I N V E S T M E N T S (continued)
| | | Coupon | | Maturity | | Principal | | |
| Bonds and Notes (continued) | | Rate (%) | | Date | | Amount ($) | | Value ($) |
| |
| |
| |
| |
|
| Paper & Forest Products (continued) | | | | | | |
| Georgia-Pacific, | | | | | | | | |
| Gtd. Notes | | 7.00 | | 1/15/15 | | 220,000 a | | 220,550 |
| Georgia-Pacific, | | | | | | | | |
| Sr. Notes | | 8.00 | | 1/15/24 | | 55,000 | | 56,100 |
| Temple-Inland, | | | | | | | | |
| Bonds | | 6.63 | | 1/15/18 | | 55,000 | | 57,144 |
| | | | | | | | | 557,069 |
| Property & Casualty Insurance—.5% | | | | | | | | |
| Allmerica Financial, | | | | | | | | |
| Debs. | | 7.63 | | 10/15/25 | | 100,000 | | 107,668 |
| Real Estate Investment Trusts—1.3% | | | | | | |
| B.F. Saul REIT, | | | | | | | | |
| Scd. Notes | | 7.50 | | 3/1/14 | | 150,000 | | 153,187 |
| Host Marriott, | | | | | | | | |
| Sr. Notes, Ser. M | | 7.00 | | 8/15/12 | | 150,000 | | 153,000 |
| | | | | | | | | 306,187 |
| Retail—1.4% | | | | | | | | |
| Amerigas Partners, | | | | | | | | |
| Sr. Unscd. Notes | | 7.25 | | 5/20/15 | | 80,000 | | 81,400 |
| Central European Distribution, | | | | | | | | |
| Scd. Bonds EUR | | 8.00 | | 7/25/12 | | 50,000 a,e | | 71,423 |
| Neiman-Marcus Group | | | | | | | | |
| Gtd. Notes | | 9.00 | | 10/15/15 | | 40,000 | | 43,850 |
| Rite Aid, | | | | | | | | |
| Scd. Notes | | 8.13 | | 5/1/10 | | 70,000 | | 71,838 |
| VICORP Restaurants, | | | | | | | | |
| Sr. Notes | | 10.50 | | 4/15/11 | | 64,000 | | 61,760 |
| | | | | | | | | 330,271 |
| State/Government | | | | | | | | |
| General Obligations—1.5% | | | | | | | | |
| Erie Tobacco Asset | | | | | | | | |
| Securitization/NY, Tobacco | | | | | | | | |
| Settlement Asset-Backed Bonds | | 6.00 | | 6/1/28 | | 25,000 | | 25,162 |
| | | | | Coupon | | Maturity | | Principal | | |
| Bonds and Notes (continued) | | Rate (%) | | Date | | Amount ($) | | Value ($) |
| |
| |
| |
| |
|
| State/Government | | | | | | | | | | |
| General Obligations (continued) | | | | | | | | |
| Michigan Tobacco Settlement | | | | | | | | |
| Finance Authority, Tobacco | | | | | | | | |
| Settlement Asset-Backed Bonds | | 7.31 | | 6/1/34 | | 135,000 | | 140,323 |
| Tobacco Settlement Authority of | | | | | | | | |
| Iowa, Tobacco Settlement | | | | | | | | | | |
| Asset-Backed Bonds | | | | 6.50 | | 6/1/23 | | 195,000 | | 193,319 |
| | | | | | | | | | | 358,804 |
| Technology—1.9% | | | | | | | | | | |
| Fisher Scientific International, | | | | | | | | |
| Sr. Sub. Notes | | | | 6.13 | | 7/1/15 | | 125,000 | | 123,777 |
| Freescale Semiconductor, | | | | | | | | | | |
| Sr. Notes | | | | 8.88 | | 12/15/14 | | 180,000 a | | 180,225 |
| Freescale Semiconductor, | | | | | | | | | | |
| Sr. Sub. Notes | | | | 10.13 | | 12/15/16 | | 50,000 a,b | | 50,313 |
| Sensata Technologies, | | | | | | | | | | |
| Sr. Sub. Notes | | EUR | | 9.25 | | 5/1/16 | | 50,000 a,d,e | | 66,557 |
| Sungard Data Systems, | | | | | | | | | | |
| Gtd. Notes | | | | 9.97 | | 8/15/13 | | 20,000 d | | 20,875 |
| | | | | | | | | | | 441,747 |
| Telecommunications—9.2% | | | | | | | | | | |
| American Tower, | | | | | | | | | | |
| Sr. Notes | | | | 7.13 | | 10/15/12 | | 86,000 | | 88,795 |
| Intelsat Bermuda, | | | | | | | | | | |
| Sr. Notes | | | | 11.25 | | 6/15/16 | | 145,000 a | | 159,863 |
| Intelsat Subsidiary Holding, | | | | | | | | | | |
| Sr. Notes | | | | 8.25 | | 1/15/13 | | 105,000 | | 107,100 |
| Intelsat Subsidiary Holding, | | | | | | | | | | |
| Gtd. Notes | | | | 10.48 | | 1/15/12 | | 85,000 d | | 86,169 |
| Level 3 Financing, | | | | | | | | | | |
| Sr. Notes | | | | 9.25 | | 11/1/14 | | 135,000 a | | 138,375 |
| Nordic Telephone Holdings, | | | | | | | | | | |
| Sr. Notes | | EUR | | 8.25 | | 5/1/16 | | 100,000 a,e | | 145,816 |
T h e P o r t f o l i o 21
S TAT E M E N T O F I N V E S T M E N T S (continued)
| | | Coupon | | Maturity | | Principal | | |
| Bonds and Notes (continued) | | Rate (%) | | Date | | Amount ($) | | Value ($) |
| |
| |
| |
| |
|
| Telecommunications (continued) | | | | | | | | |
| Nortel Networks, | | | | | | | | |
| Gtd. Notes | | 10.75 | | 7/15/16 | | 15,000 a | | 16,481 |
| PanAmSat, | | | | | | | | |
| Gtd. Notes | | 9.00 | | 6/15/16 | | 20,000 a | | 21,275 |
| Qwest Communications | | | | | | | | |
| International, | | | | | | | | |
| Gtd. Notes, Ser. B | | 7.50 | | 2/15/14 | | 255,000 b | | 263,925 |
| Qwest, | | | | | | | | |
| Bank Note, Ser. B | | 6.95 | | 6/30/10 | | 50,000 d | | 51,063 |
| Qwest, | | | | | | | | |
| Sr. Notes | | 7.88 | | 9/1/11 | | 55,000 | | 58,850 |
| Qwest, | | | | | | | | |
| Sr. Notes | | 8.61 | | 6/15/13 | | 50,000 d | | 54,375 |
| Rogers Wireless, | | | | | | | | |
| Scd. Notes | | 7.25 | | 12/15/12 | | 150,000 | | 159,750 |
| Rural Cellular, | | | | | | | | |
| Sr. Notes | | 9.88 | | 2/1/10 | | 35,000 b | | 37,406 |
| UbiquiTel Operating, | | | | | | | | |
| Gtd. Notes | | 9.88 | | 3/1/11 | | 86,000 | | 93,310 |
| US Unwired, | | | | | | | | |
| Gtd. Notes, Ser. B | | 10.00 | | 6/15/12 | | 142,000 | | 156,910 |
| Wind Acquisition Finance, | | | | | | | | |
| Gtd. Bonds | | 10.75 | | 12/1/15 | | 35,000 a | | 39,988 |
| Windstream, | | | | | | | | |
| Sr. Notes | | 8.13 | | 8/1/13 | | 370,000 a | | 402,375 |
| Windstream, | | | | | | | | |
| Sr. Notes | | 8.63 | | 8/1/16 | | 110,000 a | | 121,000 |
| | | | | | | | | 2,202,826 |
| Textiles & Apparel—1.2% | | | | | | | | |
| Invista, | | | | | | | | |
| Notes | | 9.25 | | 5/1/12 | | 260,000 a | | 280,150 |
| Transportation—1.0% | | | | | | | | |
| CHC Helicopter, | | | | | | | | |
| Sr. Sub. Notes | | 7.38 | | 5/1/14 | | 96,000 | | 93,000 |
| Gulfmark Offshore, | | | | | | | | |
| Gtd. Notes | | 7.75 | | 7/15/14 | | 113,000 | | 115,825 |
| | | Coupon | | Maturity | | Principal | | |
| Bonds and Notes (continued) | | Rate (%) | | Date | | Amount ($) | | Value ($) |
| |
| |
| |
| |
|
| Transportation (continued) | | | | | | | | |
| Kansas City Southern of Mexico, | | | | | | | | |
| Sr. Notes | | 7.63 | | 12/1/13 | | 20,000 a | | 20,050 |
| | | | | | | | | 228,875 |
| Total Bonds and Notes | | | | | | | | |
| (cost $22,192,929) | | | | | | | | 22,584,222 |
| |
| |
| |
| |
|
| |
| Preferred Stocks—1.8% | | | | | | Shares | | Value ($) |
| |
| |
| |
| |
|
| Banks—1.0% | | | | | | | | |
| Sovereign Capital Trust IV, | | | | | | | | |
| Conv., Cum. $2.1875 | | | | | | 4,850 | | 241,288 |
| Media—.8% | | | | | | | | |
| ION Media Networks, | | | | | | | | |
| Conv. $975 | | | | | | 17 a | | 75,284 |
| Spanish Broadcasting System, | | | | | | | | |
| Ser. B, Cum. $107.51 | | | | | | 98 | | 108,360 |
| | | | | | | | | 183,644 |
| Total Preferred Stocks | | | | | | | | |
| (cost $493,860) | | | | | | | | 424,932 |
| |
| |
| |
| |
|
| |
| Common Stocks—.5% | | | | | | | | |
| |
| |
| |
| |
|
| Building & Construction—.2% | | | | | | | | |
| Owens Corning | | | | | | 2,010 g | | 60,099 |
| Chemicals—.1% | | | | | | | | |
| Huntsman | | | | | | 626 g | | 11,875 |
| Oil & Gas—.2% | | | | | | | | |
| Williams Cos | | | | | | 2,111 | | 55,140 |
| Total Common Stocks | | | | | | | | |
| (cost $124,157) | | | | | | | | 127,114 |
| |
| |
| |
| |
|
| |
| Other Investment—.3% | | | | | | | | |
| |
| |
| |
| |
|
| Registered Investment Company; | | | | | | | | |
| Dreyfus Institutional Preferred | | | | | | | | |
| Plus Money Market Fund | | | | | | | | |
| (cost $63,000) | | | | | | 63,000 h | | 63,000 |
T h e P o r t f o l i o 23
S TAT E M E N T O F I N V E S T M E N T S (continued)
| Investment of Cash Collateral | | | | |
| for Securities Loaned—14.3% | | Shares | | Value ($) |
| |
| |
|
| Registered Investment Company; | | | | |
| Dreyfus Institutional Cash | | | | |
| Advantage Plus Fund | | | | |
| (cost $3,397,750) | | 3,397,750 h | | 3,397,750 |
| |
| |
|
| Total Investments (cost $26,271,696) | | 111.9% | | 26,597,018 |
| Liabilities, Less Cash and Receivables | | (11.9%) | | (2,833,547) |
| Net Assets | | 100.0% | | 23,763,471 |
| a Securities exempt from registration under Rule 144A of the Securities Act of 1933.These securities may be resold in |
| transactions exempt from registration, normally to qualified institutional buyers. At December 31, 2006, these |
| securities amounted to $5,125,547 or 21.6% of net assets. |
| b All or a portion of these securities are on loan. At December 31, 2006, the total market value of the portfolio’s |
| securities on loan is $3,223,546 and the total market value of the collateral held by the portfolio is $3,397,750. |
| c Non-income producing—security in default. |
| d Variable rate security—interest rate subject to periodic change. |
| e Principal amount stated in U.S. Dollars unless otherwise noted. |
| EUR— Euro |
| f Zero coupon until a specified date at which time the stated coupon rate becomes effective until maturity. |
| g Non-income producing security. |
| h Investment in affiliated money market mutual fund. |
| Portfolio Summary (Unaudited) † | | | | |
| |
| Value (%) | | | | Value (%) |
| |
| |
|
| Corporate Bonds | | 93.1 | | Common Stocks | | .5 |
| Short-Term/Money | | | | Asset/Mortgage-Backed | | .4 |
| Market Investments | | 14.6 | | Forward Currency Exchange Contracts | | (.1) |
| Preferred Stocks | | 1.8 | | | | |
| State/Government General Obligations | | 1.5 | | | | 111.8 |
| |
| † Based on net assets. | | | | | | |
| See notes to financial statements. | | | | | | |
S TAT E M E N T O F A S S E T S A N D L I A B I L I T I E S
| D e c e m b e r 3 1 , 2 0 0 6 | | | | |
| |
| |
|
| |
| |
| |
| |
| | | Cost | | Value |
| |
| |
|
| Assets ($): | | | | |
| Investments in securities—See Statement of | | |
| Investments (including securities on loan | | |
| valued at $3,223,546)—Note 1(c): | | | | |
| Unaffiliated issuers | | 22,810,946 | | 23,136,268 |
| Affiliated issuers | | 3,460,750 | | 3,460,750 |
| Cash denominated in foreign currencies | | 31,511 | | 32,632 |
| Dividends and interest receivable | | | | 433,581 |
| Swaps premiums paid | | | | 128,083 |
| Receivable for investment securities sold | | | | 58,216 |
| Unrealized appreciation on swap contracts—Note 4 | | 4,422 |
| Prepaid expenses | | | | 2,977 |
| | | | | 27,256,929 |
| |
| |
|
| Liabilities ($): | | | | |
| Due to The Dreyfus Corporation and affiliates—Note 3(b) | | 6,184 |
| Cash overdraft due to custodian | | | | 33,373 |
| Liability for securities on loan—Note 1(c) | | | | 3,397,750 |
| Unrealized depreciation on swap contracts—Note 4 | | 12,165 |
| Unrealized depreciation on forward currency | | |
| exchange contracts—Note 4 | | | | 5,612 |
| Accrued expenses | | | | 38,374 |
| | | | | 3,493,458 |
| |
| |
|
| Net Assets ($) | | | | 23,763,471 |
| |
| |
|
| Composition of Net Assets ($): | | | | |
| Paid-in capital | | | | 58,657,196 |
| Accumulated undistributed investment income—net | | 12,413 |
| Accumulated net realized gain (loss) on investments | | (35,219,450) |
| Accumulated net unrealized appreciation (depreciation) | | |
| on investments, foreign currency transactions, swaps | | |
| transactions and forward currency exchange contracts | | 313,312 |
| |
|
| Net Assets ($) | | | | 23,763,471 |
| |
| |
|
| |
| |
| Net Asset Value Per Share | | | | |
| | | Initial Shares | | Service Shares |
| |
| |
|
| Net Assets ($) | | 15,790,871 | | 7,972,600 |
| Shares Outstanding | | 2,409,285 | | 1,213,524 |
| |
| |
|
| Net Asset Value Per Share ($) | | 6.55 | | 6.57 |
See notes to financial statements.
T h e P o r t f o l i o 25
| S TAT E M E N T O F | | O P E R AT I O N S | | |
| Ye a r E n d e d D e c e m b e r 3 1 , | | 2 0 0 6 | | |
| |
| |
|
| |
| |
| |
| |
| Investment Income ($): | | | | |
| Income: | | | | |
| Interest | | | | 1,863,705 |
| Dividends: | | | | |
| Unaffiliated | | | | 35,240 |
| Affiliated issuers | | | | 10,267 |
| Income from securities lending | | | | 8,887 |
| Total Income | | | | 1,918,099 |
| Expenses: | | | | |
| Investment advisory fee—Note 3(a) | | 165,478 |
| Auditing fees | | | | 35,457 |
| Distribution fees—Note 3(b) | | | | 20,788 |
| Prospectus and shareholders’ reports | | 9,991 |
| Custodian fees—Note 3(b) | | | | 5,376 |
| Trustees’ fees and expenses—Note 3(c) | | 3,704 |
| Legal fees | | | | 730 |
| Shareholder servicing costs—Note 3(b) | | 600 |
| Miscellaneous | | | | 37,088 |
| Total Expenses | | | | 279,212 |
| Less—waiver of fees due to undertaking—Note 3(a) | | (50,088) |
| Net Expenses | | | | 229,124 |
| Investment Income—Net | | | | 1,688,975 |
| |
| |
|
| Realized and Unrealized Gain (Loss) on Investments—Note 4 ($): |
| Net realized gain (loss) on investments and foreign currency transactions | | 281,998 |
| Net realized gain (loss) on swap transactions | | 268 |
| Net realized gain (loss) on forward currency exchange contracts | | (30,721) |
| Net Realized Gain (Loss) | | | | 251,545 |
| Net unrealized appreciation (depreciation) on investments, | | |
| foreign currency transactions, forward currency | | |
| exchange contracts and swap transactions | | 192,633 |
| Net Realized and Unrealized Gain (Loss) on Investments | | 444,178 |
| Net Increase in Net Assets Resulting from Operations | | 2,133,153 |
See notes to financial statements.
|
S TAT E M E N T O F C H A N G E S I N N E T A S S E T S
| | | Year Ended December 31, |
| |
|
| | | 2006 | | 2005 |
| |
| |
|
| Operations ($): | | | | |
| Investment income—net | | 1,688,975 | | 2,023,379 |
| Net realized gain (loss) on investments | | 251,545 | | (260,534) |
| Net unrealized appreciation | | | | |
| (depreciation) on investments | | 192,633 | | (1,095,928) |
| Net Increase (Decrease) in Net Assets | | | | |
| Resulting from Operations | | 2,133,153 | | 666,917 |
| |
| |
|
| Dividends to Shareholders from ($): | | | | |
| Investment income—net: | | | | |
| Initial shares | | (1,284,720) | | (1,531,558) |
| Service shares | | (623,176) | | (660,967) |
| Total Dividends | | (1,907,896) | | (2,192,525) |
| |
| |
|
| Beneficial Interest Transactions ($): | | | | |
| Net proceeds from shares sold: | | | | |
| Initial shares | | 482,757 | | 1,336,313 |
| Service shares | | 1,319,417 | | 1,804,074 |
| Dividends reinvested: | | | | |
| Initial shares | | 1,284,720 | | 1,531,558 |
| Service shares | | 623,176 | | 660,967 |
| Cost of shares redeemed: | | | | |
| Initial shares | | (5,271,683) | | (6,535,964) |
| Service shares | | (2,969,622) | | (2,523,884) |
| Increase (Decrease) in Net Assets from | | | | |
| Beneficial Interest Transactions | | (4,531,235) | | (3,726,936) |
| Total Increase (Decrease) in Net Assets | | (4,305,978) | | (5,252,544) |
| |
| |
|
| Net Assets ($): | | | | |
| Beginning of Period | | 28,069,449 | | 33,321,993 |
| End of Period | | 23,763,471 | | 28,069,449 |
| Undistributed investment income—net | | 12,413 | | 76,686 |
T h e P o r t f o l i o 27
S TAT E M E N T O F C H A N G E S I N N E T A S S E T S (continued)
| | | Year Ended December 31, |
| |
|
| | | 2006 | | 2005 |
| |
| |
|
| Capital Share Transactions: | | | | |
| Initial Shares | | | | |
| Shares sold | | 74,023 | | 197,550 |
| Shares issued for dividends reinvested | | 199,043 | | 233,424 |
| Shares redeemed | | (807,793) | | (982,751) |
| Net Increase (Decrease) in Shares Outstanding | | (534,727) | | (551,777) |
| |
| |
|
| Service Shares | | | | |
| Shares sold | | 201,440 | | 269,680 |
| Shares issued for dividends reinvested | | 96,355 | | 100,639 |
| Shares redeemed | | (454,895) | | (380,156) |
| Net Increase (Decrease) in Shares Outstanding | | (157,100) | | (9,837) |
See notes to financial statements.
F I N A N C I A L H I G H L I G H T S
The following tables describe the performance for each share class for the fiscal periods indicated.All information (except portfolio turnover rate) reflects financial results for a single portfolio share. Total return shows how much your investment in the portfolio would have increased (or decreased) during each period, assuming you had reinvested all dividends and distributions.These figures have been derived from the portfolio’s financial statements.
| | | | | Year Ended December 31, | | |
| |
| |
| |
|
| Initial Shares | | 2006 | | 2005 | | 2004 a | | 2003 | | 2002 |
| |
| |
| |
| |
| |
|
| Per Share Data ($): | | | | | | | | | | |
| Net asset value, beginning of period | | 6.50 | | 6.83 | | 6.68 | | 5.63 | | 7.33 |
| Investment Operations: | | | | | | | | | | |
| Investment income—net b | | .43 | | .43 | | .46 | | .53 | | .69 |
| Net realized and unrealized | | | | | | | | | | |
| gain (loss) on investments | | .12 | | (.27) | | .19 | | 1.12 | | (1.64) |
| Total from Investment Operations | | .55 | | .16 | | .65 | | 1.65 | | (.95) |
| Distributions: | | | | | | | | | | |
| Dividends from investment income—net | | (.50) | | (.49) | | (.50) | | (.60) | | (.75) |
| Net asset value, end of period | | 6.55 | | 6.50 | | 6.83 | | 6.68 | | 5.63 |
| |
| |
| |
| |
| |
|
| Total Return (%) | | 8.70 | | 2.42 | | 10.10 | | 30.00 | | (13.01) |
| |
| |
| |
| |
| |
|
| Ratios/Supplemental Data (%): | | | | | | | | | | |
| Ratio of total expenses | | | | | | | | | | |
| to average net assets | | 1.01 | | .90 | | .89 | | .96 | | .94 |
| Ratio of net expenses | | | | | | | | | | |
| to average net assets | | .90 | | .88 | | .89 | | .90 | | .92 |
| Ratio of net investment income | | | | | | | | | | |
| to average net assets | | 6.64 | | 6.53 | | 6.82 | | 8.43 | | 10.69 |
| Portfolio Turnover Rate | | 29.91 | | 60.64 | | 78.90 | | 258.88 | | 436.35 |
| |
| |
| |
| |
| |
|
| Net Assets, end of period ($ x 1,000) | | 15,791 | | 19,142 | | 23,881 | | 25,571 | | 20,033 |
| a | | As of January 1, 2004, the portfolio has adopted the method of accounting for interim payments on swap contracts in |
| | | accordance with Financial Accounting Standards Board Statement No. 133.These interim payments are reflected |
| | | within net realized and unrealized gain (loss) on swap contracts, however, prior to January 1, 2004, these interim |
| | | payments were reflected within interest income/expense in the Statement of Operations.The effect of this change for |
| | | the period ended December 31, 2004, was to increase net investment income per share by less than $.01, decrease net |
| | | realized and unrealized gain (loss) on investments per share by less than $.01 and increase the ratio of net |
| | | investment income to average net assets from 6.81% to 6.82%. Per share data and ratios/supplemental data for |
| | | periods prior to January 1, 2004 have not been restated to reflect this change in presentation. |
| b | | Based on average shares outstanding at each month end. |
| See notes to financial statements. |
T h e P o r t f o l i o 29
F I N A N C I A L H I G H L I G H T S (continued)
| | | | | Year Ended December 31, | | |
| |
| |
| |
|
| Service Shares | | 2006 | | 2005 | | 2004 a | | 2003 | | 2002 |
| |
| |
| |
| |
| |
|
| Per Share Data ($): | | | | | | | | | | |
| Net asset value, beginning of period | | 6.51 | | 6.84 | | 6.68 | | 5.63 | | 7.33 |
| Investment Operations: | | | | | | | | | | |
| Investment income—net b | | .43 | | .44 | | .46 | | .53 | | .68 |
| Net realized and unrealized | | | | | | | | | | |
| gain (loss) on investments | | .13 | | (.29) | | .19 | | 1.12 | | (1.63) |
| Total from Investment Operations | | .56 | | .15 | | .65 | | 1.65 | | (.95) |
| Distributions: | | | | | | | | | | |
| Dividends from investment income—net | | (.50) | | (.48) | | (.49) | | (.60) | | (.75) |
| Net asset value, end of period | | 6.57 | | 6.51 | | 6.84 | | 6.68 | | 5.63 |
| |
| |
| |
| |
| |
|
| Total Return (%) | | 8.64 | | 2.34 | | 10.06 | | 30.28 | | (13.12) |
| |
| |
| |
| |
| |
|
| Ratios/Supplemental Data (%): | | | | | | | | | | |
| Ratio of total expenses | | | | | | | | | | |
| to average net assets | | 1.26 | | 1.15 | | 1.14 | | 1.22 | | 1.25 |
| Ratio of net expenses | | | | | | | | | | |
| to average net assets | | .90 | | .90 | | .90 | | .90 | | .92 |
| Ratio of net investment income | | | | | | | | | | |
| to average net assets | | 6.64 | | 6.54 | | 6.80 | | 8.34 | | 10.73 |
| Portfolio Turnover Rate | | 29.91 | | 60.64 | | 78.90 | | 258.88 | | 436.35 |
| |
| |
| |
| |
| |
|
| Net Assets, end of period ($ x 1,000) | | 7,973 | | 8,928 | | 9,441 | | 9,062 | | 4,933 |
| a | | As of January 1, 2004, the portfolio has adopted the method of accounting for interim payments on swap contracts |
| | | in accordance with Financial Accounting Standards Board Statement No. 133.These interim payments are reflected |
| | | within net realized and unrealized gain (loss) on swap contracts, however, prior to January 1, 2004, these interim |
| | | payments were reflected within interest income/expense in the Statement of Operations.The effect of these changes |
| | | for the fiscal year ended December 31, 2004, was to increase net investment income per share by less than $.01, |
| | | decrease net realized and unrealized gain (loss) on investments per share by less than $.01 and had no effect on the |
| | | ratio of net investment income to average net assets. Per share data and ratios/supplemental data for periods prior to |
| | | January 1, 2004 have not been restated to reflect this change in presentation. |
| b | | Based on average shares outstanding at each month end. |
| See notes to financial statements. |
N O T E S T O F I N A N C I A L S TAT E M E N T S
NOTE 1—Significant Accounting Policies:
Dreyfus Variable Investment Fund (the “fund”) is registered under the Investment Company Act of 1940 as amended (the “Act”), as an open-end management investment company, operating as a series company currently offering twelve series, including the Limited Term High Yield Portfolio (the “portfolio”).The portfolio is only offered to separate accounts established by insurance companies to fund variable annuity contracts and variable life insurance policies.The portfolio is a diversified series.The portfolio’s investment objective is to maximize total return, consisting of capital appreciation and current income.The Dreyfus Corporation (the “Manager” or “Dreyfus”) serves as the portfolio’s investment adviser.The Manager is a wholly-owned subsidiary of Mellon Financial Corporation (“Mellon Financial”).
On December 4, 2006, Mellon Financial and The Bank of New York Company, Inc. announced that they had entered into a definitive agreement to merge. The new company will be called The Bank of New York Mellon Corporation. As part of this transaction, Dreyfus would become a wholly-owned subsidiary of The Bank of New York Mellon Corporation.The transaction is subject to certain regulatory approvals and the approval of The Bank of New York Company, Inc.’s and Mellon Financial’s shareholders, as well as other customary conditions to closing. Subject to such approvals and the satisfaction of the other conditions, Mellon Financial and The Bank of New York Company, Inc. expect the transaction to be completed in the third quarter of 2007.
Dreyfus Service Corporation (the “Distributor”), a wholly-owned subsidiary of the Manager, is the distributor of the portfolio’s shares, which are sold without a sales charge. The portfolio is authorized to issue an unlimited number of $.001 par value shares of Beneficial Interest in the following classes of shares: Initial and Service. Each class of shares has identical rights and privileges, except with respect to the distribution plan and the expenses borne by each class and certain voting rights. Income, expenses (other than expenses attributable to a specific class), and realized and unrealized gains or losses on investments are allocated to each class of shares based on its relative net assets.
T h e P o r t f o l i o 31
N O T E S T O F I N A N C I A L S TAT E M E N T S (continued)
The fund accounts separately for the assets, liabilities and operations of each series. Expenses directly attributable to each series are charged to that series’ operations; expenses which are applicable to all series are allocated among them on a pro rata basis.
The portfolio’s financial statements are prepared in accordance with U.S. generally accepted accounting principles, which may require the use of management estimates and assumptions.Actual results could differ from those estimates.
The fund enters into contracts that contain a variety of indemnifica-tions.The portfolio’s maximum exposure under these arrangements is unknown. The portfolio does not anticipate recognizing any loss related to these arrangements.
(a) Portfolio valuation: Investments in securities (excluding short-term investments other than U.S. Treasury Bills), financial futures, options, swap transactions and forward currency exchange contracts are valued each business day by an independent pricing service (the “Service”) approved by the Board of Trustees. Investments for which quoted bid prices are readily available and are representative of the bid side of the market in the judgment of the Service are valued at the mean between the quoted bid prices (as obtained by the Service from dealers in such securities) and asked prices (as calculated by the Service based upon its evaluation of the market for such securities). Other investments (which constitute a majority of the portfolio securities) are valued as determined by the Service, based on methods which include consideration of: yields or prices of securities of comparable quality, coupon, maturity and type; indications as to values from dealers; and general market conditions. Restricted securities, as well as securities or other assets for which recent market quotations are not readily available, that are not valued by a pricing service approved by the Board of Trustees, or are determined by the portfolio not to reflect accurately fair value are valued at fair value as determined in good faith under the direction of the Board of Trustees.The factors that may be considered when fair valuing a security include fundamental analytical data, the nature and duration of restrictions on disposition, an
evaluation of the forces that influence the market in which the securities are purchased and sold and public trading in similar securities of the issuer or comparable issuers. Short-term investments, excluding U.S.Treasury Bills, are carried at amortized cost, which approximates value. Registered open-ended investment companies that are not traded on an exchange are valued at their net asset value. Investments in swap transactions are valued each business day by an independent pricing service approved by the Board of Trustees. Swaps are valued by the service by using a swap pricing model which incorporates among other factors, default probabilities, recovery rates, credit curves of the underlying issuer and swap spreads on interest rates. Investments denominated in foreign currencies are translated to U.S. dollars at the prevailing rates of exchange. Forward currency exchange contracts are valued at the forward rate.
On September 20, 2006, the Financial Accounting Standards Board (FASB) released Statement of Financial Accounting Standards No. 157 “Fair Value Measurements” (“FAS 157”). FAS 157 establishes an authoritative definition of fair value, sets out a framework for measuring fair value, and requires additional disclosures about fair-value measurements. The application of FAS 157 is required for fiscal years beginning after November 15, 2007 and interim periods within those fiscal years. Management does not believe that the application of this standard will have a material impact on the financial statements of the portfolio.
(b) Foreign currency transactions: The portfolio does not isolate that portion of the results of operations resulting from changes in foreign exchange rates on investments from the fluctuations arising from changes in the market prices of securities held. Such fluctuations are included with the net realized and unrealized gain or loss on investments.
Net realized foreign exchange gains or losses arise from sales and maturities of short-term securities, sales of foreign currencies, currency gains or losses realized on securities transactions and the difference between the amounts of dividends, interest and foreign withholding taxes recorded on the fund’s books and the U.S. dollar equivalent of the
T h e P o r t f o l i o 33
N O T E S T O F I N A N C I A L S TAT E M E N T S (continued)
amounts actually received or paid. Net unrealized foreign exchange gains and losses arise from changes in the value of assets and liabilities, other than investments in securities, resulting from changes in exchange rates. Such gains and losses are included with net realized and unrealized gain or loss on investments.
(c) Securities transactions and investment income: Securities transactions are recorded on a trade date basis. Realized gain and loss from securities transactions are recorded on the identified cost basis. Dividend income is recognized on the ex-dividend date and interest income, including, where applicable, accretion of discount and amortization of premium on investments, is recognized on the accrual basis.
The portfolio has an arrangement with the custodian bank whereby the portfolio receives earnings credits from the custodian when positive cash balances are maintained, which are used to offset custody fees. For financial reporting purposes, the portfolio includes net earnings credits as an expense offset in the Statement of Operations.
Pursuant to a securities lending agreement with Mellon Bank, N.A., an affiliate of the Manager, the portfolio may lend securities to qualified institutions. It is the portfolio’s policy, that at origination, all loans are secured by collateral of at least 102% of the value of U.S. securities loaned and 105% of the value of foreign securities loaned. Collateral equivalent to at least 100% of the market value of securities on loan is maintained at all times. Cash collateral is invested in certain money market mutual funds managed by the Manager.The portfolio is entitled to receive all income on securities loaned, in addition to income earned as a result of the lending transaction. Although each security loaned is fully collateralized, the portfolio bears the risk of delay in recovery of, or loss of rights in, the securities loaned should a borrower fail to return the securities in a timely manner.
(d) Affiliated issuers: Investments in other investment companies advised by the Manager are defined as “affiliated” in the Act.
(e) Dividends to shareholders: It is the policy of the portfolio to declare and pay dividends quarterly from investment income-net. Dividends from net realized capital gain, if any, are normally declared
and paid annually, but the portfolio may make distributions on a more frequent basis to comply with the distribution requirements of the Internal Revenue Code of 1986, as amended (the “Code”). To the extent that net realized capital gain can be offset by capital loss carryovers, it is the policy of the portfolio not to distribute such gain. Income and capital gain distributions are determined in accordance with income tax regulations, which may differ from U.S. generally accepted accounting principles.
(f) Federal income taxes: It is the policy of the portfolio to continue to qualify as a regulated investment company, if such qualification is in the best interests of its shareholders, by complying with the applicable provisions of the Code, and to make distributions of taxable income sufficient to relieve it from substantially all federal income and excise taxes.
On July 13, 2006, the FASB released FASB Interpretation No. 48, “Accounting for Uncertainty in Income Taxes” (FIN 48). FIN 48 provides guidance for how uncertain tax positions should be recognized, measured, presented and disclosed in the financial statements. FIN 48 requires the evaluation of tax positions taken or expected to be taken in the course of preparing the portfolio’s tax returns to determine whether the tax positions are “more-likely-than-not” of being sustained by the applicable tax authority. Tax positions not deemed to meet the more-likely-than-not threshold would be recorded as a tax benefit or expense in the current year.Adoption of FIN 48 is required for fiscal years beginning after December 15, 2006 and is to be applied to all open tax years as of the effective date. Management does not believe that the application of this standard will have a material impact on the financial statements of the portfolio.
At December 31, 2006, the components of accumulated earnings on a tax basis were as follows: undistributed ordinary income $58,867, accumulated capital losses $35,044,961 and unrealized appreciation $107,098. In addition, the portfolio had $14,729 of capital losses realized after October 31, 2006, which were deferred for tax purposes to the first day of the following fiscal year.
T h e P o r t f o l i o 35
N O T E S T O F I N A N C I A L S TAT E M E N T S (continued)
The accumulated capital loss carryover is available to be applied against future net securities profits, if any, realized subsequent to December 31, 2006. If not applied, $4,697,048 of the carryover expires in fiscal 2007, $4,480,534 expires in fiscal 2008, $10,613,045 expires in fiscal 2009, $10,693,853 expires in fiscal 2010, $4,059,439 expires in fiscal 2011 and $501,042 expires in fiscal 2013.
The tax character of distributions paid to shareholders during the fiscal year ended December 31, 2006 and December 31, 2005, were as follows: ordinary income $1,907,896 and $2,192,525, respectively.
During the period ended December 31, 2006, as a result of permanent book to tax differences, primarily due to the tax treatment for foreign currency gains and losses, amortization of premiums and consent fees, the portfolio increased accumulated undistributed investment income-net by $154,648, decreased accumulated net realized gain (loss) on investments by $154,361 and decreased paid-in capital by $287. Net assets were not affected by this reclassification.
NOTE 2—Bank Lines of Credit:
The portfolio may borrow up to $10 million for leveraging purposes under a short-term unsecured line of credit and participates with other Dreyfus-managed funds in a $100 million unsecured line of credit primarily to be utilized for temporary or emergency purposes, including the financing of redemptions. Interest is charged to the portfolio based on prevailing market rates in effect at the time of borrowing. During the period ended December 31, 2006, the portfolio did not borrow under either line of credit.
NOTE 3—Investment Advisory Fee and Other Transactions With Affiliates:
(a) Pursuant to an Investment Advisory Agreement (“Agreement”) with Dreyfus, the investment advisory fee is computed at the annual rate of .65% of the value of the portfolio’s average daily net assets and is payable monthly.
The Manager has agreed, from January 1, 2006 to December 31, 2007, to waive receipt of its fees and/or assume the expenses of the portfolio so that the expenses of neither class, exclusive of taxes, brokerage commissions, extraordinary expenses, interest expenses and commitment fees on borrowings exceed .90% of the value of the average daily net assets of their class. During the period ended December 31, 2006, the Manager waived receipt of fees of $50,088, pursuant to the undertaking.
(b) Under the Distribution Plan (the “Plan”) adopted pursuant to Rule 12b-1 under the Act, Service shares pay the Distributor for distributing their shares, for servicing and/or maintaining Service shares shareholder accounts and for advertising and marketing for Service shares.The Plan provides for payments to be made at an annual rate of .25% of the value of the Service shares’ average daily net assets. The Distributor may make payments to Participating Insurance Companies and to brokers and dealers acting as principal underwriter for their variable insurance products. The fees payable under the Plan are payable without regard to actual expenses incurred. During the period ended December 31, 2006, Service shares were charged $20,788 pursuant to the Plan.
The portfolio compensates Dreyfus Transfer, Inc., a wholly-owned subsidiary of the Manager, under a transfer agency agreement for providing personnel and facilities to perform transfer agency services for the portfolio. During the period ended December 31, 2006, the portfolio was charged $64 pursuant to the transfer agency agreement.
The portfolio compensates Mellon Bank, N.A., an affiliate of the Manager, under a custody agreement to provide custodial services for the portfolio. During the period ended December 31, 2006, the portfolio was charged $5,376 pursuant to the custody agreement.
During the period ended December 31, 2006, the portfolio was charged $4,204 for services performed by the Chief Compliance Officer.
T h e P o r t f o l i o 37
N O T E S T O F I N A N C I A L S TAT E M E N T S (continued)
The components of Due to The Dreyfus Corporation and affiliates in the Statement of Assets and Liabilities consist of: investment advisory fees $13,151, chief compliance officer fees $2,044, Rule 12b-1 distribution plan fees $1,696, custodian fees $1,094 and transfer agency per account fees $11, which are offset against an expense reimbursement currently in effect in the amount of $11,812.
(c) Each Board member also serves as a Board member of other funds within the Dreyfus complex. Annual retainer fees and attendance fees are allocated to each fund based on net assets.
(d) Pursuant to an exemptive order from the SEC, the portfolio may invest its available cash balances in affiliated money market mutual funds. Management fees of the underlying money market mutual funds have been waived by the Manager.
NOTE 4—Securities Transactions:
The aggregate amount of purchases and sales of investment securities, excluding short-term securities, forward currency exchange contracts, and swap transactions, during the period ended December 31, 2006, amounted to $7,458,487 and $11,635,960, respectively.
The portfolio enters into forward currency exchange contracts in order to hedge its exposure to changes in foreign currency exchange rates on its foreign portfolio holdings and to settle foreign currency transactions. When executing forward currency exchange contracts, the portfolio is obligated to buy or sell a foreign currency at a specified rate on a certain date in the future. With respect to sales of forward currency exchange contracts, the portfolio would incur a loss if the value of the contract increases between the date the forward contract is opened and the date the forward contract is closed.The portfolio realizes a gain if the value of the contract decreases between those dates.With respect to purchases of forward currency exchange contracts, the portfolio would incur a loss if the value of the contract decreases between the date the
forward contract is opened and the date the forward contract is closed. The portfolio realizes a gain if the value of the contract increases between those dates.The portfolio is also exposed to credit risk associated with counterparty nonperformance on these forward currency exchange contracts which is typically limited to the unrealized gain on each open contract.The following summarizes open forward currency exchange contracts at December 31, 2006:
| | | Foreign | | | | | | |
| Forward Currency | | Currency | | | | | | Unrealized |
| Exchange Contracts | | Amounts | | Proceeds ($) | | Value ($) | | (Depreciation) ($) |
| |
| |
| |
| |
|
| Sales; | | | | | | | | |
| Euro | | | | | | | | |
| expiring 3/21/2007 | | 610,000 | | 802,089 | | 807,701 | | (5,612) |
The portfolio may enter into swap agreements to exchange the interest rate on, or return generated by, one nominal instrument for the return generated by another nominal instrument.
The portfolio accrues for the interim payments on swap contracts on a daily basis, with the net amount recorded within unrealized appreciation (depreciation) of swap contracts on the Statement of Assets and Liabilities. Once the interim payments are settled in cash, the net amount is recorded as realized gain (loss) on swaps, in addition to realized gain (loss) recorded upon the termination of swap contracts in the Statement of Operations. Fluctuations in the value of swap contracts are recorded as a component of net change in unrealized appreciation (depreciation) on investments.
Credit default swaps involve commitments to pay a fixed interest rate in exchange for payment if a credit event affecting a third party (the referenced company) occurs. Credit events may include a failure to pay interest or principal, bankruptcy, or restructuring. For those credit default swaps in which the portfolio is receiving a fixed rate, the portfolio is providing credit protection on the underlying instru-
T h e P o r t f o l i o 39
N O T E S T O F I N A N C I A L S TAT E M E N T S (continued)
ment. The maximum payouts for these contracts are limited to the notional amount of each swap. The following summarizes credit default swaps entered into by the portfolio at December 31, 2006:
| | | | | | | | | | | Unrealized |
| Notional | | Reference | | | | (Pay) Receive | | | | Appreciation |
| Amount ($) | | Entity | | Counterparty | | Fixed Rate (%) | | Expiration (Depreciation)($) |
| |
| |
| |
| |
|
| |
| 527,700 | | Dow Jones | | Morgan | | | | | | |
| | | CDX.NA.IG.4 | | Stanley | | (0.35) | | 6/20/2010 | | (5,140) |
| 332,300 | | Dow Jones | | | | | | | | |
| | | CDX.NA.IG.4 | | Merrill Lynch | | (0.31) | | 6/20/2010 | | (2,751) |
| 190,000 | | ITRAXX S5 Index | | UBS | | 0.40 | | 6/20/2011 | | 1,271 |
| 193,000 | | Kimberly Clark, | | JPMorgan | | | | | | |
| | | 6.875%, 2/15/2014 | | Chase | | (0.19) | | 12/20/2011 | | 3 |
| 50,000 | | Kimberly Clark, | | JPMorgan | | | | | | |
| | | 6.875%, 2/15/2015 | | Chase | | (0.37) | | 12/20/2016 | | 87 |
| 100,000 | | Kimberly Clark, | | Morgan | | | | | | |
| | | 6.875%, 2/15/2016 | | Stanley | | (0.37) | | 12/20/2016 | | 174 |
| 150,000 | | Kimberly Clark, | | JPMorgan | | | | | | |
| | | 6.875%, 2/15/2017 | | Chase | | (0.37) | | 12/20/2016 | | 260 |
| 150,000 | | Owens-Bockway, | | JPMorgan | | | | | | |
| | | 8.875%, 2/15/2009 | | Chase | | (1.95) | | 6/20/2010 | | (2,401) |
| 150,000 | | Owens-Illinois, | | JPMorgan | | | | | | |
| | | 7.5%, 5/15/2010 | | Chase | | 2.60 | | 6/20/2010 | | 2,627 |
| 560,000 | | Structured Model | | | | | | | | |
| | | Portfolio 0-3% | | UBS | | — | | 9/20/2013 | | — |
| 120,000 | | Telekom Finanze, | | | | | | | | |
| | | 5%, 7/22/13 | | UBS | | (0.45) | | 9/20/2011 | | (815) |
| 120,000 | | Wolters Kluwer, | | | | | | | | |
| | | 5.125%, 1/27/2014 | | UBS | | (0.55) | | 9/20/2011 | | (1,058) |
| | | | | | | | | | | (7,743) |
Risks may arise upon entering into these agreements from the potential inability of the counterparties to meet the terms of the agreement and are generally limited to the amount of net payments to be received, if any, at the date of default.
At December 31, 2006, the cost of investments for federal income tax purposes was $26,445,219; accordingly, accumulated net unrealized depreciation on investment was $151,799, consisting of $714,097 gross unrealized appreciation and $562,298 gross unrealized depreciation.
R E P O R T O F I N D E P E N D E N T R E G I S T E R E D P U B L I C A C C O U N T I N G F I R M
| Shareholders and Board of Trustees |
| Dreyfus Variable Investment Fund, |
| Limited Term High Yield Portfolio |
We have audited the accompanying statement of assets and liabilities, including the statement of investments, of Dreyfus Variable Investment Fund, Limited Term High Yield Portfolio (one of the funds comprising Dreyfus Variable Investment Fund) as of December 31, 2006, and the related statement of operations for the year then ended, the statement of changes in net assets for each of the two years in the period then ended, and financial highlights for each of the periods indicated therein.These financial statements and financial highlights are the responsibility of the Fund’s management. Our responsibility is to express an opinion on these financial statements and financial highlights based on our audits.
We conducted our audits in accordance with the standards of the Public Company Accounting Oversight Board (United States).Those standards require that we plan and perform the audit to obtain reasonable assurance about whether the financial statements and financial highlights are free of material misstatement.We were not engaged to perform an audit of the Fund’s internal control over financial reporting. Our audits included consideration of internal control over financial reporting as a basis for designing audit procedures that are appropriate in the circumstances, but not for the purpose of expressing an opinion on the effectiveness of the Fund’s internal control over financial reporting. Accordingly, we express no such opinion.An audit also includes examining, on a test basis, evidence supporting the amounts and disclosures in the financial statements and financial highlights, assessing the accounting principles used and significant estimates made by management, and evaluating the overall financial statement presentation. Our procedures included confirmation of securities owned as of December 31, 2006 by correspondence with the custodian and others.We believe that our audits provide a reasonable basis for our opinion.
In our opinion, the financial statements and financial highlights referred to above present fairly, in all material respects, the financial position of Dreyfus Variable Investment Fund, Limited Term High Yield Portfolio at December 31, 2006, the results of its operations for the year then ended, the changes in its net assets for each of the two years in the period then ended, and the financial highlights for each of the indicated periods, in conformity with U.S. generally accepted accounting principles.

| New York, New York |
| February 6, 2007 |
T h e P o r t f o l i o 41
I M P O R TA N T TA X I N F O R M AT I O N ( U n a u d i t e d )
For federal tax purposes, the portfolio hereby designates 1.91% of the ordinary dividends paid during the fiscal year ended December 31, 2006 as qualifying for the corporate dividends received deduction. Shareholders will receive notification in January 2007 of the percentage applicable to the preparation of their 2006 income tax returns.
P R O X Y R E S U LT S ( U n a u d i t e d )
Dreyfus Variable Investment Fund held a special meeting of shareholders on June 29, 2006.The proposal considered at the meeting, and the results, are as follows:
| | | | | Shares | | |
| |
| |
| |
|
| | | Votes For | | | | Authority Withheld |
| |
| |
| |
|
| To elect additional Board Members: | | | | | | |
| Peggy C. Davis † | | 171,078,927 | | | | 7,687,714 |
| Joseph S. DiMartino | | 170,946,484 | | | | 7,820,156 |
| David P. Feldman | | 170,959,921 | | | | 7,806,720 |
| Ehud Houminer † | | 170,132,087 | | | | 8,634,554 |
| Gloria Messinger † | | 170,187,241 | | | | 8,579,400 |
| Anne Wexler † | | 170,212,607 | | �� | | 8,554,033 |
† Each new Board member’s term commenced on September 26, 2006.
In addition to Joseph S. DiMartino and David P. Feldman, James F. Henry, Dr. Paul A. Marks and Dr. Martin Peretz continue as Board members of the fund.
N O T E S

| Telephone 1-800-554-4611 or 516-338-3300 |
| Mail | | The Dreyfus Family of Funds, 144 Glenn Curtiss Boulevard, Uniondale, NY 11556-0144 |
| | | Attn: Investments Division |
The portfolio files its complete schedule of portfolio holdings with the Securities and Exchange Commission (“SEC”) for the first and third quarters of each fiscal year on Form N-Q. The portfolio’s Forms N-Q are available on the SEC’s website at http://www.sec.gov and may be reviewed and copied at the SEC’s Public Reference Room in Washington, DC. Information on the operation of the Public Reference Room may be obtained by calling 1-202-551-8090.
A description of the policies and procedures that the portfolio uses to determine how to vote proxies relating to portfolio securities, and information regarding how the portfolio voted these proxies for the 12-month period ended June 30, 2006, is available at http://www.dreyfus.com and on the SEC’s website at http://www.sec.gov. The description of the policies and procedures is also available without charge, upon request, by calling 1-800-645-6561.

| Dreyfus Variable |
| Investment Fund, |
| Money Market |
| Portfolio |

The views expressed in this report reflect those of the portfolio manager only through the end of the period covered and do not necessarily represent the views of Dreyfus or any other person in the Dreyfus organization.Any such views are subject to change at any time based upon market or other conditions and Dreyfus disclaims any responsibility to update such views. These views may not be relied on as investment advice and, because investment decisions for a Dreyfus portfolio are based on numerous factors, may not be relied on as an indication of trading intent on behalf of any Dreyfus portfolio.
Not FDIC-Insured • Not Bank-Guaranteed • May Lose Value
| | | Contents |
| |
| | | THE PORTFOLIO |
| |
|
| 2 | | A Letter from the CEO |
| 3 | | Discussion of Performance |
| 6 | | Understanding Your Portfolio’s Expenses |
| 6 | | Comparing Your Portfolio’s Expenses |
| | | With Those of Other Funds |
| 7 | | Statement of Investments |
| 10 | | Statement of Assets and Liabilities |
| 11 | | Statement of Operations |
| 12 | | Statement of Changes in Net Assets |
| 13 | | Financial Highlights |
| 14 | | Notes to Financial Statements |
| 19 | | Report of Independent Registered |
| | | Public Accounting Firm |
| 20 | | Proxy Results |
| 21 | | Board Members Information |
| 24 | | Officers of the Fund |
| |
| FOR MORE INFORMATION |
|
| | | Back Cover |
Dreyfus Variable Investment Fund,
Money Market Portfolio
|
The Portfolio

We are pleased to present this annual report for Dreyfus Variable Investment Fund, Money Market Portfolio, covering the 12-month period from January 1, 2006, through December 31, 2006.
2006 proved to be a good time for the financial markets, with rallies in the second half of the year helping stocks, bonds and money market instruments achieve positive absolute returns.A number of factors contributed to the markets’ gains, including a more moderate economic expansion, strong business conditions, subdued inflation, stabilizing interest rates and robust investor demand for most asset classes.
In our analysis, 2006 provided an excellent reminder of the need for a long-term investment perspective. Adopting too short a time frame proved costly for some investors last year, as reducing allocations to stocks and bonds generally meant missing subsequent rallies. Indeed, history shows that reacting to near-term developments with extreme shifts in strategy rarely is the right decision. We believe that a better course is to set a portfolio mix to meet future goals, while attempting to ignore short term market fluctuations. Money market portfolios have continued to play an important role in that mix.
For information about how the portfolio performed during the reporting period, as well as market perspectives, we have provided a Discussion of Performance given by the portfolio manager.
Thank you for your continued confidence and support.We wish you good health and prosperity in 2007.

Thomas F. Eggers
Chief Executive Officer
The Dreyfus Corporation
January 16, 2007
|

DISCUSSION OF PERFORMANCE
Bernard W. Kiernan, Jr., Senior Portfolio Manager
How did Dreyfus Variable Investment Fund, Money Market Portfolio perform during the period?
During the 12-month period ended December 31, 2006, the portfolio produced a yield of 4.50% . Taking into account the effects of compounding, the portfolio also provided an effective yield of 4.59% for the same period.1
What is the portfolio’s investment approach?
The portfolio seeks as high a level of current income as is consistent with the preservation of capital and the maintenance of liquidity.To pursue this goal, the portfolio invests in a diversified selection of high-quality, short-term debt securities, including securities issued or guaranteed by the U.S. government or its agencies or instrumentalities, certificates of deposit, time deposits, bankers’ acceptances and other short-term securities issued by domestic or foreign banks, repurchase agreements, asset-backed securities, domestic and dollar-denominated foreign commercial paper and other short-term corporate and bank obligations of domestic and foreign issuers and dollar-denominated obligations issued or guaranteed by one or more foreign governments or their agencies, including obligations of supranational entities.
Normally, the portfolio invests at least 25% of its net assets in domestic or dollar-denominated foreign bank obligations.
What other factors influenced the portfolio’s performance?
The portfolio’s returns in 2006 were mainly influenced by changing economic conditions. The U.S. economy expanded at a robust 5.6% annualized rate in the first quarter of the year. Low unemployment and strong consumer confidence began to rekindle investors’ inflation concerns, and despite increases in short-term interest rates in January and March, the U.S.Treasury securities yield curve steepened.
The Portfolio 3
DISCUSSION OF PERFORMANCE (continued)
|
In May, investors’ economic concerns intensified when hawkish comments from members of the Federal Reserve Board (the “Fed”) sparked sharp declines in longer-term U.S.Treasury security prices. In addition, the unemployment rate fell to 4.6%, stoking fears that wage inflation might accelerate. Hence, investors revised upward their interest-rate expectations, and they widely expected the Fed’s rate hike in May to 5%. Although investors also anticipated the Fed’s June 29 rate hike to 5.25%, the outlook for future action became cloudier amid worries that the Fed might become too aggressive, possibly triggering a recession.
Investors’ concerns were compounded when it later was announced that U.S. GDP expanded at a more moderate 2.6% annualized rate during the second quarter. Indeed, the U.S. economy appeared to slow further over the summer, when housing markets softened and employment gains moderated.The Fed cited a slower economy when it left short-term interest rates unchanged at 5.25% at its meeting on August 8, the first pause after more than two years of steady rate hikes.
The Fed again left overnight interest rates unchanged in September. While core inflation data remained elevated, the Fed indicated that it expected those pressures to moderate as the economy slowed. In fact, oil prices tumbled to around $60 per barrel, helping to put a lid on one of the main drivers of the market’s inflation fears. At the same time, a decline in the unemployment rate helped to reassure investors that the economy probably was headed for a soft landing.
As was widely expected, the Fed continued to hold overnight interest rates steady at its meeting in late October. Still, Fed members indicated that the risk of higher inflation was greater than the risk of a pronounced economic downturn, and further policy firming might be needed if inflation remains above the Fed’s comfort zone.
The Fed’s concerns appeared to be warranted when an employment report released in December showed healthy employment gains and an unemployment rate of just 4.5% . However, other economic data —including declines in consumer confidence and orders for durable goods — suggested that the economy continued to slow, but at a gradual pace that appeared to hold little risk of recession.
Over the first half of the reporting period, as short-term interest rates rose, we maintained the portfolio’s weighted average maturity in a range we considered shorter than industry averages.After the Fed paused in its tightening campaign in August, we increased the portfolio’s weighted average maturity to a more neutral range. However, with only minimal yield differences along the money market yield curve it made little sense to us to establish an even longer maturity position.
What is the portfolio’s current strategy?
Fed members may be comfortable with interest rates for now, but they stand ready to change monetary policy as conditions warrant.Therefore, after a multi-year period in which Fed actions were predictable, we have entered a more uncertain time, in which every piece of economic data is likely to be scrutinized for its possible impact on monetary policy. Current economic data suggest that the U.S. economy remains sound and inflationary pressures are moderating, which may allow the Fed to remain on hold for some time. However, new economic data could paint a different picture, making a relatively cautious investment posture prudent.
| | | An investment in the portfolio is not insured or guaranteed by the FDIC or any other |
| | | government agency. Although the portfolio seeks to preserve the value of your investment at $1.00 |
| | | per share, it is possible to lose money by investing in the portfolio. |
| | | The portfolio is only available as a funding vehicle under variable life insurance policies or variable |
| | | annuity contracts issued by insurance companies. Individuals may not purchase shares of the |
| | | portfolio directly. A variable annuity is an insurance contract issued by an insurance company that |
| | | enables investors to accumulate assets on a tax-deferred basis for retirement or other long-term |
| | | goals.The investment objective and policies of Dreyfus Variable Investment Fund, Money Market |
| | | Portfolio made available through insurance products may be similar to other funds/portfolios |
| | | managed or advised by Dreyfus. However, the investment results of the portfolio may be higher or |
| | | lower than, and may not be comparable to, those of any other Dreyfus fund/portfolio. |
| 1 | | Effective yield is based upon dividends declared daily and reinvested monthly. Past performance is |
| | | no guarantee of future results.Yields fluctuate.The portfolio’s performance does not reflect the |
| | | deduction of additional charges and expenses imposed in connection with investing in variable |
| | | insurance contracts, which will reduce returns. |
The Portfolio 5
UNDERSTANDING YOUR
PORTFOLIO’S EXPENSES (Unaudited)
|
As a mutual fund investor,you pay ongoing expenses,such as management fees and other expenses.Using the information below, you can estimate how these expenses affect your investment and compare them with the expenses of other funds.You also may pay one-time transaction expenses, including sales charges (loads) and redemption fees, which are not shown in this section and would have resulted in higher total expenses. For more information, see your portfolio’s prospectus or talk to your financial adviser.
Review your portfolio’s expenses
|
The table below shows the expenses you would have paid on a $1,000 investment in Dreyfus Variable Investment Fund,Money Market Portfolio from July 1,2006 to December 31,2006. It also shows how much a $1,000 investment would be worth at the close of the period, assuming actual returns and expenses.
Expenses and Value of a $1,000 Investment assuming actual returns for the six months ended December 31, 2006
| Expenses paid per $1,000 † | | $ 2.81 |
| Ending value (after expenses) | | $1,024.30 |
COMPARING YOUR PORTFOLIO’S EXPENSES WITH THOSE OF OTHER FUNDS (Unaudited)
Using the SEC’s method to compare expenses
The Securities and Exchange Commission (SEC) has established guidelines to help investors assess fund expenses. Per these guidelines, the table below shows your portfolio’s expenses based on a $1,000 investment, assuming a hypothetical 5% annualized return. You can use this information to compare the ongoing expenses (but not transaction expenses or total cost) of investing in the portfolio with those of other funds. All mutual fund shareholder reports will provide this information to help you make this comparison. Please note that you cannot use this information to estimate your actual ending account balance and expenses paid during the period.
Expenses and Value of a $1,000 Investment assuming a hypothetical 5% annualized return for the six months ended December 31, 2006
| Expenses paid per $1,000 † | | $ 2.80 |
| Ending value (after expenses) | | $1,022.43 |
† Expenses are equal to the portfolio’s annualized expense ratio of .55%, multiplied by the average account value over the period, multiplied by 184/365 (to reflect the one-half year period).
STATEMENT OF INVESTMENTS
December 31, 2006
|
| | | Principal | | |
| Negotiable Bank Certificates of Deposit—9.9% | | Amount ($) | | Value ($) |
| |
| |
|
| Bank of America N.A. | | | | |
| 5.32%, 3/21/07 | | 5,000,000 a | | 5,000,000 |
| Citibank (South Dakota) N.A., Sioux Falls | | | | |
| 5.32%, 2/22/07 | | 5,000,000 | | 5,000,000 |
| Washington Mutual Bank | | | | |
| 5.33%, 5/1/07 | | 5,000,000 | | 4,999,897 |
| Total Negotiable Bank Certificates of Deposit | | | | |
| (cost $14,999,897) | | | | 14,999,897 |
| |
| |
|
| |
| Commercial Paper—77.4% | | | | |
| |
| |
|
| Amsterdam Funding Corp. | | | | |
| 5.31%, 1/23/07 | | 5,000,000 b | | 4,983,958 |
| Atlantis One Funding Corp. | | | | |
| 5.32%, 2/5/07 | | 5,000,000 b | | 4,974,625 |
| Bear Stearns Cos. Inc. | | | | |
| 5.38%, 3/20/07 | | 5,000,000 | | 4,943,233 |
| Beta Finance Inc. | | | | |
| 5.31%, 2/28/07 | | 5,000,000 b | | 4,957,789 |
| BNP Paribas Finance Inc. | | | | |
| 5.25%, 6/6/07 | | 5,000,000 | | 4,889,175 |
| Calyon North America Inc. | | | | |
| 5.31%, 3/1/07 | | 5,000,000 | | 4,957,061 |
| CBA (Delaware) Finance Inc. | | | | |
| 5.32%, 2/21/07 | | 5,000,000 | | 4,962,813 |
| CC (USA) Inc. | | | | |
| 5.31%, 2/6/07 | | 5,200,000 b | | 5,172,752 |
| Concord Minutemen Capital Co. LLC | | | | |
| 5.31%, 2/2/07 | | 4,000,000 b | | 3,981,369 |
| Crown Point Capital Co. LLC | | | | |
| 5.38%, 3/16/07 | | 5,961,000 b | | 5,896,793 |
| Danske Corp., Delaware | | | | |
| 5.31%, 1/30/07 | | 5,000,000 | | 4,978,894 |
| Govco Inc. | | | | |
| 5.32%, 2/21/07 | | 5,000,000 b | | 4,962,813 |
| Grampian Funding Ltd. | | | | |
| 5.31%—5.32%, 2/26/07—3/27/07 | | 9,000,000 b | | 8,910,283 |
The Portfolio 7
STATEMENT OF INVESTMENTS (continued)
|
| | | Principal | | |
| Commercial Paper (continued) | | Amount ($) | | Value ($) |
| |
| |
|
| HSBC Bank USA N.A. | | | | |
| 5.33%, 5/7/07 | | 5,000,000 | | 4,909,175 |
| Intesa Funding LLC | | | | |
| 5.31%, 3/1/07 | | 5,000,000 | | 4,957,061 |
| Liquid Funding Ltd. | | | | |
| 5.33%, 2/20/07 | | 5,000,000 b | | 4,963,472 |
| Premier Asset Collateralized Entity LLC | | |
| 5.32%, 2/20/07 | | 5,000,000 b | | 4,963,542 |
| Sheffield Receivables Corp. | | | | |
| 5.31%, 1/4/07 | | 5,000,000 b | | 4,997,808 |
| Sigma Finance Inc. | | | | |
| 5.25%, 6/6/07 | | 5,000,000 b | | 4,889,067 |
| Simba Funding Corp. | | | | |
| 5.31%, 1/22/07 | | 5,000,000 b | | 4,984,688 |
| Societe Generale N.A. Inc. | | | | |
| 5.32%, 3/29/07 | | 4,000,000 | | 3,949,927 |
| Thames Asset Global Securitization No. 1 Inc. | | |
| 5.32%, 1/22/07 | | 5,000,000 b | | 4,984,688 |
| Toyota Motor Credit Corp. | | | | |
| 5.31%, 2/28/07 | | 5,000,000 b | | 4,957,829 |
| Total Commercial Paper | | | | |
| (cost $117,128,815) | | | | 117,128,815 |
| |
| |
|
| |
| Corporate Notes—9.3% | | | | |
| |
| |
|
| Cullinan Finance Ltd. | | | | |
| 5.32%, 10/25/07 | | 5,000,000 a,b | | 4,999,400 |
| General Electric Capital Corp. | | | | |
| 5.31%, 1/24/07 | | 5,000,000 a | | 5,000,000 |
| Wells Fargo & Co. | | | | |
| 5.34%, 1/3/07 | | 4,000,000 a | | 4,000,000 |
| Total Corporate Notes | | | | |
| (cost $13,999,400) | | | | 13,999,400 |
| | | | | | | Principal | | |
| Time Deposits—3.4% | | | | Amount ($) | | Value ($) |
| |
| |
| |
|
| State Street Bank and Trust Co., Boston, MA (Grand Cayman) | | |
| 5.13%, 1/2/07 | | | | | | |
| (cost $5,100,000) | | | | 5,100,000 | | 5,100,000 |
| |
| |
| |
|
| |
| Total Investments (cost $151,228,112) | | 100.0% | | 151,228,112 |
| |
| Cash and Receivables (Net) | | .0% | | 73,204 |
| |
| Net Assets | | | | 100.0% | | 151,301,316 |
| |
| a | | Variable rate security—interest rate subject to periodic change. | | |
| b | | Securities exempt from registration under Rule 144A of the Securities Act of 1933.These securities may be resold in |
| | | transactions exempt from registration, normally to qualified institutional buyers. At December 31, 2006, these |
| | | securities amounted to $83,580,876 or 55.2% of net assets. | | |
| |
| |
|
| |
| |
| |
| |
| Portfolio Summary (Unaudited) † | | | | |
| |
| | | | | Value (%) | | | | Value (%) |
| |
| |
| |
| |
|
| Banking | | 44.7 | | Asset-Backed/Securities | | |
| Asset-Backed/Structured | | | | Arbitrage Vehicles | | 9.2 |
| Investment Vehicles | | 19.8 | | Finance | | 6.6 |
| Asset-Backed/ | | | | Brokerage Firms | | 3.3 |
| Multi-Seller Programs | | 16.4 | | | | 100.0 |
| |
| † | | Based on net assets. | | | | | | |
| See notes to financial statements. | | | | |
The Portfolio 9
STATEMENT OF ASSETS AND LIABILITIES
December 31, 2006
| | | Cost | | Value |
| |
| |
|
| Assets ($): | | | | |
| Investments in securities—See Statement of Investments | | 151,228,112 | | 151,228,112 |
| Cash | | | | 51,844 |
| Interest receivable | | | | 177,732 |
| Prepaid expenses | | | | 7,540 |
| | | | | 151,465,228 |
| |
| |
|
| Liabilities ($): | | | | |
| Due to The Dreyfus Corporation and affiliates—Note 2(a) | | | | 80,376 |
| Accrued expenses | | | | 83,536 |
| | | | | 163,912 |
| |
| |
|
| Net Assets ($) | | | | 151,301,316 |
| |
| |
|
| Composition of Net Assets ($): | | | | |
| Paid-in capital | | | | 151,284,815 |
| Accumulated undistributed investment income—net | | | | 40,045 |
| Accumulated net realized gain (loss) on investments | | | | (23,544) |
| |
| |
|
| Net Assets ($) | | | | 151,301,316 |
| |
| |
|
| Shares Outstanding | | | | |
| (unlimited number of $.001 par value shares of Beneficial Interest authorized) | | 151,284,815 |
| Net Asset Value, offering and redemption price per share ($) | | 1.00 |
See notes to financial statements.
|
STATEMENT OF OPERATIONS
Year Ended December 31, 2006
|
| Investment Income ($): | | |
| Interest Income | | 8,053,108 |
| Expenses: | | |
| Investment advisory fee—Note 2(a) | | 784,811 |
| Professional fees | | 38,428 |
| Custodian fees | | 26,647 |
| Trustees’ fees and expenses—Note 2(b) | | 15,722 |
| Prospectus and shareholders’ reports | | 14,478 |
| Shareholder servicing costs—Note 2(a) | | 2,798 |
| Miscellaneous | | 9,246 |
| Total Expenses | | 892,130 |
| Less—reduction in custody fees due to | | |
| earnings credits—Note 1(b) | | (2,256) |
| Net Expenses | | 889,874 |
| Investment Income—Net | | 7,163,234 |
| |
|
| Net Realized Gain (Loss) on Investments—Note 1(b) ($) | | (715) |
| Net Increase in Net Assets Resulting from Operations | | 7,162,519 |
See notes to financial statements.
|
The Portfolio 11
STATEMENT OF CHANGES IN NET ASSETS
| | | Year Ended December 31, |
| |
|
| | | 2006 | | 2005 |
| |
| |
|
| Operations ($): | | | | |
| Investment income—net | | 7,163,234 | | 3,347,189 |
| Net realized gain (loss) on investments | | (715) | | (65) |
| Net Increase (Decrease) in Net Assets | | | | |
| Resulting from Operations | | 7,162,519 | | 3,347,124 |
| |
| |
|
| Dividends to Shareholders from ($): | | | | |
| Investment income—net | | (7,136,592) | | (3,333,786) |
| |
| |
|
| Beneficial Interest Transactions ($1.00 per share): | | |
| Net proceeds from shares sold | | 249,036,593 | | 224,565,495 |
| Dividends reinvested | | 7,136,592 | | 3,333,786 |
| Cost of shares redeemed | | (236,107,747) | | (200,931,351) |
| Increase (Decrease) in Net Assets | | | | |
| from Beneficial Interest Transactions | | 20,065,438 | | 26,967,930 |
| Total Increase (Decrease) in Net Assets | | 20,091,365 | | 26,981,268 |
| |
| |
|
| Net Assets ($): | | | | |
| Beginning of Period | | 131,209,951 | | 104,228,683 |
| End of Period | | 151,301,316 | | 131,209,951 |
| Undistributed investment income—net | | 40,045 | | 13,403 |
See notes to financial statements.
|
The following table describes the performance for the fiscal periods indicated.Total return shows how much your investment in the portfolio would have increased (or decreased) during each period, assuming you had reinvested all dividends and distri-butions.These figures have been derived from the portfolio’s financial statements.
| | | | | Year Ended December 31, | | |
| |
| |
| |
|
| | | 2006 | | 2005 | | 2004 | | 2003 | | 2002 |
| |
| |
| |
| |
| |
|
| Per Share Data ($): | | | | | | | | | | |
| Net asset value, beginning of period | | 1.00 | | 1.00 | | 1.00 | | 1.00 | | 1.00 |
| Investment Operations: | | | | | | | | | | |
| Investment income—net | | .045 | | .026 | | .008 | | .007 | | .015 |
| Distributions: | | | | | | | | | | |
| Dividends from investment income—net | | (.045) | | (.026) | | (.008) | | (.007) | | (.015) |
| Net asset value, end of period | | 1.00 | | 1.00 | | 1.00 | | 1.00 | | 1.00 |
| |
| |
| |
| |
| |
|
| Total Return (%) | | 4.58 | | 2.65 | | .80 | | .70 | | 1.46 |
| |
| |
| |
| |
| |
|
| Ratios/Supplemental Data (%): | | | | | | | | | | |
| Ratio of total expenses | | | | | | | | | | |
| to average net assets | | .57 | | .59 | | .60 | | .57 | | .56 |
| Ratio of net expenses | | | | | | | | | | |
| to average net assets | | .57 | | .59 | | .60 | | .57 | | .56 |
| Ratio of net investment income | | | | | | | | | | |
| to average net assets | | 4.56 | | 2.66 | | .77 | | .71 | | 1.44 |
| |
| |
| |
| |
| |
|
| Net Assets, end of period ($ x 1,000) | | 151,301 | | 131,210 | | 104,229 | | 152,559 | | 196,217 |
See notes to financial statements.
|
The Portfolio 13
NOTES TO FINANCIAL STATEMENTS
NOTE 1—Significant Accounting Policies:
Dreyfus Variable Investment Fund (the “fund”) is registered under the Investment Company Act of 1940, as amended (the “Act”), as an open-end management investment company, operating as a series company currently offering twelve series, including the Money Market Portfolio (the “portfolio”).The portfolio is only offered to separate accounts established by insurance companies to fund variable annuity contracts and variable life insurance policies.The portfolio is a diversified series.The portfolio’s investment objective is to provide as high a level of current income as is consistent with the preservation of capital and the maintenance of liquidity.The Dreyfus Corporation (the “Manager” or “Dreyfus”) serves as the portfolio’s investment adviser. The Manager is a wholly-owned subsidiary of Mellon Financial Corporation (“Mellon Financial”). Dreyfus Service Corporation (the “Distributor”), a wholly-owned subsidiary of the Manager, is the distributor of the portfolio’s shares, which are sold without a sales charge.
On December 4, 2006, Mellon Financial and The Bank of New York Company, Inc. announced that they had entered into a definitive agreement to merge. The new company will be called The Bank of New York Mellon Corporation. As part of this transaction, Dreyfus would become a wholly-owned subsidiary of The Bank of New York Mellon Corporation.The transaction is subject to certain regulatory approvals and the approval of The Bank of New York Company, Inc.’s and Mellon Financial’s shareholders, as well as other customary conditions to closing. Subject to such approvals and the satisfaction of the other conditions, Mellon Financial and The Bank of New York Company, Inc. expect the transaction to be completed in the third quarter of 2007.
It is the portfolio’s policy to maintain a continuous net asset value per share of $1.00; the portfolio has adopted certain investment, portfolio valuation and dividend and distribution policies to enable it to do so. There is no assurance, however, that the portfolio will be able to maintain a stable net asset value per share of $1.00.
The fund accounts separately for the assets, liabilities and operations of each series. Expenses directly attributable to each series are charged to that series’ operations; expenses which are applicable to all series are allocated among them on a pro rata basis.
The portfolio’s financial statements are prepared in accordance with U.S. generally accepted accounting principles, which may require the use of management estimates and assumptions.Actual results could differ from those estimates.
The fund enters into contracts that contain a variety of indemnifica-tions.The portfolio’s maximum exposure under these arrangements is unknown. The portfolio does not anticipate recognizing any loss related to these arrangements.
(a) Portfolio valuation: Investments in securities are valued at amortized cost in accordance with Rule 2a-7 of the Act, which has been determined by the fund’s Board of Trustees to represent the fair value of the portfolio’s investments.
On September 20, 2006, the Financial Accounting Standards Board (FASB) released Statement of Financial Accounting Standards No. 157 “Fair Value Measurements” (“FAS 157”). FAS 157 establishes an authoritative definition of fair value, sets out a framework for measuring fair value, and requires additional disclosures about fair-value measurements. The application of FAS 157 is required for fiscal years beginning after November 15, 2007 and interim periods within those fiscal years. Management does not believe that the application of this standard will have a material impact on the financial statements of the fund.
(b) Securities transactions and investment income: Securities transactions are recorded on a trade date basis. Realized gain and loss from securities transactions are recorded on the identified cost basis. Interest income, adjusted for accretion of discount and amortization of premium on investments, is earned from settlement date and recognized on the accrual basis. Cost of investments represents amortized cost.
The Portfolio 15
NOTES TO FINANCIAL STATEMENTS (continued)
|
The portfolio has an arrangement with the custodian bank whereby the portfolio receives earnings credits from the custodian when positive cash balances are maintained, which are used to offset custody fees. For financial reporting purposes, the portfolio includes net earnings credits as an expense offset in the Statement of Operations.
The portfolio may enter into repurchase agreements with financial institutions, deemed to be creditworthy by the Manager, subject to the seller’s agreement to repurchase and the portfolio’s agreement to resell such securities at a mutually agreed upon price. Securities purchased subject to repurchase agreements are deposited with the portfolio’s custodian and, pursuant to the terms of the repurchase agreement, must have an aggregate market value greater than or equal to the terms of the repurchase price plus accrued interest at all times. If the value of the underlying securities falls below the value of the repurchase price plus accrued interest, the portfolio will require the seller to deposit additional collateral by the next business day. If the request for additional collateral is not met, or the seller defaults on its repurchase obligation, the portfolio maintains its right to sell the underlying securities at market value and may claim any resulting loss against the seller.
(c) Dividends to shareholders: It is the policy of the portfolio to declare dividends daily from investment income-net. Such dividends are paid monthly. Dividends from net realized capital gain, if any, are normally declared and paid annually, but the portfolio may make distributions on a more frequent basis to comply with the distribution requirements of the Internal Revenue Code of 1986 as amended (the “Code”). To the extent that net realized capital gain can be offset by capital loss carryovers, it is the policy of the portfolio not to distribute such gain.
On January 2, 2007, the portfolio declared a cash dividend of approximately $.0003 per share from undistributed investment income-net which includes investment income-net for Saturday December 30, 2006 and Sunday December 31, 2006.
(d) Federal income taxes: It is the policy of the portfolio to continue to qualify as a regulated investment company, if such qualification is in the best interests of its shareholders, by complying with the applicable provisions of the Code, and to make distributions of taxable income sufficient to relieve it from substantially all federal income and excise taxes.
On July 13, 2006, the FASB released FASB Interpretation No. 48 “Accounting for Uncertainty in Income Taxes” (FIN 48). FIN 48 provides guidance for how uncertain tax positions should be recognized, measured, presented and disclosed in the financial statements. FIN 48 requires the evaluation of tax positions taken or expected to be taken in the course of preparing the fund’s tax returns to determine whether the tax positions are “more-likely-than-not” of being sustained by the applicable tax authority.Tax positions not deemed to meet the more-likely-than-not threshold would be recorded as a tax benefit or expense in the current year. Adoption of FIN 48 is required for fiscal years beginning after December 15, 2006 and is to be applied to all open tax years as of the effective date. Management does not believe that the application of this standard will have a material impact on the financial statements of the fund.
At December 31, 2006, the components of accumulated earnings on a tax basis were substantially the same as for financial reporting purposes.
The accumulated capital loss carryover of $23,613 is available to be applied against future net securities profits, if any, realized subsequent to December 31, 2006. If not applied, $783 of the carryover expires in fiscal 2007, $11,060 expires in fiscal 2008, $10,973 expires in fiscal 2010, $17 expires in fiscal 2011, $65 expires in fiscal 2013 and $715 expires in fiscal 2014.
The tax character of distributions paid to shareholders during the fiscal periods ended December 31, 2006 and December 31, 2005, were all ordinary income.
The Portfolio 17
NOTES TO FINANCIAL STATEMENTS (continued)
|
At December 31, 2006, the cost of investments for federal income tax purposes was substantially the same as the cost for financial reporting purposes (see the Statement of Investments).
NOTE 2—Investment Advisory Fee and Other Transactions With Affiliates:
(a) Pursuant to an Investment Advisory Agreement with the Manager, the investment advisory fee is computed at the annual rate of .50% of the value of the portfolio’s average daily net assets and is payable monthly.
The portfolio compensates Dreyfus Transfer, Inc., a wholly-owned subsidiary of the Manager, under a transfer agency agreement for providing personnel and facilities to perform transfer agency services for the portfolio. During the period ended December 31, 2006, the portfolio was charged $310 pursuant to the transfer agency agreement.
During the period ended December 31, 2006, the portfolio was charged $4,204 for services performed by the Chief Compliance Officer.
The components of Due to The Dreyfus Corporation and affiliates in the Statement of Assets and Liabilities consist of: investment advisory fee $78,282, chief compliance officer fees $2,044 and transfer agency per account fees $50.
(b) Each Board member also serves as a Board member of other funds within the Dreyfus complex. Annual retainer fees and attendance fees are allocated to each fund based on net assets.
REPORT OF INDEPENDENT REGISTERED PUBLIC ACCOUNTING FIRM
Shareholders and Board of Trustees
Dreyfus Variable Investment Fund, Money Market Portfolio
We have audited the accompanying statement of assets and liabilities, including the statement of investments of Dreyfus Variable Investment Fund, Money Market Portfolio (one of the funds comprising Dreyfus Variable Investment Fund) as of December 31, 2006, and the related statement of operations for the year then ended, the statement of changes in net assets for each of the two years in the period then ended, and financial highlights for each of the years indicated therein. These financial statements and financial highlights are the responsibility of the Fund’s management. Our responsibility is to express an opinion on these financial statements and financial highlights based on our audits.
We conducted our audits in accordance with the standards of the Public Company Accounting Oversight Board (United States).Those standards require that we plan and perform the audit to obtain reasonable assurance about whether the financial statements and financial highlights are free of material misstatement.We were not engaged to perform an audit of the Fund’s internal control over financial reporting. Our audits included consideration of internal control over financial reporting as a basis for designing audit procedures that are appropriate in the circumstances, but not for the purpose of expressing an opinion on the effectiveness of the Fund’s internal control over financial reporting. Accordingly, we express no such opinion.An audit also includes examining, on a test basis, evidence supporting the amounts and disclosures in the financial statements and financial highlights, assessing the accounting principles used and significant estimates made by management, and evaluating the overall financial statement presentation. Our procedures included confirmation of securities owned as of December 31, 2006 by correspondence with the custodian and others or by other appropriate auditing procedures where replies from others were not received. We believe that our audits provide a reasonable basis for our opinion.
In our opinion, the financial statements and financial highlights referred to above present fairly, in all material respects, the financial position of Dreyfus Variable Investment Fund,Money Market Portfolio at December 31, 2006, the results of its operations, for the year then ended, the changes in its net assets for each of the two years in the period then ended and the financial highlights for each of the indicated periods, in conformity with U.S. generally accepted accounting principles.
| | New York, New York
February 6, 2007
|
The Portfolio 19
PROXY RESULTS (Unaudited)
|
Dreyfus Variable Investment Fund held a special meeting of shareholders on June 29, 2006.The proposal considered at the meeting, and the results, are as follows:
| | | | | Shares | | |
| |
| |
| |
|
| | | Votes For | | | | Authority Withheld |
| |
| |
| |
|
| To elect additional Board Members: | | | | | | |
| Peggy C. Davis † | | 171,078,927 | | | | 7,687,714 |
| Joseph S. DiMartino | | 170,946,484 | | | | 7,820,156 |
| David P. Feldman | | 170,959,921 | | | | 7,806,720 |
| Ehud Houminer † | | 170,132,087 | | | | 8,634,554 |
| Gloria Messinger † | | 170,187,241 | | | | 8,579,400 |
| Anne Wexler † | | 170,212,607 | | | | 8,554,033 |
† Each new Board member’s term commenced on September 26, 2006.
In addition to Joseph S. DiMartino and David P. Feldman, James F. Henry, Dr. Paul A. Marks and Dr. Martin Peretz continue as Board members of the fund.
BOARD MEMBERS INFORMATION (Unaudited)
Joseph S. DiMartino (63)
Chairman of the Board (1995)
|
Principal Occupation During Past 5 Years:
• Corporate Director and Trustee
|
Other Board Memberships and Affiliations:
|
- The Muscular Dystrophy Association, Director
- Century Business Services, Inc., a provider of outsourcing functions for small and medium size companies, Director
- The Newark Group, a provider of a national market of paper recovery facilities, paperboard mills and paperboard converting plants, Director
- Sunair Services Corporation, engaging in the design, manufacture and sale of high frequency systems for long-range voice and data communications, as well as providing certain outdoor-related services to homes and businesses, Director
No. of Portfolios for which Board Member Serves: 190
———————
Peggy C. Davis (63) Board Member (2006)
Principal Occupation During Past 5 Years:
|
- Shad Professor of Law, New York University School of Law (1983-present)
- Writer and teacher in the fields of evidence, constitutional theory, family law, social sciences and the law, legal process and professional methodology and training
No. of Portfolios for which Board Member Serves: 80
|
David P. Feldman (67)
Board Member (1994)
|
Principal Occupation During Past 5 Years:
• Corporate Director and Trustee
|
Other Board Memberships and Affiliations:
|
- BBH Mutual Funds Group (11 funds), Director
- The Jeffrey Company, a private investment company, Director
- QMED, a medical device company, Director
No. of Portfolios for which Board Member Serves: 57
|
The Portfolio 21
BOARD MEMBERS INFORMATION (Unaudited) (continued)
James F. Henry (76)
Board Member (1990)
|
Principal Occupation During Past 5 Years:
|
- President,The International Institute for Conflict Prevention and Resolution, a non-profit organization principally engaged in the development of alternatives to business litigation (Retired 2003)
- Advisor to The Elaw Forum, a consultant on managing corporate legal costs
- Advisor to John Jay Homestead (the restored home of the first U.S. Chief Justice)
- Individual Trustee of several trusts
Other Board Memberships and Affiliations:
|
- Director, advisor and mediator involved in several non-profit organizations, primarily engaged in domestic and international dispute resolution, and historic preservation
No. of Portfolios for which Board Member Serves: 48
|
———————
Ehud Houminer (66) Board Member (2006)
Principal Occupation During Past 5 Years:
• Executive-in-Residence at the Columbia Business School, Columbia University
Other Board Memberships and Affiliations:
|
- Avnet Inc., an electronics distributor, Director
- International Advisory Board to the MBA Program School of Management, Ben Gurion University, Chairman
- Explore Charter School, Brooklyn, NY, Chairman
No. of Portfolios for which Board Member Serves: 78
———————
Gloria Messinger (77) Board Member (2006)
Principal Occupation During Past 5 Years:
|
- Arbitrator for American Arbitration Association and National Association of Securities Dealers, Inc.
- Consultant in Intellectual Property
Other Board Memberships and Affiliations:
|
- Theater for a New Audience, Inc., Director
- Brooklyn Philharmonic, Director
No. of Portfolios for which Board Member Serves: 48
|
Dr. Martin Peretz (67)
Board Member (1990)
|
Principal Occupation During Past 5 Years:
|
- Editor-in-Chief of The New Republic Magazine
- Lecturer in Social Studies at Harvard University (1965-2002)
- Director of TheStreet.com, a financial information service on the web
Other Board Memberships and Affiliations:
|
- American Council of Trustees and Alumni, Director
- Pershing Square Capital Management, Adviser
- Montefiore Ventures, General Partner
- Harvard Center for Blood Research,Trustee
- Bard College,Trustee
- Board of Overseers of YIVO Institute for Jewish Research, Chairman
No. of Portfolios for which Board Member Serves: 48
———————
Anne Wexler (76) Board Member (2006)
Principal Occupation During Past 5 Years:
|
- Chairman of the Wexler & Walker Public Policy Associates, consultants specializing in government relations and public affairs
Other Board Memberships and Affiliations:
|
- Wilshire Mutual Funds (5 funds), Director
- Methanex Corporation, a methanol producing company, Director
- Member of the Council of Foreign Relations
- Member of the National Park Foundation
No. of Portfolios for which Board Member Serves: 57
|
Once elected all Board Members serve for an indefinite term, but achieve Emeritus status on December 31st of the calendar year in which the Board Member reaches age 80.The address of the Board Members and Officers is in c/o The Dreyfus Corporation, 200 Park Avenue, New York, New York 10166. Additional information about the Board Members is available in the fund’s Statement of Additional Information which can be obtained from Dreyfus free of charge by calling this toll free number: 1-800-554-4611.
John M. Fraser, Jr., Emeritus Board Member Rosalind G. Jacobs, Emeritus Board Member Dr. Paul A. Marks, Emeritus Board Member
The Portfolio 23
OFFICERS OF THE FUND (Unaudited)
| J. DAVID OFFICER, President since | | JOSEPH M. CHIOFFI, Vice President and |
| December 2006. | | Assistant Secretary since August 2005. |
| Chief Operating Officer,Vice Chairman and a | | Associate General Counsel of the Manager, |
| director of the Manager, and an officer of 90 | | and an officer of 91 investment companies |
| investment companies (comprised of 190 | | (comprised of 206 portfolios) managed by the |
| portfolios) managed by the Manager. He is 58 | | Manager. He is 45 years old and has been an |
| years old and has been an employee of the | | employee of the Manager since June 2000. |
| |
| Manager since April 1, 1998. | | JANETTE E. FARRAGHER, Vice President |
| MARK N. JACOBS, Vice President since | | and Assistant Secretary since |
| March 2000. | | August 2005. |
| Executive Vice President, Secretary and | | Associate General Counsel of the Manager, |
| General Counsel of the Manager, and an | | and an officer of 91 investment companies |
| officer of 91 investment companies (comprised | | (comprised of 206 portfolios) managed by the |
| of 206 portfolios) managed by the Manager. | | Manager. She is 44 years old and has been an |
| He is 60 years old and has been an employee | | employee of the Manager since February 1984. |
| |
| of the Manager since June 1977. | | JOHN B. HAMMALIAN, Vice President and |
| MICHAEL A. ROSENBERG, Vice President | | Assistant Secretary since August 2005. |
| and Secretary since August 2005. | | Associate General Counsel of the Manager, |
| Associate General Counsel of the Manager, | | and an officer of 91 investment companies |
| and an officer of 91 investment companies | | (comprised of 206 portfolios) managed by the |
| (comprised of 206 portfolios) managed by the | | Manager. He is 43 years old and has been an |
| Manager. He is 46 years old and has been an | | employee of the Manager since February 1991. |
| |
| employee of the Manager since October 1991. | | ROBERT R. MULLERY, Vice President and |
| JAMES BITETTO, Vice President and | | Assistant Secretary since August 2005. |
| Assistant Secretary since August 2005. | | Associate General Counsel of the Manager, |
| Associate General Counsel and Assistant | | and an officer of 91 investment companies |
| Secretary of the Manager, and an officer of 91 | | (comprised of 206 portfolios) managed by the |
| investment companies (comprised of 206 | | Manager. He is 54 years old and has been an |
| portfolios) managed by the Manager. He is 40 | | employee of the Manager since May 1986. |
| |
| years old and has been an employee of the | | JEFF PRUSNOFSKY, Vice President and |
| Manager since December 1996. | | Assistant Secretary since August 2005. |
| JONI LACKS CHARATAN, Vice President | | Associate General Counsel of the Manager, |
| and Assistant Secretary since | | and an officer of 91 investment companies |
| August 2005. | | (comprised of 206 portfolios) managed by the |
| Associate General Counsel of the Manager, | | Manager. He is 41 years old and has been an |
| and an officer of 91 investment companies | | employee of the Manager since October 1990. |
| (comprised of 206 portfolios) managed by the | | |
| Manager. She is 51 years old and has been an | | |
| employee of the Manager since October 1988. | | |
24
| JAMES WINDELS, Treasurer since | | JOSEPH W. CONNOLLY, Chief Compliance |
| November 2001. | | Officer since October 2004. |
| Director – Mutual Fund Accounting of the | | Chief Compliance Officer of the Manager and |
| Manager, and an officer of 91 investment | | The Dreyfus Family of Funds (91 investment |
| companies (comprised of 206 portfolios) | | companies, comprised of 206 portfolios). From |
| managed by the Manager. He is 48 years old | | November 2001 through March 2004, Mr. |
| and has been an employee of the Manager | | Connolly was first Vice-President, Mutual |
| since April 1985. | | Fund Servicing for Mellon Global Securities |
| |
| ERIK D. NAVILOFF, Assistant Treasurer | | Services. In that capacity, Mr. Connolly was |
| since December 2002. | | responsible for managing Mellon’s Custody, |
| | | Fund Accounting and Fund Administration |
| Senior Accounting Manager – Taxable Fixed | | services to third-party mutual fund clients. He |
| Income Funds of the Manager, and an officer | | is 49 years old and has served in various |
| of 91 investment companies (comprised of 206 | | capacities with the Manager since 1980, |
| portfolios) managed by the Manager. He is 38 | | including manager of the firm’s Fund |
| years old and has been an employee of the | | Accounting Department from 1997 through |
| Manager since November 1992. | | October 2001. |
| |
| ROBERT ROBOL, Assistant Treasurer | | WILLIAM GERMENIS, Anti-Money |
| since August 2003. | | Laundering Compliance Officer since |
| Senior Accounting Manager – Money Market | | September 2002. |
| and Municipal Bond Funds of the Manager, | | Vice President and Anti-Money Laundering |
| and an officer of 91 investment companies | | Compliance Officer of the Distributor, and the |
| (comprised of 206 portfolios) managed by the | | Anti-Money Laundering Compliance Officer |
| Manager. He is 42 years old and has been an | | of 87 investment companies (comprised of 202 |
| employee of the Manager since October 1988. | | portfolios) managed by the Manager. He is 36 |
| ROBERT SVAGNA, Assistant Treasurer | | years old and has been an employee of the |
| since December 2002. | | Distributor since October 1998. |
| Senior Accounting Manager – Equity Funds of | | |
| the Manager, and an officer of 91 investment | | |
| companies (comprised of 206 portfolios) | | |
| managed by the Manager. He is 39 years old | | |
| and has been an employee of the Manager | | |
| since November 1990. | | |
| |
| GAVIN C. REILLY, Assistant Treasurer | | |
| since December 2005. | | |
| Tax Manager of the Investment Accounting | | |
| and Support Department of the Manager, and | | |
| an officer of 91 investment companies | | |
| (comprised of 206 portfolios) managed by the | | |
| Manager. He is 38 years old and has been an | | |
| employee of the Manager since April 1991. | | |
The Portfolio 25
| For More | | Information |
| |
|
| |
| Dreyfus Variable | | Transfer Agent & |
| Investment Fund, | | Dividend Disbursing Agent |
| Money Market Portfolio | | |
| | | Dreyfus Transfer, Inc. |
| 200 Park Avenue | | |
| | | 200 Park Avenue |
| New York, NY 10166 | | |
| | | New York, NY 10166 |
| |
| Investment Adviser | | Distributor |
| The Dreyfus Corporation | | |
| | | Dreyfus Service Corporation |
| 200 Park Avenue | | |
| | | 200 Park Avenue |
| New York, NY 10166 | | |
| | | New York, NY 10166 |
| Custodian | | |
| The Bank of New York | | |
| One Wall Street | | |
| New York, NY 10286 | | |
| | Telephone 1-800-554-4611 or 516-338-3300
Mail The Dreyfus Family of Funds, 144 Glenn Curtiss Boulevard, Uniondale, NY 11556-0144
Attn: Investments Division
|
The portfolio files its complete schedule of portfolio holdings with the Securities and Exchange Commission (“SEC”) for the first and third quarters of each fiscal year on Form N-Q. The portfolio’s Forms N-Q are available on the SEC’s website at http://www.sec.gov and may be reviewed and copied at the SEC’s Public Reference Room in Washington, DC. Information on the operation of the Public Reference Room may be obtained by calling 1-202-551-8090.
Information regarding how the portfolio voted proxies relating to portfolio securities for the 12-month period ended June 30, 2006, is available on the SEC’s website at http://www.sec.gov and without charge, upon request, by calling 1-800-645-6561.
© 2007 Dreyfus Service Corporation


The views expressed in this report reflect those of the portfolio manager only through the end of the period covered and do not necessarily represent the views of Dreyfus or any other person in the Dreyfus organization.Any such views are subject to change at any time based upon market or other conditions and Dreyfus disclaims any responsibility to update such views. These views may not be relied on as investment advice and, because investment decisions for a Dreyfus portfolio are based on numerous factors, may not be relied on as an indication of trading intent on behalf of any Dreyfus portfolio.
Not FDIC-Insured • Not Bank-Guaranteed • May Lose Value
| | | Contents |
| |
| | | T H E P O R T F O L I O |
| |
|
| 2 | | A Letter from the CEO |
| 3 | | Discussion of Performance |
| 6 | | Portfolio Performance |
| 8 | | Understanding Your Portfolio’s Expenses |
| 8 | | Comparing Your Portfolio’s Expenses |
| | | With Those of Other Funds |
| 9 | | Statement of Investments |
| 31 | | Statement of Financial Futures |
| 32 | | Statement of Assets and Liabilities |
| 33 | | Statement of Operations |
| 34 | | Statement of Changes in Net Assets |
| 36 | | Financial Highlights |
| 38 | | Notes to Financial Statements |
| 51 | | Report of Independent Registered |
| | | Public Accounting Firm |
| 52 | | Proxy Results |
| 53 | | Board Members Information |
| 56 | | Officers of the Fund |
| | | F O R M O R E I N F O R M AT I O N |
| |
|
| | | Back Cover |
| Dreyfus Variable Investment Fund, |
| Quality Bond Portfolio |
The Portfolio

A LETTER FROM THE CEO
Dear Shareholder:
We are pleased to present this annual report for Dreyfus Variable Investment Fund, Quality Bond Portfolio, covering the 12-month period from January 1, 2006, through December 31, 2006.
2006 proved to be a year of low volatility in the U.S. bond market. Yields of 10-year Treasury securities remained within a relatively narrow range of just 75 basis points, making 2006 the third least volatile bond market since 1970.Yet, a number of developments during the year might have suggested otherwise, including mounting economic uncertainty, volatile energy prices, softening real estate markets, a change in U.S. monetary policy and ongoing geopolitical turmoil.
Why did fixed-income investors appear to shrug off some of the year’s more negative influences? In our analysis, investors disregarded near-term concerns in favor of a longer view, looking to broader trends that showed moderately slower economic growth, subdued inflation, stabilizing short-term interest rates, a flat “yield curve” and persistently strong credit fundamentals. Indeed, 2006 confirmed that reacting to near-term influences with extreme shifts in investment strategy rarely is the right decision.We believe that a better course is to set a portfolio mix to meet long-term goals, while attempting to ignore short term market fluctuations.
For information about how the portfolio performed during the reporting period, as well as market perspectives, we have provided a Discussion of Performance given by the portfolio manager.
Thank you for your continued confidence and support.We wish you good health and prosperity in 2007.
| Thomas F. Eggers |
| Chief Executive Officer |
| The Dreyfus Corporation |
| January 16, 2007 |

DISCUSSION OF PERFORMANCE
Catherine Powers, Portfolio Manager
How did Dreyfus Variable Investment Fund, Quality Bond Portfolio perform relative to its benchmark?
For the 12-month period ended December 31, 2006, the portfolio’s Initial shares achieved a total return of 4.23%, and its Service shares achieved a total return of 3.90% .1 The portfolio produced aggregate income dividends of $0.51 per share and $0.48 per share for its Initial and Service shares, respectively. In comparison, the portfolio’s benchmark, the Lehman Brothers U.S. Aggregate Index (the “Index”), achieved a total return of 4.33% for the same period.2
After producing relatively lackluster returns over the first half of the year, the bond market rallied over the second half as short-term interest rates stabilized and economic growth slowed. For the reporting period overall, the portfolio’s returns approximated the performance of its benchmark.
What is the portfolio’s investment approach?
The portfolio seeks to maximize total return consisting of capital appreciation and current income.To achieve this objective, the portfolio normally invests at least 80% of its assets in bonds, including corporate bonds, mortgage-related securities, collateralized mortgage obligations and asset-backed securities that, when purchased, are A-rated or better or what we believe are the unrated equivalent, and in securities issued or guaranteed by the U.S. government or its agencies or its instru-mentalities.The portfolio may also invest up to 10% of its net assets in non-dollar-denominated foreign securities and up to 20% of its assets in the securities of foreign issues collectively.
What other factors influenced the portfolio’s performance?
Bond prices declined modestly over the first six months of 2006 due mainly to investors’ inflation concerns in a generally robust economic environment. However, investor sentiment improved over the second half of the year, as U.S. economic growth moderated amid cooling housing markets and more modest employment gains.As a result, after four increases in short-term interest rates over the first half of the year,
T h e P o r t f o l i o 3
DISCUSSION OF PERFORMANCE (continued)
the Federal Reserve Board (the “Fed”) held the overnight federal funds rate steady at 5.25% between August and December. Investors reacted favorably to the shift in policy, and the bond market rallied.
Despite the economic slowdown, business fundamentals remained healthy in most industries, generally supporting prices of corporate bonds across the credit-rating spectrum. In the U.S. government securities market, low levels of volatility helped mortgage-backed securities, asset-backed securities and other high-quality, “yield advantaged” instruments outperform U.S.Treasury securities.
The portfolio’s position in high yield bonds helped it participate in the rally among lower-rated credits.We attempted to manage the risks of lower-rated credits by focusing on bonds with relatively short maturities, which would be less negatively affected if risk premiums rose. In the investment-grade corporate bond market, where we have seen significant negative event risk due to leveraged buy-outs, mergers and share buybacks, we have favored regulated industries where such activities are less common, as well as the REIT sector, which offers strong covenant protection.
Investments in non-dollar securities contributed positively to performance. We established unhedged positions in countries with high inflation-adjusted interest rates, such as Brazil and Mexico.The portfolio also benefited from relatively short duration positions in Japan, Sweden and Poland, where the hedged yield advantage relative to the U.S. was quite attractive.
A modestly short average duration over the first half of 2006 helped protect the portfolio from the potentially adverse effects of rising interest rates, while a shift in mid-year to a slightly long position helped boost its participation in the market rally during the second half. Our yield curve position was a drag on returns as the yield curve flattened and the portfolio was overweight in intermediate-term bonds. The portfolio’s derivative investments generally fared well, including tactical positions in credit default swaps designed to provide protection from declines in specific issuers. An underweight position in mortgage-backed securities detracted modestly from relative performance in the low volatility environment. In addition, tactical positions in Treasury Inflation Protected Securities (“TIPS”) underperformed, as energy prices fell in the second half of the year.
What is the portfolio’s current strategy?
As we begin the new year, we expect the Fed to leave the policy rate unchanged as it waits to see if moderating growth brings inflation down toward the 2% range.The risks to this view are inflation pressures from a strong labor market or weaker growth due to declining housing activity. As the Fed remains on hold, we expect a low volatility environment and flat yield curve to persist over the near term. However, with the possibility of a Fed ease and a steeper yield curve, we remain underweight in the long end in favor of intermediate bonds.
We have positioned the portfolio for this environment by increasing its allocation to mortgage-related securities to capitalize on low volatility and favorable supply-and-demand conditions.We may reduce the portfolio’s position in TIPS due to declining oil prices and a slowing economy,which seem unlikely to result in higher inflation expectations.We see incremental opportunities to add international bonds to pick up the current-hedged yield advantage of some countries relative to the United States.
January 16, 2007
| | | The portfolio is only available as a funding vehicle under variable life insurance policies or variable |
| | | annuity contracts issued by insurance companies. Individuals may not purchase shares of the |
| | | portfolio directly. A variable annuity is an insurance contract issued by an insurance company that |
| | | enables investors to accumulate assets on a tax-deferred basis for retirement or other long-term |
| | | goals.The investment objective and policies of Dreyfus Variable Investment Fund, Quality Bond |
| | | Portfolio may be similar to other funds/portfolios managed or advised by Dreyfus. However, the |
| | | investment results of the portfolio may be higher or lower than, and may not be comparable to, |
| | | those of any other Dreyfus fund/portfolio. |
| 1 | | Total return includes reinvestment of dividends and any capital gains paid. Past performance is no |
| | | guarantee of future results. Share price and investment return fluctuate such that upon redemption, |
| | | portfolio shares may be worth more or less than their original cost.The portfolio’s performance does |
| | | not reflect the deduction of additional charges and expenses imposed in connection with investing |
| | | in variable insurance contracts, which will reduce returns. Return figures provided reflect the |
| | | absorption of certain portfolio expenses by The Dreyfus Corporation pursuant to an agreement in |
| | | effect through June 30, 2007, at which time it may be extended, modified or terminated. Had |
| | | these expenses not been absorbed, the portfolio’s returns would have been lower. |
| 2 | | SOURCE: LIPPER INC. — Reflects reinvestment of dividends and, where applicable, capital |
| | | gain distributions.The Lehman Brothers U.S. Aggregate Index is a widely accepted, unmanaged |
| | | total return index of corporate, U.S. government and U.S. government agency debt instruments, |
| | | mortgage-backed securities and asset-backed securities with an average maturity of 1-10 years.The |
| | | Index does not include fees and expenses to which the portfolio is subject. |
T h e P o r t f o l i o 5
P O R T F O L I O P E R F O R M A N C E
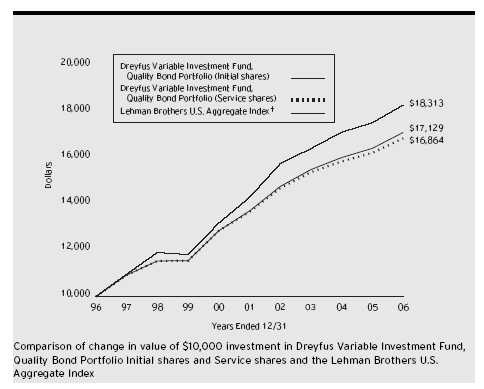
| Average Annual Total Returns | | as of 12/31/06 | | | | |
| |
| | | 1 Year | | 5 Years | | 10 Years |
| |
| |
| |
|
| Initial shares | | 4.23% | | 4.54% | | 5.53% |
| Service shares | | 3.90% | | 4.28% | | 5.37% |
| |
| The data for Service shares primarily represents the results of Initial shares for the period prior to December 31, |
| 2000 (inception date of Service shares). Actual Service shares’ average annual total return and hypothetical |
| growth results would have been lower. See notes below. | | | | |
| † Source: Lipper Inc. | | | | | | |
| Past performance is not predictive of future performance.The portfolio’s performance shown in the graph and table does not |
| reflect the deduction of taxes that a shareholder would pay on portfolio distributions or the redemption of portfolio shares. |
| The portfolio’s performance does not reflect the deduction of additional charges and expenses imposed in |
| connection with investing in variable insurance contracts which will reduce returns. | | |
| The above graph compares a $10,000 investment made in Initial and Service shares of Dreyfus Variable Investment |
| Fund, Quality Bond Portfolio on 12/31/96 to a $10,000 investment made in the Lehman Brothers U.S. Aggregate |
| Index (the “Index”) on that date. | | | | | | |
6
| The portfolio’s Initial shares are not subject to a Rule 12b-1 fee.The portfolio’s Service shares are subject to a 0.25% |
| annual Rule 12b-1 fee.The performance figures for Service shares reflect the performance of the portfolio’s Initial shares |
| from their inception date through December 30, 2000, and the performance of the portfolio’s Service shares from |
| December 31, 2000 (inception date of Service shares) to December 31, 2006 (blended performance figures).The |
| blended performance figures have not been adjusted to reflect the higher operating expenses of the Service shares. If |
| these expenses had been reflected, the blended performance figures would have been lower. All dividends and capital gain |
| distributions are reinvested. |
| The portfolio’s performance shown in the line graph takes into account all applicable portfolio fees and expenses.The |
| Index is a widely accepted, unmanaged index of corporate, U.S. government and U.S. government agency debt |
| instruments, mortgage-backed securities and asset-backed securities.The Index does not take into account charges, fees and |
| other expenses. Further information relating to portfolio performance, including expense reimbursements, if applicable, is |
| contained in the Financial Highlights section of the prospectus and elsewhere in this report. |
T h e P o r t f o l i o 7
U N D E R S TA N D I N G Y O U R
P O R T F O L I O ’ S E X P E N S E S ( U n a u d i t e d )
As a mutual fund investor,you pay ongoing expenses,such as management fees and other expenses.Using the information below,you can estimate how these expenses affect your investment and compare them with the expenses of other funds.You also may pay one-time transaction expenses,including sales charges (loads) and redemption fees, which are not shown in this section and would have resulted in higher total expenses. For more information, see your portfolio’s prospectus or talk to your financial adviser.
Review your portfolio’s expenses
The table below shows the expenses you would have paid on a $1,000 investment in Dreyfus Variable Investment Fund, Quality Bond Portfolio from July 1, 2006 to December 31, 2006. It also shows how much a $1,000 investment would be worth at the close of the period, assuming actual returns and expenses.
| Expenses and Value of a $1,000 Investment | | |
| assuming actual returns for the six months ended December 31, 2006 |
| | | Initial Shares | | Service Shares |
| |
| |
|
| Expenses paid per $1,000 † | | $ 3.41 | | $ 4.70 |
| Ending value (after expenses) | | $1,051.20 | | $1,049.20 |
C O M P A R I N G Y O U R P O R T F O L I O ’ S E X P E N S E S W I T H T H O S E O F O T H E R F U N D S ( U n a u d i t e d )
Using the SEC’s method to compare expenses
The Securities and Exchange Commission (SEC) has established guidelines to help investors assess fund expenses. Per these guidelines, the table below shows your portfolio’s expenses based on a $1,000 investment, assuming a hypothetical 5% annualized return. You can use this information to compare the ongoing expenses (but not transaction expenses or total cost) of investing in the portfolio with those of other funds. All mutual fund shareholder reports will provide this information to help you make this comparison. Please note that you cannot use this information to estimate your actual ending account balance and expenses paid during the period.
Expenses and Value of a $1,000 Investment assuming a hypothetical 5% annualized return for the six months ended December 31, 2006
| | | Initial Shares | | Service Shares |
| |
| |
|
| Expenses paid per $1,000 † | | $ 3.36 | | $ 4.63 |
| Ending value (after expenses) | | $1,021.88 | | $1,020.62 |
† Expenses are equal to the portfolio’s annualized expense ratio of .66% for Initial shares and .91% for Service shares, multiplied by the average account value over the period, multiplied by 184/365 (to reflect the one-half year period).
| S TAT E M E N T O F | | I N V E S T M E N T S | | | | |
| D e c e m b e r 3 1 , 2 0 0 6 | | | | | | | | |
| |
| |
| |
| |
|
| |
| |
| |
| | | Coupon | | Maturity | | Principal | | |
| Bonds and Notes—137.8% | | Rate (%) | | Date | | Amount ($) | | Value ($) |
| |
| |
| |
| |
|
| Aerospace & Defense—.4% | | | | | | | | |
| L-3 Communications, | | | | | | | | |
| Sr. Sub. Notes, Ser. B | | 6.38 | | 10/15/15 | | 115,000 | | 114,425 |
| L-3 Communications, | | | | | | | | |
| Gtd. Notes | | 7.63 | | 6/15/12 | | 415,000 | | 431,600 |
| Raytheon, | | | | | | | | |
| Sr. Notes | | 5.50 | | 11/15/12 | | 210,000 | | 211,580 |
| | | | | | | | | 757,605 |
| Agricultural—.5% | | | | | | | | |
| Philip Morris, | | | | | | | | |
| Debs. | | 7.75 | | 1/15/27 | | 805,000 | | 979,072 |
| Airlines—.0% | | | | | | | | |
| U.S. Air, | | | | | | | | |
| Enhanced Equip. Notes, | | | | | | | | |
| Ser. CL C | | 8.93 | | 10/15/09 | | 270,471 a,b | | 27 |
| Asset-Backed Ctfs./ | | | | | | | | |
| Auto Receivables—2.4% | | | | | | | | |
| AmeriCredit Automobile Receivables | | | | | | |
| Trust, Ser. 2005-DA, Cl. A2 | | 4.75 | | 11/6/08 | | 125,294 | | 125,348 |
| Chase Manhattan Auto Owner Trust, | | | | | | |
| Ser. 2005-B, Cl. A2 | | 4.77 | | 3/15/08 | | 279,274 | | 279,343 |
| Ford Credit Auto Owner Trust, | | | | | | | | |
| Ser. 2005-B, Cl. B | | 4.64 | | 4/15/10 | | 650,000 | | 644,982 |
| Ford Credit Auto Owner Trust, | | | | | | | | |
| Ser. 2006-C, Cl. C | | 5.47 | | 9/15/12 | | 215,000 | | 215,000 |
| Nissan Auto Receivables Owner | | | | | | |
| Trust, Ser. 2006-B, Cl. A1 | | 5.08 | | 5/15/07 | | 20,790 | | 20,806 |
| WFS Financial Owner Trust, | | | | | | | | |
| Ser. 2003-3, Cl. A4 | | 3.25 | | 5/20/11 | | 2,966,190 | | 2,937,466 |
| WFS Financial Owner Trust, | | | | | | | | |
| Ser. 2005-2, Cl. B | | 4.57 | | 11/19/12 | | 325,000 | | 321,789 |
| | | | | | | | | 4,544,734 |
| Asset-Backed Ctfs./Credit Cards—.5% | | | | | | |
| Capital One Multi-Asset Execution | | | | | | |
| Trust, Ser. 2004-C1, Cl. C1 | | 3.40 | | 11/16/09 | | 860,000 | | 859,804 |
| Asset-Backed Ctfs./ | | | | | | | | |
| Home Equity Loans—11.9% | | | | | | | | |
| Accredited Mortgage Loan Trust, | | | | | | |
| Ser. 2006-1, Cl. A1 | | 5.38 | | 4/25/36 | | 376,767 c | | 377,045 |
| Accredited Mortgage Loan Trust, | | | | | | |
| Ser. 2005-3, Cl. A2A | | 5.45 | | 9/25/35 | | 111,995 c | | 112,075 |
T h e P o r t f o l i o 9
S TAT E M E N T O F I N V E S T M E N T S (continued)
| | | Coupon | | Maturity | | Principal | | |
| Bonds and Notes (continued) | | Rate (%) | | Date | | Amount ($) | | Value ($) |
| |
| |
| |
| |
|
| Asset-Backed Ctfs./ | | | | | | | | |
| Home Equity Loans (continued) | | | | | | |
| Ameriquest Mortgage Securities, | | | | | | | | |
| Ser. 2003-11, Cl. AF6 | | 5.14 | | 1/25/34 | | 525,000 c | | 519,596 |
| Carrington Mortgage Loan Trust, | | | | | | | | |
| Ser. 2006-RFC1, Cl. A1 | | 5.39 | | 5/25/36 | | 382,817 c | | 383,083 |
| Centex Home Equity, | | | | | | | | |
| Ser. 2006-A, Cl. AV1 | | 5.40 | | 6/25/36 | | 268,173 c | | 268,345 |
| Centex Home Equity, | | | | | | | | |
| Ser. 2005-D, Cl. AV1 | | 5.46 | | 10/25/35 | | 83,006 c | | 83,065 |
| Citicorp Residential Mortgage | | | | | | | | |
| Securities, Ser. 2006-2, Cl. A2 | | 5.56 | | 9/25/36 | | 950,000 c | | 949,645 |
| Citicorp Residential Mortgage | | | | | | | | |
| Securities, Ser. 2006-2, | | | | | | | | |
| Cl. A1A | | 5.87 | | 9/25/36 | | 786,099 c | | 785,848 |
| Citicorp Residential Mortgage | | | | | | | | |
| Securities, Ser. 2006-1, | | | | | | | | |
| Cl. A1 | | 5.96 | | 7/25/36 | | 1,672,520 c | | 1,673,133 |
| Countrywide Asset-Backed | | | | | | | | |
| Certificates, Ser. 2006-SPS1, | | | | | | | | |
| Cl. A | | 5.46 | | 12/25/25 | | 894,606 c | | 895,179 |
| Countrywide Asset-Backed | | | | | | | | |
| Certificates, Ser. 2004-3, | | | | | | | | |
| Cl. M3 | | 6.22 | | 5/25/34 | | 185,000 c | | 186,146 |
| Credit-Based Asset Servicing and | | | | | | | | |
| Securitization, Ser. 2005-CB7, | | | | | | | | |
| Cl. AF1 | | 5.21 | | 11/25/35 | | 369,429 c | | 367,891 |
| Credit-Based Asset Servicing and | | | | | | | | |
| Securitization, Ser. 2005-CB4, | | | | | | | | |
| Cl. AV1 | | 5.45 | | 8/25/35 | | 151,136 c | | 151,228 |
| Credit-Based Asset Servicing and | | | | | | | | |
| Securitization, Ser. 2005-CB8, | | | | | | | | |
| Cl. AF1B | | 5.45 | | 12/25/35 | | 422,364 c | | 420,803 |
| Credit-Based Asset Servicing and | | | | | | | | |
| Securitization, Ser. 2006-CB1, | | | | | | | | |
| Cl. AF1 | | 5.46 | | 1/25/36 | | 634,785 c | | 632,121 |
| Credit-Based Asset Servicing and | | | | | | | | |
| Securitization, Ser. 2006-CB2, | | | | | | | | |
| Cl. AF1 | | 5.72 | | 12/25/36 | | 157,434 c | | 156,954 |
| First NLC Trust, | | | | | | | | |
| Ser. 2005-3, Cl. AV2 | | 5.58 | | 12/25/35 | | 513,709 c | | 514,210 |
10
| | | Coupon | | Maturity | | Principal | | |
| Bonds and Notes (continued) | | Rate (%) | | Date | | Amount ($) | | Value ($) |
| |
| |
| |
| |
|
| Asset-Backed Ctfs./ | | | | | | | | |
| Home Equity Loans (continued) | | | | | | | | |
| GSAA Trust, | | | | | | | | |
| Ser. 2006-7, Cl. AV1 | | 5.43 | | 3/25/46 | | 591,198 c | | 591,593 |
| GSAMP Trust, | | | | | | | | |
| Ser. 2006-S4, Cl. A1 | | 5.41 | | 5/25/36 | | 353,634 c | | 353,877 |
| Home Equity Asset Trust, | | | | | | | | |
| Ser. 2005-5, Cl. 2A1 | | 5.46 | | 11/25/35 | | 286,664 c | | 286,878 |
| Home Equity Asset Trust, | | | | | | | | |
| Ser. 2005-8, Cl. 2A1 | | 5.46 | | 2/25/36 | | 212,915 c | | 213,097 |
| Home Equity Mortgage Trust, | | | | | | | | |
| Ser. 2006-3, Cl. A1 | | 5.47 | | 9/25/36 | | 341,458 c | | 341,600 |
| Home Equity Mortgage Trust, | | | | | | | | |
| Ser. 2006-5, Cl. A1 | | 5.50 | | 1/25/37 | | 1,131,764 c | | 1,132,273 |
| Home Equity Mortgage Trust, | | | | | | | | |
| Ser. 2006-4, Cl. A1 | | 5.67 | | 11/25/36 | | 1,133,330 c | | 1,135,152 |
| J.P. Morgan Mortgage Acquisition, | | | | | | | | |
| Ser. 2005-FRE1, Cl. A2F1 | | 5.38 | | 10/25/35 | | 124,133 c | | 123,748 |
| J.P. Morgan Mortgage Acquisition, | | | | | | | | |
| Ser. 2006-CW1, Cl. A2 | | 5.39 | | 5/25/36 | | 279,746 c | | 279,941 |
| Morgan Stanley ABS Capital I, | | | | | | | | |
| Ser. 2006-HE3, Cl. A2A | | 5.39 | | 4/25/36 | | 242,886 c | | 243,042 |
| Morgan Stanley ABS Capital I, | | | | | | | | |
| Ser. 2005-WMC6, Cl. A2A | | 5.46 | | 7/25/35 | | 113,128 c | | 113,216 |
| Morgan Stanley Home Equity Loans, | | | | | | |
| Ser. 2006-3, Cl. A1 | | 5.40 | | 4/25/36 | | 389,208 c | | 389,457 |
| Morgan Stanley Home Equity Loans, | | | | | | |
| Ser. 2005-2, Cl. A2A | | 5.44 | | 5/25/35 | | 38,668 c | | 38,668 |
| Morgan Stanley Mortgage Loan | | | | | | | | |
| Trust, Ser. 2006-15XS, Cl. A6B | | 5.83 | | 11/25/36 | | 285,000 c | | 285,983 |
| Newcastle Mortgage Securities | | | | | | | | |
| Trust, Ser. 2006-1, Cl. A1 | | 5.42 | | 3/25/36 | | 632,803 c | | 633,311 |
| Ownit Mortgage Loan Asset Backed | | | | | | |
| Certificates, Ser. 2006-1, | | | | | | | | |
| Cl. AF1 | | 5.42 | | 12/25/36 | | 662,265 c | | 659,160 |
| Popular ABS Mortgage Pass-Through | | | | | | |
| Trust, Ser. 2005-D, Cl. A1 | | 5.36 | | 1/25/36 | | 476,637 c | | 474,469 |
| Renaissance Home Equity Loan | | | | | | | | |
| Trust, Ser. 2006-2, Cl. AF1 | | 6.00 | | 8/25/36 | | 1,145,831 c | | 1,144,085 |
T h e P o r t f o l i o 11
S TAT E M E N T O F I N V E S T M E N T S (continued)
| | | Coupon | | Maturity | | Principal | | |
| Bonds and Notes (continued) | | Rate (%) | | Date | | Amount ($) | | Value ($) |
| |
| |
| |
| |
|
| Asset-Backed Ctfs./ | | | | | | | | |
| Home Equity Loans (continued) | | | | | | |
| Renaissance Home Equity Loan | | | | | | | | |
| Trust, Ser. 2006-2, Cl. M1 | | 6.25 | | 8/25/36 | | 675,000 c | | 687,473 |
| Residential Asset Mortgage | | | | | | | | |
| Products, Ser. 2005-RZ1, | | | | | | | | |
| Cl. A1 | | 5.45 | | 4/25/35 | | 57,012 c | | 57,052 |
| Residential Asset Mortgage | | | | | | | | |
| Products, Ser. 2005-EFC5, | | | | | | | | |
| Cl. A1 | | 5.45 | | 10/25/35 | | 311,471 c | | 311,720 |
| Residential Asset Securities, | | | | | | | | |
| Ser. 2006-EMX4, Cl. A1 | | 5.36 | | 6/25/36 | | 478,095 c | | 478,438 |
| Residential Asset Securities, | | | | | | | | |
| Ser. 2006-EMX3, Cl. A1 | | 5.41 | | 4/25/36 | | 398,335 c | | 398,641 |
| Residential Asset Securities, | | | | | | | | |
| Ser. 2005-AHL2, Cl. A1 | | 5.45 | | 10/25/35 | | 164,948 c | | 165,073 |
| Residential Asset Securities, | | | | | | | | |
| Ser. 2005-EMX3, Cl. AI1 | | 5.46 | | 9/25/35 | | 225,879 c | | 226,056 |
| Residential Asset Securities, | | | | | | | | |
| Ser. 2003-KS7, Cl. MI3 | | 5.75 | | 9/25/33 | | 167,244 | | 163,158 |
| Residential Funding Mortgage | | | | | | | | |
| Securities II, Ser. 2006-HSA2, | | | | | | | | |
| Cl. AI2 | | 5.50 | | 3/25/36 | | 140,000 c | | 139,695 |
| Saxon Asset Securities Trust, | | | | | | | | |
| Ser. 2004-2, Cl. AF2 | | 4.15 | | 8/25/35 | | 1,149,485 c | | 1,141,251 |
| Saxon Asset Securities Trust, | | | | | | | | |
| Ser. 2005-3, Cl. A2A | | 5.47 | | 11/25/35 | | 43,887 c | | 43,917 |
| Soundview Home | | | | | | | | |
| Equity Loan Trust, | | | | | | | | |
| Ser. 2005-B, Cl. M3 | | 5.83 | | 5/25/35 | | 225,000 c | | 222,349 |
| Specialty Underwriting & | | | | | | | | |
| Residential Finance, | | | | | | | | |
| Ser. 2006-BC2, Cl. A2A | | 5.41 | | 2/25/37 | | 753,919 c | | 754,484 |
| Wells Fargo Home Equity Trust, | | | | | | | | |
| Ser. 2006-1, Cl. A1 | | 5.35 | | 5/25/36 | | 443,179 c | | 443,489 |
| | | | | | | | | 22,148,713 |
| Asset-Backed Ctfs./ | | | | | | | | |
| Manufactured Housing—.6% | | | | | | | | |
| Green Tree Financial, | | | | | | | | |
| Ser. 1994-7, Cl. M1 | | 9.25 | | 3/15/20 | | 312,681 | | 323,740 |
| Origen Manufactured Housing, | | | | | | | | |
| Ser. 2005-A, Cl. A1 | | 4.06 | | 7/15/13 | | 224,838 | | 223,998 |
12
| | | Coupon | | Maturity | | Principal | | |
| Bonds and Notes (continued) | | Rate (%) | | Date | | Amount ($) | | Value ($) |
| |
| |
| |
| |
|
| Asset-Backed Ctfs./ | | | | | | | | |
| Manufactured Housing (continued) | | | | | | |
| Origen Manufactured Housing, | | | | | | | | |
| Ser. 2005-B, Cl. A1 | | 5.25 | | 2/15/14 | | 550,193 | | 548,466 |
| | | | | | | | | 1,096,204 |
| Automobile Manufacturers—.2% | | | | | | | | |
| DaimlerChrysler N.A. Holding, | | | | | | | | |
| Notes | | 4.88 | | 6/15/10 | | 175,000 | | 170,724 |
| DaimlerChrysler N.A. Holding, | | | | | | | | |
| Gtd. Notes | | 8.50 | | 1/18/31 | | 180,000 | | 214,881 |
| | | | | | | | | 385,605 |
| Automotive, Trucks & Parts—.1% | | | | | | |
| Johnson Controls, | | | | | | | | |
| Sr. Notes | | 5.25 | | 1/15/11 | | 110,000 | | 109,231 |
| Banks—7.1% | | | | | | | | |
| Chevy Chase Bank, F.S.B., | | | | | | | | |
| Sub. Notes | | 6.88 | | 12/1/13 | | 260,000 | | 261,300 |
| Chuo Mitsui Trust & Banking, | | | | | | | | |
| Sub. Notes | | 5.51 | | 12/29/49 | | 565,000 c,d | | 540,533 |
| Colonial Bank N.A./Montgomery, AL | | | | | | |
| Sub. Notes | | 6.38 | | 12/1/15 | | 500,000 | | 513,895 |
| Colonial Bank N.A./Montgomery, AL | | | | | | |
| Sub. Notes | | 8.00 | | 3/15/09 | | 140,000 | | 145,716 |
| Glitnir Banki, | | | | | | | | |
| Sub. Notes | | 6.69 | | 6/15/16 | | 270,000 c,d | | 279,006 |
| Glitnir Banki, | | | | | | | | |
| Unscd. Bonds | | 7.45 | | 9/14/49 | | 210,000 c,d | | 221,690 |
| HBOS Capital Funding, | | | | | | | | |
| Bank Gtd. Bonds | | 6.07 | | 6/29/49 | | 2,590,000 c,d,e | | 2,630,065 |
| Landsbanki Islands, | | | | | | | | |
| Notes | | 6.10 | | 8/25/11 | | 505,000 d | | 513,932 |
| Manufacturers & Traders Trust, | | | | | | | | |
| Sub. Notes | | 5.59 | | 12/28/20 | | 275,000 c | | 273,502 |
| NB Capital Trust IV, | | | | | | | | |
| Gtd. Cap. Secs. | | 8.25 | | 4/15/27 | | 620,000 | | 647,166 |
| Northern Rock, | | | | | | | | |
| Sub. Notes | | 5.60 | | 4/29/49 | | 535,000 c,d | | 518,410 |
| Regions Financial, | | | | | | | | |
| Sr. Notes | | 5.46 | | 8/8/08 | | 825,000 c | | 826,335 |
| Resona Bank, | | | | | | | | |
| Notes | | 5.85 | | 9/29/49 | | 475,000 c,d | | 464,635 |
T h e P o r t f o l i o 13
S TAT E M E N T O F I N V E S T M E N T S (continued)
| | | Coupon | | Maturity | | Principal | | |
| Bonds and Notes (continued) | | Rate (%) | | Date | | Amount ($) | | Value ($) |
| |
| |
| |
| |
|
| Banks (continued) | | | | | | | | |
| Shinsei Finance Cayman, | | | | | | | | |
| Bonds | | 6.42 | | 1/29/49 | | 475,000 c,d | | 475,280 |
| Sovereign Bancorp, | | | | | | | | |
| Sr. Notes | | 4.80 | | 9/1/10 | | 525,000 d | | 514,147 |
| Sumitomo Mitsui Banking, | | | | | | | | |
| Notes | | 5.63 | | 7/29/49 | | 315,000 c,d | | 308,450 |
| SunTrust Preferred Capital I, | | | | | | | | |
| Bank Gtd. Notes | | 5.85 | | 12/31/49 | | 435,000 c,e | | 438,786 |
| USB Capital IX, | | | | | | | | |
| Gtd. Notes | | 6.19 | | 4/15/49 | | 585,000 c,e | | 598,010 |
| Wachovia Bank N.A., | | | | | | | | |
| Sub. Notes | | 5.00 | | 8/15/15 | | 495,000 | | 480,315 |
| Washington Mutual, | | | | | | | | |
| Sub. Notes | | 4.63 | | 4/1/14 | | 970,000 | | 909,436 |
| Washington Mutual, | | | | | | | | |
| Notes | | 5.67 | | 1/15/10 | | 475,000 c | | 477,485 |
| Wells Fargo & Co., | | | | | | | | |
| Sub. Notes | | 6.38 | | 8/1/11 | | 290,000 | | 303,993 |
| Zions Bancorporation, | | | | | | | | |
| Sr. Unscd. Notes | | 5.49 | | 4/15/08 | | 365,000 c | | 365,370 |
| Zions Bancorporation, | | | | | | | | |
| Sub. Notes | | 6.00 | | 9/15/15 | | 465,000 | | 474,318 |
| | | | | | | | | 13,181,775 |
| Building & Construction—.1% | | | | | | | | |
| Owens Corning, | | | | | | | | |
| Sr. Unscd. Notes | | 6.50 | | 12/1/16 | | 125,000 d | | 127,210 |
| Chemicals—.5% | | | | | | | | |
| Equistar Chemicals/Funding, | | | | | | | | |
| Gtd. Notes | | 10.13 | | 9/1/08 | | 220,000 | | 234,850 |
| Lubrizol, | | | | | | | | |
| Sr. Notes | | 4.63 | | 10/1/09 | | 445,000 | | 436,796 |
| Lubrizol, | | | | | | | | |
| Sr. Notes | | 5.50 | | 10/1/14 | | 255,000 e | | 248,977 |
| | | | | | | | | 920,623 |
| Commercial & Professional | | | | | | | | |
| Services—.3% | | | | | | | | |
| ERAC USA Finance, | | | | | | | | |
| Bonds | | 5.60 | | 5/1/15 | | 310,000 d | | 308,225 |
14
| | | Coupon | | Maturity | | Principal | | |
| Bonds and Notes (continued) | | Rate (%) | | Date | | Amount ($) | | Value ($) |
| |
| |
| |
| |
|
| Commercial & Professional | | | | | | | | |
| Services (continued) | | | | | | | | |
| ERAC USA Finance, | | | | | | | | |
| Notes | | 5.63 | | 4/30/09 | | 110,000 c,d | | 110,285 |
| ERAC USA Finance, | | | | | | | | |
| Notes | | 7.95 | | 12/15/09 | | 210,000 d | | 224,037 |
| | | | | | | | | 642,547 |
| Commercial Mortgage | | | | | | | | |
| Pass-Through Ctfs.—7.2% | | | | | | | | |
| Banc of America Commercial | | | | | | | | |
| Mortgage, Ser. 2005-2, Cl. A2 | | 4.25 | | 7/10/43 | | 875,000 | | 864,600 |
| Bayview Commercial Asset Trust, | | | | | | | | |
| Ser. 2006-SP1, Cl. A1 | | 5.62 | | 4/25/36 | | 136,815 c,d | | 136,858 |
| Bayview Commercial Asset Trust, | | | | | | | | |
| Ser. 2004-1, Cl. A | | 5.71 | | 4/25/34 | | 254,979 c,d | | 255,297 |
| Bayview Commercial Asset Trust, | | | | | | | | |
| Ser. 2003-1, Cl. A | | 5.93 | | 8/25/33 | | 168,541 c,d | | 168,686 |
| Bayview Commercial Asset Trust, | | | | | | | | |
| Ser. 2003-2, Cl. A | | 5.93 | | 12/25/33 | | 235,253 c,d | | 235,988 |
| Bayview Commercial Asset Trust, | | | | | | | | |
| Ser. 2006-2A, Cl. B2 | | 6.82 | | 7/25/36 | | 467,465 c,d | | 467,392 |
| Bayview Commercial Asset Trust, | | | | | | | | |
| Ser. 2005-3A, Cl. B3 | | 8.35 | | 11/25/35 | | 132,668 c,d | | 134,768 |
| Bayview Commercial Asset Trust, | | | | | | | | |
| Ser. 2005-4A, Cl. B3 | | 8.85 | | 1/25/36 | | 92,824 c,d | | 92,824 |
| Bear Stearns Commercial Mortgage | | | | | | |
| Securities, Ser. 2006-PW14, | | | | | | | | |
| Cl. AAB | | 5.17 | | 12/1/38 | | 1,125,000 | | 1,131,134 |
| Bear Stearns Commercial Mortgage | | | | | | |
| Securities, Ser. 2006-PW13, | | | | | | | | |
| Cl. A3 | | 5.52 | | 9/11/41 | | 200,000 | | 202,251 |
| Bear Stearns Commercial Mortgage | | | | | | |
| Securities, Ser. 2006-T24, | | | | | | | | |
| Cl. AAB | | 5.53 | | 10/12/41 | | 500,000 | | 506,246 |
| Bear Stearns Commercial Mortgage | | | | | | |
| Securities, Ser. 2006-PW12, | | | | | | | | |
| Cl. AAB | | 5.69 | | 9/11/38 | | 430,000 c | | 440,745 |
| Calwest Industrial Trust, | | | | | | | | |
| Ser. 2002-CALW, Cl. A | | 6.13 | | 2/15/17 | | 1,000,000 d | | 1,039,467 |
T h e P o r t f o l i o 15
S TAT E M E N T O F I N V E S T M E N T S (continued)
| | | Coupon | | Maturity | | Principal | | |
| Bonds and Notes (continued) | | Rate (%) | | Date | | Amount ($) | | Value ($) |
| |
| |
| |
| |
|
| Commercial Mortgage | | | | | | | | |
| Pass-Through Ctfs. (continued) | | | | | | |
| Citigroup/Deutsche Bank Commercial | | | | | | |
| Mortgage Trust, Ser. 2006-CD2, | | | | | | |
| Cl. A2 | | 5.41 | | 1/15/46 | | 340,000 | | 342,232 |
| Credit Suisse/Morgan Stanley | | | | | | | | |
| Commercial Mortgage | | | | | | | | |
| Certificates, Ser. 2006-HC1A, | | | | | | | | |
| Cl. A1 | | 5.54 | | 5/15/23 | | 425,000 c,d | | 425,398 |
| Crown Castle Towers, | | | | | | | | |
| Ser. 2005-1A, Cl. D | | 5.61 | | 6/15/35 | | 240,000 d | | 238,893 |
| Crown Castle Towers, | | | | | | | | |
| Ser. 2006-1A, Cl. D | | 5.77 | | 11/15/36 | | 350,000 d | | 349,782 |
| Global Signal Trust, | | | | | | | | |
| Ser. 2006-1, Cl. D | | 6.05 | | 2/15/36 | | 340,000 d | | 343,316 |
| Global Signal Trust, | | | | | | | | |
| Ser. 2006-1, Cl. E | | 6.50 | | 2/15/36 | | 170,000 d | | 172,426 |
| J.P. Morgan Chase Commercial | | | | | | | | |
| Mortgage Securities, | | | | | | | | |
| Ser. 2005-LDP5, Cl. A2 | | 5.20 | | 12/15/44 | | 725,000 | | 723,894 |
| J.P. Morgan Chase Commercial | | | | | | | | |
| Mortgage Securities, | | | | | | | | |
| Ser. 2006-LDP7, Cl. ASB | | 5.88 | | 4/15/45 | | 425,000 c | | 439,895 |
| Merrill Lynch Mortgage Trust, | | | | | | | | |
| Ser. 2005-CIP1, Cl. A2 | | 4.96 | | 7/12/38 | | 505,000 | | 500,892 |
| Merrill Lynch Mortgage Trust, | | | | | | | | |
| Ser. 2005-CKI1, Cl. A2 | | 5.22 | | 11/12/37 | | 165,000 c | | 165,384 |
| Morgan Stanley Capital I, | | | | | | | | |
| Ser. 2006-T21, Cl. A2 | | 5.09 | | 10/12/52 | | 500,000 | | 497,859 |
| Morgan Stanley Capital I, | | | | | | | | |
| Ser. 2006-IQ12, Cl. AAB | | 5.33 | | 12/15/43 | | 935,000 c | | 934,164 |
| Morgan Stanley Capital I, | | | | | | | | |
| Ser. 2006-HQ9, Cl. A3 | | 5.71 | | 7/12/44 | | 915,000 | | 935,121 |
| SBA CMBS Trust, | | | | | | | | |
| Ser. 2006-1A, Cl. D | | 5.85 | | 11/15/36 | | 135,000 d | | 135,261 |
| Washington Mutual Asset | | | | | | | | |
| Securities, Ser. 2003-C1A, | | | | | | | | |
| Cl. A | | 3.83 | | 1/25/35 | | 1,577,559 d | | 1,524,064 |
| | | | | | | | | 13,404,837 |
| | | Coupon | | Maturity | | Principal | | |
| Bonds and Notes (continued) | | Rate (%) | | Date | | Amount ($) | | Value ($) |
| |
| |
| |
| |
|
| Diversified Financial Services—14.0% | | | | | | |
| American Express, | | | | | | | | |
| Sub. Debs. | | 6.80 | | 9/1/66 | | 195,000 c | | 208,306 |
| Ameriprise Financial, | | | | | | | | |
| Jr. Sub. Bonds | | 7.52 | | 6/1/66 | | 465,000 c | | 511,522 |
| Amvescap, | | | | | | | | |
| Gtd. Notes | | 5.38 | | 2/27/13 | | 550,000 | | 545,005 |
| Bear Stearns Cos., | | | | | | | | |
| Sr. Unscd. Notes | | 5.50 | | 8/15/11 | | 475,000 e | | 480,164 |
| Bear Stearns, | | | | | | | | |
| Notes | | 3.25 | | 3/25/09 | | 1,900,000 | | 1,823,734 |
| Boeing Capital, | | | | | | | | |
| Sr. Notes | | 7.38 | | 9/27/10 | | 490,000 | | 525,758 |
| CIT Group Funding of Canada, | | | | | | | | |
| Gtd. Notes | | 5.60 | | 11/2/11 | | 370,000 | | 373,025 |
| CIT Group, | | | | | | | | |
| Sr. Notes | | 4.75 | | 8/15/08 | | 470,000 | | 466,188 |
| Countrywide Financial, | | | | | | | | |
| Gtd. Notes | | 5.50 | | 1/5/09 | | 1,500,000 c | | 1,500,502 |
| Countrywide Home Loans, | | | | | | | | |
| Gtd. Notes, Ser. L | | 4.00 | | 3/22/11 | | 290,000 e | | 275,576 |
| Credit Suisse First Boston USA, | | | | | | | | |
| Notes | | 4.13 | | 1/15/10 | | 1,910,000 e | | 1,854,331 |
| Credit Suisse USA, | | | | | | | | |
| Sr. Unsub. Notes | | 5.50 | | 8/16/11 | | 730,000 e | | 738,702 |
| Fuji JGB Investment, | | | | | | | | |
| Bonds | | 9.87 | | 12/29/49 | | 425,000 c,d | | 450,535 |
| Glencore Funding, | | | | | | | | |
| Gtd. Notes | | 6.00 | | 4/15/14 | | 260,000 d | | 253,823 |
| Goldman Sachs Group, | | | | | | | | |
| Notes | | 4.50 | | 6/15/10 | | 525,000 | | 514,242 |
| HSBC Finance Capital Trust IX, | | | | | | | | |
| Gtd. Notes | | 5.91 | | 11/30/35 | | 625,000 c | | 629,169 |
| HSBC Finance, | | | | | | | | |
| Notes | | 5.50 | | 1/19/16 | | 495,000 | | 498,215 |
| Jefferies Group, | | | | | | | | |
| Sr. Notes | | 5.50 | | 3/15/16 | | 685,000 | | 668,205 |
T h e P o r t f o l i o 17
S TAT E M E N T O F I N V E S T M E N T S (continued)
| | | Coupon | | Maturity | | Principal | | |
| Bonds and Notes (continued) | | Rate (%) | | Date | | Amount ($) | | Value ($) |
| |
| |
| |
| |
|
| Diversified Financial | | | | | | | | |
| Services (continued) | | | | | | | | |
| John Deere Capital, | | | | | | | | |
| Sr. Notes, Ser. D | | 4.40 | | 7/15/09 | | 320,000 | | 313,651 |
| JPMorgan Chase & Co., | | | | | | | | |
| Sub. Notes | | 5.13 | | 9/15/14 | | 780,000 e | | 768,192 |
| Kaupthing Bank, | | | | | | | | |
| Notes | | 7.13 | | 5/19/16 | | 475,000 d,e | | 504,686 |
| Lehman Brothers Holdings E-Capital | | | | | | |
| Trust I, Notes | | 6.16 | | 8/19/65 | | 100,000 c | | 101,009 |
| Lehman Brothers Holdings, | | | | | | | | |
| Notes | | 4.25 | | 1/27/10 | | 1,905,000 e | | 1,855,685 |
| Lehman Brothers Holdings, | | | | | | | | |
| Notes | | 5.50 | | 4/4/16 | | 155,000 e | | 155,257 |
| MBNA, | | | | | | | | |
| Notes | | 6.13 | | 3/1/13 | | 750,000 | | 779,755 |
| Merrill Lynch & Co., | | | | | | | | |
| Notes | | 4.79 | | 8/4/10 | | 1,900,000 | | 1,875,661 |
| Morgan Stanley, | | | | | | | | |
| Notes | | 4.00 | | 1/15/10 | | 1,920,000 | | 1,859,111 |
| Morgan Stanley, | | | | | | | | |
| Sub. Notes | | 4.75 | | 4/1/14 | | 1,097,000 | | 1,050,451 |
| Morgan Stanley, | | | | | | | | |
| Sr. Notes | | 5.49 | | 2/9/09 | | 475,000 c | | 476,034 |
| MUFG Capital Finance 1, | | | | | | | | |
| Gtd. Bonds | | 6.35 | | 7/29/49 | | 735,000 c | | 747,865 |
| Nuveen Investments, | | | | | | | | |
| Sr. Notes | | 5.00 | | 9/15/10 | | 285,000 | | 280,608 |
| Residential Capital, | | | | | | | | |
| Gtd. Notes | | 6.13 | | 11/21/08 | | 225,000 | | 226,214 |
| Residential Capital, | | | | | | | | |
| Sr. Unscd. Notes | | 6.38 | | 6/30/10 | | 455,000 | | 460,651 |
| Residential Capital, | | | | | | | | |
| Gtd. Notes | | 7.20 | | 4/17/09 | | 575,000 c,d | | 578,176 |
| SLM, | | | | | | | | |
| Notes, Ser. A | | 5.52 | | 7/27/09 | | 950,000 c | | 952,341 |
| SMFG Preferred Capital, | | | | | | | | |
| Bonds | | 6.08 | | 1/29/49 | | 525,000 c,d | | 520,588 |
| St. George Funding, | | | | | | | | |
| Bonds | | 8.49 | | 12/29/49 | | 275,000 c,d | | 288,944 |
| | | Coupon | | Maturity | | Principal | | |
| Bonds and Notes (continued) | | Rate (%) | | Date | | Amount ($) | | Value ($) |
| |
| |
| |
| |
|
| Diversified Financial | | | | | | | | |
| Services (continued) | | | | | | | | |
| Windsor Financing, | | | | | | | | |
| Gtd. Notes | | 5.88 | | 7/15/17 | | 121,560 d | | 121,347 |
| | | | | | | | | 26,233,228 |
| Diversified Metals & Mining—.1% | | | | | | |
| Reliance Steel & Aluminum, | | | | | | | | |
| Gtd. Notes | | 6.20 | | 11/15/16 | | 260,000 d | | 258,562 |
| Electric Utilities—2.9% | | | | | | | | |
| American Electric Power, | | | | | | | | |
| Sr. Notes | | 5.25 | | 6/1/15 | | 390,000 | | 381,360 |
| Consolidated Edison of NY, | | | | | | | | |
| Sr. Unscd. Debs. | | 5.30 | | 12/1/16 | | 400,000 | | 393,841 |
| Consumers Energy, | | | | | | | | |
| First Mortgage Bonds | | 5.00 | | 2/15/12 | | 655,000 | | 639,716 |
| Dominion Resources/VA, | | | | | | | | |
| Sr. Unscd. Notes, Ser. E | | 7.20 | | 9/15/14 | | 450,000 | | 494,527 |
| DTE Energy, | | | | | | | | |
| Sr. Unsub. Notes | | 6.35 | | 6/1/16 | | 250,000 | | 260,156 |
| FirstEnergy, | | | | | | | | |
| Notes, Ser. B | | 6.45 | | 11/15/11 | | 300,000 | | 313,168 |
| FPL Energy National Wind, | | | | | | | | |
| Scd. Notes | | 5.61 | | 3/10/24 | | 92,446 d | | 90,961 |
| FPL Group Capital, | | | | | | | | |
| Gtd. Notes | | 5.63 | | 9/1/11 | | 950,000 | | 961,385 |
| Gulf Power, | | | | | | | | |
| Sr. Unscd. Notes | | 5.30 | | 12/1/16 | | 475,000 | | 468,398 |
| Mirant North America, | | | | | | | | |
| Gtd. Notes | | 7.38 | | 12/31/13 | | 230,000 | | 234,600 |
| National Grid, | | | | | | | | |
| Sr. Unscd. Notes | | 6.30 | | 8/1/16 | | 605,000 | | 627,713 |
| NiSource Finance, | | | | | | | | |
| Gtd. Notes | | 5.25 | | 9/15/17 | | 375,000 | | 352,173 |
| NiSource Finance, | | | | | | | | |
| Gtd. Notes | | 5.94 | | 11/23/09 | | 260,000 c | | 260,283 |
| | | | | | | | | 5,478,281 |
| Environmental Control—.7% | | | | | | | | |
| Republic Services, | | | | | | | | |
| Sr. Notes | | 6.75 | | 8/15/11 | | 365,000 | | 382,963 |
T h e P o r t f o l i o 19
S TAT E M E N T O F I N V E S T M E N T S (continued)
| | | | | Coupon | | Maturity | | Principal | | |
| Bonds and Notes (continued) | | Rate (%) | | Date | | Amount ($) | | Value ($) |
| |
| |
| |
| |
|
| Environmental Control (continued) | | | | | | | | |
| USA Waste Services, | | | | | | | | | | |
| Sr. Notes | | | | 7.00 | | 7/15/28 | | 525,000 | | 565,058 |
| Waste Management, | | | | | | | | | | |
| Gtd. Notes | | | | 6.88 | | 5/15/09 | | 270,000 | | 279,264 |
| | | | | | | | | | | 1,227,285 |
| Food & Beverages—.6% | | | | | | | | |
| H.J. Heinz, | | | | | | | | | | |
| Notes | | | | 6.43 | | 12/1/20 | | 225,000 d | | 229,116 |
| Safeway, | | | | | | | | | | |
| Sr. Unscd. Notes | | | | 5.63 | | 8/15/14 | | 390,000 | | 385,426 |
| Stater Brothers Holdings, | | | | | | | | |
| Sr. Notes | | | | 8.13 | | 6/15/12 | | 195,000 | | 198,900 |
| Tyson Foods, | | | | | | | | | | |
| Sr. Unscd. Notes | | | | 6.85 | | 4/1/16 | | 200,000 | | 206,365 |
| | | | | | | | | | | 1,019,807 |
| Foreign/Governmental—5.7% | | | | | | | | |
| Banco Nacional de Desenvolvimento | | | | | | | | |
| Economico e Social, Unsub. | | | | | | | | |
| Notes | | | | 5.17 | | 6/16/08 | | 660,000 c | | 655,050 |
| Export-Import Bank of Korea, | | | | | | | | |
| Sr. Notes | | | | 4.50 | | 8/12/09 | | 575,000 | | 564,007 |
| Federal Republic of Brazil, | | | | | | | | |
| Bonds | | BRL | | 12.50 | | 1/5/16 | | 1,995,000 e,f | | 1,062,910 |
| Poland Government, | | | | | | | | | | |
| Bonds, Ser. 0608 | | PLN | | 5.75 | | 6/24/08 | | 16,225,000 f | | 5,685,348 |
| Republic of Argentina, | | | | | | | | |
| Bonds | | | | 5.59 | | 8/3/12 | | 685,000 c | | 500,735 |
| Republic of Peru, | | | | | | | | | | |
| Notes | | | | 9.13 | | 2/21/12 | | 405,000 | | 469,800 |
| Republic of South Africa, | | | | | | | | |
| Notes | | | | 9.13 | | 5/19/09 | | 470,000 | | 508,775 |
| Russian Federation, | | | | | | | | | | |
| Unscd. Bonds | | | | 8.25 | | 3/31/10 | | 688,344 d | | 721,041 |
| United Mexican States, | | | | | | | | |
| Notes, Ser. A | | | | 8.00 | | 9/24/22 | | 390,000 | | 477,555 |
| | | | | | | | | | | 10,645,221 |
| Health Care—1.0% | | | | | | | | | | |
| American Home Products, | | | | | | | | |
| Notes | | | | 6.95 | | 3/15/11 | | 325,000 | | 345,474 |
20
| | | Coupon | | Maturity | | Principal | | |
| Bonds and Notes (continued) | | Rate (%) | | Date | | Amount ($) | | Value ($) |
| |
| |
| |
| |
|
| Health Care (continued) | | | | | | | | |
| Coventry Health Care, | | | | | | | | |
| Sr. Notes | | 5.88 | | 1/15/12 | | 160,000 | | 158,776 |
| Medco Health Solutions, | | | | | | | | |
| Sr. Notes | | 7.25 | | 8/15/13 | | 155,000 | | 166,593 |
| Quest Diagnostics, | | | | | | | | |
| Gtd. Notes | | 5.13 | | 11/1/10 | | 205,000 | | 202,053 |
| Teva Pharmaceutical Finance, | | | | | | | | |
| Gtd. Notes | | 6.15 | | 2/1/36 | | 325,000 | | 316,828 |
| UnitedHealth Group, | | | | | | | | |
| Sr. Unscd. Notes | | 5.38 | | 3/15/16 | | 500,000 | | 496,025 |
| WellPoint, | | | | | | | | |
| Unscd. Notes | | 5.00 | | 1/15/11 | | 255,000 | | 252,115 |
| | | | | | | | | 1,937,864 |
| Lodging & Entertainment—.8% | | | | | | | | |
| MGM Mirage, | | | | | | | | |
| Gtd. Notes | | 6.00 | | 10/1/09 | | 205,000 | | 205,513 |
| MGM Mirage, | | | | | | | | |
| Gtd. Notes | | 8.50 | | 9/15/10 | | 250,000 | | 268,750 |
| Mohegan Tribal Gaming Authority, | | | | | | |
| Sr. Notes | | 6.13 | | 2/15/13 | | 345,000 | | 344,138 |
| Resorts International Hotel & | | | | | | | | |
| Casino, First Mortgage Notes | | 11.50 | | 3/15/09 | | 560,000 d | | 580,300 |
| | | | | | | | | 1,398,701 |
| Machinery—.1% | | | | | | | | |
| Terex, | | | | | | | | |
| Gtd. Notes | | 7.38 | | 1/15/14 | | 240,000 | | 244,800 |
| Media—1.1% | | | | | | | | |
| AOL Time Warner, | | | | | | | | |
| Gtd. Notes | | 6.75 | | 4/15/11 | | 480,000 | | 502,933 |
| British Sky Broadcasting, | | | | | | | | |
| Gtd. Notes | | 6.88 | | 2/23/09 | | 510,000 | | 525,275 |
| Comcast, | | | | | | | | |
| Gtd. Notes | | 5.50 | | 3/15/11 | | 530,000 | | 532,728 |
| News America Holdings, | | | | | | | | |
| Debs. | | 7.70 | | 10/30/25 | | 425,000 | | 479,206 |
| | | | | | | | | 2,040,142 |
| Oil & Gas—.9% | | | | | | | | |
| Amerada Hess, | | | | | | | | |
| Unscd. Notes | | 6.65 | | 8/15/11 | | 470,000 | | 489,881 |
T h e P o r t f o l i o 21
S TAT E M E N T O F I N V E S T M E N T S (continued)
| | | Coupon | | Maturity | | Principal | | |
| Bonds and Notes (continued) | | Rate (%) | | Date | | Amount ($) | | Value ($) |
| |
| |
| |
| |
|
| Oil & Gas (continued) | | | | | | | | |
| Enterprise Products Operating, | | | | | | | | |
| Sr. Notes, Ser. B | | 5.60 | | 10/15/14 | | 810,000 e | | 796,765 |
| Pemex Project Funding Master | | | | | | | | |
| Trust, Gtd. Notes | | 5.75 | | 12/15/15 | | 365,000 | | 362,901 |
| | | | | | | | | 1,649,547 |
| Packaging & Containers—.6% | | | | | | | | |
| Ball, | | | | | | | | |
| Gtd. Notes | | 6.88 | | 12/15/12 | | 120,000 | | 123,000 |
| Crown Americas/Capital, | | | | | | | | |
| Gtd. Notes | | 7.63 | | 11/15/13 | | 325,000 | | 336,375 |
| Crown Americas/Capital, | | | | | | | | |
| Sr. Notes | | 7.75 | | 11/15/15 | | 185,000 | | 192,863 |
| Sealed Air, | | | | | | | | |
| Notes | | 5.63 | | 7/15/13 | | 505,000 d | | 500,352 |
| | | | | | | | | 1,152,590 |
| Paper & Forest Products—1.0% | | | | | | | | |
| Georgia-Pacific, | | | | | | | | |
| Gtd. Notes | | 7.00 | | 1/15/15 | | 340,000 d | | 340,850 |
| Georgia-Pacific, | | | | | | | | |
| Sr. Notes | | 8.00 | | 1/15/24 | | 415,000 e | | 423,300 |
| Sappi Papier Holding, | | | | | | | | |
| Gtd. Notes | | 6.75 | | 6/15/12 | | 145,000 d | | 144,777 |
| Temple-Inland, | | | | | | | | |
| Bonds | | 6.63 | | 1/15/18 | | 400,000 | | 415,593 |
| Westvaco, | | | | | | | | |
| Unscd. Debs. | | 7.95 | | 2/15/31 | | 250,000 | | 274,488 |
| Weyerhaeuser, | | | | | | | | |
| Unscd. Debs. | | 7.13 | | 7/15/23 | | 245,000 | | 245,523 |
| | | | | | | | | 1,844,531 |
| Property & Casualty Insurance—3.0% | | | | | | |
| Aegon Funding, | | | | | | | | |
| Gtd. Notes | | 5.75 | | 12/15/20 | | 550,000 | | 557,232 |
| American International Group, | | | | | | | | |
| Sr. Notes | | 5.05 | | 10/1/15 | | 270,000 | | 262,999 |
| AON Capital Trust A, | | | | | | | | |
| Gtd. Cap. Secs. | | 8.21 | | 1/1/27 | | 300,000 | | 347,508 |
| Assurant, | | | | | | | | |
| Sr. Notes | | 6.75 | | 2/15/34 | | 400,000 | | 431,158 |
22
| | | Coupon | | Maturity | | Principal | | |
| Bonds and Notes (continued) | | Rate (%) | | Date | | Amount ($) | | Value ($) |
| |
| |
| |
| |
|
| Property & Casualty | | | | | | | | |
| Insurance (continued) | | | | | | | | |
| Chubb, | | | | | | | | |
| Sr. Notes | | 5.47 | | 8/16/08 | | 950,000 | | 952,869 |
| Hartford Financial | | | | | | | | |
| Services Group, | | | | | | | | |
| Sr. Unscd. Notes | | 5.55 | | 8/16/08 | | 450,000 | | 451,950 |
| ING Groep, | | | | | | | | |
| Bonds | | 5.78 | | 12/29/49 | | 400,000 c | | 396,492 |
| Lincoln National, | | | | | | | | |
| Bonds | | 7.00 | | 5/17/66 | | 465,000 c | | 493,697 |
| MetLife, | | | | | | | | |
| Sr. Unscd. Notes | | 5.00 | | 6/15/15 | | 1,050,000 | | 1,020,101 |
| Nippon Life Insurance, | | | | | | | | |
| Notes | | 4.88 | | 8/9/10 | | 475,000 d | | 464,974 |
| Phoenix Cos., | | | | | | | | |
| Sr. Unscd. Notes | | 6.68 | | 2/16/08 | | 205,000 | | 206,825 |
| | | | | | | | | 5,585,805 |
| Real Estate Investment Trusts—5.0% | | | | | | |
| Archstone-Smith Operating Trust, | | | | | | |
| Sr. Unscd. Notes | | 5.25 | | 5/1/15 | | 525,000 | | 515,976 |
| Arden Realty, | | | | | | | | |
| Notes | | 5.25 | | 3/1/15 | | 350,000 | | 346,013 |
| Boston Properties, | | | | | | | | |
| Sr. Notes | | 5.00 | | 6/1/15 | | 470,000 e | | 452,575 |
| Brandywine Operating Partnership, | | | | | | |
| Gtd. Notes | | 5.82 | | 4/1/09 | | 350,000 c | | 350,000 |
| Commercial Net Lease Realty, | | | | | | | | |
| Sr. Unscd. Notes | | 6.15 | | 12/15/15 | | 210,000 | | 212,689 |
| Duke Realty, | | | | | | | | |
| Notes | | 3.50 | | 11/1/07 | | 520,000 | | 511,425 |
| Duke Realty, | | | | | | | | |
| Sr. Notes | | 5.88 | | 8/15/12 | | 1,250,000 | | 1,271,007 |
| EOP Operating, | | | | | | | | |
| Sr. Notes | | 7.00 | | 7/15/11 | | 595,000 | | 644,523 |
| ERP Operating, | | | | | | | | |
| Notes | | 5.13 | | 3/15/16 | | 350,000 e | | 340,526 |
| ERP Operating, | | | | | | | | |
| Notes | | 5.25 | | 9/15/14 | | 85,000 | | 84,179 |
T h e P o r t f o l i o 23
S TAT E M E N T O F I N V E S T M E N T S (continued)
| | | Coupon | | Maturity | | Principal | | |
| Bonds and Notes (continued) | | Rate (%) | | Date | | Amount ($) | | Value ($) |
| |
| |
| |
| |
|
| Real Estate Investment | | | | | | | | |
| Trusts (continued) | | | | | | | | |
| ERP Operating, | | | | | | | | |
| Unscd. Notes | | 5.38 | | 8/1/16 | | 145,000 e | | 143,750 |
| Federal Realty Investment Trust, | | | | | | | | |
| Sr. Unscd. Bonds | | 5.65 | | 6/1/16 | | 325,000 | | 324,232 |
| Federal Realty Investment Trust, | | | | | | | | |
| Notes | | 6.00 | | 7/15/12 | | 100,000 | | 102,183 |
| Healthcare Realty Trust, | | | | | | | | |
| Sr. Notes | | 5.13 | | 4/1/14 | | 475,000 | | 453,906 |
| Host Hotels & Resorts, | | | | | | | | |
| Gtd. Notes | | 6.88 | | 11/1/14 | | 80,000 d | | 81,400 |
| HRPT Properties Trust, | | | | | | | | |
| Sr. Unscd. Notes | | 5.99 | | 3/16/11 | | 475,000 c | | 475,690 |
| Liberty Property, | | | | | | | | |
| Notes | | 5.50 | | 12/15/16 | | 185,000 | | 182,729 |
| Mack-Cali Realty, | | | | | | | | |
| Unscd. Notes | | 5.05 | | 4/15/10 | | 225,000 | | 221,507 |
| Mack-Cali Realty, | | | | | | | | |
| Notes | | 5.25 | | 1/15/12 | | 400,000 | | 393,881 |
| Mack-Cali Realty, | | | | | | | | |
| Bonds | | 5.80 | | 1/15/16 | | 400,000 | | 401,804 |
| Regency Centers, | | | | | | | | |
| Gtd. Notes | | 5.25 | | 8/1/15 | | 145,000 | | 140,821 |
| Simon Property Group, | | | | | | | | |
| Unsub. Notes | | 5.00 | | 3/1/12 | | 550,000 | | 540,923 |
| Simon Property Group, | | | | | | | | |
| Unscd. Notes | | 5.75 | | 5/1/12 | | 150,000 | | 151,710 |
| Socgen Real Estate, | | | | | | | | |
| Bonds | | 7.64 | | 12/29/49 | | 935,000 c,d | | 949,621 |
| | | | | | | | | 9,293,070 |
| Residential Mortgage | | | | | | | | |
| Pass-Through Ctfs.—4.8% | | | | | | | | |
| Bayview Commercial Asset Trust, | | | | | | |
| Ser. 2006-1A, Cl. B2 | | 7.05 | | 4/25/36 | | 117,565 c,d | | 117,712 |
| ChaseFlex Trust, | | | | | | | | |
| Ser. 2006-2, Cl. A1A | | 5.59 | | 9/25/36 | | 350,288 c | | 350,137 |
| Citigroup Mortgage Loan Trust, | | | | | | | | |
| Ser. 2005-WF2, Cl. AF2 | | 4.92 | | 8/25/35 | | 401,781 c | | 398,929 |
| | | Coupon | | Maturity | | Principal | | |
| Bonds and Notes (continued) | | Rate (%) | | Date | | Amount ($) | | Value ($) |
| |
| |
| |
| |
|
| Residential Mortgage | | | | | | | | |
| Pass-Through Ctfs. (continued) | | | | | | | | |
| Citigroup Mortgage Loan Trust, | | | | | | | | |
| Ser. 2005-WF2, Cl. AF7 | | 5.25 | | 8/25/35 | | 950,000 c | | 931,640 |
| Citigroup Mortgage Loan Trust, | | | | | | | | |
| Ser. 2006-WF1, Cl. A2A | | 5.70 | | 3/25/36 | | 209,303 c | | 208,836 |
| CSAB Mortgage Backed Trust, | | | | | | | | |
| Ser. 2006-3, Cl. A1A | | 6.00 | | 11/25/36 | | 1,643,129 c | | 1,641,035 |
| First Horizon Alternative Mortgage | | | | | | | | |
| Securities, Ser. 2004-FA1, | | | | | | | | |
| Cl. 1A1 | | 6.25 | | 10/25/34 | | 2,242,670 | | 2,257,267 |
| Impac Secured Assets CMN Owner | | | | | | | | |
| Trust, Ser. 2006-1, Cl. 2A1 | | 5.70 | | 5/25/36 | | 285,593 c | | 286,277 |
| IndyMac Index Mortgage Loan Trust, | | | | | | |
| Ser. 2006-AR9, Cl. B2 | | 6.07 | | 6/25/36 | | 69,963 c | | 69,483 |
| IndyMac Index Mortgage Loan Trust, | | | | | | |
| Ser. 2006-AR25, Cl. 4A2 | | 6.18 | | 9/25/36 | | 900,022 c | | 909,329 |
| J.P. Morgan Alternative Loan | | | | | | | | |
| Trust, Ser. 2006-S4, Cl. A6 | | 5.71 | | 12/25/36 | | 425,000 c | | 424,260 |
| Nomura Asset Acceptance, | | | | | | | | |
| Ser. 2005-AP2, Cl. A5 | | 4.98 | | 5/25/35 | | 425,000 c | | 412,128 |
| Nomura Asset Acceptance, | | | | | | | | |
| Ser. 2005-WF1, Cl. 2A5 | | 5.16 | | 3/25/35 | | 475,000 c | | 463,818 |
| Washington Mutual, | | | | | | | | |
| Ser. 2005-AR4, Cl. A4B | | 4.67 | | 4/25/35 | | 575,000 c | | 565,178 |
| | | | | | | | | 9,036,029 |
| Retail—.2% | | | | | | | | |
| CVS, | | | | | | | | |
| Sr. Unscd. Notes | | 5.75 | | 8/15/11 | | 155,000 | | 157,022 |
| Federated Retail Holding, | | | | | | | | |
| Gtd. Notes | | 5.90 | | 12/1/16 | | 160,000 | | 160,048 |
| Yum! Brands, | | | | | | | | |
| Sr. Notes | | 6.25 | | 4/15/16 | | 140,000 | | 143,699 |
| | | | | | | | | 460,769 |
| State/Government | | | | | | | | |
| General Obligations—1.6% | | | | | | | | |
| Erie Tobacco Asset | | | | | | | | |
| Securitization/NY, Tobacco | | | | | | | | |
| Settlement Asset-Backed Bonds | | 6.00 | | 6/1/28 | | 400,000 | | 402,596 |
T h e P o r t f o l i o 25
S TAT E M E N T O F I N V E S T M E N T S (continued)
| | | Coupon | | Maturity | | Principal | | |
| Bonds and Notes (continued) | | Rate (%) | | Date | | Amount ($) | | Value ($) |
| |
| |
| |
| |
|
| State/Government | | | | | | | | |
| General Obligations (continued) | | | | | | | | |
| Michigan Tobacco Settlement | | | | | | | | |
| Finance Authority, Tobacco | | | | | | | | |
| Settlement Asset-Backed Bonds | | 7.31 | | 6/1/34 | | 1,425,000 | | 1,481,188 |
| Michigan Tobacco Settlement | | | | | | | | |
| Finance Authority, Tobacco | | | | | | | | |
| Settlement Asset-Backed Bonds | | 7.50 | | 6/1/34 | | 375,000 c | | 376,061 |
| Tobacco Settlement Authority of | | | | | | | | |
| Iowa, Tobacco Settlement | | | | | | | | |
| Asset-Backed Bonds | | 6.50 | | 6/1/23 | | 740,000 | | 733,621 |
| | | | | | | | | 2,993,466 |
| Technology—.2% | | | | | | | | |
| Hewlett-Packard, | | | | | | | | |
| Sr. Unscd. Notes | | 5.50 | | 5/22/09 | | 390,000 c | | 390,877 |
| Telecommunications—2.9% | | | | | | | | |
| AT & T Wireless, | | | | | | | | |
| Sr. Notes | | 8.75 | | 3/1/31 | | 235,000 | | 306,284 |
| AT & T, | | | | | | | | |
| Notes | | 5.46 | | 5/15/08 | | 380,000 c | | 380,351 |
| AT & T, | | | | | | | | |
| Sr. Notes | | 7.30 | | 11/15/11 | | 440,000 | | 476,866 |
| Deutsche Telekom International | | | | | | | | |
| Finance, Gtd. Bonds | | 8.25 | | 6/15/30 | | 400,000 | | 493,154 |
| France Telecom, | | | | | | | | |
| Notes | | 8.50 | | 3/1/31 | | 370,000 | | 487,150 |
| KPN, | | | | | | | | |
| Sr. Unsub. Bonds | | 8.38 | | 10/1/30 | | 820,000 | | 942,122 |
| Nextel Communications, | | | | | | | | |
| Gtd. Notes, Ser. F | | 5.95 | | 3/15/14 | | 280,000 | | 273,061 |
| Nextel Partners, | | | | | | | | |
| Gtd. Notes | | 8.13 | | 7/1/11 | | 245,000 | | 256,331 |
| Nordic Telephone Holdings, | | | | | | | | |
| Sr. Notes EUR | | 8.25 | | 5/1/16 | | 180,000 d,f | | 262,468 |
| Qwest, | | | | | | | | |
| Notes | | 8.88 | | 3/15/12 | | 30,000 | | 33,563 |
| Telefonica Emisiones, | | | | | | | | |
| Gtd. Notes | | 5.98 | | 6/20/11 | | 375,000 | | 382,094 |
| | | Coupon | | Maturity | | Principal | | |
| Bonds and Notes (continued) | | Rate (%) | | Date | | Amount ($) | | Value ($) |
| |
| |
| |
| |
|
| Telecommunications (continued) | | | | | | |
| Verizon Communications, | | | | | | | | |
| Sr. Notes | | 5.50 | | 8/15/07 | | 320,000 c | | 320,001 |
| Verizon Global Funding, | | | | | | | | |
| Sr. Notes | | 5.85 | | 9/15/35 | | 200,000 e | | 192,198 |
| Verizon Global Funding, | | | | | | | | |
| Notes | | 7.75 | | 6/15/32 | | 110,000 | | 129,459 |
| Windstream, | | | | | | | | |
| Sr. Notes | | 8.13 | | 8/1/13 | | 360,000 d | | 391,500 |
| Windstream, | | | | | | | | |
| Sr. Notes | | 8.63 | | 8/1/16 | | 115,000 d,e | | 126,500 |
| | | | | | | | | 5,453,102 |
| Textiles & Apparel—.2% | | | | | | | | |
| Mohawk Industries, | | | | | | | | |
| Sr. Unscd. Notes | | 5.75 | | 1/15/11 | | 400,000 | | 400,631 |
| U.S. Government Agencies/ | | | | | | | | |
| Mortgage-Backed—41.5% | | | | | | | | |
| Federal Home Loan Mortgage Corp.: | | | | | | |
| 4.50% | | | | | | 2,910,000 g | | 2,803,614 |
| 5.00% | | | | | | 4,225,000 g | | 4,151,062 |
| 5.50% | | | | | | 10,425,000 g | | 10,418,550 |
| 6.00% | | | | | | 7,550,000 g | | 7,651,523 |
| 3.50%, 9/1/10 | | | | | | 178,339 | | 172,689 |
| Multiclass Mortgage Participation Ctfs., | | | | | | |
| Ser. 2586, Cl. WE, 4.00%, 12/15/32 | | | | 855,105 | | 800,768 |
| Multiclass Mortgage Participation Ctfs. | | | | | | |
| (Interest Only), Ser. 2764, | | | | | | | | |
| Cl. IT, 5.00%, 6/15/27 | | | | | | 7,390,400 h | | 1,091,774 |
| Federal National Mortgage Association: | | | | | | |
| 4.50% | | | | | | 2,565,000 g | | 2,474,404 |
| 5.00% | | | | | | 16,900,000 g | | 16,407,353 |
| 5.50% | | | | | | 10,055,000 g | | 9,938,664 |
| 6.00% | | | | | | 7,625,000 g | | 7,677,384 |
| 4.00%, 5/1/10 | | | | | | 923,355 | | 895,784 |
| 5.50%, 9/1/34 | | | | | | 338,833 | | 335,306 |
| 7.00%, 6/1/29—9/1/29 | | | | | | 122,712 | | 126,549 |
| Government National Mortgage Association I: | | | | | | |
| 5.50%, 4/15/33—3/15/34 | | | | | | 3,059,511 | | 3,048,974 |
| 8.00%, 9/15/08 | | | | | | 8,228 | | 8,233 |
T h e P o r t f o l i o 27
S TAT E M E N T O F I N V E S T M E N T S (continued)
| | | Principal | | |
| Bonds and Notes (continued) | | Amount ($) | | Value ($) |
| |
| |
|
| U.S. Government Agencies/ | | | | |
| Mortgage-Backed (continued) | | | | |
| Government National | | | | |
| Mortgage Association I (continued): | | | | |
| Ser. 2004-23, Cl. B, 2.95%, 3/16/19 | | 1,578,904 | | 1,516,170 |
| Ser. 2005-90, Cl. A, 3.76%, 9/16/28 | | 805,373 | | 779,742 |
| Ser. 2006-67, Cl. A 3.95%, 10/6/11 | | 1,000,000 | | 967,500 |
| Ser. 2005-29, Cl. A, 4.02%, 7/16/27 | | 485,755 | | 472,829 |
| Ser. 2006-6, Cl. A, 4.05%, 10/16/23 | | 116,990 | | 114,529 |
| Ser. 2006-66, Cl. A 4.09%, 1/16/30 | | 948,555 | | 923,117 |
| Ser. 2006-3, Cl. A, 4.21%, 1/16/28 | | 977,189 | | 955,334 |
| Ser. 2006-5, Cl. A, 4.24%, 7/16/29 | | 708,768 | | 693,152 |
| Ser. 2006-55, Cl. A 4.25%, 7/16/29 | | 866,456 | | 845,901 |
| Ser. 2005-32, Cl. B, 4.39%, 8/16/30 | | 675,000 | | 663,363 |
| Ser. 2005-87, Cl. A, 4.45%, 3/16/25 | | 556,385 | | 546,907 |
| Ser. 2004-39, Cl. LC, 5.50%, 12/20/29 | | 1,000,000 | | 1,002,058 |
| Government National Mortgage Association II; | | | | |
| 7.00%, 9/20/28—7/20/29 | | 21,173 | | 21,802 |
| | | | | 77,505,035 |
| U.S. Government Securities—17.1% | | | | |
| U.S. Treasury Bonds: | | | | |
| 4.50%, 2/15/36 | | 3,765,000 i | | 3,581,460 |
| 5.25%, 11/15/28 | | 245,000 e | | 257,001 |
| U.S. Treasury Inflation Protected Securities: | | | | |
| 2.00%, 1/15/16 | | 1,921,979 j | | 1,855,791 |
| 3.00%, 7/15/12 | | 5,680,154 j | | 5,844,767 |
| U.S. Treasury Notes: | | | | |
| 2.25%, 2/15/07 | | 150,000 | | 149,543 |
| 3.00%, 12/31/06 | | 150,000 k | | 150,000 |
| 4.38%, 12/31/07 | | 300,000 e | | 298,254 |
| 4.50%, 9/30/11 | | 1,755,000 e | | 1,740,125 |
| 4.50%, 11/30/11 | | 1,175,000 i | | 1,164,903 |
| 4.63%, 2/29/08 | | 430,000 e | | 428,320 |
| 4.63%, 8/31/11 | | 20,000 e | | 19,943 |
| 4.63%, 11/15/16 | | 11,500,000 i | | 11,428,137 |
| | | Principal | | |
| Bonds and Notes (continued) | | Amount ($) | | Value ($) |
| |
| |
|
| U.S. Government Securities (continued) | | |
| U.S. Treasury Notes (continued): | | | | |
| 5.13%, 6/30/08 | | 4,600,000 e | | 4,615,815 |
| 5.13%, 5/15/16 | | 425,000 e | | 437,900 |
| | | | | 31,971,959 |
| Total Bonds and Notes | | | | |
| (cost $258,184,791) | | | | 257,379,289 |
| |
| |
|
| | | Face Amount | | |
| | | Covered by | | |
| Options—.0% | | Contracts ($) | | Value ($) |
| |
| |
|
| Call Options—.0% | | | | |
| 3-Month Floor USD Libor-BBA | | | | |
| Interest Rate, January 2009 @ 4 | | 9,250,000 | | 9,810 |
| Put Options—.0% | | | | |
| 3-Month Capped USD Libor-BBA | | | | |
| Interest Rate, June 2007 @ 5.75 | | 38,000,000 | | 885 |
| Total Options | | | | |
| (cost $49,645) | | | | 10,695 |
| |
| |
|
| | | Principal | | |
| Short-Term Investments—1.1% | | Amount ($) | | Value ($) |
| |
| |
|
| Corporate Notes; | | | | |
| Egyptian Treasury Bills, | | | | |
| 9.06%, 3/15/07 | | | | |
| (cost $1,971,743) | | 1,970,000 d,l | | 2,027,563 |
| |
| |
|
| |
| Other Investment—1.9% | | Shares | | Value ($) |
| |
| |
|
| Registered Investment Company; | | | | |
| Dreyfus Institutional Preferred | | | | |
| Plus Money Market Fund | | | | |
| (cost $3,542,000) | | 3,542,000 m | | 3,542,000 |
T h e P o r t f o l i o 29
S TAT E M E N T O F I N V E S T M E N T S (continued)
| Investment of Cash Collateral | | | | |
| | | for Securities Loaned—9.4% | | Shares | | Value ($) |
| |
| |
| |
|
| Registered Investment Company; | | | | |
| Dreyfus Institutional Cash | | | | | | |
| | | Advantage Fund | | | | | | |
| | | (cost $17,664,546) | | | | 17,664,546 m | | 17,664,546 |
| |
| |
| |
| |
|
| |
| Total Investments (cost $281,412,725) | | 150.2% | | 280,624,093 |
| |
| Liabilities, Less Cash and Receivables | | (50.2%) | | (93,770,719) |
| |
| Net Assets | | | | 100.0% | | 186,853,374 |
| |
| a | | Non-income producing—security in default. | | | | |
| b | | The value of this security has been determined in good faith under the direction of the Board of Trustees. |
| c | | Variable rate security—interest rate subject to periodic change. | | |
| d | | Securities exempt from registration under Rule 144A of the Securities Act of 1933.These securities may be resold in |
| | | transactions exempt from registration, normally to qualified institutional buyers. At December 31, 2006, these |
| | | securities amounted to $22,962,121 or 12.3% of net assets. | | |
| e | | All or a portion of these securities are on loan. At December 31, 2006, the total market value of the portfolio’s |
| | | securities on loan is $16,871,494 and the total market value of the collateral held by the portfolio is $17,673,872, |
| | | consisting of cash collateral of $17,664,546 and U.S. Government and agency securities valued at $9,326. |
| f | | Principal amount stated in U.S. Dollars unless otherwise noted. | | |
| | | BRL— Brazilian Real | | | | | | |
| | | EUR— Euro | | | | | | |
| | | PLN— Polish Zloty | | | | | | |
| g | | Purchased on a forward commitment basis. | | | | |
| h | | Notional face amount shown. | | | | | | |
| i | | Purchased on a delayed delivery basis. | | | | |
| j | | Principal amount for accrual purposes is periodically adjusted based on changes in the Consumer Price Index. |
| k | | All or partially held by a broker as collateral for open financial futures positions. | | |
| l | | Credit Linked Notes. | | | | | | |
| m | | Investment in affiliated money market mutual fund. | | | | |
| |
| |
| |
|
| |
| |
| |
| Portfolio Summary (Unaudited) † | | | | |
| |
| | | | | Value (%) | | | | Value (%) |
| |
| |
| |
| |
|
| U.S. Government & Agencies | | 58.6 | | Foreign/Governmental | | 5.7 |
| Corporate Bonds | | 44.5 | | State/Government General Obligations 1.6 |
| Asset/Mortgage-Backed | | 27.4 | | Futures/Forward Currency Exchange |
| Short-Term/Money | | | | Contracts/Options/Swaps | | .2 |
| | | Market Investments | | 12.4 | | | | 150.4 |
| |
| † | | Based on net assets. | | | | | | |
| See notes to financial statements. | | | | | | |
30
S TAT E M E N T O F F I N A N C I A L F U T U R E S
| D e c e m b e r 3 1 , 2 0 0 6 | | | | | | | | |
| |
| |
| |
| |
|
| |
| |
| |
| | | | | | | | | Unrealized |
| | | | | Market Value | | | | Appreciation |
| | | | | Covered by | | | | (Depreciation) |
| | | Contracts | | Contracts ($) | | Expiration | | at 12/31/2006 ($) |
| |
| |
| |
| |
|
| Financial Futures Long | | | | | | | | |
| U.S. Treasury 2 year Notes | | 23 | | 4,692,719 | | March 2007 | | (23,328) |
| U.S. Treasury 5 year Notes | | 109 | | 11,451,813 | | March 2007 | | (80,047) |
| Financial Futures Short | | | | | | | | |
| U.S. Treasury 10 year Notes | | 204 | | (21,923,625) | | March 2007 | | 408,187 |
| U.S. Treasury 30 year Bonds | | 23 | | (2,563,063) | | March 2007 | | 52,063 |
| | | | | | | | | 356,875 |
See notes to financial statements.
T h e P o r t f o l i o 31
S TAT E M E N T O F A S S E T S A N D L I A B I L I T I E S
| D e c e m b e r 3 1 , 2 0 0 6 | | | | |
| |
| |
|
| |
| |
| |
| |
| | | Cost | | Value |
| |
| |
|
| Assets ($): | | | | |
| Investments in securities—See Statement of Investments (including | | |
| securities on loan, valued at $16,871,494)—Note 1(c): | | |
| Unaffiliated issuers | | 260,206,179 | | 259,417,547 |
| Affiliated issuers | | 21,206,546 | | 21,206,546 |
| Cash | | | | 30,967 |
| Cash denominated in foreign currencies | | 158,856 | | 156,697 |
| Dividends and interest receivable | | | | 2,439,463 |
| Unrealized appreciation on forward | | | | |
| currency exchange contracts—Note 4 | | | | 66,199 |
| Receivable from broker for swap transactions—Note 4 | | 22,823 |
| Unrealized appreciation on swaps—Note 4 | | | | 19,228 |
| Receivable for futures variation margin—Note 4 | | 19,047 |
| Receivable for shares of Beneficial Interest subscribed | | 12,213 |
| Receivable for investment securities sold | | | | 158,722 |
| Paydowns receivable | | | | 469 |
| Prepaid expenses | | | | 51,462 |
| | | | | 283,601,383 |
| |
| |
|
| Liabilities ($): | | | | |
| Due to The Dreyfus Corporation and affiliates—Note 3(b) | | 109,771 |
| Payable for investment securities purchased | | 78,811,421 |
| Liability for securities on loan—Note 1(c) | | | | 17,664,546 |
| Unrealized depreciation on swaps—Note 4 | | | | 87,426 |
| Payable for shares of Beneficial Interest redeemed | | 30,296 |
| Net unrealized depreciation of forward | | | | |
| currency exchange contracts—Note 4 | | | | 1,748 |
| Accrued expenses and other liabilities | | | | 42,801 |
| | | | | 96,748,009 |
| |
| |
|
| Net Assets ($) | | | | 186,853,374 |
| |
| |
|
| Composition of Net Assets ($): | | | | |
| Paid-in capital | | | | 191,069,161 |
| Accumulated undistributed investment income—net | | 2,098,366 |
| Accumulated net realized gain (loss) on investments | | (5,879,441) |
| Accumulated net unrealized appreciation (depreciation) | | |
| on investments (including $356,875 net unrealized | | |
| appreciation on financial futures) | | | | (434,712) |
| |
| |
|
| Net Assets ($) | | | | 186,853,374 |
| |
| |
|
| |
| |
| |
| Net Asset Value Per Share | | | | |
| | | Initial Shares | | Service Shares |
| |
| |
|
| Net Assets ($) | | 145,490,376 | | 41,362,998 |
| Shares Outstanding | | 12,929,589 | | 3,688,361 |
| |
| |
|
| Net Asset Value Per Share ($) | | 11.25 | | 11.21 |
See notes to financial statements.
32
| S TAT E M E N T O F | | O P E R AT I O N S | | |
| Ye a r E n d e d D e c e m b e r 3 1 , | | 2 0 0 6 | | |
| |
| |
|
| |
| |
| |
| |
| Investment Income ($): | | | | |
| Income: | | | | |
| Interest | | | | 9,392,823 |
| Dividends; | | | | |
| Affiliated issuers | | | | 425,496 |
| Income from securities lending | | | | 9,748 |
| Total Income | | | | 9,828,067 |
| Expenses: | | | | |
| Investment advisory fee—Note 3(a) | | 1,264,664 |
| Distribution fees—Note 3(b) | | | | 109,189 |
| Prospectus and shareholders’ reports | | 49,306 |
| Custodian fees—Note 3(b) | | | | 36,966 |
| Professional fees | | | | 36,345 |
| Trustees’ fees and expenses—Note 3(c) | | 22,154 |
| Shareholder servicing costs—Note 3(b) | | 2,696 |
| Registration fees | | | | 621 |
| Miscellaneous | | | | 51,230 |
| Total Expenses | | | | 1,573,171 |
| Less—reduction in investment advisory | | |
| fee due to undertaking—Note 3 (a) | | (243,967) |
| Less—reduction in custody fees due | | |
| to earning credits—Note 1(c) | | | | (1,644) |
| Net Expenses | | | | 1,327,560 |
| Investment Income—Net | | | | 8,500,507 |
| |
| |
|
| Realized and Unrealized Gain (Loss) on Investments—Note 4 ($): |
| Net realized gain (loss) on investments and foreign currency transactions | | (542,560) |
| Net realized gain (loss) on options transactions | | 22,209 |
| Net realized gain (loss) on financial futures | | (627,141) |
| Net realized gain (loss) on swap transactions | | 220,169 |
| Net realized gain (loss) on forward currency exchange contracts | | (137,706) |
| Net Realized Gain (Loss) | | | | (1,065,029) |
| Net unrealized appreciation (depreciation) on investments, | | |
| foreign currency transactions, options and swap transactions | | |
| (including $325,500 net unrealized appreciation on financial futures) | | 538,313 |
| Net Realized and Unrealized Gain (Loss) on Investments | | (526,716) |
| Net Increase in Net Assets Resulting from Operations | | 7,973,791 |
| |
| See notes to financial statements. | | | | |
T h e P o r t f o l i o 33
S TAT E M E N T O F C H A N G E S I N N E T A S S E T S
| | | Year Ended December 31, |
| |
|
| | | 2006 | | 2005 |
| |
| |
|
| Operations ($): | | | | |
| Investment income—net | | 8,500,507 | | 7,383,631 |
| Net realized gain (loss) on investments | | (1,065,029) | | 1,338,482 |
| Net unrealized appreciation | | | | |
| (depreciation) on investments | | 538,313 | | (3,502,310) |
| Net Increase (Decrease) in Net Assets | | | | |
| Resulting from Operations | | 7,973,791 | | 5,219,803 |
| |
| |
|
| Dividends to Shareholders from ($): | | | | |
| Investment income—net: | | | | |
| Initial shares | | (6,935,072) | | (5,953,689) |
| Service shares | | (1,909,726) | | (1,742,786) |
| Total Dividends | | (8,844,798) | | (7,696,475) |
| |
| |
|
| Beneficial Interest Transactions ($): | | | | |
| Net proceeds from shares sold: | | | | |
| Initial shares | | 18,413,862 | | 15,895,953 |
| Service shares | | 2,378,699 | | 2,170,592 |
| Dividends reinvested: | | | | |
| Initial shares | | 6,935,072 | | 5,953,689 |
| Service shares | | 1,909,726 | | 1,742,786 |
| Cost of shares redeemed: | | | | |
| Initial shares | | (38,215,309) | | (32,401,995) |
| Service shares | | (10,453,409) | | (11,137,633) |
| Increase (Decrease) in Net Assets from | | | | |
| Beneficial Interest Transactions | | (19,031,359) | | (17,776,608) |
| Total Increase (Decrease) in Net Assets | | (19,902,366) | | (20,253,280) |
| |
| |
|
| Net Assets ($): | | | | |
| Beginning of Period | | 206,755,740 | | 227,009,020 |
| End of Period | | 186,853,374 | | 206,755,740 |
| Undistributed investment income—net | | 2,098,366 | | 2,169,586 |
| | | Year Ended December 31, |
| |
|
| | | 2006 | | 2005 |
| |
| |
|
| Capital Share Transactions: | | | | |
| Initial Shares | | | | |
| Shares sold | | 1,656,604 | | 1,400,032 |
| Shares issued for dividends reinvested | | 624,164 | | 525,289 |
| Shares redeemed | | (3,437,427) | | (2,856,400) |
| Net Increase (Decrease) in Shares Outstanding | | (1,156,659) | | (931,079) |
| |
| |
|
| Service Shares | | | | |
| Shares sold | | 214,567 | | 191,927 |
| Shares issued for dividends reinvested | | 172,423 | | 154,203 |
| Shares redeemed | | (943,077) | | (984,701) |
| Net Increase (Decrease) in Shares Outstanding | | (556,087) | | (638,571) |
See notes to financial statements.
T h e P o r t f o l i o 35
F I N A N C I A L H I G H L I G H T S
The following tables describe the performance for each share class for the fiscal periods indicated. All information (except portfolio turnover rate) reflects financial results for a single portfolio share.Total return shows how much your investment in the portfolio would have increased (or decreased) during each period, assuming you had reinvested all dividends and distributions.These figures have been derived from the portfolio’s financial statements.
| | | | | Year Ended December 31, | | |
| |
| |
| |
|
| Initial Shares | | 2006 | | 2005 | | 2004a | | 2003 | | 2002 |
| |
| |
| |
| |
| |
|
| Per Share Data ($): | | | | | | | | | | |
| Net asset value, beginning of period | | 11.29 | | 11.42 | | 11.50 | | 11.65 | | 11.37 |
| Investment Operations: | | | | | | | | | | |
| Investment income—net b | | .49 | | .39 | | .37 | | .35 | | .54 |
| Net realized and unrealized | | | | | | | | | | |
| gain (loss) on investments | | (.02) | | (.11) | | .01 | | .21 | | .32 |
| Total from Investment Operations | | .47 | | .28 | | .38 | | .56 | | .86 |
| Distributions: | | | | | | | | | | |
| Dividends from investment income—net | | (.51) | | (.41) | | (.46) | | (.46) | | (.58) |
| Dividends from net realized gain | | | | | | | | | | |
| on investments | | — | | — | | — | | (.25) | | — |
| Total Distributions | | (.51) | | (.41) | | (.46) | | (.71) | | (.58) |
| Net asset value, end of period | | 11.25 | | 11.29 | | 11.42 | | 11.50 | | 11.65 |
| |
| |
| |
| |
| |
|
| Total Return (%) | | 4.23 | | 2.48 | | 3.37 | | 4.94 | | 7.76 |
| |
| |
| |
| |
| |
|
| Ratios/Supplemental Data (%): | | | | | | | | | | |
| Ratio of total expenses | | | | | | | | | | |
| to average net assets | | .75 | | .75 | | .74 | | .74 | | .72 |
| Ratio of net expenses | | | | | | | | | | |
| to average net assets | | .63 | | .60 | | .74 | | .74 | | .72 |
| Ratio of net investment income | | | | | | | | | | |
| to average net assets | | 4.43 | | 3.45 | | 3.30 | | 2.96 | | 4.70 |
| Portfolio Turnover Rate | | 507.83c | | 504.21c | | 819.75c | | 898.18c | | 877.87 |
| |
| |
| |
| |
| |
|
| Net Assets, end of period ($ x 1,000) | | 145,490 | | 158,999 | | 171,424 | | 173,534 | | 194,519 |
| a | | As of January 1, 2004, the portfolio has adopted the method of accounting for interim payments on swap contracts in |
| | | accordance with Financial Accounting Standards Board Statement No. 133.These interim payments are reflected |
| | | within net realized and unrealized gain (loss) on swap contracts, however, prior to January 1, 2004, these interim |
| | | payments were reflected within interest income/expense in the Statement of Operations.The effect of this change for |
| | | the period ended December 31, 2004, was to increase net investment income per share by less than $.01, decrease net |
| | | realized and unrealized gain (loss) on investments per share by less than $.01 and increase the ratio of net |
| | | investment income to average net assets from 3.28% to 3.30%. Per share data and ratios/supplemental data for |
| | | periods prior to January 1, 2004 have not been restated to reflect this change in presentation. |
| b | | Based on average shares outstanding at each month end. |
| c | | The portfolio turnover rates excluding mortgage dollar roll transactions for the years ended December 31, 2006, |
| | | December 31, 2005, December 31, 2004 and December 31, 2003, were 262.26%, 393.37%, 761.92% and |
| | | 755.08%, respectively. |
| See notes to financial statements. |
36
| | | | | Year Ended December 31, | | |
| |
| |
| |
|
| Service Shares | | 2006 | | 2005 | | 2004a | | 2003 | | 2002 |
| |
| |
| |
| |
| |
|
| Per Share Data ($): | | | | | | | | | | |
| Net asset value, beginning of period | | 11.25 | | 11.38 | | 11.48 | | 11.62 | | 11.35 |
| Investment Operations: | | | | | | | | | | |
| Investment income—net b | | .46 | | .36 | | .35 | | .31 | | .50 |
| Net realized and unrealized | | | | | | | | | | |
| gain (loss) on investments | | (.02) | | (.11) | | (.01) | | .24 | | .32 |
| Total from Investment Operations | | .44 | | .25 | | .34 | | .55 | | .82 |
| Distributions: | | | | | | | | | | |
| Dividends from investment income—net | | (.48) | | (.38) | | (.44) | | (.44) | | (.55) |
| Dividends from net realized gain | | | | | | | | | | |
| on investments | | — | | — | | — | | (.25) | | — |
| Total Distributions | | (.48) | | (.38) | | (.44) | | (.69) | | (.55) |
| Net asset value, end of period | | 11.21 | | 11.25 | | 11.38 | | 11.48 | | 11.62 |
| |
| |
| |
| |
| |
|
| Total Return (%) | | 3.90 | | 2.26 | | 3.05 | | 4.78 | | 7.47 |
| |
| |
| |
| |
| |
|
| Ratios/Supplemental Data (%): | | | | | | | | | | |
| Ratio of total expenses | | | | | | | | | | |
| to average net assets | | 1.00 | | .99 | | .99 | | .99 | | .97 |
| Ratio of net expenses | | | | | | | | | | |
| to average net assets | | .88 | | .84 | | .99 | | .99 | | .97 |
| Ratio of net investment income | | | | | | | | | | |
| to average net assets | | 4.17 | | 3.21 | | 3.06 | | 2.66 | | 4.39 |
| Portfolio Turnover Rate | | 507.83c | | 504.21c | | 819.75c | | 898.18c | | 877.87 |
| |
| |
| |
| |
| |
|
| Net Assets, end of period ($ x 1,000) | | 41,363 | | 47,757 | | 55,585 | | 60,561 | | 57,966 |
| a | | As of January 1, 2004, the portfolio has adopted the method of accounting for interim payments on swap contracts in |
| | | accordance with Financial Accounting Standards Board Statement No. 133.These interim payments are reflected |
| | | within net realized and unrealized gain (loss) on swap contracts, however, prior to January 1, 2004, these interim |
| | | payments were reflected within interest income/expense in the Statement of Operations.The effect of this change for |
| | | the period ended December 31, 2004, was to increase net investment income per share by $.01, decrease net realized |
| | | and unrealized gain (loss) on investments per share by $.01 and increase the ratio of net investment income to |
| | | average net assets from 3.03% to 3.06%. Per share data and ratios/supplemental data for periods prior to January |
| | | 1, 2004 have not been restated to reflect these changes in presentation. |
| b | | Based on average shares outstanding at each month end. |
| c | | The portfolio turnover rates excluding mortgage dollar roll transactions for the years ended December 31, 2006, |
| | | December 31, 2005, December 31, 2004 and December 31, 2003, were 262.26%, 393.37%, 761.92% and |
| | | 755.08%, respectively. |
| See notes to financial statements. |
T h e P o r t f o l i o 37
N O T E S T O F I N A N C I A L S TAT E M E N T S
NOTE 1—Significant Accounting Policies:
Dreyfus Variable Investment Fund (the “fund”) is registered under the Investment Company Act of 1940, as amended (the “Act”), as an open-end management investment company, operating as a series company currently offering twelve series, including the Quality Bond Portfolio (the “portfolio”). The portfolio is only offered to separate accounts established by insurance companies to fund variable annuity contracts and variable life insurance policies.The portfolio is a diversified series.The portfolio’s investment objective is to maximize total return, consisting of capital appreciation and current income. The Dreyfus Corporation (the “Manager” or “Dreyfus”) serves as the portfolio’s investment adviser.The Manager is a wholly-owned subsidiary of Mellon Financial Corporation (“Mellon Financial”).
On December 4, 2006, Mellon Financial and The Bank of New York Company, Inc. announced that they had entered into a definitive agreement to merge. The new company will be called The Bank of New York Mellon Corporation. As part of this transaction, Dreyfus would become a wholly-owned subsidiary of The Bank of New York Mellon Corporation.The transaction is subject to certain regulatory approvals and the approval of The Bank of New York Company, Inc.’s and Mellon Financial’s shareholders, as well as other customary conditions to closing. Subject to such approvals and the satisfaction of the other conditions, Mellon Financial and The Bank of New York Company, Inc. expect the transaction to be completed in the third quarter of 2007.
Dreyfus Service Corporation (the “Distributor”), a wholly-owned subsidiary of the Manager, is the distributor of the portfolio’s shares, which are sold without a sales charge.The portfolio is authorized to issue an unlimited number of $.001 par value shares of Beneficial Interest in each of the following classes of shares: Initial and Service. Each class of shares has identical rights and privileges, except with respect to the distribution plan and the expenses borne by each class and certain voting rights. Income, expenses (other than expenses attributable to a specific class), and realized and unrealized gains or losses on investments are allocated to each class of shares based on its relative net assets.
The fund accounts separately for the assets, liabilities and operations of each series. Expenses directly attributable to each series are charged to that series’ operations, expenses which are applicable to all series are allocated among them on a pro rata basis.
The portfolio’s financial statements are prepared in accordance with U.S. generally accepted accounting principles, which may require the use of management estimates and assumptions.Actual results could differ from those estimates.
The fund enters into contracts that contain a variety of indemnifica-tions.The portfolio’s maximum exposure under these arrangements is unknown. The portfolio does not anticipate recognizing any loss related to these arrangements.
(a) Portfolio valuation: Investments in securities (excluding short-term investments (other than U.S. Treasury Bills), financial futures, options, swap transactions and forward currency exchange contracts) are valued each business day by an independent pricing service (the “Service”) approved by the Board of Trustees. Investments for which quoted bid prices are readily available and are representative of the bid side of the market in the judgment of the Service are valued at the mean between the quoted bid prices (as obtained by the Service from dealers in such securities) and asked prices (as calculated by the Service based upon its evaluation of the market for such securities). Other investments (which constitute a majority of the portfolio securities) are valued as determined by the Service, based on methods which include consideration of: yields or prices of securities of comparable quality, coupon, maturity and type; indications as to values from dealers; and general market conditions. Restricted securities, as well as securities or other assets for which recent market quotations are not readily available, not valued by a pricing service approved by the Board of Trustees, or determined by the portfolio not to reflect accurately fair value, are valued at fair value as determined in good faith under the direction of the Board of Trustees. The factors that may be considered when fair valuing a security include fundamental analytical data, the nature and duration of restrictions on
T h e P o r t f o l i o 39
N O T E S T O F I N A N C I A L S TAT E M E N T S (continued)
disposition, an evaluation of the forces that influence the market in which the securities are purchased and sold, and public trading in similar securities of the issuer or comparable issuers. Short-term investments, excluding U.S. Treasury Bills, are carried at amortized cost, which approximates value. Registered open-ended investment companies that are not traded on an exchange are valued at their net asset value. Financial futures and options, which are traded on an exchange, are valued at the last sales price on the securities exchange on which such securities are primarily traded or at the last sales price on the national securities market on each business day. Options traded over-the-counter are priced at the mean between the bid prices and asked prices. Investments in swap transactions are valued each business day by an independent pricing service approved by the Board of Trustees. Swaps are valued by the service by using a swap pricing model which incorporates among other factors, default probabilities, recovery rates, credit curves of the underlying issuers and swap spreads on interest rates. Investments denominated in foreign currencies are translated to U.S. dollars at the prevailing rates of exchange. Forward currency exchange contracts are valued at the forward rate.
On September 20, 2006, the Financial Accounting Standards Board (FASB) released Statement of Financial Accounting Standards No. 157 “Fair Value Measurements” (“FAS 157”). FAS 157 establishes an authoritative definition of fair value, sets out a framework for measuring fair value, and requires additional disclosures about fair-value measurements. The application of FAS 157 is required for fiscal years beginning after November 15, 2007 and interim periods within those fiscal years. Management does not believe that the application of this standard will have a material impact on the financial statements of the portfolio.
(b) Foreign currency transactions: The portfolio does not isolate that portion of the results of operations resulting from changes in foreign exchange rates on investments from the fluctuations arising from changes in the market prices of securities held. Such fluctuations are included with the net realized and unrealized gain or loss on investments.
Net realized foreign exchange gains or losses arise from sales and maturities of short-term securities, sales of foreign currencies, currency gains or losses realized on securities transactions and the difference between the amounts of dividends, interest and foreign withholding taxes recorded on the portfolios’ books and the U.S. dollar equivalent of the amounts actually received or paid. Net unrealized foreign exchange gains and losses arise from changes in the value of assets and liabilities other than investments in securities, resulting from changes in exchange rates. Such gains and losses are included with net realized and unrealized gain or loss on investments.
(c) Securities transactions and investment income: Securities transactions are recorded on a trade date basis. Realized gain and loss from securities transactions are recorded on the identified cost basis. Dividend income is recognized on the ex-dividend date and interest income, including, where applicable, accretion of discount and amortization of premium on investments, is recognized on the accrual basis.
The portfolio has an arrangement with the custodian bank whereby the portfolio receives earnings credits from the custodian when positive cash balances are maintained, which are used to offset custody fees. For financial reporting purposes, the portfolio includes net earnings credits as an expense offset in the Statement of Operations.
Pursuant to a securities lending agreement with Mellon Bank, N.A., an affiliate of the Manager, the portfolio may lend securities to qualified institutions.At origination, all loans are secured by collateral of at least 102% of the value of U.S. securities loaned and 105% of the value of foreign securities loaned. Collateral equivalent to at least 100% of the market value of securities on loan will be maintained at all times. Cash collateral is invested in certain money market mutual funds managed by the Manager. The portfolio will be entitled to receive all income on securities loaned, in addition to income earned as a result of the lending transaction. Although each security loaned is fully collateralized, the fund would bear the risk of delay in recovery of, or loss
T h e P o r t f o l i o 41
N O T E S T O F I N A N C I A L S TAT E M E N T S (continued)
of rights in, the securities loaned should a borrower fail to return the securities in a timely manner.
(d) Affiliated issuers: Investments in other investment companies advised by the Manager are defined as “affiliated” in the Act.
(e) Dividends to shareholders: Dividends are recorded on the ex-dividend date. Dividends from investment income-net are declared and paid monthly. Dividends from net realized capital gain, if any, are normally declared and paid annually, but the portfolio may make distributions on a more frequent basis to comply with the distribution requirements of the Internal Revenue Code of 1986, as amended (the “Code”).To the extent that net realized capital gain can be offset by capital loss carryovers, it is the policy of the portfolio not to distribute such gain. Income and capital gain distributions are determined in accordance with income tax regulations, which may differ from U.S. generally accepted accounting principles.
On December 29, 2006, the Board of Trustees declared a cash dividend of .042 and .040 per share for the Initial shares and Service shares respectively, from undistributed investment income-net payable on January 3, 2007 (ex-dividend date) to shareholders of record as of the close of business on December 29, 2006.
(f) Federal income taxes: It is the policy of the portfolio to continue to qualify as a regulated investment company, if such qualification is in the best interests of its shareholders, by complying with the applicable provisions of the Code, and to make distributions of taxable income sufficient to relieve it from substantially all federal income and excise taxes.
On July 13, 2006, the FASB released FASB Interpretation No. 48 “Accounting for Uncertainty in Income Taxes” (FIN 48). FIN 48 provides guidance for how uncertain tax positions should be recognized, measured, presented and disclosed in the financial statements. FIN 48 requires the evaluation of tax positions taken or expected to be taken
in the course of preparing the portfolio’s tax returns to determine whether the tax positions are “more-likely-than-not” of being sustained by the applicable tax authority. Tax positions not deemed to meet the more-likely-than-not threshold would be recorded as a tax benefit or expense in the current year.Adoption of FIN 48 is required for fiscal years beginning after December 15, 2006 and is to be applied to all open tax years as of the effective date. Management does not believe that the application of this standard will have a material impact on the financial statements of the portfolio.
At December 31, 2006, the components of accumulated earnings on a tax basis were as follows: undistributed ordinary income $2,451,964, accumulated capital losses $4,857,959 and unrealized depreciation $1,628,900. In addition, the portfolio had $180,892 of capital losses realized after October 31, 2006, which were deferred for tax purposes to the first day of the following fiscal year.
The accumulated capital loss carryover is available to be applied against future net securities profits, if any, realized subsequent to December 31, 2006. If not applied, $3,171,594 of the carryover expires in fiscal 2012, $61,980 expires in fiscal 2013 and $1,624,385 expires in fiscal 2014.
The tax character of distributions paid to shareholders during the fiscal period ended December 31, 2006 and December 31, 2005, were as follows: ordinary income $8,844,798 and $7,696,475.
During the period ended December 31, 2006, as a result of permanent book to tax differences primarily due to the tax treatment of amortization of premiums, paydowns gains/losses, treatment of swap periodic payments, contigent deferred debt securities and foreign currency transactions, the portfolio increased accumulated undistributed investment income-net by $273,071, decreased accumulated net realized gain (loss) on investments by $274,513 and increased paid-in capital by $1,442. Net assets were not affected by this reclassification.
T h e P o r t f o l i o 43
N O T E S T O F I N A N C I A L S TAT E M E N T S (continued)
NOTE 2—Bank Lines of Credit:
The portfolio may borrow up to $10 million for leveraging purposes under a short-term unsecured line of credit and participates with other Dreyfus-managed funds in a $100 million unsecured line of credit primarily to be utilized for temporary or emergency purposes, including the financing of redemptions. Interest is charged to the portfolio based on prevailing market rates in effect at the time of borrowing. During the period ended December 31, 2006, the portfolio did not borrow under the Facility.
NOTE 3—Investment Advisory Fee and Other Transactions With Affiliates:
(a) Pursuant to an Investment Advisory Agreement with the Manager, the investment advisory fee is computed at the annual rate of .65% of the value of the portfolio’s average daily net assets and is payable monthly.The Manager had agreed from January 1, 2006 through June 30, 2006 to waive receipt of a portion of the portfolios investment advisory fee, in the amount of .15% of the value of the portfolio’s average net assets.The Manager has agreed from July 1, 2006 through June 30, 2007, to waive receipt of a portion of the portfolio’s investment advisory fee, in the amount of .10% of the value of the portfolio’s average net assets. The reduction in investment advisory fee, pursuant to the undertaking, amounted to $243,967 during the period ended December 31, 2006.
(b) Under the Distribution Plan (the “Plan”) adopted pursuant to Rule 12b-1 under the Act, Service shares pay the Distributor for distributing their shares, for servicing and/or maintaining Service shares shareholder accounts and for advertising and marketing for Service shares.The Plan provides for payments to be made at an annual rate of .25% of the value of the Service shares’ average daily net assets.The Distributor may make payments to Participating Insurance Companies and to brokers and dealers acting as principal underwriter for their variable insurance products.The fees payable under the Plan are payable without regard to actual expenses incurred. During the period ended December 31, 2006, Service shares were charged $109,189 pursuant to the Plan.
The portfolio compensates Dreyfus Transfer, Inc., a wholly-owned subsidiary of the Manager, under a transfer agency agreement for providing personnel and facilities to perform transfer agency services for the portfolio. During the period ended December 31, 2006, the portfolio was charged $494 pursuant to the transfer agency agreement.
The portfolio compensates Mellon Bank, N.A., an affiliate of the Manager, under a custody agreement to provide custodial services for the portfolio. During the period ended December 31, 2006, the portfolio was charged $36,966 pursuant to the custody agreement.
During the period ended December 31, 2006, the portfolio was charged $4,204 for services performed by the Chief Compliance Officer.
The components of Due to The Dreyfus Corporation and affiliates in the Statement of Assets and Liabilities consist of: investment advisory fees $104,218, Rule 12b-1 distribution plan fees $8,827, custodian fees $10,650, chief compliance officer fees $2,044 and transfer agency per account fees $66, which are offset against an expense reimbursement currently in effect in the amount of $16,034.
(c) Each Board member also serves as a Board member of other funds within the Dreyfus complex. Annual retainer fees and attendance fees are allocated to each fund based on net assets.
(d) Pursuant to an exemptive order from the SEC, the portfolio may invest its available cash balances in affiliated money market mutual funds. Management fees of the underlying money market mutual funds have been waived by the Manager.
NOTE 4—Securities Transactions:
The aggregate amount of purchases and sales (including paydowns) of investment securities, excluding short-term securities, financial futures, forward currency exchange contracts, options transactions and swap transactions, during the period ended December 31, 2006, amounted to $1,294,897,503 and $1,288,112,717, respectively, of which $622,620,346 in purchases and $622,907,163 in sales were from mortgage dollar roll transactions.
T h e P o r t f o l i o 45
N O T E S T O F I N A N C I A L S TAT E M E N T S (continued)
A mortgage dollar roll transaction involves a sale by the portfolio of mortgage related securities that it holds with an agreement by the portfolio to repurchase similar securities at an agreed upon price and date.The securities purchased will bear the same interest rate as those sold, but generally will be collateralized by pools of mortgages with different prepayment histories than those securities sold.
The portfolio may invest in financial futures contracts in order to gain exposure to or protect against changes in the market.The portfolio is exposed to market risk as a result of changes in the value of the underlying financial instruments. Investments in financial futures require the portfolio to “mark to market” on a daily basis, which reflects the change in market value of the contracts at the close of each day’s trading. Accordingly, variation margin payments are received or made to reflect daily unrealized gains or losses.When the contracts are closed, the portfolio recognizes a realized gain or loss.These investments require initial margin deposits with a broker, which consist of cash or cash equiva-lents.The amount of these deposits is determined by the exchange or Board of Trade on which the contract is traded and is subject to change. Contracts open at December 31, 2006, are set forth in the Statement of Financial Futures.
The portfolio may purchase and write (sell) put and call options in order to gain exposure to or to protect against changes in the market.
As a writer of call options, the portfolio receives a premium at the outset and then bears the market risk of unfavorable changes in the price of the financial instrument underlying the option. Generally, the portfolio would incur a gain, to the extent of the premium, if the price of the underlying financial instrument decreases between the date the option is written and the date on which the option is terminated. Generally, the portfolio would realize a loss, if the price of the financial instrument increases between those dates.
As a writer of put options, the portfolio receives a premium at the outset and then bears the market risk of unfavorable changes in the price of
the financial instrument underlying the option. Generally, the portfolio would incur a gain, to the extent of the premium, if the price of the underlying financial instrument increases between the date the option is written and the date on which the option is terminated. Generally, the portfolio would realize a loss, if the price of the financial instrument decreases between those dates.The following summarizes the portfolio’s call/put options written for the period ended December 31, 2006.
| | | Face Amount | | | | Options Terminated |
| | | | | |
|
| | | Covered by | | Premiums | | | | Net Realized |
| Options Written: | | Contracts ($) | | Received ($) | | Cost ($) | | Gain (Loss) ($) |
| |
| |
| |
| |
|
| Contracts outstanding | | | | | | | | |
| December 31, 2005 | | 12,110,000 | | 49,688 | | | | |
| Contracts written | | 290,755,000 | | 198,715 | | | | |
| Contracts terminated: | | | | | | | | |
| Contracts closed | | 48,410,000 | | 144,563 | | 331,624 | | (187,061) |
| Contracts expired | | 244,805,000 | | 94,190 | | — | | 94,190 |
| Contracts exercised | | 9,650,000 | | 9,650 | | 9,650 | | — |
| Total contracts | | | | | | | | |
| terminated | | 302,865,000 | | 248,403 | | 341,274 | | (92,871) |
| Contracts outstanding | | | | | | | | |
| December 31, 2006 | | — | | — | | | | |
The portfolio may enter into forward currency exchange contracts in order to hedge its exposure to changes in foreign currency exchange rates on its foreign portfolio holdings and to settle foreign currency transactions.When executing forward currency exchange contracts, the portfolio is obligated to buy or sell a foreign currency at a specified rate on a certain date in the future.With respect to sales of forward currency exchange contracts, the portfolio would incur a loss if the value of the contract increases between the date the forward contract is opened and the date the forward contract is closed.The portfolio realizes a gain if the value of the contract decreases between those dates.With respect to purchases of forward currency exchange contracts, the portfolio would incur a loss if the value of the contract decreases between the date the forward contract is opened and the date the forward contract is closed. The portfolio realizes a gain if the value of the contract increases between those dates.The portfolio is also exposed to credit risk associ-
T h e P o r t f o l i o 47
N O T E S T O F I N A N C I A L S TAT E M E N T S (continued)
ated with counterparty nonperformance on these forward currency exchange contracts which is typically limited to the unrealized gain on each open contract.The following summarizes open forward currency exchange contracts at December 31, 2006:
| | | Foreign | | | | Unrealized |
| Forward Currency | | Currency | | | | Appreciation |
| Exchange Contracts | | Amounts | | Proceeds ($) Value ($) | | (Depreciation) ($) |
| |
| |
| |
|
| Sales: | | | | | | |
| Euro, expiring | | | | | | |
| 3/21/2007 | | 190,000 | | 249,831 251,579 | | (1,748) |
| Polish Zloty, expiring | | | | |
| 3/21/2007 | | 16,840,000 | | 5,880,915 5,814,716 | | 66,199 |
| Total | | | | | | 64,451 |
The portfolio may enter into swap agreements to exchange the interest rate on, or return generated by, one nominal instrument for the return generated by another nominal instrument.
The portfolio accrues for the interim payments on swap contracts on a daily basis, with the net amount recorded within unrealized appreciation (depreciation) of swap contracts in the Statement of Assets and Liabilities. Once the interim payments are settled in cash, the net amount is recorded as realized gain (loss) on swaps, in addition to realized gain (loss) recorded upon the termination of swap contracts in the Statement of Operations. Fluctuations in the value of swap contracts are recorded as a component of net change in unrealized appreciation (depreciation) on investments.
Credit default swaps involve commitments to pay a fixed interest rate in exchange for payment if a credit event affecting a third party (the referenced company) occurs. Credit events may include a failure to pay interest or principal, bankruptcy, or restructuring. For those credit default swaps in which the fund is receiving a fixed rate, the fund is providing credit protection on the underlying instrument.The maxi-
mum payouts for these contracts are limited to the notional amount of each swap.The following summarizes credit default swaps entered into by the portfolio at December 31, 2006:
| | | | | | | | | | | Unrealized |
| Notional | | Reference | | | | (Pay) Receive | | Appreciation |
| Amount ($) | | Entity | | Counterparty | | Fixed Rate (%) Expiration (Depreciation)($) |
| |
| |
| |
|
| |
| 407,000 | | CenturyTel, | | | | | | | | |
| | | 7.875%, | | | | | | | | |
| | | 8/15/2012 | | Citigroup | | (1.16) | | 9/20/2015 | | 200 |
| 118,000 | | CenturyTel, | | | | | | | | |
| | | 7.875%, | | Morgan | | | | | | |
| | | 8/15/2012 | | Stanley | | (1.15) | | 9/20/2015 | | 138 |
| 900,000 | | CenturyTel, | | | | | | | | |
| | | 7.875%, | | | | | | | | |
| | | 8/15/2012 | | Citigroup | | (1.19) | | 9/20/2015 | | (1,395) |
| 760,000 | | Dow Jones | | Morgan | | | | | | |
| | | CDX.NA.IG.4 Index | | Stanley | | (.69) | | 6/20/2010 | | (15,662) |
| 760,000 | | Dow Jones | | | | | | | | |
| | | CDX. NA.IG.4 Index | | Citigroup | | (.69) | | 6/20/2010 | | (15,662) |
| 3,650,000 | | Dow Jones | | | | | | | | |
| | | CDX. NA.IG.7 Index | | UBS | | .53 | | 12/20/2016 | | 2,418 |
| 1,825,000 | | Dow Jones | | | | | | | | |
| | | CDX. NA.IG.7 Index | | UBS | | (1.12) | | 12/20/2016 | | 426 |
| 275,000 | | Kaupthing Bank, | | | | | | | | |
| | | 5.52%, | | Deutsche | | | | | | |
| | | 12/1/2009 | | Bank | | .65 | | 9/20/2007 | | 950 |
| 1,100,000 | | Kaupthing Bank, | | | | | | | | |
| | | 5.52%, | | Deutsche | | | | | | |
| | | 12/1/2009 | | Bank | | .52 | | 9/20/2007 | | 2,723 |
| 193,000 | | Kimberly Clark, | | | | | | | | |
| | | 6.875%, | | J.P. Morgan | | | | | | |
| | | 2/15/2014 | | Chase Bank | | (.19) | | 12/20/2011 | | 4 |
| 50,000 | | Kimberly Clark, | | | | | | | | |
| | | 6.875%, | | J.P. Morgan | | | | | | |
| | | 2/15/2014 | | Chase Bank | | (.37) | | 12/20/2016 | | 87 |
| 100,000 | | Kimberly Clark, | | | | | | | | |
| | | 6.875%, | | J.P. Morgan | | | | | | |
| | | 2/15/2014 | | Chase Bank | | (.37) | | 12/20/2016 | | 174 |
| 150,000 | | Kimberly Clark, | | | | | | | | |
| | | 6.875%, | | J.P. Morgan | | | | | | |
| | | 2/15/2014 | | Chase Bank | | (.37) | | 12/20/2016 | | 260 |
| 600,000 | | VF, 8.5%, | | Morgan | | | | | | |
| | | 10/1/2010 | | Stanley | | (.72) | | 6/20/2016 | | (8,400) |
| 1,710,000 | | VF, 8.5%, | | Morgan | | | | | | |
| | | 10/1/2010 | | Stanley | | (.46) | | 6/20/2011 | | (18,401) |
T h e P o r t f o l i o 49
N O T E S T O F I N A N C I A L S TAT E M E N T S (continued)
50
| | | | | | | | | Unrealized |
| Notional | | Reference | | | | (Pay) Receive | | Appreciation |
| Amount ($) | | Entity | | Counterparty | | Fixed Rate (%) Expiration (Depreciation)($) |
| |
| |
| |
|
| |
| 400,000 | | VF, 8.5%, | | Morgan | | | | |
| | | 10/1/2010 | | Stanley | | (.45) 6/20/2011 | | (4,142) |
| 940,000 | | Wolters Kluwer, | | | | | | |
| | | 5.125%, | | Deutsche | | | | |
| | | 1/27/2014 | | Bank | | (.72) 9/20/2013 | | (11,452) |
(67,734)
The portfolio may enter into interest rate swaps which involve the exchange of commitments to pay and receive interest based on a notional principal amount. The following summarizes interest rate swaps entered into by the portfolio at December 31, 2006:
| | | | | | | | | Unrealized |
| Notional | | Reference | | | | (Pay) Receive | | Appreciation |
| Amount ($) | | Entity | | Counterparty | | Fixed Rate (%) Expiration (Depreciation)($) |
| |
| |
| |
|
| |
| 1,057,000,000 | | JPY-6 Month | | | | | | |
| | | YENIBOR | | UBS | | .88 5/11/2008 | | 11,848 |
| 26,000,000 | | SEK-3 Month | | J.P. Morgan | | | | |
| | | STIBOR | | Chase Bank | | 3.75 12/4/2008 | | (12,312) |
| | | | | | | | | (464) |
Total return swaps involve commitments to pay interest in exchange for a market-linked return based on a notional amount.To the extent the total return of the security or index underlying the transaction exceeds or falls short of the offsetting interest rate obligation, the portfolio will receive a payment from or make a payment to the counterparty, respec-tively.At December 31, 2006, there was no open total return swaps.
Risks may arise upon entering into these agreements from the potential inability of the counterparties to meet the terms of the agreement and are generally limited to the amount of net payments to be received, if any, at the date of default.
At December 31, 2006, the cost of investments for federal income tax purposes was $282,040,655; accordingly, accumulated net unrealized depreciation on investments was $1,416,562, consisting of $1,899,924 gross unrealized appreciation and $3,316,486 gross unrealized depreciation.
R E P O R T O F I N D E P E N D E N T R E G I S T E R E D P U B L I C A C C O U N T I N G F I R M
Shareholders and Board of Trustees
Dreyfus Variable Investment Fund, Quality Bond Portfolio
We have audited the accompanying statement of assets and liabilities, including the statements of investments and financial futures, of Dreyfus Variable Investment Fund, Quality Bond Portfolio (one of the funds comprising Dreyfus Variable Investment Fund) as of December 31, 2006, and the related statement of operations for the year then ended, the statement of changes in net assets for each of the two years in the period then ended and financial highlights for each of the years indicated therein. These financial statements and financial highlights are the responsibility of the Fund’s management. Our responsibility is to express an opinion on these financial statements and financial highlights based on our audits.
We conducted our audits in accordance with the standards of the Public Company Accounting Oversight Board (United States).Those standards require that we plan and perform the audit to obtain reasonable assurance about whether the financial statements and financial highlights are free of material misstatement.We were not engaged to perform an audit of the Fund’s internal control over financial reporting. Our audits included consideration of internal control over financial reporting as a basis for designing audit procedures that are appropriate in the circumstances, but not for the purpose of expressing an opinion on the effectiveness of the Fund’s internal control over financial reporting. Accordingly, we express no such opinion. An audit also includes examining, on a test basis, evidence supporting the amounts and disclosures in the financial statements and financial highlights, assessing the accounting principles used and significant estimates made by management, and evaluating the overall financial statement presentation. Our procedures included confirmation of securities owned as of December 31, 2006 by correspondence with the custodian and others or by other appropriate auditing procedures where replies from others were not received.We believe that our audits provide a reasonable basis for our opinion.
In our opinion, the financial statements and financial highlights referred to above present fairly, in all material respects, the financial position of Dreyfus Variable Investment Fund, Quality Bond Portfolio at December 31,2006,the results of its operations for the year then ended,the changes in its net assets for each of the two years in the period then ended and the financial highlights for each of the indicated years, in conformity with U.S. generally accepted accounting principles.

| New York, New York |
| February 6, 2007 |
T h e P o r t f o l i o 51
P R O X Y R E S U LT S ( U n a u d i t e d )
Dreyfus Variable Investment Fund held a special meeting of shareholders on June 29, 2006.The proposal considered at the meeting, and the results, are as follows:
| | | | | Shares | | |
| |
| |
| |
|
| | | Votes For | | | | Authority Withheld |
| |
| |
| |
|
| To elect additional Board Members: | | | | | | |
| Peggy C. Davis† | | 171,078,927 | | | | 7,687,714 |
| Joseph S. DiMartino | | 170,946,484 | | | | 7,820,156 |
| David P. Feldman | | 170,959,921 | | | | 7,806,720 |
| Ehud Houminer† | | 170,132,087 | | | | 8,634,554 |
| Gloria Messinger† | | 170,187,241 | | | | 8,579,400 |
| Anne Wexler† | | 170,212,607 | | | | 8,554,033 |
† Each new Board member’s term commenced on September 26, 2006.
In addition to Joseph S. DiMartino and David P. Feldman, James F. Henry, Dr. Paul A. Marks and Dr. Martin Peretz continue as Board members of the fund.


| Telephone 1-800-554-4611 or 516-338-3300 |
| Mail | | The Dreyfus Family of Funds, 144 Glenn Curtiss Boulevard, Uniondale, NY 11556-0144 |
| | | Attn: Investments Division |
The portfolio files its complete schedule of portfolio holdings with the Securities and Exchange Commission (“SEC”) for the first and third quarters of each fiscal year on Form N-Q. The portfolio’s Forms N-Q are available on the SEC’s website at http://www.sec.gov and may be reviewed and copied at the SEC’s Public Reference Room in Washington, DC. Information on the operation of the Public Reference Room may be obtained by calling 1-202-551-8090.
A description of the policies and procedures that the portfolio uses to determine how to vote proxies relating to portfolio securities, and information regarding how the portfolio voted these proxies for the 12-month period ended June 30, 2006, is available at http://www.dreyfus.com and on the SEC’s website at http://www.sec.gov. The description of the policies and procedures is also available without charge, upon request, by calling 1-800-645-6561.

| Dreyfus Variable |
| Investment Fund, |
| Small | | Company |
| Stock | | Portfolio |

The views expressed in this report reflect those of the portfolio manager only through the end of the period covered and do not necessarily represent the views of Dreyfus or any other person in the Dreyfus organization.Any such views are subject to change at any time based upon market or other conditions and Dreyfus disclaims any responsibility to update such views. These views may not be relied on as investment advice and, because investment decisions for a Dreyfus portfolio are based on numerous factors, may not be relied on as an indication of trading intent on behalf of any Dreyfus portfolio.
Not FDIC-Insured • Not Bank-Guaranteed • May Lose Value
| | | Contents |
| |
| | | THE PORTFOLIO |
| |
|
| 2 | | A Letter from the CEO |
| 3 | | Discussion of Performance |
| 6 | | Portfolio Performance |
| 8 | | Understanding Your Portfolio’s Expenses |
| 8 | | Comparing Your Portfolio’s Expenses |
| | | With Those of Other Funds |
| 9 | | Statement of Investments |
| 15 | | Statement of Assets and Liabilities |
| 16 | | Statement of Operations |
| 17 | | Statement of Changes in Net Assets |
| 19 | | Financial Highlights |
| 21 | | Notes to Financial Statements |
| 28 | | Report of Independent Registered |
| | | Public Accounting Firm |
| 29 | | Important Tax Information |
| 29 | | Proxy Results |
| 30 | | Board Members Information |
| 33 | | Officers of the Fund |
| |
| FOR MORE INFORMATION |
|
| | | Back Cover |
| Dreyfus Variable Investment Fund, |
| Small Company Stock Portfolio |
The Portfolio

We are pleased to present this annual report for Dreyfus Variable Investment Fund, Small Company Stock Portfolio, covering the 12-month period from January 1, 2006, through December 31, 2006.
2006 proved to be a good year for the financial markets.Virtually all sectors and capitalization ranges of the U.S. equity markets generated strong returns, especially over the second half of the year.A number of positive factors contributed to the markets’ gains in 2006, including an expanding domestic economy, subdued inflation, stabilizing interest rates, rising productivity and robust corporate profits.
In our analysis, 2006 provided an excellent reminder of the need for a long-term investment perspective. Adopting too short a time frame proved costly for some investors last year, as chasing recent winners often meant buying the next month’s losers. Indeed, history shows that reacting to near-term developments with extreme shifts in strategy rarely is the right decision.We believe that a better course of action is to set a portfolio mix to meet future goals, while attempting to ignore short term market fluctuations in favor of a longer-term view.
For information about how the portfolio performed during the reporting period, as well as market perspectives, we have provided a Discussion of Performance given by the portfolio manager.
Thank you for your continued confidence and support.We wish you good health and prosperity in 2007.

Thomas F. Eggers
Chief Executive Officer
The Dreyfus Corporation
January 16, 2007
|

DISCUSSION OF PERFORMANCE
Dwight Cowden, Portfolio Manager
How did Dreyfus Variable Investment Fund, Small Company Stock Portfolio perform relative to its benchmark?
For the 12-month period ended December 31, 2006, the portfolio produced total returns of 10.97% for its Initial shares and 10.95% for its Service shares.1This compares with a total return of 15.12% for the portfolio’s benchmark, the S&P SmallCap 600 Index, for the same period.2
Robust corporate earnings helped drive stock prices higher in 2006, especially over the second half of the year. Small-cap stocks generally outperformed midcap stocks and roughly matched the performance of their large-cap counterparts.The portfolio participated in the small-cap market’s gains, deriving relatively strong returns from the consumer discretionary, technology and telecommunications sectors. However, relatively weak performance in the health care, consumer staples and financials sectors caused the portfolio’s returns to lag the benchmark.
What is the portfolio’s investment approach?
The portfolio seeks capital appreciation.To pursue this goal, the portfolio normally invests at least 80% of its assets in the stocks of small-capitalization companies. We may continue to hold the securities of companies as their market capitalization grows. Stocks are chosen through a disciplined investment process that combines computer modeling techniques, fundamental analysis and risk management. We attempt to manage risk by diversifying across companies and industries, limiting the potential adverse impact from any one stock or industry. The portfolio is structured so that its sector weightings and risk characteristics, such as growth, size and yield, are generally similar to those of the S&P SmallCap 600 Index.
What other factors influenced the portfolio’s performance?
Resurgent energy prices, rising short-term interest rates and fears of higher inflation limited the stock market’s advance during the first half of 2006. Over the summer and fall, however, investors first anticipated and then responded positively to the Federal Reserve Board’s decision to hold short-term interest rates steady at 5.25%, its first pauses after
The Portfolio 3
DISCUSSION OF PERFORMANCE (continued)
|
more than two years of rate hikes. Investors’ improving inflation and interest rate expectations, as well as anticipation of an economic “soft landing,”helped drive stock prices higher over the remainder of the year.
These market conditions proved to be challenging for disciplined investors, causing a substantial majority of small-cap mutual funds to lag behind their benchmarks. Nevertheless, the portfolio generated relatively strong returns in the consumer discretionary sector, bolstered by good individual stock selections among retailers. Robust same store sales growth drove gains in holdings such as Coldwater Creek, GameStop and Dick’s Sporting Goods, while The Children’s Place Retail Stores, owned by the fund, led a successful turnaround with its Disney Store operations. GameStop and Dick’s Sporting Goods were sold during the reporting period. Within the media industry, cable television and broadband services provider Charter Communications built investor confidence with its focus on improving operations and improving its balance sheet.
Investments in technology and telecommunications companies also bolstered relative returns, though to a lesser degree. In the technology sector, the portfolio’s performance was augmented by a diverse group of holdings, such as semiconductor device and equipment makers Varian Semiconductor Equipment Associates and Atheros Communications, which was sold during the reporting period; software developers Digital River and Digitas, which were also sold during the reporting period; and communications technology suppliers Polycom and Sonus Networks. In the telecommunications area, the portfolio’s gains were primarily driven by its holdings of SBA Communications, which rose on the strength of cellular subscriber growth and accretive acquisitions.
On the other hand, the portfolio’s performance was most severely constrained by weak individual stock selections in the health care sector, particularly in the biotechnology industry. For example, shares of DOV Pharmaceutical, which were sold during the reporting period, declined when a drug under development faltered during clinical trials; Syneron Medical was hurt by disappointing unit sales of its aesthetic medical equipment; and Panacos Pharmaceuticals, which was also sold during the reporting period, lost ground following its announcement of delays in bringing a key drug to market.
The portfolio’s relative returns were further undermined by disappointing results in the consumer staples and financials sectors.Within the con-
sumer staples sector, most of the portfolio’s underperformance resulted from unfortunate timing of an investment in beverage maker Hansen Natural, which sold off sharply following the portfolio’s purchase as the company’s growth outlook faded. Among financial stocks, relative performance suffered due to the portfolio’s emphasis on lodging-related real estate investment trusts (REITs) at a time when the market favored office and entertainment-related REITs.
What is the portfolio’s current strategy?
Current forecasts for slowing but continued U.S. economic growth give us confidence regarding the market’s prospects for the coming year. In particular, we have focused on what, in our view, are several promising secular investment themes, including healthy living, consolidating industries, internet growth beneficiaries and aging demographics. In general, our sector-neutral strategy remains intact. However, we have adopted a mildly underweighted position in the energy sector, primarily due to inventory buildup and slack weather-related demand. On the other hand, we have allocated a slightly greater proportion of assets than the benchmark to the technology sector, where we have found what we consider to be a number of attractively priced stocks in the wake of the sector’s relatively weak 2006 performance.
| | | The portfolio is only available as a funding vehicle under various life insurance policies or variable |
| | | annuity contracts issued by insurance companies. Individuals may not purchase shares of the |
| | | portfolio directly. A variable annuity is an insurance contract issued by an insurance company that |
| | | enables investors to accumulate assets on a tax-deferred basis for retirement or other long-term |
| | | goals.The investment objective and policies of Dreyfus Variable Investment Fund, Small Company |
| | | Stock Portfolio made available through insurance products may be similar to other funds/portfolios |
| | | managed or advised by Dreyfus. However, the investment results of the portfolio may be higher or |
| | | lower than, and may not be comparable to, those of any other Dreyfus fund/portfolio. |
| 1 | | Total return includes reinvestment of dividends and any capital gains paid. Past performance is no |
| | | guarantee of future results. Share price and investment return fluctuate such that upon redemption, |
| | | portfolio shares may be worth more or less than their original cost.The portfolio’s performance does |
| | | not reflect the deduction of additional charges and expenses imposed in connection with investing |
| | | in variable insurance contracts, which will reduce returns. Return figures provided reflect the |
| | | absorption of certain portfolio expenses by The Dreyfus Corporation pursuant to an agreement in |
| | | effect through December 31, 2007, at which time it may be extended, terminated or modified. |
| | | Had these expenses not been absorbed, the portfolio’s returns would have been lower. |
| 2 | | SOURCE: LIPPER INC. — Reflects reinvestment of dividends and, where applicable, |
| | | capital gain distributions.The Standard & Poor’s SmallCap 600 Index is a widely accepted, |
| | | unmanaged index of small-cap stock market performance. |
The Portfolio 5

| Average Annual Total Returns as of | | 12/31/06 | | | | |
| |
| | | 1 Year | | 5 Years | | 10 Years |
| |
| |
| |
|
| Initial shares | | 10.97% | | 8.78% | | 7.50% |
| Service shares | | 10.95% | | 8.58% | | 7.37% |
| |
| The data for Service shares includes the results of Initial shares for the period prior to December 31, 2000 |
| (inception date of Service shares). Actual Service shares’ average annual total return and hypothetical growth |
| results would have been lower. See notes below. | | | | | | |
| † Source: Lipper Inc. | | | | | | |
| Past performance is not predictive of future performance.The portfolio’s performance shown in the graph and table does not |
| reflect the deduction of taxes that a shareholder would pay on portfolio distributions or the redemption of portfolio shares. |
| The portfolio’s performance does not reflect the deduction of additional charges and expenses imposed in |
| connection with investing in variable insurance contracts which will reduce returns. | | |
| The above graph compares a $10,000 investment made in Initial and Service shares of Dreyfus Variable Investment |
| Fund, Small Company Stock Portfolio on 12/31/96 to a $10,000 investment made in the Standard & Poor’s |
| SmallCap 600 Index (the “Index”) on that date. | | | | | | |
6
The portfolio’s Initial shares are not subject to a Rule 12b-1 fee.The portfolio’s Service shares are subject to a 0.25% annual Rule 12b-1 fee.The performance figures for Service shares reflect the performance of the portfolio’s Initial shares from their inception date through December 30, 2000, and the performance of the portfolio’s Service shares from December 31, 2000 (inception date of Service shares) to December 31, 2006 (blended performance figures).The blended performance figures have not been adjusted to reflect the higher operating expenses of the Service shares. If these expenses had been reflected, the blended performance figures would have been lower. All dividends and capital gain distributions are reinvested.
The portfolio’s performance shown in the line graph takes into account all applicable portfolio fees and expenses.The Index is a widely accepted, unmanaged index of small-cap stock market performance.The Index does not take into account charges, fees and other expenses. Further information relating to portfolio performance, including expense reimbursements, if applicable, is contained in the Financial Highlights section of the prospectus and elsewhere in this report.
The Portfolio 7
UNDERSTANDING YOUR
PORTFOLIO’S EXPENSES (Unaudited)
As a mutual fund investor,you pay ongoing expenses,such as management fees and other expenses.Using the information below,you can estimate how these expenses affect your investment and compare them with the expenses of other funds.You also may pay one-time transaction expenses, including sales charges (loads) and redemption fees, which are not shown in this section and would have resulted in higher total expenses. For more information, see your portfolio’s prospectus or talk to your financial adviser.
Review your portfolio’s expenses
|
The table below shows the expenses you would have paid on a $1,000 investment in Dreyfus Variable Investment Fund, Small Company Stock Portfolio from July 1, 2006 to December 31, 2006. It also shows how much a $1,000 investment would be worth at the close of the period, assuming actual returns and expenses.
| Expenses and Value of a $1,000 Investment | | |
| assuming actual returns for the six months ended December 31, 2006 |
| | | Initial Shares | | Service Shares |
| |
| |
|
| Expenses paid per $1,000 † | | $ 4.71 | | $ 4.87 |
| Ending value (after expenses) | | $1,031.90 | | $1,031.80 |
COMPARING YOUR PORTFOLIO’S EXPENSES WITH THOSE OF OTHER FUNDS (Unaudited)
Using the SEC’s method to compare expenses
The Securities and Exchange Commission (SEC) has established guidelines to help investors assess fund expenses. Per these guidelines, the table below shows your portfolio’s expenses based on a $1,000 investment, assuming a hypothetical 5% annualized return. You can use this information to compare the ongoing expenses (but not transaction expenses or total cost) of investing in the portfolio with those of other funds. All mutual fund shareholder reports will provide this information to help you make this comparison. Please note that you cannot use this information to estimate your actual ending account balance and expenses paid during the period.
Expenses and Value of a $1,000 Investment assuming a hypothetical 5% annualized return for the six months ended December 31, 2006
| | | Initial Shares | | Service Shares |
| |
| |
|
| Expenses paid per $1,000 † | | $ 4.69 | | $ 4.84 |
| Ending value (after expenses) | | $1,020.57 | | $1,020.42 |
† Expenses are equal to the portfolio's annualized expense ratio of .92% for Initial shares and .95% for Service shares, multiplied by the average account value over the period, multiplied by 184/365 (to reflect the one-half year period).
STATEMENT OF INVESTMENTS
December 31, 2006
|
| Common Stocks—98.2% | | Shares | | | | Value ($) |
| |
| |
| |
|
| Consumer Discretionary—17.1% | | | | | | |
| bebe Stores | | 26,700 | | a | | 528,393 |
| Charter Communications, Cl. A | | 103,100 | | a,b | | 315,486 |
| Children’s Place Retail Stores | | 6,000 | | b | | 381,120 |
| Coldwater Creek | | 24,785 | | b | | 607,728 |
| Domino’s Pizza | | 13,100 | | | | 366,800 |
| Focus Media Holding, ADR | | 4,200 | | b | | 278,838 |
| Lear | | 12,500 | | a,b | | 369,125 |
| Life Time Fitness | | 8,600 | | b | | 417,186 |
| Live Nation | | 14,900 | | b | | 333,760 |
| Meritage Homes | | 6,800 | | b | | 324,496 |
| NutriSystem | | 3,100 | | a,b | | 196,509 |
| PEP Boys-Manny Moe & Jack | | 30,500 | | a | | 453,230 |
| Phillips-Van Heusen | | 4,000 | | | | 200,680 |
| Scientific Games, Cl. A | | 10,700 | | b | | 323,461 |
| Shuffle Master | | 10,200 | | a,b | | 267,240 |
| Sonic Automotive | | 16,800 | | | | 487,872 |
| Sotheby’s, Cl. A | | 13,600 | | | | 421,872 |
| Standard Pacific | | 8,800 | | | | 235,752 |
| Tween Brands | | 5,300 | | b | | 211,629 |
| Vail Resorts | | 10,600 | | a,b | | 475,092 |
| | | | | | | 7,196,269 |
| Consumer Staples—2.2% | | | | | | |
| Flowers Foods | | 3,900 | | | | 105,261 |
| Hain Celestial Group | | 2,800 | | b | | 87,388 |
| Jones Soda | | 21,600 | | a,b | | 265,680 |
| Performance Food Group | | 9,280 | | b | | 256,499 |
| Sanderson Farms | | 6,600 | | a | | 199,914 |
| | | | | | | 914,742 |
| Energy—6.0% | | | | | | |
| Cabot Oil & Gas | | 4,200 | | | | 254,730 |
| Cimarex Energy | | 7,240 | | | | 264,260 |
| Forest Oil | | 5,900 | | b | | 192,812 |
| Helix Energy Solutions Group | | 5,840 | | b | | 183,201 |
The Portfolio 9
STATEMENT OF INVESTMENTS (continued)
|
| Common Stocks (continued) | | Shares | | Value ($) |
| |
| |
|
| Energy (continued) | | | | |
| Input/Output | | 23,800 a,b | | 324,394 |
| Lone Star Technologies | | 4,100 b | | 198,481 |
| Massey Energy | | 7,600 a | | 176,548 |
| Oceaneering International | | 4,200 b | | 166,740 |
| St. Mary Land & Exploration | | 9,530 | | 351,085 |
| Tetra Technologies | | 5,100 b | | 130,458 |
| Unit | | 3,610 b | | 174,905 |
| W-H Energy Services | | 2,500 b | | 121,725 |
| | | | | 2,539,339 |
| Financial—15.5% | | | | |
| Annaly Capital Management | | 21,800 | | 303,238 |
| Apollo Investment | | 18,820 | | 421,576 |
| Aspen Insurance Holdings | | 7,800 | | 205,608 |
| Corus Bankshares | | 13,300 a | | 306,831 |
| Cullen/Frost Bankers | | 4,220 | | 235,560 |
| Downey Financial | | 5,700 | | 413,706 |
| FelCor Lodging Trust | | 10,220 | | 223,205 |
| First BanCorp/Puerto Rico | | 32,400 | | 308,772 |
| First Midwest Bancorp/IL | | 5,440 | | 210,419 |
| FirstFed Financial | | 8,100 a,b | | 542,457 |
| Innkeepers USA Trust | | 24,700 | | 382,850 |
| International Securities Exchange | | | | |
| Holdings, Cl. A | | 5,400 | | 252,666 |
| Investment Technology Group | | 3,600 b | | 154,368 |
| Kilroy Realty | | 2,600 | | 202,800 |
| Luminent Mortgage Capital | | 28,200 | | 273,822 |
| Ohio Casualty | | 7,000 | | 208,670 |
| Philadelphia Consolidated Holding | | 10,110 b | | 450,502 |
| SVB Financial Group | | 4,090 b | | 190,676 |
| U-Store-It Trust | | 9,780 | | 200,979 |
| Umpqua Holdings | | 13,900 | | 409,077 |
| Whitney Holding | | 4,470 | | 145,811 |
| Wintrust Financial | | 3,470 | | 166,629 |
| Zenith National Insurance | | 7,200 | | 337,752 |
| | | | | 6,547,974 |
| Common Stocks (continued) | | Shares | | | | Value ($) |
| |
| |
| |
|
| Health Care—11.9% | | | | | | |
| AMERIGROUP | | 4,100 | | b | | 147,149 |
| AMN Healthcare Services | | 16,500 | | a,b | | 454,410 |
| Cerner | | 3,260 | | a,b | | 148,330 |
| Cooper Cos. | | 6,990 | | | | 311,055 |
| Cytyc | | 12,200 | | b | | 345,260 |
| Five Star Quality Care | | 31,200 | | a,b | | 347,880 |
| Hologic | | 3,900 | | b | | 184,392 |
| IDEXX Laboratories | | 2,200 | | b | | 174,460 |
| Immucor | | 5,000 | | b | | 146,150 |
| Merit Medical Systems | | 1 | | b | | 16 |
| Par Pharmaceutical Cos. | | 19,700 | | b | | 440,689 |
| PDL BioPharma | | 14,600 | | a,b | | 294,044 |
| Pediatrix Medical Group | | 3,500 | | b | | 171,150 |
| Psychiatric Solutions | | 14,920 | | b | | 559,798 |
| Regeneron Pharmaceuticals | | 4,500 | | b | | 90,315 |
| Respironics | | 15,560 | | b | | 587,390 |
| Sirona Dental Systems | | 8,600 | | | | 331,186 |
| Syneron Medical | | 10,600 | | b | | 287,578 |
| | | | | | | 5,021,252 |
| Industrial—14.8% | | | | | | |
| AGCO | | 11,400 | | b | | 352,716 |
| Armor Holdings | | 11,660 | | a,b | | 639,551 |
| Continental Airlines, Cl. B | | 7,400 | | a,b | | 305,250 |
| Corrections Corp. of America | | 17,600 | | b | | 796,048 |
| DRS Technologies | | 3,900 | | | | 205,452 |
| ESCO Technologies | | 4,500 | | | | 204,480 |
| General Cable | | 4,700 | | b | | 205,437 |
| Hexcel | | 9,900 | | a,b | | 172,359 |
| IDEX | | 3,800 | | | | 180,158 |
| Kansas City Southern | | 5,860 | | b | | 169,823 |
| Landstar System | | 4,470 | | | | 170,665 |
| Manitowoc | | 6,100 | | | | 362,523 |
| Pacer International | | 11,530 | | | | 343,248 |
| Quanta Services | | 16,980 | | a,b | | 333,997 |
The Portfolio 11
STATEMENT OF INVESTMENTS (continued)
|
| Common Stocks (continued) | | Shares | | Value ($) |
| |
| |
|
| Industrial (continued) | | | | |
| Shaw Group | | 14,100 b | | 472,350 |
| Teledyne Technologies | | 9,100 b | | 365,183 |
| URS | | 7,590 b | | 325,232 |
| Wabtec | | 11,000 | | 334,180 |
| Watsco | | 3,390 | | 159,872 |
| Watson Wyatt Worldwide, Cl. A | | 3,100 | | 139,965 |
| | | | | 6,238,489 |
| Information Technology—17.5% | | | | |
| ANSYS | | 5,500 b | | 239,195 |
| Avocent | | 8,500 b | | 287,725 |
| Axcelis Technologies | | 48,080 b | | 280,306 |
| BearingPoint | | 24,600 a,b | | 193,602 |
| Benchmark Electronics | | 12,800 b | | 311,808 |
| CommScope | | 12,240 a,b | | 373,075 |
| ECI Telecommunications | | 35,700 b | | 309,162 |
| Electronics for Imaging | | 17,390 b | | 462,226 |
| FactSet Research Systems | | 2,715 | | 153,343 |
| FLIR Systems | | 15,100 a,b | | 480,633 |
| Gevity HR | | 7,600 a | | 180,044 |
| Itron | | 5,800 a,b | | 300,672 |
| j2 Global Communications | | 7,900 a,b | | 215,275 |
| L-1 Identity Solutions | | 12,200 a,b | | 184,586 |
| ManTech International, Cl. A | | 6,900 a,b | | 254,127 |
| Micros Systems | | 2,570 b | | 135,439 |
| Microsemi | | 4,820 b | | 94,713 |
| Napster | | 94,200 b | | 341,946 |
| Nuance Communications | | 17,800 a,b | | 203,988 |
| Polycom | | 10,500 b | | 324,555 |
| Rackable Systems | | 5,900 a,b | | 182,723 |
| S1 | | 36,919 b | | 203,424 |
| Sonus Networks | | 77,500 a,b | | 510,725 |
| Trimble Navigation | | 4,400 b | | 223,212 |
| ValueClick | | 12,100 b | | 285,923 |
| Common Stocks (continued) | | Shares | | Value ($) |
| |
| |
|
| Information Technology (continued) | | | | |
| Varian Semiconductor | | | | |
| Equipment Associates | | 13,965 b | | 635,687 |
| | | | | 7,368,114 |
| Materials—6.7% | | | | |
| AK Steel Holding | | 22,900 b | | 387,010 |
| Carpenter Technology | | 1,900 | | 194,788 |
| Cleveland-Cliffs | | 2,820 a | | 136,601 |
| Compass Minerals International | | 7,600 | | 239,856 |
| Nalco Holding | | 24,800 b | | 507,408 |
| RTI International Metals | | 6,300 a,b | | 492,786 |
| Terra Industries | | 49,000 a,b | | 587,020 |
| Texas Industries | | 4,100 a | | 263,343 |
| | | | | 2,808,812 |
| Telecommunication Services—2.0% | | | | |
| Alaska Communications | | | | |
| Systems Group | | 20,140 a | | 305,927 |
| SBA Communications, Cl. A | | 20,100 b | | 552,750 |
| | | | | 858,677 |
| Utilities—4.5% | | | | |
| Dynegy, Cl. A | | 50,500 b | | 365,620 |
| Energen | | 5,830 | | 273,660 |
| New Jersey Resources | | 6,000 | | 291,480 |
| OGE Energy | | 7,980 | | 319,200 |
| UGI | | 23,400 | | 638,352 |
| | | | | 1,888,312 |
| Total Common Stocks | | | | |
| (cost $35,858,117) | | | | 41,381,980 |
| |
| |
|
| |
| Other Investment—2.1% | | | | |
| |
| |
|
| Registered Investment Company; | | | | |
| Dreyfus Institutional Preferred | | | | |
| Plus Money Market Fund | | | | |
| (cost $894,000) | | 894,000 c | | 894,000 |
The Portfolio 13
STATEMENT OF INVESTMENTS (continued)
|
| Investment of Cash Collateral | | | | |
| for Securities Loaned—23.5% | | Shares | | Value ($) |
| |
| |
|
| Registered Investment Company; | | | | |
| Dreyfus Institutional Cash | | | | | | |
| Advantage Plus Fund | | | | | | |
| (cost $9,883,467) | | | | 9,883,467 c | | 9,883,467 |
| |
| |
| |
|
| |
| Total Investments (cost $46,635,584) | | 123.8% | | 52,159,447 |
| |
| Liabilities, Less Cash and Receivables | | (23.8%) | | (10,026,430) |
| |
| Net Assets | | | | 100.0% | | 42,133,017 |
| |
| ADR—American Depository Receipts | | | | |
| a | | All or a portion of these securities are on loan. At December 31, 2006, the total market value of the portfolio’s |
| | | securities on loan is $9,653,936 and the total market value of the collateral held by the portfolio is $10,245,099, |
| | | consisting of $9,883,467 of cash collateral and U.S. Government and agency securities valued at $361,632. |
| b | | Non-income producing security. | | | | |
| c | | Investment in affiliated money market mutual fund. | | | | |
| |
| |
| |
|
| |
| |
| |
| |
| Portfolio Summary (Unaudited) † | | | | |
| |
| | | | | Value (%) | | | | Value (%) |
| |
| |
| |
| |
|
| Money Market Investments | | 25.6 | | Materials | | 6.7 |
| Information Technology | | 17.5 | | Energy | | 6.0 |
| Consumer Discretionary | | 17.1 | | Utilities | | 4.5 |
| Financial | | 15.5 | | Consumer Staples | | 2.2 |
| Industrial | | 14.8 | | Telecommunication Services | | 2.0 |
| Health Care | | 11.9 | | | | 123.8 |
| |
| † | | Based on net assets. | | | | | | |
| See notes to financial statements. | | | | | | |
STATEMENT OF ASSETS AND LIABILITIES
December 31, 2006
|
| | | Cost | | Value |
| |
| |
|
| Assets ($): | | | | |
| Investments in securities—See Statement of | | |
| Investments (including securities on loan, | | |
| valued at $9,653,936)—Note 1(b): | | |
| Unaffiliated issuers | | 35,858,117 | | 41,381,980 |
| Affiliated issuers | | 10,777,467 | | 10,777,467 |
| Cash | | | | 4,833 |
| Dividends and interest receivable | | | | 52,494 |
| Prepaid expenses | | | | 3,232 |
| | | | | 52,220,006 |
| |
| |
|
| Liabilities ($): | | | | |
| Due to The Dreyfus Corporation and affiliates—Note 3(b) | | 34,905 |
| Liability for securities on loan—Note 1(b) | | 9,883,467 |
| Payable for investment securities purchased | | 106,468 |
| Payable for shares of Beneficial Interest redeemed | | 4,189 |
| Interest payable—Note 2 | | | | 19 |
| Accrued expenses | | | | 57,941 |
| | | | | 10,086,989 |
| |
| |
|
| Net Assets ($) | | | | 42,133,017 |
| |
| |
|
| Composition of Net Assets ($): | | | | |
| Paid-in capital | | | | 30,966,016 |
| Accumulated undistributed investment income—net | | 7,790 |
| Accumulated net realized gain (loss) on investments | | 5,635,348 |
| Accumulated net unrealized appreciation | | |
| (depreciation) on investments | | | | 5,523,863 |
| |
| |
|
| Net Assets ($) | | | | 42,133,017 |
| |
| |
|
| |
| |
| Net Asset Value Per Share | | | | |
| | | Initial Shares | | Service Shares |
| |
| |
|
| Net Assets ($) | | 36,170,322 | | 5,962,695 |
| Shares Outstanding | | 1,693,607 | | 282,778 |
| |
| |
|
| Net Asset Value Per Share ($) | | 21.36 | | 21.09 |
See notes to financial statements.
|
The Portfolio 15
STATEMENT OF OPERATIONS
Year Ended December 31, 2006
|
| Investment Income ($): | | |
| Income: | | |
| Cash dividends (net of $531 foreign taxes withheld at source): | | |
| Unaffiliated issuers | | 301,452 |
| Affiliated issuers | | 44,930 |
| Income from securities lending | | 34,495 |
| Interest | | 6,398 |
| Total Income | | 387,275 |
| Expenses: | | |
| Investment advisory fee—Note 3(a) | | 334,655 |
| Auditing fees | | 32,511 |
| Prospectus and shareholders’ reports | | 27,947 |
| Custodian fees—Note 3(b) | | 20,917 |
| Distribution fees—Note 3(b) | | 14,722 |
| Trustees’ fees and expenses—Note 3(c) | | 5,070 |
| Shareholder servicing costs—Note 3(b) | | 1,549 |
| Legal fees | | 1,314 |
| Loan commitment fees—Note 2 | | 349 |
| Interest expense—Note 2 | | 272 |
| Miscellaneous | | 8,618 |
| Total Expenses | | 447,924 |
| Less—waiver of fees due to undertaking—Note 3(a) | | (34,557) |
| Net Expenses | | 413,367 |
| Investment (Loss)—Net | | (26,092) |
| |
|
| Realized and Unrealized Gain (Loss) on Investments—Note 4 ($): |
| Net realized gain (loss) on investments | | 5,764,530 |
| Net unrealized appreciation (depreciation) on investments | | (1,021,064) |
| Net Realized and Unrealized Gain (Loss) on Investments | | 4,743,466 |
| Net Increase in Net Assets Resulting from Operations | | 4,717,374 |
See notes to financial statements.
|
STATEMENT OF CHANGES IN NET ASSETS
| | | Year Ended December 31, |
| |
|
| | | 2006 | | 2005 |
| |
| |
|
| Operations ($): | | | | |
| Investment (loss)—net | | (26,092) | | (22,216) |
| Net realized gain (loss) on investments | | 5,764,530 | | 5,572,770 |
| Net unrealized appreciation | | | | |
| (depreciation) on investments | | (1,021,064) | | (5,095,828) |
| Net Increase (Decrease) in Net Assets | | | | |
| Resulting from Operations | | 4,717,374 | | 454,726 |
| |
| |
|
| Dividends to Shareholders from ($): | | | | |
| Net realized gain on investments: | | | | |
| Initial shares | | (4,889,034) | | (1,889,620) |
| Service shares | | (716,009) | | (300,690) |
| Total Dividends | | (5,605,043) | | (2,190,310) |
| |
| |
|
| Beneficial Interest Transactions ($): | | | | |
| Net proceeds from shares sold: | | | | |
| Initial shares | | 6,379,522 | | 5,992,695 |
| Service shares | | 1,471,157 | | 1,085,909 |
| Dividends reinvested: | | | | |
| Initial shares | | 4,889,034 | | 1,889,620 |
| Service shares | | 716,009 | | 300,690 |
| Cost of shares redeemed: | | | | |
| Initial shares | | (13,370,744) | | (8,889,197) |
| Service shares | | (2,074,344) | | (2,046,928) |
| Increase (Decrease) in Net Assets from | | | | |
| Beneficial Interest Transactions | | (1,989,366) | | (1,667,211) |
| Total Increase (Decrease) in Net Assets | | (2,877,035) | | (3,402,795) |
| |
| |
|
| Net Assets ($): | | | | |
| Beginning of Period | | 45,010,052 | | 48,412,847 |
| End of Period | | 42,133,017 | | 45,010,052 |
| Undistributed investment income—net | | 7,790 | | 18,019 |
The Portfolio 17
STATEMENT OF CHANGES IN NET ASSETS (continued)
|
| | | Year Ended December 31, |
| |
|
| | | 2006 | | 2005 |
| |
| |
|
| Capital Share Transactions: | | | | |
| Initial Shares | | | | |
| Shares sold | | 303,362 | | 285,421 |
| Shares issued for dividends reinvested | | 226,764 | | 90,585 |
| Shares redeemed | | (630,933) | | (414,716) |
| Net Increase (Decrease) in Shares Outstanding | | (100,807) | | (38,710) |
| |
| |
|
| Service Shares | | | | |
| Shares sold | | 70,173 | | 52,466 |
| Shares issued for dividends reinvested | | 33,631 | | 14,561 |
| Shares redeemed | | (97,554) | | (96,856) |
| Net Increase (Decrease) in Shares Outstanding | | 6,250 | | (29,829) |
See notes to financial statements.
|
The following tables describe the performance for each share class for the fiscal periods indicated.All information (except portfolio turnover rate) reflects financial results for a single portfolio share. Total return shows how much your investment in the portfolio would have increased (or decreased) during each period, assuming you had reinvested all dividends and distributions.These figures have been derived from the portfolio’s financial statements.
| | | | | | | Year Ended December 31, | | |
| | | |
| |
| |
|
| Initial Shares | | 2006 | | 2005 | | 2004 | | 2003 | | 2002 |
| |
| |
| |
| |
| |
|
| Per Share Data ($): | | | | | | | | | | |
| Net asset value, beginning of period | | 21.77 | | 22.66 | | 20.34 | | 14.25 | | 17.79 |
| Investment Operations: | | | | | | | | | | |
| Investment income (loss)—net a | | (.01) | | (.01) | | .00b | | (.01) | | .05 |
| Net realized and unrealized | | | | | | | | | | |
| gain (loss) on investments | | 2.42 | | .17 | | 3.76 | | 6.12 | | (3.55) |
| Total from Investment Operations | | 2.41 | | .16 | | 3.76 | | 6.11 | | (3.50) |
| Distributions: | | | | | | | | | | |
| Dividends from investment income—net | | — | | — | | — | | (.02) | | (.04) |
| Dividends from net realized | | | | | | | | | | |
| gain on investments | | (2.82) | | (1.05) | | (1.44) | | — | | — |
| Total Distributions | | (2.82) | | (1.05) | | (1.44) | | (.02) | | (.04) |
| Net asset value, end of period | | 21.36 | | 21.77 | | 22.66 | | 20.34 | | 14.25 |
| |
| |
| |
| |
| |
|
| Total Return (%) | | 10.97 | | .91 | | 18.52 | | 42.94 | | (19.71) |
| |
| |
| |
| |
| |
|
| Ratios/Supplemental Data (%): | | | | | | | | | | |
| Ratio of total expenses | | | | | | | | | | |
| to average net assets | | .97 | | .99 | | .95 | | 1.12 | | .98 |
| Ratio of net expenses | | | | | | | | | | |
| to average net assets | | .92 | | .98 | | .95 | | 1.12 | | .98 |
| Ratio of net investment income | | | | | | | | | | |
| (loss) to average net assets | | (.05) | | (.03) | | .00c | | (.09) | | .28 |
| Portfolio Turnover Rate | | 124.91 | | 157.60 | | 112.27 | | 171.34 | | 71.76 |
| |
| |
| |
| |
| |
|
| Net Assets, end of period ($ x 1,000) | | 36,170 | | 39,057 | | 41,534 | | 36,200 | | 25,458 |
| |
| a | | Based on average shares outstanding at each month end. | | | | | | | | |
| b | | Amount represents less than $.01 per share. | | | | | | | | |
| c | | Amount represents less than .01%. | | | | | | | | | | |
| See notes to financial statements. | | | | | | | | | | |
The Portfolio 19
FINANCIAL HIGHLIGHTS (continued)
|
| | | | | | | Year Ended December 31, | | |
| | | |
| |
| |
|
| Service Shares | | 2006 | | 2005 | | 2004 | | 2003 | | 2002 |
| |
| |
| |
| |
| |
|
| Per Share Data ($): | | | | | | | | | | |
| Net asset value, beginning of period | | 21.53 | | 22.45 | | 20.22 | | 14.20 | | 17.73 |
| Investment Operations: | | | | | | | | | | |
| Investment income (loss)—net a | | (.02) | | (.04) | | (.05) | | (.06) | | .01 |
| Net realized and unrealized | | | | | | | | | | |
| gain (loss) on investments | | 2.40 | | .17 | | 3.72 | | 6.10 | | (3.54) |
| Total from Investment Operations | | 2.38 | | .13 | | 3.67 | | 6.04 | | (3.53) |
| Distributions: | | | | | | | | | | |
| Dividends from investment income—net | | — | | — | | — | | (.02) | | (.00)b |
| Dividends from net realized | | | | | | | | | | |
| gain on investments | | (2.82) | | (1.05) | | (1.44) | | — | | — |
| Total Distributions | | (2.82) | | (1.05) | | (1.44) | | (.02) | | (.00)b |
| Net asset value, end of period | | 21.09 | | 21.53 | | 22.45 | | 20.22 | | 14.20 |
| |
| |
| |
| |
| |
|
| Total Return (%) | | 10.95 | | .77 | | 18.18 | | 42.60 | | (19.89) |
| |
| |
| |
| |
| |
|
| Ratios/Supplemental Data (%): | | | | | | | | | | |
| Ratio of total expenses | | | | | | | | | | |
| to average net assets | | 1.22 | | 1.25 | | 1.20 | | 1.37 | | 1.22 |
| Ratio of net expenses | | | | | | | | | | |
| to average net assets | | .95 | | 1.14 | | 1.20 | | 1.37 | | 1.22 |
| Ratio of net investment income | | | | | | | | | | |
| (loss) to average net assets | | (.08) | | (.19) | | (.25) | | (.34) | | .04 |
| Portfolio Turnover Rate | | 124.91 | | 157.60 | | 112.27 | | 171.34 | | 71.76 |
| |
| |
| |
| |
| |
|
| Net Assets, end of period ($ x 1,000) | | 5,963 | | 5,953 | | 6,879 | | 5,559 | | 3,117 |
| |
| a | | Based on average shares outstanding at each month end. | | | | | | | | |
| b | | Amount represents less than $.01 per share. | | | | | | | | |
| See notes to financial statements. | | | | | | | | | | |
NOTES TO FINANCIAL STATEMENTS
NOTE 1—Significant Accounting Policies:
Dreyfus Variable Investment Fund (the “fund”) is registered under the Investment Company Act of 1940, as amended (the “Act”), as an open-end management investment company, operating as a series company currently offering twelve series, including the Small Company Stock Portfolio (the “portfolio”). The portfolio is only offered to separate accounts established by insurance companies to fund variable annuity contracts and variable life insurance policies.The portfolio is a diversified series.The portfolio’s investment objective is to provide capital appreci-ation.The Dreyfus Corporation (the “Manager” or “Dreyfus”) serves as the portfolio’s investment adviser.The Manager is a wholly-owned subsidiary of Mellon Financial Corporation (“Mellon Financial”).
On December 4, 2006, Mellon Financial and The Bank of New York Company, Inc. announced that they had entered into a definitive agreement to merge. The new company will be called The Bank of New York Mellon Corporation. As part of this transaction, Dreyfus would become a wholly-owned subsidiary of The Bank of New York Mellon Corporation.The transaction is subject to certain regulatory approvals and the approval of The Bank of New York Company, Inc.’s and Mellon Financial’s shareholders, as well as other customary conditions to closing. Subject to such approvals and the satisfaction of the other conditions, Mellon Financial and The Bank of New York Company, Inc. expect the transaction to be completed in the third quarter of 2007.
Dreyfus Service Corporation (the “Distributor”), a wholly-owned subsidiary of the Manager, is the distributor of the portfolio’s shares, which are sold without a sales charge.The portfolio is authorized to issue an unlimited number of $.001 par value shares of Beneficial Interest in each of the following classes of shares: Initial and Service. Each class of shares has identical rights and privileges, except with respect to the distribution plan and the expenses borne by each class and certain voting rights. Income, expenses (other than expenses attributable to a specific class), and realized and unrealized gains or losses on investments are allocated to each class of shares based on its relative net assets.
The Portfolio 21
NOTES TO FINANCIAL STATEMENTS (continued)
|
The fund accounts separately for the assets, liabilities and operations of each series. Expenses directly attributable to each series are charged to that series’ operations; expenses which are applicable to all series are allocated among them on a pro rata basis.
The portfolio’s financial statements are prepared in accordance with U.S. generally accepted accounting principles, which may require the use of management estimates and assumptions. Actual results may differ from those estimates.
The fund enters into contracts that contain a variety of indemnifica-tions.The portfolio’s maximum exposure under these arrangements is unknown. The portfolio does not anticipate recognizing any loss related to these arrangements.
(a) Portfolio valuation: Investments in securities are valued at the last sales price on the securities exchange or national securities market on which such securities are primarily traded. Securities listed on the National Market System for which market quotations are available are valued at the official closing price or, if there is no official closing price that day, at the last sales price. Securities not listed on an exchange or the national securities market, or securities for which there were no transactions, are valued at the average of the most recent bid and asked prices, except for open short positions, where the asked price is used for valuation purposes. Bid price is used when no asked price is available. Registered open-end investment companies that are not traded on an exchange are valued at their net asset value.When market quotations or official closing prices are not readily available, or are determined not to reflect accurately fair value, such as when the value of a security has been significantly affected by events after the close of the exchange or market on which the security is principally traded (for example, a foreign exchange or market), but before the portfolio calculates its net asset value, the portfolio may value these investments at fair value as determined in accordance with the procedures approved by the Board of Trustees. Fair valuing of securities may be determined with the assistance of a pricing service using calculations based on indices of domestic securities and other appropriate indicators, such as
prices of relevant ADR’s and futures contracts. For other securities that are fair valued by the Board of Trustees, certain factors may be considered such as: fundamental analytical data, the nature and duration of restrictions on disposition, an evaluation of the forces that influence the market in which the securities are purchased and sold and public trading in similar securities of the issuer or comparable issuers. Financial futures are valued at the last sales price.
On September 20, 2006, the Financial Accounting Standards Board (FASB) released Statement of Financial Accounting Standards No. 157 “Fair Value Measurements” (“FAS 157”). FAS 157 establishes an authoritative definition of fair value, sets out a framework for measuring fair value, and requires additional disclosures about fair-value measurements. The application of FAS 157 is required for fiscal years beginning after November 15, 2007 and interim periods within those fiscal years. Management does not believe that the application of this standard will have a material impact on the financial statements of the portfolio.
(b) Securities transactions and investment income: Securities transactions are recorded on a trade date basis. Realized gain and loss from securities transactions are recorded on the identified cost basis. Dividend income is recognized on the ex-dividend date and interest income, including, where applicable, accretion of discount and amortization of premium on investments, is recognized on the accrual basis.
The portfolio has an arrangement with the custodian bank whereby the portfolio receives earnings credits from the custodian when positive cash balances are maintained, which are used to offset custody fees. For financial reporting purposes, the portfolio includes net earnings credits, if any, as an expense offset in the Statement of Operations.
Pursuant to a securities lending agreement with Mellon Bank, N.A., an affiliate of the Manager, the portfolio may lend securities to qualified institutions. It is the portfolio’s policy, that at origination, all loans are secured by collateral of at least 102% of the value of U.S. securities loaned and 105% of the value of foreign securities loaned. Collateral equivalent to at least 100% of the market value of securities on loan is
The Portfolio 23
NOTES TO FINANCIAL STATEMENTS (continued)
|
maintained at all times. Cash collateral is invested in certain money market mutual funds managed by the Manager.The portfolio is entitled to receive all income on securities loaned, in addition to income earned as a result of the lending transaction. Although each security loaned is fully collateralized, the portfolio bears the risk of delay in recovery of, or loss of rights in, the securities loaned should a borrower fail to return the securities in a timely manner.
(c) Affiliated issuers: Investments in other investment companies advised by the Manager are defined as “affiliated” in the Act.
(d) Dividends to shareholders: Dividends are recorded on the ex-dividend date. Dividends from investment income-net and dividends from net realized capital gain, if any, are normally declared and paid annually, but the portfolio may make distributions on a more frequent basis to comply with the distribution requirements of the Internal Revenue Code of 1986, as amended (the “Code”).To the extent that net realized capital gain can be offset by capital loss carryovers, if any, it is the policy of the portfolio not to distribute such gain. Income and capital gain distributions are determined in accordance with income tax regulations, which may differ from U.S. generally accepted accounting principles.
(e) Federal income taxes: It is the policy of the portfolio to continue to qualify as a regulated investment company, if such qualification is in the best interests of its shareholders, by complying with the applicable provisions of the Code, and to make distributions of taxable income sufficient to relieve it from substantially all federal income and excise taxes.
On July 13, 2006, the FASB released FASB Interpretation No. 48 “Accounting for Uncertainty in Income Taxes” (FIN 48). FIN 48 provides guidance for how uncertain tax positions should be recognized, measured, presented and disclosed in the financial statements. FIN 48 requires the evaluation of tax positions taken or expected to be taken in the course of preparing the portfolio’s tax returns to determine whether the tax positions are “more-likely-than-not” of being sustained by the applicable tax authority. Tax positions not deemed to
meet the more-likely-than-not threshold would be recorded as a tax benefit or expense in the current year.Adoption of FIN 48 is required for fiscal years beginning after December 15, 2006 and is to be applied to all open tax years as of the effective date. Management does not believe that the application of this standard will have a material impact on the financial statements of the portfolio.
At December 31, 2006, the components of accumulated earnings on a tax basis were as follows: undistributed ordinary income $1,426,352, undistributed capital gains $4,296,664 and unrealized appreciation $5,443,985.
The tax character of distributions paid to shareholders during the fiscal periods ended December 31, 2006 and December 31, 2005 were as follows: ordinary income $523,984 and $400,440 and long-term capital gains $5,081,059 and $1,789,870, respectively.
During the period ended December 31, 2006, as a result of permanent book to tax differences, primarily due to the tax treatment for net operating losses and real estate investment trusts, the portfolio increased accumulated undistributed investment income-net by $15,863 and decreased accumulated net realized gain (loss) on investments by the same amount. Net assets were not affected by this reclassification.
NOTE 2—Bank Line of Credit:
|
The portfolio participates with other Dreyfus-managed funds in a $350 million redemption credit facility (the “Facility”) to be utilized for temporary or emergency purposes, including the financing of redemptions. In connection therewith, the portfolio has agreed to pay commitment fees on its pro rata portion of the Facility. Interest is charged to the portfolio based on prevailing market rates in effect at the time of borrowing.
The average daily amount of borrowings outstanding under the Facility during the period ended December 31, 2006, was approximately $4,740 with a related weighted average annualized interest rate of 5.74% .
The Portfolio 25
NOTES TO FINANCIAL STATEMENTS (continued)
|
NOTE 3—Investment Advisory Fee and Other Transactions with Affiliates:
(a) Pursuant to an Investment Advisory Agreement with the Manager, the investment advisory fee is computed at the annual rate of .75% of the value of the portfolio’s average daily net assets and is payable monthly.
The Manager has agreed, from January 1, 2006 to December 31, 2007, to waive receipt of its fees and/or assume the expenses of the portfolio so that the expenses of neither class, exclusive of taxes, brokerage fees, interest on borrowings, commitment fees and extraordinary expenses, exceed an annual rate of .95% of the value of the average daily net assets of their class. During the period ended December 31, 2006, the Manager waived receipt of fees of $34,557, pursuant to the undertaking.
(b) Under the Distribution Plan (the “Plan”) adopted pursuant to Rule 12b-1 under the Act, Service shares pay the Distributor for distributing their shares, for servicing and/or maintaining Service shares shareholder accounts and for advertising and marketing for Service shares.The Plan provides for payments to be made at an annual rate of .25% of the value of the Service shares’ average daily net assets.The Distributor may make payments to Participating Insurance Companies and to brokers and dealers acting as principal underwriter for their variable insurance products.The fees payable under the Plan are payable without regard to actual expenses incurred. During the period ended December 31, 2006, Service shares were charged $14,722 pursuant to the Plan.
The portfolio compensates Dreyfus Transfer, Inc., a wholly-owned subsidiary of the Manager, under a transfer agency agreement for providing personnel and facilities to perform transfer agency services for the portfolio. During the period ended December 31, 2006, the portfolio was charged $364 pursuant to the transfer agency agreement.
The portfolio compensates Mellon Bank, N.A., an affiliate of the Manager, under a custody agreement for providing custodial services for the portfolio. During the period ended December 31, 2006, the portfolio was charged $20,917 pursuant to the custody agreement.
During the period ended December 31, 2006, the portfolio was charged $4,204 for services performed by the Chief Compliance Officer.
The components of Due to The Dreyfus Corporation and affiliates in the Statement of Assets and Liabilities consist of: investment advisory fees $27,247, Rule 12b-1 distribution plan fees $1,275, custodian fees $5,889, chief compliance officer fees $2,044 and transfer agency per account fees $52, which are offset against an expense reimbursement currently in effect in the amount of $1,602.
(c) Each Board member also serves as a Board member of other funds within the Dreyfus complex. Annual retainer fees and attendance fees are allocated to each fund based on net assets.
(d) Pursuant to an exemptive order from the SEC, the portfolio may invest its available cash balances in affiliated money market mutual funds. Management fees of the underlying money market mutual funds have been waived by the Manager.
NOTE 4—Securities Transactions:
The aggregate amount of purchases and sales of investment securities, excluding short-term securities, during the period ended December 31, 2006, amounted to $54,812,377, and $62,509,359, respectively.
At December 31, 2006, the cost of investments for federal income tax purposes was $46,715,462; accordingly, accumulated net unrealized appreciation on investments was $5,443,985, consisting of $6,387,412 gross unrealized appreciation and $943,427 gross unrealized depreciation.
The Portfolio 27
REPORT OF INDEPENDENT REGISTERED
PUBLIC ACCOUNTING FIRM
|
Shareholders and Board of Trustees
Dreyfus Variable Investment Fund, Small Company Stock Portfolio
We have audited the accompanying statement of assets and liabilities, including the statement of investments, of Dreyfus Variable Investment Fund, Small Company Stock Portfolio (one of the funds comprising Dreyfus Variable Investment Fund) as of December 31, 2006, and the related statement of operations for the year then ended, the statement of changes in net assets for each of the two years in the period then ended, and financial highlights for each of the years indicated therein. These financial statements and financial highlights are the responsibility of the Fund’s management. Our responsibility is to express an opinion on these financial statements and financial highlights based on our audits.
We conducted our audits in accordance with the standards of the Public Company Accounting Oversight Board (United States).Those standards require that we plan and perform the audit to obtain reasonable assurance about whether the financial statements and financial highlights are free of material misstatement.We were not engaged to perform an audit of the Fund’s internal control over financial reporting. Our audits included consideration of internal control over financial reporting as a basis for designing audit procedures that are appropriate in the circumstances, but not for the purpose of expressing an opinion on the effectiveness of the Fund’s internal control over financial reporting. Accordingly, we express no such opinion. An audit also includes examining, on a test basis, evidence supporting the amounts and disclosures in the financial statements and financial highlights, assessing the accounting principles used and significant estimates made by management, and evaluating the overall financial statement presentation. Our procedures included confirmation of securities owned as of December 31, 2006 by correspondence with the custodian and others or by other appropriate auditing procedures where replies from others were not received.We believe that our audits provide a reasonable basis for our opinion.
In our opinion, the financial statements and financial highlights referred to above present fairly, in all material respects, the financial position of Dreyfus Variable Investment Fund, Small Company Stock Portfolio at December 31, 2006, the results of its operations for the year then ended, the changes in its net assets for each of the two years in the period then ended, and the financial highlights for each of the indicated years, in conformity with U. S. generally accepted accounting principles.
New York, New York
February 6, 2007
|
IMPORTANT TAX INFORMATION (Unaudited)
For federal tax purposes, the portfolio hereby designates $2.5600 per share as a long-term capital gain distribution paid on March 27, 2006, and also the portfolio hereby designates 71.55% of the ordinary dividends paid during the fiscal year ended December 31, 2006 as qualifying for the corporate dividends received deduction. Shareholders will receive notification in January 2007 of the percentage applicable to the preparation of their 2006 income tax returns.
PROXY RESULTS (Unaudited)
|
Dreyfus Variable Investment Fund held a special meeting of shareholders on June 29, 2006.The proposal considered at the meeting, and the results, are as follows:
| | | | | Shares | | |
| |
| |
| |
|
| | | Votes For | | | | Authority Withheld |
| |
| |
| |
|
| To elect additional Board Members: | | | | | | |
| Peggy C. Davis † | | 171,078,927 | | | | 7,687,714 |
| Joseph S. DiMartino | | 170,946,484 | | | | 7,820,156 |
| David P. Feldman | | 170,959,921 | | | | 7,806,720 |
| Ehud Houminer† | | 170,132,087 | | | | 8,634,554 |
| Gloria Messinger † | | 170,187,241 | | | | 8,579,400 |
| Anne Wexler † | | 170,212,607 | | | | 8,554,033 |
† Each new Board member’s term commenced on September 26, 2006.
In addition to Joseph S. DiMartino and David P. Feldman, James F. Henry, Dr. Paul A. Marks and Dr. Martin Peretz continue as Board members of the fund.
The Portfolio 29
BOARD MEMBERS INFORMATION (Unaudited)
Joseph S. DiMartino (63)
Chairman of the Board (1995)
|
Principal Occupation During Past 5 Years:
• Corporate Director and Trustee
|
Other Board Memberships and Affiliations:
|
- The Muscular Dystrophy Association, Director
- Century Business Services, Inc., a provider of outsourcing functions for small and medium size companies, Director
- The Newark Group, a provider of a national market of paper recovery facilities, paperboard mills and paperboard converting plants, Director
- Sunair Services Corporation, engaging in the design, manufacture and sale of high frequency systems for long-range voice and data communications, as well as providing certain outdoor-related services to homes and businesses, Director
No. of Portfolios for which Board Member Serves: 190
———————
Peggy C. Davis (63) Board Member (2006)
Principal Occupation During Past 5 Years:
|
- Shad Professor of Law, New York University School of Law (1983-present)
- Writer and teacher in the fields of evidence, constitutional theory, family law, social sciences and the law, legal process and professional methodology and training
No. of Portfolios for which Board Member Serves: 80
|
David P. Feldman (67)
Board Member (1994)
|
Principal Occupation During Past 5 Years:
• Corporate Director and Trustee
|
Other Board Memberships and Affiliations:
|
- BBH Mutual Funds Group (11 funds), Director
- The Jeffrey Company, a private investment company, Director
- QMED, a medical device company, Director
No. of Portfolios for which Board Member Serves: 57
|
James F. Henry (76)
Board Member (1990)
|
Principal Occupation During Past 5 Years:
|
- President,The International Institute for Conflict Prevention and Resolution, a non-profit organization principally engaged in the development of alternatives to business litigation (Retired 2003)
- Advisor to The Elaw Forum, a consultant on managing corporate legal costs
- Advisor to John Jay Homestead (the restored home of the first U.S. Chief Justice)
- Individual Trustee of several trusts
Other Board Memberships and Affiliations:
|
- Director, advisor and mediator involved in several non-profit organizations, primarily engaged in domestic and international dispute resolution, and historic preservation
No. of Portfolios for which Board Member Serves: 48
|
———————
Ehud Houminer (66) Board Member (2006)
Principal Occupation During Past 5 Years:
• Executive-in-Residence at the Columbia Business School, Columbia University
Other Board Memberships and Affiliations:
|
- Avnet Inc., an electronics distributor, Director
- International Advisory Board to the MBA Program School of Management, Ben Gurion University, Chairman
- Explore Charter School, Brooklyn, NY, Chairman
No. of Portfolios for which Board Member Serves: 78
———————
Gloria Messinger (77) Board Member (2006)
Principal Occupation During Past 5 Years:
|
- Arbitrator for American Arbitration Association and National Association of Securities Dealers, Inc.
- Consultant in Intellectual Property
Other Board Memberships and Affiliations:
|
- Theater for a New Audience, Inc., Director
- Brooklyn Philharmonic, Director
No. of Portfolios for which Board Member Serves: 48
|
The Portfolio 31
BOARD MEMBERS INFORMATION (Unaudited) (continued)
Dr. Martin Peretz (67)
Board Member (1990)
|
Principal Occupation During Past 5 Years:
|
- Editor-in-Chief of The New Republic Magazine
- Lecturer in Social Studies at Harvard University (1965-2002)
- Director of TheStreet.com, a financial information service on the web
Other Board Memberships and Affiliations:
|
- American Council of Trustees and Alumni, Director
- Pershing Square Capital Management, Adviser
- Montefiore Ventures, General Partner
- Harvard Center for Blood Research,Trustee
- Bard College,Trustee
- Board of Overseers of YIVO Institute for Jewish Research, Chairman
No. of Portfolios for which Board Member Serves: 48
———————
Anne Wexler (76) Board Member (2006)
Principal Occupation During Past 5 Years:
|
- Chairman of the Wexler & Walker Public Policy Associates, consultants specializing in government relations and public affairs
Other Board Memberships and Affiliations:
|
- Wilshire Mutual Funds (5 funds), Director
- Methanex Corporation, a methanol producing company, Director
- Member of the Council of Foreign Relations
- Member of the National Park Foundation
No. of Portfolios for which Board Member Serves: 57
|
Once elected all Board Members serve for an indefinite term, but achieve Emeritus status on December 31st of the calendar year in which the Board Member reaches age 80.The address of the Board Members and Officers is in c/o The Dreyfus Corporation, 200 Park Avenue, New York, New York 10166. Additional information about the Board Members is available in the fund’s Statement of Additional Information which can be obtained from Dreyfus free of charge by calling this toll free number: 1-800-554-4611.
John M. Fraser, Jr., Emeritus Board Member Rosalind G. Jacobs, Emeritus Board Member Dr. Paul A. Marks, Emeritus Board Member
OFFICERS OF THE FUND (Unaudited)
| J. DAVID OFFICER, President since | | JOSEPH M. CHIOFFI, Vice President and |
| December 2006. | | Assistant Secretary since August 2005. |
| Chief Operating Officer,Vice Chairman and a | | Associate General Counsel of the Manager, |
| director of the Manager, and an officer of 90 | | and an officer of 91 investment companies |
| investment companies (comprised of 190 | | (comprised of 206 portfolios) managed by the |
| portfolios) managed by the Manager. He is 58 | | Manager. He is 45 years old and has been an |
| years old and has been an employee of the | | employee of the Manager since June 2000. |
| |
| Manager since April 1, 1998. | | JANETTE E. FARRAGHER, Vice President |
| MARK N. JACOBS, Vice President since | | and Assistant Secretary since |
| March 2000. | | August 2005. |
| Executive Vice President, Secretary and | | Associate General Counsel of the Manager, |
| General Counsel of the Manager, and an | | and an officer of 91 investment companies |
| officer of 91 investment companies (comprised | | (comprised of 206 portfolios) managed by the |
| of 206 portfolios) managed by the Manager. | | Manager. She is 44 years old and has been an |
| He is 60 years old and has been an employee | | employee of the Manager since February 1984. |
| |
| of the Manager since June 1977. | | JOHN B. HAMMALIAN, Vice President and |
| MICHAEL A. ROSENBERG, Vice President | | Assistant Secretary since August 2005. |
| and Secretary since August 2005. | | Associate General Counsel of the Manager, |
| Associate General Counsel of the Manager, | | and an officer of 91 investment companies |
| and an officer of 91 investment companies | | (comprised of 206 portfolios) managed by the |
| (comprised of 206 portfolios) managed by the | | Manager. He is 43 years old and has been an |
| Manager. He is 46 years old and has been an | | employee of the Manager since February 1991. |
| |
| employee of the Manager since October 1991. | | ROBERT R. MULLERY, Vice President and |
| JAMES BITETTO, Vice President and | | Assistant Secretary since August 2005. |
| Assistant Secretary since August 2005. | | Associate General Counsel of the Manager, |
| Associate General Counsel and Assistant | | and an officer of 91 investment companies |
| Secretary of the Manager, and an officer of 91 | | (comprised of 206 portfolios) managed by the |
| investment companies (comprised of 206 | | Manager. He is 54 years old and has been an |
| portfolios) managed by the Manager. He is 40 | | employee of the Manager since May 1986. |
| |
| years old and has been an employee of the | | JEFF PRUSNOFSKY, Vice President and |
| Manager since December 1996. | | Assistant Secretary since August 2005. |
| JONI LACKS CHARATAN, Vice President | | Associate General Counsel of the Manager, |
| and Assistant Secretary since | | and an officer of 91 investment companies |
| August 2005. | | (comprised of 206 portfolios) managed by the |
| Associate General Counsel of the Manager, | | Manager. He is 41 years old and has been an |
| and an officer of 91 investment companies | | employee of the Manager since October 1990. |
| (comprised of 206 portfolios) managed by the | | |
| Manager. She is 51 years old and has been an | | |
| employee of the Manager since October 1988. | | |
The Portfolio 33
OFFICERS OF THE FUND (Unaudited) (continued)
| JAMES WINDELS, Treasurer since | | JOSEPH W. CONNOLLY, Chief Compliance |
| November 2001. | | Officer since October 2004. |
| Director – Mutual Fund Accounting of the | | Chief Compliance Officer of the Manager and |
| Manager, and an officer of 91 investment | | The Dreyfus Family of Funds (91 investment |
| companies (comprised of 206 portfolios) | | companies, comprised of 206 portfolios). From |
| managed by the Manager. He is 48 years old | | November 2001 through March 2004, Mr. |
| and has been an employee of the Manager | | Connolly was first Vice-President, Mutual |
| since April 1985. | | Fund Servicing for Mellon Global Securities |
| |
| ERIK D. NAVILOFF, Assistant Treasurer | | Services. In that capacity, Mr. Connolly was |
| since December 2002. | | responsible for managing Mellon’s Custody, |
| | | Fund Accounting and Fund Administration |
| Senior Accounting Manager – Taxable Fixed | | services to third-party mutual fund clients. He |
| Income Funds of the Manager, and an officer | | is 49 years old and has served in various |
| of 91 investment companies (comprised of 206 | | capacities with the Manager since 1980, |
| portfolios) managed by the Manager. He is 38 | | including manager of the firm’s Fund |
| years old and has been an employee of the | | Accounting Department from 1997 through |
| Manager since November 1992. | | October 2001. |
| |
| ROBERT ROBOL, Assistant Treasurer | | WILLIAM GERMENIS, Anti-Money |
| since August 2003. | | Laundering Compliance Officer since |
| Senior Accounting Manager – Money Market | | September 2002. |
| and Municipal Bond Funds of the Manager, | | Vice President and Anti-Money Laundering |
| and an officer of 91 investment companies | | Compliance Officer of the Distributor, and the |
| (comprised of 206 portfolios) managed by the | | Anti-Money Laundering Compliance Officer |
| Manager. He is 42 years old and has been an | | of 87 investment companies (comprised of 202 |
| employee of the Manager since October 1988. | | portfolios) managed by the Manager. He is 36 |
| ROBERT SVAGNA, Assistant Treasurer | | years old and has been an employee of the |
| since December 2002. | | Distributor since October 1998. |
| Senior Accounting Manager – Equity Funds of | | |
| the Manager, and an officer of 91 investment | | |
| companies (comprised of 206 portfolios) | | |
| managed by the Manager. He is 39 years old | | |
| and has been an employee of the Manager | | |
| since November 1990. | | |
| |
| GAVIN C. REILLY, Assistant Treasurer | | |
| since December 2005. | | |
| Tax Manager of the Investment Accounting | | |
| and Support Department of the Manager, and | | |
| an officer of 91 investment companies | | |
| (comprised of 206 portfolios) managed by the | | |
| Manager. He is 38 years old and has been an | | |
| employee of the Manager since April 1991. | | |
34
NOTES
| For More | | Information |
| |
|
| |
| Dreyfus Variable | | Transfer Agent & |
| Investment Fund, | | Dividend Disbursing Agent |
| Small Company Stock Portfolio |
| | | Dreyfus Transfer, Inc. |
| 200 Park Avenue | | |
| | | 200 Park Avenue |
| New York, NY 10166 | | |
| | | New York, NY 10166 |
| |
| Investment Adviser | | Distributor |
| The Dreyfus Corporation | | |
| | | Dreyfus Service Corporation |
| 200 Park Avenue | | |
| | | 200 Park Avenue |
| New York, NY 10166 | | |
| | | New York, NY 10166 |
| Custodian | | |
| Mellon Bank, N.A. | | |
| One Mellon Bank Center | | |
| Pittsburgh, PA 15258 | | |
| | Telephone 1-800-554-4611 or 516-338-3300
Mail The Dreyfus Family of Funds, 144 Glenn Curtiss Boulevard, Uniondale, NY 11556-0144
Attn: Investments Division
|
The portfolio files its complete schedule of portfolio holdings with the Securities and Exchange Commission (“SEC”) for the first and third quarters of each fiscal year on Form N-Q. The portfolio’s Forms N-Q are available on the SEC’s website at http://www.sec.gov and may be reviewed and copied at the SEC’s Public Reference Room in Washington, DC. Information on the operation of the Public Reference Room may be obtained by calling 1-202-551-8090.
A description of the policies and procedures that the portfolio uses to determine how to vote proxies relating to portfolio securities, and information regarding how the portfolio voted these proxies for the 12-month period ended June 30, 2006, is available at http://www.dreyfus.com and on the SEC’s website at http://www.sec.gov. The description of the policies and procedures is also available without charge, upon request, by calling 1-800-645-6561.
© 2007 Dreyfus Service Corporation


The views expressed in this report reflect those of the portfolio manager only through the end of the period covered and do not necessarily represent the views of Dreyfus or any other person in the Dreyfus organization.Any such views are subject to change at any time based upon market or other conditions and Dreyfus disclaims any responsibility to update such views. These views may not be relied on as investment advice and, because investment decisions for a Dreyfus portfolio are based on numerous factors, may not be relied on as an indication of trading intent on behalf of any Dreyfus portfolio.
Not FDIC-Insured • Not Bank-Guaranteed • May Lose Value
| | | Contents |
| |
| | | T H E P O R T F O L I O |
| |
|
| 2 | | A Letter from the CEO |
| 3 | | Discussion of Performance |
| 6 | | Portfolio Performance |
| 8 | | Understanding Your Portfolio’s Expenses |
| 8 | | Comparing Your Portfolio’s Expenses |
| | | With Those of Other Funds |
| 9 | | Statement of Investments |
| 13 | | Statement of Assets and Liabilities |
| 14 | | Statement of Operations |
| 15 | | Statement of Changes in Net Assets |
| 17 | | Financial Highlights |
| 19 | | Notes to Financial Statements |
| 26 | | Report of Independent Registered |
| | | Public Accounting Firm |
| 27 | | Important Tax Information |
| 27 | | Proxy Results |
| 28 | | Board Members Information |
| 31 | | Officers of the Fund |
| | | F O R M O R E I N F O R M AT I O N |
| |
|
| | | Back Cover |
Dreyfus Variable Investment Fund,
Special Value Portfolio
The Portfolio

A LETTER FROM THE CEO
Dear Shareholder:
We are pleased to present this annual report for Dreyfus Variable Investment Fund, Special Value Portfolio, covering the 12-month period from January 1, 2006, through December 31, 2006.
2006 proved to be a good year for the financial markets.Virtually all sectors and capitalization ranges of the U.S. equity markets generated strong returns, especially over the second half of the year.A number of positive factors contributed to the markets’ gains in 2006, including an expanding domestic economy, subdued inflation, stabilizing interest rates, rising productivity and robust corporate profits.
In our analysis, 2006 provided an excellent reminder of the need for a long-term investment perspective. Adopting too short a time frame proved costly for some investors last year, as chasing recent winners often meant buying the next month’s losers. Indeed, history shows that reacting to near-term developments with extreme shifts in strategy rarely is the right decision.We believe that a better course of action is to set a portfolio mix to meet future goals, while attempting to ignore short term market fluctuations in favor of a longer-term view.
For information about how the portfolio performed during the reporting period, as well as market perspectives, we have provided a Discussion of Performance given by the portfolio managers.
Thank you for your continued confidence and support.We wish you good health and prosperity in 2007.

Thomas F. Eggers
Chief Executive Officer
The Dreyfus Corporation
January 16, 2007
|

DISCUSSION OF PERFORMANCE
Mark G. DeFranco and Brian M. Gillott, Portfolio Managers Jennison Associates LLC, Sub-Investment Adviser
How did Dreyfus Variable Investment Fund, Special Value Portfolio perform relative to its benchmark?
For the 12-month period ended December 31, 2006, the portfolio produced total returns of 16.60% for its Initial shares and 16.49% for its Service shares.1 For the same period, the total return of the Russell 1000 Value Index (the “Index”), the portfolio’s benchmark, was 22.25% .2
Stocks rallied strongly in 2006, particularly over the second half of the year, as investors responded favorably to robust corporate earnings, stabilizing interest rates and expectations of a “soft economic land-ing.”The fund produced lower returns than its benchmark, primarily due to a handful of holdings in the media and education industries that have not yet responded to catalysts that we believe are likely to support higher share prices.
What is the portfolio’s investment approach?
The portfolio seeks to maximize total return, consisting of capital appreciation and current income. We seek to identify the stocks of attractively valued companies with current or emerging earnings growth that may not be fully recognized by the market. These may include companies that are out of favor with investors but that we expect to see improved earnings over the next 12 to 18 months due to corporate restructurings, new products, industry cycle turns, greater focus on shareholder value or improving balance sheets and cash flows. We also look for companies with good growth characteristics that appear to be mispriced by the market due to short-term earnings setbacks or uncertainty regarding the sustainability of earnings growth.
What other factors influenced the portfolio’s performance?
After encountering heightened market volatility during the first half of 2006, stocks rallied strongly over the second half, enabling most market indices to end the year with double-digit gains. Value stocks led the market’s advance, as investors increasingly turned to reasonably priced
DISCUSSION OF PERFORMANCE (continued)
|
stocks of companies with track records of consistent earnings under a variety of economic conditions. The shift in investor sentiment was largely a result of slowing economic growth, as evidenced by cooling housing markets and falling energy prices.The Federal Reserve Board appeared to confirm that slower economic growth might relieve inflationary pressures when it refrained from raising short-term interest rates over the second half of the year, its first pauses in more than two years.
The portfolio participated to a significant degree in the market’s 2006 gains. We achieved attractive results from holdings in the industrials sector, where profit margins expanded in a growing labor market for temporary employment agency Manpower, which was sold during the reporting period.The financial results of railroad operator CSX were boosted by the success of a new management team’s turnaround strategy and rising demand for the transport of coal from mines to utilities. Waste management company Allied Waste Industries benefited from increases in pricing and margin expansion, a successful cost-cutting campaign and improving business conditions in its industry.
The portfolio’s financial holdings also contributed positively to performance, despite an underweighted position in the sector.Top performers included Charles Schwab & Co., which rebounded when earnings nearly doubled and investors increasingly recognized that the company is more than just a discount broker; it has a valuable institutional/RIA (Registered Investment Advisor) business. We acquired shares of investment bank Lazard at prices we considered attractive soon after its initial public offering fell flat, and we participated in the subsequent rebound amid a resurgence of mergers-and-acquisitions activity. The portfolio’s relative performance also benefited from its light exposure to banks, which we regarded as relatively unattractive due to heightened interest-rate risks.
In the consumer discretionary area, media company Pearson gained market share in its textbook publishing division, and a new chairman focused more intently on bolstering the value of company assets. Liberty Global, which operates cable and broadband networks in overseas markets, gained market share and took steps to enhance shareholder value. Gaming equipment manufacturer Bally Technologies benefited from a new product cycle tied to the growth of slot machine-based gambling.
However, some holdings detracted from the portfolio’s performance. At media company Radio One, revenue growth was mild and profit margins declined. However, the company reformatted radio stations in key urban markets, and its TV One television network has gained subscribers. Both of these developments could provide catalysts for better returns. For-profit education company Career Education continued to suffer from previous regulatory problems, but its turnaround appears to be on track under new management. Finally, a few of the portfolio’s energy holdings were hurt by declining commodity prices.
What is the portfolio’s current strategy?
We remain committed to our bottom-up, value-oriented security selection process. We recently identified several opportunities among pharmaceutical and biotechnology companies that had declined to attractive valuations. Conversely, as of year-end, we have found relatively few companies meeting our criteria in the financials, technology and basic materials sectors. However, we intend to continually evaluate the changing risk-reward profiles of attractively priced stocks that appear poised to benefit from catalysts for growth, and we are prepared to adjust the fund’s composition accordingly.
January 16, 2007
| | | The portfolio is only available as a funding vehicle under variable life insurance policies or variable |
| | | annuity contracts issued by insurance companies. Individuals may not purchase shares of the |
| | | portfolio directly. A variable annuity is an insurance contract issued by an insurance company that |
| | | enables investors to accumulate assets on a tax-deferred basis for retirement or other long-term |
| | | goals.The investment objective and policies of Dreyfus Variable Investment Fund, Special Value |
| | | Portfolio made available through insurance products may be similar to other funds/portfolios |
| | | managed or advised by Dreyfus. However, the investment results of the portfolio may be higher or |
| | | lower than, and may not be comparable to, those of any other Dreyfus fund/portfolio. |
| 1 | | Total return includes reinvestment of dividends and any capital gains paid. Past performance is no |
| | | guarantee of future results. Share price and investment return fluctuate such that upon redemption, |
| | | portfolio shares may be worth more or less than their original cost.The portfolio’s performance does |
| | | not reflect the deduction of additional charges and expenses imposed in connection with investing |
| | | in variable insurance contracts, which will reduce returns. Return figures provided reflect the |
| | | absorption of certain portfolio expenses by The Dreyfus Corporation pursuant to an agreement in |
| | | effect through December 31, 2007, at which time it may be extended, terminated or modified. |
| | | Had these expenses not been absorbed, the portfolio’s returns would have been lower. |
| 2 | | SOURCE: LIPPER INC. — Reflects the reinvestment of dividends and, where applicable, |
| | | capital gain distributions.The Russell 1000 Value Index is an unmanaged index which measures |
| | | the performance of those Russell 1000 companies with lower price-to-book ratios and lower |
| | | forecasted growth values. |
The Portfolio 5
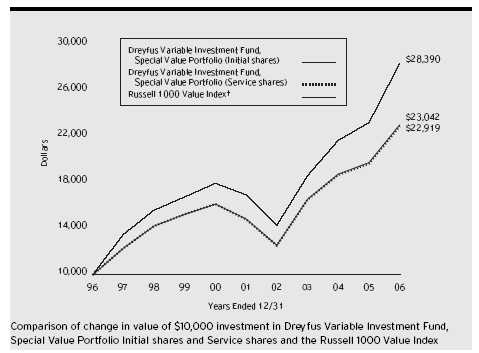
| Average Annual Total Returns | | as of 12/31/06 | | | | | | |
| | | | | 1 Year | | 5 Years | | 10 Years |
| |
| |
| |
| |
|
| Initial shares | | | | 16.60% | | 9.16% | | 8.71% |
| Service shares | | | | 16.49% | | 9.09% | | 8.65% |
The data for Service shares includes the results of Initial shares for the period prior to December 31, 2000 (inception date of Service shares). Actual Service shares’ average annual total return and hypothetical growth results would have been lower. See notes below.
† Source: Lipper Inc.
Past performance is not predictive of future performance.The portfolio’s performance shown in the graph and table does not reflect the deduction of taxes that a shareholder would pay on portfolio distributions or the redemption of portfolio shares.
The portfolio’s performance does not reflect the deduction of additional charges and expenses imposed in connection with investing in variable insurance contracts which will reduce returns.
The above graph compares a $10,000 investment made in Initial and Service shares of Dreyfus Variable Investment Fund, Special Value Portfolio on 12/31/96 to a $10,000 investment made in the Russell 1000 Value Index (the “Index”) on that date.
The portfolio’s Initial shares are not subject to a Rule 12b-1 fee.The portfolio’s Service shares are subject to a 0.25% annual Rule 12b-1 fee.The performance figures for Service shares reflect the performance of the portfolio’s Initial shares from their inception date through December 30, 2000, and the performance of the portfolio’s Service shares from December 31, 2000 (inception date of Service shares) to December 31, 2006 (blended performance figures).The performance figures for each share class reflect certain expense reimbursements, without which the performance of each share class would have been lower. In addition, the blended performance figures have not been adjusted to reflect the higher operating expenses of the Service shares. If these expenses had been reflected, the blended performance figures would have been lower. All dividends and capital gain distributions are reinvested.
The portfolio’s performance shown in the line graph takes into account all applicable portfolio fees and expenses (after any expense reimbursements).The Index is an unmanaged index which measures the performance of those Russell 1000 companies with lower price-to-book ratios and lower forecasted growth values.The Index does not take into account charges, fees and other expenses. Further information relating to portfolio performance, including expense reimbursements, if applicable, is contained in the Financial Highlights section of the prospectus and elsewhere in this report.
UNDERSTANDING YOUR
PORTFOLIO’S EXPENSES (Unaudited)
As a mutual fund investor,you pay ongoing expenses,such as management fees and other expenses.Using the information below,you can estimate how these expenses affect your investment and compare them with the expenses of other funds.You also may pay one-time transaction expenses, including sales charges (loads) and redemption fees, which are not shown in this section and would have resulted in higher total expenses. For more information, see your portfolio’s prospectus or talk to your financial adviser.
Review your portfolio’s expenses
The table below shows the expenses you would have paid on a $1,000 investment in Dreyfus Variable Investment Fund, Special Value Portfolio from July 1, 2006 to December 31, 2006. It also shows how much a $1,000 investment would be worth at the close of the period, assuming actual returns and expenses.
| Expenses and Value of a $1,000 Investment | | |
| assuming actual returns for the six months ended December 31, 2006 |
| | | Initial Shares | | Service Shares |
| |
| |
|
| Expenses paid per $1,000 † | | $ 5.29 | | $ 5.29 |
| Ending value (after expenses) | | $1,098.00 | | $1,098.30 |
COMPARING YOUR PORTFOLIO’S EXPENSES WITH THOSE OF OTHER FUNDS (Unaudited)
Using the SEC’s method to compare expenses
The Securities and Exchange Commission (SEC) has established guidelines to help investors assess fund expenses. Per these guidelines, the table below shows your portfolio’s expenses based on a $1,000 investment, assuming a hypothetical 5% annualized return. You can use this information to compare the ongoing expenses (but not transaction expenses or total cost) of investing in the portfolio with those of other funds. All mutual fund shareholder reports will provide this information to help you make this comparison. Please note that you cannot use this information to estimate your actual ending account balance and expenses paid during the period.
Expenses and Value of a $1,000 Investment assuming a hypothetical 5% annualized return for the six months ended December 31, 2006
| | | Initial Shares | | Service Shares |
| |
| |
|
| Expenses paid per $1,000 † | | $ 5.09 | | $ 5.09 |
| Ending value (after expenses) | | $1,020.16 | | $1,020.16 |
† Expenses are equal to the portfolio’s annualized expense ratio of 1.00% for Initial shares and 1.00% for Service shares, multiplied by the average account value over the period, multiplied by 184/365 (to reflect the one-half year period).
STATEMENT OF INVESTMENTS
December 31, 2006
|
| Common Stocks—96.7% | | Shares | | | | Value ($) |
| |
| |
| |
|
| Consumer Discretionary—17.7% | | | | | | |
| Bally Technologies | | 14,600 | | a | | 272,728 |
| Blockbuster, Cl. A | | 43,900 | | a | | 232,231 |
| Boyd Gaming | | 4,900 | | | | 222,019 |
| Career Education | | 11,900 | | a | | 294,882 |
| DeVry | | 11,100 | | | | 310,800 |
| Discovery Holding, Cl. A | | 23,000 | | a | | 370,070 |
| Gemstar-TV Guide International | | 60,800 | | a | | 243,808 |
| H & R Block | | 13,900 | | | | 320,256 |
| IAC/InterActiveCorp | | 10,600 | | a | | 393,896 |
| Liberty Global, Ser. C | | 14,940 | | a | | 418,320 |
| Pearson, ADR | | 29,700 | | | | 448,470 |
| Radio One, Cl. D | | 28,000 | | a | | 188,720 |
| ServiceMaster | | 11,300 | | | | 148,143 |
| Tribune | | 13,800 | | | | 424,764 |
| Urban Outfitters | | 15,300 | | a | | 352,359 |
| Viacom, Cl. B | | 10,287 | | a | | 422,076 |
| | | | | | | 5,063,542 |
| Consumer Staples—9.4% | | | | | | |
| Cadbury Schweppes | | 39,200 | | | | 419,608 |
| ConAgra Foods | | 18,900 | | | | 510,300 |
| Kimberly-Clark | | 4,700 | | | | 319,365 |
| Kroger | | 24,000 | | | | 553,680 |
| Performance Food Group | | 17,200 | | a | | 475,408 |
| Wal-Mart Stores | | 8,900 | | | | 411,002 |
| | | | | | | 2,689,363 |
| Energy—7.9% | | | | | | |
| Alpha Natural Resources | | 14,200 | | a | | 202,066 |
| Baker Hughes | | 3,800 | | | | 283,708 |
| Massey Energy | | 13,900 | | | | 322,897 |
| National Oilwell Varco | | 4,700 | | a | | 287,546 |
| Occidental Petroleum | | 6,300 | | | | 307,629 |
| Range Resources | | 12,700 | | | | 348,742 |
| Schlumberger | | 8,000 | | | | 505,280 |
| | | | | | | 2,257,868 |
STATEMENT OF INVESTMENTS (continued)
|
| Common Stocks (continued) | | Shares | | Value ($) |
| |
| |
|
| Financial—20.9% | | | | |
| American International Group | | 10,900 | | 781,094 |
| Axis Capital Holdings | | 6,600 | | 220,242 |
| Bank of New York | | 16,300 | | 641,731 |
| Benfield Group | | 49,900 | | 349,417 |
| Charles Schwab | | 27,300 | | 527,982 |
| Citigroup | | 8,100 | | 451,170 |
| Eaton Vance | | 11,100 | | 366,411 |
| KKR Private Equity Investors, LLP (Units) | | 18,000 c | | 411,300 |
| Lazard, Cl. A | | 6,500 | | 307,710 |
| Nuveen Investments, Cl. A | | 5,800 | | 300,904 |
| Royal Bank of Scotland Group | | 15,526 | | 606,087 |
| SLM | | 8,300 | | 404,791 |
| StanCorp Financial Group | | 7,300 | | 328,865 |
| State Street | | 4,400 | | 296,736 |
| | | | | 5,994,440 |
| Health Care—12.8% | | | | |
| Abbott Laboratories | | 10,200 | | 496,842 |
| Amgen | | 5,800 a | | 396,198 |
| Endo Pharmaceuticals Holdings | | 11,800 a | | 325,444 |
| Medicis Pharmaceutical, Cl. A | | 7,700 | | 270,501 |
| Novartis | | 4,800 | | 276,643 |
| Omnicare | | 7,900 | | 305,177 |
| Pfizer | | 10,500 | | 271,950 |
| St. Jude Medical | | 9,900 a | | 361,944 |
| UnitedHealth Group | | 10,500 | | 564,165 |
| Watson Pharmaceuticals | | 15,100 a | | 393,053 |
| | | | | 3,661,917 |
| Industrial—7.9% | | | | |
| Allied Waste Industries | | 46,900 a | | 576,401 |
| CSX | | 9,000 | | 309,870 |
| Common Stocks (continued) | | Shares | | Value ($) |
| |
| |
|
| Industrial (continued) | | | | |
| Dover | | 8,800 | | 431,376 |
| Honeywell International | | 7,800 | | 352,872 |
| Navigant Consulting | | 13,900 a | | 274,664 |
| Waste Management | | 8,900 | | 327,253 |
| | | | | 2,272,436 |
| Information Technology—9.6% | | | | |
| BEA Systems | | 17,700 a | | 222,666 |
| Corning | | 15,200 a | | 284,392 |
| Diebold | | 12,100 | | 563,860 |
| Fair Isaac | | 10,700 | | 434,955 |
| Integrated Device Technology | | 22,800 a | | 352,944 |
| Manhattan Associates | | 9,000 a | | 270,720 |
| Microsoft | | 10,300 | | 307,558 |
| TIBCO Software | | 34,700 a | | 327,568 |
| | | | | 2,764,663 |
| Materials—6.3% | | | | |
| E.I. du Pont de Nemours & Co. | | 12,500 | | 608,875 |
| Huntsman | | 15,100 a | | 286,447 |
| Nalco Holding | | 20,700 a | | 423,522 |
| Rockwood Holdings | | 9,800 a | | 247,548 |
| Temple-Inland | | 5,000 | | 230,150 |
| | | | | 1,796,542 |
| Telecommunication Services—.7% | | | | |
| IDT, Cl. B | | 15,900 a | | 207,972 |
| Utilities—3.5% | | | | |
| NRG Energy | | 12,800 a | | 716,928 |
| Sempra Energy | | 5,300 | | 297,012 |
| | | | | 1,013,940 |
| Total Common Stocks | | | | |
| (cost $24,122,098) | | | | 27,722,683 |
STATEMENT OF INVESTMENTS (continued)
|
| Other Investment—2.6% | | | | Shares | | Value ($) |
| |
| |
| |
|
| Registered Investment Company; | | | | |
| Dreyfus Institutional Preferred | | | | | | |
| Plus Money Market Fund | | | | | | |
| (cost $759,000) | | | | 759,000 b | | 759,000 |
| |
| |
| |
|
| |
| Total Investments (cost $24,881,098) | | 99.3% | | 28,481,683 |
| |
| Cash and Receivables (Net) | | | | .7% | | 188,489 |
| |
| Net Assets | | | | 100.0% | | 28,670,172 |
| |
| ADR—American Depository Receipts | | | | | | |
| a Non-income producing security. | | | | | | |
| b Investment in affiliated money market mutual fund. | | | | |
| c Security restricted as to public resale. Investments in restricted securities, with a value of $411,300 or 1.4% of net |
| assets, are as follows: | | | | | | |
| |
| | | Acquisition | | Purchase | | |
| Issuer | | Date | | Price ($) † | | Valuation ($) †† |
| |
| |
| |
|
| KKR Private Equity | | | | | | |
| Investors, LLP (Units) | | 5/3/06-5/5/06 | | 24.97 | | 22.85 per unit |
† Average cost per unit.
† † The valuation of this security has been determined in good faith under the direction of the Board of Trustees.
| Portfolio Summary | | (Unaudited) ††† | | | | |
| |
| | | Value (%) | | | | Value (%) |
| |
| |
| |
|
| Financial | | 20.9 | | Industrial | | 7.9 |
| Consumer Discretionary | | 17.7 | | Materials | | 6.3 |
| Health Care | | 12.8 | | Utilities | | 3.5 |
| Information Technology | | 9.6 | | Money Market Investment | | 2.6 |
| Consumer Staples | | 9.4 | | Telecommunication Services | | .7 |
| Energy | | 7.9 | | | | 99.3 |
| |
| ††† Based on net assets. | | | | | | |
| See notes to financial statements. | | | | |
| STATEMENT OF ASSETS AND LIABILITIES |
| December 31, 2006 |
| | | Cost | | Value |
| |
| |
|
| Assets ($): | | | | |
| Investments in securities—See Statement of Investments: | | |
| Unaffiliated issuers | | 24,122,098 | | 27,722,683 |
| Affiliated issuers | | 759,000 | | 759,000 |
| Receivable for investment securities sold | | 586,723 |
| Dividends and interest receivable | | | | 20,527 |
| Prepaid expenses | | | | 2,698 |
| | | | | 29,091,631 |
| |
| |
|
| Liabilities ($): | | | | |
| Due to The Dreyfus Corporation and affiliates—Note 3(b) | | 28,057 |
| Cash overdraft due to Custodian | | | | 301,275 |
| Payable for investment securities purchased | | 49,534 |
| Accrued expenses | | | | 42,593 |
| | | | | 421,459 |
| |
| |
|
| Net Assets ($) | | | | 28,670,172 |
| |
| |
|
| Composition of Net Assets ($): | | | | |
| Paid-in capital | | | | 21,864,109 |
| Accumulated undistributed investment income—net | | 130,561 |
| Accumulated net realized gain (loss) on investments | | 3,074,917 |
| Accumulated net unrealized appreciation | | |
| (depreciation) on investments | | | | 3,600,585 |
| |
| |
|
| Net Assets ($) | | | | 28,670,172 |
| |
| |
|
| |
| |
| Net Asset Value Per Share | | | | |
| | | Initial Shares | | Service Shares |
| |
| |
|
| Net Assets ($) | | 23,719,400 | | 4,950,772 |
| Shares Outstanding | | 1,556,545 | | 325,919 |
| |
| |
|
| Net Asset Value Per Share ($) | | 15.24 | | 15.19 |
See notes to financial statements.
|
STATEMENT OF OPERATIONS
Year Ended December 31, 2006
|
| Investment Income ($): | | |
| Income: | | |
| Cash dividends (net of $1,531 foreign taxes withheld at source): | | |
| Unaffiliated issuers | | 354,456 |
| Affiliated issuers | | 46,984 |
| Interest | | 2,457 |
| Total Income | | 403,897 |
| Expenses: | | |
| Investment advisory fee—Note 3(a) | | 215,351 |
| Auditing fees | | 35,916 |
| Prospectus and shareholders’ reports | | 14,666 |
| Custodian fees | | 14,345 |
| Distribution fees—Note 3(b) | | 12,185 |
| Trustees’ fees and expenses—Note 3(c) | | 3,509 |
| Legal fees | | 801 |
| Miscellaneous | | 6,659 |
| Total Expenses | | 303,432 |
| Less—waiver of fees due to undertaking—Note 3(a) | | (26,908) |
| Less—reduction in custody fees | | |
| due to earnings credits—Note 1(c) | | (1,840) |
| Net Expenses | | 274,684 |
| Investment Income—Net | | 129,213 |
| |
|
| Realized and Unrealized Gain (Loss) on Investments—Note 4 ($): |
| Net realized gain (loss) on investments and foreign currency transactions | | 3,176,868 |
| Net unrealized appreciation (depreciation) on investments | | 1,143,867 |
| Net Realized and Unrealized Gain (Loss) on Investments | | 4,320,735 |
| Net Increase in Net Assets Resulting from Operations | | 4,449,948 |
See notes to financial statements.
|
STATEMENT OF CHANGES IN NET ASSETS
| | | Year Ended December 31, |
| |
|
| | | 2006 | | 2005 |
| |
| |
|
| Operations ($): | | | | |
| Investment income—net | | 129,213 | | 147,886 |
| Net realized gain (loss) on investments | | 3,176,868 | | 3,663,489 |
| Net unrealized appreciation | | | | |
| (depreciation) on investments | | 1,143,867 | | (2,280,297) |
| Net Increase (Decrease) in Net Assets | | | | |
| Resulting from Operations | | 4,449,948 | | 1,531,078 |
| |
| |
|
| Dividends to Shareholders from ($): | | | | |
| Investment income—net: | | | | |
| Initial shares | | (125,482) | | (33,620) |
| Service shares | | (22,153) | | (2,523) |
| Net realized gain on investments: | | | | |
| Initial shares | | (3,049,073) | | (720,459) |
| Service shares | | (614,098) | | (131,069) |
| Total Dividends | | (3,810,806) | | (887,671) |
| |
| |
|
| Beneficial Interest Transactions ($): | | | | |
| Net proceeds from shares sold: | | | | |
| Initial shares | | 843,325 | | 1,498,805 |
| Service shares | | 508,706 | | 771,389 |
| Dividends reinvested: | | | | |
| Initial shares | | 3,174,555 | | 754,079 |
| Service shares | | 636,251 | | 133,592 |
| Cost of shares redeemed: | | | | |
| Initial shares | | (5,736,489) | | (6,803,276) |
| Service shares | | (1,522,420) | | (1,135,216) |
| Increase (Decrease) in Net Assets from | | | | |
| Beneficial Interest Transactions | | (2,096,072) | | (4,780,627) |
| Total Increase (Decrease) in Net Assets | | (1,456,930) | | (4,137,220) |
| |
| |
|
| Net Assets ($): | | | | |
| Beginning of Period | | 30,127,102 | | 34,264,322 |
| End of Period | | 28,670,172 | | 30,127,102 |
| Undistributed investment income—net | | 130,561 | | 147,483 |
STATEMENT OF CHANGES IN NET ASSETS (continued)
|
| | | Year Ended December 31, |
| |
|
| | | 2006 | | 2005 |
| |
| |
|
| Capital Share Transactions: | | | | |
| Initial Shares | | | | |
| Shares sold | | 59,436 | | 105,018 |
| Shares issued for dividends reinvested | | 226,269 | | 54,683 |
| Shares redeemed | | (392,797) | | (475,011) |
| Net Increase (Decrease) in Shares Outstanding | | (107,092) | | (315,310) |
| |
| |
|
| Service Shares | | | | |
| Shares sold | | 35,654 | | 54,193 |
| Shares issued for dividends reinvested | | 45,479 | | 9,716 |
| Shares redeemed | | (103,337) | | (80,214) |
| Net Increase (Decrease) in Shares Outstanding | | (22,204) | | (16,305) |
See notes to financial statements.
|
FINANCIAL HIGHLIGHTS
The following tables describe the performance for each share class for the fiscal periods indicated.All information (except portfolio turnover rate) reflects financial results for a single portfolio share. Total return shows how much your investment in the portfolio would have increased (or decreased) during each period, assuming you had reinvested all dividends and distributions.These figures have been derived from the portfolio’s financial statements.
| | | | | Year Ended December 31, | | |
| |
| |
| |
|
| Initial Shares | | 2006 | | 2005 | | 2004 | | 2003 | | 2002 |
| |
| |
| |
| |
| |
|
| Per Share Data ($): | | | | | | | | | | |
| Net asset value, beginning of period | | 14.98 | | 14.63 | | 14.39 | | 11.04 | | 13.07 |
| Investment Operations: | | | | | | | | | | |
| Investment income—net a | | .07 | | .07 | | .07 | | .03 | | .10 |
| Net realized and unrealized | | | | | | | | | | |
| gain (loss) on investments | | 2.24 | | .68 | | 1.82 | | 3.43 | | (2.09) |
| Total from Investment Operations | | 2.31 | | .75 | | 1.89 | | 3.46 | | (1.99) |
| Distributions: | | | | | | | | | | |
| Dividends from investment income—net | | (.08) | | (.02) | | (.10) | | (.11) | | (.04) |
| Dividends from net realized | | | | | | | | | | |
| gain on investments | | (1.97) | | (.38) | | (1.55) | | — | | — |
| Total Distributions | | (2.05) | | (.40) | | (1.65) | | (.11) | | (.04) |
| Net asset value, end of period | | 15.24 | | 14.98 | | 14.63 | | 14.39 | | 11.04 |
| |
| |
| |
| |
| |
|
| Total Return (%) | | 16.60 | | 5.34 | | 13.08 | | 31.74 | | (15.28) |
| |
| |
| |
| |
| |
|
| Ratios/Supplemental Data (%): | | | | | | | | | | |
| Ratio of total expenses | | | | | | | | | | |
| to average net assets | | 1.01 | | .94 | | .93 | | 1.01 | | .99 |
| Ratio of net expenses | | | | | | | | | | |
| to average net assets | | .95 | | .93 | | .91 | | .97 | | .92 |
| Ratio of net investment income | | | | | | | | | | |
| to average net assets | | .46 | | .48 | | .50 | | .23 | | .81 |
| Portfolio Turnover Rate | | 77.91 | | 83.27 | | 90.27 | | 108.01 | | 148.29 |
| |
| |
| |
| |
| |
|
| Net Assets, end of period ($ x 1,000) | | 23,719 | | 24,926 | | 28,949 | | 31,557 | | 27,255 |
| |
| a Based on average shares outstanding at each month end. | | | | | | | | |
| See notes to financial statements. | | | | | | | | | | |
FINANCIAL HIGHLIGHTS (continued)
|
| | | | | Year Ended December 31, | | |
| |
| |
| |
|
| Service Shares | | 2006 | | 2005 | | 2004 | | 2003 | | 2002 |
| |
| |
| |
| |
| |
|
| Per Share Data ($): | | | | | | | | | | |
| Net asset value, beginning of period | | 14.94 | | 14.59 | | 14.36 | | 11.02 | | 13.05 |
| Investment Operations: | | | | | | | | | | |
| Investment income—net a | | .06 | | .06 | | .06 | | .02 | | .08 |
| Net realized and unrealized | | | | | | | | | | |
| gain (loss) on investments | | 2.23 | | .68 | | 1.80 | | 3.43 | | (2.07) |
| Total from Investment Operations | | 2.29 | | .74 | | 1.86 | | 3.45 | | (1.99) |
| Distributions: | | | | | | | | | | |
| Dividends from investment income—net | | (.07) | | (.01) | | (.08) | | (.11) | | (.04) |
| Dividends from net realized | | | | | | | | | | |
| gain on investments | | (1.97) | | (.38) | | (1.55) | | — | | — |
| Total Distributions | | (2.04) | | (.39) | | (1.63) | | (.11) | | (.04) |
| Net asset value, end of period | | 15.19 | | 14.94 | | 14.59 | | 14.36 | | 11.02 |
| |
| |
| |
| |
| |
|
| Total Return (%) | | 16.49 | | 5.28 | | 12.96 | | 31.71 | | (15.32) |
| |
| |
| |
| |
| |
|
| Ratios/Supplemental Data (%): | | | | | | | | | | |
| Ratio of total expenses | | | | | | | | | | |
| to average net assets | | 1.27 | | 1.19 | | 1.18 | | 1.27 | | 1.26 |
| Ratio of net expenses | | | | | | | | | | |
| to average net assets | | 1.00 | | 1.00 | | 1.00 | | 1.00 | | .99 |
| Ratio of net investment income | | | | | | | | | | |
| to average net assets | | .41 | | .41 | | .42 | | .21 | | .69 |
| Portfolio Turnover Rate | | 77.91 | | 83.27 | | 90.27 | | 108.01 | | 148.29 |
| |
| |
| |
| |
| |
|
| Net Assets, end of period ($ x 1,000) | | 4,951 | | 5,201 | | 5,316 | | 5,196 | | 3,910 |
| |
| a Based on average shares outstanding at each month end. | | | | | | | | |
| See notes to financial statements. | | | | | | | | | | |
NOTES TO FINANCIAL STATEMENTS
NOTE 1—Significant Accounting Policies:
Dreyfus Variable Investment Fund (the “fund”) is registered under the Investment Company Act of 1940, as amended (the “Act”), as an open-end management investment company, operating as a series company currently offering twelve series, including the Special Value Portfolio (the “portfolio”). The portfolio is only offered to separate accounts established by insurance companies to fund variable annuity contracts and variable life insurance policies.The portfolio is a diversified series. The portfolio’s investment objective is to maximize total return, consisting of capital appreciation and current income. The Dreyfus Corporation (the “Manager” or “Dreyfus”) serves as the portfolio’s investment adviser. Dreyfus is a wholly-owned subsidiary of Mellon Financial Corporation (“Mellon Financial”). Jennison Associates LLC (“Jennison”) serves as the portfolio’s sub-investment adviser.
On December 4, 2006, Mellon Financial and The Bank of New York Company, Inc. announced that they had entered into a definitive agreement to merge. The new company will be called The Bank of New York Mellon Corporation. As part of this transaction, Dreyfus would become a wholly-owned subsidiary of The Bank of New York Mellon Corporation.The transaction is subject to certain regulatory approvals and the approval of The Bank of New York Company, Inc.’s and Mellon Financial’s shareholders, as well as other customary conditions to closing. Subject to such approvals and the satisfaction of the other conditions, Mellon Financial and The Bank of New York Company, Inc. expect the transaction to be completed in the third quarter of 2007.
Dreyfus Service Corporation (the “Distributor”), a wholly-owned subsidiary of Dreyfus, is the distributor of the portfolio’s shares, which are sold without a sales charge.The portfolio is authorized to issue an unlimited number of $.001 par value shares of Beneficial Interest in each of the following classes of shares: Initial and Service. Each class of shares has identical rights and privileges, except with respect to the distribution plan and the expenses borne by each class and certain voting
NOTES TO FINANCIAL STATEMENTS (continued)
|
rights. Income, expenses (other than expenses attributable to a specific class), and realized and unrealized gains or losses on investments are allocated to each class of shares based on its relative net assets.
The fund accounts separately for the assets, liabilities and operations of each series. Expenses directly attributable to each series are charged to that series’ operations; expenses which are applicable to all series are allocated among them on a pro rata basis.
The portfolio’s financial statements are prepared in accordance with U.S. generally accepted accounting principles, which may require the use of management estimates and assumptions.Actual results could differ from those estimates.
The fund enters into contracts that contain a variety of indemnifica-tions.The portfolio’s maximum exposure under these arrangements is unknown. The portfolio does not anticipate recognizing any loss related to these arrangements.
(a) Portfolio valuation: Investments in securities are valued at the last sales price on the securities exchange or national securities market on which such securities are primarily traded. Securities listed on the National Market System for which market quotations are available are valued at the official closing price or, if there is no official closing price that day, at the last sales price. Securities not listed on an exchange or the national securities market, or securities for which there were no transactions, are valued at the average of the most recent bid and asked prices, except for open short positions, where the asked price is used for valuation purposes. Bid price is used when no asked price is available. Registered open-end investment companies that are not traded on an exchange are valued at their net asset value.When market quotations or official closing prices are not readily available, or are determined not to reflect accurately fair value, such as when the value of a security has been significantly affected by events after the close of the exchange or market on which the security is principally traded (for example, a foreign exchange or market), but before the portfolio calculates its net asset value, the portfolio may value these investments at fair value as deter-
mined in accordance with the procedures approved by the Board of Trustees. Fair valuing of securities may be determined with the assistance of a pricing service using calculations based on indices of domestic securities and other appropriate indicators, such as prices of relevant ADR’s and futures contracts. For other securities that are fair valued by the Board of Trustees, certain factors may be considered such as: fundamental analytical data, the nature and duration of restrictions on disposition, an evaluation of the forces that influence the market in which the securities are purchased and sold, and public trading in similar securities of the issuer or comparable issuers. Financial futures are valued at the last sales price. Investments denominated in foreign currencies are translated to U.S. dollars at the prevailing rates of exchange. Forward currency exchange contracts are valued at the forward rate.
On September 20, 2006, the Financial Accounting Standards Board (FASB) released Statement of Financial Accounting Standards No. 157 “Fair Value Measurements” (“FAS 157”). FAS 157 establishes an authoritative definition of fair value, sets out a framework for measuring fair value, and requires additional disclosures about fair-value measurements. The application of FAS 157 is required for fiscal years beginning after November 15, 2007 and interim periods within those fiscal years. Management does not believe that the application of this standard will have a material impact on the financial statements of the portfolio.
(b) Foreign currency transactions: The portfolio does not isolate that portion of the results of operations resulting from changes in foreign exchange rates on investments from the fluctuations arising from changes in market prices of securities held. Such fluctuations are included with the net realized and unrealized gain or loss on investments.
Net realized foreign exchange gains or losses arise from sales and maturities of short-term securities, sales of foreign currencies, currency gains or losses realized on securities transactions and the difference between the amounts of dividends, interest and foreign withholding taxes recorded on the portfolio’s books and the U.S. dollar equivalent of the amounts actually received or paid. Net unrealized foreign exchange
NOTES TO FINANCIAL STATEMENTS (continued)
|
gains or losses arise from changes in the value of assets and liabilities other than investments in securities, resulting from changes in exchange rates. Such gains and losses are included with net realized and unrealized gain or loss on investments.
(c) Securities transactions and investment income: Securities transactions are recorded on a trade date basis. Realized gain and loss from securities transactions are recorded on the identified cost basis. Dividend income is recognized on the ex-dividend date and interest income, including, where applicable, accretion of discount and amortization of premium on investments, is recognized on the accrual basis.
The portfolio has an arrangement with the custodian bank whereby the portfolio receives earnings credits from the custodian when positive cash balances are maintained, which are used to offset custody fees. For financial reporting purposes, the portfolio includes net earnings credits as an expense offset in the Statement of Operations.
(d) Affiliated issuers: Investments in other investment companies advised by Dreyfus are defined as “affiliated” in the Act.
(e) Dividends to shareholders: Dividends are recorded on the ex-dividend date. Dividends from investment income-net and dividends from net realized capital gain, if any, are normally declared and paid annually, but the portfolio may make distributions on a more frequent basis to comply with the distribution requirements of the Internal Revenue Code of 1986, as amended (the “Code”).To the extent that net realized capital gain can be offset by capital loss carryovers, if any, it is the policy of the portfolio not to distribute such gain. Income and capital gain distributions are determined in accordance with income tax regulations, which may differ from U.S. generally accepted accounting principles.
(f) Federal income taxes: It is the policy of the portfolio to continue to qualify as a regulated investment company, if such qualification is in the best interests of its shareholders, by complying with the applicable provisions of the Code, and to make distributions of taxable income sufficient to relieve it from substantially all federal income and excise taxes.
On July 13, 2006, the FASB released FASB Interpretation No. 48 “Accounting for Uncertainty in Income Taxes” (FIN 48). FIN 48 provides guidance for how uncertain tax positions should be recognized, measured, presented and disclosed in the financial statements. FIN 48 requires the evaluation of tax positions taken or expected to be taken in the course of preparing the portfolio’s tax returns to determine whether the tax positions are “more-likely-than-not” of being sustained by the applicable tax authority.Tax positions not deemed to meet the more-likely-than-not threshold would be recorded as a tax benefit or expense in the current year. Adoption of FIN 48 is required for fiscal years beginning after December 15, 2006 and is to be applied to all open tax years as of the effective date. Management does not believe that the application of this standard will have a material impact on the financial statements of the portfolio.
At December 31, 2006, the components of accumulated earnings on a tax basis were as follows: undistributed ordinary income $1,089,330, undistributed capital gains $2,319,215 and unrealized appreciation $3,397,518.
The tax character of distributions paid to shareholders during the fiscal period ended December 31, 2006 and December 31, 2005, were as follows: ordinary income $1,850,985 and $475,265 and long-term capital gains $1,959,821 and $412,406.
During the period ended December 31, 2006, as a result of permanent book to tax differences primarily due to tax treatment for foreign currency gains and losses, the portfolio increased accumulated undistributed investment income-net by $1,500 and decreased accumulated net realized gain (loss) on investments by the same amount. Net assets were not affected by this reclassification.
NOTE 2—Bank Lines of Credit:
The portfolio may borrow up to $5 million for leveraging purposes under a short-term unsecured line of credit and participates with other Dreyfus managed funds in a $100 million unsecured line of credit pri-
NOTES TO FINANCIAL STATEMENTS (continued)
|
marily to be utilized for temporary or emergency purposes including the financing of redemptions. Interest is charged to the portfolio based on prevailing market rates in effect at the time of borrowing. During the period ended December 31, 2006, the portfolio did not borrow under either line of credit.
NOTE 3—Investment Advisory Fee and Other Transactions With Affiliates:
(a) Pursuant to an Investment Advisory Agreement with Dreyfus, the investment advisory fee is computed at the annual rate of .75% of the value of the portfolio’s average daily net assets and is payable monthly.
Pursuant to a Sub-Investment Advisory Agreement between Dreyfus and Jennison, the sub-investment advisory fee is payable monthly by Dreyfus, and is based upon the value of the portfolio’s average daily net assets, computed at the following annual rates: .50% of the first $300 million and .45% over $300 million.
Dreyfus has agreed, from January 1, 2006 to December 31, 2007 to waive receipt of its fees and/or assume the expenses of the portfolio so that the expenses of neither class, exclusive of taxes, brokerage commissions, interest expense and extraordinary expenses, exceed 1% of the value of the average daily net assets of their class. During the period ended December 31, 2006, Dreyfus waived receipt of fees of $26,908, pursuant to the undertaking.
(b) Under the Distribution Plan (the “Plan”) adopted pursuant to Rule 12b-1 under the Act, Service shares pay the Distributor for distributing their shares, for servicing and/or maintaining Service shares shareholder accounts and for advertising and marketing for Service shares.The Plan provides for payments to be made at an annual rate of .25% of the value of the Service shares’ average daily net assets.The Distributor may make payments to Participating Insurance Companies and to brokers and dealers acting as principal underwriter for their variable insurance products.The fees payable under the Plan are payable without regard to actual expenses incurred. During the period ended December 31, 2006, Service shares were charged $12,185 pursuant to the Plan.
The portfolio compensates Dreyfus Transfer, Inc., a wholly-owned subsidiary of Dreyfus, under a transfer agency agreement for providing personnel and facilities to perform transfer agency services for the portfolio. During the period ended December 31, 2006, the portfolio was charged $61 pursuant to the transfer agency agreement.
During the period ended December 31, 2006, the portfolio was charged $4,204 for services performed by the Chief Compliance Officer.
The components of Due to The Dreyfus Corporation and affiliates in the Statement of Assets and Liabilities consist of: investment advisory fees $18,325, Rule 12b-1 distribution plan fees $1,053, custodian fees $7,677, chief compliance officer fees $2,044 and transfer agency per account fees $10, which are offset against an expense reimbursement currently in effect in the amount of $1,052.
(c) Each Board member also serves as a Board member of other funds within the Dreyfus complex. Annual retainer fees and attendance fees are allocated to each fund based on net assets.
(d) Pursuant to an exemptive order from the SEC, the portfolio may invest its available cash balances in affiliated money market mutual funds. Management fees of the underlying money market mutual funds have been waived by Dreyfus.
NOTE 4—Securities Transactions:
The aggregate amount of purchases and sales of investment securities, excluding short-term securities, during the period ended December 31, 2006, amounted to $21,764,220 and $27,827,259, respectively.
At December 31, 2006, the cost of investments for federal income tax purposes was $25,084,165; accordingly, accumulated net unrealized appreciation on investments was $3,397,518, consisting of $4,209,375 gross unrealized appreciation and $811,857 gross unrealized depreciation.
REPORT OF INDEPENDENT REGISTERED PUBLIC ACCOUNTING FIRM
Shareholders and Board of Trustees
Dreyfus Variable Investment Fund, Special Value Portfolio
We have audited the accompanying statement of assets and liabilities, including the statement of investments, of Dreyfus Variable Investment Fund, Special Value Portfolio (one of the funds comprising Dreyfus Variable Investment Fund) as of December 31, 2006, and the related statement of operations for the year then ended, the statement of changes in net assets for each of the two years in the period then ended, and financial highlights for each of the years indicated therein. These financial statements and financial highlights are the responsibility of the Fund’s management. Our responsibility is to express an opinion on these financial statements and financial highlights based on our audits.
We conducted our audits in accordance with the standards of the Public Company Accounting Oversight Board (United States).Those standards require that we plan and perform the audit to obtain reasonable assurance about whether the financial statements and financial highlights are free of material misstatement.We were not engaged to perform an audit of the Fund’s internal control over financial reporting. Our audits included consideration of internal control over financial reporting as a basis for designing audit procedures that are appropriate in the circumstances, but not for the purpose of expressing an opinion on the effectiveness of the Fund’s internal control over financial reporting. Accordingly, we express no such opinion.An audit also includes examining, on a test basis, evidence supporting the amounts and disclosures in the financial statements and financial highlights, assessing the accounting principles used and significant estimates made by management, and evaluating the overall financial statement presentation. Our procedures included confirmation of securities owned as of December 31, 2006 by correspondence with the custodian and others or by other appropriate auditing procedures where replies from others were not received. We believe that our audits provide a reasonable basis for our opinion.
In our opinion, the financial statements and financial highlights referred to above present fairly, in all material respects, the financial position of Dreyfus Variable Investment Fund, Special Value Portfolio at December 31, 2006, the results of its operations for the year then ended, the changes in its net assets for each of the two years in the period then ended, and the financial highlights for each of the indicated years, in conformity with U.S. generally accepted accounting principles.

New York, New York
February 6, 2007
|
IMPORTANT TAX INFORMATION (Unaudited)
For federal tax purposes, the portfolio hereby designates $1.0530 per share as a long-term capital gain distribution paid on March 29, 2006 and also the portfolio hereby designates 16.79% of the ordinary dividends paid during the fiscal year ended December 31, 2006 as qualifying for the corporate dividends received deduction. Shareholders will receive notification in January 2007 of the percentage applicable to the preparation of their 2006 income tax returns.
PROXY RESULTS (Unaudited)
Dreyfus Variable Investment Fund held a special meeting of shareholders on June 29, 2006.The proposal considered at the meeting, and the results, are as follows:
| | | | | Shares | | |
| |
| |
| |
|
| | | Votes For | | | | Authority Withheld |
| |
| |
| |
|
| To elect additional Board Members: | | | | | | |
| Peggy C. Davis † | | 171,078,927 | | | | 7,687,714 |
| Joseph S. DiMartino | | 170,946,484 | | | | 7,820,156 |
| David P. Feldman | | 170,959,921 | | | | 7,806,720 |
| Ehud Houminer † | | 170,132,087 | | | | 8,634,554 |
| Gloria Messinger † | | 170,187,241 | | | | 8,579,400 |
| Anne Wexler † | | 170,212,607 | | | | 8,554,033 |
† Each new Board member’s term commenced on September 26, 2006.
In addition to Joseph S. DiMartino and David P. Feldman, James F. Henry, Dr. Paul A. Marks and Dr. Martin Peretz continue as Board members of the fund.
BOARD MEMBERS INFORMATION (Unaudited)
Joseph S. DiMartino (63)
Chairman of the Board (1995)
|
Principal Occupation During Past 5 Years:
• Corporate Director and Trustee
|
Other Board Memberships and Affiliations:
|
- The Muscular Dystrophy Association, Director
- Century Business Services, Inc., a provider of outsourcing functions for small and medium size companies, Director
- The Newark Group, a provider of a national market of paper recovery facilities, paperboard mills and paperboard converting plants, Director
- Sunair Services Corporation, engaging in the design, manufacture and sale of high frequency systems for long-range voice and data communications, as well as providing certain outdoor-related services to homes and businesses, Director
No. of Portfolios for which Board Member Serves: 190
———————
Peggy C. Davis (63) Board Member (2006)
Principal Occupation During Past 5 Years:
|
- Shad Professor of Law, New York University School of Law (1983-present)
- Writer and teacher in the fields of evidence, constitutional theory, family law, social sciences and the law, legal process and professional methodology and training
No. of Portfolios for which Board Member Serves: 80
|
David P. Feldman (67)
Board Member (1994)
|
Principal Occupation During Past 5 Years:
• Corporate Director and Trustee
|
Other Board Memberships and Affiliations:
|
- BBH Mutual Funds Group (11 funds), Director
- The Jeffrey Company, a private investment company, Director
- QMED, a medical device company, Director
No. of Portfolios for which Board Member Serves: 57
|
James F. Henry (76)
Board Member (1990)
|
Principal Occupation During Past 5 Years:
|
- President,The International Institute for Conflict Prevention and Resolution, a non-profit organization principally engaged in the development of alternatives to business litigation (Retired 2003)
- Advisor to The Elaw Forum, a consultant on managing corporate legal costs
- Advisor to John Jay Homestead (the restored home of the first U.S. Chief Justice)
- Individual Trustee of several trusts
Other Board Memberships and Affiliations:
|
- Director, advisor and mediator involved in several non-profit organizations, primarily engaged in domestic and international dispute resolution, and historic preservation
No. of Portfolios for which Board Member Serves: 48
|
———————
Ehud Houminer (66) Board Member (2006)
Principal Occupation During Past 5 Years:
• Executive-in-Residence at the Columbia Business School, Columbia University
Other Board Memberships and Affiliations:
|
- Avnet Inc., an electronics distributor, Director
- International Advisory Board to the MBA Program School of Management, Ben Gurion University, Chairman
- Explore Charter School, Brooklyn, NY, Chairman
No. of Portfolios for which Board Member Serves: 78
———————
Gloria Messinger (77) Board Member (2006)
Principal Occupation During Past 5 Years:
|
- Arbitrator for American Arbitration Association and National Association of Securities Dealers, Inc.
- Consultant in Intellectual Property
Other Board Memberships and Affiliations:
|
- Theater for a New Audience, Inc., Director
- Brooklyn Philharmonic, Director
No. of Portfolios for which Board Member Serves: 48
|
BOARD MEMBERS INFORMATION (Unaudited) (continued)
| | Dr. Martin Peretz (67)
Board Member (1990)
|
| | Principal Occupation During Past 5 Years:
|
- Editor-in-Chief of The New Republic Magazine
- Lecturer in Social Studies at Harvard University (1965-2002)
- Director of TheStreet.com, a financial information service on the web
| | Other Board Memberships and Affiliations:
|
- American Council of Trustees and Alumni, Director
- Pershing Square Capital Management, Adviser
- Montefiore Ventures, General Partner
- Harvard Center for Blood Research,Trustee
- Bard College,Trustee
- Board of Overseers of YIVO Institute for Jewish Research, Chairman
No. of Portfolios for which Board Member Serves: 48
———————
Anne Wexler (76) Board Member (2006)
| | Principal Occupation During Past 5 Years:
|
- Chairman of the Wexler & Walker Public Policy Associates, consultants specializing in government relations and public affairs
| | Other Board Memberships and Affiliations:
|
- Wilshire Mutual Funds (5 funds), Director
- Methanex Corporation, a methanol producing company, Director
- Member of the Council of Foreign Relations
- Member of the National Park Foundation
| | No. of Portfolios for which Board Member Serves: 57
|
Once elected all Board Members serve for an indefinite term, but achieve Emeritus status on December 31st of the calendar year in which the Board Member reaches age 80.The address of the Board Members and Officers is in c/o The Dreyfus Corporation, 200 Park Avenue, New York, New York 10166. Additional information about the Board Members is available in the fund’s Statement of Additional Information which can be obtained from Dreyfus free of charge by calling this toll free number: 1-800-554-4611.
| John M. Fraser, Jr., Emeritus Board Member |
| Rosalind G. Jacobs, Emeritus Board Member |
| Dr. Paul A. Marks, Emeritus Board Member |
OFFICERS OF THE FUND (Unaudited)
J. DAVID OFFICER, President since December 2006.
Chief Operating Officer,Vice Chairman and a director of the Manager, and an officer of 90 investment companies (comprised of 190 portfolios) managed by the Manager. He is 58 years old and has been an employee of the Manager since April 1, 1998.
MARK N. JACOBS, Vice President since March 2000.
Executive Vice President, Secretary and General Counsel of the Manager, and an officer of 91 investment companies (comprised of 206 portfolios) managed by the Manager. He is 60 years old and has been an employee of the Manager since June 1977.
MICHAEL A. ROSENBERG, Vice President and Secretary since August 2005.
Associate General Counsel of the Manager, and an officer of 91 investment companies (comprised of 206 portfolios) managed by the Manager. He is 46 years old and has been an employee of the Manager since October 1991.
JAMES BITETTO, Vice President and Assistant Secretary since August 2005.
Associate General Counsel and Assistant Secretary of the Manager, and an officer of 91 investment companies (comprised of 206 portfolios) managed by the Manager. He is 40 years old and has been an employee of the Manager since December 1996.
JONI LACKS CHARATAN, Vice President and Assistant Secretary since August 2005.
Associate General Counsel of the Manager, and an officer of 91 investment companies (comprised of 206 portfolios) managed by the Manager. She is 51 years old and has been an employee of the Manager since October 1988.
JOSEPH M. CHIOFFI, Vice President and Assistant Secretary since August 2005.
Associate General Counsel of the Manager, and an officer of 91 investment companies (comprised of 206 portfolios) managed by the Manager. He is 45 years old and has been an employee of the Manager since June 2000.
JANETTE E. FARRAGHER, Vice President and Assistant Secretary since August 2005.
Associate General Counsel of the Manager, and an officer of 91 investment companies (comprised of 206 portfolios) managed by the Manager. She is 44 years old and has been an employee of the Manager since February 1984.
JOHN B. HAMMALIAN, Vice President and Assistant Secretary since August 2005.
Associate General Counsel of the Manager, and an officer of 91 investment companies (comprised of 206 portfolios) managed by the Manager. He is 43 years old and has been an employee of the Manager since February 1991.
ROBERT R. MULLERY, Vice President and Assistant Secretary since August 2005.
Associate General Counsel of the Manager, and an officer of 91 investment companies (comprised of 206 portfolios) managed by the Manager. He is 54 years old and has been an employee of the Manager since May 1986.
JEFF PRUSNOFSKY, Vice President and Assistant Secretary since August 2005.
Associate General Counsel of the Manager, and an officer of 91 investment companies (comprised of 206 portfolios) managed by the Manager. He is 41 years old and has been an employee of the Manager since October 1990.
OFFICERS OF THE FUND (Unaudited) (continued)
JAMES WINDELS, Treasurer since November 2001.
Director – Mutual Fund Accounting of the Manager, and an officer of 91 investment companies (comprised of 206 portfolios) managed by the Manager. He is 48 years old and has been an employee of the Manager since April 1985.
ERIK D. NAVILOFF, Assistant Treasurer since December 2002.
Senior Accounting Manager – Taxable Fixed Income Funds of the Manager, and an officer of 91 investment companies (comprised of 206 portfolios) managed by the Manager. He is 38 years old and has been an employee of the Manager since November 1992.
ROBERT ROBOL, Assistant Treasurer since August 2003.
Senior Accounting Manager – Money Market and Municipal Bond Funds of the Manager, and an officer of 91 investment companies (comprised of 206 portfolios) managed by the Manager. He is 42 years old and has been an employee of the Manager since October 1988.
ROBERT SVAGNA, Assistant Treasurer since December 2002.
Senior Accounting Manager – Equity Funds of the Manager, and an officer of 91 investment companies (comprised of 206 portfolios) managed by the Manager. He is 39 years old and has been an employee of the Manager since November 1990.
GAVIN C. REILLY, Assistant Treasurer since December 2005.
Tax Manager of the Investment Accounting and Support Department of the Manager, and an officer of 91 investment companies (comprised of 206 portfolios) managed by the Manager. He is 38 years old and has been an employee of the Manager since April 1991.
JOSEPH W. CONNOLLY, Chief Compliance Officer since October 2004.
Chief Compliance Officer of the Manager and The Dreyfus Family of Funds (91 investment companies, comprised of 206 portfolios). From November 2001 through March 2004, Mr. Connolly was first Vice-President, Mutual Fund Servicing for Mellon Global Securities Services. In that capacity, Mr. Connolly was responsible for managing Mellon’s Custody, Fund Accounting and Fund Administration services to third-party mutual fund clients. He is 49 years old and has served in various capacities with the Manager since 1980, including manager of the firm’s Fund Accounting Department from 1997 through October 2001.
WILLIAM GERMENIS, Anti-Money Laundering Compliance Officer since September 2002.
Vice President and Anti-Money Laundering Compliance Officer of the Distributor, and the Anti-Money Laundering Compliance Officer of 87 investment companies (comprised of 202 portfolios) managed by the Manager. He is 36 years old and has been an employee of the Distributor since October 1998.
| For More | | Information |
| |
|
| |
| |
| |
| Dreyfus Variable | | Custodian |
| |
| Investment Fund, | | |
| | | The Bank of New York |
| Special Value Portfolio | | |
| | | One Wall Street |
| 200 Park Avenue | | |
| | | New York, NY 10286 |
| New York, NY 10166 | | |
| |
| | | Transfer Agent & |
| |
| Investment Adviser | | Dividend Disbursing Agent |
| |
| The Dreyfus Corporation | | |
| | | Dreyfus Transfer, Inc. |
| 200 Park Avenue | | |
| | | 200 Park Avenue |
| New York, NY 10166 | | |
| | | New York, NY 10166 |
| |
| |
| Sub-Investment Adviser | | Distributor |
| |
| Jennison Associates LLC | | |
| | | Dreyfus Service Corporation |
| 466 Lexington Avenue | | |
| | | 200 Park Avenue |
| New York, NY 10017 | | |
| | | New York, NY 10166 |
| Telephone 1-800-554-4611 or 516-338-3300 |
| Mail | | The Dreyfus Family of Funds, 144 Glenn Curtiss Boulevard, Uniondale, NY 11556-0144 |
| | | Attn: Investments Division |
The portfolio files its complete schedule of portfolio holdings with the Securities and Exchange Commission (“SEC”) for the first and third quarters of each fiscal year on Form N-Q. The portfolio’s Forms N-Q are available on the SEC’s website at http://www.sec.gov and may be reviewed and copied at the SEC’s Public Reference Room in Washington, DC. Information on the operation of the Public Reference Room may be obtained by calling 1-202-551-8090.
A description of the policies and procedures that the portfolio uses to determine how to vote proxies relating to portfolio securities, and information regarding how the portfolio voted these proxies for the 12-month period ended June 30, 2006, is available at http://www.dreyfus.com and on the SEC’s website at http://www.sec.gov. The description of the policies and procedures is also available without charge, upon request, by calling 1-800-645-6561.

The Registrant has adopted a code of ethics that applies to the Registrant's principal executive officer, principal financial officer, principal accounting officer or controller, or persons performing similar functions. There have been no amendments to, or waivers in connection with, the Code of Ethics during the period covered by this Report.
| Item 3. | | Audit Committee Financial Expert. |
The Registrant's Board has determined that David P. Feldman, a member of the Audit Committee of the Board, is an audit committee financial expert as defined by the Securities and Exchange Commission (the "SEC"). David P. Feldman is "independent" as defined by the SEC for purposes of audit committee financial expert determinations.
| Item 4. | | Principal Accountant Fees and Services |
(a) Audit Fees. The aggregate fees billed for each of the last two fiscal years (the "Reporting Periods") for professional services rendered by the Registrant's principal accountant (the "Auditor") for the audit of the Registrant's annual financial statements, or services that are normally provided by the Auditor in connection with the statutory and regulatory filings or engagements for the Reporting Periods, were $243,347 in 2005 and $254,905 in 2006.
(b) Audit-Related Fees. The aggregate fees billed in the Reporting Periods for assurance and related services by the Auditor that are reasonably related to the performance of the audit of the Registrant's financial statements and are not reported under paragraph (a) of this Item 4 were $81,252 in 2005 and $84,427 in 2006. These services consisted of (i) agreed-upon procedures related to compliance with Internal Revenue Code section 817(h), and (ii) security counts required by Rule 17f-2 under the Investment Company Act of 1940, as amended.
The aggregate fees billed in the Reporting Periods for non-audit assurance and related services by the Auditor to the Registrant's investment adviser (not including any sub-investment adviser whose role is primarily portfolio management and is subcontracted with or overseen by another investment adviser), and any entity controlling, controlled by or under common control with the investment adviser that provides ongoing services to the Registrant ("Service Affiliates"), that were reasonably related to the performance of the annual audit of the Service Affiliate, which required pre-approval by the Audit Committee were $-0- in 2005 and $-0- in 2006.
Note: For the second paragraph in each of (b) through (d) of this Item 4, certain of such services were not pre-approved prior to May 6, 2003, when such services were required to be pre-approved. On and after May 6, 2003, 100% of all services provided by the Auditor were pre-approved as required. For comparative purposes, the fees shown assume that all such services were pre-approved, including services that were not pre-approved prior to the compliance date of the pre-approval requirement.
(c) Tax Fees. The aggregate fees billed in the Reporting Periods for professional services rendered by the Auditor for tax compliance, tax advice and tax planning ("Tax Services") were $35,640 in 2005 and $52,913 in 2006. These services consisted of (i) review or preparation of U.S. federal, state, local and excise tax
returns; (ii) U.S. federal, state and local tax planning, advice and assistance regarding statutory, regulatory or administrative developments, (iii) tax advice regarding tax qualification matters and/or treatment of various financial instruments held or proposed to be acquired or held, and (iv) determination of Passive Foreign Investment Companies (as applicable).
The aggregate fees billed in the Reporting Periods for Tax Services by the Auditor to Service Affiliates which required pre-approval by the Audit Committee were $-0- in 2005 and $-0- in 2006.
(d) All Other Fees. The aggregate fees billed in the Reporting Periods for products and services provided by the Auditor, other than the services reported in paragraphs (a) through (c) of this Item, were $13 in 2005 and $20 in 2006. These services consisted of a review of the Registrant's anti-money laundering program.
The aggregate fees billed in the Reporting Periods for Non-Audit Services by the Auditor to Service Affiliates, other than the services reported in paragraphs (b) through (c) of this Item, which required pre-approval by the Audit Committee were $-0- in 2005 and $-0- in 2006.
Audit Committee Pre-Approval Policies and Procedures. The Registrant's Audit Committee has established policies and procedures (the "Policy") for pre-approval (within specified fee limits) of the Auditor's engagements for non-audit services to the Registrant and Service Affiliates without specific case-by-case consideration. Pre-approval considerations include whether the proposed services are compatible with maintaining the Auditor's independence. Pre-approvals pursuant to the Policy are considered annually.
Non-Audit Fees. The aggregate non-audit fees billed by the Auditor for services rendered to the Registrant, and rendered to Service Affiliates, for the Reporting Periods were $758,091 in 2005 and $383,726 in 2006.
Auditor Independence. The Registrant's Audit Committee has considered whether the provision of non-audit services that were rendered to Service Affiliates which were not pre-approved (not requiring pre-approval) is compatible with maintaining the Auditor's independence.
| Item 5. | | Audit Committee of Listed Registrants. |
| | | Not applicable. | | [CLOSED-END FUNDS ONLY] |
| Item 6. | | Schedule of Investments. |
| | | Not applicable. | | |
| Item 7. | | Disclosure of Proxy Voting Policies and Procedures for Closed-End Management |
| | | Investment Companies. |
| | | Not applicable. | | [CLOSED-END FUNDS ONLY] |
| Item 8. | | Portfolio Managers of Closed-End Management Investment Companies. |
| | | Not applicable. | | [CLOSED-END FUNDS ONLY, beginning with reports for periods ended |
| | | | | on and after December 31, 2005] |
| Item 9. | | Purchases of Equity Securities by Closed-End Management Investment Companies and |
| | | Affiliated Purchasers. |
| | | Not applicable. | | [CLOSED-END FUNDS ONLY] |
Item 10. Submission of Matters to a Vote of Security Holders.
The Registrant has a Nominating Committee (the "Committee"), which is responsible for selecting and nominating persons for election or appointment by the Registrant's Board as Board members. The Committee has adopted a Nominating Committee Charter (the "Charter"). Pursuant to the Charter, the Committee will consider recommendations for nominees from shareholders submitted to the Secretary of the Registrant, c/o The Dreyfus Corporation Legal Department, 200 Park Avenue, 8th Floor East, New York, New York 10166. A nomination submission must include information regarding the recommended nominee as specified in the Charter. This information includes all information relating to a recommended nominee that is required to be disclosed in solicitations or proxy statements for the election of Board members, as well as information sufficient to evaluate the factors to be considered by the Committee, including character and integrity, business and professional experience, and whether the person has the ability to apply sound and independent business judgment and would act in the interests of the Registrant and its shareholders.
Nomination submissions are required to be accompanied by a written consent of the individual to stand for election if nominated by the Board and to serve if elected by the shareholders, and such additional information must be provided regarding the recommended nominee as reasonably requested by the Committee.
| Item 11. | | Controls and Procedures. |
(a) The Registrant's principal executive and principal financial officers have concluded, based on their evaluation of the Registrant's disclosure controls and procedures as of a date within 90 days of the filing date of this report, that the Registrant's disclosure controls and procedures are reasonably designed to ensure that information required to be disclosed by the Registrant on Form N-CSR is recorded, processed, summarized and reported within the required time periods and that information required to be disclosed by the Registrant in the reports that it files or submits on Form N-CSR is accumulated and communicated to the Registrant's management, including its principal executive and principal financial officers, as appropriate to allow timely decisions regarding required disclosure.
(b) There were no changes to the Registrant's internal control over financial reporting that occurred during the second fiscal quarter of the period covered by this report that have materially affected, or are reasonably likely to materially affect, the Registrant's internal control over financial reporting.
| (a)(1) | | Code of ethics referred to in Item 2. |
| (a)(2) | | Certifications of principal executive and principal financial officers as required by Rule 30a-2(a) |
| under the Investment Company Act of 1940. |
| (a)(3) | | Not applicable. |
| (b) | | Certification of principal executive and principal financial officers as required by Rule 30a-2(b) |
| under the Investment Company Act of 1940. |
Pursuant to the requirements of the Securities Exchange Act of 1934 and the Investment Company Act of 1940, the Registrant has duly caused this Report to be signed on its behalf by the undersigned, thereunto duly authorized.
| | Dreyfus Variable Investment Fund
|

Pursuant to the requirements of the Securities Exchange Act of 1934 and the Investment Company Act of 1940, this Report has been signed below by the following persons on behalf of the Registrant and in the capacities and on the dates indicated.

| | | EXHIBIT INDEX |
| (a)(1) | | Code of ethics referred to in Item 2. |
| (a)(2) | | Certifications of principal executive and principal financial officers as required by Rule 30a- |
| 2(a) under the Investment Company Act of 1940. (EX-99.CERT) |
| (b) | | Certification of principal executive and principal financial officers as required by Rule 30a- |
| 2(b) under the Investment Company Act of 1940. (EX-99.906CERT) |