| | | UNITED STATES |
| | | SECURITIES AND EXCHANGE COMMISSION |
| | | Washington, D.C. 20549 |
| |
| |
| | | FORM N-CSR |
| |
| CERTIFIED SHAREHOLDER REPORT OF REGISTERED MANAGEMENT |
| | | INVESTMENT COMPANIES |
| |
| Investment Company Act file number 811-5125 |
| |
| | | Dreyfus Variable Investment Fund |
| | | (Exact name of Registrant as specified in charter) |
| |
| |
| | | c/o The Dreyfus Corporation |
| | | 200 Park Avenue |
| | | New York, New York 10166 |
| | | (Address of principal executive offices) (Zip code) |
| |
| | | Mark N. Jacobs, Esq. |
| | | 200 Park Avenue |
| | | New York, New York 10166 |
| | | (Name and address of agent for service) |
| |
| Registrant's telephone number, including area code: (212) 922-6000 |
| |
| Date of fiscal year end: | | 12/31 |
| |
| Date of reporting period: | | 12/31/05 |
P:\Edgar Filings\Pending\117\NCSRA-117-2-2006\formncsr117.DOC
| Item 1. | | Reports to Stockholders. |

The views expressed in this report reflect those of the portfolio manager only through the end of the period covered and do not necessarily represent the views of Dreyfus or any other person in the Dreyfus organization.Any such views are subject to change at any time based upon market or other conditions and Dreyfus disclaims any responsibility to update such views. These views may not be relied on as investment advice and, because investment decisions for a Dreyfus portfolio are based on numerous factors, may not be relied on as an indication of trading intent on behalf of any Dreyfus portfolio.
Not FDIC-Insured • Not Bank-Guaranteed • May Lose Value
| | | Contents |
| |
| | | T H E P O R T F O L I O |
| |
|
| 2 | | Letter from the Chairman |
| 3 | | Discussion of Performance |
| 6 | | Portfolio Performance |
| 8 | | Understanding Your Portfolio’s Expenses |
| 8 | | Comparing Your Portfolio’s Expenses |
| | | With Those of Other Funds |
| 9 | | Statement of Investments |
| 12 | | Statement of Assets and Liabilities |
| 13 | | Statement of Operations |
| 14 | | Statement of Changes in Net Assets |
| 16 | | Financial Highlights |
| 18 | | Notes to Financial Statements |
| 25 | | Report of Independent Registered |
| | | Public Accounting Firm |
| 26 | | Important Tax Information |
| 27 | | Board Members Information |
| 29 | | Officers of the Fund |
| | | F O R M O R E I N F O R M AT I O N |
| |
|
| | | Back Cover |
| Dreyfus Variable Investment Fund, |
| Appreciation Portfolio |

LETTER FROM THE CHAIRMAN
Dear Shareholder:
We are pleased to present this annual report for Dreyfus Variable Investment Fund, Appreciation Portfolio, covering the 12-month period from January 1, 2005, through December 31, 2005. Inside, you’ll find valuable information about how the portfolio was managed during the reporting period, including a discussion with the portfolio manager, Fayez Sarofim, of Fayez Sarofim & Co., the portfolio’s sub-investment adviser.
Stocks generally absorbed both good and bad news in 2005 to post modestly positive total returns. On the plus side, an expanding U.S. economy and low inflation helped support corporate earnings in most industry groups. Negative influences included rising short-term interest rates and escalating energy prices, which many analysts feared might erode corporate profits. In addition, hurricanes Katrina, Rita and Wilma disrupted economic activity along the Gulf Coast.
We expect the U.S. economy to continue its moderate expansion in 2006, fueled in part by a rebound in corporate capital spending and exports. The labor market likely will remain relatively strong while inflation should stay low, supporting consumers’ real incomes. Risks in the new year include the possible end of the boom in the housing market, where we believe prices are more likely to stall than plunge.
As always, we encourage you to speak with your financial consultant about how these and other market forces may affect your investments. Thank you for your continued confidence and support.

DISCUSSION OF PERFORMANCE
Fayez Sarofim, Portfolio Manager
Fayez Sarofim & Co., Sub-Investment Adviser
How did Dreyfus Variable Investment Fund, Appreciation Portfolio perform relative to its benchmark?
For the 12-month period ended December 31, 2005, the portfolio’s Initial shares produced a total return of 4.38%, and its Service shares produced a total return of 4.12% .1 For the same period, the total return of the portfolio’s benchmark, the Standard & Poor’s 500 Composite Stock Price Index (“S&P 500 Index”), was 4.91% .2
After lackluster performance for much of the year, stocks rallied modestly toward the end of 2005, when oil prices moderated and investors looked forward to the end of the interest-rate hikes of the Federal Reserve Board (the “Fed”). The portfolio’s returns were roughly in line with its benchmark, as above-average returns among consumer-oriented companies were balanced by disappointments in the health care and financials sectors.
What is the portfolio’s investment approach?
The portfolio normally invests at least 80% of its assets in common stocks. The portfolio focuses on large, well-established multinational growth companies that have demonstrated sustained patterns of profitability, strong balance sheets, an expanding global presence and the potential to achieve predictable above-average earnings growth. We focus on purchasing reasonably priced growth stocks of fundamentally sound companies in economic sectors that we believe will expand over the next three to five years or longer.
What other factors influenced the portfolio’s performance?
Despite steady economic growth and rising corporate earnings, returns from the U.S. stock market were limited during much of 2005 by investors’ concerns regarding rising interest rates and surging energy prices.The Fed raised short-term interest rates at each of eight scheduled meetings during the year, driving the overnight federal funds rate from 2.25% to 4.25% . Contrary to historical norms, however, these moves did
DISCUSSION OF PERFORMANCE (continued)
|
not cause longer-term bond yields to rise significantly, helping to contain corporate borrowing costs.While sharply higher energy costs threatened to erode profit margins of industrial companies that use oil and gas in their manufacturing processes, other market sectors — most notably energy and utilities — benefited from higher commodity prices.
Toward the end of the year, investors began to look forward to the possibility of an end to the Fed’s rate hikes, and market sentiment began to improve.Although the ensuing rally was relatively modest,it was led by large, well-established companies with track records of consistent earnings. However, as they have for the past several years, smaller, more speculative stocks generally posted higher returns for 2005 overall.
The portfolio received particularly strong contributions to its performance from consumer-oriented stocks. In the consumer discretionary area, publisher McGraw Hill enjoyed strong results in its Standard & Poor’s division, and luxury apparel company Christian Dior benefited from strong spending trends among affluent consumers. Similarly, mass merchandiser Target achieved improved results by focusing on higher-end mass merchandising consumers.
Among consumer staples companies, longtime holding Altria Group, the food and tobacco giant, gained substantial value as litigation concerns eased and investors looked forward to a corporate reorganization designed to unlock shareholder value. Pharmacy chain Walgreen and snack and beverage maker PepsiCo also fared well when business fundamentals improved in the growing economy.
While the portfolio participated in gains produced by the energy sector amid soaring oil and gas prices, its energy returns fell short of the bench-mark.This was primarily due to our focus on integrated oil companies at a time in which smaller oil services companies fared even better.
The portfolio’s health care investments detracted from its relative performance. Large pharmaceutical companies, including portfolio holdings Pfizer and Merck, suffered from safety-related product issues, concerns regarding the effects of the new Medicare prescription drug benefit and anemic new product pipelines. Other disappointments included retailer Wal-Mart, which was hurt by the effects of higher fuel prices on its customers, and mortgage agency Fannie Mae, where accounting irregularities raised regulatory concerns.
In light of these and other company-specific issues, we reduced the portfolio’s positions in Merck and Pfizer, and we eliminated the portfolio’s holdings of Fannie Mae, its sister agency Freddie Mac, insurance holdings American International Group and Marsh & McLennan, and food purveyor Kraft during the reporting period. Instead, we established new positions in payroll and benefits processor Automatic Data Processing, industrial gases manufacturer Praxair, global energy producer Total and health insurer UnitedHealth Group, all of which appear poised for growth under favorable market conditions.
What is the portfolio’s current strategy?
In the context of moderating economic and profit growth, investors are likely to reward companies for their ability to sustain organic growth, not just for improved balance sheets and reduced risk profiles.The high-quality multinationals that are the focus of our strategy have the resources to reinvest in their businesses and extend their established records of earnings and dividend increases. Over the last six years, these companies have seen their price/earnings multiples contract and their valuations relative to small- and midcap issues compress.These trends, which are typical early in an expansion, have persisted much longer than usual in the current cycle but are beginning to shift.The globally competitive industry leaders in the portfolio are positioned to benefit as financial conditions become more restrictive and a premium for quality returns to the market.
| | | The portfolio is only available as a funding vehicle under variable life insurance policies or variable |
| | | annuity contracts issued by insurance companies. Individuals may not purchase shares of the |
| | | portfolio directly. A variable annuity is an insurance contract issued by an insurance company that |
| | | enables investors to accumulate assets on a tax-deferred basis for retirement or other long-term |
| | | goals.The investment objective and policies of Dreyfus Variable Investment Fund, Appreciation |
| | | Portfolio made available through insurance products may be similar to other funds/portfolios |
| | | managed or advised by Dreyfus. However, the investment results of the portfolio may be higher or |
| | | lower than, and may not be comparable to, those of any other Dreyfus fund/portfolio. |
| 1 | | Total return includes reinvestment of dividends and any capital gains paid. Past performance is no |
| | | guarantee of future results. Share price and investment return fluctuate such that upon redemption, |
| | | portfolio shares may be worth more or less than their original cost.The portfolio’s performance does |
| | | not reflect the deduction of additional charges and expenses imposed in connection with investing |
| | | in variable insurance contracts, which will reduce returns. |
| 2 | | SOURCE: LIPPER INC. — Reflects monthly reinvestment of dividends and, where |
| | | applicable, capital gain distributions.The Standard & Poor’s 500 Composite Stock Price Index is |
| | | a widely accepted, unmanaged index of U.S. stock market performance. |

| Average Annual Total Returns as of | | 12/31/05 | | | | |
| |
| | | 1 Year | | 5 Years | | 10 Years |
| |
| |
| |
|
| Initial shares | | 4.38% | | 0.07% | | 8.81% |
| Service shares | | 4.12% | | (0.20)% | | 8.66% |
| |
| The data for Service shares includes the results of Initial shares for the period prior to December 31, 2000 |
| (inception date of Service shares). Actual Service shares’ average annual total return and hypothetical growth |
| results would have been lower. See notes below. | | | | | | |
| † Source: Lipper Inc. | | | | | | |
| Past performance is not predictive of future performance.The portfolio’s performance shown in the graph and table does not |
| reflect the deduction of taxes that a shareholder would pay on portfolio distributions or the redemption of portfolio shares. |
| The portfolio’s performance does not reflect the deduction of additional charges and expenses imposed in |
| connection with investing in variable insurance contracts which will reduce returns. | | |
| The above graph compares a $10,000 investment made in Initial and Service shares of Dreyfus Variable Investment |
| Fund, Appreciation Portfolio on 12/31/95 to a $10,000 investment made in the Standard & Poor’s 500 Composite |
| Stock Price Index (the “Index”) on that date. | | | | | | |
6
The portfolio’s Initial shares are not subject to a Rule 12b-1 fee.The portfolio’s Service shares are subject to a 0.25% annual Rule 12b-1 fee.The performance figures for Service shares reflect the performance of the portfolio’s Initial shares from their inception date through December 30, 2000, and the performance of the portfolio’s Service shares from December 31, 2000 (inception date of Service shares) to December 31, 2005 (blended performance figures).The blended performance figures have not been adjusted to reflect the higher operating expenses of the Service shares. If these expenses had been reflected, the blended performance figures would have been lower. All dividends and capital gain distributions are reinvested.
The portfolio’s performance shown in the line graph takes into account all applicable portfolio fees and expenses.The Index is a widely accepted, unmanaged index of U.S. stock market performance, which does not take into account charges, fees and other expenses. Further information relating to portfolio performance, including expense reimbursements, if applicable, is contained in the Financial Highlights section of the prospectus and elsewhere in this report.
UNDERSTANDING YOUR PORTFOLIO’S EXPENSES (Unaudited)
As a mutual fund investor,you pay ongoing expenses,such as management fees and other expenses.Using the information below,you can estimate how these expenses affect your investment and compare them with the expenses of other funds.You also may pay one-time transaction expenses,including sales charges (loads) and redemption fees, which are not shown in this section and would have resulted in higher total expenses. For more information, see your portfolio’s prospectus or talk to your financial adviser.
Review your portfolio’s expenses
The table below shows the expenses you would have paid on a $1,000 investment in Dreyfus Variable Investment Fund,Appreciation Portfolio from July 1, 2005 to December 31, 2005. It also shows how much a $1,000 investment would be worth at the close of the period, assuming actual returns and expenses.
| Expenses and Value of a $1,000 Investment | | |
| assuming actual returns for the six months ended December 31, 2005 |
| | | Initial Shares | | Service Shares |
| |
| |
|
| Expenses paid per $1,000 † | | $ 4.00 | | $ 5.28 |
| Ending value (after expenses) | | $1,036.90 | | $1,035.60 |
COMPARING YOUR PORTFOLIO’S EXPENSES WITH THOSE OF OTHER FUNDS (Unaudited)
Using the SEC’s method to compare expenses
The Securities and Exchange Commission (SEC) has established guidelines to help investors assess fund expenses. Per these guidelines, the table below shows your portfolio’s expenses based on a $1,000 investment, assuming a hypothetical 5% annualized return. You can use this information to compare the ongoing expenses (but not transaction expenses or total cost) of investing in the portfolio with those of other funds. All mutual fund shareholder reports will provide this information to help you make this comparison. Please note that you cannot use this information to estimate your actual ending account balance and expenses paid during the period.
Expenses and Value of a $1,000 Investment assuming a hypothetical 5% annualized return for the six months ended December 31, 2005
| | | Initial Shares | | Service Shares |
| |
| |
|
| Expenses paid per $1,000 † | | $ 3.97 | | $ 5.24 |
| Ending value (after expenses) | | $1,021.27 | | $1,020.01 |
| † Expenses are equal to the portfolio’s annualized expense ratio of .78% for Initial shares and 1.03% for Service shares, |
| multiplied by the average account value over the period, multiplied by 184/365 (to reflect the one-half year period). |
| | STATEMENT OF INVESTMENTS
December 31, 2005
|
| Common Stocks—99.5% | | Shares | | Value ($) |
| |
| |
|
| Apparel—.8% | | | | |
| Christian Dior | | 72,700 a | | 6,457,816 |
| Beverages—7.8% | | | | |
| Anheuser-Busch Cos. | | 195,100 | | 8,381,496 |
| Coca-Cola | | 664,500 | | 26,785,995 |
| PepsiCo | | 445,900 | | 26,343,772 |
| | | | | 61,511,263 |
| Consumer Discretionary—8.5% | | | | |
| McDonald’s | | 304,500 | | 10,267,740 |
| McGraw-Hill Cos. | | 501,600 | | 25,897,608 |
| News, Cl. B | | 9,800 a | | 162,778 |
| Polo Ralph Lauren | | 125,500 | | 7,045,570 |
| Target | | 256,900 | | 14,121,793 |
| Time Warner | | 226,800 | | 3,955,392 |
| Viacom, Cl. B | | 150,300 b | | 4,899,780 |
| | | | | 66,350,661 |
| Consumer Staples—17.6% | | | | |
| Altria Group | | 850,400 | | 63,541,888 |
| Nestle, ADR | | 291,000 | | 21,738,709 |
| Sysco | | 80,000 | | 2,484,000 |
| Wal-Mart Stores | | 439,700 | | 20,577,960 |
| Walgreen | | 649,900 | | 28,764,574 |
| Whole Foods Market | | 18,000 a | | 1,393,020 |
| | | | | 138,500,151 |
| Cosmetics/Personal Care—5.7% | | | | |
| Colgate-Palmolive | | 140,000 | | 7,679,000 |
| Estee Lauder Cos., Cl. A | | 145,500 a | | 4,871,340 |
| Procter & Gamble | | 560,000 | | 32,412,800 |
| | | | | 44,963,140 |
| Energy—18.3% | | | | |
| BP, ADR | | 455,900 | | 29,277,898 |
| Chevron | | 445,800 | | 25,308,066 |
| ConocoPhillips | | 205,000 | | 11,926,900 |
| Exxon Mobil | | 1,080,064 | | 60,667,195 |
| Occidental Petroleum | | 65,000 | | 5,192,200 |
| Royal Dutch Shell, Cl. A, ADR | | 59,800 | | 3,677,102 |
| Total, ADR | | 60,000 a | | 7,584,000 |
| | | | | 143,633,361 |
The Portfolio 9
STATEMENT OF INVESTMENTS (continued)
|
| Common Stocks (continued) | | Shares | | Value ($) |
| |
| |
|
| Financial—13.8% | | | | |
| American Express | | 307,500 | | 15,823,950 |
| American International Group | | 105,920 | | 7,226,921 |
| Ameriprise Financial | | 61,500 | | 2,521,500 |
| Bank of America | | 291,216 | | 13,439,618 |
| Citigroup | | 601,524 | | 29,191,960 |
| HSBC Holdings, ADR | | 30,000 | | 2,414,100 |
| JPMorgan Chase & Co. | | 451,100 | | 17,904,159 |
| Merrill Lynch & Co. | | 145,500 | | 9,854,715 |
| SunTrust Banks | | 130,600 | | 9,502,456 |
| | | | | 107,879,379 |
| Health Care—10.1% | | | | |
| Abbott Laboratories | | 324,100 | | 12,779,263 |
| Eli Lilly & Co. | | 261,900 | | 14,820,921 |
| Johnson & Johnson | | 360,000 | | 21,636,000 |
| Merck & Co. | | 210,000 | | 6,680,100 |
| Pfizer | | 630,000 | | 14,691,600 |
| Roche Holding, ADR | | 64,000 | | 4,800,487 |
| UnitedHealth Group | | 60,000 | | 3,728,400 |
| | | | | 79,136,771 |
| Industrial—7.7% | | | | |
| Emerson Electric | | 164,900 | | 12,318,030 |
| General Electric | | 1,115,500 | | 39,098,275 |
| United Parcel Service, Cl. B | | 116,800 | | 8,777,520 |
| | | | | 60,193,825 |
| Information Technology—7.7% | | | | |
| Automatic Data Processing | | 50,000 | | 2,294,500 |
| Intel | | 1,414,700 | | 35,310,912 |
| Microsoft | | 867,300 | | 22,679,895 |
| | | | | 60,285,307 |
| Materials—.3% | | | | |
| Praxair | | 50,000 | | 2,648,000 |
| Media—1.2% | | | | |
| News, Cl. A | | 606,436 | | 9,430,080 |
| Total Common Stocks | | | | |
| (cost $598,666,250) | | | | 780,989,754 |
| Investment of Cash Collateral | | | | |
| for Securities Loaned—2.0% | | Shares | | Value ($) |
| |
| |
|
| Registered Investment Company; | | | | |
| Dreyfus Institutional Cash Advantage Fund | | | | |
| (cost $15,240,760) | | 15,240,760 c | | 15,240,760 |
| |
| |
|
| Total Investments (cost $613,907,010) | | 101.5% | | 796,230,514 |
| Liabilities, Less Cash and Receivables | | (1.5%) | | (11,391,160) |
| Net Assets | | 100.0% | | 784,839,354 |
| ADR—American Depository Receipts. |
| a All or a portion of these securities are on loan. At December 31, 2005, the total market value of the portfolio’s |
| securities on loan is $13,953,570 and the total market value of the collateral held by the portfolio is $15,240,760. |
| b Non-income producing. |
| c Investment in affiliated money market mutual fund. |
| Portfolio Summary † | | | | | | |
| |
| | | Value (%) | | | | Value (%) |
| |
| |
| |
|
| Energy | | 18.3 | | Industrial | | 7.7 |
| Consumer Staples | | 17.6 | | Information Technology | | 7.7 |
| Financial | | 13.8 | | Cosmetics/Personal Care | | 5.7 |
| Health Care | | 10.1 | | Money Market Investment | | 2.0 |
| Consumer Discretionary | | 8.5 | | Other | | 2.3 |
| Beverages | | 7.8 | | | | 101.5 |
| |
| † Based on net assets. | | | | | | |
| See notes to financial statements. | | | | | | |
STATEMENT OF ASSETS AND LIABILITIES
December 31, 2005
| | | Cost | | Value |
| |
| |
|
| Assets ($): | | | | |
| Investments in securities— | | | | |
| See Statement of Investments (including securities | | |
| on loan valued at $13,953,570)—Note 1(c): | | |
| Unaffiliated issuers | | 598,666,250 | | 780,989,754 |
| Affiliated issuers | | 15,240,760 | | 15,240,760 |
| Receivable for shares of Beneficial Interest subscribed | | 3,776,818 |
| Dividends receivable | | | | 1,347,774 |
| Prepaid expenses | | | | 49,541 |
| | | | | 801,404,647 |
| |
| |
|
| Liabilities ($): | | | | |
| Due to The Dreyfus Corporation and affiliates—Note 3(b) | | 337,021 |
| Due to Fayez Sarofim & Co. | | | | 215,757 |
| Liability for securities on loan—Note 1(c) | | 15,240,760 |
| Payable for shares of Beneficial Interest redeemed | | 620,844 |
| Cash overdraft due to custodian | | | | 63,000 |
| Interest payable—Note 2 | | | | 1,996 |
| Accrued expenses | | | | 85,915 |
| | | | | 16,565,293 |
| |
| |
|
| Net Assets ($) | | | | 784,839,354 |
| |
| |
|
| Composition of Net Assets ($): | | | | |
| Paid-in capital | | | | 631,385,064 |
| Accumulated undistributed investment income—net | | 11,942,179 |
| Accumulated net realized gain (loss) on investments | | (40,811,563) |
| Accumulated net unrealized appreciation (depreciation) | | |
| on investments and foreign currency transactions | | 182,323,674 |
| |
|
| Net Assets ($) | | | | 784,839,354 |
| |
| |
|
| |
| |
| Net Asset Value Per Share | | | | |
| | | Initial Shares | | Service Shares |
| |
| |
|
| Net Assets ($) | | 683,667,416 | | 101,171,938 |
| Shares Outstanding | | 18,422,041 | | 2,740,043 |
| |
| |
|
| Net Asset Value Per Share ($) | | 37.11 | | 36.92 |
See notes to financial statements.
|
STATEMENT OF OPERATIONS
Year Ended December 31, 2005
|
| Investment Income ($): | | |
| Income: | | |
| Cash dividends (net of $155,676 foreign taxes withheld at source): | | |
| Unaffiliated issuers | | 18,646,282 |
| Affiliated issuers | | 33,483 |
| Income from securities lending | | 52,841 |
| Total Income | | 18,732,606 |
| Expenses: | | |
| Investment advisory fee—Note 3(a) | | 3,527,538 |
| Sub-investment advisory fee—Note 3(a) | | 2,627,538 |
| Distribution fees—Note 3(b) | | 220,439 |
| Prospectus and shareholders’ reports | | 139,571 |
| Trustees’ fees and expenses—Note 3(c) | | 62,392 |
| Custodian fees—Note 3(b) | | 61,485 |
| Professional fees | | 57,582 |
| Interest expense—Note 2 | | 36,218 |
| Shareholder servicing costs—Note 3(b) | | 23,030 |
| Loan commitment fees—Note 2 | | 6,140 |
| Registration fees | | 799 |
| Miscellaneous | | 20,609 |
| Total Expenses | | 6,783,341 |
| Investment Income—Net | | 11,949,265 |
| |
|
| Realized and Unrealized Gain (Loss) on Investments—Note 4 ($): |
| Net realized gain (loss) on investments and foreign currency transactions | | 16,190,739 |
| Net unrealized appreciation (depreciation) on investments | | 6,752,030 |
| Net Realized and Unrealized Gain (Loss) on Investments | | 22,942,769 |
| Net Increase in Net Assets Resulting from Operations | | 34,892,034 |
See notes to financial statements.
|
STATEMENT OF CHANGES IN NET ASSETS
| | | Year Ended December 31, |
| |
|
| | | 2005 | | 2004 |
| |
| |
|
| Operations ($): | | | | |
| Investment income—net | | 11,949,265 | | 13,729,438 |
| Net realized gain (loss) on investments | | 16,190,739 | | (5,994,905) |
| Net unrealized appreciation | | | | |
| (depreciation) on investments | | 6,752,030 | | 33,662,361 |
| Net Increase (Decrease) in Net Assets | | | | |
| Resulting from Operations | | 34,892,034 | | 41,396,894 |
| |
| |
|
| Dividends to Shareholders from ($): | | | | |
| Investment income—net: | | | | |
| Initial shares | | (135,857) | | (12,718,082) |
| Service shares | | — | | (1,102,158) |
| Total Dividends | | (135,857) | | (13,820,240) |
| |
| |
|
| Beneficial Interest Transactions ($): | | | | |
| Net proceeds from shares sold: | | | | |
| Initial shares | | 56,572,319 | | 58,196,296 |
| Service shares | | 29,036,589 | | 21,783,851 |
| Dividends reinvested: | | | | |
| Initial shares | | 135,857 | | 12,718,082 |
| Service shares | | — | | 1,102,158 |
| Cost of shares redeemed: | | | | |
| Initial shares | | (170,386,472) | | (150,984,809) |
| Service shares | | (11,972,455) | | (34,135,074) |
| Increase (Decrease) in Net Assets from | | | | |
| Beneficial Interest Transactions | | (96,614,162) | | (91,319,496) |
| Total Increase (Decrease) in Net Assets | | (61,857,985) | | (63,742,842) |
| |
| |
|
| Net Assets ($): | | | | |
| Beginning of Period | | 846,697,339 | | 910,440,181 |
| End of Period | | 784,839,354 | | 846,697,339 |
| Undistributed investment income—net | | 11,942,179 | | 130,363 |
| | | Year Ended December 31, |
| |
|
| | | 2005 | | 2004 |
| |
| |
|
| Capital Share Transactions: | | | | |
| Initial Shares | | | | |
| Shares sold | | 1,561,261 | | 1,672,805 |
| Shares issued for dividends reinvested | | 3,818 | | 357,874 |
| Shares redeemed | | (4,688,720) | | (4,347,023) |
| Net Increase (Decrease) in Shares Outstanding | | (3,123,641) | | (2,316,344) |
| |
| |
|
| Service Shares | | | | |
| Shares sold | | 799,853 | | 629,793 |
| Shares issued for dividends reinvested | | — | | 31,090 |
| Shares redeemed | | (330,659) | | (987,230) |
| Net Increase (Decrease) in Shares Outstanding | | 469,194 | | (326,347) |
See notes to financial statements.
|
FINANCIAL HIGHLIGHTS
The following tables describe the performance for each share class for the fiscal periods indicated. All information (except portfolio turnover rate) reflects financial results for a single portfolio share.Total return shows how much your investment in the portfolio would have increased (or decreased) during each period, assuming you had reinvested all dividends and distributions.These figures have been derived from the portfolio’s financial statements.
| | | | | Year Ended December 31, | | |
| |
| |
| |
|
| Initial Shares | | 2005 | | 2004 | | 2003 | | 2002 | | 2001 |
| |
| |
| |
| |
| |
|
| Per Share Data ($): | | | | | | | | | | |
| Net asset value, beginning of period | | 35.56 | | 34.42 | | 28.79 | | 34.98 | | 38.91 |
| Investment Operations: | | | | | | | | | | |
| Investment income—net a | | .54 | | .56 | | .43 | | .36 | | .30 |
| Net realized and unrealized | | | | | | | | | | |
| gain (loss) on investments | | 1.02 | | 1.18 | | 5.64 | | (6.19) | | (3.93) |
| Total from Investment Operations | | 1.56 | | 1.74 | | 6.07 | | (5.83) | | (3.63) |
| Distributions: | | | | | | | | | | |
| Dividends from investment income—net | | (.01) | | (.60) | | (.44) | | (.36) | | (.30) |
| Net asset value, end of period | | 37.11 | | 35.56 | | 34.42 | | 28.79 | | 34.98 |
| |
| |
| |
| |
| |
|
| Total Return (%) | | 4.38 | | 5.05 | | 21.17 | | (16.71) | | (9.31) |
| |
| |
| |
| |
| |
|
| Ratios/Supplemental Data (%): | | | | | | | | | | |
| Ratio of total expenses | | | | | | | | | | |
| to average net assets | | .80 | | .79 | | .80 | | .78 | | .78 |
| Ratio of net investment income | | | | | | | | | | |
| to average net assets | | 1.48 | | 1.60 | | 1.41 | | 1.10 | | .84 |
| Portfolio Turnover Rate | | 2.67 | | 1.64 | | 4.60 | | 6.61 | | 4.19 |
| |
| |
| |
| |
| |
|
| Net Assets, end of period ($ x 1,000) | | 683,667 | | 766,169 | | 821,319 | | 722,706 | | 897,535 |
| | a Based on average shares outstanding at each month end.
See notes to financial statements.
|
| | | | | Year Ended December 31, | | |
| |
| |
| |
|
| Service Shares | | 2005 | | 2004 | | 2003 | | 2002 | | 2001 |
| |
| |
| |
| |
| |
|
| Per Share Data ($): | | | | | | | | | | |
| Net asset value, beginning of period | | 35.46 | | 34.31 | | 28.71 | | 34.89 | | 38.91 |
| Investment Operations: | | | | | | | | | | |
| Investment income—net a | | .45 | | .46 | | .36 | | .29 | | .18 |
| Net realized and unrealized | | | | | | | | | | |
| gain (loss) on investments | | 1.01 | | 1.19 | | 5.61 | | (6.17) | | (3.94) |
| Total from Investment Operations | | 1.46 | | 1.65 | | 5.97 | | (5.88) | | (3.76) |
| Distributions: | | | | | | | | | | |
| Dividends from investment income—net | | — | | (.50) | | (.37) | | (.30) | | (.26) |
| Net asset value, end of period | | 36.92 | | 35.46 | | 34.31 | | 28.71 | | 34.89 |
| |
| |
| |
| |
| |
|
| Total Return (%) | | 4.12 | | 4.80 | | 20.83 | | (16.89) | | (9.63) |
| |
| |
| |
| |
| |
|
| Ratios/Supplemental Data (%): | | | | | | | | | | |
| Ratio of total expenses | | | | | | | | | | |
| to average net assets | | 1.05 | | 1.04 | | 1.05 | | 1.02 | | 1.10 |
| Ratio of net investment income | | | | | | | | | | |
| to average net assets | | 1.24 | | 1.34 | | 1.16 | | .91 | | .53 |
| Portfolio Turnover Rate | | 2.67 | | 1.64 | | 4.60 | | 6.61 | | 4.19 |
| |
| |
| |
| |
| |
|
| Net Assets, end of period ($ x 1,000) | | 101,172 | | 80,529 | | 89,121 | | 60,572 | | 35,632 |
| |
| a Based on average shares outstanding at each month end. | | | | | | | | |
| See notes to financial statements. | | | | | | | | | | |
NOTES TO FINANCIAL STATEMENTS
NOTE 1—Significant Accounting Policies:
Dreyfus Variable Investment Fund (the “fund”) is registered under the Investment Company Act of 1940, as amended (the “Act”), as an open-end management investment company, operating as a series company currently offering twelve series,including the Appreciation Portfolio (the “portfolio”). The portfolio is only offered to separate accounts established by insurance companies to fund variable annuity contracts and variable life insurance policies. The portfolio is a diversified series. The portfolio’s investment objective is to provide long-term capital growth consistent with the preservation of capital.The Dreyfus Corporation (the “Manager” or “Dreyfus”) serves as the portfolio’s investment adviser. Dreyfus is a wholly-owned subsidiary of Mellon Financial Corporation (“Mellon Financial”). Fayez Sarofim & Co. (“Sarofim”) serves as the portfolio’s sub-investment adviser.
Dreyfus Service Corporation (the “Distributor”), a wholly-owned subsidiary of the Manager, is the distributor of the portfolio’s shares, which are sold without a sales charge. The portfolio is authorized to issue an unlimited number of $.001 par value shares of Beneficial Interest in each of the following classes of shares: Initial and Service. Each class of shares has identical rights and privileges, except with respect to the distribution plan and the expenses borne by each class and certain voting rights. Income, expenses (other than expenses attributable to a specific class), and realized and unrealized gains or losses on investments are allocated to each class of shares based on its relative net assets.
The fund accounts separately for the assets, liabilities and operations of each series. Expenses directly attributable to each series are charged to that series’ operations; expenses which are applicable to all series are allocated among them on a pro rata basis.
The portfolio’s financial statements are prepared in accordance with U.S. generally accepted accounting principles, which may require the use of management estimates and assumptions.Actual results could differ from those estimates.
The fund enters into contracts that contain a variety of indemnifica-tions.The portfolio’s maximum exposure under these arrangements is unknown. The portfolio does not anticipate recognizing any loss related to these arrangements.
(a) Portfolio valuation: Investments in securities are valued at the last sales price on the securities exchange or national securities market on which such securities are primarily traded. Securities listed on the National Market System for which market quotations are available are valued at the official closing price or, if there is no official closing price that day, at the last sales price. Securities not listed on an exchange or the national securities market, or securities for which there were no transactions, are valued at the average of the most recent bid and asked prices, except for open short positions, where the asked price is used for valuation purposes. Bid price is used when no asked price is available. Investments in registered investment companies are valued at their net asset value.When market quotations or official closing prices are not readily available, or are determined not to reflect accurately fair value, such as when the value of a security has been significantly affected by events after the close of the exchange or market on which the security is principally traded (for example, a foreign exchange or market), but before the portfolio calculates its net asset value, the portfolio may value these investments at fair value as determined in accordance with the procedures approved by the Board of Trustees. Fair valuing of securities may be determined with the assistance of a pricing service using calculations based on indices of domestic securities and other appropriate indicators, such as prices of relevant ADR’s and futures contracts. For other securities that are fair valued by the Board of Trustees, certain factors may be considered such as: fundamental analytical data, the nature and duration of restrictions on disposition, an evaluation of the forces that influence the market in which the securities are purchased and sold and public trading in similar securities of the issuer or comparable issuers. Financial futures are valued at the last sales price. Investments denominated in foreign currencies are
NOTES TO FINANCIAL STATEMENTS (continued)
|
translated to U.S. dollars at the prevailing rates of exchange. Forward currency exchange contracts are valued at the forward rate.
(b) Foreign currency transactions: The portfolio does not isolate that portion of the results of operations resulting from changes in foreign exchange rates on investments from the fluctuations arising from changes in market prices of securities held. Such fluctuations are included with the net realized and unrealized gain or loss on investments.
Net realized foreign exchange gains or losses arise from sales and maturities of short-term securities, sales of foreign currencies, currency gains or losses realized on securities transactions and the difference between the amounts of dividends, interest and foreign withholding taxes recorded on the portfolio’s books and the U.S. dollar equivalent of the amounts actually received or paid. Net unrealized foreign exchange gains or losses arise from changes in the value of assets and liabilities other than investments in securities, resulting from changes in exchange rates. Such gains and losses are included with net realized and unrealized gain or loss on investments.
(c) Securities transactions and investment income: Securities transactions are recorded on a trade date basis. Realized gain and loss from securities transactions are recorded on the identified cost basis. Dividend income is recognized on the ex-dividend date and interest income, including, where applicable, accretion of discount and amortization of premium on investments, is recognized on the accrual basis.
The portfolio has an arrangement with the custodian bank whereby the portfolio receives earnings credits from the custodian when positive cash balances are maintained, which are used to offset custody fees. For financial reporting purposes, the portfolio includes net earnings credits, if any, as an expense offset in the Statement of Operations.
Pursuant to a securities lending agreement with Mellon Bank, N.A., an affiliate of Dreyfus, the portfolio may lend securities to qualified institutions.At origination, all loans are secured by collateral of at least 102% of the value of U.S. securities loaned and 105% of the value of foreign securities loaned. Collateral equivalent to at least 100% of the
market value of securities on loan will be maintained at all times. Cash collateral is invested in certain money market mutual funds managed by Dreyfus. The portfolio will be entitled to receive all income on securities loaned, in addition to income earned as a result of the lending transaction. Although each security loaned is fully collateralized, the portfolio would bear the risk of delay in recovery of, or loss of rights in, the securities loaned should a borrower fail to return the securities in a timely manner.
(d) Affiliated issuers: Investments in other investment companies advised by Dreyfus are defined as “affiliated” in the Act.
(e) Dividends to shareholders: Dividends are recorded on the ex-dividend date. Dividends from investment income-net and dividends from net realized capital gain, if any, are normally declared and paid annually, but the portfolio may make distributions on a more frequent basis to comply with the distribution requirements of the Internal Revenue Code of 1986, as amended (the “Code”).To the extent that net realized capital gain can be offset by capital loss carryovers, it is the policy of the portfolio not to distribute such gain. Income and capital gain distributions are determined in accordance with income tax regulations, which may differ from U.S. generally accepted accounting principles.
(e) Federal income taxes: It is the policy of the portfolio to continue to qualify as a regulated investment company, if such qualification is in the best interests of its shareholders, by complying with the applicable provisions of the Code, and to make distributions of taxable income sufficient to relieve it from substantially all federal income and excise taxes.
At December 31, 2005, the components of accumulated earnings on a tax basis were as follows: undistributed ordinary income $11,942,179, accumulated capital losses $40,811,549 and unrealized appreciation $182,323,660.
The accumulated capital loss carryover is available to be applied against future net securities profits, if any, realized subsequent to December 31, 2005. If not applied, $13,419,000 expires in fiscal 2010, $20,683,522 expires in fiscal 2011 and $6,709,027 expires in fiscal 2012.
NOTES TO FINANCIAL STATEMENTS (continued)
|
The tax character of distributions paid to shareholders during the fiscal periods ended December 31, 2005 and December 31, 2004 were as follows: ordinary income $135,857 and $13,820,240, respectively.
During the period ended December 31, 2005, as a result of permanent book to tax differences primarily due to the tax treatment for foreign currency exchange gains and losses, the fund decreased accumulated undistributed investment income-net by $1,592 and increased accumulated net realized gain (loss) on investments by the same amount. Net assets were not affected by this reclassification.
NOTE 2—Bank Line of Credit:
The portfolio participates with other Dreyfus-managed funds in a $350 million redemption credit facility (the “Facility”) to be utilized for temporary or emergency purposes, including the financing of redemptions. In connection therewith, the portfolio has agreed to pay commitment fees on its pro rata portion of the Facility. Interest is charged to the portfolio at rates based on prevailing market rates in effect at the time of borrowings.
The average daily amount of borrowings outstanding during the period ended December 31, 2005 was approximately $931,000, with a related weighted average annualized interest rate of 3.89% .
NOTE 3—Investment Advisory Fee, Sub-Investment Advisory Fee and Other Transactions With Affiliates:
(a) Pursuant to an Investment Advisory Agreement with Dreyfus, the investment advisory fee is based on the value of the portfolio’s average daily net assets and is computed at the following annual rates: .55% of the first $150 million; .50% of the next $150 million; and .375% over $300 million.The fee is payable monthly. Pursuant to a Sub-Investment Advisory Agreement with Sarofim, the sub-investment advisory fee is based upon the value of the portfolio’s average daily net assets and is computed at the following annual rates: .20% of the first $150 million; .25% of the next $150 million; and .375% over $300 million.The fee is payable monthly.
(b) Under the Distribution Plan (the “Plan”) adopted pursuant to Rule 12b-1 under the Act, Service shares pay the Distributor for distributing their shares, for servicing and/or maintaining Service shares shareholder accounts and for advertising and marketing for Service shares.The Plan provides for payments to be made at an annual rate of .25% of the value of the Service shares’ average daily net assets. The Distributor may make payments to Participating Insurance Companies and to brokers and dealers acting as principal underwriter for their variable insurance products. The fees payable under the Plan are payable without regard to actual expenses incurred. During the period ended December 31, 2005, Service shares were charged $220,439 pursuant to the Plan.
The portfolio compensates Dreyfus Transfer, Inc., a wholly-owned subsidiary of Dreyfus, under a transfer agency agreement for providing personnel and facilities to perform transfer agency services for the portfolio. During the period ended December 31, 2005, the portfolio was charged $1,080 pursuant to the transfer agency agreement.
The portfolio compensates Mellon Bank, N.A., an affiliate of Dreyfus, under a custody agreement to provide custodial services for the portfolio. During the period ended December 31, 2005, the portfolio was charged $61,485 pursuant to the custody agreement.
During the period ended December 31, 2005, the portfolio was charged $3,762 for services performed by the Chief Compliance Officer.
The components of Due to The Dreyfus Corporation and affiliates in the Statement of Assets and Liabilities consist of: investment advisory fees $292,196, chief compliance officer fees $1,858, Rule 12b-1 distribution plan fees $20,880, custodian fees $21,832 and transfer agency per account fees $255.
(c) Each Board member also serves as a Board member of other funds within the Dreyfus complex. Annual retainer fees and attendance fees are allocated to each fund based on net assets.
NOTES TO FINANCIAL STATEMENTS (continued)
|
(d) Pursuant to an exemptive order from the Securities and Exchange Commission, the portfolio may invest its available cash in affiliated money market mutual funds. Management fees of the underlying money market mutual funds have been waived by Dreyfus.
NOTE 4—Securities Transactions:
The aggregate amount of purchases and sales of investment securities, excluding short-term securities, during the period ended December 31, 2005, amounted to $21,785,051 and $110,636,450, respectively.
At December 31, 2005, the cost of investments for federal income tax purposes was $613,907,024; accordingly, accumulated net unrealized appreciation on investments was $182,323,490 consisting of $222,181,342 gross unrealized appreciation and $39,857,852 gross unrealized depreciation.
REPORT OF INDEPENDENT REGISTERED PUBLIC ACCOUNTING FIRM
Shareholders and Board of Trustees
Dreyfus Variable Investment Fund, Appreciation Portfolio
We have audited the accompanying statement of assets and liabilities, including the statement of investments, of Dreyfus Variable Investment Fund, Appreciation Portfolio (one of the funds comprising Dreyfus Variable Investment Fund) as of December 31, 2005, and the related statement of operations for the year then ended, the statement of changes in net assets for each of the two years in the period then ended, and financial highlights for each of the years indicated therein. These financial statements and financial highlights are the responsibility of the Fund’s management. Our responsibility is to express an opinion on these financial statements and financial highlights based on our audits.
We conducted our audits in accordance with the standards of the Public Company Accounting Oversight Board (United States).Those standards require that we plan and perform the audit to obtain reasonable assurance about whether the financial statements and financial highlights are free of material misstatement.We were not engaged to perform an audit of the Fund’s internal control over financial reporting. Our audits included consideration of internal control over financial reporting as a basis for designing audit procedures that are appropriate in the circumstances, but not for the purpose of expressing an opinion on the effectiveness of the Fund’s internal control over financial reporting. Accordingly, we express no such opinion.An audit also includes examining, on a test basis, evidence supporting the amounts and disclosures in the financial statements and financial highlights, assessing the accounting principles used and significant estimates made by management, and evaluating the overall financial statement presentation. Our procedures included verification by examination of securities held by the custodian as of December 31, 2005 and confirmation of securities not held by the custodian by correspondence with others. We believe that our audits provide a reasonable basis for our opinion.
In our opinion, the financial statements and financial highlights referred to above present fairly, in all material respects, the financial position of Dreyfus Variable Investment Fund, Appreciation Portfolio at December 31,2005,the results of its operations for the year then ended,the changes in its net assets for each of the two years in the period then ended, and the financial highlights for each of the indicated years, in conformity with U.S. generally accepted accounting principles.
| | New York, New York
February 6, 2006
|
IMPORTANT TAX INFORMATION (Unaudited)
For federal tax purposes, the portfolio hereby designates 100% of the ordinary dividends paid during the fiscal year ended December 31, 2005 as qualifying for the corporate dividends received deduction. Shareholders will receive notification in January 2006 of the percentage applicable to the preparation of their 2005 income tax returns.
| BOARD MEMBERS INFORMATION (Unaudited) |
| |
| |
| |
| Joseph S. DiMartino (62) |
| Chairman of the Board (1995) |
| Principal Occupation During Past 5 Years: |
| • Corporate Director and Trustee |
| Other Board Memberships and Affiliations: |
| • The Muscular Dystrophy Association, Director |
| • Levcor International, Inc., an apparel fabric processor, Director |
| • Century Business Services, Inc., a provider of outsourcing functions for small and medium size |
| companies, Director |
| • The Newark Group, a provider of a national market of paper recovery facilities, paperboard |
| mills and paperboard converting plants, Director |
| • Sunair Services Corporation, engages in the design, manufacture and sale of high frequency |
| systems for long-range voice and data communications, as well as providing certain outdoor- |
| related services to homes and businesses, Director |
| No. of Portfolios for which Board Member Serves: 193 |
| ——————— |
| David P. Feldman (66) |
| Board Member (1994) |
| Principal Occupation During Past 5 Years: |
| • Corporate Director and Trustee |
| Other Board Memberships and Affiliations: |
| • BBH Mutual Funds Group (11 funds), Director |
| • The Jeffrey Company, a private investment company, Director |
| • QMED, a medical device company, Director |
| No. of Portfolios for which Board Member Serves: 58 |
| ——————— |
| James F. Henry (75) |
| Board Member (1990) |
| Principal Occupation During Past 5 Years: |
| • President, CPR Institute for Dispute Resolution, a non-profit organization principally |
| engaged in the development of alternatives to business litigation (Retired 2003) |
| No. of Portfolios for which Board Member Serves: 22 |
The Portfolio 27
| BOARD MEMBERS INFORMATION (Unaudited) (continued) |
| |
| |
| |
| |
| Dr. Paul A. Marks (79) |
| Board Member (1990) |
| Principal Occupation During Past 5 Years: |
| • President, Emeritus (2000-present) and President and Chief Executive Officer of Memorial |
| Sloan-Kettering Cancer Center (Retired 1999) |
| Other Board Memberships and Affiliations: |
| • Pfizer, Inc., a pharmaceutical company, Director-Emeritus |
| • Lazard Freres & Company, LLC, Senior Adviser |
| • Carrot Capital Health Care Ventures, Advisor |
| • Armgo-Start-Up Biotech; Board of Directors |
| • Nanoviricide, Board Director |
| • PTC, Scientific Advisory Board |
| No. of Portfolios for which Board Member Serves: 22 |
| ——————— |
| Dr. Martin Peretz (66) |
| Board Member (1990) |
| Principal Occupation During Past 5 Years: |
| • Editor-in-Chief of The New Republic Magazine |
| • Lecturer in Social Studies at Harvard University (1965-2001) |
| • Co-Chairman of TheStreet.com, a financial daily on the web |
| Other Board Memberships and Affiliations: |
| • Academy for Liberal Education, an accrediting agency for colleges and universities certified by |
| the U.S. Department of Education, Director |
| • Harvard Center for Blood Research,Trustee |
| • Bard College,Trustee |
| • Board of Overseers of YIVO Institute for Jewish Research, Chairman |
| No. of Portfolios for which Board Member Serves: 22 |
| ——————— |
| Once elected all Board Members serve for an indefinite term.The address of the Board Members and Officers is in c/o |
| The Dreyfus Corporation, 200 Park Avenue, New York, New York 10166. Additional information about the Board |
| Members is available in the fund’s Statement of Additional Information which can be obtained from Dreyfus free of |
| charge by calling this toll free number: 1-800-554-4611. |
| John M. Fraser, Jr., Emeritus Board Member |
| Rosalind Gersten Jacobs, Emeritus Board Member |
28
OFFICERS OF THE FUND (Unaudited)
| STEPHEN E. CANTER, President since |
| March 2000. |
Chairman of the Board, Chief Executive Officer and Chief Operating Officer of the Manager, and an officer of 90 investment companies (comprised of 184 portfolios) managed by the Manager. Mr. Canter also is a Board member and, where applicable, an Executive Committee Member of the other investment management subsidiaries of Mellon Financial Corporation, each of which is an affiliate of the Manager. He is 60 years old and has been an employee of the Manager since May 1995.
| STEPHEN R. BYERS, Executive Vice |
| President since November 2002. |
Chief Investment Officer,Vice Chairman and a director of the Manager, and an officer of 90 investment companies (comprised of 184 portfolios) managed by the Manager. Mr. Byers also is an officer, director or an Executive Committee Member of certain other investment management subsidiaries of Mellon Financial Corporation, each of which is an affiliate of the Manager. He is 52 years old and has been an employee of the Manager since January 2000.
| MARK N. JACOBS, Vice President since |
| March 2000. |
Executive Vice President, Secretary and General Counsel of the Manager, and an officer of 91 investment companies (comprised of 200 portfolios) managed by the Manager. He is 59 years old and has been an employee of the Manager since June 1977.
| MICHAEL A. ROSENBERG, Vice President |
| and Secretary since August 2005. |
Associate General Counsel of the Manager, and an officer of 91 investment companies (comprised of 200 portfolios) managed by the Manager. He is 45 years old and has been an employee of the Manager since October 1991.
| JAMES BITETTO, Vice President and |
| Assistant Secretary since August 2005. |
Assistant General Counsel and Assistant Secretary of the Manager, and an officer of 91 investment companies (comprised of 200 portfolios) managed by the Manager. He is 39 years old and has been an employee of the Manager since December 1996.
| JONI LACKS CHARATAN, Vice President |
| and Assistant Secretary since |
| August 2005. |
Associate General Counsel of the Manager, and an officer of 91 investment companies (comprised of 200 portfolios) managed by the Manager. She is 50 years old and has been an employee of the Manager since October 1988.
| JOSEPH M. CHIOFFI, Vice President and |
| Assistant Secretary since August 2005. |
Assistant General Counsel of the Manager, and an officer of 91 investment companies (comprised of 200 portfolios) managed by the Manager. He is 44 years old and has been an employee of the Manager since June 2000.
| JANETTE E. FARRAGHER, Vice President |
| and Assistant Secretary since |
| August 2005. |
Associate General Counsel of the Manager, and an officer of 91 investment companies (comprised of 200 portfolios) managed by the Manager. She is 43 years old and has been an employee of the Manager since February 1984.
| JOHN B. HAMMALIAN, Vice President and |
| Assistant Secretary since August 2005. |
Associate General Counsel of the Manager, and an officer of 91 investment companies (comprised of 200 portfolios) managed by the Manager. He is 42 years old and has been an employee of the Manager since February 1991.
OFFICERS OF THE FUND (Unaudited) (continued)
| ROBERT R. MULLERY, Vice President and |
| Assistant Secretary since August 2005. |
Associate General Counsel of the Manager, and an officer of 91 investment companies (comprised of 200 portfolios) managed by the Manager. He is 53 years old and has been an employee of the Manager since May 1986.
| JEFF PRUSNOFSKY, Vice President and |
| Assistant Secretary since August 2005. |
Associate General Counsel of the Manager, and an officer of 91 investment companies (comprised of 200 portfolios) managed by the Manager. He is 40 years old and has been an employee of the Manager since October 1990.
| JAMES WINDELS, Treasurer since |
| November 2001. |
Director – Mutual Fund Accounting of the Manager, and an officer of 91 investment companies (comprised of 200 portfolios) managed by the Manager. He is 47 years old and has been an employee of the Manager since April 1985.
| ERIK D. NAVILOFF, Assistant Treasurer |
| since December 2002. |
Senior Accounting Manager – Taxable Fixed Income Funds of the Manager, and an officer of 91 investment companies (comprised of 200 portfolios) managed by the Manager. He is 37 years old and has been an employee of the Manager since November 1992.
| ROBERT ROBOL, Assistant Treasurer |
| since August 2003. |
Senior Accounting Manager – Money Market and Municipal Bond Funds of the Manager, and an officer of 91 investment companies (comprised of 200 portfolios) managed by the Manager. He is 41 years old and has been an employee of the Manager since October 1988.
| ROBERT SVAGNA, Assistant Treasurer |
| since December 2002. |
Senior Accounting Manager – Equity Funds of the Manager, and an officer of 91 investment companies (comprised of 200 portfolios) managed by the Manager. He is 38 years old and has been an employee of the Manager since November 1990.
| GAVIN C. REILLY, Assistant Treasurer |
| since December 2005. |
Tax Manager of the Investment Accounting and Support Department of the Manager, and an officer of 91 investment companies (comprised of 200 portfolios) managed by the Manager. He is 37 years old and has been an employee of the Manager since April 1991.
| JOSEPH W. CONNOLLY, Chief Compliance |
| Officer since October 2004. |
Chief Compliance Officer of the Manager and The Dreyfus Family of Funds (91 investment companies, comprised of 200 portfolios). From November 2001 through March 2004, Mr. Connolly was first Vice-President, Mutual Fund Servicing for Mellon Global Securities Services. In that capacity, Mr. Connolly was responsible for managing Mellon’s Custody, Fund Accounting and Fund Administration services to third-party mutual fund clients. He is 48 years old and has served in various capacities with the Manager since 1980, including manager of the firm’s Fund Accounting Department from 1997 through October 2001.
| WILLIAM GERMENIS, Anti-Money |
| Laundering Compliance Officer since |
| September 2002. |
Vice President and Anti-Money Laundering Compliance Officer of the Distributor, and the Anti-Money Laundering Compliance Officer of 87 investment companies (comprised of 196 portfolios) managed by the Manager. He is 35 years old and has been an employee of the Distributor since October 1998.
NOTES
| Dreyfus Variable |
| Investment Fund, |
| Appreciation Portfolio |
| 200 Park Avenue |
| New York, NY 10166 |
| |
| Investment Adviser |
| The Dreyfus Corporation |
| 200 Park Avenue |
| New York, NY 10166 |
| |
| Sub-Investment Advisor |
| Fayez Sarofim & Co. |
| Two Houston Center |
| Suite 2907�� |
| Houston,TX 77010 |
| Custodian |
| Mellon Bank, N.A. |
| One Mellon Bank Center |
| Pittsburgh, PA 15258 |
| |
| Transfer Agent & |
| Dividend Disbursing Agent |
| Dreyfus Transfer, Inc. |
| 200 Park Avenue |
| New York, NY 10166 |
| |
| Distributor |
| Dreyfus Service Corporation |
| 200 Park Avenue |
| New York, NY 10166 |
Telephone 1-800-554-4611 or 516-338-3300
Mail The Dreyfus Family of Funds, 144 Glenn Curtiss Boulevard, Uniondale, NY 11556-0144 Attn: Institutional Servicing
The portfolio files its complete schedule of portfolio holdings with the Securities and Exchange Commission (“SEC”) for the first and third quarters of each fiscal year on Form N-Q. The portfolio’s Forms N-Q are available on the SEC’s website at http://www.sec.gov and may be reviewed and copied at the SEC’s Public Reference Room in Washington, DC. Information on the operation of the Public Reference Room may be obtained by calling 1-800-SEC-0330.
A description of the policies and procedures that the portfolio uses to determine how to vote proxies relating to portfolio securities, and information regarding how the portfolio voted these proxies for the 12-month period ended June 30, 2005, is available at http://www.dreyfus.com and on the SEC’s website at http://www.sec.gov. The description of the policies and procedures is also available without charge, upon request, by calling 1-800-645-6561.
© 2006 Dreyfus Service Corporation


The views expressed in this report reflect those of the portfolio manager only through the end of the period covered and do not necessarily represent the views of Dreyfus or any other person in the Dreyfus organization.Any such views are subject to change at any time based upon market or other conditions and Dreyfus disclaims any responsibility to update such views. These views may not be relied on as investment advice and, because investment decisions for a Dreyfus portfolio are based on numerous factors, may not be relied on as an indication of trading intent on behalf of any Dreyfus portfolio.
Not FDIC-Insured • Not Bank-Guaranteed • May Lose Value
| | | Contents |
| |
| | | T H E P O R T F O L I O |
| |
|
| 2 | | Letter from the Chairman |
| 3 | | Discussion of Performance |
| 6 | | Portfolio Performance |
| 8 | | Understanding Your Portfolio’s Expenses |
| 8 | | Comparing Your Portfolio’s Expenses |
| | | With Those of Other Funds |
| 9 | | Statement of Investments |
| 14 | | Statement of Assets and Liabilities |
| 15 | | Statement of Operations |
| 16 | | Statement of Changes in Net Assets |
| 18 | | Financial Highlights |
| 20 | | Notes to Financial Statements |
| 28 | | Report of Independent Registered |
| | | Public Accounting Firm |
| 29 | | Important Tax Information |
| 30 | | Board Members Information |
| 32 | | Officers of the Fund |
| | | F O R M O R E I N F O R M AT I O N |
| |
|
| | | Back Cover |
| Dreyfus Variable Investment Fund, |
| Balanced Portfolio |

LETTER FROM THE CHAIRMAN
Dear Shareholder:
We are pleased to present this annual report for Dreyfus Variable Investment Fund, Balanced Portfolio covering the 12-month period from January 1, 2005, through December 31, 2005. Inside, you’ll find valuable information about how the portfolio was managed during the reporting period, including a discussion with the portfolio manager, Thomas Plumb of Wisconsin Capital Management, LLC, the portfolio’s sub-investment adviser.
Stocks generally absorbed both good and bad news in 2005 to post modestly positive total returns. On the plus side, an expanding U.S. economy and low inflation helped support corporate earnings in most industry groups. Negative influences included rising short-term interest rates and escalating energy prices, which many analysts feared might erode corporate profits. In addition, hurricanes Katrina, Rita and Wilma disrupted economic activity along the Gulf Coast.
We expect the U.S. economy to continue its moderate expansion in 2006, fueled in part by a rebound in corporate capital spending and exports. The labor market likely will remain relatively strong while inflation should stay low, supporting consumers’ real incomes. Risks in the new year include the possible end of the boom in the housing market, where we believe prices are more likely to stall than plunge.
As always, we encourage you to speak with your financial consultant about how these and other market forces may affect your investments. Thank you for your continued confidence and support.


DISCUSSION OF PERFORMANCE
Thomas Plumb, Primary Portfolio Manager
Wisconsin Capital Management, LLC, Sub-Investment Adviser
How did Dreyfus Variable Investment Fund, Balanced Portfolio perform relative to its benchmarks?
For the 12-month period ended December 31, 2005, the portfolio’s total returns were –1.21% for its Initial shares and –1.30% for its Service shares.1 In comparison, the portfolio’s benchmark, a hybrid index composed of 60% Standard & Poor’s 500 Composite Stock Price Index (the “S&P 500 Index”) and 40% Lehman Brothers Intermediate Government/Credit Bond Index (the “Lehman Intermediate Bond Index”), achieved a total return of 3.58% for the reporting period.2The portfolio’s former benchmark index, a hybrid index composed of 60% Standard & Poor’s 500 Composite Stock Price Index (the “S&P 500 Index”) and 40% Lehman Brothers U.S.Aggregate Index (the “Lehman Aggregate Index”), provided a total return of 3.92% for the reporting period.3 Separately, the S&P 500 Index, the Lehman Intermediate Bond Index and the Lehman Aggregate Index achieved total returns of 4.91%, 1.58% and 2.43%, respectively, for the reporting period.
Stock prices advanced modestly in a growing U.S. economy, and bonds held up well despite a rising interest-rate environment.The portfolio produced lower returns than its current benchmark, primarily due to our focus on blue-chip stocks, which, despite attractive valuations and strong business fundamentals, continued to lag smaller, more economically sensitive companies during 2005. The portfolio’s fixed-income investments produced returns that were roughly in line with the Lehman Intermediate Bond Index.
What is the portfolio’s investment approach?
The portfolio seeks high total return through a combination of capital appreciation and current income. To pursue this goal, the portfolio invests in a diversified mix of stocks and fixed-income securities.The portfolio will vary the mix of stocks and bonds from time to time, but normally the portfolio will allocate more than 50% of its assets to stocks and the remainder to bonds and other fixed-income securities.
In allocating portfolio assets between stocks and bonds, the portfolio manager assesses the relative return and risk of each asset class, analyzing several factors, including general economic conditions, anticipated future changes in interest rates and the outlook for stocks generally.
DISCUSSION OF PERFORMANCE (continued)
|
In choosing stocks for the portfolio, the manager looks for high-quality companies that possess most of the following characteristics: leading market positions, high barriers to market entry and other competitive or technological advantages, high returns on equity and assets, good growth prospects, strong management, and relatively low debt burdens.
The portfolio normally invests at least 25% of its assets in fixed-income securities.The fixed-income securities in which the portfolio may invest include corporate bonds and other debt instruments, mortgage-related securities, asset-backed securities, debt securities issued or guaranteed by the U.S. government (including its agencies and instrumentalities), convertible debt securities and preferred stock that is convertible into common stock.
What other factors influenced the portfolio’s performance?
Energy prices soared and short-term interest rates rose,but the U.S.econ-omy continued to grow at a relatively moderate pace. While the stock indicies produced positive returns in this environment, most of the stock market’s gains for 2005 were concentrated in energy sectors and small-and midcap companies that tend to be relatively sensitive to economic ups and downs. The growing economy also benefited the business fundamentals of larger, blue-chip companies, but their stocks generally continued to languish.Although short- and intermediate-term bonds lost some of their value when short-term interest rates rose, income contributions helped them produce generally positive total returns.
Throughout the year, we allocated the portfolio’s assets to areas of the stock market that, in our judgment, offered significant long-term opportunities. In hindsight, we may have been too early in our efforts to anticipate some market trends. However, we remain confident that growing companies with stable earnings, high returns on equity, positive cash flows and strong balance sheets will return to favor among investors.
During the reporting period, the portfolio received disappointing results from for-profit education providers, which were hurt by industry-wide issues that we regard as temporary. Results from the financial sector were hindered by accounting-related problems at government-sponsored mortgage agency Fannie Mae, and some consumer discretionary companies suffered amid concerns that high energy prices might constrain consumer spending. On the other hand, the portfolio participated in gains in a variety of holdings, including drug distributors McKesson and Cardinal Health, insurer American International Group, pharmaceutical manufacturer Schering-Plough and food company Nestle.
Because interest rates historically have tended to erode the value of fixed-income securities, the portfolio’s bond portfolio focused mainly on short-term corporate bonds that we believed offered attractive yields and ready liquidity.
What is the portfolio’s current strategy?
It is difficult to remember a time when we have been more enthusiastic about the prospects of blue-chip stocks. As of year-end, many of the world’s most recognizable and successful companies were selling at valuations well below their historical norms. Accordingly, we added to many of the portfolio’s positions during this period of relative weakness. In addition, we have identified a number of long-term secular trends —from a recovery in corporate spending to the aging of the baby boom generation — that appear poised to support business conditions in certain industries.Among bonds, we recently have seen signs that the steady rise of interest rates may be nearing an end, and we are prepared to extend the maturities of the portfolio’s fixed-income holdings.
| | | The portfolio is only available as a funding vehicle under variable life insurance policies or variable |
| | | annuity contracts issued by insurance companies. Individuals may not purchase shares of the |
| | | portfolio directly. A variable annuity is an insurance contract issued by an insurance company that |
| | | enables investors to accumulate assets on a tax-deferred basis for retirement or other long-term |
| | | goals.The investment objective and policies of Dreyfus Variable Investment Fund, Balanced |
| | | Portfolio made available through insurance products may be similar to other funds/portfolios |
| | | managed or advised by Dreyfus. However, the investment results of the portfolio may be higher or |
| | | lower than, and may not be comparable to, those of any other Dreyfus fund/portfolio. |
| 1 | | Total return includes reinvestment of dividends and any capital gains paid. Past performance is no |
| | | guarantee of future results. Share price and investment return fluctuate such that upon redemption, |
| | | portfolio shares may be worth more or less than their original cost.The portfolio’s performance does |
| | | not reflect the deduction of additional charges and expenses imposed in connection with investing |
| | | in variable insurance contracts, which will reduce returns. Return figures provided reflect the |
| | | absorption of certain portfolio expenses by The Dreyfus Corporation pursuant to an agreement in |
| | | effect through December 31, 2006, at which time it may be extended, terminated or modified. |
| | | Had these expenses not been absorbed, the portfolio’s returns would have been lower. |
| 2 | | SOURCE: LIPPER, INC. — Reflects reinvestment of dividends and, where applicable, capital |
| | | gain distributions.The Standard & Poor’s 500 Composite Stock Price Index is a widely accepted, |
| | | unmanaged index of U.S. stock market performance.The Lehman Brothers Intermediate |
| | | Government/Credit Bond Index is a widely accepted, unmanaged index of government and |
| | | corporate bond market performance composed of U.S. government,Treasury and agency securities, |
| | | fixed-income securities and nonconvertible investment-grade corporate debt, with an average |
| | | maturity of 1-10 years. |
| 3 | | SOURCE: LIPPER INC. — Reflects the reinvestment of dividends and, where applicable, |
| | | capital gain distributions.The Standard & Poor’s 500 Composite Stock Price Index (“S&P 500 |
| | | Index”) is a widely accepted, unmanaged index of U.S. stock market performance.The Lehman |
| | | Brothers U.S. Aggregate Index is a widely accepted, unmanaged total return index of corporate, |
| | | U.S. government and U.S. government agency debt instruments, mortgage-backed securities and |
| | | asset-backed securities with an average maturity of 1-10 years. |
The Portfolio 5

| Average Annual Total Returns as of 12/31/05 | | | | |
| | | Inception | | | | | | From |
| | | Date | | 1 Year | | 5 Years | | Inception |
| |
| |
| |
| |
|
| Initial shares | | 5/1/97 | | (1.21)% | | (1.08)% | | 4.30% |
| Service shares | | 5/1/97 | | (1.30)% | | (1.21)% | | 4.22% |
| The data for Service shares includes the results of Initial shares for the period prior to December 31, 2000 |
| (inception date of Service shares). Actual Service shares’ average annual total return and hypothetical growth |
| results would have been lower. See notes below. |
| † Source: Lipper Inc. |
| Past performance is not predictive of future performance.The portfolio’s performance shown in the graph and table does not |
| reflect the deduction of taxes that a shareholder would pay on portfolio distributions or the redemption of portfolio shares. |
The portfolio’s performance does not reflect the deduction of additional charges and expenses imposed in connection with investing in variable insurance contracts which will reduce returns.
The above graph compares a $10,000 investment made in Initial and Service shares of Dreyfus Variable Investment Fund, Balanced Portfolio on 5/1/97 (inception date of Initial shares) to a $10,000 investment made in each of the Standard & Poor’s 500 Composite Stock Price Index (the “S&P 500 Index”), the Lehman Brothers Intermediate Government/Credit Bond Index (the “Lehman Intermediate Bond Index”), the Lehman Brothers U.S. Aggregate Index (the “Lehman Aggregate Index”), a hybrid index composed of 60% S&P 500 Index and 40% Lehman Intermediate Bond Index (the “New Hybrid Index”) and a hybrid index composed of 60% S&P 500 Index and 40% Lehman Aggregate Index (the “Former Hybrid Index”). Both hybrid indices are calculated on a year-to-year basis. In December 2004, the portfolio’s benchmark was changed to the Lehman Intermediate Bond Index from the Lehman Aggregate Index because the Lehman Intermediate Bond Index is expected to more accurately reflect the portfolio’s investment approach. For comparative purposes, the value of both indices on 4/30/97 is used as the beginning value on 5/1/97.
The portfolio’s Initial shares are not subject to a Rule 12b-1 fee.The portfolio’s Service shares are subject to a 0.25% annual Rule 12b-1 fee.The performance figures for Service shares reflect the performance of the portfolio’s Initial shares from their inception date through December 30, 2000, and the performance of the portfolio’s Service shares from December 31, 2000 (inception date of Service shares) to December 31, 2005 (blended performance figures).The performance figures for each share class reflect certain expense reimbursements, without which the performance of each share class would have been lower. In addition, the blended performance figures have not been adjusted to reflect the higher operating expenses of the Service shares. If these expenses had been reflected, the blended performance figures would have been lower. All dividends and capital gain distributions are reinvested.
The portfolio’s performance shown in the line graph takes into account all applicable portfolio fees and expenses (after any expense reimbursements).The S&P 500 Index is a widely accepted, unmanaged index of U.S. stock market performance.The Lehman Intermediate Bond Index is a widely accepted, unmanaged index of government and corporate bond market performance composed of U.S. government,Treasury and agency securities, fixed-income securities and nonconvertible investment-grade corporate debt, with an average maturity of 1-10 years.The Lehman Aggregate Index is a widely accepted, unmanaged total return index of corporate, U.S. government and U.S. government agency debt instruments, mortgage-backed securities and asset-backed securities with an average maturity of 1-10 years.The indices do not take into account charges, fees and other expenses. Further information relating to portfolio performance, including expense reimbursements, if applicable, is contained in the Financial Highlights section of the prospectus and elsewhere in this report.
UNDERSTANDING YOUR PORTFOLIO’S EXPENSES (Unaudited)
As a mutual fund investor,you pay ongoing expenses,such as management fees and other expenses.Using the information below,you can estimate how these expenses affect your investment and compare them with the expenses of other funds.You also may pay one-time transaction expenses,including sales charges (loads) and redemption fees, which are not shown in this section and would have resulted in higher total expenses. For more information, see your portfolio’s prospectus or talk to your financial adviser.
Review your portfolio’s expenses
The table below shows the expenses you would have paid on a $1,000 investment in Dreyfus Variable Investment Fund, Balanced Portfolio from July 1, 2005 to December 31, 2005. It also shows how much a $1,000 investment would be worth at the close of the period, assuming actual returns and expenses.
| Expenses and Value of a $1,000 Investment | | |
| assuming actual returns for the six months ended December 31, 2005 |
| | | Initial Shares | | Service Shares |
| |
| |
|
| Expenses paid per $1,000 † | | $ 4.39 | | $ 5.04 |
| Ending value (after expenses) | | $1,001.20 | | $1,001.30 |
COMPARING YOUR PORTFOLIO’S EXPENSES WITH THOSE OF OTHER FUNDS (Unaudited)
Using the SEC’s method to compare expenses
The Securities and Exchange Commission (SEC) has established guidelines to help investors assess fund expenses. Per these guidelines, the table below shows your portfolio’s expenses based on a $1,000 investment, assuming a hypothetical 5% annualized return. You can use this information to compare the ongoing expenses (but not transaction expenses or total cost) of investing in the portfolio with those of other funds. All mutual fund shareholder reports will provide this information to help you make this comparison. Please note that you cannot use this information to estimate your actual ending account balance and expenses paid during the period.
Expenses and Value of a $1,000 Investment assuming a hypothetical 5% annualized return for the six months ended December 31, 2005
| | | Initial Shares | | Service Shares |
| |
| |
|
| Expenses paid per $1,000 † | | $ 4.43 | | $ 5.09 |
| Ending value (after expenses) | | $1,020.82 | | $1,020.16 |
| † Expenses are equal to the portfolio’s annualized expense ratio of .87% for Initial shares and 1.00% for Service shares, |
| multiplied by the average account value over the period, multiplied by 184/365 (to reflect the one-half year period). |
STATEMENT OF INVESTMENTS
December 31, 2005
|
| Common Stocks—70.2% | | Shares | | | | Value ($) |
| |
| |
| |
|
| Consumer Discretionary—9.4% | | | | | | |
| Cabela’s Inc | | 50,000 | | a,b | | 830,000 |
| Interpublic Group Of Cos. | | 70,000 | | a,b | | 675,500 |
| Kohl’s | | 21,000 | | a | | 1,020,600 |
| Liberty Media, Cl. A | | 83,000 | | a | | 653,210 |
| Time Warner | | 50,000 | | | | 872,000 |
| Viacom, Cl. B | | 30,000 | | a | | 978,000 |
| Wal-Mart Stores | | 28,000 | | | | 1,310,400 |
| | | | | | | 6,339,710 |
| Consumer Staples—3.8% | | | | | | |
| Coca-Cola | | 28,300 | | | | 1,140,773 |
| Nestle, ADR | | 19,000 | | | | 1,419,366 |
| | | | | | | 2,560,139 |
| Energy—4.0% | | | | | | |
| Chevron | | 24,000 | | | | 1,362,480 |
| Exxon Mobil | | 24,000 | | | | 1,348,080 |
| | | | | | | 2,710,560 |
| Financial—15.5% | | | | | | |
| American International Group | | 23,500 | | | | 1,603,405 |
| Bank of America | | 25,000 | | | | 1,153,750 |
| Berkshire Hathaway, Cl. A | | 13 | | a | | 1,152,060 |
| Citigroup | | 28,000 | | | | 1,358,840 |
| Doral Financial | | 70,000 | | | | 742,000 |
| Fannie Mae | | 33,000 | | | | 1,610,730 |
| JPMorgan Chase & Co. | | 34,000 | | | | 1,349,460 |
| Marsh & McLennan Cos. | | 45,000 | | | | 1,429,200 |
| | | | | | | 10,399,445 |
| Health Care—14.5% | | | | | | |
| Bristol-Myers Squibb | | 21,200 | | | | 487,176 |
| Cardinal Health | | 31,000 | | | | 2,131,250 |
| McKesson | | 22,100 | | | | 1,140,139 |
| Merck & Co. | | 41,000 | | | | 1,304,210 |
| Pfizer | | 78,100 | | | | 1,821,292 |
| Wright Medical Group | | 58,000 | | a | | 1,183,200 |
STATEMENT OF INVESTMENTS (continued)
|
| Common Stocks (continued) | | Shares | | Value ($) |
| |
| |
|
| Health Care (continued) | | | | |
| Wyeth | | 22,000 | | 1,013,540 |
| Zimmer Holdings | | 9,900 a | | 667,656 |
| | | | | 9,748,463 |
| Industrial—7.4% | | | | |
| Career Education | | 44,300 a | | 1,493,796 |
| Corinthian Colleges | | 160,000 a | | 1,884,800 |
| General Electric | | 45,000 | | 1,577,250 |
| | | | | 4,955,846 |
| Information Technology—14.6% | | | | |
| BISYS Group | | 90,000 a | | 1,260,900 |
| Dell | | 7,500 a | | 224,925 |
| Electronic Data Systems | | 80,000 | | 1,923,200 |
| First Data | | 30,000 | | 1,290,300 |
| Fiserv | | 26,800 a | | 1,159,636 |
| Microsoft | | 77,000 | | 2,013,550 |
| Sabre Holdings, Cl. A | | 58,000 | | 1,398,380 |
| Unisys | | 90,000 a | | 524,700 |
| | | | | 9,795,591 |
| Personal Care—1.0% | | | | |
| Estee Lauder Cos., Cl. A | | 20,000 | | 669,600 |
| Total Common Stocks | | | | |
| (cost $45,617,149) | | | | 47,179,354 |
| |
| |
|
| |
| Preferred Stocks—2.1% | | | | |
| |
| |
|
| Auto Manufacturing—.7% | | | | |
| General Motors, | | | | |
| Cum., $1.84 | | 21,000 | | 445,200 |
| Banking/Finance—1.4% | | | | |
| Citigroup Capital VII, | | | | |
| Cum., $1.78 | | 25,000 | | 640,625 |
| General Motors Acceptance, | | | | |
| Cum., $1.84 | | 22,500 | | 318,517 |
| | | | | 959,142 |
| Total Preferred Stocks | | | | |
| (cost $1,754,875) | | | | 1,404,342 |
| | | Principal | | |
| Bonds and Notes—25.5% | | Amount ($) | | Value ($) |
| |
| |
|
| Banks—.6% | | | | |
| Bank of America, | | | | |
| Sr. Notes, 4.375%, 12/1/2010 | | 445,000 | | 434,620 |
| Broadcasting—2.9% | | | | |
| Liberty Media, | | | | |
| Notes, 3.50%, 9/25/2006 | | 1,000,000 | | 994,741 |
| Tribune, | | | | |
| Unscd. Notes, 4.875%, 8/15/2010 | | 1,000,000 | | 976,179 |
| | | | | 1,970,920 |
| Commercial Mortgage Pass-Through Certificates—1.0% | | |
| First Horizon Alternative Mortgage Securities, | | | | |
| Ser. 2004-FA1, Cl. 1A1, 6.25%, 10/25/2034 | | 416,283 | | 421,588 |
| Salomon Brothers Mortgage Securities VII, | | | | |
| Ser. 2002-KEY2, Cl. A1, 3.222%, 3/18/2036 | | 232,310 | | 229,255 |
| | | | | 650,843 |
| Diversified Financial Services—1.6% | | | | |
| Ford Motor Credit, | | | | |
| Notes: | | | | |
| 4.68%, 3/13/2007 | | 35,000 c | | 32,760 |
| 5.35%, 9/28/2007 | | 105,000 c | | 97,174 |
| General Motors, | | | | |
| Notes, 7.10%, 3/15/2006 | | 270,000 b | | 269,325 |
| General Motors Acceptance, | | | | |
| Notes: | | | | |
| 6.125%, 2/1/2007 | | 45,000 | | 42,970 |
| 6.75%, 12/1/2014 | | 135,000 b | | 121,645 |
| International Lease Finance, | | | | |
| Unsub. Notes, 4.75%, 7/1/2009 | | 500,000 b | | 491,898 |
| | | | | 1,055,772 |
| Food & Beverages—1.5% | | | | |
| HJ Heinz, | | | | |
| Notes, 6%, 3/15/2008 | | 1,000,000 | | 1,020,644 |
| Insurance—2.2% | | | | |
| Berkshire Hathaway Finance, | | | | |
| Notes, 3.375%, 10/15/2008 | | 1,000,000 | | 964,159 |
| Marsh & McLennan Cos., | | | | |
| Sr. Notes, 7.125%, 6/15/2009 | | 500,000 | | 529,694 |
| | | | | 1,493,853 |
| | STATEMENT OF INVESTMENTS (continued)
|
| | | Principal | | |
| Bonds and Notes (continued) | | Amount ($) | | Value ($) |
| |
| |
|
| Pharmaceuticals—1.2% | | | | |
| Cardinal Health, | | | | |
| Notes, 6.75%, 2/15/2011 | | 750,000 | | 800,369 |
| Real Estate—.1% | | | | |
| EOP Operating, LP, | | | | |
| Sr. Notes, 7%, 7/15/2011 | | 35,000 | | 37,505 |
| Services—1.4% | | | | |
| First Data, | | | | |
| Notes, 3.90%, 10/1/2009 | | 1,000,000 | | 952,349 |
| Structured Index—1.5% | | | | |
| Morgan Stanley TRACERS, | | | | |
| Ser. 2002-1, 5.878%, 3/1/2007 | | 1,035,000 d,e | | 1,040,516 |
| Telecommunications—3.3% | | | | |
| GTE Northwest, | | | | |
| Debs., Ser. C, 6.30%, 6/1/2010 | | 1,700,000 | | 1,737,012 |
| New York Telephone, | | | | |
| Debs., 6.125%, 1/15/2010 | | 500,000 | | 502,514 |
| | | | | 2,239,526 |
| U.S. Government & Agencies—7.8% | | |
| Federal Home Loan Bank System, | | | | |
| Bonds: | | | | |
| 3.25%, 8/11/2006 | | 2,000,000 | | 1,983,808 |
| 4.50%, 7/12/2010 | | 500,000 | | 494,558 |
| Federal Home Loan Mortgage Corp., | | | | |
| Notes, 2.375%, 2/15/2007 | | 1,000,000 | | 974,441 |
| U.S. Treasury Notes, | | | | |
| 4.25%, 10/15/2010 | | 1,800,000 | | 1,791,126 |
| | | | | 5,243,933 |
| U.S. Government Agencies/Mortgage-Backed—.4% | | |
| Federal Home Loan Mortgage Corp., | | | | |
| 5.50%, 9/1/2034 | | 22,492 | | 22,316 |
| Federal National Mortgage Association: | | |
| 5.50%-6%, 9/1/2034 | | 248,825 | | 249,594 |
| | | | | 271,910 |
| Total Bonds and Notes | | | | |
| (cost $17,417,417) | | | | 17,212,760 |
| Other Investment—2.3% | | Shares | | Value ($) |
| |
| |
|
| Registered Investment Company; | | | | |
| Dreyfus Institutional Preferred Plus | | | | |
| Money Market Fund | | | | | | |
| (cost $1,547,000) | | | | 1,547,000 f | | 1,547,000 |
| |
| |
| |
|
| |
| Investment of Cash Collateral | | | | |
| for Securities Loaned—3.4% | | | | |
| |
| |
|
| Registered Investment Company; | | | | |
| Dreyfus Institutional Cash Advantage Plus Fund | | |
| (cost $2,267,300) | | | | 2,267,300 f | | 2,267,300 |
| |
| |
| |
|
| |
| Total Investments (cost $68,603,741) | | 103.5% | | 69,610,756 |
| |
| Liabilities, Less Cash and Receivables | | (3.5%) | | (2,376,195) |
| |
| Net Assets | | | | 100.0% | | 67,234,561 |
| |
| ADR—American Depository Receipts. | | | | |
| a | | Non-income producing. | | | | | | |
| b | | All or a portion of these securities are on loan. At December 31,2005, the total market value of the portfolio’s |
| | | securities on loan is $2,147,117 and the total market value of the collateral held by the portfolio is $2,267,300. |
| c | | Variable rate security—interest rate subject to periodic change. | | |
| d | | Securities exempt from registration under Rule 144A of the Securities Act of 1933.These securities may be sold in |
| | | transactions exempt from registration, normally to qualified institutional buyers. At December 31,2005, these |
| | | securities amounted to $1,040,516 or 1.5% of net assets. | | |
| e | | Security linked to a portfolio of investment grade debt securities. | | |
| f | | Investment in affiliated money market mutual fund. | | | | |
| |
| |
| |
|
| |
| |
| |
| Portfolio Summary † | | | | | | |
| |
| | | | | Value (%) | | | | Value (%) |
| |
| |
| |
| |
|
| Financial | | 15.5 | | Money Market Investments | | 5.7 |
| Information Technology | | 14.6 | | Energy | | 4.0 |
| Health Care | | 14.5 | | Consumer Staples | | 3.8 |
| Consumer Discretionary | | 9.4 | | Other | | 20.4 |
| U.S. Government & Agencies | | 8.2 | | | | |
| Industrial | | 7.4 | | | | 103.5 |
| |
| † | | Based on net assets. | | | | | | |
| See notes to financial statements. | | | | | | |
STATEMENT OF ASSETS AND LIABILITIES
December 31, 2005
| | | Cost | | Value |
| |
| |
|
| Assets ($): | | | | |
| Investments in securities—See Statement | | | | |
| of Investments (including securities on loan, | | |
| valued at $2,147,117)—Note 1(c): | | | | |
| Unaffiliated issuers | | 64,789,441 | | 65,796,456 |
| Affiliated issuers | | 3,814,300 | | 3,814,300 |
| Cash | | | | 56,354 |
| Dividends and interest receivable | | | | 274,032 |
| Prepaid expenses and other assets | | | | 1,055 |
| | | | | 69,942,197 |
| |
| |
|
| Liabilities ($): | | | | |
| Due to The Dreyfus Corporation and affiliates—Note 3(b) | | 50,236 |
| Liability for securities on loan—Note 1(c) | | | | 2,267,300 |
| Payable for investment securities purchased | | 325,470 |
| Payable for shares of Beneficial Interest redeemed | | 12,028 |
| Accrued expenses | | | | 52,602 |
| | | | | 2,707,636 |
| |
| |
|
| Net Assets ($) | | | | 67,234,561 |
| |
| |
|
| Composition of Net Assets ($): | | | | |
| Paid-in capital | | | | 82,249,947 |
| Accumulated undistributed investment income—net | | 467,715 |
| Accumulated net realized gain (loss) on investments | | (16,490,116) |
| Accumulated net unrealized appreciation | | | | |
| (depreciation) on investments | | | | 1,007,015 |
| |
| |
|
| Net Assets ($) | | | | 67,234,561 |
| |
| |
|
| |
| |
| Net Asset Value Per Share | | | | |
| | | Initial Shares | | Service Shares |
| |
| |
|
| Net Assets ($) | | 49,093,817 | | 18,140,744 |
| Shares Outstanding | | 3,798,851 | | 1,402,339 |
| |
| |
|
| Net Asset Value Per Share ($) | | 12.92 | | 12.94 |
See notes to financial statements.
|
STATEMENT OF OPERATIONS
Year Ended December 31, 2005
|
| Investment Income ($): | | |
| Income: | | |
| Cash dividends (net of $7,078 foreign taxes withheld at source): | | |
| Unaffiliated issuers | | 907,228 |
| Affiliated issuers | | 40,320 |
| Interest | | 767,993 |
| Income on securities lending | | 24,339 |
| Total Income | | 1,739,880 |
| Expenses: | | |
| Investment advisory fee—Note 3(a) | | 555,205 |
| Prospectus and shareholders’ reports | | 53,301 |
| Distribution fees—Note 3(b) | | 48,826 |
| Professional fees | | 34,792 |
| Custodian fees—Note 3(b) | | 10,588 |
| Trustees’ fees and expenses—Note 3(c) | | 6,177 |
| Shareholder servicing costs—Note 3(b) | | 3,321 |
| Loan commitment fees—Note 2 | | 441 |
| Registration fees | | 68 |
| Miscellaneous | | 13,147 |
| Total Expenses | | 725,866 |
| Less—waiver of fees due to undertaking—Note 3(a) | | (36,263) |
| Less—reduction in custody fees | | |
| due to earnings credits—Note 1(c) | | (1,977) |
| Net Expenses | | 687,626 |
| Investment Income—Net | | 1,052,254 |
| |
|
| Realized and Unrealized Gain (Loss) on Investments—Note 4 ($): |
| Net realized gain (loss) on investments | | 305,484 |
| Net unrealized appreciation (depreciation) on investments | | (2,479,092) |
| Net Realized and Unrealized Gain (Loss) on Investments | | (2,173,608) |
| Net (Decrease) in Net Assets Resulting from Operations | | (1,121,354) |
See notes to financial statements.
|
STATEMENT OF CHANGES IN NET ASSETS
| | | Year Ended December 31, |
| |
|
| | | 2005 | | 2004 |
| |
| |
|
| Operations ($): | | | | |
| Investment income—net | | 1,052,254 | | 1,452,740 |
| Net realized gain (loss) on investments | | 305,484 | | 7,704,069 |
| Net unrealized appreciation | | | | |
| (depreciation) on investments | | (2,479,092) | | (4,614,377) |
| Net Increase (Decrease) in Net Assets | | | | |
| Resulting from Operations | | (1,121,354) | | 4,542,432 |
| |
| |
|
| Dividends to Shareholders from ($): | | | | |
| Investment income—net: | | | | |
| Initial shares | | (933,459) | | (1,313,856) |
| Service shares | | (316,209) | | (422,063) |
| Total Dividends | | (1,249,668) | | (1,735,919) |
| |
| |
|
| Beneficial Interest Transactions ($): | | | | |
| Net proceeds from shares sold: | | | | |
| Initial shares | | 763,690 | | 1,535,093 |
| Service shares | | 588,316 | | 1,598,254 |
| Dividends reinvested: | | | | |
| Initial shares | | 933,459 | | 1,313,856 |
| Service shares | | 316,209 | | 422,063 |
| Cost of shares redeemed: | | | | |
| Initial shares | | (11,888,473) | | (11,090,415) |
| Service shares | | (4,057,658) | | (4,186,838) |
| Increase (Decrease) in Net Assets from | | | | |
| Beneficial Interest Transactions | | (13,344,457) | | (10,407,987) |
| Total Increase (Decrease) in Net Assets | | (15,715,479) | | (7,601,474) |
| |
| |
|
| Net Assets ($): | | | | |
| Beginning of Period | | 82,950,040 | | 90,551,514 |
| End of Period | | 67,234,561 | | 82,950,040 |
| Undistributed investment income—net | | 467,715 | | 274,309 |
| | | Year Ended December 31, |
| |
|
| | | 2005 | | 2004 |
| |
| |
|
| Capital Share Transactions: | | | | |
| Initial Shares | | | | |
| Shares sold | | 58,603 | | 119,914 |
| Shares issued for dividends reinvested | | 72,180 | | 101,379 |
| Shares redeemed | | (916,292) | | (863,058) |
| Net Increase (Decrease) in Shares Outstanding | | (785,509) | | (641,765) |
| |
| |
|
| Service Shares | | | | |
| Shares sold | | 45,287 | | 124,997 |
| Shares issued for dividends reinvested | | 24,427 | | 32,575 |
| Shares redeemed | | (311,605) | | (325,263) |
| Net Increase (Decrease) in Shares Outstanding | | (241,891) | | (167,691) |
See notes to financial statements.
|
FINANCIAL HIGHLIGHTS
The following tables describe the performance for each share class for the fiscal periods indicated. All information (except portfolio turnover rate) reflects financial results for a single portfolio share.Total return shows how much your investment in the portfolio would have increased (or decreased) during each period, assuming you had reinvested all dividends and distributions.These figures have been derived from the portfolio’s financial statements.
| | | | | | | Year Ended December 31, | | |
| | | |
| |
| |
|
| Initial Shares | | 2005 | | 2004 | | 2003 | | 2002 | | 2001 |
| |
| |
| |
| |
| |
|
| Per Share Data ($): | | | | | | | | | | |
| Net asset value, beginning of period | | 13.31 | | 12.87 | | 11.09 | | 13.34 | | 15.00 |
| Investment Operations: | | | | | | | | | | |
| Investment income—net a | | .19 | | .22 | | .15 | | .19 | | .27 |
| Net realized and unrealized | | | | | | | | | | |
| gain (loss) on investments | | (.35) | | .50 | | 1.84 | | (2.25) | | (1.65) |
| Total from Investment Operations | | (.16) | | .72 | | 1.99 | | (2.06) | | (1.38) |
| Distributions: | | | | | | | | | | |
| Dividends from investment income—net | | (.23) | | (.28) | | (.21) | | (.19) | | (.28) |
| Dividends from net realized | | | | | | | | | | |
| gain on investments | | — | | — | | — | | — | | — |
| Total Distributions | | (.23) | | (.28) | | (.21) | | (.19) | | (.28) |
| Net asset value, end of period | | 12.92 | | 13.31 | | 12.87 | | 11.09 | | 13.34 |
| |
| |
| |
| |
| |
|
| Total Return (%) | | (1.21) | | 5.64 | | 18.14 | | (15.48) | | (9.12) |
| |
| |
| |
| |
| |
|
| Ratios/Supplemental Data (%): | | | | | | | | | | |
| Ratio of total expenses | | | | | | | | | | |
| to average net assets | | .91 | | .88 | | .89 | | .85 | | .85 |
| Ratio of net expenses | | | | | | | | | | |
| to average net assets | | .90 | | .88 | | .89 | | .85 | | .85 |
| Ratio of net investment income | | | | | | | | | | |
| to average net assets | | 1.45 | | 1.73 | | 1.26 | | 1.58 | | 1.92 |
| Portfolio Turnover Rate | | 41.89 | | 281.51b | | 363.02b | | 388.26 | | 128.44 |
| |
| |
| |
| |
| |
|
| Net Assets, end of period ($ x 1,000) | | 49,094 | | 61,038 | | 67,239 | | 64,865 | | 96,290 |
| a | | Based on average shares outstanding at each month end. | | | | | | | | |
| b | | The portfolio turnover rates excluding mortgage dollar roll transactions for the years ended December 31, 2004 and |
| | | December 31, 2003 were 266.40% and 305.71%, respectively. | | | | | | |
| See notes to financial statements. | | | | | | | | | | |
| | | | | | | Year Ended December 31, | | |
| | | |
| |
| |
|
| Service Shares | | 2005 | | 2004 | | 2003 | | 2002 | | 2001 |
| |
| |
| |
| |
| |
|
| Per Share Data ($): | | | | | | | | | | |
| Net asset value, beginning of period | | 13.33 | | 12.87 | | 11.08 | | 13.33 | | 15.00 |
| Investment Operations: | | | | | | | | | | |
| Investment income—net a | | .17 | | .21 | | .14 | | .17 | | .22 |
| Net realized and unrealized | | | | | | | | | | |
| gain (loss) on investments | | (.34) | | .50 | | 1.84 | | (2.24) | | (1.63) |
| Total from Investment Operations | | (.17) | | .71 | | 1.98 | | (2.07) | | (1.41) |
| Distributions: | | | | | | | | | | |
| Dividends from investment income—net | | (.22) | | (.25) | | (.19) | | (.18) | | (.26) |
| Net asset value, end of period | | 12.94 | | 13.33 | | 12.87 | | 11.08 | | 13.33 |
| |
| |
| |
| |
| |
|
| Total Return (%) | | (1.30) | | 5.57 | | 18.02 | | (15.63) | | (9.31) |
| |
| |
| |
| |
| |
|
| Ratios/Supplemental Data (%): | | | | | | | | | | |
| Ratio of total expenses | | | | | | | | | | |
| to average net assets | | 1.16 | | 1.13 | | 1.14 | | 1.09 | | 1.16 |
| Ratio of net expenses | | | | | | | | | | |
| to average net assets | | 1.00 | | 1.00 | | 1.00 | | 1.00 | | 1.00 |
| Ratio of net investment income | | | | | | | | | | |
| to average net assets | | 1.35 | | 1.62 | | 1.15 | | 1.45 | | 1.66 |
| Portfolio Turnover Rate | | 41.89 | | 281.51b | | 363.02b | | 388.26 | | 128.44 |
| |
| |
| |
| |
| |
|
| Net Assets, end of period ($ x 1,000) | | 18,141 | | 21,912 | | 23,313 | | 22,040 | | 15,396 |
| a | | Based on average shares outstanding at each month end. | | | | | | | | |
| b | | The portfolio turnover rates excluding mortgage dollar roll transactions for the years ended December 31, 2004 and |
| | | December 31, 2003 were 266.40% and 305.71%, respectively. | | | | | | |
| See notes to financial statements. | | | | | | | | | | |
NOTES TO FINANCIAL STATEMENTS
NOTE 1—Significant Accounting Policies:
Dreyfus Variable Investment Fund (the “fund”) is registered under the Investment Company Act of 1940, as amended (the “Act”), as an open-end management investment company, operating as a series company currently offering twelve series, including the Balanced Portfolio (the “portfolio”).The portfolio is only offered to separate accounts established by insurance companies to fund variable annuity contracts and variable life insurance policies.The portfolio is a diversified series.The portfolio’s investment objective seeks high total return through a combination of capital appreciation and current income.The Dreyfus Corporation (the “Manager” or “Dreyfus”) serves as the portfolio’s investment adviser. Dreyfus is a wholly-owned subsidiary of Mellon Financial Corporation (“Mellon Financial”).Wisconsin Capital Management, Inc. (“Wisconsin Capital”) serves as the portfolio’s sub-investment adviser.
Dreyfus Service Corporation (the “Distributor”), a wholly-owned subsidiary of the Manager, is the distributor of the portfolio’s shares, which are sold without a sales charge.The portfolio is authorized to issue an unlimited number of $.001 par value shares of Beneficial Interest in each of the following classes of shares: Initial and Service. Each class of shares has identical rights and privileges, except with respect to the distribution plan and the expenses borne by each class and certain voting rights. Income, expenses (other than expenses attributable to a specific class), and realized and unrealized gains or losses on investments are allocated to each class of shares based on its relative net assets.
The fund accounts separately for the assets, liabilities and operations of each series. Expenses directly attributable to each series are charged to that series’ operations; expenses which are applicable to all series are allocated among them on a pro rata basis.
The portfolio’s financial statements are prepared in accordance with U.S. generally accepted accounting principles, which may require the use of management estimates and assumptions.Actual results could differ from those estimates.
The fund enters into contracts that contain a variety of indemnifica-tions.The portfolio’s maximum exposure under these arrangements is unknown. The portfolio does not anticipate recognizing any loss related to these arrangements.
(a) Portfolio valuation: Most debt securities are valued each business day by an independent pricing service (the “Service”) approved by the Board of Trustees. Securities listed on the National Market System, for which market quotations are available are valued at the official closing price or, if there is no official closing price that day, at the last sale price. Debt securities for which quoted bid prices are readily available and are representative of the bid side of the market in the judgment of the Service are valued at the mean between the quoted bid prices (as obtained by the Service from dealers in such securities) and asked prices (as calculated by the Service based upon its evaluation of the market for such securities). Other debt securities are carried at fair value as determined by the Service, based on methods which include consideration of: yields or prices of securities of comparable quality, coupon, maturity and type; indications as to values from dealers; and general market conditions. Other securities are valued at the last sales price on the securities exchange or on the national securities market on which such securities are primarily traded. Securities listed on the National Market System for which market quotations are available are valued at the official closing price or, if there is no official closing price that day, at the last sales price. Securities not listed on an exchange or the national securities market, or securities for which there were no transactions, are valued at the average of the most recent bid and asked prices, except for open short positions, where the asked price is used for valuation purposes. Bid price is used when no asked price is available. Investments in registered companies are valued at their net asset value.When market quotations or official closing prices are not readily available, or are determined not to reflect accurately fair value, such as when the value of a security has been significantly affected by events after the close of the exchange or market on which the security is
NOTES TO FINANCIAL STATEMENTS (continued)
|
principally traded (for example, a foreign exchange or market), but before the portfolio calculates its net asset value, the portfolio may value these investments at fair value as determined in accordance with the procedures approved by the Board of Trustees. Fair valuing of securities may be determined with the assistance of a pricing service using calculations based on indices of domestic securities and other appropriate indicators, such as prices of relevant ADR’s and futures contracts. Investments denominated in foreign currencies are translated to U.S. dollars at the prevailing rates of exchange. For other securities that are fair valued by the Board of Trustees, certain factors may be considered such as: fundamental analytical data, the nature and duration of restrictions on disposition, an evaluation of the forces that influence the market in which the securities are purchased and sold, and public trading in similar securities of the issuer or comparable issuers. Financial futures are valued at the last sales price. Investments denominated in foreign currencies are translated to U.S. dollars at the prevailing rates of exchange. Forward currency exchange contracts are valued at the forward rate.
(b) Foreign currency transactions: The portfolio does not isolate that portion of the results of operations resulting from changes in foreign exchange rates on investments from the fluctuations arising from changes in market prices of securities held. Such fluctuations are included with the net realized and unrealized gain or loss on investments.
Net realized foreign exchange gains or losses arise from sales and maturities of short-term securities, sales of foreign currencies, currency gains or losses realized on securities transactions and the difference between the amounts of dividends, interest and foreign withholding taxes recorded on the portfolio’s books and the U.S. dollar equivalent of the amounts actually received or paid. Net unrealized foreign exchange gains or losses arise from changes in the value of assets and liabilities other than investments in securities, resulting from changes in exchange rates. Such gains and losses are included with net realized and unrealized gain or loss on investments.
(c) Securities transactions and investment income: Securities transactions are recorded on a trade date basis. Realized gain and loss from securities transactions are recorded on the identified cost basis. Dividend income is recognized on the ex-dividend date and interest income, including, where applicable, accretion of discount and amortization of premium on investments, is recognized on the accrual basis.
The portfolio has an arrangement with the custodian bank whereby the portfolio receives earnings credits from the custodian when positive cash balances are maintained, which are used to offset custody fees. For financial reporting purposes, the portfolio includes net earnings credits as an expense offset in the Statement of Operations.
Pursuant to a securities lending agreement with Mellon Bank, N.A., an affiliate of Dreyfus, the portfolio may lend securities to qualified institutions.At origination, all loans are secured by collateral of at least 102% of the value of U.S. securities loaned and 105% of the value of foreign securities loaned. Collateral equivalent to at least 100% of the market value of securities on loan will be maintained at all times. Cash collateral is invested in certain money market mutual funds managed by Dreyfus. The portfolio will be entitled to receive all income on securities loaned, in addition to income earned as a result of the lending transaction. Although each security loaned is fully collateralized, the portfolio would bear the risk of delay in recovery of, or loss of rights in, the securities loaned should a borrower fail to return the securities in a timely manner.
(d) Affiliated issuers: Investments in other investment companies advised by Dreyfus are defined as “affiliated” in the Act.
(e) Dividends to shareholders: Dividends are recorded on the ex-dividend date. Dividends from investment income-net are declared and paid quarterly. Dividends from net realized capital gain, if any, are normally declared and paid annually, but the portfolio may make distributions on a more frequent basis to comply with the distribution requirements of the Internal Revenue Code of 1986, as amended (the
NOTES TO FINANCIAL STATEMENTS (continued)
|
“Code”). To the extent that net realized capital gain can be offset by capital loss carryovers, it is the policy of the portfolio not to distribute such gain. Income and capital gain distributions are determined in accordance with income tax regulations, which may differ from U.S. generally accepted accounting principles.
(f) Federal income taxes: It is the policy of the portfolio to continue to qualify as a regulated investment company, if such qualification is in the best interests of its shareholders, by complying with the applicable provisions of the Code, and to make distributions of taxable income sufficient to relieve it from substantially all federal income and excise taxes.
At December 31, 2005, the components of accumulated earnings on a tax basis were as follows: undistributed ordinary income $467,715, accumulated capital losses $14,909,425 and unrealized appreciation $343,494. In addition, the fund had $917,170 of capital losses realized after October 31, 2005, which were deferred for tax purposes to the first day of the following fiscal year.
The accumulated capital loss carryover is available to be applied against future net securities profits, if any, realized subsequent to December 31, 2005. If not applied, $2,741,702 of the carryover expires in fiscal 2009, $8,289,370 expires in fiscal 2010 and $3,878,353 expires in fiscal 2011.
The tax character of distributions paid to shareholders during the fiscal periods ended December 31, 2005 and December 31, 2004, were as follows: ordinary income $1,249,668 and $1,735,919.
During the period ended December 31, 2005, as a result of permanent book to tax differences, primarily due to the tax treatment for amortization of premiums and treasury inflation protected securities, the portfolio increased accumulated undistributed investment income-net by $390,820 and decreased accumulated net realized gain (loss) on investments by the same amount. Net assets were not affected by this reclassification.
NOTE 2—Bank Line of Credit:
The portfolio participates with other Dreyfus-managed funds in a $350 million redemption credit facility (the “Facility”) to be utilized for temporary or emergency purposes, including the financing of redemptions. In connection therewith, the portfolio has agreed to pay commitment fees on its pro rata portion of the Facility. Interest is charged to the portfolio based on prevailing market rates in effect at the time of borrowing. During the period ended December 31, 2005, the portfolio did not borrow under the Facility.
NOTE 3—Investment Advisory Fee and Other Transactions With Affiliates:
(a) Pursuant to an Investment Advisory Agreement with Dreyfus, the investment advisory fee is computed at the annual rate of .75% of the value of the portfolio’s average daily net assets and is payable monthly.
Dreyfus has agreed, from January 1, 2005 to December 31, 2006, to waive receipt of its fees and/or assume the expenses of the portfolio so that the expenses of neither class, exclusive of taxes, brokerage fees, interest on borrowings, commitment fees and extraordinary expenses, exceed 1% of the value of the average daily net assets of their class. During the period ended December 31, 2005, Dreyfus waived receipt of fees of $36,263 pursuant to the undertaking.
Pursuant to a Sub-Investment Advisory Agreement between Dreyfus and Wisconsin Capital, the sub-investment advisory fee is payable monthly by Dreyfus, and is based upon the value of the portfolio’s average daily net assets, computed at the following annual rates:
| Average Net Assets | | |
| 0 to $300 million | | .25% |
| In excess of $300 million | | .20% |
NOTES TO FINANCIAL STATEMENTS (continued)
|
(b) Under the Distribution Plan (the “Plan”) adopted pursuant to Rule 12b-1 under the Act, Service shares pay the Distributor for distributing their shares, for servicing and/or maintaining Service shares shareholder accounts and for advertising and marketing for Service shares.The Plan provides for payments to be made at an annual rate of .25% of the value of the Service shares’ average daily net assets.The Distributor may make payments to Participating Insurance Companies and to brokers and dealers acting as principal underwriter for their variable insurance products.The fees payable under the Plan are payable without regard to actual expenses incurred. During the period ended December 31, 2005, Service shares were charged $48,826 pursuant to the Plan.
The portfolio compensates Dreyfus Transfer, Inc., a wholly-owned subsidiary of Dreyfus, under a transfer agency agreement for providing personnel and facilities to perform transfer agency services for the portfolio. During the period ended December 31, 2005, the portfolio was charged $53 pursuant to the transfer agency agreement.
The portfolio compensates Mellon Bank, N.A., an affiliate of Dreyfus, under a custody agreement for providing custodial services for the portfolio. During the period ended December 31, 2005, the portfolio was charged $10,588 pursuant to the custody agreement.
During the period ended December 31, 2005, the portfolio was charged $3,762 for services performed by the Chief Compliance Officer.
The components of Due to The Dreyfus Corporation and affiliates in the Statement of Assets and Liabilities consist of: investment advisory fees $43,426, Rule 12b-1 distribution plan fees $3,877, custodian fees $2,460, chief compliance officer fees $1,858 and transfer agency per account fees $10, which are offset against an expense reimbursement currently in effect in the amount of $1,395.
(c) Each Board member also serves as a Board member of other funds within the Dreyfus complex. Annual retainer fees and attendance fees are allocated to each fund based on net assets.
(d) Pursuant to an exemptive order from the Securities and Exchange Commission, the portfolio may invest its available cash balances in affiliated money market mutual funds. Management fees of the underlying money market mutual funds have been waived by Dreyfus.
NOTE 4—Securities Transactions:
The aggregate amount of purchases and sales (including paydowns) of investment securities, excluding short-term securities, during the period ended December 31, 2005, amounted to $30,377,379 and $39,530,112, respectively.
At December 31, 2005, the cost of investments for federal income tax purposes was $69,267,262; accordingly, accumulated net unrealized appreciation on investments was $343,494, consisting of $4,485,810 gross unrealized appreciation and $4,142,316 gross unrealized depreciation.
REPORT OF INDEPENDENT REGISTERED PUBLIC ACCOUNTING FIRM
Shareholders and Board of Trustees
Dreyfus Variable Investment Fund, Balanced Portfolio
We have audited the accompanying statement of assets and liabilities, including the statement of investments, of Dreyfus Variable Investment Fund, Balanced Portfolio (one of the funds comprising Dreyfus Variable Investment Fund) as of December 31, 2005, and the related statement of operations for the year then ended, the statement of changes in net assets for each of the two years in the period then ended, and financial highlights for each of the years indicated therein.These financial statements and financial highlights are the responsibility of the Fund’s management. Our responsibility is to express an opinion on these financial statements and financial highlights based on our audits.
We conducted our audits in accordance with the standards of the Public Company Accounting Oversight Board (United States).Those standards require that we plan and perform the audit to obtain reasonable assurance about whether the financial statements and financial highlights are free of material misstatement.We were not engaged to perform an audit of the Fund’s internal control over financial reporting. Our audits included consideration of internal control over financial reporting as a basis for designing audit procedures that are appropriate in the circumstances, but not for the purpose of expressing an opinion on the effectiveness of the Fund’s internal control over financial reporting.Accordingly, we express no such opinion. An audit also includes examining, on a test basis, evidence supporting the amounts and disclosures in the financial statements and financial highlights,assessing the accounting principles used and significant estimates made by management,and evaluating the overall financial statement presentation. Our procedures included verification by examination of securities held by the custodian as of December 31, 2005 and confirmation of securities not held by the custodian by correspondence with oth-ers.We believe that our audits provide a reasonable basis for our opinion.
In our opinion, the financial statements and financial highlights referred to above present fairly, in all material respects, the financial position of Dreyfus Variable Investment Fund, Balanced Portfolio at December 31, 2005, the results of its operations for the year then ended, the changes in its net assets for each of the two years in the period then ended, and the financial highlights for each of the indicated years, in conformity with U.S. generally accepted accounting principles.
New York, New York
February 6, 2006
|
IMPORTANT TAX INFORMATION (Unaudited)
For federal tax purposes, the portfolio hereby designates 61.83% of the ordinary dividends paid during the fiscal year ended December 31, 2005 as qualifying for the corporate dividends received deduction. Shareholders will receive notification in January 2006 of the percentage applicable to the preparation of their 2005 income tax returns.
| BOARD MEMBERS INFORMATION (Unaudited) |
| |
| |
| |
| Joseph S. DiMartino (62) |
| Chairman of the Board (1995) |
| Principal Occupation During Past 5 Years: |
| • Corporate Director and Trustee |
| Other Board Memberships and Affiliations: |
| • The Muscular Dystrophy Association, Director |
| • Levcor International, Inc., an apparel fabric processor, Director |
| • Century Business Services, Inc., a provider of outsourcing functions for small and medium size |
| companies, Director |
| • The Newark Group, a provider of a national market of paper recovery facilities, paperboard |
| mills and paperboard converting plants, Director |
| • Sunair Services Corporation, engages in the design, manufacture and sale of high frequency |
| systems for long-range voice and data communications, as well as providing certain outdoor- |
| related services to homes and businesses, Director |
| No. of Portfolios for which Board Member Serves: 193 |
| ——————— |
| David P. Feldman (66) |
| Board Member (1994) |
| Principal Occupation During Past 5 Years: |
| • Corporate Director and Trustee |
| Other Board Memberships and Affiliations: |
| • BBH Mutual Funds Group (11 funds), Director |
| • The Jeffrey Company, a private investment company, Director |
| • QMED, a medical device company, Director |
| No. of Portfolios for which Board Member Serves: 58 |
| ——————— |
| James F. Henry (75) |
| Board Member (1990) |
| Principal Occupation During Past 5 Years: |
| • President, CPR Institute for Dispute Resolution, a non-profit organization principally |
| engaged in the development of alternatives to business litigation (Retired 2003) |
| No. of Portfolios for which Board Member Serves: 22 |
30
| Dr. Paul A. Marks (79) |
| Board Member (1990) |
| Principal Occupation During Past 5 Years: |
| • President, Emeritus (2000-present) and President and Chief Executive Officer of Memorial |
| Sloan-Kettering Cancer Center (Retired 1999) |
| Other Board Memberships and Affiliations: |
| • Pfizer, Inc., a pharmaceutical company, Director-Emeritus |
| • Lazard Freres & Company, LLC, Senior Adviser |
| • Carrot Capital Health Care Ventures, Advisor |
| • Armgo-Start-Up Biotech; Board of Directors |
| • Nanoviricide, Board Director |
| • PTC, Scientific Advisory Board |
| No. of Portfolios for which Board Member Serves: 22 |
| ——————— |
| Dr. Martin Peretz (66) |
| Board Member (1990) |
| Principal Occupation During Past 5 Years: |
| • Editor-in-Chief of The New Republic Magazine |
| • Lecturer in Social Studies at Harvard University (1965-2001) |
| • Co-Chairman of TheStreet.com, a financial daily on the web |
| Other Board Memberships and Affiliations: |
| • Academy for Liberal Education, an accrediting agency for colleges and universities certified by |
| the U.S. Department of Education, Director |
| • Harvard Center for Blood Research,Trustee |
| • Bard College,Trustee |
| • Board of Overseers of YIVO Institute for Jewish Research, Chairman |
| No. of Portfolios for which Board Member Serves: 22 |
| ——————— |
| Once elected all Board Members serve for an indefinite term.The address of the Board Members and Officers is in c/o |
| The Dreyfus Corporation, 200 Park Avenue, New York, New York 10166. Additional information about the Board |
| Members is available in the fund’s Statement of Additional Information which can be obtained from Dreyfus free of |
| charge by calling this toll free number: 1-800-554-4611. |
| John M. Fraser, Jr., Emeritus Board Member |
| Rosalind Gersten Jacobs, Emeritus Board Member |
The Portfolio 31
OFFICERS OF THE FUND (Unaudited)
| STEPHEN E. CANTER, President since |
| March 2000. |
Chairman of the Board, Chief Executive Officer and Chief Operating Officer of the Manager, and an officer of 90 investment companies (comprised of 184 portfolios) managed by the Manager. Mr. Canter also is a Board member and, where applicable, an Executive Committee Member of the other investment management subsidiaries of Mellon Financial Corporation, each of which is an affiliate of the Manager. He is 60 years old and has been an employee of the Manager since May 1995.
| STEPHEN R. BYERS, Executive Vice |
| President since November 2002. |
Chief Investment Officer,Vice Chairman and a director of the Manager, and an officer of 90 investment companies (comprised of 184 portfolios) managed by the Manager. Mr. Byers also is an officer, director or an Executive Committee Member of certain other investment management subsidiaries of Mellon Financial Corporation, each of which is an affiliate of the Manager. He is 52 years old and has been an employee of the Manager since January 2000.
| MARK N. JACOBS, Vice President since |
| March 2000. |
Executive Vice President, Secretary and General Counsel of the Manager, and an officer of 91 investment companies (comprised of 200 portfolios) managed by the Manager. He is 59 years old and has been an employee of the Manager since June 1977.
| MICHAEL A. ROSENBERG, Vice President |
| and Secretary since August 2005. |
Associate General Counsel of the Manager, and an officer of 91 investment companies (comprised of 200 portfolios) managed by the Manager. He is 45 years old and has been an employee of the Manager since October 1991.
| JAMES BITETTO, Vice President and |
| Assistant Secretary since August 2005. |
Assistant General Counsel and Assistant Secretary of the Manager, and an officer of 91 investment companies (comprised of 200 portfolios) managed by the Manager. He is 39 years old and has been an employee of the Manager since December 1996.
| JONI LACKS CHARATAN, Vice President |
| and Assistant Secretary since |
| August 2005. |
Associate General Counsel of the Manager, and an officer of 91 investment companies (comprised of 200 portfolios) managed by the Manager. She is 50 years old and has been an employee of the Manager since October 1988.
| JOSEPH M. CHIOFFI, Vice President and |
| Assistant Secretary since August 2005. |
Assistant General Counsel of the Manager, and an officer of 91 investment companies (comprised of 200 portfolios) managed by the Manager. He is 44 years old and has been an employee of the Manager since June 2000.
| JANETTE E. FARRAGHER, Vice President |
| and Assistant Secretary since |
| August 2005. |
Associate General Counsel of the Manager, and an officer of 91 investment companies (comprised of 200 portfolios) managed by the Manager. She is 43 years old and has been an employee of the Manager since February 1984.
| JOHN B. HAMMALIAN, Vice President and |
| Assistant Secretary since August 2005. |
Associate General Counsel of the Manager, and an officer of 91 investment companies (comprised of 200 portfolios) managed by the Manager. He is 42 years old and has been an employee of the Manager since February 1991.
| ROBERT R. MULLERY, Vice President and |
| Assistant Secretary since August 2005. |
Associate General Counsel of the Manager, and an officer of 91 investment companies (comprised of 200 portfolios) managed by the Manager. He is 53 years old and has been an employee of the Manager since May 1986.
| JEFF PRUSNOFSKY, Vice President and |
| Assistant Secretary since August 2005. |
Associate General Counsel of the Manager, and an officer of 91 investment companies (comprised of 200 portfolios) managed by the Manager. He is 40 years old and has been an employee of the Manager since October 1990.
| JAMES WINDELS, Treasurer since |
| November 2001. |
Director – Mutual Fund Accounting of the Manager, and an officer of 91 investment companies (comprised of 200 portfolios) managed by the Manager. He is 47 years old and has been an employee of the Manager since April 1985.
| ERIK D. NAVILOFF, Assistant Treasurer |
| since December 2002. |
Senior Accounting Manager – Taxable Fixed Income Funds of the Manager, and an officer of 91 investment companies (comprised of 200 portfolios) managed by the Manager. He is 37 years old and has been an employee of the Manager since November 1992.
| ROBERT ROBOL, Assistant Treasurer |
| since August 2003. |
Senior Accounting Manager – Money Market and Municipal Bond Funds of the Manager, and an officer of 91 investment companies (comprised of 200 portfolios) managed by the Manager. He is 41 years old and has been an employee of the Manager since October 1988.
| ROBERT SVAGNA, Assistant Treasurer |
| since December 2002. |
Senior Accounting Manager – Equity Funds of the Manager, and an officer of 91 investment companies (comprised of 200 portfolios) managed by the Manager. He is 38 years old and has been an employee of the Manager since November 1990.
| GAVIN C. REILLY, Assistant Treasurer |
| since December 2005. |
Tax Manager of the Investment Accounting and Support Department of the Manager, and an officer of 91 investment companies (comprised of 200 portfolios) managed by the Manager. He is 37 years old and has been an employee of the Manager since April 1991.
| JOSEPH W. CONNOLLY, Chief Compliance |
| Officer since October 2004. |
Chief Compliance Officer of the Manager and The Dreyfus Family of Funds (91 investment companies, comprised of 200 portfolios). From November 2001 through March 2004, Mr. Connolly was first Vice-President, Mutual Fund Servicing for Mellon Global Securities Services. In that capacity, Mr. Connolly was responsible for managing Mellon’s Custody, Fund Accounting and Fund Administration services to third-party mutual fund clients. He is 48 years old and has served in various capacities with the Manager since 1980, including manager of the firm’s Fund Accounting Department from 1997 through October 2001.
| WILLIAM GERMENIS, Anti-Money |
| Laundering Compliance Officer since |
| September 2002. |
Vice President and Anti-Money Laundering Compliance Officer of the Distributor, and the Anti-Money Laundering Compliance Officer of 87 investment companies (comprised of 196 portfolios) managed by the Manager. He is 35 years old and has been an employee of the Distributor since October 1998.
| Dreyfus Variable |
| Investment Fund, |
| Balanced Portfolio |
| 200 Park Avenue |
| New York, NY 10166 |
| |
| Investment Adviser |
| The Dreyfus Corporation |
| 200 Park Avenue |
| New York, NY 10166 |
| |
| Sub-Investment Adviser |
| Wisconsin Capital Management, Inc. |
| 1200 John Q. Hammons Drive |
| Madison,Wisconsin 53717 |
| Custodian |
| Mellon Bank, N.A. |
| One Mellon Bank Center |
| Pittsburgh, PA 15258 |
| |
| Transfer Agent & |
| Dividend Disbursing Agent |
| Dreyfus Transfer, Inc. |
| 200 Park Avenue |
| New York, NY 10166 |
| |
| Distributor |
| Dreyfus Service Corporation |
| 200 Park Avenue |
| New York, NY 10166 |
Telephone 1-800-554-4611 or 516-338-3300
Mail The Dreyfus Family of Funds, 144 Glenn Curtiss Boulevard, Uniondale, NY 11556-0144 Attn: Institutional Servicing
The portfolio files its complete schedule of portfolio holdings with the Securities and
Exchange Commission (“SEC”) for the first and third quarters of each fiscal year on Form N-Q. The portfolio’s Forms N-Q are available on the SEC’s website at http://www.sec.gov and may be reviewed and copied at the SEC’s Public Reference Room in Washington, DC. Information on the operation of the Public Reference Room may be obtained by calling 1-800-SEC-0330.
A description of the policies and procedures that the portfolio uses to determine how to vote proxies relating to portfolio securities, and information regarding how the portfolio voted these proxies for the 12-month period ended June 30, 2005, is available through the portfolio’s website at http://www.dreyfus.com and on the SEC’s website at http://www.sec.gov. The description of the policies and procedures is also available without charge, upon request, by calling 1-800-645-6561.
© 2006 Dreyfus Service Corporation

The views expressed in this report reflect those of the portfolio manager only through the end of the period covered and do not necessarily represent the views of Dreyfus or any other person in the Dreyfus organization.Any such views are subject to change at any time based upon market or other conditions and Dreyfus disclaims any responsibility to update such views. These views may not be relied on as investment advice and, because investment decisions for a Dreyfus portfolio are based on numerous factors, may not be relied on as an indication of trading intent on behalf of any Dreyfus portfolio.
Not FDIC-Insured • Not Bank-Guaranteed • May Lose Value
| | | Contents |
| |
| | | T H E P O R T F O L I O |
| |
|
| 2 | | Letter from the Chairman |
| 3 | | Discussion of Performance |
| 6 | | Portfolio Performance |
| 8 | | Understanding Your Portfolio’s Expenses |
| 8 | | Comparing Your Portfolio’s Expenses |
| | | With Those of Other Funds |
| 9 | | Statement of Investments |
| 16 | | Statement of Assets and Liabilities |
| 17 | | Statement of Operations |
| 18 | | Statement of Changes in Net Assets |
| 19 | | Financial Highlights |
| 21 | | Notes to Financial Statements |
| 28 | | Report of Independent Registered |
| | | Public Accounting Firm |
| 29 | | Board Members Information |
| 31 | | Officers of the Fund |
| | | F O R M O R E I N F O R M AT I O N |
| |
|
| | | Back Cover |
| Dreyfus Variable Investment Fund, |
| Developing Leaders Portfolio |
The Portfolio

LETTER FROM THE CHAIRMAN
Dear Shareholder:
We are pleased to present this annual report for Dreyfus Variable Investment Fund, Developing Leaders Portfolio, covering the 12-month period from January 1, 2005, through December 31, 2005. Inside, you’ll find valuable information about how the portfolio was managed during the reporting period, including a discussion with the portfolio managers, John S. Cone, Oliver Buckley, Langton C. Garvin and Kristin Crawford, each of whom is a member of the Smallcap Team of Franklin Portfolio Associates, LLC.
Stocks generally absorbed both good and bad news in 2005 to post modestly positive total returns. On the plus side, an expanding U.S. economy and low inflation helped support corporate earnings in most industry groups. Negative influences included rising short-term interest rates and escalating energy prices, which many analysts feared might erode corporate profits. In addition, hurricanes Katrina, Rita and Wilma disrupted economic activity along the Gulf Coast.
We expect the U.S. economy to continue its moderate expansion in 2006, fueled in part by a rebound in corporate capital spending and exports. The labor market likely will remain relatively strong while inflation should stay low, supporting consumers’ real incomes. Risks in the new year include the possible end of the boom in the housing market, where we believe prices are more likely to stall than plunge.
As always, we encourage you to speak with your financial consultant about how these and other market forces may affect your investments. Thank you for your continued confidence and support.

DISCUSSION OF PERFORMANCE
Franklin Portfolio Associates Smallcap Team, Portfolio Managers
How did Dreyfus Variable Investment Fund, Developing Leaders Portfolio perform relative to its benchmark?
For the 12-month period ended December 31, 2005, the portfolio produced total returns of 5.80% for its Initial shares and 5.56% for its Service shares.1 In comparison,the Russell 2000 Index (the “Index”),the portfolio’s benchmark, produced a total return of 4.55% for the same period.2
We attribute the small-cap market’s gains to stronger economic growth during the second half of the reporting period, which allayed earlier concerns regarding rising interest rates and energy prices. Energy stocks led the market’s rise due to higher oil and gas prices. In addition, the market tended to reward companies that raised and met earnings expectations, while punishing those reporting disappointing financial results.The portfolio outperformed the Index, primarily due to the strength of its energy sector position during the first half of the reporting period and good individual stock selections across a variety of sectors during the second half of the reporting period.
What is the portfolio’s investment approach?
With the appointment of the current management team on June 30, 2005, the portfolio employs an investment process based on a “bottom-up” approach that seeks to identify undervalued small-cap stocks using a quantitative screening process.This process is driven by a proprietary quantitative model which uses over 40 factors to identify and rank stocks based on:
| • | | fundamental momentum, meaning measures that reflect the changes in |
| | | short-term earnings outlook through factors such as revised earn- |
| | | ings estimates and earnings surprises; |
| • | | relative value, such as current and forecasted price-to-earnings ratios, |
| | | price-to-book ratios, yields and other price-sensitive data for a stock |
| | | compared to its past, its peers and the models’ overall stock universe; |
| • | | future value, such as discounted present value measures; |
| • | | long-term growth, based on measures that reflect the changes in |
| | | estimated long-term earnings growth over multiple horizons; and |
DISCUSSION OF PERFORMANCE (continued)
|
• additional factors, such as technical factors, trading by company insiders or share issuance/buy-back data.
Next, through a “bottom-up” approach, the portfolio managers focus on stock selection as opposed to making proactive decisions about industry or sector exposure. Over time, the portfolio managers attempt to construct a portfolio that has exposure to industries and market capitalizations that is generally similar to the portfolio’s benchmark. Finally, within each sector, the portfolio managers seek to overweight the most attractive stocks and underweight or not hold the stocks that have been ranked least attractive.
What other factors influenced the portfolio’s performance?
During the first half of the reporting period, the portfolio benefited from relatively heavy exposure to — and successful individual stock selections among — energy stocks, such as Denbury Resources, Cabot Oil & Gas and Arch Coal. Relative performance was further enhanced by favorable stock selections in the health care area, where investments focused on service providers with a history of consistent earnings, and in the transportation sector, which had little exposure to the hard-hit automotive industry. However, these gains were offset to a degree by relatively disappointing stock selections in the technology and materials and processing areas.
During the second half of the reporting period, the investment approach of the new portfolio managers caused the impact of sector and industry weightings to diminish. Instead, returns relative to the Index were driven primarily by the performance of individual stocks identified by our value and earnings/momentum metrics.These sets of metrics determined roughly 90% of the portfolio’s composition during the second half of the reporting period. While earnings/momentum-based metrics helped the portfolio target several strong performing stocks, value metrics proved less effective. As a result, the portfolio produced a mixed record in late 2005, with relatively robust gains in several holdings offset by disappointing results from others. Top performers from July through December 2005 included biotechnology developer Myogen, electronics distributor WESCO International and gold mining firm Agnico-Eagle Mines. Notably weak performers
included reinsurer Montpelier Re Holdings, Ltd.; pharmaceutical company Impax Laboratories; and home health care service provider Apria Healthcare Group.
What is the portfolio’s current strategy?
Recent changes have not altered the portfolio’s primary focus: it continues to provide investors with diversified exposure to the small-cap equities market. At the same time, the portfolio is now more evenly balanced, with exposures to various sectors and industries maintained within 2% of the Index’s weightings. Holdings within each sector are diversified across stocks that, in our judgment, exhibit attractive value characteristics and those that we believe display attractive earnings/momentum characteristics. As of the end of the reporting period, various value-based metrics accounted for roughly a 45% weighting in our process, earnings/momentum-based metrics accounted for approximately 45%, and additional factors accounted for about 10%. These proportions reflect our commitment to adding value through the portfolio’s disciplined, bottom-up investment approach.
January 17, 2006
| | | The portfolio is only available as a funding vehicle under various life insurance policies or variable |
| | | annuity contracts issued by insurance companies. Individuals may not purchase shares of the |
| | | portfolio directly.A variable annuity is an insurance contract issued by an insurance company that |
| | | enables investors to accumulate assets on a tax-deferred basis for retirement or other long-term goals. |
| | | The investment objective and policies of Dreyfus Variable Investment Fund, Developing Leaders |
| | | Portfolio made available through insurance products may be similar to other funds/portfolios |
| | | managed or advised by Dreyfus. However, the investment results of the portfolio may be higher or |
| | | lower than, and may not be comparable to, those of any other Dreyfus fund/portfolio. |
| 1 | | Total return includes reinvestment of dividends and any capital gains paid. Past performance is no |
| | | guarantee of future results. Share price and investment return fluctuate such that upon redemption, |
| | | portfolio shares may be worth more or less than their original cost.The portfolio’s performance does |
| | | not reflect the deduction of additional charges and expenses imposed in connection with investing |
| | | in variable insurance contracts, which will reduce returns. |
| | | Part of the portfolio’s recent performance is attributable to positive returns from its initial |
| | | public offering (IPO) investments.There can be no guarantee that IPOs will have or |
| | | continue to have a positive effect on portfolio performance. |
| 2 | | SOURCE: LIPPER INC. — Reflects reinvestment of dividends and, where applicable, capital |
| | | gain distributions.The Russell 2000 Index is an unmanaged index of small-cap stock performance |
| | | and is composed of the 2,000 smallest companies in the Russell 3000 Index.The Russell 3000 |
| | | Index is composed of the 3,000 largest U.S. companies based on total market capitalization. |
| | | Franklin Portfolio Associates is an independently managed, wholly owned subsidiary of Mellon |
| | | Financial Corporation. Franklin Portfolio Associates has no affiliation to the Franklin Templeton |
| | | Group of Funds or Franklin Resources, Inc.The portfolio managers are dual employees of Franklin |
| | | Portfolio Associates and Dreyfus. |
The Portfolio 5
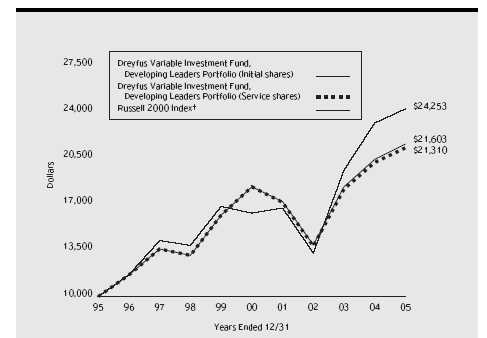
Comparison of change in value of $10,000 investment in Dreyfus Variable Investment Fund, Developing Leaders Portfolio Initial shares and Service shares and the Russell 2000 Index
| Average Annual Total Returns as of | | 12/31/05 | | | | |
| |
| | | 1 Year | | 5 Years | | 10 Years |
| |
| |
| |
|
| Initial shares | | 5.80% | | 3.33% | | 8.01% |
| Service shares | | 5.56% | | 3.05% | | 7.86% |
| |
| The data for Service shares includes the results of Initial shares for the period prior to December 31, 2000 |
| (inception date of Service shares). Actual Service shares’ average annual total return and hypothetical growth |
| results would have been lower. See notes below. | | | | | | |
| † Source: Lipper Inc. | | | | | | |
| Past performance is not predictive of future performance.The portfolio’s performance shown in the graph and table does not |
| reflect the deduction of taxes that a shareholder would pay on portfolio distributions or the redemption of portfolio shares. |
| Part of the portfolio’s recent performance is attributable to positive returns from its initial public offering (IPO) investments. |
| There can be no guarantee that IPOs will have or continue to have a positive effect on the portfolio’s performance. |
| The portfolio’s performance does not reflect the deduction of additional charges and expenses imposed in |
| connection with investing in variable insurance contracts which will reduce returns. | | |
| The above graph compares a $10,000 investment made in Initial and Service shares of Dreyfus Variable Investment |
| Fund, Developing Leaders Portfolio on 12/31/95 to a $10,000 investment made in the Russell 2000 Index (the |
| “Index”) on that date. | | | | | | |
6
The portfolio’s Initial shares are not subject to a Rule 12b-1 fee.The portfolio’s Service shares are subject to a 0.25% annual Rule 12b-1 fee.The performance figures for Service shares reflect the performance of the portfolio’s Initial shares from their inception date through December 30, 2000, and the performance of the portfolio’s Service shares from December 31, 2000 (inception date of Service shares) to December 31, 2005 (blended performance figures).The blended performance figures have not been adjusted to reflect the higher operating expenses of the Service shares. If these expenses had been reflected, the blended performance figures would have been lower. All dividends and capital gain distributions are reinvested.
The portfolio’s performance shown in the line graph takes into account all applicable portfolio fees and expenses.The Index is an unmanaged index and is composed of the 2,000 smallest companies in the Russell 3000 Index.The Russell 3000 Index is composed of 3,000 of the largest U.S. companies by market capitalization.The Index does not take into account charges, fees and other expenses. Further information relating to portfolio performance, including expense reimbursements, if applicable, is contained in the Financial Highlights section of the prospectus and elsewhere in this report.
UNDERSTANDING YOUR PORTFOLIO’S EXPENSES (Unaudited)
As a mutual fund investor,you pay ongoing expenses,such as management fees and other expenses.Using the information below,you can estimate how these expenses affect your investment and compare them with the expenses of other funds.You also may pay one-time transaction expenses,including sales charges (loads) and redemption fees, which are not shown in this section and would have resulted in higher total expenses. For more information, see your portfolio’s prospectus or talk to your financial adviser.
Review your portfolio’s expenses
The table below shows the expenses you would have paid on a $1,000 investment in Dreyfus Variable Investment Fund, Developing Leaders Portfolio from July 1, 2005 to December 31, 2005. It also shows how much a $1,000 investment would be worth at the close of the period, assuming actual returns and expenses.
| Expenses and Value of a $1,000 Investment | | |
| assuming actual returns for the six months ended December 31, 2005 |
| | | Initial Shares | | Service Shares |
| |
| |
|
| Expenses paid per $1,000 † | | $ 4.15 | | $ 5.44 |
| Ending value (after expenses) | | $1,057.80 | | $1,056.60 |
COMPARING YOUR PORTFOLIO’S EXPENSES WITH THOSE OF OTHER FUNDS (Unaudited)
Using the SEC’s method to compare expenses
The Securities and Exchange Commission (SEC) has established guidelines to help investors assess fund expenses. Per these guidelines, the table below shows your portfolio’s expenses based on a $1,000 investment, assuming a hypothetical 5% annualized return. You can use this information to compare the ongoing expenses (but not transaction expenses or total cost) of investing in the portfolio with those of other funds. All mutual fund shareholder reports will provide this information to help you make this comparison. Please note that you cannot use this information to estimate your actual ending account balance and expenses paid during the period.
Expenses and Value of a $1,000 Investment assuming a hypothetical 5% annualized return for the six months ended December 31, 2005
| | | Initial Shares | | Service Shares |
| |
| |
|
| Expenses paid per $1,000 † | | $ 4.08 | | $ 5.35 |
| Ending value (after expenses) | | $1,021.17 | | $1,019.91 |
† Expenses are equal to the portfolio’s annualized expense ratio of .80% for Initial shares and 1.05% for Service shares, multiplied by the average account value over the period, multiplied by 184/365 (to reflect the one-half year period).
STATEMENT OF INVESTMENTS
December 31, 2005
|
| Common Stocks—99.8% | | Shares | | Value ($) |
| |
| |
|
| Advertising—1.5% | | | | |
| Valassis Communications | | 147,700 a | | 4,293,639 |
| Valueclick | | 418,300 a | | 7,575,413 |
| | | | | 11,869,052 |
| Aircraft & Aerospace—2.5% | | | | |
| Armor Holdings | | 250,000 a | | 10,662,500 |
| Triumph Group | | 230,600 a | | 8,442,266 |
| | | | | 19,104,766 |
| Airlines—1.9% | | | | |
| Skywest | | 531,200 | | 14,268,032 |
| Apparel—5.2% | | | | |
| Finish Line, Cl. A | | 500,000 | | 8,710,000 |
| Pacific Sunwear of California | | 470,400 a | | 11,722,368 |
| Talbots | | 300,000 | | 8,346,000 |
| Warnaco Group | | 402,100 a | | 10,744,112 |
| | | | | 39,522,480 |
| Biotechnology—2.6% | | | | |
| Alexion Pharmaceuticals | | 56,600 a,b | | 1,146,150 |
| Geron | | 677,400 a,b | | 5,832,414 |
| Medicines | | 100,000 a | | 1,745,000 |
| Myogen | | 316,400 a | | 9,542,624 |
| Neopharm | | 179,300 a,b | | 1,934,647 |
| | | | | 20,200,835 |
| Broadcasting—.6% | | | | |
| Sinclair Broadcast Group, Cl. A | | 511,400 | | 4,704,880 |
| Casinos & Gaming—.9% | | | | |
| Lakes Entertainment | | 136,000 a,b | | 904,400 |
| Pinnacle Entertainment | | 239,700 a | | 5,922,987 |
| | | | | 6,827,387 |
| Chemicals—2.3% | | | | |
| Agrium | | 565,500 | | 12,435,345 |
| Pioneer Cos. | | 181,000 a | | 5,424,570 |
| | | | | 17,859,915 |
| Commercial & Professional Services—.8% | | |
| Ritchie Brothers Auctioneers | | 146,600 | | 6,193,850 |
STATEMENT OF INVESTMENTS (continued)
|
| Common Stocks (continued) | | Shares | | Value ($) |
| |
| |
|
| Computers—1.0% | | | | |
| Komag | | 230,900 a,b | | 8,002,994 |
| Consumer Services—2.7% | | | | |
| Bankrate | | 95,500 a,b | | 2,819,160 |
| Charles & Colvard | | 72,500 b | | 1,464,500 |
| Olin | | 400,000 | | 7,872,000 |
| Portfolio Recovery Associates | | 180,800 a,b | | 8,396,352 |
| | | | | 20,552,012 |
| Containers—.7% | | | | |
| Chesapeake | | 311,200 | | 5,284,176 |
| Cosmetics/Toiletries—.3% | | | | |
| Parlux Fragrances | | 69,100 a,b | | 2,109,623 |
| Drugs & Medical—.2% | | | | |
| Albany Molecular Research | | 124,200 a | | 1,509,030 |
| Electric Utilities—.8% | | | | |
| UIL Holdings | | 138,400 | | 6,365,016 |
| Electronics—3.3% | | | | |
| ADE | | 340,200 a | | 8,185,212 |
| Agilysys | | 198,300 | | 3,613,026 |
| Coherent | | 50,000 a | | 1,484,000 |
| Conn’s | | 77,500 a,b | | 2,857,425 |
| Hutchinson Technology | | 225,000 a,b | | 6,401,250 |
| Intevac | | 194,800 a | | 2,571,360 |
| | | | | 25,112,273 |
| Financial Services—12.5% | | | | |
| Asset Acceptance Capital | | 63,200 a | | 1,419,472 |
| BankAtlantic Bancorp, Cl. A | | 591,200 | | 8,276,800 |
| Boston Private Financial Holdings | | 289,800 | | 8,815,716 |
| CompuCredit | | 142,400 a,b | | 5,479,552 |
| Corus Bankshares | | 33,800 | | 1,901,926 |
| First Bancorp/Puerto Rico | | 150,900 | | 1,872,669 |
| First Midwest Bancorp/IL | | 296,000 | | 10,377,760 |
| First Niagara Financial Group | | 302,900 | | 4,382,963 |
| First Republic Bank/San Francisco, CA | | 47,800 | | 1,769,078 |
| FirstFed Financial | | 146,100 a | | 7,965,372 |
| Fremont General | | 362,300 | | 8,416,229 |
| Common Stocks (continued) | | Shares | | Value ($) |
| |
| |
|
| Financial Services (continued) | | | | |
| Investment Technology Group | | 212,000 a | | 7,513,280 |
| MAF Bancorp | | 150,900 | | 6,244,242 |
| Texas Regional Bancshares, Cl. A | | 345,000 | | 9,763,500 |
| W Holding | | 83,300 | | 685,559 |
| Waddell & Reed Financial, Cl. A | | 66,700 | | 1,398,699 |
| Wintrust Financial | | 175,000 b | | 9,607,500 |
| Zions Bancorporation | | 1,549 | | 117,043 |
| | | | | 96,007,360 |
| Food Distributors—2.7% | | | | |
| Chiquita Brands International | | 73,800 | | 1,476,738 |
| Performance Food Group | | 285,500 a,b | | 8,099,635 |
| Ralcorp Holdings | | 125,000 a | | 4,988,750 |
| United Natural Foods | | 239,600 a | | 6,325,440 |
| | | | | 20,890,563 |
| Health Care—7.6% | | | | |
| Angiodynamics | | 277,500 a | | 7,084,575 |
| Apria Healthcare Group | | 285,200 a | | 6,876,172 |
| Aspect Medical Systems | | 113,400 a | | 3,895,290 |
| CNS | | 90,000 | | 1,971,900 |
| Genesis HealthCare | | 227,500 a,b | | 8,308,300 |
| IDX Systems | | 156,400 a | | 6,869,088 |
| Magellan Health Services | | 275,000 a | | 8,648,750 |
| NDCHealth | | 235,000 a | | 4,519,050 |
| Palomar Medical Technologies | | 176,600 a,b | | 6,188,064 |
| Per-Se Technologies | | 41,700 a,b | | 974,112 |
| Thoratec | | 153,600 a,b | | 3,177,984 |
| | | | | 58,513,285 |
| Homebuilding—1.1% | | | | |
| Brookfield Homes | | 144,100 b | | 7,166,093 |
| Technical Olympic USA | | 59,200 b | | 1,248,528 |
| | | | | 8,414,621 |
| Hotels, Resorts & Cruise Lines—1.4% | | |
| Intrawest | | 90,900 | | 2,631,555 |
| La Quinta | | 691,700 a | | 7,705,538 |
| | | | | 10,337,093 |
STATEMENT OF INVESTMENTS (continued)
|
| Common Stocks (continued) | | Shares | | Value ($) |
| |
| |
|
| Human Resources—.9% | | | | |
| Resources Connection | | 266,300 a | | 6,939,778 |
| Industrial—2.9% | | | | |
| Actuant, Cl. A | | 173,700 b | | 9,692,460 |
| GrafTech International | | 729,200 a | | 4,535,624 |
| Headwaters | | 233,600 a,b | | 8,278,784 |
| | | | | 22,506,868 |
| Information Technology—2.0% | | | | |
| CACI International, Cl. A | | 115,000 a | | 6,598,700 |
| Intergraph | | 179,200 a | | 8,925,952 |
| | | | | 15,524,652 |
| Insurance—2.3% | | | | |
| Arch Capital Group | | 240,000 a | | 13,140,000 |
| Phoenix Cos. | | 253,300 b | | 3,455,012 |
| UICI | | 33,300 | | 1,182,483 |
| | | | | 17,777,495 |
| Internet—2.9% | | | | |
| Click Commerce | | 176,100 a,b | | 3,701,622 |
| eCollege.com | | 312,400 a | | 5,632,572 |
| InfoSpace | | 298,700 a | | 7,712,434 |
| NetFlix | | 88,300 a,b | | 2,389,398 |
| United Online | | 189,400 | | 2,693,268 |
| | | | | 22,129,294 |
| Machinery/Agricultural/Trucks—3.9% | | |
| AGCO | | 500,000 a,b | | 8,285,000 |
| Gardner Denver | | 205,400 a | | 10,126,220 |
| Wabtec | | 435,400 | | 11,712,260 |
| | | | | 30,123,480 |
| Metals—2.2% | | | | |
| Agnico-Eagle Mines | | 503,300 | | 9,945,208 |
| Dynamic Materials | | 163,000 b | | 4,893,260 |
| Steel Technologies | | 67,100 | | 1,878,129 |
| | | | | 16,716,597 |
| Oil & Gas—6.1% | | | | |
| Atwood Oceanics | | 113,600 a | | 8,864,208 |
| Cabot Oil & Gas | | 263,950 | | 11,904,145 |
| Common Stocks (continued) | | Shares | | Value ($) |
| |
| |
|
| Oil & Gas (continued) | | | | |
| Cimarex Energy | | 152,200 a | | 6,546,122 |
| Hanover Compressor | | 6,978 a | | 98,460 |
| Vectren | | 330,600 | | 8,979,096 |
| W-H Energy Services | | 319,600 a | | 10,572,368 |
| | | | | 46,964,399 |
| Personnel Services—.5% | | | | |
| Hudson Highland Group | | 175,800 a | | 3,051,888 |
| Kforce | | 68,200 a | | 761,112 |
| | | | | 3,813,000 |
| Pharmaceutical—2.2% | | | | |
| Impax Laboratories | | 525,600 a | | 5,623,920 |
| PRA International | | 75,000 a | | 2,111,250 |
| United Therapeutics | | 129,100 a,b | | 8,923,392 |
| | | | | 16,658,562 |
| Real Estate—5.3% | | | | |
| Affordable Residential Communities | | 178,600 b | | 1,702,058 |
| Arbor Realty Trust | | 188,900 | | 4,896,288 |
| Bimini Mortgage Management, Cl. A | | 62,300 b | | 563,815 |
| Boykin Lodging | | 197,400 a | | 2,412,228 |
| Commercial Net Lease Realty | | 66,600 | | 1,356,642 |
| Equity Inns | | 248,300 | | 3,364,465 |
| FelCor Lodging Trust | | 130,600 b | | 2,247,626 |
| Fieldstone Investment | | 230,600 | | 2,734,916 |
| Getty Realty | | 47,000 | | 1,235,630 |
| HomeBanc/Atlanta, GA | | 352,700 | | 2,638,196 |
| LTC Properties | | 50,300 | | 1,057,809 |
| Luminent Mortgage Capital | | 397,900 | | 2,988,229 |
| Omega Healthcare Investors | | 755,900 | | 9,516,781 |
| Sunterra | | 250,300 a,b | | 3,559,266 |
| | | | | 40,273,949 |
| Recreational Products/Toys—1.0% | | | | |
| WMS Industries | | 304,500 a,b | | 7,639,905 |
| Restaurants—.5% | | | | |
| Jack in the Box | | 100,000 a | | 3,493,000 |
| | STATEMENT OF INVESTMENTS (continued)
|
| Common Stocks (continued) | | Shares | | Value ($) |
| |
| |
|
| Retail—2.5% | | | | |
| Hibbett Sporting Goods | | 197,250 a | | 5,617,680 |
| Petco Animal Supplies | | 250,000 a | | 5,487,500 |
| Sonic Automotive | | 179,400 | | 3,997,032 |
| Tuesday Morning | | 203,400 | | 4,255,128 |
| | | | | 19,357,340 |
| Semiconductors—3.5% | | | | |
| Exar | | 110,166 a | | 1,379,278 |
| Integrated Device Technology | | 1,016,530 a | | 13,397,865 |
| MIPS Technologies | | 288,300 a | | 1,637,544 |
| PLX Technology | | 107,500 a | | 924,500 |
| Power Integrations | | 385,000 a | | 9,166,850 |
| | | | | 26,506,037 |
| Software—1.3% | | | | |
| Quest Software | | 635,500 a | | 9,271,945 |
| Transaction Systems Architects | | 33,300 a | | 958,707 |
| | | | | 10,230,652 |
| Steel—1.1% | | | | |
| NS Group | | 197,700 a | | 8,265,837 |
| Wheeling-Pittsburgh | | 52,600 a | | 474,452 |
| | | | | 8,740,289 |
| Telecommunications—3.7% | | | | |
| Aeroflex | | 382,300 a | | 4,109,725 |
| Commonwealth Telephone Enterprises | | 198,000 | | 6,686,460 |
| Comtech Telecommunications | | 166,700 a | | 5,091,018 |
| RCN | | 66,700 a | | 1,564,115 |
| SBA Communications, Cl. A | | 310,476 a | | 5,557,520 |
| Spectralink | | 183,900 | | 2,182,893 |
| Symmetricom | | 100,000 a | | 847,000 |
| Talk America Holdings | | 275,800 a,b | | 2,380,154 |
| | | | | 28,418,885 |
| Textiles—1.0% | | | | |
| Albany International, Cl. A | | 218,800 | | 7,911,808 |
| Wholesale—1.4% | | | | |
| Handleman | | 220,200 | | 2,734,884 |
| WESCO International | | 188,900 a | | 8,071,697 |
| | | | | 10,806,581 |
| Total Common Stocks | | | | |
| (cost $671,700,150) | | | | 766,181,814 |
14
| Other Investment—.3% | | Shares | | Value ($) |
| |
| |
|
| Registered Investment Company; | | | | |
| Dreyfus Institutional Preferred Plus Money Market Fund | | |
| (cost $2,048,000) | | 2,048,000 c | | 2,048,000 |
| |
| |
|
| |
| Investment of Cash Collateral | | | | |
| for Securities Loaned—7.3% | | | | |
| |
| |
|
| Registered Investment Company; | | | | |
| Dreyfus Institutional Cash Advantage Fund | | | | |
| (cost $56,181,024) | | 56,181,024 c | | 56,181,024 |
| |
| |
|
| Total Investments (cost $729,929,174) | | 107.4% | | 824,410,838 |
| Liabilities, Less Cash and Receivables | | (7.4%) | | (57,031,218) |
| Net Assets | | 100.0% | | 767,379,620 |
| a Non-income producing. |
| b All or a portion of these securities are on loan. At December 31, 2005, the total market value of the portfolio’s |
| securities on loan is $65,263,547 and the total market value of the collateral held by the portfolio is $67,958,336, |
| consisting of cash collateral of $56,181,024 and U.S. Government and agency securities valued at $11,777,312. |
| c Investment in affiliated money market mutual fund. |
| Portfolio Summary † | | | | | | |
| |
| | | Value (%) | | | | Value (%) |
| |
| |
| |
|
| Financial Services | | 12.5 | | Machinery/Agricultural/Trucks | | 3.9 |
| Health Care | | 7.6 | | Telecommunications | | 3.7 |
| Money Market Investments | | 7.6 | | Semiconductors | | 3.5 |
| Oil & Gas | | 6.1 | | Other | | 52.0 |
| Real Estate | | 5.3 | | | | |
| Apparel | | 5.2 | | | | 107.4 |
| |
| † Based on net assets. | | | | | | |
| See notes to financial statements. | | | | | | |
STATEMENT OF ASSETS AND LIABILITIES
December 31, 2005
| | | Cost | | Value |
| |
| |
|
| Assets ($): | | | | |
| Investments in securities— | | | | |
| See Statement of Investments (including securities | | |
| on loan, valued at $65,263,547)—Note 1(c): | | |
| Unaffiliated issuers | | 671,700,150 | | 766,181,814 |
| Affiliated issuers | | 58,229,024 | | 58,229,024 |
| Cash | | | | 130,544 |
| Dividends and interest receivable | | | | 864,122 |
| Receivable for shares of Beneficial Interest subscribed | | 6,963 |
| Prepaid expenses | | | | 12,977 |
| | | | | 825,425,444 |
| |
| |
|
| Liabilities ($): | | | | |
| Due to The Dreyfus Corporation and affiliates—Note 3(b) | | 514,852 |
| Liability for securities on loan—Note 1(c) | | 56,181,024 |
| Payable for shares of Beneficial Interest redeemed | | 1,245,413 |
| Accrued expenses | | | | 104,535 |
| | | | | 58,045,824 |
| |
| |
|
| Net Assets ($) | | | | 767,379,620 |
| |
| |
|
| Composition of Net Assets ($): | | | | |
| Paid-in capital | | | | 608,383,942 |
| Accumulated undistributed investment income—net | | 3,606,472 |
| Accumulated net realized gain (loss) on investments | | 60,907,542 |
| Accumulated net unrealized appreciation | | |
| (depreciation) on investments | | | | 94,481,664 |
| |
| |
|
| Net Assets ($) | | | | 767,379,620 |
| |
| |
|
| |
| |
| Net Asset Value Per Share | | | | |
| | | Initial Shares | | Service Shares |
| |
| |
|
| Net Assets ($) | | 744,620,526 | | 22,759,094 |
| Shares Outstanding | | 16,940,049 | | 523,123 |
| |
| |
|
| Net Asset Value Per Share ($) | | 43.96 | | 43.51 |
See notes to financial statements.
|
STATEMENT OF OPERATIONS
Year Ended December 31, 2005
|
| Investment Income ($): | | |
| Income: | | |
| Cash dividends (net of $59,215 foreign taxes withheld at source): | | |
| Unaffiliated issuers | | 8,389,742 |
| Affiliated issuers | | 637,481 |
| Income from securities lending | | 447,736 |
| Interest | | 1,669 |
| Total Income | | 9,476,628 |
| Expenses: | | |
| Investment advisory fee—Note 3(a) | | 5,768,275 |
| Prospectus and shareholders’ reports | | 205,369 |
| Custodian fees—Note 3(b) | | 62,287 |
| Professional fees | | 61,326 |
| Trustees’ fees and expenses—Note 3(c) | | 60,526 |
| Distribution fees—Note 3(b) | | 54,626 |
| Shareholder servicing costs—Note 3(b) | | 16,856 |
| Loan commitment fees—Note 2 | | 3,417 |
| Interest expense—Note 2 | | 388 |
| Miscellaneous | | 20,401 |
| Total Expenses | | 6,253,471 |
| Less—reduction in custody fees | | |
| due to earnings credits—Note 1(c) | | (3,865) |
| Net Expenses | | 6,249,606 |
| Investment Income—Net | | 3,227,022 |
| |
|
| Realized and Unrealized Gain (Loss) on Investments—Note 4 ($): |
| Net realized gain (loss) on investments and foreign currency transactions | | 118,134,175 |
| Net unrealized appreciation (depreciation) on investments | | (79,064,153) |
| Net Realized and Unrealized Gain (Loss) on Investments | | 39,070,022 |
| Net Increase in Net Assets Resulting from Operations | | 42,297,044 |
See notes to financial statements.
|
STATEMENT OF CHANGES IN NET ASSETS
| | | Year Ended December 31, |
| |
|
| | | 2005 | | 2004 |
| |
| |
|
| Operations ($): | | | | |
| Investment income—net | | 3,227,022 | | 1,529,543 |
| Net realized gain (loss) on investments | | 118,134,175 | | 48,901,062 |
| Net unrealized appreciation | | | | |
| (depreciation) on investments | | (79,064,153) | | 33,039,125 |
| Net Increase (Decrease) in Net Assets | | | | |
| Resulting from Operations | | 42,297,044 | | 83,469,730 |
| |
| |
|
| Dividends to Shareholders from ($): | | | | |
| Investment income—net; | | | | |
| Initial shares | | — | | (1,506,023) |
| |
| |
|
| Beneficial Interest Transactions ($): | | | | |
| Net proceeds from shares sold: | | | | |
| Initial shares | | 33,642,117 | | 58,479,227 |
| Service shares | | 2,846,538 | | 7,722,696 |
| Dividends reinvested: | | | | |
| Initial shares | | — | | 1,506,023 |
| Cost of shares redeemed: | | | | |
| Initial shares | | (119,050,790) | | (95,845,376) |
| Service shares | | (3,359,312) | | (5,211,288) |
| Increase (Decrease) in Net Assets from | | | | |
| Beneficial Interest Transactions | | (85,921,447) | | (33,348,718) |
| Total Increase (Decrease) in Net Assets | | (43,624,403) | | 48,614,989 |
| |
| |
|
| Net Assets ($): | | | | |
| Beginning of Period | | 811,004,023 | | 762,389,034 |
| End of Period | | 767,379,620 | | 811,004,023 |
| Undistributed investment income—net | | 3,606,472 | | 508,750 |
| |
| |
|
| Capital Share Transactions (Shares): | | | | |
| Initial Shares | | | | |
| Shares sold | | 820,825 | | 1,499,986 |
| Shares issued for dividends reinvested | | — | | 36,750 |
| Shares redeemed | | (2,869,844) | | (2,467,053) |
| Net Increase (Decrease) in Shares Outstanding | | (2,049,019) | | (930,317) |
| |
| |
|
| Service Shares | | | | |
| Shares sold | | 69,052 | | 199,242 |
| Shares redeemed | | (81,086) | | (136,149) |
| Net Increase (Decrease) in Shares Outstanding | | (12,034) | | 63,093 |
See notes to financial statements.
|
FINANCIAL HIGHLIGHTS
The following tables describe the performance for each share class for the fiscal periods indicated.All information (except portfolio turnover rate) reflects financial results for a single portfolio share. Total return shows how much your investment in the portfolio would have increased (or decreased) during each period, assuming you had reinvested all dividends and distributions.These figures have been derived from the portfolio’s financial statements.
| | | | | Year Ended December 31, | | |
| |
| |
| |
|
| Initial Shares | | 2005 | | 2004 | | 2003 | | 2002 | | 2001 |
| |
| |
| |
| |
| |
|
| Per Share Data ($): | | | | | | | | | | |
| Net asset value, beginning of period | | 41.55 | | 37.39 | | 28.40 | | 35.13 | | 40.30 |
| Investment Operations: | | | | | | | | | | |
| Investment income—net a | | .18 | | .08 | | .01 | | .01 | | .11 |
| Net realized and unrealized | | | | | | | | | | |
| gain (loss) on investments | | 2.23 | | 4.16 | | 8.99 | | (6.73) | | (2.63) |
| Total from Investment Operations | | 2.41 | | 4.24 | | 9.00 | | (6.72) | | (2.52) |
| Distributions: | | | | | | | | | | |
| Dividends from investment income—net | | — | | (.08) | | (.01) | | (.01) | | (.17) |
| Dividends from net realized | | | | | | | | | | |
| gain on investments | | — | | — | | — | | — | | (1.38) |
| Dividends in excess of net realized | | | | | | | | | | |
| gain on investments | | — | | — | | — | | — | | (1.10) |
| Total Distributions | | — | | (.08) | | (.01) | | (.01) | | (2.65) |
| Net asset value, end of period | | 43.96 | | 41.55 | | 37.39 | | 28.40 | | 35.13 |
| |
| |
| |
| |
| |
|
| Total Return (%) | | 5.80 | | 11.34 | | 31.69 | | (19.12) | | (6.12) |
| |
| |
| |
| |
| |
|
| Ratios/Supplemental Data (%): | | | | | | | | | | |
| Ratio of total expenses | | | | | | | | | | |
| to average net assets | | .81 | | .79 | | .82 | | .81 | | .79 |
| Ratio of net expenses | | | | | | | | | | |
| to average net assets | | .81 | | .79 | | .82 | | .81 | | .79 |
| Ratio of net investment income | | | | | | | | | | |
| to average net assets | | .43 | | .20 | | .03 | | .02 | | .29 |
| Portfolio Turnover Rate | | 67.11 | | 56.06 | | 69.34 | | 52.41 | | 84.45 |
| |
| |
| |
| |
| |
|
| Net Assets, end of period ($ x 1,000) | | 744,621 | | 788,943 | | 744,866 | | 577,468 | | 687,283 |
| | a Based on average shares outstanding at each month end.
See notes to financial statements.
|
FINANCIAL HIGHLIGHTS (continued)
|
| | | | | Year Ended December 31, | | |
| |
| |
| |
|
| Service Shares | | 2005 | | 2004 | | 2003 | | 2002 | | 2001 |
| |
| |
| |
| |
| |
|
| Per Share Data ($): | | | | | | | | | | |
| Net asset value, beginning of period | | 41.22 | | 37.12 | | 28.26 | | 35.02 | | 40.30 |
| Investment Operations: | | | | | | | | | | |
| Investment income (loss)—net a | | .07 | | (.02) | | (.07) | | (.03) | | (.01) |
| Net realized and unrealized | | | | | | | | | | |
| gain (loss) on investments | | 2.22 | | 4.12 | | 8.93 | | (6.72) | | (2.67) |
| Total from Investment Operations | | 2.29 | | 4.10 | | 8.86 | | (6.75) | | (2.68) |
| Distributions: | | | | | | | | | | |
| Dividends from investment income—net | | — | | — | | — | | (.01) | | (.12) |
| Dividends from net realized | | | | | | | | | | |
| gain on investments | | — | | — | | — | | — | | (1.38) |
| Dividends in excess of net realized | | | | | | | | | | |
| gain on investments | | — | | — | | — | | — | | (1.10) |
| Total Distributions | | — | | — | | — | | (.01) | | (2.60) |
| Net asset value, end of period | | 43.51 | | 41.22 | | 37.12 | | 28.26 | | 35.02 |
| |
| |
| |
| |
| |
|
| Total Return (%) | | 5.56 | | 11.05 | | 31.35 | | (19.31) | | (6.47) |
| |
| |
| |
| |
| |
|
| Ratios/Supplemental Data (%): | | | | | | | | | | |
| Ratio of total expenses | | | | | | | | | | |
| to average net assets | | 1.06 | | 1.04 | | 1.07 | | 1.05 | | 1.11 |
| Ratio of net expenses | | | | | | | | | | |
| to average net assets | | 1.06 | | 1.04 | | 1.07 | | 1.05 | | 1.11 |
| Ratio of net investment income | | | | | | | | | | |
| (loss) to average net assets | | .18 | | (.04) | | (.22) | | (.11) | | (.02) |
| Portfolio Turnover Rate | | 67.11 | | 56.06 | | 69.34 | | 52.41 | | 84.45 |
| |
| |
| |
| |
| |
|
| Net Assets, end of period ($ x 1,000) | | 22,759 | | 22,061 | | 17,523 | | 10,896 | | 5,796 |
| |
| a Based on average shares outstanding at each month end. | | | | | | | | |
| See notes to financial statements. | | | | | | | | | | |
NOTES TO FINANCIAL STATEMENTS
NOTE 1—Significant Accounting Policies:
Dreyfus Variable Investment Fund (the “fund”) is registered under the Investment Company Act of 1940, as amended (the “Act”), as an open-end management investment company, operating as a series company currently offering twelve series, including the Developing Leaders Portfolio (the “portfolio”). The portfolio is only offered to separate accounts established by insurance companies to fund variable annuity contracts and variable life insurance policies.The portfolio is a diversified series. The portfolio’s investment objective is capital growth.The Dreyfus Corporation (the “Manager” or “Dreyfus”) serves as the portfolio’s investment adviser.The Manager is a wholly-owned subsidiary of Mellon Financial Corporation (“Mellon Financial”).
Dreyfus Service Corporation (the “Distributor”), a wholly-owned subsidiary of the Manager, is the distributor of the portfolio’s shares, which are sold without a sales charge.The portfolio is authorized to issue an unlimited number of $.001 par value shares of Beneficial Interest in the following classes of shares: Initial and Service. Each class of shares has identical rights and privileges, except with respect to the distribution plan and the expenses borne by each class and certain voting rights. Income, expenses (other than expenses attributable to a specific class), and realized and unrealized gains or losses on investments are allocated to each class of shares based on its relative net assets.
The fund accounts separately for the assets, liabilities and operations of each series. Expenses directly attributable to each series are charged to that series’ operations; expenses which are applicable to all series are allocated among them on a pro rata basis.
The portfolio’s financial statements are prepared in accordance with U.S. generally accepted accounting principles, which may require the use of management estimates and assumptions.Actual results could differ from those estimates.
NOTES TO FINANCIAL STATEMENTS (continued)
|
The fund enters into contracts that contain a variety of indemnifica-tions.The portfolio’s maximum exposure under these arrangements is unknown. The portfolio does not anticipate recognizing any loss related to these arrangements.
(a) Portfolio valuation: Investments in securities are valued at the last sales price on the securities exchange or national securities market on which such securities are primarily traded. Securities listed on the National Market System for which market quotations are available are valued at the official closing price or, if there is no official closing price that day, at the last sale price. Securities not listed on an exchange or the national securities market, or securities for which there were no transactions, are valued at the average of the most recent bid and asked prices, except for open short positions, where the asked price is used for valuation purposes. Bid price is used when no asked price is available. Investments in registered investment companies are valued at their net asset value.When market quotations or official closing prices are not readily available, or are determined not to reflect accurately fair value, such as when the value of a security has been significantly affected by events after the close of the exchange or market on which the security is principally traded (for example, a foreign exchange or market), but before the portfolio calculates its net asset value, the portfolio may value these investments at fair value as determined in accordance with the procedures approved by the Board of Trustees. Fair valuing of securities may be determined with the assistance of a pricing service using calculations based on indices of domestic securities and other appropriate indicators, such as prices of relevant ADR’s and futures contracts. For other securities that are fair valued by the Board of Trustees, certain factors may be considered such as: fundamental analytical data, the nature and duration of restrictions on disposition, an evaluation of the forces that influence the market in which the securities are purchased and sold, and public trading in similar securities of the issuer or comparable issuers. Financial futures are valued at
the last sales price. Investments denominated in foreign currencies are translated to U.S. dollars at the prevailing rates of exchange. Forward currency exchange contracts are valued at the forward rate.
(b) Foreign currency transactions: The portfolio does not isolate that portion of the results of operations resulting from changes in foreign exchange rates on investments from the fluctuations arising from changes in market prices of securities held. Such fluctuations are included with the net realized and unrealized gain or loss on investments.
Net realized foreign exchange gains or losses arise from sales and maturities of short-term securities, sales of foreign currencies, currency gains or losses realized on securities transactions and the difference between the amounts of dividends, interest and foreign withholding taxes recorded on the portfolio’s books and the U.S. dollar equivalent of the amounts actually received or paid. Net unrealized foreign exchange gains or losses arise from changes in the value of assets and liabilities other than investments in securities resulting from changes in exchange rates. Such gains and losses are included with net realized and unrealized gain or loss on investments.
(c) Securities transactions and investment income: Securities transactions are recorded on a trade date basis. Realized gain and loss from securities transactions are recorded on the identified cost basis. Dividend income is recognized on the ex-dividend date and interest income, including, where applicable, accretion of discount and amortization of premium on investments, is recognized on the accrual basis.
The portfolio has an arrangement with the custodian bank whereby the portfolio receives earnings credits from the custodian when positive cash balances are maintained, which are used to offset custody fees. For financial reporting purposes, the portfolio includes net earnings credits as an expense offset in the Statement of Operations.
NOTES TO FINANCIAL STATEMENTS (continued)
|
Pursuant to a securities lending agreement with Mellon Bank, N.A., an affiliate of the Manager, the portfolio may lend securities to qualified institutions.At origination, all loans are secured by collateral of at least 102% of the value of U.S. securities loaned and 105% of the value of foreign securities loaned. Collateral equivalent to at least 100% of the market value of securities on loan will be maintained at all times. Cash collateral is invested in certain money market mutual funds managed by the Manager. The portfolio will be entitled to receive all income on securities loaned, in addition to income earned as a result of the lending transaction. Although each security loaned is fully collateralized, the portfolio would bear the risk of delay in recovery of, or loss of rights in, the securities loaned should a borrower fail to return the securities in a timely manner.
(d) Affiliated issuers: Investments in other investment companies advised by the Manager are defined as “affiliated” in the Act.
(e) Dividends to shareholders: Dividends are recorded on the ex-dividend date. Dividends from investment income-net and dividends from net realized capital gain, if any, are normally declared and paid annually, but the portfolio may make distributions on a more frequent basis to comply with the distribution requirements of the Internal Revenue Code of 1986, as amended (the “Code”).To the extent that net realized capital gain can be offset by capital loss carryovers, it is the policy of the portfolio not to distribute such gain. Income and capital gain distributions are determined in accordance with income tax regulations, which may differ from U.S. generally accepted accounting principles.
(f) Federal income taxes: It is the policy of the portfolio to continue to qualify as a regulated investment company, if such qualification is in the best interests of its shareholders, by complying with the applicable provisions of the Code, and to make distributions of taxable income sufficient to relieve it from substantially all federal income and excise taxes.
At December 31, 2005, the components of accumulated earnings on a tax basis were as follows: undistributed ordinary income $2,919,023, undistributed capital gains $61,036,558 and unrealized appreciation $95,040,097.
The tax character of distributions paid to shareholders during the fiscal periods ended December 31, 2005 and December 31, 2004, were as follows: ordinary income $0 and $1,506,023, respectively.
During the period ended December 31, 2005, as a result of permanent book to tax differences primarily due to the tax treatment for real estate investment trusts, the portfolio decreased accumulated undistributed investment income-net by $129,300 and increased accumulated net realized gain (loss) on investments by the same amount. Net assets were not affected by this reclassification.
NOTE 2—Bank Line of Credit:
The portfolio participates with other Dreyfus-managed funds in a $350 million redemption credit facility (the “Facility”) to be utilized for temporary or emergency purposes, including the financing of redemptions. In connection therewith, the portfolio has agreed to pay commitment fees on its pro rata portion of the Facility. Interest is charged to the portfolio based on prevailing market rates in effect at the time of borrowing.
The average daily amount of borrowings outstanding under the Facility during the period ended December 31, 2005, was $10,400 with a related weighted average annualized interest rate of 3.73% .
NOTE 3—Investment Advisory Fee and Other Transactions With Affiliates:
(a) Pursuant to an Investment Advisory Agreement with the Manager, the investment advisory fee is computed at the annual rate of .75% of the value of the portfolio’s average daily net assets and is payable monthly.
(b) Under the Distribution Plan (the “Plan”) adopted pursuant to Rule 12b-1 under the Act, Service shares pay the Distributor for distributing their shares, for servicing and/or maintaining Service shares shareholder accounts and for advertising and marketing for Service shares.The Plan provides for payments to be made at an annual rate of .25% of the value of the Service shares’ average daily net assets.The Distributor may make payments to Participating Insurance Companies and to brokers and
NOTES TO FINANCIAL STATEMENTS (continued)
|
dealers acting as principal underwriter for their variable insurance products.The fees payable under the Plan are payable without regard to actual expenses incurred. During the period ended December 31, 2005, Service shares were charged $54,626 pursuant to the Plan.
The portfolio compensates Dreyfus Transfer, Inc., a wholly-owned subsidiary of the Manager, under a transfer agency agreement for providing personnel and facilities to perform transfer agency services for the portfolio. During the period ended December 31, 2005, the portfolio was charged $904 pursuant to the transfer agency agreement.
The portfolio compensates Mellon Bank, N.A., an affiliate of the Manager, under a custody agreement for providing custodial services for the portfolio. During the period ended December 31, 2005, the portfolio was charged $62,287 pursuant to the custody agreement.
During the period ended December 31, 2005, the portfolio was charged $3,762 for services performed by the Chief Compliance Officer.
The components of Due to The Dreyfus Corporation and affiliates in the Statement of Assets and Liabilities consist of: investment advisory fees $492,740, Rule 12b-1 distribution plan fees $4,875, custodian fees $15,233, chief compliance officer fees $1,858 and transfer agency per account fees $146.
(c) Each Board member also serves as a Board member of other funds within the Dreyfus complex. Annual retainer fees and attendance fees are allocated to each fund based on net assets.
(d) Pursuant to an exemptive order from the Securities and Exchange Commission, the portfolio invests its available cash balances in affiliated money market mutual funds. Management fees of the underlying money market mutual funds have been waived by the Manager.
NOTE 4—Securities Transactions:
The aggregate amount of purchases and sales of investment securities, excluding short-term securities, during the period ended December 31, 2005, amounted to $501,357,164 and $548,672,971, respectively.
At December 31, 2005, the cost of investments for federal income tax purposes was $729,370,741; accordingly, accumulated net unrealized appreciation on investments was $95,040,097, consisting of $134,611,802 gross unrealized appreciation and $39,571,705 gross unrealized depreciation.
REPORT OF INDEPENDENT REGISTERED PUBLIC ACCOUNTING FIRM
Shareholders and Board of Trustees
Dreyfus Variable Investment Fund, Developing Leaders Portfolio
We have audited the accompanying statement of assets and liabilities, including the statement of investments, of Dreyfus Variable Investment Fund, Developing Leaders Portfolio (one of the funds comprising Dreyfus Variable Investment Fund) as of December 31, 2005, and the related statement of operations for the year then ended, the statement of changes in net assets for each of the two years in the period then ended, and financial highlights for each of the years indicated therein. These financial statements and financial highlights are the responsibility of the Fund’s management. Our responsibility is to express an opinion on these financial statements and financial highlights based on our audits.
We conducted our audits in accordance with the standards of the Public Company Accounting Oversight Board (United States).Those standards require that we plan and perform the audit to obtain reasonable assurance about whether the financial statements and financial highlights are free of material misstatement.We were not engaged to perform an audit of the Fund’s internal control over financial reporting. Our audits included consideration of internal control over financial reporting as a basis for designing audit procedures that are appropriate in the circumstances, but not for the purpose of expressing an opinion on the effectiveness of the Fund’s internal control over financial reporting. Accordingly, we express no such opinion.An audit also includes examining, on a test basis, evidence supporting the amounts and disclosures in the financial statements and financial highlights, assessing the accounting principles used and significant estimates made by management, and evaluating the overall financial statement presentation. Our procedures included verification by examination of securities held by the custodian as of December 31, 2005 and confirmation of securities not held by the custodian by correspondence with others. We believe that our audits provide a reasonable basis for our opinion.
In our opinion, the financial statements and financial highlights referred to above present fairly, in all material respects, the financial position of Dreyfus Variable Investment Fund, Developing Leaders Portfolio at December 31, 2005, the results of its operations for the year then ended, the changes in its net assets for each of the two years in the period then ended, and the financial highlights for each of the indicated years, in conformity with U.S. generally accepted accounting principles.

| New York, New York |
| February 6, 2006 |
28
| BOARD MEMBERS INFORMATION (Unaudited) |
| |
| |
| |
| Joseph S. DiMartino (62) |
| Chairman of the Board (1995) |
| Principal Occupation During Past 5 Years: |
| • Corporate Director and Trustee |
| Other Board Memberships and Affiliations: |
| • The Muscular Dystrophy Association, Director |
| • Levcor International, Inc., an apparel fabric processor, Director |
| • Century Business Services, Inc., a provider of outsourcing functions for small and medium size |
| companies, Director |
| • The Newark Group, a provider of a national market of paper recovery facilities, paperboard |
| mills and paperboard converting plants, Director |
| • Sunair Services Corporation, engages in the design, manufacture and sale of high frequency |
| systems for long-range voice and data communications, as well as providing certain outdoor- |
| related services to homes and businesses, Director |
| No. of Portfolios for which Board Member Serves: 193 |
| ——————— |
| David P. Feldman (66) |
| Board Member (1994) |
| Principal Occupation During Past 5 Years: |
| • Corporate Director and Trustee |
| Other Board Memberships and Affiliations: |
| • BBH Mutual Funds Group (11 funds), Director |
| • The Jeffrey Company, a private investment company, Director |
| • QMED, a medical device company, Director |
| No. of Portfolios for which Board Member Serves: 58 |
| ——————— |
| James F. Henry (75) |
| Board Member (1990) |
| Principal Occupation During Past 5 Years: |
| • President, CPR Institute for Dispute Resolution, a non-profit organization principally |
| engaged in the development of alternatives to business litigation (Retired 2003) |
| No. of Portfolios for which Board Member Serves: 22 |
The Portfolio 29
| BOARD MEMBERS INFORMATION (Unaudited) (continued) |
| |
| |
| |
| |
| Dr. Paul A. Marks (79) |
| Board Member (1990) |
| Principal Occupation During Past 5 Years: |
| • President, Emeritus (2000-present) and President and Chief Executive Officer of Memorial |
| Sloan-Kettering Cancer Center (Retired 1999) |
| Other Board Memberships and Affiliations: |
| • Pfizer, Inc., a pharmaceutical company, Director-Emeritus |
| • Lazard Freres & Company, LLC, Senior Adviser |
| • Carrot Capital Health Care Ventures, Advisor |
| • Armgo-Start-Up Biotech; Board of Directors |
| • Nanoviricide, Board Director |
| • PTC, Scientific Advisory Board |
| No. of Portfolios for which Board Member Serves: 22 |
| ——————— |
| Dr. Martin Peretz (66) |
| Board Member (1990) |
| Principal Occupation During Past 5 Years: |
| • Editor-in-Chief of The New Republic Magazine |
| • Lecturer in Social Studies at Harvard University (1965-2001) |
| • Co-Chairman of TheStreet.com, a financial daily on the web |
| Other Board Memberships and Affiliations: |
| • Academy for Liberal Education, an accrediting agency for colleges and universities certified by |
| the U.S. Department of Education, Director |
| • Harvard Center for Blood Research,Trustee |
| • Bard College,Trustee |
| • Board of Overseers of YIVO Institute for Jewish Research, Chairman |
| No. of Portfolios for which Board Member Serves: 22 |
| ——————— |
| Once elected all Board Members serve for an indefinite term.The address of the Board Members and Officers is in c/o |
| The Dreyfus Corporation, 200 Park Avenue, New York, New York 10166. Additional information about the Board |
| Members is available in the fund’s Statement of Additional Information which can be obtained from Dreyfus free of |
| charge by calling this toll free number: 1-800-554-4611. |
| John M. Fraser, Jr., Emeritus Board Member |
| Rosalind Gersten Jacobs, Emeritus Board Member |
30
OFFICERS OF THE FUND (Unaudited)
STEPHEN E. CANTER, President since March 2000.
Chairman of the Board, Chief Executive Officer and Chief Operating Officer of the Manager, and an officer of 90 investment companies (comprised of 184 portfolios) managed by the Manager. Mr. Canter also is a Board member and, where applicable, an Executive Committee Member of the other investment management subsidiaries of Mellon Financial Corporation, each of which is an affiliate of the Manager. He is 60 years old and has been an employee of the Manager since May 1995.
STEPHEN R. BYERS, Executive Vice President since November 2002.
Chief Investment Officer,Vice Chairman and a director of the Manager, and an officer of 90 investment companies (comprised of 184 portfolios) managed by the Manager. Mr. Byers also is an officer, director or an Executive Committee Member of certain other investment management subsidiaries of Mellon Financial Corporation, each of which is an affiliate of the Manager. He is 52 years old and has been an employee of the Manager since January 2000.
MARK N. JACOBS, Vice President since March 2000.
Executive Vice President, Secretary and General Counsel of the Manager, and an officer of 91 investment companies (comprised of 200 portfolios) managed by the Manager. He is 59 years old and has been an employee of the Manager since June 1977.
MICHAEL A. ROSENBERG, Vice President and Secretary since August 2005.
Associate General Counsel of the Manager, and an officer of 91 investment companies (comprised of 200 portfolios) managed by the Manager. He is 45 years old and has been an employee of the Manager since October 1991.
JAMES BITETTO, Vice President and Assistant Secretary since August 2005.
Assistant General Counsel and Assistant Secretary of the Manager, and an officer of 91 investment companies (comprised of 200 portfolios) managed by the Manager. He is 39 years old and has been an employee of the Manager since December 1996.
JONI LACKS CHARATAN, Vice President and Assistant Secretary since August 2005.
Associate General Counsel of the Manager, and an officer of 91 investment companies (comprised of 200 portfolios) managed by the Manager. She is 50 years old and has been an employee of the Manager since October 1988.
JOSEPH M. CHIOFFI, Vice President and Assistant Secretary since August 2005.
Assistant General Counsel of the Manager, and an officer of 91 investment companies (comprised of 200 portfolios) managed by the Manager. He is 44 years old and has been an employee of the Manager since June 2000.
JANETTE E. FARRAGHER, Vice President and Assistant Secretary since August 2005.
Associate General Counsel of the Manager, and an officer of 91 investment companies (comprised of 200 portfolios) managed by the Manager. She is 43 years old and has been an employee of the Manager since February 1984.
JOHN B. HAMMALIAN, Vice President and Assistant Secretary since August 2005.
Associate General Counsel of the Manager, and an officer of 91 investment companies (comprised of 200 portfolios) managed by the Manager. He is 42 years old and has been an employee of the Manager since February 1991.
OFFICERS OF THE FUND (Unaudited) (continued)
ROBERT R. MULLERY, Vice President and Assistant Secretary since August 2005.
Associate General Counsel of the Manager, and an officer of 91 investment companies (comprised of 200 portfolios) managed by the Manager. He is 53 years old and has been an employee of the Manager since May 1986.
JEFF PRUSNOFSKY, Vice President and Assistant Secretary since August 2005.
Associate General Counsel of the Manager, and an officer of 91 investment companies (comprised of 200 portfolios) managed by the Manager. He is 40 years old and has been an employee of the Manager since October 1990.
JAMES WINDELS, Treasurer since November 2001.
Director – Mutual Fund Accounting of the Manager, and an officer of 91 investment companies (comprised of 200 portfolios) managed by the Manager. He is 47 years old and has been an employee of the Manager since April 1985.
ERIK D. NAVILOFF, Assistant Treasurer since December 2002.
Senior Accounting Manager – Taxable Fixed Income Funds of the Manager, and an officer of 91 investment companies (comprised of 200 portfolios) managed by the Manager. He is 37 years old and has been an employee of the Manager since November 1992.
ROBERT ROBOL, Assistant Treasurer since August 2003.
Senior Accounting Manager – Money Market and Municipal Bond Funds of the Manager, and an officer of 91 investment companies (comprised of 200 portfolios) managed by the Manager. He is 41 years old and has been an employee of the Manager since October 1988.
ROBERT SVAGNA, Assistant Treasurer since December 2002.
Senior Accounting Manager – Equity Funds of the Manager, and an officer of 91 investment companies (comprised of 200 portfolios) managed by the Manager. He is 38 years old and has been an employee of the Manager since November 1990.
GAVIN C. REILLY, Assistant Treasurer since December 2005.
Tax Manager of the Investment Accounting and Support Department of the Manager, and an officer of 91 investment companies (comprised of 200 portfolios) managed by the Manager. He is 37 years old and has been an employee of the Manager since April 1991.
JOSEPH W. CONNOLLY, Chief Compliance Officer since October 2004.
Chief Compliance Officer of the Manager and The Dreyfus Family of Funds (91 investment companies, comprised of 200 portfolios). From November 2001 through March 2004, Mr. Connolly was first Vice-President, Mutual Fund Servicing for Mellon Global Securities Services. In that capacity, Mr. Connolly was responsible for managing Mellon’s Custody, Fund Accounting and Fund Administration services to third-party mutual fund clients. He is 48 years old and has served in various capacities with the Manager since 1980, including manager of the firm’s Fund Accounting Department from 1997 through October 2001.
WILLIAM GERMENIS, Anti-Money Laundering Compliance Officer since September 2002.
Vice President and Anti-Money Laundering Compliance Officer of the Distributor, and the Anti-Money Laundering Compliance Officer of 87 investment companies (comprised of 196 portfolios) managed by the Manager. He is 35 years old and has been an employee of the Distributor since October 1998.
| For More | | Information |
| |
|
| |
| Dreyfus Variable | | Transfer Agent & |
| Investment Fund, | | Dividend Disbursing Agent |
| Developing Leaders Portfolio |
| | | Dreyfus Transfer, Inc. |
| 200 Park Avenue | | |
| | | 200 Park Avenue |
| New York, NY 10166 | | |
| | | New York, NY 10166 |
| |
| Investment Adviser | | Distributor |
| The Dreyfus Corporation | | |
| | | Dreyfus Service Corporation |
| 200 Park Avenue | | |
| | | 200 Park Avenue |
| New York, NY 10166 | | |
| | | New York, NY 10166 |
| Custodian | | |
| Mellon Bank, N.A. | | |
| One Mellon Bank Center | | |
| Pittsburgh, PA 15258 | | |
Telephone 1-800-554-4611 or 516-338-3300
Mail The Dreyfus Family of Funds, 144 Glenn Curtiss Boulevard, Uniondale, NY 11556-0144 Attn: Institutional Servicing
The portfolio files its complete schedule of portfolio holdings with the Securities and Exchange Commission (“SEC”) for the first and third quarters of each fiscal year on Form N-Q. The portfolio’s Forms N-Q are available on the SEC’s website at http://www.sec.gov and may be reviewed and copied at the SEC’s Public Reference Room in Washington, DC. Information on the operation of the Public Reference Room may be obtained by calling 1-800-SEC-0330.
A description of the policies and procedures that the portfolio uses to determine how to vote proxies relating to portfolio securities, and information regarding how the portfolio voted these proxies for the 12-month period ended June 30, 2005, is available at http://www.dreyfus.com and on the SEC’s website at http://www.sec.gov. The description of the policies and procedures is also available without charge, upon request, by calling 1-800-645-6561.


The views expressed in this report reflect those of the portfolio manager only through the end of the period covered and do not necessarily represent the views of Dreyfus or any other person in the Dreyfus organization.Any such views are subject to change at any time based upon market or other conditions and Dreyfus disclaims any responsibility to update such views. These views may not be relied on as investment advice and, because investment decisions for a Dreyfus portfolio are based on numerous factors, may not be relied on as an indication of trading intent on behalf of any Dreyfus portfolio.
Not FDIC-Insured • Not Bank-Guaranteed • May Lose Value
| | | Contents |
| |
| | | T H E P O R T F O L I O |
| |
|
| 2 | | Letter from the Chairman |
| 3 | | Discussion of Performance |
| 6 | | Portfolio Performance |
| 8 | | Understanding Your Portfolio’s Expenses |
| 8 | | Comparing Your Portfolio’s Expenses |
| | | With Those of Other Funds |
| 9 | | Statement of Investments |
| 13 | | Statement of Assets and Liabilities |
| 14 | | Statement of Operations |
| 15 | | Statement of Changes in Net Assets |
| 17 | | Financial Highlights |
| 19 | | Notes to Financial Statements |
| 25 | | Report of Independent Registered |
| | | Public Accounting Firm |
| 26 | | Board Members Information |
| 28 | | Officers of the Fund |
| | | F O R M O R E I N F O R M AT I O N |
| |
|
| | | Back Cover |
| Dreyfus Variable Investment Fund, |
| Disciplined Stock Portfolio |

LETTER FROM THE CHAIRMAN
Dear Shareholder:
We are pleased to present this annual report for Dreyfus Variable Investment Fund, Disciplined Stock Portfolio, covering the 12-month period from January 1, 2005, through December 31, 2005. Inside, you’ll find valuable information about how the portfolio was managed during the reporting period, including a discussion with the portfolio manager, Sean P. Fitzgibbon.
Stocks generally absorbed both good and bad news in 2005 to post modestly positive total returns. On the plus side, an expanding U.S. economy and low inflation helped support corporate earnings in most industry groups. Negative influences included rising short-term interest rates and escalating energy prices, which many analysts feared might erode corporate profits. In addition, hurricanes Katrina, Rita and Wilma disrupted economic activity along the Gulf Coast.
We expect the U.S. economy to continue its moderate expansion in 2006, fueled in part by a rebound in corporate capital spending and exports. The labor market likely will remain relatively strong while inflation should stay low, supporting consumers’ real incomes. Risks in the new year include the possible end of the boom in the housing market, where we believe prices are more likely to stall than plunge.
As always, we encourage you to speak with your financial consultant about how these and other market forces may affect your investments. Thank you for your continued confidence and support.

DISCUSSION OF PERFORMANCE
Sean P. Fitzgibbon, Portfolio Manager
How did Dreyfus Variable Investment Fund, Disciplined Stock Portfolio perform relative to its benchmark?
For the 12-month period ended December 31, 2005, the portfolio achieved total returns of 6.26% for its Initial shares and 6.22% for its Service shares.1 For the same period, the total return of the Standard & Poor’s 500 Composite Stock Price Index (“S&P 500 Index”), the portfolio’s benchmark, was 4.91% .2
We attribute these results primarily to continued U.S. economic growth.Although rising interest rates and high energy prices inhibited market performance during much of 2005, positive corporate earnings reports set a better tone later in the reporting period. The portfolio participated in the market’s second-half gains, outperforming its benchmark on the strength of relatively good returns in the consumer discretionary and financial sectors.
What is the portfolio’s investment approach?
The portfolio seeks investment returns (consisting of capital appreciation and income) that are consistently superior to the S&P 500 Index. The portfolio normally invests at least 80% of its assets in stocks, and focuses on stocks of large-cap companies. The portfolio invests in growth and value stocks, which are chosen through a disciplined investment process that combines computer modeling techniques, fundamental analysis and risk management.
When selecting securities, we use a computer model to identify and rank stocks within an industry or sector, based on several characteristics, including: value, or how a stock is priced relative to its perceived value; growth, in this case the sustainability or growth of earnings; financial profile, which measures the financial health of a company. Next, based on fundamental analysis, we generally select the most attractive of the higher ranked securities, drawing on a variety of sources, including internal as well as Wall Street research, and company management.
DISCUSSION OF PERFORMANCE (continued)
|
In addition to identifying what we believe are attractive investment opportunities, we also attempt to manage risks by diversifying across companies and industries.The portfolio is structured so that its sector weightings and risk characteristics are generally similar to those of the S&P 500 Index.
What other factors influenced the portfolio’s performance?
Oil and gas prices hit their 2005 highs during the summer, then moderated. Nevertheless, high energy costs continued to affect stock prices throughout the year. Energy stocks benefited most, with the benchmark’s energy component rising sharply.The portfolio’s energy holdings generally mirrored the market’s gains, with particularly strong performance from drilling service providers, such as Transocean, and oil and gas producers, such as Devon Energy. High industrial demand for tight power supplies also benefited the utilities group, where the portfolio focused on unregulated companies that could readily pass along higher commodity costs. The portfolio’s top utility performers included Constellation Energy Group, which benefited from a buy-out offer, and Exelon.
The portfolio achieved its best relative performance in the consumer discretionary sector, thanks largely to its lack of exposure to the hard-hit automobile manufacturing industry and strong stock selections among retailers. Because high energy costs tend to undermine lower-income consumer spending, the portfolio emphasized higher-end retailers, such as Nordstrom and Coach, which enjoyed relatively strong sales and revenues in 2005. Other consumer discretionary investments delivered mixed results, with gains in holdings such as Advance Auto Parts balanced by declines in others, such as PETCO Animal Supplies and Estee Lauder Cos.The portfolio also fared well in the financials area by reducing its exposure to interest-rate-sensitive banks and focusing instead on brokerage firms, such as Lehman Brothers Holdings, and asset management firms, such as Franklin Resources. Certain technology holdings, most notably Apple Computer and Google, further contributed to the portfolio’s relatively strong returns.
On the other hand, the portfolio lost ground against the benchmark in the materials and processing sector, mainly due to its relatively light exposure to steel and metals producers that benefited from robust
industrial demand. In the industrials area, the portfolio’s emphasis early in the reporting period on machinery companies, such as Deere & Company and PACCAR, also undermined its relative performance. During the second half of 2005, the portfolio emphasized companies, such as General Electric and Burlington Northern Santa Fe, that historically have performed well later in the economic growth cycle, and the portfolio’s performance in the industrials sector improved.
What is the portfolio’s current strategy?
We believe that large-cap valuations currently are compellingly attractive compared to valuations of smaller-cap stocks.Within the large-cap range, we remain committed to the portfolio’s generally sector-neutral strategy. However, in light of high fuel prices and rising interest rates, we have trimmed the portfolio’s retail holdings, shifting some assets to consumer-oriented areas traditionally known for stable earnings and revenues, such as the food and tobacco industries.We have also reduced the portfolio’s exposure to interest-rate-sensitive banks and the highly competitive telecommunications sector. By contrast, we have mildly increased the portfolio’s weighting in the health care sector, reflecting trends toward greater utilization of medical services.
January 17, 2006
| | | The portfolio is only available as a funding vehicle under variable life insurance policies or variable |
| | | annuity contracts issued by insurance companies. Individuals may not purchase shares of the |
| | | portfolio directly. A variable annuity is an insurance contract issued by an insurance company that |
| | | enables investors to accumulate assets on a tax-deferred basis for retirement or other long-term |
| | | goals.The investment objective and policies of Dreyfus Variable Investment Fund, Disciplined |
| | | Stock Portfolio made available through insurance products may be similar to other funds/portfolios |
| | | managed or advised by Dreyfus. However, the investment results of the portfolio may be higher or |
| | | lower than, and may not be comparable to, those of any other Dreyfus fund/portfolio. |
| 1 | | Total return includes reinvestment of dividends and any capital gains paid. Past performance is no |
| | | guarantee of future results. Share price and investment return fluctuate such that upon redemption, |
| | | portfolio shares may be worth more or less than their original cost.The portfolio’s performance does |
| | | not reflect the deduction of additional charges and expenses imposed in connection with investing |
| | | in variable insurance contracts, which will reduce returns. Return figures provided reflect the |
| | | absorption of certain portfolio expenses by The Dreyfus Corporation pursuant to an agreement in |
| | | effect through December 31, 2006, at which time it may be extended, terminated or modified. |
| | | Had these expenses not been absorbed, the portfolio’s returns would have been lower. |
| 2 | | SOURCE: LIPPER INC. — Reflects reinvestment of dividends and, where applicable, capital |
| | | gain distributions.The Standard & Poor’s 500 Composite Stock Price Index is a widely accepted, |
| | | unmanaged index of U.S. stock market performance. |
The Portfolio 5
PORTFOLIO PERFORMANCE

| Average Annual Total Returns as of 12/31/05 | | | | |
| | | Inception | | | | | | From |
| | | Date | | 1 Year | | 5 Years | | Inception |
| |
| |
| |
| |
|
| Initial shares | | 5/1/96 | | 6.26% | | (1.01)% | | 7.57% |
| Service shares | | 5/1/96 | | 6.22% | | (1.17)% | | 7.49% |
| The data for Service shares includes the results of Initial shares for the period prior to December 31, 2000 |
| (inception date of Service shares). Actual Service shares’ average annual total return and hypothetical growth |
| results would have been lower. See notes below. |
| † Source: Lipper Inc. |
| Past performance is not predictive of future performance.The portfolio’s performance shown in the graph and table does not |
| reflect the deduction of taxes that a shareholder would pay on portfolio distributions or the redemption of portfolio shares. |
| The portfolio’s performance does not reflect the deduction of additional charges and expenses imposed in |
| connection with investing in variable insurance contracts which will reduce returns. |
The above graph compares a $10,000 investment made in Initial and Service shares of Dreyfus Variable Investment Fund, Disciplined Stock Portfolio on 5/1/96 (inception date of Initial shares) to a $10,000 investment made in the Standard & Poor’s 500 Composite Stock Price Index (the “Index”) on that date.
The portfolio’s Initial shares are not subject to a Rule 12b-1 fee.The portfolio’s Service shares are subject to a 0.25% annual Rule 12b-1 fee.The performance figures for Service shares reflect the performance of the portfolio’s Initial shares from their inception date through December 30, 2000, and the performance of the portfolio’s Service shares from December 31, 2000 (inception date of Service shares) to December 31, 2005 (blended performance figures).The performance figures for each share class reflect certain expense reimbursements, without which the performance of each share class would have been lower. In addition, the blended performance figures have not been adjusted to reflect the higher operating expenses of the Service shares. If these expenses had been reflected, the blended performance figures would have been lower. All dividends and capital gain distributions are reinvested.
The portfolio’s performance shown in the line graph takes into account all applicable portfolio fees and expenses (after any expense reimbursements).The Index is a widely accepted, unmanaged index of U.S. stock market performance, which does not take into account charges, fees and other expenses. Further information relating to portfolio performance, including expense reimbursements, if applicable, is contained in the Financial Highlights section of the prospectus and elsewhere in this report.
UNDERSTANDING YOUR PORTFOLIO’S EXPENSES (Unaudited)
As a mutual fund investor,you pay ongoing expenses,such as management fees and other expenses.Using the information below,you can estimate how these expenses affect your investment and compare them with the expenses of other funds.You also may pay one-time transaction expenses,including sales charges (loads) and redemption fees, which are not shown in this section and would have resulted in higher total expenses. For more information, see your portfolio’s prospectus or talk to your financial adviser.
Review your portfolio’s expenses
The table below shows the expenses you would have paid on a $1,000 investment in Dreyfus Variable Investment Fund, Disciplined Stock Portfolio from July 1, 2005 to December 31, 2005. It also shows how much a $1,000 investment would be worth at the close of the period, assuming actual returns and expenses.
| Expenses and Value of a $1,000 Investment | | |
| assuming actual returns for the six months ended December 31, 2005 |
| | | Initial Shares | | Service Shares |
| |
| |
|
| Expenses paid per $1,000 † | | $ 4.57 | | $ 5.20 |
| Ending value (after expenses) | | $1,061.60 | | $1,061.20 |
COMPARING YOUR PORTFOLIO’S EXPENSES WITH THOSE OF OTHER FUNDS (Unaudited)
Using the SEC’s method to compare expenses
The Securities and Exchange Commission (SEC) has established guidelines to help investors assess fund expenses. Per these guidelines, the table below shows your portfolio’s expenses based on a $1,000 investment, assuming a hypothetical 5% annualized return. You can use this information to compare the ongoing expenses (but not transaction expenses or total cost) of investing in the portfolio with those of other funds. All mutual fund shareholder reports will provide this information to help you make this comparison. Please note that you cannot use this information to estimate your actual ending account balance and expenses paid during the period.
Expenses and Value of a $1,000 Investment assuming a hypothetical 5% annualized return for the six months ended December 31, 2005
| | | Initial Shares | | Service Shares |
| |
| |
|
| Expenses paid per $1,000 † | | $ 4.48 | | $ 5.09 |
| Ending value (after expenses) | | $1,020.77 | | $1,020.16 |
| † Expenses are equal to the portfolio’s annualized expense ratio of .88% for Initial shares and 1.00% for Service shares, |
| multiplied by the average account value over the period, multiplied by 184/365 (to reflect the one-half year period). |
| | STATEMENT OF INVESTMENTS
December 31, 2005
|
| Common Stocks—98.8% | | Shares | | Value ($) |
| |
| |
|
| Consumer Discretionary—10.3% | | | | |
| Advance Auto Parts | | 16,410 a | | 713,179 |
| Coach | | 14,250 a | | 475,095 |
| Hilton Hotels | | 66,760 | | 1,609,584 |
| Home Depot | | 22,600 | | 914,848 |
| JC Penney | | 14,670 | | 815,652 |
| McDonald’s | | 33,930 | | 1,144,119 |
| Omnicom Group | | 6,140 | | 522,698 |
| Target | | 15,780 | | 867,427 |
| Time Warner | | 66,630 | | 1,162,027 |
| Viacom, Cl. B | | 22,130 a | | 721,438 |
| Walt Disney | | 46,040 | | 1,103,579 |
| | | | | 10,049,646 |
| Consumer Staples—12.2% | | | | |
| Altria Group | | 44,650 | | 3,336,248 |
| Cadbury Schweppes, ADR | | 32,670 | | 1,250,934 |
| CVS | | 36,200 | | 956,404 |
| General Mills | | 10,110 | | 498,625 |
| Kellogg | | 11,810 | | 510,428 |
| Kroger | | 24,660 a | | 465,581 |
| PepsiCo | | 21,820 | | 1,289,125 |
| Procter & Gamble | | 52,734 | | 3,052,244 |
| Wal-Mart Stores | | 12,220 | | 571,896 |
| | | | | 11,931,485 |
| Energy—8.9% | | | | |
| Anadarko Petroleum | | 4,730 | | 448,168 |
| Chevron | | 13,300 | | 755,041 |
| ConocoPhillips | | 23,810 | | 1,385,266 |
| Devon Energy | | 20,800 | | 1,300,832 |
| Exxon Mobil | | 52,220 | | 2,933,197 |
| GlobalSantaFe | | 17,000 | | 818,550 |
| Weatherford International | | 29,700 a | | 1,075,140 |
| | | | | 8,716,194 |
| Financial Services—19.1% | | | | |
| ACE | | 10,970 | | 586,237 |
| American International Group | | 14,391 | | 981,898 |
| Bank of America | | 61,850 | | 2,854,378 |
The Portfolio 9
STATEMENT OF INVESTMENTS (continued)
|
| Common Stocks (continued) | | Shares | | Value ($) |
| |
| |
|
| Financial Services (continued) | | | | |
| Chubb | | 6,050 | | 590,783 |
| CIT Group | | 21,620 | | 1,119,484 |
| Citigroup | | 48,630 | | 2,360,014 |
| E*Trade Financial | | 35,510 a | | 740,739 |
| Hartford Financial Services Group | | 11,460 | | 984,299 |
| JPMorgan Chase & Co. | | 60,960 | | 2,419,502 |
| Lehman Brothers Holdings | | 4,570 | | 585,737 |
| Merrill Lynch & Co. | | 21,560 | | 1,460,259 |
| Prudential Financial | | 16,880 | | 1,235,447 |
| Wachovia | | 39,640 | | 2,095,370 |
| WR Berkley | | 12,330 | | 587,155 |
| | | | | 18,601,302 |
| Health Care—14.0% | | | | |
| Amgen | | 13,060 a | | 1,029,912 |
| Barr Pharmaceuticals | | 11,630 a | | 724,433 |
| Fisher Scientific International | | 12,760 a | | 789,334 |
| Genzyme | | 6,700 a | | 474,226 |
| IMS Health | | 28,930 | | 720,936 |
| Invitrogen | | 7,310 a | | 487,138 |
| Johnson & Johnson | | 32,350 | | 1,944,235 |
| Medtronic | | 16,730 | | 963,146 |
| Novartis, ADR | | 18,690 | | 980,851 |
| Omnicare | | 10,140 | | 580,211 |
| Pfizer | | 41,274 | | 962,510 |
| St. Jude Medical | | 11,910 a | | 597,882 |
| Thermo Electron | | 16,000 a | | 482,080 |
| WellPoint | | 17,540 a | | 1,399,517 |
| Wyeth | | 32,730 | | 1,507,871 |
| | | | | 13,644,282 |
| Industrial—12.0% | | | | |
| Burlington Northern Santa Fe | | 6,800 | | 481,576 |
| Caterpillar | | 8,830 | | 510,109 |
| Danaher | | 17,280 | | 963,878 |
| Eaton | | 7,600 | | 509,884 |
| Emerson Electric | | 11,630 | | 868,761 |
| Common Stocks (continued) | | Shares | | Value ($) |
| |
| |
|
| Industrial (continued) | | | | |
| General Electric | | 90,990 | | 3,189,199 |
| Lockheed Martin | | 15,670 | | 997,082 |
| Norfolk Southern | | 16,440 | | 737,005 |
| Rockwell Automation | | 12,530 | | 741,275 |
| Textron | | 11,570 | | 890,659 |
| Tyco International | | 33,570 | | 968,830 |
| United Technologies | | 15,990 | | 894,001 |
| | | | | 11,752,259 |
| Information Technology—13.8% | | | | |
| Apple Computer | | 13,240 a | | 951,824 |
| Checkfree | | 10,190 a | | 467,721 |
| Cisco Systems | | 22,110 a | | 378,523 |
| EMC/Massachusetts | | 57,920 a | | 788,870 |
| Google, Cl. A | | 1,161 a | | 481,652 |
| Hewlett-Packard | | 51,120 | | 1,463,566 |
| Ingram Micro, Cl. A | | 27,780 a | | 553,655 |
| Intel | | 37,530 | | 936,749 |
| International Business Machines | | 23,250 | | 1,911,150 |
| Microsoft | | 102,160 | | 2,671,484 |
| Motorola | | 22,880 | | 516,859 |
| Oracle | | 58,630 a | | 715,872 |
| Qualcomm | | 27,190 | | 1,171,345 |
| Texas Instruments | | 13,880 | | 445,132 |
| | | | | 13,454,402 |
| Materials—3.0% | | | | |
| Air Products & Chemicals | | 12,150 | | 719,159 |
| Alcoa | | 34,920 | | 1,032,584 |
| Dow Chemical | | 11,880 | | 520,581 |
| E I Du Pont de Nemours & Co. | | 9,240 | | 392,700 |
| PPG Industries | | 4,720 | | 273,288 |
| | | | | 2,938,312 |
| Telecommunication Services—2.1% | | | | |
| AT & T | | 31,200 | | 764,088 |
| Verizon Communications | | 41,600 | | 1,252,992 |
| | | | | 2,017,080 |
| | STATEMENT OF INVESTMENTS (continued)
|
| Common Stocks (continued) | | Shares | | Value ($) |
| |
| |
|
| Utilities—3.4% | | | | |
| Constellation Energy Group | | 13,490 | | 777,024 |
| PG & E | | 36,360 | | 1,349,683 |
| Sempra Energy | | 26,710 | | 1,197,676 |
| | | | | 3,324,383 |
| Total Common Stocks | | | | |
| (cost $81,176,285) | | | | 96,429,345 |
| |
| |
|
| | | Principal | | |
| Short-Term Investments—.7% | | Amount ($) | | Value ($) |
| |
| |
|
| U.S. Treasury Bills: | | | | |
| 3.72%, 3/2/2006 | | 509,000 | | 505,834 |
| 3.87%, 3/23/2006 | | 135,000 | | 133,834 |
| Total Short-Term Investments | | | | |
| (cost $639,665) | | | | 639,668 |
| |
| |
|
| Total Investments (cost $81,815,950) | | 99.5% | | 97,069,013 |
| Cash and Receivables (Net) | | .5% | | 484,472 |
| Net Assets | | 100.0% | | 97,553,485 |
| | ADR—American Depository Receipts.
a Non-income producing.
|
| Portfolio Summary† | | | | | | |
| |
| | | Value (%) | | | | Value (%) |
| |
| |
| |
|
| Financial Services | | 19.1 | | Energy | | 8.9 |
| Health Care | | 14.0 | | Utilities | | 3.4 |
| Information Technology | | 13.8 | | Materials | | 3.0 |
| Consumer Staples | | 12.2 | | Telecommunication Services | | 2.1 |
| Industrial | | 12.0 | | Short-Term Investments | | .7 |
| Consumer Discretionary | | 10.3 | | | | 99.5 |
| |
| † Based on net assets. | | | | | | |
| See notes to financial statements. | | | | | | |
STATEMENT OF ASSETS AND LIABILITIES
December 31, 2005
| | | Cost | | Value |
| |
| |
|
| Assets ($): | | | | |
| Investments in securities—See Statement of Investments | | 81,815,950 | | 97,069,013 |
| Receivable for investment securities sold | | | | 6,634,782 |
| Dividends and interest receivable | | | | 144,060 |
| | | | | 103,847,855 |
| |
| |
|
| Liabilities ($): | | | | |
| Due to The Dreyfus Corporation and affiliates—Note 3(b) | | | | 72,238 |
| Cash overdraft due to custodian | | | | 158 |
| Payable for investment securities purchased | | | | 5,661,478 |
| Payable for shares of Beneficial Interest redeemed | | | | 496,803 |
| Interest payable—Note 2 | | | | 26 |
| Accrued expenses | | | | 63,667 |
| | | | | 6,294,370 |
| |
| |
|
| Net Assets ($) | | | | 97,553,485 |
| |
| |
|
| Composition of Net Assets ($): | | | | |
| Paid-in capital | | | | 99,610,910 |
| Accumulated undistributed investment income—net | | | | 812,180 |
| Accumulated net realized gain (loss) on investments | | | | (18,122,668) |
| Accumulated net unrealized appreciation | | | | |
| (depreciation) on investments | | | | 15,253,063 |
| |
| |
|
| Net Assets ($) | | | | 97,553,485 |
| |
| |
|
| |
| |
| Net Asset Value Per Share | | | | |
| | | Initial Shares | | Service Shares |
| |
| |
|
| Net Assets ($) | | 88,608,295 | | 8,945,190 |
| Shares Outstanding | | 3,984,428 | | 403,220 |
| |
| |
|
| Net Asset Value Per Share ($) | | 22.24 | | 22.18 |
See notes to financial statements.
|
STATEMENT OF OPERATIONS
Year ended December 31, 2005
|
| Investment Income ($): | | |
| Income: | | |
| Cash dividends (net of $2,969 foreign taxes withheld at source) | | 1,750,771 |
| Interest | | 10,103 |
| Income from securities lending | | 1,577 |
| Total Income | | 1,762,451 |
| Expenses: | | |
| Investment advisory fee—Note 3(a) | | 781,667 |
| Prospectus and shareholders’ reports | | 83,109 |
| Professional fees | | 36,758 |
| Distribution fees—Note 3(b) | | 22,958 |
| Custodian fees—Note 3(b) | | 16,557 |
| Trustees’ fees and expenses—Note 3(c) | | 11,412 |
| Shareholder servicing costs—Note 3(b) | | 4,642 |
| Interest expense—Note 2 | | 449 |
| Loan commitment fees—Note 2 | | 371 |
| Miscellaneous | | 6,328 |
| Total Expenses | | 964,251 |
| Less-waiver of fees due to undertaking—Note 3(a) | | (13,980) |
| Net Expenses | | 950,271 |
| Investment Income—Net | | 812,180 |
| |
|
| Realized and Unrealized Gain (Loss) on Investments—Note 4 ($): |
| Net realized gain (loss) on investments | | 10,150,869 |
| Net unrealized appreciation (depreciation) on investments | | (4,868,955) |
| Net Realized and Unrealized Gain (Loss) on Investments | | 5,281,914 |
| Net Increase in Net Assets Resulting from Operations | | 6,094,094 |
See notes to financial statements.
|
STATEMENT OF CHANGES IN NET ASSETS
| | | Year Ended December 31, |
| |
|
| | | 2005 | | 2004 |
| |
| |
|
| Operations ($): | | | | |
| Investment income—net | | 812,180 | | 1,188,966 |
| Net realized gain (loss) on investments | | 10,150,869 | | 15,349,371 |
| Net unrealized appreciation | | | | |
| (depreciation) on investments | | (4,868,955) | | (8,166,167) |
| Net Increase (Decrease) in Net Assets | | | | |
| Resulting from Operations | | 6,094,094 | | 8,372,170 |
| |
| |
|
| Dividends to Shareholders from ($): | | | | |
| Investment income—net: | | | | |
| Initial shares | | — | | (1,359,657) |
| Service shares | | — | | (110,438) |
| Total Dividends | | — | | (1,470,095) |
| |
| |
|
| Beneficial Interest Transactions ($): | | | | |
| Net proceeds from shares sold: | | | | |
| Initial shares | | 3,453,325 | | 2,270,271 |
| Service shares | | 300,528 | | 433,322 |
| Dividends reinvested: | | | | |
| Initial shares | | — | | 1,359,657 |
| Service shares | | — | | 110,438 |
| Cost of shares redeemed: | | | | |
| Initial shares | | (23,812,339) | | (17,871,990) |
| Service shares | | (1,646,452) | | (1,690,439) |
| Increase (Decrease) in Net Assets from | | | | |
| Beneficial Interest Transactions | | (21,704,938) | | (15,388,741) |
| Total Increase (Decrease) in Net Assets | | (15,610,844) | | (8,486,666) |
| |
| |
|
| Net Assets ($): | | | | |
| Beginning of Period | | 113,164,329 | | 121,650,995 |
| End of Period | | 97,553,485 | | 113,164,329 |
| Undistributed investment income—net | | 812,180 | | 1,955 |
STATEMENT OF CHANGES IN NET ASSETS (continued)
|
| | | Year Ended December 31, |
| |
|
| | | 2005 | | 2004 |
| |
| |
|
| Capital Share Transactions: | | | | |
| Initial Shares | | | | |
| Shares sold | | 164,137 | | 114,692 |
| Shares issued for dividends reinvested | | — | | 65,032 |
| Shares redeemed | | (1,121,420) | | (900,487) |
| Net Increase (Decrease) in Shares Outstanding | | (957,283) | | (720,763) |
| |
| |
|
| Service Shares | | | | |
| Shares sold | | 14,394 | | 21,907 |
| Shares issued for dividends reinvested | | — | | 5,286 |
| Shares redeemed | | (77,648) | | (85,389) |
| Net Increase (Decrease) in Shares Outstanding | | (63,254) | | (58,196) |
See notes to financial statements.
|
The following tables describe the performance for each share class for the fiscal periods indicated. All information (except portfolio turnover rate) reflects financial results for a single portfolio share.Total return shows how much your investment in the portfolio would have increased (or decreased) during each period, assuming you had reinvested all dividends and distributions.These figures have been derived from the portfolio’s financial statements.
| | | | | Year Ended December 31, | | |
| |
| |
| |
|
| Initial Shares | | 2005 | | 2004 | | 2003 | | 2002 | | 2001 |
| |
| |
| |
| |
| |
|
| Per Share Data ($): | | | | | | | | | | |
| Net asset value, beginning of period | | 20.93 | | 19.66 | | 16.04 | | 20.89 | | 24.19 |
| Investment Operations: | | | | | | | | | | |
| Investment income—net a | | .17 | | .21 | | .14 | | .12 | | .09 |
| Net realized and unrealized gain | | | | | | | | | | |
| (loss) on investments | | 1.14 | | 1.34 | | 3.63 | | (4.84) | | (3.30) |
| Total from Investment Operations | | 1.31 | | 1.55 | | 3.77 | | (4.72) | | (3.21) |
| Distributions: | | | | | | | | | | |
| Dividends from investment income—net | | — | | (.28) | | (.15) | | (.13) | | (.09) |
| Net asset value, end of period | | 22.24 | | 20.93 | | 19.66 | | 16.04 | | 20.89 |
| |
| |
| |
| |
| |
|
| Total Return (%) | | 6.26 | | 7.87 | | 23.53 | | (22.61) | | (13.27) |
| |
| |
| |
| |
| |
|
| Ratios/Supplemental Data (%): | | | | | | | | | | |
| Ratio of total expenses | | | | | | | | | | |
| to average net assets | | .90 | | .85 | | .85 | | .83 | | .81 |
| Ratio of net expenses | | | | | | | | | | |
| to average net assets | | .90 | | .85 | | .85 | | .83 | | .81 |
| Ratio of net investment income | | | | | | | | | | |
| to average net assets | | .79 | | 1.04 | | .81 | | .64 | | .40 |
| Portfolio Turnover Rate | | 74.33 | | 83.64 | | 52.74 | | 47.47 | | 48.22 |
| |
| |
| |
| |
| |
|
| Net Assets, end of period ($ x 1,000) | | 88,608 | | 103,417 | | 111,352 | | 106,404 | | 172,360 |
a Based on average shares outstanding at each month end.
See notes to financial statements.
|
FINANCIAL HIGHLIGHTS (continued)
|
| | | | | Year Ended December 31, | | |
| |
| |
| |
|
| Service Shares | | 2005 | | 2004 | | 2003 | | 2002 | | 2001 |
| |
| |
| |
| |
| |
|
| Per Share Data ($): | | | | | | | | | | |
| Net asset value, beginning of period | | 20.90 | | 19.63 | | 16.02 | | 20.86 | | 24.19 |
| Investment Operations: | | | | | | | | | | |
| Investment income—net a | | .15 | | .18 | | .11 | | .09 | | .05 |
| Net realized and unrealized gain | | | | | | | | | | |
| (loss) on investments | | 1.13 | | 1.33 | | 3.62 | | (4.83) | | (3.30) |
| Total from Investment Operations | | 1.28 | | 1.51 | | 3.73 | | (4.74) | | (3.25) |
| Distributions: | | | | | | | | | | |
| Dividends from investment income—net | | — | | (.24) | | (.12) | | (.10) | | (.08) |
| Net asset value, end of period | | 22.18 | | 20.90 | | 19.63 | | 16.02 | | 20.86 |
| |
| |
| |
| |
| |
|
| Total Return (%) | | 6.22 | | 7.64 | | 23.31 | | (22.72) | | (13.46) |
| |
| |
| |
| |
| |
|
| Ratios/Supplemental Data (%): | | | | | | | | | | |
| Ratio of total expenses | | | | | | | | | | |
| to average net assets | | 1.15 | | 1.10 | | 1.09 | | 1.06 | | 1.13 |
| Ratio of net expenses | | | | | | | | | | |
| to average net assets | | 1.00 | | 1.00 | | 1.00 | | 1.00 | | 1.00 |
| Ratio of net investment income | | | | | | | | | | |
| to average net assets | | .69 | | .90 | | .65 | | .49 | | .26 |
| Portfolio Turnover Rate | | 74.33 | | 83.64 | | 52.74 | | 47.47 | | 48.22 |
| |
| |
| |
| |
| |
|
| Net Assets, end of period ($ x 1,000) | | 8,945 | | 9,748 | | 10,299 | | 9,150 | | 7,929 |
| a Based on average shares outstanding at each month end. | | | | | | | | |
| See notes to financial statements. | | | | | | | | | | |
NOTES TO FINANCIAL STATEMENTS
NOTE 1—Significant Accounting Policies:
Dreyfus Variable Investment Fund (the “fund”) is registered under the Investment Company Act of 1940, as amended (the “Act”), as an open-end management investment company, operating as a series company currently offering twelve series, including the Disciplined Stock Portfolio (the “portfolio”).The portfolio is only offered to separate accounts established by insurance companies to fund variable annuity contracts and variable life insurance policies.The portfolio is a diversified series. The portfolio’s investment objective is to provide investment returns (consisting of capital appreciation and income) that are greater than the total return performance of stocks represented by the Standard & Poor’s 500 Composite Stock Price Index.The Dreyfus Corporation (the “Manager” or “Dreyfus”) serves as the portfolio’s investment adviser. The Manager is a wholly-owned subsidiary of Mellon Financial Corporation (“Mellon Financial”).
Dreyfus Service Corporation (the “Distributor”), a wholly-owned subsidiary of the Manager, is the distributor of the portfolio’s shares, which are sold without a sales charge.The portfolio is authorized to issue an unlimited number of $.001 par value shares of Beneficial Interest in each of the following classes of shares: Initial and Service. Each class of shares has identical rights and privileges, except with respect to the distribution plan and the expenses borne by each class and certain voting rights. Income, expenses (other than expenses attributable to a specific class), and realized and unrealized gains or losses on investments are allocated to each class of shares based on its relative net assets.
The fund accounts separately for the assets, liabilities and operations of each series. Expenses directly attributable to each series are charged to that series’ operations; expenses which are applicable to all series are allocated among them on a pro rata basis.
The portfolio’s financial statements are prepared in accordance with U.S. generally accepted accounting principles, which may require the use of management estimates and assumptions.Actual results could differ from those estimates.
NOTES TO FINANCIAL STATEMENTS (continued)
|
The fund enters into contracts that contain a variety of indemnifica-tions.The portfolio’s maximum exposure under these arrangements is unknown. The portfolio does not anticipate recognizing any loss related to these arrangements.
(a) Portfolio valuation: Investments in securities are valued at the last sales price on the securities exchange or national securities market on which such securities are primarily traded. Securities listed on the National Market System for which market quotations are available are valued at the official closing price or, if there is no official closing price that day, at the last sales price. Securities not listed on an exchange or the national securities market, or securities for which there were no transactions, are valued at the average of the most recent bid and asked prices, except for open short positions, where the asked price is used for valuation purposes. Bid price is used when no asked price is available. Investments in registered investment companies are valued at their net asset value. When market quotations or official closing prices are not readily available, or are determined not to reflect accurately fair value, such as when the value of a security has been significantly affected by events after the close of the exchange or market on which the security is principally traded (for example, a foreign exchange or market), but before the portfolio calculates its net asset value, the portfolio may value these investments at fair value as determined in accordance with the procedures approved by the Board of Trustees. Fair valuing of securities may be determined with the assistance of a pricing service using calculations based on indices of domestic securities and other appropriate indicators, such as prices of relevant ADR’s and futures contracts. For other securities that are fair valued by the Board of Trustees, certain factors may be considered such as: fundamental analytical data, the nature and duration of restrictions on disposition, an evaluation of the forces that influence the market in which the securities are purchased and sold and public trading in similar securities of the issuer or comparable issuers. Investments denominated in foreign currencies are translated to U.S. dollars at the prevailing rates of exchange. Forward currency exchange contracts are valued at the forward rate.
(b) Securities transactions and investment income: Securities transactions are recorded on a trade date basis. Realized gain and loss from securities transactions are recorded on the identified cost basis. Dividend income is recognized on the ex-dividend date and interest income, including, where applicable, accretion of discount and amortization of premium on investments, is recognized on the accrual basis.
The portfolio has an arrangement with the custodian bank whereby the portfolio receives earnings credits from the custodian when positive cash balances are maintained, which are used to offset custody fees. For financial reporting purposes, the portfolio includes net earnings credits, if any, as an expense offset in the Statement of Operations.
Pursuant to a securities lending agreement with Mellon Bank, N.A., an affiliate of the Manager, the portfolio may lend securities to qualified institutions.At origination, all loans are secured by collateral of at least 102% of the value of U.S. securities loaned and 105% of the value of foreign securities loaned. Collateral equivalent to at least 100% of the market value of securities on loan will be maintained at all times. Cash collateral is invested in certain money market mutual funds managed by the Manager. The portfolio will be entitled to receive all income on securities loaned, in addition to income earned as a result of the lending transaction. Although each security loaned is fully collateralized, the portfolio would bear the risk of delay in recovery of, or loss of rights in, the securities loaned should a borrower fail to return the securities in a timely manner.
(c) Affiliated issuers: Investments in other investment companies advised by the Manager are defined as “affiliated” in the Act.
(d) Dividends to shareholders: Dividends are recorded on the ex-dividend date. Dividends from investment income-net and dividends from net realized capital gain, if any, are normally declared and paid annually, but the portfolio may make distributions on a more frequent basis to comply with the distribution requirements of the Internal Revenue Code of 1986, as amended (the “Code”).To the extent that net realized
NOTES TO FINANCIAL STATEMENTS (continued)
|
capital gain can be offset by capital loss carryovers, it is the policy of the portfolio not to distribute such gain. Income and capital gain distributions are determined in accordance with income tax regulations, which may differ from U.S. generally accepted accounting principles.
(e) Federal income taxes: It is the policy of the portfolio to continue to qualify as a regulated investment company, if such qualification is in the best interests of its shareholders, by complying with the applicable provisions of the Code, and to make distributions of taxable income sufficient to relieve it from substantially all federal income and excise taxes.
At December 31, 2005, the components of accumulated earnings on a tax basis were as follows: undistributed ordinary income $812,180, accumulated capital losses $17,278,113 and unrealized appreciation $14,408,508.
The accumulated capital loss carryover is available to be applied against future net securities profits, if any, realized subsequent to December 31, 2005. If not applied, $13,192,745 of the carryover expires in fiscal 2010 and $4,085,368 expires in fiscal 2011.
The tax character of distributions paid to shareholders during the fiscal periods ended December 31, 2005 and December 31, 2004 were as follows: ordinary income $0 and $1,470,095, respectively.
During the period ended December 31, 2005, as a result of permanent book to tax differences, primarily due to the tax treatment for real estate investment trusts, the portfolio decreased accumulated undistributed investment income-net by $1,955 and increased accumulated net realized gain (loss) on investments by the same amount. Net assets were not affected by this reclassification.
NOTE 2—Bank Line of Credit:
The portfolio participates with other Dreyfus-managed funds in a $350 million redemption credit facility (the “Facility”) to be utilized for temporary or emergency purposes, including the financing of redemptions. In connection therewith, the portfolio has agreed to pay commitment fees on its pro rata portion of the Facility. Interest is charged to the portfolio based on prevailing market rates in effect at the time of borrowing.
The average daily amount of borrowings outstanding under the Facility during the period ended December 31, 2005 was approximately $11,200, with a related weighted average annualized interest rate of 4.03% .
NOTE 3—Investment Advisory Fee and Other Transactions With Affiliates:
(a) Pursuant to an Investment Advisory Agreement with the Manager, the investment advisory fee is computed at the annual rate of .75% of the value of the portfolio’s average daily net assets and is payable monthly.
The Manager has undertaken, from January 1, 2005 to December 31, 2006, to waive receipt of its fees and/or assume the expenses of the portfolio so that the expenses of neither class, exclusive of taxes, brokerage fees, interest on borrowings, commitment fees and extraordinary expenses, exceed an annual rate of 1% of the value of the average daily net assets of their class. During the period ended December 31, 2005, the Manager waived receipt of fees of $13,980, pursuant to the undertaking.
(b) Under the Distribution Plan (the “Plan”) adopted pursuant to Rule 12b-1 under the Act, Service shares pay the Distributor for distributing their shares, for servicing and/or maintaining Service shares shareholder accounts and for advertising and marketing for Service shares.The Plan provides for payments to be made at an annual rate of .25% of the value of the Service shares’ average daily net assets.The Distributor may make payments to Participating Insurance Companies and to brokers and dealers acting as principal underwriter for their variable insurance products.The fees payable under the Plan are payable without regard to actual expenses incurred. During the period ended December 31, 2005, Service shares were charged $22,958 pursuant to the Plan.
The portfolio compensates Dreyfus Transfer, Inc., a wholly-owned subsidiary of the Manager, under a transfer agency agreement for providing personnel and facilities to perform transfer agency services for the portfolio. During the period ended December 31, 2005, the portfolio was charged $183 pursuant to the transfer agency agreement.
NOTES TO FINANCIAL STATEMENTS (continued)
|
The portfolio compensates Mellon Bank, N.A., an affiliate of the Manager, under a custody agreement to provide custodial services for the portfolio. During the period ended December 31, 2005, the portfolio was charged $16,557 pursuant to the custody agreement.
During the period ended December 31, 2005, the portfolio was charged $3,762 for services performed by the Chief Compliance Officer.
The components of Due to The Dreyfus Corporation and affiliates in the Statement of Assets and Liabilities consist of: investment advisory fees $63,464, chief compliance officer fees $1,858, Rule 12b-1 distribution plan fees $1,934, custodian fees $6,419 and transfer agency per account fees $36, which are offset against an expense reimbursement currently in effect in the amount of $1,473.
(c) Each Board member also serves as a Board member of other funds within the Dreyfus complex. Annual retainer fees and attendance fees are allocated to each fund based on net assets.
NOTE 4—Securities Transactions:
The aggregate amount of purchases and sales of investment securities, excluding short-term securities, during the period ended December 31, 2005, amounted to $76,989,129 and $98,127,682, respectively.
At December 31, 2005, the cost of investments for federal income tax purposes was $82,660,505; accordingly, accumulated net unrealized appreciation on investments was $14,408,508, consisting of $16,048,672 gross unrealized appreciation and $1,640,164 gross unrealized depreciation.
REPORT OF INDEPENDENT REGISTERED PUBLIC ACCOUNTING FIRM
Shareholders and Board of Trustees
Dreyfus Variable Investment Fund, Disciplined Stock Portfolio
We have audited the accompanying statement of assets and liabilities, including the statement of investments, of Dreyfus Variable Investment Fund, Disciplined Stock Portfolio (one of the funds comprising Dreyfus Variable Investment Fund) as of December 31, 2005, and the related statement of operations for the year then ended, the statement of changes in net assets for each of the two years in the period then ended, and financial highlights for each of the years indicated therein. These financial statements and financial highlights are the responsibility of the Fund’s management. Our responsibility is to express an opinion on these financial statements and financial highlights based on our audits.
We conducted our audits in accordance with the standards of the Public Company Accounting Oversight Board (United States). Those standards require that we plan and perform the audit to obtain reasonable assurance about whether the financial statements and financial highlights are free of material misstatement. We were not engaged to perform an audit of the Fund’s internal control over financial reporting. Our audits included consideration of internal control over financial reporting as a basis for designing audit procedures that are appropriate in the circumstances, but not for the purpose of expressing an opinion on the effectiveness of the Fund’s internal control over financial reporting. Accordingly, we express no such opinion. An audit also includes examining, on a test basis, evidence supporting the amounts and disclosures in the financial statements and financial highlights, assessing the accounting principles used and significant estimates made by management, and evaluating the overall financial statement presentation. Our procedures included verification by examination of securities held by the custodian as of December 31, 2005 and confirmation of securities not held by the custodian by correspondence with others. We believe that our audits provide a reasonable basis for our opinion.
In our opinion, the financial statements and financial highlights referred to above present fairly, in all material respects, the financial position of Dreyfus Variable Investment Fund, Disciplined Stock Portfolio at December 31, 2005, the results of its operations for the year then ended, the changes in its net assets for each of the two years in the period then ended, and the financial highlights for each of the indicated years, in conformity with U.S. generally accepted accounting principles.
| | New York, New York
February 6, 2006
|

| B O A R D M E M B E R S I N F O R M AT I O N ( U n a u d i t e d ) |
| |
| |
| |
| Joseph S. DiMartino (62) |
| Chairman of the Board (1995) |
| Principal Occupation During Past 5 Years: |
| • Corporate Director and Trustee |
| Other Board Memberships and Affiliations: |
| • The Muscular Dystrophy Association, Director |
| • Levcor International, Inc., an apparel fabric processor, Director |
| • Century Business Services, Inc., a provider of outsourcing functions for small and medium size |
| companies, Director |
| • The Newark Group, a provider of a national market of paper recovery facilities, paperboard |
| mills and paperboard converting plants, Director |
| • Sunair Services Corporation, engages in the design, manufacture and sale of high frequency |
| systems for long-range voice and data communications, as well as providing certain outdoor- |
| related services to homes and businesses, Director |
| No. of Portfolios for which Board Member Serves: 193 |
| ——————— |
| David P. Feldman (66) |
| Board Member (1994) |
| Principal Occupation During Past 5 Years: |
| • Corporate Director and Trustee |
| Other Board Memberships and Affiliations: |
| • BBH Mutual Funds Group (11 funds), Director |
| • The Jeffrey Company, a private investment company, Director |
| • QMED, a medical device company, Director |
| No. of Portfolios for which Board Member Serves: 58 |
| ——————— |
| James F. Henry (75) |
| Board Member (1990) |
| Principal Occupation During Past 5 Years: |
| • President, CPR Institute for Dispute Resolution, a non-profit organization principally |
| engaged in the development of alternatives to business litigation (Retired 2003) |
| No. of Portfolios for which Board Member Serves: 22 |
| Dr. Paul A. Marks (79) |
| Board Member (1990) |
| Principal Occupation During Past 5 Years: |
| • President, Emeritus (2000-present) and President and Chief Executive Officer of Memorial |
| Sloan-Kettering Cancer Center (Retired 1999) |
| Other Board Memberships and Affiliations: |
| • Pfizer, Inc., a pharmaceutical company, Director-Emeritus |
| • Lazard Freres & Company, LLC, Senior Adviser |
| • Carrot Capital Health Care Ventures, Advisor |
| • Armgo-Start-Up Biotech; Board of Directors |
| • Nanoviricide, Board Director |
| • PTC, Scientific Advisory Board |
| No. of Portfolios for which Board Member Serves: 22 |
| ——————— |
| Dr. Martin Peretz (66) |
| Board Member (1990) |
| Principal Occupation During Past 5 Years: |
| • Editor-in-Chief of The New Republic Magazine |
| • Lecturer in Social Studies at Harvard University (1965-2001) |
| • Co-Chairman of TheStreet.com, a financial daily on the web |
| Other Board Memberships and Affiliations: |
| • Academy for Liberal Education, an accrediting agency for colleges and universities certified by |
| the U.S. Department of Education, Director |
| • Harvard Center for Blood Research,Trustee |
| • Bard College,Trustee |
| • Board of Overseers of YIVO Institute for Jewish Research, Chairman |
| No. of Portfolios for which Board Member Serves: 22 |
| ——————— |
| Once elected all Board Members serve for an indefinite term.The address of the Board Members and Officers is in c/o |
| The Dreyfus Corporation, 200 Park Avenue, New York, New York 10166. Additional information about the Board |
| Members is available in the fund’s Statement of Additional Information which can be obtained from Dreyfus free of |
| charge by calling this toll free number: 1-800-554-4611. |
| John M. Fraser, Jr., Emeritus Board Member |
| Rosalind Gersten Jacobs, Emeritus Board Member |
OFFICERS OF THE FUND (Unaudited)
| STEPHEN E. CANTER, President since |
| March 2000. |
Chairman of the Board, Chief Executive Officer and Chief Operating Officer of the Manager, and an officer of 90 investment companies (comprised of 184 portfolios) managed by the Manager. Mr. Canter also is a Board member and, where applicable, an Executive Committee Member of the other investment management subsidiaries of Mellon Financial Corporation, each of which is an affiliate of the Manager. He is 60 years old and has been an employee of the Manager since May 1995.
| STEPHEN R. BYERS, Executive Vice |
| President since November 2002. |
Chief Investment Officer,Vice Chairman and a director of the Manager, and an officer of 90 investment companies (comprised of 184 portfolios) managed by the Manager. Mr. Byers also is an officer, director or an Executive Committee Member of certain other investment management subsidiaries of Mellon Financial Corporation, each of which is an affiliate of the Manager. He is 52 years old and has been an employee of the Manager since January 2000.
| MARK N. JACOBS, Vice President since |
| March 2000. |
Executive Vice President, Secretary and General Counsel of the Manager, and an officer of 91 investment companies (comprised of 200 portfolios) managed by the Manager. He is 59 years old and has been an employee of the Manager since June 1977.
| MICHAEL A. ROSENBERG, Vice President |
| and Secretary since August 2005. |
Associate General Counsel of the Manager, and an officer of 91 investment companies (comprised of 200 portfolios) managed by the Manager. He is 45 years old and has been an employee of the Manager since October 1991.
| JAMES BITETTO, Vice President and |
| Assistant Secretary since August 2005. |
Assistant General Counsel and Assistant Secretary of the Manager, and an officer of 91 investment companies (comprised of 200 portfolios) managed by the Manager. He is 39 years old and has been an employee of the Manager since December 1996.
| JONI LACKS CHARATAN, Vice President |
| and Assistant Secretary since |
| August 2005. |
Associate General Counsel of the Manager, and an officer of 91 investment companies (comprised of 200 portfolios) managed by the Manager. She is 50 years old and has been an employee of the Manager since October 1988.
| JOSEPH M. CHIOFFI, Vice President and |
| Assistant Secretary since August 2005. |
Assistant General Counsel of the Manager, and an officer of 91 investment companies (comprised of 200 portfolios) managed by the Manager. He is 44 years old and has been an employee of the Manager since June 2000.
| JANETTE E. FARRAGHER, Vice President |
| and Assistant Secretary since |
| August 2005. |
Associate General Counsel of the Manager, and an officer of 91 investment companies (comprised of 200 portfolios) managed by the Manager. She is 43 years old and has been an employee of the Manager since February 1984.
| JOHN B. HAMMALIAN, Vice President and |
| Assistant Secretary since August 2005. |
Associate General Counsel of the Manager, and an officer of 91 investment companies (comprised of 200 portfolios) managed by the Manager. He is 42 years old and has been an employee of the Manager since February 1991.
| ROBERT R. MULLERY, Vice President and |
| Assistant Secretary since August 2005. |
Associate General Counsel of the Manager, and an officer of 91 investment companies (comprised of 200 portfolios) managed by the Manager. He is 53 years old and has been an employee of the Manager since May 1986.
| JEFF PRUSNOFSKY, Vice President and |
| Assistant Secretary since August 2005. |
Associate General Counsel of the Manager, and an officer of 91 investment companies (comprised of 200 portfolios) managed by the Manager. He is 40 years old and has been an employee of the Manager since October 1990.
| JAMES WINDELS, Treasurer since |
| November 2001. |
Director – Mutual Fund Accounting of the Manager, and an officer of 91 investment companies (comprised of 200 portfolios) managed by the Manager. He is 47 years old and has been an employee of the Manager since April 1985.
| ERIK D. NAVILOFF, Assistant Treasurer |
| since December 2002. |
Senior Accounting Manager – Taxable Fixed Income Funds of the Manager, and an officer of 91 investment companies (comprised of 200 portfolios) managed by the Manager. He is 37 years old and has been an employee of the Manager since November 1992.
| ROBERT ROBOL, Assistant Treasurer |
| since August 2003. |
Senior Accounting Manager – Money Market and Municipal Bond Funds of the Manager, and an officer of 91 investment companies (comprised of 200 portfolios) managed by the Manager. He is 41 years old and has been an employee of the Manager since October 1988.
| ROBERT SVAGNA, Assistant Treasurer |
| since December 2002. |
Senior Accounting Manager – Equity Funds of the Manager, and an officer of 91 investment companies (comprised of 200 portfolios) managed by the Manager. He is 38 years old and has been an employee of the Manager since November 1990.
| GAVIN C. REILLY, Assistant Treasurer |
| since December 2005. |
Tax Manager of the Investment Accounting and Support Department of the Manager, and an officer of 91 investment companies (comprised of 200 portfolios) managed by the Manager. He is 37 years old and has been an employee of the Manager since April 1991.
| JOSEPH W. CONNOLLY, Chief Compliance |
| Officer since October 2004. |
Chief Compliance Officer of the Manager and The Dreyfus Family of Funds (91 investment companies, comprised of 200 portfolios). From November 2001 through March 2004, Mr. Connolly was first Vice-President, Mutual Fund Servicing for Mellon Global Securities Services. In that capacity, Mr. Connolly was responsible for managing Mellon’s Custody, Fund Accounting and Fund Administration services to third-party mutual fund clients. He is 48 years old and has served in various capacities with the Manager since 1980, including manager of the firm’s Fund Accounting Department from 1997 through October 2001.
| WILLIAM GERMENIS, Anti-Money |
| Laundering Compliance Officer since |
| September 2002. |
Vice President and Anti-Money Laundering Compliance Officer of the Distributor, and the Anti-Money Laundering Compliance Officer of 87 investment companies (comprised of 196 portfolios) managed by the Manager. He is 35 years old and has been an employee of the Distributor since October 1998.
| Dreyfus Variable |
| Investment Fund, |
| Disciplined Stock Portfolio |
| 200 Park Avenue |
| New York, NY 10166 |
| |
| Investment Adviser |
| The Dreyfus Corporation |
| 200 Park Avenue |
| New York, NY 10166 |
| |
| Custodian |
| Mellon Bank, N.A. |
| One Mellon Bank Center |
| Pittsburgh, PA 15258 |
| Transfer Agent & |
| Dividend Disbursing Agent |
| Dreyfus Transfer, Inc. |
| 200 Park Avenue |
| New York, NY 10166 |
| |
| Distributor |
| Dreyfus Service Corporation |
| 200 Park Avenue |
| New York, NY 10166 |
Telephone 1-800-554-4611 or 516-338-3300
Mail The Dreyfus Family of Funds, 144 Glenn Curtiss Boulevard, Uniondale, NY 11556-0144 Attn: Institutional Servicing
The portfolio files its complete schedule of portfolio holdings with the Securities and
Exchange Commission (“SEC”) for the first and third quarters of each fiscal year on Form N-Q. The portfolio’s Forms N-Q are available on the SEC’s website at http://www.sec.gov and may be reviewed and copied at the SEC’s Public Reference Room in Washington, DC. Information on the operation of the Public Reference Room may be obtained by calling 1-800-SEC-0330.
A description of the policies and procedures that the portfolio uses to determine how to vote proxies relating to portfolio securities, and information regarding how the portfolio voted these proxies for the 12-month period ended June 30, 2005, is available through the portfolio’s website at http://www.dreyfus.com and on the SEC’s website at http://www.sec.gov. The description of the policies and procedures is also available without charge, upon request, by calling 1-800-645-6561.
© 2006 Dreyfus Service Corporation


The views expressed in this report reflect those of the portfolio manager only through the end of the period covered and do not necessarily represent the views of Dreyfus or any other person in the Dreyfus organization.Any such views are subject to change at any time based upon market or other conditions and Dreyfus disclaims any responsibility to update such views. These views may not be relied on as investment advice and, because investment decisions for a Dreyfus portfolio are based on numerous factors, may not be relied on as an indication of trading intent on behalf of any Dreyfus portfolio.
Not FDIC-Insured • Not Bank-Guaranteed • May Lose Value
| | | Contents |
| |
| | | T H E P O R T F O L I O |
| |
|
| 2 | | Letter from the Chairman |
| 3 | | Discussion of Performance |
| 6 | | Portfolio Performance |
| 8 | | Understanding Your Portfolio’s Expenses |
| 8 | | Comparing Your Portfolio’s Expenses |
| | | With Those of Other Funds |
| 9 | | Statement of Investments |
| 13 | | Statement of Assets and Liabilities |
| 14 | | Statement of Operations |
| 15 | | Statement of Changes in Net Assets |
| 17 | | Financial Highlights |
| 19 | | Notes to Financial Statements |
| 26 | | Report of Independent Registered |
| | | Public Accounting Firm |
| 27 | | Important Tax Information |
| 28 | | Board Members Information |
| 30 | | Officers of the Fund |
| | | F O R M O R E I N F O R M AT I O N |
| |
|
| | | Back Cover |
| Dreyfus Variable Investment Fund, |
| Growth and Income Portfolio |
The Portfolio

LETTER FROM THE CHAIRMAN
Dear Shareholder:
We are pleased to present this annual report for Dreyfus Variable Investment Fund, Growth and Income Portfolio, covering the 12-month period from January 1, 2005, through December 31, 2005. Inside, you’ll find valuable information about how the fund was managed during the reporting period, including a discussion with the fund’s portfolio manager, L. Emerson Tuttle.
Stocks generally absorbed both good and bad news in 2005 to post modestly positive total returns. On the plus side, an expanding U.S. economy and low inflation helped support corporate earnings in most industry groups. Negative influences included rising short-term interest rates and escalating energy prices, which many analysts feared might erode corporate profits. In addition, hurricanes Katrina, Rita and Wilma disrupted economic activity along the Gulf Coast.
We expect the U.S. economy to continue its moderate expansion in 2006, fueled in part by a rebound in corporate capital spending and exports. The labor market likely will remain relatively strong while inflation should stay low, supporting consumers’ real incomes. Risks in the new year include the possible end of the boom in the housing market, where we believe prices are more likely to stall than plunge.
As always, we encourage you to speak with your financial consultant about how these and other market forces may affect your investments. Thank you for your continued confidence and support.

The Dreyfus Corporation
January 17, 2006
|

DISCUSSION OF PERFORMANCE
L. Emerson Tuttle, Portfolio Manager
How did Dreyfus Variable Investment Fund, Growth and Income Portfolio perform relative to its benchmark?
For the 12-month period ended December 31, 2005, the portfolio achieved total returns of 3.35% for its Initial shares and 3.21% for its Service shares.1 For the same period, the total return of the Standard & Poor’s 500 Composite Stock Price Index (“S&P 500 Index”), the portfolio’s benchmark, was 4.91% .2
Despite a growing U.S. economy and strong corporate earnings, stocks generally failed to advance for much of 2005 due to lingering concerns regarding rising interest rates and soaring energy prices.While the portfolio benefited from its overweighted exposure to better-performing energy companies and strong stock selections in the health care and consumer-related sectors, disappointing performance in the technology sector caused the portfolio’s returns to lag the benchmark.
What is the portfolio’s investment approach?
The portfolio seeks long-term capital growth, current income and growth of income consistent with reasonable investment risk. To pursue these goals, the portfolio invests primarily in stocks, bonds and money market instruments of domestic and foreign issuers. The portfolio’s stock investments may include common stocks, preferred stocks and convertible securities, including those purchased in initial public offerings or shortly thereafter.
The portfolio’s investment strategy combines market economics with fundamental research. The portfolio manager begins by assessing current economic conditions and forecasting economic expectations. Each economic sector of the S&P 500 Index is examined to determine the sector’s market-capitalized weighting and to estimate the performance of the sector relative to the S&P 500 Index as a whole.A balance is determined for the portfolio, giving greater weight to sectors that are expected to outperform the overall market and less weight to sectors that are expected to underperform the overall market.
DISCUSSION OF PERFORMANCE (continued)
|
In choosing stocks, the portfolio employs fundamental analysis, generally seeking companies with strong positions in their industries, and companies with a catalyst that can trigger a price increase (such as accelerating earnings growth, a corporate restructuring or change in management).The portfolio manager seeks to create a broadly diversified core portfolio comprised of growth stocks, value stocks and stocks that exhibit characteristics of both investment styles. Income is generated primarily from dividend-paying stocks in which the portfolio may invest.The manager selects stocks based on:
| • | | value, or how a stock is priced relative to its perceived intrinsic worth |
| • | | growth, in this case the sustainability or growth of earnings or cash flow |
| • financial profile, which measures the financial health of the company |
What other factors influenced the portfolio’s performance?
Sharply higher oil and gas prices fueled record profits for many energy-related companies in 2005, boosting energy stocks significantly. The portfolio added to its energy exposure during the reporting period, which enhanced its relative performance despite weaker-than-average performance from holdings such as Exxon Mobil and Chevron. Top energy performers included independent exploration and production company Anadarko Petroleum and integrated oil and gas company ConocoPhillips.
Relatively heavy exposure to the health care area and strong individual stock selections also helped boost returns. We focused on service providers, such as WellPoint and Caremark Rx; equipment companies, such as Alcon; and biotechnology firms, such as Genzyme. Performance also benefited from the portfolio’s limited exposure to troubled large-cap pharmaceutical companies.Among consumer staples holdings, food and tobacco leader Altria Group and beverage and food company Pepsico contributed to comparatively strong returns, while the portfolio outperformed the benchmark’s consumer cyclicals component due to a slightly underweighted position and strong stock selections in the sector. Finally, transportation company Burlington Northern Santa Fe, a member of the industrials sector, provided the single greatest contribution to the portfolio’s performance during 2005.
On the other hand, investments in the technology sector accounted for most of the portfolio’s relative underperformance. Gains in
communications equipment producer Motorola and semiconductor maker Texas Instruments were undermined by company-specific issues affecting other technology holdings, most notably personal computer and electronics seller Dell, computing giant International Business Machines, online security provider Verisign and programmable chip supplier Altera. Relative performance in the technology area also suffered from an underweighted position in high-flying Internet stocks, many of which failed to meet our investment criteria.
What is the portfolio’s current strategy?
As of the end of the reporting period, the total number of holdings in the portfolio stood at 56, down from more than 120 a little more than one year earlier. By concentrating on fewer holdings, we expect to increase the performance impact of the stocks we view most favorably. The fund currently holds its most overweighted position in the energy sector and slightly underweighted positions in the consumer discretionary, utilities and basic materials areas. In addition, the portfolio’s average market capitalization ended the year higher than the benchmark’s, reflecting what we believe to be attractive valuations for larger companies and concerns regarding the possible effects of slowing economic growth on smaller companies.
| | | The portfolio is only available as a funding vehicle under variable life insurance policies or variable |
| | | annuity contracts issued by insurance companies. Individuals may not purchase shares of the |
| | | portfolio directly.A variable annuity is an insurance contract issued by an insurance company that |
| | | enables investors to accumulate assets on a tax-deferred basis for retirement or other long-term goals. |
| | | The investment objective and policies of Dreyfus Variable Investment Fund, Growth and Income |
| | | Portfolio made available through insurance products may be similar to other funds/portfolios |
| | | managed or advised by Dreyfus. However, the investment results of the portfolio may be higher or |
| | | lower than, and may not be comparable to, those of any other Dreyfus fund/portfolio. |
| 1 | | Total return includes reinvestment of dividends and any capital gains paid. Past performance is no |
| | | guarantee of future results. Share price and investment return fluctuate such that upon redemption, |
| | | portfolio shares may be worth more or less than their original cost.The portfolio’s performance does |
| | | not reflect the deduction of additional charges and expenses imposed in connection with investing in |
| | | variable insurance contracts, which will reduce returns. Return figures provided reflect the absorption |
| | | of certain portfolio expenses by The Dreyfus Corporation pursuant to an agreement in effect |
| | | through January 31, 2006, at which time it may be extended, terminated or modified. Had these |
| | | expenses not been absorbed, the portfolio’s returns would have been lower. |
| 2 | | SOURCE: LIPPER INC. — Reflects the reinvestment of dividends and, where applicable, |
| | | capital gain distributions.The Standard & Poor’s 500 Composite Stock Price Index is a widely |
| | | accepted, unmanaged index of U.S. stock market performance. |
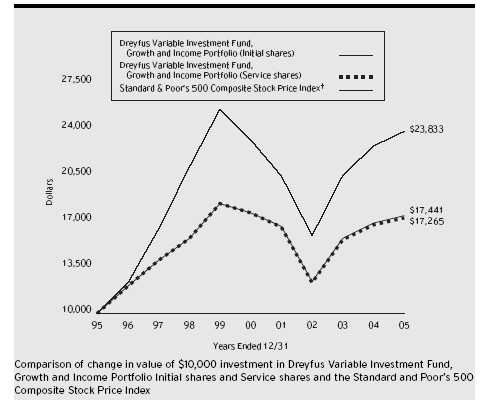
| Average Annual Total Returns as of | | 12/31/05 | | | | |
| |
| | | 1 Year | | 5 Years | | 10 Years |
| |
| |
| |
|
| Initial shares | | 3.35% | | (0.24)% | | 5.72% |
| Service shares | | 3.21% | | (0.44)% | | 5.61% |
| |
| The data for Service shares includes the results of Initial shares for the period prior to December 31, 2000 |
| (inception date of Service shares). Actual Service shares’ average annual total return and hypothetical growth |
| results would have been lower. See notes below. | | | | | | |
| † Source: Lipper Inc. | | | | | | |
| Past performance is not predictive of future performance.The portfolio’s performance shown in the graph and table does not |
| reflect the deduction of taxes that a shareholder would pay on portfolio distributions or the redemption of portfolio shares. |
| The portfolio’s performance does not reflect the deduction of additional charges and expenses imposed in |
| connection with investing in variable insurance contracts which will reduce returns. | | |
| The above graph compares a $10,000 investment made in Initial and Service shares of Dreyfus Variable Investment |
| Fund, Growth and Income Portfolio on 12/31/95 to a $10,000 investment made in the Standard & Poor’s 500 |
| Composite Stock Price Index (the “Index”) on that date. | | | | |
6
The portfolio’s Initial shares are not subject to a Rule 12b-1 fee.The portfolio’s Service shares are subject to a 0.25% annual Rule 12b-1 fee.The performance figures for Service shares reflect the performance of the portfolio’s Initial shares from their inception date through December 30, 2000, and the performance of the portfolio’s Service shares from December 31, 2000 (inception date of Service shares) to December 31, 2005 (blended performance figures).The performance figures for each share class reflect certain expense reimbursements, without which the performance of each share class would have been lower. In addition, the blended performance figures have not been adjusted to reflect the higher operating expenses of the Service shares. If these expenses had been reflected, the blended performance figures would have been lower. All dividends and capital gain distributions are reinvested.
The portfolio’s performance shown in the line graph takes into account all applicable portfolio fees and expenses (after any expense reimbursements).The Index is a widely accepted, unmanaged index of U.S. stock market performance.The Index does not take into account charges, fees and other expenses. Further information relating to portfolio performance, including expense reimbursements, if applicable, is contained in the Financial Highlights section of the prospectus and elsewhere in this report.
UNDERSTANDING YOUR PORTFOLIO’S EXPENSES (Unaudited)
As a mutual fund investor,you pay ongoing expenses,such as management fees and other expenses.Using the information below,you can estimate how these expenses affect your investment and compare them with the expenses of other funds.You also may pay one-time transaction expenses,including sales charges (loads) and redemption fees, which are not shown in this section and would have resulted in higher total expenses. For more information, see your portfolio’s prospectus or talk to your financial adviser.
Review your portfolio’s expenses
The table below shows the expenses you would have paid on a $1,000 investment in Dreyfus Variable Investment Fund, Growth and Income Portfolio from July 1, 2005 to December 31, 2005. It also shows how much a $1,000 investment would be worth at the close of the period, assuming actual returns and expenses.
| Expenses and Value of a $1,000 Investment | | |
| assuming actual returns for the six months ended December 31, 2005 |
| | | Initial Shares | | Service Shares |
| |
| |
|
| Expenses paid per $1,000 † | | $ 4.19 | | $ 5.18 |
| Ending value (after expenses) | | $1,054.60 | | $1,054.10 |
COMPARING YOUR PORTFOLIO’S EXPENSES WITH THOSE OF OTHER FUNDS (Unaudited)
Using the SEC’s method to compare expenses
The Securities and Exchange Commission (SEC) has established guidelines to help investors assess fund expenses. Per these guidelines, the table below shows your portfolio’s expenses based on a $1,000 investment, assuming a hypothetical 5% annualized return. You can use this information to compare the ongoing expenses (but not transaction expenses or total cost) of investing in the portfolio with those of other funds. All mutual fund shareholder reports will provide this information to help you make this comparison. Please note that you cannot use this information to estimate your actual ending account balance and expenses paid during the period.
Expenses and Value of a $1,000 Investment assuming a hypothetical 5% annualized return for the six months ended December 31, 2005
| | | Initial Shares | | Service Shares |
| |
| |
|
| Expenses paid per $1,000 † | | $ 4.13 | | $ 5.09 |
| Ending value (after expenses) | | $1,021.12 | | $1,020.16 |
† Expenses are equal to the portfolio’s annualized expense ratio of .81% for Initial shares and 1.00% for Service shares, multiplied by the average account value over the period, multiplied by 184/365 (to reflect the one-half year period).
| STATEMENT OF INVESTMENTS |
| December 31, 2005 |
| Common Stocks—98.7% | | Shares | | Value ($) |
| |
| |
|
| Banking—3.5% | | | | |
| Bank of America | | 155,600 | | 7,180,940 |
| Basic Industries—3.1% | | | | |
| Air Products & Chemicals | | 56,400 | | 3,338,316 |
| E I Du Pont de Nemours & Co. | | 71,800 | | 3,051,500 |
| | | | | 6,389,816 |
| Beverages & Tobacco—2.7% | | | | |
| Altria Group | | 74,300 | | 5,551,696 |
| Capital Goods—8.4% | | | | |
| Danaher | | 66,200 | | 3,692,636 |
| Emerson Electric | | 42,100 | | 3,144,870 |
| General Electric | | 291,000 | | 10,199,550 |
| | | | | 17,037,056 |
| Consumer Non-Durables—3.7% | | | | |
| PepsiCo | | 57,000 | | 3,367,560 |
| Procter & Gamble | | 72,500 | | 4,196,300 |
| | | | | 7,563,860 |
| Consumer Services—10.5% | | | | |
| Advance Auto Parts | | 78,850 a | | 3,426,821 |
| CVS | | 127,800 | | 3,376,476 |
| Hilton Hotels | | 132,400 | | 3,192,164 |
| Home Depot | | 73,200 | | 2,963,136 |
| News, Cl. A | | 134,100 | | 2,085,255 |
| Target | | 73,400 | | 4,034,798 |
| Walt Disney | | 95,300 | | 2,284,341 |
| | | | | 21,362,991 |
| Electrical Components—1.8% | | | | |
| EMC/Massachusetts | | 267,000 a | | 3,636,540 |
| Energy—12.0% | | | | |
| Anadarko Petroleum | | 24,600 | | 2,330,850 |
| Chesapeake Energy | | 54,900 b | | 1,741,977 |
| Chevron | | 93,300 | | 5,296,641 |
| ConocoPhillips | | 39,500 | | 2,298,110 |
| Exxon Mobil | | 163,800 | | 9,200,646 |
STATEMENT OF INVESTMENTS (continued)
|
| Common Stocks (continued) | | Shares | | Value ($) |
| |
| |
|
| Energy (continued) | | | | |
| Grant Prideco | | 40,500 a | | 1,786,860 |
| Weatherford International | | 49,500 a | | 1,791,900 |
| | | | | 24,446,984 |
| Financial Services—16.7% | | | | |
| Axis Capital Holdings | | 131,300 | | 4,107,064 |
| Capital One Financial | | 50,400 | | 4,354,560 |
| Countrywide Financial | | 125,000 | | 4,273,750 |
| JPMorgan Chase & Co. | | 165,100 | | 6,552,819 |
| Merrill Lynch & Co. | | 77,300 | | 5,235,529 |
| Radian Group | | 70,100 | | 4,107,159 |
| Wachovia | | 103,400 | | 5,465,724 |
| | | | | 34,096,605 |
| Health Care—13.5% | | | | |
| Alcon | | 28,000 | | 3,628,800 |
| Caremark Rx | | 46,800 a | | 2,423,772 |
| Fisher Scientific International | | 37,600 a | | 2,325,936 |
| Genzyme | | 52,100 a | | 3,687,638 |
| Johnson & Johnson | | 96,700 | | 5,811,670 |
| Novartis, ADR | | 69,200 | | 3,631,616 |
| WellPoint | | 43,900 a | | 3,502,781 |
| Wyeth | | 53,700 | | 2,473,959 |
| | | | | 27,486,172 |
| Technology—14.0% | | | | |
| Cisco Systems | | 125,100 a | | 2,141,712 |
| Dell | | 103,800 a | | 3,112,962 |
| Enterasys Networks | | 21 a,b | | 279 |
| International Business Machines | | 27,500 | | 2,260,500 |
| Common Stocks (continued) | | Shares | | Value ($) |
| |
| |
|
| Technology (continued) | | | | |
| Microchip Technology | | 65,200 | | 2,096,180 |
| Microsoft | | 225,500 | | 5,896,825 |
| Motorola | | 189,100 | | 4,271,769 |
| National Semiconductor | | 62,500 | | 1,623,750 |
| Qualcomm | | 56,100 | | 2,416,788 |
| Texas Instruments | | 75,600 | | 2,424,492 |
| Yahoo! | | 61,600 a | | 2,413,488 |
| | | | | 28,658,745 |
| Transportation—4.2% | | | | |
| Burlington Northern Santa Fe | | 71,200 | | 5,042,384 |
| Carnival | | 65,500 | | 3,502,285 |
| | | | | 8,544,669 |
| Utilities—4.6% | | | | |
| AT & T | | 111,900 | | 2,740,431 |
| PG & E | | 27,500 b | | 1,020,800 |
| Sempra Energy | | 38,600 | | 1,730,824 |
| Southern | | 66,200 | | 2,285,886 |
| Verizon Communications | | 53,900 | | 1,623,468 |
| | | | | 9,401,409 |
| Total Common Stocks | | | | |
| (cost $176,223,255) | | | | 201,357,483 |
| |
| |
|
| |
| Other Investment—1.1% | | | | |
| |
| |
|
| Registered Investment Company; | | | | |
| Dreyfus Institutional Preferred Plus | | | | |
| Money Market Fund | | | | |
| (cost $2,287,000) | | 2,287,000 c | | 2,287,000 |
STATEMENT OF INVESTMENTS (continued)
|
| Investment of Cash Collateral | | | | |
| for Securities Loaned—1.0% | | Shares | | Value ($) |
| |
| |
|
| Registered Investment Company; | | | | |
| Dreyfus Institutional Cash Advantage Fund | | | | |
| (cost $2,039,265) | | | | 2,039,265 c | | 2,039,265 |
| |
| |
| |
|
| |
| Total Investments (cost $180,549,520) | | 100.8% | | 205,683,748 |
| |
| Liabilities, Less Cash and Receivables | | (.8%) | | (1,540,433) |
| |
| Net Assets | | | | 100.0% | | 204,143,315 |
| |
| ADR—American Depository Receipts. | | | | |
| a | | Non-income producing. | | | | | | |
| b | | All or a portion of these securities are on loan. At December 31, 2005, the total market value of the portfolio’s |
| | | securities on loan is $2,477,232 and the total market value of the collateral held by the portfolio is $2,564,394, |
| | | consisting of cash collateral of $2,039,265 and U.S. Government and agency securities valued at $525,129. |
| c | | Investment in affiliated money market mutual fund. | | | | |
| |
| |
| |
|
| |
| |
| |
| |
| Portfolio Summary † | | | | | | |
| |
| | | | | Value (%) | | | | Value (%) |
| |
| |
| |
| |
|
| Financial Services | | 16.7 | | Transportation | | 4.2 |
| Technology | | 14.0 | | Consumer Non-Durables | | 3.7 |
| Health Care | | 13.5 | | Banking | | 3.5 |
| Energy | | 12.0 | | Money Market Investments | | 2.1 |
| Consumer Services | | 10.5 | | Other | | 7.6 |
| Capital Goods | | 8.4 | | | | |
| Utilities | | 4.6 | | | | 100.8 |
| |
| † | | Based on net assets. | | | | | | |
| See notes to financial statements. | | | | | | |
STATEMENT OF ASSETS AND LIABILITIES
December 31, 2005
| | | Cost | | Value |
| |
| |
|
| Assets ($): | | | | |
| Investments in securities—See Statement | | | | |
| of Investments (including securities on loan, | | |
| valued at $2,477,232)—Note 1(c): | | | | |
| Unaffiliated issuers | | 176,223,255 | | 201,357,483 |
| Affiliated issuers | | 4,326,265 | | 4,326,265 |
| Cash | | | | 7,328 |
| Receivable for investment securities sold | | | | 488,496 |
| Dividends receivable | | | | 275,037 |
| Receivable for shares of Beneficial Interest subscribed | | 3,731 |
| Prepaid expenses | | | | 3,303 |
| | | | | 206,461,643 |
| |
| |
|
| Liabilities ($): | | | | |
| Due to The Dreyfus Corporation and affiliates—Note 3(b) | | 144,737 |
| Liability for securities on loan—Note 1(c) | | | | 2,039,265 |
| Payable for shares of Beneficial Interest redeemed | | 78,780 |
| Accrued expenses | | | | 55,546 |
| | | | | 2,318,328 |
| |
| |
|
| Net Assets ($) | | | | 204,143,315 |
| |
| |
|
| Composition of Net Assets ($): | | | | |
| Paid-in capital | | | | 198,982,593 |
| Accumulated undistributed investment income—net | | 49,057 |
| Accumulated net realized gain | | | | |
| (loss) on investments | | | | (20,022,563) |
| Accumulated net unrealized appreciation | | | | |
| (depreciation) on investments | | | | 25,134,228 |
| |
| |
|
| Net Assets ($) | | | | 204,143,315 |
| |
| |
|
| |
| |
| Net Asset Value Per Share | | | | |
| | | Initial Shares | | Service Shares |
| |
| |
|
| Net Assets ($) | | 183,902,768 | | 20,240,547 |
| Shares Outstanding | | 8,427,288 | | 927,360 |
| |
| |
|
| Net Asset Value Per Share ($) | | 21.82 | | 21.83 |
See notes to financial statements.
|
STATEMENT OF OPERATIONS
Year Ended December 31, 2005
|
| Investment Income ($): | | |
| Income: | | |
| Cash dividends (net of $21,651 foreign taxes withheld at source): | | |
| Unaffiliated issuers | | 4,617,183 |
| Affiliated issuers | | 62,005 |
| Income from securities lending | | 6,026 |
| Total Income | | 4,685,214 |
| Expenses: | | |
| Investment advisory fee—Note 3(a) | | 1,642,047 |
| Distribution fees—Note 3(b) | | 53,457 |
| Prospectus and shareholders’ reports | | 45,163 |
| Professional fees | | 39,517 |
| Custodian fees—Note 3(b) | | 25,116 |
| Trustees’ fees and expenses—Note 3(c) | | 17,059 |
| Shareholder servicing costs—Note 3(b) | | 4,534 |
| Loan commitment fees—Note 2 | | 847 |
| Miscellaneous | | 8,228 |
| Total Expenses | | 1,835,968 |
| Less—waiver of fees due to undertaking—Note 3(a) | | (14,352) |
| Net Expenses | | 1,821,616 |
| Investment Income—Net | | 2,863,598 |
| |
|
| Realized and Unrealized Gain (Loss) on Investments—Note 4 ($): |
| Net realized gain (loss) on investments | | 19,846,942 |
| Net unrealized appreciation (depreciation) on investments | | (16,388,140) |
| Net Realized and Unrealized Gain (Loss) on Investments | | 3,458,802 |
| Net Increase in Net Assets Resulting from Operations | | 6,322,400 |
See notes to financial statements.
|
STATEMENT OF CHANGES IN NET ASSETS
| | | Year Ended December 31, |
| |
|
| | | 2005 | | 2004 |
| |
| |
|
| Operations ($): | | | | |
| Investment income—net | | 2,863,598 | | 2,984,747 |
| Net realized gain (loss) on investments | | 19,846,942 | | 9,935,047 |
| Net unrealized appreciation | | | | |
| (depreciation) on investments | | (16,388,140) | | 3,922,915 |
| Net Increase (Decrease) in Net Assets | | | | |
| Resulting from Operations | | 6,322,400 | | 16,842,709 |
| |
| |
|
| Dividends to Shareholders from ($): | | | | |
| Investment income—net: | | | | |
| Initial shares | | (2,613,010) | | (2,740,259) |
| Service shares | | (245,151) | | (220,109) |
| Total Dividends | | (2,858,161) | | (2,960,368) |
| |
| |
|
| Beneficial Interest Transactions ($): | | | | |
| Net proceeds from shares sold: | | | | |
| Initial shares | | 5,508,762 | | 9,133,233 |
| Service shares | | 684,376 | | 1,120,251 |
| Dividends reinvested: | | | | |
| Initial shares | | 2,613,010 | | 2,740,259 |
| Service shares | | 245,151 | | 220,109 |
| Cost of shares redeemed: | | | | |
| Initial shares | | (47,764,428) | | (47,893,005) |
| Service shares | | (4,528,127) | | (3,444,004) |
| Increase (Decrease) in Net Assets from | | | | |
| Beneficial Interest Transactions | | (43,241,256) | | (38,123,157) |
| Total Increase (Decrease) in Net Assets | | (39,777,017) | | (24,240,816) |
| |
| |
|
| Net Assets ($): | | | | |
| Beginning of Period | | 243,920,332 | | 268,161,148 |
| End of Period | | 204,143,315 | | 243,920,332 |
| Undistributed investment income—net | | 49,057 | | 43,620 |
STATEMENT OF CHANGES IN NET ASSETS (continued)
|
| | | Year Ended December 31, |
| |
|
| | | 2005 | | 2004 |
| |
| |
|
| Capital Share Transactions: | | | | |
| Initial Shares | | | | |
| Shares sold | | 261,996 | | 451,117 |
| Shares issued for dividends reinvested | | 123,642 | | 133,226 |
| Shares redeemed | | (2,260,103) | | (2,382,304) |
| Net Increase (Decrease) in Shares Outstanding | | (1,874,465) | | (1,797,961) |
| |
| |
|
| Service Shares | | | | |
| Shares sold | | 32,737 | | 55,328 |
| Shares issued for dividends reinvested | | 11,596 | | 10,725 |
| Shares redeemed | | (213,741) | | (169,880) |
| Net Increase (Decrease) in Shares Outstanding | | (169,408) | | (103,827) |
See notes to financial statements.
|
FINANCIAL HIGHLIGHTS
The following tables describe the performance for each share class for the fiscal periods indicated.All information (except portfolio turnover rate) reflects financial results for a single portfolio share. Total return shows how much your investment in the portfolio would have increased (or decreased) during each period, assuming you had reinvested all dividends and distributions.These figures have been derived from the portfolio’s financial statements.
| | | | | Year Ended December 31, | | |
| |
| |
| |
|
| Initial Shares | | 2005 | | 2004 | | 2003 | | 2002 | | 2001 |
| |
| |
| |
| |
| |
|
| Per Share Data ($): | | | | | | | | | | |
| Net asset value, beginning of period | | 21.40 | | 20.16 | | 16.06 | | 21.65 | | 23.48 |
| Investment Operations: | | | | | | | | | | |
| Investment income—net a | | .28 | | .24 | | .14 | | .11 | | .11 |
| Net realized and unrealized | | | | | | | | | | |
| gain (loss) on investments | | .43 | | 1.25 | | 4.11 | | (5.59) | | (1.49) |
| Total from Investment Operations | | .71 | | 1.49 | | 4.25 | | (5.48) | | (1.38) |
| Distributions: | | | | | | | | | | |
| Dividends from investment income—net | | (.29) | | (.25) | | (.15) | | (.11) | | (.11) |
| Dividends from net realized | | | | | | | | | | |
| gain on investments | | — | | — | | — | | — | | (.11) |
| Dividends in excess of net realized | | | | | | | | | | |
| gain on investments | | — | | — | | — | | — | | (.23) |
| Total Distributions | | (.29) | | (.25) | | (.15) | | (.11) | | (.45) |
| Net asset value, end of period | | 21.82 | | 21.40 | | 20.16 | | 16.06 | | 21.65 |
| |
| |
| |
| |
| |
|
| Total Return (%) | | 3.35 | | 7.47 | | 26.57 | | (25.33) | | (5.85) |
| |
| |
| |
| |
| |
|
| Ratios/Supplemental Data (%): | | | | | | | | | | |
| Ratio of total expenses | | | | | | | | | | |
| to average net assets | | .81 | | .82 | | .82 | | .80 | | .80 |
| Ratio of net expenses | | | | | | | | | | |
| to average net assets | | .81 | | .82 | | .82 | | .80 | | .80 |
| Ratio of net investment income | | | | | | | | | | |
| to average net assets | | 1.33 | | 1.21 | | .81 | | .58 | | .48 |
| Portfolio Turnover Rate | | 65.91 | | 52.74 | | 40.68 | | 34.61 | | 33.82 |
| |
| |
| |
| |
| |
|
| Net Assets, end of period ($ x 1,000) | | 183,903 | | 220,447 | | 243,973 | | 226,548 | | 385,569 |
| | a Based on average shares outstanding at each month end.
See notes to financial statements.
|
FINANCIAL HIGHLIGHTS (continued)
|
| | | | | Year Ended December 31, | | |
| |
| |
| |
|
| Service Shares | | 2005 | | 2004 | | 2003 | | 2002 | | 2001 |
| |
| |
| |
| |
| |
|
| Per Share Data ($): | | | | | | | | | | |
| Net asset value, beginning of period | | 21.40 | | 20.15 | | 16.03 | | 21.61 | | 23.48 |
| Investment Operations: | | | | | | | | | | |
| Investment income—net | | .24a | | .21a | | .11a | | .08a | | .06 |
| Net realized and unrealized | | | | | | | | | | |
| gain (loss) on investments | | .44 | | 1.24 | | 4.10 | | (5.58) | | (1.51) |
| Total from Investment Operations | | .68 | | 1.45 | | 4.21 | | (5.50) | | (1.45) |
| Distributions: | | | | | | | | | | |
| Dividends from investment income—net | | (.25) | | (.20) | | (.09) | | (.08) | | (.08) |
| Dividends from net realized | | | | | | | | | | |
| gain on investments | | — | | — | | — | | — | | (.11) |
| Dividends in excess of net realized | | | | | | | | | | |
| gain on investments | | — | | — | | — | | — | | (.23) |
| Total Distributions | | (.25) | | (.20) | | (.09) | | (.08) | | (.42) |
| Net asset value, end of period | | 21.83 | | 21.40 | | 20.15 | | 16.03 | | 21.61 |
| |
| |
| |
| |
| |
|
| Total Return (%) | | 3.21 | | 7.22 | | 26.36 | | (25.46) | | (6.14) |
| |
| |
| |
| |
| |
|
| Ratios/Supplemental Data (%): | | | | | | | | | | |
| Ratio of total expenses | | | | | | | | | | |
| to average net assets | | 1.07 | | 1.07 | | 1.07 | | 1.03 | | 1.12 |
| Ratio of net expenses | | | | | | | | | | |
| to average net assets | | 1.00 | | 1.00 | | 1.01 | | .98 | | 1.01 |
| Ratio of net investment income | | | | | | | | | | |
| to average net assets | | 1.14 | | 1.05 | | .63 | | .43 | | .28 |
| Portfolio Turnover Rate | | 65.91 | | 52.74 | | 40.68 | | 34.61 | | 33.82 |
| |
| |
| |
| |
| |
|
| Net Assets, end of period ($ x 1,000) | | 20,241 | | 23,473 | | 24,188 | | 20,388 | | 16,185 |
| |
| a Based on average shares outstanding at each month end. | | | | | | | | |
| See notes to financial statements. | | | | | | | | | | |
NOTES TO FINANCIAL STATEMENTS
NOTE 1—Significant Accounting Policies:
Dreyfus Variable Investment Fund (the “fund”) is registered under the Investment Company Act of 1940, as amended (the “Act”), as an open-end management investment company, operating as a series company currently offering twelve series, including the Growth and Income Portfolio (the “portfolio”). The portfolio is only offered to separate accounts established by insurance companies to fund variable annuity contracts and variable life insurance policies. The portfolio is a non-diversified series. The portfolio’s investment objective is to provide long-term capital growth, current income and growth of income, consistent with reasonable investment risk.The Dreyfus Corporation (the “Manager” or “Dreyfus”) serves as the portfolio’s investment adviser. The Manager is a wholly-owned subsidiary of Mellon Financial Corporation (“Mellon Financial”).
Dreyfus Service Corporation (the “Distributor”), a wholly-owned subsidiary of the Manager, is the distributor of the portfolio’s shares, which are sold without a sales charge.The portfolio is authorized to issue an unlimited number of $.001 par value shares of Beneficial Interest in each of the following classes of shares: Initial and Service. Each class of shares has identical rights and privileges, except with respect to the distribution plan and the expenses borne by each class and certain voting rights. Income, expenses (other than expenses attributable to a specific class), and realized and unrealized gains or losses on investments are allocated to each class of shares based on its relative net assets.
The fund accounts separately for the assets, liabilities and operations of each series. Expenses directly attributable to each series are charged to that series’ operations; expenses which are applicable to all series are allocated among them on a pro rata basis.
The portfolio’s financial statements are prepared in accordance with U.S. generally accepted accounting principles, which may require the use of management estimates and assumptions.Actual results could differ from those estimates.
NOTES TO FINANCIAL STATEMENTS (continued)
|
The fund enters into contracts that contain a variety of indemnifica-tions.The portfolio’s maximum exposure under these arrangements is unknown. The portfolio does not anticipate recognizing any loss related to these arrangements.
(a) Portfolio valuation: Investments in securities are valued at the last sales price on the securities exchange or national securities market on which such securities are primarily traded. Securities listed on the National Market System for which market quotations are available are valued at the official closing price or, if there is no official closing price that day, at the last sale price. Securities not listed on an exchange or the national securities market, or securities for which there were no transactions, are valued at the average of the most recent bid and asked prices, except for open short positions, where the asked price is used for valuation purposes. Bid price is used when no asked price is available. Investments in registered investment companies are valued at their net asset value.When market quotations or official closing prices are not readily available, or are determined not to reflect accurately fair value, such as when the value of a security has been significantly affected by events after the close of the exchange or market on which the security is principally traded (for example, a foreign exchange or market), but before the portfolio calculates its net asset value, the portfolio may value these investments at fair value as determined in accordance with the procedures approved by the Board of Trustees. Fair valuing of securities may be determined with the assistance of a pricing service using calculations based on indices of domestic securities and other appropriate indicators, such as prices of relevant ADR’s and futures contracts. For other securities that are fair valued by the Board of Trustees, certain factors may be considered such as: fundamental analytical data, the nature and duration of restrictions on disposition, an evaluation of the forces that influence the market in which the securities are purchased and sold, and public trading in similar securities of the issuer or comparable issuers. Financial futures are valued at the last sales price. Investments denominated in foreign currencies are translated to U.S. dollars at the prevailing rates of exchange. Forward currency exchange contracts are valued at the forward rate.
(b) Foreign currency transactions: The portfolio does not isolate that portion of the results of operations resulting from changes in foreign exchange rates on investments from the fluctuations arising from changes in the market prices of securities held. Such fluctuations are included with the net realized and unrealized gain or loss on investments.
Net realized foreign exchange gains or losses arise from sales and maturities of short-term securities, sales of foreign currencies, currency gains or losses realized on securities transactions and the difference between the amounts of dividends, interest and foreign withholding taxes recorded on the portfolios’ books and the U.S. dollar equivalent of the amounts actually received or paid. Net unrealized foreign exchange gains and losses arise from changes in the value of assets and liabilities other than investments in securities, resulting from changes in exchange rates. Such gains and losses are included with net realized and unrealized gain or loss on investments.
(c) Securities transactions and investment income: Securities transactions are recorded on a trade date basis. Realized gain and loss from securities transactions are recorded on the identified cost basis. Dividend income is recognized on the ex-dividend date and interest income, including, where applicable, accretion of discount and amortization of premium on investments, is recognized on the accrual basis.
The portfolio has an arrangement with the custodian bank whereby the portfolio receives earnings credits from the custodian when positive cash balances are maintained which are used to offset custody fees. For financial reporting purposes, the portfolio includes net earnings credits, if any, as an expense offset in the Statement of Operations.
Pursuant to a securities lending agreement with Mellon Bank, N.A., an affiliate of the Manager, the portfolio may lend securities to qualified institutions.At origination, all loans are secured by collateral of at least 102% of the value of U.S. securities loaned and 105% of the value of foreign securities loaned. Collateral equivalent to at least 100% of the market value of securities on loan will be maintained at all times. Cash collateral is invested in certain money market mutual funds man-
NOTES TO FINANCIAL STATEMENTS (continued)
|
aged by the Manager. The portfolio will be entitled to receive all income on securities loaned, in addition to income earned as a result of the lending transaction. Although each security loaned is fully collateralized, the portfolio would bear the risk of delay in recovery of, or loss of rights in, the securities loaned should a borrower fail to return the securities in a timely manner.
(d) Affiliated issuers: Investments in other investment companies advised by the Manager are defined as “affiliated” in the Act.
(e) Dividends to shareholders: Dividends are recorded on the ex-dividend date.The portfolio declares and pays dividends from investment income-net on a quarterly basis. Dividends from net realized capital gain, if any, are normally declared and paid annually, but the portfolio may make distributions on a more frequent basis to comply with the distribution requirements of the Internal Revenue Code of 1986, as amended (the “Code”).To the extent that net realized capital gain can be offset by capital loss carryovers, it is the policy of the portfolio not to distribute such gain. Income and capital gain distributions are determined in accordance with income tax regulations, which may differ from U.S. generally accepted accounting principles.
(f) Federal income taxes: It is the policy of the portfolio to continue to qualify as a regulated investment company, if such qualification is in the best interests of its shareholders, by complying with the applicable provisions of the Code and to make distributions of taxable income sufficient to relieve it from substantially all federal income and excise taxes.
At December 31, 2005, the components of accumulated earnings on a tax basis were as follows: undistributed ordinary income $49,057, accumulated capital losses $19,953,795 and unrealized appreciation $25,065,460.
The accumulated capital loss carryover is available to be applied against future net securities profits, if any, realized subsequent to December 31, 2005. If not applied, $5,702,414 of the carryover expires in fiscal 2010 and $14,251,381 expires in fiscal 2011.
The tax character of distributions paid to shareholders during the fiscal periods ended December 31, 2005 and December 31, 2004, were as follows: ordinary income $2,858,161 and $2,960,368, respectively.
NOTE 2—Bank Line of Credit:
The portfolio participates with other Dreyfus-managed funds in a $350 million redemption credit facility (the “Facility”) to be utilized for temporary or emergency purposes, including the financing of redemptions. In connection therewith, the portfolio has agreed to pay commitment fees on its pro rata portion of the Facility. Interest is charged to the portfolio based on prevailing market rates in effect at the time of borrowing. During the period ended December 31, 2005, the portfolio did not borrow under the Facility.
NOTE 3—Investment Advisory Fee and Other Transactions With Affiliates:
(a) Pursuant to an Investment Advisory Agreement with the Manager, the investment advisory fee is computed at the annual rate of .75% of the value of the portfolios’ average daily net assets and is payable monthly.
The Manager has agreed, from January 1, 2005 to December 31, 2006 to waive receipt of its fees and/or assume the expenses of the portfolio so that the expenses of neither class, exclusive of taxes, brokerage fees, interest on borrowings, commitment fees and extraordinary expenses, exceed 1% of the value of the average daily net assets of their class. During the period ended December 31, 2005, the Manager waived receipt of fees of $14,352, pursuant to the undertaking.
(b) Under the Distribution Plan (the “Plan”) adopted pursuant to Rule 12b-1 under the Act, Service shares pay the Distributor for distributing their shares, for servicing and/or maintaining Service shares shareholder accounts and for advertising and marketing for Service shares.The Plan provides for payments to be made at an annual rate of .25% of the value of the Service shares’ average daily net assets. The Distributor may make payments to Participating Insurance Companies
NOTES TO FINANCIAL STATEMENTS (continued)
|
and to brokers and dealers acting as principal underwriter for their variable insurance products. The fees payable under the Plan are payable without regard to actual expenses incurred. During the period ended December 31, 2005, Service shares were charged $53,457 pursuant to the Plan.
The portfolio compensates Dreyfus Transfer, Inc., a wholly-owned subsidiary of the Manager, under a transfer agency agreement for providing personnel and facilities to perform transfer agency services for the portfolio. During the period ended December 31, 2005, the portfolio was charged $431 pursuant to the transfer agency agreement.
The portfolio compensates Mellon Bank, N.A., an affiliate of the Manager, under a custody agreement for providing custodial services for the portfolio. During the period ended December 31, 2005, the portfolio was charged $25,116 pursuant to the custody agreement.
During the period ended December 31, 2005, the portfolio was charged $3,762 for services performed by the Chief Compliance Officer.
The components of Due to The Dreyfus Corporation and affiliates in the Statement of Assets and Liabilities consist of: investment advisory fees $132,486, chief compliance officer fees $1,858, Rule 12b-1 distribution plan fees $4,366, custodian fees $6,601 and transfer agency per account fees $69, which are offset against an expense reimbursement currently in effect in the amount of $643.
(c) Each Board member also serves as a Board member of other funds within the Dreyfus complex. Annual retainer fees and attendance fees are allocated to each fund based on net assets.
(d) Pursuant to an exemptive order from the Securities and Exchange Commission, the portfolio may invest its available cash balances in affiliated money market mutual funds. Management fees of the underlying money market mutual funds have been waived by the Manager.
NOTE 4—Securities Transactions:
The aggregate amount of purchases and sales of investment securities, excluding short-term securities, during the period ended December 31, 2005, amounted to $142,734,863 and $184,788,623, respectively.
At December 31, 2005, the cost of investments for federal income tax purposes was $180,618,288; accordingly, accumulated net unrealized appreciation on investments was $25,065,460 consisting of $28,091,036 gross unrealized appreciation and $3,025,576 gross unrealized depreciation.
REPORT OF INDEPENDENT REGISTERED PUBLIC ACCOUNTING FIRM
| Shareholders and Board of Trustees |
| Dreyfus Variable Investment Fund, Growth and Income Portfolio |
We have audited the accompanying statement of assets and liabilities, including the statement of investments, of Dreyfus Variable Investment Fund, Growth and Income Portfolio (one of the funds comprising Dreyfus Variable Investment Fund) as of December 31, 2005 and the related statement of operations for the year then ended, the statement of changes in net assets for each of the two years in the period then ended, and financial highlights for each of the years indicated therein. These financial statements and financial highlights are the responsibility of the Fund’s management. Our responsibility is to express an opinion on these financial statements and financial highlights based on our audits.
We conducted our audits in accordance with the standards of the Public Company Accounting Oversight Board (United States). Those standards require that we plan and perform the audit to obtain reasonable assurance about whether the financial statements and financial highlights are free of material misstatement. We were not engaged to perform an audit of the Fund’s internal control over financial reporting. Our audits included consideration of internal control over financial reporting as a basis for designing audit procedures that are appropriate in the circumstances, but not for the purpose of expressing an opinion on the effectiveness of the Fund’s internal control over financial reporting. Accordingly, we express no such opinion. An audit also includes examining, on a test basis, evidence supporting the amounts and disclosures in the financial statements and financial highlights, assessing the accounting principles used and significant estimates made by management, and evaluating the overall financial statement presentation. Our procedures included verification by examination of securities held by the custodian as of December 31, 2005 and confirmation of securities not held by the custodian by correspondence with others. We believe that our audits provide a reasonable basis for our opinion.
In our opinion, the financial statements and financial highlights referred to above present fairly, in all material respects, the financial position of Dreyfus Variable Investment Fund, Growth and Income Portfolio at December 31, 2005, the results of its operations for the year then ended, the changes in its net assets for each of the two years in the period then ended, and the financial highlights for each of the indicated years, in conformity with U.S. generally accepted accounting principles.
New York, New York
February 6, 2006
|
IMPORTANT TAX INFORMATION (Unaudited)
For federal tax purposes, the portfolio designates 100% of the ordinary dividends paid during the fiscal year ended December 31, 2005 as qualifying for the corporate dividends received deduction. Shareholders will receive notification in January 2006 of the percentage applicable to the preparation of their 2005 income tax returns.
| BOARD MEMBERS INFORMATION (Unaudited) |
| |
| |
| |
| Joseph S. DiMartino (62) |
| Chairman of the Board (1995) |
| Principal Occupation During Past 5 Years: |
| • Corporate Director and Trustee |
| Other Board Memberships and Affiliations: |
| • The Muscular Dystrophy Association, Director |
| • Levcor International, Inc., an apparel fabric processor, Director |
| • Century Business Services, Inc., a provider of outsourcing functions for small and medium size |
| companies, Director |
| • The Newark Group, a provider of a national market of paper recovery facilities, paperboard |
| mills and paperboard converting plants, Director |
| • Sunair Services Corporation, engages in the design, manufacture and sale of high frequency |
| systems for long-range voice and data communications, as well as providing certain outdoor- |
| related services to homes and businesses, Director |
| No. of Portfolios for which Board Member Serves: 193 |
| ——————— |
| David P. Feldman (66) |
| Board Member (1994) |
| Principal Occupation During Past 5 Years: |
| • Corporate Director and Trustee |
| Other Board Memberships and Affiliations: |
| • BBH Mutual Funds Group (11 funds), Director |
| • The Jeffrey Company, a private investment company, Director |
| • QMED, a medical device company, Director |
| No. of Portfolios for which Board Member Serves: 58 |
| ——————— |
| James F. Henry (74) |
| Board Member (1991) |
| Principal Occupation During Past 5 Years: |
| • President, CPR Institute for Dispute Resolution, a non-profit organization principally |
| engaged in the development of alternatives to business litigation (Retired 2003) |
| No. of Portfolios for which Board Member Serves: 22 |
28
| Dr. Paul A. Marks (79) |
| Board Member (1990) |
| Principal Occupation During Past 5 Years: |
| • President, Emeritus (2000-present) and President and Chief Executive Officer of Memorial |
| Sloan-Kettering Cancer Center (Retired 1999) |
| Other Board Memberships and Affiliations: |
| • Pfizer, Inc., a pharmaceutical company, Director-Emeritus |
| • Lazard Freres & Company, LLC, Senior Adviser |
| • Carrot Capital Health Care Ventures; Advisor |
| • Armgo-Start-Up Biotech; Board of Directors |
| • Nanoviricide, Board Director |
| • PTC, Scientific Advisory Board |
| No. of Portfolios for which Board Member Serves: 22 |
| ——————— |
| Dr. Martin Peretz (66) |
| Board Member (1990) |
| Principal Occupation During Past 5 Years: |
| • Editor-in-Chief of The New Republic Magazine |
| • Lecturer in Social Studies at Harvard University (1965-2001) |
| • Co-Chairman of TheStreet.com, a financial daily on the web |
| Other Board Memberships and Affiliations: |
| • Academy for Liberal Education, an accrediting agency for colleges and universities certified by |
| the U.S. Department of Education, Director |
| • Harvard Center for Blood Research,Trustee |
| • Bard College,Trustee |
| • Board of Overseers of YIVO Institute for Jewish Research, Chairman |
| No. of Portfolios for which Board Member Serves: 22 |
| ——————— |
| Once elected all Board Members serve for an indefinite term.The address of the Board Members and Officers is in c/o |
| The Dreyfus Corporation, 200 Park Avenue, New York, New York 10166. Additional information about the Board |
| Members is available in the fund’s Statement of Additional Information which can be obtained from Dreyfus free of |
| charge by calling this toll free number: 1-800-554-4611. |
| John M. Fraser, Jr., Emeritus Board Member |
| Rosalind Gersten Jacobs, Emeritus Board Member |
The Portfolio 29
OFFICERS OF THE FUND (Unaudited)
STEPHEN E. CANTER, President since March 2000.
Chairman of the Board, Chief Executive Officer and Chief Operating Officer of the Manager, and an officer of 90 investment companies (comprised of 184 portfolios) managed by the Manager. Mr. Canter also is a Board member and, where applicable, an Executive Committee Member of the other investment management subsidiaries of Mellon Financial Corporation, each of which is an affiliate of the Manager. He is 60 years old and has been an employee of the Manager since May 1995.
STEPHEN R. BYERS, Executive Vice President since November 2002.
Chief Investment Officer,Vice Chairman and a director of the Manager, and an officer of 90 investment companies (comprised of 184 portfolios) managed by the Manager. Mr. Byers also is an officer, director or an Executive Committee Member of certain other investment management subsidiaries of Mellon Financial Corporation, each of which is an affiliate of the Manager. He is 52 years old and has been an employee of the Manager since January 2000.
MARK N. JACOBS, Vice President since March 2000.
Executive Vice President, Secretary and General Counsel of the Manager, and an officer of 91 investment companies (comprised of 200 portfolios) managed by the Manager. He is 59 years old and has been an employee of the Manager since June 1977.
MICHAEL A. ROSENBERG, Vice President and Secretary since August 2005.
Associate General Counsel of the Manager, and an officer of 91 investment companies (comprised of 200 portfolios) managed by the Manager. He is 45 years old and has been an employee of the Manager since October 1991.
JAMES BITETTO, Vice President and Assistant Secretary since August 2005.
Assistant General Counsel and Assistant Secretary of the Manager, and an officer of 91 investment companies (comprised of 200 portfolios) managed by the Manager. He is 39 years old and has been an employee of the Manager since December 1996.
JONI LACKS CHARATAN, Vice President and Assistant Secretary since August 2005.
Associate General Counsel of the Manager, and an officer of 91 investment companies (comprised of 200 portfolios) managed by the Manager. She is 50 years old and has been an employee of the Manager since October 1988.
JOSEPH M. CHIOFFI, Vice President and Assistant Secretary since August 2005.
Assistant General Counsel of the Manager, and an officer of 91 investment companies (comprised of 200 portfolios) managed by the Manager. He is 44 years old and has been an employee of the Manager since June 2000.
JANETTE E. FARRAGHER, Vice President and Assistant Secretary since August 2005.
Associate General Counsel of the Manager, and an officer of 91 investment companies (comprised of 200 portfolios) managed by the Manager. She is 42 years old and has been an employee of the Manager since February 1984.
JOHN B. HAMMALIAN, Vice President and Assistant Secretary since August 2005.
Associate General Counsel of the Manager, and an officer of 91 investment companies (comprised of 200 portfolios) managed by the Manager. He is 42 years old and has been an employee of the Manager since February 1991.
ROBERT R. MULLERY, Vice President and Assistant Secretary since August 2005.
Associate General Counsel of the Manager, and an officer of 91 investment companies (comprised of 200 portfolios) managed by the Manager. He is 53 years old and has been an employee of the Manager since May 1986.
JEFF PRUSNOFSKY, Vice President and Assistant Secretary since August 2005.
Associate General Counsel of the Manager, and an officer of 91 investment companies (comprised of 200 portfolios) managed by the Manager. He is 40 years old and has been an employee of the Manager since October 1990.
JAMES WINDELS, Treasurer since November 2001.
Director – Mutual Fund Accounting of the Manager, and an officer of 91 investment companies (comprised of 200 portfolios) managed by the Manager. He is 47 years old and has been an employee of the Manager since April 1985.
ERIK D. NAVILOFF, Assistant Treasurer since December 2002.
Senior Accounting Manager – Taxable Fixed Income Funds of the Manager, and an officer of 91 investment companies (comprised of 200 portfolios) managed by the Manager. He is 37 years old and has been an employee of the Manager since November 1992.
ROBERT ROBOL, Assistant Treasurer since August 2003.
Senior Accounting Manager – Money Market and Municipal Bond Funds of the Manager, and an officer of 91 investment companies (comprised of 200 portfolios) managed by the Manager. He is 41 years old and has been an employee of the Manager since October 1988.
ROBERT SVAGNA, Assistant Treasurer since December 2002.
Senior Accounting Manager – Equity Funds of the Manager, and an officer of 91 investment companies (comprised of 200 portfolios) managed by the Manager. He is 38 years old and has been an employee of the Manager since November 1990.
GAVIN C. REILLY, Assistant Treasurer since December 2005.
Tax Manager of the Investment Accounting and Support Department of the Manager, and an officer of 91 investment companies (comprised of 200 portfolios) managed by the Manager. He is 37 years old and has been an employee of the Manager since April 1991.
JOSEPH W. CONNOLLY, Chief Compliance Officer since October 2004.
Chief Compliance Officer of the Manager and The Dreyfus Family of Funds (91 investment companies, comprised of 200 portfolios). From November 2001 through March 2004, Mr. Connolly was first Vice-President, Mutual Fund Servicing for Mellon Global Securities Services. In that capacity, Mr. Connolly was responsible for managing Mellon’s Custody, Fund Accounting and Fund Administration services to third-party mutual fund clients. He is 48 years old and has served in various capacities with the Manager since 1980, including manager of the firm’s Fund Accounting Department from 1997 through October 2001.
WILLIAM GERMENIS, Anti-Money Laundering Compliance Officer since September 2002.
Vice President and Anti-Money Laundering Compliance Officer of the Distributor, and the Anti-Money Laundering Compliance Officer of 87 investment companies (comprised of 196 portfolios) managed by the Manager. He is 35 years old and has been an employee of the Distributor since October 1998.
NOTES
| For More | | Information |
| |
|
| |
| Dreyfus Variable | | Transfer Agent & |
| Investment Fund, | | Dividend Disbursing Agent |
| Growth and Income Portfolio |
| | | Dreyfus Transfer, Inc. |
| 200 Park Avenue | | |
| | | 200 Park Avenue |
| New York, NY 10166 | | |
| | | New York, NY 10166 |
| |
| Investment Adviser | | Distributor |
| The Dreyfus Corporation | | |
| | | Dreyfus Service Corporation |
| 200 Park Avenue | | |
| | | 200 Park Avenue |
| New York, NY 10166 | | |
| | | New York, NY 10166 |
| Custodian | | |
| Mellon Bank, N.A. | | |
| One Mellon Bank Center | | |
| Pittsburgh, PA 15258 | | |
Telephone 1-800-554-4611 or 516-338-3300
Mail The Dreyfus Family of Funds, 144 Glenn Curtiss Boulevard, Uniondale, NY 11556-0144 Attn: Institutional Servicing
The portfolio files its complete schedule of portfolio holdings with the Securities and Exchange Commission (“SEC”) for the first and third quarters of each fiscal year on Form N-Q. The portfolio’s Forms N-Q are available on the SEC’s website at http://www.sec.gov and may be reviewed and copied at the SEC’s Public Reference Room in Washington, DC. Information on the operation of the Public Reference Room may be obtained by calling 1-800-SEC-0330.
A description of the policies and procedures that the portfolio uses to determine how to vote proxies relating to portfolio securities, and information regarding how the portfolio voted these proxies for the 12-month period ended June 30, 2005, is available at http://www.dreyfus.com and on the SEC’s website at http://www.sec.gov. The description of the policies and procedures is also available without charge, upon request, by calling 1-800-645-6561.

The views expressed in this report reflect those of the portfolio manager only through the end of the period covered and do not necessarily represent the views of Dreyfus or any other person in the Dreyfus organization.Any such views are subject to change at any time based upon market or other conditions and Dreyfus disclaims any responsibility to update such views. These views may not be relied on as investment advice and, because investment decisions for a Dreyfus portfolio are based on numerous factors, may not be relied on as an indication of trading intent on behalf of any Dreyfus portfolio.
Not FDIC-Insured • Not Bank-Guaranteed • May Lose Value
| | | Contents |
| |
| | | T H E P O R T F O L I O |
| |
|
| 2 | | Letter from the Chairman |
| 3 | | Discussion of Performance |
| 6 | | Portfolio Performance |
| 8 | | Understanding Your Portfolio’s Expenses |
| 8 | | Comparing Your Portfolio’s Expenses |
| | | With Those of Other Funds |
| 9 | | Statement of Investments |
| 14 | | Statement of Assets and Liabilities |
| 15 | | Statement of Operations |
| 16 | | Statement of Changes in Net Assets |
| 18 | | Financial Highlights |
| 20 | | Notes to Financial Statements |
| 27 | | Report of Independent Registered |
| | | Public Accounting Firm |
| 28 | | Important Tax Information |
| 29 | | Board Members Information |
| 31 | | Officers of the Fund |
| | | F O R M O R E I N F O R M AT I O N |
| |
|
| | | Back Cover |
| Dreyfus Variable Investment Fund, |
| International Equity Portfolio |

LETTER FROM THE CHAIRMAN
We are pleased to present this annual report for Dreyfus Variable Investment Fund, International Equity Portfolio, covering the 12-month period from January 1, 2005, through December 31, 2005. Inside, you’ll find valuable information about how the portfolio was managed during the reporting period, including a discussion with the portfolio manager, Paul Butler of Newton Capital Management Limited, the portfolio’s sub-investment adviser.
International stocks generally produced higher returns than their U.S. counterparts in 2005. Low interest rates and corporate restructuring in Europe and Japan helped buoy stock prices in the developed markets, and rising global demand for natural resources supported returns in the emerging markets. However, a strengthening U.S. dollar relative to most major foreign currencies eroded some of these gains for U.S. investors.
We expect the global economy to continue its expansion in 2006. Low real interest rates in Asia should support regional growth, while Japan appears to be emerging from its long recession. Europe seems poised for better economic times after several years of sluggish growth, and emerging markets in Eastern Europe and Latin America may continue to benefit from greater fiscal stability. Risks in the new year include the possibility of a slowdown in China, where a robust economy has fueled demand for exports from other nations.
As always, we encourage you to speak with your financial consultant about how these and other market forces may affect your investments. Thank you for your continued confidence and support.

DISCUSSION OF PERFORMANCE
Paul Butler, Portfolio Manager
Newton Capital Management Limited, Sub-Investment Adviser
How did Dreyfus Variable Investment Fund, International Equity Portfolio perform relative to its benchmark?
For the 12-month period ended December 31, 2005, the portfolio produced total returns of 14.75% for its Initial shares and 14.45% for its Service shares.1 This compares with a 13.54% total return produced by the portfolio’s benchmark, the Morgan Stanley Capital International Europe, Australasia, Far East Index (“MSCI EAFE Index”), for the same period.2
Although 2005 was a volatile year for international stocks, most major markets ended the year with healthy gains. Japan, Latin America and much of Asia benefited from a growing global economy, while the effects of a sluggish economy in Europe were offset by investors’ positive reactions to corporate restructuring.The portfolio outperformed its benchmark, primarily due to good stock selection.
What is the portfolio’s investment approach?
The portfolio seeks capital growth. To pursue its goal, the portfolio primarily invests in growth stocks of foreign companies. Normally, the portfolio invests at least 80% of its assets in stocks, including common stocks, preferred stocks and convertible securities, including those purchased in initial public offerings.
In choosing stocks, we consider: key trends in global economic variables, such as gross domestic product, inflation and interest rates; investment themes, such as the impact of new technologies and the globalization of industries and brands; relative values of equity securities, bonds and cash; and long-term trends in currency movements.
Within the markets and sectors determined to be relatively attractive, we seek what we believe to be attractively priced companies that possess a sustainable competitive advantage in their market or sector.We generally will sell securities when themes or strategies change, or
The Portfolio 3
DISCUSSION OF PERFORMANCE (continued)
|
when we determine that the company’s prospects have changed, or that its stock is fully valued by the market.
What other factors influenced the portfolio’s performance?
Our bottom-up investment process led us to maintain relatively light exposure to companies that are highly leveraged to the U.S. dollar, including businesses based in countries, such as Malaysia, whose currencies are pegged to the dollar, as well as companies that derive much of their revenues in dollars. Instead, we favored domestic businesses with relatively little exposure to the strengthening U.S.dollar in 2005,enabling them to avoid the eroding effects of fluctuating currency exchange rates.
Among locally oriented companies, we focused on those producing high levels of free cash flow, including tobacco producers in Asia, where consumption is growing. Korea Tobacco boosted its results by satisfying higher-end consumers’ desire for premium brands. HM Sampoerna in Indonesia was acquired by U.S. food and tobacco giant Altria Group in 2005. Japan Tobacco rose in anticipation of the possible repeal of double taxation of dividends in Japan.
We found a number of stocks meeting our criteria in Latin America. Countries in the region, particularly Brazil, have instilled greater investor confidence by adopting fiscal policies that promote stability and fight inflation. These reforms helped support the stock prices of Brazilian oil company Petrobras, which enjoyed higher commodity prices, and beauty products retailer Natura Cosmeticos, whose door-to-door sales model proved popular among consumers with disposable income. In addition, Brazilian railroad company Americana Latina Logistica benefited from a growing need to transport agricultural products in a nation with an undeveloped highway system.
In Europe, we focused on companies that we believed might benefit if economic performance exceeded expectations, such as German financial planner MLP and real estate firm Deutsche Wohnen.We also maintained the portfolio’s exposure to French oil producer Total. Evidence that the long economic and market slumps in Japan may be ending prompted us to increase the portfolio’s holdings of automobile companies, such as Honda Motor and Toyota Motor, which appear
poised to capture a larger share of the U.S. market. We also have increased holdings in Japanese financial companies, including Mitsubishi UFJ Financial Group, Matsui Securities and Nikko Cordial.
Gains in these areas were offset to a degree by disappointments in others. The portfolio’s telecommunications holdings were hurt by company-specific problems affecting service providers in Brazil, Korea and Taiwan. Utilities also fared relatively poorly, largely due to concerns regarding the potential impact of changing interest rates on profit margins. We reduced the portfolio’s allocation to both sectors during the second half of the year.
What is the portfolio’s current strategy?
We have maintained our bottom-up investment process, which we believe has remained effective. This approach enables us to forego sector or regional allocation targets, allowing us instead to focus on finding what we believe to be the most attractive stocks in the world.
| | | Investing in foreign companies involves special risks, including changes in currency rates, |
| | | political, economic and social instability, a lack of comprehensive company information, |
| | | differing auditing and legal standards and less market liquidity. An investment in this fund |
| | | should be considered only as a supplement to an overall investment program. |
| | | The portfolio is only available as a funding vehicle under variable life insurance policies or variable |
| | | annuity contracts issued by insurance companies. Individuals may not purchase shares of the |
| | | portfolio directly.A variable annuity is an insurance contract issued by an insurance company that |
| | | enables investors to accumulate assets on a tax-deferred basis for retirement or other long-term goals. |
| | | The investment objective and policies of Dreyfus Variable Investment Fund, International Equity |
| | | Portfolio made available through insurance products may be similar to other funds/portfolios |
| | | managed or advised by Dreyfus. However, the investment results of the portfolio may be higher or |
| | | lower than, and may not be comparable to, those of any other Dreyfus fund/portfolio. |
| 1 | | Total return includes reinvestment of dividends and any capital gains paid. Past performance is no |
| | | guarantee of future results. Share price and investment return fluctuate such that upon redemption, |
| | | portfolio shares may be worth more or less than their original cost.The portfolio’s performance does |
| | | not reflect the deduction of additional charges and expenses imposed in connection with investing |
| | | in variable insurance contracts, which will reduce returns. |
| | | Part of the portfolio’s recent performance is attributable to positive returns from its initial public |
| | | offering (IPO) investments.There can be no guarantee that IPOs will have or continue to have |
| | | a positive effect on the portfolio’s performance. Currently, the portfolio is relatively small in |
| | | asset size. IPOs tend to have a reduced effect on performance as a portfolio’s asset base grows. |
| 2 | | SOURCE: LIPPER INC. — Reflects reinvestment of net dividends and, where applicable, |
| | | capital gain distributions.The Morgan Stanley Capital International Europe, Australasia, Far |
| | | East (MSCI EAFE) Index is an unmanaged index composed of a sample of companies |
| | | representative of the market structure of European and Pacific Basin countries. |
| | | The Portfolio 5 |

| Average Annual Total Returns as of | | 12/31/05 | | | | |
| |
| | | 1 Year | | 5 Years | | 10 Years |
| |
| |
| |
|
| Initial shares | | 14.75% | | 3.99% | | 7.58% |
| Service shares | | 14.45% | | 3.71% | | 7.43% |
| |
| The data for Service shares includes the results of Initial shares for the period prior to December 31, 2000 |
| (inception date of Service shares). Actual Service shares’ average annual total return and hypothetical growth |
| results would have been lower. See notes below. | | | | | | |
| † Source: Lipper Inc. | | | | | | |
| Past performance is not predictive of future performance.The portfolio’s performance shown in the graph and table does not |
| reflect the deduction of taxes that a shareholder would pay on portfolio distributions or the redemption of portfolio shares. |
| Part of the portfolio’s recent performance is attributable to positive returns from its initial public offering (IPO) |
| investments.There can be no guarantee that IPOs will have or continue to have a positive effect on the portfolio’s |
| performance. Currently, the portfolio is relatively small in asset size. IPOs tend to have a reduced effect on performance |
| as a portfolio’s asset base grows. | | | | | | |
| |
| 6 | | | | | | |
The portfolio’s performance does not reflect the deduction of additional charges and expenses imposed in connection with investing in variable insurance contracts which will reduce returns.
The above graph compares a $10,000 investment made in Initial and Service shares of Dreyfus Variable Investment Fund, International Equity Portfolio on 12/31/95 to a $10,000 investment made in the Morgan Stanley Capital International Europe, Australasia, Far East Index (the “Index”) on that date.
The portfolio’s Initial shares are not subject to a Rule 12b-1 fee.The portfolio’s Service shares are subject to a 0.25% annual Rule 12b-1 fee.The performance figures for Service shares reflect the performance of the portfolio’s Initial shares from their inception date through December 30, 2000, and the performance of the portfolio’s Service shares from December 31, 2000 (inception date of Service shares) to December 31, 2005 (blended performance figures).The blended performance figures have not been adjusted to reflect the higher operating expenses of the Service shares. If these expenses had been reflected, the blended performance figures would have been lower. All dividends and capital gain distributions are reinvested.
The portfolio’s performance shown in the line graph takes into account all applicable portfolio fees and expenses.The Index is an unmanaged index composed of a sample of companies representative of the market structure of European and Pacific Basin countries and includes net dividends reinvested.The Index does not take into account charges, fees and other expenses. Further information relating to portfolio performance, including expense reimbursements, if applicable, is contained in the Financial Highlights section of the prospectus and elsewhere in this report.
The Portfolio 7
UNDERSTANDING YOUR PORTFOLIO’S EXPENSES (Unaudited)
As a mutual fund investor,you pay ongoing expenses,such as management fees and other expenses.Using the information below,you can estimate how these expenses affect your investment and compare them with the expenses of other funds.You also may pay one-time transaction expenses,including sales charges (loads) and redemption fees, which are not shown in this section and would have resulted in higher total expenses. For more information, see your portfolio’s prospectus or talk to your financial adviser.
Review your portfolio’s expenses
|
The table below shows the expenses you would have paid on a $1,000 investment in Dreyfus Variable Investment Fund, International Equity Portfolio from July 1, 2005 to December 31, 2005. It also shows how much a $1,000 investment would be worth at the close of the period, assuming actual returns and expenses.
| Expenses and Value of a $1,000 Investment | | |
| assuming actual returns for the six months ended December 31, 2005 |
| | | Initial Shares | | Service Shares |
| |
| |
|
| Expenses paid per $1,000 † | | $ 5.41 | | $ 6.76 |
| Ending value (after expenses) | | $1,147.60 | | $1,146.20 |
COMPARING YOUR PORTFOLIO’S EXPENSES WITH THOSE OF OTHER FUNDS (Unaudited)
Using the SEC’s method to compare expenses
The Securities and Exchange Commission (SEC) has established guidelines to help investors assess fund expenses. Per these guidelines, the table below shows your portfolio’s expenses based on a $1,000 investment, assuming a hypothetical 5% annualized return. You can use this information to compare the ongoing expenses (but not transaction expenses or total cost) of investing in the portfolio with those of other funds. All mutual fund shareholder reports will provide this information to help you make this comparison. Please note that you cannot use this information to estimate your actual ending account balance and expenses paid during the period.
Expenses and Value of a $1,000 Investment assuming a hypothetical 5% annualized return for the six months ended December 31, 2005
| | | Initial Shares | | Service Shares |
| |
| |
|
| Expenses paid per $1,000 † | | $ 5.09 | | $ 6.36 |
| Ending value (after expenses) | | $1,020.16 | | $1,018.90 |
| † Expenses are equal to the portfolio’s annualized expense ratio of 1.00% for Initial shares and 1.25% for Service |
| shares; multiplied by the average account value over the period, multiplied by 184/365 (to reflect the one-half |
| year period). |
STATEMENT OF INVESTMENTS
December 31, 2005
|
| Common Stocks—95.9% | | Shares | | Value ($) |
| |
| |
|
| Australia—1.1% | | | | |
| ABC Learning Centres | | 45,300 | | 239,401 |
| Excel Coal | | 59,869 | | 280,362 |
| | | | | 519,763 |
| Belgium—1.0% | | | | |
| KBC Groep | | 5,116 | | 475,927 |
| Brazil—7.0% | | | | |
| Brasil Telecom Participacoes, ADR | | 24,545 | | 916,756 |
| Diagnosticos da America | | 13,370 a | | 248,726 |
| Natura Cosmeticos | | 14,800 | | 651,800 |
| Petroleo Brasileiro, ADR | | 17,701 | | 1,139,412 |
| Tele Norte Leste Participacoes, ADR | | 24,540 | | 439,757 |
| | | | | 3,396,451 |
| Canada—4.9% | | | | |
| Canadian Pacific Railway | | 8,260 | | 345,984 |
| Oncolytics Biotech | | 151,225 a | | 680,116 |
| Petro-Canada | | 12,880 | | 516,684 |
| Shoppers Drug Mart | | 7,950 | | 300,663 |
| Talisman Energy | | 9,490 | | 502,695 |
| | | | | 2,346,142 |
| France—7.1% | | | | |
| Air Liquide | | 1,657 | | 318,484 |
| AXA | | 26,519 | | 855,056 |
| Sanofi-Aventis | | 7,872 | | 689,014 |
| Societe Generale | | 4,340 | | 533,355 |
| Total | | 2,185 | | 548,414 |
| Vinci | | 5,382 | | 462,478 |
| | | | | 3,406,801 |
| Germany—9.8% | | | | |
| Allianz | | 4,542 | | 687,383 |
| Celesio | | 3,604 | | 309,736 |
| Comdirect Bank | | 24,270 | | 228,504 |
| DaimlerChrysler | | 9,532 | | 486,380 |
The Portfolio 9
STATEMENT OF INVESTMENTS (continued)
|
| Common Stocks (continued) | | Shares | | Value ($) |
| |
| |
|
| Germany (continued) | | | | |
| Deutsche Boerse | | 6,717 | | 687,708 |
| Deutsche Postbank | | 12,174 | | 705,571 |
| Deutsche Wohnen | | 1,476 | | 340,957 |
| MLP | | 18,154 | | 376,199 |
| Praktiker Bau—und Heimwerkermaerkte | | 11,470 | | 207,978 |
| Siemens | | 4,276 | | 366,022 |
| Tipp24 | | 13,428 a | | 317,653 |
| | | | | 4,714,091 |
| Hong Kong—.7% | | | | |
| China Netcom Group (Hong Kong) | | 211,000 | | 336,087 |
| India—.7% | | | | |
| Reliance Industries, GDR | | 8,306 b | | 326,509 |
| Italy—1.1% | | | | |
| UniCredito Italiano | | 79,585 | | 547,855 |
| Japan—18.7% | | | | |
| Fuji Television Network | | 278 | | 699,564 |
| Honda Motor | | 9,900 | | 564,516 |
| Japan Tobacco | | 42 | | 612,074 |
| Keihin Electric Express Railway | | 10,000 | | 78,797 |
| Matsui Securities | | 64,200 | | 890,450 |
| Mitsubishi | | 29,000 | | 641,305 |
| Mitsubishi UFJ Financial Group | | 90 | | 1,220,080 |
| Nikko Cordial | | 55,000 | | 870,494 |
| Nippon Express | | 66,000 | | 402,067 |
| Promise | | 4,500 | | 299,301 |
| Secom | | 9,500 | | 496,632 |
| Toda | | 71,000 | | 389,816 |
| Toyota Motor | | 22,800 | | 1,182,257 |
| Yamato Holdings | | 41,000 | | 679,483 |
| | | | | 9,026,836 |
| Common Stocks (continued) | | Shares | | Value ($) |
| |
| |
|
| Netherlands—4.5% | | | | |
| ASML Holding | | 23,762 a | | 474,986 |
| ING Groep | | 24,955 | | 864,841 |
| Koninklijke Philips Electronics | | 12,317 | | 382,424 |
| STMicroelectronics | | 25,621 | | 459,720 |
| | | | | 2,181,971 |
| Norway—2.8% | | | | |
| Norsk Hydro | | 6,380 | | 654,751 |
| Statoil | | 29,478 | | 676,632 |
| | | | | 1,331,383 |
| Peru—.5% | | | | |
| Cia de Minas Buenaventura, ADR | | 8,861 | | 250,766 |
| Russia—1.2% | | | | |
| AFK Sistema, GDR | | 25,028 | | 588,158 |
| Singapore—2.9% | | | | |
| MobileOne | | 232,720 | | 296,690 |
| Singapore Airlines | | 48,000 | | 357,929 |
| Singapore Post | | 609,000 | | 421,162 |
| United Overseas Bank | | 34,000 | | 298,515 |
| United Overseas Land | | 4,900 | | 7,396 |
| | | | | 1,381,692 |
| South Korea—5.5% | | | | |
| Hyundai Motor, GDR | | 7,984 b | | 384,988 |
| KT&G, GDR | | 32,018 b | | 704,396 |
| Samsung Electronics, GDR | | 1,802 b | | 592,858 |
| Samsung Heavy Industries | | 24,080 | | 424,238 |
| SK | | 10,980 | | 567,800 |
| | | | | 2,674,280 |
| Spain—.3% | | | | |
| Acciona | | 1,132 | | 126,462 |
The Portfolio 11
STATEMENT OF INVESTMENTS (continued)
|
| Common Stocks (continued) | | Shares | | Value ($) |
| |
| |
|
| Sweden—1.7% | | | | |
| Investor, Cl. B | | 21,540 | | 376,583 |
| Telefonaktiebolaget LM Ericsson, Cl. B | | 134,360 | | 461,352 |
| | | | | 837,935 |
| Switzerland—7.3% | | | | |
| Nestle | | 2,130 | | 636,474 |
| Novartis | | 15,877 | | 833,567 |
| Roche Holding | | 3,007 | | 451,096 |
| UBS | | 9,755 | | 927,882 |
| Zurich Financial Services | | 3,121 | | 664,446 |
| | | | | 3,513,465 |
| Thailand—2.5% | | | | |
| Bank of Ayudhya | | 1,125,800 | | 408,883 |
| Banpu | | 86,500 | | 277,264 |
| Shin | | 490,600 | | 505,249 |
| | | | | 1,191,396 |
| United Kingdom—14.6% | | | | |
| Admiral Group | | 54,507 | | 426,597 |
| AstraZeneca | | 11,272 | | 548,514 |
| Barclays | | 34,067 | | 358,038 |
| BHP Billiton | | 46,655 | | 761,986 |
| BP | | 96,322 | | 1,025,580 |
| British American Tobacco | | 27,979 | | 625,647 |
| Cadbury Schweppes | | 31,597 | | 298,653 |
| GlaxoSmithKline | | 41,762 | | 1,055,252 |
| ICAP | | 77,371 | | 538,998 |
| Old Mutual | | 190,083 | | 538,670 |
| Prudential | | 38,282 | | 362,169 |
| Standard Chartered | | 21,907 | | 487,985 |
| | | | | 7,028,089 |
| Total Common Stocks | | | | |
| (cost $37,376,404) | | | | 46,202,059 |
| Preferred Stocks—3.3% | | | | Shares | | Value ($) |
| |
| |
| |
|
| Brazil—2.2% | | | | | | |
| All America Latina Logistica | | | | 17,261 | | 736,340 |
| Caemi Mineracao e Metalurgica | | | | 214,077 | | 312,194 |
| | | | | | | | | 1,048,534 |
| Germany—1.1% | | | | | | |
| Henkel | | | | 5,398 | | 542,704 |
| Total Preferred Stocks | | | | | | |
| (cost $1,149,719) | | | | | | 1,591,238 |
| |
| |
| |
|
| |
| Total Investments (cost $38,526,123) | | 99.2% | | 47,793,297 |
| Cash and Receivables (Net) | | | | .8% | | 365,200 |
| Net Assets | | | | 100.0% | | 48,158,497 |
| |
| ADR—American Depository Receipts. | | | | | | |
| GDR—Global Depository Receipts. | | | | | | |
| a | | Non-income producing. | | | | | | |
| b | | Securities exempt from registration under Rule 144A of Securities Act of 1933.These securities may be resold in |
| | | transactions exempt from registration, normally to qualified institutional buyers. At December 31, 2005, these |
| | | securities amounted to $2,008,751 or 4.2% of net assets. | | |
| |
| |
|
| |
| |
| |
| Portfolio Summary (Unaudited) † | | | | |
| | | | | Value (%) | | | | Value (%) |
| |
| |
| |
| |
|
| Banks | | 12.4 | | Information Technology Hardware 4.1 |
| Oil & Gas | | 11.7 | | Tobacco | | 4.0 |
| Pharmaceuticals & Biotechnology | | 9.5 | | Transportation | | 4.0 |
| Insurance | | 8.8 | | Mining | | 3.9 |
| Specialty & Other Finance | | 7.3 | | Support Services | | 3.8 |
| Telecommunication Services | | 6.4 | | Other | | 17.9 |
| Automobiles & Parts | | 5.4 | | | | 99.2 |
| |
| † | | Based on net assets. | | | | | | |
| See notes to financial statements. | | | | | | |
The Portfolio 13
STATEMENT OF ASSETS AND LIABILITIES
December 31, 2005
| | | Cost | | Value |
| |
| |
|
| Assets ($): | | | | |
| Investments in securities—See Statement of Investments | | 38,526,123 | | 47,793,297 |
| Cash denominated in foreign currencies | | 2,640 | | 2,633 |
| Receivable for investment securities sold | | | | 1,712,366 |
| Dividends receivable | | | | 119,991 |
| Unrealized appreciation on forward | | | | |
| currency exchange contracts—Note 4 | | | | 2,778 |
| Receivable for shares of Beneficial Interest subscribed | | | | 332 |
| | | | | 49,631,397 |
| |
| |
|
| Liabilities ($): | | | | |
| Due to The Dreyfus Corporation and affiliates—Note 3(b) | | | | 33,656 |
| Cash overdraft due to Custodian | | | | 198,609 |
| Payable for investment securities purchased | | | | 1,061,403 |
| Unrealized depreciation on forward | | | | |
| currency exchange contracts—Note 4 | | | | 118,552 |
| Payable for shares of Beneficial Interest redeemed | | | | 13,096 |
| Accrued expenses | | | | 47,584 |
| | | | | 1,472,900 |
| |
| |
|
| Net Assets ($) | | | | 48,158,497 |
| |
| |
|
| Composition of Net Assets ($): | | | | |
| Paid-in capital | | | | 52,668,804 |
| Accumulated undistributed investment income—net | | | | 484,206 |
| Accumulated net realized gain (loss) on investments | | | | (14,142,573) |
| Accumulated net unrealized appreciation (depreciation) | | | | |
| on investments and foreign currency transactions | | | | 9,148,060 |
| |
| |
|
| Net Assets ($) | | | | 48,158,497 |
| |
| |
|
| |
| |
| Net Asset Value Per Share | | | | |
| | | Initial Shares | | Service Shares |
| |
| |
|
| Net Assets ($) | | 42,288,693 | | 5,869,804 |
| Shares Outstanding | | 2,577,732 | | 358,107 |
| |
| |
|
| Net Asset Value Per Share ($) | | 16.41 | | 16.39 |
See notes to financial statements.
|
STATEMENT OF OPERATIONS
Year Ended December 31, 2005
|
| Investment Income ($): | | |
| Income: | | |
| Cash dividends (net of $148,374 foreign taxes withheld at source) | | 1,258,885 |
| Interest | | 2,089 |
| Total Income | | 1,260,974 |
| Expenses: | | |
| Investment advisory fee—Note 3(a) | | 332,502 |
| Custodian fees | | 59,654 |
| Prospectus and shareholders’ reports | | 40,621 |
| Auditing fees | | 27,304 |
| Distribution fees—Note 3(b) | | 12,476 |
| Trustees’ fees and expenses—Note 3(c) | | 3,576 |
| Shareholder servicing costs—Note 3(b) | | 3,316 |
| Legal fees | | 1,316 |
| Loan commitment fees—Note 2 | | 188 |
| Registration fees | | 172 |
| Miscellaneous | | 17,308 |
| Total Expenses | | 498,433 |
| Less—reduction in custody fees due to | | |
| earnings credits—Note 1(c) | | (4,801) |
| Net Expenses | | 493,632 |
| Investment Income—Net | | 767,342 |
| |
|
| Realized and Unrealized Gain (Loss) on Investments—Note 4 ($): |
| Net realized gain (loss) on investments and foreign currency transactions | | 7,664,782 |
| Net realized gain (loss) on forward currency exchange contracts | | 60,287 |
| Net Realized Gain (Loss) | | 7,725,069 |
| Net unrealized appreciation (depreciation) | | |
| on investments and foreign currency transactions | | (2,244,526) |
| Net Realized and Unrealized Gain (Loss) on Investments | | 5,480,543 |
| Net Increase in Net Assets Resulting from Operations | | 6,247,885 |
See notes to financial statements.
|
The Portfolio 15
STATEMENT OF CHANGES IN NET ASSETS
| | | Year Ended December 31, |
| |
|
| | | 2005 | | 2004 |
| |
| |
|
| Operations ($): | | | | |
| Investment income—net | | 767,342 | | 793,607 |
| Net realized gain (loss) on investments | | 7,725,069 | | 5,531,332 |
| Net unrealized appreciation | | | | |
| (depreciation) on investments | | (2,244,526) | | 2,245,710 |
| Net Increase (Decrease) in Net Assets | | | | |
| Resulting from Operations | | 6,247,885 | | 8,570,649 |
| |
| |
|
| Dividends to Shareholders from ($): | | | | |
| Investment income—net: | | | | |
| Initial shares | | (160,712) | | (1,378,991) |
| Service shares | | (9,235) | | (137,306) |
| Total Dividends | | (169,947) | | (1,516,297) |
| |
| |
|
| Beneficial Interest Transactions ($): | | | | |
| Net proceeds from shares sold: | | | | |
| Initial shares | | 5,791,282 | | 4,222,550 |
| Service shares | | 1,742,456 | | 1,471,321 |
| Dividends reinvested: | | | | |
| Initial shares | | 160,712 | | 1,378,991 |
| Service shares | | 9,235 | | 137,306 |
| Cost of shares redeemed: | | | | |
| Initial shares | | (7,886,743) | | (5,980,727) |
| Service shares | | (874,791) | | (1,412,444) |
| Increase (Decrease) in Net Assets from | | | | |
| Beneficial Interest Transactions | | (1,057,849) | | (183,003) |
| Total Increase (Decrease) in Net Assets | | 5,020,089 | | 6,871,349 |
| |
| |
|
| Net Assets ($): | | | | |
| Beginning of Period | | 43,138,408 | | 36,267,059 |
| End of Period | | 48,158,497 | | 43,138,408 |
| Undistributed (distributions in excess of) | | | | |
| investment income—net | | 484,206 | | (623,491) |
| | | Year Ended December 31, |
| |
|
| | | 2005 | | 2004 |
| |
| |
|
| Capital Share Transactions: | | | | |
| Initial Shares | | | | |
| Shares sold | | 391,336 | | 334,613 |
| Shares issued for dividends reinvested | | 11,334 | | 100,613 |
| Shares redeemed | | (531,886) | | (475,177) |
| Net Increase (Decrease) in Shares Outstanding | | (129,216) | | (39,951) |
| |
| |
|
| Service Shares | | | | |
| Shares sold | | 119,792 | | 117,142 |
| Shares issued for dividends reinvested | | 651 | | 9,989 |
| Shares redeemed | | (59,441) | | (112,465) |
| Net Increase (Decrease) in Shares Outstanding | | 61,002 | | 14,666 |
See notes to financial statements.
|
The Portfolio 17
The following tables describe the performance for each share class for the fiscal periods indicated. All information (except portfolio turnover rate) reflects financial results for a single portfolio share.Total return shows how much your investment in the portfolio would have increased (or decreased) during each period, assuming you had reinvested all dividends and distributions.These figures have been derived from the portfolio’s financial statements.
| | | | | Year Ended December 31, | | |
| |
| |
| |
|
| Initial Shares | | 2005 | | 2004 | | 2003 | | 2002 | | 2001 |
| |
| |
| |
| |
| |
|
| Per Share Data ($): | | | | | | | | | | |
| Net asset value, beginning of period | | 14.36 | | 11.97 | | 8.75 | | 10.76 | | 15.34 |
| Investment Operations: | | | | | | | | | | |
| Investment income—net a | | .26 | | .27 | | .14 | | .10 | | .03 |
| Net realized and unrealized | | | | | | | | | | |
| gain (loss) on investments | | 1.85 | | 2.64 | | 3.55 | | (1.81) | | (4.50) |
| Total from Investment Operations | | 2.11 | | 2.91 | | 3.69 | | (1.71) | | (4.47) |
| Distributions: | | | | | | | | | | |
| Dividends from investment income—net | | (.06) | | (.52) | | (.47) | | (.30) | | (.11) |
| Net asset value, end of period | | 16.41 | | 14.36 | | 11.97 | | 8.75 | | 10.76 |
| |
| |
| |
| |
| |
|
| Total Return (%) | | 14.75 | | 24.57 | | 42.89 | | (15.94) | | (29.18) |
| |
| |
| |
| |
| |
|
| Ratios/Supplemental Data (%): | | | | | | | | | | |
| Ratio of total expenses | | | | | | | | | | |
| to average net assets | | 1.10 | | 1.04 | | 1.19 | | 1.14 | | 1.08 |
| Ratio of net expenses | | | | | | | | | | |
| to average net assets | | 1.09 | | 1.04 | | 1.19 | | 1.14 | | 1.08 |
| Ratio of net investment income | | | | | | | | | | |
| to average net assets | | 1.76 | | 2.13 | | 1.42 | | .96 | | .25 |
| Portfolio Turnover Rate | | 92.82 | | 96.55 | | 101.02 | | 116.65 | | 238.88 |
| |
| |
| |
| |
| |
|
| Net Assets, end of period ($ x 1,000) | | 42,289 | | 38,874 | | 32,892 | | 27,117 | | 39,961 |
| |
| a Based on average shares outstanding at each month end. | | | | | | | | |
| See notes to financial statements. | | | | | | | | | | |
| | | | | Year Ended December 31, | | |
| |
| |
| |
|
| Service Shares | | 2005 | | 2004 | | 2003 | | 2002 | | 2001 |
| |
| |
| |
| |
| |
|
| Per Share Data ($): | | | | | | | | | | |
| Net asset value, beginning of period | | 14.35 | | 11.95 | | 8.74 | | 10.75 | | 15.34 |
| Investment Operations: | | | | | | | | | | |
| Investment income (loss)—net a | | .22 | | .24 | | .12 | | .07 | | (.03) |
| Net realized and unrealized | | | | | | | | | | |
| gain (loss) on investments | | 1.85 | | 2.63 | | 3.54 | | (1.80) | | (4.47) |
| Total from Investment Operations | | 2.07 | | 2.87 | | 3.66 | | (1.73) | | (4.50) |
| Distributions: | | | | | | | | | | |
| Dividends from investment income—net | | (.03) | | (.47) | | (.45) | | (.28) | | (.09) |
| Net asset value, end of period | | 16.39 | | 14.35 | | 11.95 | | 8.74 | | 10.75 |
| |
| |
| |
| |
| |
|
| Total Return (%) | | 14.45 | | 24.20 | | 42.56 | | (16.20) | | (29.35) |
| |
| |
| |
| |
| |
|
| Ratios/Supplemental Data (%): | | | | | | | | | | |
| Ratio of total expenses | | | | | | | | | | |
| to average net assets | | 1.34 | | 1.29 | | 1.44 | | 1.41 | | 1.47 |
| Ratio of net expenses | | | | | | | | | | |
| to average net assets | | 1.33 | | 1.29 | | 1.44 | | 1.41 | | 1.47 |
| Ratio of net investment income | | | | | | | | | | |
| (loss) to average net assets | | 1.50 | | 1.89 | | 1.17 | | .74 | | (.27) |
| Portfolio Turnover Rate | | 92.82 | | 96.55 | | 101.02 | | 116.65 | | 238.88 |
| |
| |
| |
| |
| |
|
| Net Assets, end of period ($ x 1,000) | | 5,870 | | 4,265 | | 3,375 | | 2,017 | | 1,644 |
| |
| a Based on average shares outstanding at each month end. | | | | | | | | |
| See notes to financial statements. | | | | | | | | | | |
The Portfolio 19
NOTES TO FINANCIAL STATEMENTS
NOTE 1—Significant Accounting Policies:
Dreyfus Variable Investment Fund (the “fund”) is registered under the Investment Company Act of 1940, as amended (the “Act”), as an open-end management investment company, operating as a series company currently offering twelve series, including the International Equity Portfolio (the “portfolio”).The portfolio is only offered to separate accounts established by insurance companies to fund variable annuity contracts and variable life insurance policies.The portfolio is a non-diversified series.The portfolio’s investment objective is to maximize capital growth. The Dreyfus Corporation (the “Manager” or “Dreyfus”) serves as the portfolio’s investment adviser. Dreyfus is a wholly-owned subsidiary of Mellon Financial Corporation (“Mellon Financial”). Newton Capital Management Limited (“Newton”) is the portfolio’s sub-investment adviser. Newton is also a wholly-owned subsidiary of Mellon Bank, N. A., and an affiliate of Dreyfus.
Dreyfus Service Corporation (the “Distributor”), a wholly-owned subsidiary of Dreyfus, is the distributor of the portfolio’s shares, which are sold without a sales charge.The portfolio is authorized to issue an unlimited number of $.001 par value shares of Beneficial Interest in each of the following classes of shares: Initial and Service. Each class of shares has identical rights and privileges, except with respect to the distribution plan and the expenses borne by each class and certain voting rights. Income, expenses (other than expenses attributable to a specific class), and realized and unrealized gains or losses on investments are allocated to each class of shares based on its relative net assets.
The fund accounts separately for the assets, liabilities and operations of each series. Expenses directly attributable to each series are charged to that series’ operations; expenses which are applicable to all series’ are allocated among them on a pro rata basis.
The portfolio’s financial statements are prepared in accordance with U.S. generally accepted accounting principles, which may require the use of management estimates and assumptions.Actual results could differ from those estimates.
The fund enters into contracts that contain a variety of indemnifica-tions.The portfolio’s maximum exposure under these arrangements is unknown. The portfolio does not anticipate recognizing any loss related to these arrangements.
(a) Portfolio valuation: Investments in securities are valued at the last sales price on the securities exchange or national securities market on which such securities are primarily traded. Securities listed on the National Market System for which market quotations are available are valued at the official closing price or, if there is no official closing price that day, at the last sales price. Securities not listed on an exchange or the national securities market, or securities for which there were no transactions, are valued at the average of the most recent bid and asked prices, except for open short positions, where the asked price is used for valuation purposes. Bid price is used when no asked price is available. Investments in registered investment companies are valued at their net asset value.When market quotations or official closing prices are not readily available, or are determined not to reflect accurately fair value, such as when the value of a security has been significantly affected by events after the close of the exchange or market on which the security is principally traded (for example, a foreign exchange or market), but before the portfolio calculates its net asset value, the portfolio may value these investments at fair value as determined in accordance with the procedures approved by the Board of Trustees. Fair valuing of securities may be determined with the assistance of a pricing service using calculations based on indices of domestic securities and other appropriate indicators, such as prices of relevant ADR’s and futures contracts. For other securities that are fair valued by the Board of Trustees, certain factors may be considered such as: fundamental analytical data, the nature and duration of restrictions on disposition, an evaluation of the forces that influence the market in which the securities are purchased and sold and public trading in similar securities of the issuer or comparable issuers. Financial futures are valued at the last sales price. Investments denominated in foreign currencies are
The Portfolio 21
NOTES TO FINANCIAL STATEMENTS (continued)
|
translated to U.S. dollars at the prevailing rates of exchange. Forward currency exchange contracts are valued at the forward rate.
(b) Foreign currency transactions: The portfolio does not isolate that portion of the results of operations resulting from changes in foreign exchange rates on investments from the fluctuations arising from changes in market prices of securities held. Such fluctuations are included with the net realized and unrealized gain or loss on investments.
Net realized foreign exchange gains or losses arise from sales and maturities of short-term securities, sales of foreign currencies, currency gains or losses realized on securities transactions and the difference between the amounts of dividends, interest and foreign withholding taxes recorded on the portfolio’s books and the U.S. dollar equivalent of the amounts actually received or paid. Net unrealized foreign exchange gains or losses arise from changes in the value of assets and liabilities other than investments in securities, resulting from changes in exchange rates. Such gains and losses are included with net realized and unrealized gain or loss on investments.
(c) Securities transactions and investment income: Securities transactions are recorded on a trade date basis. Realized gain and loss from securities transactions are recorded on the identified cost basis. Dividend income is recognized on the ex-dividend date and interest income, including, where applicable, accretion of discount and amortization of premium on investments, is recognized on the accrual basis.
The portfolio has an arrangement with the custodian bank whereby the portfolio receives earnings credits from the custodian when positive cash balances are maintained, which are used to offset custody fees. For financial reporting purposes, the portfolio includes net earnings credits as an expense offset in the Statement of Operations.
(d) Dividends to shareholders: Dividends are recorded on the ex-dividend date. Dividends from investment income-net and dividends from net realized capital gain, if any, are normally declared and paid annually,
but the portfolio may make distributions on a more frequent basis to comply with the distribution requirements of the Internal Revenue Code of 1986, as amended (the “Code”).To the extent that net realized capital gain can be offset by capital loss carryovers, it is the policy of the portfolio not to distribute such gain. Income and capital gain distributions are determined in accordance with income tax regulations, which may differ from U.S. generally accepted accounting principles.
(e) Federal income taxes: It is the policy of the portfolio to continue to qualify as a regulated investment company, if such qualification is in the best interests of its shareholders, by complying with the applicable provisions of the Code, and to make distributions of taxable income sufficient to relieve it from substantially all federal income and excise taxes.
At December 31, 2005, the components of accumulated earnings on a tax basis were as follows: undistributed ordinary income $439,122, accumulated capital losses $14,111,202 and unrealized appreciation $9,161,773.
The accumulated capital loss carryover is available to be applied against future net securities profits, if any, realized subsequent to December 31, 2005. If not applied, $9,013,748 of the carryover expires in fiscal 2009, $3,933,328 expires in fiscal 2010 and $1,164,126 expires in fiscal 2011.
The tax character of distributions paid to shareholders during the fiscal periods ended December 31, 2005 and December 31, 2004 were as follows: ordinary income $169,947 and $1,516,297, respectively.
During the period ended December 31, 2005, as a result of permanent book to tax differences primarily due to the tax treatment for foreign currency transactions and passive foreign investment companies, the portfolio increased accumulated undistributed investment income-net by $510,302 and decreased accumulated net realized gain (loss) on investments by the same amount. Net assets were not affected by this reclassification.
The Portfolio 23
NOTES TO FINANCIAL STATEMENTS (continued)
|
NOTE 2—Bank Line of Credit:
|
The portfolio participates with other Dreyfus-managed funds in a $350 million redemption credit facility (the “Facility”) to be utilized for temporary or emergency purposes, including the financing of redemptions. In connection therewith, the portfolio has agreed to pay commitment fees on its pro rata portion of the Facility. Interest is charged to the portfolio based on prevailing market rates in effect at the time of borrowing. During the period ended December 31, 2005, the portfolio did not borrow under the Facility.
NOTE 3—Investment Advisory Fee, Sub-Investment Advisory Fee and Other Transactions with Affiliates:
(a) Pursuant to an Investment Advisory Agreement with Dreyfus, the investment advisory fee is computed at the annual rate of .75% of the value of the portfolio’s average daily net assets and is payable monthly.
Pursuant to a Sub-Investment Advisory Agreement between Dreyfus and Newton, the sub-investment advisory fee is payable monthly by Dreyfus, and is based upon the value of the portfolio’s average daily net assets, computed at the following annual rates:
| Average Net Assets | | |
| 0 to $100 million | | .35% |
| $100 million to $1 billion | | .30% |
| $1 billion to $1.5 billion | | .26% |
| In excess of $1.5 billion | | .20% |
(b) Under the Distribution Plan (the “Plan”) adopted pursuant to Rule 12b-1 under the Act, Service shares pay the Distributor for distributing their shares, for servicing and/or maintaining Service shares shareholder accounts and for advertising and marketing for Service shares.The Plan provides for payments to be made at an annual rate of .25% of the value of Service shares’ average daily net assets. The Distributor may make payments to Participating Insurance Companies and to brokers and dealers acting as principal underwriter for their variable insurance products.The fees payable under the Plan are payable without regard to
actual expenses incurred. During the period ended December 31, 2005, Service shares were charged $12,476 pursuant to the Plan.
The portfolio compensates Dreyfus Transfer, Inc., a wholly-owned subsidiary of Dreyfus, under a transfer agency agreement for providing personnel and facilities to perform transfer agency services for the portfolio. During the period ended December 31, 2005, the portfolio was charged $147 pursuant to the transfer agency agreement.
During the period ended December 31, 2005, the portfolio was charged $3,762 for services performed by the Chief Compliance Officer.
The components of Due to The Dreyfus Corporation and affiliates in the Statement of Assets and Liabilities consist of: investment advisory fees $30,550, Rule 12b-1 distribution plan fees $1,234, chief compliance officer fees $1,858 and transfer agency per account fees $14.
(c) Each Board member also serves as a Board member of other funds within the Dreyfus complex. Annual retainer fees and attendance fees are allocated to each portfolio based on net assets.
NOTE 4—Securities Transactions:
The aggregate amount of purchases and sales of investment securities, excluding short-term securities and forward currency exchange contracts, during the period ended December 31, 2005, amounted to $40,924,434 and $42,829,233, respectively.
The portfolio enters into forward currency exchange contracts in order to hedge its exposure to changes in foreign currency exchange rates on its foreign portfolio holdings and to settle foreign currency transactions. When executing forward currency exchange contracts, the portfolio is obligated to buy or sell a foreign currency at a specified rate on a certain date in the future. With respect to sales of forward currency exchange contracts, the portfolio would incur a loss if the value of the contract increases between the date the forward contract is opened and the date the forward contract is closed.The portfolio realizes a gain if the value of the contract decreases between those dates.With respect to
The Portfolio 25
NOTES TO FINANCIAL STATEMENTS (continued)
|
purchases of forward currency exchange contracts, the portfolio would incur a loss if the value of the contract decreases between the date the forward contract is opened and the date the forward contract is closed. The portfolio realizes a gain if the value of the contract increases between those dates.The portfolio is also exposed to credit risk associated with counterparty nonperformance on these forward currency exchange contracts which is typically limited to the unrealized gain on each open contract.The following summarizes open forward currency exchange contracts at December 31, 2005:
| | | Foreign | | | | | | Unrealized |
| Forward Currency | | Currency | | | | | | Appreciation |
| Exchange Contracts | | Amounts | | Cost ($) | | Value ($) | | (Depreciation) ($) |
| |
| |
| |
| |
|
| Purchases: | | | | | | | | |
| British Pound, | | | | | | | | |
| expiring 1/3/2006 | | 148,932 | | 255,746 | | 256,178 | | 432 |
| Euro, expiring | | | | | | | | |
| 1/13/2006 | | 1,449,752 | | 1,793,000 | | 1,715,782 | | (77,218) |
| Euro, expiring | | | | | | | | |
| 5/15/2006 | | 200,522 | | 241,000 | | 238,942 | | (2,058) |
| Norwegian Krone, | | | | | | | | |
| expiring 2/15/2006 | | 2,794,087 | | 454,000 | | 414,762 | | (39,238) |
| Thai Bhat, | | | | | | | | |
| expiring 1/4/2006 | | 521,975 | | 12,734 | | 12,723 | | (11) |
| Sales: | | | | Proceeds ($) | | | | |
| British Pound, | | | | | | | | |
| expiring 1/4/2006 | | 41,907 | | 72,281 | | 72,084 | | 197 |
| Euro, | | | | | | | | |
| expiring 1/3/2006 | | 289,855 | | 342,898 | | 342,840 | | 58 |
| Hong Kong Dollar, | | | | | | | | |
| expiring 1/3/2006 | | 731,446 | | 94,311 | | 94,338 | | (27) |
| Japanese Yen, | | | | | | | | |
| expiring 1/4/2006 | | 29,472,055 | | 251,740 | | 249,710 | | 2,030 |
| Japanese Yen, | | | | | | | | |
| expiring 1/5/2006 | | 3,892,980 | | 33,045 | | 32,984 | | 61 |
| Total | | | | | | | | (115,774) |
At December 31, 2005, the cost of investments for federal income tax purposes was $38,630,924; accordingly, accumulated net unrealized appreciation on investments was $9,162,373, consisting of $9,560,837 gross unrealized appreciation and $398,464 gross unrealized depreciation.
REPORT OF INDEPENDENT REGISTERED PUBLIC ACCOUNTING FIRM
Shareholders and Board of Trustees
Dreyfus Variable Investment Fund, International Equity Portfolio
We have audited the accompanying statement of assets and liabilities, including the statement of investments, of Dreyfus Variable Investment Fund, International Equity Portfolio (one of the funds comprising Dreyfus Variable Investment Fund) as of December 31, 2005, and the related statement of operations for the year then ended, the statement of changes in net assets for each of the two years in the period then ended, and financial highlights for each of the years indicated therein. These financial statements and financial highlights are the responsibility of the Fund’s management. Our responsibility is to express an opinion on these financial statements and financial highlights based on our audits. We conducted our audits in accordance with the standards of the Public Company Accounting Oversight Board (United States).Those standards require that we plan and perform the audit to obtain reasonable assurance about whether the financial statements and financial highlights are free of material misstatement.We were not engaged to perform an audit of the Fund’s internal control over financial reporting. Our audits included consideration of internal control over financial reporting as a basis for designing audit procedures that are appropriate in the circumstances, but not for the purpose of expressing an opinion on the effectiveness of the Fund’s internal control over financial reporting. Accordingly, we express no such opinion. An audit also includes examining, on a test basis, evidence supporting the amounts and disclosures in the financial statements and financial highlights, assessing the accounting principles used and significant estimates made by management, and evaluating the overall financial statement presentation. Our procedures included confirmation of securities owned as of December 31, 2005 by correspondence with the custodian and others or by other appropriate auditing procedures where replies from others were not received. We believe that our audits provide a reasonable basis for our opinion. In our opinion, the financial statements and financial highlights referred to above present fairly, in all material respects, the financial position of Dreyfus Variable Investment Fund, International Equity Portfolio at December 31, 2005, the results of its operations for the year then ended, the changes in its net assets for each of the two years in the period then ended, and the financial highlights for each of the indicated years, in conformity with U.S. generally accepted accounting principles.
| | New York, New York
February 6, 2006
|
The Portfolio 27
IMPORTANT TAX INFORMATION (Unaudited)
In accordance with federal tax law, the portfolio elects to provide each shareholder with their portion of the portfolio’s foreign taxes paid and the income sourced from foreign countries.Accordingly, the portfolio hereby makes the following designations regarding its fiscal year ended December 31, 2005:
—the total amount of taxes paid to foreign countries was $121,888.
—the total amount of income sourced from foreign countries was $587,791.
As required by federal tax law rules, shareholders will receive notification of their proportionate share of foreign taxes paid and foreign source income for the 2005 calendar year with Form 1099-DIV which will be mailed by January 31, 2006.
BOARD MEMBERS INFORMATION (Unaudited)
| Joseph S. DiMartino (62) |
| Chairman of the Board (1995) |
| Principal Occupation During Past 5 Years: |
| • Corporate Director and Trustee |
| | Other Board Memberships and Affiliations:
|
- The Muscular Dystrophy Association, Director
- Levcor International, Inc., an apparel fabric processor, Director
- Century Business Services, Inc., a provider of outsourcing functions for small and medium size companies, Director
- The Newark Group, a provider of a national market of paper recovery facilities, paperboard mills and paperboard converting plants, Director
- Sunair Services Corporation, engages in the design, manufacture and sale of high frequency systems for long-range voice and data communications, as well as providing certain outdoor- related services to homes and businesses, Director
No. of Portfolios for which Board Member Serves: 193
———————
| David P. Feldman (66) |
| Board Member (1994) |
| Principal Occupation During Past 5 Years: |
| • Corporate Director and Trustee |
| | Other Board Memberships and Affiliations:
|
- BBH Mutual Funds Group (11 funds), Director
- The Jeffrey Company, a private investment company, Director
- QMED, a medical device company, Director
No. of Portfolios for which Board Member Serves: 58
———————
| James F. Henry (75) |
| Board Member (1990) |
| | Principal Occupation During Past 5 Years:
|
- President, CPR Institute for Dispute Resolution, a non-profit organization principally engaged in the development of alternatives to business litigation (Retired 2003)
| | No. of Portfolios for which Board Member Serves: 22
|
The Portfolio 29
BOARD MEMBERS INFORMATION (Unaudited) (continued)
| Dr. Paul A. Marks (79) |
| Board Member (1990) |
Principal Occupation During Past 5 Years:
|
- President, Emeritus (2000-present) and President and Chief Executive Officer of Memorial Sloan-Kettering Cancer Center (Retired 1999)
Other Board Memberships and Affiliations:
|
- Pfizer, Inc., a pharmaceutical company, Director-Emeritus
- Lazard Freres & Company, LLC, Senior Adviser
- Carrot Capital Health Care Ventures, Advisor
- Armgo-Start-Up Biotech; Board of Directors
- Nanoviricide, Board Director
- PTC, Scientific Advisory Board
No. of Portfolios for which Board Member Serves: 22
|
———————
| Dr. Martin Peretz (66) |
| Board Member (1990) |
Principal Occupation During Past 5 Years:
|
- Editor-in-Chief of The New Republic Magazine
- Lecturer in Social Studies at Harvard University (1965-2001)
- Co-Chairman of TheStreet.com, a financial daily on the web
Other Board Memberships and Affiliations:
|
- Academy for Liberal Education, an accrediting agency for colleges and universities certified by the U.S. Department of Education, Director
- Harvard Center for Blood Research,Trustee
- Bard College,Trustee
- Board of Overseers of YIVO Institute for Jewish Research, Chairman
No. of Portfolios for which Board Member Serves: 22
|
———————
Once elected all Board Members serve for an indefinite term.The address of the Board Members and Officers is in c/o The Dreyfus Corporation, 200 Park Avenue, New York, New York 10166. Additional information about the Board Members is available in the fund’s Statement of Additional Information which can be obtained from Dreyfus free of charge by calling this toll free number: 1-800-554-4611.
John M. Fraser, Jr., Emeritus Board Member
Rosalind Gersten Jacobs, Emeritus Board Member
OFFICERS OF THE FUND (Unaudited)
| STEPHEN E. CANTER, President since |
| March 2000. |
Chairman of the Board, Chief Executive Officer and Chief Operating Officer of the Manager, and an officer of 90 investment companies (comprised of 184 portfolios) managed by the Manager. Mr. Canter also is a Board member and, where applicable, an Executive Committee Member of the other investment management subsidiaries of Mellon Financial Corporation, each of which is an affiliate of the Manager. He is 60 years old and has been an employee of the Manager since May 1995.
| STEPHEN R. BYERS, Executive Vice |
| President since November 2002. |
Chief Investment Officer,Vice Chairman and a director of the Manager, and an officer of 90 investment companies (comprised of 184 portfolios) managed by the Manager. Mr. Byers also is an officer, director or an Executive Committee Member of certain other investment management subsidiaries of Mellon Financial Corporation, each of which is an affiliate of the Manager. He is 52 years old and has been an employee of the Manager since January 2000.
| MARK N. JACOBS, Vice President since |
| March 2000. |
Executive Vice President, Secretary and General Counsel of the Manager, and an officer of 91 investment companies (comprised of 200 portfolios) managed by the Manager. He is 59 years old and has been an employee of the Manager since June 1977.
| MICHAEL A. ROSENBERG, Vice President |
| and Secretary since August 2005. |
Associate General Counsel of the Manager, and an officer of 91 investment companies (comprised of 200 portfolios) managed by the Manager. He is 45 years old and has been an employee of the Manager since October 1991.
| JAMES BITETTO, Vice President and |
| Assistant Secretary since August 2005. |
Assistant General Counsel and Assistant Secretary of the Manager, and an officer of 91 investment companies (comprised of 200 portfolios) managed by the Manager. He is 39 years old and has been an employee of the Manager since December 1996.
| JONI LACKS CHARATAN, Vice President |
| and Assistant Secretary since |
| August 2005. |
Associate General Counsel of the Manager, and an officer of 91 investment companies (comprised of 200 portfolios) managed by the Manager. She is 50 years old and has been an employee of the Manager since October 1988.
| JOSEPH M. CHIOFFI, Vice President and |
| Assistant Secretary since August 2005. |
Assistant General Counsel of the Manager, and an officer of 91 investment companies (comprised of 200 portfolios) managed by the Manager. He is 44 years old and has been an employee of the Manager since June 2000.
| JANETTE E. FARRAGHER, Vice President |
| and Assistant Secretary since |
| August 2005. |
Associate General Counsel of the Manager, and an officer of 91 investment companies (comprised of 200 portfolios) managed by the Manager. She is 43 years old and has been an employee of the Manager since February 1984.
| JOHN B. HAMMALIAN, Vice President and |
| Assistant Secretary since August 2005. |
Associate General Counsel of the Manager, and an officer of 91 investment companies (comprised of 200 portfolios) managed by the Manager. He is 42 years old and has been an employee of the Manager since February 1991.
The Portfolio 31
OFFICERS OF THE FUND (Unaudited) (continued)
| ROBERT R. MULLERY, Vice President and |
| Assistant Secretary since August 2005. |
Associate General Counsel of the Manager, and an officer of 91 investment companies (comprised of 200 portfolios) managed by the Manager. He is 53 years old and has been an employee of the Manager since May 1986.
| JEFF PRUSNOFSKY, Vice President and |
| Assistant Secretary since August 2005. |
Associate General Counsel of the Manager, and an officer of 91 investment companies (comprised of 200 portfolios) managed by the Manager. He is 40 years old and has been an employee of the Manager since October 1990.
| JAMES WINDELS, Treasurer since |
| November 2001. |
Director – Mutual Fund Accounting of the Manager, and an officer of 91 investment companies (comprised of 200 portfolios) managed by the Manager. He is 47 years old and has been an employee of the Manager since April 1985.
| ERIK D. NAVILOFF, Assistant Treasurer |
| since December 2002. |
Senior Accounting Manager – Taxable Fixed Income Funds of the Manager, and an officer of 91 investment companies (comprised of 200 portfolios) managed by the Manager. He is 37 years old and has been an employee of the Manager since November 1992.
| ROBERT ROBOL, Assistant Treasurer |
| since August 2003. |
Senior Accounting Manager – Money Market and Municipal Bond Funds of the Manager, and an officer of 91 investment companies (comprised of 200 portfolios) managed by the Manager. He is 41 years old and has been an employee of the Manager since October 1988.
| ROBERT SVAGNA, Assistant Treasurer |
| since December 2002. |
Senior Accounting Manager – Equity Funds of the Manager, and an officer of 91 investment companies (comprised of 200 portfolios) managed by the Manager. He is 38 years old and has been an employee of the Manager since November 1990.
| GAVIN C. REILLY, Assistant Treasurer |
| since December 2005. |
Tax Manager of the Investment Accounting and Support Department of the Manager, and an officer of 91 investment companies (comprised of 200 portfolios) managed by the Manager. He is 37 years old and has been an employee of the Manager since April 1991.
| JOSEPH W. CONNOLLY, Chief Compliance |
| Officer since October 2004. |
Chief Compliance Officer of the Manager and The Dreyfus Family of Funds (91 investment companies, comprised of 200 portfolios). From November 2001 through March 2004, Mr. Connolly was first Vice-President, Mutual Fund Servicing for Mellon Global Securities Services. In that capacity, Mr. Connolly was responsible for managing Mellon’s Custody, Fund Accounting and Fund Administration services to third-party mutual fund clients. He is 48 years old and has served in various capacities with the Manager since 1980, including manager of the firm’s Fund Accounting Department from 1997 through October 2001.
| WILLIAM GERMENIS, Anti-Money |
| Laundering Compliance Officer since |
| September 2002. |
Vice President and Anti-Money Laundering Compliance Officer of the Distributor, and the Anti-Money Laundering Compliance Officer of 87 investment companies (comprised of 196 portfolios) managed by the Manager. He is 35 years old and has been an employee of the Distributor since October 1998.
32
For More Information
| Dreyfus Variable Investment Fund, |
| International Equity Portfolio |
| 200 Park Avenue |
| New York, NY 10166 |
| |
| Investment Adviser |
| The Dreyfus Corporation |
| 200 Park Avenue |
| New York, NY 10166 |
| |
| Sub-Investment Adviser |
| Newton Capital Management Limited |
| 160 Queen Victoria Street |
| London, EC4V 4LA |
| England |
| Custodian |
| The Bank of New York |
| One Wall Street |
| New York, NY 10286 |
| |
| Transfer Agent & |
| Dividend Disbursing Agent |
| Dreyfus Transfer, Inc. |
| 200 Park Avenue |
| New York, NY 10166 |
| |
| Distributor |
| Dreyfus Service Corporation |
| 200 Park Avenue |
| New York, NY 10166 |
Telephone 1-800-554-4611 or 516-338-3300
Mail The Dreyfus Family of Funds, 144 Glenn Curtiss Boulevard, Uniondale, NY 11556-0144 Attn: Institutional Servicing
The portfolio files its complete schedule of portfolio holdings with the Securities and Exchange Commission (“SEC”) for the first and third quarters of each fiscal year on Form N-Q. The portfolio’s Forms N-Q are available on the SEC’s website at http://www.sec.gov and may be reviewed and copied at the SEC’s Public Reference Room in Washington, DC. Information on the operation of the Public Reference Room may be obtained by calling 1-800-SEC-0330.
A description of the policies and procedures that the portfolio uses to determine how to vote proxies relating to portfolio securities, and information regarding how the portfolio voted these proxies for the 12-month period ended June 30, 2005, is available at http://www.dreyfus.com and on the SEC’s website at http://www.sec.gov. The description of the policies and procedures is also available without charge, upon request, by calling 1-800-645-6561.
© 2006 Dreyfus Service Corporation


The views expressed in this report reflect those of the portfolio manager only through the end of the period covered and do not necessarily represent the views of Dreyfus or any other person in the Dreyfus organization.Any such views are subject to change at any time based upon market or other conditions and Dreyfus disclaims any responsibility to update such views. These views may not be relied on as investment advice and, because investment decisions for a Dreyfus portfolio are based on numerous factors, may not be relied on as an indication of trading intent on behalf of any Dreyfus portfolio.
Not FDIC-Insured • Not Bank-Guaranteed • May Lose Value
| | | Contents |
| |
| | | T H E P O R T F O L I O |
| |
|
| 2 | | Letter from the Chairman |
| 3 | | Discussion of Performance |
| 6 | | Portfolio Performance |
| 8 | | Understanding Your Portfolio’s Expenses |
| 8 | | Comparing Your Portfolio’s Expenses |
| | | With Those of Other Funds |
| 9 | | Statement of Investments |
| 15 | | Statement of Assets and Liabilities |
| 16 | | Statement of Operations |
| 17 | | Statement of Changes in Net Assets |
| 19 | | Financial Highlights |
| 21 | | Notes to Financial Statements |
| 28 | | Report of Independent Registered |
| | | Public Accounting Firm |
| 29 | | Important Tax Information |
| 30 | | Board Members Information |
| 32 | | Officers of the Fund |
| | | F O R M O R E I N F O R M AT I O N |
| |
|
| | | Back Cover |
Dreyfus Variable Investment Fund,
International Value Portfolio
The Portfolio

LETTER FROM THE CHAIRMAN
Dear Shareholder:
We are pleased to present this annual report for Dreyfus Variable Investment Fund, International Value Portfolio, covering the 12-month period from January 1, 2005, through December 31, 2005. Inside, you’ll find valuable information about how the portfolio was managed during the reporting period, including a discussion with the portfolio manager, D. Kirk Henry.
International stocks generally produced higher returns than their U.S. counterparts in 2005. Low interest rates and corporate restructuring in Europe and Japan helped buoy stock prices in the developed markets, and rising global demand for natural resources supported returns in the emerging markets. However, a strengthening U.S. dollar relative to most major foreign currencies eroded some of these gains for U.S. investors.
We expect the global economy to continue its expansion in 2006. Low real interest rates in Asia should support regional growth, while Japan appears to be emerging from its long recession. Europe seems poised for better economic times after several years of sluggish growth, and emerging markets in Eastern Europe and Latin America may continue to benefit from greater fiscal stability. Risks in the new year include the possibility of a slowdown in China, where a robust economy has fueled demand for exports from other nations.
As always, we encourage you to speak with your financial consultant about how these and other market forces may affect your investments. Thank you for your continued confidence and support.

The Dreyfus Corporation
January 17, 2006
|

DISCUSSION OF PERFORMANCE
D. Kirk Henry, Senior Portfolio Manager
How did Dreyfus Variable Investment Fund, International Value Portfolio perform relative to its benchmark?
For the 12-month period ended December 31, 2005, the portfolio produced total returns of 11.89% for its Initial shares and 11.69% for its Service shares.1 This compares with a 13.54% return for the portfolio’s benchmark, the Morgan Stanley Capital International Europe, Australasia, Far East Index (“MSCI EAFE Index”), for the same period.2
We attribute the international stock market’s overall performance to steady global economic growth and improved corporate earnings, which helped support higher stock prices for many international companies during the reporting period. The portfolio’s returns trailed its benchmark, primarily due to its emphasis on Japanese information technology stocks at a time when the country’s industrial conglomerates and capital good companies delivered stronger gains.
What is the portfolio’s investment approach?
The portfolio seeks long-term capital growth.To pursue this goal, we normally invest at least 80% of the portfolio’s assets in stocks.We ordinarily invest most of the portfolio’s assets in securities of foreign companies which we consider to be value companies.The portfolio’s stock investments may include common stocks, preferred stocks and convertible securities, including those purchased in initial public offerings or shortly thereafter.We may invest in companies of any size, and may also invest in companies located in emerging markets.
The portfolio’s investment approach is value-oriented and research-driven. In selecting stocks, we identify potential investments through extensive quantitative and fundamental research. Emphasizing individual stock selection rather than economic and industry trends, the portfolio focuses on three key factors: value, or how a stock is valued relative to its intrinsic worth based on traditional value measures; business health, or overall efficiency and profitability as measured by return on assets and
DISCUSSION OF PERFORMANCE (continued)
|
return on equity; business momentum, or the presence of a catalyst (such as corporate restructuring, change in management or spin-off) that potentially will trigger a price increase near term or midterm.
What other factors influenced the portfolio’s performance?
International stock markets posted generally positive returns during the reporting period, due to productivity gains among corporations, continued economic expansion in the U.S. and parts of Asia, and low inflation and interest rates. Japan rallied on a more favorable outlook for domestic consumption. Corporate restructuring and merger activity helped support investor sentiment in parts of Europe.
Among the most impressive stories of 2005 was the economic rebound in Japan during the second half of the year.On the heels of major reforms of its banking system, rising employment and improved local sentiment has sparked a turnaround in domestic consumption, helping boost many retail and financial stocks. In addition, the country has benefited from rising exports. In fact, Japan led the developed international markets during the fourth quarter of 2005. However, the portfolio’s emphasis on electric component manufacturers, which lagged due to increased competition from Chinese companies, and light exposure to better-performing financial and capital good companies contributed to the portfolio’s underper-formance relative to the MSCI EAFE Index.
In addition, oil prices weighed heavily on the portfolio’s specialty chemical and paper companies. Producers have been reluctant to pass higher energy costs on to the consumer.As a result, profit margins have declined over the near term.
On the other hand, the portfolio achieved relatively strong gains in the United Kingdom, mainly by avoiding local retailers, and taking advantage of opportunities in industrials, energy and materials. Performance was also relatively strong in Italy and Spain, where we avoided telecommunications companies that were making what we believed to be expensive acquisitions.The portfolio delivered attractive results from a handful of Japanese banks that rebounded in the wake of long-awaited banking reforms.To a lesser degree, several Italian banks also fared well.
The portfolio also achieved impressive results in the emerging markets, where steady global economic growth triggered greater demand for developing countries’ exports of oil, iron and other natural resources. Brazilian oil company Petroleo Brasileiro posted attractive returns in 2005. Another clear winner in the emerging markets included Korea Electric Power,which benefited from the growing demand for electricity.
What is the portfolio’s current strategy?
As of the end of the reporting period, we have found a number of attractively valued investment opportunities in Europe, most notably in Germany where companies are focused on restructuring. In Japan, we continue to find opportunities in domestically oriented companies across several industries, including paper, finance, and housing. As always, we have continued to look for stocks with strong underlying fundamentals that may have been overlooked by investors and therefore are selling at discounted prices.
| | | Investing in foreign companies involves special risks, including changes in currency rates, |
| | | political, economic and social instability, a lack of comprehensive company information, |
| | | differing auditing and legal standards and less market liquidity. An investment in this fund |
| | | should be considered only as a supplement to an overall investment program. |
| | | The portfolio is only available as a funding vehicle under variable life insurance policies or variable |
| | | annuity contracts issued by insurance companies. Individuals may not purchase shares of the |
| | | portfolio directly. A variable annuity is an insurance contract issued by an insurance company that |
| | | enables investors to accumulate assets on a tax-deferred basis for retirement or other long-term |
| | | goals.The investment objective and policies of Dreyfus Variable Investment Fund, International |
| | | Value Portfolio made available through insurance products may be similar to other funds/portfolios |
| | | managed or advised by Dreyfus. However, the investment results of the portfolio may be higher or |
| | | lower than, and may not be comparable to, those of any other Dreyfus fund/portfolio. |
| 1 | | Total return includes reinvestment of dividends and any capital gains paid. Past performance is no |
| | | guarantee of future results. Share price and investment return fluctuate such that upon redemption, |
| | | portfolio shares may be worth more or less than their original cost.The portfolio’s performance does |
| | | not reflect the deduction of additional charges and expenses imposed in connection with investing |
| | | in variable insurance contracts, which will reduce returns. Return figures provided reflect the |
| | | absorption of certain portfolio expenses by The Dreyfus Corporation pursuant to an agreement in |
| | | effect through December 31, 2006, at which time it may be extended, terminated or modified. |
| | | Had these expenses not been absorbed, the portfolio’s returns would have been lower. |
| 2 | | SOURCE: LIPPER INC. — Reflects reinvestment of net dividends and, where applicable, |
| | | capital gain distributions.The Morgan Stanley Capital International Europe, Australasia, Far |
| | | East (MSCI EAFE) Index is an unmanaged index composed of a sample of companies |
| | | representative of the market structure of European and Pacific Basin countries. |
The Portfolio 5
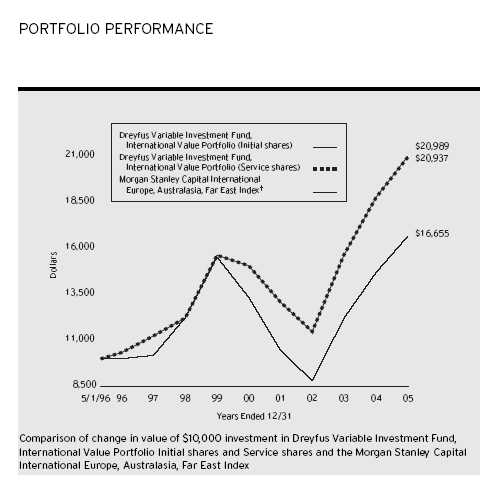
| Average Annual Total Returns as of 12/31/05 | | | | |
| | | Inception | | | | | | From |
| | | Date | | 1 Year | | 5 Years | | Inception |
| |
| |
| |
| |
|
| Initial shares | | 5/1/96 | | 11.89% | | 6.88% | | 7.97% |
| Service shares | | 5/1/96 | | 11.69% | | 6.83% | | 7.94% |
| The data for Service shares includes the results of Initial shares for the period prior to December 31, 2000 |
| (inception date of Service shares). Actual Service shares’ average annual total return and hypothetical growth |
| results would have been lower. See notes below. |
| † Source: Lipper Inc. |
| Past performance is not predictive of future performance.The portfolio’s performance shown in the graph and table does not |
| reflect the deduction of taxes that a shareholder would pay on portfolio distributions or the redemption of portfolio shares. |
| The portfolio’s performance does not reflect the deduction of additional charges and expenses imposed in |
| connection with investing in variable insurance contracts which will reduce returns. |
| The above graph compares a $10,000 investment made in Initial and Service shares of Dreyfus Variable Investment |
| Fund, International Value Portfolio on 5/1/96 (inception date of Initial shares) to a $10,000 investment made in the |
| Morgan Stanley Capital International Europe, Australasia, Far East Index (the “Index”) on that date. |
6
The portfolio’s Initial shares are not subject to a Rule 12b-1 fee.The portfolio’s Service shares are subject to a 0.25% annual Rule 12b-1 fee.The performance figures for Service shares reflect the performance of the portfolio’s Initial shares from their inception date through December 30, 2000, and the performance of the portfolio’s Service shares from December 31, 2000 (inception date of Service shares) to December 31, 2005 (blended performance figures).The performance figures for each share class reflect certain expense reimbursements, without which the performance of each share class would have been lower. In addition, the blended performance figures have not been adjusted to reflect the higher operating expenses of the Service shares. If these expenses had been reflected, the blended performance figures would have been lower. All dividends and capital gain distributions are reinvested.
The portfolio’s performance shown in the line graph takes into account all applicable portfolio fees and expenses (after any expense reimbursements).The Index is an unmanaged index composed of a sample of companies representative of the market structure of European and Pacific Basin countries and includes net dividends reinvested.The Index does not take into account charges, fees and other expenses. Further information relating to portfolio performance, including expense reimbursements, if applicable, is contained in the Financial Highlights section of the prospectus and elsewhere in this report.
UNDERSTANDING YOUR PORTFOLIO’S EXPENSES (Unaudited)
As a mutual fund investor,you pay ongoing expenses,such as management fees and other expenses.Using the information below,you can estimate how these expenses affect your investment and compare them with the expenses of other funds.You also may pay one-time transaction expenses,including sales charges (loads) and redemption fees, which are not shown in this section and would have resulted in higher total expenses. For more information, see your portfolio’s prospectus or talk to your financial adviser.
Review your portfolio’s expenses
The table below shows the expenses you would have paid on a $1,000 investment in Dreyfus Variable Investment Fund, International Value Portfolio from July 1, 2005 to December 31, 2005. It also shows how much a $1,000 investment would be worth at the close of the period, assuming actual returns and expenses.
| Expenses and Value of a $1,000 Investment | | |
| assuming actual returns for the six months ended December 31, 2005 |
| | | Initial Shares | | Service Shares |
| |
| |
|
| Expenses paid per $1,000 † | | $ 5.91 | | $ 7.19 |
| Ending value (after expenses) | | $1,132.00 | | $1,130.00 |
COMPARING YOUR PORTFOLIO’S EXPENSES WITH THOSE OF OTHER FUNDS (Unaudited)
Using the SEC’s method to compare expenses
The Securities and Exchange Commission (SEC) has established guidelines to help investors assess fund expenses. Per these guidelines, the table below shows your portfolio’s expenses based on a $1,000 investment, assuming a hypothetical 5% annualized return. You can use this information to compare the ongoing expenses (but not transaction expenses or total cost) of investing in the portfolio with those of other funds. All mutual fund shareholder reports will provide this information to help you make this comparison. Please note that you cannot use this information to estimate your actual ending account balance and expenses paid during the period.
Expenses and Value of a $1,000 Investment assuming a hypothetical 5% annualized return for the six months ended December 31, 2005
| | | Initial Shares | | Service Shares |
| |
| |
|
| Expenses paid per $1,000 † | | $ 5.60 | | $ 6.82 |
| Ending value (after expenses) | | $1,019.66 | | $1,018.45 |
† Expenses are equal to the portfolio’s annualized expense ratio of 1.10% for Initial shares and 1.34% for Service shares, multiplied by the average account value over the period, multiplied by 184/365 (to reflect the one-half year period).
STATEMENT OF INVESTMENTS
December 31, 2005
|
| Common Stocks—97.1% | | Shares | | Value ($) |
| |
| |
|
| Australia—1.7% | | | | |
| Amcor | | 219,726 | | 1,204,753 |
| National Australia Bank | | 58,436 | | 1,389,702 |
| | | | | 2,594,455 |
| Belgium—.9% | | | | |
| Fortis | | 42,650 | | 1,356,504 |
| Brazil—.9% | | | | |
| Petroleo Brasileiro, ADR | | 12,520 | | 892,300 |
| Telecomunicacoes Brasileiras, ADR | | 14,830 | | 509,411 |
| | | | | 1,401,711 |
| Finland—1.6% | | | | |
| M-real, Cl. B | | 166,500 | | 831,071 |
| Nokia | | 17,200 | | 314,317 |
| Nokia, ADR | | 17,530 | | 320,799 |
| UPM-Kymmene | | 48,378 | | 947,588 |
| | | | | 2,413,775 |
| France—10.1% | | | | |
| BNP Paribas | | 18,050 | | 1,459,241 |
| Carrefour | | 52,410 | | 2,453,586 |
| Credit Agricole | | 45,370 | | 1,427,989 |
| France Telecom | | 89,720 | | 2,227,476 |
| Lafarge | | 8,710 | | 782,966 |
| Sanofi-Aventis | | 21,290 | | 1,863,454 |
| Thomson | | 46,690 | | 977,481 |
| Total | | 9,780 | | 2,454,684 |
| Valeo | | 37,458 | | 1,391,630 |
| | | | | 15,038,507 |
| Germany—8.9% | | | | |
| Allianz | | 6,400 | | 968,571 |
| Deutsche Bank | | 15,910 | | 1,541,223 |
| Deutsche Lufthansa | | 83,937 | | 1,241,008 |
| Deutsche Post | | 101,690 | | 2,468,124 |
| Deutsche Telekom | | 78,230 | | 1,300,978 |
| E.ON | | 9,229 | | 954,719 |
STATEMENT OF INVESTMENTS (continued)
|
| Common Stocks (continued) | | Shares | | Value ($) |
| |
| |
|
| Germany (continued) | | | | |
| Hannover Rueckversicherung | | 34,760 | | 1,226,846 |
| Infineon Technologies | | 134,860 a | | 1,233,031 |
| Medion | | 9,600 | | 131,830 |
| Metro | | 15,430 | | 744,442 |
| Schering | | 6,580 | | 440,119 |
| Volkswagen | | 18,950 | | 1,001,684 |
| | | | | 13,252,575 |
| Greece—.5% | | | | |
| Public Power | | 33,110 | | 722,940 |
| Hong Kong—1.2% | | | | |
| Bank of East Asia | | 455,411 | | 1,374,427 |
| Citic Pacific | | 171,400 | | 473,071 |
| | | | | 1,847,498 |
| Ireland—1.3% | | | | |
| Bank of Ireland | | 122,176 | | 1,921,980 |
| Italy—3.6% | | | | |
| Banco Popolare di Verona e Novara | | 26,710 | | 539,917 |
| Benetton Group | | 51,000 | | 580,305 |
| ENI | | 60,395 | | 1,673,727 |
| Finmeccanica | | 21,770 | | 421,005 |
| UniCredito Italiano | | 276,970 | | 1,906,633 |
| Unipol | | 109,050 | | 305,822 |
| | | | | 5,427,409 |
| Japan—26.6% | | | | |
| 77 Bank | | 133,500 | | 1,013,480 |
| Aeon | | 40,000 | | 1,016,734 |
| Aiful | | 7,212 | | 601,891 |
| Ajinomoto | | 38,000 | | 388,613 |
| Astellas Pharma | | 19,200 | | 748,316 |
| Canon | | 27,900 | | 1,631,095 |
| Dentsu | | 407 | | 1,324,194 |
| Fuji Heavy Industries | | 106,900 | | 579,674 |
| Fuji Photo Film | | 61,300 | | 2,025,588 |
| Funai Electric | | 9,800 | | 1,083,584 |
| Common Stocks (continued) | | Shares | | Value ($) |
| |
| |
|
| Japan (continued) | | | | |
| JS Group | | 52,800 | | 1,055,776 |
| Kao | | 47,200 | | 1,263,732 |
| KDDI | | 333 | | 1,918,577 |
| Kuraray | | 83,900 | | 868,679 |
| Mabuchi Motor | | 19,800 | | 1,098,835 |
| Matsumotokiyoshi | | 13,000 | | 410,845 |
| Minebea | | 117,800 | | 627,801 |
| Mitsubishi UFJ Financial Group | | 80 | | 1,084,516 |
| Murata Manufacturing | | 7,400 | | 474,001 |
| Nippon Express | | 335,500 | | 2,043,842 |
| Nippon Paper Group | | 142 | | 567,880 |
| Nissan Motor | | 199,600 | | 2,020,945 |
| ORIX | | 2,700 | | 687,439 |
| Ricoh | | 74,300 | | 1,299,975 |
| Rinnai | | 40,400 | | 956,729 |
| Rohm | | 19,400 | | 2,108,892 |
| Sekisui Chemical | | 159,300 | | 1,077,072 |
| Sekisui House | | 97,400 | | 1,224,669 |
| Shin-Etsu Chemical | | 15,000 | | 796,865 |
| Shinsei Bank | | 167,000 | | 964,999 |
| Skylark | | 58,100 | | 925,465 |
| Sohgo Security Services | | 21,794 | | 333,304 |
| Sumitomo Bakelite | | 47,300 | | 390,343 |
| Sumitomo Chemical | | 36,300 | | 249,125 |
| Sumitomo Mitsui Financial Group | | 211 | | 2,234,696 |
| Takefuji | | 24,070 | | 1,633,558 |
| TDK | | 2,600 | | 179,098 |
| Toyoda Gosei | | 35,900 | | 699,598 |
| | | | | 39,610,425 |
| Mexico—1.2% | | | | |
| Coca-Cola Femsa, ADR | | 33,400 | | 902,134 |
| Telefonos de Mexico, ADR | | 33,372 | | 823,621 |
| | | | | 1,725,755 |
STATEMENT OF INVESTMENTS (continued)
|
| Common Stocks (continued) | | Shares | | Value ($) |
| |
| |
|
| Netherlands—6.6% | | | | |
| ABN AMRO Holding | | 43,838 | | 1,145,401 |
| Aegon | | 77,783 | | 1,265,024 |
| Heineken | | 58,609 | | 1,856,463 |
| Koninklijke Philips Electronics | | 54,850 | | 1,703,010 |
| Royal Dutch Shell, Cl. A | | 66,995 | | 2,042,851 |
| VNU | | 15,290 | | 506,561 |
| Wolters Kluwer | | 62,365 | | 1,259,912 |
| | | | | 9,779,222 |
| Portugal—.7% | | | | |
| Energias de Portugal | | 328,560 | | 1,010,414 |
| Singapore—1.9% | | | | |
| DBS Group Holdings | | 173,930 | | 1,725,807 |
| United Overseas Bank | | 120,600 | | 1,058,849 |
| | | | | 2,784,656 |
| South Africa—1.8% | | | | |
| Anglo American | | 54,885 | | 1,868,328 |
| Nedbank Group | | 53,020 | | 838,791 |
| | | | | 2,707,119 |
| South Korea—1.6% | | | | |
| Korea Electric Power, ADR | | 32,340 | | 630,307 |
| KT, ADR | | 38,300 | | 825,365 |
| SK Telecom, ADR | | 46,170 | | 936,789 |
| | | | | 2,392,461 |
| Spain—2.4% | | | | |
| Banco Sabadell | | 19,620 | | 514,257 |
| Banco Santander Central Hispano | | 33,350 | | 439,827 |
| Endesa | | 27,530 | | 723,538 |
| Gamesa Corp Tecnologica | | 12,500 | | 182,743 |
| Repsol YPF | | 22,530 | | 657,418 |
| Repsol YPF, ADR | | 35,340 | | 1,039,349 |
| | | | | 3,557,132 |
| Sweden—.8% | | | | |
| Svenska Cellulosa, Cl. B | | 32,140 | | 1,200,611 |
| Common Stocks (continued) | | Shares | | Value ($) |
| |
| |
|
| Switzerland—6.3% | | | | |
| Ciba Specialty Chemicals | | 27,896 | | 1,802,889 |
| Clariant | | 51,460 | | 757,110 |
| Lonza Group | | 5,970 | | 364,954 |
| Nestle | | 5,215 | | 1,558,314 |
| Novartis | | 31,970 | | 1,678,474 |
| Swiss Reinsurance | | 22,090 | | 1,615,768 |
| UBS | | 17,700 | | 1,683,600 |
| | | | | 9,461,109 |
| Taiwan—.6% | | | | |
| United Microelectronics, ADR | | 293,299 | | 915,093 |
| United Kingdom—15.9% | | | | |
| BAA | | 106,466 | | 1,148,239 |
| BAE Systems | | 74,066 | | 486,353 |
| Barclays | | 154,320 | | 1,621,874 |
| Boots Group | | 149,676 | | 1,557,619 |
| BP | | 195,566 | | 2,082,273 |
| BT Group | | 207,116 | | 793,570 |
| Centrica | | 396,950 | | 1,739,417 |
| Diageo | | 99,234 | | 1,438,084 |
| GKN | | 107,734 | | 533,702 |
| GlaxoSmithKline | | 97,100 | | 2,453,549 |
| HSBC Holdings | | 81,774 | | 1,312,353 |
| J Sainsbury | | 145,258 | | 787,678 |
| Marks & Spencer Group | | 54,768 | | 475,742 |
| Rexam | | 58,165 | | 508,252 |
| Royal Bank of Scotland Group | | 85,463 | | 2,579,936 |
| Trinity Mirror | | 10,800 | | 106,447 |
| Unilever | | 160,103 | | 1,587,642 |
| Vodafone Group | | 1,189,978 | | 2,568,836 |
| | | | | 23,781,566 |
| Total Common Stocks | | | | |
| (cost $123,282,284) | | | | 144,902,917 |
| | STATEMENT OF INVESTMENTS (continued)
|
| | | Principal | | |
| Short-Term Investment—1.7% | | Amount ($) | | Value ($) |
| |
| |
|
| U.S. Treasury Bill; | | | | |
| 3.66%, 3/2/2006 | | | | |
| (cost $2,516,555) | | 2,532,000 | | 2,516,251 |
| |
| |
|
| Total Investments (cost $125,798,839) | | 98.8% | | 147,419,168 |
| Cash and Receivables (Net) | | 1.2% | | 1,823,687 |
| Net Assets | | 100.0% | | 149,242,855 |
| | ADR—American Depository Receipts.
a Non-income producing.
|
| Portfolio Summary (Unaudited) † | | | | |
| |
| | | Value (%) | | | | Value (%) |
| |
| |
| |
|
| Banking | | 15.6 | | Chemicals | | 3.2 |
| Financial Services | | 7.9 | | Electronic Components | | |
| Telecommunications | | 6.7 | | and Instruments | | 3.2 |
| Food and Household Products | | 5.7 | | Forest and Paper Products | | 3.2 |
| Energy | | 5.4 | | Miscellaneous | | 3.0 |
| Heath Care | | 4.5 | | Other | | 33.6 |
| Transportation | | 3.4 | | | | |
| Utilities | | 3.4 | | | | 98.8 |
| |
| † Based on net assets. | | | | | | |
| See notes to financial statements. | | | | | | |
STATEMENT OF ASSETS AND LIABILITIES
December 31, 2005
| | | Cost | | Value |
| |
| |
|
| Assets ($): | | | | |
| Investments in securities—See Statement of Investments | | 125,798,839 | | 147,419,168 |
| Cash | | | | 481,193 |
| Cash denominated in foreign currencies | | 1,851,347 | | 1,845,217 |
| Receivable for investment securities sold | | | | 735,775 |
| Dividends receivable | | | | 330,013 |
| Receivable for shares of Beneficial Interest subscribed | | | | 282,377 |
| Unrealized appreciation on forward | | | | |
| currency exchange contracts—Note 4 | | | | 32 |
| Prepaid expenses | | | | 1,259 |
| | | | | 151,095,034 |
| |
| |
|
| Liabilities ($): | | | | |
| Due to The Dreyfus Corporation and affiliates—Note 3(b) | | | | 140,214 |
| Payable for investment securities purchased | | | | 1,180,210 |
| Payable for shares of Beneficial Interest redeemed | | | | 482,822 |
| Unrealized depreciation on forward | | | | |
| currency exchange contracts—Note 4 | | | | 166 |
| Accrued expenses | | | | 48,767 |
| | | | | 1,852,179 |
| |
| |
|
| Net Assets ($) | | | | 149,242,855 |
| |
| |
|
| Composition of Net Assets ($): | | | | |
| Paid-in capital | | | | 114,262,438 |
| Accumulated undistributed investment income—net | | | | 1,875,213 |
| Accumulated net realized gain (loss) on investments | | | | 11,494,474 |
| Accumulated net unrealized appreciation (depreciation) | | | | |
| on investments and foreign currency transactions | | | | 21,610,730 |
| |
| |
|
| Net Assets ($) | | | | 149,242,855 |
| |
| |
|
| |
| |
| Net Asset Value Per Share | | | | |
| | | Initial Shares | | Service Shares |
| |
| |
|
| Net Assets ($) | | 94,988,155 | | 54,254,700 |
| Shares Outstanding | | 5,432,178 | | 3,105,458 |
| |
| |
|
| Net Asset Value Per Share ($) | | 17.49 | | 17.47 |
See notes to financial statements.
|
STATEMENT OF OPERATIONS
Year Ended December 31, 2005
|
| Investment Income ($): | | |
| Income: | | |
| Cash dividends (net of $330,204 foreign taxes withheld at source) | | 3,343,484 |
| Interest | | 78,434 |
| Total Income | | 3,421,918 |
| Expenses: | | |
| Investment advisory fee—Note 3(a) | | 1,351,536 |
| Custodian fees | | 183,784 |
| Distribution fees—Note 3(b) | | 107,586 |
| Professional fees | | 32,113 |
| Prospectus and shareholders’ reports | | 21,131 |
| Trustees’ fees and expenses—Note 3(c) | | 9,846 |
| Shareholder servicing costs—Note 3(b) | | 6,287 |
| Loan commitment fees—Note 2 | | 680 |
| Registration fees | | 425 |
| Miscellaneous | | 17,950 |
| Total Expenses | | 1,731,338 |
| Less—waiver of fees due to | | |
| undertaking—Note 3(a) | | (22,937) |
| Less—reduction in custody fees | | |
| due to earnings credits—Note 1(c) | | (44,118) |
| Net Expenses | | 1,664,283 |
| Investment Income—Net | | 1,757,635 |
| |
|
| Realized and Unrealized Gain (Loss) on Investments—Note 4 ($): |
| Net realized gain (loss) on investments and foreign currency transactions | | 14,233,455 |
| Net realized gain (loss) on forward currency exchange contracts | | (139,718) |
| Net Realized Gain (Loss) | | 14,093,737 |
| Net unrealized appreciation (depreciation) on investments | | |
| and foreign currency transactions | | (669,066) |
| Net Realized and Unrealized Gain (Loss) on Investments | | 13,424,671 |
| Net Increase in Net Assets Resulting from Operations | | 15,182,306 |
See notes to financial statements.
|
STATEMENT OF CHANGES IN NET ASSETS
| | | Year Ended December 31, |
| |
|
| | | 2005 | | 2004 |
| |
| |
|
| Operations ($): | | | | |
| Investment income—net | | 1,757,635 | | 865,155 |
| Net realized gain (loss) on investments | | 14,093,737 | | 7,632,545 |
| Net unrealized appreciation | | | | |
| (depreciation) on investments | | (669,066) | | 9,969,437 |
| Net Increase (Decrease) in Net Assets | | | | |
| Resulting from Operations | | 15,182,306 | | 18,467,137 |
| |
| |
|
| Dividends to Shareholders from ($): | | | | |
| Investment income—net: | | | | |
| Initial shares | | — | | (870,666) |
| Service shares | | — | | (257,284) |
| Net realized gain on investments: | | | | |
| Initial shares | | (1,331,789) | | (1,271,294) |
| Service shares | | (527,874) | | (468,090) |
| Total Dividends | | (1,859,663) | | (2,867,334) |
| |
| |
|
| Beneficial Interest Transactions ($): | | | | |
| Net proceeds from shares sold: | | | | |
| Initial shares | | 37,251,329 | | 40,833,715 |
| Service shares | | 25,773,157 | | 28,518,845 |
| Dividends reinvested: | | | | |
| Initial shares | | 1,331,789 | | 2,141,960 |
| Service shares | | 527,874 | | 725,374 |
| Cost of shares redeemed: | | | | |
| Initial shares | | (40,886,960) | | (25,431,592) |
| Service shares | | (10,908,937) | | (5,117,977) |
| Increase (Decrease) in Net Assets from | | | | |
| Beneficial Interest Transactions | | 13,088,252 | | 41,670,325 |
| Total Increase (Decrease) in Net Assets | | 26,410,895 | | 57,270,128 |
| |
| |
|
| Net Assets ($): | | | | |
| Beginning of Period | | 122,831,960 | | 65,561,832 |
| End of Period | | 149,242,855 | | 122,831,960 |
| Undistributed (distributions in excess of) | | | | |
| investment income—net | | 1,875,213 | | (31,947) |
STATEMENT OF CHANGES IN NET ASSETS (continued)
|
| | | Year Ended December 31, |
| |
|
| | | 2005 | | 2004 |
| |
| |
|
| Capital Share Transactions: | | | | |
| Initial Shares | | | | |
| Shares sold | | 2,332,353 | | 2,873,243 |
| Shares issued for dividends reinvested | | 85,481 | | 140,767 |
| Shares redeemed | | (2,584,421) | | (1,762,671) |
| Net Increase (Decrease) in Shares Outstanding | | (166,587) | | 1,251,339 |
| |
| |
|
| Service Shares | | | | |
| Shares sold | | 1,598,408 | | 1,966,357 |
| Shares issued for dividends reinvested | | 33,860 | | 47,425 |
| Shares redeemed | | (677,869) | | (357,787) |
| Net Increase (Decrease) in Shares Outstanding | | 954,399 | | 1,655,995 |
See notes to financial statements.
|
The following tables describe the performance for each share class for the fiscal periods indicated.All information (except portfolio turnover rate) reflects financial results for a single portfolio share. Total return shows how much your investment in the portfolio would have increased (or decreased) during each period, assuming you had reinvested all dividends and distributions.These figures have been derived from the portfolio’s financial statements.
| | | | | Year Ended December 31, | | |
| |
| |
| |
|
| Initial Shares | | 2005 | | 2004 | | 2003 | | 2002 | | 2001 |
| |
| |
| |
| |
| |
|
| Per Share Data ($): | | | | | | | | | | |
| Net asset value, beginning of period | | 15.85 | | 13.54 | | 10.04 | | 11.56 | | 13.52 |
| Investment Operations: | | | | | | | | | | |
| Investment income—net a | | .22 | | .16 | | .12 | | .12 | | .12 |
| Net realized and unrealized | | | | | | | | | | |
| gain (loss) on investments | | 1.64 | | 2.54 | | 3.51 | | (1.53) | | (1.90) |
| Total from Investment Operations | | 1.86 | | 2.70 | | 3.63 | | (1.41) | | (1.78) |
| Distributions: | | | | | | | | | | |
| Dividends from investment income—net | | — | | (.16) | | (.13) | | (.11) | | (.11) |
| Dividends from net realized | | | | | | | | | | |
| gain on investments | | (.22) | | (.23) | | — | | — | | — |
| Dividends in excess of net | | | | | | | | | | |
| realized gain on investments | | — | | — | | — | | — | | (.07) |
| Total Distributions | | (.22) | | (.39) | | (.13) | | (.11) | | (.18) |
| Net asset value, end of period | | 17.49 | | 15.85 | | 13.54 | | 10.04 | | 11.56 |
| |
| |
| |
| |
| |
|
| Total Return (%) | | 11.89 | | 20.02 | | 36.36 | | (12.23) | | (13.22) |
| |
| |
| |
| |
| |
|
| Ratios/Supplemental Data (%): | | | | | | | | | | |
| Ratio of total expenses | | | | | | | | | | |
| to average net assets | | 1.20 | | 1.25 | | 1.49 | | 1.47 | | 1.60 |
| Ratio of net expenses | | | | | | | | | | |
| to average net assets | | 1.17 | | 1.24 | | 1.41 | | 1.40 | | 1.40 |
| Ratio of net investment income | | | | | | | | | | |
| to average net assets | | 1.39 | | 1.08 | | 1.11 | | 1.10 | | .97 |
| Portfolio Turnover Rate | | 54.32 | | 44.05 | | 107.73 | | 47.18 | | 49.34 |
| |
| |
| |
| |
| |
|
| Net Assets, end of period ($ x 1,000) | | 94,988 | | 88,713 | | 58,849 | | 27,549 | | 21,602 |
| |
| a Based on average shares outstanding at each month end. | | | | | | | | |
| See notes to financial statements. | | | | | | | | | | |
FINANCIAL HIGHLIGHTS (continued)
|
| | | | | Year Ended December 31, | | |
| |
| |
| |
|
| Service Shares | | 2005 | | 2004 | | 2003 | | 2002 | | 2001 |
| |
| |
| |
| |
| |
|
| Per Share Data ($): | | | | | | | | | | |
| Net asset value, beginning of period | | 15.86 | | 13.56 | | 10.06 | | 11.58 | | 13.52 |
| Investment Operations: | | | | | | | | | | |
| Investment income—net a | | .18 | | .06 | | .14 | | .12 | | .05 |
| Net realized and unrealized | | | | | | | | | | |
| gain (loss) on investments | | 1.65 | | 2.62 | | 3.49 | | (1.54) | | (1.81) |
| Total from Investment Operations | | 1.83 | | 2.68 | | 3.63 | | (1.42) | | (1.76) |
| Distributions: | | | | | | | | | | |
| Dividends from investment income—net | | — | | (.15) | | (.13) | | (.10) | | (.11) |
| Dividends from net realized | | | | | | | | | | |
| gain on investments | | (.22) | | (.23) | | — | | — | | — |
| Dividends in excess of net | | | | | | | | | | |
| realized gain on investments | | — | | — | | — | | — | | (.07) |
| Total Distributions | | (.22) | | (.38) | | (.13) | | (.10) | | (.18) |
| Net asset value, end of period | | 17.47 | | 15.86 | | 13.56 | | 10.06 | | 11.58 |
| |
| |
| |
| |
| |
|
| Total Return (%) | | 11.69 | | 19.83 | | 36.28 | | (12.25) | | (13.07) |
| |
| |
| |
| |
| |
|
| Ratios/Supplemental Data (%): | | | | | | | | | | |
| Ratio of total expenses | | | | | | | | | | |
| to average net assets | | 1.45 | | 1.49 | | 1.75 | | 1.66 | | 1.99 |
| Ratio of net expenses | | | | | | | | | | |
| to average net assets | | 1.36 | | 1.39 | | 1.41 | | 1.40 | | 1.40 |
| Ratio of net investment income | | | | | | | | | | |
| to average net assets | | 1.10 | | .44 | | 1.29 | | 1.07 | | .44 |
| Portfolio Turnover Rate | | 54.32 | | 44.05 | | 107.73 | | 47.18 | | 49.34 |
| |
| |
| |
| |
| |
|
| Net Assets, end of period ($ x 1,000) | | 54,255 | | 34,119 | | 6,713 | | 4,441 | | 2,148 |
| |
| a Based on average shares outstanding at each month end. | | | | | | | | |
| See notes to financial statements. | | | | | | | | | | |
NOTES TO FINANCIAL STATEMENTS
NOTE 1—Significant Accounting Policies:
Dreyfus Variable Investment Fund (the “fund”) is registered under the Investment Company Act of 1940, as amended (the “Act”), as an open-end management investment company, operating as a series company currently offering twelve series, including the International Value Portfolio (the “portfolio”). The portfolio is only offered to separate accounts established by insurance companies to fund variable annuity contracts and variable life insurance policies.The portfolio is a diversified series. The portfolio’s investment objective is long-term capital growth.The Dreyfus Corporation (the “Manager” or “Dreyfus”) serves as the portfolio’s investment adviser. The Manager is a wholly-owned subsidiary of Mellon Financial Corporation (“Mellon Financial”).
Dreyfus Service Corporation (the “Distributor”), a wholly-owned subsidiary of the Manager, is the distributor of the portfolio’s shares, which are sold without a sales charge. The portfolio is authorized to issue an unlimited number of $.001 par value shares of Beneficial Interest in each of the following classes of shares: Initial and Service. Each class of shares has identical rights and privileges, except with respect to the distribution plan and the expenses borne by each class and certain voting rights. Income, expenses (other than expenses attributable to a specific class), and realized and unrealized gains or losses on investments are allocated to each class of shares based on its relative net assets.
The fund accounts separately for the assets, liabilities and operations of each series. Expenses directly attributable to each series are charged to that series’ operations; expenses which are applicable to all series are allocated among them on a pro rata basis.
The portfolio’s financial statements are prepared in accordance with U.S. generally accepted accounting principles, which may require the use of management estimates and assumptions.Actual results could differ from those estimates.
NOTES TO FINANCIAL STATEMENTS (continued)
|
The fund enters into contracts that contain a variety of indemnifica-tions.The portfolio’s maximum exposure under these arrangements is unknown. The portfolio does not anticipate recognizing any loss related to these arrangements.
(a) Portfolio valuation: Investments in securities are valued at the last sales price on the securities exchange or national securities market on which such securities are primarily traded. Securities listed on the National Market System for which market quotations are available are valued at the official closing price or, if there is no official closing price that day, at the last sales price. Securities not listed on an exchange or the national securities market, or securities for which there were no transactions, are valued at the average of the most recent bid and asked prices, except for open short positions, where the asked price is used for valuation purposes. Bid price is used when no asked price is available. Investments in registered investment companies are valued at their net asset value.When market quotations or official closing prices are not readily available, or are determined not to reflect accurately fair value, such as when the value of a security has been significantly affected by events after the close of the exchange or market on which the security is principally traded (for example, a foreign exchange or market), but before the portfolio calculates its net asset value, the portfolio may value these investments at fair value as determined in accordance with the procedures approved by the Board of Trustees. Fair valuing of securities may be determined with the assistance of a pricing service using calculations based on indices of domestic securities and other appropriate indicators, such as prices of relevant ADR’s and futures contracts. For other securities that are fair valued by the Board of Trustees, certain factors may be considered such as: fundamental analytical data, the nature and duration of restrictions on disposition, an evaluation of the forces that influence the market in which the securities are purchased and sold and public trading in similar securities of the issuer or comparable issuers. Financial futures are valued at the last sales price. Investments denominated in foreign currencies are translated to U.S. dollars at the prevailing rates of exchange. Forward currency exchange contracts are valued at the forward rate.
(b) Foreign currency transactions: The portfolio does not isolate that portion of the results of operations resulting from changes in foreign exchange rates on investments from the fluctuations arising from changes in market prices of securities held. Such fluctuations are included with the net realized and unrealized gain or loss on investments.
Net realized foreign exchange gains or losses arise from sales and maturities of short-term securities, sales of foreign currencies, currency gains or losses realized on securities transactions and the difference between the amounts of dividends, interest and foreign withholding taxes recorded on the portfolio’s books and the U.S. dollar equivalent of the amounts actually received or paid. Net unrealized foreign exchange gains or losses arise from changes in the value of assets and liabilities other than investments in securities, resulting from changes in exchange rates. Such gains and losses are included with net realized and unrealized gain or loss on investments.
(c) Securities transactions and investment income: Securities transactions are recorded on a trade date basis. Realized gain and loss from securities transactions are recorded on the identified cost basis. Dividend income is recognized on the ex-dividend date and interest income, including, where applicable, accretion of discount and amortization of premium on investments, is recognized on the accrual basis.
The portfolio has an arrangement with the custodian bank whereby the portfolio receives earnings credits from the custodian when positive cash balances are maintained, which are used to offset custody fees. For financial reporting purposes, the portfolio includes net earnings credits as an expense offset in the Statement of Operations.
(d) Dividends to shareholders: Dividends are recorded on the ex-dividend date. Dividends from investment income-net and dividends from net realized capital gain, if any, are normally declared and paid annually, but the portfolio may make distributions on a more frequent basis to comply with the distribution requirements of the Internal Revenue Code of 1986, as amended (the “Code”).To the extent that net realized capital gain can be offset by capital loss carryovers, if any, it is the policy
NOTES TO FINANCIAL STATEMENTS (continued)
|
of the portfolio not to distribute such gain. Income and capital gain distributions are determined in accordance with income tax regulations, which may differ from U.S. generally accepted accounting principles.
(e) Federal income taxes: It is the policy of the portfolio to continue to qualify as a regulated investment company, if such qualification is in the best interests of its shareholders, by complying with the applicable provisions of the Code, and to make distributions of taxable income sufficient to relieve it from substantially all federal income and excise taxes.
At December 31, 2005, the components of accumulated earnings on a tax basis were as follows: undistributed ordinary income $5,531,231, undistributed capital gains $9,650,856 and unrealized appreciation $19,798,330.
The tax character of distributions paid to shareholders during the fiscal periods ended December 31, 2005 and December 31, 2004 were as follows: ordinary income $639,526 and $1,127,950 and long-term capital gains $1,220,137 and $1,739,384, respectively.
During the period ended December 31, 2005, as a result of permanent book to tax differences, primarily due to the tax treatment for passive foreign investment companies and foreign currency transactions, the portfolio increased accumulated undistributed investment income-net by $149,525 and decreased accumulated net realized gain (loss) on investments by the same amount. Net assets were not affected by this reclassification.
NOTE 2—Bank Line of Credit:
The portfolio participates with other Dreyfus-managed funds in a $350 million redemption credit facility (the “Facility”) to be utilized for temporary or emergency purposes, including the financing of redemptions. In connection therewith, the portfolio has agreed to pay commitment fees on its pro rata portion of the Facility. Interest is charged to the portfolio based on prevailing market rates in effect at the time of borrowing. During the period ended December 31, 2005, the portfolio did not borrow under the Facility.
NOTE 3—Investment Advisory Fee and Other Transactions With Affiliates:
(a) Pursuant to an Investment Advisory Agreement with the Manager, the investment advisory fee is computed at the annual rate of 1% of the value of the portfolio’s average daily net assets and is payable monthly.
The Manager has agreed, from January 1, 2005 to December 31, 2006, to waive receipt of its fees and/or assume the expenses of the portfolio so that the expenses of neither class, exclusive of taxes, brokerage fees, interest on borrowings, commitment fees and extraordinary expenses, exceed an annual rate of 1.40% of the value of the average daily net assets of their class. During the period ended December 31, 2005, the Manager waived receipt of fees of $22,937, pursuant to the undertaking.
(b) Under the Distribution Plan (the “Plan”) adopted pursuant to Rule 12b-1 under the Act, Service shares pay the Distributor for distributing their shares, for servicing and/or maintaining Service shares shareholder accounts and for advertising and marketing for Service shares.The Plan provides for payments to be made at an annual rate of .25% of the value of the Service shares’ average daily net assets.The Distributor may make payments to Participating Insurance Companies and to brokers and dealers acting as principal underwriter for their variable insurance products.The fees payable under the Plan are payable without regard to actual expenses incurred. During the period ended December 31, 2005, Service shares were charged $107,586 pursuant to the Plan.
The portfolio compensates Dreyfus Transfer, Inc., a wholly-owned subsidiary of the Manager, under a transfer agency agreement for providing personnel and facilities to perform transfer agency services for the portfolio. During the period ended December 31, 2005, the portfolio was charged $357 pursuant to the transfer agency agreement.
During the period ended December 31, 2005, the portfolio was charged $3,762 for services performed by the Chief Compliance Officer.
The Portfolio 25
NOTES TO FINANCIAL STATEMENTS (continued)
|
The components of Due to The Dreyfus Corporation and affiliates in the Statement of Assets and Liabilities consist of: investment advisory fees $126,861, Rule 12b-1 distribution plan fees $11,467, chief compliance officer fees $1,858 and transfer agency per account fees $28.
(c) Each Board member also serves as a Board member of other funds within the Dreyfus complex. Annual retainer fees and attendance fees are allocated to each fund based on net assets.
NOTE 4—Securities Transactions:
The aggregate amount of purchases and sales of investment securities, excluding short-term securities and forward currency exchange contracts, during the period ended December 31, 2005, amounted to $79,699,890 and $70,460,652, respectively.
The portfolio enters into forward currency exchange contracts in order to hedge its exposure to changes in foreign currency exchange rates on its foreign portfolio holdings and to settle foreign currency transactions. When executing forward currency exchange contracts, the portfolio is obligated to buy or sell a foreign currency at a specified rate on a certain date in the future. With respect to sales of forward currency exchange contracts, the portfolio would incur a loss if the value of the contract increases between the date the forward contract is opened and the date the forward contract is closed.The portfolio realizes a gain if the value of the contract decreases between those dates.With respect to purchases of forward currency exchange contracts, the portfolio would incur a loss if the value of the contract decreases between the date the forward contract is opened and the date the forward contract is closed. The portfolio realizes a gain if the value of the contract increases between those dates.The portfolio is also exposed to credit risk associated with counterparty nonperformance on these forward currency
exchange contracts which is typically limited to the unrealized gain on each open contract.The following summarizes open forward currency exchange contracts at December 31, 2005:
| | | Foreign | | | | | | Unrealized |
| Forward Currency | | Currency | | | | | | Appreciation |
| Exchange Contracts | | Amounts | | Cost ($) | | Value ($) | | (Depreciation) ($) |
| |
| |
| |
| |
|
| Purchases: | | | | | | | | |
| Australian Dollar, | | | | | | | | |
| expiring 1/4/2006 | | 63,499 | | 46,576 | | 46,608 | | 32 |
| British Pound, | | | | | | | | |
| expiring 1/4/2006 | | 350,000 | | 602,140 | | 602,035 | | (105) |
| Sales; | | | | Proceeds ($) | | | | |
| Swiss Franc, | | | | | | | | |
| expiring 1/4/2006 | | 25,089 | | 19,015 | | 19,076 | | (61) |
| Total | | | | | | | | (134) |
At December 31, 2005, the cost of investments for federal income tax purposes was $127,611,239; accordingly, accumulated net unrealized appreciation on investments was $19,807,929, consisting of $23,213,663 gross unrealized appreciation and $3,405,734 gross unrealized depreciation.
REPORT OF INDEPENDENT REGISTERED PUBLIC ACCOUNTING FIRM
Shareholders and Board of Trustees
Dreyfus Variable Investment Fund, International Value Portfolio
We have audited the accompanying statement of assets and liabilities, including the statement of investments, of Dreyfus Variable Investment Fund, International Value Portfolio (one of the funds comprising Dreyfus Variable Investment Fund) as of December 31, 2005, and the related statement of operations for the year then ended, the statement of changes in net assets for each of the two years in the period then ended, and financial highlights for each of the years indicated therein. These financial statements and financial highlights are the responsibility of the Fund’s management. Our responsibility is to express an opinion on these financial statements and financial highlights based on our audits.
We conducted our audits in accordance with the standards of the Public Company Accounting Oversight Board (United States).Those standards require that we plan and perform the audit to obtain reasonable assurance about whether the financial statements and financial highlights are free of material misstatement.We were not engaged to perform an audit of the Fund’s internal control over financial reporting. Our audits included consideration of internal control over financial reporting as a basis for designing audit procedures that are appropriate in the circumstances,but not for the purpose of expressing an opinion on the effectiveness of the Fund’s internal control over financial reporting.Accordingly, we express no such opinion.An audit also includes examining, on a test basis, evidence supporting the amounts and disclosures in the financial statements and financial highlights, assessing the accounting principles used and significant estimates made by management, and evaluating the overall financial statement presentation. Our procedures included confirmation of securities owned as of December 31, 2005 by correspondence with the custodian and others or by other appropriate auditing procedures where replies from others were not received.We believe that our audits provide a reasonable basis for our opinion.
In our opinion, the financial statements and financial highlights referred to above present fairly, in all material respects, the financial position of Dreyfus Variable Investment Fund, International Value Portfolio at December 31, 2005, the results of its operations for the year then ended, the changes in its net assets for each of the two years in the period then ended, and the financial highlights for each of the indicated years, in conformity with U. S. generally accepted accounting principles.

New York, New York
February 6, 2006
|
IMPORTANT TAX INFORMATION (Unaudited)
In accordance with federal tax law, the portfolio elects to provide each shareholder with their portion of the portfolio’s foreign taxes paid and the income sourced from foreign countries.Accordingly, the portfolio hereby makes the following designations regarding its fiscal year ended December 31, 2005:
—the total amount of taxes paid to foreign countries was $307,521.
—the total amount of income sourced from foreign countries was $2,860,804.
As required by federal tax law rules, shareholders will receive notification of their proportionate share of foreign taxes paid and foreign sourced income for the 2005 calendar year with Form 1099-DIV which will be mailed by January 31, 2006.
Also the portfolio hereby designates $.1429 per share as a long-term capital gain distribution of the $.2178 per share paid on March 30, 2005.
| BOARD MEMBERS INFORMATION (Unaudited) |
| |
| |
| |
| Joseph S. DiMartino (62) |
| Chairman of the Board (1995) |
| Principal Occupation During Past 5 Years: |
| • Corporate Director and Trustee |
| Other Board Memberships and Affiliations: |
| • The Muscular Dystrophy Association, Director |
| • Levcor International, Inc., an apparel fabric processor, Director |
| • Century Business Services, Inc., a provider of outsourcing functions for small and medium size |
| companies, Director |
| • The Newark Group, a provider of a national market of paper recovery facilities, paperboard |
| mills and paperboard converting plants, Director |
| • Sunair Services Corporation, engages in the design, manufacture and sale of high frequency |
| systems for long-range voice and data communications, as well as providing certain outdoor- |
| related services to homes and businesses, Director |
| No. of Portfolios for which Board Member Serves: 193 |
| ——————— |
| David P. Feldman (66) |
| Board Member (1994) |
| Principal Occupation During Past 5 Years: |
| • Corporate Director and Trustee |
| Other Board Memberships and Affiliations: |
| • BBH Mutual Funds Group (11 funds), Director |
| • The Jeffrey Company, a private investment company, Director |
| • QMED, a medical device company, Director |
| No. of Portfolios for which Board Member Serves: 58 |
| ——————— |
| James F. Henry (75) |
| Board Member (1990) |
| Principal Occupation During Past 5 Years: |
| • President, CPR Institute for Dispute Resolution, a non-profit organization principally |
| engaged in the development of alternatives to business litigation (Retired 2003) |
| No. of Portfolios for which Board Member Serves: 22 |
30
| Dr. Paul A. Marks (79) |
| Board Member (1990) |
| Principal Occupation During Past 5 Years: |
| • President, Emeritus (2000-present) and President and Chief Executive Officer of Memorial |
| Sloan-Kettering Cancer Center (Retired 1999) |
| Other Board Memberships and Affiliations: |
| • Pfizer, Inc., a pharmaceutical company, Director-Emeritus |
| • Lazard Freres & Company, LLC, Senior Adviser |
| • Carrot Capital Health Care Ventures, Advisor |
| • Armgo-Start-Up Biotech; Board of Directors |
| • Nanoviricide, Board Director |
| • PTC, Scientific Advisory Board |
| No. of Portfolios for which Board Member Serves: 22 |
| ——————— |
| Dr. Martin Peretz (66) |
| Board Member (1990) |
| Principal Occupation During Past 5 Years: |
| • Editor-in-Chief of The New Republic Magazine |
| • Lecturer in Social Studies at Harvard University (1965-2001) |
| • Co-Chairman of TheStreet.com, a financial daily on the web |
| Other Board Memberships and Affiliations: |
| • Academy for Liberal Education, an accrediting agency for colleges and universities certified by |
| the U.S. Department of Education, Director |
| • Harvard Center for Blood Research,Trustee |
| • Bard College,Trustee |
| • Board of Overseers of YIVO Institute for Jewish Research, Chairman |
| No. of Portfolios for which Board Member Serves: 22 |
| ——————— |
| Once elected all Board Members serve for an indefinite term.The address of the Board Members and Officers is in c/o |
| The Dreyfus Corporation, 200 Park Avenue, New York, New York 10166. Additional information about the Board |
| Members is available in the fund’s Statement of Additional Information which can be obtained from Dreyfus free of |
| charge by calling this toll free number: 1-800-554-4611. |
| John M. Fraser, Jr., Emeritus Board Member |
| Rosalind Gersten Jacobs, Emeritus Board Member |
The Portfolio 31
OFFICERS OF THE FUND (Unaudited)
STEPHEN E. CANTER, President since March 2000.
Chairman of the Board, Chief Executive Officer and Chief Operating Officer of the Manager, and an officer of 90 investment companies (comprised of 184 portfolios) managed by the Manager. Mr. Canter also is a Board member and, where applicable, an Executive Committee Member of the other investment management subsidiaries of Mellon Financial Corporation, each of which is an affiliate of the Manager. He is 60 years old and has been an employee of the Manager since May 1995.
STEPHEN R. BYERS, Executive Vice President since November 2002.
Chief Investment Officer,Vice Chairman and a director of the Manager, and an officer of 90 investment companies (comprised of 184 portfolios) managed by the Manager. Mr. Byers also is an officer, director or an Executive Committee Member of certain other investment management subsidiaries of Mellon Financial Corporation, each of which is an affiliate of the Manager. He is 52 years old and has been an employee of the Manager since January 2000.
MARK N. JACOBS, Vice President since March 2000.
Executive Vice President, Secretary and General Counsel of the Manager, and an officer of 91 investment companies (comprised of 200 portfolios) managed by the Manager. He is 59 years old and has been an employee of the Manager since June 1977.
MICHAEL A. ROSENBERG, Vice President and Secretary since August 2005.
Associate General Counsel of the Manager, and an officer of 91 investment companies (comprised of 200 portfolios) managed by the Manager. He is 45 years old and has been an employee of the Manager since October 1991.
JAMES BITETTO, Vice President and Assistant Secretary since August 2005.
Assistant General Counsel and Assistant Secretary of the Manager, and an officer of 91 investment companies (comprised of 200 portfolios) managed by the Manager. He is 39 years old and has been an employee of the Manager since December 1996.
JONI LACKS CHARATAN, Vice President and Assistant Secretary since August 2005.
Associate General Counsel of the Manager, and an officer of 91 investment companies (comprised of 200 portfolios) managed by the Manager. She is 50 years old and has been an employee of the Manager since October 1988.
JOSEPH M. CHIOFFI, Vice President and Assistant Secretary since August 2005.
Assistant General Counsel of the Manager, and an officer of 91 investment companies (comprised of 200 portfolios) managed by the Manager. He is 44 years old and has been an employee of the Manager since June 2000.
JANETTE E. FARRAGHER, Vice President and Assistant Secretary since August 2005.
Associate General Counsel of the Manager, and an officer of 91 investment companies (comprised of 200 portfolios) managed by the Manager. She is 43 years old and has been an employee of the Manager since February 1984.
JOHN B. HAMMALIAN, Vice President and Assistant Secretary since August 2005.
Associate General Counsel of the Manager, and an officer of 91 investment companies (comprised of 200 portfolios) managed by the Manager. He is 42 years old and has been an employee of the Manager since February 1991.
ROBERT R. MULLERY, Vice President and Assistant Secretary since August 2005.
Associate General Counsel of the Manager, and an officer of 91 investment companies (comprised of 200 portfolios) managed by the Manager. He is 53 years old and has been an employee of the Manager since May 1986.
JEFF PRUSNOFSKY, Vice President and Assistant Secretary since August 2005.
Associate General Counsel of the Manager, and an officer of 91 investment companies (comprised of 200 portfolios) managed by the Manager. He is 40 years old and has been an employee of the Manager since October 1990.
JAMES WINDELS, Treasurer since November 2001.
Director – Mutual Fund Accounting of the Manager, and an officer of 91 investment companies (comprised of 200 portfolios) managed by the Manager. He is 47 years old and has been an employee of the Manager since April 1985.
ERIK D. NAVILOFF, Assistant Treasurer since December 2002.
Senior Accounting Manager – Taxable Fixed Income Funds of the Manager, and an officer of 91 investment companies (comprised of 200 portfolios) managed by the Manager. He is 37 years old and has been an employee of the Manager since November 1992.
ROBERT ROBOL, Assistant Treasurer since August 2003.
Senior Accounting Manager – Money Market and Municipal Bond Funds of the Manager, and an officer of 91 investment companies (comprised of 200 portfolios) managed by the Manager. He is 41 years old and has been an employee of the Manager since October 1988.
ROBERT SVAGNA, Assistant Treasurer since December 2002.
Senior Accounting Manager – Equity Funds of the Manager, and an officer of 91 investment companies (comprised of 200 portfolios) managed by the Manager. He is 38 years old and has been an employee of the Manager since November 1990.
GAVIN C. REILLY, Assistant Treasurer since December 2005.
Tax Manager of the Investment Accounting and Support Department of the Manager, and an officer of 91 investment companies (comprised of 200 portfolios) managed by the Manager. He is 37 years old and has been an employee of the Manager since April 1991.
JOSEPH W. CONNOLLY, Chief Compliance Officer since October 2004.
Chief Compliance Officer of the Manager and The Dreyfus Family of Funds (91 investment companies, comprised of 200 portfolios). From November 2001 through March 2004, Mr. Connolly was first Vice-President, Mutual Fund Servicing for Mellon Global Securities Services. In that capacity, Mr. Connolly was responsible for managing Mellon’s Custody, Fund Accounting and Fund Administration services to third-party mutual fund clients. He is 48 years old and has served in various capacities with the Manager since 1980, including manager of the firm’s Fund Accounting Department from 1997 through October 2001.
WILLIAM GERMENIS, Anti-Money Laundering Compliance Officer since September 2002.
Vice President and Anti-Money Laundering Compliance Officer of the Distributor, and the Anti-Money Laundering Compliance Officer of 87 investment companies (comprised of 196 portfolios) managed by the Manager. He is 35 years old and has been an employee of the Distributor since October 1998.
| For More | | Information |
| |
|
| |
| Dreyfus Variable | | Transfer Agent & |
| Investment Fund, | | Dividend Disbursing Agent |
| International Value Portfolio |
| | | Dreyfus Transfer, Inc. |
| 200 Park Avenue | | |
| | | 200 Park Avenue |
| New York, NY 10166 | | |
| | | New York, NY 10166 |
| |
| Investment Adviser | | Distributor |
| The Dreyfus Corporation | | |
| | | Dreyfus Service Corporation |
| 200 Park Avenue | | |
| | | 200 Park Avenue |
| New York, NY 10166 | | |
| | | New York, NY 10166 |
| Custodian | | |
| The Bank of New York | | |
| One Wall Street | | |
| New York, NY 10286 | | |
Telephone 1-800-554-4611 or 516-338-3300
Mail The Dreyfus Family of Funds, 144 Glenn Curtiss Boulevard, Uniondale, NY 11556-0144 Attn: Institutional Servicing
The portfolio files its complete schedule of portfolio holdings with the Securities and Exchange Commission (“SEC”) for the first and third quarters of each fiscal year on Form N-Q. The portfolio’s Forms N-Q are available on the SEC’s website at http://www.sec.gov and may be reviewed and copied at the SEC’s Public Reference Room in Washington, DC. Information on the operation of the Public Reference Room may be obtained by calling 1-800-SEC-0330.
A description of the policies and procedures that the portfolio uses to determine how to vote proxies relating to portfolio securities, and information regarding how the portfolio voted these proxies for the 12-month period ended June 30, 2005, is available at http://www.dreyfus.com and on the SEC’s website at http://www.sec.gov. The description of the policies and procedures is also available without charge, upon request, by calling 1-800-645-6561.

The views expressed in this report reflect those of the portfolio manager only through the end of the period covered and do not necessarily represent the views of Dreyfus or any other person in the Dreyfus organization.Any such views are subject to change at any time based upon market or other conditions and Dreyfus disclaims any responsibility to update such views. These views may not be relied on as investment advice and, because investment decisions for a Dreyfus portfolio are based on numerous factors, may not be relied on as an indication of trading intent on behalf of any Dreyfus portfolio.
Not FDIC-Insured • Not Bank-Guaranteed • May Lose Value
| | | Contents |
| |
| | | T H E P O R T F O L I O |
| |
|
| 2 | | Letter from the Chairman |
| 3 | | Discussion of Performance |
| 6 | | Portfolio Performance |
| 8 | | Understanding Your Portfolio’s Expenses |
| 8 | | Comparing Your Portfolio’s Expenses |
| | | With Those of Other Funds |
| 9 | | Statement of Investments |
| 24 | | Statement of Assets and Liabilities |
| 25 | | Statement of Operations |
| 26 | | Statement of Changes in Net Assets |
| 28 | | Financial Highlights |
| 30 | | Notes to Financial Statements |
| 40 | | Report of Independent Registered |
| | | Public Accounting Firm |
| 41 | | Important Tax Information |
| 42 | | Board Members Information |
| 44 | | Officers of the Fund |
| | | F O R M O R E I N F O R M AT I O N |
| |
|
| | | Back Cover |
| Dreyfus Variable Investment Fund, |
| Limited Term High Yield Portfolio |
The Portfolio

LETTER FROM THE CHAIRMAN
Dear Shareholder:
We are pleased to present this annual report for Dreyfus Variable Investment Fund, Limited Term High Yield Portfolio, covering the 12-month period from January 1, 2005, through December 31, 2005. Inside, you’ll find valuable information about how the portfolio was managed during the reporting period, including a discussion with the primary portfolio manager, Jonathan Uhrig.
Most sectors of the taxable fixed-income marketplace shrugged off bad news and responded to more positive factors in 2005. Although short-term interest rates rose by 200 basis points due to eight consecutive increases by the Federal Reserve Board during the year, the yield of the 10-year U.S. Treasury security ended the year only 17 basis points higher than where it began. Analysts generally attribute the bond market’s resilience to low inflation and robust investor demand, especially from overseas investors.
We expect the U.S. economy to continue its moderate expansion in 2006, while inflation should stay low and investor demand for income-producing securities should remain high. Risks in the new year include uncertainty regarding Fed policy under a new chairman and the possibility of continued turmoil in the automotive sector, including some of the corporate bond market’s largest issuers.
As always, we encourage you to speak with your financial consultant about how these and other market forces may affect your investments. Thank you for your continued confidence and support.

The Dreyfus Corporation
January 17, 2006
|

DISCUSSION OF PERFORMANCE
Jonathan Uhrig, Portfolio Manager
How did Dreyfus Variable Investment Fund, Limited Term High Yield Portfolio perform during the period?
For the 12-month period ended December 31, 2005, the portfolio’s Initial shares achieved a total return of 2.42%, and its Service shares achieved a total return of 2.34% . The portfolio generated aggregate income dividends of $0.49 for Initial shares and $0.48 for Service shares.1 In comparison, the Merrill Lynch U.S. High Yield Master II Constrained Index (the “Merrill Lynch Constrained Index”) achieved a total return of 2.76% for the same period.2 The fund’s previous benchmark, the Merrill Lynch High Yield Master II Index, achieved a total return of 2.74% for the same period.3
Effective September 23, 2005, the fund adopted a new benchmark, the Merrill Lynch U.S. High Yield Master II Constrained Index.The Merrill Lynch Constrained Index is similar to the previous benchmark, except the Merrill Lynch Constrained Index is capitalization-weighted, and restricts the weighting of any individual issue to 2%.
High-yield bonds produced moderately positive total returns during 2005 as supportive factors, such as a growing economy and low default rates, were offset by concerns regarding problems in the automotive industry and an increase in highly leveraged financing transactions.The portfolio produced slightly lower returns than both indices, which we attribute in part to its transition early in the year to an investment process utilized by the current management team. In addition, portfolio fees and expenses are not reflected in either benchmark’s performance.
What is the portfolio’s investment approach?
The portfolio seeks to maximize total return consisting of capital appreciation and current income. To pursue this goal, we normally invest at least 80% of the portfolio’s assets in fixed-income securities rated below investment-grade (“high yield” or “junk” bonds).We may invest in various types of fixed-income securities, including corporate bonds and notes, mortgage-related securities, asset-backed securities, zero coupon securities, inflation-indexed bonds, convertible securities, preferred stocks and other debt securities of U.S. and foreign issuers.
In choosing securities, we seek to capture higher yields offered by junk bonds, while managing credit risk and the volatility caused by inter-
DISCUSSION OF PERFORMANCE (continued)
|
est-rate movements. We reduce interest-rate risk by maintaining an average effective portfolio maturity of 5.5 years or less, although there is no limit on the maturity of individual securities.
Our investment process is based on fundamental credit research.We look at a variety of factors when assessing a potential investment, including the company’s financial strength, the state of the industry or sector it belongs to, the long-term fundamentals of that industry or sector, the company’s management, and whether there is sufficient equity value in the company.
What other factors influenced the portfolio’s performance?
The general tenor of news in the bond market took a turn for the worse in 2005. Higher short-term interest rates, a series of headline-grabbing financial problems in the U.S. automotive industry; the high-profile bankruptcies of energy utility Calpine Generating, financial services company REFCO and auto parts supplier Delphi Automotive; and ongoing weakness in the airline industry contributed to nervousness among fixed-income investors. In addition, the investment-grade corporate bond market encountered credit issues when a number of companies, frustrated by lagging stock market valuations, pursued leveraged financing transactions or outright sales that harmed prices of covenant-free debt issues.
These negative influences were balanced to a significant degree by more positive factors. Steady economic expansion and low inflation helped support business conditions, and default rates generally stayed low. In addition, demand remained high for securities producing competitive levels of current income, while the supply of newly issued high-yield bonds declined, supporting prices. As a result, high-yield bonds generally ended a challenging year with positive total returns.
During much of the year, we repositioned the portfolio to have less exposure to lower-rated high-yield credits, concentrating primarily on investments with “single-B” and “double-B” credit ratings.This change proved to be beneficial for performance, as the upper and middle credit-rating tiers generally outperformed the lower tier.
The high-yield market achieved relatively strong returns from the fixed-line telecommunications, banks, wireless telecommunications, railroads and insurance sectors. The automotive, auto parts and suppliers, airlines, and paper and forest products areas generally lagged the averages for the overall one-year period in 2005.The fund benefited from its relatively heavy exposure to wireless telecommunications
companies and its underweighted positions in the airlines, automotive and paper and forest products sectors. In addition, the portfolio avoided the full brunt of weakness stemming from the bankruptcy of Calpine, which composed a substantially larger portion of both indices relative to that of the portfolio.
What is the portfolio’s current strategy?
As of year-end, conditions in the high-yield market appear to be favorable.The seemingly relentless search for yield by investors has shown few signs of easing, high-yield default rates are projected by major rating agencies to remain roughly unchanged in 2006, and supply-and-demand factors generally have remained positive. However, we remain cautious given the recent shift in corporate financing activity toward transactions that seem to benefit stockholders over bondholders, and seek to maintain the portfolio’s focus on securities with credit ratings at the higher end of the high-yield range. Of course, there can be no guarantees given for any markets’ future performance, but in our view, the key to positive performance in 2006 may be efficient credit management and risk control.
January 17, 2006
| | | The portfolio is only available as a funding vehicle under variable life insurance policies or variable |
| | | annuity contracts issued by insurance companies. Individuals may not purchase shares of these |
| | | portfolios directly. A variable annuity is an insurance contract issued by an insurance company that |
| | | enables investors to accumulate assets on a tax-deferred basis for retirement or other long-term |
| | | goals.The investment objective and policies of Dreyfus Variable Investment Fund, Limited Term |
| | | High Yield Portfolio may be similar to other funds/portfolios managed or advised by Dreyfus. |
| | | However, the investment results of the portfolio may be higher or lower than, and may not be |
| | | comparable to, those of any other Dreyfus fund/portfolio. |
| 1 | | Total return includes reinvestment of dividends and any capital gains paid. Past performance is no |
| | | guarantee of future results. Share price and investment return fluctuate such that upon redemption, |
| | | portfolio shares may be worth more or less than their original cost.The portfolio’s performance does |
| | | not reflect the deduction of additional charges and expenses imposed in connection with investing |
| | | in variable insurance contracts, which will reduce returns. Return figures provided reflect the |
| | | absorption of certain portfolio expenses by The Dreyfus Corporation pursuant to an agreement |
| | | that was in effect through December 31, 2006, at which time it may be extended, modified or |
| | | terminated. Had these expenses not been absorbed, the portfolio’s returns would have been lower. |
| 2 | | SOURCE: BLOOMBERG — Reflects reinvestment of dividends and, where applicable, |
| | | capital gain distributions.The Merrill Lynch U.S. High Yield Master II Constrained Index is an |
| | | unmanaged performance benchmark composed of U.S. dollar-denominated domestic and Yankee |
| | | bonds rated below investment grade with at least $100 million par amount outstanding and at |
| | | least one year remaining to maturity. Bonds are capitalization-weighted.Total allocations to an |
| | | issuer are capped at 2%. |
| 3 | | SOURCE: LIPPER INC. — Reflects reinvestment of dividends and, where applicable, capital |
| | | gain distributions.The Merrill Lynch High Yield Master II Index is an unmanaged performance |
| | | benchmark composed of U.S. domestic and Yankee bonds rated below investment grade with at |
| | | least $100 million par amount outstanding and greater than or equal to one year to maturity. |
The Portfolio 5
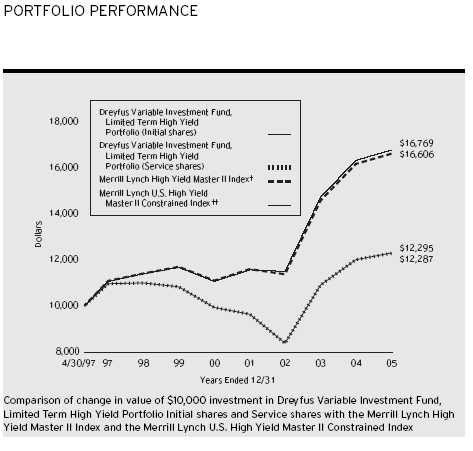
| Average Annual Total Returns as of 12/31/05 | | | | |
| | | Inception | | | | | | From |
| | | Date | | 1 Year | | 5 Years | | Inception |
| |
| |
| |
| |
|
| Initial shares | | 4/30/97 | | 2.42% | | 4.37% | | 2.41% |
| Service shares | | 4/30/97 | | 2.34% | | 4.35% | | 2.40% |
| The data for Service shares includes the results of Initial shares for the period prior to December 31, 2000 |
| (inception date of Service shares). Actual Service shares’ average annual total return and hypothetical growth |
| results would have been lower. See notes below. |
| † | | Source: Lipper Inc. |
| †† | | Source: Bloomberg L.P. |
| Past performance is not predictive of future performance.The portfolio’s performance shown in the graph and table does not |
| reflect the deduction of taxes that a shareholder would pay on portfolio distributions or the redemption of portfolio shares. |
| The portfolio’s performance does not reflect the deduction of additional charges and expenses imposed in |
| connection with investing in variable insurance contracts which will reduce returns. |
| The above graph compares a $10,000 investment made in Initial and Service shares of Dreyfus Variable Investment |
| Fund, Limited Term High Yield Portfolio on 4/30/97 (inception date of Initial shares) to a $10,000 investment made |
| in the Merrill Lynch U.S. High Yield Master II Constrained Index (the “Merrill Lynch Constrained Index”) and the |
| Merrill Lynch High Yield Master II Index (the “Merrill Lynch Index”) on that date. |
6
On September 23, 2005, the fund’s benchmark was changed to the Merrill Lynch Constrained Index from the Merrill Lynch Index because the former is expected to more accurately reflect the asset composition of the fund’s portfolio. The portfolio’s Initial shares are not subject to a Rule 12b-1 fee.The portfolio’s Service shares are subject to a 0.25% annual Rule 12b-1 fee.The performance figures for Service shares reflect the performance of the portfolio’s Initial shares from their inception date through December 30, 2000, and the performance of the portfolio’s Service shares from December 31, 2000 (inception date of Service shares) to December 31, 2005 (blended performance figures).The performance figures for each share class reflect certain expense reimbursements, without which the performance of each share class would have been lower. In addition, the blended performance figures have not been adjusted to reflect the higher operating expenses of the Service shares. If these expenses had been reflected, the blended performance figures would have been lower. All dividends and capital gain distributions are reinvested.
The portfolio’s performance shown in the line graph takes into account all applicable portfolio fees and expenses (after any expense reimbursements).The Merrill Lynch Constrained Index is an unmanaged performance benchmark composed of U.S. dollar-denominated domestic and Yankee bonds rated below investment grade with at least $100 million par amount outstanding and at least one year remaining to maturity. Bonds are capitalization-weighted.Total allocations to an issuer are capped at 2%.The Merrill Lynch Index is an unmanaged performance benchmark composed of U.S. domestic and Yankee bonds rated below investment grade with at least $100 million par amounts outstanding and greater than or equal to one year to maturity.The indices do not take into account charges, fees and other expenses. Further information relating to fund performance, including expense reimbursements, if applicable, is contained in the Financial Highlights section of the prospectus and elsewhere in this report.
UNDERSTANDING YOUR
PORTFOLIO’S EXPENSES (Unaudited)
|
As a mutual fund investor,you pay ongoing expenses,such as management fees and other expenses.Using the information below,you can estimate how these expenses affect your investment and compare them with the expenses of other funds.You also may pay one-time transaction expenses,including sales charges (loads) and redemption fees, which are not shown in this section and would have resulted in higher total expenses. For more information, see your portfolio’s prospectus or talk to your financial adviser.
Review your portfolio’s expenses
The table below shows the expenses you would have paid on a $1,000 investment in Dreyfus Variable Investment Fund, Limited Term High Yield Portfolio from July 1, 2005 to December 31, 2005. It also shows how much a $1,000 investment would be worth at the close of the period, assuming actual returns and expenses.
| Expenses and Value of a $1,000 Investment | | |
| assuming actual returns for the six months ended December 31, 2005 |
| | | Initial Shares | | Service Shares |
| |
| |
|
| Expenses paid per $1,000 † | | $ 4.59 | | $ 4.59 |
| Ending value (after expenses) | | $1,022.50 | | $1,023.10 |
COMPARING YOUR PORTFOLIO’S EXPENSES
WITH THOSE OF OTHER FUNDS (Unaudited)
|
Using the SEC’s method to compare expenses
The Securities and Exchange Commission (SEC) has established guidelines to help investors assess fund expenses. Per these guidelines, the table below shows your portfolio’s expenses based on a $1,000 investment, assuming a hypothetical 5% annualized return. You can use this information to compare the ongoing expenses (but not transaction expenses or total cost) of investing in the portfolio with those of other funds. All mutual fund shareholder reports will provide this information to help you make this comparison. Please note that you cannot use this information to estimate your actual ending account balance and expenses paid during the period.
Expenses and Value of a $1,000 Investment assuming a hypothetical 5% annualized return for the six months ended December 31, 2005
| | | Initial Shares | | Service Shares |
| |
| |
|
| Expenses paid per $1,000 † | | $ 4.58 | | $ 4.58 |
| Ending value (after expenses) | | $1,020.67 | | $1,020.67 |
† Expenses are equal to the portfolio’s annualized expense ratio of .90% for Initial shares and .90% for Service shares, multiplied by the average account value over the period, multiplied by 184/365 (to reflect the one-half year period).
STATEMENT OF INVESTMENTS
December 31, 2005
|
| | | Principal | | | | |
| Bonds and Notes—93.7% | | Amount a | | Value ($) |
| |
| |
|
| Advertising—.2% | | | | | | |
| RH Donnelley Financial, | | | | | | |
| Sr. Sub. Notes, 10.875%, 2012 | | 39,000 | | b | | 44,168 |
| Aerospace & Defense—1.8% | | | | | | |
| Argo-Tech, | | | | | | |
| Sr. Notes, 9.25%, 2011 | | 78,000 | | | | 80,340 |
| DRS Technologies, | | | | | | |
| Sr. Sub. Notes, 6.875%, 2013 | | 29,000 | | | | 27,876 |
| L-3 Communications: | | | | | | |
| Conv. Bonds, 3%, 2035 | | 35,000 | | b | | 34,781 |
| Sr. Sub. Notes, 6.375%, 2015 | | 100,000 | | b | | 100,250 |
| Sr. Sub. Notes, 7.625%, 2012 | | 75,000 | | | | 79,313 |
| Transdigm, | | | | | | |
| Sr. Sub Notes, 8.375%, 2011 | | 155,000 | | | | 163,913 |
| | | | | | | 486,473 |
| Agricultural—.2% | | | | | | |
| Alliance One International, | | | | | | |
| Notes, 11%, 2012 | | 55,000 | | b | | 48,675 |
| Airlines—.5% | | | | | | |
| Northwest Airlines, | | | | | | |
| Pass-Through Ctfs., Ser. 1996-1, 7.67%, 2015 | | 108,335 | | | | 97,861 |
| United AirLines, | | | | | | |
| Enhanced Pass-Through Ctfs., | | | | | | |
| Ser. 1997-1A, 4.09%, 2049 | | 45,118 | | c | | 45,129 |
| | | | | | | 142,990 |
| Auto Manufacturing—.3% | | | | | | |
| Navistar International, | | | | | | |
| Sr. Notes, 7.5%, 2011 | | 85,000 | | d | | 81,388 |
| Automotive, Trucks & Parts—1.5% | | | | | | |
| Cooper-Standard Automotive, | | | | | | |
| Sr. Sub. Notes, 8.375%, 2014 | | 35,000 | | | | 26,775 |
| Goodyear Tire & Rubber, | | | | | | |
| Sr. Notes, 9%, 2015 | | 170,000 | | b | | 168,300 |
| HLI Operating, | | | | | | |
| Sr. Notes, 10.5%, 2010 | | 18,000 | | d | | 14,805 |
| Polypore International, | | | | | | |
| Sr. Discount Notes, 0/10.5%, 2012 | | 131,000 | | e | | 74,015 |
| United Components, | | | | | | |
| Sr. Sub. Notes, 9.375%, 2013 | | 48,000 | | | | 48,000 |
The Portfolio 9
| | STATEMENT OF INVESTMENTS (continued)
|
| | | Principal | | | | |
| Bonds and Notes (continued) | | Amount a | | Value ($) |
| |
| |
|
| Automotive, Trucks & Parts (continued) | | | | |
| Visteon, | | | | | | |
| Sr. Notes, 8.25%, 2010 | | 90,000 | | | | 76,950 |
| | | | | | | 408,845 |
| Banking—1.3% | | | | | | |
| Chevy Chase Bank, | | | | | | |
| Sub. Notes, 6.875%, 2013 | | 265,000 | | | | 274,275 |
| Colonial Bank of Montgomery Alabama, | | | | | | |
| Sub. Notes, 9.375%, 2011 | | 75,000 | | | | 88,156 |
| | | | | | | 362,431 |
| Building & Construction—2.8% | | | | | | |
| Asia Aluminum, | | | | | | |
| Secured Notes, 8%, 2011 | | 34,000 | | b | | 33,362 |
| Beazer Homes, | | | | | | |
| Sr. Notes, 6.875%, 2015 | | 125,000 | | | | 120,469 |
| Compression Polymers, | | | | | | |
| Sr. Notes, 10.5%, 2013 | | 65,000 | | b | | 63,375 |
| DR Horton, | | | | | | |
| Sr. Notes, 8.5%, 2012 | | 65,000 | | | | 69,771 |
| Goodman Global: | | | | | | |
| Sr. Notes, 7.491%, 2012 | | 125,000 | | b,f | | 124,375 |
| Sr. Sub. Notes, 7.875%, 2012 | | 29,000 | | b | | 27,115 |
| Nortek, | | | | | | |
| Sr. Sub. Notes, 8.5%, 2014 | | 85,000 | | | | 82,450 |
| Owens Corning, | | | | | | |
| Notes, 7.7%, 2008 | | 175,000 | | c | | 135,187 |
| Standard-Pacific, | | | | | | |
| Sr. Notes, 6.5%, 2010 | | 125,000 | | | | 119,844 |
| Texas Industries, | | | | | | |
| Sr. Notes, 7.25%, 2013 | | 15,000 | | b | | 15,637 |
| | | | | | | 791,585 |
| Chemicals—4.2% | | | | | | |
| Huntsman: | | | | | | |
| Sr. Notes, 9.875%, 2009 | | 29,000 | | | | 30,740 |
| Sr. Secured Notes, 11.625%, 2010 | | 14,000 | | | | 16,013 |
| Huntsman ICI Chemicals, | | | | | | |
| Sr. Sub. Notes, 10.125%, 2009 | | 239,000 | | | | 247,962 |
| Nalco, | | | | | | |
| Sr. Notes, 7.75%, 2011 | | 50,000 | | | | 51,625 |
| Sr. Sub. Notes, 8.875%, 2013 | | 275,000 | | | | 289,437 |
10
| | | Principal | | | | |
| Bonds and Notes (continued) | | Amount a | | Value ($) |
| |
| |
|
| Chemicals (continued) | | | | | | |
| Nova Chemicals, | | | | | | |
| Sr. Notes, 6.5%, 2012 | | 60,000 | | d | | 58,425 |
| PQ, | | | | | | |
| Sr. Sub. Notes, 7.5%, 2013 | | 20,000 | | b | | 18,700 |
| Rhodia, | | | | | | |
| Sr. Notes, 10.25%, 2010 | | 262,000 | | | | 288,200 |
| Rockwood Specialties, | | | | | | |
| Sr. Sub. Notes, 10.63%, 2011 | | 70,000 | | | | 77,087 |
| Westlake Chemical, | | | | | | |
| Sr. Notes, 8.75%, 2011 | | 85,000 | | | | 91,375 |
| | | | | | | 1,169,564 |
| Commercial & Professional Services—1.3% | | | | |
| Brickman, | | | | | | |
| Sr. Sub. Notes, Ser. B, 11.75%, 2009 | | 62,000 | | | | 68,975 |
| Corrections Corp of America, | | | | | | |
| Sr. Sub. Notes, 6.25%, 2013 | | 175,000 | | | | 174,125 |
| Hertz:. | | | | | | |
| Sr. Notes, 8.875%, 2014 | | 65,000 | | b | | 66,544 |
| Sr. Sub. Notes, 10.5%, 2016 | | 30,000 | | b | | 31,050 |
| Williams Scotsman, | | | | | | |
| Sr. Notes, 8.5%, 2015 | | 35,000 | | | | 36,400 |
| | | | | | | 377,094 |
| Consumer Products—1.3% | | | | | | |
| Ames True Temper, | | | | | | |
| Sr. Sub. Notes, 10%, 2012 | | 85,000 | | d | | 67,150 |
| Amscan, | | | | | | |
| Sr. Sub. Notes, 8.75%, 2014 | | 110,000 | | d | | 93,225 |
| Playtex Products, | | | | | | |
| Sr. Sub. Notes, 9.375%, 2011 | | 160,000 | | d | | 168,400 |
| Rayovac, | | | | | | |
| Sr. Sub. Notes, 8.5%, 2013 | | 32,000 | | | | 28,080 |
| | | | | | | 356,855 |
| Diversified Financial Services—7.3% | | | | | | |
| BCP Crystal US, | | | | | | |
| Sr. Sub. Notes, 9.625%, 2014 | | 155,000 | | | | 173,213 |
| CCM Merger, | | | | | | |
| Notes, 8%, 2013 | | 70,000 | | b | | 67,550 |
| | STATEMENT OF INVESTMENTS (continued)
|
| | | | | Principal | | | | |
| Bonds and Notes (continued) | | | | Amount a | | Value ($) |
| |
| |
| |
|
| Diversified Financial Services (continued) | | | | | | | | |
| Consolidated Communications Illinois/Texas, | | | | | | | | |
| Sr. Notes, 9.75%, 2012 | | | | 65,000 | | | | 69,550 |
| E*Trade Financial, | | | | | | | | |
| Sr. Notes, 7.375%, 2013 | | | | 25,000 | | b | | 25,438 |
| FINOVA, | | | | | | | | |
| Notes, 7.5%, 2009 | | | | 150,480 | | | | 53,420 |
| Ford Motor Credit: | | | | | | | | |
| Global Landmark Securities, 7.375%, 2009 | | | | 120,000 | | | | 106,511 |
| Notes, 5.29%, 2006 | | | | 315,000 | | d,f | | 305,929 |
| GMAC: | | | | | | | | |
| Notes, 5.125%, 2008 | | | | 85,000 | | | | 75,710 |
| Notes, 7.75%, 2010 | | | | 230,000 | | d | | 214,975 |
| Sr. Notes, 5.375%, 2011 | | EUR | | 80,000 | | | | 84,504 |
| Glencore Funding, | | | | | | | | |
| Notes, 6%, 2014 | | | | 100,000 | | b | | 94,204 |
| K&F Acquisition, | | | | | | | | |
| Sr. Sub. Notes, 7.75%, 2014 | | | | 35,000 | | | | 35,525 |
| Kansas City Southern Railway, | | | | | | | | |
| Sr. Notes, 9.5%, 2008 | | | | 70,000 | | | | 76,125 |
| Leucadia National, | | | | | | | | |
| Sr. Notes, 7%, 2013 | | | | 75,000 | | | | 75,000 |
| Nell AF SARL, | | | | | | | | |
| Sr. Notes, 8.375%, 2015 | | | | 75,000 | | b | | 74,625 |
| Noble, | | | | | | | | |
| Sr. Notes, 6.625%, 2015 | | | | 200,000 | | b | | 184,546 |
| Residential Capital: | | | | | | | | |
| Sr. Notes, 6.375%, 2010 | | | | 205,000 | | | | 208,505 |
| Sr. Notes, 6.875%, 2015 | | | | 55,000 | | d | | 58,544 |
| Stena AB, | | | | | | | | |
| Sr. Notes, 7.5%, 2013 | | | | 66,000 | | d | | 63,690 |
| | | | | | | | | 2,047,564 |
| Diversified Metals & Mining—2.4% | | | | | | | | |
| Consol Energy, | | | | | | | | |
| Notes, 7.875%, 2012 | | | | 223,000 | | | | 244,464 |
| CSN Islands VIII, | | | | | | | | |
| Sr. Notes, 10%, 2015 | | | | 85,000 | | b | | 95,200 |
| Freeport-McMoRan Copper & Gold, | | | | | | | | |
| Sr. Notes, 6.875%, 2014 | | | | 90,000 | | | | 91,350 |
| Gibraltar Industries, | | | | | | | | |
| Sr. Sub. Notes, 8%, 2015 | | | | 60,000 | | b | | 60,750 |
12
| | | Principal | | | | |
| Bonds and Notes (continued) | | Amount a | | Value ($) |
| |
| |
|
| Diversified Metals & Mining (continued) | | | | |
| International Steel, | | | | | | |
| Sr. Notes, 6.5%, 2014 | | 90,000 | | d | | 90,450 |
| Southern Peru Copper, | | | | | | |
| Notes, 6.375%, 2015 | | 100,000 | | b | | 100,068 |
| | | | | | | 682,282 |
| Electric Utilities—10.1% | | | | | | |
| AES: | | | | | | |
| Sr. Sub. Notes, 8.875%, 2011 | | 450,000 | | d | | 488,812 |
| Sr. Sub. Notes, 9.375%, 2010 | | 75,000 | | | | 82,312 |
| Allegheny Energy Supply, | | | | | | |
| Bonds, 8.25%, 2012 | | 346,000 | | b | | 391,845 |
| CMS Energy, | | | | | | |
| Sr. Notes, 9.875%, 2007 | | 159,000 | | | | 170,925 |
| Calpine Generating, | | | | | | |
| Secured Notes, 13.21625%, 2011 | | 17,000 | | c | | 17,340 |
| FPL Energy National Wind, | | | | | | |
| Notes, 6.125%, 2019 | | 146,085 | | b | | 143,259 |
| MSW Energy: | | | | | | |
| Notes, Ser. B, 7.375%, 2010 | | 40,000 | | | | 41,300 |
| Secured Bonds, 8.5%, 2010 | | 85,000 | | | | 90,950 |
| Mirant: | | | | | | |
| Sr. Notes, 7.375%, 2013 | | 210,000 | | b | | 213,412 |
| Sr. Notes, 7.4%, 2004 | | 100,000 | | b,c,d | | 124,500 |
| Nevada Power: | | | | | | |
| First Mortgage, 6.50%, 2012 | | 32,000 | | | | 32,960 |
| Mortgage Bonds, Ser. A, 8.25%, 2011 | | 70,000 | | | | 77,875 |
| Notes, Ser. E, 10.875%, 2009 | | 41,000 | | | | 44,997 |
| NRG Energy, | | | | | | |
| Sr. Secured Notes, 8%, 2013 | | 116,000 | | | | 129,920 |
| Reliant Energy, | | | | | | |
| Sr. Secured Notes, 9.25%, 2010 | | 270,000 | | | | 271,350 |
| Sierra Pacific Power, | | | | | | |
| Mortgage Notes, 6.25%, 2012 | | 50,000 | | | | 51,000 |
| Sierra Pacific Resources, | | | | | | |
| Sr. Notes, 8.625%, 2014 | | 219,000 | | | | 238,051 |
| TECO Energy, | | | | | | |
| Sr. Notes, 6.75%, 2015 | | 40,000 | | | | 41,600 |
| TXU, | | | | | | |
| Sr. Notes, 5.55%, 2014 | | 150,000 | | d | | 143,225 |
The Portfolio 13
| | STATEMENT OF INVESTMENTS (continued)
|
| | | Principal | | | | |
| Bonds and Notes (continued) | | Amount a | | Value ($) |
| |
| |
|
| Electric Utilities (continued) | | | | | | |
| Texas Genco/Financing, | | | | | | |
| Sr. Notes, 6.875%, 2014 | | 50,000 | | b | | 54,375 |
| | | | | | | 2,850,008 |
| Environmental Control—1.9% | | | | | | |
| Allied Waste, | | | | | | |
| Sr. Notes, Ser. B, 8.5%, 2008 | | 425,000 | | | | 448,375 |
| Sr. Notes, Ser. B, 9.25%, 2012 | | 37,000 | | | | 40,238 |
| Geo Sub, | | | | | | |
| Sr. Notes, 11%, 2012 | | 56,000 | | | | 55,160 |
| | | | | | | 543,773 |
| Food & Beverages—2.3% | | | | | | |
| Agrilink Foods, | | | | | | |
| Sr. Sub. Notes, 11.875%, 2008 | | 16,000 | | | | 16,400 |
| Corn Products International: | | | | | | |
| Sr. Notes, 8.25%, 2007 | | 57,000 | | | | 59,578 |
| Sr. Notes, 8.45%, 2009 | | 57,000 | | | | 62,870 |
| Del Monte, | | | | | | |
| Sr. Sub. Notes, 8.625%, 2012 | | 62,000 | | | | 66,185 |
| Dole Foods: | | | | | | |
| Debs., 8.75%, 2013 | | 46,000 | | | | 47,610 |
| Sr. Notes, 8.625%, 2009 | | 49,000 | | | | 50,470 |
| Sr. Notes, 8.875%, 2011 | | 32,000 | | | | 32,960 |
| Ingles Markets, | | | | | | |
| Sr. Sub. Notes, 8.875%, 2011 | | 25,000 | | | | 26,000 |
| Smithfield Foods, | | | | | | |
| Sr. Notes, 7%, 2011 | | 60,000 | | | | 61,500 |
| Stater Brothers: | | | | | | |
| Sr. Notes, 7.991%, 2010 | | 50,000 | | | | 50,250 |
| Sr. Notes, 8.125%, 2012 | | 170,000 | | | | 169,150 |
| | | | | | | 642,973 |
| Health Care—4.2% | | | | | | |
| Beverly Enterprises, | | | | | | |
| Sr. Sub. Notes, 7.875%, 2014 | | 57,000 | | | | 61,275 |
| Coventry Health Care, | | | | | | |
| Sr. Notes, 8.125%, 2012 | | 115,000 | | | | 122,763 |
| DaVita, | | | | | | |
| Sr. Sub. Notes, 7.25%, 2015 | | 100,000 | | d | | 101,750 |
| Extendicare Health Services, | | | | | | |
| Sr. Notes, 9.5%, 2010 | | 40,000 | | | | 42,650 |
14
| | | Principal | | | | |
| Bonds and Notes (continued) | | Amount a | | Value ($) |
| |
| |
|
| Health Care (continued) | | | | | | |
| HCA, | | | | | | |
| Notes, 8.75%, 2010 | | 235,000 | | | | 261,084 |
| Healthsouth, | | | | | | |
| Sr. Notes, 8.375%, 2011 | | 120,000 | | d | | 122,700 |
| Psychiatric Solutions, | | | | | | |
| Sr. Sub. Notes, 7.75%, 2015 | | 35,000 | | | | 36,312 |
| Tenet Healthcare, | | | | | | |
| Sr. Notes, 9.875%, 2014 | | 231,000 | | | | 235,042 |
| Triad Hospitals, | | | | | | |
| Sr. Sub. Notes, 7%, 2013 | | 201,000 | | | | 202,507 |
| | | | | | | 1,186,083 |
| Lodging & Entertainment—8.8% | | | | | | |
| AMC Entertainment, | | | | | | |
| Sr. Sub. Notes, 9.875%, 2012 | | 70,000 | | d | | 68,950 |
| Chumash Casino & Resort Enterprise, | | | | | | |
| Sr. Notes, 9.26%, 2010 | | 40,000 | | b | | 42,700 |
| Cinemark, | | | | | | |
| Sr. Discount Notes, 0/9.75%, 2014 | | 90,000 | | e | | 67,050 |
| Gaylord Entertainment, | | | | | | |
| Sr. Notes, 6.75%, 2014 | | 65,000 | | | | 64,025 |
| Inn of the Mountain Gods Resort & Casino, | | | | |
| Sr. Notes, 12%, 2010 | | 174,000 | | | | 173,130 |
| Isle of Capri Casinos, | | | | | | |
| Sr. Sub. Notes, 9%, 2012 | | 57,000 | | | | 60,562 |
| Leslie’s Poolmart, | | | | | | |
| Sr. Notes, 7.75%, 2013 | | 55,000 | | | | 55,412 |
| MGM Mirage, | | | | | | |
| Notes, 8.5%, 2010 | | 129,000 | | | | 140,449 |
| Mandalay Resort, | | | | | | |
| Sr. Notes, 6.5%, 2009 | | 127,000 | | | | 129,064 |
| Mashantucket Western Pequot Tribe, | | | | | | |
| Bonds, 5.912%, 2021 | | 190,000 | | b | | 190,319 |
| Mohegan Tribal Gaming Authority: | | | | | | |
| Sr. Notes, 6.125%, 2013 | | 170,000 | | | | 167,875 |
| Sr. Sub. Notes, 6.375%, 2009 | | 157,000 | | | | 158,766 |
| Sr. Sub. Notes, 8%, 2012 | | 85,000 | | | | 89,887 |
| Park Place Entertainment: | | | | | | |
| Sr. Sub. Notes, 7.875%, 2010 | | 79,000 | | | | 85,320 |
| Sr. Sub. Notes, 8.875%, 2008 | | 321,000 | | | | 347,884 |
The Portfolio 15
STATEMENT OF INVESTMENTS (continued)
|
| | | Principal | | | | |
| Bonds and Notes (continued) | | Amount a | | Value ($) |
| |
| |
|
| Lodging & Entertainment (continued) | | | | | | |
| Penn National Gaming: | | | | | | |
| Sr. Sub. Notes, 6.75%, 2015 | | 35,000 | | | | 34,562 |
| Sr. Sub. Notes, 6.875%, 2011 | | 80,000 | | | | 81,200 |
| Royal Caribbean Cruises, | | | | | | |
| Sr. Notes, 8.75%, 2011 | | 124,000 | | | | 140,740 |
| Resorts International Hotel and Casino, | | | | | | |
| First Mortgage, 11.5%, 2009 | | 194,000 | | | | 215,825 |
| Seneca Gaming, | | | | | | |
| Sr. Notes, 7.25%, 2012 | | 60,000 | | b | | 60,675 |
| Turning Stone Casino Entertainment, | | | | | | |
| Sr. Notes, 9.125%, 2010 | | 45,000 | | b | | 46,575 |
| Wynn Las Vegas Capital, | | | | | | |
| First Mortgage Notes, 6.625%, 2014 | | 85,000 | | d | | 83,087 |
| | | | | | | 2,504,057 |
| Machinery—1.9% | | | | | | |
| Case New Holland, | | | | | | |
| Sr. Notes, 9.25%, 2011 | | 209,000 | | | | 224,675 |
| Columbus McKinnon, | | | | | | |
| Sr. Sub. Notes, 8.875%, 2013 | | 40,000 | | b | | 41,800 |
| Douglas Dynamics, | | | | | | |
| Sr. Notes, 7.75%, 2012 | | 215,000 | | b | | 208,550 |
| Terex, | | | | | | |
| Notes, 7.375%, 2014 | | 50,000 | | | | 49,750 |
| | | | | | | 524,775 |
| Manufacturing—1.0% | | | | | | |
| Bombardier, | | | | | | |
| Notes, 6.3%, 2014 | | 100,000 | | b | | 88,000 |
| JB Poindexter & Co, | | | | | | |
| Sr. Notes, 8.75%, 2014 | | 152,000 | | | | 129,200 |
| Polypore, | | | | | | |
| Sr. Sub. Notes, 8.75%, 2012 | | 68,000 | | | | 60,180 |
| | | | | | | 277,380 |
| Media—5.9% | | | | | | |
| Adelphia Communications, | | | | | | |
| Sr. Notes, Ser. B, 7.75%, 2009 | | 103,000 | | c | | 58,195 |
| Charter Communications, | | | | | | |
| Sr. Notes, 8.75%, 2013 | | 154,000 | | | | 147,455 |
| | | Principal | | | | |
| Bonds and Notes (continued) | | Amount a | | Value ($) |
| |
| |
|
| Media (continued) | | | | | | |
| CSC Holdings: | | | | | | |
| Sr. Notes, 6.75%, 2012 | | 66,000 | | b | | 62,700 |
| Sr. Notes, 7.875%, 2007 | | 123,000 | | | | 125,768 |
| Sr. Notes, Ser. B, 8.125%, 2009 | | 100,000 | | | | 101,500 |
| Dex Media East Finance: | | | | | | |
| Sr. Sub. Notes, Ser. B, 9.875%, 2009 | | 11,000 | | | | 11,949 |
| Sr. Sub. Notes, Ser. B, 12.125%, 2012 | | 207,000 | | | | 243,225 |
| Dex Media West Finance, | | | | | | |
| Sr. Sub. Notes, Ser. B, 9.875%, 2013 | | 153,000 | | | | 170,595 |
| DirecTV Holdings/Finance, | | | | | | |
| Sr. Notes, 8.375%, 2013 | | 116,000 | | | | 125,280 |
| Entercom Radio Capital, | | | | | | |
| Sr. Sub. Notes, 7.625%, 2014 | | 35,000 | | | | 35,262 |
| Kabel Deutschland, | | | | | | |
| Sr. Notes, 10.625%, 2014 | | 87,000 | | b | | 92,002 |
| LBI Media, | | | | | | |
| Sr. Discount Notes, 0/11%, 2013 | | 97,000 | | e | | 71,416 |
| Lodgenet Entertainment, | | | | | | |
| Sr. Sub. Deb., 9.5%, 2013 | | 28,000 | | | | 30,590 |
| Nexstar Finance, | | | | | | |
| Sr. Discount Notes, 0/11.375%, 2013 | | 148,000 | | e | | 112,295 |
| Pegasus Communications, | | | | | | |
| Sr. Sub. Notes, Ser. B, 12.5%, 2007 | | 228,000 | | c | | 20,805 |
| Radio One, | | | | | | |
| Sr. Sub. Notes, Ser. B, 8.875%, 2011 | | 90,000 | | | | 95,400 |
| Salem Communications, | | | | | | |
| Sr. Sub. Notes, Ser. B, 9%, 2011 | | 138,000 | | | | 146,107 |
| | | | | | | 1,650,544 |
| Oil & Gas—9.0% | | | | | | |
| ANR Pipeline, | | | | | | |
| Notes, 8.875%, 2010 | | 150,000 | | d | | 161,057 |
| Colorado Interstate Gas, | | | | | | |
| Sr. Notes, 5.95%, 2015 | | 75,000 | | | | 72,816 |
| Dynegy, | | | | | | |
| Secured Notes, 9.875%, 2010 | | 153,000 | | b | | 168,491 |
| Secured Notes, 10.125%, 2013 | | 134,000 | | b | | 152,090 |
STATEMENT OF INVESTMENTS (continued)
|
| | | Principal | | | | |
| Bonds and Notes (continued) | | Amount a | | Value ($) |
| |
| |
|
| Oil & Gas (continued) | | | | | | |
| El Paso Production: | | | | | | |
| Debs., 6.5%, 2008 | | 57,000 | | b | | 56,715 |
| Notes, 7.625%, 2008 | | 256,000 | | | | 261,120 |
| Notes, 7.75%, 2010 | | 257,000 | | d | | 263,425 |
| Sr. Notes, 7.75%, 2013 | | 109,000 | | | | 113,633 |
| Hanover Compressor: | | | | | | |
| Sr. Notes, 8.625%, 2010 | | 66,000 | | | | 70,125 |
| Sr. Notes, 9%, 2014 | | 84,000 | | | | 91,980 |
| Hanover Equipment Trust: | | | | | | |
| Sr. Secured Notes, Ser. A, 8.5%, 2008 | | 114,000 | | | | 118,703 |
| Sr. Secured Notes, Ser. B, 8.75%, 2011 | | 11,000 | | | | 11,688 |
| McMoRan Exploration, | | | | | | |
| Sr. Notes, 5.25%, 2011 | | 57,000 | | b | | 70,680 |
| Northwest Pipeline, | | | | | | |
| Sr. Notes, 8.125%, 2010 | | 155,000 | | | | 165,075 |
| Pogo Producing, | | | | | | |
| Sr. Sub. Notes, 6.625%, 2015 | | 135,000 | | d | | 132,300 |
| Southern Natural Gas, | | | | | | |
| Notes, 8.875%, 2010 | | 123,000 | | | | 132,067 |
| Whiting Petroleum, | | | | | | |
| Sr. Sub. Notes, 7.25%, 2013 | | 155,000 | | | | 157,713 |
| Williams Cos: | | | | | | |
| Notes, 7.125%, 2011 | | 100,000 | | | | 104,375 |
| Notes, 7.875%, 2021 | | 150,000 | | d | | 163,125 |
| Notes, 8.75%, 2032 | | 50,000 | | | | 58,250 |
| | | | | | | 2,525,428 |
| Packaging & Containers—7.3% | | | | | | |
| Ball, | | | | | | |
| Notes, 6.875%, 2012 | | 150,000 | | | | 155,625 |
| Berry Plastics, | | | | | | |
| Sr. Sub. Notes, 10.75%, 2012 | | 95,000 | | | | 102,600 |
| Crown Americas Capital: | | | | | | |
| Sr. Notes, 7.625%, 2013 | | 445,000 | | b | | 463,913 |
| Sr. Notes, 7.75%, 2015 | | 255,000 | | b | | 265,200 |
| Jefferson Smurfit, | | | | | | |
| Sr. Notes, 8.25%, 2012 | | 57,000 | | | | 55,005 |
| Norampac, | | | | | | |
| Sr. Notes, 6.75%, 2013 | | 75,000 | | | | 72,750 |
| | | Principal | | | | |
| Bonds and Notes (continued) | | Amount a | | Value ($) |
| |
| |
|
| Packaging & Containers (continued) | | | | | | |
| Owens Brockway: | | | | | | |
| Sr. Notes, 6.75%, 2014 | | 28,000 | | | | 27,300 |
| Sr. Notes, 8.25%, 2013 | | 30,000 | | | | 31,125 |
| Sr. Secured Notes, 7.75%, 2011 | | 60,000 | | | | 62,925 |
| Sr. Secured Notes, 8.75%, 2012 | | 9,000 | | | | 9,720 |
| Sr. Secured Notes, 8.875%, 2009 | | 50,000 | | | | 52,438 |
| Owens-Illinois, | | | | | | |
| Debs., 7.8%, 2018 | | 175,000 | | | | 175,000 |
| Plastipak, | | | | | | |
| Sr. Notes, 8.5%, 2015 | | 150,000 | | b | | 152,250 |
| Pliant, | | | | | | |
| Sr. Secured Discount Notes, 0/11.125%, 2009 | | 97,000 | | e,g | | 82,086 |
| Solo Cup, | | | | | | |
| Sr. Sub. Notes, 8.5%, 2014 | | 90,000 | | d | | 79,200 |
| Stone Container: | | | | | | |
| Sr. Notes, 8.375%, 2012 | | 75,000 | | | | 72,938 |
| Sr. Notes, 9.75%, 2011 | | 180,000 | | | | 182,700 |
| | | | | | | 2,042,775 |
| Paper & Forest Products—1.3% | | | | | | |
| Appleton Papers, | | | | | | |
| Sr. Sub. Notes, 9.75%, 2014 | | 185,000 | | d | | 173,900 |
| Buckeye Technologies, | | | | | | |
| Sr. Notes, 8.5%, 2013 | | 80,000 | | | | 80,400 |
| Georgia-Pacific Corporation, | | | | | | |
| Sr. Notes, 8%, 2024 | | 55,000 | | | | 52,800 |
| Temple-Inland, | | | | | | |
| Bonds, 6.625%, 2018 | | 55,000 | | d | | 56,782 |
| | | | | | | 363,882 |
| Real Estate Investment Trust—1.1% | | | | | | |
| BF Saul, | | | | | | |
| Sr. Secured Notes, 7.5%, 2014 | | 150,000 | | | | 153,375 |
| Host Marriott, | | | | | | |
| Sr. Notes, Ser. M, 7%, 2012 | | 150,000 | | | | 154,500 |
| | | | | | | 307,875 |
| Retail—1.8% | | | | | | |
| Amerigas Partners, | | | | | | |
| Sr. Notes, 7.25%, 2015 | | 80,000 | | | | 82,000 |
STATEMENT OF INVESTMENTS (continued)
|
| | | | | Principal | | | | |
| Bonds and Notes (continued) | | | | Amount a | | Value ($) |
| |
| |
| |
|
| Retail (continued) | | | | | | | | |
| Central European Distributor, | | | | | | | | |
| Sr. Secured Bonds, 8%, 2012 | | EUR | | 50,000 | | b | | 64,167 |
| JC Penney, | | | | | | | | |
| Sr. Notes, 8%, 2010 | | | | 101,000 | | | | 111,125 |
| Neiman-Marcus, | | | | | | | | |
| Sr. Notes, 9%, 2015 | | | | 40,000 | | b | | 41,100 |
| Rite Aid: | | | | | | | | |
| Sr. Secured Notes, 8.125%, 2010 | | | | 70,000 | | | | 71,575 |
| Sr. Secured Notes, 12.5%, 2006 | | | | 64,000 | | | | 67,280 |
| VICORP Restaurants, | | | | | | | | |
| Sr. Notes, 10.5%, 2011 | | | | 64,000 | | d | | 59,680 |
| | | | | | | | | 496,927 |
| State Government—.4% | | | | | | | | |
| Erie Tobacco Asset Securitization, | | | | | | | | |
| Asset-Backed, Ser. E, 6%, 2028 | | | | 25,000 | | | | 24,516 |
| Tobacco Settlement Authority of Iowa, | | | | | | |
| Asset-Backed, Ser. A, 6.5%, 2023 | | | | 100,000 | | | | 100,377 |
| | | | | | | | | 124,893 |
| Structured Index—.7% | | | | | | | | |
| AB Svensk Exportkredit, | | | | | | | | |
| GSNE-ER Indexed Notes, 0%, 2007 | | 190,000 | | b,h | | 186,295 |
| Dow Jones CDX, | | | | | | | | |
| Credit Linked Notes, Ser. 4-T2, 6.75%, 2010 | | 16,814 | | b,i | | 16,593 |
| | | | | | | | | 202,888 |
| Technology—2.1% | | | | | | | | |
| Dresser, | | | | | | | | |
| Sr. Sub. Notes, 9.375%, 2011 | | | | 137,000 | | | | 144,878 |
| Fisher Scientific International, | | | | | | | | |
| Sr. Sub. Notes, 6.125%, 2015 | | | | 100,000 | | b | | 100,500 |
| Freescale Semiconductor, | | | | | | | | |
| Sr. Notes, 6.875%, 2011 | | | | 230,000 | | | | 242,650 |
| Imax, | | | | | | | | |
| Sr. Notes, 9.625%, 2010 | | | | 66,000 | | | | 68,310 |
| Sungard Data Systems, | | | | | | | | |
| Sr. Notes, 8.524%, 2013 | | | | 20,000 | | b,f | | 20,800 |
| | | | | | | | | 577,138 |
| | | Principal | | | | |
| Bonds and Notes (continued) | | Amount a | | Value ($) |
| |
| |
|
| Telecommunications—6.2% | | | | | | |
| American Tower: | | | | | | |
| Sr. Notes, 7.125%, 2012 | | 86,000 | | | | 89,010 |
| Sr. Sub. Notes, 7.25%, 2011 | | 42,000 | | | | 43,890 |
| American Tower Escrow, | | | | | | |
| Discount Notes, 0%, 2008 | | 30,000 | | | | 23,625 |
| Hawaiian Telcom Communications, | | | | | | |
| Sr. Notes, 9.948%, 2013 | | 75,000 | | b,f | | 72,750 |
| Innova S de RL, | | | | | | |
| Notes, 9.375%, 2013 | | 128,000 | | | | 142,720 |
| Intelsat Bermuda: | | | | | | |
| Sr. Notes, 8.695%, 2012 | | 85,000 | | b,f | | 86,806 |
| Sr. Notes, 8.25%, 2013 | | 105,000 | | b | | 106,575 |
| Qwest: | | | | | | |
| Bank Note, Ser. A, 8.53%, 2007 | | 74,800 | | | | 76,483 |
| Bank Note, Ser. B, 6.95%, 2010 | | 50,000 | | f | | 50,563 |
| Sr. Notes, 7.875%, 2011 | | 55,000 | | | | 59,538 |
| Qwest Communications International, | | | | | | |
| Sr. Notes, 7.5%, 2014 | | 255,000 | | b | | 263,288 |
| Rogers Wireless Communications, | | | | | | |
| Secured Notes, 7.25%, 2012 | | 150,000 | | | | 158,438 |
| Rural Cellular, | | | | | | |
| Sr. Notes, 9.875%, 2010 | | 35,000 | | | | 37,100 |
| SBA Telecommunications, | | | | | | |
| Sr. Discount Notes, 0/9.75%, 2011 | | 258,000 | | e | | 240,585 |
| UbiquiTel Operating, | | | | | | |
| Sr. Notes, 9.875%, 2011 | | 86,000 | | | | 95,675 |
| US Unwired, | | | | | | |
| Second Priority Sr. Secured Notes, | | | | | | |
| Ser. B, 10%, 2012 | | 142,000 | | | | 160,460 |
| Wind Acquisition Finance, | | | | | | |
| Sr. Bonds, 10.75%, 2015 | | 35,000 | | b | | 36,313 |
| | | | | | | 1,743,819 |
| Textiles & Apparel—1.0% | | | | | | |
| INVISTA, | | | | | | |
| Notes, 9.25%, 2012 | | 260,000 | | b | | 278,850 |
| | STATEMENT OF INVESTMENTS (continued)
|
| | | Principal | | |
| Bonds and Notes (continued) | | Amount a | | Value ($) |
| |
| |
|
| Transportation—1.6% | | | | |
| CHC Helicopter, | | | | |
| Sr. Sub. Notes, 7.375%, 2014 | | 96,000 | | 97,560 |
| Gulfmark Offshore, | | | | |
| Sr. Notes, 7.75%, 2014 | | 113,000 | | 118,085 |
| TFM, S.A. de C.V., | | | | |
| Sr. Notes, 10.25%, 2007 | | 214,000 | | 226,840 |
| | | | | 442,485 |
| Total Bonds and Notes | | | | |
| (cost $26,179,849) | | | | 26,286,467 |
| |
| |
|
| |
| Preferred Stocks—2.0% | | Shares | | Value ($) |
| |
| |
|
| Banking—1.0% | | | | |
| Sovereign Capital Trust IV, | | | | |
| Conv., $2.1875 | | 6,850 | | 301,400 |
| Diversified Financial Services—.2% | | | | |
| Williams Holdings of Delaware, | | | | |
| Cum. Conv., $2.75 | | 460 b | | 51,750 |
| Media—.8% | | | | |
| Paxson Communications, | | | | |
| Cum. Conv., $975 | | 16 b | | 109,900 |
| Spanish Broadcasting System (Units) | | | | |
| Cum. Conv., Ser. B, $107.5 | | 98 | | 106,394 |
| | | | | 216,294 |
| Total Preferred Stocks | | | | |
| (cost $504,034) | | | | 569,444 |
| |
| |
|
| |
| Common Stocks—.1% | | | | |
| |
| |
|
| Chemicals-Fibers & Diversified—.1% | | |
| Huntsman | | 626 j | | 10,780 |
| Lodging—.0% | | | | |
| Trump Entertainment Resorts | | 333 j | | 6,701 |
| Telecommunications—.0% | | | | |
| iPCS | | 27 j | | 1,303 |
| Textiles & Apparel—.0% | | | | |
| Dan River | | 4,342 j | | 1,303 |
| Total Common Stocks | | | | |
| (cost $73,786) | | | | 20,087 |
22
| Other Investment—2.4% | | | | Shares | | Value ($) |
| |
| |
| |
|
| Registered Investment Company; | | | | |
| Dreyfus Institutional Preferred Plus Money Market Fund | | |
| (cost $679,000) | | | | 679,000 k | | 679,000 |
| |
| |
| |
|
| |
| Investment of Cash Collateral | | | | |
| for Securities Loaned—12.1% | | | | |
| |
| |
|
| Registered Investment Company; | | | | |
| Dreyfus Institutional Cash Advantage Plus Fund | | |
| (cost $3,399,150) | | | | 3,399,150 k | | 3,399,150 |
| |
| |
| |
|
| |
| Total Investments (cost $30,835,819) | | 110.3% | | 30,954,148 |
| |
| Liabilities, Less Cash and Receivables | | (10.3%) | | (2,884,699) |
| |
| Net Assets | | | | 100.0% | | 28,069,449 |
| |
| a | | Principal amount stated in U.S Dollars unless otherwise noted. | | |
| | | EUR—Euro | | | | | | |
| b | | Securities exempt from registration under Rule 144A of the Securities Act of 1933.These securities may be resold in |
| | | transactions exempt from registration, normally to qualified institutional buyers. At December 31, 2005, these |
| | | securities amounted to $6,004,451 or 21.4% of net assets. | | |
| c | | Non-income producing—security in default. | | | | |
| d | | All or a portion of these securities are on loan. At December 31, 2005, the total market value of the portfolio’s |
| | | securities on loan is $3,274,050 and the total market value of the collateral held by the portfolio is $3,399,150. |
| e | | Zero coupon until a specified date at which time the stated coupon rate becomes effective until maturity. |
| f | | Variable rate security—interest rate subject to periodic change. | | |
| g | | Subsequent to December 31, 2005, this security became non-income producing—security in default. |
| h | | Security linked to Goldman Sachs Non-Energy—Excess Return Index. | | |
| i | | Security linked to a portfolio of debt securities. | | | | |
| j | | Non-income producing. | | | | | | |
| k | | Investment in affiliated money market mutual fund. | | | | |
| |
| |
| |
|
| |
| |
| |
| |
| Portfolio Summary † | | | | | | |
| |
| | | | | Value (%) | | | | Value (%) |
| |
| |
| |
| |
|
| Corporate Bonds | | 92.6 | | State Government | | .4 |
| Money Market Investments | | 14.5 | | Swaps and Foreign Currency | | |
| Common and Preferred Stocks | | 2.1 | | Exchange Contracts | | .0 |
| Structured Index | | .7 | | | | 110.3 |
| |
| † | | Based on net assets. | | | | | | |
| See notes to financial statements. | | | | | | |
The Portfolio 23
STATEMENT OF ASSETS AND LIABILITIES
December 31, 2005
| | | Cost | | Value |
| |
| |
|
| Assets ($): | | | | |
| Investments in securities— | | | | |
| See Statement of Investments (including securities | | |
| on loan valued at $3,274,050)—Note 1(c): | | |
| Unaffiliated issuers | | 26,757,669 | | 26,875,998 |
| Affiliated issuers | | 4,078,150 | | 4,078,150 |
| Cash | | | | 39,569 |
| Cash denominated in foreign currencies | | 43 | | 41 |
| Dividends and interest receivable | | | | 521,732 |
| Unrealized appreciation on swap contracts—Note 4 | | 6,047 |
| Receivable for shares of Beneficial Interest subscribed | | 2,258 |
| Unrealized appreciation on forward currency | | |
| exchange contracts—Note 4 | | | | 1,630 |
| Prepaid expenses | | | | 684 |
| | | | | 31,526,109 |
| |
| |
|
| Liabilities ($): | | | | |
| Due to The Dreyfus Corporation and affiliates—Note 3(b) | | 15,173 |
| Liability for securities on loan—Note 1(c) | | | | 3,399,150 |
| Unrealized depreciation on swap contracts—Note 4 | | 5,232 |
| Payable for shares of Beneficial Interest redeemed | | 1,619 |
| Accrued expenses | | | | 35,486 |
| | | | | 3,456,660 |
| |
| |
|
| Net Assets ($) | | | | 28,069,449 |
| |
| |
|
| Composition of Net Assets ($): | | | | |
| Paid-in capital | | | | 63,188,718 |
| Accumulated undistributed investment income—net | | 76,686 |
| Accumulated net realized gain (loss) on investments | | (35,316,634) |
| Accumulated net unrealized appreciation (depreciation) | | |
| on investments and foreign currency transactions | | 120,679 |
| |
|
| Net Assets ($) | | | | 28,069,449 |
| |
| |
|
| |
| |
| Net Asset Value Per Share | | | | |
| | | Initial Shares | | Service Shares |
| |
| |
|
| Net Assets ($) | | 19,141,808 | | 8,927,641 |
| Shares Outstanding | | 2,944,012 | | 1,370,624 |
| |
| |
|
| Net Asset Value Per Share ($) | | 6.50 | | 6.51 |
See notes to financial statements.
|
STATEMENT OF OPERATIONS
Year Ended December 31, 2005
|
| Investment Income ($): | | |
| Income: | | |
| Interest | | 2,164,831 |
| Dividends: | | |
| Unaffiliated issuers | | 55,097 |
| Affiliated issuers | | 60,540 |
| Income from securities lending | | 18,654 |
| Total Income | | 2,299,122 |
| Expenses: | | |
| Investment advisory fee—Note 3(a) | | 201,748 |
| Auditing fees | | 32,173 |
| Distribution fees—Note 3(b) | | 23,343 |
| Prospectus and shareholders’ reports | | 8,459 |
| Custodian fees—Note 3(b) | | 4,013 |
| Trustees’ fees and expenses—Note 3(c) | | 3,211 |
| Legal fees | | 1,150 |
| Shareholder servicing costs—Note 3(b) | | 1,442 |
| Miscellaneous | | 28,220 |
| Total Expenses | | 303,759 |
| Less—waiver of fees due to undertaking—Note 3(a) | | (26,839) |
| Less—reduction in custody fees due to earnings credit—Note 1(c) | | (1,177) |
| Net Expenses | | 275,743 |
| Investment Income—Net | | 2,023,379 |
| |
|
| Realized and Unrealized Gain (Loss) on Investments—Note 4 ($): |
| Net realized gain (loss) on investments and foreign currency transactions | | (269,244) |
| Net realized gain (loss) on swap transactions | | 5,349 |
| Net realized gain (loss) on forward currency exchange contracts | | 3,361 |
| Net Realized Gain (Loss) | | (260,534) |
| Net unrealized appreciation (depreciation) on investments, | | |
| foreign currency transactions and swap transactions | | (1,095,928) |
| Net Realized and Unrealized Gain (Loss) on Investments | | (1,356,462) |
| Net Increase in Net Assets Resulting from Operations | | 666,917 |
See notes to financial statements.
|
STATEMENT OF CHANGES IN NET ASSETS
| | | Year Ended December 31, |
| |
|
| | | 2005 | | 2004 |
| |
| |
|
| Operations ($): | | | | |
| Investment income—net | | 2,023,379 | | 2,260,746 |
| Net realized gain (loss) on investments | | (260,534) | | 1,126,311 |
| Net unrealized appreciation | | | | |
| (depreciation) on investments | | (1,095,928) | | (211,372) |
| Net Increase (Decrease) in Net Assets | | | | |
| Resulting from Operations | | 666,917 | | 3,175,685 |
| |
| |
|
| Dividends to Shareholders from ($): | | | | |
| Investment income—net: | | | | |
| Initial shares | | (1,531,558) | | (1,757,277) |
| Service shares | | (660,967) | | (642,542) |
| Total Dividends | | (2,192,525) | | (2,399,819) |
| |
| |
|
| Beneficial Interest Transactions ($): | | | | |
| Net proceeds from shares sold: | | | | |
| Initial shares | | 1,336,313 | | 1,502,127 |
| Service shares | | 1,804,074 | | 2,407,679 |
| Dividends reinvested: | | | | |
| Initial shares | | 1,531,558 | | 1,757,277 |
| Service shares | | 660,967 | | 642,542 |
| Cost of shares redeemed: | | | | |
| Initial shares | | (6,535,964) | | (5,508,371) |
| Service shares | | (2,523,884) | | (2,887,368) |
| Increase (Decrease) in Net Assets from | | | | |
| Beneficial Interest Transactions | | (3,726,936) | | (2,086,114) |
| Total Increase (Decrease) in Net Assets | | (5,252,544) | | (1,310,248) |
| |
| |
|
| Net Assets ($): | | | | |
| Beginning of Period | | 33,321,993 | | 34,632,241 |
| End of Period | | 28,069,449 | | 33,321,993 |
| Undistributed investment income—net | | 76,686 | | 22,369 |
| | | Year Ended December 31, |
| |
|
| | | 2005 | | 2004 |
| |
| |
|
| Capital Share Transactions: | | | | |
| Initial Shares | | | | |
| Shares sold | | 197,550 | | 225,131 |
| Shares issued for dividends reinvested | | 233,424 | | 263,707 |
| Shares redeemed | | (982,751) | | (821,797) |
| Net Increase (Decrease) in Shares Outstanding | | (551,777) | | (332,959) |
| |
| |
|
| Service Shares | | | | |
| Shares sold | | 269,680 | | 357,890 |
| Shares issued for dividends reinvested | | 100,639 | | 96,282 |
| Shares redeemed | | (380,156) | | (431,163) |
| Net Increase (Decrease) in Shares Outstanding | | (9,837) | | 23,009 |
See notes to financial statements.
|
The following tables describe the performance for each share class for the fiscal periods indicated. All information (except portfolio turnover rate) reflects financial results for a single portfolio share.Total return shows how much your investment in the portfolio would have increased (or decreased) during each period, assuming you had reinvested all dividends and distributions.These figures have been derived from the portfolio’s financial statements.
| | | | | Year Ended December 31, | | |
| |
| |
| |
|
| Initial Shares | | 2005 | | 2004 a | | 2003 | | 2002 | | 2001 |
| |
| |
| |
| |
| |
|
| Per Share Data ($): | | | | | | | | | | |
| Net asset value, beginning of period | | 6.83 | | 6.68 | | 5.63 | | 7.33 | | 8.47 |
| Investment Operations: | | | | | | | | | | |
| Investment income—net b | | .43 | | .46 | | .53 | | .69 | | .84 |
| Net realized and unrealized | | | | | | | | | | |
| gain (loss) on investments | | (.27) | | .19 | | 1.12 | | (1.64) | | (1.07) |
| Total from Investment Operations | | .16 | | .65 | | 1.65 | | (.95) | | (.23) |
| Distributions: | | | | | | | | | | |
| Dividends from investment income—net | | (.49) | | (.50) | | (.60) | | (.75) | | (.91) |
| Net asset value, end of period | | 6.50 | | 6.83 | | 6.68 | | 5.63 | | 7.33 |
| |
| |
| |
| |
| |
|
| Total Return (%) | | 2.42 | | 10.10 | | 30.00 | | (13.01) | | (2.90) |
| |
| |
| |
| |
| |
|
| Ratios/Supplemental Data (%): | | | | | | | | | | |
| Ratio of total expenses | | | | | | | | | | |
| to average net assets | | .90 | | .89 | | .96 | | .94 | | .91 |
| Ratio of net expenses | | | | | | | | | | |
| to average net assets | | .88 | | .89 | | .90 | | .92 | | .91 |
| Ratio of net investment income | | | | | | | | | | |
| to average net assets | | 6.53 | | 6.82 | | 8.43 | | 10.69 | | 10.37 |
| Portfolio Turnover Rate | | 60.64 | | 78.90 | | 258.88 | | 436.35 | | 198.14 |
| |
| |
| |
| |
| |
|
| Net Assets, end of period ($ x 1,000) | | 19,142 | | 23,881 | | 25,571 | | 20,033 | | 30,146 |
| a | | As of January 1, 2004, the portfolio has adopted the method of accounting for interim payments on swap contracts in |
| | | accordance with Financial Accounting Standards Board Statement No. 133.These interim payments are reflected |
| | | within net realized and unrealized gain (loss) on swap contracts, however, prior to January 1, 2004, these interim |
| | | payments were reflected within interest income/expense in the Statement of Operations.The effect of this change for |
| | | the period ended December 31, 2004, was to increase net investment income per share by less than $.01, decrease net |
| | | realized and unrealized gain (loss) on investments per share by less than $.01 and increase the ratio of net |
| | | investment income to average net assets from 6.81% to 6.82%. Per share data and ratios/supplemental data for |
| | | periods prior to January 1, 2004 have not been restated to reflect this change in presentation. |
| b | | Based on average shares outstanding at each month end. |
| See notes to financial statements. |
| | | | | Year Ended December 31, | | |
| |
| |
| |
|
| Service Shares | | 2005 | | 2004 a | | 2003 | | 2002 | | 2001 |
| |
| |
| |
| |
| |
|
| Per Share Data ($): | | | | | | | | | | |
| Net asset value, beginning of period | | 6.84 | | 6.68 | | 5.63 | | 7.33 | | 8.46 |
| Investment Operations: | | | | | | | | | | |
| Investment income—net b | | .44 | | .46 | | .53 | | .68 | | .79 |
| Net realized and unrealized | | | | | | | | | | |
| gain (loss) on investments | | (.29) | | .19 | | 1.12 | | (1.63) | | (1.02) |
| Total from Investment Operations | | .15 | | .65 | | 1.65 | | (.95) | | (.23) |
| Distributions: | | | | | | | | | | |
| Dividends from investment income—net | | (.48) | | (.49) | | (.60) | | (.75) | | (.90) |
| Net asset value, end of period | | 6.51 | | 6.84 | | 6.68 | | 5.63 | | 7.33 |
| |
| |
| |
| |
| |
|
| Total Return (%) | | 2.34 | | 10.06 | | 30.28 | | (13.12) | | (2.95) |
| |
| |
| |
| |
| |
|
| Ratios/Supplemental Data (%): | | | | | | | | | | |
| Ratio of total expenses | | | | | | | | | | |
| to average net assets | | 1.15 | | 1.14 | | 1.22 | | 1.25 | | 1.15 |
| Ratio of net expenses | | | | | | | | | | |
| to average net assets | | .90 | | .90 | | .90 | | .92 | | .91 |
| Ratio of net investment income | | | | | | | | | | |
| to average net assets | | 6.54 | | 6.80 | | 8.34 | | 10.73 | | 10.35 |
| Portfolio Turnover Rate | | 60.64 | | 78.90 | | 258.88 | | 436.35 | | 198.14 |
| |
| |
| |
| |
| |
|
| Net Assets, end of period ($ x 1,000) | | 8,928 | | 9,441 | | 9,062 | | 4,933 | | 2,797 |
| a | | As of January 1, 2004, the portfolio has adopted the method of accounting for interim payments on swap contracts |
| | | in accordance with Financial Accounting Standards Board Statement No. 133.These interim payments are reflected |
| | | within net realized and unrealized gain (loss) on swap contracts, however, prior to January 1, 2004, these interim |
| | | payments were reflected within interest income/expense in the Statement of Operations.The effect of these changes |
| | | for the fiscal year ended December 31, 2004, was to increase net investment income per share by less than $.01, |
| | | decrease net realized and unrealized gain (loss) on investments per share by less than $.01 and had no effect on the |
| | | ratio of net investment income to average net assets. Per share data and ratios/supplemental data for periods prior to |
| | | January 1, 2004 have not been restated to reflect this change in presentation. |
| b | | Based on average shares outstanding at each month end. |
| See notes to financial statements. |
NOTES TO FINANCIAL STATEMENTS
NOTE 1—Significant Accounting Policies:
Dreyfus Variable Investment Fund (the “fund”) is registered under the Investment Company Act of 1940 as amended (the “Act”), as an open-end management investment company, operating as a series company currently offering twelve series, including the Limited Term High Yield Portfolio (the “portfolio”).The portfolio is only offered to separate accounts established by insurance companies to fund variable annuity contracts and variable life insurance policies.The portfolio is a diversified series.The portfolio’s investment objective is to maximize total return, consisting of capital appreciation and current income.The Dreyfus Corporation (the “Manager” or “Dreyfus”) serves as the portfolio’s investment adviser.The Manager is a wholly-owned subsidiary of Mellon Financial Corporation (“Mellon Financial”).
Dreyfus Service Corporation (the “Distributor”), a wholly-owned subsidiary of the Manager, is the distributor of the portfolio’s shares, which are sold without a sales charge. The portfolio is authorized to issue an unlimited number of $.001 par value shares of Beneficial Interest in the following classes of shares: Initial and Service. Each class of shares has identical rights and privileges, except with respect to the distribution plan and the expenses borne by each class and certain voting rights. Income, expenses (other than expenses attributable to a specific class), and realized and unrealized gains or losses on investments are allocated to each class of shares based on its relative net assets.
The fund accounts separately for the assets, liabilities and operations of each series. Expenses directly attributable to each series are charged to that series’ operations; expenses which are applicable to all series are allocated among them on a pro rata basis.
The portfolio’s financial statements are prepared in accordance with U.S. generally accepted accounting principles, which may require the use of management estimates and assumptions.Actual results could differ from those estimates.
The fund enters into contracts that contain a variety of indemnifica-tions.The portfolio’s maximum exposure under these arrangements is unknown. The portfolio does not anticipate recognizing any loss related to these arrangements.
(a) Portfolio valuation: Investments in securities (excluding short-term investments (other than U.S. Treasury Bills), financial futures, options, swap transactions and forward currency exchange contracts) are valued each business day by an independent pricing service (the “Service”) approved by the Board of Trustees. Investments for which quoted bid prices are readily available and are representative of the bid side of the market in the judgment of the Service are valued at the mean between the quoted bid prices (as obtained by the Service from dealers in such securities) and asked prices (as calculated by the Service based upon its evaluation of the market for such securities). Other investments (which constitute a majority of the portfolio securities) are valued as determined by the Service, based on methods which include consideration of: yields or prices of securities of comparable quality, coupon, maturity and type; indications as to values from dealers; and general market conditions. Securities for which there are no such valuations are valued at fair value as determined in good faith under the direction of the Board of Trustees. Restricted securities, as well as securities or other assets for which recent market quotations are not readily available, that are not valued by a pricing service approved by the Board of Trustees, or are determined by the portfolio not to reflect accurately fair value (such as when an event occurs after the close of the exchange on which the security is principally traded and that is determined by the portfolio to have changed the value of the security), are valued at fair value as determined in good faith under the direction of the Board of Trustees.The factors that may be considered when fair valuing a security include fundamental analytical data, the nature and duration of restrictions on disposition, an evaluation of the forces that influence the market in which the securities are purchased and sold and public trading in similar securities of
NOTES TO FINANCIAL STATEMENTS (continued)
|
the issuer or comparable issuers. Short-term investments, excluding U.S. Treasury Bills, are carried at amortized cost, which approximates value. Investments in registered investment companies are valued at their net asset value. Investments in swap transactions are valued each business day by an independent pricing service approved by the Board of Trustees. Swaps are valued by the service by using a swap pricing model which incorporates among other factors, default probabilities, recovery rates, credit curves of the underlying issuer and swap spreads on interest rates. Investments denominated in foreign currencies are translated to U.S. dollars at the prevailing rates of exchange. Forward currency exchange contracts are valued at the forward rate.
(b) Foreign currency transactions: The portfolio does not isolate that portion of the results of operations resulting from changes in foreign exchange rates on investments from the fluctuations arising from changes in the market prices of securities held. Such fluctuations are included with the net realized and unrealized gain or loss on investments.
Net realized foreign exchange gains or losses arise from sales and maturities of short-term securities, sales of foreign currencies, currency gains or losses realized on securities transactions and the difference between the amounts of dividends, interest and foreign withholding taxes recorded on the portfolio’s books and the U.S. dollar equivalent of the amounts actually received or paid. Net unrealized foreign exchange gains and losses arise from changes in the value of assets and liabilities, other than investments in securities, resulting from changes in exchange rates. Such gains and losses are included with net realized and unrealized gain or loss on investments.
(c) Securities transactions and investment income: Securities transactions are recorded on a trade date basis. Realized gain and loss from securities transactions are recorded on the identified cost basis. Dividend income is recognized on the ex-dividend date and interest income, including, where applicable, accretion of discount and amortization of premium on investments, is recognized on the accrual basis.
The portfolio has an arrangement with the custodian bank whereby the portfolio receives earnings credits from the custodian when positive cash balances are maintained, which are used to offset custody fees. For financial reporting purposes, the portfolio includes net earnings credits as an expense offset in the Statement of Operations.
Pursuant to a securities lending agreement with Mellon Bank, N.A., an affiliate of the Manager, the portfolio may lend securities to qualified institutions. At origination, all loans are secured by collateral of at least 102% of the value of U.S. securities loaned and 105% of the value of foreign securities loaned. Collateral equivalent to at least 100% of the market value of securities on loan will be maintained at all times. Cash collateral is invested in certain money market mutual funds managed by the Manager. The portfolio will be entitled to receive all income on securities loaned, in addition to income earned as a result of the lending transaction.Although each security loaned is fully collateralized, the portfolio would bear the risk of delay in recovery of, or loss of rights in, the securities loaned should a borrower fail to return the securities in a timely manner.
(d) Affiliated issuers: Investments in other investment companies advised by the Manager are defined as “affiliated” in the Act.
(e) Dividends to shareholders: It is the policy of the portfolio to declare and pay dividends quarterly from investment income-net. Dividends from net realized capital gain, if any, are normally declared and paid annually, but the portfolio may make distributions on a more frequent basis to comply with the distribution requirements of the Internal Revenue Code of 1986, as amended (the “Code”). To the extent that net realized capital gain can be offset by capital loss carryovers, it is the policy of the portfolio not to distribute such gain. Income and capital gain distributions are determined in accordance with income tax regulations, which may differ from U.S. generally accepted accounting principles.
NOTES TO FINANCIAL STATEMENTS (continued)
|
(f) Federal income taxes: It is the policy of the portfolio to continue to qualify as a regulated investment company, if such qualification is in the best interests of its shareholders, by complying with the applicable provisions of the Code, and to make distributions of taxable income sufficient to relieve it from substantially all federal income and excise taxes.
At December 31, 2005, the components of accumulated earnings on a tax basis were as follows: undistributed ordinary income $97,153, accumulated capital losses $35,162,624 and unrealized depreciation $46,183. In addition, the portfolio had $7,615 of capital losses realized after October 31, 2005, which were deferred for tax purposes to the first day of the following year.
The accumulated capital loss carryover is available to be applied against future net securities profits, if any, realized subsequent to December 31, 2005. If not applied, $4,814,711 of the carryover expires in fiscal 2007, $4,480,534 expires in fiscal 2008, $10,613,045 expires in fiscal 2009, $10,693,853 expires in fiscal 2010, $4,059,439 expires in fiscal 2011 and $501,042 expires in fiscal 2013.
The tax character of distributions paid to shareholders during the fiscal periods ended December 31, 2005 and December 31, 2004, were as follows: ordinary income $2,192,525 and $2,399,819, respectively.
During the period ended December 31, 2005, as a result of permanent book to tax differences, primarily due to the tax treatment for amortization of premiums and consent fees, the portfolio increased accumulated undistributed investment income-net by $223,463, decreased accumulated net realized gain (loss) on investments by $223,750 and increased paid-in capital by $287. Net assets were not affected by this reclassification.
NOTE 2—Bank Lines of Credit:
|
The portfolio may borrow up to $10 million for leveraging purposes under a short-term unsecured line of credit and participates with other Dreyfus-managed funds in a $100 million unsecured line of credit primarily to be utilized for temporary or emergency purposes, including
the financing of redemptions. Interest is charged to the portfolio based on prevailing market rates in effect at the time of borrowing. During the period ended December 31, 2005, the portfolio did not borrow under either line of credit.
NOTE 3—Investment Advisory Fee and Other Transactions With Affiliates:
(a) Pursuant to an Investment Advisory Agreement (“Agreement”) with Dreyfus, the investment advisory fee is computed at the annual rate of .65% of the value of the portfolio’s average daily net assets and is payable monthly.
The Manager has agreed, from January 1, 2005 to December 31, 2006, to waive receipt of its fees and/or assume the expenses of the portfolio so that the expenses of neither class, exclusive of taxes, brokerage commissions, extraordinary expenses, interest expenses and commitment fees on borrowings exceed .90% of the value of the average daily net assets of their class. During the period ended December 31, 2005, the Manager waived receipt of fees of $26,839, pursuant to the undertaking.
(b) Under the Distribution Plan (the “Plan”) adopted pursuant to Rule 12b-1 under the Act, Service shares pay the Distributor for distributing their shares, for servicing and/or maintaining Service shares shareholder accounts and for advertising and marketing for Service shares.The Plan provides for payments to be made at an annual rate of .25% of the value of the Service shares’ average daily net assets.The Distributor may make payments to Participating Insurance Companies and to brokers and dealers acting as principal underwriter for their variable insurance products.The fees payable under the Plan are payable without regard to actual expenses incurred. During the period ended December 31, 2005, Service shares were charged $23,343 pursuant to the Plan.
The portfolio compensates Dreyfus Transfer, Inc., a wholly-owned subsidiary of the Manager, under a transfer agency agreement for providing personnel and facilities to perform transfer agency services for the
NOTES TO FINANCIAL STATEMENTS (continued)
|
portfolio. During the period ended December 31, 2005, the portfolio was charged $69 pursuant to the transfer agency agreement.
The portfolio compensates Mellon Bank, N.A., an affiliate of the Manager, under a custody agreement to provide custodial services for the portfolio. During the period ended December 31, 2005, the portfolio was charged $4,013 pursuant to the custody agreement.
During the period ended December 31, 2005, the portfolio was charged $3,762 for services performed by the Chief Compliance Officer.
The components of Due to The Dreyfus Corporation and affiliates in the Statement of Assets and Liabilities consist of:investment advisory fees $15,595, Rule 12b-1 distribution plan fees $1,903, custodian fees $1,008, chief compliance officer fees $1,858 and transfer agency per account fees $11, which are offset against an expense reimbursement currently in effect in the amount of $5,202.
(c) Each Board member also serves as a Board member of other funds within the Dreyfus complex. Annual retainer fees and attendance fees are allocated to each fund based on net assets.
(d) Pursuant to an exemptive order from the Securities and Exchange Commission, the portfolio may invest its available cash balances in affiliated money market mutual funds. Management fees of the underlying money market mutual funds have been waived by the Manager.
NOTE 4—Securities Transactions:
The aggregate amount of purchases and sales of investment securities, excluding short-term securities, forward currency exchange contracts and swap transactions, during the period ended December 31, 2005, amounted to $17,551,076 and $17,158,982, respectively.
The portfolio enters into forward currency exchange contracts in order to hedge its exposure to changes in foreign currency exchange rates on its foreign portfolio holdings and to settle foreign currency transactions. When executing forward currency exchange contracts, the portfolio is obligated to buy or sell a foreign currency at a specified rate on a cer-
tain date in the future. With respect to sales of forward currency exchange contracts, the portfolio would incur a loss if the value of the contract increases between the date the forward contract is opened and the date the forward contract is closed.The portfolio realizes a gain if the value of the contract decreases between those dates.With respect to purchases of forward currency exchange contracts, the portfolio would incur a loss if the value of the contract decreases between the date the forward contract is opened and the date the forward contract is closed. The portfolio realizes a gain if the value of the contract increases between those dates.The portfolio is also exposed to credit risk associated with counterparty nonperformance on these forward currency exchange contracts which is typically limited to the unrealized gain on each open contract.The following summarizes open forward currency exchange contracts at December 31, 2005:
| | | Foreign | | | | | | |
| Forward Currency | | Currency | | | | | | Unrealized |
| Exchange Contracts | | Amounts | | Proceeds ($) | | Value ($) | | Appreciation ($) |
| |
| |
| |
| |
|
| Sale; | | | | | | | | |
| Euro, | | | | | | | | |
| expiring 3/15/2006 | | 130,000 | | 156,005 | | 154,375 | | 1,630 |
The portfolio may enter into swap agreements to exchange the interest rate on, or return generated by, one nominal instrument for the return generated by another nominal instrument.
The portfolio accrues for the interim payments on a daily basis, with the net amount recorded within unrealized appreciation (depreciation) of swap contracts in the Statement of Assets and Liabilities. Once the interim payments are settled in cash, the net amount is recorded as realized gain (loss) on swaps, in addition to realized gain (loss) recorded upon the termination of swap contracts in the Statement of Operations. Fluctuations in the value of swap contracts are recorded as a component of net change in unrealized appreciation (depreciation) on investments.
Credit default swaps involve commitments to pay a fixed interest rate in exchange for payment if a credit event affecting a third party (the
NOTES TO FINANCIAL STATEMENTS (continued)
|
referenced company) occurs. Credit events may include a failure to pay interest or principal, bankruptcy, or restructuring. For those credit default swaps in which the portfolio is receiving a fixed rate, the portfolio is providing credit protection on the underlying instrument.The maximum payouts for these contracts are limited to the notional amount of each swap.The following summarizes credit default swaps entered into by the portfolio at December 31, 2005:

Risks may arise upon entering into these agreements from the potential inability of the counterparties to meet the terms of the agreement and are generally limited to the amount of net payments to be received, if any, at the date of default.
At December 31, 2005, the cost of investments for federal income tax purposes was $31,001,040; accordingly, accumulated net unrealized depreciation on investments was $46,892, consisting of $822,160 gross unrealized appreciation and $869,052 gross unrealized depreciation.
REPORT OF INDEPENDENT REGISTERED
PUBLIC ACCOUNTING FIRM
|
Shareholders and Board of Trustees Dreyfus Variable Investment Fund, Limited Term High Yield Portfolio
We have audited the accompanying statement of assets and liabilities, including the statement of investments, of Dreyfus Variable Investment Fund, Limited Term High Yield Portfolio (one of the funds comprising Dreyfus Variable Investment Fund) as of December 31, 2005, and the related statement of operations for the year then ended, the statement of changes in net assets for each of the two years in the period then ended, and financial highlights for each of the years indicated therein. These financial statements and financial highlights are the responsibility of the Fund’s management. Our responsibility is to express an opinion on these financial statements and financial highlights based on our audits. We conducted our audits in accordance with the standards of the Public Company Accounting Oversight Board (United States). Those standards require that we plan and perform the audit to obtain reasonable assurance about whether the financial statements and financial highlights are free of material misstatement. We were not engaged to perform an audit of the Fund’s internal control over financial reporting. Our audits included consideration of internal control over financial reporting as a basis for designing audit procedures that are appropriate in the circumstances, but not for the purpose of expressing an opinion on the effectiveness of the Fund’s internal control over financial reporting. Accordingly, we express no such opinion. An audit also includes examining, on a test basis, evidence supporting the amounts and disclosures in the financial statements and financial highlights, assessing the accounting principles used and significant estimates made by management, and evaluating the overall financial statement presentation. Our procedures included verification by examination of securities held by the custodian as of December 31, 2005 and confirmation of securities not held by the custodian by correspondence with others.We believe that our audits provide a reasonable basis for our opinion.
In our opinion, the financial statements and financial highlights referred to above present fairly, in all material respects, the financial position of Dreyfus Variable Investment Fund, Limited Term High Yield Portfolio at December 31, 2005, the results of its operations for the year then ended, the changes in its net assets for each of the two years in the period then ended, and the financial highlights for each of the indicated years, in conformity with U.S. generally accepted accounting principles.
| | | New York, New York |
| 40 | | February 6, 2006 |
IMPORTANT TAX INFORMATION (Unaudited)
For federal tax purposes, the portfolio hereby designates 2.43% of the ordinary dividends paid during the fiscal year ended December 31, 2005 as qualifying for the corporate dividends received deduction. Shareholders will receive notification in January 2006 of the percentage applicable to the preparation of their 2005 income tax returns.
| BOARD MEMBERS INFORMATION (Unaudited) |
| |
| |
| |
| Joseph S. DiMartino (62) |
| Chairman of the Board (1995) |
| Principal Occupation During Past 5 Years: |
| • Corporate Director and Trustee |
| Other Board Memberships and Affiliations: |
| • The Muscular Dystrophy Association, Director |
| • Levcor International, Inc., an apparel fabric processor, Director |
| • Century Business Services, Inc., a provider of outsourcing functions for small and medium size |
| companies, Director |
| • The Newark Group, a provider of a national market of paper recovery facilities, paperboard |
| mills and paperboard converting plants, Director |
| • Sunair Services Corporation, engages in the design, manufacture and sale of high frequency |
| systems for long-range voice and data communications, as well as providing certain outdoor- |
| related services to homes and businesses, Director |
| No. of Portfolios for which Board Member Serves: 193 |
| ——————— |
| David P. Feldman (66) |
| Board Member (1994) |
| Principal Occupation During Past 5 Years: |
| • Corporate Director and Trustee |
| Other Board Memberships and Affiliations: |
| • BBH Mutual Funds Group (11 funds), Director |
| • The Jeffrey Company, a private investment company, Director |
| • QMED, a medical device company, Director |
| No. of Portfolios for which Board Member Serves: 58 |
| ——————— |
| James F. Henry (75) |
| Board Member (1990) |
| Principal Occupation During Past 5 Years: |
| • President, CPR Institute for Dispute Resolution, a non-profit organization principally |
| engaged in the development of alternatives to business litigation (Retired 2003) |
| No. of Portfolios for which Board Member Serves: 22 |
42
| Dr. Paul A. Marks (79) |
| Board Member (1990) |
| Principal Occupation During Past 5 Years: |
| • President, Emeritus (2000-present) and President and Chief Executive Officer of Memorial |
| Sloan-Kettering Cancer Center (Retired 1999) |
| Other Board Memberships and Affiliations: |
| • Pfizer, Inc., a pharmaceutical company, Director-Emeritus |
| • Lazard Freres & Company, LLC, Senior Adviser |
| • Carrot Capital Health Care Ventures, Advisor |
| • Armgo-Start-Up Biotech; Board of Directors |
| • Nanoviricide, Board Director |
| • PTC, Scientific Advisory Board |
| No. of Portfolios for which Board Member Serves: 22 |
| ——————— |
| Dr. Martin Peretz (66) |
| Board Member (1990) |
| Principal Occupation During Past 5 Years: |
| • Editor-in-Chief of The New Republic Magazine |
| • Lecturer in Social Studies at Harvard University (1965-2001) |
| • Co-Chairman of TheStreet.com, a financial daily on the web |
| Other Board Memberships and Affiliations: |
| • Academy for Liberal Education, an accrediting agency for colleges and universities certified by |
| the U.S. Department of Education, Director |
| • Harvard Center for Blood Research,Trustee |
| • Bard College,Trustee |
| • Board of Overseers of YIVO Institute for Jewish Research, Chairman |
| No. of Portfolios for which Board Member Serves: 22 |
| ——————— |
| Once elected all Board Members serve for an indefinite term.The address of the Board Members and Officers is in c/o |
| The Dreyfus Corporation, 200 Park Avenue, New York, New York 10166. Additional information about the Board |
| Members is available in the fund’s Statement of Additional Information which can be obtained from Dreyfus free of |
| charge by calling this toll free number: 1-800-554-4611. |
| John M. Fraser, Jr., Emeritus Board Member |
| Rosalind Gersten Jacobs, Emeritus Board Member |
The Portfolio 43
OFFICERS OF THE FUND (Unaudited)
STEPHEN E. CANTER, President since March 2000.
Chairman of the Board, Chief Executive Officer and Chief Operating Officer of the Manager, and an officer of 90 investment companies (comprised of 184 portfolios) managed by the Manager. Mr. Canter also is a Board member and, where applicable, an Executive Committee Member of the other investment management subsidiaries of Mellon Financial Corporation, each of which is an affiliate of the Manager. He is 60 years old and has been an employee of the Manager since May 1995.
STEPHEN R. BYERS, Executive Vice President since November 2002.
Chief Investment Officer,Vice Chairman and a director of the Manager, and an officer of 90 investment companies (comprised of 184 portfolios) managed by the Manager. Mr. Byers also is an officer, director or an Executive Committee Member of certain other investment management subsidiaries of Mellon Financial Corporation, each of which is an affiliate of the Manager. He is 52 years old and has been an employee of the Manager since January 2000.
MARK N. JACOBS, Vice President since March 2000.
Executive Vice President, Secretary and General Counsel of the Manager, and an officer of 91 investment companies (comprised of 200 portfolios) managed by the Manager. He is 59 years old and has been an employee of the Manager since June 1977.
MICHAEL A. ROSENBERG, Vice President and Secretary since August 2005.
Associate General Counsel of the Manager, and an officer of 91 investment companies (comprised of 200 portfolios) managed by the Manager. He is 45 years old and has been an employee of the Manager since October 1991.
JAMES BITETTO, Vice President and Assistant Secretary since August 2005.
Assistant General Counsel and Assistant Secretary of the Manager, and an officer of 91 investment companies (comprised of 200 portfolios) managed by the Manager. He is 39 years old and has been an employee of the Manager since December 1996.
JONI LACKS CHARATAN, Vice President and Assistant Secretary since August 2005.
Associate General Counsel of the Manager, and an officer of 91 investment companies (comprised of 200 portfolios) managed by the Manager. She is 50 years old and has been an employee of the Manager since October 1988.
JOSEPH M. CHIOFFI, Vice President and Assistant Secretary since August 2005.
Assistant General Counsel of the Manager, and an officer of 91 investment companies (comprised of 200 portfolios) managed by the Manager. He is 44 years old and has been an employee of the Manager since June 2000.
JANETTE E. FARRAGHER, Vice President and Assistant Secretary since August 2005.
Associate General Counsel of the Manager, and an officer of 91 investment companies (comprised of 200 portfolios) managed by the Manager. She is 43 years old and has been an employee of the Manager since February 1984.
JOHN B. HAMMALIAN, Vice President and Assistant Secretary since August 2005.
Associate General Counsel of the Manager, and an officer of 91 investment companies (comprised of 200 portfolios) managed by the Manager. He is 42 years old and has been an employee of the Manager since February 1991.
ROBERT R. MULLERY, Vice President and Assistant Secretary since August 2005.
Associate General Counsel of the Manager, and an officer of 91 investment companies (comprised of 200 portfolios) managed by the Manager. He is 53 years old and has been an employee of the Manager since May 1986.
JEFF PRUSNOFSKY, Vice President and Assistant Secretary since August 2005.
Associate General Counsel of the Manager, and an officer of 91 investment companies (comprised of 200 portfolios) managed by the Manager. He is 40 years old and has been an employee of the Manager since October 1990.
JAMES WINDELS, Treasurer since November 2001.
Director – Mutual Fund Accounting of the Manager, and an officer of 91 investment companies (comprised of 200 portfolios) managed by the Manager. He is 47 years old and has been an employee of the Manager since April 1985.
ERIK D. NAVILOFF, Assistant Treasurer since December 2002.
Senior Accounting Manager – Taxable Fixed Income Funds of the Manager, and an officer of 91 investment companies (comprised of 200 portfolios) managed by the Manager. He is 37 years old and has been an employee of the Manager since November 1992.
ROBERT ROBOL, Assistant Treasurer since August 2003.
Senior Accounting Manager – Money Market and Municipal Bond Funds of the Manager, and an officer of 91 investment companies (comprised of 200 portfolios) managed by the Manager. He is 41 years old and has been an employee of the Manager since October 1988.
ROBERT SVAGNA, Assistant Treasurer since December 2002.
Senior Accounting Manager – Equity Funds of the Manager, and an officer of 91 investment companies (comprised of 200 portfolios) managed by the Manager. He is 38 years old and has been an employee of the Manager since November 1990.
GAVIN C. REILLY, Assistant Treasurer since December 2005.
Tax Manager of the Investment Accounting and Support Department of the Manager, and an officer of 91 investment companies (comprised of 200 portfolios) managed by the Manager. He is 37 years old and has been an employee of the Manager since April 1991.
JOSEPH W. CONNOLLY, Chief Compliance Officer since October 2004.
Chief Compliance Officer of the Manager and The Dreyfus Family of Funds (91 investment companies, comprised of 200 portfolios). From November 2001 through March 2004, Mr. Connolly was first Vice-President, Mutual Fund Servicing for Mellon Global Securities Services. In that capacity, Mr. Connolly was responsible for managing Mellon’s Custody, Fund Accounting and Fund Administration services to third-party mutual fund clients. He is 48 years old and has served in various capacities with the Manager since 1980, including manager of the firm’s Fund Accounting Department from 1997 through October 2001.
WILLIAM GERMENIS, Anti-Money Laundering Compliance Officer since September 2002.
Vice President and Anti-Money Laundering Compliance Officer of the Distributor, and the Anti-Money Laundering Compliance Officer of 87 investment companies (comprised of 196 portfolios) managed by the Manager. He is 35 years old and has been an employee of the Distributor since October 1998.
| For More | | Information |
| |
|
| |
| |
| |
| Dreyfus Variable | | Transfer Agent & |
| |
| Investment Fund, | | Dividend Disbursing Agent |
| |
| Limited Term | | |
| | | Dreyfus Transfer, Inc. |
| High Yield Portfolio | | |
| | | 200 Park Avenue |
| 200 Park Avenue | | |
| | | New York, NY 10166 |
| New York, NY 10166 | | |
| |
| | | Distributor |
| Investment Adviser | | |
| |
| | | Dreyfus Service Corporation |
| The Dreyfus Corporation | | |
| | | 200 Park Avenue |
| 200 Park Avenue | | |
| | | New York, NY 10166 |
| New York, NY 10166 | | |
| |
| |
| Custodian | | |
| |
| |
| Mellon Bank, N.A. | | |
| |
| One Mellon Bank Center | | |
| |
| Pittsburgh, PA 15258 | | |
Telephone 1-800-554-4611 or 516-338-3300
Mail The Dreyfus Family of Funds, 144 Glenn Curtiss Boulevard, Uniondale, NY 11556-0144 Attn: Institutional Servicing
The portfolio files its complete schedule of portfolio holdings with the Securities and Exchange Commission (“SEC”) for the first and third quarters of each fiscal year on Form N-Q. The portfolio’s Forms N-Q are available on the SEC’s website at http://www.sec.gov and may be reviewed and copied at the SEC’s Public Reference Room in Washington, DC. Information on the operation of the Public Reference Room may be obtained by calling 1-800-SEC-0330.
A description of the policies and procedures that the portfolio uses to determine how to vote proxies relating to portfolio securities, and information regarding how the portfolio voted these proxies for the 12-month period ended June 30, 2005, is available at http://www.dreyfus.com and on the SEC’s website at http://www.sec.gov. The description of the policies and procedures is also available without charge, upon request, by calling 1-800-645-6561.


The views expressed in this report reflect those of the portfolio manager only through the end of the period covered and do not necessarily represent the views of Dreyfus or any other person in the Dreyfus organization.Any such views are subject to change at any time based upon market or other conditions and Dreyfus disclaims any responsibility to update such views. These views may not be relied on as investment advice and, because investment decisions for a Dreyfus portfolio are based on numerous factors, may not be relied on as an indication of trading intent on behalf of any Dreyfus portfolio.
Not FDIC-Insured • Not Bank-Guaranteed • May Lose Value
| | | Contents |
| |
| | | T H E P O R T F O L I O |
| |
|
| 2 | | Letter from the Chairman |
| 3 | | Discussion of Performance |
| 6 | | Understanding Your Portfolio’s Expenses |
| 6 | | Comparing Your Portfolio’s Expenses |
| | | With Those of Other Funds |
| 7 | | Statement of Investments |
| 10 | | Statement of Assets and Liabilities |
| 11 | | Statement of Operations |
| 12 | | Statement of Changes in Net Assets |
| 13 | | Financial Highlights |
| 14 | | Notes to Financial Statements |
| 18 | | Report of Independent Registered |
| | | Public Accounting Firm |
| 19 | | Board Members Information |
| 21 | | Officers of the Fund |
| | | F O R M O R E I N F O R M AT I O N |
| |
|
| | | Back Cover |
| Dreyfus Variable Investment Fund, |
| Money Market Portfolio |

LETTER FROM THE CHAIRMAN
We are pleased to present this annual report for Dreyfus Variable Investment Fund, Money Market Portfolio, covering the 12-month period from January 1, 2005, through December 31, 2005. Inside, you’ll find valuable information about how the portfolio was managed during the reporting period, including a discussion with the portfolio manager, Bernard W. Kiernan, Jr.
The Federal Reserve Board continued to raise short-term interest rates in an environment of steady economic growth and low inflation in 2005, driving money market yields to their highest levels in more than four years. In fact, the U.S. economy appeared to shrug off a number of negative influences during the year, including soaring energy prices and the disruptions caused by hurricanes Katrina, Rita and Wilma along the Gulf Coast.
We expect the U.S. economy to continue its moderate expansion in 2006, while inflation should stay low and investor demand for money market securities should remain high. Risks in the new year include uncertainty regarding Fed policy under a new chairman and the possible end of the boom in the housing market, where we believe prices are more likely to stall than plunge.
As always, we encourage you to speak with your financial consultant about how these and other market forces may affect your investments. Thank you for your continued confidence and support.


DISCUSSION OF PERFORMANCE
Bernard W. Kiernan, Jr., Senior Portfolio Manager
How did Dreyfus Variable Investment Fund, Money Market Portfolio perform during the period?
During the 12-month period ended December 31, 2005, the portfolio produced a yield of 2.63% .Taking into account the effects of compounding, the portfolio also provided an effective yield of 2.66% for the same period.1
What is the portfolio’s investment approach?
The portfolio seeks as high a level of current income as is consistent with the preservation of capital and the maintenance of liquidity.To pursue this goal, the portfolio invests in a diversified selection of high-quality, short-term debt securities, including securities issued or guaranteed by the U.S. government or its agencies or instrumentalities, certificates of deposit, time deposits, bankers’ acceptances and other short-term securities issued by domestic or foreign banks, repurchase agreements, asset-backed securities, domestic and dollar-denominated foreign commercial paper and other short-term corporate and bank obligations of domestic and foreign issuers and dollar-denominated obligations issued or guaranteed by one or more foreign governments or their agencies, including obligations of supranational entities.
Normally, the portfolio invests at least 25% of its net assets in domestic or dollar-denominated foreign bank obligations.
What other factors influenced the portfolio’s performance?
Although the overnight federal funds rate began the year at 2.25% after approximately six months of gradual increases, long-dormant inflationary pressures appeared to intensify during the opening months of 2005 when energy prices moved sharply higher. It was no surprise, therefore, that the Federal Reserve Board (the “Fed”) continued to raise short-term interest rates at its February and March meetings, driving the federal funds rate to 2.75% . It later was revealed that the
The Portfolio 3
DISCUSSION OF PERFORMANCE (continued)
|
U.S. economy expanded at a relatively moderate 3.5% annualized rate during the first quarter of 2005.
Although concerns in the spring that the U.S. economy might have hit a soft patch proved to be short-lived, soaring energy prices and the possibility of slower economic growth in overseas markets weighed on investor sentiment. Still, the Fed continued to implement its gradual rate hikes at its meetings in May and June, which raised the federal funds rate to 3.25% . U.S. GDP grew at a 3.3% annualized rate during the second quarter of 2005.
In July and August, stronger employment data helped convince investors that U.S. economic growth was solid. While inflationary pressures appeared to stay contained due to steep discounts from automobile manufacturers and apparel retailers, oil and gas prices continued to escalate. The Fed raised the federal funds rate to 3.5% at its meeting on August 9.
On August 29, however, Hurricane Katrina struck the Gulf Coast, and oil prices spiked to more than $70 per barrel, reigniting concerns about a possible economic slowdown.Although some analysts believed that the Gulf Coast hurricanes might prompt the Fed to pause at its September 20 meeting, the Fed remained on course, increasing the federal funds rate to 3.75% . It was later announced that U.S. GDP grew at a relatively robust 4.1% annualized rate during the third quarter of 2005.
As was widely expected, the Fed hiked interest rates for the twelfth consecutive time in November. The economy continued to exhibit signs of strength through year-end, including evidence of greater activity in the corporate sector. December saw the creation of 108,000 new jobs and a decline in the unemployment rate to 4.9% .These statistics appeared to confirm that the U.S. economy finished 2005 on solid footing, and the twin drags caused by higher energy prices and the Gulf Coast hurricanes were not sufficient to offset strength in broad sectors of the domestic economy.
The Fed implemented its final rate increase of 2005 at its meeting on December 10, leaving the federal funds rate at 4.25% by year-end. However, the Fed changed some of the language in its announcement of the increase, which many analysts interpreted as a signal that the
credit-tightening campaign might be nearing completion. This view was reinforced shortly after the start of 2006, when minutes from the December meeting showed that some Fed members had expressed concern that further rate hikes might restrict economic growth.
Throughout 2005, many money market investors focused primarily on securities with maturities of six months or less in an attempt to maintain liquidity and keep funds available for higher-yielding instruments as they become available.We adopted a similar strategy for much of the year, setting the portfolio’s weighted average maturity in a range we considered shorter than industry averages and making adjustments to reflect the proximity of upcoming Fed meetings.
What is the portfolio’s current strategy?
Investors currently are facing greater uncertainty regarding Fed policy in advance of Chairman Alan Greenspan’s retirement and the appointment of his successor, Ben Bernanke, on February 1. In addition, the Fed appears ready to give greater weight to incoming economic data when deciding whether to continue the tightening process at upcoming meetings.Therefore, we have continued to maintain the portfolio’s relatively defensive posture. However, we are prepared to increase the portfolio’s weighted average maturity should we see more concrete signs that short-term interest rates have peaked.
| | | An investment in the portfolio is not insured or guaranteed by the FDIC or any other |
| | | government agency. Although the portfolio seeks to preserve the value of your investment at $1.00 |
| | | per share, it is possible to lose money by investing in the portfolio. |
| | | The portfolio is only available as a funding vehicle under variable life insurance policies or variable |
| | | annuity contracts issued by insurance companies. Individuals may not purchase shares of the |
| | | portfolio directly. A variable annuity is an insurance contract issued by an insurance company that |
| | | enables investors to accumulate assets on a tax-deferred basis for retirement or other long-term |
| | | goals.The investment objective and policies of Dreyfus Variable Investment Fund, Money Market |
| | | Portfolio made available through insurance products may be similar to other funds/portfolios |
| | | managed or advised by Dreyfus. However, the investment results of the portfolio may be higher or |
| | | lower than, and may not be comparable to, those of any other Dreyfus fund/portfolio. |
| 1 | | Effective yield is based upon dividends declared daily and reinvested monthly. Past performance is |
| | | no guarantee of future results.Yields fluctuate.The portfolio’s performance does not reflect the |
| | | deduction of additional charges and expenses imposed in connection with investing in variable |
| | | insurance contracts, which will reduce returns. |
| |
| | | The Portfolio 5 |
UNDERSTANDING YOUR
PORTFOLIO’S EXPENSES (Unaudited)
As a mutual fund investor,you pay ongoing expenses,such as management fees and other expenses.Using the information below,you can estimate how these expenses affect your investment and compare them with the expenses of other funds.You also may pay one-time transaction expenses,including sales charges (loads) and redemption fees, which are not shown in this section and would have resulted in higher total expenses. For more information, see your portfolio’s prospectus or talk to your financial adviser.
Review your portfolio’s expenses
|
The table below shows the expenses you would have paid on a $1,000 investment in Dreyfus Variable Investment Fund, Money Market Portfolio from July 1, 2005 to December 31, 2005. It also shows how much a $1,000 investment would be worth at the close of the period, assuming actual returns and expenses.
Expenses and Value of a $1,000 Investment assuming actual returns for the six months ended December 31, 2005
| Expenses paid per $1,000 † | | $ 3.00 |
| Ending value (after expenses) | | $1,016.00 |
COMPARING YOUR PORTFOLIO’S EXPENSES WITH THOSE OF OTHER FUNDS (Unaudited)
Using the SEC’s method to compare expenses
The Securities and Exchange Commission (SEC) has established guidelines to help investors assess fund expenses. Per these guidelines, the table below shows your portfolio’s expenses based on a $1,000 investment, assuming a hypothetical 5% annualized return. You can use this information to compare the ongoing expenses (but not transaction expenses or total cost) of investing in the portfolio with those of other funds. All mutual fund shareholder reports will provide this information to help you make this comparison. Please note that you cannot use this information to estimate your actual ending account balance and expenses paid during the period.
Expenses and Value of a $1,000 Investment assuming a hypothetical 5% annualized return for the six months ended December 31, 2005
| Expenses paid per $1,000 † | | $ 3.01 |
| Ending value (after expenses) | | $1,022.23 |
| † Expenses are equal to the portfolio’s annualized expense ratio of .59%, multiplied by the average account value over |
| the period, multiplied by 184/365 (to reflect the one-half year period). |
STATEMENT OF INVESTMENTS
December 31, 2005
|
| | | Principal | | |
| Negotiable Bank Certificates of Deposit—7.6% | | Amount ($) | | Value ($) |
| |
| |
|
| American Express Bank FSB | | | | |
| 4.40%, 3/6/2006 | | 5,000,000 | | 5,000,000 |
| First Tennessee Bank N.A. | | | | |
| 4.38%, 2/13/2006 | | 5,000,000 | | 5,000,000 |
| Total Negotiable Bank Certificates of Deposit | | | | |
| (cost $10,000,000) | | | | 10,000,000 |
| |
| |
|
| |
| Commercial Paper—78.4% | | | | |
| |
| |
|
| Amstel Funding Corp. | | | | |
| 4.23%, 2/2/2006 | | 5,000,000 a | | 4,981,422 |
| Bank of America Corp. | | | | |
| 4.37%, 2/13/2006 | | 5,000,000 | | 4,974,081 |
| Barclays U.S. Funding Corp. | | | | |
| 4.37%, 2/13/2006 | | 5,000,000 | | 4,974,081 |
| Beethoven Funding Corp. | | | | |
| 4.36%, 2/3/2006 | | 5,000,000 a | | 4,980,154 |
| Calyon | | | | |
| 4.36%, 2/13/2006 | | 5,000,000 | | 4,974,140 |
| Charta LLC | | | | |
| 4.40%, 2/21/2006 | | 5,000,000 a | | 4,969,046 |
| Concord Minutemen Capital Co. LLC | | | | |
| 4.40%, 3/2/2006 | | 5,000,000 a | | 4,963,750 |
| CRC Funding LLC | | | | |
| 4.40%, 2/23/2006 | | 5,000,000 a | | 4,967,832 |
| Cullinan Finance Ltd. | | | | |
| 4.40%, 3/2/2006 | | 5,000,000 a | | 4,963,750 |
| Danske Corp. Inc. | | | | |
| 4.37%, 2/15/2006 | | 5,000,000 | | 4,972,906 |
| DEPFA Bank PLC | | | | |
| 4.22%, 2/2/2006 | | 5,000,000 | | 4,981,444 |
| FCAR Owner Trust, Ser. I | | | | |
| 4.31%, 2/15/2006 | | 5,000,000 | | 4,973,375 |
| Grampian Funding Ltd. | | | | |
| 4.41%, 3/7/2006 | | 5,000,000 a | | 4,960,639 |
| ING (US) Funding LLC | | | | |
| 4.34%, 2/8/2006 | | 5,000,000 | | 4,977,253 |
The Portfolio 7
STATEMENT OF INVESTMENTS (continued)
|
| | | Principal | | |
| Commercial Paper (continued) | | Amount ($) | | Value ($) |
| |
| |
|
| K2 Corp. | | | | |
| 4.40%, 3/2/2006 | | 5,000,000 a | | 4,963,750 |
| Links Finance Corp. | | | | |
| 4.22%, 2/2/2006 | | 5,000,000 a | | 4,981,444 |
| Northern Rock PLC | | | | |
| 4.31%, 2/16/2006 | | 3,000,000 | | 2,983,670 |
| PB Finance (Delaware) Inc. | | | | |
| 4.35%, 1/10/2006 | | 5,000,000 | | 4,994,588 |
| Sigma Finance Inc. | | | | |
| 4.40%, 2/22/2006 | | 5,395,000 a | | 5,360,946 |
| Solitaire Funding Ltd. | | | | |
| 4.40%, 2/23/2006 | | 5,000,000 a | | 4,967,832 |
| UBS Finance Delaware LLC | | | | |
| 4.19%, 1/3/2006 | | 5,000,000 | | 4,998,836 |
| Total Commercial Paper | | | | |
| (cost $102,864,939) | | | | 102,864,939 |
| |
| |
|
| |
| Corporate Notes—12.2% | | | | |
| |
| |
|
| Harrier Finance Funding Ltd. | | | | |
| 4.25%, 4/13/2006 | | 4,000,000 a,b | | 4,000,000 |
| Lehman Brothers Inc. | | | | |
| 4.31%, 2/23/2006 | | 4,000,000 b | | 4,000,000 |
| Toyota Motor Credit Corp. | | | | |
| 4.31%, 8/8/2006 | | 4,000,000 a,b | | 4,000,000 |
| Wells Fargo & Co. | | | | |
| 4.27%, 7/1/2011 | | 4,000,000 b | | 4,000,000 |
| Total Corporate Notes | | | | |
| (cost $16,000,000) | | | | 16,000,000 |
| | | | | | | Principal | | |
| Time Deposits—.3% | | | | Amount ($) | | Value ($) |
| |
| |
| |
|
| State Street Bank & Trust Co. (Grand Cayman) | | | | |
| 4.06%, 1/3/2006 | | | | | | |
| (cost $400,000) | | | | 400,000 | | 400,000 |
| |
| |
| |
|
| |
| Total Investments (cost $129,264,939) | | 98.5% | | 129,264,939 |
| |
| Cash and Receivables (Net) | | 1.5% | | 1,945,012 |
| |
| Net Assets | | | | 100.0% | | 131,209,951 |
| |
| a | | Securities exempt from registration under Rule 144A of the Securities Act of 1933.These securities may be resold in |
| | | transactions exempt from registration, normally to qualified institutional buyers. At December 31, 2005, these |
| | | securities amounted to $63,060,565 or 48.1% of net assets. | | |
| b | | Variable interest rate—subject to periodic change. | | | | |
| |
| |
| |
|
| |
| |
| |
| |
| Portfolio Summary | | (Unaudited)† | | | | |
| |
| | | | | Value (%) | | | | Value (%) |
| |
| |
| |
| |
|
| Banking | | 41.3 | | Finance | | 6.1 |
| Asset-Backed/ | | | | Asset-Backed/Single Seller | | 3.8 |
| Multi-Seller Programs | | 22.7 | | Asset-Backed/Securities Arbitrage 3.8 |
| Asset-Backed/Structured | | Building & Construction | | 2.3 |
| Investment Vehicles | | 18.5 | | | | 98.5 |
| |
| † | | Based on net assets. | | | | | | |
| See notes to financial statements. | | | | |
The Portfolio 9
STATEMENT OF ASSETS AND LIABILITIES
December 31, 2005
| | | Cost | | Value |
| |
| |
|
| Assets ($): | | | | |
| Investments in securities-See Statement of Investments | | 129,264,939 | | 129,264,939 |
| Cash | | | | 2,004,164 |
| Interest receivable | | | | 145,525 |
| Prepaid expenses | | | | 1,427 |
| | | | | 131,416,055 |
| |
| |
|
| Liabilities ($): | | | | |
| Due to The Dreyfus Corporation and affiliates—Note 2(a) | | | | 58,329 |
| Payable for shares of Beneficial Interest redeemed | | | | 69,671 |
| Accrued expenses | | | | 78,104 |
| | | | | 206,104 |
| |
| |
|
| Net Assets ($) | | | | 131,209,951 |
| |
| |
|
| Composition of Net Assets ($): | | | | |
| Paid-in capital | | | | 131,219,377 |
| Accumulated undistributed investment income—net | | | | 13,403 |
| Accumulated net realized gain (loss) on investments | | | | (22,829) |
| |
| |
|
| Net Assets ($) | | | | 131,209,951 |
| |
| |
|
| Shares Outstanding | | | | |
| (unlimited number of $.001 par value shares of Beneficial Interest authorized) | | 131,219,377 |
| Net Asset Value, offering and redemption price per share ($) | | 1.00 |
See notes to financial statements.
|
STATEMENT OF OPERATIONS
Year Ended December 31, 2005
|
| Investment Income ($): | | |
| Interest Income | | 4,093,367 |
| Expenses: | | |
| Investment advisory fee—Note 2(a) | | 629,865 |
| Custodian fees | | 38,146 |
| Professional fees | | 29,367 |
| Prospectus and shareholders’ reports | | 25,833 |
| Trustees’ fees and expenses—Note 2(b) | | 9,216 |
| Shareholder servicing costs—Note 2(a) | | 7,438 |
| Miscellaneous | | 6,313 |
| Total Expenses | | 746,178 |
| Investment Income—Net | | 3,347,189 |
| |
|
| Net Realized Gain (Loss) on Investments—Note 1(b) ($) | | (65) |
| Net Increase in Net Assets Resulting from Operations | | 3,347,124 |
See notes to financial statements.
|
The Portfolio 11
STATEMENT OF CHANGES IN NET ASSETS
| | | Year Ended December 31, |
| |
|
| | | 2005 | | 2004 |
| |
| |
|
| Operations ($): | | | | |
| Investment income—net | | 3,347,189 | | 993,834 |
| Net realized gain (loss) on investments | | (65) | | 1,438 |
| Net Increase (Decrease) in | | | | |
| Net Assets Resulting from Operations | | 3,347,124 | | 995,272 |
| |
| |
|
| Dividends to Shareholders from ($): | | | | |
| Investment income—net | | (3,333,786) | | (993,834) |
| |
| |
|
| Beneficial Interest Transactions ($1.00 per share): | | |
| Net proceeds from shares sold | | 224,565,495 | | 246,007,735 |
| Dividends reinvested | | 3,333,786 | | 993,834 |
| Cost of shares redeemed | | (200,931,351) | | (295,333,389) |
| Increase (Decrease) in Net Assets | | | | |
| from Beneficial Interest Transactions | | 26,967,930 | | (48,331,820) |
| Total Increase (Decrease) in Net Assets | | 26,981,268 | | (48,330,382) |
| |
| |
|
| Net Assets ($): | | | | |
| Beginning of Period | | 104,228,683 | | 152,559,065 |
| End of Period | | 131,209,951 | | 104,228,683 |
| Undistributed investment income—net | | 13,403 | | — |
See notes to financial statements.
|
The following table describes the performance for the fiscal periods indicated.Total return shows how much your investment in the portfolio would have increased (or decreased) during each period, assuming you had reinvested all dividends and dis-tributions.These figures have been derived from the portfolio ’s financial statements.
| | | | | Year Ended December 31, | | |
| |
| |
| |
|
| | | 2005 | | 2004 | | 2003 | | 2002 | | 2001 |
| |
| |
| |
| |
| |
|
| Per Share Data ($): | | | | | | | | | | |
| Net asset value, beginning of period | | 1.00 | | 1.00 | | 1.00 | | 1.00 | | 1.00 |
| Investment Operations: | | | | | | | | | | |
| Investment income—net | | .026 | | .008 | | .007 | | .015 | | .039 |
| Distributions: | | | | | | | | | | |
| Dividends from investment income—net | | (.026) | | (.008) | | (.007) | | (.015) | | (.039) |
| Net asset value, end of period | | 1.00 | | 1.00 | | 1.00 | | 1.00 | | 1.00 |
| |
| |
| |
| |
| |
|
| Total Return (%) | | 2.65 | | .80 | | .70 | | 1.46 | | 3.97 |
| |
| |
| |
| |
| |
|
| Ratios/Supplemental Data (%): | | | | | | | | | | |
| Ratio of total expenses | | | | | | | | | | |
| to average net assets | | .59 | | .60 | | .57 | | .56 | | .58 |
| Ratio of net expenses | | | | | | | | | | |
| to average net assets | | .59 | | .60 | | .57 | | .56 | | .58 |
| Ratio of net investment income | | | | | | | | | | |
| to average net assets | | 2.66 | | .77 | | .71 | | 1.44 | | 3.72 |
| |
| |
| |
| |
| |
|
| Net Assets, end of period ($ x 1,000) | | 131,210 | | 104,229 | | 152,559 | | 196,217 | | 190,449 |
See notes to financial statements.
|
The Portfolio 13
NOTES TO FINANCIAL STATEMENTS
NOTE 1—Significant Accounting Policies:
Dreyfus Variable Investment Fund (the “fund”) is registered under the Investment Company Act of 1940, as amended (the “Act”), as an open-end management investment company, operating as a series company currently offering twelve series, including the Money Market Portfolio (the “portfolio”).The portfolio is only offered to separate accounts established by insurance companies to fund variable annuity contracts and variable life insurance policies.The portfolio is a diversified series.The portfolio’s investment objective is to provide as high a level of current income as is consistent with the preservation of capital and the maintenance of liquidity.The Dreyfus Corporation (the “Manager” or “Dreyfus”) serves as the portfolio’s investment adviser. The Manager is a wholly-owned subsidiary of Mellon Financial Corporation (“Mellon Financial”). Dreyfus Service Corporation (the “Distributor”), a wholly-owned subsidiary of the Manager, is the distributor of the portfolio’s shares, which are sold without a sales charge.
It is the portfolio’s policy to maintain a continuous net asset value per share of $1.00; the portfolio has adopted certain investment, portfolio valuation and dividend and distribution policies to enable it to do so. There is no assurance, however, that the portfolio will be able to maintain a stable net asset value per share of $1.00.
The fund accounts separately for the assets, liabilities and operations of each series. Expenses directly attributable to each series are charged to that series’ operations; expenses which are applicable to all series are allocated among them on a pro rata basis.
The portfolio’s financial statements are prepared in accordance with U.S. generally accepted accounting principles, which may require the use of management estimates and assumptions.Actual results could differ from those estimates.
The fund enters into contracts that contain a variety of indemnifica-tions.The portfolio’s maximum exposure under these arrangements is unknown. The portfolio does not anticipate recognizing any loss related to these arrangements.
(a) Portfolio valuation: Investments in securities are valued at amortized cost in accordance with Rule 2a-7 of the Act, which has been determined by the fund’s Board of Trustees to represent the fair value of the portfolio’s investments.
(b) Securities transactions and investment income: Securities transactions are recorded on a trade date basis. Realized gain and loss from securities transactions are recorded on the identified cost basis. Interest income, adjusted for accretion of discount and amortization of premium on investments, is earned from settlement date and recognized on the accrual basis. Cost of investments represents amortized cost.
The portfolio has an arrangement with the custodian bank whereby the portfolio receives earnings credits from the custodian when positive cash balances are maintained, which are used to offset custody fees. For financial reporting purposes, the portfolio includes net earnings credits, if any, as an expense offset in the Statement of Operations.
The portfolio may enter into repurchase agreements with financial institutions, deemed to be creditworthy by the Manager, subject to the seller’s agreement to repurchase and the portfolio’s agreement to resell such securities at a mutually agreed upon price. Securities purchased subject to repurchase agreements are deposited with the portfolio’s custodian and, pursuant to the terms of the repurchase agreement, must have an aggregate market value greater than or equal to the terms of the repurchase price plus accrued interest at all times. If the value of the underlying securities falls below the value of the repurchase price plus accrued interest, the portfolio will require the seller to deposit additional collateral by the next business day. If the request for additional collateral is not met, or the seller defaults on its repurchase obligation, the portfolio maintains its right to sell the underlying securities at market value and may claim any resulting loss against the seller.
(c) Dividends to shareholders: It is the policy of the portfolio to declare dividends daily from investment income-net. Such dividends are paid monthly. Dividends from net realized capital gain, if any, are normally declared and paid annually, but the portfolio may make dis-
The Portfolio 15
NOTES TO FINANCIAL STATEMENTS (continued)
|
tributions on a more frequent basis to comply with the distribution requirements of the Internal Revenue Code of 1986 as amended (the “Code”). To the extent that net realized capital gain can be offset by capital loss carryovers, it is the policy of the portfolio not to distribute such gain.
On January 3, 2006, the fund declared a cash dividend of approximately $.0001 per share from undistributed investment income-net which includes investment income-net for Saturday December 31, 2005.
(d) Federal income taxes: It is the policy of the portfolio to continue to qualify as a regulated investment company, if such qualification is in the best interests of its shareholders, by complying with the applicable provisions of the Code, and to make distributions of taxable income sufficient to relieve it from substantially all federal income and excise taxes.
At December 31, 2005, the components of accumulated earnings on a tax basis were substantially the same as for financial reporting purposes.
The accumulated capital loss carryover of $22,898 is available to be applied against future net securities profits, if any, realized subsequent to December 31, 2005. If not applied, $783 of the carryover expires in fiscal 2007, $11,060 expires in fiscal 2008, $10,973 expires in fiscal 2010, $17 expires in fiscal 2011 and $65 expires in fiscal 2013.
The tax character of distributions paid to shareholders during the fiscal periods ended December 31, 2005 and December 31, 2004, were all ordinary income.
At December 31, 2005, the cost of investments for federal income tax purposes was substantially the same as the cost for financial reporting purposes (see the Statement of Investments).
NOTE 2—Investment Advisory Fee and Other Transactions With Affiliates:
(a) Pursuant to an Investment Advisory Agreement with the Manager, the investment advisory fee is computed at the annual rate of .50% of the value of the portfolio’s average daily net assets and is payable monthly.
The portfolio compensates Dreyfus Transfer, Inc., a wholly-owned subsidiary of the Manager, under a transfer agency agreement for providing personnel and facilities to perform transfer agency services for the portfolio. During the period ended December 31, 2005, the portfolio was charged $319 pursuant to the transfer agency agreement.
During the period ended December 31, 2005, the portfolio was charged $3,762 for services performed by the Chief Compliance Officer.
The components of Due to The Dreyfus Corporation and affiliates in the Statement of Assets and Liabilities consist of: investment advisory fee $56,421, chief compliance officer fees $1,858 and transfer agency per account fees $50.
(b) Each Board member also serves as a Board member of other funds within the Dreyfus complex. Annual retainer fees and attendance fees are allocated to each fund based on net assets.
The Portfolio 17
REPORT OF INDEPENDENT REGISTERED PUBLIC ACCOUNTING FIRM
Shareholders and Board of Trustees
Dreyfus Variable Investment Fund, Money Market Portfolio
We have audited the accompanying statement of assets and liabilities, including the statement of investments, of Dreyfus Variable Investment Fund, Money Market Portfolio (one of the funds comprising Dreyfus Variable Investment Fund) as of December 31, 2005 and the related statement of operations for the year then ended, the statement of changes in net assets for each of the two years in the period then ended, and financial highlights for each of the years indicated therein. These financial statements and financial highlights are the responsibility of the Fund’s management. Our responsibility is to express an opinion on these financial statements and financial highlights based on our audits.
We conducted our audits in accordance with the standards of the Public Company Accounting Oversight Board (United States).Those standards require that we plan and perform the audit to obtain reasonable assurance about whether the financial statements and financial highlights are free of material misstatement.We were not engaged to perform an audit of the Fund’s internal control over financial reporting. Our audits included consideration of internal control over financial reporting as a basis for designing audit procedures that are appropriate in the circumstances,but not for the purpose of expressing an opinion on the effectiveness of the Fund’s internal control over financial reporting.Accordingly, we express no such opinion.An audit also includes examining, on a test basis, evidence supporting the amounts and disclosures in the financial statements and financial highlights, assessing the accounting principles used and significant estimates made by management, and evaluating the overall financial statement presentation. Our procedures included confirmation of securities owned as of December 31, 2005 by correspondence with the custodian. We believe that our audits provide a reasonable basis for our opinion.
In our opinion, the financial statements and financial highlights referred to above present fairly, in all material respects, the financial position of Dreyfus Variable Investment Fund, Money Market Portfolio at December 31, 2005, the results of its operations for the year then ended, the changes in its net assets for each of the two years in the period then ended, and the financial highlights for each of the indicated years, in conformity with U.S. generally accepted accounting principles.
New York, New York
February 6, 2006
|
BOARD MEMBERS INFORMATION (Unaudited)
| Joseph S. DiMartino (62) |
| Chairman of the Board (1995) |
| Principal Occupation During Past 5 Years: |
| • Corporate Director and Trustee |
Other Board Memberships and Affiliations:
|
- The Muscular Dystrophy Association, Director
- Levcor International, Inc., an apparel fabric processor, Director
- Century Business Services, Inc., a provider of outsourcing functions for small and medium size companies, Director
- The Newark Group, a provider of a national market of paper recovery facilities, paperboard mills and paperboard converting plants, Director
- Sunair Services Corporation, engages in the design, manufacture and sale of high frequency systems for long-range voice and data communications, as well as providing certain outdoor- related services to homes and businesses, Director
No. of Portfolios for which Board Member Serves: 193
———————
| David P. Feldman (66) |
| Board Member (1994) |
| Principal Occupation During Past 5 Years: |
| • Corporate Director and Trustee |
Other Board Memberships and Affiliations:
|
- BBH Mutual Funds Group (11 funds), Director
- The Jeffrey Company, a private investment company, Director
- QMED, a medical device company, Director
No. of Portfolios for which Board Member Serves: 58
———————
| James F. Henry (75) |
| Board Member (1990) |
Principal Occupation During Past 5 Years:
|
- President, CPR Institute for Dispute Resolution, a non-profit organization principally engaged in the development of alternatives to business litigation (Retired 2003)
No. of Portfolios for which Board Member Serves: 22
|
The Portfolio 19
BOARD MEMBERS INFORMATION (Unaudited) (continued)
| Dr. Paul A. Marks (79) |
| Board Member (1990) |
| | Principal Occupation During Past 5 Years:
|
- President, Emeritus (2000-present) and President and Chief Executive Officer of Memorial Sloan-Kettering Cancer Center (Retired 1999)
| | Other Board Memberships and Affiliations:
|
- Pfizer, Inc., a pharmaceutical company, Director-Emeritus
- Lazard Freres & Company, LLC, Senior Adviser
- Carrot Capital Health Care Ventures; Advisor
- Armgo-Start-Up Biotech; Board of Directors
- Nanoviricide, Board Director
- PTC, Scientific Advisory Board
| | No. of Portfolios for which Board Member Serves: 22
|
———————
| Dr. Martin Peretz (66) |
| Board Member (1990) |
| | Principal Occupation During Past 5 Years:
|
- Editor-in-Chief of The New Republic Magazine
- Lecturer in Social Studies at Harvard University (1965-2001)
- Co-Chairman of TheStreet.com, a financial daily on the web
| | Other Board Memberships and Affiliations:
|
- Academy for Liberal Education, an accrediting agency for colleges and universities certified by the U.S. Department of Education, Director
- Harvard Center for Blood Research,Trustee
- Bard College,Trustee
- Board of Overseers of YIVO Institute for Jewish Research, Chairman
| | No. of Portfolios for which Board Member Serves: 22
|
———————
Once elected all Board Members serve for an indefinite term.The address of the Board Members and Officers is in c/o The Dreyfus Corporation, 200 Park Avenue, New York, New York 10166. Additional information about the Board Members is available in the fund’s Statement of Additional Information which can be obtained from Dreyfus free of charge by calling this toll free number: 1-800-554-4611.
John M. Fraser, Jr., Emeritus Board Member
Rosalind Gersten Jacobs, Emeritus Board Member
OFFICERS OF THE FUND (Unaudited)
| STEPHEN E. CANTER, President since |
| March 2000. |
Chairman of the Board, Chief Executive Officer and Chief Operating Officer of the Manager, and an officer of 90 investment companies (comprised of 184 portfolios) managed by the Manager. Mr. Canter also is a Board member and, where applicable, an Executive Committee Member of the other investment management subsidiaries of Mellon Financial Corporation, each of which is an affiliate of the Manager. He is 60 years old and has been an employee of the Manager since May 1995.
| STEPHEN R. BYERS, Executive Vice |
| President since November 2002. |
Chief Investment Officer,Vice Chairman and a director of the Manager, and an officer of 90 investment companies (comprised of 184 portfolios) managed by the Manager. Mr. Byers also is an officer, director or an Executive Committee Member of certain other investment management subsidiaries of Mellon Financial Corporation, each of which is an affiliate of the Manager. He is 52 years old and has been an employee of the Manager since January 2000.
| MARK N. JACOBS, Vice President since |
| March 2000. |
Executive Vice President, Secretary and General Counsel of the Manager, and an officer of 91 investment companies (comprised of 200 portfolios) managed by the Manager. He is 59 years old and has been an employee of the Manager since June 1977.
| MICHAEL A. ROSENBERG, Vice President |
| and Secretary since August 2005. |
Associate General Counsel of the Manager, and an officer of 91 investment companies (comprised of 200 portfolios) managed by the Manager. He is 45 years old and has been an employee of the Manager since October 1991.
| JAMES BITETTO, Vice President and |
| Assistant Secretary since August 2005. |
Assistant General Counsel and Assistant Secretary of the Manager, and an officer of 91 investment companies (comprised of 200 portfolios) managed by the Manager. He is 39 years old and has been an employee of the Manager since December 1996.
| JONI LACKS CHARATAN, Vice |
| President and Assistant Secretary |
| since August 2005. |
Associate General Counsel of the Manager, and an officer of 91 investment companies (comprised of 200 portfolios) managed by the Manager. She is 50 years old and has been an employee of the Manager since October 1988.
| JOSEPH M. CHIOFFI, Vice President and |
| Assistant Secretary since August 2005. |
Assistant General Counsel of the Manager, and an officer of 91 investment companies (comprised of 200 portfolios) managed by the Manager. He is 44 years old and has been an employee of the Manager since June 2000.
| JANETTE E. FARRAGHER, Vice |
| President and Assistant Secretary |
| since August 2005. |
Associate General Counsel of the Manager, and an officer of 91 investment companies (comprised of 200 portfolios) managed by the Manager. She is 42 years old and has been an employee of the Manager since February 1984.
| JOHN B. HAMMALIAN, Vice President and |
| Assistant Secretary since August 2005. |
Associate General Counsel of the Manager, and an officer of 91 investment companies (comprised of 200 portfolios) managed by the Manager. He is 42 years old and has been an employee of the Manager since February 1991.
The Portfolio 21
OFFICERS OF THE FUND (Unaudited) (continued)
| ROBERT R. MULLERY, Vice President and |
| Assistant Secretary since August 2005. |
Associate General Counsel of the Manager, and an officer of 91 investment companies (comprised of 200 portfolios) managed by the Manager. He is 53 years old and has been an employee of the Manager since May 1986.
| JEFF PRUSNOFSKY, Vice President and |
| Assistant Secretary since August 2005. |
Associate General Counsel of the Manager, and an officer of 91 investment companies (comprised of 200 portfolios) managed by the Manager. He is 40 years old and has been an employee of the Manager since October 1990.
| JAMES WINDELS, Treasurer since |
| November 2001. |
Director – Mutual Fund Accounting of the Manager, and an officer of 91 investment companies (comprised of 200 portfolios) managed by the Manager. He is 47 years old and has been an employee of the Manager since April 1985.
| ERIK D. NAVILOFF, Assistant Treasurer |
| since December 2002. |
Senior Accounting Manager – Taxable Fixed Income Funds of the Manager, and an officer of 91 investment companies (comprised of 200 portfolios) managed by the Manager. He is 37 years old and has been an employee of the Manager since November 1992.
| ROBERT ROBOL, Assistant Treasurer |
| since August 2003. |
Senior Accounting Manager – Money Market and Municipal Bond Funds of the Manager, and an officer of 91 investment companies (comprised of 200 portfolios) managed by the Manager. He is 41 years old and has been an employee of the Manager since October 1988.
| ROBERT SVAGNA, Assistant Treasurer |
| since December 2002. |
Senior Accounting Manager – Equity Funds of the Manager, and an officer of 91 investment companies (comprised of 200 portfolios) managed by the Manager. He is 38 years old and has been an employee of the Manager since November 1990.
| GAVIN C. REILLY, Assistant Treasurer |
| since December 2005. |
Tax Manager of the Investment Accounting and Support Department of the Manager, and an officer of 91 investment companies (comprised of 200 portfolios) managed by the Manager. He is 37 years old and has been an employee of the Manager since April 1991.
| JOSEPH W. CONNOLLY, Chief Compliance |
| Officer since October 2004. |
Chief Compliance Officer of the Manager and The Dreyfus Family of Funds (91 investment companies, comprised of 200 portfolios). From November 2001 through March 2004, Mr. Connolly was first Vice-President, Mutual Fund Servicing for Mellon Global Securities Services. In that capacity, Mr. Connolly was responsible for managing Mellon’s Custody, Fund Accounting and Fund Administration services to third-party mutual fund clients. He is 48 years old and has served in various capacities with the Manager since 1980, including manager of the firm’s Fund Accounting Department from 1997 through October 2001.
| WILLIAM GERMENIS, Anti-Money |
| Laundering Compliance Officer since |
| September 2002. |
Vice President and Anti-Money Laundering Compliance Officer of the Distributor, and the Anti-Money Laundering Compliance Officer of 87 investment companies (comprised of 196 portfolios) managed by the Manager. He is 35 years old and has been an employee of the Distributor since October 1998.
22
NOTES
| Dreyfus Variable |
| Investment Fund, |
| Money Market Portfolio |
| 200 Park Avenue |
| New York, NY 10166 |
| |
| Investment Adviser |
| The Dreyfus Corporation |
| 200 Park Avenue |
| New York, NY 10166 |
| |
| Custodian |
| The Bank of New York |
| One Wall Street |
| New York, NY 10286 |
| Transfer Agent & |
| Dividend Disbursing Agent |
| Dreyfus Transfer, Inc. |
| 200 Park Avenue |
| New York, NY 10166 |
| |
| Distributor |
| Dreyfus Service Corporation |
| 200 Park Avenue |
| New York, NY 10166 |
Telephone 1-800-554-4611 or 516-338-3300
Mail The Dreyfus Family of Funds, 144 Glenn Curtiss Boulevard, Uniondale, NY 11556-0144 Attn: Institutional Servicing
The portfolio files its complete schedule of portfolio holdings with the Securities and Exchange Commission (“SEC”) for the first and third quarters of each fiscal year on Form N-Q. The portfolio’s Forms N-Q are available on the SEC’s website at http://www.sec.gov and may be reviewed and copied at the SEC’s Public Reference Room in Washington, DC. Information on the operation of the Public Reference Room may be obtained by calling 1-800-SEC-0330.
Information regarding how the portfolio voted proxies relating to portfolio securities for the 12-month period ended June 30, 2005, is available on the SEC’s website at http://www.sec.gov and without charge, upon request, by calling 1-800-645-6561.
© 2006 Dreyfus Service Corporation


The views expressed in this report reflect those of the portfolio manager only through the end of the period covered and do not necessarily represent the views of Dreyfus or any other person in the Dreyfus organization.Any such views are subject to change at any time based upon market or other conditions and Dreyfus disclaims any responsibility to update such views. These views may not be relied on as investment advice and, because investment decisions for a Dreyfus portfolio are based on numerous factors, may not be relied on as an indication of trading intent on behalf of any Dreyfus portfolio.
Not FDIC-Insured • Not Bank-Guaranteed • May Lose Value
| | | Contents |
| |
| | | T H E P O R T F O L I O |
| |
|
| 2 | | Letter from the Chairman |
| 3 | | Discussion of Performance |
| 6 | | Portfolio Performance |
| 8 | | Understanding Your Portfolio’s Expenses |
| 8 | | Comparing Your Portfolio’s Expenses |
| | | With Those of Other Funds |
| 9 | | Statement of Investments |
| 23 | | Statement of Financial Futures |
| 23 | | Statement of Options Written |
| 24 | | Statement of Assets and Liabilities |
| 25 | | Statement of Operations |
| 26 | | Statement of Changes in Net Assets |
| 28 | | Financial Highlights |
| 32 | | Notes to Financial Statements |
| 45 | | Report of Independent Registered |
| | | Public Accounting Firm |
| 46 | | Board Members Information |
| 48 | | Officers of the Fund |
| | | FOR MORE INFORMATION |
| |
|
| | | Back Cover |
Dreyfus Variable Investment Fund,
Quality Bond Portfolio
The Portfolio

LETTER FROM THE CHAIRMAN
Dear Shareholder:
We are pleased to present this annual report for Dreyfus Variable Investment Fund, Quality Bond Portfolio, covering the 12-month period from January 1, 2005, through December 31, 2005. Inside, you’ll find valuable information about how the portfolio was managed during the reporting period, including a discussion with the primary portfolio manager, Catherine Powers.
Most sectors of the taxable fixed-income marketplace shrugged off bad news and responded to more positive factors in 2005. Although short-term interest rates rose by 200 basis points due to eight consecutive increases by the Federal Reserve Board during the year, the yield of the 10-year U.S. Treasury security ended the year only 17 basis points higher than where it began. Analysts generally attribute the bond market’s resilience to low inflation and robust investor demand, especially from overseas investors.
We expect the U.S. economy to continue its moderate expansion in 2006, while inflation should stay low and investor demand for income-producing securities should remain high. Risks in the new year include uncertainty regarding Fed policy under a new chairman and the possibility of continued turmoil in the automotive sector, including some of the corporate bond market’s largest issuers.
As always, we encourage you to speak with your financial consultant about how these and other market forces may affect your investments. Thank you for your continued confidence and support.

The Dreyfus Corporation
January 17, 2006
|

DISCUSSION OF PERFORMANCE
Catherine Powers, Primary Portfolio Manager
How did Dreyfus Variable Investment Fund, Quality Bond Portfolio perform relative to its benchmark?
For the 12-month period ended December 31, 2005, the portfolio’s Initial shares achieved a total return of 2.48%, and its Service shares achieved a total return of 2.26% .1 The portfolio produced aggregate income dividends of $0.41 per share and $0.38 per share for its Initial and Service shares, respectively. In comparison, the portfolio’s benchmark, the Lehman Brothers U.S. Aggregate Index (the “Index”), achieved a total return of 2.43% for the same period.2
Although low inflation and robust investor demand generally supported bond prices during 2005, rising short-term interest rates limited their returns.The portfolio’s results were slightly higher than the Index’s, primarily due to its “barbell” yield-curve strategy, which benefited from a flattening U.S.Treasury yield curve, and good relative performance from foreign securities and Treasury Inflation Protected Securities (“TIPS”).
What is the portfolio’s investment approach?
The portfolio seeks to maximize total return consisting of capital appreciation and current income. To achieve this objective, the portfolio normally invests at least 80% of its assets in bonds, including corporate bonds, mortgage-related securities, collateralized mortgage obligations and asset-backed securities that, when purchased, are A-rated or better or what we believe are the unrated equivalent, and in securities issued or guaranteed by the U.S. government or its agencies or its instrumen-talities.The portfolio may also invest up to 10% of its net assets in non-dollar-denominated foreign securities and up to 20% of its assets in the securities of foreign issues collectively.
What other factors affected the portfolio’s performance?
In its ongoing effort to forestall potential inflationary pressures, the Federal Reserve Board (the “Fed”) raised the overnight federal
DISCUSSION OF PERFORMANCE (continued)
|
funds rate eight consecutive times during 2005, driving it from 2.25% to 4.25% .All other things being equal, bond prices should fall when short-term interest rates rise, as fixed-income investors can invest in higher coupon new issues.The reporting period proved to be different. Longer-term bond prices held up surprisingly well, with domestic investors expressing confidence in the Fed’s inflation-fighting ability. Robust demand from overseas investors also supported prices of U.S. government securities.
The portfolio benefited from a flattening yield curve by adopting a “barbell” strategy that focused on underweighting intermediate maturity bonds in favor of cash and 30-year securities. In the credit market, the portfolio also enjoyed attractive results from the allocation to emerging markets where the credit quality is improving for sovereign issuers including Argentina, Brazil and Russia.These nations also benefited from rising demand for the commodities they produce. In the global marketplace, the portfolio’s position in hedged European bonds capitalized on lower interest rates in Europe relative to the U.S. amid steady rate hikes by the Fed.
U.S. corporate bonds encountered heightened volatility amid increased turmoil in the automotive sector and concerns regarding mergers-and-acquisitions activity and leveraged buyouts. Most significantly, General Motors and Ford reported disappointing financial results in the spring, prompting the major bond rating agencies to eventually downgrade their debt to the high-yield category.The portfolio held relatively few automotive bonds when the automakers’ financial problems became known. Subsequently, we have established tactical positions in short maturity bonds issued by the financing arms of Ford and GM as we viewed their pricing as significantly undervalued and likely to rebound.
Finally, TIPS positively impacted portfolio performance as the sector benefited from rising inflation accruals amid much higher energy prices. On the other hand, the portfolio’s underweighted position in mortgage-backed securities prevented it from participating fully in the sector’s relatively attractive returns. However, we offset some of this
allocation-related weakness by investing in high-quality alternatives to traditional mortgage pass-through securities, including commercial mortgages, Ginnie Mae project loans and asset-backed securities.
What is the portfolio’s current strategy?
In the minutes of its December meeting, some members of the Fed’s Federal Open Market Committee expressed concern that further rate hikes might constrain economic growth, suggesting to many analysts that the Fed may be nearing the end of its credit tightening campaign. Although we expect at least one more rate hike in 2006, we have begun to prepare the portfolio for the next phase of the credit cycle. Accordingly, we have moved from a barbell yield-curve strategy and toward a “bulleted” structure, emphasizing securities in the five-year maturity range. In addition, we have lengthened the portfolio’s average duration (a measure of sensitivity to changing interest rates) from a short position to one that is in line with the benchmark.
| | | The portfolio is only available as a funding vehicle under variable life insurance policies or variable |
| | | annuity contracts issued by insurance companies. Individuals may not purchase shares of the |
| | | portfolio directly. A variable annuity is an insurance contract issued by an insurance company that |
| | | enables investors to accumulate assets on a tax-deferred basis for retirement or other long-term |
| | | goals.The investment objective and policies of Dreyfus Variable Investment Fund, Quality Bond |
| | | Portfolio may be similar to other funds/portfolios managed or advised by Dreyfus. However, the |
| | | investment results of the portfolio may be higher or lower than, and may not be comparable to, |
| | | those of any other Dreyfus fund/portfolio. |
| 1 | | Total return includes reinvestment of dividends and any capital gains paid. Past performance is no |
| | | guarantee of future results. Share price and investment return fluctuate such that upon redemption, |
| | | portfolio shares may be worth more or less than their original cost.The portfolio’s performance does |
| | | not reflect the deduction of additional charges and expenses imposed in connection with investing |
| | | in variable insurance contracts, which will reduce returns. Return figures provided reflect the |
| | | absorption of certain portfolio expenses by The Dreyfus Corporation pursuant to an agreement in |
| | | effect through June 30, 2006, at which time it may be extended, modified or terminated. Had |
| | | these expenses not been absorbed, the portfolio’s returns would have been lower. |
| 2 | | SOURCE: LIPPER INC. — Reflects reinvestment of dividends and, where applicable, capital |
| | | gain distributions.The Lehman Brothers U.S. Aggregate Index is a widely accepted, unmanaged |
| | | total return index of corporate, U.S. government and U.S. government agency debt instruments, |
| | | mortgage-backed securities and asset-backed securities with an average maturity of 1-10 years. |
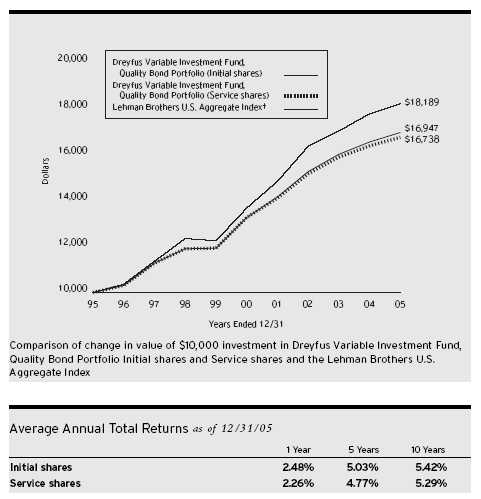
| The data for Service shares primarily represents the results of Initial shares for the period prior to December 31, |
| 2000 (inception date of Service shares). Actual Service shares’ average annual total return and hypothetical |
| growth results would have been lower. See notes below. |
| † Source: Lipper Inc. |
| Past performance is not predictive of future performance.The portfolio’s performance shown in the graph and table does not |
| reflect the deduction of taxes that a shareholder would pay on portfolio distributions or the redemption of portfolio shares. |
| The portfolio’s performance does not reflect the deduction of additional charges and expenses imposed in |
| connection with investing in variable insurance contracts which will reduce returns. |
| The above graph compares a $10,000 investment made in Initial and Service shares of Dreyfus Variable Investment |
| Fund, Quality Bond Portfolio on 12/31/95 to a $10,000 investment made in the Lehman Brothers U.S. Aggregate |
| Index (the “Index”) on that date. |
The portfolio’s Initial shares are not subject to a Rule 12b-1 fee.The portfolio’s Service shares are subject to a 0.25% annual Rule 12b-1 fee.The performance figures for Service shares reflect the performance of the portfolio’s Initial shares from their inception date through December 30, 2000, and the performance of the portfolio’s Service shares from December 31, 2000 (inception date of Service shares) to December 31, 2005 (blended performance figures).The blended performance figures have not been adjusted to reflect the higher operating expenses of the Service shares. If these expenses had been reflected, the blended performance figures would have been lower. All dividends and capital gain distributions are reinvested.
The portfolio’s performance shown in the line graph takes into account all applicable portfolio fees and expenses.The Index is a widely accepted, unmanaged index of corporate, U.S. government and U.S. government agency debt instruments, mortgage-backed securities and asset-backed securities.The Index does not take into account charges, fees and other expenses. Further information relating to portfolio performance, including expense reimbursements, if applicable, is contained in the Financial Highlights section of the prospectus and elsewhere in this report.
UNDERSTANDING YOUR PORTFOLIO’S EXPENSES (Unaudited)
As a mutual fund investor,you pay ongoing expenses,such as management fees and other expenses.Using the information below,you can estimate how these expenses affect your investment and compare them with the expenses of other funds.You also may pay one-time transaction expenses,including sales charges (loads) and redemption fees, which are not shown in this section and would have resulted in higher total expenses. For more information, see your portfolio’s prospectus or talk to your financial adviser.
Review your portfolio’s expenses
The table below shows the expenses you would have paid on a $1,000 investment in Dreyfus Variable Investment Fund, Quality Bond Portfolio from July 1, 2005 to December 31, 2005. It also shows how much a $1,000 investment would be worth at the close of the period, assuming actual returns and expenses.
| Expenses and Value of a $1,000 Investment | | |
| assuming actual returns for the six months ended December 31, 2005 |
| | | Initial Shares | | Service Shares |
| |
| |
|
| Expenses paid per $1,000 † | | $ 2.93 | | $ 4.19 |
| Ending value (after expenses) | | $1,002.00 | | $1,000.90 |
COMPARING YOUR PORTFOLIO’S EXPENSES WITH THOSE OF OTHER FUNDS (Unaudited)
Using the SEC’s method to compare expenses
The Securities and Exchange Commission (SEC) has established guidelines to help investors assess fund expenses. Per these guidelines, the table below shows your portfolio’s expenses based on a $1,000 investment, assuming a hypothetical 5% annualized return. You can use this information to compare the ongoing expenses (but not transaction expenses or total cost) of investing in the portfolio with those of other funds. All mutual fund shareholder reports will provide this information to help you make this comparison. Please note that you cannot use this information to estimate your actual ending account balance and expenses paid during the period.
Expenses and Value of a $1,000 Investment assuming a hypothetical 5% annualized return for the six months ended December 31, 2005
| | | Initial Shares | | Service Shares |
| |
| |
|
| Expenses paid per $1,000 † | | $ 2.96 | | $ 4.23 |
| Ending value (after expenses) | | $1,022.28 | | $1,021.02 |
† Expenses are equal to the portfolio’s annualized expense ratio of .58% for Initial shares and .83% for Service shares, multiplied by the average account value over the period, multiplied by 184/365 (to reflect the one-half year period).
| | STATEMENT OF INVESTMENTS
December 31, 2005
|
| | | Principal | | | | |
| Bonds and Notes—121.5% | | Amounta | | Value ($) |
| |
| |
|
| Aerospace & Defense—.4% | | | | | | |
| L-3 Communications: | | | | | | |
| Sr. Sub. Notes, 6.375%, 2015 | | 115,000 | | b | | 115,288 |
| Sr. Sub. Notes, 7.625%, 2012 | | 415,000 | | | | 438,863 |
| Raytheon, | | | | | | |
| Notes, 5.5%, 2012 | | 210,000 | | | | 215,082 |
| | | | | | | 769,233 |
| Agricultural—.4% | | | | | | |
| Altria, | | | | | | |
| Notes, 7%, 2013 | | 805,000 | | | | 882,206 |
| Airlines—.0% | | | | | | |
| USAir, | | | | | | |
| Enhanced Equipment Notes, Ser. C, 8.93%, 2009 | | 270,470 | | c,d | | 27 |
| Asset-Backed Ctfs-Automobile Receivables—4.3% | | | | |
| AmeriCredit Automobile Receivables Trust, | | | | | | |
| Ser. 2005-DA, Cl. A2, 4.75%, 2008 | | 675,000 | | | | 675,207 |
| Capital One Auto Finance Trust, | | | | | | |
| Ser. 2005-C, Cl. A2, 4.48%, 2008 | | 775,000 | | | | 773,801 |
| Chase Manhattan Auto Owner Trust, | | | | | | |
| Ser. 2005-B, Cl. A2, 4.77%, 2008 | | 675,000 | | | | 675,363 |
| Ford Credit Auto Owner Trust, | | | | | | |
| Ser. 2005-B, Cl. B, 4.64%, 2010 | | 650,000 | | | | 643,822 |
| Honda Auto Receivables Owner Trust, | | | | | | |
| Ser. 2005-5, Cl. A1, 4.220% 2006 | | 1,273,188 | | | | 1,272,865 |
| WFS Financial Owner Trust: | | | | | | |
| Ser. 2003-3, Cl. A4, 3.25%, 2011 | | 4,525,000 | | | | 4,456,582 |
| Ser. 2005-2, Cl. B, 4.57%, 2012 | | 325,000 | | | | 322,621 |
| | | | | | | 8,820,261 |
| Asset-Backed Ctfs.-Home Equity Loans—4.6% | | | | | | |
| Accredited Mortgage Loan Trust: | | | | | | |
| Ser. 2005-1, Cl. A2A, 4.48%, 2035 | | 218,006 | | e | | 218,170 |
| Ser. 2005-2, Cl. A2A, 4.48%, 2035 | | 481,171 | | e | | 481,419 |
| Ser. 2005-3, Cl. A2A, 4.48%, 2035 | | 722,387 | | e | | 722,910 |
| ACE Securities, | | | | | | |
| Ser. 2005-HE1, Cl. A2A, 4.50%, 2035 | | 230,328 | | e | | 230,521 |
| Ameriquest Mortgage Securities, | | | | | | |
| Ser. 2003-11, Cl. AF6, 5.14%, 2034 | | 525,000 | | | | 522,173 |
| Bear Stearns Asset Backed Securities: | | | | | | |
| Ser. 2005-HE2, Cl. 1A1, 4.49%, 2035 | | 168,093 | | e | | 168,229 |
| Ser. 2005-HE3, Cl. A1, 4.46%, 2035 | | 175,819 | | e | | 175,955 |
| Ser. 2005-HE4, Cl. 1A1, 4.48%, 2035 | | 369,767 | | e | | 370,064 |
| Ser. 2005-TC1, Cl. A1, 4.49%, 2035 | | 306,460 | | e | | 306,435 |
The Portfolio 9
| | STATEMENT OF INVESTMENTS (continued)
|
| | | Principal | | | | |
| Bonds and Notes (continued) | | Amount a | | Value ($) |
| |
| |
|
| Asset-Backed Ctfs.-Home Equity Loans (continued) | | | | |
| Centex Home Equity, | | | | | | |
| Ser. 2005-D, Cl. AV1, 4.49%, 2035 | | 705,316 | | e | | 705,802 |
| Fremont Home Loan Trust, | | | | | | |
| Ser. 2005-1, Cl. 2A1, 4.48%, 2035 | | 280,693 | | e | | 280,949 |
| Home Equity Asset Trust: | | | | | | |
| Ser. 2005-5, Cl. 2A1, 4.49%, 2035 | | 892,831 | | e | | 893,450 |
| Ser. 2005-8, Cl. 2A1, 4.49%, 2036 | | 577,619 | | e | | 578,079 |
| JP Morgan Mortgage Acquisition, | | | | | | |
| Ser. 2005-FRE1, Cl. A2F, 5.375%, 2027 | | 1,092,584 | | | | 1,092,280 |
| Mastr Asset Backed Securities Trust, | | | | | | |
| Ser. 2005-WMC1, Cl. A3, 4.48%, 2035 | | 231,289 | | e | | 231,324 |
| Merrill Lynch Mortgage Investors, | | | | | | |
| Ser. 2005-NC1, Cl. A2A, 4.49%, 2035 | | 10,715 | | e | | 10,723 |
| Morgan Stanley ABS Capital I, | | | | | | |
| Ser. 2005-NC2, Cl. A3A, 4.46%, 2035 | | 395,495 | | e | | 395,786 |
| Morgan Stanley Home Equity Loans, | | | | | | |
| Ser. 2005-2, Cl. A2A, 4.47%, 2035 | | 327,267 | | e | | 327,103 |
| Residential Asset Securities: | | | | | | |
| Ser. 2005-AHL2, Cl. A1, 4.48%, 2035 | | 789,338 | | e | | 789,860 |
| Ser. 2005-EMX1, Cl. AI1, 4.48%, 2035 | | 326,833 | | e | | 327,102 |
| Ser. 2005-EMX3, Cl. AI1, 4.48%, 2035 | | 672,371 | | e | | 672,892 |
| | | | | | | 9,501,226 |
| Asset-Backed Ctfs.-Manufactured Housing—1.0% | | | | |
| Green Tree Financial, | | | | | | |
| Ser. 1994-7, Cl. M1, 9.25%, 2020 | | 463,838 | | | | 487,548 |
| Origen Manufactured Housing: | | | | | | |
| Ser. 2005-A, Cl. A1, 4.06%, 2013 | | 751,220 | | | | 747,568 |
| Ser. 2005-B, Cl. A1, 5.25%, 2014 | | 925,000 | | | | 925,768 |
| | | | | | | 2,160,884 |
| Asset-Backed-Other—6.1% | | | | | | |
| Citigroup Mortgage Loan Trust, | | | | | | |
| Ser. 2005-OPT3, Cl. A1A, 4.47%, 2035 | | 664,751 | | e | | 664,891 |
| Countrywide, | | | | | | |
| Ser. 2005-2, Cl. 2A1, 4.47%, 2035 | | 243,533 | | e | | 243,562 |
| Credit-Based Asset Servicing and Securitization: | | | | |
| Ser. 2005-CB4, Cl. AV1, 4.48%, 2035 | | 449,160 | | e | | 449,438 |
| Ser. 2005-CB7, Cl. AF1, 5.208%, 2035 | | 1,070,404 | | | | 1,068,896 |
| Ser. 2005-CB8, Cl. AF1B, 5.451%, 2035 | | 1,025,000 | | | | 1,024,416 |
| First Franklin Mortgage Loan, | | | | | | |
| Ser. 2005-FFH3, Cl. 2A1, 4.51%, 2035 | | 794,791 | | e | | 795,384 |
10
| | | Principal | | | | |
| Bonds and Notes (continued) | | Amount a | | Value ($) |
| |
| |
|
| Asset-Backed-Other (continued) | | | | | | |
| Merrill Lynch Mortgage Investors, | | | | | | |
| Ser. 2005-WMC1, Cl. A2A, 4.48%, 2035 | | 21,776 | | e | | 21,793 |
| Morgan Stanley ABS Capital I: | | | | | | |
| Ser. 2005-WMC2, Cl. A2A, 4.46%, 2035 | | 199,908 | | e | | 200,060 |
| Ser. 2005-WMC6, Cl. A2A, 4.49%, 2035 | | 449,823 | | e | | 450,141 |
| Ownit Mortgage Loan, | | | | | | |
| Ser. 2005-2, Cl. A2A, 4.49%, 2036 | | 555,922 | | e | | 556,022 |
| Popular ABS Mortgage Pass-Through Trust, | | | | | | |
| Ser. 2005-D, Cl. A1, 5.361%, 2036 | | 999,471 | | | | 999,458 |
| Residential Asset Mortgage Products: | | | | | | |
| Ser. 2004-RS12, Cl. AII1, 4.51%, 2027 | | 484,080 | | e | | 484,528 |
| Ser. 2005-EFC5, Cl. A1, 4.48%, 2035 | | 855,778 | | e | | 856,343 |
| Ser. 2005-RS2, Cl. AII1, 4.49%, 2035 | | 355,722 | | e | | 356,068 |
| Ser. 2005-RS3, Cl. AIA1, 4.48%, 2035 | | 676,071 | | e | | 676,597 |
| Ser. 2005-RZ1, Cl. A1, 4.48%, 2034 | | 420,756 | | e | | 421,107 |
| Saxon Asset Securities Trust: | | | | | | |
| Ser. 2004-2, Cl. AF2, 4.15%, 2035 | | 2,298,000 | | | | 2,278,503 |
| Ser. 2005-3, Cl. A2A, 4.50%, 2035 | | 621,230 | | e | | 621,662 |
| Soundview Home Equity Loan Trust, | | | | | | |
| Ser. 2005-B, Cl. M3, 5.825%, 2035 | | 225,000 | | e | | 224,254 |
| Specialty Underwriting & Residential Finance, | | | | |
| Ser. 2005-BC1, Cl. A1A, 4.49%, 2035 | | 244,900 | | e | | 245,086 |
| | | | | | | 12,638,209 |
| Auto Manufacturing—.2% | | | | | | |
| DaimlerChrysler: | | | | | | |
| Notes, 4.875%, 2010 | | 175,000 | | | | 171,036 |
| Notes, 8.5%, 2031 | | 180,000 | | | | 218,431 |
| | | | | | | 389,467 |
| Banking—5.0% | | | | | | |
| Chevy Chase Bank, | | | | | | |
| Sub. Notes, 6.875%, 2013 | | 260,000 | | | | 269,100 |
| Chuo Mitsui Trust & Banking, | | | | | | |
| Sub. Notes, 5.506%, 2049 | | 565,000 | | b,e | | 548,470 |
| Colonial Bank NA/Montgomery AL, | | | | | | |
| Sub. Notes, 6.375%, 2015 | | 500,000 | | | | 515,072 |
| HBOS Capital, | | | | | | |
| Notes, 6.071%, 2049 | | 2,590,000 | | b,e | | 2,680,492 |
| Northern Rock, | | | | | | |
| Notes, 5.6%, 2049 | | 535,000 | | b,e | | 538,875 |
The Portfolio 11
STATEMENT OF INVESTMENTS (continued)
|
| | | Principal | | |
| Bonds and Notes (continued) | | Amount a | | Value ($) |
| |
| |
|
| Banking (continued) | | | | |
| Rabobank Capital Funding II, | | | | |
| Bonds, 5.26%, 2049 | | 1,385,000 b,e | | 1,374,355 |
| Regions Financial, | | | | |
| Sr. Notes, 4.38%, 2008 | | 825,000 e | | 825,446 |
| Resona Bank, | | | | |
| Notes, 5.85%, 2049 | | 475,000 b,e | | 473,897 |
| Sovereign Bancorp, | | | | |
| Sr. Notes, 4.8%, 2010 | | 525,000 b | | 515,064 |
| Sumitomo Mitsui Banking, | | | | |
| Notes, 5.625%, 2049 | | 315,000 b,e | | 314,405 |
| US Bank NA, | | | | |
| Notes, Ser. BNT1, 4.3125%, 2006 | | 1,325,000 e | | 1,325,500 |
| Wells Fargo & Co., | | | | |
| Sub. Notes, 6.375%, 2011 | | 290,000 | | 311,201 |
| Zions Bancorp, | | | | |
| Sub. Notes, 6%, 2015 | | 465,000 | | 486,836 |
| | | | | 10,178,713 |
| Building & Construction—.4% | | | | |
| American Standard: | | | | |
| Sr. Notes, 7.375%, 2008 | | 265,000 | | 276,205 |
| Sr. Notes, 7.625%, 2010 | | 450,000 | | 484,122 |
| | | | | 760,327 |
| Chemicals—1.2% | | | | |
| ICI Wilmington, | | | | |
| Notes, 5.625%, 2013 | | 640,000 | | 638,041 |
| Lubrizol: | | | | |
| Debs., 6.5%, 2034 | | 600,000 | | 628,501 |
| Sr. Notes, 4.625%, 2009 | | 445,000 | | 436,525 |
| RPM International: | | | | |
| Bonds, 6.25%, 2013 | | 420,000 | | 424,065 |
| Sr. Notes, 4.45%, 2009 | | 450,000 | | 431,862 |
| | | | | 2,558,994 |
| Commercial & Professional Services—1.0% | | |
| Aramark Services, | | | | |
| Notes, 5%, 2012 | | 785,000 | | 759,758 |
| Erac USA Finance: | | | | |
| Bonds, 5.6%, 2015 | | 310,000 b | | 309,268 |
| Notes, 7.95%, 2009 | | 210,000 b | | 230,983 |
| | | Principal | | | | |
| Bonds and Notes (continued) | | Amount a | | Value ($) |
| |
| |
|
| Commercial & Professional Services (continued) | | | | |
| R.R. Donnelley & Sons, | | | | | | |
| Notes, 4.95%, 2014 | | 680,000 | | | | 635,944 |
| | | | | | | 1,935,953 |
| Commercial Mortgage Pass-Through Ctfs.—1.8% | | | | |
| Banc of America Commercial Mortgage, | | | | | | |
| Ser. 2005-2, Cl. A2, 4.247%, 2043 | | 875,000 | | | | 863,247 |
| Bayview Commercial Asset Trust: | | | | | | |
| Ser. 2005-3A, Cl. B3, 7.38%, 2035 | | 148,373 | | b,e | | 148,373 |
| Ser. 2005-4A, Cl. B3, 7.87%, 2036 | | 100,000 | | b,e | | 100,000 |
| Calwest Industrial Trust, | | | | | | |
| Ser. 2002-CALW, Cl. A, 6.127%, 2017 | | 1,000,000 | | b | | 1,053,101 |
| Crown Castle Towers, | | | | | | |
| Ser. 2005-1A, Cl. D, 5.612%, 2035 | | 240,000 | | b | | 233,910 |
| JP Morgan Chase Commercial Mortgage Securities, | | | | |
| Ser. 2005-LDP5, Cl. A2, 5.198%, 2044 | | 725,000 | | | | 727,980 |
| Merrill Lynch Mortgage Trust: | | | | | | |
| Ser. 2005-CIP1, Cl. A2, 4.96%, 2038 | | 505,000 | | | | 502,432 |
| Ser. 2005-CKI1, Cl. A2, 5.223%, 2037 | | 165,000 | | | | 166,470 |
| | | | | | | 3,795,513 |
| Diversified Financial Services—5.2% | | | | | | |
| Amvescap, | | | | | | |
| Notes, 5.375%, 2013 | | 550,000 | | | | 542,809 |
| Bear Stearns & Cos., | | | | | | |
| Notes, 4.5%, 2010 | | 325,000 | | | | 317,614 |
| Boeing Capital, | | | | | | |
| Sr. Notes, 7.375%, 2010 | | 490,000 | | | | 539,719 |
| CIT, | | | | | | |
| Sr. Notes, 4.75%, 2008 | | 470,000 | | | | 468,495 |
| Countrywide Home Loans, | | | | | | |
| Notes, Ser. L, 4%, 2011 | | 290,000 | | | | 273,187 |
| Credit Suisse First Boston, | | | | | | |
| Notes, 5.125%, 2015 | | 490,000 | | | | 486,174 |
| Glencore Funding, | | | | | | |
| Notes, 6%, 2014 | | 675,000 | | b | | 635,877 |
| Goldman Sachs, | | | | | | |
| Notes, 4.5%, 2010 | | 525,000 | | | | 513,568 |
| HSBC Finance Capital Trust IX, | | | | | | |
| Notes, 5.911%, 2035 | | 300,000 | | | | 303,115 |
| | STATEMENT OF INVESTMENTS (continued)
|
| | | Principal | | |
| Bonds and Notes (continued) | | Amount a | | Value ($) |
| |
| |
|
| Diversified Financial Services (continued) | | |
| ILFC E-Capital Trust I, | | | | |
| Bonds, 5.9%, 2065 | | 175,000 b | | 175,874 |
| International Lease Finance, | | | | |
| Notes, 4.75%, 2012 | | 295,000 | | 287,996 |
| Jefferies, | | | | |
| Sr. Notes, 5.5%, 2016 | | 685,000 | | 677,948 |
| John Deere Capital, | | | | |
| Sr. Notes, Ser. D, 4.4%, 2009 | | 320,000 | | 314,790 |
| JPMorgan Chase & Co., | | | | |
| Sub. Notes, 5.125%, 2014 | | 780,000 f | | 773,470 |
| Lehman Brothers Holdings E-Capital Trust I, | | |
| Notes, 5.15%, 2065 | | 100,000 b,e | | 100,370 |
| MBNA, | | | | |
| Notes, 6.125%, 2013 | | 750,000 | | 796,468 |
| Mizuho JGB Investment, | | | | |
| Bonds, Ser. A, 9.87%, 2008 | | 425,000 b,e | | 470,286 |
| Morgan Stanley, | | | | |
| Sub. Notes, 4.75%, 2014 | | 1,097,000 | | 1,053,862 |
| Nuveen Investments, | | | | |
| Sr. Notes, 5%, 2010 | | 285,000 | | 280,710 |
| Pearson Dollar Finance, | | | | |
| Notes, 4.7%, 2009 | | 335,000 b | | 329,797 |
| Residential Capital: | | | | |
| Notes, 6.125%, 2008 | | 225,000 | | 225,694 |
| Sr. Notes, 6.375%, 2010 | | 1,070,000 | | 1,088,294 |
| | | | | 10,656,117 |
| Diversified Metals & Mining—.8% | | | | |
| Falconbridge: | | | | |
| Bonds, 5.375%, 2015 | | 75,000 | | 72,441 |
| Notes, 6%, 2015 | | 195,000 | | 197,264 |
| International Steel, | | | | |
| Sr. Notes, 6.5%, 2014 | | 430,000 | | 432,150 |
| Ispat Inland ULC, | | | | |
| Secured Notes, 9.75%, 2014 | | 115,000 | | 130,813 |
| Southern Peru Copper, | | | | |
| Notes, 7.5%, 2035 | | 280,000 b | | 279,688 |
| Teck Cominco, | | | | |
| Notes, 7%, 2012 | | 500,000 | | 542,320 |
| | | | | 1,654,676 |
14
| | | Principal | | | | |
| Bonds and Notes (continued) | | Amount a | | Value ($) |
| |
| |
|
| Electric Utilities—1.2% | | | | | | |
| Consumers Energy, | | | | | | |
| First Mortgage, 5%, 2012 | | 655,000 | | | | 641,578 |
| Dominion Resources, | | | | | | |
| Sr. Notes, Ser. A, 7.195%, 2014 | | 575,000 | | | | 639,853 |
| FirstEnergy, | | | | | | |
| Notes, Ser. B, 6.45%, 2011 | | 300,000 | | | | 318,387 |
| FPL Energy National Wind, | | | | | | |
| Notes, 5.608%, 2024 | | 97,743 | | b | | 97,656 |
| Mirant, | | | | | | |
| Sr. Notes, 7.375%, 2013 | | 230,000 | | b | | 233,737 |
| Nisource Finance, | | | | | | |
| Sr, Notes, 5.25%, 2017 | | 375,000 | | | | 365,542 |
| Sierra Pacific Power, | | | | | | |
| Mortgage Notes, 6.25%, 2012 | | 200,000 | | | | 204,000 |
| | | | | | | 2,500,753 |
| Entertainment—.2% | | | | | | |
| Mohegan Tribal Gaming Authority, | | | | | | |
| Sr. Notes, 6.125%, 2013 | | 345,000 | | | | 340,688 |
| Environmental Control—.8% | | | | | | |
| Republic Services, | | | | | | |
| Notes, 6.086%, 2035 | | 700,000 | | | | 716,472 |
| Waste Management: | | | | | | |
| Sr. Notes, 6.875%, 2009 | | 270,000 | | | | 284,889 |
| Sr. Notes, 7%, 2028 | | 525,000 | | | | 593,258 |
| | | | | | | 1,594,619 |
| Food & Beverages—.9% | | | | | | |
| Bavaria, | | | | | | |
| Sr. Notes, 8.875%, 2010 | | 925,000 | | b | | 1,009,406 |
| H.J. Heinz, | | | | | | |
| Bonds, 6.428%, 2005 | | 225,000 | | b,e | | 231,287 |
| Safeway, | | | | | | |
| Sr. Debs., 7.25%, 2031 | | 375,000 | | | | 405,867 |
| Stater Brothers, | | | | | | |
| Sr. Notes, 8.125%, 2012 | | 195,000 | | f | | 194,025 |
| | | | | | | 1,840,585 |
| Foreign Governmental—1.6% | | | | | | |
| Argentina Bonos, | | | | | | |
| Bonds, 4.005%, 2012 | | 685,000 | | e | | 539,780 |
The Portfolio 15
| | STATEMENT OF INVESTMENTS (continued)
|
| | | | | Principal | | |
| Bonds and Notes (continued) | | | | Amount a | | Value ($) |
| |
| |
| |
|
| Foreign Governmental (continued) | | | | | | |
| Banco Nacional de Desenvolvimento | | | | | | |
| Economico e Social, Notes, 5.727%, 2008 | | | | 660,000 e | | 660,000 |
| Export-Import Bank of Korea, | | | | | | |
| Sr. Notes, 4.5%, 2009 | | | | 575,000 | | 565,286 |
| Mexican Bonos, | | | | | | |
| Bonds, 9%, 2011 | | MXN | | 5,900,000 | | 579,669 |
| Mexico Government, | | | | | | |
| Notes, 6.625%, 2015 | | | | 480,000 f | | 526,800 |
| Republic of South Africa, | | | | | | |
| Notes, 9.125%, 2009 | | | | 470,000 | | 528,163 |
| | | | | | | 3,399,698 |
| Gaming & Lodging—.8% | | | | | | |
| Harrah’s Operating, | | | | | | |
| Sr. Notes, 8%, 2011 | | | | 380,000 | | 420,396 |
| MGM Mirage, | | | | | | |
| Sr. Notes, 6%, 2009 | | | | 205,000 | | 204,744 |
| Resorts International Hotel and Casino, | | | | | | |
| First Mortgage, 11.5%, 2009 | | | | 560,000 b | | 623,000 |
| Station Casinos, | | | | | | |
| Sr. Notes, 6%, 2012 | | | | 450,000 | | 451,125 |
| | | | | | | 1,699,265 |
| Health Care—.4% | | | | | | |
| American Home Products, | | | | | | |
| Notes, 6.7%, 2011 | | | | 325,000 e | | 350,981 |
| Coventry Health Care, | | | | | | |
| Sr. Notes, 5.875%, 2012 | | | | 160,000 | | 162,400 |
| Medco Health Solutions, | | | | | | |
| Sr. Notes, 7.25%, 2013 | | | | 155,000 | | 170,522 |
| Quest Diagnostics, | | | | | | |
| Notes, 5.125%, 2010 | | | | 205,000 b | | 205,158 |
| | | | | | | 889,061 |
| Manufacturing—.3% | | | | | | |
| Bombardier, | | | | | | |
| Notes, 6.3%, 2014 | | | | 780,000 b,f | | 686,400 |
| Media—1.3% | | | | | | |
| AOL Time Warner, | | | | | | |
| Notes, 6.75%, 2011 | | | | 480,000 | | 504,601 |
| British Sky Broadcasting, | | | | | | |
| Notes, 6.875%, 2009 | | | | 510,000 | | 534,635 |
16
| | | Principal | | | | |
| Bonds and Notes (continued) | | Amount a | | Value ($) |
| |
| |
|
| Media (continued) | | | | | | |
| Comcast, | | | | | | |
| Notes, 5.5%, 2011 | | 530,000 | | f | | 533,471 |
| News America, | | | | | | |
| Debs., 7.7%, 2025 | | 425,000 | | | | 488,945 |
| Univision Communications, | | | | | | |
| Notes, 7.85%, 2011 | | 560,000 | | | | 616,959 |
| | | | | | | 2,678,611 |
| Oil & Gas—1.1% | | | | | | |
| Amerada Hess: | | | | | | |
| Notes, 6.65%, 2011 | | 240,000 | | | | 258,194 |
| Notes, 7.3%, 2031 | | 405,000 | | | | 470,163 |
| Enterprise Products Operating, | | | | | | |
| Sr. Notes, Ser. B, 6.65%, 2034 | | 775,000 | | | | 802,838 |
| ONEOK, | | | | | | |
| Sr. Notes, 5.2%, 2015 | | 225,000 | | | | 221,355 |
| XTO Energy, | | | | | | |
| Sr. Notes, 7.5%, 2012 | | 475,000 | | | | 531,993 |
| | | | | | | 2,284,543 |
| Packaging & Containers—.4% | | | | | | |
| Crown Americas Capital: | | | | | | |
| Sr. Notes, 7.625%, 2013 | | 325,000 | | b | | 338,813 |
| Sr. Notes, 7.75%, 2015 | | 185,000 | | b | | 192,400 |
| Sealed Air, | | | | | | |
| Notes, 5.625%, 2013 | | 310,000 | | b | | 308,189 |
| | | | | | | 839,402 |
| Paper & Forest Products—1.1% | | | | | | |
| Celulosa Arauco y Constitucion: | | | | | | |
| Notes, 5.125%, 2013 | | 360,000 | | | | 348,643 |
| Notes, 5.625%, 2015 | | 170,000 | | | | 169,122 |
| Georgia-Pacific, | | | | | | |
| Sr. Notes, 8%, 2014 | | 415,000 | | | | 398,400 |
| Sappi Papier, | | | | | | |
| Notes, 6.75%, 2012 | | 315,000 | | b | | 301,212 |
| Temple-Inland, | | | | | | |
| Bonds, 6.625%, 2018 | | 400,000 | | f | | 412,957 |
| Westvaco, | | | | | | |
| Debs., 7.95%, 2031 | | 250,000 | | | | 288,543 |
| Weyerhaeuser, | | | | | | |
| Debs., 7.375%, 2032 | | 245,000 | | | | 273,203 |
| | | | | | | 2,192,080 |
The Portfolio 17
| | STATEMENT OF INVESTMENTS (continued)
|
| | | Principal | | |
| Bonds and Notes (continued) | | Amount a | | Value ($) |
| |
| |
|
| Property-Casualty Insurance—2.0% | | |
| ACE Capital Trust II, | | | | |
| Capital Securities, 9.7%, 2030 | | 225,000 f | | 313,957 |
| Aegon Funding, | | | | |
| Bonds, 5.75%, 2020 | | 550,000 | | 559,714 |
| American International, | | | | |
| Notes, 5.05%, 2015 | | 270,000 b | | 265,489 |
| AON Capital Trust, | | | | |
| Capital Securities, 8.205%, 2027 | | 300,000 | | 357,321 |
| Assurant, | | | | |
| Sr. Notes, 6.75%, 2034 | | 400,000 | | 436,145 |
| ING Groep, | | | | |
| Bonds, 5.78%, 2049 | | 400,000 | | 406,162 |
| MetLife, | | | | |
| Sr. Notes, 5%, 2015 | | 1,050,000 | | 1,031,764 |
| Nippon Life Insurance, | | | | |
| Notes, 4.875%, 2010 | | 475,000 b | | 468,131 |
| Phoenix Cos., | | | | |
| Sr. Notes, 6.675%, 2008 | | 205,000 | | 207,021 |
| | | | | 4,045,704 |
| Real Estate Investment Trust—2.7% | | |
| Archstone-Smith Operating Trust, | | | | |
| Notes, 5.25%, 2015 | | 525,000 | | 518,682 |
| Arden Realty, | | | | |
| Notes, 5.25%, 2015 | | 350,000 | | 354,290 |
| Boston Properties, | | | | |
| Sr. Notes, 5%, 2015 | | 470,000 | | 453,478 |
| Commercial Net Lease Realty, | | | | |
| Sr. Notes, 6.15%, 2015 | | 210,000 | | 213,524 |
| Duke Realty, | | | | |
| Sr. Notes, 5.875%, 2012 | | 1,250,000 | | 1,294,838 |
| EOP Operating, | | | | |
| Sr. Notes, 7%, 2011 | | 595,000 | | 637,585 |
| ERP Operating: | | | | |
| Notes, 5.125%, 2016 | | 350,000 | | 337,766 |
| Notes, 5.25%, 2014 | | 85,000 | | 84,756 |
| Federal Realty Investment Trust, | | | | |
| Notes, 5.65%, 2016 | | 325,000 | | 327,479 |
| Healthcare Realty Trust, | | | | |
| Sr. Notes, 5.125%, 2014 | | 475,000 | | 450,387 |
18
| | | Principal | | | | |
| Bonds and Notes (continued) | | Amount a | | Value ($) |
| |
| |
|
| Real Estate Investment Trust (continued) | | | | | | |
| Mack-Cali Realty, | | | | | | |
| Notes, 5.05%, 2010 | | 225,000 | | | | 222,653 |
| Regency Centers, | | | | | | |
| Bonds, 5.25%, 2015 | | 145,000 | | | | 142,613 |
| Simon Property, | | | | | | |
| Notes, 4.875%, 2010 | | 550,000 | | | | 542,924 |
| | | | | | | 5,580,975 |
| Residential Mortgage Pass—Through Ctfs.—3.5% | | | | |
| Citigroup Mortgage Loan Trust: | | | | | | |
| Ser. 2005-WF2, Cl. AF2, 4.922%, 2035 | | 868,386 | | | | 865,661 |
| Ser. 2005-WF2, Cl. AF7, 5.249%, 2035 | | 950,000 | | | | 962,106 |
| Countrywide Alternative Loan Trust, | | | | | | |
| Ser. 2005-J4, Cl. 2A1B, 4.50%, 2035 | | 435,028 | | e | | 435,025 |
| First Horizon Alternative Mortgage Securities I, | | | | |
| Ser. 2004-FA1, Cl. A1, 6.25%, 2034 | | 2,970,666 | | | | 3,008,522 |
| Nomura Asset Acceptance: | | | | | | |
| Ser. 2005-AP2, Cl. A5, 4.976%, 2035 | | 425,000 | | | | 411,597 |
| Ser. 2005-WF1, Cl. 2A5, 5.159%, 2035 | | 475,000 | | | | 463,510 |
| Structured Adjustable Rate Mortgage Loan Trust, | | | | |
| Ser. 2005-8XS, Cl. A1, 4.48%, 2035 | | 475,948 | | e | | 475,948 |
| Washington Mutual, | | | | | | |
| Ser. 2005-AR4, Cl. A4B, 4.684%, 2035 | | 575,000 | | e | | 563,141 |
| | | | | | | 7,185,510 |
| Retail—.4% | | | | | | |
| Darden Restaurants, | | | | | | |
| Notes, 6%, 2035 | | 315,000 | | | | 299,334 |
| May Department Stores, | | | | | | |
| Notes, 6.65%, 2024 | | 575,000 | | | | 606,187 |
| | | | | | | 905,521 |
| State Government—.3% | | | | | | |
| Erie Tobacco Asset Securitization, | | | | | | |
| Asset-Backed Bonds, 6%, 2028 | | 400,000 | | | | 392,252 |
| Tobacco Settlement Authority of Iowa, | | | | | | |
| Asset-Backed Bonds, Series A, 6.5%, 2023 | | 210,000 | | | | 210,792 |
| | | | | | | 603,044 |
| Structured Index—1.1% | | | | | | |
| AB Svensk Exportkredit, | | | | | | |
| GSNE-ER Indexed Notes, 0%, 2007 | | 2,275,000 | | b,g | | 2,230,638 |
The Portfolio 19
| | STATEMENT OF INVESTMENTS (continued)
|
| | | Principal | | |
| Bonds and Notes (continued) | | Amount a | | Value ($) |
| |
| |
|
| Technology—.0% | | | | |
| Freescale Semiconductor, | | | | |
| Sr. Notes, 6.875%, 2011 | | 160,000 | | 168,800 |
| Telecommunications—2.2% | | | | |
| AT&T Wireless Services, | | | | |
| Sr. Notes, 8.75%, 2031 | | 235,000 | | 312,260 |
| Deutsche Telekom International Finance, | | | | |
| Notes, 8.75%, 2030 | | 635,000 e | | 810,049 |
| Koninklijke KPN, | | | | |
| Sr. Notes, 8.375%, 2030 | | 820,000 | | 974,467 |
| Nextel Communications, | | | | |
| Sr. Notes, 5.95%, 2014 | | 280,000 | | 281,828 |
| SBC Communications, | | | | |
| Notes, 5.625%, 2016 | | 315,000 | | 317,562 |
| Sprint Capital, | | | | |
| Notes, 8.75%, 2032 | | 800,000 | | 1,064,879 |
| Telecom Italia Capital, | | | | |
| Notes, 4.875%, 2010 | | 440,000 | | 431,821 |
| Verizon Global Funding: | | | | |
| Bonds, 5.85%, 2035 | | 200,000 f | | 193,398 |
| Notes, 7.75%, 2032 | | 110,000 | | 131,354 |
| | | | | 4,517,618 |
| Transportation—.1% | | | | |
| Ryder Systems, | | | | |
| Bonds, 5%, 2012 | | 325,000 | | 309,801 |
| U.S. Government—35.4% | | | | |
| U.S. Treasury Bonds: | | | | |
| 5.25%, 11/15/2028 | | 5,605,000 | | 6,115,111 |
| 6.25%, 5/15/2030 | | 105,000 | | 130,437 |
| U.S. Treasury Notes: | | | | |
| 1.5%, 3/31/2006 | | 150,000 h | | 149,104 |
| 1.875%, 12/31/2005 | | 25,300,000 h | | 25,300,000 |
| 3.5%, 2/15/2010 | | 14,440,000 | | 13,971,841 |
| 3.625%, 4/30/2007 | | 27,180,000 | | 26,903,851 |
| 4.75%, 5/15/2014 | | 520,000 | | 532,813 |
| | | | | 73,103,157 |
| U.S. Government Agencies/Mortgage-Backed—31.3% | | |
| Federal Home Loan Mortgage Corp.: | | | | |
| 3.5%, 9/1/2010 | | 205,997 | | 196,146 |
| REMIC Trust, Gtd. Pass-Through Ctfs., | | | | |
| Ser. 2586, Cl. WE, 4%, 12/15/2032 | | 1,107,344 | | 1,037,942 |
| (Interest Only Obligation) | | | | |
| Ser. 2764, Cl. IT, 5%, 6/15/2027 | | 7,390,400 i | | 1,296,049 |
20
| | | Principal | | |
| Bonds and Notes (continued) | | Amount a | | Value ($) |
| |
| |
|
| U.S. Government Agencies/ | | | | |
| Mortgage-Backed (continued) | | | | |
| Federal National Mortgage Association: | | | | |
| 4%, 5/1/2010 | | 1,110,097 | | 1,074,019 |
| 4.5% | | 15,275,000 j | | 14,864,408 |
| 5% | | 30,925,000 j | | 30,156,556 |
| 5.5% | | 4,700,000 j | | 4,729,375 |
| 5.5%, 9/1/2034 | | 423,925 | | 420,312 |
| 6% | | 3,275,000 j | | 3,345,609 |
| 7%, 6/1/2029—9/1/2029 | | 196,409 | | 205,185 |
| Government National Mortgage Association I: | | | | |
| 5.5%, 4/15/2033-3/15/2034 | | 3,797,564 | | 3,827,724 |
| Project Loan, | | | | |
| 8%, 9/15/2008 | | 28,766 | | 29,080 |
| Ser. 2005-29, Cl. A, 4.016%, 7/16/2027 | | 504,761 | | 491,395 |
| Ser. 2005-32, Cl. B, 4.385%, 8/16/2030 | | 675,000 | | 662,344 |
| Ser. 2005-87, Cl. A, 4.449%, 3/16/2025 | | 598,575 | | 588,880 |
| Ser. 2005-90, Cl. A, 3.76%, 7/16/2028 | | 825,000 | | 797,156 |
| Government National Mortgage Association II: | | | | |
| 7%, 9/20/2028-7/20/2029 | | 28,476 | | 29,734 |
| Ser. 2004-39, Cl. LC, 5.5%, 12/20/2029 | | 1,000,000 | | 1,006,858 |
| | | | | 64,758,772 |
| Total Bonds and Notes | | | | |
| (cost $252,140,066) | | | | 251,057,051 |
| |
| |
|
| |
| | | Face Amount | | |
| | | Covered by | | |
| Options—.0% | �� | Contracts ($) | | Value ($) |
| |
| |
|
| |
| Call Options—.0% | | | | |
| Dow Jones CDX.NA.IG.4 | | | | |
| February 2006 @ 1.016 | | 4,000,000 | | 18,983 |
| Put Options—.0% | | | | |
| U.S. Treasury Notes, 4.25%, 8/15/2015 | | | | |
| February 2006 @ 97.171875 | | 2,055,000 | | 5,343 |
| Total Options | | | | |
| (cost $49,688) | | | | 24,326 |
| |
| |
|
| |
| |
| Other Investment—3.2% | | Shares | | Value ($) |
| |
| |
|
| |
| Registered Investment Company; | | | | |
| Dreyfus Institutional Preferred Plus | | | | |
| Money Market Fund | | | | |
| (cost $6,692,000) | | 6,692,000 k | | 6,692,000 |
STATEMENT OF INVESTMENTS (continued)
|
| Investment of Cash Collateral | | | | |
| for Securities Loaned—1.6% | | Shares | | Value ($) |
| |
| |
|
| Registered Investment Company; | | | | |
| Dreyfus Institutional Cash Advantage Fund | | | | |
| (cost $3,296,590) | | 3,296,590 k | | 3,296,590 |
| |
| |
|
| Total Investments (cost $262,178,344) | | 126.3% | | 261,069,967 |
| Liabilities, Less Cash and Receivables | | (26.3%) | | (54,314,227) |
| Net Assets | | 100.0% | | 206,755,740 |
| a Principal amount stated in U.S Dollars unless otherwise noted. |
| MXN—Mexican Pesos |
| b Securities exempt from registration under Rule 144A of the Securities Act of 1933.These securities may be resold in |
| transactions exempt from registration, normally to qualified institutional buyers. At December 31, 2005, these |
| securities amounted to $17,819,889 or 8.6% of net assets. |
| c Non-income producing—security in default. |
| d The value of this security has been determined in good faith under the direction of the Board of Trustees. |
| e Variable rate security—interest rate subject to periodic change. |
| f All or a portion of these securities are on loan. At December 31, 2005, the total market value of the portfolio’s |
| securities on loan is $3,161,528 and the total market value of the collateral held by the portfolio is $3,296,590. |
| g Security linked to Goldman Sachs Non Energy—Excess Return Index. |
| h Partially held by a broker as collateral for open financial futures positions. |
| i Notional face amount shown. |
| j Purchased on a forward commitment basis. |
| k Investment in affiliated money market mutual fund. |
| Portfolio Summary † | | | | | | |
| |
| | | Value (%) | | | | Value (%) |
| |
| |
| |
|
| U.S. Government & Agencies | | 66.7 | | Structured Index | | 1.1 |
| Corporate Bonds | | 30.5 | | State Government | | .3 |
| Asset/Mortgage Backed | | 21.3 | | Futures/Options/Forward Currency |
| Money Market Investments | | 4.8 | | Exchange Contracts/Swaps | | .0 |
| Foreign/Governmental | | 1.6 | | | | 126.3 |
| |
| † Based on net assets. | | | | | | |
| See notes to financial statements. | | | | | | |
STATEMENT OF FINANCIAL FUTURES
December 31, 2005
| | | | | | | | | Unrealized |
| | | | | Market Value | | | | Appreciation |
| | | | | Covered by | | | | (Depreciation) |
| | | Contracts | | Contracts ($) | | Expiration | | at 12/31/2005 ($) |
| |
| |
| |
| |
|
| Financial Futures Long | | | | | | | | |
| U.S. Treasury 2 Year Notes | | 35 | | 7,181,563 | | March 2006 | | 5,469 |
| U.S. Treasury 5 Year Notes | | 135 | | 14,356,406 | | March 2006 | | 22,813 |
| U.S. Treasury 30 Year Bonds | | 22 | | 2,512,125 | | March 2006 | | 43,484 |
| |
| Financial Futures Short | | | | | | | | |
| U.S. Treasury 10 Year Notes | | 55 | | 6,017,344 | | March 2006 | | (40,391) |
| | | | | | | | | 31,375 |
See notes to financial statements.
STATEMENT OF OPTIONS WRITTEN
December 31, 2005
|
| | | Face Amount | | |
| | | Covered by | | |
| Issuer | | Contracts | | Value ($) |
| |
| |
|
| Call Options; | | | | |
| Dow Jones CDX.NA.IG.4 | | | | |
| February 2006 @ 1.0238 | | 8,000,000 | | 15,804 |
| Put Options; | | | | |
| U.S. Treasury Notes, 4.25%, 8/15/2015 | | |
| February 2006 @ 95.609375 | | 4,110,000 | | 2,096 |
| (Premiums received $49,688) | | | | 17,900 |
See notes to financial statements.
|
STATEMENT OF ASSETS AND LIABILITIES
December 31, 2005
| | | Cost | | Value |
| |
| |
|
| Assets ($): | | | | |
| Investments in securities—See Statement of Investments (including | | |
| securities on loan, valued at $3,161,528)—Note 1(c): | | |
| Unaffiliated issuers | | 252,189,754 | | 251,081,377 |
| Affiliated issuers | | 9,988,590 | | 9,988,590 |
| Cash | | | | 68,727 |
| Receivable for investment securities sold | | | | 3,938,567 |
| Dividends and interest receivable | | | | 2,121,169 |
| Unrealized appreciation on swaps—Note 4 | | | | 145,998 |
| Receivable from broker for swap transactions—Note 4 | | 24,966 |
| Receivable for shares of Beneficial Interest subscribed | | 10,189 |
| Prepaid expenses | | | | 7,851 |
| | | | | 267,387,434 |
| |
| |
|
| Liabilities ($): | | | | |
| Due to The Dreyfus Corporation and affiliates—Note 3(b) | | 109,561 |
| Payable for investment securities purchased | | 56,969,867 |
| Liability for securities on loan—Note 1(c) | | | | 3,296,590 |
| Payable for shares of Beneficial Interest redeemed | | 94,427 |
| Unrealized depreciation on swaps—Note 4 | | | | 90,793 |
| Outstanding options written, at value (premiums | | |
| received $49,688)—See Statement of Options Written | | 17,900 |
| Payable for futures variation margin—Note 4 | | 5,109 |
| Accrued expenses and other liabilities | | | | 47,447 |
| | | | | 60,631,694 |
| |
| |
|
| Net Assets ($) | | | | 206,755,740 |
| |
| |
|
| Composition of Net Assets ($): | | | | |
| Paid-in capital | | | | 210,099,078 |
| Accumulated undistributed investment income—net | | 2,169,586 |
| Accumulated net realized gain (loss) on investments | | (4,539,899) |
| Accumulated net unrealized appreciation (depreciation) | | |
| on investments (including $31,375 net unrealized | | |
| appreciation on financial futures) | | | | (973,025) |
| |
| |
|
| Net Assets ($) | | | | 206,755,740 |
| |
| |
|
| |
| |
| |
| Net Asset Value Per Share | | | | |
| | | Initial Shares | | Service Shares |
| |
| |
|
| Net Assets ($) | | 158,998,617 | | 47,757,123 |
| Shares Outstanding | | 14,086,248 | | 4,244,448 |
| |
| |
|
| Net Asset Value Per Share ($) | | 11.29 | | 11.25 |
See notes to financial statements.
|
24
| | STATEMENT OF OPERATIONS
Year Ended December 31, 2005
|
| Investment Income ($): | | |
| Income: | | |
| Interest | | 8,577,714 |
| Dividends; | | |
| Affiliated issuers | | 218,306 |
| Income from securities lending | | 8,710 |
| Total Income | | 8,804,730 |
| Expenses: | | |
| Investment advisory fee—Note 3(a) | | 1,414,465 |
| Distribution fees—Note 3(b) | | 129,231 |
| Custodian fees—Note 3(b) | | 68,295 |
| Prospectus and shareholders’ reports | | 45,611 |
| Professional fees | | 44,016 |
| Trustees’ fees and expenses—Note 3(c) | | 20,772 |
| Shareholder servicing costs—Note 3(b) | | 3,697 |
| Miscellaneous | | 28,260 |
| Total Expenses | | 1,754,347 |
| Less—reduction in investment advisory fee | | |
| due to undertaking—Note 3(a) | | (326,415) |
| Less—reduction in custody fees due to | | |
| earnings credits—Note 1(c) | | (6,833) |
| Net Expenses | | 1,421,099 |
| Investment Income—Net | | 7,383,631 |
| |
|
| Realized and Unrealized Gain (Loss) on Investments—Note 4 ($): |
| Net realized gain (loss) on investments and foreign currency transactions | | 704,330 |
| Net realized gain (loss) on options transactions | | 137,566 |
| Net realized gain (loss) on financial futures | | (152,703) |
| Net realized gain (loss) on swap transactions | | 119,269 |
| Net realized gain (loss) on forward currency exchange contracts | | 530,020 |
| Net Realized Gain (Loss) | | 1,338,482 |
| Net unrealized appreciation (depreciation) on investments, | | |
| foreign currency transactions, options and swap transactions | | |
| (including $29,312 net unrealized appreciation on financial futures) | | (3,502,310) |
| Net Realized and Unrealized Gain (Loss) on Investments | | (2,163,828) |
| Net Increase in Net Assets Resulting from Operations | | 5,219,803 |
| |
| See notes to financial statements. | | |
The Portfolio 25
STATEMENT OF CHANGES IN NET ASSETS
| | | Year Ended December 31, |
| |
|
| | | 2005 | | 2004 |
| |
| |
|
| Operations ($): | | | | |
| Investment income—net | | 7,383,631 | | 7,298,267 |
| Net realized gain (loss) on investments | | 1,338,482 | | (66,428) |
| Net unrealized appreciation | | | | |
| (depreciation) on investments | | (3,502,310) | | 516,522 |
| Net Increase (Decrease) in Net Assets | | | | |
| Resulting from Operations | | 5,219,803 | | 7,748,361 |
| |
| |
|
| Dividends to Shareholders from ($): | | | | |
| Investment income—net: | | | | |
| Initial shares | | (5,953,689) | | (6,897,830) |
| Service shares | | (1,742,786) | | (2,194,224) |
| Total Dividends | | (7,696,475) | | (9,092,054) |
| |
| |
|
| Beneficial Interest Transactions ($): | | | | |
| Net proceeds from shares sold: | | | | |
| Initial shares | | 15,895,953 | | 31,181,952 |
| Service shares | | 2,170,592 | | 5,024,349 |
| Dividends reinvested: | | | | |
| Initial shares | | 5,953,689 | | 6,897,830 |
| Service shares | | 1,742,786 | | 2,194,224 |
| Cost of shares redeemed: | | | | |
| Initial shares | | (32,401,995) | | (39,389,257) |
| Service shares | | (11,137,633) | | (11,650,522) |
| Increase (Decrease) in Net Assets from | | | | |
| Beneficial Interest Transactions | | (17,776,608) | | (5,741,424) |
| Total Increase (Decrease) in Net Assets | | (20,253,280) | | (7,085,117) |
| |
| |
|
| Net Assets ($): | | | | |
| Beginning of Period | | 227,009,020 | | 234,094,137 |
| End of Period | | 206,755,740 | | 227,009,020 |
| Undistributed investment income—net | | 2,169,586 | | 309,435 |
| | | Year Ended December 31, |
| |
|
| | | 2005 | | 2004 |
| |
| |
|
| Capital Share Transactions: | | | | |
| Initial Shares | | | | |
| Shares sold | | 1,400,032 | | 2,799,550 |
| Shares issued for dividends reinvested | | 525,289 | | 611,686 |
| Shares redeemed | | (2,856,400) | | (3,478,459) |
| Net Increase (Decrease) in Shares Outstanding | | (931,079) | | (67,223) |
| |
| |
|
| Service Shares | | | | |
| Shares sold | | 191,927 | | 444,035 |
| Shares issued for dividends reinvested | | 154,203 | | 195,075 |
| Shares redeemed | | (984,701) | | (1,033,241) |
| Net Increase (Decrease) in Shares Outstanding | | (638,571) | | (394,131) |
See notes to financial statements.
|
FINANCIAL HIGHLIGHTS
The following tables describe the performance for each share class for the fiscal periods indicated. All information (except portfolio turnover rate) reflects financial results for a single portfolio share.Total return shows how much your investment in the portfolio would have increased (or decreased) during each period, assuming you had reinvested all dividends and distributions.These figures have been derived from the portfolio’s financial statements.
| | | | | Year Ended December 31, | | |
| |
| |
| |
|
| Initial Shares | | 2005 | | 2004a | | 2003 | | 2002 | | 2001 |
| |
| |
| |
| |
| |
|
| Per Share Data ($): | | | | | | | | | | |
| Net asset value, beginning of period | | 11.42 | | 11.50 | | 11.65 | | 11.37 | | 11.39 |
| Investment Operations: | | | | | | | | | | |
| Investment income—net b | | .39 | | .37 | | .35 | | .54 | | .65 |
| Net realized and unrealized | | | | | | | | | | |
| gain (loss) on investments | | (.11) | | .01 | | .21 | | .32 | | .10 |
| Total from Investment Operations | | .28 | | .38 | | .56 | | .86 | | .75 |
| Distributions: | | | | | | | | | | |
| Dividends from investment income—net | | (.41) | | (.46) | | (.46) | | (.58) | | (.69) |
| Dividends from net realized | | | | | | | | | | |
| gain on investments | | — | | — | | (.25) | | — | | (.08) |
| Total Distributions | | (.41) | | (.46) | | (.71) | | (.58) | | (.77) |
| Net asset value, end of period | | 11.29 | | 11.42 | | 11.50 | | 11.65 | | 11.37 |
| |
| |
| |
| |
| |
|
| Total Return (%) | | 2.48 | | 3.37 | | 4.94 | | 7.76 | | 6.69 |
| | | | | Year Ended December 31, | | |
| |
| |
| |
|
| Initial Shares | | 2005 | | 2004a | | 2003 | | 2002 | | 2001 |
| |
| |
| |
| |
| |
|
| Ratios/Supplemental Data (%): | | | | | | | | | | |
| Ratio of total expenses | | | | | | | | | | |
| to average net assets | | .75 | | .74 | | .74 | | .72 | | .75 |
| Ratio of net expenses | | | | | | | | | | |
| to average net assets | | .60 | | .74 | | .74 | | .72 | | .75 |
| Ratio of net investment income | | | | | | | | | | |
| to average net assets | | 3.45 | | 3.30 | | 2.96 | | 4.70 | | 5.57 |
| Portfolio Turnover Rate | | 504.21c | | 819.75c | | 898.18c | | 877.87 | | 1,105.61 |
| |
| |
| |
| |
| |
|
| Net Assets, end of period ($ x 1,000) | | 158,999 | | 171,424 | | 173,534 | | 194,519 | | 191,089 |
| a | | As of January 1, 2004, the portfolio has adopted the method of accounting for interim payments on swap contracts in |
| | | accordance with Financial Accounting Standards Board Statement No. 133.These interim payments are reflected |
| | | within net realized and unrealized gain (loss) on swap contracts, however, prior to January 1, 2004, these interim |
| | | payments were reflected within interest income/expense in the Statement of Operations.The effect of this change for |
| | | the period ended December 31, 2004, was to increase net investment income per share by less than $.01, decrease net |
| | | realized and unrealized gain (loss) on investments per share by less than $.01 and increase the ratio of net |
| | | investment income to average net assets from 3.28% to 3.30%. Per share data and ratios/supplemental data for |
| | | periods prior to January 1, 2004 have not been restated to reflect this change in presentation. |
| b | | Based on average shares outstanding at each month end. |
| c | | The portfolio turnover rates excluding mortgage dollar roll transactions for the years ended December 31, 2005, |
| | | December 31, 2004 and December 31, 2003, were 393.37%, 761.92% and 755.08%, respectively. |
| See notes to financial statements. |
FINANCIAL HIGHLIGHTS (continued)
|
| | | | | Year Ended December 31, | | |
| |
| |
| |
|
| Service Shares | | 2005 | | 2004a | | 2003 | | 2002 | | 2001 |
| |
| |
| |
| |
| |
|
| Per Share Data ($): | | | | | | | | | | |
| Net asset value, beginning of period | | 11.38 | | 11.48 | | 11.62 | | 11.35 | | 11.39 |
| Investment Operations: | | | | | | | | | | |
| Investment income—net b | | .36 | | .35 | | .31 | | .50 | | .58 |
| Net realized and unrealized | | | | | | | | | | |
| gain (loss) on investments | | (.11) | | (.01) | | .24 | | .32 | | .14 |
| Total from Investment Operations | | .25 | | .34 | | .55 | | .82 | | .72 |
| Distributions: | | | | | | | | | | |
| Dividends from investment income—net | | (.38) | | (.44) | | (.44) | | (.55) | | (.68) |
| Dividends from net realized | | | | | | | | | | |
| gain on investments | | — | | — | | (.25) | | — | | (.08) |
| Total Distributions | | (.38) | | (.44) | | (.69) | | (.55) | | (.76) |
| Net asset value, end of period | | 11.25 | | 11.38 | | 11.48 | | 11.62 | | 11.35 |
| |
| |
| |
| |
| |
|
| Total Return (%) | | 2.26 | | 3.05 | | 4.78 | | 7.47 | | 6.37 |
| | | | | Year Ended December 31, | | |
| |
| |
| |
|
| Service Shares | | 2005 | | 2004a | | 2003 | | 2002 | | 2001 |
| |
| |
| |
| |
| |
|
| Ratios/Supplemental Data (%): | | | | | | | | | | |
| Ratio of total expenses | | | | | | | | | | |
| to average net assets | | .99 | | .99 | | .99 | | .97 | | 1.01 |
| Ratio of net expenses | | | | | | | | | | |
| to average net assets | | .84 | | .99 | | .99 | | .97 | | 1.01 |
| Ratio of net investment income | | | | | | | | | | |
| to average net assets | | 3.21 | | 3.06 | | 2.66 | | 4.39 | | 5.24 |
| Portfolio Turnover Rate | | 504.21c | | 819.75c | | 898.18c | | 877.87 | | 1,105.61 |
| |
| |
| |
| |
| |
|
| Net Assets, end of period ($ x 1,000) | | 47,757 | | 55,585 | | 60,561 | | 57,966 | | 23,431 |
| a | | As of January 1, 2004, the portfolio has adopted the method of accounting for interim payments on swap contracts in |
| | | accordance with Financial Accounting Standards Board Statement No. 133.These interim payments are reflected |
| | | within net realized and unrealized gain (loss) on swap contracts, however, prior to January 1, 2004, these interim |
| | | payments were reflected within interest income/expense in the Statement of Operations.The effect of this change for |
| | | the period ended December 31, 2004, was to increase net investment income per share by $.01, decrease net realized |
| | | and unrealized gain (loss) on investments per share by $.01 and increase the ratio of net investment income to |
| | | average net assets from 3.03% to 3.06%. Per share data and ratios/supplemental data for periods prior to January |
| | | 1, 2004 have not been restated to reflect this change in presentation. |
| b | | Based on average shares outstanding at each month end. |
| c | | The portfolio turnover rates excluding mortgage dollar roll transactions for the years ended December 31, 2005, |
| | | December 31, 2004 and December 31, 2003, were 393.37%, 761.92% and 755.08%, respectively. |
| See notes to financial statements. |
NOTES TO FINANCIAL STATEMENTS
NOTE 1—Significant Accounting Policies:
Dreyfus Variable Investment Fund (the “fund”) is registered under the Investment Company Act of 1940, as amended (the “Act”), as an open-end management investment company, operating as a series company currently offering twelve series, including the Quality Bond Portfolio (the “portfolio”). The portfolio is only offered to separate accounts established by insurance companies to fund variable annuity contracts and variable life insurance policies.The portfolio is a diversified series.The portfolio’s investment objective is to maximize total return, consisting of capital appreciation and current income. The Dreyfus Corporation (the “Manager” or “Dreyfus”) serves as the portfolio’s investment adviser.The Manager is a wholly-owned subsidiary of Mellon Financial Corporation (“Mellon Financial”).
Dreyfus Service Corporation (the “Distributor”), a wholly-owned subsidiary of the Manager, is the distributor of the portfolio’s shares, which are sold without a sales charge.The portfolio is authorized to issue an unlimited number of $.001 par value shares of Beneficial Interest in each of the following classes of shares: Initial and Service. Each class of shares has identical rights and privileges, except with respect to the distribution plan and the expenses borne by each class and certain voting rights. Income, expenses (other than expenses attributable to a specific class), and realized and unrealized gains or losses on investments are allocated to each class of shares based on its relative net assets.
The fund accounts separately for the assets, liabilities and operations of each series. Expenses directly attributable to each series are charged to that series’ operations, expenses which are applicable to all series are allocated among them on a pro rata basis.
The portfolio’s financial statements are prepared in accordance with U.S. generally accepted accounting principles, which may require the use of management estimates and assumptions.Actual results could differ from those estimates.
The fund enters into contracts that contain a variety of indemnifica-tions.The portfolio’s maximum exposure under these arrangements is
unknown. The portfolio does not anticipate recognizing any loss related to these arrangements.
(a) Portfolio valuation: Investments in securities (excluding short-term investments (other than U.S. Treasury Bills), financial futures, options, swap transactions and forward currency exchange contracts) are valued each business day by an independent pricing service (the “Service”) approved by the Board of Trustees. Investments for which quoted bid prices are readily available and are representative of the bid side of the market in the judgment of the Service are valued at the mean between the quoted bid prices (as obtained by the Service from dealers in such securities) and asked prices (as calculated by the Service based upon its evaluation of the market for such securities). Other investments (which constitute a majority of the portfolio securities) are valued as determined by the Service, based on methods which include consideration of: yields or prices of securities of comparable quality, coupon, maturity and type; indications as to values from dealers; and general market conditions. Securities for which there are no such valuations are valued at fair value as determined in good faith under the direction of the Board of Trustees. Restricted securities, as well as securities or other assets for which recent market quotations are not readily available, not valued by a pricing service approved by the Board of Trustees, or determined by the portfolio not to reflect accurately fair value (such as when an event occurs after the close of the exchange on which the security is principally traded and that is determined by the portfolio to have changed the value of the security), are valued at fair value as determined in good faith under the direction of the Board of Trustees. The factors that may be considered when fair valuing a security include fundamental analytical data, the nature and duration of restrictions on disposition, an evaluation of the forces that influence the market in which the securities are purchased and sold, and public trading in similar securities of the issuer or comparable issuers. Short-term investments, excluding U.S.Treasury Bills, are carried at amortized cost, which approximates value. Investments in registered investment companies are valued at their net asset value.
NOTES TO FINANCIAL STATEMENTS (continued)
|
Financial futures and options, which are traded on an exchange, are valued at the last sales price on the securities exchange on which such securities are primarily traded or at the last sales price on the national securities market on each business day. Options traded over-the-counter are priced at the mean between the bid prices and asked prices. Investments in swap transactions are valued each business day by an independent pricing service approved by the Board of Trustees. Swaps are valued by the service by using a swap pricing model which incorporates among other factors, default probabilities, recovery rates, credit curves of the underlying issuers and swap spreads on interest rates. Investments denominated in foreign currencies are translated to U.S. dollars at the prevailing rates of exchange. Forward currency exchange contracts are valued at the forward rate.
(b) Foreign currency transactions: The portfolio does not isolate that portion of the results of operations resulting from changes in foreign exchange rates on investments from the fluctuations arising from changes in the market prices of securities held. Such fluctuations are included with the net realized and unrealized gain or loss on investments.
Net realized foreign exchange gains or losses arise from sales and maturities of short-term securities, sales of foreign currencies, currency gains or losses realized on securities transactions and the difference between the amounts of dividends, interest and foreign withholding taxes recorded on the portfolios’ books and the U.S. dollar equivalent of the amounts actually received or paid. Net unrealized foreign exchange gains and losses arise from changes in the value of assets and liabilities other than investments in securities, resulting from changes in exchange rates. Such gains and losses are included with net realized and unrealized gain or loss on investments.
(c) Securities transactions and investment income: Securities transactions are recorded on a trade date basis. Realized gain and loss from securities transactions are recorded on the identified cost basis. Dividend income is recognized on the ex-dividend date and interest income, including, where applicable, accretion of discount and amortization of premium on investments, is recognized on the accrual basis.
The portfolio has an arrangement with the custodian bank whereby the portfolio receives earnings credits from the custodian when positive cash balances are maintained, which are used to offset custody fees. For financial reporting purposes, the portfolio includes net earnings credits as an expense offset in the Statement of Operations.
Pursuant to a securities lending agreement with Mellon Bank, N.A., an affiliate of the Manager, the portfolio may lend securities to qualified institutions.At origination, all loans are secured by collateral of at least 102% of the value of U.S. securities loaned and 105% of the value of foreign securities loaned. Collateral equivalent to at least 100% of the market value of securities on loan will be maintained at all times. Cash collateral is invested in certain money market mutual funds managed by the Manager. The portfolio will be entitled to receive all income on securities loaned, in addition to income earned as a result of the lending transaction. Although each security loaned is fully collateralized, the fund would bear the risk of delay in recovery of, or loss of rights in, the securities loaned should a borrower fail to return the securities in a timely manner.
(d) Affiliated issuers: Investments in other investment companies advised by the Manager are defined as “affiliated” in the Act.
(e) Dividends to shareholders: Dividends are recorded on the ex-dividend date. Dividends from investment income-net are declared and paid monthly. Dividends from net realized capital gain, if any, are normally declared and paid annually, but the portfolio may make distributions on a more frequent basis to comply with the distribution requirements of the Internal Revenue Code of 1986, as amended (the “Code”). To the extent that net realized capital gain can be offset by capital loss carryovers it is the policy of the portfolio not to distribute such gain. Income and capital gain distributions are determined in accordance with income tax regulations, which may differ from U.S. generally accepted accounting principles.
On December 30, 2005, the Board of Trustees declared a cash dividend of $.04 and $.037 per share for the Initial shares and Service shares
NOTES TO FINANCIAL STATEMENTS (continued)
|
respectively, from undistributed investment income-net payable on January 3, 2006 (ex-dividend date) to shareholders of record as of the close of business on December 30, 2005.
(f) Federal income taxes: It is the policy of the portfolio to continue to qualify as a regulated investment company, if such qualification is in the best interests of its shareholders, by complying with the applicable provisions of the Code, and to make distributions of taxable income sufficient to relieve it from substantially all federal income and excise taxes.
At December 31, 2005, the components of accumulated earnings on a tax basis were as follows: undistributed ordinary income $2,292,987, accumulated capital losses $3,233,574 and unrealized depreciation $1,447,609. In addition, the portfolio had $955,142 of capital losses realized after October 31, 2005, which were deferred for tax purposes to the first day of the following fiscal year.
The accumulated capital loss carryover is available to be applied against future net securities profits, if any, realized subsequent to December 31, 2005. If not applied, $3,171,594 of the carryover expires in fiscal 2012 and $61,980 expires in fiscal 2013.
The tax character of distributions paid to shareholders during the fiscal periods ended December 31, 2005 and December 31, 2004, were as follows: ordinary income $7,696,475 and $9,092,054, respectively.
During the period ended December 31, 2005, as a result of permanent book to tax differences primarily due to the tax treatment of amortization of premiums, paydowns gains/losses, treasury inflation protected securities and foreign currency transaction, the fund increased accumulated undistributed investment income-net by $2,172,995, decreased accumulated net realized gain (loss) on investments by $2,169,925 and decreased paid-in capital by $3,070. Net assets were not affected by this reclassification.
NOTE 2—Bank Lines of Credit:
The portfolio may borrow up to $10 million for leveraging purposes under a short-term unsecured line of credit and participates with other
Dreyfus-managed funds in a $100 million unsecured line of credit primarily to be utilized for temporary or emergency purposes, including the financing of redemptions. Interest is charged to the portfolio based on prevailing market rates in effect at the time of borrowing. During the period ended December 31, 2005, the portfolio did not borrow under the Facility.
NOTE 3—Investment Advisory Fee and Other Transactions
With Affiliates:
|
(a) Pursuant to an Investment Advisory Agreement with the Manager, the investment advisory fee is computed at the annual rate of .65% of the value of the portfolio’s average daily net assets and is payable monthly.The Manager has agreed from January 1, 2005 until June 30, 2006, to waive receipt of a portion of the portfolio’s investment advisory fee, in the amount of .15% of the value of the portfolio’s average net assets. The reduction in investment advisory fee, pursuant to the undertaking, amounted to $326,415 during the period ended December 31, 2005.
(b) Under the Distribution Plan (the “Plan”) adopted pursuant to Rule 12b-1 under the Act, Service shares pay the Distributor for distributing their shares, for servicing and/or maintaining Service shares shareholder accounts and for advertising and marketing for Service shares.The Plan provides for payments to be made at an annual rate of .25% of the value of the Service shares’ average daily net assets.The Distributor may make payments to Participating Insurance Companies and to brokers and dealers acting as principal underwriter for their variable insurance products.The fees payable under the Plan are payable without regard to actual expenses incurred. During the period ended December 31, 2005, Service shares were charged $129,231 pursuant to the Plan.
The portfolio compensates Dreyfus Transfer, Inc., a wholly-owned subsidiary of the Manager, under a transfer agency agreement for providing personnel and facilities to perform transfer agency services for the portfolio. During the period ended December 31, 2005, the portfolio was charged $395 pursuant to the transfer agency agreement.
NOTES TO FINANCIAL STATEMENTS (continued)
|
The portfolio compensates Mellon Bank, N.A., an affiliate of the Manager, under a custody agreement to provide custodial services for the portfolio. During the period ended December 31, 2005, the portfolio was charged $68,295 pursuant to the custody agreement.
During the period ended December 31, 2005, the portfolio was charged $3,762 for services performed by the Chief Compliance Officer.
The components of Due to The Dreyfus Corporation and affiliates in the Statement of Assets and Liabilities consist of: investment advisory fees $114,294, Rule 12b-1 distribution plan fees $10,194, custodian fees $10,267, chief compliance officer fees $1,858 and transfer agency per account fees $66, which are offset against an expense reimbursement currently in effect in the amount of $27,118.
(c) Each Board member also serves as a Board member of other funds within the Dreyfus complex. Annual retainer fees and attendance fees are allocated to each fund based on net assets.
(d) Pursuant to an exemptive order from the Securities and Exchange Commission, the portfolio may invest its available cash balances in affiliated money market mutual funds. Management fees of the underlying money market mutual funds have been waived by the Manager.
NOTE 4—Securities Transactions:
|
The aggregate amount of purchases and sales (including paydowns) of investment securities, excluding short-term securities, financial futures, forward currency exchange contracts, options transactions and swap transactions, during the period ended December 31, 2005, amounted to $1,259,836,548 and $1,204,400,050, respectively, of which $264,492,617 in purchases and $264,771,923 in sales were from mortgage dollar roll transactions.
A mortgage dollar roll transaction involves a sale by the portfolio of mortgage related securities that it holds with an agreement by the portfolio to repurchase similar securities at an agreed upon price and date.The securities purchased will bear the same interest rate as those
sold, but generally will be collateralized by pools of mortgages with different prepayment histories than those securities sold.
The portfolio may invest in financial futures contracts in order to gain exposure to or protect against changes in the market.The portfolio is exposed to market risk as a result of changes in the value of the underlying financial instruments. Investments in financial futures require the portfolio to “mark to market” on a daily basis, which reflects the change in market value of the contracts at the close of each day’s trading. Accordingly, variation margin payments are received or made to reflect daily unrealized gains or losses.When the contracts are closed, the portfolio recognizes a realized gain or loss. These investments require initial margin deposits with a broker, which consist of cash or cash equivalents. The amount of these deposits is determined by the exchange or Board of Trade on which the contract is traded and is subject to change. Contracts open at December 31, 2005, are set forth in the Statement of Financial Futures.
The portfolio may purchase and write (sell) put and call options in order to gain exposure to or to protect against changes in the market.
As a writer of call options, the portfolio receives a premium at the outset and then bears the market risk of unfavorable changes in the price of the financial instrument underlying the option. Generally, the portfolio would incur a gain, to the extent of the premium, if the price of the underlying financial instrument decreases between the date the option is written and the date on which the option is terminated. Generally, the portfolio would realize a loss, if the price of the financial instrument increases between those dates.
As a writer of put options, the portfolio receives a premium at the outset and then bears the market risk of unfavorable changes in the price of the financial instrument underlying the option. Generally, the portfolio would incur a gain, to the extent of the premium, if the price of the underlying financial instrument increases between the date the option is
NOTES TO FINANCIAL STATEMENTS (continued)
|
written and the date on which the option is terminated. Generally, the portfolio would realize a loss, if the price of the financial instrument decreases between those dates.The following summarizes the portfolio’s call/put options written for the period ended December 31, 2005.
| | | Face Amount | | | | Options Terminated |
| | | | | |
|
| | | Covered by | | Premiums | | | | Net Realized |
| Options Written: | | Contracts ($) | | Received ($) | | Cost ($) | | Gain ($) |
| |
| |
| |
| |
|
| Contracts outstanding | | | | | | | | |
| December 31, 2004 | | 25,785,000 | | 326,625 | | | | |
| Contracts written | | 89,900,000 | | 304,643 | | | | |
| Contracts terminated: | | | | | | | | |
| Contracts closed | | 52,055,000 | | 399,476 | | 596,505 | | (197,029) |
| Contracts expired | | 51,520,000 | | 182,104 | | — | | 182,104 |
| Total contracts terminated | | 103,575,000 | | 581,580 | | 596,505 | | (14,925) |
| Contracts outstanding | | | | | | | | |
| December 31, 2005 | | 12,110,000 | | 49,688 | | | | |
The portfolio may enter into forward currency exchange contracts in order to hedge its exposure to changes in foreign currency exchange rates on its foreign portfolio holdings and to settle foreign currency transactions.When executing forward currency exchange contracts, the portfolio is obligated to buy or sell a foreign currency at a specified rate on a certain date in the future.With respect to sales of forward currency exchange contracts, the portfolio would incur a loss if the value of the contract increases between the date the forward contract is opened and the date the forward contract is closed.The portfolio realizes a gain if the value of the contract decreases between those dates.With respect to purchases of forward currency exchange contracts, the portfolio would incur a loss if the value of the contract decreases between the date the forward contract is opened and the date the forward contract is closed. The portfolio realizes a gain if the value of the contract increases between those dates.The portfolio is also exposed to credit risk associated with counterparty nonperformance on these forward currency exchange contracts which is typically limited to the unrealized gain on each open contract.At December 31, 2005, there were no forward currency exchange contracts outstanding.
The portfolio may enter into swap agreements to exchange the interest rate on, or return generated by, one nominal instrument for the return generated by another nominal instrument.
The portfolio accrues for the interim payments on swap contracts on a daily basis, with the net amount recorded within unrealized appreciation (depreciation) of swap contracts in the Statement of Assets and Liabilities. Once the interim payments are settled in cash, the net amount is recorded as realized gain (loss) on swaps, in addition to realized gain (loss) recorded upon the termination of swap contracts in the Statement of Operations. Fluctuations in the value of swap contracts are recorded as a component of net change in unrealized appreciation (depreciation) on investments.
Credit default swaps involve commitments to pay a fixed interest rate in exchange for payment if a credit event affecting a third party (the referenced company) occurs. Credit events may include a failure to pay interest or principal, bankruptcy, or restructuring. For those credit default swaps in which the fund is receiving a fixed rate, the fund is providing credit protection on the underlying instrument.The maximum payouts for these contracts are limited to the notional amount of each swap.The following summarizes credit default swaps entered into by the portfolio at December 31, 2005:

The Portfolio 41
NOTES TO FINANCIAL STATEMENTS (continued)
|


NOTES TO FINANCIAL STATEMENTS (continued)
|
Risks may arise upon entering into these agreements from the potential inability of the counterparties to meet the terms of the agreement and are generally limited to the amount of net payments to be received, if any, at the date of default.
At December 31, 2005, the cost of investments for federal income tax purposes was $262,621,553; accordingly, accumulated net unrealized depreciation on investments was $1,551,586, consisting of $1,210,262 gross unrealized appreciation and $2,761,848 gross unrealized depreciation.
REPORT OF INDEPENDENT REGISTERED
PUBLIC ACCOUNTING FIRM
|
Shareholders and Board of Trustees
Dreyfus Variable Investment Fund, Quality Bond Portfolio
We have audited the accompanying statement of assets and liabilities, including the statements of investments, financial futures and options written, of Dreyfus Variable Investment Fund, Quality Bond Portfolio (one of the funds comprising Dreyfus Variable Investment Fund) as of December 31, 2005, and the related statement of operations for the year then ended, the statement of changes in net assets for each of the two years in the period then ended and financial highlights for each of the years indicated therein. These financial statements and financial highlights are the responsibility of the Fund’s management. Our responsibility is to express an opinion on these financial statements and financial highlights based on our audits.
We conducted our audits in accordance with the standards of the Public Company Accounting Oversight Board (United States).Those standards require that we plan and perform the audit to obtain reasonable assurance about whether the financial statements and financial highlights are free of material misstatement.We were not engaged to perform an audit of the Fund’s internal control over financial reporting. Our audits included consideration of internal control over financial reporting as a basis for designing audit procedures that are appropriate in the circumstances, but not for the purpose of expressing an opinion on the effectiveness of the Fund’s internal control over financial reporting. Accordingly, we express no such opinion.An audit also includes examining, on a test basis, evidence supporting the amounts and disclosures in the financial statements and financial highlights, assessing the accounting principles used and significant estimates made by management, and evaluating the overall financial statement presentation. Our procedures included verification by examination of securities held by the custodian as of December 31, 2005 and confirmation of securities not held by the custodian by correspondence with others. We believe that our audits provide a reasonable basis for our opinion.
In our opinion, the financial statements and financial highlights referred to above present fairly, in all material respects, the financial position of Dreyfus Variable Investment Fund, Quality Bond Portfolio at December 31,2005,the results of its operations for the year then ended,the changes in its net assets for each of the two years in the period then ended and the financial highlights for each of the indicated years, in conformity with U.S. generally accepted accounting principles.

| | New York, New York
February 6, 2006
|
| BOARD MEMBERS INFORMATION (Unaudited) |
| |
| |
| |
| Joseph S. DiMartino (62) |
| Chairman of the Board (1995) |
| Principal Occupation During Past 5 Years: |
| • Corporate Director and Trustee |
| Other Board Memberships and Affiliations: |
| • The Muscular Dystrophy Association, Director |
| • Levcor International, Inc., an apparel fabric processor, Director |
| • Century Business Services, Inc., a provider of outsourcing functions for small and medium size |
| companies, Director |
| • The Newark Group, a provider of a national market of paper recovery facilities, paperboard |
| mills and paperboard converting plants, Director |
| • Sunair Services Corporation, engages in the design, manufacture and sale of high frequency |
| systems for long-range voice and data communications, as well as providing certain outdoor- |
| related services to homes and businesses, Director |
| No. of Portfolios for which Board Member Serves: 193 |
| ——————— |
| David P. Feldman (66) |
| Board Member (1994) |
| Principal Occupation During Past 5 Years: |
| • Corporate Director and Trustee |
| Other Board Memberships and Affiliations: |
| • BBH Mutual Funds Group (11 funds), Director |
| • The Jeffrey Company, a private investment company, Director |
| • QMED, a medical device company, Director |
| No. of Portfolios for which Board Member Serves: 58 |
| ——————— |
| James F. Henry (75) |
| Board Member (1991) |
| Principal Occupation During Past 5 Years: |
| • President, CPR Institute for Dispute Resolution, a non-profit organization principally |
| engaged in the development of alternatives to business litigation (Retired 2003) |
| No. of Portfolios for which Board Member Serves: 22 |
46
| Dr. Paul A. Marks (79) |
| Board Member (1990) |
| Principal Occupation During Past 5 Years: |
| • President, Emeritus (2000-present) and President and Chief Executive Officer of Memorial |
| Sloan-Kettering Cancer Center (Retired 1999) |
| Other Board Memberships and Affiliations: |
| • Pfizer, Inc., a pharmaceutical company, Director-Emeritus |
| • Lazard Freres & Company, LLC, Senior Adviser |
| • Carrot Capital Health Care Ventures; Advisor |
| • Armgo-Start-Up Biotech; Board of Directors |
| • Nanoviricide, Board Director |
| • PTC, Scientific Advisory Board |
| No. of Portfolios for which Board Member Serves: 22 |
| ——————— |
| Dr. Martin Peretz (66) |
| Board Member (1990) |
| Principal Occupation During Past 5 Years: |
| • Editor-in-Chief of The New Republic Magazine |
| • Lecturer in Social Studies at Harvard University (1965-2001) |
| • Co-Chairman of TheStreet.com, a financial daily on the web |
| Other Board Memberships and Affiliations: |
| • Academy for Liberal Education, an accrediting agency for colleges and universities certified by |
| the U.S. Department of Education, Director |
| • Harvard Center for Blood Research,Trustee |
| • Bard College,Trustee |
| • Board of Overseers of YIVO Institute for Jewish Research, Chairman |
| No. of Portfolios for which Board Member Serves: 22 |
| ——————— |
| Once elected all Board Members serve for an indefinite term.The address of the Board Members and Officers is in c/o |
| The Dreyfus Corporation, 200 Park Avenue, New York, New York 10166. Additional information about the Board |
| Members is available in the fund’s Statement of Additional Information which can be obtained from Dreyfus free of |
| charge by calling this toll free number: 1-800-554-4611. |
| John M. Fraser, Jr., Emeritus Board Member |
| Rosalind Gersten Jacobs, Emeritus Board Member |
The Portfolio 47
OFFICERS OF THE FUND (Unaudited)
STEPHEN E. CANTER, President since March 2000.
Chairman of the Board, Chief Executive Officer and Chief Operating Officer of the Manager, and an officer of 90 investment companies (comprised of 184 portfolios) managed by the Manager. Mr. Canter also is a Board member and, where applicable, an Executive Committee Member of the other investment management subsidiaries of Mellon Financial Corporation, each of which is an affiliate of the Manager. He is 60 years old and has been an employee of the Manager since May 1995.
STEPHEN R. BYERS, Executive Vice President since November 2002.
Chief Investment Officer,Vice Chairman and a director of the Manager, and an officer of 90 investment companies (comprised of 184 portfolios) managed by the Manager. Mr. Byers also is an officer, director or an Executive Committee Member of certain other investment management subsidiaries of Mellon Financial Corporation, each of which is an affiliate of the Manager. He is 52 years old and has been an employee of the Manager since January 2000.
MARK N. JACOBS, Vice President since March 2000.
Executive Vice President, Secretary and General Counsel of the Manager, and an officer of 91 investment companies (comprised of 200 portfolios) managed by the Manager. He is 59 years old and has been an employee of the Manager since June 1977.
MICHAEL A. ROSENBERG, Vice President and Secretary since August 2005.
Associate General Counsel of the Manager, and an officer of 91 investment companies (comprised of 200 portfolios) managed by the Manager. He is 45 years old and has been an employee of the Manager since October 1991.
JAMES BITETTO, Vice President and Assistant Secretary since August 2005.
Assistant General Counsel and Assistant Secretary of the Manager, and an officer of 91 investment companies (comprised of 200 portfolios) managed by the Manager. He is 39 years old and has been an employee of the Manager since December 1996.
JONI LACKS CHARATAN, Vice President and Assistant Secretary since August 2005.
Associate General Counsel of the Manager, and an officer of 91 investment companies (comprised of 200 portfolios) managed by the Manager. She is 50 years old and has been an employee of the Manager since October 1988.
JOSEPH M. CHIOFFI, Vice President and Assistant Secretary since August 2005.
Assistant General Counsel of the Manager, and an officer of 91 investment companies (comprised of 200 portfolios) managed by the Manager. He is 44 years old and has been an employee of the Manager since June 2000.
JANETTE E. FARRAGHER, Vice President and Assistant Secretary since August 2005.
Associate General Counsel of the Manager, and an officer of 91 investment companies (comprised of 200 portfolios) managed by the Manager. She is 42 years old and has been an employee of the Manager since February 1984.
JOHN B. HAMMALIAN, Vice President and Assistant Secretary since August 2005.
Associate General Counsel of the Manager, and an officer of 91 investment companies (comprised of 200 portfolios) managed by the Manager. He is 42 years old and has been an employee of the Manager since February 1991.
ROBERT R. MULLERY, Vice President and Assistant Secretary since August 2005.
Associate General Counsel of the Manager, and an officer of 91 investment companies (comprised of 200 portfolios) managed by the Manager. He is 53 years old and has been an employee of the Manager since May 1986.
JEFF PRUSNOFSKY, Vice President and Assistant Secretary since August 2005.
Associate General Counsel of the Manager, and an officer of 91 investment companies (comprised of 200 portfolios) managed by the Manager. He is 40 years old and has been an employee of the Manager since October 1990.
JAMES WINDELS, Treasurer since November 2001.
Director-Mutual Fund Accounting of the Manager, and an officer of 91 investment companies (comprised of 200 portfolios) managed by the Manager. He is 47 years old and has been an employee of the Manager since April 1985.
ERIK D. NAVILOFF, Assistant Treasurer since December 2002.
Senior Accounting Manager - Taxable Fixed Income Funds of the Manager, and an officer of 91 investment companies (comprised of 200 portfolios) managed by the Manager. He is 37 years old and has been an employee of the Manager since November 1992.
ROBERT ROBOL, Assistant Treasurer since August 2003.
Senior Accounting Manager — Money Market and Municipal Bond Funds of the Manager, and an officer of 91 investment companies (comprised of 200 portfolios) managed by the Manager. He is 41 years old and has been an employee of the Manager since October 1988.
ROBERT SVAGNA, Assistant Treasurer since December 2002.
Senior Accounting Manager - Equity Funds of the Manager, and an officer of 91 investment companies (comprised of 200 portfolios) managed by the Manager. He is 38 years old and has been an employee of the Manager since November 1990.
GAVIN C. REILLY, Assistant Treasurer since December 2005.
Tax Manager of the Investment Accounting and Support Department of the Manager, and an officer of 91 investment companies (comprised of 200 portfolios) managed by the Manager. He is 37 years old and has been an employee of the Manager since April 1991.
JOSEPH W. CONNOLLY, Chief Compliance Officer since October 2004.
Chief Compliance Officer of the Manager and The Dreyfus Family of Funds (91 investment companies, comprised of 200 portfolios). From November 2001 through March 2004, Mr. Connolly was first Vice-President, Mutual Fund Servicing for Mellon Global Securities Services. In that capacity, Mr. Connolly was responsible for managing Mellon’s Custody, Fund Accounting and Fund Administration services to third-party mutual fund clients. He is 48 years old and has served in various capacities with the Manager since 1980, including manager of the firm’s Fund Accounting Department from 1997 through October 2001.
WILLIAM GERMENIS, Anti-Money Laundering Compliance Officer since September 2002.
Vice President and Anti-Money Laundering Compliance Officer of the Distributor, and the Anti-Money Laundering Compliance Officer of 87 investment companies (comprised of 196 portfolios) managed by the Manager. He is 35 years old and has been an employee of the Distributor since October 1998.
| For More | | Information |
| |
|
| |
| Dreyfus Variable | | Transfer Agent & |
| Investment Fund, | | Dividend Disbursing Agent |
| Quality Bond Portfolio | | |
| | | Dreyfus Transfer, Inc. |
| 200 Park Avenue | | |
| | | 200 Park Avenue |
| New York, NY 10166 | | |
| | | New York, NY 10166 |
| |
| Investment Adviser | | Distributor |
| The Dreyfus Corporation | | |
| | | Dreyfus Service Corporation |
| 200 Park Avenue | | |
| | | 200 Park Avenue |
| New York, NY 10166 | | |
| | | New York, NY 10166 |
| Custodian | | |
| Mellon Bank, N.A. | | |
| One Mellon Bank Center | | |
| Pittsburgh, PA 15258 | | |
Telephone 1-800-554-4611 or 516-338-3300
Mail The Dreyfus Family of Funds, 144 Glenn Curtiss Boulevard, Uniondale, NY 11556-0144 Attn: Institutional Servicing
The portfolio files its complete schedule of portfolio holdings with the Securities and Exchange Commission (“SEC”) for the first and third quarters of each fiscal year on Form N-Q. The portfolio’s Forms N-Q are available on the SEC’s website at http://www.sec.gov and may be reviewed and copied at the SEC’s Public Reference Room in Washington, DC. Information on the operation of the Public Reference Room may be obtained by calling 1-800-SEC-0330.
A description of the policies and procedures that the portfolio uses to determine how to vote proxies relating to portfolio securities, and information regarding how the portfolio voted these proxies for the 12-month period ended June 30, 2005, is available at http://www.dreyfus.com and on the SEC’s website at http://www.sec.gov. The description of the policies and procedures is also available without charge, upon request, by calling 1-800-645-6561.


The views expressed in this report reflect those of the portfolio manager only through the end of the period covered and do not necessarily represent the views of Dreyfus or any other person in the Dreyfus organization.Any such views are subject to change at any time based upon market or other conditions and Dreyfus disclaims any responsibility to update such views. These views may not be relied on as investment advice and, because investment decisions for a Dreyfus portfolio are based on numerous factors, may not be relied on as an indication of trading intent on behalf of any Dreyfus portfolio.
Not FDIC-Insured • Not Bank-Guaranteed • May Lose Value
| | | Contents |
| |
| | | T H E P O R T F O L I O |
| |
|
| 2 | | Letter from the Chairman |
| 3 | | Discussion of Performance |
| 6 | | Portfolio Performance |
| 8 | | Understanding Your Portfolio’s Expenses |
| 8 | | Comparing Your Portfolio’s Expenses |
| | | With Those of Other Funds |
| 9 | | Statement of Investments |
| 16 | | Statement of Assets and Liabilities |
| 17 | | Statement of Operations |
| 18 | | Statement of Changes in Net Assets |
| 20 | | Financial Highlights |
| 22 | | Notes to Financial Statements |
| 29 | | Report of Independent Registered |
| | | Public Accounting Firm |
| 30 | | Important Tax Information |
| 31 | | Board Members Information |
| 33 | | Officers of the Fund |
| | | F O R M O R E I N F O R M AT I O N |
| |
|
| | | Back Cover |
| Dreyfus Variable Investment Fund, |
| Small Company Stock Portfolio |

LETTER FROM THE CHAIRMAN
Dear Shareholder:
We are pleased to present this annual report for Dreyfus Variable Investment Fund, Small Company Stock Portfolio, covering the 12-month period from January 1, 2005, through December 31, 2005. Inside, you’ll find valuable information about how the portfolio was managed during the reporting period, including a discussion with the portfolio manager, Dwight Cowden.
Stocks generally absorbed both good and bad news in 2005 to post modestly positive total returns. On the plus side, an expanding U.S. economy and low inflation helped support corporate earnings in most industry groups. Negative influences included rising short-term interest rates and escalating energy prices, which many analysts feared might erode corporate profits. In addition, hurricanes Katrina, Rita and Wilma disrupted economic activity along the Gulf Coast.
We expect the U.S. economy to continue its moderate expansion in 2006, fueled in part by a rebound in corporate capital spending and exports. The labor market likely will remain relatively strong while inflation should stay low, supporting consumers’ real incomes. Risks in the new year include the possible end of the boom in the housing market, where we believe prices are more likely to stall than plunge.
As always, we encourage you to speak with your financial consultant about how these and other market forces may affect your investments. Thank you for your continued confidence and support.

DISCUSSION OF PERFORMANCE
Dwight Cowden, Portfolio Manager
How did Dreyfus Variable Investment Fund, Small Company Stock Portfolio perform relative to its benchmark?
For the 12-month period ended December 31, 2005, the portfolio produced total returns of 0.91% for its Initial shares and 0.77% for its Service shares.1This compares with a total return of 7.68% for the portfolio’s benchmark, the S&P SmallCap 600 Index, for the same period.2
Small-cap stocks fared relatively well in 2005 due to a growing economy and positive earnings reports, which more than offset concerns related to rising interest rates and soaring energy prices. While the portfolio posted positive returns for the reporting period, its performance compared to the benchmark lagged due to several disappointments in the technology and consumer discretionary sectors. Relative performance also suffered due to the portfolio’s lack of exposure to several companies in the benchmark that received buyout offers.
What is the portfolio’s investment approach?
The portfolio seeks capital appreciation.To pursue this goal, the portfolio normally invests at least 80% of its assets in the stocks of small-capitalization companies. Small-capitalization companies are generally new and often entrepreneurial companies with market capitalizations ranging from $100 million to $3 billion at the time of purchase. We may continue to hold the securities of companies as their market capitalization grows. Small-cap companies can, if successful, grow faster than larger-cap companies and typically use any profits for expansion rather than for paying dividends.
Stocks are chosen through a disciplined investment process that combines computer modeling techniques, fundamental analysis and risk management. In selecting securities, we use a computer model to identify and rank stocks within an industry or sector, based on several characteristics, including: value, or how a stock is priced relative to its perceived intrinsic
DISCUSSION OF PERFORMANCE (continued)
|
worth; growth, in this case the sustainability or growth of earnings; and financial profile, which measures the financial health of the company.
We then use fundamental analysis and generally select what we believe are the most attractive of the higher-ranked securities and determine those issues that should be sold.We use a variety of sources, including internal as well as Wall Street research, and company management to stay abreast of current developments.We attempt to manage risk by diversifying across companies and industries, limiting the potential adverse impact from any one stock or industry.The portfolio is structured so that its sector weightings and risk characteristics, such as growth, size and yield, are generally similar to those of the S&P SmallCap 600 Index.
What other factors influenced the portfolio’s performance?
Investors tended to punish stocks of companies that failed to fulfill earnings expectations or that announced unclear prospects for future earnings during 2005.Technology stocks stood at the forefront of this trend, with some semiconductor and hardware manufacturers experiencing particularly steep declines. For example, among the portfolio’s holdings, media hardware and software maker Avid Technology fell sharply in mid-year when a delay in the receipt of revenues caused quarterly earnings to fall. Similarly, shares of MIPS Technologies lost ground due to slowing semiconductor orders and a shift in demand toward lower margin products.
Holdings in other sectors also contributed to the portfolio’s under-performance compared to the benchmark. Some of the most notable of these included clothing retailer Aeropostale, which experienced inventory problems; broadcaster Radio One, which was hurt by weak advertising revenues;and air carriers Continental Airlines and Pinnacle Airlines,which suffered from high fuel costs and broad-based industry weakness.
On a more positive note, the portfolio participated significantly in the energy sector’s rise, which was the result of surging oil and gas prices. Modestly heavy exposure to energy stocks, such as Southwestern Energy, Unit Corp., Cal Dive International and Goodrich Petroleum, contributed strongly to the portfolio’s returns.The portfolio’s relative performance in the health care sector benefited from an overweighted
position and good individual stock selections in the biotechnology industry, such as Abgenix, which specializes in antibody therapies, and Psychiatric Solutions, a provider of outpatient therapy services. Finally, acquisitions of wireless services providers, including Alamosa Holdings, by larger carriers enhanced the portfolio’s results in the telecommunications services area.
What is the portfolio’s current strategy?
While we generally allocate the portfolio’s assets across market sectors in proportions that are close to their representation in the benchmark, as of year-end we have placed slight emphasis on biotechnology companies, where we see potential for major new products and increasing mergers-and-acquisitions activity. In the technology sector, we have emphasized telecommunications and Internet-related companies, where we have found what we believe to be attractive opportunities for growth. In the materials and processing area, metals and mining-related stocks position the portfolio to benefit from strengthening global industrial demand. On the other hand, rising interest rates have made us relatively cautious regarding banking and mortgage-related stocks. We have also de-emphasized consumer discretionary stocks in light of rising interest rates, high energy prices and increasing consumer debt levels.
| | | The portfolio is only available as a funding vehicle under various life insurance policies or variable |
| | | annuity contracts issued by insurance companies. Individuals may not purchase shares of the |
| | | portfolio directly. A variable annuity is an insurance contract issued by an insurance company that |
| | | enables investors to accumulate assets on a tax-deferred basis for retirement or other long-term |
| | | goals.The investment objective and policies of Dreyfus Variable Investment Fund, Small Company |
| | | Stock Portfolio made available through insurance products may be similar to other funds/portfolios |
| | | managed or advised by Dreyfus. However, the investment results of the portfolio may be higher or |
| | | lower than, and may not be comparable to, those of any other Dreyfus fund/portfolio. |
| 1 | | Total return includes reinvestment of dividends and any capital gains paid. Past performance is no |
| | | guarantee of future results. Share price and investment return fluctuate such that upon redemption, |
| | | portfolio shares may be worth more or less than their original cost.The portfolio’s performance does |
| | | not reflect the deduction of additional charges and expenses imposed in connection with investing |
| | | in variable insurance contracts, which will reduce returns. Return figures provided reflect the |
| | | absorption of certain portfolio expenses by The Dreyfus Corporation pursuant to an agreement in |
| | | effect through January 31, 2006, at which time it may be extended, terminated or modified. Had |
| | | these expenses not been absorbed, the portfolio’s returns would have been lower. |
| 2 | | SOURCE: LIPPER INC. — Reflects reinvestment of dividends and, where applicable, capital |
| | | gain distributions.The Standard and Poor’s SmallCap 600 Index is a widely accepted, |
| | | unmanaged index of small-cap stock market performance. |
The Portfolio 5

| Average Annual Total Returns | | as of 12/31/05 | | | | | | |
| | | Inception | | | | | | From |
| | | Date | | 1 Year | | 5 Years | | Inception |
| |
| |
| |
| |
|
| Initial shares | | 5/1/96 | | 0.91% | | 6.21% | | 7.54% |
| Service shares | | 5/1/96 | | 0.77% | | 5.95% | | 7.40% |
The data for Service shares includes the results of Initial shares for the period prior to December 31, 2000 (inception date of Service shares). Actual Service shares’ average annual total return and hypothetical growth results would have been lower. See notes below.
† Source: Lipper Inc.
Past performance is not predictive of future performance.The portfolio’s performance shown in the graph and table does not reflect the deduction of taxes that a shareholder would pay on portfolio distributions or the redemption of portfolio shares.
The portfolio’s performance does not reflect the deduction of additional charges and expenses imposed in connection with investing in variable insurance contracts which will reduce returns.
The above graph compares a $10,000 investment made in Initial and Service shares of Dreyfus Variable Investment Fund, Small Company Stock Portfolio on 5/1/96 (inception date of Initial shares) to a $10,000 investment made in the Standard and Poor’s SmallCap 600 Index (the “Index”) on that date.
The portfolio’s Initial shares are not subject to a Rule 12b-1 fee.The portfolio’s Service shares are subject to a 0.25% annual Rule 12b-1 fee.The performance figures for Service shares reflect the performance of the portfolio’s Initial shares from their inception date through December 30, 2000, and the performance of the portfolio’s Service shares from December 31, 2000 (inception date of Service shares) to December 31, 2005 (blended performance figures).The performance figures for each share class reflect certain expense reimbursements, without which the performance of each share class would have been lower. In addition, the blended performance figures have not been adjusted to reflect the higher operating expenses of the Service shares. If these expenses had been reflected, the blended performance figures would have been lower. All dividends and capital gain distributions are reinvested.
The portfolio’s performance shown in the line graph takes into account all applicable portfolio fees and expenses.The Index is a widely accepted, unmanaged index of small-cap stock market performance.The Index does not take into account charges, fees and other expenses. Further information relating to portfolio performance, including expense reimbursements, if applicable, is contained in the Financial Highlights section of the prospectus and elsewhere in this report.
UNDERSTANDING YOUR PORTFOLIO’S EXPENSES (Unaudited)
As a mutual fund investor,you pay ongoing expenses,such as management fees and other expenses.Using the information below,you can estimate how these expenses affect your investment and compare them with the expenses of other funds.You also may pay one-time transaction expenses,including sales charges (loads) and redemption fees, which are not shown in this section and would have resulted in higher total expenses. For more information, see your portfolio’s prospectus or talk to your financial adviser.
Review your portfolio’s expenses
The table below shows the expenses you would have paid on a $1,000 investment in Dreyfus Variable Investment Fund, Small Company Stock Portfolio from July 1, 2005 to December 31, 2005. It also shows how much a $1,000 investment would be worth at the close of the period, assuming actual returns and expenses.
| Expenses and Value of a $1,000 Investment | | |
| assuming actual returns for the six months ended December 31, 2005 |
| | | Initial Shares | | Service Shares |
| |
| |
|
| Expenses paid per $1,000 † | | $ 4.86 | | $ 5.12 |
| Ending value (after expenses) | | $1,029.80 | | $1,029.70 |
COMPARING YOUR PORTFOLIO’S EXPENSES WITH THOSE OF OTHER FUNDS (Unaudited)
Using the SEC’s method to compare expenses
The Securities and Exchange Commission (SEC) has established guidelines to help investors assess fund expenses. Per these guidelines, the table below shows your portfolio’s expenses based on a $1,000 investment, assuming a hypothetical 5% annualized return. You can use this information to compare the ongoing expenses (but not transaction expenses or total cost) of investing in the portfolio with those of other funds. All mutual fund shareholder reports will provide this information to help you make this comparison. Please note that you cannot use this information to estimate your actual ending account balance and expenses paid during the period.
Expenses and Value of a $1,000 Investment assuming a hypothetical 5% annualized return for the six months ended December 31, 2005
| | | Initial Shares | | Service Shares |
| |
| |
|
| Expenses paid per $1,000 † | | $ 4.84 | | $ 5.09 |
| Ending value (after expenses) | | $1,020.42 | | $1,020.16 |
| † Expenses are equal to the portfolio’s annualized expense ratio of .95% for Initial shares and 1.00% for Service shares, |
| multiplied by the average account value over the period, multiplied by 184/365 (to reflect the one-half year period). |
STATEMENT OF INVESTMENTS
December 31, 2005
|
| Common Stocks—98.5% | | Shares | | Value ($) |
| |
| |
|
| Automobiles & Components—1.6% | | | | |
| Fleetwood Enterprises | | 27,580 a,b | | 340,613 |
| Winnebago Industries | | 11,100 | | 369,408 |
| | | | | 710,021 |
| Banking—6.5% | | | | |
| Bank of Hawaii | | 7,200 | | 371,088 |
| Bankunited Financial, Cl. A | | 8,310 | | 220,797 |
| Cullen/Frost Bankers | | 4,420 | | 237,266 |
| Downey Financial | | 3,450 | | 235,945 |
| East West Bancorp | | 4,090 | | 149,244 |
| First Midwest Bancorp/IL | | 5,740 | | 201,244 |
| South Financial Group | | 4,990 | | 137,425 |
| SVB Financial Group | | 4,390 a | | 205,628 |
| UCBH Holdings | | 21,600 | | 386,208 |
| Umpqua Holdings | | 10,100 | | 288,153 |
| Whitney Holding | | 10,370 | | 285,797 |
| Wintrust Financial | | 3,670 | | 201,483 |
| | | | | 2,920,278 |
| Capital Goods—12.3% | | | | |
| Actuant, Cl. A | | 8,630 | | 481,554 |
| Armor Holdings | | 2,560 a | | 109,184 |
| BE Aerospace | | 11,600 a | | 255,200 |
| Briggs & Stratton | | 4,480 b | | 173,779 |
| Bucyrus International, Cl. A | | 4,500 | | 237,150 |
| Drew Industries | | 8,990 a | | 253,428 |
| Greenbrier Cos. | | 6,860 | | 194,824 |
| IDEX | | 4,000 | | 164,440 |
| Manitowoc | | 3,250 | | 163,215 |
| Oshkosh Truck | | 5,970 | | 266,202 |
| Quanta Services | | 37,680 a | | 496,246 |
| Roper Industries | | 6,980 | | 275,780 |
| Teledyne Technologies | | 9,600 a | | 279,360 |
| Terex | | 8,920 a | | 529,848 |
| URS | | 15,410 a | | 579,570 |
STATEMENT OF INVESTMENTS (continued)
|
| Common Stocks (continued) | | Shares | | Value ($) |
| |
| |
|
| Capital Goods (continued) | | | | |
| Walter Industries | | 4,680 | | 232,690 |
| Watsco | | 5,910 | | 353,477 |
| WESCO International | | 11,750 a | | 502,077 |
| | | | | 5,548,024 |
| Commercial & Professional Services—2.4% | | |
| Allied Waste Industries | | 54,750 a,b | | 478,515 |
| Healthcare Services Group | | 10,205 | | 211,346 |
| Labor Ready | | 19,540 a | | 406,823 |
| | | | | 1,096,684 |
| Consumer Durables—2.5% | | | | |
| Carter’s | | 7,220 a | | 424,897 |
| Quiksilver | | 37,400 a | | 517,616 |
| RC2 | | 5,820 a | | 206,726 |
| | | | | 1,149,239 |
| Consumer Services—3.0% | | | | |
| Cheesecake Factory | | 7,090 a | | 265,095 |
| Choice Hotels International | | 9,480 | | 395,885 |
| Panera Bread, Cl. A | | 2,710 a | | 177,993 |
| Pinnacle Entertainment | | 20,300 a | | 501,613 |
| | | | | 1,340,586 |
| Diversified Financial—1.9% | | | | |
| Apollo Investment | | 9,506 | | 170,447 |
| Dresser-Rand Group | | 18,960 a | | 458,453 |
| Nelnet, Cl. A | | 5,550 a | | 225,774 |
| | | | | 854,674 |
| Energy—8.3% | | | | |
| Cabot Oil & Gas | | 4,400 | | 198,440 |
| Cal Dive International | | 13,240 a | | 475,184 |
| Cimarex Energy | | 7,740 | | 332,897 |
| Frontier Oil | | 4,670 | | 175,265 |
| Goodrich Petroleum | | 17,850 a,b | | 448,928 |
| Massey Energy | | 14,560 | | 551,387 |
| Southwestern Energy | | 6,060 a | | 217,796 |
| Common Stocks (continued) | | Shares | | Value ($) |
| |
| |
|
| Energy (continued) | | | | |
| St. Mary Land & Exploration | | 12,430 b | | 457,548 |
| Todco, Cl. A | | 5,500 | | 209,330 |
| Unit | | 11,910 a | | 655,407 |
| | | | | 3,722,182 |
| Food & Beverages—.8% | | | | |
| Premium Standard Farms | | 23,260 | | 347,970 |
| Healthcare Equipment—10.3% | | | | |
| American Healthways | | 2,970 a | | 134,393 |
| Cerner | | 3,380 a,b | | 307,276 |
| Cooper Cos. | | 2,790 | | 143,127 |
| Idexx Laboratories | | 6,100 a | | 439,078 |
| Merit Medical Systems | | 1 a | | 12 |
| Pediatrix Medical Group | | 1,800 a | | 159,426 |
| PerkinElmer | | 8,020 | | 188,951 |
| Pharmaceutical Product Development | | 7,860 | | 486,927 |
| Psychiatric Solutions | | 9,310 a | | 546,869 |
| Resmed | | 11,340 a | | 434,435 |
| Respironics | | 5,660 a | | 209,816 |
| Sierra Health Services | | 4,910 a | | 392,604 |
| Sybron Dental Specialties | | 10,020 a | | 398,896 |
| Syneron Medical | | 12,890 a | | 409,258 |
| Ventiv Health | | 16,280 a | | 384,534 |
| | | | | 4,635,602 |
| Hotels & Restaurants—.6% | | | | |
| Shuffle Master | | 11,532 a,b | | 289,914 |
| Insurance—2.5% | | | | |
| AmerUs Group | | 3,240 | | 183,611 |
| Horace Mann Educators | | 8,880 | | 168,365 |
| Max Re Capital | | 6,020 | | 156,339 |
| Ohio Casualty | | 7,100 | | 201,072 |
| Philadelphia Consolidated Holding | | 2,370 a | | 229,155 |
| Phoenix Cos. | | 12,560 | | 171,318 |
| | | | | 1,109,860 |
STATEMENT OF INVESTMENTS (continued)
|
| Common Stocks (continued) | | Shares | | Value ($) |
| |
| |
|
| Materials—6.4% | | | | |
| Abitibi-Consolidated | | 91,600 | | 370,980 |
| Airgas | | 7,800 | | 256,620 |
| Cleveland-Cliffs | | 5,560 | | 492,449 |
| Coeur d’ Alene Mines | | 99,110 a | | 396,440 |
| Commercial Metals | | 5,710 | | 214,353 |
| Florida Rock Industries | | 5,340 | | 261,980 |
| Olin | | 18,970 | | 373,330 |
| Smurfit-Stone Container | | 36,500 a | | 517,205 |
| | | | | 2,883,357 |
| Media—2.2% | | | | |
| Harte-Hanks | | 8,120 | | 214,287 |
| Meredith | | 6,700 | | 350,678 |
| Regal Entertainment Group, Cl. A | | 22,490 b | | 427,760 |
| | | | | 992,725 |
| Pharmaceuticals—2.7% | | | | |
| Amylin Pharmaceuticals | | 5,700 a,b | | 227,544 |
| BioCryst Pharmaceuticals | | 14,400 a | | 241,200 |
| Cephalon | | 4,870 a | | 315,284 |
| Onyx Pharmaceuticals | | 7,900 a | | 227,204 |
| Protein Design Labs | | 8,060 a | | 229,065 |
| | | | | 1,240,297 |
| Real Estate—3.8% | | | | |
| Equity Inns | | 34,220 | | 463,681 |
| Equity One | | 10,080 | | 233,050 |
| Friedman Billings Ramsey Group, Cl. A | | 27,300 b | | 270,270 |
| Spirit Finance | | 20,080 | | 227,908 |
| Sunstone Hotel Investors | | 18,830 | | 500,313 |
| | | | | 1,695,222 |
| Retail—5.7% | | | | |
| AnnTaylor Stores | | 8,600 a | | 296,872 |
| Coldwater Creek | | 17,890 a | | 546,182 |
| Dick’s Sporting Goods | | 13,080 a,b | | 434,779 |
| GameStop, Cl. A | | 16,070 a,b | | 511,347 |
| Guitar Center | | 2,690 a | | 134,527 |
| Common Stocks (continued) | | Shares | | Value ($) |
| |
| |
|
| Retail (continued) | | | | |
| Performance Food Group | | 14,580 a | | 413,635 |
| Rite Aid | | 59,700 a | | 207,756 |
| | | | | 2,545,098 |
| Semiconductors & Equipment—4.8% | | | | |
| Advanced Energy Industries | | 46,060 a | | 544,890 |
| Atheros Communications | | 19,800 a | | 257,400 |
| Axcelis Technologies | | 83,380 a | | 397,723 |
| Microsemi | | 5,120 a | | 141,619 |
| Silicon Laboratories | | 7,330 a | | 268,718 |
| Varian Semiconductor Equipment Associates | | 12,810 a | | 562,743 |
| | | | | 2,173,093 |
| Software & Services—8.0% | | | | |
| Ansys | | 5,800 a | | 247,602 |
| aQuantive | | 4,300 a | | 108,532 |
| CACI International, Cl. A | | 3,690 a | | 211,732 |
| Compuware | | 26,090 a | | 234,027 |
| Digital River | | 11,600 a,b | | 344,984 |
| Factset Research Systems | | 2,915 | | 119,981 |
| Global Payments | | 13,940 | | 649,743 |
| Hyperion Solutions | | 5,325 a | | 190,742 |
| Kronos/MA | | 3,640 a | | 152,370 |
| Lawson Software | | 28,190 a,b | | 207,197 |
| Micros Systems | | 12,770 a | | 617,046 |
| WebSideStory | | 15,870 a | | 287,723 |
| Wind River Systems | | 16,980 a | | 250,795 |
| | | | | 3,622,474 |
| Technology Hardware & Equipment—4.5% | | | | |
| Applied Films | | 11,200 a | | 232,624 |
| Comtech Telecommunications | | 7,300 a | | 222,942 |
| Electronics for Imaging | | 18,490 a | | 492,019 |
| JDS Uniphase | | 127,350 a | | 300,546 |
| Palm | | 11,900 a,b | | 378,420 |
| Polycom | | 26,900 a | | 411,570 |
| | | | | 2,038,121 |
| | STATEMENT OF INVESTMENTS (continued)
|
| Common Stocks (continued) | | Shares | | | | Value ($) |
| |
| |
| |
|
| Telecommunication Services—1.5% | | | | | | |
| Alaska Communications Systems Group | | 21,340 | | b | | 216,814 |
| SBA Communications, Cl. A | | 25,200 | | a | | 451,080 |
| | | | | | | 667,894 |
| Transportation—2.8% | | | | | | |
| Airtran Holdings | | 15,000 | | a | | 240,450 |
| JB Hunt Transport Services | | 23,360 | | | | 528,870 |
| Kansas City Southern | | 6,160 | | a | | 150,489 |
| Pacer International | | 12,230 | | | | 318,714 |
| | | | | | | 1,238,523 |
| Utilities—3.4% | | | | | | |
| CMS Energy | | 15,890 | | a | | 230,564 |
| El Paso Electric | | 23,970 | | a | | 504,329 |
| Energen | | 10,430 | | | | 378,818 |
| OGE Energy | | 15,580 | | | | 417,388 |
| | | | | | | 1,531,099 |
| Total Common Stocks | | | | | | |
| (cost $37,808,010) | | | | | | 44,352,937 |
| |
| |
| |
|
| | | Principal | | | | |
| Short-Term Investment—1.3% | | Amount ($) | | Value ($) |
| |
| |
|
| Repurchase Agreement; | | | | | | |
| Greenwich Capital Markets, | | | | | | |
| 3.45%, dated 12/30/2005, due 1/3/2006 | | | | |
| in the amount of $580,222 | | | | | | |
| (fully collateralized by $605,000 of | | | | | | |
| Federal Home Loan Mortgage Corp., Notes, | | | | |
| 4.125%, due 10/18/2010, value $596,328) | | | | |
| (cost $580,000) | | 580,000 | | | | 580,000 |
| Investment of Cash Collateral | | | | |
| for Securities Loaned—9.8% | | Shares | | Value ($) |
| |
| |
|
| Registered Investment Company; | | | | |
| Dreyfus Institutional Cash Advantage Plus Fund | | |
| (cost $4,391,577) | | | | 4,391,577 c | | 4,391,577 |
| |
| |
| |
|
| |
| Total Investments (cost $42,779,587) | | 109.6% | | 49,324,514 |
| |
| Liabilities, Less Cash and Receivables | | (9.6%) | | (4,314,462) |
| |
| Net Assets | | | | 100.0% | | 45,010,052 |
| |
| a | | Non-income producing. | | | | | | |
| b | | All or a portion of these securities are on loan. At December 31, 2005, the total market value of the portfolio’s |
| | | securities on loan is $4,585,746 and the total market value of the collateral held by the portfolio is $4,863,824, |
| | | consisting of cash collateral of $4,391,577 and U.S. Government and agency securities valued at $472,247. |
| c | | Investment in affiliated money market mutual fund. | | | | |
| |
| |
| |
|
| |
| |
| |
| |
| Portfolio Summary † | | | | | | |
| |
| | | | | Value (%) | | | | Value (%) |
| |
| |
| |
| |
|
| Capital Goods | | 12.3 | | Retail | | 5.7 |
| Short-Term/ | | | | Semiconductors & Equipment | | 4.8 |
| Money Market Investments | | 11.1 | | Technology Hardware & Equipment 4.5 |
| Healthcare Equipment | | 10.3 | | Real Estate | | 3.8 |
| Energy | | 8.3 | | Utilities | | 3.4 |
| Software & Services | | 8.0 | | Other | | 24.5 |
| Banking | | 6.5 | | | | |
| Materials | | 6.4 | | | | 109.6 |
| |
| † | | Based on net assets. | | | | | | |
| See notes to financial statements. | | | | | | |
STATEMENT OF ASSETS AND LIABILITIES
December 31, 2005
| | | Cost | | Value |
| |
| |
|
| Assets ($): | | | | |
| Investments in securities—See Statement | | | | |
| of Investments (including securities on loan, | | |
| valued at $4,585,746)—Note 1(b): | | | | |
| Unaffiliated issuers | | 38,388,010 | | 44,932,937 |
| Affiliated issuers | | 4,391,577 | | 4,391,577 |
| Cash | | | | 38,889 |
| Receivable for investment securities sold | | | | 305,277 |
| Dividends and interest receivable | | | | 44,843 |
| Receivable for shares of Beneficial Interest subscribed | | 406 |
| | | | | 49,713,929 |
| |
| |
|
| Liabilities ($): | | | | |
| Due to The Dreyfus Corporation and affiliates—Note 3(b) | | 38,378 |
| Liability for securities on loan—Note 1(b) | | | | 4,391,577 |
| Payable for investment securities purchased | | 196,874 |
| Payable for shares of Beneficial Interest redeemed | | 16,233 |
| Accrued expenses | | | | 60,815 |
| | | | | 4,703,877 |
| |
| |
|
| Net Assets ($) | | | | 45,010,052 |
| |
| |
|
| Composition of Net Assets ($): | | | | |
| Paid-in capital | | | | 32,955,382 |
| Accumulated undistributed investment income—net | | 18,019 |
| Accumulated net realized gain (loss) on investments | | 5,491,724 |
| Accumulated net unrealized appreciation | | | | |
| (depreciation) on investments | | | | 6,544,927 |
| |
| |
|
| Net Assets ($) | | | | 45,010,052 |
| |
| |
|
| |
| |
| Net Asset Value Per Share | | | | |
| | | Initial Shares | | Service Shares |
| |
| |
|
| Net Assets ($) | | 39,057,394 | | 5,952,658 |
| Shares Outstanding | | 1,794,414 | | 276,528 |
| |
| |
|
| Net Asset Value Per Share ($) | | 21.77 | | 21.53 |
See notes to financial statements.
|
STATEMENT OF OPERATIONS
Year Ended December 31, 2005
|
| Investment Income ($): | | |
| Income: | | |
| Cash dividends (net of $367 foreign taxes withheld at source) | | 388,873 |
| Income from securities lending | | 26,278 |
| Interest | | 15,889 |
| Total Income | | 431,040 |
| Expenses: | | |
| Investment advisory fee—Note 3(a) | | 338,726 |
| Auditing fees | | 34,345 |
| Custodian fees—Note 3(b) | | 31,820 |
| Prospectus and shareholders’ reports | | 25,776 |
| Distribution fees—Note 3(b) | | 15,431 |
| Shareholder servicing costs—Note 3(b) | | 8,800 |
| Trustees’ fees and expenses—Note 3(c) | | 3,322 |
| Legal fees | | 1,576 |
| Loan commitment fees—Note 2 | | 352 |
| Miscellaneous | | 5,246 |
| Total Expenses | | 465,394 |
| Less—waiver of fees due to | | |
| undertaking—Note 3(a) | | (12,079) |
| Less—reduction in custody fees due | | |
| to earnings credits—Note 1(b) | | (59) |
| Net Expenses | | 453,256 |
| Investment (Loss)—Net | | (22,216) |
| |
|
| Realized and Unrealized Gain (Loss) on Investments—Note 4 ($): |
| Net realized gain (loss) on investments | | 5,572,770 |
| Net unrealized appreciation (depreciation) on investments | | (5,095,828) |
| Net Realized and Unrealized Gain (Loss) on Investments | | 476,942 |
| Net Increase in Net Assets Resulting from Operations | | 454,726 |
See notes to financial statements.
|
STATEMENT OF CHANGES IN NET ASSETS
| | | Year Ended December 31, |
| |
|
| | | 2005 | | 2004 |
| |
| |
|
| Operations ($): | | | | |
| Investment (loss)—net | | (22,216) | | (13,309) |
| Net realized gain (loss) on investments | | 5,572,770 | | 5,768,704 |
| Net unrealized appreciation | | | | |
| (depreciation) on investments | | (5,095,828) | | 1,812,799 |
| Net Increase (Decrease) in Net Assets | | | | |
| Resulting from Operations | | 454,726 | | 7,568,194 |
| |
| |
|
| Dividends to Shareholders from ($): | | | | |
| Net realized gain on investments: | | | | |
| Initial shares | | (1,889,620) | | (2,482,168) |
| Service shares | | (300,690) | | (414,059) |
| Total Dividends | | (2,190,310) | | (2,896,227) |
| |
| |
|
| Beneficial Interest Transactions ($): | | | | |
| Net proceeds from shares sold: | | | | |
| Initial shares | | 5,992,695 | | 5,675,897 |
| Service shares | | 1,085,909 | | 3,986,665 |
| Dividends reinvested: | | | | |
| Initial shares | | 1,889,620 | | 2,482,168 |
| Service shares | | 300,690 | | 414,059 |
| Cost of shares redeemed: | | | | |
| Initial shares | | (8,889,197) | | (6,864,790) |
| Service shares | | (2,046,928) | | (3,712,388) |
| Increase (Decrease) in Net Assets from | | | | |
| Beneficial Interest Transactions | | (1,667,211) | | 1,981,611 |
| Total Increase (Decrease) in Net Assets | | (3,402,795) | | 6,653,578 |
| |
| |
|
| Net Assets ($): | | | | |
| Beginning of Period | | 48,412,847 | | 41,759,269 |
| End of Period | | 45,010,052 | | 48,412,847 |
| Undistributed investment income—net | | 18,019 | | 7,597 |
| | | Year Ended December 31, |
| |
|
| | | 2005 | | 2004 |
| |
| |
|
| Capital Share Transactions: | | | | |
| Initial Shares | | | | |
| Shares sold | | 285,421 | | 265,284 |
| Shares issued for dividends reinvested | | 90,585 | | 110,368 |
| Shares redeemed | | (414,716) | | (322,098) |
| Net Increase (Decrease) in Shares Outstanding | | (38,710) | | 53,554 |
| |
| |
|
| Service Shares | | | | |
| Shares sold | | 52,466 | | 188,954 |
| Shares issued for dividends reinvested | | 14,561 | | 18,576 |
| Shares redeemed | | (96,856) | | (176,121) |
| Net Increase (Decrease) in Shares Outstanding | | (29,829) | | 31,409 |
See notes to financial statements.
|
FINANCIAL HIGHLIGHTS
The following tables describe the performance for each share class for the fiscal periods indicated. All information (except portfolio turnover rate) reflects financial results for a single portfolio share.Total return shows how much your investment in the portfolio would have increased (or decreased) during each period, assuming you had reinvested all dividends and distributions.These figures have been derived from the portfolio’s financial statements.
| | | | | | | Year Ended December 31, | | |
| | | |
| |
| |
|
| Initial Shares | | 2005 | | 2004 | | 2003 | | 2002 | | 2001 |
| |
| |
| |
| |
| |
|
| Per Share Data ($): | | | | | | | | | | |
| Net asset value, beginning of period | | 22.66 | | 20.34 | | 14.25 | | 17.79 | | 18.08 |
| Investment Operations: | | | | | | | | | | |
| Investment income (loss)—net a | | (.01) | | .00b | | (.01) | | .05 | | .03 |
| Net realized and unrealized gain | | | | | | | | | | |
| (loss) on investments | | .17 | | 3.76 | | 6.12 | | (3.55) | | (.31) |
| Total from Investment Operations | | .16 | | 3.76 | | 6.11 | | (3.50) | | (.28) |
| Distributions: | | | | | | | | | | |
| Dividends from investment income—net | | — | | — | | (.02) | | (.04) | | (.01) |
| Dividends from net realized | | | | | | | | | | |
| gain on investments | | (1.05) | | (1.44) | | — | | — | | — |
| Total Distributions | | (1.05) | | (1.44) | | (.02) | | (.04) | | (.01) |
| Net asset value, end of period | | 21.77 | | 22.66 | | 20.34 | | 14.25 | | 17.79 |
| |
| |
| |
| |
| |
|
| Total Return (%) | | .91 | | 18.52 | | 42.94 | | (19.71) | | (1.53) |
| |
| |
| |
| |
| |
|
| Ratios/Supplemental Data (%): | | | | | | | | | | |
| Ratio of total expenses | | | | | | | | | | |
| to average net assets | | .99 | | .95 | | 1.12 | | .98 | | 1.03 |
| Ratio of net expenses | | | | | | | | | | |
| to average net assets | | .98 | | .95 | | 1.12 | | .98 | | 1.03 |
| Ratio of net investment income | | | | | | | | | | |
| (loss) to average net assets | | (.03) | | .00c | | (.09) | | .28 | | .16 |
| Portfolio Turnover Rate | | 157.60 | | 112.27 | | 171.34 | | 71.76 | | 60.40 |
| |
| |
| |
| |
| |
|
| Net Assets, end of period ($ x 1,000) | | 39,057 | | 41,534 | | 36,200 | | 25,458 | | 33,341 |
| |
| a | | Based on average shares outstanding at each month end. | | | | | | | | |
| b | | Amount represents less than $.01 per share. | | | | | | | | |
| c | | Amount represents less than .01%. | | | | | | | | | | |
| See notes to financial statements. | | | | | | | | | | |
| | | | | | | Year Ended December 31, | | |
| | | |
| |
| |
|
| Service Shares | | 2005 | | 2004 | | 2003 | | 2002 | | 2001 |
| |
| |
| |
| |
| |
|
| Per Share Data ($): | | | | | | | | | | |
| Net asset value, beginning of period | | 22.45 | | 20.22 | | 14.20 | | 17.73 | | 18.08 |
| Investment Operations: | | | | | | | | | | |
| Investment income (loss)—net a | | (.04) | | (.05) | | (.06) | | .01 | | (.03) |
| Net realized and unrealized | | | | | | | | | | |
| gain (loss) on investments | | .17 | | 3.72 | | 6.10 | | (3.54) | | (.31) |
| Total from Investment Operations | | .13 | | 3.67 | | 6.04 | | (3.53) | | (.34) |
| Distributions: | | | | | | | | | | |
| Dividends from investment income—net | | — | | — | | (.02) | | (.00)b | | (.01) |
| Dividends from net realized | | | | | | | | | | |
| gain on investments | | (1.05) | | (1.44) | | — | | — | | — |
| Total Distributions | | (1.05) | | (1.44) | | (.02) | | (.00)b | | (.01) |
| Net asset value, end of period | | 21.53 | | 22.45 | | 20.22 | | 14.20 | | 17.73 |
| |
| |
| |
| |
| |
|
| Total Return (%) | | .77 | | 18.18 | | 42.60 | | (19.89) | | (1.86) |
| |
| |
| |
| |
| |
|
| Ratios/Supplemental Data (%): | | | | | | | | | | |
| Ratio of total expenses | | | | | | | | | | |
| to average net assets | | 1.25 | | 1.20 | | 1.37 | | 1.22 | | 1.39 |
| Ratio of net expenses | | | | | | | | | | |
| to average net assets | | 1.14 | | 1.20 | | 1.37 | | 1.22 | | 1.39 |
| Ratio of net investment income | | | | | | | | | | |
| (loss) to average net assets | | (.19) | | (.25) | | (.34) | | .04 | | (.18) |
| Portfolio Turnover Rate | | 157.60 | | 112.27 | | 171.34 | | 71.76 | | 60.40 |
| |
| |
| |
| |
| |
|
| Net Assets, end of period ($ x 1,000) | | 5,953 | | 6,879 | | 5,559 | | 3,117 | | 1,944 |
| |
| a | | Based on average shares outstanding at each month end. | | | | | | | | |
| b | | Amount represents less than $.01 per share. | | | | | | | | |
| See notes to financial statements. | | | | | | | | | | |
NOTES TO FINANCIAL STATEMENTS
NOTE 1—Significant Accounting Policies:
Dreyfus Variable Investment Fund (the “fund”) is registered under the Investment Company Act of 1940, as amended (the “Act”), as an open-end management investment company, operating as a series company currently offering twelve series, including the Small Company Stock Portfolio (the “portfolio”). The portfolio is only offered to separate accounts established by insurance companies to fund variable annuity contracts and variable life insurance policies.The portfolio is a diversified series.The portfolio’s investment objective is to provide capital appreciation. The Dreyfus Corporation (the “Manager” or “Dreyfus”) serves as the portfolio’s investment adviser.The Manager is a wholly-owned subsidiary of Mellon Financial Corporation (“Mellon Financial”).
Dreyfus Service Corporation (the “Distributor”), a wholly-owned subsidiary of the Manager, is the distributor of the portfolio’s shares, which are sold without a sales charge.The portfolio is authorized to issue an unlimited number of $.001 par value shares of Beneficial Interest in each of the following classes of shares: Initial and Service. Each class of shares has identical rights and privileges, except with respect to the distribution plan and the expenses borne by each class and certain voting rights. Income, expenses (other than expenses attributable to a specific class), and realized and unrealized gains or losses on investments are allocated to each class of shares based on its relative net assets.
The fund accounts separately for the assets, liabilities and operations of each series. Expenses directly attributable to each series are charged to that series’ operations; expenses which are applicable to all series are allocated among them on a pro rata basis.
The portfolio’s financial statements are prepared in accordance with U.S. generally accepted accounting principles, which may require the use of management estimates and assumptions. Actual results may differ from those estimates.
The fund enters into contracts that contain a variety of indemnifica-tions.The portfolio’s maximum exposure under these arrangements is unknown. The portfolio does not anticipate recognizing any loss related to these arrangements.
(a) Portfolio valuation: Investments in securities are valued at the last sales price on the securities exchange or national securities market on which such securities are primarily traded. Securities listed on the National Market System for which market quotations are available are valued at the official closing price or, if there is no official closing price that day, at the last sales price. Securities not listed on an exchange or the national securities market, or securities for which there were no transactions, are valued at the average of the most recent bid and asked prices, except for open short positions, where the asked price is used for valuation purposes. Bid price is used when no asked price is available. Investments in registered investment companies are valued at their net asset value. When market quotations or official closing prices are not readily available, or are determined not to reflect accurately fair value, such as when the value of a security has been significantly affected by events after the close of the exchange or market on which the security is principally traded (for example, a foreign exchange or market), but before the portfolio calculates its net asset value, the portfolio may value these investments at fair value as determined in accordance with the procedures approved by the Board of Trustees. Fair valuing of securities may be determined with the assistance of a pricing service using calculations based on indices of domestic securities and other appropriate indicators, such as prices of relevant ADR’s and futures contracts. For other securities that are fair valued by the Board of Trustees, certain factors may be considered such as: fundamental analytical data, the nature and duration of restrictions on disposition, an evaluation of the forces that influence the market in which the securities are purchased and sold and public trading in similar securities of the issuer or comparable issuers. Financial futures are valued at the last sales price.
(b) Securities transactions and investment income: Securities transactions are recorded on a trade date basis. Realized gain and loss from securities transactions are recorded on the identified cost basis. Dividend income is recognized on the ex-dividend date and interest income, including, where applicable, accretion of discount and amortization of premium on investments, is recognized on the accrual basis.
NOTES TO FINANCIAL STATEMENTS (continued)
|
The portfolio has an arrangement with the custodian bank whereby the portfolio receives earnings credits from the custodian when positive cash balances are maintained, which are used to offset custody fees. For financial reporting purposes, the portfolio includes net earnings credits as an expense offset in the Statement of Operations.
Pursuant to a securities lending agreement with Mellon Bank, N.A., an affiliate of the Manager, the portfolio may lend securities to qualified institutions.At origination, all loans are secured by collateral of at least 102% of the value of U.S. securities loaned and 105% of the value of foreign securities loaned. Collateral equivalent to at least 100% of the market value of securities on loan will be maintained at all times. Cash collateral is invested in certain money market mutual funds managed by the Manager. The portfolio will be entitled to receive all income on securities loaned, in addition to income earned as a result of the lending transaction. Although each security loaned is fully collateralized, the portfolio would bear the risk of delay in recovery of, or loss of rights in, the securities loaned should a borrower fail to return the securities in a timely manner.
The portfolio may enter into repurchase agreements with financial institutions, deemed to be creditworthy by the Manager, subject to the seller’s agreement to repurchase and the portfolio’s agreement to resell such securities at a mutually agreed upon price. Securities purchased subject to repurchase agreements are deposited with the portfolio’s custodian and, pursuant to the terms of the repurchase agreement, must have an aggregate market value greater than or equal to the terms of the repurchase price plus accrued interest at all times. If the value of the underlying securities falls below the value of the repurchase price plus accrued interest, the portfolio will require the seller to deposit additional collateral by the next business day. If the request for additional collateral is not met, or the seller defaults on its repurchase obligation, the portfolio maintains its right to sell the underlying securities at market value and may claim any resulting loss against the seller.
(c) Affiliated issuers: Investments in other investment companies advised by the Manager are defined as “affiliated” in the Act.
(d) Dividends to shareholders: Dividends are recorded on the ex-dividend date. Dividends from investment income-net and dividends from net realized capital gain, if any, are normally declared and paid annually, but the portfolio may make distributions on a more frequent basis to comply with the distribution requirements of the Internal Revenue Code of 1986, as amended (the “Code”).To the extent that net realized capital gain can be offset by capital loss carryovers, if any, it is the policy of the portfolio not to distribute such gain. Income and capital gain distributions are determined in accordance with income tax regulations, which may differ from U.S. generally accepted accounting principles.
(e) Federal income taxes: It is the policy of the portfolio to continue to qualify as a regulated investment company, if such qualification is in the best interests of its shareholders, by complying with the applicable provisions of the Code, and to make distributions of taxable income sufficient to relieve it from substantially all federal income and excise taxes.
At December 31, 2005, the components of accumulated earnings on a tax basis were as follows: undistributed ordinary income $515,785, undistributed capital gains $5,077,548 and unrealized appreciation $6,461,337.
The tax character of distributions paid to shareholders during the fiscal periods ended December 31, 2005 and December 31, 2004 were as follows: ordinary income $400,440 and $0 and long-term capital gains $1,789,870 and $2,896,227, respectively.
During the period ended December 31, 2005, as a result of permanent book to tax differences, primarily due to the tax treatment for net operating losses and real estate investment trusts, the portfolio increased accumulated undistributed investment income-net by
NOTES TO FINANCIAL STATEMENTS (continued)
|
$32,638 and decreased accumulated net realized gain (loss) on investments by the same amount. Net assets were not affected by this reclassification.
NOTE 2—Bank Line of Credit:
|
The portfolio participates with other Dreyfus-managed funds in a $350 million redemption credit facility (the “Facility”) to be utilized for temporary or emergency purposes, including the financing of redemptions. In connection therewith, the portfolio has agreed to pay commitment fees on its pro rata portion of the Facility. Interest is charged to the portfolio based on prevailing market rates in effect at the time of borrowing. During the period ended December 31, 2005, the portfolio did not borrow under the Facility.
NOTE 3—Investment Advisory Fee and Other Transactions with Affiliates:
(a) Pursuant to an Investment Advisory Agreement with the Manager, the investment advisory fee is computed at the annual rate of .75% of the value of the portfolio’s average daily net assets and is payable monthly.
The Manager has agreed, from August 1, 2005 to December 31, 2006, to waive receipt of its fees and/or assume the expenses of the portfolio so that the expenses of neither class, exclusive of taxes, brokerage fees, interest on borrowings, commitment fees and extraordinary expenses, exceed an annual rate of .95% of the value of the average daily net assets of their class. During the period ended December 31, 2005, the Manager waived receipt of fees of $12,079, pursuant to the undertaking.
(b) Under the Distribution Plan (the “Plan”) adopted pursuant to Rule 12b-1 under the Act, Service shares pay the Distributor for distributing their shares, for servicing and/or maintaining Service shares shareholder accounts and for advertising and marketing for Service shares.The Plan
provides for payments to be made at an annual rate of .25% of the value of the Service shares’ average daily net assets.The Distributor may make payments to Participating Insurance Companies and to brokers and dealers acting as principal underwriter for their variable insurance products.The fees payable under the Plan are payable without regard to actual expenses incurred. During the period ended December 31, 2005, Service shares were charged $15,431 pursuant to the Plan.
The portfolio compensates Dreyfus Transfer, Inc., a wholly-owned subsidiary of the Manager, under a transfer agency agreement for providing personnel and facilities to perform transfer agency services for the portfolio. During the period ended December 31, 2005, the portfolio was charged $351 pursuant to the transfer agency agreement.
The portfolio compensates Mellon Bank, N.A., an affiliate of the Manager, under a custody agreement for providing custodial services for the portfolio. During the period ended December 31, 2005, the portfolio was charged $31,820 pursuant to the custody agreement.
During the period ended December 31, 2005, the portfolio was charged $3,762 for services performed by the Chief Compliance Officer.
The components of Due to The Dreyfus Corporation and affiliates in the Statement of Assets and Liabilities consist of: investment advisory fees $29,274, Rule 12b-1 distribution plan fees $1,295, custodian fees $8,738, chief compliance officer fees $1,858 and transfer agency per account fees $52, which are offset against an expense reimbursement currently in effect in the amount of $2,839.
(c) Each Board member also serves as a Board member of other funds within the Dreyfus complex. Annual retainer fees and attendance fees are allocated to each fund based on net assets.
NOTES TO FINANCIAL STATEMENTS (continued)
|
NOTE 4—Securities Transactions:
The aggregate amount of purchases and sales of investment securities, excluding short-term securities, during the period ended December 31, 2005, amounted to $70,973,121, and $75,331,490, respectively.
At December 31, 2005, the cost of investments for federal income tax purposes was $42,863,177; accordingly, accumulated net unrealized appreciation on investments was $6,461,337, consisting of $7,192,131 gross unrealized appreciation and $730,794 gross unrealized depreciation.
REPORT OF INDEPENDENT REGISTERED PUBLIC ACCOUNTING FIRM
Shareholders and Board of Trustees
Dreyfus Variable Investment Fund, Small Company Stock Portfolio
We have audited the accompanying statement of assets and liabilities, including the statement of investments, of Dreyfus Variable Investment Fund, Small Company Stock Portfolio (one of the funds comprising Dreyfus Variable Investment Fund) as of December 31, 2005, and the related statement of operations for the year then ended, the statement of changes in net assets for each of the two years in the period then ended, and financial highlights for each of the years indicated therein. These financial statements and financial highlights are the responsibility of the Fund’s management. Our responsibility is to express an opinion on these financial statements and financial highlights based on our audits.
We conducted our audits in accordance with the standards of the Public Company Accounting Oversight Board (United States). Those standards require that we plan and perform the audit to obtain reasonable assurance about whether the financial statements and financial highlights are free of material misstatement. We were not engaged to perform an audit of the Fund’s internal control over financial reporting. Our audits included consideration of internal control over financial reporting as a basis for designing audit procedures that are appropriate in the circumstances, but not for the purpose of expressing an opinion on the effectiveness of the Fund’s internal control over financial reporting. Accordingly, we express no such opinion. An audit also includes examining, on a test basis, evidence supporting the amounts and disclosures in the financial statements and financial highlights, assessing the accounting principles used and significant estimates made by management, and evaluating the overall financial statement presentation. Our procedures included verification by examination of securities held by the custodian as of December 31, 2005 and confirmation of securities not held by the custodian by correspondence with others. We believe that our audits provide a reasonable basis for our opinion.
In our opinion, the financial statements and financial highlights referred to above present fairly, in all material respects, the financial position of Dreyfus Variable Investment Fund, Small Company Stock Portfolio at December 31, 2005, the results of its operations for the year then ended, the changes in its net assets for each of the two years in the period then ended, and the financial highlights for each of the indicated years, in conformity with U. S. generally accepted accounting principles.
| | New York, New York
February 6, 2006
|
IMPORTANT TAX INFORMATION (Unaudited)
For federal tax purposes, the portfolio hereby designates $.8573 per share as a long-term capital gain distribution of the $1.0491 per share paid on March 31, 2005, and also the portfolio hereby designates 95.11% of the ordinary dividends paid during the fiscal year ended December 31, 2005 as qualifying for the corporate dividends received deduction. Shareholders will receive notification in January 2006 of the percentage applicable to the preparation of their 2005 income tax returns.
| BOARD MEMBERS INFORMATION (Unaudited) |
| |
| |
| |
| Joseph S. DiMartino (62) |
| Chairman of the Board (1995) |
| Principal Occupation During Past 5 Years: |
| • Corporate Director and Trustee |
| Other Board Memberships and Affiliations: |
| • The Muscular Dystrophy Association, Director |
| • Levcor International, Inc., an apparel fabric processor, Director |
| • Century Business Services, Inc., a provider of outsourcing functions for small and medium size |
| companies, Director |
| • The Newark Group, a provider of a national market of paper recovery facilities, paperboard |
| mills and paperboard converting plants, Director |
| • Sunair Services Corporation, engages in the design, manufacture and sale of high frequency |
| systems for long-range voice and data communications, as well as providing certain outdoor- |
| related services to homes and businesses, Director |
| No. of Portfolios for which Board Member Serves: 193 |
| ——————— |
| David P. Feldman (66) |
| Board Member (1994) |
| Principal Occupation During Past 5 Years: |
| • Corporate Director and Trustee |
| Other Board Memberships and Affiliations: |
| • BBH Mutual Funds Group (11 funds), Director |
| • The Jeffrey Company, a private investment company, Director |
| • QMED, a medical device company, Director |
| No. of Portfolios for which Board Member Serves: 58 |
| ——————— |
| James F. Henry (75) |
| Board Member (1990) |
| Principal Occupation During Past 5 Years: |
| • President, CPR Institute for Dispute Resolution, a non-profit organization principally |
| engaged in the development of alternatives to business litigation (Retired 2003) |
| No. of Portfolios for which Board Member Serves: 22 |
| BOARD MEMBERS INFORMATION (Unaudited) (continued) |
| |
| |
| |
| |
| Dr. Paul A. Marks (79) |
| Board Member (1990) |
| Principal Occupation During Past 5 Years: |
| • President, Emeritus (2000-present) and President and Chief Executive Officer of Memorial |
| Sloan-Kettering Cancer Center (Retired 1999) |
| Other Board Memberships and Affiliations: |
| • Pfizer, Inc., a pharmaceutical company, Director-Emeritus |
| • Lazard Freres & Company, LLC, Senior Adviser |
| • Carrot Capital Health Care Ventures, Advisor |
| • Armgo-Start-Up Biotech; Board of Directors |
| • Nanoviricide, Board Director |
| • PTC, Scientific Advisory Board |
| No. of Portfolios for which Board Member Serves: 22 |
| ——————— |
| Dr. Martin Peretz (66) |
| Board Member (1990) |
| Principal Occupation During Past 5 Years: |
| • Editor-in-Chief of The New Republic Magazine |
| • Lecturer in Social Studies at Harvard University (1965-2001) |
| • Co-Chairman of TheStreet.com, a financial daily on the web |
| Other Board Memberships and Affiliations: |
| • Academy for Liberal Education, an accrediting agency for colleges and universities certified by |
| the U.S. Department of Education, Director |
| • Harvard Center for Blood Research,Trustee |
| • Bard College,Trustee |
| • Board of Overseers of YIVO Institute for Jewish Research, Chairman |
| No. of Portfolios for which Board Member Serves: 22 |
| ——————— |
| Once elected all Board Members serve for an indefinite term.The address of the Board Members and Officers is in c/o |
| The Dreyfus Corporation, 200 Park Avenue, New York, New York 10166. Additional information about the Board |
| Members is available in the fund’s Statement of Additional Information which can be obtained from Dreyfus free of |
| charge by calling this toll free number: 1-800-554-4611. |
| John M. Fraser, Jr., Emeritus Board Member |
| Rosalind Gersten Jacobs, Emeritus Board Member |
OFFICERS OF THE FUND (Unaudited)
| STEPHEN E. CANTER, President since |
| March 2000. |
Chairman of the Board, Chief Executive Officer and Chief Operating Officer of the Manager, and an officer of 90 investment companies (comprised of 184 portfolios) managed by the Manager. Mr. Canter also is a Board member and, where applicable, an Executive Committee Member of the other investment management subsidiaries of Mellon Financial Corporation, each of which is an affiliate of the Manager. He is 60 years old and has been an employee of the Manager since May 1995.
| STEPHEN R. BYERS, Executive Vice |
| President since November 2002. |
Chief Investment Officer,Vice Chairman and a director of the Manager, and an officer of 90 investment companies (comprised of 184 portfolios) managed by the Manager. Mr. Byers also is an officer, director or an Executive Committee Member of certain other investment management subsidiaries of Mellon Financial Corporation, each of which is an affiliate of the Manager. He is 52 years old and has been an employee of the Manager since January 2000.
| MARK N. JACOBS, Vice President since |
| March 2000. |
Executive Vice President, Secretary and General Counsel of the Manager, and an officer of 91 investment companies (comprised of 200 portfolios) managed by the Manager. He is 59 years old and has been an employee of the Manager since June 1977.
| MICHAEL A. ROSENBERG, Vice President |
| and Secretary since August 2005. |
Associate General Counsel of the Manager, and an officer of 91 investment companies (comprised of 200 portfolios) managed by the Manager. He is 45 years old and has been an employee of the Manager since October 1991.
| JAMES BITETTO, Vice President and |
| Assistant Secretary since August 2005. |
Assistant General Counsel and Assistant Secretary of the Manager, and an officer of 91 investment companies (comprised of 200 portfolios) managed by the Manager. He is 39 years old and has been an employee of the Manager since December 1996.
| JONI LACKS CHARATAN, Vice President |
| and Assistant Secretary since |
| August 2005. |
Associate General Counsel of the Manager, and an officer of 91 investment companies (comprised of 200 portfolios) managed by the Manager. She is 50 years old and has been an employee of the Manager since October 1988.
| JOSEPH M. CHIOFFI, Vice President and |
| Assistant Secretary since August 2005. |
Assistant General Counsel of the Manager, and an officer of 91 investment companies (comprised of 200 portfolios) managed by the Manager. He is 44 years old and has been an employee of the Manager since June 2000.
| JANETTE E. FARRAGHER, Vice President |
| and Assistant Secretary since |
| August 2005. |
Associate General Counsel of the Manager, and an officer of 91 investment companies (comprised of 200 portfolios) managed by the Manager. She is 43 years old and has been an employee of the Manager since February 1984.
| JOHN B. HAMMALIAN, Vice President and |
| Assistant Secretary since August 2005. |
Associate General Counsel of the Manager, and an officer of 91 investment companies (comprised of 200 portfolios) managed by the Manager. He is 42 years old and has been an employee of the Manager since February 1991.
OFFICERS OF THE FUND (Unaudited) (continued)
| ROBERT R. MULLERY, Vice President and |
| Assistant Secretary since August 2005. |
Associate General Counsel of the Manager, and an officer of 91 investment companies (comprised of 200 portfolios) managed by the Manager. He is 53 years old and has been an employee of the Manager since May 1986.
| JEFF PRUSNOFSKY, Vice President and |
| Assistant Secretary since August 2005. |
Associate General Counsel of the Manager, and an officer of 91 investment companies (comprised of 200 portfolios) managed by the Manager. He is 40 years old and has been an employee of the Manager since October 1990.
| JAMES WINDELS, Treasurer since |
| November 2001. |
Director – Mutual Fund Accounting of the Manager, and an officer of 91 investment companies (comprised of 200 portfolios) managed by the Manager. He is 47 years old and has been an employee of the Manager since April 1985.
| ERIK D. NAVILOFF, Assistant Treasurer |
| since December 2002. |
Senior Accounting Manager – Taxable Fixed Income Funds of the Manager, and an officer of 91 investment companies (comprised of 200 portfolios) managed by the Manager. He is 37 years old and has been an employee of the Manager since November 1992.
| ROBERT ROBOL, Assistant Treasurer |
| since August 2003. |
Senior Accounting Manager – Money Market and Municipal Bond Funds of the Manager, and an officer of 91 investment companies (comprised of 200 portfolios) managed by the Manager. He is 41 years old and has been an employee of the Manager since October 1988.
| ROBERT SVAGNA, Assistant Treasurer |
| since December 2002. |
Senior Accounting Manager – Equity Funds of the Manager, and an officer of 91 investment companies (comprised of 200 portfolios) managed by the Manager. He is 38 years old and has been an employee of the Manager since November 1990.
| GAVIN C. REILLY, Assistant Treasurer |
| since December 2005. |
Tax Manager of the Investment Accounting and Support Department of the Manager, and an officer of 91 investment companies (comprised of 200 portfolios) managed by the Manager. He is 37 years old and has been an employee of the Manager since April 1991.
| JOSEPH W. CONNOLLY, Chief Compliance |
| Officer since October 2004. |
Chief Compliance Officer of the Manager and The Dreyfus Family of Funds (91 investment companies, comprised of 200 portfolios). From November 2001 through March 2004, Mr. Connolly was first Vice-President, Mutual Fund Servicing for Mellon Global Securities Services. In that capacity, Mr. Connolly was responsible for managing Mellon’s Custody, Fund Accounting and Fund Administration services to third-party mutual fund clients. He is 48 years old and has served in various capacities with the Manager since 1980, including manager of the firm’s Fund Accounting Department from 1997 through October 2001.
| WILLIAM GERMENIS, Anti-Money |
| Laundering Compliance Officer since |
| September 2002. |
Vice President and Anti-Money Laundering Compliance Officer of the Distributor, and the Anti-Money Laundering Compliance Officer of 87 investment companies (comprised of 196 portfolios) managed by the Manager. He is 35 years old and has been an employee of the Distributor since October 1998.
34
NOTES
| Dreyfus Variable |
| Investment Fund, |
| Small Company Stock Portfolio |
| 200 Park Avenue |
| New York, NY 10166 |
| |
| Investment Adviser |
| The Dreyfus Corporation |
| 200 Park Avenue |
| New York, NY 10166 |
| |
| Custodian |
| Mellon Bank, N.A. |
| One Mellon Bank Center |
| Pittsburgh, PA 15258 |
| Transfer Agent & |
| Dividend Disbursing Agent |
| Dreyfus Transfer, Inc. |
| 200 Park Avenue |
| New York, NY 10166 |
| |
| Distributor |
| Dreyfus Service Corporation |
| 200 Park Avenue |
| New York, NY 10166 |
Telephone 1-800-554-4611 or 516-338-3300
Mail The Dreyfus Family of Funds, 144 Glenn Curtiss Boulevard, Uniondale, NY 11556-0144 Attn: Institutional Servicing
The portfolio files its complete schedule of portfolio holdings with the Securities and Exchange Commission (“SEC”) for the first and third quarters of each fiscal year on Form N-Q. The portfolio’s Forms N-Q are available on the SEC’s website at http://www.sec.gov and may be reviewed and copied at the SEC’s Public Reference Room in Washington, DC. Information on the operation of the Public Reference Room may be obtained by calling 1-800-SEC-0330.
A description of the policies and procedures that the portfolio uses to determine how to vote proxies relating to portfolio securities, and information regarding how the portfolio voted these proxies for the 12-month period ended June 30, 2005, is available at http://www.dreyfus.com and on the SEC’s website at http://www.sec.gov. The description of the policies and procedures is also available without charge, upon request, by calling 1-800-645-6561.
© 2006 Dreyfus Service Corporation


The views expressed in this report reflect those of the portfolio manager only through the end of the period covered and do not necessarily represent the views of Dreyfus or any other person in the Dreyfus organization.Any such views are subject to change at any time based upon market or other conditions and Dreyfus disclaims any responsibility to update such views. These views may not be relied on as investment advice and, because investment decisions for a Dreyfus portfolio are based on numerous factors, may not be relied on as an indication of trading intent on behalf of any Dreyfus portfolio.
Not FDIC-Insured • Not Bank-Guaranteed • May Lose Value
| | | Contents |
| |
| | | T H E P O R T F O L I O |
| |
|
| 2 | | Letter from the Chairman |
| 3 | | Discussion of Performance |
| 6 | | Portfolio Performance |
| 8 | | Understanding Your Portfolio’s Expenses |
| 8 | | Comparing Your Portfolio’s Expenses |
| | | With Those of Other Funds |
| 9 | | Statement of Investments |
| 14 | | Statement of Assets and Liabilities |
| 15 | | Statement of Operations |
| 16 | | Statement of Changes in Net Assets |
| 18 | | Financial Highlights |
| 20 | | Notes to Financial Statements |
| 26 | | Report of Independent Registered |
| | | Public Accounting Firm |
| 27 | | Important Tax Information |
| 28 | | Board Members Information |
| 30 | | Officers of the Fund |
| | | F O R M O R E I N F O R M AT I O N |
| |
|
| | | Back Cover |
| Dreyfus Variable Investment Fund, |
| Special Value Portfolio |

LETTER FROM THE CHAIRMAN
Dear Shareholder:
We are pleased to present this annual report for Dreyfus Variable Investment Fund, Special Value Portfolio, covering the 12-month period from January 1, 2005, through December 31, 2005. Inside, you’ll find valuable information about how the portfolio was managed during the reporting period, including a discussion with the portfolio managers, Mark G. DeFranco and Brian M. Gillott of Jennison Associates LLC, the portfolio’s sub-investment adviser.
Stocks generally absorbed both good and bad news in 2005 to post modestly positive total returns. On the plus side, an expanding U.S. economy and low inflation helped support corporate earnings in most industry groups. Negative influences included rising short-term interest rates and escalating energy prices, which many analysts feared might erode corporate profits. In addition, hurricanes Katrina, Rita and Wilma disrupted economic activity along the Gulf Coast.
We expect the U.S. economy to continue its moderate expansion in 2006, fueled in part by a rebound in corporate capital spending and exports. The labor market likely will remain relatively strong while inflation should stay low, supporting consumers’ real incomes. Risks in the new year include the possible end of the boom in the housing market, where we believe prices are more likely to stall than plunge.
As always, we encourage you to speak with your financial consultant about how these and other market forces may affect your investments. Thank you for your continued confidence and support.

DISCUSSION OF PERFORMANCE
Mark G. DeFranco and Brian M. Gillott, Portfolio Managers Jennison Associates LLC, Sub-Investment Adviser
How did Dreyfus Variable Investment Fund, Special Value Portfolio perform relative to its benchmark?
For the 12-month period ended December 31, 2005, the portfolio produced total returns of 5.34% for its Initial shares and 5.28% for its Service shares.1 For the same period, the total return of the Russell 1000 Value Index (the “Index”), the portfolio’s benchmark, was 7.05% .2
Despite lackluster performance for much of 2005, value-oriented stocks rallied late in the year as energy prices moderated and investors began to look forward to the end of higher interest rates from the Federal Reserve Board (the “Fed”).Although the portfolio participated in these gains to a substantial degree, its performance relative to the Index primarily was constrained by disappointments among materials stocks in the first half of the year and media stocks during the second half.
What is the portfolio’s investment approach?
The portfolio seeks to maximize total return, consisting of capital appreciation and current income.To pursue this goal, the portfolio normally invests at least 80% of its assets in stocks. The portfolio’s stock investments may include common stocks, preferred stocks and convertible securities of both U.S. and foreign companies of any size, including those purchased in initial public offerings or shortly thereafter.
The portfolio managers seek to identify attractively valued companies with current or emerging earnings growth that may not be fully recognized or appreciated by the market. Generally, there are two types of companies which may exhibit the characteristics the portfolio managers are seeking.The first type is a company that is out of favor with investors but which the portfolio managers expect will experience an improved earnings cycle over the next 12 to 18 months due to corporate restructuring, new product development, an industry cycle turn, increased management focus on shareholder value or improving balance sheet and cash flow. The second type is a company currently delivering good
DISCUSSION OF PERFORMANCE (continued)
|
growth characteristics but which the portfolio managers believe is being mispriced by the market based on short-term earnings results relative to “street” expectations or market uncertainty regarding the sustainability of earnings growth.
What other factors influenced the portfolio’s performance?
Despite a steadily and moderately expanding economy, the overall stock market failed to advance during much of 2005 as investors remained worried about the potentially negative impact of rising interest rates and soaring energy prices on future economic growth. These concerns began to wane in the final months of the year, when energy prices retreated from their post-Katrina peak and the Fed signaled that its credit-tightening campaign might be coming to an end. Generally, stocks rallied as a result, ending 2005 in positive territory.
Rising oil and gas prices helped the energy sector post particularly strong gains. Energy service companies proved to be especially sensitive to higher commodity prices, and the portfolio’s relatively heavy exposure to the industry enabled it to participate fully in its advance. Some of the portfolio’s better-performing energy stocks included global oil services leader Schlumberger and drilling equipment supplier National Oilwell Varco.
The portfolio also held an overweighted position in the technology area, which posted relatively robust returns during the second half of the year. The portfolio achieved especially attractive results from undervalued software companies and semiconductor manufacturers that generated high levels of free cash flow and were expected to benefit from a catalyst for growth. For example, semiconductor manufacturer MEMC Electronic Materials benefited from a shortage in polysilicon, a raw material used to manufacture silicon wafers, and high silicon wafer demand.This enabled it to raise prices. In addition, some individual holdings in the financials area contributed positively to the portfolio’s relative performance. Capital markets firm Lazard benefited from rising mergers-and-acquisitions activity, and disability insurance provider UnumProvident made progress toward reducing expenses and increasing profit margins.
Detractors from the portfolio’s relative performance during 2005 included providers of basic materials, which were hurt by the eroding
effects of higher energy prices on profit margins early in the year. In the consumer discretionary area, traditional media stocks, such as radio syndicator Westwood One and urban programmer Radio One, continued to suffer from disappointing revenues as competition intensified from newer, online marketing vehicles.
What is the portfolio’s current strategy?
While our focus on fundamentally sound, undervalued companies poised for growth has not changed, we recently have found a number of new opportunities.When some of the fund’s energy-related holdings became more richly valued toward year-end, we redeployed assets to companies we considered more attractively priced. However, we have not found a preponderance of opportunities in any one industry or market sector; instead, we have identified stocks meeting our criteria in a variety of industry groups. This suggests to us that we may be entering a market environment that rewards individual security selection over broader sector allocations. In our judgment, our bottom-up, value-oriented investment process may be particularly well suited to a “stock picker’s market.”
January 17, 2006
| | | The portfolio is only available as a funding vehicle under variable life insurance policies or variable |
| | | annuity contracts issued by insurance companies. Individuals may not purchase shares of the |
| | | portfolio directly. A variable annuity is an insurance contract issued by an insurance company that |
| | | enables investors to accumulate assets on a tax-deferred basis for retirement or other long-term |
| | | goals.The investment objective and policies of Dreyfus Variable Investment Fund, Special Value |
| | | Portfolio made available through insurance products may be similar to other funds/portfolios |
| | | managed or advised by Dreyfus. However, the investment results of the portfolio may be higher or |
| | | lower than, and may not be comparable to, those of any other Dreyfus fund/portfolio. |
| 1 | | Total return includes reinvestment of dividends and any capital gains paid. Past performance is no |
| | | guarantee of future results. Share price and investment return fluctuate such that upon redemption, |
| | | portfolio shares may be worth more or less than their original cost.The portfolio’s performance does |
| | | not reflect the deduction of additional charges and expenses imposed in connection with investing |
| | | in variable insurance contracts, which will reduce returns. Return figures provided reflect the |
| | | absorption of certain portfolio expenses by The Dreyfus Corporation pursuant to an agreement in |
| | | effect through December 31, 2006, at which time it may be extended, terminated or modified. |
| | | Had these expenses not been absorbed, the portfolio’s returns would have been lower. |
| | | Part of the portfolio’s recent performance is attributable to positive returns from its initial |
| | | public offering (IPO) investments.There can be no guarantee that IPOs will have or |
| | | continue to have a positive effect on the portfolio’s performance. |
| 2 | | SOURCE: LIPPER INC. — Reflects the reinvestment of dividends and, where applicable, |
| | | capital gain distributions.The Russell 1000 Value Index is an unmanaged index which measures |
| | | the performance of those Russell 1000 companies with lower price-to-book ratios and lower |
| | | forecasted growth values. |
The Portfolio 5
PORTFOLIO PERFORMANCE
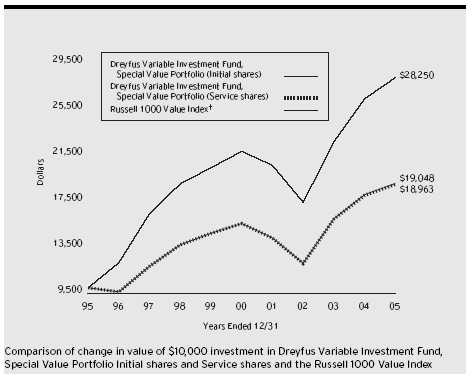
| Average Annual Total Returns as of | | 12/31/05 | | | | |
| |
| | | 1 Year | | 5 Years | | 10 Years |
| |
| |
| |
|
| Initial shares | | 5.34% | | 4.12% | | 6.66% |
| Service shares | | 5.28% | | 4.02% | | 6.61% |
| |
| The data for Service shares includes the results of Initial shares for the period prior to December 31, 2000 |
| (inception date of Service shares). Actual Service shares’ average annual total return and hypothetical growth |
| results would have been lower. See notes below. | | | | | | |
| † Source: Lipper Inc. | | | | | | |
| Past performance is not predictive of future performance.The portfolio’s performance shown in the graph and table does not |
| reflect the deduction of taxes that a shareholder would pay on portfolio distributions or the redemption of portfolio shares. |
| Part of the portfolio’s recent performance is attributable to positive returns from its initial public offering (IPO) investments. |
| There can be no guarantee that IPOs will have or continue to have a positive effect on the portfolio’s performance. |
| The portfolio’s performance does not reflect the deduction of additional charges and expenses imposed in |
| connection with investing in variable insurance contracts which will reduce returns. | | |
| The above graph compares a $10,000 investment made in Initial and Service shares of Dreyfus Variable Investment |
| Fund, Special Value Portfolio on 12/31/95 to a $10,000 investment made in the Russell 1000 Value Index (the |
| “Index”) on that date. | | | | | | |
6
The portfolio’s Initial shares are not subject to a Rule 12b-1 fee.The portfolio’s Service shares are subject to a 0.25% annual Rule 12b-1 fee.The performance figures for Service shares reflect the performance of the portfolio’s Initial shares from their inception date through December 30, 2000, and the performance of the portfolio’s Service shares from December 31, 2000 (inception date of Service shares) to December 31, 2005 (blended performance figures).The performance figures for each share class reflect certain expense reimbursements, without which the performance of each share class would have been lower. In addition, the blended performance figures have not been adjusted to reflect the higher operating expenses of the Service shares. If these expenses had been reflected, the blended performance figures would have been lower. All dividends and capital gain distributions are reinvested.
The portfolio’s performance shown in the line graph takes into account all applicable portfolio fees and expenses (after any expense reimbursements).The Index is an unmanaged index which measures the performance of those Russell 1000 companies with lower price-to-book ratios and lower forecasted growth values.The Index does not take into account charges, fees and other expenses. Further information relating to portfolio performance, including expense reimbursements, if applicable, is contained in the Financial Highlights section of the prospectus and elsewhere in this report.
UNDERSTANDING YOUR PORTFOLIO’S EXPENSES (Unaudited)
As a mutual fund investor,you pay ongoing expenses,such as management fees and other expenses.Using the information below,you can estimate how these expenses affect your investment and compare them with the expenses of other funds.You also may pay one-time transaction expenses,including sales charges (loads) and redemption fees, which are not shown in this section and would have resulted in higher total expenses. For more information, see your portfolio’s prospectus or talk to your financial adviser.
Review your portfolio’s expenses
The table below shows the expenses you would have paid on a $1,000 investment in Dreyfus Variable Investment Fund, Special Value Portfolio from July 1, 2005 to December 31, 2005. It also shows how much a $1,000 investment would be worth at the close of the period, assuming actual returns and expenses.
| Expenses and Value of a $1,000 Investment | | |
| assuming actual returns for the six months ended December 31, 2005 |
| | | Initial Shares | | Service Shares |
| |
| |
|
| Expenses paid per $1,000 † | | $ 4.93 | | $ 5.25 |
| Ending value (after expenses) | | $1,081.60 | | $1,081.80 |
COMPARING YOUR PORTFOLIO’S EXPENSES WITH THOSE OF OTHER FUNDS (Unaudited)
Using the SEC’s method to compare expenses
The Securities and Exchange Commission (SEC) has established guidelines to help investors assess fund expenses. Per these guidelines, the table below shows your portfolio’s expenses based on a $1,000 investment, assuming a hypothetical 5% annualized return. You can use this information to compare the ongoing expenses (but not transaction expenses or total cost) of investing in the portfolio with those of other funds. All mutual fund shareholder reports will provide this information to help you make this comparison. Please note that you cannot use this information to estimate your actual ending account balance and expenses paid during the period.
Expenses and Value of a $1,000 Investment assuming a hypothetical 5% annualized return for the six months ended December 31, 2005
| | | Initial Shares | | Service Shares |
| |
| |
|
| Expenses paid per $1,000 † | | $ 4.79 | | $ 5.09 |
| Ending value (after expenses) | | $1,020.47 | | $1,020.16 |
| † Expenses are equal to the portfolio’s annualized expense ratio of .94% for Initial shares and 1.00% for Service shares, |
| multiplied by the average account value over the period, multiplied by 184/365 (to reflect the one-half year period). |
STATEMENT OF INVESTMENTS
December 31, 2005
|
| Common Stocks—97.8% | | Shares | | Value ($) |
| |
| |
|
| Aerospace & Defense—.7% | | | | |
| Empresa Brasileira de Aeronautica, ADR | | 5,600 | | 218,960 |
| Biotechnology—1.1% | | | | |
| Human Genome Sciences | | 13,000 a | | 111,280 |
| Medimmune | | 6,200 a | | 217,124 |
| | | | | 328,404 |
| Capital Markets—6.3% | | | | |
| Bank of New York | | 8,200 | | 261,170 |
| Charles Schwab | | 39,700 | | 582,399 |
| Lazard, Cl. A | | 15,100 | | 481,690 |
| Nuveen Investments, Cl. A | | 13,500 | | 575,370 |
| | | | | 1,900,629 |
| Capital Spending—1.4% | | | | |
| Allied Waste Industries | | 48,300 a | | 422,142 |
| Chemicals—5.5% | | | | |
| E I Du Pont de Nemours & Co. | | 15,300 | | 650,250 |
| Huntsman | | 15,500 a | | 266,910 |
| Nalco Holding | | 25,000 a | | 442,750 |
| Rockwood Holdings | | 14,800 a | | 292,004 |
| | | | | 1,651,914 |
| Commercial & Professional Services—4.3% | | |
| Aramark, Cl. B | | 17,100 | | 475,038 |
| Manpower | | 13,500 | | 627,750 |
| Navigant Consulting | | 8,100 a | | 178,038 |
| | | | | 1,280,826 |
| Commercial Banking—1.6% | | | | |
| Royal Bank of Scotland Group | | 15,826 | | 477,751 |
| Communications Equipment—2.4% | | | | |
| Nokia, ADR | | 39,900 | | 730,170 |
| Containers—1.1% | | | | |
| Packaging Corp. of America | | 4,300 | | 98,685 |
| Temple-Inland | | 5,100 | | 228,735 |
| | | | | 327,420 |
| Diversified Financial Services—1.2% | | | | |
| JPMorgan Chase & Co. | | 9,336 | | 370,546 |
STATEMENT OF INVESTMENTS (continued)
|
| Common Stocks (continued) | | Shares | | Value ($) |
| |
| |
|
| Diversified Telecommunications—2.6% | | | | |
| Citizens Communications | | 36,500 | | 446,395 |
| IDT, Cl. B | | 27,800 a | | 325,260 |
| | | | | 771,655 |
| Electronic Equipment—.0% | | | | |
| Agilent Technologies | | 395 a | | 13,150 |
| Electronic Technology—1.0% | | | | |
| Intel | | 11,800 | | 294,528 |
| Energy Equipment & Services—6.0% | | | | |
| BJ Services | | 8,800 | | 322,696 |
| Rowan Cos. | | 9,300 | | 331,452 |
| Schlumberger | | 4,600 | | 446,890 |
| TXU | | 6,600 | | 331,254 |
| Weatherford International | | 10,400 a | | 376,480 |
| | | | | 1,808,772 |
| Food Retail—5.3% | | | | |
| Cadbury Schweppes | | 45,300 | | 428,173 |
| Kroger | | 35,400 a | | 668,352 |
| Performance Food Group | | 17,200 a | | 487,964 |
| | | | | 1,584,489 |
| Health Care—2.4% | | | | |
| Community Health Systems | | 9,100 a | | 348,894 |
| Medco Health Solutions | | 5,800 a | | 323,640 |
| Tenet Healthcare | | 6,100 a | | 46,726 |
| | | | | 719,260 |
| Hotels, Restaurants & Leisure—3.9% | | | | |
| Alliance Gaming | | 15,600 a | | 203,112 |
| GTECH Holdings | | 15,000 | | 476,100 |
| Pinnacle Entertainment | | 19,800 a | | 489,258 |
| | | | | 1,168,470 |
| Insurance—7.8% | | | | |
| American International Group | | 11,900 | | 811,937 |
| Axis Capital Holdings | | 16,800 | | 525,504 |
| Benfield Group | | 45,100 | | 279,275 |
| Common Stocks (continued) | | Shares | | | | Value ($) |
| |
| |
| |
|
| Insurance (continued) | | | | | | |
| Montpelier Re Holdings | | 16,900 | | | | 319,410 |
| UnumProvident | | 18,000 | | | | 409,500 |
| | | | | | | 2,345,626 |
| Internet—3.0% | | | | | | |
| Expedia | | 14,100 a | | | | 337,836 |
| IAC/InterActiveCorp | | 20,100 a | | | | 569,031 |
| | | | | | | 906,867 |
| IT Consulting & Services—.6% | | | | | | |
| Hewitt Associates, Cl. A | | 6,700 a | | | | 187,667 |
| Machinery—2.3% | | | | | | |
| Dover | | 13,600 | | | | 550,664 |
| Navistar International | | 4,800 a | | | | 137,376 |
| | | | | | | 688,040 |
| Media—9.7% | | | | | | |
| Discovery Holding, Cl. A | | 26,200 a | | | | 396,930 |
| Gemstar-TV Guide International | | 126,900 a | | | | 331,209 |
| Pearson, ADR | | 48,900 | | | | 580,443 |
| Radio One, Cl. D | | 41,800 a | | | | 432,630 |
| Viacom, Cl. B | | 20,574 a | | | | 670,712 |
| VNU | | 11,000 | | | | 364,433 |
| Westwood One | | 9,300 | | | | 151,590 |
| | | | | | | 2,927,947 |
| Mining & Metals—1.9% | | | | | | |
| Alcoa | | 11,300 | | | | 334,141 |
| Harmony Gold Mining, ADR | | 18,400 a | | | | 240,120 |
| | | | | | | 574,261 |
| Oil & Gas—1.0% | | | | | | |
| Occidental Petroleum | | 3,900 | | | | 311,532 |
| Paper & Forest Products—1.7% | | | | | | |
| MeadWestvaco | | 18,500 | | | | 518,555 |
| Pharmaceutical—8.8% | | | | | | |
| Abbott Laboratories | | 10,200 | | | | 402,186 |
| Andrx | | 17,100 a | | | | 281,637 |
STATEMENT OF INVESTMENTS (continued)
|
| Common Stocks (continued) | | Shares | | Value ($) |
| |
| |
|
| Pharmaceutical (continued) | | | | |
| Eli Lilly & Co. | | 5,700 | | 322,563 |
| ImClone Systems | | 6,200 a | | 212,288 |
| Pfizer | | 20,500 | | 478,060 |
| Sanofi-Aventis | | 5,100 | | 446,389 |
| Watson Pharmaceuticals | | 15,600 a | | 507,156 |
| | | | | 2,650,279 |
| Railroads—2.3% | | | | |
| CSX | | 13,300 | | 675,241 |
| Schools—1.7% | | | | |
| DeVry | | 9,900 a | | 198,000 |
| Education Management | | 9,700 a | | 325,047 |
| | | | | 523,047 |
| Semiconductors & Equipment—.5% | | |
| MEMC Electronic Materials | | 6,900 a | | 152,973 |
| Software—6.7% | | | | |
| BEA Systems | | 40,500 a | | 380,700 |
| Computer Associates International | | 13,900 | | 391,841 |
| Manhattan Associates | | 18,300 a | | 374,784 |
| Microsoft | | 27,400 | | 716,510 |
| TIBCO Software | | 21,800 a | | 162,846 |
| | | | | 2,026,681 |
| Specialty Retail/Stores—.6% | | | | |
| Blockbuster, Cl. A | | 50,100 | | 187,875 |
| Utilities—2.4% | | | | |
| Aquila | | 54,200 a | | 195,120 |
| Sempra Energy | | 11,800 | | 529,112 |
| | | | | 724,232 |
| Total Common Stocks | | | | |
| (cost $27,013,191) | | | | 29,469,909 |
| Other Investment—2.0% | | | | Shares | | Value ($) |
| |
| |
| |
|
| Registered Investment Company; | | | | |
| Dreyfus Institutional Preferred Plus Money Market Fund | | |
| (cost $586,000) | | | | 586,000 b | | 586,000 |
| |
| |
| |
|
| |
| Total Investments (cost $27,599,191) | | 99.8% | | 30,055,909 |
| Cash and Receivables (Net) | | | | .2% | | 71,193 |
| Net Assets | | | | 100.0% | | 30,127,102 |
| |
| ADR—American Depository Receipts. | | | | |
| a | | Non-income producing. | | | | | | |
| b | | Investment in affiliated money market mutual fund. | | | | |
| |
| |
| |
|
| |
| |
| |
| |
| Portfolio Summary † | | | | | | |
| | | | | Value (%) | | | | Value (%) |
| |
| |
| |
| |
|
| Media | | 9.7 | | Chemicals | | 5.5 |
| Pharmaceutical | | 8.8 | | Food Retail | | 5.3 |
| Insurance | | 7.8 | | Commercial & | | |
| Software | | 6.7 | | Professional Services | | 4.3 |
| Capital Markets | | 6.3 | | Other | | 39.4 |
| Energy Equipment & Services | | 6.0 | | | | 99.8 |
| |
| † | | Based on net assets. | | | | | | |
| See notes to financial statements. | | | | | | |
STATEMENT OF ASSETS AND LIABILITIES
December 31, 2005
|
| | | Cost | | Value |
| |
| |
|
| Assets ($): | | | | |
| Investments in securities—See Statement of Investments | | |
| Unaffiliated issuers | | 27,013,191 | | 29,469,909 |
| Affiliated issuers | | 586,000 | | 586,000 |
| Cash | | | | 30,665 |
| Receivable for investment securities sold | | 155,282 |
| Dividends receivable | | | | 19,249 |
| | | | | 30,261,105 |
| |
| |
|
| Liabilities ($): | | | | |
| Due to The Dreyfus Corporation and affiliates—Note 3(b) | | 25,307 |
| Payable for investment securities purchased | | 71,237 |
| Payable for shares of Beneficial Interest redeemed | | 3,340 |
| Accrued expenses | | | | 34,119 |
| | | | | 134,003 |
| |
| |
|
| Net Assets ($) | | | | 30,127,102 |
| |
| |
|
| Composition of Net Assets ($): | | | | |
| Paid-in capital | | | | 23,960,181 |
| Accumulated undistributed investment income—net | | 147,483 |
| Accumulated net realized gain (loss) on investments | | 3,562,720 |
| Accumulated net unrealized appreciation | | |
| (depreciation) on investments | | | | 2,456,718 |
| |
| |
|
| Net Assets ($) | | | | 30,127,102 |
| |
| |
|
| |
| |
| Net Asset Value Per Share | | | | |
| | | Initial Shares | | Service Shares |
| |
| |
|
| Net Assets ($) | | 24,926,196 | | 5,200,906 |
| Shares Outstanding | | 1,663,637 | | 348,123 |
| |
| |
|
| Net Asset Value Per Share ($) | | 14.98 | | 14.94 |
See notes to financial statements.
|
STATEMENT OF OPERATIONS
Year Ended December 31, 2005
|
| Investment Income ($): | | |
| Income: | | |
| Cash dividends (net of $4,803 foreign taxes withheld at source): | | |
| Unaffiliated issuers | | 401,840 |
| Affiliated issuers | | 41,756 |
| Total Income | | 443,596 |
| Expenses: | | |
| Investment advisory fee—Note 3(a) | | 234,656 |
| Auditing fees | | 26,763 |
| Custodian fees | | 12,525 |
| Distribution fees—Note 3(b) | | 12,485 |
| Prospectus and shareholders’ reports | | 11,413 |
| Trustees’ fees and expenses—Note 3(c) | | 2,547 |
| Shareholder servicing costs—Note 3(b) | | 1,079 |
| Legal fees | | 1,074 |
| Miscellaneous | | 5,065 |
| Total Expenses | | 307,607 |
| Less—waiver of fees due to undertaking—Note 3(a) | | (11,890) |
| Less—reduction in custody fees due to earnings credits—Note 1(c) | | (7) |
| Net Expenses | | 295,710 |
| Investment Income—Net | | 147,886 |
| |
|
| Realized and Unrealized Gain (Loss) on Investments—Note 4 ($): |
| Net realized gain (loss) on investments and foreign currency transactions | | 3,663,489 |
| Net unrealized appreciation (depreciation) on investments | | (2,280,297) |
| Net Realized and Unrealized Gain (Loss) on Investments | | 1,383,192 |
| Net Increase in Net Assets Resulting from Operations | | 1,531,078 |
See notes to financial statements.
|
STATEMENT OF CHANGES IN NET ASSETS
| | | Year Ended December 31, |
| |
|
| | | 2005 | | 2004 |
| |
| |
|
| Operations ($): | | | | |
| Investment income—net | | 147,886 | | 171,248 |
| Net realized gain (loss) on investments | | 3,663,489 | | 4,777,637 |
| Net unrealized appreciation | | | | |
| (depreciation) on investments | | (2,280,297) | | (866,908) |
| Net Increase (Decrease) in Net Assets | | | | |
| Resulting from Operations | | 1,531,078 | | 4,081,977 |
| |
| |
|
| Dividends to Shareholders from ($): | | | | |
| Investment income—net: | | | | |
| Initial shares | | (33,620) | | (178,813) |
| Service shares | | (2,523) | | (28,674) |
| Net realized gain on investments: | | | | |
| Initial shares | | (720,459) | | (2,756,165) |
| Service shares | | (131,069) | | (507,560) |
| Total Dividends | | (887,671) | | (3,471,212) |
| |
| |
|
| Beneficial Interest Transactions ($): | | | | |
| Net proceeds from shares sold: | | | | |
| Initial shares | | 1,498,805 | | 1,068,137 |
| Service shares | | 771,389 | | 713,100 |
| Dividends reinvested: | | | | |
| Initial shares | | 754,079 | | 2,934,978 |
| Service shares | | 133,592 | | 536,234 |
| Cost of shares redeemed: | | | | |
| Initial shares | | (6,803,276) | | (7,150,023) |
| Service shares | | (1,135,216) | | (1,201,875) |
| Increase (Decrease) in Net Assets from | | | | |
| Beneficial Interest Transactions | | (4,780,627) | | (3,099,449) |
| Total Increase (Decrease) in Net Assets | | (4,137,220) | | (2,488,684) |
| |
| |
|
| Net Assets ($): | | | | |
| Beginning of Period | | 34,264,322 | | 36,753,006 |
| End of Period | | 30,127,102 | | 34,264,322 |
| Undistributed investment income—net | | 147,483 | | 35,889 |
| | | Year Ended December 31, |
| |
|
| | | 2005 | | 2004 |
| |
| |
|
| Capital Share Transactions: | | | | |
| Initial Shares | | | | |
| Shares sold | | 105,018 | | 71,441 |
| Shares issued for dividends reinvested | | 54,683 | | 200,454 |
| Shares redeemed | | (475,011) | | (485,958) |
| Net Increase (Decrease) in Shares Outstanding | | (315,310) | | (214,063) |
| |
| |
|
| Service Shares | | | | |
| Shares sold | | 54,193 | | 48,492 |
| Shares issued for dividends reinvested | | 9,716 | | 36,724 |
| Shares redeemed | | (80,214) | | (82,737) |
| Net Increase (Decrease) in Shares Outstanding | | (16,305) | | 2,479 |
See notes to financial statements.
|
FINANCIAL HIGHLIGHTS
The following tables describe the performance for each share class for the fiscal periods indicated. All information (except portfolio turnover rate) reflects financial results for a single portfolio share.Total return shows how much your investment in the portfolio would have increased (or decreased) during each period, assuming you had reinvested all dividends and distributions.These figures have been derived from the portfolio’s financial statements.
| | | | | Year Ended December 31, | | |
| |
| |
| |
|
| Initial Shares | | 2005 | | 2004 | | 2003 | | 2002 | | 2001 |
| |
| |
| |
| |
| |
|
| Per Share Data ($): | | | | | | | | | | |
| Net asset value, beginning of period | | 14.63 | | 14.39 | | 11.04 | | 13.07 | | 14.65 |
| Investment Operations: | | | | | | | | | | |
| Investment income—net a | | .07 | | .07 | | .03 | | .10 | | .14 |
| Net realized and unrealized | | | | | | | | | | |
| gain (loss) on investments | | .68 | | 1.82 | | 3.43 | | (2.09) | | (1.30) |
| Total from Investment Operations | | .75 | | 1.89 | | 3.46 | | (1.99) | | (1.16) |
| Distributions: | | | | | | | | | | |
| Dividends from investment income—net | | (.02) | | (.10) | | (.11) | | (.04) | | (.11) |
| Dividends from net realized | | | | | | | | | | |
| gain on investments | | (.38) | | (1.55) | | — | | — | | (.31) |
| Total Distributions | | (.40) | | (1.65) | | (.11) | | (.04) | | (.42) |
| Net asset value, end of period | | 14.98 | | 14.63 | | 14.39 | | 11.04 | | 13.07 |
| |
| |
| |
| |
| |
|
| Total Return (%) | | 5.34 | | 13.08 | | 31.74 | | (15.28) | | (7.97) |
| |
| |
| |
| |
| |
|
| Ratios/Supplemental Data (%): | | | | | | | | | | |
| Ratio of total expenses | | | | | | | | | | |
| to average net assets | | .94 | | .93 | | 1.01 | | .99 | | .91 |
| Ratio of net expenses | | | | | | | | | | |
| to average net assets | | .93 | | .91 | | .97 | | .92 | | .90 |
| Ratio of net investment income | | | | | | | | | | |
| to average net assets | | .48 | | .50 | | .23 | | .81 | | 1.00 |
| Portfolio Turnover Rate | | 83.27 | | 90.27 | | 108.01 | | 148.29 | | 59.85 |
| |
| |
| |
| |
| |
|
| Net Assets, end of period ($ x 1,000) | | 24,926 | | 28,949 | | 31,557 | | 27,255 | | 39,854 |
| |
| a Based on average shares outstanding at each month end. | | | | | | | | |
| See notes to financial statements. | | | | | | | | | | |
| | | | | Year Ended December 31, | | |
| |
| |
| |
|
| Service Shares | | 2005 | | 2004 | | 2003 | | 2002 | | 2001 |
| |
| |
| |
| |
| |
|
| Per Share Data ($): | | | | | | | | | | |
| Net asset value, beginning of period | | 14.59 | | 14.36 | | 11.02 | | 13.05 | | 14.65 |
| Investment Operations: | | | | | | | | | | |
| Investment income—net a | | .06 | | .06 | | .02 | | .08 | | .12 |
| Net realized and unrealized | | | | | | | | | | |
| gain (loss) on investments | | .68 | | 1.80 | | 3.43 | | (2.07) | | (1.31) |
| Total from Investment Operations | | .74 | | 1.86 | | 3.45 | | (1.99) | | (1.19) |
| Distributions: | | | | | | | | | | |
| Dividends from investment income—net | | (.01) | | (.08) | | (.11) | | (.04) | | (.10) |
| Dividends from net realized | | | | | | | | | | |
| gain on investments | | (.38) | | (1.55) | | — | | — | | (.31) |
| Total Distributions | | (.39) | | (1.63) | | (.11) | | (.04) | | (.41) |
| Net asset value, end of period | | 14.94 | | 14.59 | | 14.36 | | 11.02 | | 13.05 |
| |
| |
| |
| |
| |
|
| Total Return (%) | | 5.28 | | 12.96 | | 31.71 | | (15.32) | | (8.17) |
| |
| |
| |
| |
| |
|
| Ratios/Supplemental Data (%): | | | | | | | | | | |
| Ratio of total expenses | | | | | | | | | | |
| to average net assets | | 1.19 | | 1.18 | | 1.27 | | 1.26 | | 1.24 |
| Ratio of net expenses | | | | | | | | | | |
| to average net assets | | 1.00 | | 1.00 | | 1.00 | | .99 | | 1.00 |
| Ratio of net investment income | | | | | | | | | | |
| to average net assets | | .41 | | .42 | | .21 | | .69 | | .92 |
| Portfolio Turnover Rate | | 83.27 | | 90.27 | | 108.01 | | 148.29 | | 59.85 |
| |
| |
| |
| |
| |
|
| Net Assets, end of period ($ x 1,000) | | 5,201 | | 5,316 | | 5,196 | | 3,910 | | 2,585 |
| |
| a Based on average shares outstanding at each month end. | | | | | | | | |
| See notes to financial statements. | | | | | | | | | | |
NOTES TO FINANCIAL STATEMENTS
NOTE 1—Significant Accounting Policies:
Dreyfus Variable Investment Fund (the “fund”) is registered under the Investment Company Act of 1940, as amended (the “Act”), as an open-end management investment company, operating as a series company currently offering twelve series, including the Special Value Portfolio (the “portfolio”).The portfolio is only offered to separate accounts established by insurance companies to fund variable annuity contracts and variable life insurance policies.The portfolio is a diversified series.The portfolio’s investment objective is to maximize total return, consisting of capital appreciation and current income. The Dreyfus Corporation (the “Manager” or “Dreyfus”) serves as the portfolio’s investment adviser. Dreyfus is a wholly-owned subsidiary of Mellon Financial Corporation (“Mellon Financial”). Jennison Associates LLC (“Jennison”) serves as the portfolio’s sub-investment adviser.
Dreyfus Service Corporation (the “Distributor”), a wholly-owned subsidiary of Dreyfus, is the distributor of the portfolio’s shares, which are sold without a sales charge.The portfolio is authorized to issue an unlimited number of $.001 par value shares of Beneficial Interest in each of the following classes of shares: Initial and Service. Each class of shares has identical rights and privileges, except with respect to the distribution plan and the expenses borne by each class and certain voting rights. Income, expenses (other than expenses attributable to a specific class), and realized and unrealized gains or losses on investments are allocated to each class of shares based on its relative net assets.
The fund accounts separately for the assets, liabilities and operations of each series. Expenses directly attributable to each series are charged to that series’ operations; expenses which are applicable to all series are allocated among them on a pro rata basis.
The portfolio’s financial statements are prepared in accordance with U.S. generally accepted accounting principles, which may require the use of management estimates and assumptions.Actual results could differ from those estimates.
The fund enters into contracts that contain a variety of indemnifica-tions.The portfolio’s maximum exposure under these arrangements is unknown. The portfolio does not anticipate recognizing any loss related to these arrangements.
(a) Portfolio valuation: Investments in securities are valued at the last sales price on the securities exchange or national securities market on which such securities are primarily traded. Securities listed on the National Market System for which market quotations are available are valued at the official closing price or, if there is no official closing price that day, at the last sales price. Securities not listed on an exchange or the national securities market, or securities for which there were no transactions, are valued at the average of the most recent bid and asked prices, except for open short positions, where the asked price is used for valuation purposes. Bid price is used when no asked price is available. Investments in registered investment companies are valued at their net asset value. When market quotations or official closing prices are not readily available, or are determined not to reflect accurately fair value, such as when the value of a security has been significantly affected by events after the close of the exchange or market on which the security is principally traded (for example, a foreign exchange or market), but before the portfolio calculates its net asset value, the portfolio may value these investments at fair value as determined in accordance with the procedures approved by the Board of Trustees. Fair valuing of securities may be determined with the assistance of a pricing service using calculations based on indices of domestic securities and other appropriate indicators, such as prices of relevant ADR’s and futures contracts. For other securities that are fair valued by the Board of Trustees, certain factors may be considered such as: fundamental analytical data, the nature and duration of restrictions on disposition, an evaluation of the forces that influence the market in which the securities are purchased and sold, and public trading in similar securities of the issuer or comparable issuers. Financial futures are valued at the last sales price.
NOTES TO FINANCIAL STATEMENTS (continued)
|
(b) Foreign currency transactions: The portfolio does not isolate that portion of the results of operations resulting from changes in foreign exchange rates on investments from the fluctuations arising from changes in market prices of securities held. Such fluctuations are included with the net realized and unrealized gain or loss on investments.
Net realized foreign exchange gains or losses arise from sales and maturities of short-term securities, sales of foreign currencies, currency gains or losses realized on securities transactions and the difference between the amounts of dividends, interest and foreign withholding taxes recorded on the portfolio’s books and the U.S. dollar equivalent of the amounts actually received or paid. Net unrealized foreign exchange gains or losses arise from changes in the value of assets and liabilities other than investments in securities, resulting from changes in exchange rates. Such gains and losses are included with net realized and unrealized gain or loss on investments.
(c) Securities transactions and investment income: Securities transactions are recorded on a trade date basis. Realized gain and loss from securities transactions are recorded on the identified cost basis. Dividend income is recognized on the ex-dividend date and interest income, including, where applicable, accretion of discount and amortization of premium on investments, is recognized on the accrual basis.
The portfolio has an arrangement with the custodian bank whereby the portfolio receives earnings credits from the custodian when positive cash balances are maintained, which are used to offset custody fees. For financial reporting purposes, the portfolio includes net earnings credits as an expense offset in the Statement of Operations.
(d) Affiliated issuers: Investments in other investment companies advised by Dreyfus are defined as “affiliated” in the Act.
(e) Dividends to shareholders: Dividends are recorded on the ex-dividend date. Dividends from investment income-net and dividends from net realized capital gain,if any,are normally declared and paid annually, but the portfolio may make distributions on a more frequent basis to comply with the distribution requirements of the Internal Revenue Code of 1986, as amended (the “Code”).To the extent that net realized
capital gain can be offset by capital loss carryovers, if any, it is the policy of the portfolio not to distribute such gain. Income and capital gain distributions are determined in accordance with income tax regulations, which may differ from U.S. generally accepted accounting principles.
(f) Federal income taxes: It is the policy of the portfolio to continue to qualify as a regulated investment company, if such qualification is in the best interests of its shareholders, by complying with the applicable provisions of the Code, and to make distributions of taxable income sufficient to relieve it from substantially all federal income and excise taxes.
At December 31, 2005, the components of accumulated earnings on a tax basis were as follows: undistributed ordinary income $1,850,610, undistributed capital gains $1,959,772 and unrealized appreciation $2,356,539.
The tax character of distributions paid to shareholders during the fiscal periods ended December 31, 2005 and December 31, 2004, were as follows: ordinary income $475,265 and $1,237,803 and long-term capital gains $412,406 and $2,233,409.
During the period ended December 31, 2005, as a result of permanent book to tax differences, primarily due to the tax treatment for foreign currency gains and losses, the fund decreased accumulated undistributed investment income-net by $149 and increased accumulated net realized gain (loss) on investments by the same amount. Net assets were not affected by this reclassification.
NOTE 2—Bank Lines of Credit:
The portfolio may borrow up to $5 million for leveraging purposes under a short-term unsecured line of credit and participates with other Dreyfus managed funds in a $100 million unsecured line of credit primarily to be utilized for temporary or emergency purposes including the financing of redemptions. Interest is charged to the portfolio based on prevailing market rates in effect at the time of borrowing. During the period ended December 31, 2005, the portfolio did not borrow under either line of credit.
NOTES TO FINANCIAL STATEMENTS (continued)
|
NOTE 3—Investment Advisory Fee and Other Transactions With Affiliates:
(a) Pursuant to an Investment Advisory Agreement with Dreyfus, the investment advisory fee is computed at the annual rate of .75% of the value of the portfolio’s average daily net assets and is payable monthly.
Pursuant to a Sub-Investment Advisory Agreement between Dreyfus and Jennison, the sub-investment advisory fee is payable monthly by Dreyfus, and is based upon the value of the portfolio’s average daily net assets, computed at the following annual rates: .50% of the first $300 million and .45% over $300 million.
Dreyfus has agreed, from January 1, 2005 to December 31, 2006 to waive receipt of its fees and/or assume the expenses of the portfolio so that the expenses of neither class, exclusive of taxes, brokerage commissions, interest expense and extraordinary expenses, exceed 1% of the value of the average daily net assets of their class. During the period ended December 31, 2005, Dreyfus waived receipt of fees of $11,890, pursuant to the undertaking.
(b) Under the Distribution Plan (the “Plan”) adopted pursuant to Rule 12b-1 under the Act, Service shares pay the Distributor for distributing their shares, for servicing and/or maintaining Service shares shareholder accounts and for advertising and marketing for Service shares.The Plan provides for payments to be made at an annual rate of .25% of the value of the Service shares’ average daily net assets.The Distributor may make payments to Participating Insurance Companies and to brokers and dealers acting as principal underwriter for their variable insurance products.The fees payable under the Plan are payable without regard to actual expenses incurred. During the period ended December 31, 2005, Service shares were charged $12,485 pursuant to the Plan.
The portfolio compensates Dreyfus Transfer, Inc., a wholly-owned subsidiary of Dreyfus, under a transfer agency agreement for providing personnel and facilities to perform transfer agency services for the portfolio. During the period ended December 31, 2005, the portfolio was charged $64 pursuant to the transfer agency agreement.
During the period ended December 31, 2005, the portfolio was charged $3,762 for services performed by the Chief Compliance Officer.
The components of Due to The Dreyfus Corporation and affiliates in the Statement of Assets and Liabilities consist of: investment advisory fees $19,505, Rule 12b-1 distribution plan fees $1,122, custodian fees $3,463, chief compliance officer fees $1,858 and transfer agency per account fees $5, which are offset against an expense reimbursement currently in effect in the amount of $646.
(c) Each Board member also serves as a Board member of other funds within the Dreyfus complex. Annual retainer fees and attendance fees are allocated to each fund based on net assets.
(d) Pursuant to an exemptive order from the Securities and Exchange Commission, the portfolio may invest its available cash balances in affiliated money market mutual funds. Management fees of the underlying money market mutual funds have been waived by Dreyfus.
NOTE 4—Securities Transactions:
The aggregate amount of purchases and sales of investment securities, excluding short-term securities, during the period ended December 31, 2005, amounted to $25,028,774 and $28,871,498, respectively.
At December 31, 2005, the cost of investments for federal income tax purposes was $27,699,370; accordingly, accumulated net unrealized appreciation on investments was $2,356,539, consisting of $3,574,894 gross unrealized appreciation and $1,218,355 gross unrealized depreciation.
REPORT OF INDEPENDENT REGISTERED PUBLIC ACCOUNTING FIRM
Shareholders and Board of Trustees
Dreyfus Variable Investment Fund, Special Value Portfolio
We have audited the accompanying statement of assets and liabilities, including the statement of investments, of Dreyfus Variable Investment Fund, Special Value Portfolio (one of the funds comprising Dreyfus Variable Investment Fund) as of December 31, 2005, and the related statement of operations for the year then ended, the statement of changes in net assets for each of the two years in the period then ended, and financial highlights for each of the years indicated therein. These financial statements and financial highlights are the responsibility of the Fund’s management. Our responsibility is to express an opinion on these financial statements and financial highlights based on our audits.
We conducted our audits in accordance with the standards of the Public Company Accounting Oversight Board (United States).Those standards require that we plan and perform the audit to obtain reasonable assurance about whether the financial statements and financial highlights are free of material misstatement.We were not engaged to perform an audit of the Fund’s internal control over financial reporting. Our audits included consideration of internal control over financial reporting as a basis for designing audit procedures that are appropriate in the circumstances, but not for the purpose of expressing an opinion on the effectiveness of the Fund’s internal control over financial reporting. Accordingly, we express no such opinion.An audit also includes examining, on a test basis, evidence supporting the amounts and disclosures in the financial statements and financial highlights, assessing the accounting principles used and significant estimates made by management, and evaluating the overall financial statement presentation. Our procedures included confirmation of securities owned as of December 31, 2005 by correspondence with the custodian and others or by other appropriate auditing procedures where replies from others were not received. We believe that our audits provide a reasonable basis for our opinion.
In our opinion, the financial statements and financial highlights referred to above present fairly, in all material respects, the financial position of Dreyfus Variable Investment Fund, Special Value Portfolio at December 31, 2005, the results of its operations for the year then ended, the changes in its net assets for each of the two years in the period then ended, and the financial highlights for each of the indicated years, in conformity with U.S. generally accepted accounting principles.
New York, New York
February 6, 2006
|
IMPORTANT TAX INFORMATION (Unaudited)
For federal tax purposes, the portfolio hereby designates $.1837 per share as a long-term capital gain distribution paid on March 31, 2005 and also the fund hereby designates 25.87% of the ordinary dividends paid during the fiscal year ended December 31, 2005 as qualifying for the corporate dividends received deduction. Shareholders will receive notification in January 2006 of the percentage applicable to the preparation of their 2005 income tax returns.
| BOARD MEMBERS INFORMATION (Unaudited) |
| |
| |
| |
| Joseph S. DiMartino (62) |
| Chairman of the Board (1995) |
| Principal Occupation During Past 5 Years: |
| • Corporate Director and Trustee |
| Other Board Memberships and Affiliations: |
| • The Muscular Dystrophy Association, Director |
| • Levcor International, Inc., an apparel fabric processor, Director |
| • Century Business Services, Inc., a provider of outsourcing functions for small and medium size |
| companies, Director |
| • The Newark Group, a provider of a national market of paper recovery facilities, paperboard |
| mills and paperboard converting plants, Director |
| • Sunair Services Corporation, engages in the design, manufacture and sale of high frequency |
| systems for long-range voice and data communications, as well as providing certain outdoor- |
| related services to homes and businesses, Director |
| No. of Portfolios for which Board Member Serves: 193 |
| ——————— |
| David P. Feldman (66) |
| Board Member (1994) |
| Principal Occupation During Past 5 Years: |
| • Corporate Director and Trustee |
| Other Board Memberships and Affiliations: |
| • BBH Mutual Funds Group (11 funds), Director |
| • The Jeffrey Company, a private investment company, Director |
| • QMED, a medical device company, Director |
| No. of Portfolios for which Board Member Serves: 58 |
| ——————— |
| James F. Henry (75) |
| Board Member (1991) |
| Principal Occupation During Past 5 Years: |
| • President, CPR Institute for Dispute Resolution, a non-profit organization principally |
| engaged in the development of alternatives to business litigation (Retired 2003) |
| No. of Portfolios for which Board Member Serves: 22 |
28
| Dr. Paul A. Marks (79) |
| Board Member (1990) |
| Principal Occupation During Past 5 Years: |
| • President, Emeritus (2000-present) and President and Chief Executive Officer of Memorial |
| Sloan-Kettering Cancer Center (Retired 1999) |
| Other Board Memberships and Affiliations: |
| • Pfizer, Inc., a pharmaceutical company, Director-Emeritus |
| • Lazard Freres & Company, LLC, Senior Adviser |
| • Carrot Capital Health Care Ventures; Advisor |
| • Armgo-Start-Up Biotech; Board of Directors |
| • Nanoviricide, Board Director |
| • PTC, Scientific Advisory Board |
| No. of Portfolios for which Board Member Serves: 22 |
| ——————— |
| Dr. Martin Peretz (66) |
| Board Member (1990) |
| Principal Occupation During Past 5 Years: |
| • Editor-in-Chief of The New Republic Magazine |
| • Lecturer in Social Studies at Harvard University (1965-2001) |
| • Co-Chairman of TheStreet.com, a financial daily on the web |
| Other Board Memberships and Affiliations: |
| • Academy for Liberal Education, an accrediting agency for colleges and universities certified by |
| the U.S. Department of Education, Director |
| • Harvard Center for Blood Research,Trustee |
| • Bard College,Trustee |
| • Board of Overseers of YIVO Institute for Jewish Research, Chairman |
| No. of Portfolios for which Board Member Serves: 22 |
| ——————— |
| Once elected all Board Members serve for an indefinite term.The address of the Board Members and Officers is in c/o |
| The Dreyfus Corporation, 200 Park Avenue, New York, New York 10166. Additional information about the Board |
| Members is available in the fund’s Statement of Additional Information which can be obtained from Dreyfus free of |
| charge by calling this toll free number: 1-800-554-4611. |
| John M. Fraser, Jr., Emeritus Board Member |
| Rosalind Gersten Jacobs, Emeritus Board Member |
The Portfolio 29
OFFICERS OF THE FUND (Unaudited)
| STEPHEN E. CANTER, President since |
| March 2000. |
Chairman of the Board, Chief Executive Officer and Chief Operating Officer of the Manager, and an officer of 90 investment companies (comprised of 184 portfolios) managed by the Manager. Mr. Canter also is a Board member and, where applicable, an Executive Committee Member of the other investment management subsidiaries of Mellon Financial Corporation, each of which is an affiliate of the Manager. He is 60 years old and has been an employee of the Manager since May 1995.
| STEPHEN R. BYERS, Executive Vice |
| President since November 2002. |
Chief Investment Officer,Vice Chairman and a director of the Manager, and an officer of 90 investment companies (comprised of 184 portfolios) managed by the Manager. Mr. Byers also is an officer, director or an Executive Committee Member of certain other investment management subsidiaries of Mellon Financial Corporation, each of which is an affiliate of the Manager. He is 52 years old and has been an employee of the Manager since January 2000.
| MARK N. JACOBS, Vice President since |
| March 2000. |
Executive Vice President, Secretary and General Counsel of the Manager, and an officer of 91 investment companies (comprised of 200 portfolios) managed by the Manager. He is 59 years old and has been an employee of the Manager since June 1977.
| MICHAEL A. ROSENBERG, Vice President |
| and Secretary since August 2005. |
Associate General Counsel of the Manager, and an officer of 91 investment companies (comprised of 200 portfolios) managed by the Manager. He is 45 years old and has been an employee of the Manager since October 1991.
| JAMES BITETTO, Vice President and |
| Assistant Secretary since August 2005. |
Assistant General Counsel and Assistant Secretary of the Manager, and an officer of 91 investment companies (comprised of 200 portfolios) managed by the Manager. He is 39 years old and has been an employee of the Manager since December 1996.
| JONI LACKS CHARATAN, Vice |
| President and Assistant Secretary |
| since August 2005. |
Associate General Counsel of the Manager, and an officer of 91 investment companies (comprised of 200 portfolios) managed by the Manager. She is 50 years old and has been an employee of the Manager since October 1988.
| JOSEPH M. CHIOFFI, Vice President and |
| Assistant Secretary since August 2005. |
Assistant General Counsel of the Manager, and an officer of 91 investment companies (comprised of 200 portfolios) managed by the Manager. He is 44 years old and has been an employee of the Manager since June 2000.
| JANETTE E. FARRAGHER, Vice |
| President and Assistant Secretary |
| since August 2005. |
Associate General Counsel of the Manager, and an officer of 91 investment companies (comprised of 200 portfolios) managed by the Manager. She is 42 years old and has been an employee of the Manager since February 1984.
| JOHN B. HAMMALIAN, Vice President and |
| Assistant Secretary since August 2005. |
Associate General Counsel of the Manager, and an officer of 91 investment companies (comprised of 200 portfolios) managed by the Manager. He is 42 years old and has been an employee of the Manager since February 1991.
| ROBERT R. MULLERY, Vice President and |
| Assistant Secretary since August 2005. |
Associate General Counsel of the Manager, and an officer of 91 investment companies (comprised of 200 portfolios) managed by the Manager. He is 53 years old and has been an employee of the Manager since May 1986.
| JEFF PRUSNOFSKY, Vice President and |
| Assistant Secretary since August 2005. |
Associate General Counsel of the Manager, and an officer of 91 investment companies (comprised of 200 portfolios) managed by the Manager. He is 40 years old and has been an employee of the Manager since October 1990.
| JAMES WINDELS, Treasurer since |
| November 2001. |
Director-Mutual Fund Accounting of the Manager, and an officer of 91 investment companies (comprised of 200 portfolios) managed by the Manager. He is 47 years old and has been an employee of the Manager since April 1985.
| ERIK D. NAVILOFF, Assistant Treasurer |
| since December 2002. |
Senior Accounting Manager – Taxable Fixed Income Funds of the Manager, and an officer of 91 investment companies (comprised of 200 portfolios) managed by the Manager. He is 37 years old and has been an employee of the Manager since November 1992.
| ROBERT ROBOL, Assistant Treasurer |
| since August 2003. |
Senior Accounting Manager – Money Market and Municipal Bond Funds of the Manager, and an officer of 91 investment companies (comprised of 200 portfolios) managed by the Manager. He is 41 years old and has been an employee of the Manager since October 1988.
| ROBERT SVAGNA, Assistant Treasurer |
| since December 2002. |
Senior Accounting Manager – Equity Funds of the Manager, and an officer of 91 investment companies (comprised of 200 portfolios) managed by the Manager. He is 38 years old and has been an employee of the Manager since November 1990.
| GAVIN C. REILLY, Assistant Treasurer |
| since December 2005. |
Tax Manager of the Investment Accounting and Support Department of the Manager, and an officer of 91 investment companies (comprised of 200 portfolios) managed by the Manager. He is 37 years old and has been an employee of the Manager since April 1991.
| JOSEPH W. CONNOLLY, Chief Compliance |
| Officer since October 2004. |
Chief Compliance Officer of the Manager and The Dreyfus Family of Funds (91 investment companies, comprised of 200 portfolios). From November 2001 through March 2004, Mr. Connolly was first Vice-President, Mutual Fund Servicing for Mellon Global Securities Services. In that capacity, Mr. Connolly was responsible for managing Mellon’s Custody, Fund Accounting and Fund Administration services to third-party mutual fund clients. He is 48 years old and has served in various capacities with the Manager since 1980, including manager of the firm’s Fund Accounting Department from 1997 through October 2001.
| WILLIAM GERMENIS, Anti-Money |
| Laundering Compliance Officer since |
| September 2002. |
Vice President and Anti-Money Laundering Compliance Officer of the Distributor, and the Anti-Money Laundering Compliance Officer of 87 investment companies (comprised of 196 portfolios) managed by the Manager. He is 35 years old and has been an employee of the Distributor since October 1998.
NOTES
| Dreyfus Variable |
| Investment Fund, |
| Special Value Portfolio |
| 200 Park Avenue |
| New York, NY 10166 |
| |
| Investment Adviser |
| The Dreyfus Corporation |
| 200 Park Avenue |
| New York, NY 10166 |
| |
| Sub-Investment Adviser |
| Jennison Associates LLC |
| 466 Lexington Avenue |
| New York, NY 10017 |
| Custodian |
| The Bank of New York |
| One Wall Street |
| New York, NY 10286 |
| |
| Transfer Agent & |
| Dividend Disbursing Agent |
| Dreyfus Transfer, Inc. |
| 200 Park Avenue |
| New York, NY 10166 |
| |
| Distributor |
| Dreyfus Service Corporation |
| 200 Park Avenue |
| New York, NY 10166 |
Telephone 1-800-554-4611 or 516-338-3300
Mail The Dreyfus Family of Funds, 144 Glenn Curtiss Boulevard, Uniondale, NY 11556-0144 Attn: Institutional Servicing
The portfolio files its complete schedule of portfolio holdings with the Securities and Exchange Commission (“SEC”) for the first and third quarters of each fiscal year on Form N-Q. The portfolio’s Forms N-Q are available on the SEC’s website at http://www.sec.gov and may be reviewed and copied at the SEC’s Public Reference Room in Washington, DC. Information on the operation of the Public Reference Room may be obtained by calling 1-800-SEC-0330.
A description of the policies and procedures that the portfolio uses to determine how to vote proxies relating to portfolio securities, and information regarding how the portfolio voted these proxies for the 12-month period ended June 30, 2005, is available at http://www.dreyfus.com and on the SEC’s website at http://www.sec.gov. The description of the policies and procedures is also available without charge, upon request, by calling 1-800-645-6561.
© 2006 Dreyfus Service Corporation

The Registrant has adopted a code of ethics that applies to the Registrant's principal executive officer, principal financial officer, principal accounting officer or controller, or persons performing similar functions There have been no amendments to, or waivers in connection with, the Code of Ethics during the period covered by this Report.
| Item 3. | | Audit Committee Financial Expert. |
The Registrant's Board has determined that David P. Feldman, a member of the Audit Committee of the Board, is an audit committee financial expert as defined by the Securities and Exchange Commission (the "SEC"). David P. Feldman is "independent" as defined by the SEC for purposes of audit committee financial expert determinations.
| Item 4. | | Principal Accountant Fees and Services |
(a) Audit Fees. The aggregate fees billed for each of the last two fiscal years (the "Reporting Periods") for professional services rendered by the Registrant's principal accountant (the "Auditor") for the audit of the Registrant's annual financial statements, or services that are normally provided by the Auditor in connection with the statutory and regulatory filings or engagements for the Reporting Periods, were $224,490 in 2004 and $243,347 in 2005.
(b) Audit-Related Fees. The aggregate fees billed in the Reporting Periods for assurance and related services by the Auditor that are reasonably related to the performance of the audit of the Registrant's financial statements and are not reported under paragraph (a) of this Item 4 were $78,768 in 2004 and $81,252 in 2005. These services consisted of (i) agreed-upon procedures related to compliance with Internal Revenue Code section 817(h) and (ii) security counts required by Rule 17f-2 under the Investment Company Act of 1940, as amended.
The aggregate fees billed in the Reporting Periods for non-audit assurance and related services by the Auditor to the Registrant's investment adviser (not including any sub-investment adviser whose role is primarily portfolio management and is subcontracted with or overseen by another investment adviser), and any entity controlling, controlled by or under common control with the investment adviser that provides ongoing services to the Registrant ("Service Affiliates"), that were reasonably related to the performance of the annual audit of the Service Affiliate, which required pre-approval by the Audit Committee were $-0- in 2004 and $-0- in 2005.
Note: For the second paragraph in each of (b) through (d) of this Item 4, certain of such services were not pre-approved prior to May 6, 2003, when such services were required to be pre-approved. On and after May 6, 2003, 100% of all services provided by the Auditor were pre-approved as required. For comparative purposes, the fees shown assume that all such services were pre-approved, including services that were not pre-approved prior to the compliance date of the pre-approval requirement.
| | P:\Edgar Filings\Pending\117\NCSRA-117-2-2006\formncsr117.DOC
|
(c) Tax Fees. The aggregate fees billed in the Reporting Periods for professional services rendered by the Auditor for tax compliance, tax advice and tax planning ("Tax Services") were $39,182 in 2004 and $35,640 in 2005. These services consisted of (i) review or preparation of U.S. federal, state, local and excise tax returns; (ii) U.S. federal, state and local tax planning, advice and assistance regarding statutory, regulatory or administrative developments, (iii) tax advice regarding tax qualification matters and/or treatment of various financial instruments held or proposed to be acquired or held, and (iv) determination of Passive Foreign Investment Companies (as applicable).
The aggregate fees billed in the Reporting Periods for Tax Services by the Auditor to Service Affiliates which required pre-approval by the Audit Committee were $-0- in 2004 and $-0- in 2005.
(d) All Other Fees. The aggregate fees billed in the Reporting Periods for products and services provided by the Auditor, other than the services reported in paragraphs (a) through (c) of this Item, were less than $200 in 2004 and $13 in 2005. These services consisted of a review of the Registrant's anti-money laundering program.
The aggregate fees billed in the Reporting Periods for Non-Audit Services by the Auditor to Service Affiliates, other than the services reported in paragraphs (b) through (c) of this Item, which required pre-approval by the Audit Committee were $-0- in 2004 and $-0- in 2005.
Audit Committee Pre-Approval Policies and Procedures. The Registrant's Audit Committee has established policies and procedures (the "Policy") for pre-approval (within specified fee limits) of the Auditor's engagements for non-audit services to the Registrant and Service Affiliates without specific case-by-case consideration. Pre-approval considerations include whether the proposed services are compatible with maintaining the Auditor's independence. Pre-approvals pursuant to the Policy are considered annually.
Non-Audit Fees. The aggregate non-audit fees billed by the Auditor for services rendered to the Registrant, and rendered to Service Affiliates, for the Reporting Periods were $592,101 in 2004 and $758,091 in 2005.
Auditor Independence. The Registrant's Audit Committee has considered whether the provision of non-audit services that were rendered to Service Affiliates which were not pre-approved (not requiring pre-approval) is compatible with maintaining the Auditor's independence.
| Item 5. | | Audit Committee of Listed Registrants. |
| | | Not applicable. | | [CLOSED-END FUNDS ONLY] |
| Item 6. | | Schedule of Investments. |
| | | Not applicable. | | |
| Item 7. | | Disclosure of Proxy Voting Policies and Procedures for Closed-End Management |
| | | Investment Companies. |
| | | Not applicable. | | [CLOSED-END FUNDS ONLY] |
| Item 8. | | Portfolio Managers of Closed-End Management Investment Companies. |
| |
| | | Not applicable. [CLOSED-END FUNDS ONLY, beginning with reports for periods ended |
| | | on and after December 31, 2005] |
| Item 9. | | Purchases of Equity Securities by Closed-End Management Investment Companies and |
| | | Affiliated Purchasers. |
| | | Not applicable. [CLOSED-END FUNDS ONLY] |
| Item 10. | | Submission of Matters to a Vote of Security Holders. |
The Registrant has a Nominating Committee (the "Committee"), which is responsible for selecting and nominating persons for election or appointment by the Registrant's Board as Board members. The Committee has adopted a Nominating Committee Charter (the "Charter"). Pursuant to the Charter, the Committee will consider recommendations for nominees from shareholders submitted to the Secretary of the Registrant, c/o The Dreyfus Corporation Legal Department, 200 Park Avenue, 8th Floor East, New York, New York 10166. A nomination submission must include information regarding the recommended nominee as specified in the Charter. This information includes all information relating to a recommended nominee that is required to be disclosed in solicitations or proxy statements for the election of Board members, as well as information sufficient to evaluate the factors to be considered by the Committee, including character and integrity, business and professional experience, and whether the person has the ability to apply sound and independent business judgment and would act in the interests of the Registrant and its shareholders.
Nomination submissions are required to be accompanied by a written consent of the individual to stand for election if nominated by the Board and to serve if elected by the shareholders, and such additional information must be provided regarding the recommended nominee as reasonably requested by the Committee.
| Item 11. | | Controls and Procedures. |
(a) The Registrant's principal executive and principal financial officers have concluded, based on their evaluation of the Registrant's disclosure controls and procedures as of a date within 90 days of the filing date of this report, that the Registrant's disclosure controls and procedures are reasonably designed to ensure that information required to be disclosed by the Registrant on Form N-CSR is recorded, processed, summarized and reported within the required time periods and that information required to be disclosed by the Registrant in the reports that it files or submits on Form N-CSR is accumulated and communicated to the Registrant's management, including its principal executive and principal financial officers, as appropriate to allow timely decisions regarding required disclosure.
(b) There were no changes to the Registrant's internal control over financial reporting that occurred during the second fiscal quarter of the period covered by this report that have materially affected, or are reasonably likely to materially affect, the Registrant's internal control over financial reporting.
| (a)(1) | | Code of ethics referred to in Item 2. |
| (a)(2) | | Certifications of principal executive and principal financial officers as required by Rule 30a-2(a) |
| under the Investment Company Act of 1940. |
| (a)(3) | | Not applicable. |
| (b) | | Certification of principal executive and principal financial officers as required by Rule 30a-2(b) |
| under the Investment Company Act of 1940. |
Pursuant to the requirements of the Securities Exchange Act of 1934 and the Investment Company Act of 1940, the Registrant has duly caused this Report to be signed on its behalf by the undersigned, thereunto duly authorized.
| Dreyfus Variable Investment Fund |

Pursuant to the requirements of the Securities Exchange Act of 1934 and the Investment Company Act of 1940, this Report has been signed below by the following persons on behalf of the Registrant and in the capacities and on the dates indicated.
| | | EXHIBIT INDEX |
| (a)(1) | | Code of ethics referred to in Item 2. |
| (a)(2) | | Certifications of principal executive and principal financial officers as required by Rule 30a- |
| 2(a) under the Investment Company Act of 1940. (EX-99.CERT) |
| (b) | | Certification of principal executive and principal financial officers as required by Rule 30a- |
| 2(b) under the Investment Company Act of 1940. (EX-99.906CERT) |