| UNITED STATES |
| SECURITIES AND EXCHANGE COMMISSION |
| Washington, D.C. 20549 |
| CERTIFIED SHAREHOLDER REPORT OF REGISTERED MANAGEMENT |
| INVESTMENT COMPANIES |
| Investment Company Act file number | | 811-5125 |
| Dreyfus Variable Investment Fund |
| (Exact name of Registrant as specified in charter) |
| c/o The Dreyfus Corporation |
| 200 Park Avenue |
| New York, New York 10166 |
| (Address of principal executive offices) (Zip code) |
| |
| Mark N. Jacobs, Esq. |
| 200 Park Avenue |
| New York, New York 10166 |
| (Name and address of agent for service) |
| Registrant's telephone number, including area code: | | (212) 922-6000 |
| Date of fiscal year end: | | 12/31 | | |
| Date of reporting period: | | 12/31/04 | | |
P:\Edgar Filings\Pending\117\NCSRA-117-2-2005\formncsra117.doc
SSL-DOCS2 70128344v14
| | | | | FORM N-CSR |
| Item 1. | | Reports to Stockholders. | | |
| Dreyfus Variable |
| Investment Fund, |
| Appreciation Portfolio |
ANNUAL REPORT December 31, 2004

The views expressed in this report reflect those of the portfolio manager only through the end of the period covered and do not necessarily represent the views of Dreyfus or any other person in the Dreyfus organization.Any such views are subject to change at any time based upon market or other conditions and Dreyfus disclaims any responsibility to update such views. These views may not be relied on as investment advice and, because investment decisions for a Dreyfus portfolio are based on numerous factors, may not be relied on as an indication of trading intent on behalf of any Dreyfus portfolio.
Not FDIC-Insured • Not Bank-Guaranteed • May Lose Value
| | | Contents |
| |
| | | T H E P O R T F O L I O |
| |
|
| 2 | | Letter from the Chairman |
| 3 | | Discussion of Performance |
| 6 | | Portfolio Performance |
| 8 | | Understanding Your Portfolio’s Expenses |
| 8 | | Comparing Your Portfolio’s Expenses |
| | | With Those of Other Funds |
| 9 | | Statement of Investments |
| 12 | | Statement of Assets and Liabilities |
| 13 | | Statement of Operations |
| 14 | | Statement of Changes in Net Assets |
| 16 | | Financial Highlights |
| 18 | | Notes to Financial Statements |
| 26 | | Report of Independent Registered |
| | | Public Accounting Firm |
| 27 | | Important Tax Information |
| 28 | | Board Members Information |
| 30 | | Officers of the Fund |
| | | F O R M O R E I N F O R M AT I O N |
| |
|
| | | Back Cover |
| Dreyfus Variable Investment Fund, |
| Appreciation Portfolio |
The Portfolio

LETTER FROM THE CHAIRMAN
We are pleased to present this annual report for Dreyfus Variable Investment Fund, Appreciation Portfolio, covering the 12-month period from January 1, 2004, through December 31, 2004. Inside, you’ll find valuable information about how the portfolio was managed during the reporting period, including a discussion with the portfolio manager, Fayez Sarofim, of Fayez Sarofim & Co., the portfolio’s sub-investment adviser.
2004 represented the second consecutive year of positive stock market performance. Unlike the 2003 rally, however, in which most stocks rose as general business conditions improved,2004’s market performance largely reflected the strengths and weaknesses of individual companies and industries. As a result, fundamental research and professional judgment became more important determinants of mutual fund performance in 2004.
What’s ahead for stocks in 2005? No one knows for certain.Positive influences remain in place, including moderately expanding U.S. and global economies and low inflation. Nonetheless, a number of risks — such as rising short-term interest rates, currency fluctuations and generally slowing corporate earnings — could threaten the market environment.
As always, we urge our shareholders to view the stock market from a long-term perspective, measured in years rather than weeks or months. One of the best ways to ensure a long-term perspective is to establish an investment plan with the help of your financial advisor, and review it periodically to track your progress toward your financial goals.
Thank you for your continued confidence and support.

| Stephen E. Canter |
| Chairman and Chief Executive Officer |
| The Dreyfus Corporation |
| January 18, 2005 |

DISCUSSION OF PERFORMANCE
Fayez Sarofim, Portfolio Manager
Fayez Sarofim & Co., Sub-Investment Adviser
How did Dreyfus Variable Investment Fund, Appreciation Portfolio perform relative to its benchmark?
For the 12-month period ended December 31, 2004, the portfolio’s Initial shares produced a total return of 5.05%, and its Service shares produced a total return of 4.80% .1 For the same period, the total return of the portfolio’s benchmark, the Standard & Poor’s 500 Composite Stock Price Index (“S&P 500 Index”), was 11.04% .2
Although stocks generally gained value over the reporting period, the market’s strength was concentrated primarily among stocks at the lower end of the S&P 500 Index’s capitalization range.The portfolio’s returns were lower than the S&P 500 Index because the larger stocks on which the portfolio focuses tended to trail the averages. In addition, the portfolio’s results were hindered by a handful of company-specific disappointments.
What is the portfolio’s investment approach?
The portfolio normally invests at least 80% of its assets in common stocks. The portfolio focuses in large, well-established multinational growth companies that have demonstrated sustained patterns of profitability, strong balance sheets, an expanding global presence and the potential to achieve predictable above-average earnings growth. We focus on purchasing reasonably priced growth stocks of fundamentally sound companies in economic sectors that we believe will expand over the next three to five years or longer.
At the same time, we manage the portfolio with long-term investors in mind. Our investment approach is based on targeting long-term growth rather than short-term profit.
What other factors influenced the portfolio’s performance?
Despite generally strong earnings reports from large-cap companies, large-cap stocks failed to advance significantly for much of the year.
DISCUSSION OF PERFORMANCE (continued)
|
Over the first 10 months of 2004, the stock market traded within a relatively narrow range, with returns constrained by uncertainty related to a fitfully growing economy, rising short-term interest rates, the U.S. presidential elections and the insurgency in Iraq. The stock market began to rally more substantially in November and December, accounting for much of the 12-month return of the S&P 500 Index.
In this challenging economic environment, investors generally continued to favor smaller stocks that, in their view, had greater potential for growth than large, well-established companies.As a result, the dominant multinational corporations in which the portfolio invests, most of which rank among the 100 largest stocks within the S&P 500 Index, produced relatively lackluster results.
In addition, the portfolio’s emphasis on consumer, financial and health care stocks hurt the portfolio’s relative performance, largely because investors apparently believed they could find better growth opportunities in other sectors. In the technology sector, semiconductor manufacturer Intel suffered from the effects of unexpectedly soft demand for its prod-ucts.The portfolio’s returns from the financial sector were held back by its investment in insurance and investment firm Marsh & McLennan Cos., which experienced turmoil related to allegations of unfair business practices.Returns from the portfolio’s health care holdings suffered when industry bellwethers Pfizer and Merck & Co. encountered safety-related issues affecting one of their better-selling drugs. In the consumer area, Coca-Cola was hurt by slower sales in Germany and North America.
On the other hand, the portfolio received positive contributions to performance from its energy holdings. Integrated oil companies, including Exxon Mobil, ChevronTexaco and British Petroleum, benefited from surging oil and gas prices during the reporting period. Good results from diversified health care company Johnson & Johnson helped offset some of the weakness experienced by other large drug producers. In the industrials area, shares of General Electric rose as investors responded to the diversified company’s renewed focus on growth businesses, which is expected to boost financial results in 2005. Food and tobacco giant Altria Group gained value when the company began to consider the possibility of separating its business units into
independent entities. Finally, publishing conglomerate The McGraw-Hill Cos. benefited from gains in its for-profit education businesses as well as better results from its Standard & Poor’s subsidiary.
Changes to the portfolio during the reporting period included, among others, the elimination of the portfolio’s position in Ford. We added ConocoPhillips and Occidental Petroleum to the portfolio’s holdings in the energy sector because we believe that supply-and-demand imbalances are likely to continue to support oil prices.We also established a small position in food distributor Sysco.
What is the portfolio’s current strategy?
Although they were out of favor for much of the reporting period, we have maintained our longstanding focus on large, high-quality corporations with dominant market positions.Valuations of the largest companies in the S&P 500 Index have fallen below historical norms, which we believe makes them attractive opportunities in a moderately growing economic environment. Indeed, many of the portfolio’s holdings ended the reporting period with record levels of cash on their balance sheets, which can be used to grow existing businesses,enter new ones or enhance shareholder value through stock buy-backs or dividend increases.
| | | The portfolio is only available as a funding vehicle under variable life insurance policies or variable |
| | | annuity contracts issued by insurance companies. Individuals may not purchase shares of the |
| | | portfolio directly.A variable annuity is an insurance contract issued by an insurance company that |
| | | enables investors to accumulate assets on a tax-deferred basis for retirement or other long-term |
| | | goals.The investment objective and policies of Dreyfus Variable Investment Fund,Appreciation |
| | | Portfolio made available through insurance products may be similar to other funds/portfolios |
| | | managed or advised by Dreyfus. However, the investment results of the portfolio may be higher or |
| | | lower than, and may not be comparable to, those of any other Dreyfus fund/portfolio. |
| 1 | | Total return includes reinvestment of dividends and any capital gains paid. Past performance is no |
| | | guarantee of future results. Share price and investment return fluctuate such that upon redemption, |
| | | portfolio shares may be worth more or less than their original cost.The portfolio’s performance does |
| | | not reflect the deduction of additional charges and expenses imposed in connection with investing |
| | | in variable insurance contracts, which will reduce returns. |
| 2 | | SOURCE: LIPPER INC. — Reflects monthly reinvestment of dividends and, where |
| | | applicable, capital gain distributions.The Standard & Poor’s 500 Composite Stock Price Index is |
| | | a widely accepted, unmanaged index of U.S. stock market performance. |
The Portfolio 5
| Average Annual Total Returns as of | | 12/31/04 | | | | |
| |
| | | 1 Year | | 5 Years | | 10 Years |
| |
| |
| |
|
| Initial shares | | 5.05% | | (0.91)% | | 11.52% |
| Service shares | | 4.80% | | (1.13)% | | 11.40% |
| |
| The data for Service shares includes the results of Initial shares for the period prior to December 31, 2000 |
| (inception date of Service shares). Actual Service shares’ average annual total return and hypothetical growth |
| results would have been lower. See notes below. | | | | | | |
| † Source: Lipper Inc. | | | | | | |
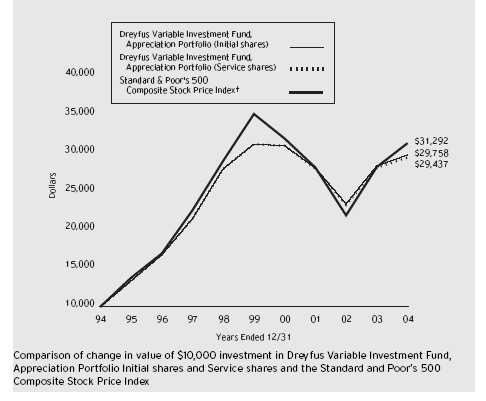
| Past performance is not predictive of future performance.The portfolio’s performance shown in the graph and table does not |
| reflect the deduction of taxes that a shareholder would pay on portfolio distributions or the redemption of portfolio shares. |
| The portfolio’s performance does not reflect the deduction of additional charges and expenses imposed in |
| connection with investing in variable insurance contracts which will reduce returns. | | |
| The above graph compares a $10,000 investment made in Initial and Service shares of Dreyfus Variable Investment |
| Fund,Appreciation Portfolio on 12/31/94 to a $10,000 investment made in the Standard & Poor’s 500 Composite |
| Stock Price Index (the “Index”) on that date. | | | | | | |
| 6 | | | | | | |
The portfolio’s Initial shares are not subject to a Rule 12b-1 fee.The portfolio’s Service shares are subject to a 0.25% annual Rule 12b-1 fee.The performance figures for Service shares reflect the performance of the portfolio’s Initial shares from their inception date through December 30, 2000, and the performance of the portfolio’s Service shares from December 31, 2000 (inception date of Service shares) to December 31, 2004 (blended performance figures).The blended performance figures have not been adjusted to reflect the higher operating expenses of the Service shares. If these expenses had been reflected, the blended performance figures would have been lower. All dividends and capital gain distributions are reinvested.
The portfolio’s performance shown in the line graph takes into account all applicable portfolio fees and expenses.The Index is a widely accepted, unmanaged index of U.S. stock market performance, which does not take into account charges, fees and other expenses. Further information relating to portfolio performance, including expense reimbursements, if applicable, is contained in the Financial Highlights section of the prospectus and elsewhere in this report.

As a mutual fund investor,you pay ongoing expenses,such as management fees and other expenses.Using the information below,you can estimate how these expenses affect your investment and compare them with the expenses of other funds.You also may pay one-time transaction expenses,including sales charges (loads) and redemption fees, which are not shown in this section and would have resulted in higher total expenses. For more information, see your portfolio’s prospectus or talk to your financial adviser.
| | Review your portfolio’s expenses
|
The table below shows the expenses you would have paid on a $1,000 investment in Dreyfus Variable Investment Fund,Appreciation Portfolio from July 1, 2004 to December 31, 2004. It also shows how much a $1,000 investment would be worth at the close of the period, assuming actual returns and expenses.
| Expenses and Value of a $1,000 Investment | | |
| assuming actual returns for the six months ended December 31, 2004 |
| | | Initial Shares | | Service Shares |
| |
| |
|
| Expenses paid per $1,000 † | | $ 4.03 | | $ 5.31 |
| Ending value (after expenses) | | $1,030.70 | | $1,029.40 |
COMPARING YOUR PORTFOLIO’S EXPENSES WITH THOSE OF OTHER FUNDS (Unaudited)
Using the SEC’s method to compare expenses
The Securities and Exchange Commission (SEC) has established guidelines to help investors assess fund expenses. Per these guidelines, the table below shows your portfolio’s expenses based on a $1,000 investment, assuming a hypothetical 5% annualized return. You can use this information to compare the ongoing expenses (but not transaction expenses or total cost) of investing in the portfolio with those of other funds. All mutual fund shareholder reports will provide this information to help you make this comparison. Please note that you cannot use this information to estimate your actual ending account balance and expenses paid during the period.
Expenses and Value of a $1,000 Investment assuming a hypothetical 5% annualized return for the six months ended December 31, 2004
| | | Initial Shares | | Service Shares |
| |
| |
|
| Expenses paid per $1,000 † | | $ 4.01 | | $ 5.28 |
| Ending value (after expenses) | | $1,021.17 | | $1,019.91 |
† Expenses are equal to the portfolio’s annualized expense ratio of .79% for Initial shares and 1.04% for Service shares, multiplied by the average account value over the period, multiplied by 184/366 (to reflect the one-half year period).
STATEMENT OF INVESTMENTS
December 31, 2004
| Common Stocks—100.0% | | Shares | | Value ($) |
| |
| |
|
| Banking—6.2% | | | | |
| Bank of America | | 291,216 | | 13,684,240 |
| Federal Home Loan Mortgage | | 121,600 | | 8,961,920 |
| Federal National Mortgage Association | | 200,800 | | 14,298,968 |
| HSBC Holdings, ADR | | 10,000 a | | 851,400 |
| SunTrust Banks | | 198,600 | | 14,672,568 |
| | | | | 52,469,096 |
| Capital Goods—6.2% | | | | |
| Emerson Electric | | 164,900 | | 11,559,490 |
| General Electric | | 1,115,500 | | 40,715,750 |
| | | | | 52,275,240 |
| Consumer Durables & Apparel—1.3% | | | | |
| Christian Dior | | 72,700 | | 4,936,172 |
| Polo Ralph Lauren | | 145,500 | | 6,198,300 |
| | | | | 11,134,472 |
| Consumer Staples—6.1% | | | | |
| Sysco | | 73,000 | | 2,786,410 |
| Wal-Mart Stores | | 459,700 | | 24,281,354 |
| Walgreen | | 649,900 | | 24,936,663 |
| | | | | 52,004,427 |
| Diversified Financials—8.7% | | | | |
| American Express | | 327,500 | | 18,461,175 |
| Citigroup | | 601,524 | | 28,981,426 |
| JP Morgan Chase & Co. | | 451,100 | | 17,597,411 |
| Merrill Lynch | | 145,500 | | 8,696,535 |
| | | | | 73,736,547 |
| Energy—14.6% | | | | |
| BP, ADR | | 455,900 | | 26,624,560 |
| ChevronTexaco | | 445,800 | | 23,408,958 |
| ConocoPhillips | | 75,000 | | 6,512,250 |
| Exxon Mobil | | 1,176,564 | | 60,310,671 |
| Occidental Petroleum | | 60,000 | | 3,501,600 |
| Royal Dutch Petroleum | | 59,800 | | 3,431,324 |
| | | | | 123,789,363 |
| Food, Beverage & Tobacco—17.2% | | | | |
| Altria Group | | 926,400 | | 56,603,040 |
| Anheuser-Busch Cos. | | 257,100 | | 13,042,683 |
| Coca-Cola | | 664,500 | | 27,663,135 |
The Portfolio 9
S T A T E M E N T O F I N V E S T M E N T S (continued)
| Common Stocks (continued) | | Shares | | | | Value ($) |
| |
| |
| |
|
| Food, Beverage & Tobacco (continued) | | | | | | |
| Kraft Foods, Cl. A | | 162,100 | | | | 5,772,381 |
| Nestle, ADR | | 291,000 | | | | 19,160,531 |
| PepsiCo | | 455,900 | | | | 23,797,980 |
| | | | | | | 146,039,750 |
| Hotels Restaurants & Leisure—1.2% | | | | | | |
| McDonald’s | | 304,500 | | | | 9,762,270 |
| Household & Personal Products—5.5% | | | | | | |
| Colgate-Palmolive | | 174,600 | | | | 8,932,536 |
| Estee Lauder Cos., Cl. A | | 145,500 | | | | 6,659,535 |
| Procter & Gamble | | 565,000 | | | | 31,120,200 |
| | | | | | | 46,712,271 |
| Insurance—5.1% | | | | | | |
| American International Group | | 202,920 | | | | 13,325,757 |
| Berkshire Hathaway, Cl. A | | 220 | | b | | 19,338,000 |
| Marsh & McLennan Cos. | | 316,100 | | | | 10,399,690 |
| | | | | | | 43,063,447 |
| Media—5.3% | | | | | | |
| Fox Entertainment Group, Cl. A | | 130,900 | | b | | 4,091,934 |
| McGraw-Hill Cos. | | 264,800 | | | | 24,239,792 |
| News, Cl. A | | 339,400 | | | | 6,333,204 |
| News, Cl. B | | 9,800 | | a | | 188,160 |
| Time Warner | | 226,800 | | b | | 4,408,992 |
| Viacom, Cl. B | | 150,300 | | | | 5,469,417 |
| | | | | | | 44,731,499 |
| Pharmaceuticals & Biotechnology—12.5% | | | | |
| Abbott Laboratories | | 354,100 | | | | 16,518,765 |
| Eli Lilly & Co. | | 261,900 | | | | 14,862,825 |
| Johnson & Johnson | | 403,300 | | | | 25,577,286 |
| Merck & Co. | | 373,000 | | | | 11,988,220 |
| Pfizer | | 1,231,000 | | | | 33,101,590 |
| Roche Holding, ADR | | 32,000 | | | | 3,716,000 |
| | | | | | | 105,764,686 |
| Retailing—1.6% | | | | | | |
| Target | | 261,900 | | | | 13,600,467 |
| Semiconductors & | | | | | | |
| Semiconductor Equipment—3.9% | | | | | | |
| Intel | | 1,414,700 | | | | 33,089,833 |
10
| Common Stocks (continued) | | Shares | | Value ($) |
| |
| |
|
| Software & Services—2.8% | | | | |
| Microsoft | | 897,300 | | 23,966,883 |
| Technology Hardware & Equipment—.5% | | | | |
| International Business Machines | | 39,800 | | 3,923,484 |
| Transportation—1.3% | | | | |
| United Parcel Service, Cl. B | | 126,800 | | 10,836,328 |
| Total Common Stocks | | | | |
| (cost $671,328,419) | | | | 846,900,063 |
| |
| |
|
| |
| Investment of Cash Collateral | | | | |
| for Securities Loaned—.1% | | Shares | | Value ($) |
| |
| |
|
| Registered Investment Company; | | | | |
| Dreyfus Institutional | | | | |
| Preferred Plus Money Market Fund | | | | |
| (cost $1,072,000) | | 1,072,000 c | | 1,072,000 |
| |
| |
|
| |
| Total Investments (cost $672,400,419) | | 100.1% | | 847,972,063 |
| Liabilities, Less Cash and Receivables | | (.1%) | | (1,274,724) |
| Net Assets | | 100.0% | | 846,697,339 |
| |
| ADR—American Depository Receipts. | | | | |
| a All or a portion of these securites are on loan.At December 31, 2004, the total market value of the fund’s securities |
| on loan is $1,035,720 and the total market value of the collateral held by the fund is $1,072,000. |
| b Non-income producing. | | | | |
| c Investment in affiliated money market mutual fund. | | |
| Portfolio Summary † | | | | | | |
| |
| | | Value (%) | | | | Value (%) |
| |
| |
| |
|
| Food, Beverage & Tobacco | | 17.2 | | Capital Goods | | 6.2 |
| Energy | | 14.6 | | Consumer Staples | | 6.1 |
| Pharmaceuticals & | | | | Household & Personal Products | | 5.5 |
| Biotechnology | | 12.5 | | Other | | 23.1 |
| Diversified Financials | | 8.7 | | | | |
| Banking | | 6.2 | | | | 100.1 |
† Based on net assets.
See notes to financial statements.
STATEMENT OF ASSETS AND LIABILITIES
December 31, 2004
| | | Cost | | Value |
| |
| |
|
| Assets ($): | | | | |
| Investments in securities—See Statement | | |
| of Investments (including securities on loan, | | |
| valued at $1,035,720)—Note 1(c): | | |
| Unaffiliated issuers | | 671,328,419 | | 846,900,063 |
| Affiliated issuers | | 1,072,000 | | 1,072,000 |
| Cash | | | | 333,520 |
| Dividends and interest receivable | | | | 1,339,749 |
| Receivable for shares of Beneficial Interest subscribed | | 175,716 |
| Prepaid expenses | | | | 50,074 |
| | | | | 849,871,122 |
| |
| |
|
| Liabilities ($): | | | | |
| Due to The Dreyfus Corporation and affiliates—Note 3(b) | | 332,582 |
| Due to Fayez Sarofim & Co. | | | | 229,509 |
| Payable for shares of Beneficial Interest redeemed | | 1,413,308 |
| Liability for securities on loan—Note 1(c) | | 1,072,000 |
| Bank loan payable—Note 2 | | | | 50,000 |
| Interest payable—Note 2 | | | | 4,082 |
| Accrued expenses | | | | 72,302 |
| | | | | 3,173,783 |
| |
| |
|
| Net Assets ($) | | | | 846,697,339 |
| |
| |
|
| Composition of Net Assets ($): | | | | |
| Paid-in capital | | | | 727,999,226 |
| Accumulated undistributed investment income—net | | 130,363 |
| Accumulated net realized gain (loss) on investments | | (57,003,894) |
| Accumulated net unrealized appreciation (depreciation) | | |
| on investments and foreign currency transactions | | 175,571,644 |
| |
|
| Net Assets ($) | | | | 846,697,339 |
| |
| |
|
| |
| |
| Net Asset Value Per Share | | | | |
| | | Initial Shares | | Service Shares |
| |
| |
|
| Net Assets ($) | | 766,168,679 | | 80,528,660 |
| Shares Outstanding | | 21,545,682 | | 2,270,849 |
| |
| |
|
| Net Asset Value Per Share ($) | | 35.56 | | 35.46 |
See notes to financial statements.
|
STATEMENT OF OPERATIONS
Year Ended December 31, 2004
|
| Investment Income ($): | | |
| Income: | | |
| Cash dividends (net of $105,981 foreign taxes withheld at source): |
| Unaffiliated issuers | | 20,753,254 |
| Affiliated issuers | | 4,464 |
| Income from securities lending | | 32,581 |
| Total Income | | 20,790,299 |
| Expenses: | | |
| Investment advisory fee—Note 3(a) | | 3,709,636 |
| Sub-investment advisory fee—Note 3(a) | | 2,809,636 |
| Distribution fees—Note 3(b) | | 203,374 |
| Trustees’ fees and expenses—Note 3(c) | | 82,127 |
| Custodian fees—Note 3(b) | | 64,246 |
| Prospectus and shareholders’ reports | | 61,117 |
| Professional fees | | 42,963 |
| Shareholder servicing costs—Note 3(b) | | 42,378 |
| Interest expense—Note 2 | | 21,662 |
| Loan commitment fees—Note 2 | | 5,425 |
| Registration fees | | 1,356 |
| Miscellaneous | | 16,941 |
| Total Expenses | | 7,060,861 |
| Investment Income—Net | | 13,729,438 |
| |
|
| Realized and Unrealized Gain (Loss) on Investments—Note 4 ($): |
| Net realized gain (loss) on investments and | | |
| foreign currency transactions | | (5,994,905) |
| Net unrealized appreciation (depreciation) | | |
| on investments and foreign currency transactions | | 33,662,361 |
| Net Realized and Unrealized Gain (Loss) on Investments | | 27,667,456 |
| Net Increase in Net Assets Resulting from Operations | | 41,396,894 |
See notes to financial statements.
|
STATEMENT OF CHANGES IN NET ASSETS
| | | Year Ended December 31, |
| |
|
| | | 2004 | | 2003 |
| |
| |
|
| Operations ($): | | | | |
| Investment income—net | | 13,729,438 | | 11,441,662 |
| Net realized gain (loss) on investments | | (5,994,905) | | (14,655,861) |
| Net unrealized appreciation | | | | |
| (depreciation) on investments | | 33,662,361 | | 164,515,474 |
| Net Increase (Decrease) in Net Assets | | | | |
| Resulting from Operations | | 41,396,894 | | 161,301,275 |
| |
| |
|
| Dividends to Shareholders from ($): | | | | |
| Investment income—net: | | | | |
| Initial shares | | (12,718,082) | | (10,470,353) |
| Service shares | | (1,102,158) | | (952,535) |
| Total Dividends | | (13,820,240) | | (11,422,888) |
| |
| |
|
| Beneficial Interest Transactions ($): | | | | |
| Net proceeds from shares sold: | | | | |
| Initial shares | | 58,196,296 | | 115,536,630 |
| Service shares | | 21,783,851 | | 24,248,136 |
| Dividends reinvested: | | | | |
| Initial shares | | 12,718,082 | | 10,470,353 |
| Service shares | | 1,102,158 | | 952,535 |
| Cost of shares redeemed: | | | | |
| Initial shares | | (150,984,809) | | (163,523,003) |
| Service shares | | (34,135,074) | | (10,401,232) |
| Increase (Decrease) in Net Assets from | | | | |
| Beneficial Interest Transactions | | (91,319,496) | | (22,716,581) |
| Total Increase (Decrease) in Net Assets | | (63,742,842) | | 127,161,806 |
| |
| |
|
| Net Assets ($): | | | | |
| Beginning of Period | | 910,440,181 | | 783,278,375 |
| End of Period | | 846,697,339 | | 910,440,181 |
| Undistributed investment income—net | | 130,363 | | 219,381 |
| | | Year Ended December 31, |
| |
|
| | | 2004 | | 2003 |
| |
| |
|
| Capital Share Transactions: | | | | |
| Initial Shares | | | | |
| Shares sold | | 1,672,805 | | 3,772,306 |
| Shares issued for dividends reinvested | | 357,874 | | 310,231 |
| Shares redeemed | | (4,347,023) | | (5,327,254) |
| Net Increase (Decrease) in Shares Outstanding | | (2,316,344) | | (1,244,717) |
| |
| |
|
| Service Shares | | | | |
| Shares sold | | 629,793 | | 797,930 |
| Shares issued for dividends reinvested | | 31,090 | | 28,309 |
| Shares redeemed | | (987,230) | | (338,806) |
| Net Increase (Decrease) in Shares Outstanding | | (326,347) | | 487,433 |
See notes to financial statements.
|
The following tables describe the performance for each share class for the fiscal periods indicated.All information (except portfolio turnover rate) reflects financial results for a single portfolio share.Total return shows how much your investment in the portfolio would have increased (or decreased) during each period, assuming you had reinvested all dividends and distributions.These figures have been derived from the portfolio’s financial statements.
| | | | | Year Ended December 31, | | |
| |
| |
| |
|
| Initial Shares | | 2004 | | 2003 | | 2002 | | 2001 | | 2000 |
| |
| |
| |
| |
| |
|
| Per Share Data ($): | | | | | | | | | | |
| Net asset value, beginning of period | | 34.42 | | 28.79 | | 34.98 | | 38.91 | | 39.87 |
| Investment Operations: | | | | | | | | | | |
| Investment income—net a | | .56 | | .43 | | .36 | | .30 | | .27 |
| Net realized and unrealized | | | | | | | | | | |
| gain (loss) on investments | | 1.18 | | 5.64 | | (6.19) | | (3.93) | | (.52) |
| Total from Investment Operations | | 1.74 | | 6.07 | | (5.83) | | (3.63) | | (.25) |
| Distributions: | | | | | | | | | | |
| Dividends from investment income—net | | (.60) | | (.44) | | (.36) | | (.30) | | (.26) |
| Dividends from net realized | | | | | | | | | | |
| gain on investments | | — | | — | | — | | — | | (.45) |
| Total Distributions | | (.60) | | (.44) | | (.36) | | (.30) | | (.71) |
| Net asset value, end of period | | 35.56 | | 34.42 | | 28.79 | | 34.98 | | 38.91 |
| |
| |
| |
| |
| |
|
| Total Return (%) | | 5.05 | | 21.17 | | (16.71) | | (9.31) | | (.65) |
| |
| |
| |
| |
| |
|
| Ratios/Supplemental Data (%): | | | | | | | | | | |
| Ratio of total expenses | | | | | | | | | | |
| to average net assets | | .79 | | .80 | | .78 | | .78 | | .78 |
| Ratio of net investment income | | | | | | | | | | |
| to average net assets | | 1.60 | | 1.41 | | 1.10 | | .84 | | .67 |
| Portfolio Turnover Rate | | 1.64 | | 4.60 | | 6.61 | | 4.19 | | 6.15 |
| |
| |
| |
| |
| |
|
| Net Assets, end of period ($ x 1,000) | | 766,169 | | 821,319 | | 722,706 | | 897,5351,009,713 |
a Based on average shares outstanding at each month end.
See notes to financial statements.
|
| | | | | | | Year Ended December 31, | | |
| | | |
| |
| |
|
| Service Shares | | 2004 | | 2003 | | 2002 | | 2001 | | 2000 a |
| |
| |
| |
| |
| |
|
| Per Share Data ($): | | | | | | | | | | |
| Net asset value, beginning of period | | 34.31 | | 28.71 | | 34.89 | | 38.91 | | 38.91 |
| Investment Operations: | | | | | | | | | | |
| Investment income—net | | .46b | | .36b | | .29b | | .18b | | — |
| Net realized and unrealized | | | | | | | | | | |
| gain (loss) on investments | | 1.19 | | 5.61 | | (6.17) | | (3.94) | | — |
| Total from Investment Operations | | 1.65 | | 5.97 | | (5.88) | | (3.76) | | — |
| Distributions: | | | | | | | | | | |
| Dividends from investment income—net | | (.50) | | (.37) | | (.30) | | (.26) | | — |
| Net asset value, end of period | | 35.46 | | 34.31 | | 28.71 | | 34.89 | | 38.91 |
| |
| |
| |
| |
| |
|
| Total Return (%) | | 4.80 | | 20.83 | | (16.89) | | (9.63) | | — |
| |
| |
| |
| |
| |
|
| Ratios/Supplemental Data (%): | | | | | | | | | | |
| Ratio of total expenses | | | | | | | | | | |
| to average net assets | | 1.04 | | 1.05 | | 1.02 | | 1.10 | | — |
| Ratio of net investment income | | | | | | | | | | |
| to average net assets | | 1.34 | | 1.16 | | .91 | | .53 | | — |
| Portfolio Turnover Rate | | 1.64 | | 4.60 | | 6.61 | | 4.19 | | 6.15 |
| |
| |
| |
| |
| |
|
| Net Assets, end of period ($ x 1,000) | | 80,529 | | 89,121 | | 60,572 | | 35,632 | | 1 |
| |
| a | | The portfolio commenced offering Service shares on December 31, 2000. | | | | | | |
| b | | Based on average shares outstanding at each month end. | | | | | | | | |
| See notes to financial statements. | | | | | | | | | | |
NOTES TO FINANCIAL STATEMENTS
NOTE 1—Significant Accounting Policies:
Dreyfus Variable Investment Fund (the “fund”) is registered under the Investment Company Act of 1940, as amended (the “Act”), as an open-end management investment company, operating as a series company currently offering twelve series, including the Appreciation Portfolio (the “portfolio”). The portfolio is only offered to separate accounts established by insurance companies to fund variable annuity contracts and variable life insurance policies.The portfolio is a diversified series. The portfolio’s investment objective is to provide long-term capital growth consistent with the preservation of capital. The Dreyfus Corporation (“Dreyfus”) serves as the portfolio’s investment adviser. Dreyfus is a wholly-owned subsidiary of Mellon Financial Corporation (“Mellon Financial”). Fayez Sarofim & Co. (“Sarofim”) serves as the portfolio’s sub-investment adviser.
Dreyfus Service Corporation (the “Distributor”), a wholly-owned subsidiary of the Manager, is the distributor of the portfolio’s shares, which are sold without a sales charge.The portfolio is authorized to issue an unlimited number of $.001 par value shares of Beneficial Interest in each of the following classes of shares: Initial and Service. Each class of shares has identical rights and privileges, except with respect to the distribution plan and the expenses borne by each class and certain voting rights. Income, expenses (other than expenses attributable to a specific class), and realized and unrealized gains or losses on investments are allocated to each class of shares based on its relative net assets.
The fund accounts separately for the assets, liabilities and operations of each series. Expenses directly attributable to each series are charged to that series’ operations; expenses which are applicable to all series are allocated among them on a pro rata basis.
The portfolio’s financial statements are prepared in accordance with U.S. generally accepted accounting principles, which may require the use of management estimates and assumptions.Actual results could differ from those estimates.
The fund enters into contracts that contain a variety of indemnifica-tions.The portfolio’s maximum exposure under these arrangements is unknown. The portfolio does not anticipate recognizing any loss related to these arrangements.
(a) Portfolio valuation: Investments in securities are valued at the last sales price on the securities exchange or national securities market on which such securities are primarily traded. Securities listed on the National Market System for which market quotations are available are valued at the official closing price or, if there is no official closing price that day, at the last sales price. Securities not listed on an exchange or the national securities market, or securities for which there were no transactions, are valued at the average of the most recent bid and asked prices, except for open short positions, where the asked price is used for valuation purposes. Bid price is used when no asked price is available. Investments in registered investment companies are valued at their net asset value. When market quotations or official closing prices are not readily available, or are determined not to reflect accurately fair value, such as when the value of a security has been significantly affected by events after the close of the exchange or market on which the security is principally traded (for example, a foreign exchange or market), but before the portfolio calculates its net asset value, the portfolio may value these investments at fair value as determined in accordance with the procedures approved by the Board of Trustees. Fair valuing of securities may be determined with the assistance of a pricing service using calculations based on indices of domestic securities and other appropriate indicators, such as prices of relevant ADR’s and futures contracts. For other securities that are fair valued by the Board of Trustees, certain factors may be considered such as: fundamental analytical data, the nature and duration of restrictions on disposition, an evaluation of the forces that influence the market in which the securities are purchased and sold and public trading in similar securities of the issuer or comparable issuers. Investments denominated in foreign cur-
NOTES TO FINANCIAL STATEMENTS (continued)
|
rencies are translated to U.S. dollars at the prevailing rates of exchange. Forward currency exchange contracts are valued at the forward rate.
(b) Foreign currency transactions: The portfolio does not isolate that portion of the results of operations resulting from changes in foreign exchange rates on investments from the fluctuations arising from changes in market prices of securities held. Such fluctuations are included with the net realized and unrealized gain or loss on investments.
Net realized foreign exchange gains or losses arise from sales and maturities of short-term securities, sales of foreign currencies, currency gains or losses realized on securities transactions and the difference between the amounts of dividends, interest and foreign withholding taxes recorded on the portfolio’s books and the U.S. dollar equivalent of the amounts actually received or paid. Net unrealized foreign exchange gains or losses arise from changes in the value of assets and liabilities other than investments in securities, resulting from changes in exchange rates. Such gains and losses are included with net realized and unrealized gain or loss on investments.
(c) Securities transactions and investment income: Securities transactions are recorded on a trade date basis. Realized gain and loss from securities transactions are recorded on the identified cost basis. Dividend income is recognized on the ex-dividend date and interest income, including, where applicable, accretion of discount and amortization of premium on investments, is recognized on the accrual basis.
The portfolio has an arrangement with the custodian bank whereby the portfolio receives earnings credits from the custodian when positive cash balances are maintained, which are used to offset custody fees. For financial reporting purposes, the portfolio includes net earnings credits, if any, as an expense offset in the Statement of Operations.
Pursuant to a securities lending agreement with Mellon Bank, N.A., an affiliate of Dreyfus, the portfolio may lend securities to qualified institutions.At origination, all loans are secured by collateral of at least
102% of the value of U.S. securities loaned and 105% of the value of foreign securities loaned. Collateral equivalent to at least 100% of the market value of securities on loan will be maintained at all times. Cash collateral is invested in certain money market mutual funds managed by Dreyfus. The portfolio will be entitled to receive all income on securities loaned, in addition to income earned as a result of the lending transaction. Although each security loaned is fully collateralized, the portfolio would bear the risk of delay in recovery of, or loss of rights in, the securities loaned should a borrower fail to return the securities in a timely manner.
(d) Affiliated issuers: Investments in other investment companies advised by Dreyfus are defined as “affiliated” in the Act.
(e) Dividends to shareholders: Dividends are recorded on the ex-dividend date. Dividends from investment income-net and dividends from net realized capital gain, if any, are normally declared and paid annually, but the portfolio may make distributions on a more frequent basis to comply with the distribution requirements of the Internal Revenue Code of 1986, as amended (the “Code”).To the extent that net realized capital gain can be offset by capital loss carryovers, it is the policy of the portfolio not to distribute such gain. Income and capital gain distributions are determined in accordance with income tax regulations, which may differ from U.S. generally accepted accounting principles.
(f) Federal income taxes: It is the policy of the portfolio to continue to qualify as a regulated investment company, if such qualification is in the best interests of its shareholders, by complying with the applicable provisions of the Code, and to make distributions of taxable income sufficient to relieve it from substantially all federal income and excise taxes.
At December 31, 2004, the components of accumulated earnings on a tax basis were as follows: undistributed ordinary income $130,363, accumulated capital losses $57,003,881 and unrealized appreciation $175,571,631.
NOTES TO FINANCIAL STATEMENTS (continued)
|
The accumulated capital loss carryover is available to be applied against future net securities profits, if any, realized subsequent to December 31, 2004. If not applied, $6,595,648 of the carryover expires in fiscal 2009, $23,015,684 expires in fiscal 2010, $20,683,522 expires in fiscal 2011 and $6,709,027 expires in fiscal 2012.
The tax character of distributions paid to shareholders during the fiscal periods ended December 31, 2004 and December 31, 2003 were as follows: ordinary income $13,820,240 and $11,422,888, respectively.
During the period ended December 31, 2004, as a result of permanent book to tax differences primarily due to the tax treatment for foreign currency transactions, the portfolio increased accumulated undistributed investment income-net by $1,784 and decreased accumulated net realized gain (loss) on investments by the same amount. Net assets were not affected by this reclassification.
NOTE 2—Bank Line of Credit:
|
The portfolio participates with other Dreyfus-managed funds in a $350 million redemption credit facility (the “Facility”) to be utilized for temporary or emergency purposes, including the financing of redemptions. In connection therewith, the portfolio has agreed to pay commitment fees on its pro rata portion of the Facility. Interest is charged to the portfolio at rates based on prevailing market rates in effect at the time of borrowings.
The average daily amount of borrowings outstanding during the period ended December 31, 2004 was approximately $1,175,300, with a related weighted average annualized interest rate of 1.81% .
NOTE 3—Investment Advisory Fee, Sub-Investment Advisory Fee and Other Transactions With Affiliates:
(a) Pursuant to an Investment Advisory Agreement with Dreyfus, the investment advisory fee is based on the value of the portfolio’s average daily net assets and is computed at the following annual rates: .55 of 1% of the first $150 million; .50 of 1% of the next $150 million; and
.375 of 1% over $300 million.The fee is payable monthly. Pursuant to a Sub-Investment Advisory Agreement with Sarofim, the sub-investment advisory fee is based upon the value of the portfolio’s average daily net assets and is computed at the following annual rates: .20 of 1% of the first $150 million; .25 of 1% of the next $150 million; and .375 of 1% over $300 million.The fee is payable monthly.
(b) Under the Distribution Plan (the “Plan”) adopted pursuant to Rule 12b-1 under the Act, Service shares pay the Distributor for distributing their shares, for servicing and/or maintaining Service shares shareholder accounts and for advertising and marketing for Service shares.The Plan provides for payments to be made at an annual rate of .25 of 1% of the value of the Service shares’ average daily net assets. The Distributor may make payments to Participating Insurance Companies and to brokers and dealers acting as principal underwriter for their variable insurance products.The fees payable under the Plan are payable without regard to actual expenses incurred. During the period ended December 31, 2004, Service shares were charged $203,374 pursuant to the Plan.
The portfolio compensates Dreyfus Transfer, Inc., a wholly-owned subsidiary of Dreyfus, under a transfer agency agreement for providing personnel and facilities to perform transfer agency services for the portfolio. During the period ended December 31, 2004, the portfolio was charged $486 pursuant to the transfer agency agreement.
The portfolio compensates Mellon Bank, N.A., an affiliate of Dreyfus, under a custody agreement to provide custodial services for the portfolio. During the period ended December 31, 2004, the portfolio was charged $64,246 pursuant to the custody agreement.
The components of Due to The Dreyfus Corporation and affiliates in the Statement of Assets and Liabilities consist of: management fees $305,575, Rule 12b-1 distribution plan fees $16,790, custodian fees $10,065 and transfer agency per account fees $152.
NOTES TO FINANCIAL STATEMENTS (continued)
|
(c) Each Board member also serves as a Board member of other funds within the Dreyfus complex. Annual retainer fees and attendance fees are allocated to each fund based on net assets.
(d) Pursuant to an exemptive order from the Securities and Exchange Commission, the portfolio may invest its available cash in affiliated money market mutual funds. Management fees of the underlying money market mutual funds have been waived by Dreyfus.
(e) During the period ended December 31, 2004, the portfolio incurred total brokerage commissions of $114,930 of which $240 was paid to Harborside Plus Inc., a wholly-owned subsidiary of Mellon Financial.
NOTE 4—Securities Transactions:
|
The aggregate amount of purchases and sales of investment securities, excluding short-term securities, during the period ended December 31, 2004, amounted to $14,281,877 and $104,499,369, respectively.
At December 31, 2004, the cost of investments for federal income tax purposes was $672,400,432; accordingly, accumulated net unrealized appreciation on investments was $175,571,631, consisting of $207,994,545 gross unrealized appreciation and $32,422,914 gross unrealized depreciation.
In early 2004, two purported class and derivative actions were filed against Mellon Financial, Mellon Bank, N.A., Dreyfus, Founders Asset Management LLC, and certain directors of the Dreyfus Funds and the Dreyfus Founders Funds (together, the ��Funds”). In September 2004, plaintiffs served a Consolidated Amended Complaint (the “Amended Complaint”) on behalf of a purported class of all persons who acquired interests in any of the Funds between January 30, 1999 and November 17, 2003, and derivatively on behalf of the Funds. The Amended Complaint in the newly styled In re Dreyfus Mutual Funds Fee Litigation also named the Distributor, Premier Mutual Fund Services, Inc. and two additional Fund directors as defendants and alleges viola-
tions of the Investment Company Act of 1940, the Investment Advisers Act of 1940, the Pennsylvania Unfair Trade Practices and Consumer Protection Law and common-law claims. Plaintiffs seek to recover allegedly improper and excessive Rule 12b-1 and advisory fees allegedly charged to the Funds for marketing and distribution services. More specifically, plaintiffs claim, among other things, that 12b-1 fees and directed brokerage were improperly used to pay brokers to recommend the Funds over other funds, and that such payments were not disclosed to investors. In addition, plaintiffs assert that economies of scale and soft-dollar benefits were not passed on to the Funds. Plaintiffs further allege that 12b-1 fees were improperly charged to certain of the Funds that were closed to new investors.The Amended Complaint seeks compensatory and punitive damages, rescission of the advisory contracts, and an accounting and restitution of any unlawful fees, as well as an award of attorneys’ fees and litigation expenses. As noted, some of the claims in this litigation are asserted derivatively on behalf of the Funds that have been named as nominal defendants. With respect to such derivative claims, no relief is sought against the Funds. Dreyfus believes the allegations to be totally without merit and intends to defend the action vig-orously.Defendants filed motions to dismiss the Amended Complaint on November 12, 2004, and those motions are pending.
Additional lawsuits arising out of these circumstances and presenting similar allegations and requests for relief may be filed against the defendants in the future. Neither Dreyfus nor the Funds believe that any of the pending actions will have a material adverse effect on the Funds or Dreyfus’ ability to perform its contract with the Funds.
| REPORT OF INDEPENDENT REGISTERED |
| PUBLIC ACCOUNTING FIRM |
Shareholders and Board of Trustees
Dreyfus Variable Investment Fund, Appreciation Portfolio
We have audited the accompanying statement of assets and liabilities, including the statement of investments, of Dreyfus Variable Investment Fund, Appreciation Portfolio (one of the funds comprising Dreyfus Variable Investment Fund) as of December 31, 2004, and the related statement of operations for the year then ended, the statement of changes in net assets for each of the two years in the period then ended, and financial highlights for each of the periods indicated therein.These financial statements and financial highlights are the responsibility of the Fund’s management. Our responsibility is to express an opinion on these financial statements and financial highlights based on our audits.
We conducted our audits in accordance with the standards of the Public Company Accounting Oversight Board (United States).Those standards require that we plan and perform the audit to obtain reasonable assurance about whether the financial statements and financial highlights are free of material misstatement. An audit includes examining, on a test basis, evidence supporting the amounts and disclosures in the financial statements and financial highlights. Our procedures included verification by examination of securities held by the custodian as of December 31, 2004 and confirmation of securities not held by the custodian by correspondence with others. An audit also includes assessing the accounting principles used and significant estimates made by management, as well as evaluating the overall financial statement presentation.We believe that our audits provide a reasonable basis for our opinion.
In our opinion, the financial statements and financial highlights referred to above present fairly, in all material respects, the financial position of Dreyfus Variable Investment Fund,Appreciation Portfolio at December 31, 2004, the results of its operations for the year then ended, the changes in its net assets for each of the two years in the period then ended, and the financial highlights for each of the indicated periods, in conformity with U.S. generally accepted accounting principles.
New York, New York
February 4, 2005
|
IMPORTANT TAX INFORMATION (Unaudited)
For federal tax purposes, the portfolio hereby designates 100% of the ordinary dividends paid during the fiscal year ended December 31, 2004 as qualifying for the corporate dividends received deduction. Shareholders will receive notification in January 2005 of the percentage applicable to the preparation of their 2004 income tax returns.
BOARD MEMBERS INFORMATION (Unaudited)
Joseph S. DiMartino (61)
Chairman of the Board (1995)
|
Principal Occupation During Past 5 Years:
• Corporate Director and Trustee
|
Other Board Memberships and Affiliations:
|
- The Muscular Dystrophy Association, Director
- Levcor International, Inc., an apparel fabric processor, Director
- Century Business Services, Inc., a provider of outsourcing functions for small and medium size companies, Director
- The Newark Group, a provider of a national market of paper recovery facilities, paperboard mills and paperboard converting plants, Director
- Azimuth Trust, an institutional asset management firm, Member of Board of Managers and Advisory Board
No. of Portfolios for which Board Member Serves: 186
David P. Feldman (65)
Board Member (1994)
|
Principal Occupation During Past 5 Years:
• Corporate Director and Trustee
|
Other Board Memberships and Affiliations:
|
- BBH Mutual Funds Group (11 funds), Director
- The Jeffrey Company, a private investment company, Director
- QMED, a medical device company, Director
No. of Portfolios for which Board Member Serves: 51
———————
James F. Henry (74)
Board Member (1990)
|
Principal Occupation During Past 5 Years:
|
- President, CPR Institute for Dispute Resolution, a non-profit organization principally engaged in the development of alternatives to business litigation (Retired 2003)
No. of Portfolios for which Board Member Serves: 22
|
———————
Rosalind Gersten Jacobs (79)
Board Member (1990)
|
Principal Occupation During Past 5 Years:
• Merchandise and marketing consultant
|
No. of Portfolios for which Board Member Serves: 33
|
| | Dr. Paul A. Marks (78)
Board Member (1990)
|
Principal Occupation During Past 5 Years:
• President and Chief Executive Officer of Memorial Sloan-Kettering Cancer Center (Retired 1999)
Other Board Memberships and Affiliations:
- Pfizer, Inc., a pharmaceutical company, Director-Emeritus
- Atom Pharm, Director
- Lazard Freres & Company, LLC, Senior Adviser
- Merck, Consultant
No. of Portfolios for which Board Member Serves: 22
| | Dr. Martin Peretz (65)
Board Member (1990)
|
Principal Occupation During Past 5 Years:
- Editor-in-Chief of The New Republic Magazine
- Lecturer in Social Studies at Harvard University (1965-2001)
- Co-Chairman of TheStreet.com, a financial daily on the web
Other Board Memberships and Affiliations:
- Academy for Liberal Education, an accrediting agency for colleges and universities certified by the U.S. Department of Education, Director
- Digital Learning Group, LLC, an online publisher of college textbooks, Director
- Harvard Center for Blood Research,Trustee
- Bard College,Trustee
- YIVO Institute for Jewish Research,Trustee
No. of Portfolios for which Board Member Serves: 22
| | Bert W.Wasserman (72)
Board Member (1993)
|
Principal Occupation During Past 5 Years:
• Financial Consultant
Other Board Memberships and Affiliations:
• Lillian Vernon Corporation, Director
No. of Portfolios for which Board Member Serves: 22
———————
Once elected all Board Members serve for an indefinite term.The address of the Board Members and Officers is in c/o The Dreyfus Corporation, 200 Park Avenue, New York, New York 10166.Additional information about the Board Members is available in the fund’s Statement of Additional Information which can be obtained from Dreyfus free of charge by calling this toll free number: 1-800-554-4611.
| John M. Fraser, Jr., Emeritus Board Member |
| Irving Kristol, Emeritus Board Member |
OFFICERS OF THE FUND (Unaudited)
| STEPHEN E. CANTER, President since | | MICHAEL A. ROSENBERG, Secretary since |
| March 2000. | | March 2000. |
| Chairman of the Board, Chief Executive | | Associate General Counsel of Dreyfus, and an |
| Officer and Chief Operating Officer of | | officer of 90 investment companies (comprised |
| Dreyfus, and an officer of 92 investment | | of 194 portfolios) managed by Dreyfus. He is |
| companies (comprised of 185 portfolios) | | 44 years old and has been an employee of |
| managed by Dreyfus. Mr. Canter also is a | | Dreyfus since October 1991. |
| |
| Board member and, where applicable, an | | ROBERT R. MULLERY, Assistant Secretary |
| Executive Committee Member of the other | | since March 2000. |
| investment management subsidiaries of Mellon | | |
| Financial Corporation, each of which is an | | Associate General Counsel of Dreyfus, and an |
| affiliate of Dreyfus. He is 59 years old and has | | officer of 26 investment companies (comprised |
| been an employee of Dreyfus since May 1995. | | of 60 portfolios) managed by Dreyfus. He is 52 |
| | | years old and has been an employee of Dreyfus |
| STEPHEN R. BYERS, Executive Vice | | since May 1986. |
| President since November 2002. | | |
| | | STEVEN F. NEWMAN, Assistant Secretary |
| Chief Investment Officer,Vice Chairman and a | | since March 2000. |
| director of Dreyfus, and an officer of 92 | | |
| investment companies (comprised of 185 | | Associate General Counsel and Assistant |
| portfolios) managed by Dreyfus. Mr. Byers also | | Secretary of Dreyfus, and an officer of 93 |
| is an officer, director or an Executive | | investment companies (comprised of 201 |
| Committee Member of certain other | | portfolios) managed by Dreyfus. He is 55 years |
| investment management subsidiaries of Mellon | | old and has been an employee of Dreyfus since |
| Financial Corporation, each of which is an | | July 1980. |
| affiliate of Dreyfus. He is 51 years old and has | | JAMES WINDELS, Treasurer since |
| been an employee of Dreyfus since January | | November 2001. |
| 2000. Prior to joining Dreyfus, he served as an | | |
| Executive Vice President-Capital Markets, | | Director – Mutual Fund Accounting of Dreyfus, |
| Chief Financial Officer and Treasurer at | | and an officer of 93 investment companies |
| Gruntal & Co., L.L.C. | | (comprised of 201 portfolios) managed by |
| | | Dreyfus. He is 46 years old and has been an |
| MARK N. JACOBS, Vice President since | | employee of Dreyfus since April 1985. |
| March 2000. | | |
| | | RICHARD CASSARO, Assistant Treasurer |
| Executive Vice President, Secretary and | | since August 2003. |
| General Counsel of Dreyfus, and an officer of | | |
| 93 investment companies (comprised of 201 | | Senior Accounting Manager – Equity Funds of |
| portfolios) managed by Dreyfus. He is 58 years | | Dreyfus, and an officer of 26 investment |
| old and has been an employee of Dreyfus since | | companies (comprised of 102 portfolios) |
| June 1977. | | managed by Dreyfus. He is 44 years old and |
| | | has been an employee of Dreyfus since |
| | | September 1982. |
| ERIK D. NAVILOFF, Assistant Treasurer | | JOSEPH W. CONNOLLY, Chief Compliance |
| since December 2002. | | Officer since October 2004. |
| Senior Accounting Manager – Taxable Fixed | | Chief Compliance Officer of Dreyfus and The |
| Income Funds of Dreyfus, and an officer of 19 | | Dreyfus Family of Funds (93 investment |
| investment companies (comprised of 75 | | companies, comprising 201 portfolios). From |
| portfolios) managed by Dreyfus. He is 36 years | | November 2001 through March 2004, Mr. |
| old and has been an employee of Dreyfus since | | Connolly was first Vice-President, Mutual Fund |
| November 1992. | | Servicing for Mellon Global Securities |
| |
| ROBERT ROBOL, Assistant Treasurer | | Services. In that capacity, Mr. Connolly was |
| since August 2003. | | responsible for managing Mellon’s Custody, |
| | | Fund Accounting and Fund Administration |
| Senior Accounting Manager – Money Market | | services to third-party mutual fund clients. He |
| Funds of Dreyfus, and an officer of 39 | | is 47 years old and has served in various |
| investment companies (comprised of 84 | | capacities with Dreyfus since 1980, including |
| portfolios) managed by Dreyfus. He is 40 years | | manager of the firm’s Fund Accounting |
| old and has been an employee of Dreyfus since | | Department from 1997 through October 2001. |
| October 1988. | | |
| | | WILLIAM GERMENIS, Anti-Money |
| ROBERT SVAGNA, Assistant Treasurer | | Laundering Compliance Officer since |
| since December 2002. | | September 2002. |
| Senior Accounting Manager – Equity Funds of | | Vice President and Anti-Money Laundering |
| Dreyfus, and an officer of 27 investment | | Compliance Officer of the Distributor, and the |
| companies (comprised of 107 portfolios) | | Anti-Money Laundering Compliance Officer |
| managed by Dreyfus. He is 37 years old and | | of 88 investment companies (comprised of 196 |
| has been an employee of Dreyfus since | | portfolios) managed by Dreyfus. He is 34 years |
| November 1990. | | old and has been an employee of the |
| KENNETH J. SANDGREN, Assistant | | Distributor since October 1998. |
| Treasurer since November 2001. | | |
| Mutual Funds Tax Director of Dreyfus, and an | | |
| officer of 93 investment companies (comprised | | |
| of 201 portfolios) managed by Dreyfus. He is | | |
| 50 years old and has been an employee of | | |
| Dreyfus since June 1993. | | |
NOTES
For More Information
| Dreyfus Variable |
| Investment Fund, |
| Appreciation Portfolio |
| 200 Park Avenue |
| New York, NY 10166 |
| |
| Investment Adviser |
| The Dreyfus Corporation |
| 200 Park Avenue |
| New York, NY 10166 |
| |
| Sub-Investment Advisor |
| Fayez Sarofim & Co. |
| Two Houston Center |
| Suite 2907 |
| Houston,TX 77010 |
| Custodian |
| Mellon Bank, N.A. |
| One Mellon Bank Center |
| Pittsburgh, PA 15258 |
| |
| Transfer Agent & |
| Dividend Disbursing Agent |
| Dreyfus Transfer, Inc. |
| 200 Park Avenue |
| New York, NY 10166 |
| |
| Distributor |
| Dreyfus Service Corporation |
| 200 Park Avenue |
| New York, NY 10166 |
Telephone 1-800-554-4611 or 516-338-3300
Mail The Dreyfus Family of Funds, 144 Glenn Curtiss Boulevard, Uniondale, NY 11556-0144 Attn: Institutional Servicing
The portfolio files its complete schedule of portfolio holdings with the Securities and
Exchange Commission (“SEC”) for the first and third quarters of each fiscal year on Form N-Q. The portfolio’s Forms N-Q are available on the SEC’s website at http://www.sec.gov and may be reviewed and copied at the SEC’s Public Reference Room in Washington, DC. Information on the operation of the Public Reference Room may be obtained by calling 1-800-SEC-0330.
A description of the policies and procedures that the portfolio uses to determine how to vote proxies relating to portfolio securities, and information regarding how the portfolio voted these proxies for the 12-month period ended June 30, 2004, is available through the portfolio’s website at http://www.dreyfus.com and on the SEC’s website at http://www.sec.gov. The description of the policies and procedures is also available without charge, upon request, by calling 1-800-645-6561.
© 2005 Dreyfus Service Corporation

| Dreyfus Variable |
| Investment Fund, |
| Balanced Portfolio |
| ANNUAL REPORT December 31, 2004 |

The views expressed in this report reflect those of the portfolio manager only through the end of the period covered and do not necessarily represent the views of Dreyfus or any other person in the Dreyfus organization.Any such views are subject to change at any time based upon market or other conditions and Dreyfus disclaims any responsibility to update such views. These views may not be relied on as investment advice and, because investment decisions for a Dreyfus portfolio are based on numerous factors, may not be relied on as an indication of trading intent on behalf of any Dreyfus portfolio.
Not FDIC-Insured • Not Bank-Guaranteed • May Lose Value
| | | Contents |
| |
| | | T H E P O R T F O L I O |
| |
|
| 2 | | Letter from the Chairman |
| 3 | | Discussion of Performance |
| 6 | | Portfolio Performance |
| 8 | | Understanding Your Portfolio’s Expenses |
| 8 | | Comparing Your Portfolio’s Expenses |
| | | With Those of Other Funds |
| 9 | | Statement of Investments |
| 16 | | Statement of Assets and Liabilities |
| 17 | | Statement of Operations |
| 18 | | Statement of Changes in Net Assets |
| 20 | | Financial Highlights |
| 22 | | Notes to Financial Statements |
| 31 | | Report of Independent Registered |
| | | Public Accounting Firm |
| 32 | | Important Tax Information |
| 32 | | Proxy Results |
| 33 | | Board Members Information |
| 35 | | Officers of the Fund |
| | | F O R M O R E I N F O R M AT I O N |
| |
|
| | | Back Cover |
| Dreyfus Variable Investment Fund, |
| Balanced Portfolio |

LETTER FROM THE CHAIRMAN
We are pleased to present this annual report for Dreyfus Variable Investment Fund, Balanced Portfolio, covering the 12-month period from January 1, 2004, through December 31, 2004. Inside, you’ll find valuable information about how the portfolio was managed during the reporting period, including a discussion with the portfolio managers, Thomas Plumb, David Duchow, Timothy O’Brien and Clint Oppermann, of Wisconsin Capital Management, Inc., the portfolio’s sub-investment adviser.
2004 represented another year of positive performance for both stocks and bonds. Unlike the 2003 rallies, however, in which rising prices were primarily the result of generally improving business conditions, 2004’s performance largely reflected the strengths and weaknesses of individual issuers and market sectors.As a result, fundamental research and professional judgment became more important determinants of mutual fund performance in 2004.
What’s ahead for stocks and bonds in 2005? No one knows for certain. Positive influences remain in place, including moderately expanding U.S. and global economies and low inflation. Nonetheless, a number of risks — such as rising interest rates and global terrorism — could threaten the market environment.
As always, we urge our shareholders to view the financial markets from a long-term perspective, measured in years rather than weeks or months. One of the best ways to ensure a long-term perspective is to establish an investment plan with the help of your financial advisor, and review it periodically to track your progress toward your financial goals.
Thank you for your continued confidence and support.


DISCUSSION OF PERFORMANCE
Thomas Plumb, David Duchow, Timothy O’Brien and Clint Oppermann, Portfolio Managers Wisconsin Capital Management, Inc., Sub-Investment Adviser
How did Dreyfus Variable Investment Fund, Balanced Portfolio perform relative to its benchmark?
For the 12-month period ending December 31, 2004, the portfolio’s total returns were 5.64% for its Initial shares and 5.57% for its Service shares.1 In comparison, the portfolio’s benchmark, a hybrid index composed of 60% Standard & Poor’s 500 Composite Stock Price Index (the “S&P 500 Index”) and 40% Lehman Brothers U.S. Aggregate Index (the “Lehman Aggregate Index”), achieved a total return of 8.26% for the reporting period.2 Separately, the S&P 500 Index and the Lehman Aggregate Index achieved total returns of 11.04% and 4.34%, respectively, for the reporting period.
Both stocks and bonds produced generally positive returns in 2004 as a growing economy and low inflation offset headwinds caused by rising interest rates, higher energy prices and geopolitical concerns. The portfolio’s returns were modestly lower than its benchmark, primarily due to its security selection strategy and its relatively heavy allocation to stocks over bonds.
We are pleased to announce that on December 10, 2004, Wisconsin Capital Management, Inc. assumed responsibility as sub-investment adviser of the portfolio following shareholder approval of a Sub-Investment Advisory Agreement between The Dreyfus Corporation and Wisconsin Capital Management, Inc.
What is the portfolio’s investment approach?
The portfolio seeks high total return through a combination of capital appreciation and current income. To pursue this goal, the portfolio invests in a diversified mix of stocks and bonds of both U.S. and foreign issuers.The portfolio’s normal asset allocation is approximately 60% stocks and 40% bonds. However, the portfolio is permitted to invest up to 75%, and as little as 40%, of its assets in stocks and up to 60%, and as little as 25%, of its assets in bonds.
The portfolio’s stock investments may include common stocks, preferred stocks and convertible securities, including those purchased in initial public offerings or shortly thereafter.
In choosing stocks, the portfolio employs fundamental analysis, generally seeking companies with strong positions in their industries, and companies with a catalyst that can trigger a price increase (such as
DISCUSSION OF PERFORMANCE (continued)
|
accelerating earnings growth, a corporate restructuring or change in management). The portfolio managers seek to create a broadly diversified core portfolio comprised of growth stocks, value stocks and stocks that exhibit characteristics of both investment styles.The managers select stocks based on: value, or how a stock is priced relative to its perceived intrinsic worth; growth, in this case the sustainability or growth of earnings or cash flow; and financial profile, which measures the financial health of the company.
In choosing bonds and other fixed-income securities, the portfolio managers review economic, market and other factors, leading to valuations by sector, maturity and quality.
In allocating assets between stocks and bonds, the portfolio managers assess the relative return and risks of each asset class, analyzing several factors, including interest-rate-adjusted price/earnings ratios, the valuation and volatility levels of stocks relative to bonds, and other economic factors, such as interest rates.
What other factors influenced the portfolio’s performance?
For much of the reporting period, lackluster economic growth and rising interest rates held back the stock market’s returns. However, stocks rallied strongly during the final two months of the year, after uncertainty surrounding the U.S. presidential election dissipated. Despite rising interest rates during the second half of the year, bonds also fared relatively well as inflation remained persistently low, with corporate bonds producing particularly attractive results.
In addition to benefiting from a relatively heavy emphasis on equities during the stock market’s rally toward the end of the year, the portfolio also received strong contributions from its consumer discretionary holdings early in the year and financial stocks during the reporting period’s second half. Top performers in the consumer discretionary sector included a number of specialty retailers, while winners in the financials sector included mortgage originator Countrywide Financial, credit card issuer Capital One Financial and government-sponsored enterprise Freddie Mac.
Energy stocks gained value when oil and gas prices surged during the spring and summer of 2004, driving higher the stocks of independent energy companies XTO Energy and Anadarko Petroleum. Health care stocks also produced positive returns overall, with strength among medical devices and equipment companies offsetting weakness among large pharmaceutical producers. For example, defibrillator manufacturer St. Jude Medical and coated stent maker Guidant contributed strongly to the portfolio’s performance.
On the other hand, the portfolio’s equity returns were constrained primarily by a handful of disappointments in the telecommunications, industrials and consumer staples sectors. Food producer Dean Foods,
European discount airline Ryanair and U.S. railroad CSX Corporation ranked among the greatest detractors from the portfolio’s performance for the reporting period.
For much of the year, the portfolio’s bond portfolio was structured to approximate the composition of the Lehman Aggregate Index. Later, we focused primarily on short-maturity bonds, including single-A rated corporate bonds and U.S. government securities. This strategy was designed to manage the risks of rising short-term interest rates in a strengthening economy.
What is the portfolio’s current strategy?
We have continued to emphasize stocks over bonds. However, we have reduced the portfolio’s equity holdings from approximately 90 stocks to around 50 stocks in which we have a high degree of confidence.We have focused primarily on what we believe to be growing companies available at reasonable prices. Recently, we have identified a number of such opportunities among major drug distributors, for-profit education providers and software developers serving the financial services industry. On the other hand, we have identified relatively few reasonably valued opportunities in the energy sector, where values rose sharply in 2004. The portfolio’s fixed-income holdings have continued to focus on shorter-term, investment-grade securities. In our view, this is a prudent strategy in a rising interest-rate environment.
| | | The portfolio is only available as a funding vehicle under variable life insurance policies or variable |
| | | annuity contracts issued by insurance companies. Individuals may not purchase shares of the |
| | | portfolio directly.A variable annuity is an insurance contract issued by an insurance company that |
| | | enables investors to accumulate assets on a tax-deferred basis for retirement or other long-term |
| | | goals.The investment objective and policies of Dreyfus Variable Investment Fund, Balanced |
| | | Portfolio made available through insurance products may be similar to other funds/portfolios |
| | | managed or advised by Dreyfus. However, the investment results of the portfolio may be higher or |
| | | lower than, and may not be comparable to, those of any other Dreyfus fund/portfolio. |
| 1 | | Total return includes reinvestment of dividends and any capital gains paid. Past performance is no |
| | | guarantee of future results. Share price and investment return fluctuate such that upon redemption, |
| | | portfolio shares may be worth more or less than their original cost.The portfolio’s performance does |
| | | not reflect the deduction of additional charges and expenses imposed in connection with investing |
| | | in variable insurance contracts, which will reduce returns. Return figures provided reflect the |
| | | absorption of portfolio expenses by The Dreyfus Corporation pursuant to an agreement in effect |
| | | through December 31, 2005, at which time it may be extended, terminated or modified. Had |
| | | these expenses not been absorbed, the portfolio’s returns would have been lower. |
| 2 | | SOURCE: LIPPER INC. — Reflects the reinvestment of dividends and, where applicable, |
| | | capital gain distributions.The Standard & Poor’s 500 Composite Stock Price Index (“S&P 500 |
| | | Index”) is a widely accepted, unmanaged index of U.S. stock market performance.The Lehman |
| | | Brothers U.S.Aggregate Index is a widely accepted, unmanaged total return index of corporate, |
| | | U.S. government and U.S. government agency debt instruments, mortgage-backed securities and |
| | | asset-backed securities with an average maturity of 1-10 years. |
| Average Annual Total Returns as | | of 12/31/04 | | | | |
| | | Inception | | | | | | From |
| | | Date | | 1 Year | | 5 Years | | Inception |
| |
| |
| |
| |
|
| Initial shares | | 5/1/97 | | 5.64% | | (1.44)% | | 5.04% |
| Service shares | | 5/1/97 | | 5.57% | | (1.55)% | | 4.96% |
| The data for Service shares includes the results of Initial shares for the period prior to December 31, 2000 |
| (inception date of Service shares). Actual Service shares’ average annual total return and hypothetical growth |
| results would have been lower. See notes below. |
| † Source: Lipper Inc. |
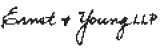
| Past performance is not predictive of future performance.The portfolio’s performance shown in the graph and table does not |
| reflect the deduction of taxes that a shareholder would pay on portfolio distributions or the redemption of portfolio shares. |
| The portfolio’s performance does not reflect the deduction of additional charges and expenses imposed in |
| connection with investing in variable insurance contracts which will reduce returns. |
| The above graph compares a $10,000 investment made in Initial and Service shares of Dreyfus Variable Investment |
| Fund, Balanced Portfolio on 5/1/97 (inception date of Initial shares) to a $10,000 investment made in each of the |
| 6 |
Standard & Poor’s 500 Composite Stock Price Index (the “S&P 500 Index”), the Lehman Brothers U.S.Aggregate Index (the “Lehman Index”) and a hybrid index composed of 60% S&P 500 Index and 40% Lehman Index (the “Hybrid Index”).The Hybrid Index is calculated on a year-to-year basis.
The portfolio’s Initial shares are not subject to a Rule 12b-1 fee.The portfolio’s Service shares are subject to a 0.25% annual Rule 12b-1 fee.The performance figures for Service shares reflect the performance of the portfolio’s Initial shares from their inception date through December 30, 2000, and the performance of the portfolio’s Service shares from December 31, 2000 (inception date of Service shares) to December 31, 2004 (blended performance figures).The performance figures for each share class reflect certain expense reimbursements, without which the performance of each share class would have been lower. In addition, the blended performance figures have not been adjusted to reflect the higher operating expenses of the Service shares. If these expenses had been reflected, the blended performance figures would have been lower. All dividends and capital gain distributions are reinvested.
The portfolio’s performance shown in the line graph takes into account all applicable portfolio fees and expenses (after any expense reimbursements).The S&P 500 Index is a widely accepted, unmanaged index of U.S. stock market performance.The Lehman Index is a widely accepted, unmanaged total return index of corporate, U.S. government and U.S. government agency debt instruments, mortgage-backed securities and asset-backed securities with an average maturity of 1-10 years.The indices do not take into account charges, fees and other expenses. Further information relating to portfolio performance, including expense reimbursements, if applicable, is contained in the Financial Highlights section of the prospectus and elsewhere in this report.
| UNDERSTANDING YOUR |
| PORTFOLIO’S EXPENSES (Unaudited) |
As a mutual fund investor,you pay ongoing expenses,such as management fees and other expenses.Using the information below,you can estimate how these expenses affect your investment and compare them with the expenses of other funds.You also may pay one-time transaction expenses,including sales charges (loads) and redemption fees, which are not shown in this section and would have resulted in higher total expenses. For more information, see your portfolio’s prospectus or talk to your financial adviser.
Review your portfolio’s expenses
|
The table below shows the expenses you would have paid on a $1,000 investment in Dreyfus Variable Investment Fund, Balanced Portfolio from July 1, 2004 to December 31, 2004. It also shows how much a $1,000 investment would be worth at the close of the period, assuming actual returns and expenses.
| Expenses and Value of a $1,000 Investment | | |
| assuming actual returns for the six months ended December 31, 2004 |
| | | Initial Shares | | Service Shares |
| |
| |
|
| Expenses paid per $1,000 † | | $ 4.65 | | $ 5.16 |
| Ending value (after expenses) | | $1,054.10 | | $1,054.20 |
| COMPARING YOUR PORTFOLIO’S EXPENSES |
| WITH THOSE OF OTHER FUNDS (Unaudited) |
Using the SEC’s method to compare expenses
The Securities and Exchange Commission (SEC) has established guidelines to help investors assess fund expenses. Per these guidelines, the table below shows your portfolio’s expenses based on a $1,000 investment, assuming a hypothetical 5% annualized return. You can use this information to compare the ongoing expenses (but not transaction expenses or total cost) of investing in the portfolio with those of other funds. All mutual fund shareholder reports will provide this information to help you make this comparison. Please note that you cannot use this information to estimate your actual ending account balance and expenses paid during the period.
Expenses and Value of a $1,000 Investment assuming a hypothetical 5% annualized return for the six months ended December 31, 2004
| | | Initial Shares | | Service Shares |
| |
| |
|
| Expenses paid per $1,000 † | | $ 4.57 | | $ 5.08 |
| Ending value (after expenses) | | $1,020.61 | | $1,020.11 |
| † Expenses are equal to the portfolio’s annualized expense ratio of .90% for Initial shares and 1.00% for Service shares, |
| multiplied by the average account value over the period, multiplied by 184/366 (to reflect the one-half year period). |
| STATEMENT OF INVESTMENTS |
| December 31, 2004 |
| Common Stocks—66.6% | | Shares | | | | Value ($) |
| |
| |
| |
|
| Consumer Discretionary—9.9% | | | | | | |
| Blyth | | 16,000 | | | | 472,960 |
| Catalina Marketing | | 34,000 | | | | 1,007,420 |
| Interpublic Group of Companies | | 90,000 | | a | | 1,206,000 |
| Kohl’s | | 24,500 | | a | | 1,204,665 |
| Liberty Media, Cl. A | | 96,000 | | a | | 1,054,080 |
| McDonald’s | | 18,000 | | | | 577,080 |
| Time Warner | | 61,000 | | a | | 1,185,840 |
| Viacom, Cl. B | | 40,000 | | | | 1,455,600 |
| | | | | | | 8,163,645 |
| Consumer Staples—6.1% | | | | | | |
| Altria Group | | 22,000 | | | | 1,344,200 |
| CVS | | 18,000 | | | | 811,260 |
| Coca-Cola | | 37,000 | | | | 1,540,310 |
| Nestle, ADR | | 21,000 | | | | 1,382,719 |
| | | | | | | 5,078,489 |
| Energy—2.4% | | | | | | |
| ChevronTexaco | | 20,000 | | | | 1,050,200 |
| Exxon Mobil | | 19,000 | | | | 973,940 |
| | | | | | | 2,024,140 |
| Financials—9.9% | | | | | | |
| Bank of America | | 25,000 | | | | 1,174,750 |
| Berkshire Hathaway, Cl. A | | 7 | | a | | 615,300 |
| Citigroup | | 25,500 | | | | 1,228,590 |
| Fannie Mae | | 25,000 | | | | 1,780,250 |
| Freddie Mac | | 11,000 | | | | 810,700 |
| J.P. Morgan Chase & Co. | | 36,000 | | | | 1,404,360 |
| Marsh & McLennan Cos. | | 37,500 | | | | 1,233,750 |
| | | | | | | 8,247,700 |
| Health Care—15.8% | | | | | | |
| Bristol-Myers Squibb | | 39,000 | | | | 999,180 |
| Cardinal Health | | 38,000 | | | | 2,209,700 |
| First Health Group | | 106,000 | | a | | 1,983,260 |
| IMS Health | | 48,000 | | | | 1,114,080 |
| McKesson | | 53,000 | | | | 1,667,380 |
| Merck & Co. | | 34,000 | | | | 1,092,760 |
| Pfizer | | 65,000 | | | | 1,747,850 |
The Portfolio 9
S T A T E M E N T O F I N V E S T M E N T S (continued)
| Common Stocks (continued) | | Shares | | Value ($) |
| |
| |
|
| Health Care (continued) | | | | |
| Schering-Plough | | 41,000 | | 856,080 |
| Wyeth | | 34,000 | | 1,448,060 |
| | | | | 13,118,350 |
| Industrials—8.2% | | | | |
| Career Education | | 50,000 a | | 2,000,000 |
| Cendant | | 45,000 | | 1,052,100 |
| Corinthian Colleges | | 112,000 a | | 2,110,640 |
| General Electric | | 45,000 | | 1,642,500 |
| | | | | 6,805,240 |
| Information Technology—12.7% | | | | |
| BISYS Group | | 115,000 a | | 1,891,750 |
| Electronic Data Systems | | 78,000 | | 1,801,800 |
| First Data | | 36,000 | | 1,531,440 |
| Fiserv | | 39,000 a | | 1,567,410 |
| Lucent Technologies (warrants) | | 361 a | | 568 |
| Microsoft | | 68,000 | | 1,816,280 |
| Sabre Holdings | | 36,000 | | 797,760 |
| Unisys | | 112,000 a | | 1,140,160 |
| | | | | 10,547,168 |
| Telecommunication Services—1.6% | | |
| SBC Communications | | 50,000 | | 1,288,500 |
| Total Common Stocks | | | | |
| (cost $51,886,543) | | | | 55,273,232 |
| |
| |
|
| |
| Preferred Stocks—2.2% | | | | |
| |
| |
|
| Auto Manufacturing—.7% | | | | |
| General Motors | | | | |
| Cum., $ 2.00 | | 21,000 | | 533,532 |
| Banking/Finance—1.5% | | | | |
| Citigroup Capital, | | | | |
| Cum., $ 1.60 | | 25,000 | | 666,408 |
| General Motors Acceptance, | | | | |
| 7.375%, 12/16/2044 | | 22,500 | | 573,048 |
| | | | | 1,239,456 |
| Total Preferred Stocks | | | | |
| (cost $1,754,875) | | | | 1,772,988 |
| |
| |
| |
| 10 | | | | |
| | | Principal | | |
| Bonds and Notes—26.8% | | Amount ($) | | Value ($) |
| |
| |
|
| Asset-Backed Certificates—.3% | | | | |
| MBNA Credit Card Master Note Trust, | | | | |
| Ser. 2002-C1, Cl. C1, 6.8%, 7/15/2014 | | 233,000 | | 258,803 |
| Banks—.5% | | | | |
| Bank of America, | | | | |
| Sr. Notes, 4.375%, 12/1/2010 | | 445,000 | | 446,901 |
| Beverages—.1% | | | | |
| Miller Brewing, | | | | |
| Notes, 4.25%, 8/15/2008 | | 90,000 b | | 90,894 |
| Commercial Mortgage Pass-Through Ctfs.—1.3% | | |
| CS First Boston Mortgage Securities Corp., | | | | |
| Ser. 1998-C1, Cl. A1A, 6.26%, 5/17/2040 | | 82,486 | | 83,794 |
| First Horizon Alternative Mortgage Securities Corp., | | |
| Ser. 2004-FA1, Cl. A1A, 6.25%, 10/25/2034 | | 621,344 | | 644,310 |
| Salomon Brothers Mortgage Securities Corp., | | | | |
| Ser. 2002-KEY2, Cl. A1, 3.222%, 3/18/2036 | | 328,480 | | 327,186 |
| | | | | 1,055,290 |
| Computers—.1% | | | | |
| International Business Machines, | | | | |
| Sr. Notes, 4.75%, 11/29/2012 | | 45,000 | | 46,023 |
| Cosmetics/Personal Care—.2% | | | | |
| Kimberly-Clark, | | | | |
| Notes, 5%, 8/15/2013 | | 165,000 | | 170,291 |
| Diversified Financial Services—.8% | | | | |
| Boeing Capital, | | | | |
| Bonds, 5.8%, 1/15/2013 | | 53,000 | | 57,259 |
| Ford Motor Credit: | | | | |
| Notes, 2.67%, 3/13/2007 | | 35,000 c | | 34,455 |
| Notes, 3.37875%, 9/28/2007 | | 105,000 c | | 104,320 |
| General Motors Acceptance, | | | | |
| Notes, 6.75%, 12/1/2014 | | 135,000 | | 135,426 |
| Goldman Sachs, | | | | |
| Notes, 3.875%, 1/15/2009 | | 170,000 d | | 169,771 |
| Morgan Stanley, | | | | |
| Sub. Notes, 4.75%, 4/1/2014 | | 165,000 | | 161,074 |
| | | | | 662,305 |
| Electric Utilities—.4% | | | | |
| Public Service Colorado, | | | | |
| Bonds, 4.875%, 3/1/2013 | | 101,000 | | 102,783 |
S T A T E M E N T O F I N V E S T M E N T S (continued)
| | | Principal | | | | |
| Bonds and Notes (continued) | | Amount ($) | | Value ($) |
| |
| |
|
| Electric Utilities (continued) | | | | | | |
| TXU Energy, | | | | | | |
| Sr. Notes, 7%, 3/15/2013 | | 215,000 | | | | 240,503 |
| | | | | | | 343,286 |
| Electrical Components & Equipment—.1% | | | | |
| Emerson Electric, | | | | | | |
| Bonds, 4.5%, 5/1/2013 | | 120,000 | | | | 119,130 |
| Forest Products & Paper—.1% | | | | | | |
| International Paper, | | | | | | |
| Notes, 5.85%, 10/30/2012 | | 40,000 | | | | 42,688 |
| Insurance—.2% | | | | | | |
| Aspen Insurance, | | | | | | |
| Sr. Notes, 6%, 8/15/2014 | | 145,000 | | b | | 147,719 |
| Chubb, | | | | | | |
| Notes, 6%, 11/15/2011 | | 50,000 | | | | 54,009 |
| | | | | | | 201,728 |
| Mining & Metals—.1% | | | | | | |
| Alcoa, | | | | | | |
| Notes, 4.25%, 8/15/2007 | | 35,000 | | | | 35,622 |
| Oil & Gas—.1% | | | | | | |
| ConocoPhillips, | | | | | | |
| Notes, 4.75%, 10/15/2012 | | 120,000 | | | | 122,548 |
| Real Estate—.1% | | | | | | |
| EOP Operating, | | | | | | |
| Sr. Notes, 7%, 7/15/2011 | | 60,000 | | | | 67,754 |
| Restaurants—.3% | | | | | | |
| Yum! Brands, | | | | | | |
| Sr. Notes, 8.875%, 4/15/2011 | | 180,000 | | | | 222,671 |
| Structured Index—1.6% | | | | | | |
| Morgan Stanley TRACERS, | | | | | | |
| Ser. 2002-1, 5.878%, 3/1/2007 | | 1,305,000 | | b,e | | 1,352,284 |
| Telecommunications—3.0% | | | | | | |
| British Telecommunications, | | | | | | |
| Notes, 8.375%, 12/15/2010 | | 172,000 | | | | 206,796 |
| | | Principal | | |
| Bonds and Notes (continued) | | Amount ($) | | Value ($) |
| |
| |
|
| Telecommunications (continued) | | | | |
| GTE Northwest, | | | | |
| Debs., 6.3%, 6/1/2010 | | 1,700,000 | | 1,810,571 |
| Knight-Ridder | | | | |
| Notes, 4.625%, 11/1/2014 | | 197,000 | | 194,542 |
| Sprint Capital, | | | | |
| Notes, 6.125%, 11/15/2008 | | 140,000 | | 150,269 |
| Verizon Florida, | | | | |
| Debs., 6.125%, 1/15/2013 | | 93,000 d | | 99,138 |
| Verizon Wireless Capital, | | | | |
| Notes, 5.375%, 12/15/2006 | | 30,000 | | 31,088 |
| | | | | 2,492,404 |
| U.S. Government—8.2% | | | | |
| U.S. Treasury Notes: | | | | |
| 7.5%, 2/15/2005 | | 1,965,000 | | 1,978,657 |
| 1.625%, 2/28/2006 | | 352,000 | | 347,339 |
| 1.5%, 3/31/2006 | | 167,000 | | 164,326 |
| U.S Treasury Inflation | | | | |
| Protection Securities, | | | | |
| 2.014%, 7/15/2014 | | 3,188,000 | | 3,333,929 |
| 3.562%, 4/15/2032 | | 667,000 | | 951,647 |
| | | | | 6,775,898 |
| U.S. Government Agencies/ | | | | |
| Mortgage-Backed—9.3% | | | | |
| Federal Home Loan Mortgage Corp.: | | | | |
| Mortgage Backed: | | | | |
| 4%, 7/15/2022 | | 232,835 | | 233,596 |
| 5.5%, 7/1/2034 | | 39,134 | | 39,793 |
| 5.5%, 9/1/2034 | | 287,041 | | 291,884 |
| Federal National Mortgage Association: | | |
| Mortgage Backed: | | | | |
| 6%, 5/25/2033 | | 449,930 | | 465,534 |
| 5.5%, 8/1/2034 | | 109,585 | | 111,365 |
| 5.5%, 9/1/2034 | | 308,492 | | 305,199 |
| 6%, 9/1/2034 | | 480,729 | | 497,491 |
S T A T E M E N T O F I N V E S T M E N T S (continued)
| | | Principal | | |
| Bonds and Notes (continued) | | Amount ($) | | Value ($) |
| |
| |
|
| U.S. Government Agencies/ | | | | |
| Mortgage-Backed (continued) | | | | |
| Government National Mortgage Association I: | | |
| Mortgage Backed: | | | | |
| 6%, 3/15/2029 | | 415,238 | | 431,716 |
| 6%, 6/15/2029 | | 48,303 | | 50,250 |
| 5.5%, 12/20/2029 | | 159,000 | | 164,592 |
| 6%, 12/15/2031 | | 291,009 | | 302,193 |
| 6%, 2/15/2032 | | 398,984 | | 414,070 |
| 6%, 3/15/2032 | | 59,038 | | 61,270 |
| 6%, 4/15/2032 | | 50,510 | | 52,420 |
| 6%, 5/15/2032 | | 59,276 | | 61,517 |
| 6%, 12/15/2032 | | 83,327 | | 86,478 |
| 6%, 1/15/2033 | | 44,996 | | 46,683 |
| 5.5%, 4/15/2033 | | 198,140 | | 202,598 |
| 6%, 12/15/2033 | | 1,010,740 | | 1,048,642 |
| 6%, 1/15/2034 | | 1,801,368 | | 1,868,919 |
| 6%, 2/15/2034 | | 660,934 | | 685,720 |
| 5.5%, 9/15/2034 | | 321,568 | | 328,701 |
| | | | | 7,750,631 |
| Total Bonds and Notes | | | | |
| (cost $22,175,846) | | | | 22,257,151 |
| |
| |
|
| |
| |
| Other Investments—1.8% | | Shares | | Value ($) |
| |
| |
|
| Registered Investment Company; | | | | |
| Dreyfus Institutional Preferred Plus Money Market Fund | | |
| (cost $1,488,000) | | 1,488,000 f | | 1,488,000 |
| Investment of Cash Collateral | | | | |
| for Securities Loaned—.3% | | Shares | | Value ($) |
| |
| |
|
| Registered Investment Company; | | | | |
| Dreyfus Institutional Cash Advantage Plus Fund | | | | |
| (cost $265,360) | | 265,360 f | | 265,360 |
| |
| |
|
| Total Investments (cost $77,570,624) | | 97.7% | | 81,056,731 |
| Cash and Receivables (Net) | | 2.3% | | 1,893,309 |
| Net Assets | | 100.0% | | 82,950,040 |
| ADR—American Depository Receipts. |
| a Non-income producing. |
| b Securities exempt from registration under Rule 144A of the Securities Act of 1933.These securities may be resold in |
| transactions exempt from registration, normally to qualified institutional buyers.These securities have been determined |
| to be liquid by the Board of Trustees.At December 31, 2004, these securities amounted to $1,590,897 or |
| approximately 1.9% of net assets. |
| c Variable rate security—interest rate subject to periodic change. |
| d All or a portion of these securities are on loan.At December 31, 2004, the total market value of the portfolio’s |
| securities on loan is $253,930 and the total market value of the collateral held by the portfolio is $265,360. |
| e Security linked to a portfolio of investment grade debt securities. |
| f Investments in affiliated money market mutual funds. |
| Portfolio Summary † | | | | | | |
| |
| | | Value (%) | | | | Value (%) |
| |
| |
| |
|
| Health Care | | 15.8 | | U.S. Government | | 8.2 |
| Information Technology | | 12.7 | | Consumer Staples | | 6.1 |
| Banking/Finance | | 11.9 | | Telecommunications | | 4.6 |
| Consumer Discretionary | | 9.9 | | Energy | | 2.4 |
| U.S. Government | | | | Money Market Investments | | 2.1 |
| Agencies/Mortgage-Backed | | 9.3 | | Other | | 6.5 |
| Industrials | | 8.2 | | | | 97.7 |
| |
| † Based on net assets. | | | | | | |
| See notes to financial statements. | | | | | | |
| STATEMENT OF ASSETS AND LIABILITIES |
| December 31, 2004 |
| | | Cost | | Value |
| |
| |
|
| Assets ($): | | | | |
| Investments in securities—See Statement of | | |
| Investments (including securities on loan, | | |
| valued at $253,930)—Note 1(c): | | | | |
| Unaffiliated issuers | | 75,817,264 | | 79,303,371 |
| Affiliated issuers | | 1,753,360 | | 1,753,360 |
| Cash | | | | 25,866 |
| Receivable for investment securities sold | | 3,104,507 |
| Dividends and interest receivable | | | | 253,785 |
| Receivable for shares of Beneficial Interest subscribed | | 404 |
| Prepaid expenses and other assets | | | | 16,647 |
| | | | | 84,457,940 |
| |
| |
|
| Liabilities ($): | | | | |
| Due to The Dreyfus Corporation and affiliates—Note 3(b) | | 56,948 |
| Payable for investment securities purchased | | 1,141,476 |
| Liability for securities loaned—Note 1(c) | | 265,360 |
| Payable for shares of Beneficial Interest redeemed | | 4,483 |
| Accrued expenses | | | | 39,633 |
| | | | | 1,507,900 |
| |
| |
|
| Net Assets ($) | | | | 82,950,040 |
| |
| |
|
| Composition of Net Assets ($): | | | | |
| Paid-in capital | | | | 95,594,404 |
| Accumulated undistributed investment income—net | | 274,309 |
| Accumulated net realized gain (loss) on investments | | (16,404,780) |
| Accumulated net unrealized appreciation | | |
| (depreciation) on investments | | | | 3,486,107 |
| |
| |
|
| Net Assets ($) | | | | 82,950,040 |
| |
| |
|
| |
| |
| Net Asset Value Per Share | | | | |
| | | Initial Shares | | Service Shares |
| |
| |
|
| Net Assets ($) | | 61,037,605 | | 21,912,435 |
| Shares Outstanding | | 4,584,360 | | 1,644,230 |
| |
| |
|
| Net Asset Value Per Share ($) | | 13.31 | | 13.33 |
See notes to financial statements.
|
| STATEMENT OF OPERATIONS |
| Year Ended December 31, 2004 |
| Investment Income ($): | | |
| Income: | | |
| Cash dividends (net of $2,403 foreign taxes withheld at source): | | |
| Unaffiliated issuers | | 1,109,540 |
| Affiliated issuers | | 46,558 |
| Interest | | 1,075,092 |
| Income on securities lending | | 3,207 |
| Total Income | | 2,234,397 |
| Expenses: | | |
| Investment advisory fee—Note 3(a) | | 640,392 |
| Distribution fees—Note 3(b) | | 56,116 |
| Prospectus and shareholders’ reports | | 36,303 |
| Professional fees | | 35,211 |
| Custodian fees—Note 3(b) | | 19,079 |
| Trustees’ fees and expenses—Note 3(c) | | 9,054 |
| Shareholder servicing costs—Note 3(b) | | 4,827 |
| Dividends on securities sold short | | 1,620 |
| Loan commitment fees—Note 2 | | 670 |
| Miscellaneous | | 8,442 |
| Total Expenses | | 811,714 |
| Less—waiver of fees due to undertaking—Note 3(a) | | (30,057) |
| Net Expenses | | 781,657 |
| Investment Income—Net | | 1,452,740 |
| |
|
| Realized and Unrealized Gain (Loss) on Investments—Note 4 ($): |
| Net realized gain (loss) on investments: | | |
| Long transactions | | 7,934,583 |
| Short sale transactions | | (34,517) |
| Net realized gain (loss) on financial futures | | (195,997) |
| Net Realized Gain (Loss) | | 7,704,069 |
| Net unrealized appreciation (depreciation) on investments | | |
| (including $5,373 net unrealized appreciation on financial futures) | | (4,614,377) |
| Net Realized and Unrealized Gain (Loss) on Investments | | 3,089,692 |
| Net Increase in Net Assets Resulting from Operations | | 4,542,432 |
| |
| See notes to financial statements. | | |
| STATEMENT OF CHANGES IN NET ASSETS |
| | | Year Ended December 31, |
| |
|
| | | 2004 | | 2003 |
| |
| |
|
| Operations ($): | | | | |
| Investment income—net | | 1,452,740 | | 1,067,621 |
| Net realized gain (loss) on investments | | 7,704,069 | | (3,466,062) |
| Net unrealized appreciation | | | | |
| (depreciation) on investments | | (4,614,377) | | 16,740,703 |
| Net Increase (Decrease) in Net Assets | | | | |
| Resulting from Operations | | 4,542,432 | | 14,342,262 |
| |
| |
|
| Dividends to Shareholders from ($): | | | | |
| Investment income—net: | | | | |
| Initial shares | | (1,313,856) | | (1,131,109) |
| Service shares | | (422,063) | | (351,942) |
| Total Dividends | | (1,735,919) | | (1,483,051) |
| |
| |
|
| Beneficial Interest Transactions ($): | | | | |
| Net proceeds from shares sold: | | | | |
| Initial shares | | 1,535,093 | | 2,731,864 |
| Service shares | | 1,598,254 | | 2,302,244 |
| Dividends reinvested: | | | | |
| Initial shares | | 1,313,856 | | 1,131,109 |
| Service shares | | 422,063 | | 351,942 |
| Cost of shares redeemed: | | | | |
| Initial shares | | (11,090,415) | | (10,978,778) |
| Service shares | | (4,186,838) | | (4,750,884) |
| Increase (Decrease) in Net Assets from | | | | |
| Beneficial Interest Transactions | | (10,407,987) | | (9,212,503) |
| Total Increase (Decrease) in Net Assets | | (7,601,474) | | 3,646,708 |
| |
| |
|
| Net Assets ($): | | | | |
| Beginning of Period | | 90,551,514 | | 86,904,806 |
| End of Period | | 82,950,040 | | 90,551,514 |
| Undistributed investment income—net | | 274,309 | | 295,843 |
| | | Year Ended December 31, |
| |
|
| | | 2004 | | 2003 |
| |
| |
|
| Capital Share Transactions: | | | | |
| Initial Shares | | | | |
| Shares sold | | 119,914 | | 230,849 |
| Shares issued for dividends reinvested | | 101,379 | | 96,529 |
| Shares redeemed | | (863,058) | | (949,903) |
| Net Increase (Decrease) in Shares Outstanding | | (641,765) | | (622,525) |
| |
| |
|
| Service Shares | | | | |
| Shares sold | | 124,997 | | 196,799 |
| Shares issued for dividends reinvested | | 32,575 | | 30,207 |
| Shares redeemed | | (325,263) | | (403,686) |
| Net Increase (Decrease) in Shares Outstanding | | (167,691) | | (176,680) |
See notes to financial statements.
|
The following tables describe the performance for each share class for the fiscal periods indicated.All information (except portfolio turnover rate) reflects financial results for a single portfolio share.Total return shows how much your investment in the portfolio would have increased (or decreased) during each period, assuming you had reinvested all dividends and distributions.These figures have been derived from the portfolio’s financial statements.
| | | | | Year Ended December 31, | | |
| |
| |
| |
|
| Initial Shares | | 2004 | | 2003 | | 2002 | | 2001 a | | 2000 |
| |
| |
| |
| |
| |
|
| Per Share Data ($): | | | | | | | | | | |
| Net asset value, beginning of period | | 12.87 | | 11.09 | | 13.34 | | 15.00 | | 16.02 |
| Investment Operations: | | | | | | | | | | |
| Investment income—net b | | .22 | | .15 | | .19 | | .27 | | .52 |
| Net realized and unrealized | | | | | | | | | | |
| gain (loss) on investments | | .50 | | 1.84 | | (2.25) | | (1.65) | | (.97) |
| Total from Investment Operations | | .72 | | 1.99 | | (2.06) | | (1.38) | | (.45) |
| Distributions: | | | | | | | | | | |
| Dividends from investment income—net | | (.28) | | (.21) | | (.19) | | (.28) | | (.48) |
| Dividends from net realized | | | | | | | | | | |
| gain on investments | | — | | — | | — | | — | | (.09) |
| Total Distributions | | (.28) | | (.21) | | (.19) | | (.28) | | (.57) |
| Net asset value, end of period | | 13.31 | | 12.87 | | 11.09 | | 13.34 | | 15.00 |
| |
| |
| |
| |
| |
|
| Total Return (%) | | 5.64 | | 18.14 | | (15.48) | | (9.12) | | (2.98) |
| |
| |
| |
| |
| |
|
| Ratios/Supplemental Data (%): | | | | | | | | | | |
| Ratio of total expenses | | | | | | | | | | |
| to average net assets | | .88 | | .89 | | .85 | | .85 | | .85 |
| Ratio of net investment income | | | | | | | | | | |
| to average net assets | | 1.73 | | 1.26 | | 1.58 | | 1.92 | | 3.35 |
| Portfolio Turnover Rate | | 281.51c | | 363.02c | | 388.26 | | 128.44 | | 111.66 |
| |
| |
| |
| |
| |
|
| Net Assets, end of period ($ x 1,000) | | 61,038 | | 67,239 | | 64,865 | | 96,290 | | 105,569 |
| a | | As required, effective January 1, 2001, the portfolio has adopted the provisions of the AICPA Audit and Accounting |
| | | Guide for Investment Companies and began accreting discount or amortizing premium on debt securities on a |
| | | scientific basis and including paydown gains and losses in interest income.The effect of this change for the period |
| | | ended December 31, 2001 was to decrease net investment income per share by $.01, increase net realized and |
| | | unrealized gain (loss) on investments per share by $.01, and decrease the ratio of net investment income to average |
| | | net assets from 2.02% to 1.92%. Per share data and ratios/supplemental data for periods prior to January 1, 2001 |
| | | have not been restated to reflect this change in presentation. |
| b | | Based on average shares outstanding at each month end. |
| c | | The portfolio turnover rates excluding mortgage dollar roll transactions for the years ended December 31, 2004 and |
| | | December 31, 2003 were 266.40% and 305.71%, respectively. |
| See notes to financial statements. |
| | | | | Year Ended December 31, | | |
| |
| |
| |
|
| Service Shares | | 2004 | | 2003 | | 2002 | | 2001 a | | 2000 b |
| |
| |
| |
| |
| |
|
| Per Share Data ($): | | | | | | | | | | |
| Net asset value, beginning of period | | 12.87 | | 11.08 | | 13.33 | | 15.00 | | 15.00 |
| Investment Operations: | | | | | | | | | | |
| Investment income—net | | .21c | | .14c | | .17c | | .22c | | — |
| Net realized and unrealized | | | | | | | | | | |
| gain (loss) on investments | | .50 | | 1.84 | | (2.24) | | (1.63) | | — |
| Total from Investment Operations | | .71 | | 1.98 | | (2.07) | | (1.41) | | — |
| Distributions: | | | | | | | | | | |
| Dividends from investment income—net | | (.25) | | (.19) | | (.18) | | (.26) | | — |
| Net asset value, end of period | | 13.33 | | 12.87 | | 11.08 | | 13.33 | | 15.00 |
| |
| |
| |
| |
| |
|
| Total Return (%) | | 5.57 | | 18.02 | | (15.63) | | (9.31) | | — |
| |
| |
| |
| |
| |
|
| Ratios/Supplemental Data (%): | | | | | | | | | | |
| Ratio of total expenses | | | | | | | | | | |
| to average net assets | | 1.13 | | 1.14 | | 1.09 | | 1.16 | | — |
| Ratio of net expenses | | | | | | | | | | |
| to average net assets | | 1.00 | | 1.00 | | 1.00 | | 1.00 | | — |
| Ratio of net investment income | | | | | | | | | | |
| to average net assets | | 1.62 | | 1.15 | | 1.45 | | 1.66 | | — |
| Portfolio Turnover Rate | | 281.51d | | 363.02d | | 388.26 | | 128.44 | | 111.66 |
| |
| |
| |
| |
| |
|
| Net Assets, end of period ($ x 1,000) | | 21,912 | | 23,313 | | 22,040 | | 15,396 | | —e |
| a | | As required, effective January 1, 2001, the portfolio has adopted the provisions of the AICPA Audit and Accounting |
| | | Guide for Investment Companies and began accreting discount or amortizing premium on debt securities on a |
| | | scientific basis and including paydown gains and losses in interest income.The effect of this change for the period |
| | | ended December 31, 2001 was to decrease net investment income per share by $.01, increase net realized and |
| | | unrealized gain (loss) on investments per share by $.01, and decrease the ratio of net investment income to average |
| | | net assets from 1.77% to 1.66%. Per share data and ratios/supplemental data for periods prior to January 1, 2001 |
| | | have not been restated to reflect this change in presentation. |
| b | | The portfolio commenced offering Service shares on December 31, 2000. |
| c | | Based on average shares outstanding at each month end. |
| d | | The portfolio turnover rates excluding mortgage dollar roll transactions for the years ended December 31, 2004 and |
| | | December 31, 2003 were 266.40% and 305.71%, respectively. |
| e | | Amount represents less than $1,000. |
| See notes to financial statements. |
NOTES TO FINANCIAL STATEMENTS
NOTE 1—Significant Accounting Policies:
Dreyfus Variable Investment Fund (the "fund") is registered under the Investment Company Act of 1940, as amended (the “Act”), as an open-end management investment company, operating as a series company currently offering twelve series, including the Balanced Portfolio (the “portfolio”).The portfolio is only offered to separate accounts established by insurance companies to fund variable annuity contracts and variable life insurance policies.The portfolio is a diversified series. On November 18, 2004, portfolio shareholders approved changing the portfolio’s investment objective and a Sub-Investment Advisory Agreement. Effective December 10, 2004, the portfolio’s investment objective seeks high return through a combination of capital appreciation and current income. Prior to December 10, 2004, the portfolio’s investment objective is long-term capital growth and current income.To pursue this goal, the portfolio invests in a diversified mix of stocks and bonds.The portfolio’s normal asset allocation is approximately 60% stocks and 40% bonds.The Dreyfus Corporation (“Dreyfus”) serves as the portfolio’s investment adviser. Dreyfus is a wholly-owned subsidiary of Mellon Financial Corporation (“Mellon Financial”).Wisconsin Capital Management, Inc. (“Wisconsin Capital”) serves as the portfolio’s sub-investment adviser.
Dreyfus Service Corporation (the “Distributor”), a wholly-owned subsidiary of the Manager, is the distributor of the portfolio’s shares, which are sold without a sales charge.The portfolio is authorized to issue an unlimited number of $.001 par value shares of Beneficial Interest in each of the following classes of shares: Initial and Service. Each class of shares has identical rights and privileges, except with respect to the distribution plan and the expenses borne by each class and certain voting rights. Income, expenses (other than expenses attributable to a specific class), and realized and unrealized gains or losses on investments are allocated to each class of shares based on its relative net assets.
The fund accounts separately for the assets, liabilities and operations of each series. Expenses directly attributable to each series are charged to that series’ operations; expenses which are applicable to all series are allocated among them on a pro rata basis.
The portfolio’s financial statements are prepared in accordance with U.S. generally accepted accounting principles, which may require the use of management estimates and assumptions.Actual results could differ from those estimates.
The fund enters into contracts that contain a variety of indemnifica-tions.The portfolio’s maximum exposure under these arrangements is unknown. The portfolio does not anticipate recognizing any loss related to these arrangements.
(a) Portfolio valuation: Most debt securities are valued each business day by an independent pricing service (the “Service”) approved by the Board of Trustees. Securities listed on the National Market System, for which market quotations are available are valued at the official closing price or, if there is no official closing price that day, at the last sale price. Debt securities for which quoted bid prices are readily available and are representative of the bid side of the market in the judgment of the Service are valued at the mean between the quoted bid prices (as obtained by the Service from dealers in such securities) and asked prices (as calculated by the Service based upon its evaluation of the market for such securities). Other debt securities are carried at fair value as determined by the Service, based on methods which include consideration of: yields or prices of securities of comparable quality, coupon, maturity and type; indications as to values from dealers; and general market conditions. Other securities are valued at the last sales price on the securities exchange or national securities market on which such securities are primarily traded. Securities listed on the National Market System for which market quotations are available are valued at the official closing price or, if there is no official closing price that day, at the last sale price. Securities not listed on an exchange or the national securities market, or securities for which there were no transactions, are valued at the average of the most recent bid and asked prices, except for open short positions, where the asked price is used for valuation purposes. Bid price is used when no asked price is available. Investments in registered investment companies are valued at their net asset value.When market quotations or official closing prices are not readily available, or are
NOTES TO FINANCIAL STATEMENTS (continued)
|
determined not to reflect accurately fair value, such as when the value of a security has been significantly affected by events after the close of the exchange or market on which the security is principally traded (for example, a foreign exchange or market), but before the fund calculates its net asset value, the fund may value these investments at fair value as determined in accordance with the procedures approved by the Board of Trustees. Fair valuing of securities may be determined with the assistance of a pricing service using calculations based on indices of domestic securities and other appropriate indicators, such as prices of relevant ADR’s and futures contracts. Investments denominated in foreign currencies are translated to U.S. dollars at the prevailing rates of exchange. For other securities that are fair valued by the Board of Trustees, certain factors may be considered such as: fundamental analytical data, the nature and duration of restrictions on disposition, an evaluation of the forces that influence the market in which the securities are purchased and sold, and public trading in similar securities of the issuer or comparable issuers. Investments denominated in foreign currencies are translated to U.S. dollars at the prevailing rates of exchange. Forward currency exchange contracts are valued at the forward rate. Financial futures are valued at the last sales price.
(b) Foreign currency transactions: The portfolio does not isolate that portion of the results of operations resulting from changes in foreign exchange rates on investments from the fluctuations arising from changes in market prices of securities held. Such fluctuations are included with the net realized and unrealized gain or loss on investments.
Net realized foreign exchange gains or losses arise from sales and maturities of short-term securities, sales of foreign currencies, currency gains or losses realized on securities transactions and the difference between the amounts of dividends, interest and foreign withholding taxes recorded on the portfolio’s books and the U.S. dollar equivalent of the amounts actually received or paid. Net unrealized foreign exchange gains or losses arise from changes in the value of assets and liabilities other than investments in securities, resulting from changes in exchange rates. Such gains and losses are included with net realized and unrealized gain or loss on investments.
(c) Securities transactions and investment income: Securities transactions are recorded on a trade date basis. Realized gain and loss from securities transactions are recorded on the identified cost basis. Dividend income is recognized on the ex-dividend date and interest income, including, where applicable, accretion of discount and amortization of premium on investments, is recognized on the accrual basis.
The portfolio has an arrangement with the custodian bank whereby the portfolio receives earnings credits from the custodian when positive cash balances are maintained, which are used to offset custody fees. For financial reporting purposes, the portfolio includes net earnings credits, if any, as an expense offset in the Statement of Operations.
Pursuant to a securities lending agreement with Mellon Bank, N.A., an affiliate of Dreyfus, the portfolio may lend securities to qualified institu-tions.At origination, all loans are secured by collateral of at least 102% of the value of U.S. securities loaned and 105% of the value of foreign securities loaned. Collateral equivalent to at least 100% of the market value of securities on loan will be maintained at all times. Cash collateral is invested in certain money market mutual funds managed by Dreyfus.The portfolio will be entitled to receive all income on securities loaned, in addition to income earned as a result of the lending transaction.Although each security loaned is fully collateralized, the portfolio would bear the risk of delay in recovery of, or loss of rights in, the securities loaned should a borrower fail to return the securities in a timely manner.
(d) Affiliated issuers: Investments in other investment companies advised by Dreyfus are defined as “affiliated” in the Act.
(e) Dividends to shareholders: Dividends are recorded on the ex-dividend date. Dividends from investment income-net are declared and paid quarterly. Dividends from net realized capital gain, if any, are normally declared and paid annually, but the portfolio may make distributions on a more frequent basis to comply with the distribution requirements of the Internal Revenue Code of 1986, as amended (the “Code”).To the extent that net realized capital gain can be offset by capital loss carryovers, it is the policy of the portfolio not to distribute such gain. Income and capital gain distributions are determined in
NOTES TO FINANCIAL STATEMENTS (continued)
|
accordance with income tax regulations, which may differ from U.S. generally accepted accounting principles.
(f) Federal income taxes: It is the policy of the portfolio to continue to qualify as a regulated investment company, if such qualification is in the best interests of its shareholders, by complying with the applicable provisions of the Code, and to make distributions of taxable income sufficient to relieve it from substantially all federal income and excise taxes.
At December 31,2004,the components of accumulated earnings on a tax basis were as follows: undistributed ordinary income $298,731, accumulated capital losses $15,657,150 and unrealized appreciation $2,714,055.
The accumulated capital loss carryover is available to be applied against future net securities profits, if any, realized subsequent to December 31, 2004. If not applied, $3,489,427 of the carryover expires in fiscal 2009, $8,289,370 expires in fiscal 2010 and $3,878,353 expires in fiscal 2011.
The tax character of distributions paid to shareholders during the fiscal periods ended December 31, 2004 and December 31, 2003, were as follows: ordinary income $1,735,919 and $1,483,051, respectively.
During the period ended December 31, 2004, as a result of permanent book to tax differences primarily due to the tax treatment for amortization of premiums and treasury inflation protected securities, the portfolio increased accumulated undistributed investment income-net by $261,645, decreased accumulated net realized gain (loss) on investments by $297,915 and increased paid-in capital by $36,270. Net assets were not affected by this reclassification.
NOTE 2—Bank Line of Credit:
|
The portfolio participates with other Dreyfus-managed funds in a $350 million redemption credit facility (the “Facility”) to be utilized for temporary or emergency purposes, including the financing of redemptions. In connection therewith, the portfolio has agreed to pay commitment fees on its pro rata portion of the Facility. Interest is charged to the portfolio based on prevailing market rates in effect at the time of borrowings. During the period ended December 31, 2004, the portfolio did not borrow under the Facility.
NOTE 3—Investment Advisory Fee and Other Transactions With Affiliates:
(a) Pursuant to an Investment Advisory Agreement with Dreyfus, the investment advisory fee is computed at the annual rate of .75 of 1% of the value of the portfolio’s average daily net assets and is payable monthly.
Dreyfus has agreed, from January 1, 2004 to December 31, 2005, to waive receipt of its fees and/or assume the expenses of the portfolio so that the expenses of neither class, exclusive of taxes, brokerage fees, interest on borrowings, commitment fees and extraordinary expenses, exceed 1% of the value of the average daily net assets of their class. During the period ended December 31, 2004, Dreyfus waived receipt of fees of $30,057 pursuant to the undertaking.
Pursuant to a Sub-Investment Advisory Agreement between Dreyfus and Wisconsin Capital, the sub-investment advisory fee is payable monthly by Dreyfus, and is based upon the value of the portfolio’s average daily net assets, computed at the following annual rates:
| Average Net Assets | | |
| 0 to $300 million | | .25 of 1% |
| In excess of $300 million | | .20 of 1% |
(b) Under the Distribution Plan (the “Plan”) adopted pursuant to Rule 12b-1 under the Act, Service shares pay the Distributor for distributing their shares, for servicing and/or maintaining Service shares shareholder accounts and for advertising and marketing for Service shares.The Plan provides for payments to be made at an annual rate of .25 of 1% of the value of the Service shares’ average daily net assets.The Distributor may make payments to Participating Insurance Companies and to brokers and dealers acting as principal underwriter for their variable insurance products.The fees payable under the Plan are payable without regard to actual expenses incurred. During the period ended December 31, 2004, Service shares were charged $56,116 pursuant to the Plan.
The portfolio compensates Dreyfus Transfer, Inc., a wholly-owned subsidiary of the Manager, under a transfer agency agreement for pro-
NOTES TO FINANCIAL STATEMENTS (continued)
|
viding personnel and facilities to perform transfer agency services for the portfolio. During the period ended December 31, 2004, the portfolio was charged $53 pursuant to the transfer agency agreement.
The portfolio compensates Mellon Bank, N.A., an affiliate of the Manager, under a custody agreement for providing custodial services for the portfolio. During the period ended December 31, 2004, the portfolio was charged $19,079 pursuant to the custody agreement.
The components of Due to The Dreyfus Corporation and affiliates in the Statement of Assets and Liabilities consist of: investment advisory fees $52,503, Rule 12b-1 distribution plan fees $4,627, transfer agency per account fees $10 and custodian fees $3,634, which are offset against an expense reimbursement currently in effect in the amount of $3,826.
(c) Each Board member also serves as a Board member of other funds within the Dreyfus complex. Annual retainer fees and attendance fees are allocated to each fund based on net assets.
(d) Pursuant to an exemptive order from the Securities and Exchange Commission, the portfolio may invest its available cash balances in affiliated money market mutual funds. Management fees of the underlying money market mutual funds have been waived by Dreyfus.
NOTE 4—Securities Transactions:
|
The following summarizes the aggregate amount of purchases and sales of investment securities and securities sold short, excluding short-term securities and financial futures, during the period ended December 31, 2004 of which $12,501,339 in purchases and $12,520,531 in sales were from dollar roll transactions:
| | | Purchases | | Sales |
| |
| |
|
| Long transactions | | 233,040,780 | | 244,574,973 |
| Short sale transactions | | 282,780 | | — |
| Total | | 233,323,560 | | 244,574,973 |
A mortgage dollar roll transaction involves a sale by the portfolio of mortgage related securities that it holds with an agreement by the portfolio to repurchase similar securities at an agreed upon price and date.The securities purchased will bear the same interest rate as those
sold, but generally will be collateralized by pools of mortgages with different prepayment histories than those securities sold.
The portfolio is engaged in short-selling which obligates the portfolio to replace the security borrowed by purchasing the security at current market value.The portfolio would incur a loss if the price of the security increases between the date of the short sale and the date on which the portfolio replaces the borrowed security.The portfolio would realize a gain if the price of the security declines between those dates. Until the portfolio replaces the borrowed security, the portfolio will maintain daily, a segregated account with a broker or custodian of permissable liquid assets sufficient to cover its short position. At December 31, 2004, there were no securities sold short outstanding.
The portfolio may invest in financial futures contracts in order to gain exposure to or protect against changes in the market. The portfolio is exposed to market risk as a result of changes in the value of the underlying financial instruments. Investments in financial futures require the fund to “mark to market”on a daily basis,which reflects the change in the market value of the contract at the close of each day’s trading.Typically, variation margin payments are received or made to reflect daily unrealized gains or losses.When the contracts are closed, the fund recognizes a realized gain or loss.These investments require initial margin deposits with a broker, which consist of cash or cash equivalents. The amount of these deposits is determined by the exchange or Board of Trade on which the contract is traded and is subject to change.At December 31, 2004, there were no financial futures contracts outstanding.
At December 31, 2004, the cost of investments for federal income tax purposes was $78,342,676;accordingly,accumulated net unrealized appreciation on investments was $2,714,055, consisting of $3,990,246 gross unrealized appreciation and $1,276,191 gross unrealized depreciation.
In early 2004, two purported class and derivative actions were filed against Mellon Financial, Mellon Bank, N.A., Dreyfus, Founders Asset Management LLC, and certain directors of the Dreyfus Funds and the
NOTES TO FINANCIAL STATEMENTS (continued)
|
Dreyfus Founders Funds (together, the “Funds”). In September 2004, plaintiffs served a Consolidated Amended Complaint (the “Amended Complaint”) on behalf of a purported class of all persons who acquired interests in any of the Funds between January 30, 1999 and November 17, 2003, and derivatively on behalf of the Funds. The Amended Complaint in the newly styled In re Dreyfus Mutual Funds Fee Litigation also named the Distributor, Premier Mutual Fund Services, Inc. and two additional Fund directors as defendants and alleges violations of the Investment Company Act of 1940, the Investment Advisers Act of 1940, the Pennsylvania Unfair Trade Practices and Consumer Protection Law and common-law claims. Plaintiffs seek to recover allegedly improper and excessive Rule 12b-1 and advisory fees allegedly charged to the Funds for marketing and distribution services. More specifically, plaintiffs claim, among other things, that 12b-1 fees and directed brokerage were improperly used to pay brokers to recommend the Funds over other funds, and that such payments were not disclosed to investors. In addition, plaintiffs assert that economies of scale and soft-dollar benefits were not passed on to the Funds. Plaintiffs further allege that 12b-1 fees were improperly charged to certain of the Funds that were closed to new investors.The Amended Complaint seeks compensatory and punitive damages, rescission of the advisory contracts, and an accounting and restitution of any unlawful fees, as well as an award of attorneys’ fees and litigation expenses. As noted, some of the claims in this litigation are asserted derivatively on behalf of the Funds that have been named as nominal defendants.With respect to such derivative claims, no relief is sought against the Funds. Dreyfus believes the allegations to be totally without merit and intends to defend the action vigorously. Defendants filed motions to dismiss the Amended Complaint on November 12, 2004, and those motions are pending.
Additional lawsuits arising out of these circumstances and presenting similar allegations and requests for relief may be filed against the defendants in the future. Neither Dreyfus nor the Funds believe that any of the pending actions will have a material adverse effect on the Funds or Dreyfus’ ability to perform its contract with the Funds.
| REPORT OF INDEPENDENT REGISTERED |
| PUBLIC ACCOUNTING FIRM |
| Shareholders and Board of Trustees |
| Dreyfus Variable Investment Fund, Balanced Portfolio |
We have audited the accompanying statement of assets and liabilities, including the statement of investments, of Dreyfus Variable Investment Fund, Balanced Portfolio (one of the funds comprising Dreyfus Variable Investment Fund) as of December 31, 2004, and the related statement of operations for the year then ended, the statement of changes in net assets for each of the two years in the period then ended, and financial highlights for each of the periods indicated therein.These financial statements and financial highlights are the responsibility of the Fund’s management. Our responsibility is to express an opinion on these financial statements and financial highlights based on our audits.
We conducted our audits in accordance with the standards of the Public Company Accounting Oversight Board (United States).Those standards require that we plan and perform the audit to obtain reasonable assurance about whether the financial statements and financial highlights are free of material misstatement. An audit includes examining, on a test basis, evidence supporting the amounts and disclosures in the financial statements and financial highlights. Our procedures included verification by examination of securities held by the custodian as of December 31, 2004 and confirmation of securities not held by the custodian by correspondence with others. An audit also includes assessing the accounting principles used and significant estimates made by management, as well as evaluating the overall financial statement presentation.We believe that our audits provide a reasonable basis for our opinion.
In our opinion, the financial statements and financial highlights referred to above present fairly, in all material respects, the financial position of Dreyfus Variable Investment Fund, Balanced Portfolio at December 31, 2004, the results of its operations for the year then ended, the changes in its net assets for each of the two years in the period then ended, and the financial highlights for each of the indicated periods, in conformity with U.S. generally accepted accounting principles.
| | New York, New York
February 4, 2005
|
IMPORTANT TAX INFORMATION (Unaudited)
For federal tax purposes, the portfolio hereby designates 62.05% of the ordinary dividends paid during the fiscal year ended December 31, 2004 as qualifying for the corporate dividends received deduction. Shareholders will receive notification in January 2005 of the percentage applicable to the preparation of their 2004 income tax returns.
PROXY RESULTS (Unaudited)
|
Dreyfus Variable Investment Fund, Balanced Portfolio held a special meeting of shareholders on November 18, 2004.The proposals considered at the meeting, and the results, are as follows:
| | | | | Shares | | |
| |
| |
| |
|
| | | For | | Against | | Abstained |
| |
| |
| |
|
| To change the portfolio’s | | | | | | |
| investment objective | | 5,790,688 | | 105,078 | | 538,848 |
| To approve a Sub-Investment | | | | | | |
| Advisory Agreement between | | | | |
| Dreyfus and Wisconsin | | | | | | |
| Capital Management, Inc. | | 5,896,860 | | 103,321 | | 434,433 |
BOARD MEMBERS INFORMATION (Unaudited)
| Joseph S. DiMartino (61) |
| Chairman of the Board (1995) |
| Principal Occupation During Past 5 Years: |
| • Corporate Director and Trustee |
Other Board Memberships and Affiliations:
| • The Muscular Dystrophy Association, Director |
| • Levcor International, Inc., an apparel fabric processor, Director |
| • Century Business Services, Inc., a provider of outsourcing functions for small and medium size |
| companies, Director |
| • The Newark Group, a provider of a national market of paper recovery facilities, paperboard |
| mills and paperboard converting plants, Director |
| • Azimuth Trust, an institutional asset management firm, Member of Board of Managers and |
| Advisory Board |
No. of Portfolios for which Board Member Serves: 186
| | David P. Feldman (65)
Board Member (1994)
|
Principal Occupation During Past 5 Years:
• Corporate Director and Trustee
Other Board Memberships and Affiliations:
- BBH Mutual Funds Group (11 funds), Director
- The Jeffrey Company, a private investment company, Director
- QMED, a medical device company, Director
No. of Portfolios for which Board Member Serves: 51
———————
| James F. Henry (74) |
| Board Member (1990) |
Principal Occupation During Past 5 Years:
- President, CPR Institute for Dispute Resolution, a non-profit organization principally engaged in the development of alternatives to business litigation (Retired 2003)
No. of Portfolios for which Board Member Serves: 22
| ——————— |
| Rosalind Gersten Jacobs (79) |
| Board Member (1990) |
Principal Occupation During Past 5 Years:
• Merchandise and marketing consultant
No. of Portfolios for which Board Member Serves: 33
BOARD MEMBERS INFORMATION (Unaudited) (continued)
| Dr. Paul A. Marks (78) |
| Board Member (1990) |
| Principal Occupation During Past 5 Years: |
| • President and Chief Executive Officer of Memorial Sloan-Kettering Cancer Center (Retired 1999) |
| | Other Board Memberships and Affiliations:
|
- Pfizer, Inc., a pharmaceutical company, Director-Emeritus
- Atom Pharm, Director
- Lazard Freres & Company, LLC, Senior Adviser
- Merck, Consultant
| | No. of Portfolios for which Board Member Serves: 22
|
| | Dr. Martin Peretz (65)
Board Member (1990)
|
| | Principal Occupation During Past 5 Years:
|
- Editor-in-Chief of The New Republic Magazine
- Lecturer in Social Studies at Harvard University (1965-2001)
- Co-Chairman of TheStreet.com, a financial daily on the web
| | Other Board Memberships and Affiliations:
|
- Academy for Liberal Education, an accrediting agency for colleges and universities certified by the U.S. Department of Education, Director
- Digital Learning Group, LLC, an online publisher of college textbooks, Director
- Harvard Center for Blood Research,Trustee
- Bard College,Trustee
- YIVO Institute for Jewish Research,Trustee
| | No. of Portfolios for which Board Member Serves: 22
|
| ——————— |
| Bert W. Wasserman (72) |
| Board Member (1993) |
| Principal Occupation During Past 5 Years: |
| • Financial Consultant |
| | Other Board Memberships and Affiliations:
• Lillian Vernon Corporation, Director
|
| | No. of Portfolios for which Board Member Serves: 22
|
———————
Once elected all Board Members serve for an indefinite term.The address of the Board Members and Officers is in c/o The Dreyfus Corporation, 200 Park Avenue, New York, New York 10166.Additional information about the Board Members is available in the fund’s Statement of Additional Information which can be obtained from Dreyfus free of charge by calling this toll free number: 1-800-554-4611.
| John M. Fraser, Jr., Emeritus Board Member |
| Irving Kristol, Emeritus Board Member |
OFFICERS OF THE FUND (Unaudited)
STEPHEN E. CANTER, President since March 2000.
Chairman of the Board, Chief Executive Officer and Chief Operating Officer of Dreyfus, and an officer of 92 investment companies (comprised of 185 portfolios) managed by Dreyfus. Mr. Canter also is a Board member and, where applicable, an Executive Committee Member of the other investment management subsidiaries of Mellon Financial Corporation, each of which is an affiliate of Dreyfus. He is 59 years old and has been an employee of Dreyfus since May 1995.
STEPHEN R. BYERS, Executive Vice President since November 2002.
Chief Investment Officer,Vice Chairman and a director of Dreyfus, and an officer of 92 investment companies (comprised of 185 portfolios) managed by Dreyfus. Mr. Byers also is an officer, director or an Executive Committee Member of certain other investment management subsidiaries of Mellon Financial Corporation, each of which is an affiliate of Dreyfus. He is 51 years old and has been an employee of Dreyfus since January 2000. Prior to joining Dreyfus, he served as an Executive Vice President-Capital Markets, Chief Financial Officer and Treasurer at Gruntal & Co., L.L.C.
MARK N. JACOBS, Vice President since March 2000.
Executive Vice President, Secretary and General Counsel of Dreyfus, and an officer of 93 investment companies (comprised of 201 portfolios) managed by Dreyfus. He is 58 years old and has been an employee of Dreyfus since June 1977.
MICHAEL A. ROSENBERG, Secretary since March 2000.
Associate General Counsel of Dreyfus, and an officer of 90 investment companies (comprised of 194 portfolios) managed by Dreyfus. He is 44 years old and has been an employee of Dreyfus since October 1991.
ROBERT R. MULLERY, Assistant Secretary since March 2000.
Associate General Counsel of Dreyfus, and an officer of 26 investment companies (comprised of 60 portfolios) managed by Dreyfus. He is 52 years old and has been an employee of Dreyfus since May 1986.
STEVEN F. NEWMAN, Assistant Secretary since March 2000.
Associate General Counsel and Assistant Secretary of Dreyfus, and an officer of 93 investment companies (comprised of 201 portfolios) managed by Dreyfus. He is 55 years old and has been an employee of Dreyfus since July 1980.
JAMES WINDELS, Treasurer since November 2001.
Director – Mutual Fund Accounting of Dreyfus, and an officer of 93 investment companies (comprised of 201 portfolios) managed by Dreyfus. He is 46 years old and has been an employee of Dreyfus since April 1985.
RICHARD CASSARO, Assistant Treasurer since August 2003.
Senior Accounting Manager – Equity Funds of Dreyfus, and an officer of 26 investment companies (comprised of 102 portfolios) managed by Dreyfus. He is 44 years old and has been an employee of Dreyfus since September 1982.
ERIK D. NAVILOFF, Assistant Treasurer since December 2002.
Senior Accounting Manager – Taxable Fixed Income Funds of Dreyfus, and an officer of 19 investment companies (comprised of 75 portfolios) managed by Dreyfus. He is 36 years old and has been an employee of Dreyfus since November 1992.
OFFICERS OF THE FUND (Unaudited) (continued)
ROBERT ROBOL, Assistant Treasurer since August 2003.
Senior Accounting Manager – Money Market Funds of Dreyfus, and an officer of 39 investment companies (comprised of 84 portfolios) managed by Dreyfus. He is 40 years old and has been an employee of Dreyfus since October 1988.
ROBERT SVAGNA, Assistant Treasurer since December 2002.
Senior Accounting Manager – Equity Funds of Dreyfus, and an officer of 27 investment companies (comprised of 107 portfolios) managed by Dreyfus. He is 37 years old and has been an employee of Dreyfus since November 1990.
KENNETH J. SANDGREN, Assistant Treasurer since November 2001.
Mutual Funds Tax Director of Dreyfus, and an officer of 93 investment companies (comprised of 201 portfolios) managed by Dreyfus. He is 50 years old and has been an employee of Dreyfus since June 1993.
JOSEPH W. CONNOLLY, Chief Compliance Officer since October 2004.
Chief Compliance Officer of Dreyfus and The Dreyfus Family of Funds (93 investment companies, comprising 201 portfolios). From November 2001 through March 2004, Mr. Connolly was first Vice-President, Mutual Fund Servicing for Mellon Global Securities Services. In that capacity, Mr. Connolly was responsible for managing Mellon’s Custody, Fund Accounting and Fund Administration services to third-party mutual fund clients. He is 47 years old and has served in various capacities with Dreyfus since 1980, including manager of the firm’s Fund Accounting Department from 1997 through October 2001.
WILLIAM GERMENIS, Anti-Money Laundering Compliance Officer since September 2002.
Vice President and Anti-Money Laundering Compliance Officer of the Distributor, and the Anti-Money Laundering Compliance Officer of 88 investment companies (comprised of 196 portfolios) managed by Dreyfus. He is 34 years old and has been an employee of the Distributor since October 1998.
| Dreyfus Variable |
| Investment Fund, |
| Balanced Portfolio |
| 200 Park Avenue |
| New York, NY 10166 |
| |
| Investment Adviser |
| The Dreyfus Corporation |
| 200 Park Avenue |
| New York, NY 10166 |
| |
| Sub-Investment Adviser |
| Wisconsin Capital Management, Inc. |
| 1200 John Q. Hammons Drive |
| Madison,Wisconsin 53717 |
| Custodian |
| Mellon Bank, N.A. |
| One Mellon Bank Center |
| Pittsburgh, PA 15258 |
| |
| Transfer Agent & |
| Dividend Disbursing Agent |
| Dreyfus Transfer, Inc. |
| 200 Park Avenue |
| New York, NY 10166 |
| |
| Distributor |
| Dreyfus Service Corporation |
| 200 Park Avenue |
| New York, NY 10166 |
Telephone 1-800-554-4611 or 516-338-3300
Mail The Dreyfus Family of Funds, 144 Glenn Curtiss Boulevard, Uniondale, NY 11556-0144 Attn: Institutional Servicing
The portfolio files its complete schedule of portfolio holdings with the Securities and
Exchange Commission (“SEC”) for the first and third quarters of each fiscal year on Form N-Q. The portfolio’s Forms N-Q are available on the SEC’s website at http://www.sec.gov and may be reviewed and copied at the SEC’s Public Reference Room in Washington, DC. Information on the operation of the Public Reference Room may be obtained by calling 1-800-SEC-0330.
A description of the policies and procedures that the portfolio uses to determine how to vote proxies relating to portfolio securities, and information regarding how the portfolio voted these proxies for the 12-month period ended June 30, 2004, is available through the portfolio’s website at http://www.dreyfus.com and on the SEC’s website at http://www.sec.gov. The description of the policies and procedures is also available without charge, upon request, by calling 1-800-645-6561.
© 2005 Dreyfus Service Corporation

| Dreyfus Variable |
| Investment Fund, |
| Developing Leaders |
| Portfolio |
| ANNUAL REPORT December 31, 2004 |

The views expressed in this report reflect those of the portfolio manager only through the end of the period covered and do not necessarily represent the views of Dreyfus or any other person in the Dreyfus organization.Any such views are subject to change at any time based upon market or other conditions and Dreyfus disclaims any responsibility to update such views. These views may not be relied on as investment advice and, because investment decisions for a Dreyfus portfolio are based on numerous factors, may not be relied on as an indication of trading intent on behalf of any Dreyfus portfolio.
Not FDIC-Insured • Not Bank-Guaranteed • May Lose Value
| | | Contents |
| |
| | | T H E P O R T F O L I O |
| |
|
| 2 | | Letter from the Chairman |
| 3 | | Discussion of Performance |
| 6 | | Portfolio Performance |
| 8 | | Understanding Your Portfolio’s Expenses |
| 8 | | Comparing Your Portfolio’s Expenses |
| | | With Those of Other Funds |
| 9 | | Statement of Investments |
| 13 | | Statement of Assets and Liabilities |
| 14 | | Statement of Operations |
| 15 | | Statement of Changes in Net Assets |
| 16 | | Financial Highlights |
| 18 | | Notes to Financial Statements |
| 25 | | Report of Independent Registered |
| | | Public Accounting Firm |
| 26 | | Important Tax Information |
| 27 | | Board Members Information |
| 29 | | Officers of the Fund |
| | | F O R M O R E I N F O R M AT I O N |
| |
|
| | | Back Cover |
| Dreyfus Variable Investment Fund, |
| Developing Leaders Portfolio |

LETTER FROM THE CHAIRMAN
We are pleased to present this annual report for Dreyfus Variable Investment Fund, Developing Leaders Portfolio, covering the 12-month period from January 1, 2004, through December 31, 2004. Inside, you’ll find valuable information about how the portfolio was managed during the reporting period, including a discussion with the portfolio managers, Paul Kandel and Hilary Woods.
2004 represented the second consecutive year of positive stock market performance. Unlike the 2003 rally, however, in which most stocks rose as general business conditions improved, 2004’s market performance largely reflected the strengths and weaknesses of individual companies and industries. As a result, fundamental research and professional judgment became more important determinants of mutual fund performance in 2004.
What’s ahead for stocks in 2005? No one knows for certain.Positive influences remain in place, including moderately expanding U.S. and global economies and low inflation. Nonetheless, a number of risks — such as rising short-term interest rates, currency fluctuations and generally slowing corporate earnings — could threaten the market environment.
As always, we urge our shareholders to view the stock market from a long-term perspective, measured in years rather than weeks or months. One of the best ways to ensure a long-term perspective is to establish an investment plan with the help of your financial advisor, and review it periodically to track your progress toward your financial goals.
Thank you for your continued confidence and support.
| Stephen E. Canter |
| Chairman and Chief Executive Officer |
| The Dreyfus Corporation |
| January 18, 2005 |

DISCUSSION OF PERFORMANCE
Paul Kandel and Hilary Woods, Portfolio Managers
How did Dreyfus Variable Investment Fund, Developing Leaders Portfolio perform relative to its benchmark?
For the 12-month period ended December 31, 2004, Dreyfus Variable Investment Fund, Developing Leaders Portfolio produced total returns of 11.34% for its Initial shares and 11.05% for its Service shares.1 This compares with a total return of 18.33% for the portfolio’s benchmark, the Russell 2000 Index (the “Index”), during the same period.2
We attribute these results to strong global economic growth and supportive U.S. fiscal policies. Markets rose most sharply during the final months of 2004, with smaller-cap stocks leading the advance.The portfolio participated in the market’s climb, delivering particularly good returns in the energy, financials and producer durables areas. However, relatively weak performance in the health care, materials and processing, and consumer discretionary sectors caused the portfolio’s performance to underperform the benchmark. Also, the portfolio’s lack of exposure to real estate investment trusts (REITs), one of the financial sector’s strongest performing groups, and disappointing results from a handful of other holdings caused the portfolio’s returns to underperform the benchmark.The portfolio’s relative performance also suffered from the exceptional strength of micro-cap stocks during the reporting period. The portfolio generally holds a smaller percentage of these very small company stocks than the benchmark, reflecting our general concerns regarding the quality and liquidity of these issues, and our preference for more fundamentally sound and higher-quality issues.
What is the portfolio’s investment approach?
The portfolio invests primarily in companies with market capitalizations of less than $2 billion at the time of purchase.Typically, these companies are characterized by new or innovative products or services that have the potential to enhance earnings or revenue growth.We also consider factors that we believe are likely to affect a stock’s performance, such as changes in a company’s management or organizational structure.
DISCUSSION OF PERFORMANCE (continued)
|
Our investment approach targets growth-oriented stocks (those companies with earnings or revenues that are expected to grow faster than the overall market),value-oriented stocks (those that appear underpriced according to a variety of financial measurements) and stocks that exhibit both growth and value characteristics.
What other factors influenced the portfolio’s performance?
Energy stocks generated the market’s greatest gains, fueled by strong industrial demand and rising oil and gas prices. In light of favorable industry fundamentals, the portfolio allocated a relatively large percentage of assets to energy holdings. This decision, along with good individual stock selections among independent exploration and production companies, such as Denbury Resources, Cabot Oil & Gas, and Plains Exploration & Production, enabled the portfolio to produce more positive returns than the benchmark in this sector. Good individual stock selections also produced relatively strong returns for the portfolio’s financial services holdings. Top performers included East West Bancorp, which benefited from its exposure to the robust Chinese market; BankAtlantic Bancorp, a fast-growing, consumer-friendly savings and loan institution; and Ventas, a real estate investment trust (REIT) investing in strategically located health care properties. The fund roughly matched the benchmark’s rise in the producer durables area, one of the market’s best performing sectors.
On the other hand, a few individual stock selections in key sectors caused the fund to underperform its benchmark. Health care proved the fund’s most disappointing single sector of investment.The portfolio’s weaker performing health care holdings included Corgentech, a biotechnology company that was hurt by the negative results of a drug study;Accredo Health, a pharmaceutical distributor that was impacted by government reimbursement policies; and NDCHealth, a service provider that reported an earnings shortfall during the reporting period.Among materials and processing holdings, steel mill equipment maker GrafTech International missed earnings despite very strong steel demand, while newsprint manufacturer Bowater was undercut by rising costs and declining demand. Finally, in the consumer discretionary
sector, specialty retailers Talbots and Linens ‘N Things failed to meet expectations, while broadcasting company Emmis Communications was undermined by unexpectedly weak advertising revenues.
What is the portfolio’s current strategy?
As of the end of the reporting period, we have emphasized industry groups that we believe are well-positioned for the next phase of the business cycle.We have trimmed the portfolio’s exposure to materials and processing stocks, a cyclical group that we believe is unlikely to sustain its recent levels of growth.We have also reduced the portfolio’s exposure to stocks in the financial and consumer discretionary sectors that we believe may prove vulnerable to rising interest rates and consumer pullback. Instead, we continue to emphasize energy and producer durables stocks that are positioned to prosper from continuing industrial strength, and have increased exposure to technology stocks that appear attractively valued and likely to benefit from increased corporate capital spending, and health care stocks, particularly those of service providers meeting the increasing needs of an aging population.
| | | The portfolio is only available as a funding vehicle under variable life insurance policies or variable |
| | | annuity contracts issued by insurance companies. Individuals may not purchase shares of the |
| | | portfolio directly.A variable annuity is an insurance contract issued by an insurance company that |
| | | enables investors to accumulate assets on a tax-deferred basis for retirement or other long-term |
| | | goals.The investment objectives and policies of Dreyfus Variable Investment Fund, Developing |
| | | Leaders Portfolio made available through insurance products may be similar to other |
| | | funds/portfolios managed or advised by Dreyfus. However, the investment results of the portfolio |
| | | may be higher or lower than, and may not be comparable to, those of any other Dreyfus |
| | | fund/portfolio. |
| 1 | | Total return includes reinvestment of dividends and any capital gains paid. Past performance is no |
| | | guarantee of future results. Share price and investment return fluctuate such that upon redemption, |
| | | portfolio shares may be worth more or less than their original cost.The portfolio’s performance does |
| | | not reflect the deduction of additional charges and expenses imposed in connection with investing |
| | | in variable insurance contracts, which will reduce returns. |
| | | Part of the portfolio’s recent performance is attributable to positive returns from its initial |
| | | public offering (IPO) investments.There can be no guarantee that IPOs will have or |
| | | continue to have a positive effect on the portfolio’s performance. |
| 2 | | SOURCE: LIPPER INC. — Reflects reinvestment of dividends and, where applicable, capital |
| | | gain distributions.The Russell 2000 Index is an unmanaged index of small-cap stock |
| | | performance and is composed of the 2,000 smallest companies in the Russell 3000 Index.The |
| | | Russell 3000 Index is composed of the 3,000 largest U.S. companies based on total market |
| | | capitalization. |
The Portfolio 5
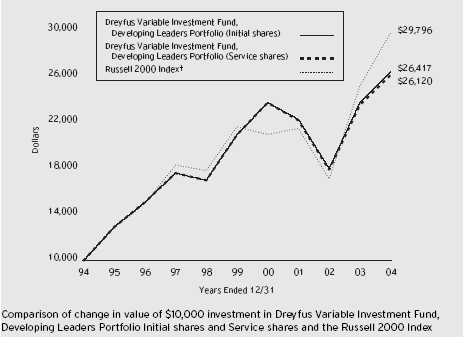
| Average Annual Total Returns as of | | 12/31/04 | | | | |
| |
| | | 1 Year | | 5 Years | | 10 Years |
| |
| |
| |
|
| Initial shares | | 11.34% | | 4.76% | | 10.20% |
| Service shares | | 11.05% | | 4.52% | | 10.08% |
| |
| The data for Service shares includes the results of Initial shares for the period prior to December 31, 2000 |
| (inception date of Service shares). Actual Service shares’ average annual total return and hypothetical growth |
| results would have been lower. See notes below. | | | | | | |
| † Source: Lipper Inc. | | | | | | |
| Past performance is not predictive of future performance.The portfolio’s performance shown in the graph and table does not |
| reflect the deduction of taxes that a shareholder would pay on portfolio distributions or the redemption of portfolio shares. |
| Part of the portfolio’s recent performance is attributable to positive returns from its initial public offering (IPO) investments. |
| There can be no guarantee that IPOs will have or continue to have a positive effect on the portfolio’s performance. |
| The portfolio’s performance does not reflect the deduction of additional charges and expenses imposed in |
| connection with investing in variable insurance contracts which will reduce returns. | | |
| The above graph compares a $10,000 investment made in Initial and Service shares of Dreyfus Variable Investment |
| Fund, Developing Leaders Portfolio on 12/31/94 to a $10,000 investment made in the Russell 2000 Index (the |
| “Index”) on that date. | | | | | | |
6
The portfolio’s Initial shares are not subject to a Rule 12b-1 fee.The portfolio’s Service shares are subject to a 0.25% annual Rule 12b-1 fee.The performance figures for Service shares reflect the performance of the portfolio’s Initial shares from their inception date through December 30, 2000, and the performance of the portfolio’s Service shares from December 31, 2000 (inception date of Service shares) to December 31, 2004 (blended performance figures).The blended performance figures have not been adjusted to reflect the higher operating expenses of the Service shares. If these expenses had been reflected, the blended performance figures would have been lower. All dividends and capital gain distributions are reinvested.
The portfolio’s performance shown in the line graph takes into account all applicable portfolio fees and expenses.The Index is an unmanaged index and is composed of the 2,000 smallest companies in the Russell 3000 Index.The Russell 3000 Index is composed of 3,000 of the largest U.S. companies by market capitalization.The Index does not take into account charges, fees and other expenses. Further information relating to portfolio performance, including expense reimbursements, if applicable, is contained in the Financial Highlights section of the prospectus and elsewhere in this report.
As a mutual fund investor,you pay ongoing expenses,such as management fees and other expenses.Using the information below,you can estimate how these expenses affect your investment and compare them with the expenses of other funds.You also may pay one-time transaction expenses,including sales charges (loads) and redemption fees, which are not shown in this section and would have resulted in higher total expenses. For more information, see your portfolio’s prospectus or talk to your financial adviser.
Review your portfolio’s expenses
|
The table below shows the expenses you would have paid on a $1,000 investment in Dreyfus Variable Investment Fund, Developing Leaders Portfolio from July 1, 2004 to December 31, 2004. It also shows how much a $1,000 investment would be worth at the close of the period, assuming actual returns and expenses.
| Expenses and Value of a $1,000 Investment | | |
| assuming actual returns for the six months ended December 31, 2004 |
| | | Initial Shares | | Service Shares |
| |
| |
|
| Expenses paid per $1,000 † | | $ 4.15 | | $ 5.40 |
| Ending value (after expenses) | | $1,065.50 | | $1,064.00 |
| COMPARING YOUR PORTFOLIO’S EXPENSES |
| WITH THOSE OF OTHER FUNDS (Unaudited) |
Using the SEC’s method to compare expenses
The Securities and Exchange Commission (SEC) has established guidelines to help investors assess fund expenses. Per these guidelines, the table below shows your portfolio’s expenses based on a $1,000 investment, assuming a hypothetical 5% annualized return. You can use this information to compare the ongoing expenses (but not transaction expenses or total cost) of investing in the portfolio with those of other funds. All mutual fund shareholder reports will provide this information to help you make this comparison. Please note that you cannot use this information to estimate your actual ending account balance and expenses paid during the period.
| Expenses and Value of a $1,000 Investment |
| assuming a hypothetical 5% annualized return for the six months ended December 31, 2004 |
| | | Initial Shares | | Service Shares |
| |
| |
|
| Expenses paid per $1,000 † | | $ 4.06 | | $ 5.28 |
| Ending value (after expenses) | | $1,021.11 | | $1,019.91 |
| † Expenses are equal to the portfolio’s annualized expense ratio of .80% for Initial shares and 1.04% for Service shares, |
| multiplied by the average account value over the period, multiplied by 184/366 (to reflect the one-half year period). |
STATEMENT OF INVESTMENTS
December 31, 2004
|
| Common Stocks—95.5% | | Shares | | Value ($) |
| |
| |
|
| Autos & Transports—5.4% | | | | |
| Kansas City Southern | | 500,000 a | | 8,865,000 |
| SkyWest | | 550,000 | | 11,033,000 |
| USF | | 295,000 | | 11,195,250 |
| Wabtec | | 610,000 | | 13,005,200 |
| | | | | 44,098,450 |
| Consumer—15.7% | | | | |
| Aeropostale | | 375,000 a | | 11,036,250 |
| Emmis Communications, Cl. A | | 520,000 a | | 9,978,800 |
| Finish Line, Cl. A | | 500,000 | | 9,150,000 |
| Intrawest | | 300,000 | | 6,897,000 |
| Meredith | | 145,000 | | 7,859,000 |
| PETCO Animal Supplies | | 250,000 a | | 9,870,000 |
| Pacific Sunwear of California | | 490,000 a | | 10,907,400 |
| Station Casinos | | 175,000 | | 9,569,000 |
| Talbots | | 300,000 | | 8,169,000 |
| United Natural Foods | | 365,000 a | | 11,351,500 |
| Valassis Communications | | 288,500 a | | 10,100,385 |
| WMS Industries | | 340,000 a,b | | 11,403,600 |
| Warnaco Group | | 532,000 a | | 11,491,200 |
| | | | | 127,783,135 |
| Energy—7.1% | | | | |
| Cabot Oil & Gas | | 255,500 | | 11,305,875 |
| Denbury Resources | | 450,000 a | | 12,352,500 |
| Key Energy Services | | 850,000 a | | 10,030,000 |
| Plains Exploration & Production | | 482,000 a | | 12,532,000 |
| TGS Nopec Geophysical | | 449,300 a | | 11,465,886 |
| | | | | 57,686,261 |
| Financial Services—18.6% | | | | |
| BOK Financial | | 215,000 a | | 10,483,400 |
| BankAtlantic Bancorp, Cl. A | | 600,000 | | 11,940,000 |
| Boston Private Financial Holdings | | 370,000 | | 10,422,900 |
| Cullen/Frost Bankers | | 205,000 | | 9,963,000 |
S T A T E M E N T O F I N V E S T M E N T S (continued)
| Common Stocks (continued) | | Shares | | Value ($) |
| |
| |
|
| Financial Services (continued) | | | | |
| East West Bancorp | | 269,500 | | 11,308,220 |
| First Midwest Bancorp | | 330,000 | | 11,975,700 |
| Global Payments | | 169,000 | | 9,893,260 |
| Harbor Florida Bancshares | | 355,000 | | 12,286,550 |
| MAF Bancorp | | 225,000 | | 10,084,500 |
| Montpelier Re Holdings | | 267,500 | | 10,285,375 |
| OMEGA Healthcare Investors | | 925,000 | | 10,915,000 |
| Saxon Capital | | 410,000 | | 9,835,900 |
| Texas Regional Bancshares, Cl. A | | 345,000 | | 11,274,600 |
| Webster Financial | | 200,000 | | 10,128,000 |
| | | | | 150,796,405 |
| Health Care—13.1% | | | | |
| Alexion Pharmaceuticals | | 325,000 a | | 8,190,000 |
| Apria Healthcare Group | | 407,500 a | | 13,427,125 |
| Genesis HealthCare | | 375,000 a | | 13,136,250 |
| IDX Systems | | 350,000 a | | 12,061,000 |
| Impax Laboratories | | 600,000 a | | 9,528,000 |
| Magellan Health Services | | 275,000 a | | 9,394,000 |
| Medicis Pharmaceutical, Cl. A | | 275,000 | | 9,655,250 |
| NDCHealth | | 366,000 | | 6,803,940 |
| NeighborCare | | 336,000 a | | 10,321,920 |
| Renal Care Group | | 371,500 a | | 13,370,285 |
| | | | | 105,887,770 |
| Materials & Processing—8.0% | | | | |
| Agnico-Eagle Mines | | 825,000 | | 11,343,750 |
| Agrium | | 699,000 | | 11,778,150 |
| Chesapeake | | 375,000 | | 10,185,000 |
| GrafTech International | | 1,000,000 a | | 9,460,000 |
| Olin | | 548,500 | | 12,077,970 |
| Wheaton River Minerals | | 3,032,000 a | | 9,884,320 |
| | | | | 64,729,190 |
| Common Stocks (continued) | | Shares | | Value ($) |
| |
| |
|
| Producer Durables—9.2% | | | | |
| Actuant, Cl. A | | 210,000 a | | 10,951,500 |
| Albany International, Cl. A | | 320,000 | | 11,251,200 |
| Gardner Denver | | 205,400 a | | 7,453,966 |
| Ritchie Bros. Auctioneers | | 381,000 | | 12,595,860 |
| Triumph Group | | 298,000 a | | 11,771,000 |
| United Defense Industries | | 250,000 a | | 11,812,500 |
| WESCO International | | 300,000 a | | 8,892,000 |
| | | | | 74,728,026 |
| Technology—13.9% | | | | |
| CACI International, Cl. A | | 150,000 a | | 10,219,500 |
| Exar | | 690,000 a | | 9,791,100 |
| Hyperion Solutions | | 135,000 a | | 6,293,700 |
| InfoSpace | | 173,000 a | | 8,226,150 |
| Integrated Circuit Systems | | 360,000 a | | 7,531,200 |
| Plexus | | 700,000 a | | 9,107,000 |
| Quest Software | | 725,000 a | | 11,563,750 |
| Silicon Image | | 475,000 a | | 7,818,500 |
| Skyworks Solutions | | 1,000,000 a | | 9,430,000 |
| Sycamore Networks | | 1,782,000 a | | 7,234,920 |
| TIBCO Software | | 1,000,000 a | | 13,340,000 |
| Varian Semiconductor | | | | |
| Equipment Associates | | 325,000 a | | 11,976,250 |
| | | | | 112,532,070 |
| Utilities & Other—4.5% | | | | |
| Arch Coal | | 300,000 | | 10,662,000 |
| OGE Energy | | 295,000 | | 7,820,450 |
| UIL Holdings | | 175,000 | | 8,977,500 |
| Vectren | | 335,000 | | 8,978,000 |
| | | | | 36,437,950 |
| Total Common Stocks | | | | |
| (cost $601,140,235) | | | | 774,679,257 |
S T A T E M E N T O F I N V E S T M E N T S (continued)
| Other Investments—4.6% | | Shares | | Value ($) |
| |
| |
|
| Registered Investment Company; | | | | |
| Dreyfus Institutional Preferred Plus Money Market Fund | | |
| (cost $37,422,000) | | 37,422,000 c | | 37,422,000 |
| |
| |
|
| |
| Investment of Cash Collateral | | | | |
| for Securities Loaned—1.5% | | | | |
| |
| |
|
| Registered Investment Company; | | | | |
| Dreyfus Institutional Cash Advantage Fund | | | | |
| (cost $11,900,000) | | 11,900,000 c | | 11,900,000 |
| |
| |
|
| |
| Total Investments (cost $650,462,235) | | 101.6% | | 824,001,257 |
| Liabilities, Less Cash and Receivables | | (1.6%) | | (12,997,234) |
| Net Assets | | 100.0% | | 811,004,023 |
| |
| a Non-income producing. | | | | |
| b This security is on loan.At December 31, 2004, the total market value of the portfolio’s security on loan is |
| $11,403,600 and the total market value of the collateral held by the portfolio is $11,900,000. |
| c Investments in affiliated money market mutual funds. | | |
| Portfolio Summary † | | | | | | |
| |
| | | Value (%) | | | | Value (%) |
| |
| |
| |
|
| Financial Services | | 18.6 | | Energy | | 7.1 |
| Consumer | | 15.7 | | Money Market Investments | | 6.1 |
| Technology | | 13.9 | | Autos & Transport | | 5.4 |
| Health Care | | 13.1 | | Utilities & Other | | 4.5 |
| Producer Durables | | 9.2 | | | | |
| Materials & Processing | | 8.0 | | | | 101.6 |
| † Based on net assets. |
| See notes to financial statements. |
STATEMENT OF ASSETS AND LIABILITIES
December 31, 2004
| | | Cost | | Value |
| |
| |
|
| Assets ($): | | | | |
| Investments in securities—See Statement of | | |
| Investments (including securities on loan, | | |
| valued at $11,403,600)—Note 1(c): | | | | |
| Unaffiliated issuers | | 601,140,235 | | 774,679,257 |
| Affiliated issuers | | 49,322,000 | | 49,322,000 |
| Cash | | | | 133,498 |
| Cash denominated in foreign currencies | | 166,392 | | 173,187 |
| Dividends and interest receivable | | | | 839,153 |
| Receivable for shares of Beneficial Interest subscribed | | 4,679 |
| Prepaid expenses | | | | 16,584 |
| | | | | 825,168,358 |
| |
| |
|
| Liabilities ($): | | | | |
| Due to The Dreyfus Corporation and affiliates—Note 3(b) | | 525,404 |
| Liability for securities on loan—Note 1(c) | | | | 11,900,000 |
| Payable for shares of Beneficial Interest redeemed | | 1,663,285 |
| Accrued expenses | | | | 75,646 |
| | | | | 14,164,335 |
| |
| |
|
| Net Assets ($) | | | | 811,004,023 |
| |
| |
|
| Composition of Net Assets ($): | | | | |
| Paid-in capital | | | | 694,305,389 |
| Accumulated undistributed investment income—net | | 508,750 |
| Accumulated net realized gain (loss) on investments | | (57,355,933) |
| Accumulated net unrealized appreciation (depreciation) | | |
| on investments and foreign currency transactions | | 173,545,817 |
| |
|
| Net Assets ($) | | | | 811,004,023 |
| |
| |
|
| |
| |
| Net Asset Value Per Share | | | | |
| | | Initial Shares | | Service Shares |
| |
| |
|
| Net Assets ($) | | 788,942,820 | | 22,061,203 |
| Shares Outstanding | | 18,989,068 | | 535,157 |
| |
| |
|
| Net Asset Value Per Share ($) | | 41.55 | | 41.22 |
See notes to financial statements.
|
STATEMENT OF OPERATIONS
Year Ended December 31, 2004
|
| Investment Income ($): | | |
| Income: | | |
| Cash dividends (net of $55,759 foreign taxes withheld at source): | | |
| Unaffiliated issuers | | 7,167,333 |
| Affiliated issuers | | 519,319 |
| Income from securities lending | | 68,643 |
| Total Income | | 7,755,295 |
| Expenses: | | |
| Investment advisory fee—Note 3(a) | | 5,852,263 |
| Prospectus and shareholders’ reports | | 96,892 |
| Trustees’ fees and expenses—Note 3(c) | | 71,904 |
| Custodian fees—Note 3(b) | | 59,118 |
| Distribution fees—Note 3(b) | | 50,970 |
| Professional fees | | 37,330 |
| Shareholder servicing costs—Note 3(b) | | 37,278 |
| Loan commitment fees—Note 2 | | 6,187 |
| Miscellaneous | | 14,197 |
| Total Expenses | | 6,226,139 |
| Less—reduction in custody fees | | |
| due to earnings credits—Note 1(c) | | (387) |
| Net Expenses | | 6,225,752 |
| Investment Income—Net | | 1,529,543 |
| |
|
| Realized and Unrealized Gain (Loss) on Investments—Note 4 ($): |
| Net realized gain (loss) on investments | | 48,901,062 |
| Net unrealized appreciation (depreciation) | | |
| on investments and foreign currency transactions | | 33,039,125 |
| Net Realized and Unrealized Gain (Loss) on Investments | | 81,940,187 |
| Net Increase in Net Assets Resulting from Operations | | 83,469,730 |
See notes to financial statements.
|
STATEMENT OF CHANGES IN NET ASSETS
| | | Year Ended December 31, |
| |
|
| | | 2004 | | 2003 |
| |
| |
|
| Operations ($): | | | | |
| Investment income—net | | 1,529,543 | | 171,225 |
| Net realized gain (loss) on investments | | 48,901,062 | | (7,755,901) |
| Net unrealized appreciation | | | | |
| (depreciation) on investments | | 33,039,125 | | 189,919,681 |
| Net Increase (Decrease) in Net Assets | | | | |
| Resulting from Operations | | 83,469,730 | | 182,335,005 |
| |
| |
|
| Dividends to Shareholders from ($): | | | | |
| Investment income—net: | | | | |
| Initial shares | | (1,506,023) | | (191,547) |
| |
| |
|
| Beneficial Interest Transactions ($): | | | | |
| Net proceeds from shares sold: | | | | |
| Initial shares | | 58,479,227 | | 141,542,406 |
| Service shares | | 7,722,696 | | 5,413,892 |
| Dividends reinvested: | | | | |
| Initial shares | | 1,506,023 | | 191,547 |
| Cost of shares redeemed: | | | | |
| Initial shares | | (95,845,376) | | (152,689,640) |
| Service shares | | (5,211,288) | | (2,576,974) |
| Increase (Decrease) in Net Assets from | | | | |
| Beneficial Interest Transactions | | (33,348,718) | | (8,118,769) |
| Total Increase (Decrease) in Net Assets | | 48,614,989 | | 174,024,689 |
| |
| |
|
| Net Assets ($): | | | | |
| Beginning of Period | | 762,389,034 | | 588,364,345 |
| End of Period | | 811,004,023 | | 762,389,034 |
| Undistributed investment income—net | | 508,750 | | — |
| |
| |
|
| Capital Share Transactions (Shares): | | | | |
| Initial Shares | | | | |
| Shares sold | | 1,499,986 | | 4,641,650 |
| Shares issued for dividends reinvested | | 36,750 | | 5,211 |
| Shares redeemed | | (2,467,053) | | (5,058,387) |
| Net Increase (Decrease) in Shares Outstanding | | (930,317) | | (411,526) |
| |
| |
|
| Service Shares | | | | |
| Shares sold | | 199,242 | | 170,027 |
| Shares redeemed | | (136,149) | | (83,573) |
| Net Increase (Decrease) in Shares Outstanding | | 63,093 | | 86,454 |
See notes to financial statements.
|
The following tables describe the performance for each share class for the fiscal periods indicated.All information (except portfolio turnover rate) reflects financial results for a single portfolio share.Total return shows how much your investment in the portfolio would have increased (or decreased) during each period, assuming you had reinvested all dividends and distributions.These figures have been derived from the portfolio’s financial statements.
| | | | | Year Ended December 31, | | |
| |
| |
| |
|
| Initial Shares | | 2004 | | 2003 | | 2002 | | 2001 | | 2000 |
| |
| |
| |
| |
| |
|
| Per Share Data ($): | | | | | | | | | | |
| Net asset value, beginning of period | | 37.39 | | 28.40 | | 35.13 | | 40.30 | | 66.34 |
| Investment Operations: | | | | | | | | | | |
| Investment income—net a | | .08 | | .01 | | .01 | | .11 | | .17 |
| Net realized and unrealized | | | | | | | | | | |
| gain (loss) on investments | | 4.16 | | 8.99 | | (6.73) | | (2.63) | | 7.16 |
| Total from Investment Operations | | 4.24 | | 9.00 | | (6.72) | | (2.52) | | 7.33 |
| Distributions: | | | | | | | | | | |
| Dividends from investment income—net | | (.08) | | (.01) | | (.01) | | (.17) | | (.27) |
| Dividends from net realized | | | | | | | | | | |
| gain on investments | | — | | — | | — | | (1.38) | | (33.10) |
| Dividends in excess of net | | | | | | | | | | |
| realized gain on investments | | — | | — | | — | | (1.10) | | — |
| Total Distributions | | (.08) | | (.01) | | (.01) | | (2.65) | | (33.37) |
| Net asset value, end of period | | 41.55 | | 37.39 | | 28.40 | | 35.13 | | 40.30 |
| |
| |
| |
| |
| |
|
| Total Return (%) | | 11.34 | | 31.69 | | (19.12) | | (6.12) | | 13.31 |
| |
| |
| |
| |
| |
|
| Ratios/Supplemental Data (%): | | | | | | | | | | |
| Ratio of total expenses | | | | | | | | | | |
| to average net assets | | .79 | | .82 | | .81 | | .79 | | .78 |
| Ratio of net expenses | | | | | | | | | | |
| to average net assets | | .79 | | .82 | | .81 | | .79 | | .78 |
| Ratio of net investment income | | | | | | | | | | |
| to average net assets | | .20 | | .03 | | .02 | | .29 | | .24 |
| Portfolio Turnover Rate | | 56.06 | | 69.34 | | 52.41 | | 84.45 | | 64.99 |
| |
| |
| |
| |
| |
|
| Net Assets, end of period ($ x 1,000) | | 788,943 | | 744,866 | | 577,468 | | 687,283 | | 688,070 |
a Based on average shares outstanding at each month end.
See notes to financial statements.
|
| | | | | | | Year Ended December 31, | | |
| | | |
| |
| |
|
| Service Shares | | 2004 | | 2003 | | 2002 | | 2001 | | 2000 a |
| |
| |
| |
| |
| |
|
| Per Share Data ($): | | | | | | | | | | |
| Net asset value, beginning of period | | 37.12 | | 28.26 | | 35.02 | | 40.30 | | 40.30 |
| Investment Operations: | | | | | | | | | | |
| Investment (loss)—net | | (.02)b | | (.07)b | | (.03)b | | (.01)b | | — |
| Net realized and unrealized | | | | | | | | | | |
| gain (loss) on investments | | 4.12 | | 8.93 | | (6.72) | | (2.67) | | — |
| Total from Investment Operations | | 4.10 | | 8.86 | | (6.75) | | (2.68) | | — |
| Distributions: | | | | | | | | | | |
| Dividends from investment income—net | | — | | — | | (.01) | | (.12) | | — |
| Dividends from net realized | | | | | | | | | | |
| gain on investments | | — | | — | | — | | (1.38) | | — |
| Dividends in excess of net | | | | | | | | | | |
| realized gain on investments | | — | | — | | — | | (1.10) | | — |
| Total Distributions | | — | | — | | (.01) | | (2.60) | | — |
| Net asset value, end of period | | 41.22 | | 37.12 | | 28.26 | | 35.02 | | 40.30 |
| |
| |
| |
| |
| |
|
| Total Return (%) | | 11.05 | | 31.35 | | (19.31) | | (6.47) | | — |
| |
| |
| |
| |
| |
|
| Ratios/Supplemental Data (%): | | | | | | | | | | |
| Ratio of total expenses | | | | | | | | | | |
| to average net assets | | 1.04 | | 1.07 | | 1.05 | | 1.11 | | — |
| Ratio of net expenses | | | | | | | | | | |
| to average net assets | | 1.04 | | 1.07 | | 1.05 | | 1.11 | | — |
| Ratio of net investment (loss) | | | | | | | | | | |
| to average net assets | | (.04) | | (.22) | | (.11) | | (.02) | | — |
| Portfolio Turnover Rate | | 56.06 | | 69.34 | | 52.41 | | 84.45 | | 64.99 |
| |
| |
| |
| |
| |
|
| Net Assets, end of period ($ x 1,000) | | 22,061 | | 17,523 | | 10,896 | | 5,796 | | 1 |
| |
| a | | The portfolio commenced offering Service shares on December 31, 2000. | | | | | | |
| b | | Based on average shares outstanding at each month end. | | | | | | | | |
| See notes to financial statements. | | | | | | | | | | |
NOTES TO FINANCIAL STATEMENTS
NOTE 1—Significant Accounting Policies:
Dreyfus Variable Investment Fund (the “fund”) is registered under the Investment Company Act of 1940, as amended (the “Act”), as an open-end management investment company, operating as a series company currently offering twelve series, including the Developing Leaders Portfolio (the “portfolio”). The portfolio is only offered to separate accounts established by insurance companies to fund variable annuity contracts and variable life insurance policies.The portfolio is a diversified series. The portfolio’s investment objective is capital growth.The Dreyfus Corporation (the “Manager” or “Dreyfus”) serves as the portfolio’s investment adviser.The Manager is a wholly-owned subsidiary of Mellon Financial Corporation (“Mellon Financial”).
Dreyfus Service Corporation (the “Distributor”), a wholly-owned subsidiary of the Manager, is the distributor of the portfolio’s shares, which are sold without a sales charge.The portfolio is authorized to issue an unlimited number of $.001 par value shares of Beneficial Interest in the following classes of shares: Initial and Service. Each class of shares has identical rights and privileges, except with respect to the distribution plan and the expenses borne by each class and certain voting rights. Income, expenses (other than expenses attributable to a specific class), and realized and unrealized gains or losses on investments are allocated to each class of shares based on its relative net assets.
The fund accounts separately for the assets, liabilities and operations of each series. Expenses directly attributable to each series are charged to that series’ operations; expenses which are applicable to all series are allocated among them on a pro rata basis.
The portfolio’s financial statements are prepared in accordance with U.S. generally accepted accounting principles, which may require the use of management estimates and assumptions.Actual results could differ from those estimates.
The fund enters into contracts that contain a variety of indemnifica-tions.The portfolio’s maximum exposure under these arrangements is unknown. The portfolio does not anticipate recognizing any loss related to these arrangements.
(a) Portfolio valuation: Investments in securities are valued at the last sales price on the securities exchange or national securities market on which such securities are primarily traded. Securities listed on the National Market System for which market quotations are available are valued at the official closing price or, if there is no official closing price that day, at the last sale price. Securities not listed on an exchange or the national securities market, or securities for which there were no transactions, are valued at the average of the most recent bid and asked prices, except for open short positions, where the asked price is used for valuation purposes. Bid price is used when no asked price is available. Investments in registered investment companies are valued at their net asset value. When market quotations or official closing prices are not readily available, or are determined not to reflect accurately fair value, such as when the value of a security has been significantly affected by events after the close of the exchange or market on which the security is principally traded (for example, a foreign exchange or market), but before the portfolio calculates its net asset value, the portfolio may value these investments at fair value as determined in accordance with the procedures approved by the Board of Trustees. Fair valuing of securities may be determined with the assistance of a pricing service using calculations based on indices of domestic securities and other appropriate indicators, such as prices of relevant ADR’s and futures contracts. For other securities that are fair valued by the Board of Trustees, certain factors may be considered such as: fundamental analytical data, the nature and duration of restrictions on disposition, an evaluation of the forces that influence the market in which the securities are purchased and sold, and public trading in similar securities of the issuer or comparable issuers. Investments denominated in foreign currencies are translated to U.S. dollars at the prevailing rates of exchange. Forward currency exchange contracts are valued at the forward rate.
(b) Foreign currency transactions: The portfolio does not isolate that portion of the results of operations resulting from changes in foreign exchange rates on investments from the fluctuations arising from changes in market prices of securities held. Such fluctuations are included with the net realized and unrealized gain or loss on investments.
NOTES TO FINANCIAL STATEMENTS (continued)
|
Net realized foreign exchange gains or losses arise from sales and maturities of short-term securities, sales of foreign currencies, currency gains or losses realized on securities transactions and the difference between the amounts of dividends, interest and foreign withholding taxes recorded on the portfolio’s books and the U.S. dollar equivalent of the amounts actually received or paid. Net unrealized foreign exchange gains or losses arise from changes in the value of assets and liabilities other than investments in securities resulting from changes in exchange rates. Such gains and losses are included with net realized and unrealized gain or loss on investments.
(c) Securities transactions and investment income: Securities transactions are recorded on a trade date basis. Realized gain and loss from securities transactions are recorded on the identified cost basis. Dividend income is recognized on the ex-dividend date and interest income, including, where applicable, accretion of discount and amortization of premium on investments, is recognized on the accrual basis.
The portfolio has an arrangement with the custodian bank whereby the portfolio receives earnings credits from the custodian when positive cash balances are maintained, which are used to offset custody fees. For financial reporting purposes, the portfolio includes net earnings credits as an expense offset in the Statement of Operations.
Pursuant to a securities lending agreement with Mellon Bank, N.A., an affiliate of the Manager, the portfolio may lend securities to qualified institutions.At origination, all loans are secured by collateral of at least 102% of the value of U.S. securities loaned and 105% of the value of foreign securities loaned. Collateral equivalent to at least 100% of the market value of securities on loan will be maintained at all times. Cash collateral is invested in certain money market mutual funds managed by the Manager. The portfolio will be entitled to receive all income on securities loaned, in addition to income earned as a result of the lending transaction.Although each security loaned is fully collateralized, the portfolio would bear the risk of delay in recovery of, or loss of rights in, the securities loaned should a borrower fail to return the securities in a timely manner.
(d) Affiliated issuers: Investments in other investment companies advised by the Manager are defined as “affiliated” in the Act.
(e) Dividends to shareholders: Dividends are recorded on the ex-dividend date. Dividends from investment income-net and dividends from net realized capital gain, if any, are normally declared and paid annually, but the portfolio may make distributions on a more frequent basis to comply with the distribution requirements of the Internal Revenue Code of 1986,as amended (the “Code”).To the extent that net realized capital gain can be offset by capital loss carryovers, it is the policy of the portfolio not to distribute such gain. Income and capital gain distributions are determined in accordance with income tax regulations, which may differ from U.S. generally accepted accounting principles.
(f) Federal income taxes: It is the policy of the portfolio to continue to qualify as a regulated investment company, if such qualification is in the best interests of its shareholders, by complying with the applicable provisions of the Code, and to make distributions of taxable income sufficient to relieve it from substantially all federal income and excise taxes.
At December 31, 2004, the components of accumulated earnings on a tax basis were as follows: accumulated capital losses $54,226,304 and unrealized appreciation $170,924,938.
The accumulated capital loss carryover is available to be applied against future net securities profits, if any, realized subsequent to December 31, 2004. If not applied, $35,667,011 of the carryover expires in fiscal 2010 and $18,559,293 expires in fiscal 2011.
The tax character of distributions paid to shareholders during the fiscal periods ended December 31, 2004 and December 31, 2003, were as follows: ordinary income $1,506,023 and $191,547, respectively.
During the period ended December 31, 2004, as a result of permanent book to tax differences primarily due to the tax treatment for real estate investment trusts and distributions in excess of investment income, the portfolio increased accumulated undistributed investment
NOTES TO FINANCIAL STATEMENTS (continued)
|
income-net by $485,230 and decreased paid-in capital by the same amount. Net assets were not affected by this reclassification.
NOTE 2—Bank Line of Credit:
|
The portfolio participates with other Dreyfus-managed funds in a $350 million redemption credit facility (the “Facility”) to be utilized for temporary or emergency purposes, including the financing of redemptions. In connection therewith, the portfolio has agreed to pay commitment fees on its pro rata portion of the Facility. Interest is charged to the portfolio based on prevailing market rates in effect at the time of borrowings. During the period ended December 31, 2004, the portfolio did not borrow under the Facility.
NOTE 3—Investment Advisory Fee and Other Transactions With Affiliates:
(a) Pursuant to an Investment Advisory Agreement with the Manager, the investment advisory fee is computed at the annual rate of .75 of 1% of the value of the portfolio’s average daily net assets and is payable monthly.
(b) Under the Distribution Plan (the “Plan”) adopted pursuant to Rule 12b-1 under the Act, Service shares pay the Distributor for distributing their shares, for servicing and/or maintaining Service shares shareholder accounts and for advertising and marketing for Service shares.The Plan provides for payments to be made at an annual rate of .25 of 1% of the value of the Service shares’ average daily net assets.The Distributor may make payments to Participating Insurance Companies and to brokers and dealers acting as principal underwriter for their variable insurance products.The fees payable under the Plan are payable without regard to actual expenses incurred. During the period ended December 31, 2004, Service shares were charged $50,970 pursuant to the Plan.
The portfolio compensates Dreyfus Transfer, Inc., a wholly-owned subsidiary of the Manager, under a transfer agency agreement for providing personnel and facilities to perform transfer agency services for the portfolio. During the period ended December 31, 2004, the portfolio was charged $868 pursuant to the transfer agency agreement.
The portfolio compensates Mellon Bank, N.A., an affiliate of the Manager, under a custody agreement for providing custodial services for the portfolio. During the period ended December 31, 2004, the portfolio was charged $59,118 pursuant to the custody agreement.
The components of Due to The Dreyfus Corporation and affiliates in the Statement of Assets and Liabilities consist of: investment advisory fees $511,101, Rule 12b-1 distribution plan fees $4,597, custodian fees $9,556 and transfer agency per account fees $150.
(c) Each Board member also serves as a Board member of other funds within the Dreyfus complex. Annual retainer fees and attendance fees are allocated to each fund based on net assets.
(d) Pursuant to an exemptive order from the Securities and Exchange Commission, the portfolio invests its available cash balances in affiliated money market mutual funds as shown in the portfolio’s Statement of Investments. Management fees of the underlying money market mutual funds have been waived by the Manager.
NOTE 4—Securities Transactions:
The aggregate amount of purchases and sales of investment securities, excluding short-term securities, during the period ended December 31, 2004, amounted to $417,015,019 and $469,897,294, respectively.
At December 31, 2004, the cost of investments for federal income tax purposes was $653,083,114; accordingly, accumulated net unrealized appreciation on investments was $170,918,143, consisting of $196,050,400 gross unrealized appreciation and $25,132,257 gross unrealized depreciation.
In early 2004, two purported class and derivative actions were filed against Mellon Financial, Mellon Bank, N.A., Dreyfus, Founders Asset Management LLC, and certain directors of the Dreyfus Funds and the Dreyfus Founders Funds (together, the “Funds”). In September 2004, plaintiffs served a Consolidated Amended Complaint (the “Amended
NOTES TO FINANCIAL STATEMENTS (continued)
|
Complaint”) on behalf of a purported class of all persons who acquired interests in any of the Funds between January 30, 1999 and November 17, 2003, and derivatively on behalf of the Funds. The Amended Complaint in the newly styled In re Dreyfus Mutual Funds Fee Litigation also named the Distributor, Premier Mutual Fund Services, Inc. and two additional Fund directors as defendants and alleges violations of the Investment Company Act of 1940, the Investment Advisers Act of 1940, the Pennsylvania Unfair Trade Practices and Consumer Protection Law and common-law claims. Plaintiffs seek to recover allegedly improper and excessive Rule 12b-1 and advisory fees allegedly charged to the Funds for marketing and distribution services. More specifically, plaintiffs claim, among other things, that 12b-1 fees and directed brokerage were improperly used to pay brokers to recommend the Funds over other funds, and that such payments were not disclosed to investors. In addition, plaintiffs assert that economies of scale and soft-dollar benefits were not passed on to the Funds. Plaintiffs further allege that 12b-1 fees were improperly charged to certain of the Funds that were closed to new investors.The Amended Complaint seeks compensatory and punitive damages,rescission of the advisory contracts, and an accounting and restitution of any unlawful fees, as well as an award of attorneys’ fees and litigation expenses. As noted, some of the claims in this litigation are asserted derivatively on behalf of the Funds that have been named as nominal defendants. With respect to such derivative claims, no relief is sought against the Funds. Dreyfus believes the allegations to be totally without merit and intends to defend the action vigorously. Defendants filed motions to dismiss the Amended Complaint on November 12, 2004, and those motions are pending.
Additional lawsuits arising out of these circumstances and presenting similar allegations and requests for relief may be filed against the defendants in the future. Neither Dreyfus nor the Funds believe that any of the pending actions will have a material adverse effect on the Funds or Dreyfus’ ability to perform its contract with the Funds.
| REPORT OF INDEPENDENT REGISTERED |
| PUBLIC ACCOUNTING FIRM |
Shareholders and Board of Trustees
Dreyfus Variable Investment Fund, Developing Leaders Portfolio
We have audited the accompanying statement of assets and liabilities, including the statement of investments, of Dreyfus Variable Investment Fund, Developing Leaders Portfolio (one of the funds comprising Dreyfus Variable Investment Fund) as of December 31, 2004, and the related statement of operations for the year then ended, the statement of changes in net assets for each of the two years in the period then ended, and financial highlights for each of the periods indicated therein.These financial statements and financial highlights are the responsibility of the Fund’s management. Our responsibility is to express an opinion on these financial statements and financial highlights based on our audits.
We conducted our audits in accordance with the standards of the Public Company Accounting Oversight Board (United States).Those standards require that we plan and perform the audit to obtain reasonable assurance about whether the financial statements and financial highlights are free of material misstatement. An audit includes examining, on a test basis, evidence supporting the amounts and disclosures in the financial statements and financial highlights. Our procedures included verification by examination of securities held by the custodian as of December 31, 2004 and confirmation of securities not held by the custodian by correspondence with others. An audit also includes assessing the accounting principles used and significant estimates made by management, as well as evaluating the overall financial statement presentation.We believe that our audits provide a reasonable basis for our opinion.
In our opinion, the financial statements and financial highlights referred to above present fairly, in all material respects, the financial position of Dreyfus Variable Investment Fund, Developing Leaders Portfolio at December 31, 2004, the results of its operations for the year then ended, the changes in its net assets for each of the two years in the period then ended, and the financial highlights for each of the indicated periods, in conformity with U.S. generally accepted accounting principles.

| | New York, New York
February 4, 2005
|
The Portfolio 25
IMPORTANT TAX INFORMATION (Unaudited)
For federal tax purposes, the portfolio also hereby designates 100% of the ordinary dividends paid during the fiscal year ended December 31, 2004 as qualifying for the corporate dividends received deduction. Shareholders will receive notification in January 2005 of the percentage applicable to the preparation of their 2004 income tax returns.
BOARD MEMBERS INFORMATION (Unaudited)
Joseph S. DiMartino (61) Chairman of the Board (1995)
Principal Occupation During Past 5 Years:
• Corporate Director and Trustee
Other Board Memberships and Affiliations:
- The Muscular Dystrophy Association, Director
- Levcor International, Inc., an apparel fabric processor, Director
- Century Business Services, Inc., a provider of outsourcing functions for small and medium size companies, Director
- The Newark Group, a provider of a national market of paper recovery facilities, paperboard mills and paperboard converting plants, Director
- Azimuth Trust, an institutional asset management firm, Member of Board of Managers and Advisory Board
No. of Portfolios for which Board Member Serves: 186
| David P. Feldman (65) |
| Board Member (1994) |
Principal Occupation During Past 5 Years:
• Corporate Director and Trustee
Other Board Memberships and Affiliations:
- BBH Mutual Funds Group (11 funds), Director
- The Jeffrey Company, a private investment company, Director
- QMED, a medical device company, Director
| No. of Portfolios for which Board Member Serves: 51 |
| ——————— |
| James F. Henry (74) |
| Board Member (1990) |
Principal Occupation During Past 5 Years:
- President, CPR Institute for Dispute Resolution, a non-profit organization principally engaged in the development of alternatives to business litigation (Retired 2003)
No. of Portfolios for which Board Member Serves: 22
| ——————— |
| Rosalind Gersten Jacobs (79) |
| Board Member (1990) |
Principal Occupation During Past 5 Years:
• Merchandise and marketing consultant
No. of Portfolios for which Board Member Serves: 33
BOARD MEMBERS INFORMATION (Unaudited) (continued)
| Dr. Paul A. Marks (78) |
| Board Member (1990) |
| Principal Occupation During Past 5 Years: |
| • President and Chief Executive Officer of Memorial Sloan-Kettering Cancer Center (Retired 1999) |
| | Other Board Memberships and Affiliations:
|
- Pfizer, Inc., a pharmaceutical company, Director-Emeritus
- Atom Pharm, Director
- Lazard Freres & Company, LLC, Senior Adviser
- Merck, Consultant
| | No. of Portfolios for which Board Member Serves: 22
|
| Dr. Martin Peretz (65) |
| Board Member (1990) |
| | Principal Occupation During Past 5 Years:
|
- Editor-in-Chief of The New Republic Magazine
- Lecturer in Social Studies at Harvard University (1965-2001)
- Co-Chairman of TheStreet.com, a financial daily on the web
| | Other Board Memberships and Affiliations:
|
- Academy for Liberal Education, an accrediting agency for colleges and universities certified by the U.S. Department of Education, Director
- Digital Learning Group, LLC, an online publisher of college textbooks, Director
- Harvard Center for Blood Research,Trustee
- Bard College,Trustee
- YIVO Institute for Jewish Research,Trustee
| | No. of Portfolios for which Board Member Serves: 22
|
| ——————— |
| Bert W. Wasserman (72) |
| Board Member (1993) |
| Principal Occupation During Past 5 Years: |
| • Financial Consultant |
| | Other Board Memberships and Affiliations:
• Lillian Vernon Corporation, Director
|
| | No. of Portfolios for which Board Member Serves: 22
|
———————
Once elected all Board Members serve for an indefinite term.The address of the Board Members and Officers is in c/o The Dreyfus Corporation, 200 Park Avenue, New York, New York 10166.Additional information about the Board Members is available in the fund’s Statement of Additional Information which can be obtained from Dreyfus free of charge by calling this toll free number: 1-800-554-4611.
| John M. Fraser, Jr., Emeritus Board Member |
| Irving Kristol, Emeritus Board Member |
OFFICERS OF THE FUND (Unaudited)
| STEPHEN E. CANTER, President since | | MICHAEL A. ROSENBERG, Secretary since |
| March 2000. | | March 2000. |
| Chairman of the Board, Chief Executive | | Associate General Counsel of the Manager, |
| Officer and Chief Operating Officer of the | | and an officer of 90 investment companies |
| Manager, and an officer of 92 investment | | (comprised of 194 portfolios) managed by the |
| companies (comprised of 185 portfolios) | | Manager. He is 44 years old and has been an |
| managed by the Manager. Mr. Canter also is a | | employee of the Manager since October 1991. |
| |
| Board member and, where applicable, an | | ROBERT R. MULLERY, Assistant Secretary |
| Executive Committee Member of the other | | since March 2000. |
| investment management subsidiaries of Mellon | | |
| Financial Corporation, each of which is an | | Associate General Counsel of the Manager, |
| affiliate of the Manager. He is 59 years old and | | and an officer of 26 investment companies |
| has been an employee of the Manager since | | (comprised of 60 portfolios) managed by the |
| May 1995. | | Manager. He is 52 years old and has been an |
| | | employee of the Manager since May 1986. |
| STEPHEN R. BYERS, Executive Vice | | |
| President since November 2002. | | STEVEN F. NEWMAN, Assistant Secretary |
| | | since March 2000. |
| Chief Investment Officer,Vice Chairman and a | | |
| director of the Manager, and an officer of 92 | | Associate General Counsel and Assistant |
| investment companies (comprised of 185 | | Secretary of the Manager, and an officer of 93 |
| portfolios) managed by the Manager. Mr. Byers | | investment companies (comprised of 201 |
| also is an officer, director or an Executive | | portfolios) managed by the Manager. He is 55 |
| Committee Member of certain other | | years old and has been an employee of the |
| investment management subsidiaries of Mellon | | Manager since July 1980. |
| Financial Corporation, each of which is an | | JAMES WINDELS, Treasurer since |
| affiliate of the Manager. He is 51 years old and | | November 2001. |
| has been an employee of the Manager since | | |
| January 2000. Prior to joining the Manager, he | | Director – Mutual Fund Accounting of the |
| served as an Executive Vice President-Capital | | Manager, and an officer of 93 investment |
| Markets, Chief Financial Officer and Treasurer | | companies (comprised of 201 portfolios) |
| at Gruntal & Co., L.L.C. | | managed by the Manager. He is 46 years old |
| | | and has been an employee of the Manager |
| MARK N. JACOBS, Vice President since | | since April 1985. |
| March 2000. | | |
| | | RICHARD CASSARO, Assistant Treasurer |
| Executive Vice President, Secretary and | | since August 2003. |
| General Counsel of the Manager, and an | | |
| officer of 93 investment companies (comprised | | Senior Accounting Manager – Equity Funds of |
| of 201 portfolios) managed by the Manager. | | the Manager, and an officer of 26 investment |
| He is 58 years old and has been an employee | | companies (comprised of 102 portfolios) |
| of the Manager since June 1977. | | managed by the Manager. He is 44 years old |
| | | and has been an employee of the Manager |
| | | since September 1982. |
OFFICERS OF THE FUND (Unaudited) (continued)
| ERIK D. NAVILOFF, Assistant Treasurer | | JOSEPH W. CONNOLLY, Chief Compliance |
| since December 2002. | | Officer since October 2004. |
| Senior Accounting Manager – Taxable Fixed | | Chief Compliance Officer of the Manager and |
| Income Funds of the Manager, and an officer | | The Dreyfus Family of Funds (93 investment |
| of 19 investment companies (comprised of 75 | | companies, comprising 201 portfolios). From |
| portfolios) managed by the Manager. He is 36 | | November 2001 through March 2004, Mr. |
| years old and has been an employee of the | | Connolly was first Vice-President, Mutual |
| Manager since November 1992. | | Fund Servicing for Mellon Global Securities |
| |
| ROBERT ROBOL, Assistant Treasurer | | Services. In that capacity, Mr. Connolly was |
| since August 2003. | | responsible for managing Mellon’s Custody, |
| | | Fund Accounting and Fund Administration |
| Senior Accounting Manager – Money Market | | services to third-party mutual fund clients. He |
| Funds of the Manager, and an officer of 39 | | is 47 years old and has served in various |
| investment companies (comprised of 84 | | capacities with the Manager since 1980, |
| portfolios) managed by the Manager. He is 40 | | including manager of the firm’s Fund |
| years old and has been an employee of the | | Accounting Department from 1997 through |
| Manager since October 1988. | | October 2001. |
| |
| ROBERT SVAGNA, Assistant Treasurer | | WILLIAM GERMENIS, Anti-Money |
| since December 2002. | | Laundering Compliance Officer since |
| Senior Accounting Manager – Equity Funds of | | September 2002. |
| the Manager, and an officer of 27 investment | | Vice President and Anti-Money Laundering |
| companies (comprised of 107 portfolios) | | Compliance Officer of the Distributor, and the |
| managed by the Manager. He is 37 years old | | Anti-Money Laundering Compliance Officer |
| and has been an employee of the Manager | | of 88 investment companies (comprised of 196 |
| since November 1990. | | portfolios) managed by the Manager. He is 34 |
| KENNETH J. SANDGREN, Assistant | | years old and has been an employee of the |
| Treasurer since November 2001. | | Distributor since October 1998. |
| Mutual Funds Tax Director of the Manager, | | |
| and an officer of 93 investment companies | | |
| (comprised of 201 portfolios) managed by the | | |
| Manager. He is 50 years old and has been an | | |
| employee of the Manager since June 1993. | | |
30
NOTES
For More Information
| Dreyfus Variable |
| Investment Fund, |
| Developing Leaders Portfolio |
| 200 Park Avenue |
| New York, NY 10166 |
| |
| Investment Adviser |
| The Dreyfus Corporation |
| 200 Park Avenue |
| New York, NY 10166 |
| |
| Custodian |
| Mellon Bank, N.A. |
| One Mellon Bank Center |
| Pittsburgh, PA 15258 |
| Transfer Agent & |
| Dividend Disbursing Agent |
| Dreyfus Transfer, Inc. |
| 200 Park Avenue |
| New York, NY 10166 |
| |
| Distributor |
| Dreyfus Service Corporation |
| 200 Park Avenue |
| New York, NY 10166 |
Telephone 1-800-554-4611 or 516-338-3300
Mail The Dreyfus Family of Funds, 144 Glenn Curtiss Boulevard, Uniondale, NY 11556-0144 Attn: Institutional Servicing
The portfolio files its complete schedule of portfolio holdings with the Securities and
Exchange Commission (“SEC”) for the first and third quarters of each fiscal year on Form N-Q. The portfolio’s Forms N-Q are available on the SEC’s website at http://www.sec.gov and may be reviewed and copied at the SEC’s Public Reference Room in Washington, DC. Information on the operation of the Public Reference Room may be obtained by calling 1-800-SEC-0330.
A description of the policies and procedures that the portfolio uses to determine how to vote proxies relating to portfolio securities, and information regarding how the portfolio voted these proxies for the 12-month period ended June 30, 2004, is available through the portfolio’s website at http://www.dreyfus.com and on the SEC’s website at http://www.sec.gov. The description of the policies and procedures is also available without charge, upon request, by calling 1-800-645-6561.
© 2005 Dreyfus Service Corporation

| Dreyfus Variable |
| Investment Fund, |
| Disciplined Stock |
| Portfolio |
ANNUAL REPORT December 31, 2004

The views expressed in this report reflect those of the portfolio manager only through the end of the period covered and do not necessarily represent the views of Dreyfus or any other person in the Dreyfus organization.Any such views are subject to change at any time based upon market or other conditions and Dreyfus disclaims any responsibility to update such views. These views may not be relied on as investment advice and, because investment decisions for a Dreyfus portfolio are based on numerous factors, may not be relied on as an indication of trading intent on behalf of any Dreyfus portfolio.
Not FDIC-Insured • Not Bank-Guaranteed • May Lose Value
| | | Contents |
| |
| | | T H E P O R T F O L I O |
| |
|
| 2 | | Letter from the Chairman |
| 3 | | Discussion of Performance |
| 6 | | Portfolio Performance |
| 8 | | Understanding Your Portfolio's Expenses |
| 8 | | Comparing Your Portfolio's Expenses |
| | | With Those of Other Funds |
| 9 | | Statement of Investments |
| 13 | | Statement of Assets and Liabilities |
| 14 | | Statement of Operations |
| 15 | | Statement of Changes in Net Assets |
| 17 | | Financial Highlights |
| 19 | | Notes to Financial Statements |
| 26 | | Report of Independent Registered |
| | | Public Accounting Firm |
| 27 | | Important Tax Information |
| 28 | | Board Members Information |
| 30 | | Officers of the Fund |
| | | F O R M O R E I N F O R M AT I O N |
| |
|
| | | Back Cover |
| Dreyfus Variable Investment Fund, |
| Disciplined Stock Portfolio |
The Portfolio

LETTER FROM THE CHAIRMAN
Dear Shareholder:
We are pleased to present this annual report for Dreyfus Variable Investment Fund, Disciplined Stock Portfolio, covering the 12-month period from January 1, 2004, through December 31, 2004. Inside, you'll find valuable information about how the portfolio was managed during the reporting period, including a discussion with the portfolio manager, Sean P. Fitzgibbon.
2004 represented the second consecutive year of positive stock market performance. Unlike the 2003 rally, however, in which most stocks rose as general business conditions improved, 2004's market performance largely reflected the strengths and weaknesses of individual companies and industries. As a result, fundamental research and professional judgment became more important determinants of mutual fund performance in 2004.
What's ahead for stocks in 2005? No one knows for certain.Positive influences remain in place, including moderately expanding U.S. and global economies and low inflation. Nonetheless, a number of risks — such as rising short-term interest rates, currency fluctuations and generally slowing corporate earnings — could threaten the market environment.
As always, we urge our shareholders to view the stock market from a long-term perspective, measured in years rather than weeks or months. One of the best ways to ensure a long-term perspective is to establish an investment plan with the help of your financial advisor, and review it periodically to track your progress toward your financial goals.
Thank you for your continued confidence and support.

Stephen E. Canter
Chairman and Chief Executive Officer
The Dreyfus Corporation
January 18, 2005
|
2

DISCUSSION OF PERFORMANCE
Sean P. Fitzgibbon, Portfolio Manager
How did Dreyfus Variable Investment Fund, Disciplined Stock Portfolio perform relative to its benchmark?
For the 12-month period ended December 31, 2004, the portfolio achieved total returns of 7.87% for its Initial shares and 7.64% for its Service shares.1 For the same period, the total return of the Standard & Poor's 500 Composite Stock Price Index ("S&P 500 Index"), the portfolio's benchmark, was 11.04% ..2
We attribute these results to steady U.S. and global economic growth. Rising levels of industrial activity boosted most market sectors — particularly energy, industrial machinery and raw materials — despite difficult business conditions among certain other industry groups and ongoing geopolitical instability. The portfolio generally shared in the market's advance. However, weak industry fundamentals hurt several holdings in the technology sector, while certain other holdings provided disappointing returns due to a variety of issues. As a result, the portfolio's returns underperformed the benchmark's return during the reporting period.
What is the portfolio's investment approach?
The portfolio seeks investment returns (consisting of capital appreciation and income) that are greater than the total return performance of stocks represented by the S&P 500 Index. The portfolio normally invests at least 80% of its assets in stocks, and focuses on stocks of large-cap companies.The portfolio invests in growth and value stocks, which are chosen through a disciplined investment process that combines computer modeling techniques, fundamental analysis and risk management.We identify potential investments through a quantitative analytic process that sifts through a universe of approximately 2,000 stocks in search of those that are not only undervalued according to our criteria but also exhibit what we believe to be higher-than-expected earnings potential and financial health. A team of experienced analysts examines the fundamentals of what we believe are the top candidates. The portfolio manager then decides which stocks to purchase and whether any current holdings should be sold.
The Portfolio 3
DISCUSSION OF PERFORMANCE (continued)
In addition to identifying what we believe are attractive investment opportunities, we also attempt to manage risks by diversifying across companies and industries.The portfolio is structured so that its sector weightings and risk characteristics are generally similar to those of the S&P 500 Index.
What other factors influenced the portfolio's performance?
Rising oil and gas prices drove energy stocks sharply higher during the reporting period.The portfolio's performance benefited from its relatively heavy exposure to energy companies and several good stock selections.Top performers included exploration and production companies Occidental Petroleum, Devon Energy and Apache; refinery operator Valero Energy; and integrated oil producer ConocoPhillips.
Performance compared to the benchmark also was boosted by favorable stock selections in several other sectors. In the health care area, the portfolio de-emphasized troubled large-cap pharmaceutical companies, focusing instead on service providers, such as Aetna and UnitedHealth Group, which fared relatively well. Among utilities, the portfolio successfully avoided most telecommunications companies, focusing instead on high dividend-yielding electric utilities, such as Exelon, PPL and Entergy, which the market favored. Particularly good performers in other areas included household product producers Procter & Gamble and Kimberly-Clark, which adapted well to a competitive global business environment; industrial conglomerates Tyco International and Pentair, which benefited from rising customer demand; and regional bank SouthTrust, which received an attractive buy-out offer.
On the negative side, much of the portfolio's weakness compared to the benchmark arose from disappointments in the technology sector. Lackluster demand undermined semiconductor-related holdings, such as Linear Technology and Agilent Technologies, while accounting difficulties hurt communications equipment company Nortel Networks and software developer Veritas.
The portfolio's returns also suffered among industry groups and individual stocks in other sectors. General Motors and Dana lost ground due to declining market share among domestic automotive producers. Holdings in employment-dependent companies, such as Paychex and
4
Manpower, were undermined by a weak job creation environment. The portfolio's lack of aerospace and defense holdings detracted from relative returns in the producer goods sector. Lack of clear market direction during most of the reporting period led to unfortunate timing in the purchase and sale of holdings such as mining companies Phelps Dodge and Alcan, media company The News Corporation and financial institution Bank of America. Finally, a few other holdings, including Comcast, St. Paul Travelers Cos., Union Pacific, Coca-Cola and IVAX were hurt by company-specific difficulties.
What is the portfolio's current strategy?
Sean Fitzgibbon stepped in as the primary portfolio manager on October 20, 2004, and has maintained the portfolio's largely sector-neutral investment strategy and profile. In light of favorable industry fundamentals, the portfolio currently maintains a slightly greater emphasis than the benchmark on energy stocks.Within other sectors, we are targeting specific businesses and industries that we believe are well-positioned in the current economic environment, such as diversified industrials, non-interest-rate sensitive financials, leisure activity service providers and health care services companies.
January 18, 2005
| | | The portfolio is only available as a funding vehicle under variable life insurance policies or variable |
| | | annuity contracts issued by insurance companies. Individuals may not purchase shares of the |
| | | portfolio directly.A variable annuity is an insurance contract issued by an insurance company that |
| | | enables investors to accumulate assets on a tax-deferred basis for retirement or other long-term |
| | | goals.The investment objective and policies of Dreyfus Variable Investment Fund, Disciplined |
| | | Stock Portfolio made available through insurance products may be similar to other funds/portfolios |
| | | managed or advised by Dreyfus. However, the investment results of the portfolio may be higher or |
| | | lower than, and may not be comparable to, those of any other Dreyfus fund/portfolio. |
| 1 | | Total return includes reinvestment of dividends and any capital gains paid. Past performance is no |
| | | guarantee of future results. Share price and investment return fluctuate such that upon redemption, |
| | | portfolio shares may be worth more or less than their original cost.The portfolio's performance does |
| | | not reflect the deduction of additional charges and expenses imposed in connection with investing |
| | | in variable insurance contracts, which will reduce returns. Return figures provided reflect the |
| | | absorption of portfolio expenses by The Dreyfus Corporation pursuant to an agreement in effect |
| | | through December 31, 2005, at which time it may be extended, terminated or modified. Had |
| | | these expenses not been absorbed, the portfolio's returns would have been lower. |
| 2 | | SOURCE: LIPPER INC. — Reflects reinvestment of dividends and, where applicable, capital |
| | | gain distributions.The Standard & Poor's 500 Composite Stock Price Index is a widely accepted, |
| | | unmanaged index of U.S. stock market performance. |
The Portfolio 5
PORTFOLIO PERFORMANCE

Comparison of change in value of $10,000 investment in Dreyfus Variable Investment Fund, Disciplined Stock Portfolio Initial shares and Service shares and the Standard & Poor's 500 Composite Stock Price Index
| Average Annual Total Returns | | as of 12/31/04 | | | | |
| | | Inception | | | | | | From |
| | | Date | | 1 Year | | 5 Years | | Inception |
| |
| |
| |
| |
|
| Initial shares | | 5/1/96 | | 7.87% | | (4.07)% | | 7.73% |
| Service shares | | 5/1/96 | | 7.64% | | (4.21)% | | 7.63% |
The data for Service shares includes the results of Initial shares for the period prior to December 31, 2000 (inception date of Service shares). Actual Service shares' average annual total return and hypothetical growth results would have been lower. See notes below.
† Source: Lipper Inc.
Past performance is not predictive of future performance.The portfolio's performance shown in the graph and table does not reflect the deduction of taxes that a shareholder would pay on portfolio distributions or the redemption of portfolio shares.
The portfolio's performance does not reflect the deduction of additional charges and expenses imposed in connection with investing in variable insurance contracts which will reduce returns.
The above graph compares a $10,000 investment made in Initial and Service shares of Dreyfus Variable Investment Fund, Disciplined Stock Portfolio on 5/1/96 (inception date of Initial shares) to a $10,000 investment made in the Standard & Poor's 500 Composite Stock Price Index (the "Index") on that date.
6
The portfolio's Initial shares are not subject to a Rule 12b-1 fee.The portfolio's Service shares are subject to a 0.25% annual Rule 12b-1 fee.The performance figures for Service shares reflect the performance of the portfolio's Initial shares from their inception date through December 30, 2000, and the performance of the portfolio's Service shares from December 31, 2000 (inception date of Service shares) to December 31, 2004 (blended performance figures).The performance figures for each share class reflect certain expense reimbursements, without which the performance of each share class would have been lower. In addition, the blended performance figures have not been adjusted to reflect the higher operating expenses of the Service shares. If these expenses had been reflected, the blended performance figures would have been lower. All dividends and capital gain distributions are reinvested.
The portfolio's performance shown in the line graph takes into account all applicable portfolio fees and expenses (after any expense reimbursements).The Index is a widely accepted, unmanaged index of U.S. stock market performance, which does not take into account charges, fees and other expenses. Further information relating to portfolio performance, including expense reimbursements, if applicable, is contained in the Financial Highlights section of the prospectus and elsewhere in this report.
The Portfolio 7
UNDERSTANDING YOUR PORTFOLIO'S EXPENSES (Unaudited)
|
As a mutual fund investor,you pay ongoing expenses,such as management fees and other expenses.Using the information below,you can estimate how these expenses affect your investment and compare them with the expenses of other funds.You also may pay one-time transaction expenses,including sales charges (loads) and redemption fees, which are not shown in this section and would have resulted in higher total expenses. For more information, see your portfolio's prospectus or talk to your financial adviser.
Review your portfolio's expenses
The table below shows the expenses you would have paid on a $1,000 investment in Dreyfus Variable Investment Fund, Disciplined Stock Portfolio from July 1, 2004 to December 31, 2004. It also shows how much a $1,000 investment would be worth at the close of the period, assuming actual returns and expenses.
| Expenses and Value of a $1,000 Investment | | |
| assuming actual returns for the six months ended December 31, 2004 |
| | | Initial Shares | | Service Shares |
| |
| |
|
| Expenses paid per $1,000 † | | $ 4.57 | | $ 5.19 |
| Ending value (after expenses) | | $1,065.00 | | $1,063.90 |
COMPARING YOUR PORTFOLIO'S EXPENSES
WITH THOSE OF OTHER FUNDS (Unaudited)
|
Using the SEC's method to compare expenses
The Securities and Exchange Commission (SEC) has established guidelines to help investors assess fund expenses. Per these guidelines, the table below shows your portfolio's expenses based on a $1,000 investment, assuming a hypothetical 5% annualized return. You can use this information to compare the ongoing expenses (but not transaction expenses or total cost) of investing in the portfolio with those of other funds. All mutual fund shareholder reports will provide this information to help you make this comparison. Please note that you cannot use this information to estimate your actual ending account balance and expenses paid during the period.
Expenses and Value of a $1,000 Investment assuming a hypothetical 5% annualized return for the six months ended December 31, 2004
| | | Initial Shares | | Service Shares |
| |
| |
|
| Expenses paid per $1,000 † | | $ 4.47 | | $ 5.08 |
| Ending value (after expenses) | | $1,020.71 | | $1,020.11 |
† Expenses are equal to the portfolio's annualized expense ratio of .88% for Initial shares and 1.00% for Service shares, multiplied by the average account value over the period, multiplied by 184/366 (to reflect the one-half year period).
STATEMENT OF INVESTMENTS
December 31, 2004
|
| Common Stocks—99.2% | | Shares | | Value ($) |
| |
| |
|
| Consumer Cyclical—11.0% | | | | |
| Carnival | | 23,640 | | 1,362,373 |
| Coach | | 18,440 a | | 1,040,016 |
| Comcast, Cl. A | | 28,710 a | | 955,469 |
| Marriott International, Cl. A | | 20,180 | | 1,270,936 |
| McDonald's | | 35,750 | | 1,146,145 |
| PETCO Animal Supplies | | 14,900 a | | 588,252 |
| Staples | | 33,770 | | 1,138,387 |
| Target | | 23,030 | | 1,195,948 |
| Time Warner | | 64,960 a | | 1,262,822 |
| Viacom, Cl. B | | 27,060 | | 984,713 |
| Walt Disney | | 55,470 | | 1,542,066 |
| | | | | 12,487,127 |
| Consumer Staples—11.4% | | | | |
| Archer-Daniels-Midland | | 52,160 | | 1,163,690 |
| Brown-Forman, Cl. B | | 12,090 | | 588,541 |
| Costco Wholesale | | 24,830 | | 1,202,020 |
| Estee Lauder Cos., Cl. A | | 17,130 | | 784,040 |
| Gillette | | 24,940 | | 1,116,813 |
| Kellogg | | 22,490 | | 1,004,403 |
| Kimberly-Clark | | 15,010 | | 987,808 |
| Procter & Gamble | | 36,800 | | 2,026,944 |
| Reynolds American | | 14,080 | | 1,106,688 |
| Wal-Mart Stores | | 34,550 | | 1,824,931 |
| Walgreen | | 27,240 | | 1,045,199 |
| | | | | 12,851,077 |
| Energy Related—7.8% | | | | |
| Anadarko Petroleum | | 9,220 | | 597,548 |
| ChevronTexaco | | 20,030 | | 1,051,775 |
| ConocoPhillips | | 19,350 | | 1,680,161 |
| Devon Energy | | 21,780 | | 847,678 |
| Exxon Mobil | | 66,330 | | 3,400,076 |
| Newfield Exploration | | 8,610 a | | 508,420 |
| Weatherford International | | 15,510 a | | 795,663 |
| | | | | 8,881,321 |
| Health Care—12.5% | | | | |
| Aetna | | 5,970 | | 744,758 |
| Boston Scientific | | 21,300 a | | 757,215 |
The Portfolio 9
S T A T E M E N T O F I N V E S T M E N T S (continued)
| Common Stocks (continued) | | Shares | | Value ($) |
| |
| |
|
| Health Care (continued) | | | | |
| Charles River Laboratories International | | 11,890 a | | 547,059 |
| Fisher Scientific International | | 14,860 a | | 926,967 |
| Genzyme | | 7,080 a | | 411,136 |
| GlaxoSmithKline, ADR | | 12,160 | | 576,262 |
| Hospira | | 24,350 a | | 815,725 |
| Johnson & Johnson | | 29,620 | | 1,878,500 |
| Laboratory Corp. of America Holdings | | 13,900 a | | 692,498 |
| Pfizer | | 48,644 | | 1,308,037 |
| Sanofi-Aventis, ADR | | 14,350 | | 574,717 |
| Triad Hospitals | | 7,300 a | | 271,633 |
| Waters | | 14,240 a | | 666,290 |
| WellPoint | | 11,810 a | | 1,358,150 |
| Wyeth | | 37,920 | | 1,615,013 |
| Zimmer Holdings | | 11,730 a | | 939,808 |
| | | | | 14,083,768 |
| Interest Sensitive—20.3% | | | | |
| Ambac Financial Group | | 7,000 | | 574,910 |
| American Express | | 18,680 | | 1,052,992 |
| American International Group | | 33,791 | | 2,219,055 |
| Bank of America | | 67,160 | | 3,155,848 |
| Boston Properties | | 8,240 | | 532,881 |
| CIT Group | | 6,150 | | 281,793 |
| Capital One Financial | | 17,940 | | 1,510,727 |
| Chubb | | 18,570 | | 1,428,033 |
| Citigroup | | 79,440 | | 3,827,419 |
| Franklin Resources | | 23,960 | | 1,668,814 |
| Goldman Sachs Group | | 22,450 | | 2,335,698 |
| Lehman Brothers Holdings | | 11,200 | | 979,776 |
| Merrill Lynch | | 9,340 | | 558,252 |
| Morgan Stanley | | 5,100 | | 283,152 |
| Radian Group | | 17,220 | | 916,793 |
| Wachovia | | 32,130 | | 1,690,038 |
| | | | | 23,016,181 |
| Producer Goods—15.6% | | | | |
| Air Products & Chemicals | | 12,790 | | 741,436 |
| Alcoa | | 36,360 | | 1,142,431 |
| Burlington Northern Santa Fe | | 13,060 | | 617,869 |
10
| Common Stocks (continued) | | Shares | | Value ($) |
| |
| |
|
| Producer Goods (continued) | | | | |
| Deere & Co. | | 10,820 | | 805,008 |
| Dow Chemical | | 12,410 | | 614,419 |
| E. I. du Pont de Nemours | | 9,670 | | 474,314 |
| Eaton | | 12,900 | | 933,444 |
| FedEx | | 6,430 | | 633,291 |
| General Dynamics | | 7,760 | | 811,696 |
| General Electric | | 89,250 | | 3,257,625 |
| Ingersoll-Rand, Cl. A | | 10,820 | | 868,846 |
| Manpower | | 18,440 | | 890,652 |
| Norfolk Southern | | 17,180 | | 621,744 |
| PACCAR | | 11,580 | | 931,958 |
| PPG Industries | | 5,000 | | 340,800 |
| 3M | | 9,800 | | 804,286 |
| Textron | | 8,910 | | 657,558 |
| Tyco International | | 35,320 | | 1,262,337 |
| United Technologies | | 11,640 | | 1,202,994 |
| | | | | 17,612,708 |
| Technology—15.5% | | | | |
| Alliance Data Systems | | 12,100 a | | 574,508 |
| Altera | | 31,020 a | | 642,114 |
| Autodesk | | 22,720 b | | 862,224 |
| Cisco Systems | | 143,880 a | | 2,776,884 |
| Cognizant Technology Solutions | | 15,800 | | 668,814 |
| EMC | | 70,300 a | | 1,045,361 |
| Intel | | 77,600 | | 1,815,064 |
| International Business Machines | | 27,910 | | 2,751,368 |
| Lucent Technologies (warrants) | | 288 a | | 454 |
| Microsoft | | 122,780 | | 3,279,454 |
| Motorola | | 58,560 | | 1,007,232 |
| QUALCOMM | | 11,520 | | 488,448 |
| Texas Instruments | | 35,350 | | 870,317 |
| VeriSign | | 23,000 a | | 770,960 |
| | | | | 17,553,202 |
| Utilities—5.1% | | | | |
| Constellation Energy Group | | 14,270 | | 623,742 |
| Exelon | | 23,290 | | 1,026,390 |
| PG&E | | 37,880 a | | 1,260,646 |
The Portfolio 11
S T A T E M E N T O F I N V E S T M E N T S (continued)
| Common Stocks (continued) | | Shares | | Value ($) |
| |
| |
|
| Utilities (continued) | | | | |
| SBC Communications | | 21,470 | | 553,282 |
| Sempra Energy | | 16,000 | | 586,880 |
| Verizon Communications | | 43,340 | | 1,755,703 |
| | | | | 5,806,643 |
| Total Common Stocks | | | | |
| (cost $92,169,942) | | | | 112,292,027 |
| |
| |
|
| | | Principal | | |
| Short-Term Investments—.7% | | Amount ($) | | Value ($) |
| |
| |
|
| U.S. Treasury Bills; | | | | |
| 1.84%, 2/24/2005 | | | | |
| (cost $749,924) | | 752,000 | | 749,857 |
| |
| |
|
| Investment of Cash Collateral | | | | |
| for Securities Loaned—.8% | | Shares | | Value ($) |
| |
| |
|
| Registered Investment Company; | | | | |
| Dreyfus Institutional Cash Advantage Plus Fund | | | | |
| (cost $886,080) | | 886,080 c | | 886,080 |
| |
| |
|
| Total Investments (cost $93,805,946) | | 100.7% | | 113,927,964 |
| Liabilities, Less Cash and Receivables | | (.7%) | | (763,635) |
| Net Assets | | 100.0% | | 113,164,329 |
| ADR—American Depository Receipts. |
| a Non-income producing. |
| b This security is on loan.At December 31, 2004, the total market value of the portfolio's security on loan is |
| $862,224 and the total market value of the collateral held by the portfolio is $886,080. |
| c Investment in affiliated money market mutual fund. |
| Portfolio Summary† | | | | | | |
| |
| | | Value (%) | | | | Value (%) |
| |
| |
| |
|
| Interest Sensitive | | 20.3 | | Energy Related | | 7.8 |
| Producer Goods | | 15.6 | | Utilities | | 5.1 |
| Technology | | 15.5 | | Short-Term/ | | |
| Health Care | | 12.5 | | Money Market Investments | | 1.5 |
| Consumer Staples | | 11.4 | | | | |
| Consumer Cyclical | | 11.0 | | | | 100.7 |
| | † Based on net assets.
See notes to financial statements.
|
12
STATEMENT OF ASSETS AND LIABILITIES
December 31, 2004
| | | Cost | | Value |
| |
| |
|
| Assets ($): | | | | |
| Investments in securities—See Statement of | | | | |
| Investments (including securities on loan, | | | | |
| valued at $862,224)—Note 1(b): | | | | |
| Unaffiliated issuers | | 92,919,866 | | 113,041,884 |
| Affiliated issuers | | 886,080 | | 886,080 |
| Cash | | | | 72,476 |
| Receivable for investment securities sold | | | | 1,491,706 |
| Dividends and interest receivable | | | | 118,739 |
| Receivable for shares of Beneficial Interest subscribed | | 46,216 |
| Prepaid expenses | | | | 730 |
| | | | | 115,657,831 |
| |
| |
|
| Liabilities ($): | | | | |
| Due to The Dreyfus Corporation and affiliates—Note 3(b) | | 77,762 |
| Payable for investment securities purchased | | | | 1,471,368 |
| Liability for securities on loan—Note 1(b) | | | | 886,080 |
| Payable for shares of Beneficial Interest redeemed | | 10,661 |
| Accrued expenses | | | | 47,631 |
| | | | | 2,493,502 |
| |
| |
|
| Net Assets ($) | | | | 113,164,329 |
| |
| |
|
| Composition of Net Assets ($): | | | | |
| Paid-in capital | | | | 121,315,848 |
| Accumulated undistributed investment income—net | | 1,955 |
| Accumulated net realized gain (loss) on investments | | (28,275,492) |
| Accumulated net unrealized appreciation | | | | |
| (depreciation) on investments | | | | 20,122,018 |
| |
| |
|
| Net Assets ($) | | | | 113,164,329 |
| Net Asset Value Per Share | | | | |
| | | Initial Shares | | Service Shares |
| |
| |
|
| Net Assets ($) | | 103,416,552 | | 9,747,777 |
| Shares Outstanding | | 4,941,711 | | 466,474 |
| |
| |
|
| Net Asset Value Per Share ($) | | 20.93 | | 20.90 |
See notes to financial statements.
The Portfolio 13
STATEMENT OF OPERATIONS
Year Ended December 31, 2004
|
| Investment Income ($): | | |
| Income: | | |
| Cash dividends (net of $3,300 foreign taxes withheld at source) | | 2,172,361 |
| Interest | | 8,685 |
| Income from securities lending | | 2,248 |
| Total Income | | 2,183,294 |
| Expenses: | | |
| Investment advisory fee—Note 3(a) | | 864,501 |
| Prospectus and shareholders' reports | | 34,481 |
| Professional fees | | 32,881 |
| Custodian fees—Note 3(b) | | 24,643 |
| Distribution fees—Note 3(b) | | 24,632 |
| Trustees' fees and expenses—Note 3(c) | | 11,294 |
| Shareholder servicing costs—Note 3(b) | | 6,491 |
| Loan commitment fees—Note 2 | | 1,113 |
| Interest expense—Note 2 | | 97 |
| Registration fees | | 87 |
| Miscellaneous | | 3,765 |
| Total Expenses | | 1,003,985 |
| Less—waiver of fees due to undertaking—Note 3(a) | | (9,657) |
| Net Expenses | | 994,328 |
| Investment Income—Net | | 1,188,966 |
| |
|
| Realized and Unrealized Gain (Loss) on Investments—Note 4 ($): |
| Net realized gain (loss) on investments | | 15,349,371 |
| Net unrealized appreciation (depreciation) on investments | | (8,166,167) |
| Net Realized and Unrealized Gain (Loss) on Investments | | 7,183,204 |
| Net Increase in Net Assets Resulting from Operations | | 8,372,170 |
See notes to financial statements.
STATEMENT OF CHANGES IN NET ASSETS
| | | Year Ended December 31, |
| |
|
| | | 2004 | | 2003 |
| |
| |
|
| Operations ($): | | | | |
| Investment income—net | | 1,188,966 | | 896,074 |
| Net realized gain (loss) on investments | | 15,349,371 | | (1,692,191) |
| Net unrealized appreciation | | | | |
| (depreciation) on investments | | (8,166,167) | | 24,729,425 |
| Net Increase (Decrease) in Net Assets | | | | |
| Resulting from Operations | | 8,372,170 | | 23,933,308 |
| |
| |
|
| Dividends to Shareholders from ($): | | | | |
| Investment income—net: | | | | |
| Initial shares | | (1,359,657) | | (850,803) |
| Service shares | | (110,438) | | (63,630) |
| Total Dividends | | (1,470,095) | | (914,433) |
| |
| |
|
| Beneficial Interest Transactions ($): | | | | |
| Net proceeds from shares sold: | | | | |
| Initial shares | | 2,270,271 | | 3,475,615 |
| Service shares | | 433,322 | | 927,471 |
| Dividends reinvested: | | | | |
| Initial shares | | 1,359,657 | | 850,803 |
| Service shares | | 110,438 | | 63,630 |
| Cost of shares redeemed: | | | | |
| Initial shares | | (17,871,990) | | (20,442,820) |
| Service shares | | (1,690,439) | | (1,796,640) |
| Increase (Decrease) in Net Assets from | | | | |
| Beneficial Interest Transactions | | (15,388,741) | | (16,921,941) |
| Total Increase (Decrease) in Net Assets | | (8,486,666) | | 6,096,934 |
| |
| |
|
| Net Assets ($): | | | | |
| Beginning of Period | | 121,650,995 | | 115,554,061 |
| End of Period | | 113,164,329 | | 121,650,995 |
| Undistributed investment income—net | | 1,955 | | 12,201 |
The Portfolio 15
STATEMENT OF CHANGES IN NET ASSETS (continued)
| | | Year Ended December 31, |
| |
|
| | | 2004 | | 2003 |
| |
| |
|
| Capital Share Transactions: | | | | |
| Initial Shares | | | | |
| Shares sold | | 114,692 | | 195,477 |
| Shares issued for dividends reinvested | | 65,032 | | 44,246 |
| Shares redeemed | | (900,487) | | (1,209,659) |
| Net Increase (Decrease) in Shares Outstanding | | (720,763) | | (969,936) |
| |
| |
|
| Service Shares | | | | |
| Shares sold | | 21,907 | | 55,956 |
| Shares issued for dividends reinvested | | 5,286 | | 3,320 |
| Shares redeemed | | (85,389) | | (105,845) |
| Net Increase (Decrease) in Shares Outstanding | | (58,196) | | (46,569) |
See notes to financial statements.
FINANCIAL HIGHLIGHTS
The following tables describe the performance for each share class for the fiscal periods indicated.All information (except portfolio turnover rate) reflects financial results for a single portfolio share.Total return shows how much your investment in the portfolio would have increased (or decreased) during each period, assuming you had reinvested all dividends and distributions.These figures have been derived from the portfolio's financial statements.
| | | | | Year Ended December 31, | | |
| |
| |
| |
|
| Initial Shares | | 2004 | | 2003 | | 2002 | | 2001 | | 2000 |
| |
| |
| |
| |
| |
|
| Per Share Data ($): | | | | | | | | | | |
| Net asset value, beginning of period | | 19.66 | | 16.04 | | 20.89 | | 24.19 | | 26.92 |
| Investment Operations: | | | | | | | | | | |
| Investment income—net a | | .21 | | .14 | | .12 | | .09 | | .06 |
| Net realized and unrealized | | | | | | | | | | |
| gain (loss) on investments | | 1.34 | | 3.63 | | (4.84) | | (3.30) | | (2.53) |
| Total from Investment Operations | | 1.55 | | 3.77 | | (4.72) | | (3.21) | | (2.47) |
| Distributions: | | | | | | | | | | |
| Dividends from investment income—net | | (.28) | | (.15) | | (.13) | | (.09) | | (.05) |
| Dividends from net realized | | | | | | | | | | |
| gain on investments | | — | | — | | — | | — | | (.21) |
| Total Distributions | | (.28) | | (.15) | | (.13) | | (.09) | | (.26) |
| Net asset value, end of period | | 20.93 | | 19.66 | | 16.04 | | 20.89 | | 24.19 |
| |
| |
| |
| |
| |
|
| Total Return (%) | | 7.87 | | 23.53 | | (22.61) | | (13.27) | | (9.14) |
| |
| |
| |
| |
| |
|
| Ratios/Supplemental Data (%): | | | | | | | | | | |
| Ratio of total expenses | | | | | | | | | | |
| to average net assets | | .85 | | .85 | | .83 | | .81 | | .81 |
| Ratio of net investment income | | | | | | | | | | |
| to average net assets | | 1.04 | | .81 | | .64 | | .40 | | .21 |
| Portfolio Turnover Rate | | 83.64 | | 52.74 | | 47.47 | | 48.22 | | 51.44 |
| |
| |
| |
| |
| |
|
| Net Assets, end of period ($ x 1,000) | | 103,417 | | 111,352 | | 106,404 | | 172,360 | | 222,920 |
a Based on average shares outstanding at each month end.
See notes to financial statements.
|
The Portfolio 17
FINANCIAL HIGHLIGHTS (continued)
| | | | | Year Ended December 31, | | |
| |
| |
| |
|
| Service Shares | | 2004 | | 2003 | | 2002 | | 2001 | | 2000 a |
| |
| |
| |
| |
| |
|
| Per Share Data ($): | | | | | | | | | | |
| Net asset value, beginning of period | | 19.63 | | 16.02 | | 20.86 | | 24.19 | | 24.19 |
| Investment Operations: | | | | | | | | | | |
| Investment income—net | | .18b | | .11b | | .09b | | .05b | | — |
| Net realized and unrealized | | | | | | | | | | |
| gain (loss) on investments | | 1.33 | | 3.62 | | (4.83) | | (3.30) | | — |
| Total from Investment Operations | | 1.51 | | 3.73 | | (4.74) | | (3.25) | | — |
| Distributions: | | | | | | | | | | |
| Dividends from investment income—net | | (.24) | | (.12) | | (.10) | | (.08) | | — |
| Net asset value, end of period | | 20.90 | | 19.63 | | 16.02 | | 20.86 | | 24.19 |
| |
| |
| |
| |
| |
|
| Total Return (%) | | 7.64 | | 23.31 | | (22.72) | | (13.46) | | — |
| |
| |
| |
| |
| |
|
| Ratios/Supplemental Data (%): | | | | | | | | | | |
| Ratio of total expenses | | | | | | | | | | |
| to average net assets | | 1.10 | | 1.09 | | 1.06 | | 1.13 | | — |
| Ratio of net expenses | | | | | | | | | | |
| to average net assets | | 1.00 | | 1.00 | | 1.00 | | 1.00 | | — |
| Ratio of net investment income | | | | | | | | | | |
| to average net assets | | .90 | | .65 | | .49 | | .26 | | — |
| Portfolio Turnover Rate | | 83.64 | | 52.74 | | 47.47 | | 48.22 | | 51.44 |
| |
| |
| |
| |
| |
|
| Net Assets, end of period ($ x 1,000) | | 9,748 | | 10,299 | | 9,150 | | 7,929 | | 1 |
| a | | The portfolio commenced offering Service shares on December 31, 2000. |
| b | | Based on average shares outstanding at each month end. |
| See notes to financial statements. |
18
NOTES TO FINANCIAL STATEMENTS
NOTE 1—Significant Accounting Policies:
Dreyfus Variable Investment Fund (the "fund") is registered under the Investment Company Act of 1940, as amended (the "Act"), as an open-end management investment company, operating as a series company currently offering twelve series, including the Disciplined Stock Portfolio (the "portfolio").The portfolio is only offered to separate accounts established by insurance companies to fund variable annuity contracts and variable life insurance policies.The portfolio is a diversified series. The portfolio's investment objective is to provide investment returns (consisting of capital appreciation and income) that are greater than the total return performance of stocks represented by the Standard & Poor's 500 Composite Stock Price Index.The Dreyfus Corporation (the "Manager"or "Dreyfus") serves as the portfolio's investment adviser. The Manager is a wholly-owned subsidiary of Mellon Financial Corporation ("Mellon Financial").
Dreyfus Service Corporation (the "Distributor"), a wholly-owned subsidiary of the Manager, is the distributor of the portfolio's shares, which are sold without a sales charge.The portfolio is authorized to issue an unlimited number of $.001 par value shares of Beneficial Interest in each of the following classes of shares: Initial and Service. Each class of shares has identical rights and privileges, except with respect to the distribution plan and the expenses borne by each class and certain voting rights. Income, expenses (other than expenses attributable to a specific class), and realized and unrealized gains or losses on investments are allocated to each class of shares based on its relative net assets.
The fund accounts separately for the assets, liabilities and operations of each series. Expenses directly attributable to each series are charged to that series' operations; expenses which are applicable to all series are allocated among them on a pro rata basis.
The portfolio's financial statements are prepared in accordance with U.S. generally accepted accounting principles, which may require the use of management estimates and assumptions.Actual results could differ from those estimates.
The Portfolio 19
NOTES TO FINANCIAL STATEMENTS (continued)
The fund enters into contracts that contain a variety of indemnifica-tions.The portfolio's maximum exposure under these arrangements is unknown. The portfolio does not anticipate recognizing any loss related to these arrangements.
(a) Portfolio valuation: Investments in securities are valued at the last sales price on the securities exchange or national securities market on which such securities are primarily traded. Securities listed on the National Market System for which market quotations are available are valued at the official closing price or, if there is no official closing price that day, at the last sales price. Securities not listed on an exchange or the national securities market, or securities for which there were no transactions, are valued at the average of the most recent bid and asked prices, except for open short positions, where the asked price is used for valuation purposes. Bid price is used when no asked price is available. Investments in registered investment companies are valued at their net asset value.When market quotations or official closing prices are not readily available, or are determined not to reflect accurately fair value, such as when the value of a security has been significantly affected by events after the close of the exchange or market on which the security is principally traded (for example, a foreign exchange or market), but before the portfolio calculates its net asset value, the portfolio may value these investments at fair value as determined in accordance with the procedures approved by the Board of Trustees. Fair valuing of securities may be determined with the assistance of a pricing service using calculations based on indices of domestic securities and other appropriate indicators, such as prices of relevant ADR's and futures contracts. For other securities that are fair valued by the Board of Trustees, certain factors may be considered such as: fundamental analytical data, the nature and duration of restrictions on disposition, an evaluation of the forces that influence the market in which the securities are purchased and sold and public trading in similar securities of the issuer or comparable issuers. Investments denominated in foreign currencies are translated to U.S. dollars at the prevailing rates of exchange. Forward currency exchange contracts are valued at the forward rate.
20
(b) Securities transactions and investment income: Securities transactions are recorded on a trade date basis. Realized gain and loss from securities transactions are recorded on the identified cost basis. Dividend income is recognized on the ex-dividend date and interest income, including, where applicable, accretion of discount and amortization of premium on investments, is recognized on the accrual basis.
The portfolio has an arrangement with the custodian bank whereby the portfolio receives earnings credits from the custodian when positive cash balances are maintained, which are used to offset custody fees. For financial reporting purposes, the portfolio includes net earnings credits, if any, as an expense offset in the Statement of Operations.
Pursuant to a securities lending agreement with Mellon Bank, N.A., an affiliate of the Manager, the portfolio may lend securities to qualified institutions.At origination, all loans are secured by collateral of at least 102% of the value of U.S. securities loaned and 105% of the value of foreign securities loaned. Collateral equivalent to at least 100% of the market value of securities on loan will be maintained at all times. Cash collateral is invested in certain money market mutual funds managed by the Manager. The portfolio will be entitled to receive all income on securities loaned, in addition to income earned as a result of the lending transaction.Although each security loaned is fully collateralized, the portfolio would bear the risk of delay in recovery of, or loss of rights in, the securities loaned should a borrower fail to return the securities in a timely manner.
(c) Affiliated issuers: Investments in other investment companies advised by the Manager are defined as "affiliated" in the Act.
(d) Dividends to shareholders: Dividends are recorded on the ex-dividend date. Dividends from investment income-net and dividends from net realized capital gain, if any, are normally declared and paid annually, but the portfolio may make distributions on a more frequent basis to comply with the distribution requirements of the Internal Revenue Code of 1986, as amended (the "Code").To the extent that net realized
The Portfolio 21
NOTES TO FINANCIAL STATEMENTS (continued)
capital gain can be offset by capital loss carryovers, it is the policy of the portfolio not to distribute such gain. Income and capital gain distributions are determined in accordance with income tax regulations, which may differ from U.S. generally accepted accounting principles.
(e) Federal income taxes: It is the policy of the portfolio to continue to qualify as a regulated investment company, if such qualification is in the best interests of its shareholders, by complying with the applicable provisions of the Code, and to make distributions of taxable income sufficient to relieve it from substantially all federal income and excise taxes.
At December 31, 2004, the components of accumulated earnings on a tax basis were as follows: accumulated capital losses $27,308,551 and unrealized appreciation $19,157,032.
The accumulated capital loss carryover is available to be applied against future net securities profits, if any, realized subsequent to December 31, 2004. If not applied, $6,839,557 of the carryover expires in fiscal 2009, $16,383,626 expires in fiscal 2010 and $4,085,368 expires in fiscal 2011.
The tax character of distributions paid to shareholders during the fiscal periods ended December 31, 2004 and December 31, 2003 were as follows: ordinary income $1,470,095 and $914,433, respectively.
During the period ended December 31, 2004, as a result of permanent book to tax differences primarily due to the tax treatment for real estate investment trusts, the portfolio increased accumulated undistributed investment income-net by $270,883, increased accumulated net realized gain (loss) on investments by $1,262 and decreased paid-in capital by $272,145. Net assets were not affected by this reclassification.
NOTE 2—Bank Line of Credit:
The portfolio participates with other Dreyfus-managed funds in a $350 million redemption credit facility (the "Facility") to be utilized for temporary or emergency purposes, including the financing of redemptions. In connection therewith, the portfolio has agreed to pay commitment fees on its pro rata portion of the Facility. Interest is charged to the portfolio based on prevailing market rates in effect at the time of borrowings.
22
The average daily amount of borrowings outstanding during the period ended December 31, 2004 was approximately $4,100, with a related weighted average annualized interest rate of 2.36% .
NOTE 3—Investment Advisory Fee and Other Transactions With Affiliates:
(a) Pursuant to an Investment Advisory Agreement with the Manager, the investment advisory fee is computed at the annual rate of .75 of 1% of the value of the portfolio's average daily net assets and is payable monthly.
The Manager has undertaken, from January 1, 2004, to December 31, 2005, to waive receipt of its fees and/or assume the expenses of the portfolio so that the expenses of neither class, exclusive of taxes, brokerage fees, interest on borrowings, commitment fees and extraordinary expenses, exceed an annual rate of 1% of the value of the average daily net assets of their class. During the period ended December 31, 2004, the Manager waived receipt of fees of $9,657, pursuant to the undertaking.
(b) Under the Distribution Plan (the "Plan") adopted pursuant to Rule 12b-1 under the Act, Service shares pay the Distributor for distributing their shares, for servicing and/or maintaining Service shares shareholder accounts and for advertising and marketing for Service shares.The Plan provides for payments to be made at an annual rate of .25 of 1% of the value of the Service shares' average daily net assets.The Distributor may make payments to Participating Insurance Companies and to brokers and dealers acting as principal underwriter for their variable insurance products.The fees payable under the Plan are payable without regard to actual expenses incurred. During the period ended December 31, 2004, Service shares were charged $24,632 pursuant to the Plan.
The portfolio compensates Dreyfus Transfer, Inc., a wholly-owned subsidiary of the Manager, under a transfer agency agreement for providing personnel and facilities to perform transfer agency services for the portfolio. During the period ended December 31, 2004, the portfolio was charged $213 pursuant to the transfer agency agreement.
The Portfolio 23
NOTES TO FINANCIAL STATEMENTS (continued)
The portfolio compensates Mellon Bank, N.A., an affiliate of the Manager, under a custody agreement to provide custodial services for the portfolio. During the period ended December 31, 2004, the portfolio was charged $24,643 pursuant to the custody agreement.
The components of Due to The Dreyfus Corporation and affiliates in the Statement of Assets and Liabilities consist of: management fees $72,372, Rule 12b-1 distribution plan fees $2,065, custodian fees $5,000 and transfer agency per account fees $40, which are offset against an expense reimbursement currently in effect in the amount of $1,715.
(c) Each Board member also serves as a Board member of other funds within the Dreyfus complex. Annual retainer fees and attendance fees are allocated to each fund based on net assets.
NOTE 4—Securities Transactions:
The aggregate amount of purchases and sales of investment securities, excluding short-term securities, during the period ended December 31, 2004, amounted to $95,816,592 and $111,122,145, respectively.
At December 31,2004,the cost of investments for federal income tax purposes was $94,770,932; accordingly, accumulated net unrealized appreciation on investments was $19,157,032, consisting of $20,440,130 gross unrealized appreciation and $1,283,098 gross unrealized depreciation.
NOTE 5—Legal Matters:
In early 2004, two purported class and derivative actions were filed against Mellon Financial, Mellon Bank, N.A., Dreyfus, Founders Asset Management LLC, and certain directors of the Dreyfus Funds and the Dreyfus Founders Funds (together, the "Funds"). In September 2004, plaintiffs served a Consolidated Amended Complaint (the "Amended Complaint") on behalf of a purported class of all persons who acquired interests in any of the Funds between January 30, 1999 and November 17, 2003, and derivatively on behalf of the Funds. The Amended Complaint in the newly styled In re Dreyfus Mutual Funds Fee Litigation also named the Distributor, Premier Mutual Fund Services,
24
Inc. and two additional Fund directors as defendants and alleges violations of the Investment Company Act of 1940, the Investment Advisers Act of 1940, the Pennsylvania Unfair Trade Practices and Consumer Protection Law and common-law claims. Plaintiffs seek to recover allegedly improper and excessive Rule 12b-1 and advisory fees allegedly charged to the Funds for marketing and distribution services. More specifically, plaintiffs claim, among other things, that 12b-1 fees and directed brokerage were improperly used to pay brokers to recommend the Funds over other funds, and that such payments were not disclosed to investors. In addition, plaintiffs assert that economies of scale and soft-dollar benefits were not passed on to the Funds. Plaintiffs further allege that 12b-1 fees were improperly charged to certain of the Funds that were closed to new investors.The Amended Complaint seeks compensatory and punitive damages, rescission of the advisory contracts, and an accounting and restitution of any unlawful fees, as well as an award of attorneys' fees and litigation expenses. As noted, some of the claims in this litigation are asserted derivatively on behalf of the Funds that have been named as nominal defendants. With respect to such derivative claims, no relief is sought against the Funds. Dreyfus believes the allegations to be totally without merit and intends to defend the action vig-orously.Defendants filed motions to dismiss the Amended Complaint on November 12, 2004, and those motions are pending.
Additional lawsuits arising out of these circumstances and presenting similar allegations and requests for relief may be filed against the defendants in the future. Neither Dreyfus nor the Funds believe that any of the pending actions will have a material adverse effect on the Funds or Dreyfus' ability to perform its contract with the Funds.
The Portfolio 25
| | REPORT OF INDEPENDENT REGISTERED
PUBLIC ACCOUNTING FIRM
|
Shareholders and Board of Trustees
Dreyfus Variable Investment Fund, Disciplined Stock Portfolio
|
We have audited the accompanying statement of assets and liabilities, including the statement of investments, of Dreyfus Variable Investment Fund, Disciplined Stock Portfolio (one of the funds comprising Dreyfus Variable Investment Fund) as of December 31, 2004, and the related statement of operations for the year then ended, the statement of changes in net assets for each of the two years in the period then ended, and financial highlights for each of the periods indicated therein.These financial statements and financial highlights are the responsibility of the Fund's management. Our responsibility is to express an opinion on these financial statements and financial highlights based on our audits.
We conducted our audits in accordance with the standards of the Public Company Accounting Oversight Board (United States).Those standards require that we plan and perform the audit to obtain reasonable assurance about whether the financial statements and financial highlights are free of material misstatement. An audit includes examining, on a test basis, evidence supporting the amounts and disclosures in the financial statements and financial highlights. Our procedures included verification by examination of securities held by the custodian as of December 31, 2004 and confirmation of securities not held by the custodian by correspondence with others. An audit also includes assessing the accounting principles used and significant estimates made by management, as well as evaluating the overall financial statement presentation.We believe that our audits provide a reasonable basis for our opinion.
In our opinion, the financial statements and financial highlights referred to above present fairly, in all material respects, the financial position of Dreyfus Variable Investment Fund, Disciplined Stock Portfolio at December 31, 2004, the results of its operations for the year then ended, the changes in its net assets for each of the two years in the period then ended, and the financial highlights for each of the indicated periods, in conformity with U.S. generally accepted accounting principles.

New York, New York
February 4, 2005
|
26
IMPORTANT TAX INFORMATION (Unaudited)
For federal tax purposes, the portfolio hereby designates 100% of the ordinary dividends paid during the fiscal year ended December 31, 2004 as qualifying for the corporate dividends received deduction. Shareholders will receive notification in January 2005 of the percentage applicable to the preparation of their 2004 income tax returns.
The Portfolio 27
BOARD MEMBERS INFORMATION (Unaudited)
| Joseph S. DiMartino (61) |
| Chairman of the Board (1995) |
| Principal Occupation During Past 5 Years: |
| • Corporate Director and Trustee |
| Other Board Memberships and Affiliations: |
| • The Muscular Dystrophy Association, Director |
| • Levcor International, Inc., an apparel fabric processor, Director |
| • Century Business Services, Inc., a provider of outsourcing functions for small and medium size |
| companies, Director |
| • The Newark Group, a provider of a national market of paper recovery facilities, paperboard |
| mills and paperboard converting plants, Director |
| • Azimuth Trust, an institutional asset management firm, Member of Board of Managers and |
| Advisory Board |
| No. of Portfolios for which Board Member Serves: 186 |
| ——————— |
| David P. Feldman (65) |
| Board Member (1994) |
| Principal Occupation During Past 5 Years: |
| • Corporate Director and Trustee |
| Other Board Memberships and Affiliations: |
| • BBH Mutual Funds Group (11 funds), Director |
| • The Jeffrey Company, a private investment company, Director |
| • QMED, a medical device company, Director |
| No. of Portfolios for which Board Member Serves: 51 |
| ——————— |
| James F. Henry (74) |
| Board Member (1990) |
| Principal Occupation During Past 5 Years: |
| • President, CPR Institute for Dispute Resolution, a non-profit organization principally |
| engaged in the development of alternatives to business litigation (Retired 2003) |
| No. of Portfolios for which Board Member Serves: 22 |
| ——————— |
| Rosalind Gersten Jacobs (79) |
| Board Member (1990) |
| Principal Occupation During Past 5 Years: |
| • Merchandise and marketing consultant |
| No. of Portfolios for which Board Member Serves: 33 |
28
| Dr. Paul A. Marks (78) |
| Board Member (1990) |
| Principal Occupation During Past 5 Years: |
| • President and Chief Executive Officer of Memorial Sloan-Kettering Cancer Center (Retired 1999) |
| Other Board Memberships and Affiliations: |
| • Pfizer, Inc., a pharmaceutical company, Director-Emeritus |
| • Atom Pharm, Director |
| • Lazard Freres & Company, LLC, Senior Adviser |
| • Merck, Consultant |
| No. of Portfolios for which Board Member Serves: 22 |
| ——————— |
| Dr. Martin Peretz (65) |
| Board Member (1990) |
| Principal Occupation During Past 5 Years: |
| • Editor-in-Chief of The New Republic Magazine |
| • Lecturer in Social Studies at Harvard University (1965-2001) |
| • Co-Chairman of TheStreet.com, a financial daily on the web |
| Other Board Memberships and Affiliations: |
| • Academy for Liberal Education, an accrediting agency for colleges and universities certified by |
| the U.S. Department of Education, Director |
| • Digital Learning Group, LLC, an online publisher of college textbooks, Director |
| • Harvard Center for Blood Research,Trustee |
| • Bard College,Trustee |
| • YIVO Institute for Jewish Research,Trustee |
| No. of Portfolios for which Board Member Serves: 22 |
| ——————— |
| Bert W. Wasserman (72) |
| Board Member (1993) |
| Principal Occupation During Past 5 Years: |
| • Financial Consultant |
| Other Board Memberships and Affiliations: |
| • Lillian Vernon Corporation, Director |
| No. of Portfolios for which Board Member Serves: 22 |
| ——————— |
| Once elected all Board Members serve for an indefinite term.The address of the Board Members and Officers is in c/o |
| The Dreyfus Corporation, 200 Park Avenue, New York, New York 10166.Additional information about the Board |
| Members is available in the fund's Statement of Additional Information which can be obtained from Dreyfus free of |
| charge by calling this toll free number: 1-800-554-4611. |
| John M. Fraser, Jr., Emeritus Board Member |
| Irving Kristol, Emeritus Board Member |
The Portfolio 29
OFFICERS OF THE FUND (Unaudited)
STEPHEN E. CANTER, President since March 2000.
Chairman of the Board, Chief Executive Officer and Chief Operating Officer of the Manager, and an officer of 92 investment companies (comprised of 185 portfolios) managed by the Manager. Mr. Canter also is a Board member and, where applicable, an Executive Committee Member of the other investment management subsidiaries of Mellon Financial Corporation, each of which is an affiliate of the Manager. He is 59 years old and has been an employee of the Manager since May 1995.
STEPHEN R. BYERS, Executive Vice President since November 2002.
Chief Investment Officer,Vice Chairman and a director of the Manager, and an officer of 92 investment companies (comprised of 185 portfolios) managed by the Manager. Mr. Byers also is an officer, director or an Executive Committee Member of certain other investment management subsidiaries of Mellon Financial Corporation, each of which is an affiliate of the Manager. He is 51 years old and has been an employee of the Manager since January 2000. Prior to joining the Manager, he served as an Executive Vice President-Capital Markets, Chief Financial Officer and Treasurer at Gruntal & Co., L.L.C.
MARK N. JACOBS, Vice President since March 2000.
Executive Vice President, Secretary and General Counsel of the Manager, and an officer of 93 investment companies (comprised of 201 portfolios) managed by the Manager. He is 58 years old and has been an employee of the Manager since June 1977.
MICHAEL A. ROSENBERG, Secretary since March 2000.
Associate General Counsel of the Manager, and an officer of 90 investment companies (comprised of 194 portfolios) managed by the Manager. He is 44 years old and has been an employee of the Manager since October 1991.
ROBERT R. MULLERY, Assistant Secretary since March 2000.
Associate General Counsel of the Manager, and an officer of 26 investment companies (comprised of 60 portfolios) managed by the Manager. He is 52 years old and has been an employee of the Manager since May 1986.
STEVEN F. NEWMAN, Assistant Secretary since March 2000.
Associate General Counsel and Assistant Secretary of the Manager, and an officer of 93 investment companies (comprised of 201 portfolios) managed by the Manager. He is 55 years old and has been an employee of the Manager since July 1980.
JAMES WINDELS, Treasurer since November 2001.
Director – Mutual Fund Accounting of the Manager, and an officer of 93 investment companies (comprised of 201 portfolios) managed by the Manager. He is 46 years old and has been an employee of the Manager since April 1985.
RICHARD CASSARO, Assistant Treasurer since August 2003.
Senior Accounting Manager – Equity Funds of the Manager, and an officer of 26 investment companies (comprised of 102 portfolios) managed by the Manager. He is 44 years old and has been an employee of the Manager since September 1982.
30
ERIK D. NAVILOFF, Assistant Treasurer since December 2002.
Senior Accounting Manager – Taxable Fixed Income Funds of the Manager, and an officer of 19 investment companies (comprised of 75 portfolios) managed by the Manager. He is 36 years old and has been an employee of the Manager since November 1992.
ROBERT ROBOL, Assistant Treasurer since August 2003.
Senior Accounting Manager – Money Market Funds of the Manager, and an officer of 39 investment companies (comprised of 84 portfolios) managed by the Manager. He is 40 years old and has been an employee of the Manager since October 1988.
ROBERT SVAGNA, Assistant Treasurer since December 2002.
Senior Accounting Manager – Equity Funds of the Manager, and an officer of 27 investment companies (comprised of 107 portfolios) managed by the Manager. He is 37 years old and has been an employee of the Manager since November 1990.
KENNETH J. SANDGREN, Assistant Treasurer since November 2001.
Mutual Funds Tax Director of the Manager, and an officer of 93 investment companies (comprised of 201 portfolios) managed by the Manager. He is 50 years old and has been an employee of the Manager since June 1993.
JOSEPH W. CONNOLLY, Chief Compliance Officer since October 2004.
Chief Compliance Officer of the Manager and The Dreyfus Family of Funds (93 investment companies, comprising 201 portfolios). From November 2001 through March 2004, Mr. Connolly was first Vice-President, Mutual Fund Servicing for Mellon Global Securities Services. In that capacity, Mr. Connolly was responsible for managing Mellon's Custody, Fund Accounting and Fund Administration services to third-party mutual fund clients. He is 47 years old and has served in various capacities with the Manager since 1980, including manager of the firm's Fund Accounting Department from 1997 through October 2001.
WILLIAM GERMENIS, Anti-Money Laundering Compliance Officer since September 2002.
Vice President and Anti-Money Laundering Compliance Officer of the Distributor, and the Anti-Money Laundering Compliance Officer of 88 investment companies (comprised of 196 portfolios) managed by the Manager. He is 34 years old and has been an employee of the Distributor since October 1998.
The Portfolio 31
NOTES
| For More | | Information |
| |
|
| |
| Dreyfus Variable | | Transfer Agent & |
| Investment Fund, | | Dividend Disbursing Agent |
| Disciplined Stock Portfolio | | |
| | | Dreyfus Transfer, Inc. |
| 200 Park Avenue | | |
| | | 200 Park Avenue |
| New York, NY 10166 | | |
| | | New York, NY 10166 |
| |
| Investment Adviser | | Distributor |
| The Dreyfus Corporation | | |
| | | Dreyfus Service Corporation |
| 200 Park Avenue | | |
| | | 200 Park Avenue |
| New York, NY 10166 | | |
| | | New York, NY 10166 |
| Custodian | | |
| Mellon Bank, N.A. | | |
| One Mellon Bank Center | | |
| Pittsburgh, PA 15258 | | |
| Telephone 1-800-554-4611 or 516-338-3300 |
| Mail | | The Dreyfus Family of Funds, 144 Glenn Curtiss Boulevard, Uniondale, NY 11556-0144 |
| | | Attn: Institutional Servicing |
The portfolio files its complete schedule of portfolio holdings with the Securities and
Exchange Commission ("SEC") for the first and third quarters of each fiscal year on Form N-Q. The portfolio's Forms N-Q are available on the SEC's website at http://www.sec.gov and may be reviewed and copied at the SEC's Public Reference Room in Washington, DC. Information on the operation of the Public Reference Room may be obtained by calling 1-800-SEC-0330.
A description of the policies and procedures that the portfolio uses to determine how to vote proxies relating to portfolio securities, and information regarding how the portfolio voted these proxies for the 12-month period ended June 30, 2004, is available through the portfolio's website at http://www.dreyfus.com and on the SEC's website at http://www.sec.gov. The description of the policies and procedures is also available without charge, upon request, by calling 1-800-645-6561.
© 2005 Dreyfus Service Corporation 0150AR1204
| Dreyfus Variable |
| Investment Fund, |
| Growth and Income |
| Portfolio |

The views expressed in this report reflect those of the portfolio manager only through the end of the period covered and do not necessarily represent the views of Dreyfus or any other person in the Dreyfus organization.Any such views are subject to change at any time based upon market or other conditions and Dreyfus disclaims any responsibility to update such views. These views may not be relied on as investment advice and, because investment decisions for a Dreyfus portfolio are based on numerous factors, may not be relied on as an indication of trading intent on behalf of any Dreyfus portfolio.
Not FDIC-Insured • Not Bank-Guaranteed • May Lose Value
| | | Contents |
| |
| | | T H E P O R T F O L I O |
| |
|
| 2 | | Letter from the Chairman |
| 3 | | Discussion of Performance |
| 6 | | Portfolio Performance |
| 8 | | Understanding Your Portfolio’s Expenses |
| 8 | | Comparing Your Portfolio’s Expenses |
| | | With Those of Other Funds |
| 9 | | Statement of Investments |
| 13 | | Statement of Assets and Liabilities |
| 14 | | Statement of Operations |
| 15 | | Statement of Changes in Net Assets |
| 17 | | Financial Highlights |
| 19 | | Notes to Financial Statements |
| 28 | | Report of Independent Registered |
| | | Public Accounting Firm |
| 29 | | Important Tax Information |
| 30 | | Board Members Information |
| 32 | | Officers of the Fund |
| | | F O R M O R E I N F O R M AT I O N |
| |
|
| | | Back Cover |
| Dreyfus Variable Investment Fund, |
| Growth and Income Portfolio |
The Portfolio

LETTER FROM THE CHAIRMAN
We are pleased to present this annual report for Dreyfus Variable Investment Fund, Growth and Income Portfolio, covering the 12-month period from January 1, 2004, through December 31, 2004. Inside, you’ll find valuable information about how the portfolio was managed during the reporting period, including a discussion with the portfolio manager, L. Emerson Tuttle.
2004 represented the second consecutive year of positive stock market performance. Unlike the 2003 rally, however, in which most stocks rose as general business conditions improved, 2004’s market performance largely reflected the strengths and weaknesses of individual companies and industries. As a result, fundamental research and professional judgment became more important determinants of mutual fund performance in 2004.
What’s ahead for stocks in 2005? No one knows for certain.Positive influences remain in place, including moderately expanding U.S. and global economies and low inflation. Nonetheless, a number of risks — such as rising short-term interest rates, currency fluctuations and generally slowing corporate earnings — could threaten the market environment.
As always, we urge our shareholders to view the stock market from a long-term perspective, measured in years rather than weeks or months. One of the best ways to ensure a long-term perspective is to establish an investment plan with the help of your financial advisor, and review it periodically to track your progress toward your financial goals.
Thank you for your continued confidence and support.

| Stephen E. Canter |
| Chairman and Chief Executive Officer |
| The Dreyfus Corporation |
| January 18, 2005 |

DISCUSSION OF PERFORMANCE
L. Emerson Tuttle, Portfolio Manager
How did Dreyfus Variable Investment Fund, Growth and Income Portfolio perform relative to its benchmark?
For the 12-month period ended December 31, 2004, the portfolio achieved total returns of 7.47% for its Initial shares and 7.22% for its Service shares.1 For the same period, the total return of the Standard & Poor’s 500 Composite Stock Price Index (“S&P 500 Index”), the portfolio’s benchmark, was 11.04% ..2
We attribute the portfolio’s overall performance to stronger U.S. and global economic growth, which led to improving business fundamentals and created a positive environment for stocks. A post-election rally during the final months of 2004 produced the market’s greatest gains. While the portfolio participated in the market’s advance, disappointing individual stock selections in the technology, telecommunications and industrials sectors caused the portfolio to underperform the benchmark.
What is the portfolio’s investment approach?
The portfolio seeks long-term capital growth,current income and growth of income consistent with reasonable investment risk.To pursue this goal, the portfolio invests primarily in stocks, bonds and money market instruments of domestic and foreign issuers.The portfolio’s stock investments may include common stocks, preferred stocks and convertible securities, including those purchased in initial public offerings or shortly thereafter.
The portfolio’s investment strategy combines market economics with fundamental research.The portfolio managers begin by assessing current economic conditions and forecasting economic expectations. Each economic sector of the Standard and Poor’s 500 Composite Index (S&P 500) is examined to determine the sector’s market-capitalized weighting and to estimate the performance of the sector relative to the S&P 500 as a whole.A balance is determined for the portfolio, giving greater weight to sectors that are expected to outperform the overall market and less weight to sectors that are expected to underperform the overall market.
In choosing stocks, the portfolio employs fundamental analysis, generally seeking companies with strong positions in their industries, and companies with a catalyst that can trigger a price increase (such as
The Portfolio 3
DISCUSSION OF PERFORMANCE (continued)
|
accelerating earnings growth, a corporate restructuring or change in management).The portfolio manager seeks to create a broadly diversified core portfolio comprised of growth stocks, value stocks and stocks that exhibit characteristics of both investment styles. Income is generated primarily from dividend-paying stocks in which the portfolio may invest.The manager selects stocks based on:
- value, or how a stock is priced relative to its perceived intrinsic worth
- growth, in this case the sustainability or growth of earnings or cash flow
- financial profile, which measures the financial health of the company
What other factors influenced the portfolio’s performance?
Strong industrial demand and rising oil and gas prices fueled sharp gains in the energy sector. While the portfolio maintained slightly lighter exposure to energy stocks than the benchmark, good individual stock selections, including exploration and production companies such as XTO Energy and diversified energy companies such as Exxon Mobil, enabled the portfolio to nearly match the benchmark’s energy-related returns. Performance also proved to be strong in the utilities sector, another of the market’s better-performing sectors, where the portfolio emphasized electric utilities.Among financial stocks, the market’s single largest sector, the portfolio roughly matched the benchmark’s advance. Top performers included mortgage broker Countrywide Financial and property insurer Fidelity National Financial.
The portfolio further enhanced performance through good stock selections in the health care and consumer discretionary sectors. In the health care sector, which represented one of the market’s weaker sectors in 2004, the portfolio generally avoided troubled large-cap pharmaceutical firms, focusing instead on equipment and supply companies, such as C.R. Bard, St. Jude Medical and Fisher Scientific International.Among consumer discretionary holdings, gains in specialty retailers such as Staples and PETsMART, and in multi-line retailers such as Target, more than made up for the lackluster performance of media holdings and for the portfolio’s relatively light exposure to Internet-related retailers.
The portfolio encountered its most significant disappointments in the technology sector.While some technology holdings, such as VeriSign, contributed positively to returns, most suffered declines. Notably weak performers included computer and peripheral companies such as Hewlett-Packard and semiconductor-related companies such as equipment makers KLA-Tencor and Applied Materials. In the
telecommunications services sector, the portfolio’s lack of exposure to wireless communications stocks compromised its relative performance. The portfolio’s returns also faltered in the industrials sector, where company-specific issues affected for-profit education provider Corinthian Colleges, European discount airline Ryanair and construction equipment manufacturer Caterpillar, offsetting gains in diversified conglomerate Tyco International.
What is the portfolio’s current strategy?
L. Emerson Tuttle took the reins as portfolio manager in October 2004. In the ensuing months, we began the process of modifying the portfolio to better reflect both top-down economic analyses and bottom-up analyst recommendations. By actively adjusting sector weightings and reducing the number of holdings in the portfolio, we increased the portfolio’s emphasis on the specific stocks in which we have the highest degree of confidence.
As of December 31, 2004, the portfolio’s total number of holdings has been reduced to 93 stocks from approximately 120 at the beginning of the reporting period.The process of adjusting sector weightings has led to mildly overweighted positions in the technology, industrial and energy sectors, and slightly underweighted positions among interest-rate-sensitive financials and consumer staples. However, the portfolio’s basic investment strategy remains unchanged.
| | | The portfolio is only available as a funding vehicle under variable life insurance policies or variable |
| | | annuity contracts issued by insurance companies. Individuals may not purchase shares of the |
| | | portfolio directly.A variable annuity is an insurance contract issued by an insurance company that |
| | | enables investors to accumulate assets on a tax-deferred basis for retirement or other long-term |
| | | goals.The investment objective and policies of Dreyfus Variable Investment Fund, Growth and |
| | | Income Portfolio made available through insurance products may be similar to other funds/ |
| | | portfolios managed or advised by Dreyfus. However, the investment results of the portfolio may be |
| | | higher or lower than, and may not be comparable to, those of any other Dreyfus fund/portfolio. |
| 1 | | Total return includes reinvestment of dividends and any capital gains paid. Past performance is |
| | | guarantee of future results. Share price and investment return fluctuate such that upon redemption, |
| | | portfolio shares may be worth more or less than their original cost.The portfolio’s performance does |
| | | not reflect the deduction of additional charges and expenses imposed in connection with investing |
| | | in variable insurance contracts, which will reduce returns. Return figures provided reflect the |
| | | absorption of portfolio expenses by The Dreyfus Corporation pursuant to an agreement in effect |
| | | through December 31, 2005, at which time it may be extended, terminated or modified. Had |
| | | these expenses not been absorbed, the portfolio’s returns would have been lower. |
| 2 | | SOURCE: LIPPER INC. — Reflects the reinvestment of dividends and, where applicable, |
| | | capital gain distributions.The Standard & Poor’s 500 Composite Stock Price Index is a widely |
| | | accepted, unmanaged index of U.S. stock market performance. |
The Portfolio 5
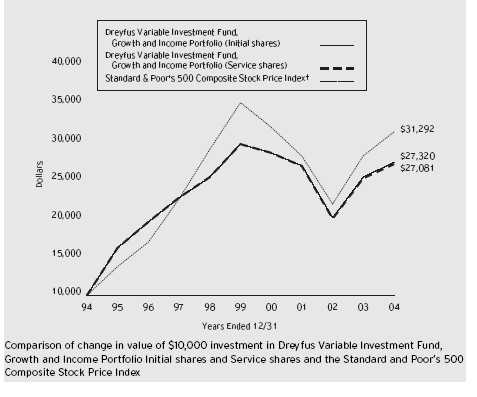
| Average Annual Total Returns as of | | 12/31/04 | | | | |
| |
| | | 1 Year | | 5 Years | | 10 Years |
| |
| |
| |
|
| Initial shares | | 7.47% | | (1.65)% | | 10.57% |
| Service shares | | 7.22% | | (1.82)% | | 10.48% |
| |
| The data for Service shares includes the results of Initial shares for the period prior to December 31, 2000 |
| (inception date of Service shares). Actual Service shares’ average annual total return and hypothetical growth |
| results would have been lower. See notes below. | | | | | | |
| † Source: Lipper Inc. | | | | | | |
| Past performance is not predictive of future performance.The portfolio’s performance shown in the graph and |
| table does not reflect the deduction of taxes that a shareholder would pay on portfolio distributions or the |
| redemption of portfolio shares. | | | | | | |
| The portfolio’s performance does not reflect the deduction of additional charges and expenses imposed in |
| connection with investing in variable insurance contracts which will reduce returns. | | |
| The above graph compares a $10,000 investment made in Initial and Service shares of Dreyfus Variable Investment |
| Fund, Growth and Income Portfolio on 12/31/94 to a $10,000 investment made in the Standard & Poor’s 500 |
| Composite Stock Price Index (the “Index”) on that date. | | | | |
6
The portfolio’s Initial shares are not subject to a Rule 12b-1 fee.The portfolio’s Service shares are subject to a 0.25% annual Rule 12b-1 fee.The performance figures for Service shares reflect the performance of the portfolio’s Initial shares from their inception date through December 30, 2000, and the performance of the portfolio’s Service shares from December 31, 2000 (inception date of Service shares) to December 31, 2004 (blended performance figures).The performance figures for each share class reflect certain expense reimbursements, without which the performance of each share class would have been lower. In addition, the blended performance figures have not been adjusted to reflect the higher operating expenses of the Service shares. If these expenses had been reflected, the blended performance figures would have been lower.All dividends and capital gain distributions are reinvested.
The portfolio’s performance shown in the line graph takes into account all applicable portfolio fees and expenses (after any expense reimbursements).The Index is a widely accepted, unmanaged index of U.S. stock market performance.The Index does not take into account charges, fees and other expenses. Further information relating to portfolio performance, including expense reimbursements, if applicable, is contained in the Financial Highlights section of the prospectus and elsewhere in this report.

As a mutual fund investor,you pay ongoing expenses,such as management fees and other expenses.Using the information below,you can estimate how these expenses affect your investment and compare them with the expenses of other funds.You also may pay one-time transaction expenses,including sales charges (loads) and redemption fees, which are not shown in this section and would have resulted in higher total expenses. For more information, see your portfolio’s prospectus or talk to your financial adviser.
Review your portfolio’s expenses
|
The table below shows the expenses you would have paid on a $1,000 investment in Dreyfus Variable Investment Fund, Growth and Income Portfolio from July 1, 2004 to December 31, 2004. It also shows how much a $1,000 investment would be worth at the close of the period, assuming actual returns and expenses.
| Expenses and Value of a $1,000 Investment | | |
| assuming actual returns for the six months ended December 31, 2004 |
| | | Initial Shares | | Service Shares |
| |
| |
|
| Expenses paid per $1,000 † | | $ 4.26 | | $ 5.19 |
| Ending value (after expenses) | | $1,067.00 | | $1,066.20 |
COMPARING YOUR PORTFOLIO’S EXPENSES WITH THOSE OF OTHER FUNDS (Unaudited)
Using the SEC’s method to compare expenses
The Securities and Exchange Commission (SEC) has established guidelines to help investors assess fund expenses. Per these guidelines, the table below shows your portfolio’s expenses based on a $1,000 investment, assuming a hypothetical 5% annualized return. You can use this information to compare the ongoing expenses (but not transaction expenses or total cost) of investing in the portfolio with those of other funds. All mutual fund shareholder reports will provide this information to help you make this comparison. Please note that you cannot use this information to estimate your actual ending account balance and expenses paid during the period.
Expenses and Value of a $1,000 Investment assuming a hypothetical 5% annualized return for the six months ended December 31, 2004
| | | Initial Shares | | Service Shares |
| |
| |
|
| Expenses paid per $1,000 † | | $ 4.17 | | $ 5.08 |
| Ending value (after expenses) | | $1,021.01 | | $1,020.11 |
† Expenses are equal to the portfolio’s annualized expense ratio of .82% for Initial shares and 1.00% for Service shares, multiplied by the average account value over the period, multiplied by 184/366 (to reflect the one-half year period).
STATEMENT OF INVESTMENTS
December 31, 2004
|
| Common Stocks—98.3% | | Shares | | | | Value ($) |
| |
| |
| |
|
| Consumer Discretionary—9.8% | | | | | | |
| Carnival | | 42,000 | | | | 2,420,460 |
| Comcast, Cl. A | | 50,941 | | a | | 1,695,317 |
| Disney (Walt) | | 80,000 | | | | 2,224,000 |
| Federated Department Stores | | 25,900 | | | | 1,496,761 |
| Hilton Hotels | | 143,400 | | | | 3,260,916 |
| International Game Technology | | 27,300 | | | | 938,574 |
| Lamar Advertising | | 33,800 | | a | | 1,445,964 |
| PetSmart | | 30,700 | | | | 1,090,771 |
| Staples | | 70,700 | | | | 2,383,297 |
| Target | | 27,000 | | | | 1,402,110 |
| Time Warner | | 111,300 | | a | | 2,163,672 |
| Univision Communications, Cl. A | | 35,600 | | a | | 1,042,012 |
| Viacom, Cl. B | | 62,696 | | | | 2,281,507 |
| | | | | | | 23,845,361 |
| Consumer Staples—7.5% | | | | | | |
| Altria Group | | 72,800 | | | | 4,448,080 |
| General Mills | | 15,700 | | | | 780,447 |
| PepsiCo | | 91,300 | | | | 4,765,860 |
| Procter & Gamble | | 58,300 | | | | 3,211,164 |
| Wal-Mart Stores | | 96,400 | | | | 5,091,848 |
| | | | | | | 18,297,399 |
| Energy—8.3% | | | | | | |
| Anadarko Petroleum | | 35,100 | | | | 2,274,831 |
| BP, ADR | | 21,700 | | | | 1,267,280 |
| ChevronTexaco | | 92,200 | | | | 4,841,422 |
| ConocoPhillips | | 15,800 | | | | 1,371,914 |
| Exxon Mobil | | 205,800 | | | | 10,549,308 |
| | | | | | | 20,304,755 |
| Financial—19.8% | | | | | | |
| American Express | | 24,800 | | | | 1,397,976 |
| American International Group | | 67,091 | | | | 4,405,866 |
| Axis Capital Holdings | | 28,400 | | | | 777,024 |
| Bank of America | | 161,900 | | | | 7,607,681 |
| Bank of New York | | 40,000 | | | | 1,336,800 |
| Capital One Financial | | 19,900 | | | | 1,675,779 |
| Citigroup | | 145,535 | | | | 7,011,876 |
| Countrywide Financial | | 101,600 | | | | 3,760,216 |
The Portfolio 9
S T A T E M E N T O F I N V E S T M E N T S (continued)
| Common Stocks (continued) | | Shares | | Value ($) |
| |
| |
|
| Financial (continued) | | | | |
| Federal National Mortgage Association | | 45,000 | | 3,204,450 |
| Fidelity National Financial | | 38,500 | | 1,758,295 |
| Fifth Third Bancorp | | 22,400 | | 1,059,072 |
| Goldman Sachs Group | | 24,000 | | 2,496,960 |
| J.P. Morgan Chase & Co. | | 85,460 | | 3,333,795 |
| Merrill Lynch | | 32,300 | | 1,930,571 |
| Morgan Stanley | | 35,700 | | 1,982,064 |
| Wachovia | | 38,300 | | 2,014,580 |
| Willis Group Holdings | | 61,300 | | 2,523,721 |
| | | | | 48,276,726 |
| Health Care—14.3% | | | | |
| Bard (C.R.) | | 13,400 | | 857,332 |
| Bristol-Myers Squibb | | 84,300 | | 2,159,766 |
| Fisher Scientific International | | 40,800 a | | 2,545,104 |
| Genzyme | | 33,700 a | | 1,956,959 |
| Gilead Sciences | | 35,300 a | | 1,235,147 |
| Hospira | | 44,800 a | | 1,500,800 |
| Johnson & Johnson | | 70,000 | | 4,439,400 |
| Lilly (Eli) & Co. | | 25,800 | | 1,464,150 |
| Medtronic | | 26,100 | | 1,296,387 |
| Novartis, ADR | | 95,600 | | 4,831,624 |
| PacifiCare Health Systems | | 30,700 a | | 1,735,164 |
| Pfizer | | 36,100 | | 970,729 |
| Schering-Plough | | 240,100 | | 5,013,288 |
| St. Jude Medical | | 59,500 a | | 2,494,835 |
| Thermo Electron | | 77,400 a | | 2,336,706 |
| | | | | 34,837,391 |
| Industrials—11.9% | | | | |
| AMR | | 66,700 a,b | | 730,365 |
| Caterpillar | | 28,300 | | 2,759,533 |
| Danaher | | 27,900 b | | 1,601,739 |
| Eaton | | 51,100 | | 3,697,596 |
| Emerson Electric | | 51,600 | | 3,617,160 |
| General Electric | | 262,300 | | 9,573,950 |
| 3M | | 20,000 | | 1,641,400 |
| Tyco International | | 47,300 | | 1,690,502 |
| |
| |
| 10 | | | | |
| Common Stocks (continued) | | Shares | | Value ($) |
| |
| |
|
| Industrials (continued) | | | | |
| United Parcel Service, Cl. B | | 28,300 | | 2,418,518 |
| United Technologies | | 13,600 | | 1,405,560 |
| | | | | 29,136,323 |
| Information Technology—18.3% | | | | |
| Accenture | | 52,000 a | | 1,404,000 |
| Altera | | 65,100 a | | 1,347,570 |
| Amdocs | | 51,900 a | | 1,362,375 |
| Cisco Systems | | 146,600 a | | 2,829,380 |
| Computer Sciences | | 28,100 a | | 1,583,997 |
| Dell | | 98,300 a | | 4,142,362 |
| First Data | | 27,700 b | | 1,178,358 |
| Intel | | 139,000 | | 3,251,210 |
| International Business Machines | | 62,800 | | 6,190,824 |
| Microsoft | | 279,900 | | 7,476,129 |
| Motorola | | 187,900 | | 3,231,880 |
| National Semiconductor | | 69,200 | | 1,242,140 |
| Oracle | | 218,700 a | | 3,000,564 |
| QUALCOMM | | 36,300 | | 1,539,120 |
| SunGard Data Systems | | 50,800 a | | 1,439,164 |
| Texas Instruments | | 39,700 | | 977,414 |
| VeriSign | | 72,300 a | | 2,423,496 |
| | | | | 44,619,983 |
| Materials—2.7% | | | | |
| Air Products & Chemicals | | 33,500 | | 1,941,995 |
| du Pont (EI) de Nemours | | 78,800 | | 3,865,140 |
| Sigma-Aldrich | | 12,300 | | 743,658 |
| | | | | 6,550,793 |
| Telecommunication Services—2.7% | | | | |
| SBC Communications | | 136,100 | | 3,507,297 |
| Verizon Communications | | 74,700 | | 3,026,097 |
| | | | | 6,533,394 |
| Utilities—3.0% | | | | |
| Consolidated Edison | | 27,900 b | | 1,220,625 |
| Dominion Resources | | 19,000 | | 1,287,060 |
| Exelon | | 31,200 | | 1,374,984 |
| FPL Group | | 16,400 b | | 1,225,900 |
The Portfolio 11
S T A T E M E N T O F I N V E S T M E N T S (continued)
| Common Stocks (continued) | | Shares | | Value ($) |
| |
| |
|
| Utilities (continued) | | | | | | |
| KeySpan | | | | 20,600 | | 812,670 |
| Southern | | | | 41,000 | | 1,374,320 |
| | | | | | | | | 7,295,559 |
| Total Common Stocks | | | | | | |
| (cost $198,175,316) | | | | | | 239,697,684 |
| |
| |
| |
|
| |
| Other Investments—1.0% | | | | |
| |
| |
|
| Registered Investment Company: | | | | |
| Dreyfus Institutional Preferred Plus Money Market Fund | | |
| (cost $2,378,000) | | | | 2,378,000 c | | 2,378,000 |
| |
| |
| |
|
| |
| Investment of Cash Collateral | | | | |
| for Securities Loaned—1.9% | | | | |
| |
| |
|
| Registered Investment Company: | | | | |
| Dreyfus Institutional Cash Advantage Fund | | | | |
| (cost $4,781,176) | | | | 4,781,176 c | | 4,781,176 |
| |
| |
| |
|
| |
| Total Investments (cost $205,334,492) | | 101.2% | | 246,856,860 |
| Liabilities, Less Cash and Receivables | | (1.2%) | | (2,936,528) |
| Net Assets | | | | 100.0% | | 243,920,332 |
| |
| ADR—American Depository Receipts. | | | | |
| a | | Non-income producing. | | | | | | |
| b | | All or a portion of these securities are on loan.At December 31, 2004, the total market value of the portfolio’s |
| | | securities on loan is $4,572,487 and the total market value of the collateral held by portfolio is $4,781,176. |
| c | | Investments in affiliated money market mutual funds. | | |
| |
| |
|
| |
| |
| Portfolio Summary † | | | | | | |
| | | | | Value (%) | | | | Value (%) |
| |
| |
| |
| |
|
| Financial | | 19.8 | | Consumer Staples | | 7.5 |
| Information Technology | | 18.3 | | Utilities | | 3.0 |
| Health Care | | 14.3 | | Money Market Investments | | 2.9 |
| Industrials | | 11.9 | | Materials | | 2.7 |
| Consumer Discretionary | | 9.8 | | Telecommunication Services | | 2.7 |
| Energy | | 8.3 | | | | 101.2 |
| |
| † | | Based on net assets. | | | | | | |
| See notes to financial statements. | | | | |
| |
| |
| 12 | | | | | | | | |
STATEMENT OF ASSETS AND LIABILITIES
December 31, 2004
| | | Cost | | Value |
| |
| |
|
| Assets ($): | | | | |
| Investments in securities—See Statement of | | |
| Investments (including securities on loan, | | |
| valued at $4,572,487)—Note 1(c): | | |
| Unaffiliated issuers | | 198,175,316 | | 239,697,684 |
| Affiliated issuers | | 7,159,176 | | 7,159,176 |
| Cash | | | | 37,691 |
| Receivable for investment securities sold | | 1,969,723 |
| Dividends and interest receivable | | | | 232,276 |
| Receivable for shares of Beneficial Interest subscribed | | 3,634 |
| Prepaid expenses | | | | 5,028 |
| | | | | 249,105,212 |
| |
| |
|
| Liabilities ($): | | | | |
| Due to The Dreyfus Corporation and affiliates—Note 3(b) | | 163,862 |
| Liability for securities on loan—Note 1(c) | | 4,781,176 |
| Payable for shares of Beneficial Interest redeemed | | 158,864 |
| Accrued expenses | | | | 80,978 |
| | | | | 5,184,880 |
| |
| |
|
| Net Assets ($) | | | | 243,920,332 |
| |
| |
|
| Composition of Net Assets ($): | | | | |
| Paid-in capital | | | | 242,223,849 |
| Accumulated undistributed investment income—net | | 43,620 |
| Accumulated net realized gain (loss) on investments | | (39,869,505) |
| Accumulated net unrealized appreciation | | |
| (depreciation) on investments | | | | 41,522,368 |
| |
| |
|
| Net Assets ($) | | | | 243,920,332 |
| |
| |
|
| |
| |
| Net Asset Value Per Share | | | | |
| | | Initial Shares | | Service Shares |
| |
| |
|
| Net Assets ($) | | 220,447,178 | | 23,473,154 |
| Shares Outstanding | | 10,301,753 | | 1,096,768 |
| |
| |
|
| Net Asset Value Per Share ($) | | 21.40 | | 21.40 |
See notes to financial statements.
|
STATEMENT OF OPERATIONS
Year Ended December 31, 2004
|
| Investment Income ($): | | |
| Income: | | |
| Cash dividends (net of $10,778 foreign taxes withheld at source): |
| Unaffiliated issuers | | 4,967,541 |
| Affiliated issuers | | 86,446 |
| Interest | | 8,177 |
| Income from securities lending | | 5,885 |
| Total Income | | 5,068,049 |
| Expenses: | | |
| Investment advisory fee—Note 3(a) | | 1,871,097 |
| Prospectus and shareholders’ reports | | 69,480 |
| Distribution fees—Note 3(b) | | 58,126 |
| Professional fees | | 31,366 |
| Custodian fees—Note 3(b) | | 22,920 |
| Trustees’ fees and expenses—Note 3(c) | | 21,038 |
| Shareholder servicing costs—Note 3(b) | | 11,404 |
| Dividends on securities sold short | | 4,860 |
| Loan commitment fees—Note 2 | | 2,132 |
| Miscellaneous | | 6,355 |
| Total Expenses | | 2,098,778 |
| Less—waiver of fees due to undertaking—Note 3(a) | | (15,375) |
| Less—reduction in custody fees | | |
| due to earnings credits—Note 1(c) | | (101) |
| Net Expenses | | 2,083,302 |
| Investment Income—Net | | 2,984,747 |
| |
|
| Realized and Unrealized Gain (Loss) on Investments—Note 4 ($): |
| Net realized gain (loss) on investments: | | |
| Long transactions | | 9,737,683 |
| Short sale transactions | | (103,550) |
| Net realized gain (loss) on financial futures | | 300,914 |
| Net Realized Gain (Loss) | | 9,935,047 |
| Net unrealized appreciation (depreciation) on investments | | |
| and securities sold short [including ($182,654) | | |
| net unrealized (depreciation) on financial futures] | | 3,922,915 |
| Net Realized and Unrealized Gain (Loss) on Investments | | 13,857,962 |
| Net Increase in Net Assets Resulting from Operations | | 16,842,709 |
See notes to financial statements.
|
STATEMENT OF CHANGES IN NET ASSETS
| | | Year Ended December 31, |
| |
|
| | | 2004 | | 2003 |
| |
| |
|
| Operations ($): | | | | |
| Investment income—net | | 2,984,747 | | 1,945,117 |
| Net realized gain (loss) on investments | | 9,935,047 | | (10,306,299) |
| Net unrealized appreciation | | | | |
| (depreciation) on investments | | 3,922,915 | | 66,060,660 |
| Net Increase (Decrease) in Net Assets | | | | |
| Resulting from Operations | | 16,842,709 | | 57,699,478 |
| |
| |
|
| Dividends to Shareholders from ($): | | | | |
| Investment income—net: | | | | |
| Initial shares | | (2,740,259) | | (1,830,941) |
| Service shares | | (220,109) | | (111,916) |
| Total Dividends | | (2,960,368) | | (1,942,857) |
| |
| |
|
| Beneficial Interest Transactions ($): | | | | |
| Net proceeds from shares sold: | | | | |
| Initial shares | | 9,133,233 | | 13,976,061 |
| Service shares | | 1,120,251 | | 2,244,742 |
| Dividends reinvested: | | | | |
| Initial shares | | 2,740,259 | | 1,830,941 |
| Service shares | | 220,109 | | 111,916 |
| Cost of shares redeemed: | | | | |
| Initial shares | | (47,893,005) | | (49,077,987) |
| Service shares | | (3,444,004) | | (3,617,039) |
| Increase (Decrease) in Net Assets from | | | | |
| Beneficial Interest Transactions | | (38,123,157) | | (34,531,366) |
| Total Increase (Decrease) in Net Assets | | (24,240,816) | | 21,225,255 |
| |
| |
|
| Net Assets ($): | | | | |
| Beginning of Period | | 268,161,148 | | 246,935,893 |
| End of Period | | 243,920,332 | | 268,161,148 |
| Undistributed investment income—net | | 43,620 | | 19,241 |
STATEMENT OF CHANGES IN NET ASSETS (continued)
|
| | | Year Ended December 31, |
| |
|
| | | 2004 | | 2003 |
| |
| |
|
| Capital Share Transactions: | | | | |
| Initial Shares | | | | |
| Shares sold | | 451,117 | | 795,436 |
| Shares issued for dividends reinvested | | 133,226 | | 103,244 |
| Shares redeemed | | (2,382,304) | | (2,906,671) |
| Net Increase (Decrease) in Shares Outstanding | | (1,797,961) | | (2,007,991) |
| |
| |
|
| Service Shares | | | | |
| Shares sold | | 55,328 | | 131,364 |
| Shares issued for dividends reinvested | | 10,725 | | 6,527 |
| Shares redeemed | | (169,880) | | (209,369) |
| Net Increase (Decrease) in Shares Outstanding | | (103,827) | | (71,478) |
See notes to financial statements.
|
The following tables describe the performance for each share class for the fiscal periods indicated.All information (except portfolio turnover rate) reflects financial results for a single portfolio share.Total return shows how much your investment in the portfolio would have increased (or decreased) during each period, assuming you had reinvested all dividends and distributions.These figures have been derived from the portfolio’s financial statements.
| | | | | Year Ended December 31, | | |
| |
| |
| |
|
| Initial Shares | | 2004 | | 2003 | | 2002 | | 2001 | | 2000 |
| |
| |
| |
| |
| |
|
| Per Share Data ($): | | | | | | | | | | |
| Net asset value, beginning of period | | 20.16 | | 16.06 | | 21.65 | | 23.48 | | 25.48 |
| Investment Operations: | | | | | | | | | | |
| Investment income—net a | | .24 | | .14 | | .11 | | .11 | | .14 |
| Net realized and unrealized | | | | | | | | | | |
| gain (loss) on investments | | 1.25 | | 4.11 | | (5.59) | | (1.49) | | (1.10) |
| Total from Investment Operations | | 1.49 | | 4.25 | | (5.48) | | (1.38) | | (.96) |
| Distributions: | | | | | | | | | | |
| Dividends from investment income—net | | (.25) | | (.15) | | (.11) | | (.11) | | (.15) |
| Dividends from net realized | | | | | | | | | | |
| gain on investments | | — | | — | | — | | (.11) | | (.89) |
| Dividends in excess of net | | | | | | | | | | |
| realized gain on investments | | — | | — | | — | | (.23) | | — |
| Total Distributions | | (.25) | | (.15) | | (.11) | | (.45) | | (1.04) |
| Net asset value, end of period | | 21.40 | | 20.16 | | 16.06 | | 21.65 | | 23.48 |
| |
| |
| |
| |
| |
|
| Total Return (%) | | 7.47 | | 26.57 | | (25.33) | | (5.85) | | (3.78) |
| |
| |
| |
| |
| |
|
| Ratios/Supplemental Data (%): | | | | | | | | | | |
| Ratio of total expenses | | | | | | | | | | |
| to average net assets | | .82 | | .82 | | .80 | | .80 | | .78 |
| Ratio of net expenses | | | | | | | | | | |
| to average net assets | | .82 | | .82 | | .80 | | .80 | | .78 |
| Ratio of net investment income | | | | | | | | | | |
| to average net assets | | 1.21 | | .81 | | .58 | | .48 | | .56 |
| Portfolio Turnover Rate | | 52.74 | | 40.68 | | 34.61 | | 33.82 | | 60.90 |
| |
| |
| |
| |
| |
|
| Net Assets, end of period ($ x 1,000) | | 220,447 | | 243,973 | | 226,548 | | 385,569 | | 437,407 |
a Based on average shares outstanding at each month end.
See notes to financial statements.
|
FINANCIAL HIGHLIGHTS (continued)
|
| | | | | | | Year Ended December 31, | | |
| | | |
| |
| |
|
| Service Shares | | 2004 | | 2003 | | 2002 | | 2001 | | 2000 a |
| |
| |
| |
| |
| |
|
| Per Share Data ($): | | | | | | | | | | |
| Net asset value, beginning of period | | 20.15 | | 16.03 | | 21.61 | | 23.48 | | 23.48 |
| Investment Operations: | | | | | | | | | | |
| Investment income—net | | .21b | | .11b | | .08b | | .06b | | — |
| Net realized and unrealized | | | | | | | | | | |
| gain (loss) on investments | | 1.24 | | 4.10 | | (5.58) | | (1.51) | | — |
| Total from Investment Operations | | 1.45 | | 4.21 | | (5.50) | | (1.45) | | — |
| Distributions: | | | | | | | | | | |
| Dividends from investment income—net | | (.20) | | (.09) | | (.08) | | (.08) | | — |
| Dividends from net realized | | | | | | | | | | |
| gain on investments | | — | | — | | — | | (.11) | | — |
| Dividends in excess of net realized | | | | | | | | | | |
| gain on investments | | — | | — | | — | | (.23) | | — |
| Total Distributions | | (.20) | | (.09) | | (.08) | | (.42) | | — |
| Net asset value, end of period | | 21.40 | | 20.15 | | 16.03 | | 21.61 | | 23.48 |
| |
| |
| |
| |
| |
|
| Total Return (%) | | 7.22 | | 26.36 | | (25.46) | | (6.14) | | — |
| |
| |
| |
| |
| |
|
| Ratios/Supplemental Data (%): | | | | | | | | | | |
| Ratio of total expenses | | | | | | | | | | |
| to average net assets | | 1.07 | | 1.07 | | 1.03 | | 1.12 | | — |
| Ratio of net expenses | | | | | | | | | | |
| to average net assets | | 1.00 | | 1.01 | | .98 | | 1.01 | | — |
| Ratio of net investment income | | | | | | | | | | |
| to average net assets | | 1.05 | | .63 | | .43 | | .28 | | — |
| Portfolio Turnover Rate | | 52.74 | | 40.68 | | 34.61 | | 33.82 | | 60.90 |
| |
| |
| |
| |
| |
|
| Net Assets, end of period ($ x 1,000) | | 23,473 | | 24,188 | | 20,388 | | 16,185 | | 1 |
| |
| a | | The portfolio commenced offering Service shares on December 31, 2000. | | | | | | |
| b | | Based on average shares outstanding at each month end. | | | | | | | | |
| See notes to financial statements. | | | | | | | | | | |
NOTES TO FINANCIAL STATEMENTS
NOTE 1—Significant Accounting Policies:
Dreyfus Variable Investment Fund (the “fund”) is registered under the Investment Company Act of 1940, as amended (the “Act”), as an open-end management investment company, operating as a series company currently offering twelve series, including the Growth and Income Portfolio (the “portfolio”). The portfolio is only offered to separate accounts established by insurance companies to fund variable annuity contracts and variable life insurance policies.The portfolio is a non-diversified series.The portfolio’s investment objective is to provide long-term capital growth, current income and growth of income, consistent with reasonable investment risk. The Dreyfus Corporation (the “Manager” or “Dreyfus”) serves as the portfolio’s investment adviser. The Manager is a wholly-owned subsidiary of Mellon Financial Corporation (“Mellon Financial”).
Dreyfus Service Corporation (the “Distributor”), a wholly-owned subsidiary of the Manager, is the distributor of the portfolio’s shares, which are sold without a sales charge.The portfolio is authorized to issue an unlimited number of $.001 par value shares of Beneficial Interest in each of the following classes of shares: Initial and Service. Each class of shares has identical rights and privileges, except with respect to the distribution plan and the expenses borne by each class and certain voting rights. Income, expenses (other than expenses attributable to a specific class), and realized and unrealized gains or losses on investments are allocated to each class of shares based on its relative net assets.
The fund accounts separately for the assets, liabilities and operations of each series. Expenses directly attributable to each series are charged to that series’ operations; expenses which are applicable to all series are allocated among them on a pro rata basis.
The portfolio’s financial statements are prepared in accordance with U.S. generally accepted accounting principles, which may require the use of management estimates and assumptions.Actual results could differ from those estimates.
NOTES TO FINANCIAL STATEMENTS (continued)
|
The fund enters into contracts that contain a variety of indemnifica-tions.The portfolio’s maximum exposure under these arrangements is unknown. The portfolio does not anticipate recognizing any loss related to these arrangements.
(a) Portfolio valuation: Investments in securities are valued at the last sales price on the securities exchange or national securities market on which such securities are primarily traded. Securities listed on the National Market System for which market quotations are available are valued at the official closing price or, if there is no official closing price that day, at the last sale price. Securities not listed on an exchange or the national securities market, or securities for which there were no transactions, are valued at the average of the most recent bid and asked prices, except for open short positions, where the asked price is used for valuation purposes. Bid price is used when no asked price is available. Investments in registered investment companies are valued at their net asset value. When market quotations or official closing prices are not readily available, or are determined not to reflect accurately fair value, such as when the value of a security has been significantly affected by events after the close of the exchange or market on which the security is principally traded (for example, a foreign exchange or market), but before the portfolio calculates its net asset value, the portfolio may value these investments at fair value as determined in accordance with the procedures approved by the Board of Trustees. Fair valuing of securities may be determined with the assistance of a pricing service using calculations based on indices of domestic securities and other appropriate indicators, such as prices of relevant ADR’s and futures contracts. For other securities that are fair valued by the Board of Trustees, certain factors may be considered such as: fundamental analytical data, the nature and duration of restrictions on disposition, an evaluation of the forces that influence the market in which the securities are purchased and sold, and public trading in similar securities of the issuer or comparable issuers. Investments denominated in foreign currencies are translated to U.S. dollars at the prevailing rates of exchange. Forward currency exchange contracts are valued at the forward rate.
(b) Foreign currency transactions: The portfolio does not isolate that portion of the results of operations resulting from changes in foreign exchange rates on investments from the fluctuations arising from changes in the market prices of securities held. Such fluctuations are included with the net realized and unrealized gain or loss on investments.
Net realized foreign exchange gains or losses arise from sales and maturities of short-term securities, sales of foreign currencies, currency gains or losses realized on securities transactions and the difference between the amounts of dividends, interest and foreign withholding taxes recorded on the portfolios’ books and the U.S. dollar equivalent of the amounts actually received or paid. Net unrealized foreign exchange gains and losses arise from changes in the value of assets and liabilities other than investments in securities, resulting from changes in exchange rates. Such gains and losses are included with net realized and unrealized gain or loss on investments.
(c) Securities transactions and investment income: Securities transactions are recorded on a trade date basis. Realized gain and loss from securities transactions are recorded on the identified cost basis. Dividend income is recognized on the ex-dividend date and interest income, including, where applicable, accretion of discount and amortization of premium on investments, is recognized on the accrual basis.
The portfolio has an arrangement with the custodian bank whereby the portfolio receives earnings credits from the custodian when positive cash balances are maintained, which are used to offset custody fees. For financial reporting purposes, the portfolio includes net earnings credits as an expense offset in the Statement of Operations.
Pursuant to a securities lending agreement with Mellon Bank, N.A., an affiliate of the Manager, the portfolio may lend securities to qualified institutions.At origination, all loans are secured by collateral of at least 102% of the value of U.S. securities loaned and 105% of the value of foreign securities loaned. Collateral equivalent to at least 100% of the
NOTES TO FINANCIAL STATEMENTS (continued)
|
market value of securities on loan will be maintained at all times. Cash collateral is invested in certain money market mutual funds managed by the Manager. The portfolio will be entitled to receive all income on securities loaned, in addition to income earned as a result of the lending transaction.Although each security loaned is fully collateralized, the portfolio would bear the risk of delay in recovery of, or loss of rights in, the securities loaned should a borrower fail to return the securities in a timely manner.
(d) Affiliated issuers: Investments in other investment companies advised by the Manager are defined as “affiliated” in the Act.
(e) Dividends to shareholders: Dividends are recorded on the ex-dividend date.The portfolio declares and pays dividends from investment income-net on a quarterly basis. Dividends from net realized capital gain, if any, are normally declared and paid annually, but the portfolio may make distributions on a more frequent basis to comply with the distribution requirements of the Internal Revenue Code of 1986, as amended (the “Code”).To the extent that net realized capital gain can be offset by capital loss carryovers, it is the policy of the portfolio not to distribute such gain. Income and capital gain distributions are determined in accordance with income tax regulations, which may differ from U.S. generally accepted accounting principles.
(f) Federal income taxes: It is the policy of the portfolio to continue to qualify as a regulated investment company, if such qualification is in the best interests of its shareholders, by complying with the applicable provisions of the Code and to make distributions of taxable income sufficient to relieve it from substantially all federal income and excise taxes.
At December 31, 2004, the components of accumulated earnings on a tax basis were as follows: undistributed ordinary income $43,620, accumulated capital losses $39,279,033 and unrealized appreciation $40,931,896.
The accumulated capital loss carryover is available to be applied against future net securities profits, if any, realized subsequent to December 31, 2004. If not applied, $25,027,652 of the carryover expires in fiscal 2010 and $14,251,381 expires in fiscal 2011.
The tax character of distributions paid to shareholders during the fiscal periods ended December 31, 2004 and December 31, 2003, were as follows: ordinary income $2,960,368 and $1,942,857, respectively.
NOTE 2—Bank Line of Credit:
|
The portfolio participates with other Dreyfus-managed funds in a $350 million redemption credit facility (the “Facility”) to be utilized for temporary or emergency purposes, including the financing of redemptions. In connection therewith, the portfolio has agreed to pay commitment fees on its pro rata portion of the Facility. Interest is charged to the portfolio based on prevailing market rates in effect at the time of borrowings. During the period ended December 31, 2004, the portfolio did not borrow under the Facility.
NOTE 3—Investment Advisory Fee and Other Transactions With Affiliates:
(a) Pursuant to an Investment Advisory Agreement with the Manager, the investment advisory fee is computed at the annual rate of .75 of 1% of the value of the portfolios’ average daily net assets and is payable monthly.
The Manager has agreed, from January 1, 2004 to December 31, 2005 to waive receipt of its fees and/or assume the expenses of the portfolio so that the expenses of neither class, exclusive of taxes, brokerage fees, interest on borrowings, commitment fees and extraordinary expenses, exceed 1% of the value of the average daily net assets of their class. During the period ended December 31, 2004, the Manager waived receipt of fees of $15,375, pursuant to the undertaking.
NOTES TO FINANCIAL STATEMENTS (continued)
|
(b) Under the Distribution Plan (the “Plan”) adopted pursuant to Rule 12b-1 under the Act, Service shares pay the Distributor for distributing their shares, for servicing and/or maintaining Service shares shareholder accounts and for advertising and marketing for Service shares.The Plan provides for payments to be made at an annual rate of .25 of 1% of the value of the Service shares’ average daily net assets. The Distributor may make payments to Participating Insurance Companies and to brokers and dealers acting as principal underwriter for their variable insurance products.The fees payable under the Plan are payable without regard to actual expenses incurred. During the period ended December 31, 2004, Service shares were charged $58,126 pursuant to the Plan.
The portfolio compensates Dreyfus Transfer, Inc., a wholly-owned subsidiary of the Manager, under a transfer agency agreement for providing personnel and facilities to perform transfer agency services for the portfolio. During the period ended December 31, 2004, the portfolio was charged $431 pursuant to the transfer agency agreement.
The portfolio compensates Mellon Bank, N.A., an affiliate of the Manager, under a custody agreement for providing custodial services for the portfolio. During the period ended December 31, 2004, the portfolio was charged $22,920 pursuant to the custody agreement.
The components of Due to The Dreyfus Corporation and affiliates in the Statement of Assets and Liabilities consist of: investment advisory fees $154,333, Rule 12b-1 distribution plan fees $4,949, custodian fees $4,512 and transfer agency per account fees $68.
(c) Each Board member also serves as a Board member of other funds within the Dreyfus complex. Annual retainer fees and attendance fees are allocated to each fund based on net assets.
(d) Pursuant to an exemptive order from the Securities and Exchange Commission, the portfolio may invest its available cash balances in affiliated money market mutual funds. Management fees of the underlying money market mutual funds have been waived by the Manager.
NOTE 4—Securities Transactions:
The following summarizes the aggregate amount of purchases and sales of investment securities and securities sold short, excluding short-term securities and financial futures, during the period ended
| | | | | | | |
| December 31, 2004: | | | | | | |
| | | | | Purchases ($) | | Sales ($) |
| |
| |
| |
|
| Long transactions | | | | 127,041,531 | | 158,705,998 |
| Short sale transactions | | | | 848,340 | | — |
| Total | | | | 127,889,871 | | 158,705,998 |
The portfolio is engaged in short-selling which obligates the portfolio to replace the security borrowed by purchasing the security at current market value.The portfolio would incur a loss if the price of the security increases between the date of the short sale and the date on which the portfolio replaces the borrowed security.The portfolio would realize a gain if the price of the security declines between those dates. Until the portfolio replaces the borrowed security, the portfolio will maintain daily, a segregated account with a broker, of permissible liquid assets sufficient to cover its short position.At December 31, 2004, there were no securities sold short outstanding.
The portfolio may invest in financial futures contracts in order to gain exposure to or protect against changes in the market. The portfolio is exposed to market risk as a result of changes in the value of the underlying financial instruments. Investments in financial futures require the portfolio to “mark to market” on a daily basis, which reflects the change in market value of the contracts at the close of each day’s trading. Accordingly, variation margin payments are received or made to reflect daily unrealized gains or losses.When the contracts are closed, the portfolio recognizes a realized gain or loss.These investments require initial margin deposits with a broker, which consist of cash or cash equivalents, up to approximately 10% of the contract amount.The amount of these deposits is determined by the exchange or Board of Trade on which the contract is traded and is subject to change.At December 31, 2004, there were no financial futures contracts oustanding.
NOTES TO FINANCIAL STATEMENTS (continued)
|
At December 31, 2004, the cost of investments for federal income tax purposes was $205,924,964; accordingly, accumulated net unrealized appreciation on investments was $40,931,896, consisting of $46,707,347 gross unrealized appreciation and $5,775,451 gross unrealized depreciation.
In early 2004, two purported class and derivative actions were filed against Mellon Financial, Mellon Bank, N.A., Dreyfus, Founders Asset Management LLC, and certain directors of the Dreyfus Funds and the Dreyfus Founders Funds (together, the “Funds”). In September 2004, plaintiffs served a Consolidated Amended Complaint (the “Amended Complaint”) on behalf of a purported class of all persons who acquired interests in any of the Funds between January 30, 1999 and November 17, 2003, and derivatively on behalf of the Funds. The Amended Complaint in the newly styled In re Dreyfus Mutual Funds Fee Litigation also named the Distributor, Premier Mutual Fund Services, Inc. and two additional Fund directors as defendants and alleges violations of the Investment Company Act of 1940, the Investment Advisers Act of 1940, the Pennsylvania Unfair Trade Practices and Consumer Protection Law and common-law claims. Plaintiffs seek to recover allegedly improper and excessive Rule 12b-1 and advisory fees allegedly charged to the Funds for marketing and distribution services. More specifically, plaintiffs claim, among other things, that 12b-1 fees and directed brokerage were improperly used to pay brokers to recommend the Funds over other funds, and that such payments were not disclosed to investors. In addition, plaintiffs assert that economies of scale and soft-dollar benefits were not passed on to the Funds. Plaintiffs further allege that 12b-1 fees were improperly charged to certain of the Funds that were closed to new investors.The Amended Complaint seeks compensatory and punitive damages,
rescission of the advisory contracts, and an accounting and restitution of any unlawful fees, as well as an award of attorneys’ fees and litigation expenses. As noted, some of the claims in this litigation are asserted derivatively on behalf of the Funds that have been named as nominal defendants.With respect to such derivative claims, no relief is sought against the Funds. Dreyfus believes the allegations to be totally without merit and intends to defend the action vigorously. Defendants filed motions to dismiss the Amended Complaint on November 12, 2004, and those motions are pending.
Additional lawsuits arising out of these circumstances and presenting similar allegations and requests for relief may be filed against the defendants in the future. Neither Dreyfus nor the Funds believe that any of the pending actions will have a material adverse effect on the Funds or Dreyfus’ ability to perform its contract with the Funds.
| REPORT OF INDEPENDENT REGISTERED |
| PUBLIC ACCOUNTING FIRM |
Shareholders and Board of Trustees
Dreyfus Variable Investment Fund, Growth and Income Portfolio
We have audited the accompanying statement of assets and liabilities, including the statement of investments, of Dreyfus Variable Investment Fund, Growth and Income Portfolio (one of the funds comprising Dreyfus Variable Investment Fund) as of December 31, 2004 and the related statement of operations for the year then ended, the statement of changes in net assets for each of the two years in the period then ended, and financial highlights for each of the periods indicated therein.These financial statements and financial highlights are the responsibility of the Fund’s management. Our responsibility is to express an opinion on these financial statements and financial highlights based on our audits.
We conducted our audits in accordance with the standards of the Public Company Accounting Oversight Board (United States).Those standards require that we plan and perform the audit to obtain reasonable assurance about whether the financial statements and financial highlights are free of material misstatement. An audit includes examining, on a test basis, evidence supporting the amounts and disclosures in the financial statements and financial highlights. Our procedures included verification by examination of securities held by the custodian as of December 31, 2004 and confirmation of securities not held by the custodian by correspondence with others. An audit also includes assessing the accounting principles used and significant estimates made by management, as well as evaluating the overall financial statement presentation.We believe that our audits provide a reasonable basis for our opinion.
In our opinion, the financial statements and financial highlights referred to above present fairly, in all material respects, the financial position of Dreyfus Variable Investment Fund, Growth and Income Portfolio at December 31, 2004, the results of its operations for the year then ended, the changes in its net assets for each of the two years in the period then ended, and the financial highlights for each of the indicated periods, in conformity with U.S. generally accepted accounting principles.

New York, New York
February 4, 2005
|
IMPORTANT TAX IMFORMATION (Unaudited)
For federal tax purposes, the portfolio designates 100% of the ordinary dividends paid during the fiscal year ended December 31, 2004 as qualifying for the corporate dividends received deduction. Shareholders will receive notification in January 2005 of the percentage applicable to the preparation of their 2004 income tax returns.
BOARD MEMBERS INFORMATION (Unaudited)
Joseph S. DiMartino (61)
Chairman of the Board (1995)
|
Principal Occupation During Past 5 Years:
• Corporate Director and Trustee
|
Other Board Memberships and Affiliations:
|
- The Muscular Dystrophy Association, Director
- Levcor International, Inc., an apparel fabric processor, Director
- Century Business Services, Inc., a provider of outsourcing functions for small and medium size companies, Director
- The Newark Group, a provider of a national market of paper recovery facilities, paperboard mills and paperboard converting plants, Director
- Azimuth Trust, an institutional asset management firm, Member of Board of Managers and Advisory Board
No. of Portfolios for which Board Member Serves: 186
David P. Feldman (65)
Board Member (1994)
|
Principal Occupation During Past 5 Years:
• Corporate Director and Trustee
|
Other Board Memberships and Affiliations:
|
- BBH Mutual Funds Group (11 funds), Director
- The Jeffrey Company, a private investment company, Director
- QMED, a medical device company, Director
No. of Portfolios for which Board Member Serves: 51
———————
James F. Henry (74) Board Member (1990)
Principal Occupation During Past 5 Years:
|
- President, CPR Institute for Dispute Resolution, a non-profit organization principally engaged in the development of alternatives to business litigation (Retired 2003)
No. of Portfolios for which Board Member Serves: 22
|
———————
Rosalind Gersten Jacobs (79) Board Member (1990)
Principal Occupation During Past 5 Years:
• Merchandise and marketing consultant
|
No. of Portfolios for which Board Member Serves: 33
|
Dr. Paul A. Marks (78)
Board Member (1990)
|
Principal Occupation During Past 5 Years:
• President and Chief Executive Officer of Memorial Sloan-Kettering Cancer Center (Retired 1999)
Other Board Memberships and Affiliations:
- Pfizer, Inc., a pharmaceutical company, Director-Emeritus
- Atom Pharm, Director
- Lazard Freres & Company, LLC, Senior Adviser
- Merck, Consultant
No. of Portfolios for which Board Member Serves: 22
Dr. Martin Peretz (65)
Board Member (1990)
|
Principal Occupation During Past 5 Years:
- Editor-in-Chief of The New Republic Magazine
- Lecturer in Social Studies at Harvard University (1965-2001)
- Co-Chairman of TheStreet.com, a financial daily on the web
Other Board Memberships and Affiliations:
- Academy for Liberal Education, an accrediting agency for colleges and universities certified by the U.S. Department of Education, Director
- Digital Learning Group, LLC, an online publisher of college textbooks, Director
- Harvard Center for Blood Research,Trustee
- Bard College,Trustee
- YIVO Institute for Jewish Research,Trustee
No. of Portfolios for which Board Member Serves: 22
Bert W.Wasserman (72)
Board Member (1993)
|
Principal Occupation During Past 5 Years:
• Financial Consultant
Other Board Memberships and Affiliations:
• Lillian Vernon Corporation, Director
No. of Portfolios for which Board Member Serves: 22
———————
Once elected all Board Members serve for an indefinite term.The address of the Board Members and Officers is in c/o The Dreyfus Corporation, 200 Park Avenue, New York, New York 10166.Additional information about the Board Members is available in the fund’s Statement of Additional Information which can be obtained from Dreyfus free of charge by calling this toll free number: 1-800-554-4611.
John M. Fraser, Jr., Emeritus Board Member Irving Kristol, Emeritus Board Member
OFFICERS OF THE FUND (Unaudited)
| STEPHEN E. CANTER, President since | | MICHAEL A. ROSENBERG, Secretary since |
| March 2000. | | March 2000. |
| Chairman of the Board, Chief Executive | | Associate General Counsel of the Manager, |
| Officer and Chief Operating Officer of the | | and an officer of 90 investment companies |
| Manager, and an officer of 92 investment | | (comprised of 194 portfolios) managed by the |
| companies (comprised of 185 portfolios) | | Manager. He is 44 years old and has been an |
| managed by the Manager. Mr. Canter also is a | | employee of the Manager since October 1991. |
| |
| Board member and, where applicable, an | | ROBERT R. MULLERY, Assistant Secretary |
| Executive Committee Member of the other | | since March 2000. |
| investment management subsidiaries of Mellon | | |
| Financial Corporation, each of which is an | | Associate General Counsel of the Manager, |
| affiliate of the Manager. He is 59 years old and | | and an officer of 26 investment companies |
| has been an employee of the Manager since | | (comprised of 60 portfolios) managed by the |
| May 1995. | | Manager. He is 52 years old and has been an |
| | | employee of the Manager since May 1986. |
| STEPHEN R. BYERS, Executive Vice | | |
| President since November 2002. | | STEVEN F. NEWMAN, Assistant Secretary |
| | | since March 2000. |
| Chief Investment Officer,Vice Chairman and a | | |
| director of the Manager, and an officer of 92 | | Associate General Counsel and Assistant |
| investment companies (comprised of 185 | | Secretary of the Manager, and an officer of 93 |
| portfolios) managed by the Manager. Mr. Byers | | investment companies (comprised of 201 |
| also is an officer, director or an Executive | | portfolios) managed by the Manager. He is 55 |
| Committee Member of certain other | | years old and has been an employee of the |
| investment management subsidiaries of Mellon | | Manager since July 1980. |
| Financial Corporation, each of which is an | | JAMES WINDELS, Treasurer since |
| affiliate of the Manager. He is 51 years old and | | November 2001. |
| has been an employee of the Manager since | | |
| January 2000. Prior to joining the Manager, he | | Director – Mutual Fund Accounting of the |
| served as an Executive Vice President-Capital | | Manager, and an officer of 93 investment |
| Markets, Chief Financial Officer and Treasurer | | companies (comprised of 201 portfolios) |
| at Gruntal & Co., L.L.C. | | managed by the Manager. He is 46 years old |
| | | and has been an employee of the Manager |
| MARK N. JACOBS, Vice President since | | since April 1985. |
| March 2000. | | |
| | | RICHARD CASSARO, Assistant Treasurer |
| Executive Vice President, Secretary and | | since August 2003. |
| General Counsel of the Manager, and an | | |
| officer of 93 investment companies (comprised | | Senior Accounting Manager – Equity Funds of |
| of 201 portfolios) managed by the Manager. | | the Manager, and an officer of 26 investment |
| He is 58 years old and has been an employee | | companies (comprised of 102 portfolios) |
| of the Manager since June 1977. | | managed by the Manager. He is 44 years old |
| | | and has been an employee of the Manager |
| | | since September 1982. |
32
| ERIK D. NAVILOFF, Assistant Treasurer | | JOSEPH W. CONNOLLY, Chief Compliance |
| since December 2002. | | Officer since October 2004. |
| Senior Accounting Manager – Taxable Fixed | | Chief Compliance Officer of the Manager and |
| Income Funds of the Manager, and an officer | | The Dreyfus Family of Funds (93 investment |
| of 19 investment companies (comprised of 75 | | companies, comprising 201 portfolios). From |
| portfolios) managed by the Manager. He is 36 | | November 2001 through March 2004, Mr. |
| years old and has been an employee of the | | Connolly was first Vice-President, Mutual |
| Manager since November 1992. | | Fund Servicing for Mellon Global Securities |
| |
| ROBERT ROBOL, Assistant Treasurer | | Services. In that capacity, Mr. Connolly was |
| since August 2003. | | responsible for managing Mellon’s Custody, |
| | | Fund Accounting and Fund Administration |
| Senior Accounting Manager – Money Market | | services to third-party mutual fund clients. He |
| Funds of the Manager, and an officer of 39 | | is 47 years old and has served in various |
| investment companies (comprised of 84 | | capacities with the Manager since 1980, |
| portfolios) managed by the Manager. He is 40 | | including manager of the firm’s Fund |
| years old and has been an employee of the | | Accounting Department from 1997 through |
| Manager since October 1988. | | October 2001. |
| |
| ROBERT SVAGNA, Assistant Treasurer | | WILLIAM GERMENIS, Anti-Money |
| since December 2002. | | Laundering Compliance Officer since |
| Senior Accounting Manager – Equity Funds of | | September 2002. |
| the Manager, and an officer of 27 investment | | Vice President and Anti-Money Laundering |
| companies (comprised of 107 portfolios) | | Compliance Officer of the Distributor, and the |
| managed by the Manager. He is 37 years old | | Anti-Money Laundering Compliance Officer |
| and has been an employee of the Manager | | of 88 investment companies (comprised of 196 |
| since November 1990. | | portfolios) managed by the Manager. He is 34 |
| KENNETH J. SANDGREN, Assistant | | years old and has been an employee of the |
| Treasurer since November 2001. | | Distributor since October 1998. |
| Mutual Funds Tax Director of the Manager, | | |
| and an officer of 93 investment companies | | |
| (comprised of 201 portfolios) managed by the | | |
| Manager. He is 50 years old and has been an | | |
| employee of the Manager since June 1993. | | |
The Portfolio 33
For More Information
| Dreyfus Variable | | Transfer Agent & |
| |
| Investment Fund, | | Dividend Disbursing Agent |
| |
| Growth and Income Portfolio |
| | | Dreyfus Transfer, Inc. |
| 200 Park Avenue | | |
| | | 200 Park Avenue |
| New York, NY 10166 | | |
| | | New York, NY 10166 |
| |
| |
| Investment Adviser | | Distributor |
| |
| The Dreyfus Corporation | | |
| | | Dreyfus Service Corporation |
| 200 Park Avenue | | |
| | | 200 Park Avenue |
| New York, NY 10166 | | |
| | | New York, NY 10166 |
| |
| Custodian | | |
| |
| Mellon Bank, N.A. | | |
| |
| One Mellon Bank Center | | |
| |
| Pittsburgh, PA 15258 | | |
Telephone 1-800-554-4611 or 516-338-3300
Mail The Dreyfus Family of Funds, 144 Glenn Curtiss Boulevard, Uniondale, NY 11556-0144 Attn: Institutional Servicing
The portfolio files its complete schedule of portfolio holdings with the Securities and
Exchange Commission (“SEC”) for the first and third quarters of each fiscal year on Form N-Q. The portfolio’s Forms N-Q are available on the SEC’s website at http://www.sec.gov and may be reviewed and copied at the SEC’s Public Reference Room in Washington, DC. Information on the operation of the Public Reference Room may be obtained by calling 1-800-SEC-0330.
A description of the policies and procedures that the portfolio uses to determine how to vote proxies relating to portfolio securities, and information regarding how the portfolio voted these proxies for the 12-month period ended June 30, 2004, is available through the portfolio’s website at http://www.dreyfus.com and on the SEC’s website at http://www.sec.gov. The description of the policies and procedures is also available without charge, upon request, by calling 1-800-645-6561.

© 2005 Dreyfus Service Corporation
| Dreyfus Variable |
| Investment Fund, |
| International |
| Equity Portfolio |
| ANNUAL REPORT December 31, 2004 |

The views expressed in this report reflect those of the portfolio manager only through the end of the period covered and do not necessarily represent the views of Dreyfus or any other person in the Dreyfus organization.Any such views are subject to change at any time based upon market or other conditions and Dreyfus disclaims any responsibility to update such views. These views may not be relied on as investment advice and, because investment decisions for a Dreyfus portfolio are based on numerous factors, may not be relied on as an indication of trading intent on behalf of any Dreyfus portfolio.
Not FDIC-Insured • Not Bank-Guaranteed • May Lose Value
| | | Contents |
| |
| | | T H E P O R T F O L I O |
| |
|
| 2 | | Letter from the Chairman |
| 3 | | Discussion of Performance |
| 6 | | Portfolio Performance |
| 8 | | Understanding Your Portfolio’s Expenses |
| 8 | | Comparing Your Portfolio’s Expenses |
| | | With Those of Other Funds |
| 9 | | Statement of Investments |
| 14 | | Statement of Assets and Liabilities |
| 15 | | Statement of Operations |
| 16 | | Statement of Changes in Net Assets |
| 18 | | Financial Highlights |
| 20 | | Notes to Financial Statements |
| 29 | | Report of Independent Registered |
| | | Public Accounting Firm |
| 30 | | Important Tax Information |
| 31 | | Board Members Information |
| 33 | | Officers of the Fund |
| | | F O R M O R E I N F O R M AT I O N |
| |
|
| | | Back Cover |
| Dreyfus Variable Investment Fund, |
| International Equity Portfolio |

LETTER FROM THE CHAIRMAN
We are pleased to present this annual report for Dreyfus Variable Investment Fund, International Equity Portfolio, covering the 12-month period from January 1, 2004, through December 31, 2004. Inside, you’ll find valuable information about how the portfolio was managed during the reporting period, including a discussion with the portfolio manager, Paul Butler.
2004 represented another year of positive international stock market performance. Unlike the 2003 rally, however, in which most stocks rose as global business conditions generally improved, 2004’s market performance largely reflected the strengths and weakness of individual companies, industries and markets. As a result, fundamental research and professional judgment became more important determinants of international equity performance in 2004.
What’s ahead for the world’s stock markets in 2005? No one knows for certain. Positive influences remain in place, including moderately expanding U.S. and global economies and low inflation. Nonetheless, a number of risks — such as currency fluctuation and global terrorism — could threaten the market environment.
As always, we urge our shareholders to view the financial markets from a long-term perspective, measured in years rather than weeks or months. One of the best ways to ensure a long-term perspective is to establish an investment plan with the help of your financial advisor, and review it periodically to track your progress toward your financial goals.
Thank you for your continued confidence and support.

DISCUSSION OF PERFORMANCE
Paul Butler, Portfolio Manager
|
How did Dreyfus Variable Investment Fund, International Equity Portfolio perform relative to its benchmark?
For the 12-month period ended December 31, 2004, the portfolio produced total returns of 24.57% for its Initial shares and 24.20% for its Service shares.1 This compares with a 20.25% total return produced by the portfolio’s benchmark, the Morgan Stanley Capital International Europe, Australasia, Far East Index (“MSCI EAFE Index”), for the same period.2 In addition, the fund is reported in the Lipper International Core category. Over the reporting period, the average total for all funds reported in the category was 17.93% .3
International stock markets moved higher over the reporting period as the global economy strengthened in response to the rapid industrialization of formerly third-world economies.The portfolio produced higher returns than its benchmark and Lipper category average, primarily due to the success of its security selection strategy, including an emphasis on companies serving domestic markets in Asia and Latin America.
What is the portfolio’s investment approach?
The portfolio seeks capital growth. To pursue its goal, the portfolio primarily invests in growth stocks of foreign companies. Normally, the portfolio invests at least 80% of its assets in stocks, including common stocks, preferred stocks and convertible securities, including those purchased in initial public offerings.
The portfolio focuses on individual stock selection.We do not attempt to predict interest rates or market movements, nor do we have country allocation models or targets. Rather, we choose investments on a company-by-company basis, searching for what we believe are well-managed, well-positioned companies, wherever they may be.
In choosing stocks, the portfolio establishes a global framework within which to select investments.This involves identifying and forecasting key trends in global economic variables, such as gross domestic product, inflation and interest rates; investment themes, such as the impact of new technologies and the globalization of industries and brands; relative values of equity securities, bonds and cash; and long-term trends in currency movements.
DISCUSSION OF PERFORMANCE (continued)
|
Within the markets and sectors determined to be relatively attractive, the portfolio seeks what it believes to be attractively priced companies that possess a sustainable competitive advantage in their market or sector. The portfolio generally will sell securities when themes or strategies change, or when the portfolio determines that the company’s prospects have changed, or if the portfolio believes that the company’s stock is fully valued by the market.
What other factors influenced the portfolio’s performance?
The portfolio was influenced by stronger economic growth throughout the world and the effects of a weakening U.S. dollar relative to other major currencies. Global growth was driven by the transformation of China and India into major global trading partners. In fact, rising demand for oil, steel and other basic materials helped drive commodity and energy prices higher, benefitting markets that derive economic benefits from the development of natural resources. In addition, companies in Western Europe and Japan achieved higher revenues from exports to the faster-growing emerging markets, which helped support their domestic economies.
At the same time, a weaker U.S. dollar relative to the euro, yen and other currencies made overseas investments more valuable for U.S. investors. The declining dollar was primarily the result of low U.S.interest rates and a ballooning federal budget deficit, which increased the supply of U.S. Treasury securities without substantially boosting demand.The portfolio’s relative performance benefited from its lack of exposure to MSCI EAFE Index holdings such as Lafarge, which relies heavily on U.S. sales.
In the emerging markets, holdings such as Brazilian oil producer Petroleo Brasileiro, Thai wireless telecommunications provider Advanced Info Service and Korean tobacco company KT&G moved higher from what we believed to be attractive valuations as investors increasingly recognized their growth. Top performers in Europe included Greece’s EFG Eurobank Ergasias, Austria’s Erste Bank der oesterreichischen Sparkassen, German health care provider Celesio, French construction firm Vinci and U.K. retailer GUS. Although Japanese markets continued to recover from their long downturn, the portfolio’s relatively light exposure to Japan prevented it from participating fully in its gains. However, the portfolio maintained relatively heavy positions in other Asian markets, which benefited performance.
As is to be expected from a broadly diversified portfolio, some holdings disappointed us during the reporting period. Chief among them
were Brasil Telecom Participacoes and Taiwan’s Nanya Technology.The portfolio’s relative performance also was hurt by its lack of exposure to MSCI EAFE Index holding BP plc, the global oil producer.
What is the portfolio’s current strategy?
As some of the portfolio’s holdings have appreciated in value, we have trimmed their positions and redeployed assets to stocks that we consider more defensive.These relatively new investments focus primarily on overseas companies that serve domestic markets and enjoy high levels of free cash flow, including a number of wireless telephone service providers in Italy, New Zealand, Singapore and Brazil.We also have added to the portfolio’s holdings of high-quality Canadian companies, primarily in the basic materials sector, that we believe are attractively valued and enjoy favorable supply-and-demand trends. On the other hand, we have continued to maintain relatively light exposure to Japanese and Hong Kong stocks, as well as the technology sector, where either valuations have become stretched or business fundamentals remain relatively unattractive. Finally, we have continued to hedge the portfolio’s exposure to the U.S. dollar through positions in currencies such as the euro, the Australian dollar and the Swedish krona.
| January 18, 2005 |
| |
| | | The portfolio is only available as a funding vehicle under variable life insurance policies or variable |
| | | annuity contracts issued by insurance companies. Individuals may not purchase shares of the |
| | | portfolio directly.A variable annuity is an insurance contract issued by an insurance company that |
| | | enables investors to accumulate assets on a tax-deferred basis for retirement or other long-term |
| | | goals.The investment objective and policies of Dreyfus Variable Investment Fund, International |
| | | Equity Portfolio made available through insurance products may be similar to other funds/ |
| | | portfolios managed or advised by Dreyfus. However, the investment results of the portfolio may be |
| | | higher or lower than, and may not be comparable to, those of any other Dreyfus fund/portfolio. |
| 1 | | Total return includes reinvestment of dividends and any capital gains paid. Past performance is no |
| | | guarantee of future results. Share price and investment return fluctuate such that upon redemption, |
| | | portfolio shares may be worth more or less than their original cost.The portfolio’s performance does |
| | | not reflect the deduction of additional charges and expenses imposed in connection with investing |
| | | in variable insurance contracts, which will reduce returns. |
| | | Part of the portfolio’s recent performance is attributable to positive returns from its initial |
| | | public offering (IPO) investments.There can be no guarantee that IPOs will have or |
| | | continue to have a positive effect on the portfolio’s performance. Currently, the portfolio is |
| | | relatively small in asset size. IPOs tend to have a reduced effect on performance as a |
| | | portfolio’s asset base grows. |
| 2 | | SOURCE: LIPPER INC. — Reflects reinvestment of net dividends and, where applicable, |
| | | capital gain distributions.The Morgan Stanley Capital International Europe,Australasia, Far |
| | | East (MSCI EAFE) Index is an unmanaged index composed of a sample of companies |
| | | representative of the market structure of European and Pacific Basin countries. |
| 3 | | Source: Lipper Inc. |
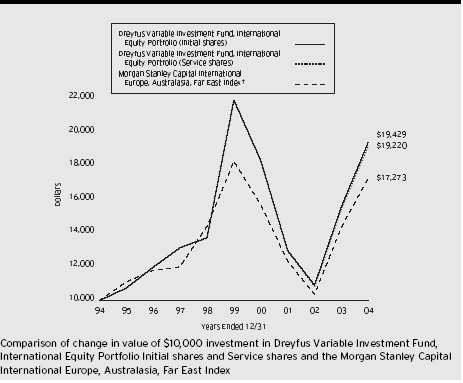
| Average Annual Total Returns | | as of 12/31/04 | | | | | | |
| | | | | 1 Year | | 5 Years | | 10 Years |
| |
| |
| |
| |
|
| Initial shares | | | | 24.57% | | (2.39)% | | 6.87% |
| Service shares | | | | 24.20% | | (2.60)% | | 6.75% |
| The data for Service shares includes the results of Initial shares for the period prior to December 31, 2000 |
| (inception date of Service shares). Actual Service shares’ average annual total return and hypothetical growth |
| results would have been lower. See notes below. |
| † Source: Lipper Inc. |
Past performance is not predictive of future performance.The portfolio’s performance shown in the graph and table does not reflect the deduction of taxes that a shareholder would pay on portfolio distributions or the redemption of portfolio shares. Part of the portfolio’s recent performance is attributable to positive returns from its initial public offering (IPO) investments. There can be no guarantee that IPOs will have or continue to have a positive effect on the portfolio’s performance. Currently, the portfolio is relatively small in asset size. IPOs tend to have a reduced effect on performance as a portfolio’s asset base grows.
The portfolio’s performance does not reflect the deduction of additional charges and expenses imposed in connection with investing in variable insurance contracts which will reduce returns.
The above graph compares a $10,000 investment made in Initial and Service shares of Dreyfus Variable Investment Fund, International Equity Portfolio on 12/31/94 to a $10,000 investment made in the Morgan Stanley Capital
6
International Europe,Australasia, Far East Index (the “Index”) on that date.
The portfolio’s Initial shares are not subject to a Rule 12b-1 fee.The portfolio’s Service shares are subject to a 0.25% annual Rule 12b-1 fee.The performance figures for Service shares reflect the performance of the portfolio’s Initial shares from their inception date through December 30, 2000, and the performance of the portfolio’s Service shares from December 31, 2000 (inception date of Service shares) to December 31, 2004 (blended performance figures).The blended performance figures have not been adjusted to reflect the higher operating expenses of the Service shares. If these expenses had been reflected, the blended performance figures would have been lower. All dividends and capital gain distributions are reinvested.
The portfolio’s performance shown in the line graph takes into account all applicable portfolio fees and expenses.The Index is an unmanaged index composed of a sample of companies representative of the market structure of European and Pacific Basin countries and includes net dividends reinvested.The Index does not take into account charges, fees and other expenses. Further information relating to portfolio performance, including expense reimbursements, if applicable, is contained in the Financial Highlights section of the prospectus and elsewhere in this report.
| UNDERSTANDING YOUR |
| PORTFOLIO’S EXPENSES (Unaudited) |
As a mutual fund investor,you pay ongoing expenses,such as management fees and other expenses.Using the information below,you can estimate how these expenses affect your investment and compare them with the expenses of other funds.You also may pay one-time transaction expenses,including sales charges (loads) and redemption fees, which are not shown in this section and would have resulted in higher total expenses. For more information, see your portfolio’s prospectus or talk to your financial adviser.
Review your portfolio’s expenses
|
The table below shows the expenses you would have paid on a $1,000 investment in Dreyfus Variable Investment Fund, International Equity Portfolio from July 1, 2004 to December 31, 2004. It also shows how much a $1,000 investment would be worth at the close of the period, assuming actual returns and expenses.
| Expenses and Value of a $1,000 Investment | | |
| assuming actual returns for the six months ended December 31, 2004 |
| | | Initial Shares | | Service Shares |
| |
| |
|
| Expenses paid per $1,000 † | | $ 5.88 | | $ 7.26 |
| Ending value (after expenses) | | $1,205.00 | | $1,203.40 |
| COMPARING YOUR PORTFOLIO’S EXPENSES |
| WITH THOSE OF OTHER FUNDS (Unaudited) |
Using the SEC’s method to compare expenses
The Securities and Exchange Commission (SEC) has established guidelines to help investors assess fund expenses. Per these guidelines, the table below shows your portfolio’s expenses based on a $1,000 investment, assuming a hypothetical 5% annualized return. You can use this information to compare the ongoing expenses (but not transaction expenses or total cost) of investing in the portfolio with those of other funds. All mutual fund shareholder reports will provide this information to help you make this comparison. Please note that you cannot use this information to estimate your actual ending account balance and expenses paid during the period.
Expenses and Value of a $1,000 Investment assuming a hypothetical 5% annualized return for the six months ended December 31, 2004
| | | Initial Shares | | Service Shares |
| |
| |
|
| Expenses paid per $1,000 † | | $ 5.38 | | $ 6.65 |
| Ending value (after expenses) | | $1,019.81 | | $1,018.55 |

STATEMENT OF INVESTMENTS
December 31, 2004
|
| Common Stocks—100.7% | | Shares | | | | Value ($) | | |
| |
| |
| |
| |
|
| Australia—1.7% | | | | | | | | |
| Multiplex | | 177,400 | | | | 754,674 | | |
| Austria—.8% | | | | | | | | |
| Erste Bank der oesterreichischen Sparkassen | | 6,769 | | | | 360,885 | | |
| Belgium—2.8% | | | | | | | | |
| Belgacom | | 15,139 | | a | | 653,095 | | |
| KBC Bankverzekeringsholding | | 7,267 | | | | 557,000 | | |
| | | | | | | 1,210,095 | | |
| Brazil—5.0% | | | | | | | | |
| Brasil Telecom Participacoes, ADR | | 18,160 | | | | 692,804 | | |
| Natura Cosmeticos | | 27,300 | | | | 796,593 | | |
| Petroleo Brasileiro, ADR | | 17,872 | | | | 647,145 | | |
| | | | | | | 2,136,542 | | |
| Canada—5.0% | | | | | | | | |
| Bank of Nova Scotia | | 12,900 | | | | 437,270 | | |
| Canadian National Railway | | 7,159 | | | | 435,669 | | |
| Dofasco | | 11,540 | | | | 436,342 | | |
| EnCana | | 6,132 | | | | 349,320 | | |
| Oncolytics Biotech | | 97,300 | | a | | 449,750 | | |
| Oncolytics Biotech (Purchase Warrants 2/21/2005) | | 53,925 | | a | | 69,613 | | |
| Oncolytics Biotech (Purchase Warrants 4/5/2005) | | 30,134 | | a | | — | | |
| | | | | | | 2,177,964 | | |
| Chile—.4% | | | | | | | | |
| Corpbanca, ADR | | 5,900 | | a | | 169,625 | | |
| France—7.3% | | | | | | | | |
| BNP Paribas | | 6,090 | | | | 440,348 | | |
| France Telecom | | 22,230 | | | | 734,630 | | |
| Sanofi-Aventis | | 10,349 | | | | 825,520 | | |
| Total | | 3,050 | | | | 664,917 | | |
| Vinci | | 3,570 | | | | 478,495 | | |
| | | | | | | 3,143,910 | | |
| Germany—3.6% | | | | | | | | |
| BASF | | 6,196 | | | | 445,491 | | |
| Celesio | | 3,699 | | | | 300,281 | | |
| Deutsche Boerse | | 4,417 | | | | 265,330 | | |
| Deutsche Postbank | | 12,100 | | a | | 533,483 | | |
| | | | | | | 1,544,585 | | |
| |
| |
| | | The Portfolio | | | | 9 |
S T A T E M E N T O F I N V E S T M E N T S (continued)
| Common Stocks (continued) | | Shares | | | | Value ($) |
| |
| |
| |
|
| Greece—2.5% | | | | | | |
| EFG Eurobank Ergasias | | 21,900 | | | | 750,463 |
| Public Power | | 11,540 | | | | 322,183 |
| | | | | | | 1,072,646 |
| Hong Kong—.7% | | | | | | |
| China Netcom Group (Hong Kong) | | 210,500 | | a | | 285,722 |
| India—1.4% | | | | | | |
| Reliance Industries, GDR | | 23,540 | | b | | 603,095 |
| Indonesia—3.1% | | | | | | |
| PT Bank Central Asia | | 2,125,000 | | | | 681,053 |
| PT Hanjaya Mandala Sampoerna | | 897,000 | | | | 642,612 |
| | | | | | | 1,323,665 |
| Italy—5.5% | | | | | | |
| Assicurazioni Generali | | 9,085 | | | | 307,748 |
| Enel | | 48,500 | | | | 475,699 |
| Eni | | 15,200 | | | | 379,826 |
| Telecom Italia | | 245,950 | | | | 797,437 |
| UniCredito Italiano | | 75,100 | | | | 430,955 |
| | | | | | | 2,391,665 |
| Japan—11.6% | | | | | | |
| ACOM | | 6,740 | | | | 504,423 |
| ASAHI BREWERIES | | 32,000 | | | | 396,234 |
| Hitachi | | 65,000 | | | | 450,310 |
| JFE | | 10,200 | | | | 291,116 |
| Japan Retail Fund Investment | | 76 | | | | 641,460 |
| MATSUI SECURITIES | | 10,300 | | | | 358,794 |
| NEC Electronics | | 5,500 | | | | 268,332 |
| Nippon Building Fund | | 62 | | | | 528,741 |
| Nippon Yusen Kabushiki Kaisha | | 53,000 | | | | 285,466 |
| Promise | | 7,300 | | | | 521,404 |
| SHIMIZU | | 84,000 | | | | 421,291 |
| Shin-Etsu Chemical | | 8,100 | | | | 331,951 |
| | | | | | | 4,999,522 |
| Luxembourg—1.0% | | | | | | |
| Arcelor | | 19,026 | | | | 438,007 |
| Common Stocks (continued) | | Shares | | Value ($) |
| |
| |
|
| Malaysia—2.2% | | | | |
| Astro All Asia Networks | | 197,300 a | | 280,374 |
| Malayan Banking | | 78,200 | | 242,832 |
| Maxis Communications | | 166,000 | | 408,447 |
| | | | | 931,653 |
| Mexico—1.4% | | | | |
| Desarrolladora Homex, ADR | | 12,266 a | | 290,091 |
| Fomento Economico Mexicano, ADR | | 5,900 | | 310,399 |
| | | | | 600,490 |
| Netherlands—1.9% | | | | |
| ING Groep | | 12,600 | | 380,494 |
| TPG | | 15,500 | | 420,125 |
| | | | | 800,619 |
| New Zealand—2.0% | | | | |
| Sky City Entertainment | | 145,375 | | 561,951 |
| Telecom Corporation of New Zealand | | 72,400 | | 319,919 |
| | | | | 881,870 |
| Norway—1.4% | | | | |
| Norsk Hydro | | 7,750 | | 608,639 |
| Portugal—1.1% | | | | |
| EDP | | 160,988 | | 487,024 |
| Singapore—4.2% | | | | |
| MobileOne | | 375,720 | | 418,924 |
| Singapore Airlines | | 78,000 | | 544,753 |
| Singapore Post | | 791,000 | | 431,287 |
| Singapore Press | | 146,500 | | 412,853 |
| | | | | 1,807,817 |
| South Africa—.8% | | | | |
| MTN Group | | 43,700 | | 336,582 |
| South Korea—2.3% | | | | |
| Hyundai Motor | | 5,790 | | 310,418 |
| KT&G, GDR | | 47,380 b | | 696,486 |
| | | | | 1,006,904 |
| Spain—4.6% | | | | |
| Abertis Infraestructuras | | 22,488 | | 494,217 |
S T A T E M E N T O F I N V E S T M E N T S (continued)
| Common Stocks (continued) | | Shares | | Value ($) |
| |
| |
|
| Spain (continued) | | | | |
| Acciona | | 3,900 | | 344,427 |
| Altadis | | 15,700 | | 717,763 |
| Iberdrola | | 16,700 | | 423,653 |
| | | | | 1,980,060 |
| Switzerland—4.7% | | | | |
| Nestle | | 1,971 | | 514,678 |
| Novartis | | 8,294 | | 417,139 |
| Roche | | 3,086 | | 354,566 |
| UBS | | 8,731 | | 730,713 |
| | | | | 2,017,096 |
| Taiwan—3.0% | | | | |
| China Steel, GDR | | 29,353 | | 656,040 |
| Fubon Financial, GDR | | 64,100 | | 644,205 |
| | | | | 1,300,245 |
| Thailand—3.5% | | | | |
| Advanced Info Service | | 205,500 | | 565,635 |
| Bank of Ayudhya | | 1,404,100 a | | 433,431 |
| Siam Cement | | 70,200 | | 498,410 |
| | | | | 1,497,476 |
| United Kingdom—15.2% | | | | |
| Admiral | | 44,300 | | 274,920 |
| BHP Billiton | | 37,424 | | 439,652 |
| BP | | 29,648 | | 289,822 |
| GUS | | 35,190 | | 635,516 |
| Imperial Tobacco | | 22,823 | | 626,714 |
| National Grid Transco | | 58,900 | | 562,173 |
| Shell Transport & Trading | | 192,830 | | 1,647,519 |
| Standard Chartered | | 37,867 | | 705,721 |
| Tesco | | 65,095 | | 403,031 |
| Vodafone | | 362,675 | | 985,777 |
| | | | | 6,570,845 |
| Total Common Stocks | | | | |
| (cost $32,403,133) | | | | 43,439,922 |
| Preferred Stocks—1.2% | | | | | | Shares | | Value ($) |
| |
| |
| |
| |
|
| Brazil—1.2% | | | | | | | | |
| All America Latina Logistica | | | | | | 16,800 | | 499,699 |
| Germany—.0% | | | | | | | | |
| Fresenius Medical Care, ADR | | | | | | 1 | | 19 |
| Total Preferred Stocks | | | | | | | | |
| (cost $373,322) | | | | | | | | 499,718 |
| |
| |
| |
| |
|
| |
| Total Investments (cost $32,776,455) | | | | 101.9% | | 43,939,640 |
| Liabilities, Less Cash and Receivables | | | | (1.9%) | | (801,232) |
| Net Assets | | | | | | 100.0% | | 43,138,408 |
| |
| ADR—American Depository Receipts. | | | | | | |
| GDR—Global Depository Receipts. | | | | | | |
| a | | Non-income producing. | | | | | | | | |
| b | | Securities exempt from registration under Rule 144A of the Securities Act of 1933.These securities may be resold |
| | | in transactions exempt from registration, normally to qualified institutional buyers.These securities have been |
| | | determined to be liquid by the Board of Trustees. At December 31, 2004, these securities amounted to $1,299,581 |
| | | or 3.0% of net assets. | | | | | | | | |
| |
| |
| |
| |
| |
|
| |
| |
| |
| Portfolio Summary (Unaudited) † | | | | | | |
| | | | | Value (%) | | | | | | Value (%) |
| |
| |
| |
| |
| |
|
| Financials | | 29.3 | | Basic Industries | | | | 7.9 |
| Non-Cyclical Services | | 14.5 | | Healthcare | | | | 6.6 |
| Cyclical Services | | 12.6 | | Other | | | | 7.8 |
| Non-Cyclical Consumer Goods | | 11.7 | | | | | | |
| Resources | | 11.5 | | | | | | 101.9 |
| |
| † | | Based on net assets. | | | | | | | | |
| See notes to financial statements. | | | | | | | | |
STATEMENT OF ASSETS AND LIABILITIES
December 31, 2004
| | | Cost | | Value |
| |
| |
|
| Assets ($): | | | | |
| Investments in securities—See Statement of Investments | | 32,776,455 | | 43,939,640 |
| Cash | | | | 266,142 |
| Cash denominated in foreign currencies | | 69,784 | | 70,313 |
| Unrealized appreciation on forward | | | | |
| currency exchange contracts—Note 4 | | | | 231,196 |
| Dividends receivable | | | | 144,255 |
| Receivable for shares of Beneficial Interest subscribed | | | | 856 |
| Prepaid expenses | | | | 796 |
| | | | | 44,653,198 |
| |
| |
|
| Liabilities ($): | | | | |
| Due to The Dreyfus Corporation and affiliates—Note 3(b) | | | | 27,483 |
| Payable for investment securities purchased | | | | 1,429,403 |
| Payable for shares of Beneficial Interest redeemed | | | | 6,154 |
| Unrealized depreciation on forward | | | | |
| currency exchange contracts—Note 4 | | | | 3,466 |
| Accrued expenses | | | | 48,284 |
| | | | | 1,514,790 |
| |
| |
|
| Net Assets ($) | | | | 43,138,408 |
| |
| |
|
| Composition of Net Assets ($): | | | | |
| Paid-in capital | | | | 53,726,653 |
| Accumulated distributions in excess of investment income—net | | (623,491) |
| Accumulated net realized gain (loss) on investments | | | | (21,357,340) |
| Accumulated net unrealized appreciation (depreciation) | | | | |
| on investments and foreign currency transactions | | | | 11,392,586 |
| |
| |
|
| Net Assets ($) | | | | 43,138,408 |
| |
| |
|
| |
| |
| Net Asset Value Per Share | | | | |
| | | Initial Shares | | Service Shares |
| |
| |
|
| Net Assets ($) | | 38,873,716 | | 4,264,692 |
| Shares Outstanding | | 2,706,948 | | 297,105 |
| |
| |
|
| Net Asset Value Per Share ($) | | 14.36 | | 14.35 |
See notes to financial statements.
|
STATEMENT OF OPERATIONS
Year Ended December 31, 2004
|
| Investment Income ($): | | |
| Income: | | |
| Cash dividends (net of $150,271 foreign taxes withheld at source) | | 1,188,262 |
| Interest | | 5,574 |
| Income from securities lending | | 1,448 |
| Total Income | | 1,195,284 |
| Expenses: | | |
| Investment advisory fee—Note 3(a) | | 282,338 |
| Custodian fees | | 53,479 |
| Auditing fees | | 24,460 |
| Prospectus and shareholders’ reports | | 13,022 |
| Distribution fees—Note 3(b) | | 9,462 |
| Shareholder servicing costs—Note 3(b) | | 5,535 |
| Trustees’ fees and expenses—Note 3(c) | | 3,538 |
| Loan commitment fees—Note 2 | | 294 |
| Legal fees | | 88 |
| Miscellaneous | | 9,461 |
| Total Expenses | | 401,677 |
| Investment Income—Net | | 793,607 |
| |
|
| Realized and Unrealized Gain (Loss) on Investments—Note 4 ($): |
| Net realized gain (loss) on investments | | |
| and foreign currency transactions | | 5,216,200 |
| Net realized gain (loss) on forward currency exchange contracts | | 315,132 |
| Net Realized Gain (Loss) | | 5,531,332 |
| Net unrealized appreciation (depreciation) on investments | | |
| and foreign currency transactions | | 2,245,710 |
| Net Realized and Unrealized Gain (Loss) on Investments | | 7,777,042 |
| Net Increase in Net Assets Resulting from Operations | | 8,570,649 |
See notes to financial statements.
|
STATEMENT OF CHANGES IN NET ASSETS
| | | Year Ended December 31, |
| |
|
| | | 2004 | | 2003 |
| |
| |
|
| Operations ($): | | | | |
| Investment income—net | | 793,607 | | 423,118 |
| Net realized gain (loss) on investments | | 5,531,332 | | 148,835 |
| Net unrealized appreciation | | | | |
| (depreciation) on investments | | 2,245,710 | | 10,549,372 |
| Net Increase (Decrease) in Net Assets | | | | |
| Resulting from Operations | | 8,570,649 | | 11,121,325 |
| |
| |
|
| Dividends to Shareholders from ($): | | | | |
| Investment income—net: | | | | |
| Initial shares | | (1,378,991) | | (1,283,793) |
| Service shares | | (137,306) | | (128,441) |
| Total Dividends | | (1,516,297) | | (1,412,234) |
| |
| |
|
| Beneficial Interest Transactions ($): | | | | |
| Net proceeds from shares sold: | | | | |
| Initial shares | | 4,222,550 | | 1,864,970 |
| Service shares | | 1,471,321 | | 1,472,940 |
| Dividends reinvested: | | | | |
| Initial shares | | 1,378,991 | | 1,283,793 |
| Service shares | | 137,306 | | 128,441 |
| Cost of shares redeemed: | | | | |
| Initial shares | | (5,980,727) | | (6,247,084) |
| Service shares | | (1,412,444) | | (1,078,940) |
| Increase (Decrease) in Net Assets from | | | | |
| Beneficial Interest Transactions | | (183,003) | | (2,575,880) |
| Total Increase (Decrease) in Net Assets | | 6,871,349 | | 7,133,211 |
| |
| |
|
| Net Assets ($): | | | | |
| Beginning of Period | | 36,267,059 | | 29,133,848 |
| End of Period | | 43,138,408 | | 36,267,059 |
| Distributions in excess of | | | | |
| investment income—net | | (623,491) | | (270,048) |
| | | Year Ended December 31, |
| |
|
| | | 2004 | | 2003 |
| |
| |
|
| Capital Share Transactions: | | | | |
| Initial Shares | | | | |
| Shares sold | | 334,613 | | 178,264 |
| Shares issued for dividends reinvested | | 100,613 | | 121,779 |
| Shares redeemed | | (475,177) | | (651,597) |
| Net Increase (Decrease) in Shares Outstanding | | (39,951) | | (351,554) |
| |
| |
|
| Service Shares | | | | |
| Shares sold | | 117,142 | | 146,307 |
| Shares issued for dividends reinvested | | 9,989 | | 12,032 |
| Shares redeemed | | (112,465) | | (106,682) |
| Net Increase (Decrease) in Shares Outstanding | | 14,666 | | 51,657 |
See notes to financial statements.
|
The following tables describe the performance for each share class for the fiscal periods indicated.All information (except portfolio turnover rate) reflects financial results for a single portfolio share.Total return shows how much your investment in the portfolio would have increased (or decreased) during each period, assuming you had reinvested all dividends and distributions.These figures have been derived from the portfolio’s financial statements.
| | | | | Year Ended December 31, | | |
| |
| |
| |
|
| Initial Shares | | 2004 | | 2003 | | 2002 | | 2001 | | 2000 |
| |
| |
| |
| |
| |
|
| Per Share Data ($): | | | | | | | | | | |
| Net asset value, beginning of period | | 11.97 | | 8.75 | | 10.76 | | 15.34 | | 22.34 |
| Investment Operations: | | | | | | | | | | |
| Investment income—net a | | .27 | | .14 | | .10 | | .03 | | .07 |
| Net realized and unrealized gain | | | | | | | | | | |
| (loss) on investments | | 2.64 | | 3.55 | | (1.81) | | (4.50) | | (3.45) |
| Total from Investment Operations | | 2.91 | | 3.69 | | (1.71) | | (4.47) | | (3.38) |
| Distributions: | | | | | | | | | | |
| Dividends from investment | | | | | | | | | | |
| income—net | | (.52) | | (.47) | | (.30) | | (.11) | | (.05) |
| Dividends from net realized | | | | | | | | | | |
| gain on investments | | — | | — | | — | | — | | (2.66) |
| Dividends in excess of net realized | | | | | | | | | | |
| gain on investments | | — | | — | | — | | — | | (.91) |
| Total Distributions | | (.52) | | (.47) | | (.30) | | (.11) | | (3.62) |
| Net asset value, end of period | | 14.36 | | 11.97 | | 8.75 | | 10.76 | | 15.34 |
| |
| |
| |
| |
| |
|
| Total Return (%) | | 24.57 | | 42.89 | | (15.94) | | (29.18) | | (16.40) |
| |
| |
| |
| |
| |
|
| Ratios/Supplemental Data (%): | | | | | | | | | | |
| Ratio of total expenses | | | | | | | | | | |
| to average net assets | | 1.04 | | 1.19 | | 1.14 | | 1.08 | | .99 |
| Ratio of net investment income | | | | | | | | | | |
| to average net assets | | 2.13 | | 1.42 | | .96 | | .25 | | .33 |
| Portfolio Turnover Rate | | 96.55 | | 101.02 | | 116.65 | | 238.88 | | 192.42 |
| |
| |
| |
| |
| |
|
| Net Assets, end of period ($ x 1,000) | | 38,874 | | 32,892 | | 27,117 | | 39,961 | | 65,854 |
| |
| a Based on average shares outstanding at each month end. | | | | | | | | |
| See notes to financial statements. | | | | | | | | | | |
| | | | | | | Year Ended December 31, | | |
| | | |
| |
| |
|
| Service Shares | | 2004 | | 2003 | | 2002 | | 2001 | | 2000 a |
| |
| |
| |
| |
| |
|
| Per Share Data ($): | | | | | | | | | | |
| Net asset value, beginning of period | | 11.95 | | 8.74 | | 10.75 | | 15.34 | | 15.34 |
| Investment Operations: | | | | | | | | | | |
| Investment income (loss)—net | | .24b | | .12b | | .07b | | (.03)b | | — |
| Net realized and unrealized | | | | | | | | | | |
| gain (loss) on investments | | 2.63 | | 3.54 | | (1.80) | | (4.47) | | — |
| Total from Investment Operations | | 2.87 | | 3.66 | | (1.73) | | (4.50) | | — |
| Distributions: | | | | | | | | | | |
| Dividends from investment | | | | | | | | | | |
| income—net | | (.47) | | (.45) | | (.28) | | (.09) | | — |
| Net asset value, end of period | | 14.35 | | 11.95 | | 8.74 | | 10.75 | | 15.34 |
| |
| |
| |
| |
| |
|
| Total Return (%) | | 24.20 | | 42.56 | | (16.20) | | (29.35) | | — |
| |
| |
| |
| |
| |
|
| Ratios/Supplemental Data (%): | | | | | | | | | | |
| Ratio of total expenses | | | | | | | | | | |
| to average net assets | | 1.29 | | 1.44 | | 1.41 | | 1.47 | | — |
| Ratio of net investment income | | | | | | | | | | |
| (loss) to average net assets | | 1.89 | | 1.17 | | .74 | | (.27) | | — |
| Portfolio Turnover Rate | | 96.55 | | 101.02 | | 116.65 | | 238.88 | | 192.42 |
| |
| |
| |
| |
| |
|
| Net Assets, end of period ($ x 1,000) | | 4,265 | | 3,375 | | 2,017 | | 1,644 | | 1 |
| |
| a | | The portfolio commenced offering Service shares on December 31, 2000. | | | | | | |
| b | | Based on average shares outstanding at each month end. | | | | | | | | |
| See notes to financial statements. | | | | | | | | | | |
NOTES TO FINANCIAL STATEMENTS
NOTE 1—Significant Accounting Policies:
Dreyfus Variable Investment Fund (the “fund”) is registered under the Investment Company Act of 1940, as amended (the “Act”), as an open-end management investment company, operating as a series company currently offering twelve series, including the International Equity Portfolio (the “portfolio”).The portfolio is only offered to separate accounts established by insurance companies to fund variable annuity contracts and variable life insurance policies.The portfolio is a non-diversified series.The portfolio’s investment objective is to maximize capital growth. The Dreyfus Corporation (“Dreyfus”) serves as the portfolio’s investment adviser. Dreyfus is a wholly-owned subsidiary of Mellon Financial Corporation (“Mellon Financial”). Newton Capital Management Limited (“Newton”) is the portfolio’s sub-investment adviser. Newton is also a wholly-owned subsidiary of Mellon Bank, N. A., and an affiliate of Dreyfus.
Dreyfus Service Corporation (the “Distributor”), a wholly-owned subsidiary of Dreyfus, is the distributor of the portfolio’s shares, which are sold without a sales charge.The portfolio is authorized to issue an unlimited number of $.001 par value shares of Beneficial Interest in each of the following classes of shares: Initial and Service. Each class of shares has identical rights and privileges, except with respect to the distribution plan and the expenses borne by each class and certain voting rights. Income, expenses (other than expenses attributable to a specific class), and realized and unrealized gains or losses on investments are allocated to each class of shares based on its relative net assets.
The fund accounts separately for the assets, liabilities and operations of each series. Expenses directly attributable to each series are charged to that series’ operations; expenses which are applicable to all series’ are allocated among them on a pro rata basis.
The portfolio’s financial statements are prepared in accordance with U.S. generally accepted accounting principles, which may require the use of management estimates and assumptions.Actual results could differ from those estimates.
The fund enters into contracts that contain a variety of indemnifica-tions.The portfolio’s maximum exposure under these arrangements is unknown. The portfolio does not anticipate recognizing any loss related to these arrangements.
(a) Portfolio valuation: Investments in securities are valued at the last sales price on the securities exchange or national securities market on which such securities are primarily traded. Securities listed on the National Market System for which market quotations are available are valued at the official closing price or, if there is no official closing price that day, at the last sales price. Securities not listed on an exchange or the national securities market, or securities for which there were no transactions, are valued at the average of the most recent bid and asked prices, except for open short positions, where the asked price is used for valuation purposes. Bid price is used when no asked price is available. Investments in registered investment companies are valued at their net asset value. When market quotations or official closing prices are not readily available, or are determined not to reflect accurately fair value, such as when the value of a security has been significantly affected by events after the close of the exchange or market on which the security is principally traded (for example, a foreign exchange or market), but before the portfolio calculates its net asset value, the portfolio may value these investments at fair value as determined in accordance with the procedures approved by the Board of Trustees. Fair valuing of securities may be determined with the assistance of a pricing service using calculations based on indices of domestic securities and other appropriate indicators, such as prices of relevant ADR’s and futures contracts. For other securities that are fair valued by the Board of Trustees, certain factors may be considered such as: fundamental analytical data, the nature and duration of restrictions on disposition, an evaluation of the forces that influence the market in which the securities are purchased and sold and public trading in similar securities of the issuer or comparable issuers. Investments denominated in foreign currencies are translated to U.S. dollars at the prevailing rates of exchange. Forward currency exchange contracts are valued at the forward rate.
NOTES TO FINANCIAL STATEMENTS (continued)
|
(b) Foreign currency transactions: The portfolio does not isolate that portion of the results of operations resulting from changes in foreign exchange rates on investments from the fluctuations arising from changes in market prices of securities held. Such fluctuations are included with the net realized and unrealized gain or loss on investments.
Net realized foreign exchange gains or losses arise from sales and maturities of short-term securities, sales of foreign currencies, currency gains or losses realized on securities transactions and the difference between the amounts of dividends, interest and foreign withholding taxes recorded on the portfolio’s books and the U.S. dollar equivalent of the amounts actually received or paid. Net unrealized foreign exchange gains or losses arise from changes in the value of assets and liabilities other than investments in securities, resulting from changes in exchange rates. Such gains and losses are included with net realized and unrealized gain or loss on investments.
(c) Securities transactions and investment income: Securities transactions are recorded on a trade date basis. Realized gain and loss from securities transactions are recorded on the identified cost basis. Dividend income is recognized on the ex-dividend date and interest income, including, where applicable, accretion of discount and amortization of premium on investments, is recognized on the accrual basis.
The portfolio has an arrangement with the custodian bank whereby the portfolio receives earnings credits from the custodian when positive cash balances are maintained, which are used to offset custody fees. For financial reporting purposes, the portfolio includes net earnings credits, if any, as an expense offset in the Statement of Operations.
Pursuant to a securities lending agreement with Mellon Bank, N.A., an affiliate of Dreyfus, the portfolio may lend securities to qualified institutions.At origination, all loans are secured by collateral of at least 102% of the value of U.S. securities loaned and 105% of the value of foreign securities loaned. Collateral equivalent to at least 100% of the market value of securities on loan will be maintained at all times. Cash collateral is invested in certain money market mutual funds managed
by Dreyfus. The portfolio will be entitled to receive all income on securities loaned, in addition to income earned as a result of the lending transaction. Although each security loaned is fully collateralized, the portfolio would bear the risk of delay in recovery of, or loss of rights in, the securities loaned should a borrower fail to return the securities in a timely manner.
(d) Affiliated issuers: Investments in other investment companies advised by Dreyfus are defined as “affiliated” in the Act.
(e) Dividends to shareholders: Dividends are recorded on the ex-dividend date. Dividends from investment income-net and dividends from net realized capital gain, if any, are normally declared and paid annually, but the portfolio may make distributions on a more frequent basis to comply with the distribution requirements of the Internal Revenue Code of 1986, as amended (the “Code”).To the extent that net realized capital gain can be offset by capital loss carryovers, it is the policy of the portfolio not to distribute such gain. Income and capital gain distributions are determined in accordance with income tax regulations, which may differ from U.S. generally accepted accounting principles.
(f) Federal income taxes: It is the policy of the portfolio to continue to qualify as a regulated investment company, if such qualification is in the best interests of its shareholders, by complying with the applicable provisions of the Code, and to make distributions of taxable income sufficient to relieve it from substantially all federal income and excise taxes.
At December 31, 2004, the components of accumulated earnings on a tax basis were as follows: undistributed ordinary income $169,654, accumulated capital losses $21,344,259 and unrealized appreciation $10,586,360.
The accumulated capital loss carryover is available to be applied against future net securities profits, if any, realized subsequent to December 31, 2004. If not applied, $16,246,805 of the carryover expires in fiscal 2009, $3,933,328 expires in fiscal 2010 and $1,164,126 expires in fiscal 2011.
NOTES TO FINANCIAL STATEMENTS (continued)
|
The tax character of distributions paid to shareholders during the fiscal periods ended December 31, 2004 and December 31, 2003 were as follows: ordinary income $1,516,297 and $1,412,234, respectively.
During the period ended December 31, 2004, as a result of permanent book to tax differences primarily due to the tax treatment for foreign currency transactions and passive foreign investment companies, the portfolio increased accumulated undistributed investment income-net by $369,247 and decreased accumulated net realized gain (loss) on investments by the same amount. Net assets were not affected by this reclassification.
NOTE 2—Bank Line of Credit:
|
The portfolio participates with other Dreyfus-managed funds in a $350 million redemption credit facility (the “Facility”) to be utilized for temporary or emergency purposes, including the financing of redemptions. In connection therewith, the portfolio has agreed to pay commitment fees on its pro rata portion of the Facility. Interest is charged to the portfolio based on prevailing market rates in effect at the time of borrowings. During the period ended December 31, 2004, the portfolio did not borrow under the Facility.
NOTE 3—Investment Advisory Fee, Sub-Investment Advisory Fee and Other Transactions with Affiliates:
(a) Pursuant to an Investment Advisory Agreement with Dreyfus, the investment advisory fee is computed at the annual rate of .75 of 1% of the value of the portfolio’s average daily net assets and is payable monthly.
Pursuant to a Sub-Investment Advisory Agreement between Dreyfus and Newton, the sub-investment advisory fee is payable monthly by Dreyfus, and is based upon the value of the portfolio’s average daily net assets, computed at the following annual rates:
| Average Net Assets | | |
| 0 to $100 million | | 35 of 1% |
| $100 million to $1 billion | | 30 of 1% |
| $1 billion to $1.5 billion | | 26 of 1% |
| In excess of $1.5 billion | | 20 of 1% |
(b) Under the Distribution Plan (the “Plan”) adopted pursuant to Rule 12b-1 under the Act, Service shares pay the Distributor for distributing their shares, for servicing and/or maintaining Service shares shareholder accounts and for advertising and marketing for Service shares.The Plan provides for payments to be made at an annual rate of .25 of 1% of the value of Service shares’ average daily net assets. The Distributor may make payments to Participating Insurance Companies and to brokers and dealers acting as principal underwriter for their variable insurance products.The fees payable under the Plan are payable without regard to actual expenses incurred. During the period ended December 31, 2004, Service shares were charged $9,462 pursuant to the Plan.
The portfolio compensates Dreyfus Transfer, Inc., a wholly-owned subsidiary of Dreyfus, under a transfer agency agreement for providing personnel and facilities to perform transfer agency services for the portfolio. During the period ended December 31, 2004, the portfolio was charged $130 pursuant to the transfer agency agreement.
The components of Due to The Dreyfus Corporation and affiliates in the Statement of Assets and Liabilities consist of: investment advisory fees $26,577, Rule 12b-1 distribution plan fees $881 and transfer agency per account fees $25.
(c) Each Board member also serves as a Board member of other funds within the Dreyfus complex. Annual retainer fees and attendance fees are allocated to each fund based on net assets.
NOTE 4—Securities Transactions:
The aggregate amount of purchases and sales of investment securities, excluding short-term securities and forward currency exchange contracts, during the period ended December 31, 2004, amounted to $36,403,149 and $36,237,359, respectively.
The portfolio enters into forward currency exchange contracts in order to hedge its exposure to changes in foreign currency exchange rates on its foreign portfolio holdings and to settle foreign currency transactions. When executing forward currency exchange contracts, the portfolio is
NOTES TO FINANCIAL STATEMENTS (continued)
|
obligated to buy or sell a foreign currency at a specified rate on a certain date in the future.With respect to sales of forward currency exchange contracts, the portfolio would incur a loss if the value of the contract increases between the date the forward contract is opened and the date the forward contract is closed.The portfolio realizes a gain if the value of the contract decreases between those dates.With respect to purchases of forward currency exchange contracts, the portfolio would incur a loss if the value of the contract decreases between the date the forward contract is opened and the date the forward contract is closed.The portfolio realizes a gain if the value of the contract increases between those dates.The portfolio is also exposed to credit risk associated with counterparty nonperformance on these forward currency exchange contracts which is typically limited to the unrealized gain on each open contract.The following summarizes open forward currency exchange contracts at December 31, 2004:
| | | Foreign | | | | | | Unrealized |
| Forward Currency | | Currency | | | | | | Appreciation |
| Exchange Contracts | | Amounts | | Cost ($) | | Value ($) | | (Depreciation) ($) |
| |
| |
| |
| |
|
| Purchases: | | | | | | | | |
| Australian Dollar, | | | | | | | | |
| expiring 3/15/2005 | | 2,129,198 | | 1,529,000 | | 1,656,303 | | 127,303 |
| Australian Dollar, | | | | | | | | |
| expiring 4/15/2005 | | 1,052,457 | | 795,447 | | 817,128 | | 21,681 |
| Euro, expiring 1/3/2005 | | 245,917 | | 334,841 | | 333,611 | | (1,230) |
| Euro, expiring 1/4/2005 | | 228,171 | | 311,772 | | 309,536 | | (2,236) |
| Euro, expiring 5/13/2005 | | 846,270 | | 1,093,000 | | 1,150,419 | | 57,419 |
| Hong Kong Dollar, | | | | | | | | |
| expiring 1/3/2005 | | 1,581,107 | | 203,386 | | 203,423 | | 37 |
| Japanese Yen, | | | | | | | | |
| expiring 1/5/2005 | | 18,267,221 | | 176,867 | | 178,243 | | 1,376 |
| New Zealand Dollar, | | | | | | | | |
| expiring 4/15/2005 | | 571,972 | | 394,000 | | 406,672 | | 12,672 |
| Singapore Dollar, | | | | | | | | |
| expiring 5/13/2005 | | 1,371,419 | | 841,000 | | 844,054 | | 3,054 |
| Swedish Krona, | | | | | | | | |
| expiring 6/15/2005 | | 1,379,989 | | 202,000 | | 208,175 | | 6,175 |
| Sales; | | | | Proceeds ($) | | | | |
| Canadian Dollar, | | | | | | | | |
| expiring 4/15/2005 | | 953,000 | | 795,447 | | 793,968 | | 1,479 |
| Total | | | | | | | | 227,730 |
At December 31, 2004, the cost of investments for federal income tax purposes was $33,355,952; accordingly, accumulated net unrealized appreciation on investments was $10,583,688, consisting of $11,198,673 gross unrealized appreciation and $614,985 gross unrealized depreciation.
In early 2004, two purported class and derivative actions were filed against Mellon Financial, Mellon Bank, N.A., Dreyfus, Founders Asset Management LLC, and certain directors of the Dreyfus Funds and the Dreyfus Founders Funds (together, the “Funds”). In September 2004, plaintiffs served a Consolidated Amended Complaint (the “Amended Complaint”) on behalf of a purported class of all persons who acquired interests in any of the Funds between January 30, 1999 and November 17, 2003, and derivatively on behalf of the Funds. The Amended Complaint in the newly styled In re Dreyfus Mutual Funds Fee Litigation also named the Distributor, Premier Mutual Fund Services, Inc. and two additional Fund directors as defendants and alleges violations of the Investment Company Act of 1940, the Investment Advisers Act of 1940, the Pennsylvania Unfair Trade Practices and Consumer Protection Law and common-law claims. Plaintiffs seek to recover allegedly improper and excessive Rule 12b-1 and advisory fees allegedly charged to the Funds for marketing and distribution services. More specifically, plaintiffs claim, among other things, that 12b-1 fees and directed brokerage were improperly used to pay brokers to recommend the Funds over other funds, and that such payments were not disclosed to investors. In addition, plaintiffs assert that economies of scale and soft-dollar benefits were not passed on to the Funds. Plaintiffs further allege that 12b-1 fees were improperly charged to certain of the Funds that were closed to new investors.The Amended Complaint seeks compensatory and punitive damages, rescission of the advisory contracts, and an accounting and restitution of any unlawful fees, as well as an award of attorneys’ fees and litigation expenses. As noted, some of the claims in this litigation are asserted derivatively on behalf of the Funds that have been named as
NOTES TO FINANCIAL STATEMENTS (continued)
|
nominal defendants.With respect to such derivative claims, no relief is sought against the Funds. Dreyfus believes the allegations to be totally without merit and intends to defend the action vigorously. Defendants filed motions to dismiss the Amended Complaint on November 12, 2004, and those motions are pending.
Additional lawsuits arising out of these circumstances and presenting similar allegations and requests for relief may be filed against the defendants in the future. Neither Dreyfus nor the Funds believe that any of the pending actions will have a material adverse effect on the Funds or Dreyfus’ ability to perform its contract with the Funds.
| REPORT OF INDEPENDENT REGISTERED |
| PUBLIC ACCOUNTING FIRM |
Shareholders and Board of Trustees
Dreyfus Variable Investment Fund, International Equity Portfolio
We have audited the accompanying statement of assets and liabilities, including the statement of investments, of Dreyfus Variable Investment Fund, International Equity Portfolio (one of the funds comprising Dreyfus Variable Investment Fund) as of December 31, 2004, and the related statement of operations for the year then ended, the statement of changes in net assets for each of the two years in the period then ended, and financial highlights for each of the periods indicated therein.These financial statements and financial highlights are the responsibility of the Fund’s management. Our responsibility is to express an opinion on these financial statements and financial highlights based on our audits.
We conducted our audits in accordance with the standards of the Public Company Accounting Oversight Board (United States).Those standards require that we plan and perform the audit to obtain reasonable assurance about whether the financial statements and financial highlights are free of material misstatement. An audit includes examining, on a test basis, evidence supporting the amounts and disclosures in the financial statements and financial highlights. Our procedures included confirmation of securities owned as of December 31, 2004 by correspondence with the custodian and others. An audit also includes assessing the accounting principles used and significant estimates made by management, as well as evaluating the overall financial statement presentation. We believe that our audits provide a reasonable basis for our opinion.
In our opinion, the financial statements and financial highlights referred to above present fairly, in all material respects, the financial position of Dreyfus Variable Investment Fund, International Equity Portfolio at December 31, 2004, the results of its operations for the year then ended, the changes in its net assets for each of the two years in the period then ended, and the financial highlights for each of the indicated periods, in conformity with U.S. generally accepted accounting principles.

| | New York, New York
February 4, 2005
|
The Portfolio 29
IMPORTANT TAX INFORMATION (Unaudited)
In accordance with federal tax law, the portfolio elects to provide each shareholder with their portion of the portfolio’s foreign taxes paid and the income sourced from foreign countries.Accordingly, the portfolio hereby makes the following designations regarding its fiscal year ended December 31, 2004:
—the total amount of taxes paid to foreign countries was $150,271.
—the total amount of income sourced from foreign countries was $1,072,736.
As required by federal tax law rules, shareholders will receive notification of their proportionate share of foreign taxes paid and foreign source income for the 2004 calendar year with Form 1099-DIV which will be mailed by January 31, 2005.
BOARD MEMBERS INFORMATION (Unaudited)
Joseph S. DiMartino (61) Chairman of the Board (1995)
Principal Occupation During Past 5 Years:
• Corporate Director and Trustee
Other Board Memberships and Affiliations:
- The Muscular Dystrophy Association, Director
- Levcor International, Inc., an apparel fabric processor, Director
- Century Business Services, Inc., a provider of outsourcing functions for small and medium size companies, Director
- The Newark Group, a provider of a national market of paper recovery facilities, paperboard mills and paperboard converting plants, Director
- Azimuth Trust, an institutional asset management firm, Member of Board of Managers and Advisory Board
No. of Portfolios for which Board Member Serves: 186
David P. Feldman (65)
Board Member (1994)
|
Principal Occupation During Past 5 Years:
• Corporate Director and Trustee
Other Board Memberships and Affiliations:
- BBH Mutual Funds Group (11 funds), Director
- The Jeffrey Company, a private investment company, Director
- QMED, a medical device company, Director
No. of Portfolios for which Board Member Serves: 51
———————
James F. Henry (74) Board Member (1990)
Principal Occupation During Past 5 Years:
- President, CPR Institute for Dispute Resolution, a non-profit organization principally engaged in the development of alternatives to business litigation (Retired 2003)
No. of Portfolios for which Board Member Serves: 22
———————
Rosalind Gersten Jacobs (79) Board Member (1990)
Principal Occupation During Past 5 Years:
• Merchandise and marketing consultant
No. of Portfolios for which Board Member Serves: 33
BOARD MEMBERS INFORMATION (Unaudited) (continued)
Dr. Paul A. Marks (78) Board Member (1990)
Principal Occupation During Past 5 Years:
• President and Chief Executive Officer of Memorial Sloan-Kettering Cancer Center (Retired 1999)
Other Board Memberships and Affiliations:
|
- Pfizer, Inc., a pharmaceutical company, Director-Emeritus
- Atom Pharm, Director
- Lazard Freres & Company, LLC, Senior Adviser
- Merck, Consultant
No. of Portfolios for which Board Member Serves: 22
|
Dr. Martin Peretz (65)
Board Member (1990)
|
Principal Occupation During Past 5 Years:
|
- Editor-in-Chief of The New Republic Magazine
- Lecturer in Social Studies at Harvard University (1965-2001)
- Co-Chairman of TheStreet.com, a financial daily on the web
Other Board Memberships and Affiliations:
|
- Academy for Liberal Education, an accrediting agency for colleges and universities certified by the U.S. Department of Education, Director
- Digital Learning Group, LLC, an online publisher of college textbooks, Director
- Harvard Center for Blood Research,Trustee
- Bard College,Trustee
- YIVO Institute for Jewish Research,Trustee
No. of Portfolios for which Board Member Serves: 22
|
———————
Bert W.Wasserman (72) Board Member (1993)
Principal Occupation During Past 5 Years:
• Financial Consultant
Other Board Memberships and Affiliations:
• Lillian Vernon Corporation, Director
|
No. of Portfolios for which Board Member Serves: 22
|
———————
Once elected all Board Members serve for an indefinite term.The address of the Board Members and Officers is in c/o The Dreyfus Corporation, 200 Park Avenue, New York, New York 10166.Additional information about the Board Members is available in the fund’s Statement of Additional Information which can be obtained from Dreyfus free of charge by calling this toll free number: 1-800-554-4611.
John M. Fraser, Jr., Emeritus Board Member
Irving Kristol, Emeritus Board Member
|
OFFICERS OF THE FUND (Unaudited)
STEPHEN E. CANTER, President since March 2000.
Chairman of the Board, Chief Executive Officer and Chief Operating Officer of Dreyfus, and an officer of 92 investment companies (comprised of 185 portfolios) managed by Dreyfus. Mr. Canter also is a Board member and, where applicable, an Executive Committee Member of the other investment management subsidiaries of Mellon Financial Corporation, each of which is an affiliate of Dreyfus. He is 59 years old and has been an employee of Dreyfus since May 1995.
STEPHEN R. BYERS, Executive Vice President since November 2002.
Chief Investment Officer,Vice Chairman and a director of Dreyfus, and an officer of 92 investment companies (comprised of 185 portfolios) managed by Dreyfus. Mr. Byers also is an officer, director or an Executive Committee Member of certain other investment management subsidiaries of Mellon Financial Corporation, each of which is an affiliate of Dreyfus. He is 51 years old and has been an employee of Dreyfus since January 2000. Prior to joining Dreyfus, he served as an Executive Vice President-Capital Markets, Chief Financial Officer and Treasurer at Gruntal & Co., L.L.C.
MARK N. JACOBS, Vice President since March 2000.
Executive Vice President, Secretary and General Counsel of Dreyfus, and an officer of 93 investment companies (comprised of 201 portfolios) managed by Dreyfus. He is 58 years old and has been an employee of Dreyfus since June 1977.
MICHAEL A. ROSENBERG, Secretary since March 2000.
Associate General Counsel of Dreyfus, and an officer of 90 investment companies (comprised of 194 portfolios) managed by Dreyfus. He is 44 years old and has been an employee of Dreyfus since October 1991.
ROBERT R. MULLERY, Assistant Secretary since March 2000.
Associate General Counsel of Dreyfus, and an officer of 26 investment companies (comprised of 60 portfolios) managed by Dreyfus. He is 52 years old and has been an employee of Dreyfus since May 1986.
STEVEN F. NEWMAN, Assistant Secretary since March 2000.
Associate General Counsel and Assistant Secretary of Dreyfus, and an officer of 93 investment companies (comprised of 201 portfolios) managed by Dreyfus. He is 55 years old and has been an employee of Dreyfus since July 1980.
JAMES WINDELS, Treasurer since November 2001.
Director – Mutual Fund Accounting of Dreyfus, and an officer of 93 investment companies (comprised of 201 portfolios) managed by Dreyfus. He is 46 years old and has been an employee of Dreyfus since April 1985.
RICHARD CASSARO, Assistant Treasurer since August 2003.
Senior Accounting Manager – Equity Funds of Dreyfus, and an officer of 26 investment companies (comprised of 102 portfolios) managed by Dreyfus. He is 44 years old and has been an employee of Dreyfus since September 1982.
OFFICERS OF THE FUND (Unaudited) (continued)
ERIK D. NAVILOFF, Assistant Treasurer since December 2002.
Senior Accounting Manager – Taxable Fixed Income Funds of Dreyfus, and an officer of 19 investment companies (comprised of 75 portfolios) managed by Dreyfus. He is 36 years old and has been an employee of Dreyfus since November 1992.
ROBERT ROBOL, Assistant Treasurer since August 2003.
Senior Accounting Manager – Money Market Funds of Dreyfus, and an officer of 39 investment companies (comprised of 84 portfolios) managed by Dreyfus. He is 40 years old and has been an employee of Dreyfus since October 1988.
ROBERT SVAGNA, Assistant Treasurer since December 2002.
Senior Accounting Manager – Equity Funds of Dreyfus, and an officer of 27 investment companies (comprised of 107 portfolios) managed by Dreyfus. He is 37 years old and has been an employee of Dreyfus since November 1990.
KENNETH J. SANDGREN, Assistant Treasurer since November 2001.
Mutual Funds Tax Director of Dreyfus, and an officer of 93 investment companies (comprised of 201 portfolios) managed by Dreyfus. He is 50 years old and has been an employee of Dreyfus since June 1993.
JOSEPH W. CONNOLLY, Chief Compliance Officer since October 2004.
Chief Compliance Officer of Dreyfus and The Dreyfus Family of Funds (93 investment companies, comprising 201 portfolios). From November 2001 through March 2004, Mr. Connolly was first Vice-President, Mutual Fund Servicing for Mellon Global Securities Services. In that capacity, Mr. Connolly was responsible for managing Mellon’s Custody, Fund Accounting and Fund Administration services to third-party mutual fund clients. He is 47 years old and has served in various capacities with Dreyfus since 1980, including manager of the firm’s Fund Accounting Department from 1997 through October 2001.
WILLIAM GERMENIS, Anti-Money Laundering Compliance Officer since September 2002.
Vice President and Anti-Money Laundering Compliance Officer of the Distributor, and the Anti-Money Laundering Compliance Officer of 88 investment companies (comprised of 196 portfolios) managed by Dreyfus. He is 34 years old and has been an employee of the Distributor since October 1998.
NOTES
For More Information
| Dreyfus Variable Investment Fund, |
| International Equity Portfolio |
| 200 Park Avenue |
| New York, NY 10166 |
| |
| Investment Adviser |
| The Dreyfus Corporation |
| 200 Park Avenue |
| New York, NY 10166 |
| |
| Sub-Investment Adviser |
| Newton Capital Management Limited |
| 160 Queen Victoria Street |
| London, EC4V 4LA |
| England |
| Custodian |
| The Bank of New York |
| One Wall Street |
| New York, NY 10286 |
| |
| Transfer Agent & |
| Dividend Disbursing Agent |
| Dreyfus Transfer, Inc. |
| 200 Park Avenue |
| New York, NY 10166 |
| |
| Distributor |
| Dreyfus Service Corporation |
| 200 Park Avenue |
| New York, NY 10166 |
Telephone 1-800-554-4611 or 516-338-3300
Mail The Dreyfus Family of Funds, 144 Glenn Curtiss Boulevard, Uniondale, NY 11556-0144 Attn: Institutional Servicing
The portfolio files its complete schedule of portfolio holdings with the Securities and
Exchange Commission (“SEC”) for the first and third quarters of each fiscal year on Form N-Q. The portfolio’s Forms N-Q are available on the SEC’s website at http://www.sec.gov and may be reviewed and copied at the SEC’s Public Reference Room in Washington, DC. Information on the operation of the Public Reference Room may be obtained by calling 1-800-SEC-0330.
A description of the policies and procedures that the portfolio uses to determine how to vote proxies relating to portfolio securities, and information regarding how the portfolio voted these proxies for the 12-month period ended June 30, 2004, is available through the portfolio’s website at http://www.dreyfus.com and on the SEC’s website at http://www.sec.gov. The description of the policies and procedures is also available without charge, upon request, by calling 1-800-645-6561.
© 2005 Dreyfus Service Corporation

| Dreyfus Variable |
| Investment Fund, |
| International Value |
| Portfolio |
| ANNUAL REPORT December 31, 2004 |

The views expressed in this report reflect those of the portfolio manager only through the end of the period covered and do not necessarily represent the views of Dreyfus or any other person in the Dreyfus organization.Any such views are subject to change at any time based upon market or other conditions and Dreyfus disclaims any responsibility to update such views. These views may not be relied on as investment advice and, because investment decisions for a Dreyfus portfolio are based on numerous factors, may not be relied on as an indication of trading intent on behalf of any Dreyfus portfolio.
Not FDIC-Insured • Not Bank-Guaranteed • May Lose Value
| | | Contents |
| |
| | | T H E P O R T F O L I O |
| |
|
| 2 | | Letter from the Chairman |
| 3 | | Discussion of Performance |
| 6 | | Portfolio Performance |
| 8 | | Understanding Your Portfolio’s Expenses |
| 8 | | Comparing Your Portfolio’s Expenses |
| | | With Those of Other Funds |
| 9 | | Statement of Investments |
| 15 | | Statement of Assets and Liabilities |
| 16 | | Statement of Operations |
| 17 | | Statement of Changes in Net Assets |
| 19 | | Financial Highlights |
| 21 | | Notes to Financial Statements |
| 29 | | Report of Independent Registered |
| | | Public Accounting Firm |
| 30 | | Important Tax Information |
| 31 | | Board Members Information |
| 33 | | Officers of the Fund |
| | | F O R M O R E I N F O R M AT I O N |
| |
|
| | | Back Cover |
| Dreyfus Variable Investment Fund, |
| International Value Portfolio |

LETTER FROM THE CHAIRMAN
We are pleased to present this annual report for Dreyfus Variable Investment Fund, International Value Portfolio, covering the 12-month period from January 1, 2004, through December 31, 2004. Inside, you’ll find valuable information about how the portfolio was managed during the reporting period, including a discussion with the portfolio manager, D. Kirk Henry.
2004 represented another year of positive international stock market performance. Unlike the 2003 rally, however, in which most stocks rose as global business conditions generally improved, 2004’s market performance largely reflected the strengths and weaknesses of individual companies, industries and markets.As a result, fundamental research and professional judgment became more important determinants of international equity performance in 2004.
What’s ahead for the world’s stock markets in 2005? No one knows for certain. Positive influences remain in place, including moderately expanding U.S. and global economies and low inflation. Nonetheless, a number of risks — such as currency fluctuation and global terrorism — could threaten the market environment.
As always, we urge our shareholders to view the financial markets from a long-term perspective, measured in years rather than weeks or months. One of the best ways to ensure a long-term perspective is to establish an investment plan with the help of your financial advisor, and review it periodically to track your progress toward your financial goals.
Thank you for your continued confidence and support.

DISCUSSION OF PERFORMANCE
D. Kirk Henry, Portfolio Manager
|
How did Dreyfus Variable Investment Fund, International Value Portfolio perform relative to its benchmark?
For the 12-month period ended December 31, 2004, the portfolio produced total returns of 20.02% for its Initial shares and 19.83% for its Service shares.1 This compares with a 20.25% return for the portfolio’s benchmark, the Morgan Stanley Capital International Europe, Australasia, Far East Index (“MSCI EAFE Index”), for the same period.2
We attribute the portfolio’s performance to strong global economic growth throughout much of 2004,led primarily by U.S.consumption and rapid industrialization in China.The portfolio’s returns were slightly lower than its benchmark, primarily due to a small cash position generated by shareholder activity.The portfolio achieved the majority of its gains from its holdings in Japan, France, the Netherlands and the United Kingdom.
What is the portfolio’s investment approach?
The portfolio invests in an internationally diversified portfolio of value stocks; that is, stocks selling at what we think are attractive valuations relative to their perceived intrinsic worth in their home markets or global sectors based on historical measures. These measures typically include price-to-earnings, price-to-book value and price-to-cash flow ratios. Discrepancies from historical norms can be the result of short-term factors that affect market perception; that is, a stock falls out of general market favor, creating what we perceive to be a buying opportunity.The portfolio purchases the security at the depressed price, seeking to profit when perceptions change and the stock price rises to its perceived value.
When putting the value approach to work, the portfolio employs the following process: we select individual securities using a process that blends quantitative and qualitative analysis. After an initial computer screen eliminates approximately 75% of purchase candidates, analysts perform extensive fundamental research and conduct on-site visits to determine which securities we will buy for the portfolio.We can invest
DISCUSSION OF PERFORMANCE (continued)
|
more or less in any given country or sector depending on the number of value opportunities that we see in a particular area.
What other factors influenced the portfolio’s performance?
The international equity markets posted strong gains in 2004, largely due to robust global economic growth. China’s rapid economic expansion created greater demand for steel, cement, copper, iron and other basic materials needed to build its industrial infrastructure. By mid-year, however, when the Chinese government imposed stricter lending standards in an effort to slow economic growth and forestall potential inflationary pressures, the international markets’ gains began to moderate. By the fall, energy prices began to retreat from record highs and the contentious U.S. presidential campaign ended, lifting much of the uncertainty plaguing the financial markets. As a result, most stock markets rebounded sharply in the fourth quarter of 2004.
In this environment, the portfolio’s performance was driven primarily by its holdings in Japan, France, the Netherlands and the United Kingdom. The portfolio’s Japanese financial stocks, including credit card issuer Credit Saison and lenders SFCG and AIFUL, benefited from a stronger labor market and the restructuring of the country’s banking system. Exports drove sales at Yamaha Motor, and Toyota Motor Companies serving Japanese domestic markets also fared well in 2004, including drug store operator Matsumotokiyoshi.
In France, the portfolio’s investment in France Telecom benefited from an increase in wireless subscriptions and broadband services. In addition, pharmaceutical company Aventis gained value when it was purchased by Sanofi-Synthelabo early in the year. Several holdings in the Netherlands helped boost the portfolio’s performance, including banking and insurance firm Fortis.The portfolio also benefited by avoiding many of the more poorly performing information technology stocks in the Netherlands. In the United Kingdom, defense contractor BAE Systems and candy and soda manufacturer Cadbury Schweppes posted gains for company-specific reasons.
As oil and gas prices reached record highs, a number of energy stocks contributed positively to the portfolio’s 2004 results, including U.K.-
based Shell Transport and Trading, Italy’s Eni and Saipem, Spain’s Repsol YPF, Santos of Australia and Norway’s Norsk Hydro. Telecommunications stocks also fared relatively well, including Greece’s Hellenic Telecommunications Organization.
On the other hand, consumer stocks in Germany disappointed, as many of these stocks suffered amid weak consumer spending and high unem-ployment.The portfolio also experienced some weakness in its Japanese technology holdings, most notably the component parts manufacturers.
What is the portfolio’s current strategy?
As of the end of the reporting period, we have been encouraged by the strength of the international stock markets, especially those companies that are benefiting from stronger local demand for their products and services. Accordingly, we recently have established several positions in companies that we believe are poised to benefit from this trend, including U.K. drugstore chain Boots, Japanese bank TakeFuji and Singapore’s United Overseas Bank. Conversely, we have reduced the portfolio’s exposure to energy companies and large banks, where we believe valuations may already have peaked.
| | | The portfolio is only available as a funding vehicle under variable life insurance policies or variable |
| | | annuity contracts issued by insurance companies. Individuals may not purchase shares of the |
| | | portfolio directly.A variable annuity is an insurance contract issued by an insurance company that |
| | | enables investors to accumulate assets on a tax-deferred basis for retirement or other long-term |
| | | goals.The investment objective and policies of Dreyfus Variable Investment Fund, International |
| | | Value Portfolio made available through insurance products may be similar to other funds/portfolios |
| | | managed or advised by Dreyfus. However, the investment results of the portfolio may be higher or |
| | | lower than, and may not be comparable to, those of any other Dreyfus fund/portfolio. |
| 1 | | Total return includes reinvestment of dividends and any capital gains paid. Past performance is no |
| | | guarantee of future results. Share price and investment return fluctuate such that upon redemption, |
| | | portfolio shares may be worth more or less than their original cost.The portfolio’s performance does |
| | | not reflect the deduction of additional charges and expenses imposed in connection with investing |
| | | in variable insurance contracts, which will reduce returns. Return figures provided reflect the |
| | | absorption of portfolio expenses by The Dreyfus Corporation pursuant to an agreement in effect |
| | | through December 31, 2005, at which time it may be extended, terminated or modified. Had |
| | | these expenses not been absorbed, the portfolio’s returns would have been lower. |
| 2 | | SOURCE: LIPPER INC. — Reflects reinvestment of net dividends and, where applicable, |
| | | capital gain distributions.The Morgan Stanley Capital International Europe,Australasia, Far |
| | | East (MSCI EAFE) Index is an unmanaged index composed of a sample of companies |
| | | representative of the market structure of European and Pacific Basin countries. |
| |
| | | The Portfolio 5 |
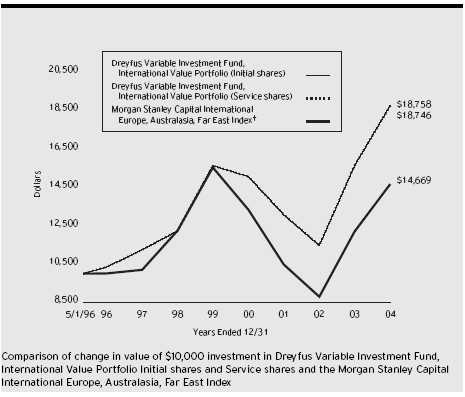
| Average Annual Total Returns | | as of 12/31/04 | | | | |
| | | Inception | | | | | | From |
| | | Date | | 1 Year | | 5 Years | | Inception |
| |
| |
| |
| |
|
| Initial shares | | 5/1/96 | | 20.02% | | 3.72% | | 7.53% |
| Service shares | | 5/1/96 | | 19.83% | | 3.71% | | 7.52% |
| The data for Service shares includes the results of Initial shares for the period prior to December 31, 2000 |
| (inception date of Service shares). Actual Service shares’ average annual total return and hypothetical growth |
| results would have been lower. See notes below. |
| † Source: Lipper Inc. |
| Past performance is not predictive of future performance.The portfolio’s performance shown in the graph and table does not |
| reflect the deduction of taxes that a shareholder would pay on portfolio distributions or the redemption of portfolio shares. |
| The portfolio’s performance does not reflect the deduction of additional charges and expenses imposed in |
| connection with investing in variable insurance contracts which will reduce returns. |
| The above graph compares a $10,000 investment made in Initial and Service shares of Dreyfus Variable Investment |
| Fund, International Value Portfolio on 5/1/96 (inception date of Initial shares) to a $10,000 investment made in the |
| Morgan Stanley Capital International Europe,Australasia, Far East Index (the “Index”) on that date. |
6
The portfolio’s Initial shares are not subject to a Rule 12b-1 fee.The portfolio’s Service shares are subject to a 0.25% annual Rule 12b-1 fee.The performance figures for Service shares reflect the performance of the portfolio’s Initial shares from their inception date through December 30, 2000, and the performance of the portfolio’s Service shares from December 31, 2000 (inception date of Service shares) to December 31, 2004 (blended performance figures).The performance figures for each share class reflect certain expense reimbursements, without which the performance of each share class would have been lower. In addition, the blended performance figures have not been adjusted to reflect the higher operating expenses of the Service shares. If these expenses had been reflected, the blended performance figures would have been lower. All dividends and capital gain distributions are reinvested.
The portfolio’s performance shown in the line graph takes into account all applicable portfolio fees and expenses (after any expense reimbursements).The Index is an unmanaged index composed of a sample of companies representative of the market structure of European and Pacific Basin countries and includes net dividends reinvested.The Index does not take into account charges, fees and other expenses. Further information relating to portfolio performance, including expense reimbursements, if applicable, is contained in the Financial Highlights section of the prospectus and elsewhere in this report.
| UNDERSTANDING YOUR |
| PORTFOLIO’S EXPENSES (Unaudited) |
As a mutual fund investor,you pay ongoing expenses,such as management fees and other expenses.Using the information below,you can estimate how these expenses affect your investment and compare them with the expenses of other funds.You also may pay one-time transaction expenses,including sales charges (loads) and redemption fees, which are not shown in this section and would have resulted in higher total expenses. For more information, see your portfolio’s prospectus or talk to your financial adviser.
Review your portfolio’s expenses
|
The table below shows the expenses you would have paid on a $1,000 investment in Dreyfus Variable Investment Fund, International Value Portfolio from July 1, 2004 to December 31, 2004. It also shows how much a $1,000 investment would be worth at the close of the period, assuming actual returns and expenses.
| Expenses and Value of a $1,000 Investment | | |
| assuming actual returns for the six months ended December 31, 2004 |
| | | Initial Shares | | Service Shares |
| |
| |
|
| Expenses paid per $1,000 † | | $ 6.37 | | $ 7.38 |
| Ending value (after expenses) | | $1,113.00 | | $1,111.40 |
| COMPARING YOUR PORTFOLIO’S EXPENSES |
| WITH THOSE OF OTHER FUNDS (Unaudited) |
Using the SEC’s method to compare expenses
The Securities and Exchange Commission (SEC) has established guidelines to help investors assess fund expenses. Per these guidelines, the table below shows your portfolio’s expenses based on a $1,000 investment, assuming a hypothetical 5% annualized return. You can use this information to compare the ongoing expenses (but not transaction expenses or total cost) of investing in the portfolio with those of other funds. All mutual fund shareholder reports will provide this information to help you make this comparison. Please note that you cannot use this information to estimate your actual ending account balance and expenses paid during the period.
Expenses and Value of a $1,000 Investment assuming a hypothetical 5% annualized return for the six months ended December 31, 2004
| | | Initial Shares | | Service Shares |
| |
| |
|
| Expenses paid per $1,000 † | | $ 6.09 | | $ 7.05 |
| Ending value (after expenses) | | $1,019.10 | | $1,018.15 |
| † Expenses are equal to the portfolio’s annualized expense ratio of 1.20% for Initial shares and 1.39% for Service shares, |
| multiplied by the average account value over the period, multiplied by 184/366 (to reflect the one-half year period). |
STATEMENT OF INVESTMENTS
December 31, 2004
|
| Common Stocks—99.4% | | Shares | | Value ($) | | |
| |
| |
| |
|
| Australia—1.7% | | | | | | |
| Amcor | | 132,316 | | 760,513 | | |
| National Australia Bank | | 61,197 | | 1,379,211 | | |
| | | | | 2,139,724 | | |
| Belgium—1.1% | | | | | | |
| Fortis | | 48,270 | | 1,333,890 | | |
| Brazil—1.1% | | | | | | |
| Petroleo Brasileiro, ADR | | 15,620 | | 621,364 | | |
| Telecomunicacoes Brasileiras, ADR | | 22,630 | | 728,233 | | |
| | | | | 1,349,597 | | |
| Denmark—.4% | | | | | | |
| Danske Bank | | 14,120 | | 431,972 | | |
| Finland—2.2% | | | | | | |
| M-real, Cl. B | | 158,800 | | 1,012,512 | | |
| Nokia | | 25,800 | | 406,703 | | |
| Nokia, ADR | | 22,230 | | 348,344 | | |
| UPM-Kymmene | | 41,968 | | 931,437 | | |
| | | | | 2,698,996 | | |
| France—8.6% | | | | | | |
| BNP Paribas | | 15,570 | | 1,125,817 | | |
| Carrefour | | 33,300 | | 1,582,924 | | |
| France Telecom | | 35,600 a | | 1,176,465 | | |
| Sanofi-Aventis | | 16,660 | | 1,328,936 | | |
| Schneider Electric | | 17,030 | | 1,182,868 | | |
| Thomson | | 27,995 | | 738,673 | | |
| Total | | 9,230 | | 2,012,192 | | |
| Valeo | | 33,000 | | 1,378,848 | | |
| | | | | 10,526,723 | | |
| Germany—6.7% | | | | | | |
| Deutsche Bank | | 9,970 | | 883,473 | | |
| Deutsche Boerse | | 11,330 | | 680,596 | | |
| Deutsche Lufthansa | | 49,187 a | | 701,969 | | |
| Deutsche Post | | 82,170 | | 1,879,415 | | |
| Deutsche Postbank | | 11,600 | | 511,438 | | |
| E.ON | | 11,699 | | 1,066,205 | | |
| Heidelberger Druckmaschinen | | 16,800 a | | 569,772 | | |
| KarstadtQuelle | | 41,300 | | 425,249 | | |
| |
| |
| | | The Portfolio | | | | 9 |
S T A T E M E N T O F I N V E S T M E N T S (continued)
| Common Stocks (continued) | | Shares | | Value ($) |
| |
| |
|
| Germany (continued) | | | | |
| Medion | | 10,200 | | 215,862 |
| Volkswagen | | 28,420 | | 1,285,795 |
| | | | | 8,219,774 |
| Hong Kong—1.4% | | | | |
| Bank of East Asia | | 245,251 | | 762,022 |
| China Mobile (Hong Kong) | | 214,800 | | 728,206 |
| Citic Pacific | | 83,600 | | 236,091 |
| | | | | 1,726,319 |
| Ireland—1.6% | | | | |
| Bank of Ireland | | 115,216 | | 1,902,196 |
| Italy—4.5% | | | | |
| Banche Popolari Unite Scrl | | 34,345 | | 697,023 |
| Benetton Group | | 42,010 | | 554,520 |
| Eni | | 54,595 | | 1,364,251 |
| Finmeccanica | | 1,078,000 | | 975,431 |
| SanPaolo IMI | | 19,576 | | 281,502 |
| UniCredito Italiano | | 288,500 | | 1,655,533 |
| | | | | 5,528,260 |
| Japan—26.1% | | | | |
| ALPS ELECTRIC | | 42,100 | | 627,279 |
| CANON | | 22,900 | | 1,235,664 |
| Credit Saison | | 37,000 | | 1,346,636 |
| DENTSU | | 269 | | 724,438 |
| FUNAI ELECTRIC | | 5,400 | | 670,225 |
| Fuji Heavy Industries | | 147,900 | | 721,569 |
| Fuji Photo Film | | 26,400 | | 963,419 |
| HONDA MOTOR | | 25,600 | | 1,326,399 |
| KDDI | | 179 | | 964,122 |
| Kao | | 34,200 | | 874,313 |
| Kuraray | | 78,300 | | 702,129 |
| LAWSON | | 20,900 | | 770,864 |
| MABUCHI MOTOR | | 14,200 | | 1,023,935 |
| MINEBEA | | 194,800 | | 849,642 |
| MURATA MANUFACTURING | | 13,100 | | 732,429 |
| Matsumotokiyoshi | | 26,800 | | 763,585 |
| Common Stocks (continued) | | Shares | | Value ($) |
| |
| |
|
| Japan (continued) | | | | |
| NIPPON TELEGRAPH AND TELEPHONE | | 188 | | 843,831 |
| Nippon Express | | 309,500 | | 1,525,077 |
| OLYMPUS | | 29,700 | | 633,210 |
| RINNAI | | 36,600 | | 982,095 |
| ROHM | | 11,200 | | 1,158,413 |
| SKYLARK | | 55,800 | | 959,356 |
| SOHGO SECURITY SERVICES | | 33,300 | | 488,688 |
| SUMITOMO CHEMICAL | | 159,800 | | 782,745 |
| Sekisui House | | 87,400 | | 1,018,252 |
| 77 Bank | | 137,200 | | 965,226 |
| Shin-Etsu Chemical | | 28,300 | | 1,159,780 |
| Shiseido | | 34,400 | | 498,117 |
| Sumitomo Bakelite | | 113,700 | | 717,802 |
| Sumitomo Mitsui Financial | | 162 | | 1,177,636 |
| TAKEFUJI | | 16,750 | | 1,132,629 |
| TDK | | 7,300 | | 540,635 |
| TOYODA GOSEI | | 10,600 | | 215,651 |
| Takeda Pharmaceutical | | 24,000 | | 1,208,372 |
| Toyota Motor | | 18,800 | | 764,951 |
| Yamaha Motor | | 69,400 | | 1,041,491 |
| | | | | 32,110,605 |
| Mexico—1.3% | | | | |
| Coca-Cola Femsa, ADR | | 30,600 | | 727,056 |
| Telefonos de Mexico, ADR | | 24,156 | | 925,658 |
| | | | | 1,652,714 |
| Netherlands—5.6% | | | | |
| ABN AMRO | | 26,825 | | 709,257 |
| Aegon | | 76,859 | | 1,045,797 |
| DSM | | 4,300 | | 277,785 |
| Heineken | | 36,159 | | 1,203,277 |
| Koninklijke (Royal) Philips Electronics | | 45,090 | | 1,193,409 |
| Koninklijke (Royal) Philips Electronics (New York Shares) | | 5,780 | | 153,170 |
| Royal Dutch Petroleum | | 19,300 | | 1,108,824 |
| Wolters Kluwer | | 57,289 | | 1,147,899 |
| | | | | 6,839,418 |
S T A T E M E N T O F I N V E S T M E N T S (continued)
| Common Stocks (continued) | | Shares | | Value ($) |
| |
| |
|
| New Zealand—.2% | | | | |
| Carter Holt Harvey | | 170,775 | | 253,993 |
| Norway—.3% | | | | |
| Norsk Hydro | | 5,115 | | 401,702 |
| Portugal—.4% | | | | |
| EDP | | 179,100 | | 541,817 |
| Singapore—1.9% | | | | |
| DBS | | 124,100 | | 1,224,046 |
| Singapore Technologies Engineering | | 236,000 | | 336,874 |
| United Overseas Bank | | 97,700 | | 825,988 |
| | | | | 2,386,908 |
| South Africa—1.4% | | | | |
| Anglo American | | 38,778 | | 919,325 |
| Nedcor | | 55,982 | | 771,167 |
| | | | | 1,690,492 |
| South Korea—1.4% | | | | |
| KT, ADR | | 33,800 | | 737,178 |
| Korea Electric Power, ADR | | 57,280 | | 758,387 |
| POSCO, ADR | | 4,080 | | 181,682 |
| | | | | 1,677,247 |
| Spain—3.2% | | | | |
| Banco de Sabadell | | 38,700 | | 903,007 |
| Endesa | | 68,560 | | 1,608,117 |
| Repsol YPF | | 16,800 | | 436,673 |
| Repsol YPF, ADR | | 35,340 | | 922,374 |
| | | | | 3,870,171 |
| Sweden—1.0% | | | | |
| Electrolux, Cl. B | | 51,700 | | 1,181,768 |
| Switzerland—8.1% | | | | |
| Clariant | | 46,912 | | 755,582 |
| Julius Baer, Cl. B | | 2,460 | | 738,993 |
| Lonza | | 20,100 | | 1,129,114 |
| Nestle | | 7,755 | | 2,025,026 |
| Novartis | | 38,500 | | 1,936,321 |
| Common Stocks (continued) | | Shares | | Value ($) |
| |
| |
|
| Switzerland (continued) | | | | |
| Swiss Re | | 19,090 | | 1,358,904 |
| UBS | | 16,620 | | 1,390,957 |
| Zurich Financial Services | | 4,000 a | | 665,672 |
| | | | | 10,000,569 |
| Taiwan—.7% | | | | |
| United Microelectronics, ADR | | 257,886 a | | 910,338 |
| United Kingdom—18.5% | | | | |
| BAA | | 74,700 | | 839,472 |
| BAE Systems | | 166,889 | | 740,238 |
| BOC | | 40,637 | | 776,895 |
| BT | | 350,900 | | 1,370,731 |
| Barclays | | 69,311 | | 781,578 |
| Boots | | 74,195 | | 935,880 |
| Bunzl | | 121,774 | | 1,018,163 |
| Centrica | | 143,780 | | 653,647 |
| Diageo | | 101,235 | | 1,447,412 |
| easyJet | | 155,600 a | | 562,163 |
| GKN | | 295,650 | | 1,345,494 |
| GlaxoSmithKline | | 97,043 | | 2,281,961 |
| Lloyds TSB | | 102,634 | | 934,168 |
| Marks & Spencer | | 78,700 | | 519,447 |
| Rexam | | 83,136 | | 735,102 |
| Rio Tinto | | 53,139 | | 1,567,575 |
| Royal Bank of Scotland | | 50,105 | | 1,689,227 |
| Sainsbury (J) | | 173,653 | | 903,904 |
| Scottish Power | | 9,700 | | 75,269 |
| Shell Transport & Trading | | 221,607 | | 1,893,386 |
| Unilever | | 110,400 | | 1,086,645 |
| Vodafone | | 200,600 | | 545,246 |
| | | | | 22,703,603 |
| Total Common Stocks | | | | |
| (cost $99,830,521) | | | | 122,078,796 |
S T A T E M E N T O F I N V E S T M E N T S (continued)
| | | Principal | | |
| Short-Term Investments—.8% | | Amount ($) | | Value ($) |
| |
| |
|
| U.S. Treasury Bills; | | | | |
| 1.72%, 2/10/2005 | | | | |
| (cost $998,089) | | 1,000,000 | | 997,970 |
| |
| |
|
| Total Investments (cost $100,828,610) | | 100.2% | | 123,076,766 |
| Liabilities, Less Cash and Receivables | | (.2%) | | (244,806) |
| Net Assets | | 100.0% | | 122,831,960 |
| ADR—American Depository Receipts. |
| a Non-income producing. |
| Portfolio Summary (Unaudited) † | | | | |
| |
| | | Value (%) | | | | Value (%) |
| |
| |
| |
|
| Banking | | 15.0 | | Electronic Components | | 3.5 |
| Chemicals | | 7.0 | | Appliances & Household Durables | | 2.6 |
| Financial Services | | 6.7 | | Beverages & Tobacco | | 2.6 |
| Food & Household Products | | 6.6 | | Transportation | | 2.5 |
| Telecommunications | | 5.5 | | Forest Products & Paper | | 2.4 |
| Automobiles | | 5.2 | | Aerospace & Military Technology | | 2.0 |
| Energy | | 5.0 | | Insurance | | 2.0 |
| Healthcare | | 4.4 | | Other | | 19.2 |
| Capital Goods | | 4.3 | | | | |
| Utilities | | 3.7 | | | | 100.2 |
| † Based on net assets. |
| See notes to financial statements. |
| STATEMENT OF ASSETS AND LIABILITIES |
| December 31, 2004 |
| | | Cost | | Value |
| |
| |
|
| Assets ($): | | | | |
| Investments in securities—See Statement of Investments | | 100,828,610 | | 123,076,766 |
| Cash denominated in foreign currencies | | 1,524,242 | | 1,547,454 |
| Receivable for investment securities sold | | | | 4,001,780 |
| Receivable for shares of Beneficial Interest subscribed | | | | 302,784 |
| Dividends receivable | | | | 188,114 |
| Unrealized appreciation on forward currency | | | | |
| exchange contracts—Note 4 | | | | 7 |
| Prepaid expenses | | | | 998 |
| | | | | 129,117,903 |
| |
| |
|
| Liabilities ($): | | | | |
| Due to The Dreyfus Corporation and affiliates—Note 3(b) | | | | 110,807 |
| Cash overdraft due to Custodian | | | | 3,413,014 |
| Payable for investment securities purchased | | | | 2,690,726 |
| Payable for shares of Beneficial Interest redeemed | | | | 5,068 |
| Unrealized depreciation on forward currency | | | | |
| exchange contracts—Note 4 | | | | 2,989 |
| Accrued expenses | | | | 63,339 |
| | | | | 6,285,943 |
| |
| |
|
| Net Assets ($) | | | | 122,831,960 |
| |
| |
|
| Composition of Net Assets ($): | | | | |
| Paid-in capital | | | | 101,174,186 |
| Accumulated distributions in excess of investment income—net | | (31,947) |
| Accumulated distributions in excess of | | | | |
| net realized gain on investments | | | | (590,075) |
| Accumulated net unrealized appreciation (depreciation) | | | | |
| on investments and foreign currency transactions | | | | 22,279,796 |
| |
| |
|
| Net Assets ($) | | | | 122,831,960 |
| |
| |
|
| |
| |
| Net Asset Value Per Share | | | | |
| | | Initial Shares | | Service Shares |
| |
| |
|
| Net Assets ($) | | 88,713,348 | | 34,118,612 |
| Shares Outstanding | | 5,598,765 | | 2,151,059 |
| |
| |
|
| Net Asset Value Per Share ($) | | 15.85 | | 15.86 |
See notes to financial statements.
|
| STATEMENT OF OPERATIONS |
| Year Ended December 31, 2004 |
| Investment Income ($): | | |
| Income: | | |
| Cash dividends (net of $239,688 | | |
| foreign taxes withheld at source) | | 1,935,560 |
| Interest | | 48,584 |
| Total Income | | 1,984,144 |
| Expenses: | | |
| Investment advisory fee—Note 3(a) | | 883,641 |
| Custodian fees | | 156,425 |
| Distribution fees—Note 3(b) | | 35,127 |
| Professional fees | | 26,399 |
| Shareholder servicing costs—Note 3(b) | | 9,111 |
| Prospectus and shareholders’ reports | | 7,956 |
| Trustees’ fees and expenses—Note 3(c) | | 7,466 |
| Registration fees | | 1,044 |
| Loan commitment fees—Note 2 | | 607 |
| Miscellaneous | | 12,782 |
| Total Expenses | | 1,140,558 |
| Less—waiver of fees due to undertaking—Note 3(a) | | (12,008) |
| Less—reduction in custody fees due | | |
| to earnings credits—Note 1(c) | | (9,561) |
| Net Expenses | | 1,118,989 |
| Investment Income—Net | | 865,155 |
| |
|
| Realized and Unrealized Gain (Loss) on Investments—Note 4 ($): |
| Net realized gain (loss) on investments and foreign currency transactions | | 7,785,665 |
| Net realized gain (loss) on forward currency exchange contracts | | (153,120) |
| Net Realized Gain (Loss) | | 7,632,545 |
| Net unrealized appreciation (depreciation) | | |
| on investments and foreign currency transactions | | 9,969,437 |
| Net Realized and Unrealized Gain (Loss) on Investments | | 17,601,982 |
| Net Increase in Net Assets Resulting from Operations | | 18,467,137 |
See notes to financial statements.
|
STATEMENT OF CHANGES IN NET ASSETS
| | | Year Ended December 31, |
| |
|
| | | 2004 | | 2003 |
| |
| |
|
| Operations ($): | | | | |
| Investment income—net | | 865,155 | | 471,599 |
| Net realized gain (loss) on investments | | 7,632,545 | | (2,206,527) |
| Net unrealized appreciation | | | | |
| (depreciation) on investments | | 9,969,437 | | 16,754,204 |
| Net Increase (Decrease) in Net Assets | | | | |
| Resulting from Operations | | 18,467,137 | | 15,019,276 |
| |
| |
|
| Dividends to Shareholders from ($): | | | | |
| Investment income—net: | | | | |
| Initial shares | | (870,666) | | (521,404) |
| Service shares | | (257,284) | | (63,290) |
| Net realized gain on investments: | | | | |
| Initial shares | | (1,271,294) | | — |
| Service shares | | (468,090) | | — |
| Total Dividends | | (2,867,334) | | (584,694) |
| |
| |
|
| Beneficial Interest Transactions ($): | | | | |
| Net proceeds from shares sold: | | | | |
| Initial shares | | 40,833,715 | | 108,255,429 |
| Service shares | | 28,518,845 | | 1,360,085 |
| Dividends reinvested: | | | | |
| Initial shares | | 2,141,960 | | 521,404 |
| Service shares | | 725,374 | | 63,290 |
| Cost of shares redeemed: | | | | |
| Initial shares | | (25,431,592) | | (90,294,034) |
| Service shares | | (5,117,977) | | (769,106) |
| Increase (Decrease) in Net Assets from | | | | |
| Beneficial Interest Transactions | | 41,670,325 | | 19,137,068 |
| Total Increase (Decrease) in Net Assets | | 57,270,128 | | 33,571,650 |
| |
| |
|
| Net Assets ($): | | | | |
| Beginning of Period | | 65,561,832 | | 31,990,182 |
| End of Period | | 122,831,960 | | 65,561,832 |
| Undistributed (distributions in excess of) | | | | |
| investment income—net | | (31,947) | | 65,830 |
STATEMENT OF CHANGES IN NET ASSETS (continued)
|
| | | Year Ended December 31, |
| |
|
| | | 2004 | | 2003 |
| |
| |
|
| Capital Share Transactions: | | | | |
| Initial Shares | | | | |
| Shares sold | | 2,873,243 | | 9,773,093 |
| Shares issued for dividends reinvested | | 140,767 | | 42,253 |
| Shares redeemed | | (1,762,671) | | (8,211,240) |
| Net Increase (Decrease) in Shares Outstanding | | 1,251,339 | | 1,604,106 |
| |
| |
|
| Service Shares | | | | |
| Shares sold | | 1,966,357 | | 122,495 |
| Shares issued for dividends reinvested | | 47,425 | | 5,191 |
| Shares redeemed | | (357,787) | | (74,043) |
| Net Increase (Decrease) in Shares Outstanding | | 1,655,995 | | 53,643 |
See notes to financial statements.
|
The following tables describe the performance for each share class for the fiscal periods indicated.All information (except portfolio turnover rate) reflects financial results for a single portfolio share.Total return shows how much your investment in the portfolio would have increased (or decreased) during each period, assuming you had reinvested all dividends and distributions.These figures have been derived from the portfolio’s financial statements.
| | | | | Year Ended December 31, | | |
| |
| |
| |
|
| Initial Shares | | 2004 | | 2003 | | 2002 | | 2001 | | 2000 |
| |
| |
| |
| |
| |
|
| Per Share Data ($): | | | | | | | | | | |
| Net asset value, beginning of period | | 13.54 | | 10.04 | | 11.56 | | 13.52 | | 15.67 |
| Investment Operations: | | | | | | | | | | |
| Investment income—net a | | .16 | | .12 | | .12 | | .12 | | .11 |
| Net realized and unrealized | | | | | | | | | | |
| gain (loss) on investments | | 2.54 | | 3.51 | | (1.53) | | (1.90) | | (.74) |
| Total from Investment Operations | | 2.70 | | 3.63 | | (1.41) | | (1.78) | | (.63) |
| Distributions: | | | | | | | | | | |
| Dividends from investment income—net | | (.16) | | (.13) | | (.11) | | (.11) | | (.06) |
| Dividends from net realized | | | | | | | | | | |
| gain on investments | | (.23) | | — | | — | | — | | (1.40) |
| Dividends in excess of net | | | | | | | | | | |
| realized gain on investments | | — | | — | | — | | (.07) | | (.06) |
| Total Distributions | | (.39) | | (.13) | | (.11) | | (.18) | | (1.52) |
| Net asset value, end of period | | 15.85 | | 13.54 | | 10.04 | | 11.56 | | 13.52 |
| |
| |
| |
| |
| |
|
| Total Return (%) | | 20.02 | | 36.36 | | (12.23) | | (13.22) | | (3.69) |
| |
| |
| |
| |
| |
|
| Ratios/Supplemental Data (%): | | | | | | | | | | |
| Ratio of total expenses | | | | | | | | | | |
| to average net assets | | 1.25 | | 1.49 | | 1.47 | | 1.60 | | 1.39 |
| Ratio of net expenses | | | | | | | | | | |
| to average net assets | | 1.24 | | 1.41 | | 1.40 | | 1.40 | | 1.39 |
| Ratio of net investment income | | | | | | | | | | |
| to average net assets | | 1.08 | | 1.11 | | 1.10 | | .97 | | .78 |
| Portfolio Turnover Rate | | 44.05 | | 107.73 | | 47.18 | | 49.34 | | 37.33 |
| |
| |
| |
| |
| |
|
| Net Assets, end of period ($ x 1,000) | | 88,713 | | 58,849 | | 27,549 | | 21,602 | | 25,765 |
| |
| a Based on average shares outstanding at each month end. | | | | | | | | |
| See notes to financial statements. | | | | | | | | | | |
FINANCIAL HIGHLIGHTS (continued)
|
| | | | | | | Year Ended December 31, | | |
| | | |
| |
| |
|
| Service Shares | | 2004 | | 2003 | | 2002 | | 2001 | | 2000 a |
| |
| |
| |
| |
| |
|
| Per Share Data ($): | | | | | | | | | | |
| Net asset value, beginning of period | | 13.56 | | 10.06 | | 11.58 | | 13.52 | | 13.52 |
| Investment Operations: | | | | | | | | | | |
| Investment income—net | | .06b | | .14b | | .12b | | .05b | | — |
| Net realized and unrealized | | | | | | | | | | |
| gain (loss) on investments | | 2.62 | | 3.49 | | (1.54) | | (1.81) | | — |
| Total from Investment Operations | | 2.68 | | 3.63 | | (1.42) | | (1.76) | | — |
| Distributions: | | | | | | | | | | |
| Dividends from investment income—net | | (.15) | | (.13) | | (.10) | | (.11) | | — |
| Dividends from net realized | | | | | | | | | | |
| gain on investments | | (.23) | | — | | — | | — | | — |
| Dividends in excess of net | | | | | | | | | | |
| realized gain on investments | | — | | — | | — | | (.07) | | — |
| Total Distributions | | (.38) | | (.13) | | (.10) | | (.18) | | — |
| Net asset value, end of period | | 15.86 | | 13.56 | | 10.06 | | 11.58 | | 13.52 |
| |
| |
| |
| |
| |
|
| Total Return (%) | | 19.83 | | 36.28 | | (12.25) | | (13.07) | | — |
| |
| |
| |
| |
| |
|
| Ratios/Supplemental Data (%): | | | | | | | | | | |
| Ratio of total expenses | | | | | | | | | | |
| to average net assets | | 1.49 | | 1.75 | | 1.66 | | 1.99 | | — |
| Ratio of net expenses | | | | | | | | | | |
| to average net assets | | 1.39 | | 1.41 | | 1.40 | | 1.40 | | — |
| Ratio of net investment income | | | | | | | | | | |
| to average net assets | | .44 | | 1.29 | | 1.07 | | .44 | | — |
| Portfolio Turnover Rate | | 44.05 | | 107.73 | | 47.18 | | 49.34 | | 37.33 |
| |
| |
| |
| |
| |
|
| Net Assets, end of period ($ x 1,000) | | 34,119 | | 6,713 | | 4,441 | | 2,148 | | 1 |
| |
| a | | The portfolio commenced offering Service shares on December 31, 2000. | | | | | | |
| b | | Based on average shares outstanding at each month end. | | | | | | | | |
| See notes to financial statements. | | | | | | | | | | |
NOTES TO FINANCIAL STATEMENTS
NOTE 1—Significant Accounting Policies:
Dreyfus Variable Investment Fund (the “fund”) is registered under the Investment Company Act of 1940, as amended (the “Act”), as an open-end management investment company, operating as a series company currently offering twelve series, including the International Value Portfolio (the “portfolio”). The portfolio is only offered to separate accounts established by insurance companies to fund variable annuity contracts and variable life insurance policies.The portfolio is a diversified series. The portfolio’s investment objective is long-term capital growth.The Dreyfus Corporation (the “Manager” or “Dreyfus”) serves as the portfolio’s investment adviser.The Manager is a wholly-owned subsidiary of Mellon Financial Corporation (“Mellon Financial”).
Dreyfus Service Corporation (the “Distributor”), a wholly-owned subsidiary of the Manager, is the distributor of the portfolio’s shares, which are sold without a sales charge.The portfolio is authorized to issue an unlimited number of $.001 par value shares of Beneficial Interest in each of the following classes of shares: Initial and Service. Each class of shares has identical rights and privileges, except with respect to the distribution plan and the expenses borne by each class and certain voting rights. Income, expenses (other than expenses attributable to a specific class), and realized and unrealized gains or losses on investments are allocated to each class of shares based on its relative net assets.
The fund accounts separately for the assets, liabilities and operations of each series. Expenses directly attributable to each series are charged to that series’ operations; expenses which are applicable to all series are allocated among them on a pro rata basis.
The portfolio’s financial statements are prepared in accordance with U.S. generally accepted accounting principles, which may require the use of management estimates and assumptions.Actual results could differ from those estimates.
NOTES TO FINANCIAL STATEMENTS (continued)
|
The fund enters into contracts that contain a variety of indemnifica-tions.The portfolio’s maximum exposure under these arrangements is unknown. The portfolio does not anticipate recognizing any loss related to these arrangements.
(a) Portfolio valuation: Investments in securities are valued at the last sales price on the securities exchange or national securities market on which such securities are primarily traded. Securities listed on the National Market System for which market quotations are available are valued at the official closing price or, if there is no official closing price that day, at the last sales price. Securities not listed on an exchange or the national securities market, or securities for which there were no transactions, are valued at the average of the most recent bid and asked prices, except for open short positions, where the asked price is used for valuation purposes. Bid price is used when no asked price is avail-able.When market quotations or official closing prices are not readily available, or are determined not to reflect accurately fair value, such as when the value of a security has been significantly affected by events after the close of the exchange or market on which the security is principally traded (for example, a foreign exchange or market), but before the portfolio calculates its net asset value, the portfolio may value these investments at fair value as determined in accordance with the procedures approved by the Board of Trustees. Fair valuing of securities may be determined with the assistance of a pricing service using calculations based on indices of domestic securities and other appropriate indicators, such as prices of relevant ADR’s and futures contracts. For other securities that are fair valued by the Board of Trustees, certain factors may be considered such as: fundamental analytical data, the nature and duration of restrictions on disposition, an evaluation of the forces that influence the market in which the securities are purchased and sold and public trading in similar securities of the issuer or comparable issuers. Investments denominated in foreign currencies are translated to U.S. dollars at the prevailing rates of exchange. Forward currency exchange contracts are valued at the forward rate.
(b) Foreign currency transactions: The portfolio does not isolate that portion of the results of operations resulting from changes in foreign exchange rates on investments from the fluctuations arising from changes in market prices of securities held. Such fluctuations are included with the net realized and unrealized gain or loss on investments.
Net realized foreign exchange gains or losses arise from sales and maturities of short-term securities, sales of foreign currencies, currency gains or losses realized on securities transactions and the difference between the amounts of dividends, interest and foreign withholding taxes recorded on the portfolio’s books and the U.S. dollar equivalent of the amounts actually received or paid. Net unrealized foreign exchange gains or losses arise from changes in the value of assets and liabilities other than investments in securities, resulting from changes in exchange rates. Such gains and losses are included with net realized and unrealized gain or loss on investments.
(c) Securities transactions and investment income: Securities transactions are recorded on a trade date basis. Realized gain and loss from securities transactions are recorded on the identified cost basis. Dividend income is recognized on the ex-dividend date and interest income, including, where applicable, accretion of discount and amortization of premium on investments, is recognized on the accrual basis.
The portfolio has an arrangement with the custodian bank whereby the portfolio receives earnings credits from the custodian when positive cash balances are maintained, which are used to offset custody fees. For financial reporting purposes, the portfolio includes net earnings credits as an expense offset in the Statement of Operations.
(d) Dividends to shareholders: Dividends are recorded on the ex-dividend date. Dividends from investment income-net and dividends from net realized capital gain, if any, are normally declared and paid annually, but the portfolio may make distributions on a more frequent basis to comply with the distribution requirements of the Internal Revenue
NOTES TO FINANCIAL STATEMENTS (continued)
|
Code of 1986, as amended (the “Code”).To the extent that net realized capital gain can be offset by capital loss carryovers, if any, it is the policy of the portfolio not to distribute such gain. Income and capital gain distributions are determined in accordance with income tax regulations, which may differ from U.S. generally accepted accounting principles.
(e) Federal income taxes: It is the policy of the portfolio to continue to qualify as a regulated investment company, if such qualification is in the best interests of its shareholders, by complying with the applicable provisions of the Code, and to make distributions of taxable income sufficient to relieve it from substantially all federal income and excise taxes.
At December 31, 2004, the components of accumulated earnings on a tax basis were as follows: undistributed ordinary income $639,368, undistributed capital gains $1,219,842 and unrealized appreciation $19,798,564.
The tax character of distributions paid to shareholders during the fiscal periods ended December 31, 2004 and December 31, 2003 were as follows: ordinary income $1,127,950 and $584,694 and long-term capital gains $1,739,384 and $0, respectively.
During the period ended December 31, 2004, as a result of permanent book to tax differences primarily due to the tax treatment for passive foreign investment companies and foreign currency transactions, the portfolio increased accumulated undistributed investment income-net by $165,018 and decreased accumulated net realized gain (loss) on investments by the same amount. Net assets were not affected by this reclassification.
NOTE 2—Bank Line of Credit:
|
The portfolio participates with other Dreyfus-managed funds in a $350 million redemption credit facility (the “Facility”) to be utilized for temporary or emergency purposes, including the financing of
redemptions. In connection therewith, the portfolio has agreed to pay commitment fees on its pro rata portion of the Facility. Interest is charged to the portfolio based on prevailing market rates in effect at the time of borrowings. During the period ended December 31, 2004, the portfolio did not borrow under the Facility.
NOTE 3—Investment Advisory Fee and Other Transactions With Affiliates:
(a) Pursuant to an Investment Advisory Agreement with the Manager, the investment advisory fee is computed at the annual rate of 1% of the value of the portfolio’s average daily net assets and is payable monthly.
The Manager has agreed, from January 1, 2004 to December 31, 2005, to waive receipt of its fees and/or assume the expenses of the portfolio so that the expenses of neither class, exclusive of taxes, brokerage fees, interest on borrowings, commitment fees and extraordinary expenses, exceed an annual rate of 1.40% of the value of the average daily net assets of their class. During the period ended December 31, 2004, the Manager waived receipt of fees of $12,008, pursuant to the undertaking.
(b) Under the Distribution Plan (the “Plan”) adopted pursuant to Rule 12b-1 under the Act, Service shares pay the Distributor for distributing their shares, for servicing and/or maintaining Service shares shareholder accounts and for advertising and marketing for Service shares.The Plan provides for payments to be made at an annual rate of .25 of 1% of the value of the Service shares’ average daily net assets.The Distributor may make payments to Participating Insurance Companies and to brokers and dealers acting as principal underwriter for their variable insurance products.The fees payable under the Plan are payable without regard to actual expenses incurred. During the period ended December 31, 2004, Service shares were charged $35,127 pursuant to the Plan.
NOTES TO FINANCIAL STATEMENTS (continued)
|
The portfolio compensates Dreyfus Transfer, Inc., a wholly-owned subsidiary of the Manager, under a transfer agency agreement for providing personnel and facilities to perform transfer agency services for the portfolio. During the period ended December 31, 2004, the portfolio was charged $307 pursuant to the transfer agency agreement.
The components of Due to The Dreyfus Corporation and affiliates in the Statement of Assets and Liabilities consist of: investment advisory fees $103,850, Rule 12b-1 distribution plan fees $6,887 and transfer agency per account fees $70.
(c) Each Board member also serves as a Board member of other funds within the Dreyfus complex. Annual retainer fees and attendance fees are allocated to each fund based on net assets.
NOTE 4—Securities Transactions:
|
The aggregate amount of purchases and sales of investment securities, excluding short-term securities and forward currency exchange contracts, during the period ended December 31, 2004, amounted to $81,497,879 and $37,389,553, respectively.
The portfolio enters into forward currency exchange contracts in order to hedge its exposure to changes in foreign currency exchange rates on its foreign portfolio holdings and to settle foreign currency transactions. When executing forward currency exchange contracts, the portfolio is obligated to buy or sell a foreign currency at a specified rate on a certain date in the future. With respect to sales of forward currency exchange contracts, the portfolio would incur a loss if the value of the contract increases between the date the forward contract is opened and the date the forward contract is closed.The portfolio realizes a gain if the value of the contract decreases between those dates.With respect to purchases of forward currency exchange contracts, the portfolio would incur a loss if the value of the contract decreases between the date the forward contract is opened and the date the forward contract is closed. The portfolio realizes a gain if the value of the contract increases
between those dates.The portfolio is also exposed to credit risk associated with counterparty nonperformance on these forward currency exchange contracts which is typically limited to the unrealized gain on each open contract.The following summarizes open forward currency exchange contracts at December 31, 2004:
| | | Foreign | | | | | | Unrealized |
| Forward Currency | | Currency | | | | | | Appreciation |
| Exchange Contracts | | Amounts | | Cost ($) | | Value ($) | | (Depreciation) ($) |
| |
| |
| |
| |
|
| Purchases: | | | | | | | | |
| Euro, | | | | | | | | |
| expiring 1/3/2005 | | 496,585 | | 674,958 | | 673,667 | | (1,291) |
| Hong Kong Dollar, | | | | | | | | |
| expiring 1/3/2005 | | 338,393 | | 43,537 | | 43,537 | | — |
| Norwegian Krone, | | | | | | | | |
| expiring 1/4/2005 | | 769,387 | | 127,424 | | 126,673 | | (751) |
| Singapore Dollar, | | | | | | | | |
| expiring 1/4/2005 | | 95,561 | | 58,537 | | 58,544 | | 7 |
| Swiss Franc, | | | | | | | | |
| expiring 1/3/2005 | | 437,758 | | 385,181 | | 384,234 | | (947) |
| Total | | | | | | | | (2,982) |
At December 31, 2004, the cost of investments for federal income tax purposes was $103,309,842; accordingly, accumulated net unrealized appreciation on investments was $19,766,924, consisting of $22,834,729 gross unrealized appreciation and $3,067,805 gross unrealized depreciation.
In early 2004, two purported class and derivative actions were filed against Mellon Financial, Mellon Bank, N.A., Dreyfus, Founders Asset Management LLC, and certain directors of the Dreyfus Funds and the Dreyfus Founders Funds (together, the “Funds”). In September 2004, plaintiffs served a Consolidated Amended Complaint (the “Amended Complaint”) on behalf of a purported class of all persons who acquired interests in any of the Funds between January 30, 1999 and
NOTES TO FINANCIAL STATEMENTS (continued)
|
November 17, 2003, and derivatively on behalf of the Funds. The Amended Complaint in the newly styled In re Dreyfus Mutual Funds Fee Litigation also named the Distributor, Premier Mutual Fund Services, Inc. and two additional Fund directors as defendants and alleges violations of the Investment Company Act of 1940, the Investment Advisers Act of 1940, the Pennsylvania Unfair Trade Practices and Consumer Protection Law and common-law claims. Plaintiffs seek to recover allegedly improper and excessive Rule 12b-1 and advisory fees allegedly charged to the Funds for marketing and distribution services. More specifically, plaintiffs claim, among other things, that 12b-1 fees and directed brokerage were improperly used to pay brokers to recommend the Funds over other funds, and that such payments were not disclosed to investors. In addition, plaintiffs assert that economies of scale and soft-dollar benefits were not passed on to the Funds. Plaintiffs further allege that 12b-1 fees were improperly charged to certain of the Funds that were closed to new investors.The Amended Complaint seeks compensatory and punitive damages, rescission of the advisory contracts, and an accounting and restitution of any unlawful fees, as well as an award of attorneys’ fees and litigation expenses. As noted, some of the claims in this litigation are asserted derivatively on behalf of the Funds that have been named as nominal defendants.With respect to such derivative claims, no relief is sought against the Funds. Dreyfus believes the allegations to be totally without merit and intends to defend the action vigorously. Defendants filed motions to dismiss the Amended Complaint on November 12, 2004, and those motions are pending.
Additional lawsuits arising out of these circumstances and presenting similar allegations and requests for relief may be filed against the defendants in the future. Neither Dreyfus nor the Funds believe that any of the pending actions will have a material adverse effect on the Funds or Dreyfus’ ability to perform its contract with the Funds.
| REPORT OF INDEPENDENT REGISTERED |
| PUBLIC ACCOUNTING FIRM |
Shareholders and Board of Trustees
Dreyfus Variable Investment Fund, International Value Portfolio
We have audited the accompanying statement of assets and liabilities, including the statement of investments, of Dreyfus Variable Investment Fund, International Value Portfolio (one of the funds comprising Dreyfus Variable Investment Fund) as of December 31, 2004, and the related statement of operations for the year then ended, the statement of changes in net assets for each of the two years in the period then ended, and financial highlights for each of the periods indicated therein.These financial statements and financial highlights are the responsibility of the Fund’s management. Our responsibility is to express an opinion on these financial statements and financial highlights based on our audits.
We conducted our audits in accordance with the standards of the Public Company Accounting Oversight Board (United States).Those standards require that we plan and perform the audit to obtain reasonable assurance about whether the financial statements and financial highlights are free of material misstatement. An audit includes examining, on a test basis, evidence supporting the amounts and disclosures in the financial statements and financial highlights. Our procedures included confirmation of securities owned as of December 31, 2004 by correspondence with the custodian and others. An audit also includes assessing the accounting principles used and significant estimates made by management, as well as evaluating the overall financial statement presentation. We believe that our audits provide a reasonable basis for our opinion.
In our opinion, the financial statements and financial highlights referred to above present fairly, in all material respects, the financial position of Dreyfus Variable Investment Fund, International Value Portfolio at December 31, 2004, the results of its operations for the year then ended, the changes in its net assets for each of the two years in the period then ended, and the financial highlights for each of the indicated periods, in conformity with U. S. generally accepted accounting principles.

| New York, New York |
| February 4, 2005 |
The Portfolio 29
IMPORTANT TAX INFORMATION (Unaudited)
In accordance with federal tax law, the portfolio elects to provide each shareholder with their portion of the portfolio’s foreign taxes paid and the income sourced from foreign countries.Accordingly, the portfolio hereby makes the following designations regarding its fiscal year ended December 31, 2004:
—the total amount of taxes paid to foreign countries was $239,688.
—the total amount of income sourced from foreign countries was $1,353,380.
As required by federal tax law rules, shareholders will receive notification of their proportionate share of foreign taxes paid and foreign source income for the 2004 calendar year with Form 1099-DIV which will be mailed by January 31, 2005.
Also, the portfolio hereby designates a $.2260 per share as a long-term capital gain distribution paid on December 16, 2004.
BOARD MEMBERS INFORMATION (Unaudited)
Joseph S. DiMartino (61) Chairman of the Board (1995)
Principal Occupation During Past 5 Years:
• Corporate Director and Trustee
Other Board Memberships and Affiliations:
- The Muscular Dystrophy Association, Director
- Levcor International, Inc., an apparel fabric processor, Director
- Century Business Services, Inc., a provider of outsourcing functions for small and medium size companies, Director
- The Newark Group, a provider of a national market of paper recovery facilities, paperboard mills and paperboard converting plants, Director
- Azimuth Trust, an institutional asset management firm, Member of Board of Managers and Advisory Board
No. of Portfolios for which Board Member Serves: 186
David P. Feldman (65)
Board Member (1994)
|
Principal Occupation During Past 5 Years:
• Corporate Director and Trustee
Other Board Memberships and Affiliations:
- BBH Mutual Funds Group (11 funds), Director
- The Jeffrey Company, a private investment company, Director
- QMED, a medical device company, Director
No. of Portfolios for which Board Member Serves: 51
———————
James F. Henry (74) Board Member (1990)
Principal Occupation During Past 5 Years:
- President, CPR Institute for Dispute Resolution, a non-profit organization principally engaged in the development of alternatives to business litigation (Retired 2003)
No. of Portfolios for which Board Member Serves: 22
———————
Rosalind Gersten Jacobs (79) Board Member (1990)
Principal Occupation During Past 5 Years:
• Merchandise and marketing consultant
No. of Portfolios for which Board Member Serves: 33
BOARD MEMBERS INFORMATION (Unaudited) (continued)
Dr. Paul A. Marks (78) Board Member (1990)
Principal Occupation During Past 5 Years:
• President and Chief Executive Officer of Memorial Sloan-Kettering Cancer Center (Retired 1999)
Other Board Memberships and Affiliations:
|
- Pfizer, Inc., a pharmaceutical company, Director-Emeritus
- Atom Pharm, Director
- Lazard Freres & Company, LLC, Senior Adviser
- Merck, Consultant
No. of Portfolios for which Board Member Serves: 22
|
Dr. Martin Peretz (65)
Board Member (1990)
|
Principal Occupation During Past 5 Years:
|
- Editor-in-Chief of The New Republic Magazine
- Lecturer in Social Studies at Harvard University (1965-2001)
- Co-Chairman of TheStreet.com, a financial daily on the web
Other Board Memberships and Affiliations:
|
- Academy for Liberal Education, an accrediting agency for colleges and universities certified by the U.S. Department of Education, Director
- Digital Learning Group, LLC, an online publisher of college textbooks, Director
- Harvard Center for Blood Research,Trustee
- Bard College,Trustee
- YIVO Institute for Jewish Research,Trustee
No. of Portfolios for which Board Member Serves: 22
|
———————
Bert W.Wasserman (72) Board Member (1993)
Principal Occupation During Past 5 Years:
• Financial Consultant
Other Board Memberships and Affiliations:
• Lillian Vernon Corporation, Director
|
No. of Portfolios for which Board Member Serves: 22
|
———————
Once elected all Board Members serve for an indefinite term.The address of the Board Members and Officers is in c/o The Dreyfus Corporation, 200 Park Avenue, New York, New York 10166.Additional information about the Board Members is available in the fund’s Statement of Additional Information which can be obtained from Dreyfus free of charge by calling this toll free number: 1-800-554-4611.
John M. Fraser, Jr., Emeritus Board Member
Irving Kristol, Emeritus Board Member
|
OFFICERS OF THE FUND (Unaudited)
STEPHEN E. CANTER, President since March 2000.
Chairman of the Board, Chief Executive Officer and Chief Operating Officer of the Manager, and an officer of 92 investment companies (comprised of 185 portfolios) managed by the Manager. Mr. Canter also is a Board member and, where applicable, an Executive Committee Member of the other investment management subsidiaries of Mellon Financial Corporation, each of which is an affiliate of the Manager. He is 59 years old and has been an employee of the Manager since May 1995.
STEPHEN R. BYERS, Executive Vice President since November 2002.
Chief Investment Officer,Vice Chairman and a director of the Manager, and an officer of 92 investment companies (comprised of 185 portfolios) managed by the Manager. Mr. Byers also is an officer, director or an Executive Committee Member of certain other investment management subsidiaries of Mellon Financial Corporation, each of which is an affiliate of the Manager. He is 51 years old and has been an employee of the Manager since January 2000. Prior to joining the Manager, he served as an Executive Vice President-Capital Markets, Chief Financial Officer and Treasurer at Gruntal & Co., L.L.C.
MARK N. JACOBS, Vice President since March 2000.
Executive Vice President, Secretary and General Counsel of the Manager, and an officer of 93 investment companies (comprised of 201 portfolios) managed by the Manager. He is 58 years old and has been an employee of the Manager since June 1977.
MICHAEL A. ROSENBERG, Secretary since March 2000.
Associate General Counsel of the Manager, and an officer of 90 investment companies (comprised of 194 portfolios) managed by the Manager. He is 44 years old and has been an employee of the Manager since October 1991.
ROBERT R. MULLERY, Assistant Secretary since March 2000.
Associate General Counsel of the Manager, and an officer of 26 investment companies (comprised of 60 portfolios) managed by the Manager. He is 52 years old and has been an employee of the Manager since May 1986.
STEVEN F. NEWMAN, Assistant Secretary since March 2000.
Associate General Counsel and Assistant Secretary of the Manager, and an officer of 93 investment companies (comprised of 201 portfolios) managed by the Manager. He is 55 years old and has been an employee of the Manager since July 1980.
JAMES WINDELS, Treasurer since November 2001.
Director – Mutual Fund Accounting of the Manager, and an officer of 93 investment companies (comprised of 201 portfolios) managed by the Manager. He is 46 years old and has been an employee of the Manager since April 1985.
RICHARD CASSARO, Assistant Treasurer since August 2003.
Senior Accounting Manager – Equity Funds of the Manager, and an officer of 26 investment companies (comprised of 102 portfolios) managed by the Manager. He is 44 years old and has been an employee of the Manager since September 1982.
OFFICERS OF THE FUND (Unaudited) (continued)
ERIK D. NAVILOFF, Assistant Treasurer since December 2002.
Senior Accounting Manager – Taxable Fixed Income Funds of the Manager, and an officer of 19 investment companies (comprised of 75 portfolios) managed by the Manager. He is 36 years old and has been an employee of the Manager since November 1992.
ROBERT ROBOL, Assistant Treasurer since August 2003.
Senior Accounting Manager – Money Market Funds of the Manager, and an officer of 39 investment companies (comprised of 84 portfolios) managed by the Manager. He is 40 years old and has been an employee of the Manager since October 1988.
ROBERT SVAGNA, Assistant Treasurer since December 2002.
Senior Accounting Manager – Equity Funds of the Manager, and an officer of 27 investment companies (comprised of 107 portfolios) managed by the Manager. He is 37 years old and has been an employee of the Manager since November 1990.
KENNETH J. SANDGREN, Assistant Treasurer since November 2001.
Mutual Funds Tax Director of the Manager, and an officer of 93 investment companies (comprised of 201 portfolios) managed by the Manager. He is 50 years old and has been an employee of the Manager since June 1993.
JOSEPH W. CONNOLLY, Chief Compliance Officer since October 2004.
Chief Compliance Officer of the Manager and The Dreyfus Family of Funds (93 investment companies, comprising 201 portfolios). From November 2001 through March 2004, Mr. Connolly was first Vice-President, Mutual Fund Servicing for Mellon Global Securities Services. In that capacity, Mr. Connolly was responsible for managing Mellon’s Custody, Fund Accounting and Fund Administration services to third-party mutual fund clients. He is 47 years old and has served in various capacities with the Manager since 1980, including manager of the firm’s Fund Accounting Department from 1997 through October 2001.
WILLIAM GERMENIS, Anti-Money Laundering Compliance Officer since September 2002.
Vice President and Anti-Money Laundering Compliance Officer of the Distributor, and the Anti-Money Laundering Compliance Officer of 88 investment companies (comprised of 196 portfolios) managed by the Manager. He is 34 years old and has been an employee of the Distributor since October 1998.
NOTES
| Dreyfus Variable |
| Investment Fund, |
| International Value Portfolio |
| 200 Park Avenue |
| New York, NY 10166 |
| |
| Investment Adviser |
| The Dreyfus Corporation |
| 200 Park Avenue |
| New York, NY 10166 |
| |
| Custodian |
| The Bank of New York |
| One Wall Street |
| New York, NY 10286 |
| Transfer Agent & |
| Dividend Disbursing Agent |
| Dreyfus Transfer, Inc. |
| 200 Park Avenue |
| New York, NY 10166 |
| |
| Distributor |
| Dreyfus Service Corporation |
| 200 Park Avenue |
| New York, NY 10166 |
Telephone 1-800-554-4611 or 516-338-3300
Mail The Dreyfus Family of Funds, 144 Glenn Curtiss Boulevard, Uniondale, NY 11556-0144 Attn: Institutional Servicing
The portfolio files its complete schedule of portfolio holdings with the Securities and
Exchange Commission (“SEC”) for the first and third quarters of each fiscal year on Form N-Q. The portfolio’s Forms N-Q are available on the SEC’s website at http://www.sec.gov and may be reviewed and copied at the SEC’s Public Reference Room in Washington, DC. Information on the operation of the Public Reference Room may be obtained by calling 1-800-SEC-0330.
A description of the policies and procedures that the portfolio uses to determine how to vote proxies relating to portfolio securities, and information regarding how the portfolio voted these proxies for the 12-month period ended June 30, 2004, is available through the portfolio’s website at http://www.dreyfus.com and on the SEC’s website at http://www.sec.gov. The description of the policies and procedures is also available without charge, upon request, by calling 1-800-645-6561.
© 2005 Dreyfus Service Corporation

| Dreyfus Variable |
| Investment Fund, |
| Limited Term |
| High Yield Portfolio |
ANNUAL REPORT December 31, 2004

The views expressed in this report reflect those of the portfolio manager only through the end of the period covered and do not necessarily represent the views of Dreyfus or any other person in the Dreyfus organization.Any such views are subject to change at any time based upon market or other conditions and Dreyfus disclaims any responsibility to update such views. These views may not be relied on as investment advice and, because investment decisions for a Dreyfus portfolio are based on numerous factors, may not be relied on as an indication of trading intent on behalf of any Dreyfus portfolio.
Not FDIC-Insured • Not Bank-Guaranteed • May Lose Value
| | | Contents |
| |
| | | THE PORTFOLIO |
| |
|
| 2 | | Letter from the Chairman |
| 3 | | Discussion of Performance |
| 6 | | Portfolio Performance |
| 8 | | Understanding Your Portfolio's Expenses |
| 8 | | Comparing Your Portfolio's Expenses |
| | | With Those of Other Funds |
| 9 | | Statement of Investments |
| 22 | | Statement of Assets and Liabilities |
| 23 | | Statement of Operations |
| 24 | | Statement of Changes in Net Assets |
| 26 | | Financial Highlights |
| 28 | | Notes to Financial Statements |
| 39 | | Report of Independent Registered |
| | | Public Accounting Firm |
| 40 | | Important Tax Information |
| 41 | | Board Members Information |
| 43 | | Officers of the Fund |
| | | FOR MORE INFORMATION |
| |
|
| | | Back Cover |
| Dreyfus Variable Investment Fund, |
| Limited Term High Yield Portfolio |
The Portfolio

LETTER FROM THE CHAIRMAN
Dear Shareholder:
We are pleased to present this annual report for Dreyfus Variable Investment Fund, Limited Term High Yield Portfolio, covering the 12-month period from January 1, 2004, through December 31, 2004. Inside, you'll find valuable information about how the portfolio was managed during the reporting period, including a discussion with Gerald E. Thunelius, portfolio manager and Director of the Dreyfus Taxable Fixed Income Team that managed the portfolio during the prior fiscal year.
Despite a moderately growing economy and rising interest rates over the second half of the year, the yield of the benchmark 10-year U.S. Treasury bond ended 2004 virtually unchanged from where it began. At the same time, corporate bonds generally continued to gain value as business conditions improved, and mortgage-backed securities benefited from waning prepayment activity among homeowners.
Can bonds continue to deliver positive results in 2005? No one knows for certain. However, with short-term interest rates rising and the economy gaining momentum, we believe that some areas of the fixed-income market are likely to be stronger than others.What's required for success, in our view, is strong fundamental research and keen professional judgment.
As always, we urge our shareholders to view the financial markets from a long-term perspective, measured in years rather than weeks or months. One of the best ways to ensure a long-term perspective is to establish an investment plan with the help of your financial advisor, and review it periodically to track your progress toward your financial goals.
Thank you for your continued confidence and support.

Stephen E. Canter
Chairman and Chief Executive Officer
The Dreyfus Corporation
February 1, 2005
|
2

DISCUSSION OF PERFORMANCE
Gerald E. Thunelius, Director and Senior Portfolio Manager Dreyfus Taxable Fixed Income Team
How did Dreyfus Variable Investment Fund, Limited Term High Yield Portfolio perform during the period?
For the 12-month period ended December 31,2004,the portfolio's Initial shares achieved a total return of 10.10%, and its Service shares achieved a total return of 10.06% . The portfolio generated aggregate income dividends of $0.498 for Initial shares and $0.486 for Service shares.1 The Merrill Lynch High Yield Master II Index (the “Index”), the portfolio's benchmark, achieved a total return of 10.87% for the same period.2
Corporate bond prices rose during 2004 as business conditions improved in a stronger economy. Returns were particularly strong during the second half of the year when political and economic uncertainty began to ease. The portfolio's returns were slightly lower than the Index, primarily due to the effects of fees and other fund expenses that were not reflected in the benchmark's performance.
What is the portfolio's investment approach?
The portfolio seeks to maximize total return consisting of capital appreciation and current income by investing in high-yield fixed-income securities. The average effective maturity of the portfolio is limited to 5.5 years.
We normally invest most of the portfolio's assets in fixed-income securities of below investment-grade credit quality. Issuers of below investment-grade securities may be in the early stages of development or may have highly leveraged balance sheets.To compensate buyers for taking greater risks, these companies must offer higher yields than those offered by more highly rated firms.
Our approach to selecting individual issues is based on careful credit analysis.We thoroughly analyze the business, management and financial strength of each of the companies whose bonds we buy, then project each issuer's ability to repay its debt.
The Portfolio 3
DISCUSSION OF PERFORMANCE (continued)
What other factors influenced the portfolio's performance?
The U.S. economy generally strengthened over the reporting period, leading to improved business conditions for many corporate bond issuers. During the first quarter of 2004, however, the economy generally recovered more slowly than investors had expected, and inflationary pressures remained low. As a result, bond prices generally were little changed over the reporting period's first half.
However, the U.S. economy appeared to gain momentum during the spring of 2004, when surprisingly strong labor statistics and higher energy prices suggested that long-dormant inflationary pressures might be resurfacing. Although rising inflation concerns led to sharply lower prices for U.S.Treasury securities and other areas of the bond market that tend to be more sensitive to changing interest rates, high-yield corporate bonds held more of their value as investors continued to look forward to better business conditions and a strengthening economy.
To forestall a potential acceleration of inflation, the Federal Reserve Board (the “Fed”) raised its target for short-term interest rates five times between June and December, driving the overnight federal funds rate to 2.25% . The initial rate hike in late June represented the Fed's first move toward higher interest rates in more than four years. However, new economic data released during the summer of 2004 proved generally disappointing. Investors' inflation fears began to wane, and the more interest-rate-sensitive areas of the U.S. bond market rallied later in the reporting period, while prices of high-yield corporate bonds remained relatively flat.
In this environment, we attempted to balance the portfolio's positions in lower-rated corporate bonds with holdings of shorter-term, more highly rated high-yield bonds.This “barbell” structure was designed to help the portfolio participate in the income and potential gains of lower-rated credits while attempting to manage risks through higher-quality, shorter-term positions. Indeed, this investment posture helped the fund participate in a market rally over the final months of 2004. The rally was driven by improving investor sentiment after the resolution of the presidential election and amid signs of stronger economic growth.
The portfolio received particularly strong contributions to performance during the reporting period from its holdings in the utilities sector and its relatively light exposure to retailers. Among individual
4
issues, chemicals producer Resolution Performance Products Capital ranked among the portfolio's top performers due to rising demand from manufacturers around the world.The portfolio also received positive contributions from a number of bonds that once were considered “distressed” credits, including building products manufacturer Owens Corning and apparel maker HCI Direct. Good results from these positions were partially offset by disappointing returns from others, such as energy company Calpine, which was hurt by deteriorating business fundamentals, and media company Pegasus Communications, which encountered financial difficulties. The portfolio's returns also were hampered by its relatively large cash holdings during 2004.
What is the portfolio's current strategy?
Effective January 31, 2005, Jonathan Uhrig assumed primary portfolio management responsibility over the portfolio. John McNichols was appointed as an additional portfolio manager. Mr. Uhrig is a Portfolio Manager for High Yield Strategies, and is also head of high-yield trading, at Standish Mellon Asset Management, LLC — an affiliate of Dreyfus. Mr. McNichols is the Director of Credit Research and Investment at Standish Mellon, overseeing all of Standish Mellon's global credit research. Each manages the portfolio under a dual-employee relationship with Dreyfus.
February 1, 2005
| | | The portfolio is only available as a funding vehicle under variable life insurance policies or variable |
| | | annuity contracts issued by insurance companies. Individuals may not purchase shares of these |
| | | portfolios directly.A variable annuity is an insurance contract issued by an insurance company that |
| | | enables investors to accumulate assets on a tax-deferred basis for retirement or other long-term |
| | | goals.The investment objective and policies of Dreyfus Variable Investment Fund, Limited Term |
| | | High Yield Portfolio may be similar to other funds/portfolios managed or advised by Dreyfus. |
| | | However, the investment results of the portfolio may be higher or lower than, and may not be |
| | | comparable to, those of any other Dreyfus fund/portfolio. |
| 1 | | Total return includes reinvestment of dividends and any capital gains paid. Past performance is no |
| | | guarantee of future results. Share price and investment return fluctuate such that upon redemption, |
| | | portfolio shares may be worth more or less than their original cost.The portfolio's performance does |
| | | not reflect the deduction of additional charges and expenses imposed in connection with investing |
| | | in variable insurance contracts, which will reduce returns. Return figures provided reflect the |
| | | absorption of certain portfolio expenses by The Dreyfus Corporation pursuant to an agreement |
| | | that was in effect through December 31, 2004, and which was extended to December 31, 2005. |
| | | Had these expenses not been absorbed, the portfolio's returns would have been lower. |
| 2 | | SOURCE: LIPPER INC. — Reflects reinvestment of dividends and, where applicable, capital |
| | | gain distributions.The Merrill Lynch High Yield Master II Index is an unmanaged performance |
| | | benchmark composed of U.S. domestic and Yankee bonds rated below investment grade with at |
| | | least $100 million par amount outstanding and greater than or equal to one year to maturity. |
| | | Unlike the portfolio, it is not limited by any maximum average maturity. |
The Portfolio 5
PORTFOLIO PERFORMANCE
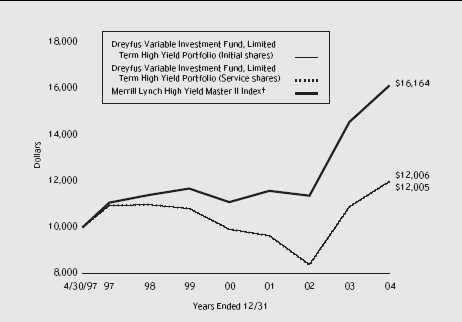
Comparison of change in value of $10,000 investment in Dreyfus Variable Investment Fund, Limited Term High Yield Portfolio Initial shares and Service shares and the Merrill Lynch High Yield Master II Index
| Average Annual Total Returns | | as of 12/31/04 | | | | |
| | | Inception | | | | | | From |
| | | Date | | 1 Year | | 5 Years | | Inception |
| |
| |
| |
| |
|
| Initial shares | | 4/30/97 | | 10.10% | | 2.09% | | 2.41% |
| Service shares | | 4/30/97 | | 10.06% | | 2.09% | | 2.41% |
| The data for Service shares includes the results of Initial shares for the period prior to December 31, 2000 |
| (inception date of Service shares). Actual Service shares' average annual total return and hypothetical growth |
| results would have been lower. See notes below. |
| † Source: Lipper Inc. |
| Past performance is not predictive of future performance.The portfolio's performance shown in the graph and table |
| does not reflect the deduction of taxes that a shareholder would pay on portfolio distributions or the redemption of |
| portfolio shares. |
| The portfolio's performance does not reflect the deduction of additional charges and expenses imposed in |
| connection with investing in variable insurance contracts which will reduce returns. |
| The above graph compares a $10,000 investment made in Initial and Service shares of Dreyfus Variable Investment |
| Fund, Limited Term High Yield Portfolio on 4/30/97 (inception date of Initial shares) to a $10,000 investment made |
| in the Merrill Lynch High Yield Master II Index (the “Index”) on that date. |
The portfolio's Initial shares are not subject to a Rule 12b-1 fee.The portfolio's Service shares are subject to a 0.25% annual Rule 12b-1 fee.The performance figures for Service shares reflect the performance of the portfolio's Initial shares from their inception date through December 30, 2000, and the performance of the portfolio's Service shares from December 31, 2000 (inception date of Service shares) to December 31, 2004 (blended performance figures).The performance figures for each share class reflect certain expense reimbursements, without which the performance of each share class would have been lower. In addition, the blended performance figures have not been adjusted to reflect the higher operating expenses of the Service shares. If these expenses had been reflected, the blended performance figures would have been lower. All dividends and capital gain distributions are reinvested.
The portfolio's performance shown in the line graph takes into account all applicable portfolio fees and expenses (after any expense reimbursements).The Index is an unmanaged performance benchmark composed of U.S. domestic and Yankee bonds rated below investment grade with at least $100 million par amounts outstanding and greater than or equal to one year to maturity.The Index does not take into account charges, fees and other expenses. Further information relating to portfolio performance, including expense reimbursements, if applicable, is contained in the Financial Highlights section of the prospectus and elsewhere in this report.
The Portfolio 7
UNDERSTANDING YOUR PORTFOLIO'S EXPENSES (Unaudited)
|
As a mutual fund investor,you pay ongoing expenses,such as management fees and other expenses.Using the information below,you can estimate how these expenses affect your investment and compare them with the expenses of other funds.You also may pay one-time transaction expenses,including sales charges (loads) and redemption fees, which are not shown in this section and would have resulted in higher total expenses. For more information, see your portfolio's prospectus or talk to your financial adviser.
Review your portfolio's expenses
The table below shows the expenses you would have paid on a $1,000 investment in Dreyfus Variable Investment Fund, Limited Term High Yield Portfolio from July 1, 2004 to December 31, 2004. It also shows how much a $1,000 investment would be worth at the close of the period, assuming actual returns and expenses.
| Expenses and Value of a $1,000 Investment | | |
| assuming actual returns for the six months ended December 31, 2004 |
| | | Initial Shares | | Service Shares |
| |
| |
|
| Expenses paid per $1,000 † | | $ 4.72 | | $ 4.72 |
| Ending value (after expenses) | | $1,087.30 | | $1,087.90 |
COMPARING YOUR PORTFOLIO'S EXPENSES
WITH THOSE OF OTHER FUNDS (Unaudited)
|
Using the SEC's method to compare expenses
The Securities and Exchange Commission (SEC) has established guidelines to help investors assess fund expenses. Per these guidelines, the table below shows your portfolio's expenses based on a $1,000 investment, assuming a hypothetical 5% annualized return. You can use this information to compare the ongoing expenses (but not transaction expenses or total cost) of investing in the portfolio with those of other funds. All mutual fund shareholder reports will provide this information to help you make this comparison. Please note that you cannot use this information to estimate your actual ending account balance and expenses paid during the period.
Expenses and Value of a $1,000 Investment assuming a hypothetical 5% annualized return for the six months ended December 31, 2004
| | | Initial Shares | | Service Shares |
| |
| |
|
| Expenses paid per $1,000 † | | $ 4.57 | | $ 4.57 |
| Ending value (after expenses) | | $1,020.61 | | $1,020.61 |
† Expenses are equal to the portfolio's annualized expense ratio of .90% for Initial shares and .90% for Service shares, multiplied by the average account value over the period, multiplied by 184/366 (to reflect the one-half year period).
STATEMENT OF INVESTMENTS
December 31, 2004
|
| | | Principal | | | | |
| Bonds and Notes—81.1% | | Amount ($) | | Value ($) |
| |
| |
|
| Advertising—.3% | | | | | | |
| RH Donnelley Financial: | | | | | | |
| Sr. Notes, 8.875%, 2010 | | 48,000 | | a | | 53,760 |
| Sr. Sub. Notes, 10.875%, 2012 | | 39,000 | | a | | 46,508 |
| | | | | | | 100,268 |
| Aerospace & Defense—.4% | | | | | | |
| Argo-Tech, | | | | | | |
| Sr. Notes, 9.25%, 2011 | | 78,000 | | | | 85,995 |
| DRS Technologies, | | | | | | |
| Sr. Sub. Notes, 6.875%, 2013 | | 29,000 | | a | | 30,450 |
| | | | | | | 116,445 |
| Agricultural Biotech—.2% | | | | | | |
| Seminis Vegetable Seeds, | | | | | | |
| Sr. Sub. Notes, 10.25%, 2013 | | 50,000 | | | | 56,500 |
| Airlines—1.0% | | | | | | |
| Delta Airlines, | | | | | | |
| Pass-Through Ctfs., | | | | | | |
| Ser. 2001-1, Cl. B, 7.711%, 2011 | | 84,000 | | | | 64,626 |
| Northwest Airlines: | | | | | | |
| Pass-Through Ctfs., Ser. 1996-1, 7.67%, 2015 | | 111,417 | | | | 96,922 |
| Sr. Notes, 10%, 2009 | | 160,000 | | b | | 135,600 |
| United AirLines, | | | | | | |
| Enhanced Pass-Through Ctfs., | | | | | | |
| Ser. 1997-1A, 1.34%, 2049 | | 48,617 | | c | | 41,487 |
| | | | | | | 338,635 |
| Auto Manufacturing—.3% | | | | | | |
| Navistar International, | | | | | | |
| Sr. Notes, 7.5%, 2011 | | 85,000 | | b | | 91,588 |
| Auto Trucks & Parts—.7% | | | | | | |
| Airxcel, | | | | | | |
| Sr. Sub. Notes, Ser. B, 11%, 2007 | | 20,000 | | | | 19,900 |
| Collins & Aikman Products: | | | | | | |
| Sr. Notes, 10.75%, 2011 | | 47,000 | | | | 48,175 |
| Sr. Sub. Notes, 12.875%, 2012 | | 115,000 | | a,b | | 99,906 |
| HLI Operating, | | | | | | |
| Sr. Notes, 10.5%, 2010 | | 18,000 | | b | | 19,395 |
| United Components, | | | | | | |
| Sr. Sub. Notes, 9.375%, 2013 | | 48,000 | | | | 52,320 |
| | | | | | | 239,696 |
The Portfolio 9
STATEMENT OF INVESTMENTS (continued)
| | | Principal | | | | |
| Bonds and Notes (continued) | | Amount ($) | | Value ($) |
| |
| |
|
| Building & Construction—1.5% | | | | | | |
| Asia Aluminum, | | | | | | |
| Secured Notes, 8%, 2011 | | 34,000 | | a | | 34,510 |
| Atrium Cos., | | | | | | |
| Sr. Sub. Notes, Ser. B, 10.5%, 2009 | | 110,000 | | | | 116,325 |
| Goodman Global, | | | | | | |
| Sr. Sub. Notes, 7.875%, 2012 | | 29,000 | | a | | 28,855 |
| Owens Corning, | | | | | | |
| Notes, 7.7%, 2008 | | 175,000 | | c | | 142,625 |
| THL Buildco, | | | | | | |
| Sr. Sub. Notes, 8.5%, 2014 | | 85,000 | | a | | 89,250 |
| WCI Communities, | | | | | | |
| Sr. Sub. Notes, 10.625%, 2011 | | 67,000 | | | | 74,705 |
| | | | | | | 486,270 |
| Chemicals—5.6% | | | | | | |
| Crompton, | | | | | | |
| Sr. Notes, 9.875%, 2012 | | 200,000 | | a | | 230,000 |
| HMP Equity, | | | | | | |
| Sr. Discount Notes, 0%, 2008 | | 135,000 | | | | 89,944 |
| Huntsman: | | | | | | |
| Sr. Secured Notes, 11.625%, 2010 | | 21,000 | | | | 24,937 |
| Sr. Sub. Notes, 9.875%, 2009 | | 29,000 | | | | 31,972 |
| Huntsman ICI Chemicals, | | | | | | |
| Sr. Sub. Notes, 10.125%, 2009 | | 241,000 | | | | 259,065 |
| Nalco, | | | | | | |
| Sr. Sub. Notes, 8.875%, 2013 | | 275,000 | | | | 303,187 |
| OM Group, | | | | | | |
| Sr. Sub. Notes, 9.25%, 2011 | | 213,000 | | | | 227,910 |
| Resolution Performance Products/Capital, | | | | |
| Sr. Secured Notes, 8%, 2009 | | 49,000 | | | | 52,920 |
| Rhodia: | | | | | | |
| Sr. Notes, 7.625%, 2010 | | 221,000 | | b | | 222,657 |
| Sr. Notes, 10.25%, 2010 | | 262,000 | | b | | 296,060 |
| Rockwood Specialties, | | | | | | |
| Sr. Sub. Notes, 10.625%, 2011 | | 96,000 | | | | 110,880 |
| | | | | | | 1,849,532 |
| Commercial Services—.5% | | | | | | |
| Brickman, | | | | | | |
| Sr. Sub. Notes, Ser. B, 11.75%, 2009 | | 62,000 | | | | 72,850 |
| United Rentals North America, | | | | | | |
| Sr. Sub. Notes, 7.75%, 2013 | | 101,000 | | | | 99,485 |
| | | | | | | 172,335 |
10
| | | Principal | | | | |
| Bonds and Notes (continued) | | Amount ($) | | Value ($) |
| |
| |
|
| Consumer Products—1.1% | | | | | | |
| Ames True Temper, | | | | | | |
| Sr. Sub. Notes, 10%, 2012 | | 85,000 | | | | 87,550 |
| Amscan, | | | | | | |
| Sr. Sub. Notes, 8.75%, 2014 | | 110,000 | | | | 110,550 |
| Playtex Products, | | | | | | |
| Sr. Sub. Notes, 9.375%, 2011 | | 160,000 | | | | 171,600 |
| | | | | | | 369,700 |
| Diversified Financial Services—2.1% | | | | | | |
| BCP Caylux Holdings Luxembourg SCA, | | | | | | |
| Sr. Sub. Notes, 9.625%, 2014 | | 200,000 | | a | | 226,500 |
| Finova, | | | | | | |
| Notes, 7.5%, 2009 | | 192,720 | | | | 95,396 |
| K&F Acquisition, | | | | | | |
| Sr. Sub. Notes, 7.75%, 2014 | | 35,000 | | a | | 36,313 |
| Stena, | | | | | | |
| Sr. Notes, 7.5%, 2013 | | 66,000 | | | | 69,465 |
| Trump Casino Holdings/Funding, | | | | | | |
| First Priority Mortgage Notes, 12.625%, 2010 | | 243,000 | | | | 264,262 |
| | | | | | | 691,936 |
| Electric Utilities—7.2% | | | | | | |
| Allegheny Energy Statutory Trust 2001, | | | | | | |
| Secured Notes, 10.25%, 2007 | | 226,999 | | a | | 258,276 |
| Allegheny Energy Supply: | | | | | | |
| Bonds, 8.25%, 2012 | | 418,000 | | a,b | | 469,205 |
| Notes, 7.8%, 2011 | | 56,000 | | | | 61,320 |
| CMS Energy, | | | | | | |
| Sr. Notes, 9.875%, 2007 | | 159,000 | | | | 178,478 |
| Calpine: | | | | | | |
| Secured Notes, 8.5%, 2010 | | 658,000 | | a,b | | 567,525 |
| Secured Notes, 9.875%, 2011 | | 66,000 | | a | | 58,080 |
| Calpine Generating: | | | | | | |
| Secured Notes, 8.31%, 2010 | | 65,000 | | d | | 63,862 |
| Secured Notes, 11.169%, 2011 | | 17,000 | | d | | 16,702 |
| Mirant, | | | | | | |
| Sr. Notes, 7.4%, 2004 | | 100,000 | | a,c | | 74,000 |
| Nevada Power: | | | | | | |
| Mortgage, Bonds Ser. A, 8.25%, 2011 | | 70,000 | | | | 80,762 |
| Mortgage Notes, 6.5%, 2012 | | 32,000 | | | | 34,000 |
| Notes, Ser. E, 10.875%, 2009 | | 63,000 | | | | 73,080 |
| Reliant Energy, | | | | | | |
| Sr. Secured, Notes, 9.25%, 2010 | | 270,000 | | | | 302,400 |
The Portfolio 11
STATEMENT OF INVESTMENTS (continued)
| | | Principal | | | | |
| Bonds and Notes (continued) | | Amount ($) | | Value ($) |
| |
| |
|
| Electric Utilities (continued) | | | | | | |
| Sierra Pacific Resources, | | | | | | |
| Sr. Notes, 8.625%, 2014 | | 129,000 | | | | 146,415 |
| | | | | | | 2,384,105 |
| Electrical & Electronics—1.3% | | | | | | |
| Dresser, | | | | | | |
| Sr. Sub. Notes, 9.375%, 2011 | | 137,000 | | | | 150,700 |
| Fisher Scientific International, | | | | | | |
| Sr. Sub. Notes, 8%, 2013 | | 162,000 | | | | 184,680 |
| Imax, | | | | | | |
| Sr. Notes, 9.625%, 2010 | | 66,000 | | b | | 72,270 |
| Rayovac, | | | | | | |
| Sr. Sub. Notes, 8.5%, 2013 | | 32,000 | | | | 35,680 |
| | | | | | | 443,330 |
| Entertainment—1.1% | | | | | | |
| Argosy Gaming, | | | | | | |
| Sr. Sub. Notes, 9%, 2011 | | 110,000 | | | | 123,200 |
| Bally Total Fitness, | | | | | | |
| Sr. Notes, 10.5%, 2011 | | 178,000 | | b | | 180,225 |
| Intrawest, | | | | | | |
| Sr. Notes, 7.5%, 2013 | | 9,000 | | | | 9,619 |
| Six Flags, | | | | | | |
| Sr. Notes, 9.625%, 2014 | | 63,000 | | | | 63,630 |
| | | | | | | 376,674 |
| Environmental Control—3.4% | | | | | | |
| Allied Waste: | | | | | | |
| Secured Notes, 6.375%, 2011 | | 47,000 | | | | 45,708 |
| Gtd. Sr. Notes, Ser. B, 7.625%, 2006 | | 370,000 | | | | 382,950 |
| Sr. Notes, Ser. B, 8.5%, 2008 | | 112,000 | | | | 119,280 |
| Sr. Notes, Ser. B, 8.875%, 2008 | | 313,000 | | | | 336,475 |
| Sr. Secured Notes, Ser. B, 9.25%, 2012 | | 56,000 | | | | 60,900 |
| Geo Sub, | | | | | | |
| Sr. Notes, 11%, 2012 | | 56,000 | | | | 56,560 |
| IMCO Recycling Escrow, | | | | | | |
| Sr. Notes, 9%, 2014 | | 14,000 | | a | | 14,630 |
| Synagro Technologies, | | | | | | |
| Sr. Sub. Notes, 9.5%, 2009 | | 61,000 | | | | 66,795 |
| Waste Services, | | | | | | |
| Sr. Sub. Notes, 9.5%, 2014 | | 64,000 | | a,b | | 64,000 |
| | | | | | | 1,147,298 |
12
| | | Principal | | | | |
| Bonds and Notes (continued) | | Amount ($) | | Value ($) |
| |
| |
|
| Food & Beverages—1.7% | | | | | | |
| Agrilink Foods, | | | | | | |
| Sr. Sub. Notes, 11.875%, 2008 | | 16,000 | | | | 16,740 |
| Corn Products International: | | | | | | |
| Sr. Notes, 8.25%, 2007 | | 57,000 | | | | 62,748 |
| Sr. Notes, 8.45%, 2009 | | 57,000 | | | | 66,182 |
| Del Monte, | | | | | | |
| Sr. Sub. Notes, 8.625%, 2012 | | 62,000 | | | | 69,750 |
| Dole Food: | | | | | | |
| Debs., 8.75%, 2013 | | 46,000 | | | | 51,635 |
| Sr. Notes, 8.625%, 2009 | | 64,000 | | | | 69,920 |
| Sr. Notes, 8.875%, 2011 | | 91,000 | | | | 99,418 |
| Land O'Lakes, | | | | | | |
| Sr. Notes, 8.75%, 2011 | | 74,000 | | b | | 74,000 |
| National Beef Packing, | | | | | | |
| Sr. Notes, 10.5%, 2011 | | 63,000 | | | | 66,465 |
| | | | | | | 576,858 |
| Gaming & Lodging—5.8% | | | | | | |
| Inn of the Mountain Gods Resort & Casino, | | | | |
| Sr. Notes, 12%, 2010 | | 174,000 | | | | 204,450 |
| Isle of Capri Casinos, | | | | | | |
| Sr. Sub. Notes, 9%, 2012 | | 57,000 | | | | 63,127 |
| Kerzner International, | | | | | | |
| Notes, 8.875%, 2011 | | 207,000 | | | | 227,182 |
| MGM Mirage: | | | | | | |
| Notes, 8.5%, 2010 | | 129,000 | | | | 147,382 |
| Sr. Collateralized Notes, 6.95%, 2005 | | 18,000 | | | | 18,045 |
| Mandalay Resort, | | | | | | |
| Sr. Notes, 6.5%, 2009 | | 127,000 | | | | 134,620 |
| Mohegan Tribal Gaming Authority, | | | | | | |
| Sr. Sub. Notes, 6.375%, 2009 | | 127,000 | | | | 131,127 |
| Park Place Entertainment: | | | | | | |
| Sr. Sub. Notes, 7.875%, 2005 | | 152,000 | | | | 158,080 |
| Sr. Sub. Notes, 7.875%, 2010 | | 79,000 | | | | 89,369 |
| Sr. Sub. Notes, 8.875%, 2008 | | 321,000 | | | | 364,335 |
| Resorts International Hotel and Casino, | | | | | | |
| First Mortgage, 11.5%, 2009 | | 194,000 | | | | 228,920 |
| Turning Stone Casino Entertainment, | | | | | | |
| Sr. Notes, 9.125%, 2010 | | 85,000 | | a | | 92,437 |
The Portfolio 13
STATEMENT OF INVESTMENTS (continued)
| | | Principal | | | | |
| Bonds and Notes (continued) | | Amount ($) | | Value ($) |
| |
| |
|
| Gaming & Lodging (continued) | | | | | | |
| Wynn Las Vegas Capital, | | | | | | |
| First Mortgage Notes, 6.625%, 2014 | | 85,000 | | a | | 84,575 |
| | | | | | | 1,943,649 |
| Health Care—4.3% | | | | | | |
| Beverly Enterprises, | | | | | | |
| Sr. Sub. Notes, 7.875%, 2014 | | 57,000 | | a | | 61,418 |
| Extendicare Health Services, | | | | | | |
| Sr. Notes, 9.5%, 2010 | | 40,000 | | | | 45,000 |
| Hanger Orthopedic, | | | | | | |
| Sr. Notes, 10.375%, 2009 | | 187,000 | | b | | 194,013 |
| Healthsouth: | | | | | | |
| Sr. Notes, 6.875%, 2005 | | 66,000 | | | | 66,743 |
| Sr. Notes, 7%, 2008 | | 196,000 | | | | 199,920 |
| Province Healthcare, | | | | | | |
| Sr. Sub. Notes, 7.5%, 2013 | | 198,000 | | | | 222,750 |
| Tenet HealthCare: | | | | | | |
| Notes, 7.375%, 2013 | | 202,000 | | b | | 196,950 |
| Sr. Notes, 9.875%, 2014 | | 229,000 | | a | | 250,755 |
| Triad Hospitals, | | | | | | |
| Sr. Sub. Notes, 7%, 2013 | | 201,000 | | | | 206,527 |
| | | | | | | 1,444,076 |
| Machinery—.7% | | | | | | |
| Case New Holland: | | | | | | |
| Sr. Notes, 6%, 2009 | | 56,000 | | a | | 54,880 |
| Sr. Notes, 9.25%, 2011 | | 96,000 | | a | | 107,280 |
| Sr. Notes, 9.25%, 2011 | | 63,000 | | a | | 70,403 |
| | | | | | | 232,563 |
| Manufacturing—2.0% | | | | | | |
| Hexcel, | | | | | | |
| Sr. Sub. Notes, 9.75%, 2009 | | 237,000 | | | | 247,665 |
| JB Poindexter, | | | | | | |
| Sr. Notes, 8.75%, 2014 | | 152,000 | | a | | 162,260 |
| Key Components/Finance, | | | | | | |
| Sr. Notes, 10.5%, 2008 | | 79,000 | | | | 82,358 |
| MAAX, | | | | | | |
| Sr. Sub. Notes, 9.75%, 2012 | | 29,000 | | a | | 30,812 |
| | | Principal | | | | |
| Bonds and Notes (continued) | | Amount ($) | | Value ($) |
| |
| |
|
| Manufacturing (continued) | | | | | | |
| Polypore: | | | | | | |
| Sr. Discount Note, 0/10.50%, 2012 | | 131,000 | | a,e | | 84,495 |
| Sr. Sub. Notes, 8.75%, 2012 | | 68,000 | | | | 71,400 |
| | | | | | | 678,990 |
| Media—9.4% | | | | | | |
| Adelphia Communications, | | | | | | |
| Sr. Notes, Ser. B, 7.75%, 2009 | | 103,000 | | c | | 96,820 |
| CSC Holdings: | | | | | | |
| Sr. Notes, 6.75%, 2012 | | 66,000 | | a | | 68,310 |
| Sr. Notes, 7.875%, 2007 | | 123,000 | | | | 132,533 |
| Charter Communications Holdings: | | | | | | |
| Sr. Discount Notes, 0/11.75%, 2011 | | 172,000 | | e | | 127,280 |
| Sr. Notes, 8.75%, 2013 | | 249,000 | | b | | 258,338 |
| Sr. Notes, 10.25%, 2010 | | 262,000 | | | | 279,030 |
| Sr. Notes, 10.75%, 2009 | | 326,000 | | | | 298,290 |
| Dex Media East Finance, | | | | | | |
| Sr. Sub. Notes, Ser. B, 9.875%, 2009 | | 11,000 | | | | 12,581 |
| Sr. Sub. Notes, Ser. B, 12.125%, 2012 | | 207,000 | | | | 253,316 |
| Dex Media West Finance, | | | | | | |
| Sr. Sub. Notes, Ser. B, 9.875%, 2013 | | 153,000 | | | | 177,097 |
| Granite Broadcasting, | | | | | | |
| Notes, 9.75%, 2010 | | 131,000 | | | | 125,760 |
| Gray Television, | | | | | | |
| Sr. Sub. Notes, 9.25%, 2011 | | 30,000 | | | | 33,750 |
| Kabel Deutschland, | | | | | | |
| Sr. Notes, 10.625%, 2014 | | 87,000 | | a | | 100,485 |
| LBI Media, | | | | | | |
| Sr. Discount Notes, 0/11%, 2013 | | 97,000 | | e | | 71,780 |
| Lodgenet Entertainment, | | | | | | |
| Sr. Sub. Debs., 9.5%, 2013 | | 28,000 | | | | 31,080 |
| Nexstar Finance: | | | | | | |
| Sr. Discount Notes, 0/11.375%, 2013 | | 148,000 | | e | | 117,660 |
| Sr. Sub. Notes, 7%, 2014 | | 215,000 | | | | 213,925 |
| Pegasus Communications, | | | | | | |
| Sr. Sub. Notes, Ser. B, 12.5%, 2007 | | 228,000 | | c | | 147,630 |
The Portfolio 15
STATEMENT OF INVESTMENTS (continued)
| | | Principal | | | | |
| Bonds and Notes (continued) | | Amount ($) | | Value ($) |
| |
| |
|
| Media (continued) | | | | | | |
| Salem Communications, | | | | | | |
| Sr. Sub. Notes, Ser. B, 9%, 2011 | | 138,000 | | | | 152,145 |
| Spanish Broadcasting System, | | | | | | |
| Sr. Sub. Notes, 9.625%, 2009 | | 259,000 | | | | 272,597 |
| Young Broadcasting: | | | | | | |
| Sr. Sub. Notes, 8.75%, 2014 | | 140,000 | | b | | 141,750 |
| Sr. Sub. Notes, 10%, 2011 | | 30,000 | | | | 32,175 |
| | | | | | | 3,144,332 |
| Mining & Metals—1.9% | | | | | | |
| AK Steel: | | | | | | |
| Sr. Notes, 7.75%, 2012 | | 117,000 | | b | | 121,095 |
| Sr. Notes, 7.875%, 2009 | | 152,000 | | | | 155,610 |
| Consol Energy, | | | | | | |
| Notes, 7.875%, 2012 | | 223,000 | | | | 250,875 |
| CSN Islands VIII, | | | | | | |
| Sr. Notes, 10%, 2015 | | 85,000 | | a | | 91,694 |
| | | | | | | 619,274 |
| Oil & Gas—5.2% | | | | | | |
| Coastal: | | | | | | |
| Notes, 7.625%, 2008 | | 256,000 | | b | | 268,800 |
| Notes, 7.75%, 2010 | | 257,000 | | b | | 269,850 |
| Sr. Deb., 6.5%, 2008 | | 57,000 | | | | 57,998 |
| El Paso Production, | | | | | | |
| Sr. Notes, 7.75%, 2013 | | 109,000 | | | | 114,722 |
| Hanover Compressor: | | | | | | |
| Sr. Notes, 8.625%, 2010 | | 66,000 | | b | | 72,435 |
| Sr. Notes, 9%, 2014 | | 84,000 | | | | 93,870 |
| Hanover Equipment Trust: | | | | | | |
| Sr. Secured Notes, Ser A., 8.5%, 2008 | | 257,000 | | | | 277,560 |
| Sr. Secured Notes, Ser. B, 8.75%, 2011 | | 11,000 | | | | 11,990 |
| McMoRan Exploration: | | | | | | |
| Sr. Notes, 5.25%, 2011 | | 57,000 | | a | | 80,869 |
| Sr. Notes, 6%, 2008 | | 316,000 | | a | | 479,135 |
| | | | | | | 1,727,229 |
| Packaging & Containers—2.3% | | | | | | |
| Jefferson Smurfit, | | | | | | |
| Sr. Notes, 8.25%, 2012 | | 57,000 | | | | 62,415 |
| | | Principal | | | | |
| Bonds and Notes (continued) | | Amount ($) | | Value ($) |
| |
| |
|
| Packaging & Containers (continued) | | | | | | |
| Owens-Brockway: | | | | | | |
| Sr. Notes, 6.75%, 2014 | | 28,000 | | a | | 28,420 |
| Sr. Notes, 8.25%, 2013 | | 30,000 | | | | 33,150 |
| Sr. Secured Notes, 7.75%, 2011 | | 60,000 | | | | 65,250 |
| Sr. Secured Notes, 8.75%, 2012 | | 9,000 | | | | 10,192 |
| Sr. Secured Notes, 8.875%, 2009 | | 50,000 | | | | 54,562 |
| Pliant: | | | | | | |
| Sr. Secured Discount Notes, 0/11.125%, 2009 | | 97,000 | | e | | 90,089 |
| Sr. Secured Notes, 11.125%, 2009 | | 31,000 | | | | 33,945 |
| Sr. Sub. Notes, 13%, 2010 | | 62,000 | | b | | 60,760 |
| Stone Container: | | | | | | |
| Sr. Notes, 8.375%, 2012 | | 75,000 | | | | 82,125 |
| Sr. Notes, 9.75%, 2011 | | 180,000 | | | | 198,000 |
| Tekni-Plex, | | | | | | |
| Secured Notes, 8.75%, 2013 | | 55,000 | | a,b | | 55,000 |
| | | | | | | 773,908 |
| Paper & Forest Products—2.6% | | | | | | |
| Appleton Papers, | | | | | | |
| Sr. Sub Notes, Sr. B, 9.75%, 2014 | | 85,000 | | b | | 94,350 |
| Buckeye Technologies, | | | | | | |
| Sr. Notes, 8.5%, 2013 | | 80,000 | | | | 87,200 |
| Georgia-Pacific: | | | | | | |
| Sr. Notes, 7.375%, 2008 | | 123,000 | | | | 134,378 |
| Sr. Notes, 8.875%, 2010 | | 485,000 | | | | 566,844 |
| | | | | | | 882,772 |
| Pipelines—1.9% | | | | | | |
| ANR Pipeline, | | | | | | |
| Notes, 8.875%, 2010 | | 150,000 | | | | 168,750 |
| Dynegy: | | | | | | |
| Secured Notes, 9.875%, 2010 | | 153,000 | | a | | 171,743 |
| Secured Notes, 10.125%, 2013 | | 134,000 | | a | | 154,100 |
| Southern Natural Gas, | | | | | | |
| Notes, 8.875%, 2010 | | 123,000 | | b | | 138,375 |
| | | | | | | 632,968 |
| Retail—1.3% | | | | | | |
| Dillards, | | | | | | |
| Notes, 6.875%, 2005 | | 6,000 | | | | 6,150 |
The Portfolio 17
STATEMENT OF INVESTMENTS (continued)
| | | Principal | | | | |
| Bonds and Notes (continued) | | Amount ($) | | Value ($) |
| |
| |
|
| Retail (continued) | | | | | | |
| JC Penney, | | | | | | |
| Sr. Notes, 8%, 2010 | | 101,000 | | | | 115,898 |
| Remington Arms, | | | | | | |
| Sr. Notes, 10.5%, 2011 | | 23,000 | | | | 22,310 |
| Rite Aid: | | | | | | |
| Sr. Secured Notes, 8.125%, 2010 | | 70,000 | | | | 74,375 |
| Sr. Secured Notes, 12.5%, 2006 | | 64,000 | | b | | 72,320 |
| Saks, | | | | | | |
| Notes, 7.5%, 2010 | | 57,000 | | | | 60,990 |
| VICORP Restaurants, | | | | | | |
| Sr. Notes, 10.5%, 2011 | | 64,000 | | | | 64,640 |
| | | | | | | 416,683 |
| Structured Index—3.8% | | | | | | |
| AB Svensk Exportkredit, | | | | | | |
| GSNE-ER Indexed Notes, 0%, 2007 | | 190,000 | | a,f | | 180,215 |
| Dow Jones CDX, | | | | | | |
| Credit Linked Notes, Ser. 3-2, 6.375%, 2009 | | 1,073,000 | | a,g | | 1,099,825 |
| | | | | | | 1,280,040 |
| Technology—.3% | | | | | | |
| AMI Semiconductor, | | | | | | |
| Sr. Sub. Notes, 10.75%, 2013 | | 81,000 | | | | 95,580 |
| Telecommunications—9.7% | | | | | | |
| American Tower: | | | | | | |
| Sr. Notes, 7.125%, 2012 | | 86,000 | | a | | 88,365 |
| Sr. Notes, 9.375%, 2009 | | 133,000 | | b | | 141,313 |
| Sr. Sub. Notes, 7.25%, 2011 | | 152,000 | | | | 161,880 |
| American Tower Escrow, | | | | | | |
| Discount Notes, 0%, 2008 | | 30,000 | | | | 22,575 |
| Crown Castle International: | | | | | | |
| Sr. Notes, 7.5%, 2013 | | 100,000 | | b | | 108,000 |
| Sr. Notes, 9.375%, 2011 | | 234,000 | | | | 263,250 |
| Sr. Notes, Ser. B, 7.5%, 2013 | | 99,000 | | b | | 106,920 |
| Dobson Communications, | | | | | | |
| Sr. Notes, 8.875%, 2013 | | 56,000 | | | | 39,620 |
| Fairpoint Communications, | | | | | | |
| Sr. Notes, 11.875%, 2010 | | 30,000 | | | | 35,250 |
| | | Principal | | | | |
| Bonds and Notes (continued) | | Amount ($) | | Value ($) |
| |
| |
|
| Telecommunications (continued) | | | | | | |
| Innova S de RL, | | | | | | |
| Notes, 9.375%, 2013 | | 128,000 | | b | | 146,240 |
| MJD Communications, | | | | | | |
| Floating Rate Notes, Ser. B, 6.488%, 2008 | | 500,000 | | d | | 495,000 |
| Nextel Partners, | | | | | | |
| Sr. Notes, 12.5%, 2009 | | 77,000 | | b | | 87,588 |
| Qwest: | | | | | | |
| Bank Note, Ser. A, 6.5%, 2007 | | 187,000 | | d | | 194,948 |
| Bank Note, Ser. B, 6.95%, 2010 | | 42,000 | | d | | 42,945 |
| Bank Note, Ser. B, 6.95%, 2010 | | 8,000 | | d | | 8,180 |
| Qwest Services, | | | | | | |
| Sr. Secured Notes, 13.5%, 2007 | | 312,000 | | a | | 358,020 |
| SBA Telecommunications, | | | | | | |
| Sr. Discount Notes, 0/9.75%, 2011 | | 395,000 | | e | | 334,763 |
| Spectrasite, | | | | | | |
| Sr. Notes, 8.25%, 2010 | | 121,000 | | | | 129,773 |
| Ubiquitel Operations, | | | | | | |
| Sr. Notes, 9.875%, 2011 | | 86,000 | | a | | 96,965 |
| US Unwired, | | | | | | |
| Sr. Secured Notes, Ser. B, 10%, 2012 | | 142,000 | | | | 160,815 |
| Western Wireless, | | | | | | |
| Sr. Notes, 9.25%, 2013 | | 201,000 | | | | 219,592 |
| | | | | | | 3,242,002 |
| Textiles & Apparel—.1% | | | | | | |
| Dan River, | | | | | | |
| Sr. Notes, 12.75%, 2009 | | 135,000 | | a,b,c | | 26,663 |
| Transportation—1.4% | | | | | | |
| CHC Helicopter, | | | | | | |
| Sr. Sub. Notes, 7.375%, 2014 | | 96,000 | | | | 101,760 |
| Gulfmark Offshore, | | | | | | |
| Sr. Notes, 7.75%, 2014 | | 113,000 | | a,b | | 120,345 |
| TFM, S.A. de C.V., | | | | | | |
| Sr. Notes, 10.25%, 2007 | | 214,000 | | | | 228,980 |
| | | | | | | 451,085 |
| Total Bonds and Notes | | | | | | |
| (cost $25,317,572) | | | | | | 27,032,984 |
The Portfolio 19
STATEMENT OF INVESTMENTS (continued)
| Preferred Stocks—2.4% | | Shares | | Value ($) |
| |
| |
|
| Commercial Services—.7% | | | | |
| Kaiser Group Holdings, | | | | |
| Cum., $3.85 | | 3,952 | | 217,360 |
| Diversified Financial Services—.1% | | | | |
| Williams Holdings Of Delaware, | | | | |
| Cum. Conv., $2.75 | | 460 a | | 38,640 |
| Media—1.6% | | | | |
| Paxson Communications, | | | | |
| Cum. Conv., $975 | | 555 a | | 305,324 |
| Spanish Broadcasting System (Units) | | | | |
| Cum. Conv., Ser. B, $107.5 | | 202 | | 224,775 |
| | | | | 530,099 |
| Total Preferred Stocks | | | | |
| (cost $784,321) | | | | 786,099 |
| |
| |
|
| |
| Common Stocks—.5% | | | | |
| |
| |
|
| Oil & Gas—.0% | | | | |
| Link Energy (Units) | | 35,228 h | | 3,171 |
| Telecommunications—.5% | | | | |
| AboveNet | | 3,991 h | | 127,712 |
| Neon Communications | | 10,724 h,i | | 29,491 |
| | | | | 157,203 |
| Total Common Stocks | | | | |
| (cost $657,246) | | | | 160,374 |
| |
| |
|
| |
| Other—.0% | | | | |
| |
| |
|
| Chemicals—.0% | | | | |
| Huntsman (warrants) | | 32 a,h | | 15,056 |
| Mining And Metals—.0% | | | | |
| Kaiser Group Holdings (rights) | | 17,554 h,i | | 0 |
| Telecommunications—.0% | | | | |
| AboveNet (warrants) | | 647 h | | 6,364 |
| Loral Cyberstar (warrants) | | 20,940 h | | 209 |
| Neon Communications (warrants) | | 10,724 h,i | | 0 |
| | | | | 6,573 |
| Total Other | | | | |
| (cost $25,343) | | | | 21,629 |
20
| Other Investments—14.0% | | Shares | | Value ($) |
| |
| |
|
| Registered Investment Company; | | | | |
| Dreyfus Institutional Preferred Plus Money Market Fund | | |
| (cost $4,677,000) | | 4,677,000 j | | 4,677,000 |
| |
| |
|
| |
| Investment of Cash Collateral | | | | |
| for Securities Loaned—13.1% | | | | |
| |
| |
|
| Registered Investment Company; | | | | |
| Dreyfus Institutional Cash Advanatage Plus Fund | | |
| (cost $4,354,180) | | 4,354,180 j | | 4,354,180 |
| |
| |
|
| Total Investments (cost $35,815,662) | | 111.1% | | 37,032,266 |
| Liabilities, Less Cash and Receivables | | (11.1%) | | (3,710,273) |
| Net Assets | | 100.0% | | 33,321,993 |
| a Securities exempt from registration under Rule 144A of the Securities Act of 1933.These securities may be resold in |
| transactions exempt from registration, normally to qualified institutional buyers.These securities have been determined to be |
| liquid by the Board of Trustees.At December 31, 2004, these securities amounted to $6,940,257 or 20.8% of net assets. |
| b All or a portion of these securities are on loan.At December 31, 2004, the total market value of the portfolio's |
| securities on loan is $4,172,209 and the total market value of the collateral held by the portfolio is $4,354,180. |
| c Non-income producing—security in default. |
| d Variable rate security—interest rate subject to periodic change. |
| e Zero coupon until a specified date at which time the stated coupon rate becomes effective until maturity date. |
| f Security linked to Goldman Sachs Non-Energy-Excess Return Index. |
| g Security linked to a portfolio of debt securities. |
| h Non-income producing security. |
| i The value of these securities has been determined in good faith under the direction of the Board of Trustees. |
| j Investments in affiliated money market mutual funds. |
| Portfolio Summary† | | | | | | |
| |
| | | Value (%) | | | | Value (%) |
| |
| |
| |
|
| Corporate Bonds | | 77.3 | | Preferred Stocks | | 2.4 |
| Money Market Investments | | 27.1 | | Common Stocks and Other | | .5 |
| Structured Index | | 3.8 | | | | 111.1 |
† Based on net assets.
See notes to financial statements.
|
The Portfolio 21
| | STATEMENT OF ASSETS AND LIABILITIES
December 31, 2004
|
| | | Cost | | Value |
| |
| |
|
| Assets ($): | | | | |
| Investments in securities—See Statement of | | | | |
| Investments (including securities on loan | | | | |
| valued at $4,172,209)—Note 1(c): | | | | |
| Unaffiliated issuers | | 26,784,482 | | 28,001,086 |
| Affiliated issuers | | 9,031,180 | | 9,031,180 |
| Cash | | | | 163,310 |
| Cash denominated in foreign currencies | | 43 | | 46 |
| Dividends and interest receivable | | | | 530,024 |
| Prepaid expenses | | | | 1,233 |
| | | | | 37,726,879 |
| |
| |
|
| Liabilities ($): | | | | |
| Due to The Dreyfus Corporation and affiliates—Note 3(b) | | 16,529 |
| Liability for securities on loan—Note 1(c) | | | | 4,354,180 |
| Payable for shares of Beneficial Interest redeemed | | 3,396 |
| Accrued expenses | | | | 30,781 |
| | | | | 4,404,886 |
| |
| |
|
| Net Assets ($) | | | | 33,321,993 |
| |
| |
|
| Composition of Net Assets ($): | | | | |
| Paid-in capital | | | | 66,915,367 |
| Accumulated undistributed investment income—net | | 22,369 |
| Accumulated net realized gain (loss) on investments | | (34,832,350) |
| Accumulated net unrealized appreciation (depreciation) | | |
| on investments and foreign currency transactions | | 1,216,607 |
| |
|
| Net Assets ($) | | | | 33,321,993 |
| Net Asset Value Per Share | | | | |
| | | Initial Shares | | Service Shares |
| |
| |
|
| Net Assets ($) | | 23,880,643 | | 9,441,350 |
| Shares Outstanding | | 3,495,789 | | 1,380,461 |
| |
| |
|
| Net Asset Value Per Share ($) | | 6.83 | | 6.84 |
See notes to financial statements.
22
| | STATEMENT OF OPERATIONS
Year Ended December 31, 2004
|
| Investment Income ($): | | |
| Income: | | |
| Interest | | 2,411,521 |
| Dividends: | | |
| Unaffiliated issuers | | 88,404 |
| Affiliated issuers | | 31,612 |
| Income from securities lending | | 25,010 |
| Total Income | | 2,556,547 |
| Expenses: | | |
| Investment advisory fee—Note 3(a) | | 215,671 |
| Auditing fees | | 26,626 |
| Distribution fees—Note 3(b) | | 22,467 |
| Prospectus and shareholders' reports | | 16,212 |
| Custodian fees—Note 3(b) | | 7,669 |
| Trustees' fees and expenses—Note 3(c) | | 2,635 |
| Shareholder servicing costs—Note 3(b) | | 2,108 |
| Legal fees | | 553 |
| Miscellaneous | | 23,483 |
| Total Expenses | | 317,424 |
| Less—waiver of fees due to undertaking—Note 3(a) | | (21,623) |
| Net Expenses | | 295,801 |
| Investment Income—Net | | 2,260,746 |
| |
|
| Realized and Unrealized Gain (Loss) on Investments—Note 4 ($): |
| Net realized gain (loss) on investments and foreign currency transactions | | 1,137,667 |
| Net realized gain (loss) on options transactions | | (2,025) |
| Net realized gain (loss) on financial futures | | (85) |
| Net realized gain (loss) on swap transactions | | (8,276) |
| Net realized gain (loss) on forward currency exchange contracts | | (970) |
| Net Realized Gain (Loss) | | 1,126,311 |
| Net unrealized appreciation (depreciation) on investments | | |
| and foreign currency transactions | | (211,372) |
| Net Realized and Unrealized Gain (Loss) on Investments | | 914,939 |
| Net Increase in Net Assets Resulting from Operations | | 3,175,685 |
See notes to financial statements.
The Portfolio 23
STATEMENT OF CHANGES IN NET ASSETS
| | | Year Ended December 31, |
| |
|
| | | 2004 | | 2003 |
| |
| |
|
| Operations ($): | | | | |
| Investment income—net | | 2,260,746 | | 2,557,027 |
| Net realized gain (loss) on investments | | 1,126,311 | | (2,697,357) |
| Net unrealized appreciation | | | | |
| (depreciation) on investments | | (211,372) | | 7,845,066 |
| Net Increase (Decrease) in Net Assets | | | | |
| Resulting from Operations | | 3,175,685 | | 7,704,736 |
| |
| |
|
| Dividends to Shareholders from ($): | | | | |
| Investment income—net: | | | | |
| Initial shares | | (1,757,277) | | (2,139,506) |
| Service shares | | (642,542) | | (701,661) |
| Total Dividends | | (2,399,819) | | (2,841,167) |
| |
| |
|
| Beneficial Interest Transactions ($): | | | | |
| Net proceeds from shares sold: | | | | |
| Initial shares | | 1,502,127 | | 4,811,283 |
| Service shares | | 2,407,679 | | 4,390,971 |
| Dividends reinvested: | | | | |
| Initial shares | | 1,757,277 | | 2,139,506 |
| Service shares | | 642,542 | | 701,661 |
| Cost of shares redeemed: | | | | |
| Initial shares | | (5,508,371) | | (5,156,119) |
| Service shares | | (2,887,368) | | (2,084,080) |
| Increase (Decrease) in Net Assets from | | | | |
| Beneficial Interest Transactions | | (2,086,114) | | 4,803,222 |
| Total Increase (Decrease) in Net Assets | | (1,310,248) | | 9,666,791 |
| |
| |
|
| Net Assets ($): | | | | |
| Beginning of Period | | 34,632,241 | | 24,965,450 |
| End of Period | | 33,321,993 | | 34,632,241 |
| Undistributed investment income—net | | 22,369 | | 36,891 |
| | | Year Ended December 31, |
| |
|
| | | 2004 | | 2003 |
| |
| |
|
| Capital Share Transactions: | | | | |
| Initial Shares | | | | |
| Shares sold | | 225,131 | | 755,152 |
| Shares issued for dividends reinvested | | 263,707 | | 337,566 |
| Shares redeemed | | (821,797) | | (820,300) |
| Net Increase (Decrease) in Shares Outstanding | | (332,959) | | 272,418 |
| |
| |
|
| Service Shares | | | | |
| Shares sold | | 357,890 | | 701,874 |
| Shares issued for dividends reinvested | | 96,282 | | 110,402 |
| Shares redeemed | | (431,163) | | (330,770) |
| Net Increase (Decrease) in Shares Outstanding | | 23,009 | | 481,506 |
See notes to financial statements.
The Portfolio 25
FINANCIAL HIGHLIGHTS
The following tables describe the performance for each share class for the fiscal periods indicated.All information (except portfolio turnover rate) reflects financial results for a single portfolio share.Total return shows how much your investment in the portfolio would have increased (or decreased) during each period, assuming you had reinvested all dividends and distributions.These figures have been derived from the portfolio's financial statements.
| | | | | Year Ended December 31, | | |
| |
| |
| |
|
| Initial Shares | | 2004 a | | 2003 | | 2002 | | 2001 b | | 2000 |
| |
| |
| |
| |
| |
|
| Per Share Data ($): | | | | | | | | | | |
| Net asset value, beginning of period | | 6.68 | | 5.63 | | 7.33 | | 8.47 | | 10.44 |
| Investment Operations: | | | | | | | | | | |
| Investment income—net | | .46c | | .53c | | .69c | | .84c | | 1.15 |
| Net realized and unrealized | | | | | | | | | | |
| gain (loss) on investments | | .19 | | 1.12 | | (1.64) | | (1.07) | | (1.95) |
| Total from Investment Operations | | .65 | | 1.65 | | (.95) | | (.23) | | (.80) |
| Distributions: | | | | | | | | | | |
| Dividends from investment income—net | | (.50) | | (.60) | | (.75) | | (.91) | | (1.17) |
| Net asset value, end of period | | 6.83 | | 6.68 | | 5.63 | | 7.33 | | 8.47 |
| |
| |
| |
| |
| |
|
| Total Return (%) | | 10.10 | | 30.00 | | (13.01) | | (2.90) | | (8.27) |
| |
| |
| |
| |
| |
|
| Ratios/Supplemental Data (%): | | | | | | | | | | |
| Ratio of total expenses to average net assets | | .89 | | .96 | | .94 | | .91 | | .99 |
| Ratio of net expenses to average net assets | | .89 | | .90 | | .92 | | .91 | | .99 |
| Ratio of net investment income | | | | | | | | | | |
| to average net assets | | 6.82 | | 8.43 | | 10.69 | | 10.37 | | 11.10 |
| Portfolio Turnover Rate | | 78.90 | | 258.88 | | 436.35 | | 198.14 | | 15.29 |
| |
| |
| |
| |
| |
|
| Net Assets, end of period ($ x 1,000) | | 23,881 | | 25,571 | | 20,033 | | 30,146 | | 39,529 |
| a | | As of January 1, 2004, the portfolio has adopted the method of accounting for interim payments on swap contracts in |
| | | accordance with Financial Accounting Standards Board Statement No. 133.These interim payments are reflected |
| | | within net realized and unrealized gain (loss) on swap contracts, however, prior to January 1, 2004, these interim |
| | | payments were reflected within interest income/expense in the Statement of Operations.The effect of this change for |
| | | the period ended December 31, 2004, was to increase net investment income per share by less than $.01, decrease net |
| | | realized and unrealized gain (loss) on investments per share by less than $.01 and increase the ratio of net |
| | | investment income to average net assets from 6.81% to 6.82%. Per share data and ratios/supplemental data for |
| | | periods prior to January 1, 2004 have not been restated to reflect this change in presentation. |
| b | | As required, effective January 1, 2001, the portfolio has adopted the provisions of the AICPA Audit and Accounting |
| | | Guide for Investment Companies and began accreting discount or amortizing premium on fixed income securities on a |
| | | scientific basis and including paydown gains and losses in interest income.The effect of this change for the period |
| | | ended December 31, 2001 was to decrease net investment income per share by $.05, increase net realized and |
| | | unrealized gain (loss) on investments per share by $.05 and decrease the ratio of net investment income to average net |
| | | assets from 11.07% to 10.37%. Per share data and ratios/supplemental data for periods prior to January 1, 2001 |
| | | have not been restated to reflect this change in presentation. |
| c | | Based on average shares outstanding at each month end. |
| See notes to financial statements. |
| | | | | Year Ended December 31, | | |
| |
| |
| |
|
| Service Shares | | 2004 a | | 2003 | | 2002 | | 2001 b | | 2000 |
| |
| |
| |
| |
| |
|
| Per Share Data ($): | | | | | | | | | | |
| Net asset value, beginning of period | | 6.68 | | 5.63 | | 7.33 | | 8.46 | | 8.46 |
| Investment Operations: | | | | | | | | | | |
| Investment income—net | | .46c | | .53c | | .68c | | .79c | | — |
| Net realized and unrealized | | | | | | | | | | |
| gain (loss) on investments | | .19 | | 1.12 | | (1.63) | | (1.02) | | — |
| Total from Investment Operations | | .65 | | 1.65 | | (.95) | | (.23) | | — |
| Distributions: | | | | | | | | | | |
| Dividends from investment income—net | | (.49) | | (.60) | | (.75) | | (.90) | | — |
| Net asset value, end of period | | 6.84 | | 6.68 | | 5.63 | | 7.33 | | 8.46 |
| |
| |
| |
| |
| |
|
| Total Return (%) | | 10.06 | | 30.28 | | (13.12) | | (2.95) | | — |
| |
| |
| |
| |
| |
|
| Ratios/Supplemental Data (%): | | | | | | | | | | |
| Ratio of total expenses to average net assets | | 1.14 | | 1.22 | | 1.25 | | 1.15 | | — |
| Ratio of net expenses to average net assets | | .90 | | .90 | | .92 | | .91 | | — |
| Ratio of net investment income | | | | | | | | | | |
| to average net assets | | 6.80 | | 8.34 | | 10.73 | | 10.35 | | — |
| Portfolio Turnover Rate | | 78.90 | | 258.88 | | 436.35 | | 198.14 | | 15.29 |
| |
| |
| |
| |
| |
|
| Net Assets, end of period ($ x 1,000) | | 9,441 | | 9,062 | | 4,933 | | 2,797 | | 1 |
| a As of January 1, 2004, the portfolio has adopted the method of accounting for interim payments on swap contracts in |
| accordance with Financial Accounting Standards Board Statement No. 133.These interim payments are reflected |
| within net realized and unrealized gain (loss) on swap contracts, however, prior to January 1, 2004, these interim |
| payments were reflected within interest income/expense in the Statement of Operations.The effect of this change for |
| the period ended December 31, 2004, was to increase net investment income per share by less than $.01, decrease net |
| realized and unrealized gain (loss) on investments per share by less than $.01 and had no effect on the ratio of net |
| investment income to average net assets. Per share data and ratios/supplemental data for periods prior to January 1, |
| 2004 have not been restated to reflect this change in presentation. |
| b As required, effective January 1, 2001, the portfolio has adopted the provisions of the AICPA Audit and Accounting |
| Guide for Investment Companies and began accreting discount or amortizing premium on fixed income securities on a |
| scientific basis and including paydown gains and losses in interest income.The effect of this change for the period |
| ended December 31, 2001 was to decrease net investment income per share by $.05, increase net realized and |
| unrealized gain (loss) on investments per share by $.05 and decrease the ratio of net investment income to average net |
| assets from 11.04% to 10.35%. Per share data and ratios/supplemental data for periods prior to January 1, 2001 |
| have not been restated to reflect this change in presentation. |
| c Based on average shares outstanding at each month end. |
See notes to financial statements.
The Portfolio 27
NOTES TO FINANCIAL STATEMENTS
NOTE 1—Significant Accounting Policies:
Dreyfus Variable Investment Fund (the “fund”) is registered under the Investment Company Act of 1940 as amended (the “Act”), as an open-end management investment company, operating as a series company currently offering twelve series, including the Limited Term High Yield Portfolio (the “portfolio”).The portfolio is only offered to separate accounts established by insurance companies to fund variable annuity contracts and variable life insurance policies.The portfolio is a diversified series.The portfolio's investment objective is to maximize total return, consisting of capital appreciation and current income.The Dreyfus Corporation (the “Manager” or “Dreyfus”) serves as the portfolio's investment adviser.The Manager is a wholly-owned subsidiary of Mellon Financial Corporation (“Mellon Financial”).
Dreyfus Service Corporation (the “Distributor”), a wholly-owned subsidiary of the Manager, is the distributor of the portfolio's shares, which are sold without a sales charge.The portfolio is authorized to issue an unlimited number of $.001 par value shares of Beneficial Interest in the following classes of shares: Initial and Service. Each class of shares has identical rights and privileges, except with respect to the distribution plan and the expenses borne by each class and certain voting rights. Income, expenses (other than expenses attributable to a specific class), and realized and unrealized gains or losses on investments are allocated to each class of shares based on its relative net assets.
The fund accounts separately for the assets, liabilities and operations of each series. Expenses directly attributable to each series are charged to that series' operations; expenses which are applicable to all series are allocated among them on a pro rata basis.
The portfolio's financial statements are prepared in accordance with U.S. generally accepted accounting principles, which may require the use of management estimates and assumptions.Actual results could differ from those estimates.
28
The fund enters into contracts that contain a variety of indemnifica-tions.The portfolio's maximum exposure under these arrangements is unknown. The portfolio does not anticipate recognizing any loss related to these arrangements.
(a) Portfolio valuation: Investments in securities (excluding short-term investments other than financial futures, options, swap transactions and forward currency exchange contracts) are valued each business day by an independent pricing service (the “Service”) approved by the Board of Trustees. Investments for which quoted bid prices are readily available and are representative of the bid side of the market in the judgment of the Service are valued at the mean between the quoted bid prices (as obtained by the Service from dealers in such securities) and asked prices (as calculated by the Service based upon its evaluation of the market for such securities). Other investments (which constitute a majority of the portfolio securities) are valued as determined by the Service, based on methods which include consideration of: yields or prices of securities of comparable quality, coupon, maturity and type; indications as to values from dealers; and general market conditions. Securities for which there are no such valuations are valued at fair value as determined in good faith under the direction of the Board of Trustees. Restricted securities, as well as securities or other assets for which recent market quotations are not readily available,that are not valued by a pricing service approved by the Board of Trustees, or are determined by the portfolio not to reflect accurately fair value (such as when an event occurs after the close of the exchange on which the security is principally traded and that is determined by the portfolio to have changed the value of the security), are valued at fair value as determined in good faith under the direction of the Board of Trustees.The factors that may be considered when fair valuing a security include: fundamental analytical data, the nature and duration of restrictions on disposition, an evaluation of the forces that influence the market in which the securities are purchased and sold and public trading in similar securities of the issuer or comparable issuers.
The Portfolio 29
NOTES TO FINANCIAL STATEMENTS (continued)
Short-term investments, excluding U.S. Treasury Bills, are carried at amortized cost, which approximates value. Investments in registered investment companies are valued at their net asset value. Financial futures and options, which are traded on an exchange, are valued at the last sales price on the securities exchange on which such securities are primarily traded or at the last sales price on the national securities market on each business day. Options traded over-the-counter are priced at the mean between the bid and asked price. Swap transactions are valued daily based upon future cash flows and other factors,such as interest rates and underlying securities. Investments denominated in foreign currencies are translated to U.S. dollars at the prevailing rates of exchange. Forward currency exchange contracts are valued at the forward rate.
(b) Foreign currency transactions: The portfolio does not isolate that portion of the results of operations resulting from changes in foreign exchange rates on investments from the fluctuations arising from changes in the market prices of securities held. Such fluctuations are included with the net realized and unrealized gain or loss on investments.
Net realized foreign exchange gains or losses arise from sales and maturities of short-term securities, sales of foreign currencies, currency gains or losses realized on securities transactions and the difference between the amounts of dividends, interest and foreign withholding taxes recorded on the fund's books and the U.S. dollar equivalent of the amounts actually received or paid. Net unrealized foreign exchange gains and losses arise from changes in the value of assets and liabilities, other than investments in securities, resulting from changes in exchange rates. Such gains and losses are included with net realized and unrealized gain or loss on investments.
(c) Securities transactions and investment income: Securities transactions are recorded on a trade date basis. Realized gain and loss from securities transactions are recorded on the identified cost basis. Dividend income is recognized on the ex-dividend date and interest income, including, where applicable, accretion of discount and amortization of premium on investments, is recognized on the accrual basis.
30
The portfolio has an arrangement with the custodian bank whereby the portfolio receives earnings credits from the custodian when positive cash balances are maintained, which are used to offset custody fees. For financial reporting purposes, the portfolio includes net earnings credits, if any, as an expense offset in the Statement of Operations.
Pursuant to a securities lending agreement with Mellon Bank, N.A., an affiliate of the Manager, the portfolio may lend securities to qualified institutions.At origination, all loans are secured by collateral of at least 102% of the value of U.S. securities loaned and 105% of the value of foreign securities loaned. Collateral equivalent to at least 100% of the market value of securities on loan will be maintained at all times. Cash collateral is invested in certain money market mutual funds managed by the Manager. The portfolio will be entitled to receive all income on securities loaned, in addition to income earned as a result of the lending transaction.Although each security loaned is fully collateralized, the portfolio would bear the risk of delay in recovery of, or loss of rights in, the securities loaned should a borrower fail to return the securities in a timely manner.
(d) Affiliated issuers: Investments in other investment companies advised by the Manager are defined as “affiliated” in the Act.
(e) Dividends to shareholders: It is the policy of the portfolio to declare and pay dividends quarterly from investment income-net. Dividends from net realized capital gain, if any, are normally declared and paid annually, but the portfolio may make distributions on a more frequent basis to comply with the distribution requirements of the Internal Revenue Code of 1986, as amended (the “Code”). To the extent that net realized capital gain can be offset by capital loss carryovers, it is the policy of the portfolio not to distribute such gain. Income and capital gain distributions are determined in accordance with income tax regulations, which may differ from U.S. generally accepted accounting principles.
The Portfolio 31
NOTES TO FINANCIAL STATEMENTS (continued)
(d) Federal income taxes: It is the policy of the portfolio to continue to qualify as a regulated investment company, if such qualification is in the best interests of its shareholders, by complying with the applicable provisions of the Code, and to make distributions of taxable income sufficient to relieve it from substantially all federal income and excise taxes.
At December 31, 2004, the components of accumulated earnings on a tax basis were as follows: undistributed ordinary income $27,051, accumulated capital losses $34,661,582 and unrealized appreciation $1,041,157.
The accumulated capital loss carryover is available to be applied against future net securities profits, if any, realized subsequent to December 31, 2004. If not applied, $4,814,711 of the carryover expires in fiscal 2007, $4,480,534 expires in fiscal 2008, $10,613,045 expires in fiscal 2009, $10,693,853 expires in fiscal 2010,and $4,059,439 expires in fiscal 2011.
The tax character of distributions paid to shareholders during the fiscal periods ended December 31, 2004 and December 31, 2003 were as follows: ordinary income $2,399,819 and $2,841,167, respectively.
During the period ended December 31, 2004, as a result of permanent book to tax differences primarily due to the tax treatment for amortization of premiums, the portfolio increased accumulated undistributed investment income-net by $124,551, decreased accumulated net realized gain (loss) on investments by $264,941 and increased paid-in capital by $140,390. Net assets were not affected by this reclassification.
NOTE 2—Bank Lines of Credit:
The portfolio may borrow up to $10 million for leveraging purposes under a short-term unsecured line of credit and participates with other Dreyfus-managed funds in a $100 million unsecured line of credit primarily to be utilized for temporary or emergency purposes, including
32
the financing of redemptions. Interest is charged to the portfolio based on prevailing market rates in effect at the time of borrowings. During the period ended December 31, 2004, the portfolio did not borrow under either line of credit.
NOTE 3—Investment Advisory Fee and Other Transactions With Affiliates:
(a) Pursuant to an Investment Advisory Agreement (“Agreement”) with Dreyfus, the investment advisory fee is computed at the annual rate of ..65 of 1% of the value of the portfolio's average daily net assets and is payable monthly.
The Manager has agreed, from January 1, 2004 to December 31, 2005, to waive receipt of its fees and/or assume the expenses of the portfolio so that the expenses of neither class, exclusive of taxes, brokerage commissions, extraordinary expenses, interest expenses and commitment fees on borrowings exceed .90 of 1% of the value of the average daily net assets of their class. During the period ended December 31, 2004, the Manager waived receipt of fees of $21,623, pursuant to the undertaking.
(b) Under the Distribution Plan (the “Plan”) adopted pursuant to Rule 12b-1 under the Act, Service shares pay the Distributor for distributing their shares, for servicing and/or maintaining Service shares shareholder accounts and for advertising and marketing for Service shares.The Plan provides for payments to be made at an annual rate of .25 of 1% of the value of the Service shares' average daily net assets.The Distributor may make payments to Participating Insurance Companies and to brokers and dealers acting as principal underwriter for their variable insurance products.The fees payable under the Plan are payable without regard to actual expenses incurred. During the period ended December 31, 2004, Service shares were charged $22,467 pursuant to the Plan.
The Portfolio 33
NOTES TO FINANCIAL STATEMENTS (continued)
The portfolio compensates Dreyfus Transfer, Inc., a wholly-owned subsidiary of the Manager, under a transfer agency agreement for providing personnel and facilities to perform transfer agency services for the portfolio. During the period ended December 31, 2004, the portfolio was charged $71 pursuant to the transfer agency agreement.
The portfolio compensates Mellon Bank, N.A., an affiliate of the Manager, under a custody agreement to provide custodial services for the portfolio. During the period ended December 31, 2004, the portfolio was charged $7,669 pursuant to the custody agreement.
The components of Due to The Dreyfus Corporation and affiliates in the Statement of Assets and Liabilities consist of: management fees $18,311, Rule 12b-1 distribution plan fees $1,992, custodian fees $1,816 and transfer agency per account fees $11, which are offset against an expense reimbursement currently in effect in the amount of $5,601.
(c) Each Board member also serves as a Board member of other funds within the Dreyfus complex. Annual retainer fees and attendance fees are allocated to each fund based on net assets.
(d) Pursuant to an exemptive order from the Securities and Exchange Commission, the portfolio may invest its available cash balances in affiliated money market mutual funds. Management fees of the underlying money market mutual funds have been waived by the Manager.
NOTE 4—Securities Transactions:
The aggregate amount of purchases and sales of investment securities, excluding short-term securities, forward currency exchange contracts, swap transactions, option transactions and financial futures, during the period ended December 31, 2004, amounted to $24,054,446 and $29,363,636, respectively.
The portfolio may invest in financial futures contracts in order to gain exposure to or protect against changes in the market.The portfolio is exposed to market risk as a result of changes in the value of the underlying financial instruments. Investments in financial futures
34
require the fund to “mark to market” on a daily basis, which reflects the change in market value of the contracts at the close of each day's trading.Accordingly, variation margin payments are received or made to reflect daily unrealized gains and losses. When the contracts are closed, the fund recognizes a realized gain or loss.These investments require initial margin deposits with a broker, which consist of cash or cash equivalents.The amount of these deposits is determined by the exchange or Board of Trade on which the contract is traded and is subject to change. At December 31, 2004, there were no financial futures contracts outstanding.
The portfolio enters into forward currency exchange contracts in order to hedge its exposure to changes in foreign currency exchange rates on its foreign portfolio holdings and to settle foreign currency transactions. When executing forward currency exchange contracts, the portfolio is obligated to buy or sell a foreign currency at a specified rate on a certain date in the future. With respect to sales of forward currency exchange contracts, the portfolio would incur a loss if the value of the contract increases between the date the forward contract is opened and the date the forward contract is closed.The portfolio realizes a gain if the value of the contract decreases between those dates.With respect to purchases of forward currency exchange contracts, the portfolio would incur a loss if the value of the contract decreases between the date the forward contract is opened and the date the forward contract is closed. The portfolio realizes a gain if the value of the contract increases between those dates.The portfolio is also exposed to credit risk associated with counterparty nonperformance on these forward currency exchange contracts which is typically limited to the unrealized gain on each open contract.At December 31, 2004, there were no forward currency exchange contracts outstanding.
The portfolio may enter into swap agreements to exchange the interest rate on, or return generated by, one nominal instrument for the return generated by another nominal instrument.
The Portfolio 35
NOTES TO FINANCIAL STATEMENTS (continued)
As of January 1, 2004, the portfolio has adopted the method of accounting for interim payments on swap contracts in accordance with Financial Accounting Standards Board Statement No. 133.The portfolio accrues for the interim payments on swap contracts on a daily basis, with the net amount recorded within unrealized appreciation (depreciation) on swap contracts on the Statement of Assets and Liabilities. Once the interim payments are settled in cash, the net amount is recorded as realized gain (loss) on swaps, in addition to realized gain (loss) recorded upon the termination of swap contracts, in the Statement of Operations. Prior to January 1, 2004, these interim payments were reflected within interest income in the Statement of Operations. Fluctuations in the value of swap contracts are recorded as a component of net change in unrealized appreciation (depreciation) on investments.
Credit default swaps involve commitments to pay a fixed interest rate in exchange for payment if a credit event affecting a third party (the referenced company) occurs. Credit events may include a failure to pay interest or principal, bankruptcy, or restructuring. At December 31, 2004, there were no credit default swaps outstanding.
The portfolio may purchase and write (sell) put and call options in order to gain exposure to or to protect against changes in the market.
As a writer of call options, the portfolio receives a premium at the outset and then bears the market risk of unfavorable changes in the price of the financial instrument underlying the option. Generally, the portfolio would incur a gain, to the extent of the premium, if the price of the underlying financial instrument decreases between the date the option is written and the date on which the option is terminated. Generally, the portfolio would realize a loss, if the price of the financial instrument increases between those dates.At December 31, 2004, there were no written call options outstanding.
As a writer of put options, the portfolio receives a premium at the outset and then bears the market risk of unfavorable changes in the price of the financial instrument underlying the option. Generally, the portfolio would incur a gain, to the extent of the premium, if the price of
36
the underlying financial instrument increases between the date the option is written and the date on which the option is terminated. Generally, the portfolio would realize a loss, if the price of the financial instrument decreases between those dates.At December 31, 2004, there were no written put options outstanding.
At December 31, 2004, the cost of investments for federal income tax purposes was $35,991,112; accordingly, accumulated net unrealized appreciation on investments was $1,041,157, consisting of $2,158,948 gross unrealized appreciation and $1,117,794 gross unrealized depreciation.
NOTE 5—Legal Matters:
In early 2004, two purported class and derivative actions were filed against Mellon Financial, Mellon Bank, N.A., Dreyfus, Founders Asset Management LLC, and certain directors of the Dreyfus Funds and the Dreyfus Founders Funds (together, the “Funds”). In September 2004, plaintiffs served a Consolidated Amended Complaint (the “Amended Complaint”) on behalf of a purported class of all persons who acquired interests in any of the Funds between January 30, 1999 and November 17, 2003, and derivatively on behalf of the Funds. The Amended Complaint in the newly styled In re Dreyfus Mutual Funds Fee Litigation also named the Distributor, Premier Mutual Fund Services, Inc. and two additional Fund directors as defendants and alleges violations of the Investment Company Act of 1940, the Investment Advisers Act of 1940, the Pennsylvania Unfair Trade Practices and Consumer Protection Law and common-law claims. Plaintiffs seek to recover allegedly improper and excessive Rule 12b-1 and advisory fees allegedly charged to the Funds for marketing and distribution services. More specifically, plaintiffs claim, among other things, that 12b-1 fees and directed brokerage were improperly used to pay brokers to recommend the Funds over other funds, and that such payments were not disclosed to investors. In addition, plaintiffs assert that economies of scale and soft-dollar benefits were not passed on to the Funds. Plaintiffs further allege that 12b-1 fees were improperly
The Portfolio 37
NOTES TO FINANCIAL STATEMENTS (continued)
charged to certain of the Funds that were closed to new investors.The Amended Complaint seeks compensatory and punitive damages, rescission of the advisory contracts, and an accounting and restitution of any unlawful fees, as well as an award of attorneys' fees and litigation expenses. As noted, some of the claims in this litigation are asserted derivatively on behalf of the Funds that have been named as nominal defendants.With respect to such derivative claims, no relief is sought against the Funds. Dreyfus believes the allegations to be totally without merit and intends to defend the action vigorously. Defendants filed motions to dismiss the Amended Complaint on November 12, 2004, and those motions are pending.
Additional lawsuits arising out of these circumstances and presenting similar allegations and requests for relief may be filed against the defendants in the future. Neither Dreyfus nor the Funds believe that any of the pending actions will have a material adverse effect on the Funds or Dreyfus' ability to perform its contract with the Funds.
38
REPORT OF INDEPENDENT REGISTERED
PUBLIC ACCOUNTING FIRM
|
| | Shareholders and Board of Trustees
Dreyfus Variable Investment Fund,
Limited Term High Yield Portfolio
|
We have audited the accompanying statement of assets and liabilities, including the statement of investments, of Dreyfus Variable Investment Fund, Limited Term High Yield Portfolio (one of the funds comprising Dreyfus Variable Investment Fund) as of December 31, 2004, and the related statement of operations for the year then ended, the statement of changes in net assets for each of the two years in the period then ended, and financial highlights for each of the periods indicated therein.These financial statements and financial highlights are the responsibility of the Fund's management. Our responsibility is to express an opinion on these financial statements and financial highlights based on our audits.
We conducted our audits in accordance with the standards of the Public Company Accounting Oversight Board (United States).Those standards require that we plan and perform the audit to obtain reasonable assurance about whether the financial statements and financial highlights are free of material misstatement. An audit includes examining, on a test basis, evidence supporting the amounts and disclosures in the financial statements and financial highlights. Our procedures included verification by examination of securities held by the custodian as of December 31, 2004 and confirmation of securities not held by the custodian by correspondence with others. An audit also includes assessing the accounting principles used and significant estimates made by management, as well as evaluating the overall financial statement presentation.We believe that our audits provide a reasonable basis for our opinion.
In our opinion, the financial statements and financial highlights referred to above present fairly, in all material respects, the financial position of Dreyfus Variable Investment Fund, Limited Term High Yield Portfolio at December 31, 2004, the results of its operations for the year then ended, the changes in its net assets for each of the two years in the period then ended, and the financial highlights for each of the indicated periods, in conformity with U.S. generally accepted accounting principles.
| | New York, New York
February 4, 2005
|
The Portfolio 39
IMPORTANT TAX INFORMATION (Unaudited)
For federal tax purposes, the portfolio hereby designates 1.47% of the ordinary dividends paid during the fiscal year ended December 31, 2004 as qualifying for the corporate dividends received deduction. Shareholders will receive notification in January 2005 of the percentage applicable to the preparation of their 2004 income tax returns.
40
BOARD MEMBERS INFORMATION (Unaudited)
| Joseph S. DiMartino (61) |
| Chairman of the Board (1995) |
| Principal Occupation During Past 5 Years: |
| • Corporate Director and Trustee |
| Other Board Memberships and Affiliations: |
| • The Muscular Dystrophy Association, Director |
| • Levcor International, Inc., an apparel fabric processor, Director |
| • Century Business Services, Inc., a provider of outsourcing functions for small and medium size |
| companies, Director |
| • The Newark Group, a provider of a national market of paper recovery facilities, paperboard |
| mills and paperboard converting plants, Director |
| • Azimuth Trust, an institutional asset management firm, Member of Board of Managers and |
| Advisory Board |
| No. of Portfolios for which Board Member Serves: 186 |
| ——————— |
| David P. Feldman (65) |
| Board Member (1994) |
| Principal Occupation During Past 5 Years: |
| • Corporate Director and Trustee |
| Other Board Memberships and Affiliations: |
| • BBH Mutual Funds Group (11 funds), Director |
| • The Jeffrey Company, a private investment company, Director |
| • QMED, a medical device company, Director |
| No. of Portfolios for which Board Member Serves: 51 |
| ——————— |
| James F. Henry (74) |
| Board Member (1990) |
| Principal Occupation During Past 5 Years: |
| • President, CPR Institute for Dispute Resolution, a non-profit organization principally |
| engaged in the development of alternatives to business litigation (Retired 2003) |
| No. of Portfolios for which Board Member Serves: 22 |
| ——————— |
| Rosalind Gersten Jacobs (79) |
| Board Member (1990) |
| Principal Occupation During Past 5 Years: |
| • Merchandise and marketing consultant |
| No. of Portfolios for which Board Member Serves: 33 |
The Portfolio 41
BOARD MEMBERS INFORMATION (Unaudited) (continued)
| Dr. Paul A. Marks (78) |
| Board Member (1990) |
| Principal Occupation During Past 5 Years: |
| • President and Chief Executive Officer of Memorial Sloan-Kettering Cancer Center |
| (Retired 1999) |
| Other Board Memberships and Affiliations: |
| • Pfizer, Inc., a pharmaceutical company, Director-Emeritus |
| • Atom Pharm, Director |
| • Lazard Freres & Company, LLC, Senior Adviser |
| • Merck, Consultant |
| No. of Portfolios for which Board Member Serves: 22 |
| ——————— |
| Dr. Martin Peretz (65) |
| Board Member (1990) |
| Principal Occupation During Past 5 Years: |
| • Editor-in-Chief of The New Republic Magazine |
| • Lecturer in Social Studies at Harvard University (1965-2001) |
| • Co-Chairman of TheStreet.com, a financial daily on the web |
| Other Board Memberships and Affiliations: |
| • Academy for Liberal Education, an accrediting agency for colleges and universities certified by |
| the U.S. Department of Education, Director |
| • Digital Learning Group, LLC, an online publisher of college textbooks, Director |
| • Harvard Center for Blood Research,Trustee |
| • Bard College,Trustee |
| • YIVO Institute for Jewish Research,Trustee |
| No. of Portfolios for which Board Member Serves: 22 |
| ——————— |
| Bert W. Wasserman (72) |
| Board Member (1993) |
| Principal Occupation During Past 5 Years: |
| • Financial Consultant |
| Other Board Memberships and Affiliations: |
| • Lillian Vernon Corporation, Director |
| No. of Portfolios for which Board Member Serves: 22 |
| ——————— |
| Once elected all Board Members serve for an indefinite term.The address of the Board Members and Officers is in c/o |
| The Dreyfus Corporation, 200 Park Avenue, New York, New York 10166.Additional information about the Board |
| Members is available in the fund's Statement of Additional Information which can be obtained from Dreyfus free of |
| charge by calling this toll free number: 1-800-554-4611. |
| John M. Fraser, Jr., Emeritus Board Member |
| Irving Kristol, Emeritus Board Member |
42
OFFICERS OF THE FUND (Unaudited)
STEPHEN E. CANTER, President since March 2000.
Chairman of the Board, Chief Executive Officer and Chief Operating Officer of the Manager, and an officer of 92 investment companies (comprised of 185 portfolios) managed by the Manager. Mr. Canter also is a Board member and, where applicable, an Executive Committee Member of the other investment management subsidiaries of Mellon Financial Corporation, each of which is an affiliate of the Manager. He is 59 years old and has been an employee of the Manager since May 1995.
STEPHEN R. BYERS, Executive Vice President since November 2002.
Chief Investment Officer,Vice Chairman and a director of the Manager, and an officer of 92 investment companies (comprised of 185 portfolios) managed by the Manager. Mr. Byers also is an officer, director or an Executive Committee Member of certain other investment management subsidiaries of Mellon Financial Corporation, each of which is an affiliate of the Manager. He is 51 years old and has been an employee of the Manager since January 2000. Prior to joining the Manager, he served as an Executive Vice President-Capital Markets, Chief Financial Officer and Treasurer at Gruntal & Co., L.L.C.
MARK N. JACOBS, Vice President since March 2000.
Executive Vice President, Secretary and General Counsel of the Manager, and an officer of 93 investment companies (comprised of 201 portfolios) managed by the Manager. He is 58 years old and has been an employee of the Manager since June 1977
MICHAEL A. ROSENBERG, Secretary since March 2000.
Associate General Counsel of the Manager, and an officer of 90 investment companies (comprised of 194 portfolios) managed by the Manager. He is 44 years old and has been an employee of the Manager since October 1991.
ROBERT R. MULLERY, Assistant Secretary since March 2000.
Associate General Counsel of the Manager, and an officer of 26 investment companies (comprised of 60 portfolios) managed by the Manager. He is 52 years old and has been an employee of the Manager since May 1986.
STEVEN F. NEWMAN, Assistant Secretary since March 2000.
Associate General Counsel and Assistant Secretary of the Manager, and an officer of 93 investment companies (comprised of 201 portfolios) managed by the Manager. He is 55 years old and has been an employee of the Manager since July 1980.
JAMES WINDELS, Treasurer since November 2001.
Director – Mutual Fund Accounting of the Manager, and an officer of 93 investment companies (comprised of 201 portfolios) managed by the Manager. He is 46 years old and has been an employee of the Manager since April 1985.
RICHARD CASSARO, Assistant Treasurer since August 2003.
Senior Accounting Manager – Equity Funds of the Manager, and an officer of 26 investment companies (comprised of 102 portfolios) managed by the Manager. He is 44 years old and has been an employee of the Manager since September 1982.
The Portfolio 43
OFFICERS OF THE FUND (Unaudited) (continued)
ERIK D. NAVILOFF, Assistant Treasurer since December 2002.
Senior Accounting Manager – Taxable Fixed Income Funds of the Manager, and an officer of 19 investment companies (comprised of 75 portfolios) managed by the Manager. He is 36 years old and has been an employee of the Manager since November 1992.
ROBERT ROBOL, Assistant Treasurer since August 2003.
Senior Accounting Manager – Money Market Funds of the Manager, and an officer of 39 investment companies (comprised of 84 portfolios) managed by the Manager. He is 40 years old and has been an employee of the Manager since October 1988.
ROBERT SVAGNA, Assistant Treasurer since December 2002.
Senior Accounting Manager – Equity Funds of the Manager, and an officer of 27 investment companies (comprised of 107 portfolios) managed by the Manager. He is 37 years old and has been an employee of the Manager since November 1990.
KENNETH J. SANDGREN, Assistant Treasurer since November 2001.
Mutual Funds Tax Director of the Manager, and an officer of 93 investment companies (comprised of 201 portfolios) managed by the Manager. He is 50 years old and has been an employee of the Manager since June 1993.
JOSEPH W. CONNOLLY, Chief Compliance Officer since October 2004.
Chief Compliance Officer of the Manager and The Dreyfus Family of Funds (93 investment companies, comprising 201 portfolios). From November 2001 through March 2004, Mr. Connolly was first Vice-President, Mutual Fund Servicing for Mellon Global Securities Services. In that capacity, Mr. Connolly was responsible for managing Mellon's Custody, Fund Accounting and Fund Administration services to third-party mutual fund clients. He is 47 years old and has served in various capacities with the Manager since 1980, including manager of the firm's Fund Accounting Department from 1997 through October 2001.
WILLIAM GERMENIS, Anti-Money Laundering Compliance Officer since September 2002.
Vice President and Anti-Money Laundering Compliance Officer of the Distributor, and the Anti-Money Laundering Compliance Officer of 88 investment companies (comprised of 196 portfolios) managed by the Manager. He is 34 years old and has been an employee of the Distributor since October 1998.
44
| For More | | Information |
| |
|
| |
| |
| |
| Dreyfus Variable | | Transfer Agent & |
| |
| Investment Fund, | | Dividend Disbursing Agent |
| |
| Limited Term | | |
| | | Dreyfus Transfer, Inc. |
| High Yield Portfolio | | |
| | | 200 Park Avenue |
| 200 Park Avenue | | |
| | | New York, NY 10166 |
| New York, NY 10166 | | |
| |
| | | Distributor |
| Investment Adviser | | |
| |
| | | Dreyfus Service Corporation |
| The Dreyfus Corporation | | |
| | | 200 Park Avenue |
| 200 Park Avenue | | |
| | | New York, NY 10166 |
| New York, NY 10166 | | |
| |
| |
| Custodian | | |
| |
| |
| Mellon Bank, N.A. | | |
| |
| One Mellon Bank Center | | |
| |
| Pittsburgh, PA 15258 | | |
| Telephone 1-800-554-4611 or 516-338-3300 |
| Mail The Dreyfus Family of Funds, 144 Glenn Curtiss Boulevard, Uniondale, NY 11556-0144 |
| Attn: Institutional Servicing |
| The portfolio files its complete schedule of portfolio holdings with the Securities and |
| Exchange Commission (“SEC”) for the first and third quarters of each fiscal year on Form N-Q. |
| The portfolio's Forms N-Q are available on the SEC's website at http://www.sec.gov and may |
| be reviewed and copied at the SEC's Public Reference Room in Washington, DC. Information |
| on the operation of the Public Reference Room may be obtained by calling 1-800-SEC-0330. |
| A description of the policies and procedures that the portfolio uses to determine how to |
| vote proxies relating to portfolio securities, and information regarding how the portfolio |
| voted these proxies for the 12-month period ended June 30, 2004, is available through the |
| portfolio's website at http://www.dreyfus.com and on the SEC's website at http://www.sec.gov. |
| The description of the policies and procedures is also available without charge, upon request, |
| by calling 1-800-645-6561. |

© 2005 Dreyfus Service Corporation 0156AR1204
| Dreyfus Variable |
| Investment Fund, |
| Money Market |
| Portfolio |
| ANNUAL REPORT December 31, 2004 |

The views expressed in this report reflect those of the portfolio manager only through the end of the period covered and do not necessarily represent the views of Dreyfus or any other person in the Dreyfus organization.Any such views are subject to change at any time based upon market or other conditions and Dreyfus disclaims any responsibility to update such views. These views may not be relied on as investment advice and, because investment decisions for a Dreyfus portfolio are based on numerous factors, may not be relied on as an indication of trading intent on behalf of any Dreyfus portfolio.
Not FDIC-Insured • Not Bank-Guaranteed • May Lose Value
| | | Contents |
| |
| | | T H E P O R T F O L I O |
| |
|
| 2 | | Letter from the Chairman |
| 3 | | Discussion of Performance |
| 6 | | Understanding Your Portfolio’s Expenses |
| 6 | | Comparing Your Portfolio’s Expenses |
| | | With Those of Other Funds |
| 7 | | Statement of Investments |
| 9 | | Statement of Assets and Liabilities |
| 10 | | Statement of Operations |
| 11 | | Statement of Changes in Net Assets |
| 12 | | Financial Highlights |
| 13 | | Notes to Financial Statements |
| 18 | | Report of Independent Registered |
| | | Public Accounting Firm |
| 19 | | Board Members Information |
| 21 | | Officers of the Fund |
| | | F O R M O R E I N F O R M AT I O N |
| |
|
| | | Back Cover |
| Dreyfus Variable Investment Fund, |
| Money Market Portfolio |

LETTER FROM THE CHAIRMAN
We are pleased to present this annual report for Dreyfus Variable Investment Fund, Money Market Portfolio, covering the 12-month period from January 1, 2004, through December 31, 2004. Inside, you’ll find valuable information about how the portfolio was managed during the reporting period, including a discussion with the portfolio manager, Bernard W. Kiernan Jr.
Many investors breathed a sigh of relief over the second half of the year as rising interest rates drove money market yields above historical lows. The Federal Reserve Board (the “Fed”) raised short-term interest rates five consecutive times between late June and December, more than doubling the overnight federal funds rate from 1% to 2.25% . What’s more, many analysts apparently expect the Fed to raise short-term interest rates further in 2005 if the U.S. economy continues to grow at its current rate. However, risks to the economic recovery persist, and the magnitude and timing of any further interest-rate increases by the Fed remain uncertain.
As always, we urge our shareholders to establish an investment plan with the help of your financial advisor, and review it periodically to track your progress toward your financial goals.
Thank you for your continued confidence and support.
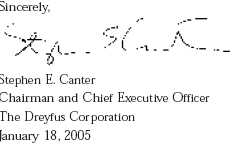

DISCUSSION OF PERFORMANCE
Bernard W. Kiernan, Jr., Portfolio Manager
How did Dreyfus Variable Investment Fund, Money Market Portfolio perform during the period?
During the 12-month period ended December 31, 2004, the portfolio produced a yield of 0.80% . Taking into account the effects of compounding, the portfolio also provided an effective yield of 0.80% for the same period.1
What is the portfolio’s investment approach?
The portfolio seeks as high a level of current income as is consistent with the preservation of capital and the maintenance of liquidity.To pursue this goal, the portfolio invests in a diversified selection of high-quality, short-term debt securities, including securities issued or guaranteed by the U.S. government or its agencies or instrumentalities, certificates of deposit, securities issued by domestic or foreign banks, repurchase agreements, asset-backed securities, domestic and dollar-denominated foreign commercial paper and dollar-denominated obligations issued or guaranteed by foreign governments.
Normally, the portfolio invests at least 25% of its net assets in domestic or dollar-denominated foreign bank obligations.
What other factors influenced the portfolio’s performance?
The portfolio was primarily influenced by a strengthening U.S. economy, which led to higher short-term interest rates during the second half of the reporting period.
Although the U.S. economy appeared to be growing moderately when 2004 began, inflation remained near historically low levels as labor markets remained weak and corporations had little room to raise prices of goods and services. As a result, the Federal Reserve Board (the “Fed”) indicated at the time that it could be “patient” before moving away from the aggressively accommodative monetary policy it
DISCUSSION OF PERFORMANCE (continued)
|
had implemented in the aftermath of the 2001 terrorist attacks. In April, however, an unexpectedly strong employment report rekindled investors’ concerns that inflationary pressures might be resurfacing. Higher energy and commodity prices appeared to lend credence to this view, and money market yields began to rise at the longer end of the maturity spectrum. However, the short-end of the money market yield curve remained anchored by the prevailing 1% federal funds rate.
While the Fed left interest rates unchanged in May, it indicated that future rate hikes were likely to be “measured.”When employment data showed a second consecutive month of robust gains, investors began to anticipate that the Fed might tighten monetary policy as early as its next meeting in June. Indeed, on June 30, the Fed raised the overnight federal funds rate to 1.25%, its first increase in more than four years. Because most investors had anticipated the Fed’s initial move, the money markets already had reflected its impact.
However, the economy appeared to hit a “soft patch” in the summer as the number of jobs created in June and July failed to meet expectations. Nonetheless, most investors expected the Fed to increase the federal funds rate again at its August meeting, and money market yields reflected that view. Then, as expected, the Fed raised short-term interest rates by 25 basis points in August, and again at its meetings in September and November.
In the meantime, economic activity continued to advance in the fall. GDP and job creation both posted solid gains in November, and the end of the contentious presidential election lifted a cloud of uncertainty from the financial markets, as evidenced by a strong stock market rally near year-end. At its December meeting, the Fed stated that, despite the rise in energy prices, economic activity was growing at a moderate pace and job creation was on an upward trend, albeit at a somewhat slower rate than is typical during economic recoveries. Consequently, the Fed raised interest rates a fifth consecutive time, bringing the overnight rate to 2.25%, while also indicating that it will remain vigilant and will respond to any threat to price stability.
In this environment of rising interest rates and stronger economic growth, we began to adopt a more defensive investment posture in the spring of 2004 when inflation concerns intensified, allowing the portfolio’s weighted average maturity to fall toward a position we consider “neutral” to industry averages.
What is the portfolio’s current strategy?
As of the end of the reporting period, we generally have maintained the portfolio’s neutral weighted average maturity, and we currently expect the Fed to continue raising interest rates at a measured pace, especially during the first half of 2005.The portfolio’s weighted average maturity should allow for reinvestment at higher yield levels should those opportunities arise. Of course, we are prepared to adjust our strategies as market conditions evolve.
| | | The portfolio is only available as a funding vehicle under variable life insurance policies or variable |
| | | annuity contracts issued by insurance companies. Individuals may not purchase shares of the |
| | | portfolio directly.A variable annuity is an insurance contract issued by an insurance company that |
| | | enables investors to accumulate assets on a tax-deferred basis for retirement or other long-term |
| | | goals.The investment objective and policies of Dreyfus Variable Investment Fund, Money Market |
| | | Portfolio made available through insurance products may be similar to other funds/portfolios |
| | | managed or advised by Dreyfus. However, the investment results of the portfolio may be higher or |
| | | lower than, and may not be comparable to, those of any other Dreyfus fund/portfolio. |
| 1 | | Effective yield is based upon dividends declared daily and reinvested monthly. Past performance is |
| | | no guarantee of future results.Yields fluctuate.An investment in the portfolio is not insured or |
| | | guaranteed by the FDIC or any other government agency.Although the portfolio seeks to preserve |
| | | the value of your investment at $1.00 per share, it is possible to lose money by investing in the |
| | | portfolio.The portfolio’s performance does not reflect the deduction of additional charges and |
| | | expenses imposed in connection with investing in variable insurance contracts, which will reduce |
| | | returns. |
| UNDERSTANDING YOUR |
| PORTFOLIO’S EXPENSES (Unaudited) |
As a mutual fund investor,you pay ongoing expenses,such as management fees and other expenses.Using the information below,you can estimate how these expenses affect your investment and compare them with the expenses of other funds.You also may pay one-time transaction expenses,including sales charges (loads) and redemption fees, which are not shown in this section and would have resulted in higher total expenses. For more information, see your portfolio’s prospectus or talk to your financial adviser.
| | Review your portfolio’s expenses
|
The table below shows the expenses you would have paid on a $1,000 investment in Dreyfus Variable Investment Fund,Money Market Portfolio from July 1,2004 to December 31,2004. It also shows how much a $1,000 investment would be worth at the close of the period, assuming actual returns and expenses.
| Expenses and Value of a $1,000 Investment |
| assuming actual returns for the six months ended December 31, 2004 |
| Expenses paid per $1,000 † | | $ 3.18 |
| Ending value (after expenses) | | $1,005.30 |
| COMPARING YOUR PORTFOLIO’S EXPENSES |
| WITH THOSE OF OTHER FUNDS (Unaudited) |
Using the SEC’s method to compare expenses
The Securities and Exchange Commission (SEC) has established guidelines to help investors assess fund expenses. Per these guidelines, the table below shows your portfolio’s expenses based on a $1,000 investment, assuming a hypothetical 5% annualized return. You can use this information to compare the ongoing expenses (but not transaction expenses or total cost) of investing in the portfolio with those of other funds. All mutual fund shareholder reports will provide this information to help you make this comparison. Please note that you cannot use this information to estimate your actual ending account balance and expenses paid during the period.
| Expenses and Value of a $1,000 Investment |
| assuming a hypothetical 5% annualized return for the six months ended December 31, 2004 |
| Expenses paid per $1,000 † | | $ 3.20 |
| Ending value (after expenses) | | $1,021.97 |
| † Expenses are equal to the portfolio’s annualized expense ratio of .63%, multiplied by the average account value over |
| the period, multiplied by 184/366 (to reflect the one-half year period). |
| STATEMENT OF INVESTMENTS |
| December 31, 2004 |
| | | Principal | | |
| Negotiable Bank Certificates of Deposit—12.5% | | Amount ($) | | Value ($) |
| |
| |
|
| Credit Agricole Indosuez (Yankee) | | | | |
| 2.32%, 4/26/2005 | | 5,000,000 a | | 4,999,683 |
| First Tennessee Bank N.A. | | | | |
| 2.24%, 1/24/2005 | | 4,000,000 | | 4,000,000 |
| Washington Mutual Bank, F.A. | | | | |
| 2.25%, 2/2/2005 | | 4,000,000 | | 4,000,000 |
| Total Negotiable Bank Certificates of Deposit | | | | |
| (cost $12,999,683) | | | | 12,999,683 |
| |
| |
|
| |
| Commercial Paper—45.0% | | | | |
| |
| |
|
| Allied Irish Banks N.A. | | | | |
| 2.43%, 3/15/2005 | | 3,000,000 | | 2,985,278 |
| Atlantis One Funding Corp. | | | | |
| 2.16%, 4/7/2005 | | 4,000,000 b | | 3,977,173 |
| Beta Finance Inc. | | | | |
| 2.03%, 3/14/2005 | | 5,000,000 b | | 4,979,900 |
| Credit Suisse First Boston Inc. | | | | |
| 2.14%, 1/10/2005 | | 4,000,000 | | 3,997,870 |
| Deutsche Bank Financial LLC | | | | |
| 2.25%, 1/3/2005 | | 2,000,000 | | 1,999,750 |
| General Electric Capital Corp. | | | | |
| 2.24%, 1/21/2005 | | 4,000,000 | | 3,995,045 |
| Greyhawk Funding LLC | | | | |
| 2.15%, 1/7/2005 | | 4,000,000 b | | 3,998,573 |
| Harrier Finance Funding LLC | | | | |
| 2.47%, 3/7/2005 | | 3,000,000 b | | 2,986,675 |
| Santander Central Hispano Finance Inc. | | | | |
| 2.16%, 4/8/2005 | | 4,000,000 | | 3,976,936 |
| Solitaire Funding LLC | | | | |
| 2.19%, 1/10/2005 | | 4,000,000 b | | 3,997,820 |
| Stadshypotek Delaware Inc. | | | | |
| 2.15%, 1/10/2005 | | 4,000,000 b | | 3,997,860 |
| Swedbank Inc. | | | | |
| 2.15%, 1/3/2005 | | 4,000,000 | | 3,999,524 |
| UBS Finance Delaware LLC | | | | |
| 2.23%, 1/3/2005 | | 2,000,000 | | 1,999,752 |
| Total Commercial Paper | | | | |
| (cost $46,892,156) | | | | 46,892,156 |
S T A T E M E N T O F I N V E S T M E N T S (continued)
| | | Principal | | |
| Corporate Notes—20.1% | | Amount ($) | | Value ($) |
| |
| |
|
| Lehman Brothers Holdings Inc. | | | | |
| 2.38%, 5/16/2005 | | 5,000,000 a | | 5,000,000 |
| Merrill Lynch & Co. Inc. | | | | |
| 2.30%, 1/31/2005 | | 8,000,000 a | | 8,000,000 |
| Sigma Finance Inc. | | | | |
| 2.32%, 1/31/2005 | | 8,000,000 a,b | | 7,999,903 |
| Total Corporate Notes | | | | |
| (cost $20,999,903) | | | | 20,999,903 |
| |
| |
|
| |
| U.S. Government Agencies—21.1% | | | | |
| |
| |
|
| Federal Home Loan Banks, Notes | | | | |
| 1.41%, 3/11/2005 | | 8,000,000 | | 8,000,000 |
| Federal National Mortgage Association, Notes | | |
| 1.35%-1.57%, 2/14/2005—5/13/2005 | | 14,000,000 | | 14,000,000 |
| Total U.S. Government Agencies | | | | |
| (cost $22,000,000) | | | | 22,000,000 |
| |
| |
|
| |
| Time Deposits—1.2% | | | | |
| |
| |
|
| Marshall & Ilsley Bank (Grand Cayman) | | | | |
| 2%, 1/3/2005 | | | | |
| (cost $1,280,000) | | 1,280,000 | | 1,280,000 |
| |
| |
|
| |
| Total Investments (cost $104,171,742) | | 99.9% | | 104,171,742 |
| Cash and Receivables (Net) | | .1% | | 56,941 |
| Net Assets | | 100.0% | | 104,228,683 |
| a Variable interest rate—subject to periodic change. |
| b Securities exempt from registration under Rule 144A of the Securities Act of 1933.These securities may be resold in |
| transactions exempt from registration, normally to qualified institutional buyers.These securities have been determined |
| to be liquid by the Board of Trustees.At December 31, 2004, these securities amounted to $31,937,904 or 30.6% |
| of net assets. |
| Portfolio Summary † | | | | |
| |
| | | Value (%) | | | | Value (%) |
| |
| |
| |
|
| Banking | | 39.5 | | Finance & Financial | | 3.9 |
| Government Agency | | 21.1 | | Asset-Backed—Multiseller | | 3.8 |
| Asset—Backed | | 15.3 | | Autos | | 3.8 |
| Brokerage Firms | | 12.5 | | | | 99.9 |
| |
| † Based on net assets. | | | | | | |
| See notes to financial statements. | | | | |
| 8 | | | | | | |
| STATEMENT OF ASSETS AND LIABILITIES |
| December 31, 2004 |
| | | Cost | | Value |
| |
| |
|
| Assets ($): | | | | |
| Investments in securities—See Statement of Investments | | 104,171,742 | | 104,171,742 |
| Cash | | | | 196,982 |
| Interest receivable | | | | 214,937 |
| Prepaid expenses | | | | 3,434 |
| | | | | 104,587,095 |
| |
| |
|
| Liabilities ($): | | | | |
| Due to The Dreyfus Corporation and affiliates—Note 2(a) | | | | 47,109 |
| Payable for shares of Beneficial Interest redeemed | | | | 250,896 |
| Accrued expenses | | | | 60,407 |
| | | | | 358,412 |
| |
| |
|
| Net Assets ($) | | | | 104,228,683 |
| |
| |
|
| Composition of Net Assets ($): | | | | |
| Paid-in capital | | | | 104,251,447 |
| Accumulated net realized gain (loss) on investments | | | | (22,764) |
| |
| |
|
| Net Assets ($) | | | | 104,228,683 |
| |
| |
|
| Shares Outstanding | | | | |
| (unlimited number of $.001 par value shares of Beneficial Interest authorized) | | 104,251,447 |
| Net Asset Value, offering and redemption price per share ($) | | 1.00 |
See notes to financial statements.
|
| STATEMENT OF OPERATIONS |
| Year Ended December 31, 2004 |
| Investment Income ($): | | |
| Interest Income | | 1,768,785 |
| Expenses: | | |
| Investment advisory fee—Note 2(a) | | 644,724 |
| Custodian fees | | 40,039 |
| Prospectus and shareholders’ reports | | 39,003 |
| Professional fees | | 24,506 |
| Trustees’ fees and expenses—Note 2(b) | | 11,568 |
| Shareholder servicing costs—Note 2(a) | | 9,387 |
| Registration fees | | 2,488 |
| Miscellaneous | | 3,359 |
| Total Expenses | | 775,074 |
| Less—reduction in custody fees | | |
| due to earnings credits—Note 1(b) | | (123) |
| Net Expenses | | 774,951 |
| Investment Income—Net | | 993,834 |
| |
|
| Net Realized Gain (Loss) on Investments—Note 1(b) ($) | | 1,438 |
| Net Increase in Net Assets Resulting from Operations | | 995,272 |
See notes to financial statements.
|
STATEMENT OF CHANGES IN NET ASSETS
| | | Year Ended December 31, |
| |
|
| | | 2004 | | 2003 |
| |
| |
|
| Operations ($): | | | | |
| Investment income—net | | 993,834 | | 1,311,405 |
| Net realized gain (loss) on investments | | 1,438 | | (16) |
| Net Increase (Decrease) in Net Assets | | | | |
| Resulting from Operations | | 995,272 | | 1,311,389 |
| |
| |
|
| Dividends to Shareholders from ($): | | | | |
| Investment income—net | | (993,834) | | (1,311,405) |
| |
| |
|
| Beneficial Interest Transactions ($1.00 per share): | | |
| Net proceeds from shares sold | | 246,007,735 | | 458,808,838 |
| Dividends reinvested | | 993,834 | | 1,311,405 |
| Cost of shares redeemed | | (295,333,389) | | (503,778,316) |
| Increase (Decrease) in Net Assets | | | | |
| from Beneficial Interest Transactions | | (48,331,820) | | (43,658,073) |
| Total Increase (Decrease) in Net Assets | | (48,330,382) | | (43,658,089) |
| |
| |
|
| Net Assets ($): | | | | |
| Beginning of Period | | 152,559,065 | | 196,217,154 |
| End of Period | | 104,228,683 | | 152,559,065 |
See notes to financial statements.
|
The following table describes the performance for the fiscal periods indicated.Total return shows how much your investment in the portfolio would have increased (or decreased) during each period, assuming you had reinvested all dividends and dis-tributions.These figures have been derived from the portfolio’s financial statements.
| | | | | Year Ended December 31, | | |
| |
| |
| |
|
| | | 2004 | | 2003 | | 2002 | | 2001 | | 2000 |
| |
| |
| |
| |
| |
|
| Per Share Data ($): | | | | | | | | | | |
| Net asset value, beginning of period | | 1.00 | | 1.00 | | 1.00 | | 1.00 | | 1.00 |
| Investment Operations: | | | | | | | | | | |
| Investment income—net | | .008 | | .007 | | .015 | | .039 | | .058 |
| Distributions: | | | | | | | | | | |
| Dividends from investment income—net | | (.008) | | (.007) | | (.015) | | (.039) | | (.058) |
| Net asset value, end of period | | 1.00 | | 1.00 | | 1.00 | | 1.00 | | 1.00 |
| |
| |
| |
| |
| |
|
| Total Return (%) | | .80 | | .70 | | 1.46 | | 3.97 | | 5.98 |
| |
| |
| |
| |
| |
|
| Ratios/Supplemental Data (%): | | | | | | | | | | |
| Ratio of total expenses | | | | | | | | | | |
| to average net assets | | .60 | | .57 | | .56 | | .58 | | .60 |
| Ratio of net expenses | | | | | | | | | | |
| to average net assets | | .60 | | .57 | | .56 | | .58 | | .60 |
| Ratio of net investment income | | | | | | | | | | |
| to average net assets | | .77 | | .71 | | 1.44 | | 3.72 | | 5.87 |
| |
| |
| |
| |
| |
|
| Net Assets, end of period ($ x 1,000) | | 104,229 | | 152,559 | | 196,217 | | 190,449 | | 124,375 |
See notes to financial statements.
|
NOTES TO FINANCIAL STATEMENTS
NOTE 1—Significant Accounting Policies:
Dreyfus Variable Investment Fund (the “fund”) is registered under the Investment Company Act of 1940, as amended (the “Act”), as an open-end management investment company, operating as a series company currently offering twelve series, including the Money Market Portfolio (the “portfolio”).The portfolio is only offered to separate accounts established by insurance companies to fund variable annuity contracts and variable life insurance policies.The portfolio is a diversified series.The portfolio’s investment objective is to provide as high a level of current income as is consistent with the preservation of capital and the maintenance of liquidity.The Dreyfus Corporation (the “Manager” or “Dreyfus”) serves as the portfolio’s investment adviser. The Manager is a wholly-owned subsidiary of Mellon Financial Corporation (“Mellon Financial”). Dreyfus Service Corporation (the “Distributor”), a wholly-owned subsidiary of the Manager, is the distributor of the portfolio’s shares, which are sold without a sales charge.
It is the portfolio’s policy to maintain a continuous net asset value per share of $1.00; the portfolio has adopted certain investment, portfolio valuation and dividend and distribution policies to enable it to do so. There is no assurance, however, that the portfolio will be able to maintain a stable net asset value per share of $1.00.
The fund accounts separately for the assets, liabilities and operations of each series. Expenses directly attributable to each series are charged to that series’ operations; expenses which are applicable to all series are allocated among them on a pro rata basis.
The portfolio’s financial statements are prepared in accordance with U.S. generally accepted accounting principles, which may require the use of management estimates and assumptions.Actual results could differ from those estimates.
The fund enters into contracts that contain a variety of indemnifica-tions.The portfolio’s maximum exposure under these arrangements is unknown. The portfolio does not anticipate recognizing any loss related to these arrangements.
NOTES TO FINANCIAL STATEMENTS (continued)
|
(a) Portfolio valuation: Investments in securities are valued at amortized cost in accordance with Rule 2a-7 of the Act, which has been determined by the fund’s Board of Trustees to represent the fair value of the portfolio’s investments.
(b) Securities transactions and investment income: Securities transactions are recorded on a trade date basis. Realized gain and loss from securities transactions are recorded on the identified cost basis. Interest income, adjusted for accretion of discount and amortization of premium on investments, is earned from settlement date and recognized on the accrual basis. Cost of investments represents amortized cost.
The portfolio has an arrangement with the custodian bank whereby the portfolio receives earnings credits from the custodian when positive cash balances are maintained, which are used to offset custody fees. For financial reporting purposes, the portfolio includes net earnings credits as an expense offset in the Statement of Operations.
The portfolio may enter into repurchase agreements with financial institutions, deemed to be creditworthy by the Manager, subject to the seller’s agreement to repurchase and the portfolio’s agreement to resell such securities at a mutually agreed upon price. Securities purchased subject to repurchase agreements are deposited with the portfolio’s custodian and, pursuant to the terms of the repurchase agreement, must have an aggregate market value greater than or equal to the terms of the repurchase price plus accrued interest at all times. If the value of the underlying securities falls below the value of the repurchase price plus accrued interest, the portfolio will require the seller to deposit additional collateral by the next business day. If the request for additional collateral is not met, or the seller defaults on its repurchase obligation, the portfolio maintains its right to sell the underlying securities at market value and may claim any resulting loss against the seller.
(c) Dividends to shareholders: It is the policy of the portfolio to declare dividends daily from investment income-net. Such dividends are paid monthly. Dividends from net realized capital gain, if any, are normally declared and paid annually, but the portfolio may make distributions on
a more frequent basis to comply with the distribution requirements of the Internal Revenue Code of 1986 as amended (the “Code”). To the extent that net realized capital gain can be offset by capital loss carryovers, it is the policy of the portfolio not to distribute such gain.
(d) Federal income taxes: It is the policy of the portfolio to continue to qualify as a regulated investment company, if such qualification is in the best interests of its shareholders, by complying with the applicable provisions of the Code, and to make distributions of taxable income sufficient to relieve it from substantially all federal income and excise taxes.
At December 31, 2004, the components of accumulated earnings on a tax basis were substantially the same as for financial reporting purposes.
The accumulated capital loss carryover of $22,833 is available to be applied against future net securities profits, if any, realized subsequent to December 31, 2004. If not applied, $783 of the carryover expires in fiscal 2007, $11,060 expires in fiscal 2008, $10,973 expires in fiscal 2010 and $17 expires in fiscal 2011.
The tax character of distributions paid to shareholders during the fiscal periods ended December 31, 2004 and December 31, 2003, were all ordinary income.
At December 31, 2004, the cost of investments for federal income tax purposes was substantially the same as the cost for financial reporting purposes (see the Statement of Investments).
NOTE 2—Investment Advisory Fee and Other Transactions With Affiliates:
(a) Pursuant to an Investment Advisory Agreement with the Manager, the investment advisory fee is computed at the annual rate of .50 of 1% of the value of the portfolio’s average daily net assets and is payable monthly.
The portfolio compensates Dreyfus Transfer, Inc., a wholly-owned subsidiary of the Manager, under a transfer agency agreement for providing personnel and facilities to perform transfer agency services for
NOTES TO FINANCIAL STATEMENTS (continued)
|
the portfolio. During the period ended December 31, 2004, the portfolio was charged $290 pursuant to the transfer agency agreement.
The components of Due to The Dreyfus Corporation and affiliates in the Statement of Assets and Liabilities consist of: investment advisory fees $47,065 and transfer agency per account fees $44.
(b) Each Board member also serves as a Board member of other funds within the Dreyfus complex. Annual retainer fees and attendance fees are allocated to each fund based on net assets.
In early 2004, two purported class and derivative actions were filed against Mellon Financial, Mellon Bank, N.A., Dreyfus, Founders Asset Management LLC, and certain directors of the Dreyfus Funds and the Dreyfus Founders Funds (together, the “Funds”). In September 2004, plaintiffs served a Consolidated Amended Complaint (the “Amended Complaint”) on behalf of a purported class of all persons who acquired interests in any of the Funds between January 30, 1999 and November 17, 2003, and derivatively on behalf of the Funds. The Amended Complaint in the newly styled In re Dreyfus Mutual Funds Fee Litigation also named the Distributor, Premier Mutual Fund Services, Inc. and two additional Fund directors as defendants and alleges violations of the Investment Company Act of 1940, the Investment Advisers Act of 1940, the Pennsylvania Unfair Trade Practices and Consumer Protection Law and common-law claims. Plaintiffs seek to recover allegedly improper and excessive Rule 12b-1 and advisory fees allegedly charged to the Funds for marketing and distribution services. More specifically, plaintiffs claim, among other things, that 12b-1 fees and directed brokerage were improperly used to pay brokers to recommend the Funds over other funds, and that such payments were not disclosed to investors. In addition, plaintiffs assert that economies of scale and soft-dollar benefits were not passed on to the Funds. Plaintiffs further allege that 12b-1 fees were improperly charged to certain of the Funds that were closed to new investors.The
Amended Complaint seeks compensatory and punitive damages, rescission of the advisory contracts, and an accounting and restitution of any unlawful fees, as well as an award of attorneys’ fees and litigation expenses. As noted, some of the claims in this litigation are asserted derivatively on behalf of the Funds that have been named as nominal defendants.With respect to such derivative claims, no relief is sought against the Funds. Dreyfus believes the allegations to be totally without merit and intends to defend the action vigorously. Defendants filed motions to dismiss the Amended Complaint on November 12, 2004, and those motions are pending.
Additional lawsuits arising out of these circumstances and presenting similar allegations and requests for relief may be filed against the defendants in the future. Neither Dreyfus nor the Funds believe that any of the pending actions will have a material adverse effect on the Funds or Dreyfus’ ability to perform its contract with the Funds.
| REPORT OF INDEPENDENT REGISTERED |
| PUBLIC ACCOUNTING FIRM |
Shareholders and Board of Trustees
Dreyfus Variable Investment Fund, Money Market Portfolio
We have audited the accompanying statement of assets and liabilities, including the statement of investments, of Dreyfus Variable Investment Fund, Money Market Portfolio (one of the funds comprising Dreyfus Variable Investment Fund) as of December 31, 2004, and the related statement of operations for the year then ended, the statement of changes in net assets for each of the two years in the period then ended, and financial highlights for each of the years indicated therein. These financial statements and financial highlights are the responsibility of the Fund’s management. Our responsibility is to express an opinion on these financial statements and financial highlights based on our audits.
We conducted our audits in accordance with the standards of the Public Company Accounting Oversight Board (United States). Those standards require that we plan and perform the audit to obtain reasonable assurance about whether the financial statements and financial highlights are free of material misstatement.An audit includes examining, on a test basis, evidence supporting the amounts and disclosures in the financial statements and financial highlights. Our procedures included confirmation of securities owned as of December 31, 2004 by correspondence with the custodian.An audit also includes assessing the accounting principles used and significant estimates made by management, as well as evaluating the overall financial statement presentation. We believe that our audits provide a reasonable basis for our opinion.
In our opinion, the financial statements and financial highlights referred to above present fairly, in all material respects, the financial position of Dreyfus Variable Investment Fund, Money Market Portfolio at December 31, 2004, the results of its operations for the year then ended, the changes in its net assets for each of the two years in the period then ended, and the financial highlights for each of the indicated years, in conformity with U.S. generally accepted accounting principles.

New York, New York
February 4, 2005
|
BOARD MEMBERS INFORMATION (Unaudited)
Joseph S. DiMartino (61) Chairman of the Board (1995)
Principal Occupation During Past 5 Years:
• Corporate Director and Trustee
Other Board Memberships and Affiliations:
- The Muscular Dystrophy Association, Director
- Levcor International, Inc., an apparel fabric processor, Director
- Century Business Services, Inc., a provider of outsourcing functions for small and medium size companies, Director
- The Newark Group, a provider of a national market of paper recovery facilities, paperboard mills and paperboard converting plants, Director
- Azimuth Trust, an institutional asset management firm, Member of Board of Managers and Advisory Board
No. of Portfolios for which Board Member Serves: 186
David P. Feldman (65)
Board Member (1994)
|
Principal Occupation During Past 5 Years:
• Corporate Director and Trustee
Other Board Memberships and Affiliations:
- BBH Mutual Funds Group (11 funds), Director
- The Jeffrey Company, a private investment company, Director
- QMED, a medical device company, Director
No. of Portfolios for which Board Member Serves: 51
———————
James F. Henry (74) Board Member (1990)
Principal Occupation During Past 5 Years:
- President, CPR Institute for Dispute Resolution, a non-profit organization principally engaged in the development of alternatives to business litigation (Retired 2003)
No. of Portfolios for which Board Member Serves: 22
———————
Rosalind Gersten Jacobs (79) Board Member (1990)
Principal Occupation During Past 5 Years:
• Merchandise and marketing consultant
No. of Portfolios for which Board Member Serves: 33
BOARD MEMBERS INFORMATION (Unaudited) (continued)
Dr. Paul A. Marks (78)
Board Member (1990)
|
Principal Occupation During Past 5 Years:
|
- President and Chief Executive Officer of Memorial Sloan-Kettering Cancer Center (Retired 1999)
Other Board Memberships and Affiliations:
|
- Pfizer, Inc., a pharmaceutical company, Director-Emeritus
- Atom Pharm, Director
- Lazard Freres & Company, LLC, Senior Adviser
- Merck, Consultant
No. of Portfolios for which Board Member Serves: 22 ———————
Dr. Martin Peretz (65) Board Member (1990)
Principal Occupation During Past 5 Years:
|
- Editor-in-Chief of The New Republic Magazine
- Lecturer in Social Studies at Harvard University (1965-2001)
- Co-Chairman of TheStreet.com, a financial daily on the web
Other Board Memberships and Affiliations:
|
- Academy for Liberal Education, an accrediting agency for colleges and universities certified by the U.S. Department of Education, Director
- Digital Learning Group, LLC, an online publisher of college textbooks, Director
- Harvard Center for Blood Research,Trustee
- Bard College,Trustee
- YIVO Institute for Jewish Research,Trustee
No. of Portfolios for which Board Member Serves: 22 ———————
Bert W.Wasserman (72) Board Member (1993)
Principal Occupation During Past 5 Years:
• Financial Consultant
Other Board Memberships and Affiliations:
• Lillian Vernon Corporation, Director
|
No. of Portfolios for which Board Member Serves: 22 ———————
Once elected all Board Members serve for an indefinite term.The address of the Board Members and Officers is in c/o The Dreyfus Corporation, 200 Park Avenue, New York, New York 10166.Additional information about the Board Members is available in the fund’s Statement of Additional Information which can be obtained from Dreyfus free of charge by calling this toll free number: 1-800-554-4611.
John M. Fraser, Jr., Emeritus Board Member Irving Kristol, Emeritus Board Member
OFFICERS OF THE FUND (Unaudited)
STEPHEN E. CANTER, President since March 2000.
Chairman of the Board, Chief Executive Officer and Chief Operating Officer of the Manager, and an officer of 92 investment companies (comprised of 185 portfolios) managed by the Manager. Mr. Canter also is a Board member and, where applicable, an Executive Committee Member of the other investment management subsidiaries of Mellon Financial Corporation, each of which is an affiliate of the Manager. He is 59 years old and has been an employee of the Manager since May 1995.
STEPHEN R. BYERS, Executive Vice President since November 2002.
Chief Investment Officer,Vice Chairman and a director of the Manager, and an officer of 92 investment companies (comprised of 185 portfolios) managed by the Manager. Mr. Byers also is an officer, director or an Executive Committee Member of certain other investment management subsidiaries of Mellon Financial Corporation, each of which is an affiliate of the Manager. He is 51 years old and has been an employee of the Manager since January 2000. Prior to joining the Manager, he served as an Executive Vice President-Capital Markets, Chief Financial Officer and Treasurer at Gruntal & Co., L.L.C.
MARK N. JACOBS, Vice President since March 2000.
Executive Vice President, Secretary and General Counsel of the Manager, and an officer of 93 investment companies (comprised of 201 portfolios) managed by the Manager. He is 58 years old and has been an employee of the Manager since June 1977.
MICHAEL A. ROSENBERG, Secretary since March 2000.
Associate General Counsel of the Manager, and an officer of 90 investment companies (comprised of 194 portfolios) managed by the Manager. He is 44 years old and has been an employee of the Manager since October 1991.
ROBERT R. MULLERY, Assistant Secretary since March 2000.
Associate General Counsel of the Manager, and an officer of 26 investment companies (comprised of 60 portfolios) managed by the Manager. He is 52 years old and has been an employee of the Manager since May 1986.
STEVEN F. NEWMAN, Assistant Secretary since March 2000.
Associate General Counsel and Assistant Secretary of the Manager, and an officer of 93 investment companies (comprised of 201 portfolios) managed by the Manager. He is 55 years old and has been an employee of the Manager since July 1980.
JAMES WINDELS, Treasurer since November 2001.
Director – Mutual Fund Accounting of the Manager, and an officer of 93 investment companies (comprised of 201 portfolios) managed by the Manager. He is 46 years old and has been an employee of the Manager since April 1985.
RICHARD CASSARO, Assistant Treasurer since August 2003.
Senior Accounting Manager – Equity Funds of the Manager, and an officer of 26 investment companies (comprised of 102 portfolios) managed by the Manager. He is 44 years old and has been an employee of the Manager since September 1982.
OFFICERS OF THE FUND (Unaudited) (continued)
ERIK D. NAVILOFF, Assistant Treasurer since December 2002.
Senior Accounting Manager – Taxable Fixed Income Funds of the Manager, and an officer of 19 investment companies (comprised of 75 portfolios) managed by the Manager. He is 36 years old and has been an employee of the Manager since November 1992.
ROBERT ROBOL, Assistant Treasurer since August 2003.
Senior Accounting Manager – Money Market Funds of the Manager, and an officer of 39 investment companies (comprised of 84 portfolios) managed by the Manager. He is 40 years old and has been an employee of the Manager since October 1988.
ROBERT SVAGNA, Assistant Treasurer since December 2002.
Senior Accounting Manager – Equity Funds of the Manager, and an officer of 27 investment companies (comprised of 107 portfolios) managed by the Manager. He is 37 years old and has been an employee of the Manager since November 1990.
KENNETH J. SANDGREN, Assistant Treasurer since November 2001.
Mutual Funds Tax Director of the Manager, and an officer of 93 investment companies (comprised of 201 portfolios) managed by the Manager. He is 50 years old and has been an employee of the Manager since June 1993.
JOSEPH W. CONNOLLY, Chief Compliance Officer since October 2004.
Chief Compliance Officer of the Manager and The Dreyfus Family of Funds (93 investment companies, comprising 201 portfolios). From November 2001 through March 2004, Mr. Connolly was first Vice-President, Mutual Fund Servicing for Mellon Global Securities Services. In that capacity, Mr. Connolly was responsible for managing Mellon’s Custody, Fund Accounting and Fund Administration services to third-party mutual fund clients. He is 47 years old and has served in various capacities with the Manager since 1980, including manager of the firm’s Fund Accounting Department from 1997 through October 2001.
WILLIAM GERMENIS, Anti-Money Laundering Compliance Officer since September 2002.
Vice President and Anti-Money Laundering Compliance Officer of the Distributor, and the Anti-Money Laundering Compliance Officer of 88 investment companies (comprised of 196 portfolios) managed by the Manager. He is 34 years old and has been an employee of the Distributor since October 1998.
NOTES
| Dreyfus Variable |
| Investment Fund, |
| Money Market Portfolio |
| 200 Park Avenue |
| New York, NY 10166 |
| |
| Investment Adviser |
| The Dreyfus Corporation |
| 200 Park Avenue |
| New York, NY 10166 |
| |
| Custodian |
| The Bank of New York |
| One Wall Street |
| New York, NY 10286 |
| Transfer Agent & |
| Dividend Disbursing Agent |
| Dreyfus Transfer, Inc. |
| 200 Park Avenue |
| New York, NY 10166 |
| |
| Distributor |
| Dreyfus Service Corporation |
| 200 Park Avenue |
| New York, NY 10166 |
Telephone 1-800-554-4611 or 516-338-3300
Mail The Dreyfus Family of Funds, 144 Glenn Curtiss Boulevard, Uniondale, NY 11556-0144 Attn: Institutional Servicing
The portfolio files its complete schedule of portfolio holdings with the Securities and Exchange Commission (“SEC”) for the first and third quarters of each fiscal year on Form N-Q. The portfolio’s Forms N-Q are available on the SEC’s website at http://www.sec.gov and may be reviewed and copied at the SEC’s Public Reference Room in Washington, DC. Information on the operation of the Public Reference Room may be obtained by calling 1-800-SEC-0330.
Information regarding how the portfolio voted proxies relating to portfolio securities for the 12-month period ended June 30, 2004, is available on the SEC’s website at http://www.sec.gov and without charge, upon request, by calling 1-800-645-6561.
© 2005 Dreyfus Service Corporation

| Dreyfus Variable |
| Investment Fund, |
| Quality Bond Portfolio |
ANNUAL REPORT December 31, 2004

The views expressed in this report reflect those of the portfolio manager only through the end of the period covered and do not necessarily represent the views of Dreyfus or any other person in the Dreyfus organization.Any such views are subject to change at any time based upon market or other conditions and Dreyfus disclaims any responsibility to update such views. These views may not be relied on as investment advice and, because investment decisions for a Dreyfus portfolio are based on numerous factors, may not be relied on as an indication of trading intent on behalf of any Dreyfus portfolio.
Not FDIC-Insured • Not Bank-Guaranteed • May Lose Value
| | | Contents |
| |
| | | T H E P O R T F O L I O |
| |
|
| 2 | | Letter from the Chairman |
| 3 | | Discussion of Performance |
| 6 | | Portfolio Performance |
| 8 | | Understanding Your Portfolio’s Expenses |
| 8 | | Comparing Your Portfolio’s Expenses |
| | | With Those of Other Funds |
| 9 | | Statement of Investments |
| 15 | | Statement of Financial Futures |
| 15 | | Statement of Options Written |
| 16 | | Statement of Assets and Liabilities |
| 17 | | Statement of Operations |
| 18 | | Statement of Changes in Net Assets |
| 20 | | Financial Highlights |
| 22 | | Notes to Financial Statements |
| 34 | | Report of Independent Registered |
| | | Public Accounting Firm |
| 35 | | Important Tax Information |
| 36 | | Board Members Information |
| 38 | | Officers of the Fund |
| | | F O R M O R E I N F O R M AT I O N |
| |
|
| | | Back Cover |
| Dreyfus Variable Investment Fund, |
| Quality Bond Portfolio |
The Portfolio

LETTER FROM THE CHAIRMAN
Dear Shareholder:
We are pleased to present this annual report for Dreyfus Variable Investment Fund, Quality Bond Portfolio, covering the 12-month period from January 1, 2004, through December 31, 2004. Inside, you’ll find valuable information about how the portfolio was managed during the reporting period, including a discussion with Gerald E.Thunelius, portfolio manager and Director of the Dreyfus Taxable Fixed Income Team that managed the portfolio during the prior fiscal year.
Despite a moderately growing economy and rising interest rates over the second half of the year, the yield of the benchmark 10-year U.S. Treasury bond ended 2004 virtually unchanged from where it began. At the same time, corporate bonds generally continued to gain value as business conditions improved, and mortgage-backed securities benefited from waning prepayment activity among homeowners.
Can bonds continue to deliver positive results in 2005? No one knows for certain. However, with short-term interest rates rising and the economy gaining momentum,we believe that some areas of the fixed-income market are likely to be stronger than others.What’s required for success, in our view, is strong fundamental research and keen professional judgment.
As always, we urge our shareholders to view the financial markets from a long-term perspective, measured in years rather than weeks or months. One of the best ways to ensure a long-term perspective is to establish an investment plan with the help of your financial advisor, and review it periodically to track your progress toward your financial goals.
Thank you for your continued confidence and support.
Sincerely,

| Stephen E. Canter |
| Chairman and Chief Executive Officer |
| The Dreyfus Corporation |

DISCUSSION OF PERFORMANCE
Gerald E. Thunelius, Director and Senior Portfolio Manager Dreyfus Taxable Fixed Income Team
How did Dreyfus Variable Investment Fund, Quality Bond Portfolio perform relative to its benchmark?
For the 12-month period ended December 31, 2004, the portfolio’s Initial shares achieved a total return of 3.37%, and its Service shares achieved a total return of 3.05% .1 The portfolio produced aggregate income dividends of $0.463 per share and $0.437 per share for its Initial and Service shares, respectively. In comparison, the portfolio’s benchmark, the Lehman Brothers U.S.Aggregate Index (the “Index”), achieved a total return of 4.34% for the same period.2
Despite rising short-term interest rates, the bond market continued to rally during the reporting period as investors reacted to low inflation and improving business conditions for corporate bond issuers. The portfolio produced lower returns than the Index, primarily due to its relatively defensive positioning early in 2004.While the fund’s performance improved during the second half of the year, it was not enough to fully offset earlier weakness.
What is the portfolio’s investment approach?
The portfolio seeks to maximize total return consisting of capital appreciation and current income.To achieve this objective, the portfolio invests at least 80% of its assets in bonds, including corporate bonds, mortgage-related securities, collateralized mortgage obligations (“CMOs”) and asset-backed securities that, when purchased, are A-rated or better or what we believe are the unrated equivalent, and in securities issued or guaranteed by the U.S. government or its agencies or its instrumentalities.The portfolio may also invest up to 10% of its net assets in non-dollar-denominated foreign securities and up to 20% of its assets in the securities of foreign issues collectively.
The Dreyfus Taxable Fixed Income Team’s approach emphasized:
- Fundamental economic analysis. Our review of U.S. economic conditions helps us establish the portfolio’s average duration, which is a measure of
DISCUSSION OF PERFORMANCE (continued)
|
- sensitivity to interest-rate changes. If interest rates appear to be rising, we will generally reduce the portfolio’s average duration to keep cash available for the purchase of higher-yielding securities as they become available. If interest rates appear to be declining, we will generally increase the portfolio’s average duration to lock in prevailing yields.
- Sector allocation. We allocate assets among the various sectors of the fixed-income marketplace according to their relative attractiveness based on prevailing and expected market and economic conditions.
- Security selection. We choose individual securities according to factors that include their yields, prices, liquidity and the financial health of their issuers.
What other factors affected the portfolio’s performance?
Early in the reporting period, it appeared to us that the U.S. economy was poised for stronger economic growth, which we expected to lead to intensifying inflationary pressures and higher short-term interest rates from the Federal Reserve Board (the “Fed”). Accordingly, we established a more defensive investment posture, emphasizing securities that we believed would benefit from narrower yield differences among bonds of various maturities. However, inflation remained low over the first quarter of 2004, and yield differences widened, causing the portfolio’s performance at the time to lag the benchmark. This “early” shift to a higher-quality, shorter-duration portfolio was the main contributing factor to the portfolio’s underperformance.
In April 2004, inflationary pressures appeared to resurface when U.S. labor markets strengthened and energy prices surged. In this changing environ-ment,the portfolio’s relatively defensive positioning enabled it to avoid the full brunt of the bond market’s springtime decline, which occurred in advance of the Fed’s first interest-rate increases in more than four years.
Although the economy hit a soft patch during the summer and political uncertainty extended into the fall, the Fed continued to raise short-term interest rates. In fact, the Fed raised the overnight federal funds rate five times between June and December, driving it from 1% to 2.25% as of year-end.
The portfolio enjoyed strong contributions from corporate bonds in 2004, which gained value as business conditions improved and many
issuers strengthened their balance sheets.The portfolio received especially strong contributions to performance from bonds issued by companies in the oil and gas industry. The portfolio’s relatively heavy exposure to mortgage-backed securities also helped boost returns.
Later in the reporting period, we reduced the fund’s average duration to a range we considered slightly shorter than industry averages,which positioned the fund for higher yields on longer-term U.S. bonds. In addition, we established a significant position in TIPS,which rallied toward year-end as U.S. economic growth and inflation expectations intensified.
What is the portfolio’s current strategy?
Effective January 31, 2005, Catherine Powers assumed the management responsibilities of the portfolio. Christopher Pellegrino was appointed as an additional portfolio manager. Ms. Powers also is a Senior Portfolio Manager for Active Core Strategies, responsible for high-grade core and core-plus fixed income strategies, with Standish Mellon Asset Management, LLC — an affiliate of Dreyfus. Mr. Pelligrino also is a Senior Portfolio Manager for Active Core Strategies, responsible for the management of high-grade core strategies, with Standish Mellon. Each manages the portfolio under a dual-employee relationship with Dreyfus.
| | | The portfolio is only available as a funding vehicle under variable life insurance policies or variable |
| | | annuity contracts issued by insurance companies. Individuals may not purchase shares of the |
| | | portfolio directly.A variable annuity is an insurance contract issued by an insurance company that |
| | | enables investors to accumulate assets on a tax-deferred basis for retirement or other long-term |
| | | goals.The investment objective and policies of Dreyfus Variable Investment Fund, Quality Bond |
| | | Portfolio may be similar to other funds/portfolios managed or advised by Dreyfus. However, the |
| | | investment results of the portfolio may be higher or lower than, and may not be comparable to, |
| | | those of any other Dreyfus fund/portfolio. |
| 1 | | Total return includes reinvestment of dividends and any capital gains paid. Past performance is no |
| | | guarantee of future results. Share price and investment return fluctuate such that upon redemption, |
| | | portfolio shares may be worth more or less than their original cost.The portfolio’s performance does |
| | | not reflect the deduction of additional charges and expenses imposed in connection with investing |
| | | in variable insurance contracts, which will reduce returns. Return figures provided reflect the |
| | | absorption of certain portfolio expenses by The Dreyfus Corporation pursuant to an agreement in |
| | | effect through July 31, 2005, at which time it may be extended or terminated. Had these |
| | | expenses not been absorbed, the portfolio’s returns would have been lower. |
| 2 | | SOURCE: LIPPER INC. — Reflects reinvestment of dividends and, where applicable, capital |
| | | gain distributions.The Lehman Brothers U.S.Aggregate Index is a widely accepted, unmanaged |
| | | total return index of corporate, U.S. government and U.S. government agency debt instruments, |
| | | mortgage-backed securities and asset-backed securities with an average maturity of 1-10 years. |
The Portfolio 5
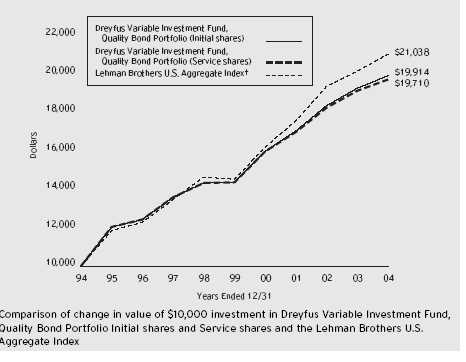
| Average Annual Total Returns as of | | 12/31/04 | | | | |
| |
| | | 1 Year | | 5 Years | | 10 Years |
| |
| |
| |
|
| Initial shares | | 3.37% | | 6.76% | | 7.13% |
| Service shares | | 3.05% | | 6.54% | | 7.02% |
| |
| The data for Service shares includes the results of Initial shares for the period prior to December 31, 2000 |
| (inception date of Service shares). Actual Service shares’ average annual total return and hypothetical growth |
| results would have been lower. See notes below. | | | | | | |
| † Source: Lipper Inc. | | | | | | |
| Past performance is not predictive of future performance.The portfolio’s performance shown in the graph and table |
| does not reflect the deduction of taxes that a shareholder would pay on portfolio distributions or the redemption of |
| portfolio shares. | | | | | | |
| The portfolio’s performance does not reflect the deduction of additional charges and expenses imposed in |
| connection with investing in variable insurance contracts which will reduce returns. | | |
| The above graph compares a $10,000 investment made in Initial and Service shares of Dreyfus Variable Investment |
| Fund, Quality Bond Portfolio on 12/31/94 to a $10,000 investment made in the Lehman Brothers U.S.Aggregate |
| Index (the “Index”) on that date. | | | | | | |
6
The portfolio’s Initial shares are not subject to a Rule 12b-1 fee.The portfolio’s Service shares are subject to a 0.25% annual Rule 12b-1 fee.The performance figures for Service shares reflect the performance of the portfolio’s Initial shares from their inception date through December 30, 2000, and the performance of the portfolio’s Service shares from December 31, 2000 (inception date of Service shares) to December 31, 2004 (blended performance figures).The blended performance figures have not been adjusted to reflect the higher operating expenses of the Service shares. If these expenses had been reflected, the blended performance figures would have been lower. All dividends and capital gain distributions are reinvested.
The portfolio’s performance shown in the line graph takes into account all applicable portfolio fees and expenses.The Index is a widely accepted, unmanaged index of corporate, U.S. government and U.S. government agency debt instruments, mortgage-backed securities and asset-backed securities.The Index does not take into account charges, fees and other expenses. Further information relating to portfolio performance, including expense reimbursements, if applicable, is contained in the Financial Highlights section of the prospectus and elsewhere in this report.

As a mutual fund investor,you pay ongoing expenses,such as management fees and other expenses.Using the information below,you can estimate how these expenses affect your investment and compare them with the expenses of other funds.You also may pay one-time transaction expenses,including sales charges (loads) and redemption fees, which are not shown in this section and would have resulted in higher total expenses. For more information, see your portfolio’s prospectus or talk to your financial adviser.
Review your portfolio’s expenses
|
The table below shows the expenses you would have paid on a $1,000 investment in Dreyfus Variable Investment Fund, Quality Bond Portfolio from July 1, 2004 to December 31, 2004. It also shows how much a $1,000 investment would be worth at the close of the period, assuming actual returns and expenses.
| Expenses and Value of a $1,000 Investment | | |
| assuming actual returns for the six months ended December 31, 2004 |
| | | Initial Shares | | Service Shares |
| |
| |
|
| Expenses paid per $1,000 † | | $ 3.82 | | $ 5.11 |
| Ending value (after expenses) | | $1,056.10 | | $1,054.80 |
COMPARING YOUR PORTFOLIO’S EXPENSES WITH THOSE OF OTHER FUNDS (Unaudited)
Using the SEC’s method to compare expenses
The Securities and Exchange Commission (SEC) has established guidelines to help investors assess fund expenses. Per these guidelines, the table below shows your portfolio’s expenses based on a $1,000 investment, assuming a hypothetical 5% annualized return. You can use this information to compare the ongoing expenses (but not transaction expenses or total cost) of investing in the portfolio with those of other funds. All mutual fund shareholder reports will provide this information to help you make this comparison. Please note that you cannot use this information to estimate your actual ending account balance and expenses paid during the period.
Expenses and Value of a $1,000 Investment assuming a hypothetical 5% annualized return for the six months ended December 31, 2004
| | | Initial Shares | | Service Shares |
| |
| |
|
| Expenses paid per $1,000 † | | $ 3.76 | | $ 5.03 |
| Ending value (after expenses) | | $1,021.42 | | $1,020.16 |
| † Expenses are equal to the portfolio’s annualized expense ratio of .74% for Initial shares and .99% for Service shares, |
| multiplied by the average account value over the period, multiplied by 184/366 (to reflect the one-half year period). |
STATEMENT OF INVESTMENTS
December 31, 2004
|
| | | Principal | | |
| Bonds and Notes—87.7% | | Amount a | | Value ($) |
| |
| |
|
| Aerospace & Defense—.5% | | | | |
| General Dynamics, | | | | |
| Sr. Notes, 4.5%, 2010 | | 1,002,000 | | 1,025,104 |
| Airlines—.5% | | | | |
| American Airlines: | | | | |
| Pass-Through Ctfs., 3.857%, 2010 | | 603,870 | | 595,510 |
| Pass-Through Ctfs., Ser. 1999-1, 7.024%, 2009 | | 413,000 | | 425,158 |
| Continental Airlines, | | | | |
| Pass-Through Ctfs., Ser. 1998-1, Cl. A, 6.648%, 2017 | | 105,728 | | 102,760 |
| US Airways, | | | | |
| Enhanced Equipment Notes, Ser. C, 8.93%, 2009 | | 270,471 b | | 27 |
| | | | | 1,123,455 |
| Asset—Backed Ctfs.-Credit Cards—.9% | | | | |
| MBNA Master Credit Card Note Trust, | | | | |
| Ser. 2002-C1, Cl. C1, 6.8%, 2014 | | 1,850,000 | | 2,054,872 |
| Asset—Backed—Other—1.0% | | | | |
| Saxon Asset Securities Trust, | | | | |
| Ser. 2004-2, Cl. AF2, 4.15%, 2035 | | 2,298,000 | | 2,295,744 |
| Auto Manufacturing—1.2% | | | | |
| General Motors, | | | | |
| Sr. Debs, 8.375%, 2033 | | 2,509,000 | | 2,606,731 |
| Banking—1.6% | | | | |
| Danske Bank, | | | | |
| Bonds, 5.914%, 2049 | | 765,000 c | | 811,488 |
| HBOS Capital, | | | | |
| Bonds, 6.071%, 2049 | | 2,590,000 c | | 2,780,888 |
| | | | | 3,592,376 |
| Commercial Mortgage Pass—Through Ctfs.—.6% | | | | |
| Salomon Brothers Mortgage Securities VII, | | | | |
| Ser. 2002-KEY2, Cl. A1, 3.222%, 2036 | | 1,421,771 | | 1,416,170 |
| Diversified Financial Services—2.3% | | | | |
| Citigroup, | | | | |
| Sub. Notes, 5% 2014 | | 2,000,000 c | | 2,013,478 |
| Ford Motor Credit: | | | | |
| Notes, 2.67%, 2007 | | 285,000 d | | 280,560 |
| Notes, 3.379%, 2007 | | 785,000 d | | 779,920 |
| Morgan Stanley, | | | | |
| Sub. Notes, 4.75%, 2014 | | 2,077,000 | | 2,027,580 |
| | | | | 5,101,538 |
The Portfolio 9
S T A T E M E N T O F I N V E S T M E N T S (continued)
| | | | | Principal | | | | |
| Bonds and Notes (continued) | | | | Amount a | | Value ($) |
| |
| |
| |
|
| Electric Utilities—1.8% | | | | | | | | |
| CenterPoint Energy Houston Electric, | | | | | | | | |
| Notes, Ser. K2, 6.95%, 2033 | | | | 614,000 | | | | 722,038 |
| Jersey Central Power & Light, | | | | | | | | |
| First Mortgages, 5.625%, 2016 | | | | 849,000 | | | | 888,997 |
| Pacific Gas & Electric, | | | | | | | | |
| First Mortgage, 4.8%, 2014 | | | | 762,000 | | | | 760,724 |
| Public Service Company of Colorado, | | | | | | | | |
| First Collateral Trust Bonds, | | | | | | | | |
| Ser. 12, 4.875%, 2013 | | | | 1,057,000 | | | | 1,075,656 |
| SCANA, | | | | | | | | |
| Sr. Notes, 2.74%, 2006 | | | | 702,000 | | d | | 703,931 |
| | | | | | | | | 4,151,346 |
| Food & Beverages—.1% | | | | | | | | |
| Pepsi Bottling, | | | | | | | | |
| Sr. Notes, Ser. B, 7%, 2029 | | | | 255,000 | | e | | 308,294 |
| Foreign Governmental—6.5% | | | | | | | | |
| Byggingarsjodur Verkamanna: | | | | | | | | |
| Bonds, Ser. 1, 3.75%, 2024 | | ISK | | 78,639,270 | | f | | 1,291,234 |
| Bonds, Ser. 3, 3.75%, 2044 | | ISK | | 122,325,633 | | f | | 2,092,808 |
| Canadian Government Bond: | | | | | | | | |
| Bonds, 4%, 2031 | | CAD | | 642,000 | | g | | 859,614 |
| Bonds, 5%, 2014 | | CAD | | 3,790,000 | | | | 3,325,996 |
| Iceland Rikisbref, | | | | | | | | |
| Notes, 7.25%, 2013 | | ISK | | 146,000,000 | | | | 2,351,043 |
| National Treasury of Mexico, | | | | | | | | |
| Inflation-Linked Bonds, 3.5%, 2013 | | MXN | | 2,000,000 | | h | | 568,574 |
| Republic of Poland, | | | | | | | | |
| Bonds, 3%, 2016 | | PLN | | 5,545,000 | | i | | 1,810,224 |
| Republic of Peru, | | | | | | | | |
| Bonds, 8.75%, 2033 | | | | 217,000 | | | | 236,530 |
| United Kingdom Gilt, | | | | | | | | |
| Bonds, 5%, 2014 | | GBP | | 1,125,000 | | | | 2,244,787 |
| | | | | | | | | 14,780,810 |
| Gaming & Lodging—.3% | | | | | | | | |
| Resorts International Hotel and Casino, | | | | | | |
| First Mortgage, 11.5%, 2009 | | | | 560,000 | | c | | 660,800 |
| | | Principal | | | | |
| Bonds and Notes (continued) | | Amount a | | Value ($) |
| |
| |
|
| Health Care—.2% | | | | | | |
| Manor Care, | | | | | | |
| Notes, 6.25%, 2013 | | 465,000 | | | | 497,756 |
| Media—1.2% | | | | | | |
| Comcast, | | | | | | |
| Sr. Notes, 6.5%, 2015 | | 1,115,000 | | | | 1,241,711 |
| Knight-Ridder, | | | | | | |
| Notes, 4.625%, 2014 | | 1,409,000 | | | | 1,391,420 |
| | | | | | | 2,633,131 |
| Oil & Gas—1.5% | | | | | | |
| Atmos Energy, | | | | | | |
| Notes, 2.465%, 2007 | | 2,086,000 | | d | | 2,086,857 |
| Kerr-McGee, | | | | | | |
| Notes, 6.95%, 2024 | | 1,195,000 | | | | 1,325,132 |
| | | | | | | 3,411,989 |
| Property-Casualty Insurance—.5% | | | | | | |
| Aspen Insurance, | | | | | | |
| Sr. Notes, 6%, 2014 | | 1,100,000 | | c | | 1,120,625 |
| Real Estate Investment Trust—.1% | | | | | | |
| EOP Operating, | | | | | | |
| Sr. Notes, 7%, 2011 | | 195,000 | | | | 220,202 |
| Residential Mortgage | | | | | | |
| Pass-Through Ctfs.—2.7% | | | | | | |
| Bank of America Mortgage Securities II, | | | | | | |
| Ser. 2003-8, Cl. B4, 4.75%, 2018 | | 173,932 | | c | | 154,252 |
| Bank of America Mortgage Securities III, | | | | | | |
| Ser. 2004-3, Cl. B4, 4.875%, 2019 | | 127,416 | | c | | 111,405 |
| First Horizon Alternative Mortgage Securities I, | | | | |
| Ser. 2004-FA1, Cl. A1, 6.25%, 2034 | | 4,434,015 | | | | 4,597,901 |
| GMAC Mortgage Corp Loan Trust, | | | | | | |
| Ser. 2004-J1, Cl. B1, 5.5%, 2034 | | 680,739 | | c | | 591,779 |
| Residential Asset Securitization Trust, | | | | | | |
| Ser. 2003-A12, B4, 5%, 2018 | | 157,524 | | c | | 145,048 |
| Wells Fargo Mortgage Backed Securities Trust II, | | | | |
| Ser. 2003-3, Cl. B4, 5.25%, 2033 | | 461,180 | | c | | 446,307 |
| | | | | | | 6,046,692 |
S T A T E M E N T O F I N V E S T M E N T S (continued)
| | | Principal | | | | |
| Bonds and Notes (continued) | | Amount a | | Value ($) |
| |
| |
|
| Retail—.7% | | | | | | |
| Tricon Global, | | | | | | |
| Sr. Notes, 8.875%, 2011 | | 1,325,000 | | | | 1,639,106 |
| Structured Index—2.3% | | | | | | |
| AB Svensk Exportkredit, | | | | | | |
| GSNE-ER Indexed Notes, 0%, 2007 | | 2,275,000 | | c,j | | 2,157,838 |
| HSBC Bank USA, Tranched Investment-Grade | | | | |
| Enhanced Return Securities (“TIGERS”): | | | | | | |
| Medium Term Notes, | | | | | | |
| Ser. 2003-2, 5.36%, 2008 | | 1,297,000 | | c,d,k | | 1,311,853 |
| Medium Term Notes, | | | | | | |
| Ser. 2003-3, 5.36%, 2008 | | 1,775,000 | | c,d,k | | 1,792,750 |
| | | | | | | 5,262,441 |
| Telecommunications—2.0% | | | | | | |
| America Movil SA de CV, | | | | | | |
| Notes, 5.75%, 2015 | | 2,443,000 | | c | | 2,443,535 |
| British Telecommunications, | | | | | | |
| Notes, 8.375%, 2010 | | 882,000 | | | | 1,060,432 |
| Sprint Capital, | | | | | | |
| Notes, 6.125%, 2008 | | 1,003,000 | | | | 1,076,567 |
| | | | | | | 4,580,534 |
| U.S. Government—27.3% | | | | | | |
| U.S. Treasury Inflation Protection Securities: | | | | |
| 3.375%, 4/15/2032 | | 11,597,218 | | l | | 15,387,582 |
| 3.625%, 4/15/2028 | | 23,506,213 | | l | | 30,898,588 |
| Principal Strips, | | | | | | |
| 0%, 4/15/2029 | | 2,500,000 | | | | 1,812,013 |
| U.S. Treasury Notes: | | | | | | |
| 7.5%, 2/15/2005 | | 7,033,000 | | m | | 7,081,879 |
| 2.875%, 11/30/2006 | | 3,540,000 | | e | | 3,530,046 |
| 3.5%, 12/15/2009 | | 3,225,000 | | | | 3,210,388 |
| | | | | | | 61,920,496 |
| U.S. Government Agencies/ | | | | | | |
| Mortgage-Backed—31.9% | | | | | | |
| Federal Home Loan Mortgage Corp.: | | | | | | |
| 5.5%, 7/1/2034-9/1/2034 | | 281,175 | | | | 287,877 |
| REMIC Trust, Gtd. Pass-Through Ctfs.: | | | | | | |
| Ser. 2586, Cl. WE, 4%, 12/15/2032 | | 1,776,128 | | | | 1,737,746 |
| Ser. 2693, Cl. MH, 4%, 9/15/2027 | | 5,000,000 | | | | 4,892,537 |
| | | | | Principal | | | | |
| Bonds and Notes (continued) | | | | Amount a | | Value ($) |
| |
| |
| |
|
| U.S. Government Agencies/ | | | | | | | | |
| Mortgage-Backed (continued) | | | | | | | | |
| Federal Home Loan Mortgage Corp. (continued): | | | | | | |
| REMIC Trust, Gtd. Pass-Through Ctfs. (continued): | | | | | | |
| (Interest Only Obligations): | | | | | | | | |
| Ser. 2764, Cl. IT, 5%, 6/15/2027 | | | | 7,390,400 | | n | | 1,579,292 |
| Ser. 1916, Cl. PI, 7%, 12/15/2011 | | | | 286,554 | | n | | 25,260 |
| Federal National Mortgage Association: | | | | | | | | |
| 5.5%, 8/1/2034-9/1/2034 | | | | 8,822,031 | | | | 8,967,724 |
| 6%, 1/1/2029-9/1/2034 | | | | 1,470,392 | | | | 1,526,162 |
| 7%, 6/1/2029-9/1/2029 | | | | 340,139 | | | | 360,973 |
| Government National | | | | | | | | |
| Mortgage Association I: | | | | | | | | |
| 5.5%, 4/15/2033-9/15/2034 | | | | 13,044,539 | | | | 13,340,353 |
| 6% | | | | 14,533,000 | | o | | 15,059,821 |
| 6%, 2/15/2029-12/15/2033 | | | | 22,724,362 | | | | 23,579,292 |
| Project Loans; | | | | | | | | |
| 8%, 9/15/2008 | | | | 66,046 | | | | 68,151 |
| Government National | | | | | | | | |
| Mortgage Association II, | | | | | | | | |
| 7%, 9/20/2028-7/20/2029 | | | | 45,666 | | | | 48,453 |
| Ser. 2004-39, Cl. LC, 5.5%, 12/20/2029 | | | | 1,000,000 | | | | 1,035,169 |
| | | | | | | | | 72,508,810 |
| Total Bonds and Notes | | | | | | | | |
| (cost $196,375,393) | | | | | | | | 198,959,022 |
| |
| |
| |
| |
|
| |
| | | | | Face Amount | | | | |
| | | | | Covered by | | | | |
| Options—.3% | | | | Contracts | | | | Value ($) |
| |
| |
| |
| |
|
| |
| Call Options; | | | | | | | | |
| U.K. 10 Year Interest Rate Swaption, | | | | | | | | |
| September 2005 @ 5.25% | | | | | | | | |
| (cost $272,924) | | GBP | | 8,595,000 | | | | 549,853 |
| |
| |
| |
| |
|
| |
| |
| Other Investments—12.9% | | | | Shares | | | | Value ($) |
| |
| |
| |
| |
|
| |
| Registered Investment Company, | | | | | | | | |
| Dreyfus Institutional Preferred | | | | | | | | |
| Plus Money Market Fund | | | | | | | | |
| (cost $29,375,000) | | | | 29,375,000 | | p | | 29,375,000 |
S T A T E M E N T O F I N V E S T M E N T S (continued)
| Investment of Cash Collateral | | | | |
| | | for Securities Loaned—1.7% | | Shares | | Value ($) |
| |
| |
| |
|
| Registered Investment Company; | | | | |
| Dreyfus Institutional Cash Advantage Fund | | | | |
| | | (cost $3,929,550) | | | | 3,929,550 p | | 3,929,550 |
| |
| |
| |
| |
|
| |
| Total Investments (cost $229,952,867) | | 102.6% | | 232,813,425 |
| |
| Liabilities, Less Cash and Receivables | | (2.6%) | | (5,804,405) |
| |
| Net Assets | | | | 100.0% | | 227,009,020 |
| |
| a | | Principal amount stated in U.S Dollars unless otherwise noted. | | |
| | | CAD—Canadian Dollar | | | | | | |
| | | GBP—British Pound Sterling | | | | | | |
| | | ISK—Icelandic Krona | | | | | | |
| | | MXN—Mexican New Peso | | | | | | |
| | | PLN—Polish Zloty | | | | | | |
| b | | Non-income producing-security in default. | | | | |
| c | | Securities exempt from registration under Rule 144A of the Secruities Act of 1933.These secruities amy be resold |
| | | in transactions exempt from registration, normally to qualified institutional buyers.These securities have been |
| | | determined to be liquid by the Board of Trustees. At December 31, 2004, these securities amounted to |
| | | $16,542,046 or 7.3% of net assets. | | | | |
| d | | Variable rate security—interest rate subject to periodic change. | | |
| e | | All of these securities are on loan.At December 31, 2004, the total market value of the portfolio’s securities on loan |
| | | is $3,838,340 and the total market value of the collateral held by the portfolio is $3,929,550. |
| f | | Principal amount for accrual purposes is periodically adjusted based on changes in the Icelandic Consumer Price Index. |
| g | | Principal amount for accrual purposes is periodically adjusted based on changes in the Canadian Consumer Price Index. |
| h | | Principal amount for accrual purposes is periodically adjusted based on changes in the Mexican Unidades de Inversion |
| | | (UDI) Index. | | | | | | |
| i | | Principal amount for accrual purposes is periodically adjusted based on changes in the Polish Consumer Price Index. |
| j | | Security linked to Goldman Sachs Non Energy—Excess Return Index. | | |
| k | | Security linked to a portfolio of debt securities. | | | | |
| l | | Principal amount for accrual purposes is periodically adjusted based on changes in the Consumer Price Index. |
| m | | Partially held by a broker as collateral for open financial futures positions. | | |
| n | | Notional face amount shown. | | | | | | |
| o | | Purchased on a forward commitment basis. | | | | |
| p | | Investments in affiliated money market mutual funds. | | |
| |
| |
|
| |
| |
| |
| Portfolio Summary † | | | | | | |
| |
| | | | | Value (%) | | | | Value (%) |
| |
| |
| |
| |
|
| U.S. Government & Agencies | | 59.2 | | Asset/Mortgage Backed | | 5.2 |
| Money Markets Investments | | 14.6 | | Structured Index | | 2.3 |
| Corporate Bonds | | 14.5 | | Futures/Options/Swaps | | .5 |
| Foreign/Governmental | | 6.5 | | | | 102.8 |
| |
| † | | Based on net assets. | | | | | | |
| See notes to financial statements. | | | | | | |
14
STATEMENT OF FINANCIAL FUTURES
December 31, 2004
| | | | | Market Value | | | | Unrealized |
| | | | | Covered by | | | | Appreciation |
| | | Contracts | | Contracts ($) | | Expiration | | at 12/31/2004 ($) |
| |
| |
| |
| |
|
| |
| Financial Futures Short | | | | | | | | |
| U.S. Treasury 2 Year Notes | | 6 | | 1,257,563 | | March 2005 | | 2,063 |
See notes to financial statements.
|
STATEMENT OF OPTIONS WRITTEN
December 31, 2004
| | | | | Face Amount | | |
| | | | | Covered by | | |
| Issuer | | | | Contracts | | Value ($) |
| |
| |
| |
|
| Call Options: | | | | | | |
| British Pound | | | | | | |
| September 2005 @ 1.8 | | GBP | | 8,595,000 | | 544,854 |
| U.K. 10 Year Interest Rate Swaption | | | | | | |
| September 2005 @ 4.60% | | GBP | | 8,595,000 | | 121,856 |
| Put Options; | | | | | | |
| U.K. 10 Year Interest Rate Swaption | | | | | | |
| September 2005 @ 5.85% | | GBP | | 8,595,000 | | 17,308 |
| (Premiums received $326,625) | | | | | | 684,018 |
See notes to financial statements.
|
STATEMENT OF ASSETS AND LIABILITIES
December 31, 2004
| | | Cost | | Value |
| |
| |
|
| Assets ($): | | | | |
| Investments in securities—See Statement of Investments (including | | |
| securities on loan, valued at $3,838,340)—Note 1(c): | | |
| Unaffiliated issuers | | 196,648,317 | | 199,508,875 |
| Affiliated issuers | | 33,304,550 | | 33,304,550 |
| Cash | | | | 128,716 |
| Cash denominated in foreign currencies | | 49,728 | | 50,135 |
| Receivable for investment securities sold | | | | 18,000,719 |
| Dividends and interest receivable | | | | 1,818,686 |
| Receivable for shares of Beneficial Interest subscribed | | 3,012 |
| Paydowns receivable | | | | 2,911 |
| Prepaid expenses | | | | 7,253 |
| | | | | 252,824,857 |
| |
| |
|
| Liabilities ($): | | | | |
| Due to The Dreyfus Corporation and affiliates—Note 3(b) | | 143,018 |
| Payable for investment securities purchased | | 19,855,710 |
| Liability for securities on loan—Note 1(c) | | | | 3,929,550 |
| Bank loan payable—Note 2 | | | | 1,100,000 |
| Outstanding options written, at value (premiums | | |
| received $326,625)—See Statement of Options Written | | 684,018 |
| Payable for shares of Beneficial Interest redeemed | | 59,554 |
| Payable for futures variation margin—Note 4 | | 1,594 |
| Unrealized depreciation on swaps—Note 4 | | | | 1,628 |
| Interest payable—Note 2 | | | | 72 |
| Accrued expenses and other liabilities | | | | 40,693 |
| | | | | 25,815,837 |
| |
| |
|
| Net Assets ($) | | | | 227,009,020 |
| |
| |
|
| Composition of Net Assets ($): | | | | |
| Paid-in capital | | | | 227,878,756 |
| Accumulated undistributed investment income—net | | 309,435 |
| Accumulated net realized gain (loss) on investments | | (3,708,456) |
| Accumulated net unrealized appreciation (depreciation) on investments | | |
| (including $2,063 net unrealized appreciation on financial futures) | | 2,529,285 |
| |
|
| Net Assets ($) | | | | 227,009,020 |
| |
| |
|
| |
| |
| |
| Net Asset Value Per Share | | | | |
| | | Initial Shares | | Service Shares |
| |
| |
|
| Net Assets ($) | | 171,424,328 | | 55,584,692 |
| Shares Outstanding | | 15,017,327 | | 4,883,019 |
| |
| |
|
| Net Asset Value Per Share ($) | | 11.42 | | 11.38 |
See notes to financial statements.
16
|
| STATEMENT OF OPERATIONS |
| Year Ended December 31, 2004 |
| Investment Income ($): | | |
| Income: | | |
| Interest | | 8,844,682 |
| Cash dividends: | | |
| Unaffiliated issuers | | 12,045 |
| Affiliated issuers | | 219,686 |
| Income from securities lending | | 32,644 |
| Total Income | | 9,109,057 |
| Expenses: | | |
| Investment advisory fee—Note 3(a) | | 1,465,319 |
| Distribution fees—Note 3(b) | | 142,802 |
| Custodian fees—Note 3(b) | | 67,348 |
| Prospectus and shareholders’ reports | | 51,557 |
| Professional fees | | 30,227 |
| Trustees’ fees and expenses—Note 3(c) | | 19,289 |
| Shareholder servicing costs—Note 3(b) | | 12,523 |
| Interest expense—Note 2 | | 5,897 |
| Miscellaneous | | 15,828 |
| Total Expenses | | 1,810,790 |
| Investment Income—Net | | 7,298,267 |
| |
|
| Realized and Unrealized Gain (Loss) on Investments—Note 4 ($): |
| Net realized gain (loss) on investments and foreign currency transactions | | 6,762,280 |
| Net realized gain (loss) on options transactions | | 188,449 |
| Net realized gain (loss) on financial futures | | (4,723,264) |
| Net realized gain (loss) on swap transactions | | (195,786) |
| Net realized gain (loss) on forward currency exchange contracts | | (2,098,107) |
| Net Realized Gain (Loss) | | (66,428) |
| Net unrealized appreciation (depreciation) on investments, | | |
| foreign currency transactions, options and swap transactions | | |
| (including $94,335 net unrealized appreciation on financial futures) | | 516,522 |
| Net Realized and Unrealized Gain (Loss) on Investments | | 450,094 |
| Net Increase in Net Assets Resulting from Operations | | 7,748,361 |
See notes to financial statements.
|
STATEMENT OF CHANGES IN NET ASSETS
| | | Year Ended December 31, |
| |
|
| | | 2004 | | 2003 |
| |
| |
|
| Operations ($): | | | | |
| Investment income—net | | 7,298,267 | | 7,249,176 |
| Net realized gain (loss) on investments | | (66,428) | | 9,093,402 |
| Net unrealized appreciation | | | | |
| (depreciation) on investments | | 516,522 | | (4,140,291) |
| Net Increase (Decrease) in Net Assets | | | | |
| Resulting from Operations | | 7,748,361 | | 12,202,287 |
| |
| |
|
| Dividends to Shareholders from ($): | | | | |
| Investment income—net: | | | | |
| Initial shares | | (6,897,830) | | (7,431,703) |
| Service shares | | (2,194,224) | | (2,243,270) |
| Net realized gain on investments: | | | | |
| Initial shares | | — | | (3,720,234) |
| Service shares | | — | | (1,287,319) |
| Total Dividends | | (9,092,054) | | (14,682,526) |
| |
| |
|
| Beneficial Interest Transactions ($): | | | | |
| Net proceeds from shares sold: | | | | |
| Initial shares | | 31,181,952 | | 26,043,929 |
| Service shares | | 5,024,349 | | 10,025,145 |
| Dividends reinvested: | | | | |
| Initial shares | | 6,897,830 | | 11,151,937 |
| Service shares | | 2,194,224 | | 3,530,589 |
| Cost of shares redeemed: | | | | |
| Initial shares | | (39,389,257) | | (56,391,243) |
| Service shares | | (11,650,522) | | (10,271,117) |
| Increase (Decrease) in Net Assets from | | | | |
| Beneficial Interest Transactions | | (5,741,424) | | (15,910,760) |
| Total Increase (Decrease) in Net Assets | | (7,085,117) | | (18,390,999) |
| |
| |
|
| Net Assets ($): | | | | |
| Beginning of Period | | 234,094,137 | | 252,485,136 |
| End of Period | | 227,009,020 | | 234,094,137 |
| Undistributed investment income—net | | 309,435 | | 182,346 |
| | | Year Ended December 31, |
| |
|
| | | 2004 | | 2003 |
| |
| |
|
| Capital Share Transactions: | | | | |
| Initial Shares | | | | |
| Shares sold | | 2,799,550 | | 2,213,000 |
| Shares issued for dividends reinvested | | 611,686 | | 956,206 |
| Shares redeemed | | (3,478,459) | | (4,785,625) |
| Net Increase (Decrease) in Shares Outstanding | | (67,223) | | (1,616,419) |
| |
| |
|
| Service Shares | | | | |
| Shares sold | | 444,035 | | 854,415 |
| Shares issued for dividends reinvested | | 195,075 | | 303,751 |
| Shares redeemed | | (1,033,241) | | (869,193) |
| Net Increase (Decrease) in Shares Outstanding | | (394,131) | | 288,973 |
See notes to financial statements.
|
The Portfolio 19
The following tables describe the performance for each share class for the fiscal periods indicated.All information (except portfolio turnover rate) reflects financial results for a single portfolio share.Total return shows how much your investment in the portfolio would have increased (or decreased) during each period, assuming you had reinvested all dividends and distributions.These figures have been derived from the portfolio’s financial statements.
| | | | | Year Ended December 31, | | |
| |
| |
| |
|
| Initial Shares | | 2004 a | | 2003 | | 2002 | | 2001 b | | 2000 |
| |
| |
| |
| |
| |
|
| Per Share Data ($): | | | | | | | | | | |
| Net asset value, beginning of period | | 11.50 | | 11.65 | | 11.37 | | 11.39 | | 10.89 |
| Investment Operations: | | | | | | | | | | |
| Investment income—net | | .37c | | .35c | | .54c | | .65c | | .68 |
| Net realized and unrealized | | | | | | | | | | |
| gain (loss) on investments | | .01 | | .21 | | .32 | | .10 | | .50 |
| Total from Investment Operations | | .38 | | .56 | | .86 | | .75 | | 1.18 |
| Distributions: | | | | | | | | | | |
| Dividends from investment income—net | | (.46) | | (.46) | | (.58) | | (.69) | | (.68) |
| Dividends from net realized gain on investments - | | (.25) | | - | | (.08) | | - |
| Total Distributions | | (.46) | | (.71) | | (.58) | | (.77) | | (.68) |
| Net asset value, end of period | | 11.42 | | 11.50 | | 11.65 | | 11.37 | | 11.39 |
| |
| |
| |
| |
| |
|
| Total Return (%) | | 3.37 | | 4.94 | | 7.76 | | 6.69 | | 11.20 |
| |
| |
| |
| |
| |
|
| Ratios/Supplemental Data (%): | | | | | | | | | | |
| Ratio of total expenses to average net assets | | .74 | | .74 | | .72 | | .75 | | .72 |
| Ratio of net investment income | | | | | | | | | | |
| to average net assets | | 3.30 | | 2.96 | | 4.70 | | 5.57 | | 6.12 |
| Portfolio Turnover Rate | | 819.75d | | 898.18d | | 877.87 | | 1,105.61 | | 917.75 |
| |
| |
| |
| |
| |
|
| Net Assets, end of period ($ x 1,000) | | 171,424 | | 173,534 | | 194,519 | | 191,089 | | 148,885 |
| a | | As of January 1, 2004, the portfolio has adopted the method of accounting for interim payments on swap contracts in |
| | | accordance with Financial Accounting Standards Board Statement No. 133.These interim payments are reflected |
| | | within net realized and unrealized gain (loss) on swap contracts, however, prior to January 1, 2004, these interim |
| | | payments were reflected within interest income/expense in the Statement of Operations.The effect of this change for |
| | | the period ended December 31, 2004, was to increase net investment income per share by less than $.01, decrease net |
| | | realized and unrealized gain (loss) on investments per share by less than $.01 and increase the ratio of net |
| | | investment income to average net assets from 3.28% to 3.30%. Per share data and ratios/supplemental data for |
| | | periods prior to January 1, 2004 have not been restated to reflect this change in presentation. |
| b | | As required, effective January 1, 2001, the portfolio has adopted the provisions of the AICPA Audit and Accounting |
| | | Guide for Investment Companies and began accreting discount or amortizing premium on fixed income securities on a |
| | | scientific basis and including paydown gains and losses in interest income.The effect of this change for the period |
| | | ended December 31, 2001, was to decrease net investment income per share by $.04, increase net realized and |
| | | unrealized gain (loss) on investments per share by $.04 and decrease the ratio of net investment income to average net |
| | | assets from 5.91% to 5.57%. Per share data and ratios/supplemental data for periods prior to January 1, 2001 |
| | | have not been restated to reflect this change in presentation. |
| c | | Based on average shares outstanding at each month end. |
| d | | The portfolio turnover rates excluding mortgage dollar roll transactions for the years ended December 31, 2004 and |
| | | December 31, 2003, were 761.92% and 755.08%, respectively. |
| See notes to financial statements. |
20
| | | | | Year Ended December 31, | | |
| |
| |
| |
|
| Service Shares | | 2004 a | | 2003 | | 2002 | | 2001 b | | 2000 c |
| |
| |
| |
| |
| |
|
| Per Share Data ($): | | | | | | | | | | |
| Net asset value, beginning of period | | 11.48 | | 11.62 | | 11.35 | | 11.39 | | 11.39 |
| Investment Operations: | | | | | | | | | | |
| Investment income—net | | .35d | | .31d | | .50d | | .58d | | — |
| Net realized and unrealized | | | | | | | | | | |
| gain (loss) on investments | | (.01) | | .24 | | .32 | | .14 | | — |
| Total from Investment Operations | | .34 | | .55 | | .82 | | .72 | | — |
| Distributions: | | | | | | | | | | |
| Dividends from investment income—net | | (.44) | | (.44) | | (.55) | | (.68) | | — |
| Dividends from net realized gain on investments | | — | | (.25) | | — | | (.08) | | — |
| Total Distributions | | (.44) | | (.69) | | (.55) | | (.76) | | — |
| Net asset value, end of period | | 11.38 | | 11.48 | | 11.62 | | 11.35 | | 11.39 |
| |
| |
| |
| |
| |
|
| Total Return (%) | | 3.05 | | 4.78 | | 7.47 | | 6.37 | | — |
| |
| |
| |
| |
| |
|
| Ratios/Supplemental Data (%): | | | | | | | | | | |
| Ratio of total expenses to average net assets | | .99 | | .99 | | .97 | | 1.01 | | — |
| Ratio of net investment income | | | | | | | | | | |
| to average net assets | | 3.06 | | 2.66 | | 4.39 | | 5.24 | | — |
| Portfolio Turnover Rate | | 819.75e | | 898.18e | | 877.87 | | 1,105.61 | | 917.75 |
| |
| |
| |
| |
| |
|
| Net Assets, end of period ($ x 1,000) | | 55,585 | | 60,561 | | 57,966 | | 23,431 | | 1 |
a As of January 1, 2004, the portfolio has adopted the method of accounting for interim payments on swap contracts in accordance with Financial Accounting Standards Board Statement No. 133.These interim payments are reflected within net realized and unrealized gain (loss) on swap contracts, however, prior to January 1, 2004, these interim payments were reflected within interest income/expense in the Statement of Operations.The effect of this change for the period ended December 31, 2004, was to increase net investment income per share by $.01, decrease net realized and unrealized gain (loss) on investments per share by $.01 and increase the ratio of net investment income to average net assets from 3.03% to 3.06% . Per share data and ratios/supplemental data for periods prior to January 1, 2004 have not been restated to reflect this change in presentation. b As required, effective January1, 2001, the portfolio has adopted the provisions of the AICPA Audit and Accounting Guide for Investment Companies and began accreting discount or amortizing premium on fixed income securities on a scientific basis and including paydown gains and losses in interest income.The effect of this change for the period ended December 31, 2001, was to decrease net investment income per share by $.03, increase net realized and unrealized gain (loss) on investments per share by $.03 and decrease the ratio of net investment income to average net assets from 5.57% to 5.24% . Per share data and ratios/supplemental data for periods prior to January 1, 2001 have not been restated to reflect this change in presentation. c The portfolio commenced offering Service shares on December 31, 2000. d Based on average shares outstanding at each month end. e The portfolio turnover rates excluding mortgage dollar roll transactions for the years ended December 31, 2004 and December 31, 2003, were 761.92% and 755.08%, respectively.
See notes to financial statements.
The Portfolio 21
NOTES TO FINANCIAL STATEMENTS
NOTE 1—Significant Accounting Policies:
Dreyfus Variable Investment Fund (the “fund”) is registered under the Investment Company Act of 1940, as amended (the “Act”), as an open-end management investment company, operating as a series company currently offering twelve series, including the Quality Bond Portfolio (the “portfolio”). The portfolio is only offered to separate accounts established by insurance companies to fund variable annuity contracts and variable life insurance policies.The portfolio is a diversified series.The portfolio’s investment objective will be to maximize total return, consisting of capital appreciation and current income.The Dreyfus Corporation (the “Manager” or “Dreyfus”) serves as the portfolio’s investment adviser.The Manager is a wholly-owned subsidiary of Mellon Financial Corporation (“Mellon Financial”).
Dreyfus Service Corporation (the “Distributor”), a wholly-owned subsidiary of the Manager, is the distributor of the portfolio’s shares, which are sold without a sales charge.The portfolio is authorized to issue an unlimited number of $.001 par value shares of Beneficial Interest in each of the following classes of shares: Initial and Service. Each class of shares has identical rights and privileges, except with respect to the distribution plan and the expenses borne by each class and certain voting rights. Income, expenses (other than expenses attributable to a specific class), and realized and unrealized gains or losses on investments are allocated to each class of shares based on its relative net assets.
The fund accounts separately for the assets, liabilities and operations of each series. Expenses directly attributable to each series are charged to that series’ operations, expenses which are applicable to all series are allocated among them on a pro rata basis.
The portfolio’s financial statements are prepared in accordance with U.S. generally accepted accounting principles, which may require the use of management estimates and assumptions.Actual results could differ from those estimates.
The fund enters into contracts that contain a variety of indemnifica-tions.The portfolio’s maximum exposure under these arrangements is unknown. The portfolio does not anticipate recognizing any loss related to these arrangements.
(a) Portfolio valuation: Investments in securities (excluding short-term investments (other than U.S. Treasury Bills), financial futures, options, swap transactions and forward currency exchange contracts) are valued each business day by an independent pricing service (the “Service”) approved by the Board of Trustees. Investments for which quoted bid prices are readily available and are representative of the bid side of the market in the judgment of the Service are valued at the mean between the quoted bid prices (as obtained by the Service from dealers in such securities) and asked prices (as calculated by the Service based upon its evaluation of the market for such securities). Other investments (which constitute a majority of the portfolio’s securities) are valued as determined by the Service, based on methods which include consideration of: yields or prices of securities of comparable quality, coupon, maturity and type; indications as to values from dealers; and general market conditions. Securities for which there are no such valuations are valued at fair value as determined in good faith under the direction of the Board of Trustees. Restricted securities, as well as securities or other assets for which recent market quotations are not readily available, not valued by a pricing service approved by the Board of Trustees, or determined by the fund not to reflect accurately fair value (such as when an event occurs after the close of the exchange on which the security is principally traded and that is determined by the fund to have changed the value of the security), are valued at fair value as determined in good faith under the direction of the Board of Trustees. The factors that may be considered when fair valuing a security include fundamental analytical data, the nature and duration of restrictions on disposition, an evaluation of the forces that influence the market in which the securities are purchased and sold, and public trading in similar securities of the issuer or
NOTES TO FINANCIAL STATEMENTS (continued)
|
comparable issuers. Short-term investments, excluding U.S. Treasury Bills, are carried at amortized cost, which approximates value. Investments in registered investment companies are valued at their net asset value. Financial futures and options, which are traded on an exchange, are valued at the last sales price on the securities exchange on which such securities are primarily traded or at the last sales price on the national securities market on each business day. Options traded over-the-counter are priced at the mean between the bid prices and asked prices. Swap transactions are valued daily based upon future cash flows and other factors, such as interest rates and underlying securities. Investments denominated in foreign currencies are translated to U.S. dollars at the prevailing rates of exchange. Forward currency exchange contracts are valued at the forward rate.
(b) Foreign currency transactions: The portfolio does not isolate that portion of the results of operations resulting from changes in foreign exchange rates on investments from the fluctuations arising from changes in the market prices of securities held. Such fluctuations are included with the net realized and unrealized gain or loss on investments.
Net realized foreign exchange gains or losses arise from sales and maturities of short-term securities, sales of foreign currencies, currency gains or losses realized on securities transactions and the difference between the amounts of dividends, interest and foreign withholding taxes recorded on the portfolios’ books and the U.S. dollar equivalent of the amounts actually received or paid. Net unrealized foreign exchange gains and losses arise from changes in the value of assets and liabilities other than investments in securities, resulting from changes in exchange rates. Such gains and losses are included with net realized and unrealized gain or loss on investments.
(c) Securities transactions and investment income: Securities transactions are recorded on a trade date basis. Realized gain and loss from securities transactions are recorded on the identified cost basis. Dividend income is recognized on the ex-dividend date and interest income, including, where applicable, accretion of discount and amortization of premium on investments, is recognized on the accrual basis.
The portfolio has an arrangement with the custodian bank whereby the portfolio receives earnings credits from the custodian when positive cash balances are maintained, which are used to offset custody fees. For financial reporting purposes, the portfolio includes net earnings credits, if any, as an expense offset in the Statement of Operations.
Pursuant to a securities lending agreement with Mellon Bank, N.A., an affiliate of the Manager, the portfolio may lend securities to qualified institutions.At origination, all loans are secured by collateral of at least 102% of the value of U.S. securities loaned and 105% of the value of foreign securities loaned. Collateral equivalent to at least 100% of the market value of securities on loan will be maintained at all times. Cash collateral is invested in certain money market mutual funds managed by the Manager. The portfolio will be entitled to receive all income on securities loaned, in addition to income earned as a result of the lending transaction.Although each security loaned is fully collateralized, the fund would bear the risk of delay in recovery of, or loss of rights in, the securities loaned should a borrower fail to return the securities in a timely manner.
(d) Affiliated issuers: Investments in other investment companies advised by the Manager are defined as “affiliated” in the Act.
(e) Dividends to shareholders: Dividends are recorded on the ex-dividend date. Dividends from investment income-net are declared and paid monthly. Dividends from net realized capital gain, if any, are normally declared and paid annually, but the portfolio may make distributions on a more frequent basis to comply with the distribution requirements of the Internal Revenue Code of 1986, as amended (the “Code”).To the extent that net realized capital gain can be offset by capital loss carryovers, if any, it is the policy of the portfolio not to distribute such gain. Income and capital gain distributions are determined in accordance with income tax regulations, which may differ from U.S. generally accepted accounting principles.
(f) Federal income taxes: It is the policy of the portfolio to continue to qualify as a regulated investment company, if such qualification is in
The Portfolio 25
NOTES TO FINANCIAL STATEMENTS (continued)
|
the best interests of its shareholders, by complying with the applicable provisions of the Code, and to make distributions of taxable income sufficient to relieve it from substantially all federal income and excise taxes.
At December 31, 2004, the components of accumulated earnings on a tax basis were as follows: undistributed ordinary income $889,592, accumulated capital losses $3,149,141 and unrealized appreciation $1,655,536. In addition, the portfolio had $265,723 of capital losses realized after October 31, 2004, which were deferred for tax purposes to the first day of the following fiscal year.
The accumulated capital loss carryover is available to be applied against future net securities profits, if any, realized subsequent to December 31, 2004. If not applied, the carryover expires in fiscal 2012.
The tax character of distributions paid to shareholders during the fiscal periods ended December 31, 2004 and December 31, 2003, were as follows: ordinary income $9,092,054 and $14,159,260, and long-term capital gains $0 and $523,266 respectively.
During the period ended December 31, 2004, as a result of permanent book to tax differences primarily due to the tax treatment for amortization of premiums, paydowns gains/losses and treasury inflation protected securities, the fund increased accumulated undistributed investment income-net by $1,920,876, decreased accumulated net realized gain (loss) on investments by $2,104,449 and increased paid-in capital by $183,573. Net assets were not affected by this reclassification.
NOTE 2—Bank Lines of Credit:
|
The portfolio may borrow up to $10 million for leveraging purposes under a short-term unsecured line of credit and participates with other Dreyfus-managed funds in a $100 million unsecured line of credit primarily to be utilized for temporary or emergency purposes, including the financing of redemptions. Interest is charged to the portfolio based on prevailing market rates in effect at the time of borrowings.
The average daily amount of borrowings outstanding under both arrangements during the period ended December 31, 2004, was approximately $276,000, with a related weighted average annualized interest rate of 2.13% .
NOTE 3—Investment Advisory Fee and Other Transactions With Affiliates:
(a) Pursuant to an Investment Advisory Agreement with the Manager, the investment advisory fee is computed at the annual rate of .65 of 1% of the value of the portfolio’s average daily net assets and is payable monthly. The Manager has agreed from January 1, 2005 until July 31, 2005 to waive receipt of a portion of the portfolio’s management fee, in the amount of .15 of 1% of the value of the portfolio’s average net assets.
(b) Under the Distribution Plan (the “Plan”) adopted pursuant to Rule 12b-1 under the Act, Service shares pay the Distributor for distributing their shares, for servicing and/or maintaining Service shares shareholder accounts and for advertising and marketing for Service shares.The Plan provides for payments to be made at an annual rate of .25 of 1% of the value of the Service shares’ average daily net assets. The Distributor may make payments to Participating Insurance Companies and to brokers and dealers acting as principal underwriter for their variable insurance products.The fees payable under the Plan are payable without regard to actual expenses incurred. During the period ended December 31, 2004, Service shares were charged $142,802 pursuant to the Plan.
The portfolio compensates Dreyfus Transfer, Inc., a wholly-owned subsidiary of the Manager, under a transfer agency agreement for providing personnel and facilities to perform transfer agency services for the portfolio. During the period ended December 31, 2004, the portfolio was charged $379 pursuant to the transfer agency agreement.
The Portfolio 27
NOTES TO FINANCIAL STATEMENTS (continued)
|
The portfolio compensates Mellon Bank, N.A., an affiliate of the Manager, under a custody agreement to provide custodial services for the portfolio. During the period ended December 31, 2004, the portfolio was charged $67,348 pursuant to the custody agreement.
The components of Due to The Dreyfus Corporation and affiliates in the Statement of Assets and Liabilities consist of:investment advisory fees $124,530, Rule 12b-1 distribution plan fees $11,740, custodian fees $6,682 and transfer agency per account fees $66.
(c) Each Board member also serves as a Board member of other funds within the Dreyfus complex. Annual retainer fees and attendance fees are allocated to each fund based on net assets.
(d) Pursuant to an exemptive order from the Securities and Exchange Commission, the portfolio may invest its available cash balances in affiliated money market mutual funds. Management fees of the underlying money market mutual funds have been waived by the Manager.
NOTE 4—Securities Transactions:
|
The aggregate amount of purchases and sales (including paydowns) of investment securities, excluding short-term securities, financial futures, forward currency exchange contracts, options transactions and swap transactions, during the period ended December 31, 2004, amounted to $1,879,936,398 and $1,938,112,556, respectively, of which $132,622,103 in purchases and $132,965,907 in sales were from dollar roll transactions.
A mortgage dollar roll transaction involves a sale by the portfolio of mortgage related securities that it holds with an agreement by the portfolio to repurchase similar securities at an agreed upon price and date.The securities purchased will bear the same interest rate as those sold, but generally will be collateralized by pools of mortgages with different prepayment histories than those securities sold.
The portfolio may invest in financial futures contracts in order to gain exposure to or protect against changes in the market.The portfolio is exposed to market risk as a result of changes in the value of the underlying financial instruments. Investments in financial futures require the portfolio to “mark to market” on a daily basis, which reflects the change in market value of the contracts at the close of each day’s trading. Accordingly, variation margin payments are received or made to reflect daily unrealized gains or losses.When the contracts are closed, the portfolio recognizes a realized gain or loss. These investments require initial margin deposits with a broker, which consist of cash or cash equivalents. The amount of these deposits is determined by the exchange or Board of Trade on which the contract is traded and is subject to change. Contracts open at December 31, 2004, are set forth in the Statement of Financial Futures.
The portfolio may purchase and write (sell) put and call options in order to gain exposure to or to protect against changes in the market.
As a writer of call options, the portfolio receives a premium at the outset and then bears the market risk of unfavorable changes in the price of the financial instrument underlying the option. Generally, the portfolio would incur a gain, to the extent of the premium, if the price of the underlying financial instrument decreases between the date the option is written and the date on which the option is terminated. Generally, the portfolio would realize a loss, if the price of the financial instrument increases between those dates.
As a writer of put options, the portfolio receives a premium at the outset and then bears the market risk of unfavorable changes in the price of the financial instrument underlying the option. Generally, the portfolio would incur a gain, to the extent of the premium, if the price of the underlying financial instrument increases between the date the option is written and the date on which the option is terminated.
The Portfolio 29
NOTES TO FINANCIAL STATEMENTS (continued)
|
Generally, the portfolio would realize a loss, if the price of the financial instrument decreases between those dates.The following summarizes the portfolio’s call/put options written for the period ended December 31, 2004.
| | | Face Amount | | | | Options Terminated |
| | | | | |
|
| | | Covered by | | Premiums | | | | Net Realized |
| Options Written: | | Contracts ($) | | Received ($) | | Cost ($) | | Gain ($) |
| |
| |
| |
| |
|
| Contracts outstanding | | | | | | | | |
| December 31, 2003 | | 8,860,000 | | 60,248 | | | | |
| Contracts written | | 30,955,000 | | 371,799 | | | | |
| Contracts terminated; | | | | | | | | |
| Contracts expired | | 14,030,000 | | 105,422 | | — | | 105,422 |
| Contracts outstanding | | | | | | | | |
| December 31, 2004 | | 25,785,000 | | 326,625 | | | | |
The portfolio may enter into forward currency exchange contracts in order to hedge its exposure to changes in foreign currency exchange rates on its foreign portfolio holdings and to settle foreign currency transactions.When executing forward currency exchange contracts, the portfolio is obligated to buy or sell a foreign currency at a specified rate on a certain date in the future.With respect to sales of forward currency exchange contracts, the portfolio would incur a loss if the value of the contract increases between the date the forward contract is opened and the date the forward contract is closed.The portfolio realizes a gain if the value of the contract decreases between those dates.With respect to purchases of forward currency exchange contracts, the portfolio would incur a loss if the value of the contract decreases between the date the forward contract is opened and the date the forward contract is closed. The portfolio realizes a gain if the value of the contract increases between those dates.The portfolio is also exposed to credit risk associated with counterparty nonperformance on these forward currency exchange contracts which is typically limited to the unrealized gain on each open contract.At December 31, 2004, there were no forward currency exchange contracts outstanding.
The portfolio may enter into swap agreements to exchange the interest rate on, or return generated by, one nominal instrument for the return generated by another nominal instrument.
As of January 1, 2004, the portfolio has adopted the method of accounting for interim payments on swap contracts in accordance with Financial Accounting Standards Board Statement No. 133.The portfolio accrues for the interim payments on swap contracts on a daily basis, with the net amount recorded within unrealized appreciation (depreciation) of swap contracts in the Statement of Assets and Liabilities. Once the interim payments are settled in cash, the net amount is recorded as realized gain (loss) on swaps, in addition to realized gain (loss) recorded upon the termination of swap contracts in the Statement of Operations. Prior to January 1, 2004, these interim payments were reflected within interest income in the Statement of Operations. Fluctuations in the value of swap contracts are recorded as a component of net change in unrealized appreciation (depreciation) on investments.
Credit default swaps involve commitments to pay a fixed interest rate in exchange for payment if a credit event affecting a third party (the referenced company) occurs.Credit events may include a failure to pay interest or principal, bankruptcy, or restructuring.The following summarizes credit default swaps entered into by the portfolio at December 31, 2004:
| | | | | Unrealized |
| Notional Amount ($) | | Description | | (Depreciation) ($) |
| |
| |
|
| 1,600,000 | | Agreement with UBS terminating | | (1,628) |
| March 20, 2009 to pay a fixed rate of .095% |
| and receive the notional amount as a result of |
| interest payment default totaling $1,000,000 |
| or principal payment default of $10,000,000 |
| | | on Republic of Italy, 6%, 5/29/2008 | | |
Risks may arise upon entering into these agreements from the potential inability of the counterparties to meet the terms of the agreement and are generally limited to the amount of net payments to be received, if any, at the date of default.
At December 31, 2004, the cost of investments for federal income tax purposes was $230,559,602; accordingly, accumulated net unrealized appreciation on investments was $2,253,823, consisting of $3,984,663 gross unrealized appreciation and $1,730,840 gross unrealized depreciation.
NOTES TO FINANCIAL STATEMENTS (continued)
|
In early 2004, two purported class and derivative actions were filed against Mellon Financial, Mellon Bank, N.A., Dreyfus, Founders Asset Management LLC, and certain directors of the Dreyfus Funds and the Dreyfus Founders Funds (together, the “Funds”). In September 2004, plaintiffs served a Consolidated Amended Complaint (the “Amended Complaint”) on behalf of a purported class of all persons who acquired interests in any of the Funds between January 30, 1999 and November 17, 2003, and derivatively on behalf of the Funds. The Amended Complaint in the newly styled In re Dreyfus Mutual Funds Fee Litigation also named the Distributor, Premier Mutual Fund Services, Inc. and two additional Fund directors as defendants and alleges violations of the Investment Company Act of 1940, the Investment Advisers Act of 1940, the Pennsylvania Unfair Trade Practices and Consumer Protection Law and common-law claims. Plaintiffs seek to recover allegedly improper and excessive Rule 12b-1 and advisory fees allegedly charged to the Funds for marketing and distribution services. More specifically, plaintiffs claim, among other things, that 12b-1 fees and directed brokerage were improperly used to pay brokers to recommend the Funds over other funds, and that such payments were not disclosed to investors. In addition, plaintiffs assert that economies of scale and soft-dollar benefits were not passed on to the Funds. Plaintiffs further allege that 12b-1 fees were improperly charged to certain of the Funds that were closed to new investors.The Amended Complaint seeks compensatory and punitive damages, rescission of the advisory contracts, and an accounting and restitution of any unlawful fees, as well as an award of attorneys’ fees and litigation expenses. As noted, some of the claims in this litigation are asserted derivatively on behalf of the Funds that have been named as nominal defendants.With respect to such derivative claims, no relief is
sought against the Funds. Dreyfus believes the allegations to be totally without merit and intends to defend the action vigorously. Defendants filed motions to dismiss the Amended Complaint on November 12, 2004, and those motions are pending.
Additional lawsuits arising out of these circumstances and presenting similar allegations and requests for relief may be filed against the defendants in the future. Neither Dreyfus nor the Funds believe that any of the pending actions will have a material adverse effect on the Funds or Dreyfus’ ability to perform its contract with the Funds.
| REPORT OF INDEPENDENT REGISTERED |
| PUBLIC ACCOUNTING FIRM |
Shareholders and Board of Trustees
Dreyfus Variable Investment Fund, Quality Bond Portfolio
We have audited the accompanying statement of assets and liabilities, including the statements of investments, financial futures and options written, of Dreyfus Variable Investment Fund, Quality Bond Portfolio (one of the funds comprising Dreyfus Variable Investment Fund) as of December 31, 2004, and the related statement of operations for the year then ended, the statement of changes in net assets for each of the two years in the period then ended and financial highlights for each of the periods indicated therein.These financial statements and financial highlights are the responsibility of the Fund’s management. Our responsibility is to express an opinion on these financial statements and financial highlights based on our audits.
We conducted our audits in accordance with the standards of the Public Company Accounting Oversight Board (United States).Those standards require that we plan and perform the audit to obtain reasonable assurance about whether the financial statements and financial highlights are free of material misstatement. An audit includes examining, on a test basis, evidence supporting the amounts and disclosures in the financial statements and financial highlights. Our procedures included verification by examination of securities held by the custodian as of December 31, 2004 and confirmation of securities not held by the custodian by correspondence with others. An audit also includes assessing the accounting principles used and significant estimates made by management, as well as evaluating the overall financial statement presentation.We believe that our audits provide a reasonable basis for our opinion.
In our opinion, the financial statements and financial highlights referred to above present fairly, in all material respects, the financial position of Dreyfus Variable Investment Fund, Quality Bond Portfolio at December 31,2004,the results of its operations for the year then ended,the changes in its net assets for each of the two years in the period then ended and the financial highlights for each of the indicated periods, in conformity with U.S. generally accepted accounting principles.

New York, New York
February 4, 2005
|
IMPORTANT TAX IMFORMATION (Unaudited)
For federal tax purposes, the portfolio hereby designates .04% of the ordinary dividends paid during the fiscal year ended December 31, 2004 as qualifying for the corporate dividends received deduction. Shareholders will receive notification in January 2005 of the percentage applicable to the preparation of their 2004 income tax returns.
The Portfolio 35
BOARD MEMBERS INFORMATION (Unaudited)
Joseph S. DiMartino (61)
Chairman of the Board (1995)
|
Principal Occupation During Past 5 Years:
• Corporate Director and Trustee
|
Other Board Memberships and Affiliations:
|
- The Muscular Dystrophy Association, Director
- Levcor International, Inc., an apparel fabric processor, Director
- Century Business Services, Inc., a provider of outsourcing functions for small and medium size companies, Director
- The Newark Group, a provider of a national market of paper recovery facilities, paperboard mills and paperboard converting plants, Director
- Azimuth Trust, an institutional asset management firm, Member of Board of Managers and Advisory Board
No. of Portfolios for which Board Member Serves: 186
David P. Feldman (65)
Board Member (1994)
|
Principal Occupation During Past 5 Years:
• Corporate Director and Trustee
|
Other Board Memberships and Affiliations:
|
- BBH Mutual Funds Group (11 funds), Director
- The Jeffrey Company, a private investment company, Director
- QMED, a medical device company, Director
No. of Portfolios for which Board Member Serves: 51
———————
James F. Henry (74)
Board Member (1990)
|
Principal Occupation During Past 5 Years:
|
- President, CPR Institute for Dispute Resolution, a non-profit organization principally engaged in the development of alternatives to business litigation (Retired 2003)
No. of Portfolios for which Board Member Serves: 22
|
———————
Rosalind Gersten Jacobs (79)
Board Member (1990)
|
Principal Occupation During Past 5 Years:
• Merchandise and marketing consultant
|
No. of Portfolios for which Board Member Serves: 33
|
Dr. Paul A. Marks (78)
Board Member (1990)
|
Principal Occupation During Past 5 Years:
• President and Chief Executive Officer of Memorial Sloan-Kettering Cancer Center (Retired 1999)
Other Board Memberships and Affiliations:
- Pfizer, Inc., a pharmaceutical company, Director-Emeritus
- Atom Pharm, Director
- Lazard Freres & Company, LLC, Senior Adviser
- Merck, Consultant
No. of Portfolios for which Board Member Serves: 22
———————
Dr. Martin Peretz (65)
Board Member (1990)
|
Principal Occupation During Past 5 Years:
- Editor-in-Chief of The New Republic Magazine
- Lecturer in Social Studies at Harvard University (1965-2001)
- Co-Chairman of TheStreet.com, a financial daily on the web
Other Board Memberships and Affiliations:
- Academy for Liberal Education, an accrediting agency for colleges and universities certified by the U.S. Department of Education, Director
- Digital Learning Group, LLC, an online publisher of college textbooks, Director
- Harvard Center for Blood Research,Trustee
- Bard College,Trustee
- YIVO Institute for Jewish Research,Trustee
No. of Portfolios for which Board Member Serves: 22
———————
Bert W.Wasserman (72)
Board Member (1993)
|
Principal Occupation During Past 5 Years:
• Financial Consultant
Other Board Memberships and Affiliations:
• Lillian Vernon Corporation, Director
No. of Portfolios for which Board Member Serves: 22
———————
Once elected all Board Members serve for an indefinite term.The address of the Board Members and Officers is in c/o The Dreyfus Corporation, 200 Park Avenue, New York, New York 10166.Additional information about the Board Members is available in the fund’s Statement of Additional Information which can be obtained from Dreyfus free of charge by calling this toll free number: 1-800-554-4611.
John M. Fraser, Jr., Emeritus Board Member Irving Kristol, Emeritus Board Member
| OFFICERS OF THE FUND (Unaudited) |
| STEPHEN E. CANTER, President since |
| March 2000. |
| Chairman of the Board, Chief Executive |
| Officer and Chief Operating Officer of the |
| Manager, and an officer of 92 investment |
| companies (comprised of 185 portfolios) |
| managed by the Manager. Mr. Canter also is a |
| Board member and, where applicable, an |
| Executive Committee Member of the other |
| investment management subsidiaries of Mellon |
| Financial Corporation, each of which is an |
| affiliate of the Manager. He is 59 years old and |
| has been an employee of the Manager since |
| May 1995. |
| |
| STEPHEN R. BYERS, Executive Vice |
| President since November 2002. |
| Chief Investment Officer,Vice Chairman and a |
| director of the Manager, and an officer of 92 |
| investment companies (comprised of 185 |
| portfolios) managed by the Manager. Mr. Byers |
| also is an officer, director or an Executive |
| Committee Member of certain other |
| investment management subsidiaries of Mellon |
| Financial Corporation, each of which is an |
| affiliate of the Manager. He is 51 years old and |
| has been an employee of the Manager since |
| January 2000. Prior to joining the Manager, he |
| served as an Executive Vice President-Capital |
| Markets, Chief Financial Officer and Treasurer |
| at Gruntal & Co., L.L.C. |
| |
| MARK N. JACOBS, Vice President since |
| March 2000. |
| Executive Vice President, Secretary and |
| General Counsel of the Manager, and an |
| officer of 93 investment companies (comprised |
| of 201 portfolios) managed by the Manager. |
| He is 58 years old and has been an employee |
| of the Manager since June 1977. |
| MICHAEL A. ROSENBERG, Secretary since |
| March 2000. |
| Associate General Counsel of the Manager, |
| and an officer of 90 investment companies |
| (comprised of 194 portfolios) managed by the |
| Manager. He is 44 years old and has been an |
| employee of the Manager since October 1991. |
| |
| ROBERT R. MULLERY, Assistant Secretary |
| since March 2000. |
| Associate General Counsel of the Manager, |
| and an officer of 26 investment companies |
| (comprised of 60 portfolios) managed by the |
| Manager. He is 52 years old and has been an |
| employee of the Manager since May 1986. |
| |
| STEVEN F. NEWMAN, Assistant Secretary |
| since March 2000. |
| Associate General Counsel and Assistant |
| Secretary of the Manager, and an officer of 93 |
| investment companies (comprised of 201 |
| portfolios) managed by the Manager. He is 55 |
| years old and has been an employee of the |
| Manager since July 1980. |
| |
| JAMES WINDELS, Treasurer since |
| November 2001. |
| Director – Mutual Fund Accounting of the |
| Manager, and an officer of 93 investment |
| companies (comprised of 201 portfolios) |
| managed by the Manager. He is 46 years old |
| and has been an employee of the Manager |
| since April 1985. |
| |
| RICHARD CASSARO, Assistant Treasurer |
| since August 2003. |
| Senior Accounting Manager – Equity Funds of |
| the Manager, and an officer of 26 investment |
| companies (comprised of 102 portfolios) |
| managed by the Manager. He is 44 years old |
| and has been an employee of the Manager |
| since September 1982. |
| ERIK D. NAVILOFF, Assistant Treasurer |
| since December 2002. |
| Senior Accounting Manager – Taxable Fixed |
| Income Funds of the Manager, and an officer |
| of 19 investment companies (comprised of 75 |
| portfolios) managed by the Manager. He is 36 |
| years old and has been an employee of the |
| Manager since November 1992. |
| |
| ROBERT ROBOL, Assistant Treasurer |
| since August 2003. |
| Senior Accounting Manager – Money Market |
| Funds of the Manager, and an officer of 39 |
| investment companies (comprised of 84 |
| portfolios) managed by the Manager. He is 40 |
| years old and has been an employee of the |
| Manager since October 1988. |
| |
| ROBERT SVAGNA, Assistant Treasurer |
| since December 2002. |
| Senior Accounting Manager – Equity Funds of |
| the Manager, and an officer of 27 investment |
| companies (comprised of 107 portfolios) |
| managed by the Manager. He is 37 years old |
| and has been an employee of the Manager |
| since November 1990. |
| |
| KENNETH J. SANDGREN, Assistant |
| Treasurer since November 2001. |
| Mutual Funds Tax Director of the Manager, |
| and an officer of 93 investment companies |
| (comprised of 201 portfolios) managed by the |
| Manager. He is 50 years old and has been an |
| employee of the Manager since June 1993. |
| JOSEPH W. CONNOLLY, Chief Compliance |
| Officer since October 2004. |
| Chief Compliance Officer of the Manager and |
| The Dreyfus Family of Funds (93 investment |
| companies, comprising 201 portfolios). From |
| November 2001 through March 2004, Mr. |
| Connolly was first Vice-President, Mutual |
| Fund Servicing for Mellon Global Securities |
| Services. In that capacity, Mr. Connolly was |
| responsible for managing Mellon’s Custody, |
| Fund Accounting and Fund Administration |
| services to third-party mutual fund clients. He |
| is 47 years old and has served in various |
| capacities with the Manager since 1980, |
| including manager of the firm’s Fund |
| Accounting Department from 1997 through |
| October 2001. |
| |
| WILLIAM GERMENIS, Anti-Money |
| Laundering Compliance Officer since |
| September 2002. |
| Vice President and Anti-Money Laundering |
| Compliance Officer of the Distributor, and the |
| Anti-Money Laundering Compliance Officer |
| of 88 investment companies (comprised of 196 |
| portfolios) managed by the Manager. He is 34 |
| years old and has been an employee of the |
| Distributor since October 1998. |
The Portfolio 39
NOTES
Telephone 1-800-554-4611 or 516-338-3300
Mail The Dreyfus Family of Funds, 144 Glenn Curtiss Boulevard, Uniondale, NY 11556-0144 Attn: Institutional Servicing
The portfolio files its complete schedule of portfolio holdings with the Securities and
Exchange Commission (“SEC”) for the first and third quarters of each fiscal year on Form N-Q. The portfolio’s Forms N-Q are available on the SEC’s website at http://www.sec.gov and may be reviewed and copied at the SEC’s Public Reference Room in Washington, DC. Information on the operation of the Public Reference Room may be obtained by calling 1-800-SEC-0330.
A description of the policies and procedures that the portfolio uses to determine how to vote proxies relating to portfolio securities, and information regarding how the portfolio voted these proxies for the 12-month period ended June 30, 2004, is available through the portfolio’s website at http://www.dreyfus.com and on the SEC’s website at http://www.sec.gov. The description of the policies and procedures is also available without charge, upon request, by calling 1-800-645-6561.
© 2005 Dreyfus Service Corporation

| Dreyfus Variable |
| Investment Fund, |
| Small | | Company |
| Stock | | Portfolio |
The views expressed in this report reflect those of the portfolio manager only through the end of the period covered and do not necessarily represent the views of Dreyfus or any other person in the Dreyfus organization.Any such views are subject to change at any time based upon market or other conditions and Dreyfus disclaims any responsibility to update such views. These views may not be relied on as investment advice and, because investment decisions for a Dreyfus portfolio are based on numerous factors, may not be relied on as an indication of trading intent on behalf of any Dreyfus portfolio.
Not FDIC-Insured • Not Bank-Guaranteed • May Lose Value
| | | Contents |
| |
| | | T H E P O R T F O L I O |
| |
|
| 2 | | Letter from the Chairman |
| 3 | | Discussion of Performance |
| 6 | | Portfolio Performance |
| 8 | | Understanding Your Portfolio’s Expenses |
| 8 | | Comparing Your Portfolio’s Expenses |
| | | With Those of Other Funds |
| 9 | | Statement of Investments |
| 18 | | Statement of Assets and Liabilities |
| 19 | | Statement of Operations |
| 20 | | Statement of Changes in Net Assets |
| 22 | | Financial Highlights |
| 24 | | Notes to Financial Statements |
| 31 | | Report of Independent Registered |
| | | Public Accounting Firm |
| 32 | | Important Tax Information |
| 33 | | Board Members Information |
| 35 | | Officers of the Fund |
| | | F O R M O R E I N F O R M AT I O N |
| |
|
| | | Back Cover |
| Dreyfus Variable Investment Fund, |
| Small Company Stock Portfolio |
The Portfolio

LETTER FROM THE CHAIRMAN
We are pleased to present this annual report for Dreyfus Variable Investment Fund, Small Company Stock Portfolio, covering the 12-month period from January 1, 2004, through December 31, 2004. Inside, you’ll find valuable information about how the portfolio was managed during the reporting period, including a discussion with the portfolio manager, Dwight Cowden.
2004 represented the second consecutive year of positive stock market performance. Unlike the 2003 rally, however, in which most stocks rose as general business conditions improved, 2004’s market performance largely reflected the strengths and weaknesses of individual companies and industries. As a result, fundamental research and professional judgment became more important determinants of mutual fund performance in 2004.
What’s ahead for stocks in 2005? No one knows for certain.Positive influences remain in place, including moderately expanding U.S. and global economies and low inflation. Nonetheless, a number of risks — such as rising short-term interest rates, currency fluctuations and generally slowing corporate earnings — could threaten the market environment.
As always, we urge our shareholders to view the stock market from a long-term perspective, measured in years rather than weeks or months. One of the best ways to ensure a long-term perspective is to establish an investment plan with the help of your financial advisor, and review it periodically to track your progress toward your financial goals.
Thank you for your continued confidence and support.
| Stephen E. Canter |
| Chairman and Chief Executive Officer |
| The Dreyfus Corporation |

DISCUSSION OF PERFORMANCE
Dwight Cowden, Portfolio Manager
How did Dreyfus Variable Investment Fund, Small Company Stock Portfolio perform relative to its benchmark?
For the 12-month period ended December 31, 2004, the portfolio produced total returns of 18.52% for its Initial shares and 18.18% for its Service shares.1This compares with a total return of 22.65% for the portfolio’s benchmark, the S&P SmallCap 600 Index, for the same period.2
We attribute the portfolio’s strong overall gains to a stronger U.S. economy and improving business fundamentals. Small-cap stocks performed particularly well, making 2004 the sixth consecutive year in which such issues outperformed their large-cap counterparts. The portfolio participated in the market’s advance to a significant degree. However, market strength was concentrated in the micro-cap arena during several months of the year.The portfolio typically maintains less exposure to micro-cap companies than the benchmark due to quality and liquidity concerns. As a result, its returns trailed the benchmark.
What is the portfolio’s investment approach?
The portfolio seeks capital appreciation.To pursue this goal, the portfolio normally invests at least 80% of its assets in the stocks of small-capitalization companies. Small-capitalization companies are those with market caps ranging from $100 million to $2 billion at the time of purchase. However, since the portfolio may continue to hold its securities as their market capitalizations grow, a substantial portion of the portfolio’s holdings may have market capitalizations in excess of $2 billion at any given time. Stocks are chosen through a disciplined process, combining computer modeling techniques, fundamental analysis and risk management to create a blended portfolio of growth and value stocks.We use a computer model to identify and rank stocks within an industry or sector, based on:
- value, or how a stock is priced relative to its perceived intrinsic worth;
- growth, in this case the sustainability or growth of earnings; and
- financial profile, which measures the financial health of the company.
DISCUSSION OF PERFORMANCE (continued)
|
We then use fundamental analysis to select what we believe are the most attractive of the top-ranked securities, drawing on a variety of sources, including Wall Street research and company management.We attempt to manage risk by diversifying across companies and industries, limiting the potential adverse impact from any one stock or industry. The portfolio is structured so that its sector weightings and risk characteristics, such as growth, size and yield, are generally similar to those of the S&P SmallCap 600 Index.
What other factors influenced the portfolio’s performance?
Every market sector in which the portfolio invested produced gains in 2004. Energy stocks led the market’s advance amid vigorous industrial demand and rising oil and gas prices.The portfolio generated higher energy-related returns than the benchmark, aided by relatively heavy exposure to the sector and good individual stock selections, such as integrated oil and gas company Southwestern Energy, independent producer Petroleum Development Corp. and tanker company Overseas Shipholding Group. Within the services sector, which also provided strong returns, the portfolio benefited from several investments in vehicle armor producer Armor Holdings, which experienced increasing government demand in Iraq; management recruitment agency Korn/Ferry International, which profited from growing demand in an expanding economy; and metals recycler Metals Management, which was bolstered by increased steel prices.
On the other hand, while the producer goods sector delivered strong total returns, the portfolio’s holdings lagged the benchmark. Concerns over rising interest rates led the portfolio to hold relatively light exposure to the construction area, which proved to be one of the market’s better-performing industries. Nevertheless, several producer goods holdings contributed positively to the portfolio’s returns, including construction retailer Building Materials Holding, mining equipment maker Joy Global, and shipping company Overnite.
Technology holdings also detracted from the portfolio’s relative per-formance.While the portfolio benefited from adding exposure to the semiconductor sector early in the fourth quarter of 2004, adverse stock
selection undermined returns from the technology sector overall. Semiconductor systems supplier Standard Microsystems, software provider SafeNet and cable equipment provider Arris Group, all hurt by negative earnings announcements, ranked among the portfolio’s most disappointing performers.
What is the portfolio’s current strategy?
Our sector-neutral investment strategy remains a core part of the portfolio’s ongoing process. However, in light of continued strength in global economies and robust levels of industrial activity, we have placed modest emphasis on investments in the producer goods and energy sectors.Technology, which continues to struggle in the current market environment, is currently receiving less emphasis.
We believe the portfolio is well-positioned to prosper in a market environment of slowing earnings growth, which could create greater investor demand for relatively consistent performers. Indeed, our proprietary quantitative model and disciplined approach to fundamental analysis tend to give the portfolio a bias in favor of high-quality stocks with the ability to deliver sustained long-term growth.
The portfolio is only available as a funding vehicle under various life insurance policies or variable annuity contracts issued by insurance companies. Individuals may not purchase shares of the portfolio directly.A variable annuity is an insurance contract issued by an insurance company that enables investors to accumulate assets on a tax-deferred basis for retirement or other long-term goals.The investment objective and policies of Dreyfus Variable Investment Fund, Small Company Stock Portfolio made available through insurance products may be similar to other funds/portfolios managed or advised by Dreyfus. However, the investment results of the portfolio may be higher or lower than, and may not be comparable to, those of any other Dreyfus fund/portfolio.
1 Total return includes reinvestment of dividends and any capital gains paid. Past performance is no guarantee of future results. Share price and investment return fluctuate such that upon redemption, portfolio shares may be worth more or less than their original cost.The portfolio’s performance does not reflect the deduction of additional charges and expenses imposed in connection with investing in variable insurance contracts, which will reduce returns.
Part of the portfolio’s recent performance is attributable to positive returns from its initial public offering (IPO) investments.There can be no guarantee that IPOs will have or continue to have a positive effect on the portfolio’s performance.
2 SOURCE: LIPPER INC. — Reflects reinvestment of dividends and, where applicable, capital gain distributions.The Standard and Poor’s SmallCap 600 Index is a widely accepted, unmanaged index of small-cap stock market performance.
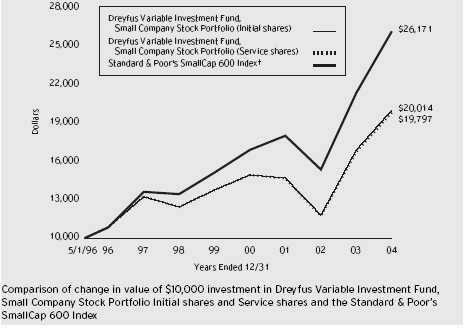
| Average Annual Total Returns | | as of 12/31/04 | | | | |
| | | Inception | | | | | | From |
| | | Date | | 1 Year | | 5 Years | | Inception |
| |
| |
| |
| |
|
| Initial shares | | 5/1/96 | | 18.52% | | 7.77% | | 8.33% |
| Service shares | | 5/1/96 | | 18.18% | | 7.53% | | 8.20% |
The data for Service shares includes the results of Initial shares for the period prior to December 31, 2000 (inception date of Service shares). Actual Service shares’ average annual total return and hypothetical growth results would have been lower. See notes below.
† Source: Lipper Inc.
Past performance is not predictive of future performance.The portfolio’s performance shown in the graph and table does not reflect the deduction of taxes that a shareholder would pay on portfolio distributions or the redemption of portfolio shares. Part of the portfolio’s recent performance is attributable to positive returns from its initial public offering (IPO) investments. There can be no guarantee that IPOs will have or continue to have a positive effect on the portfolio’s performance.
The portfolio’s performance does not reflect the deduction of additional charges and expenses imposed in connection with investing in variable insurance contracts which will reduce returns.
The above graph compares a $10,000 investment made in Initial and Service shares of Dreyfus Variable Investment Fund, Small Company Stock Portfolio on 5/1/96 (inception date of Initial shares) to a $10,000 investment made in the Standard and Poor’s SmallCap 600 Index (the “Index”) on that date.
6
The portfolio’s Initial shares are not subject to a Rule 12b-1 fee.The portfolio’s Service shares are subject to a 0.25% annual Rule 12b-1 fee.The performance figures for Service shares reflect the performance of the portfolio’s Initial shares from their inception date through December 30, 2000, and the performance of the portfolio’s Service shares from December 31, 2000 (inception date of Service shares) to December 31, 2004 (blended performance figures).The blended performance figures have not been adjusted to reflect the higher operating expenses of the Service shares. If these expenses had been reflected, the blended performance figures would have been lower. All dividends and capital gain distributions are reinvested.
The portfolio’s performance shown in the line graph takes into account all applicable portfolio fees and expenses.The Index is a widely accepted, unmanaged index of small-cap stock market performance.The Index does not take into account charges, fees and other expenses. Further information relating to portfolio performance, including expense reimbursements, if applicable, is contained in the Financial Highlights section of the prospectus and elsewhere in this report.

As a mutual fund investor,you pay ongoing expenses,such as management fees and other expenses.Using the information below,you can estimate how these expenses affect your investment and compare them with the expenses of other funds.You also may pay one-time transaction expenses,including sales charges (loads) and redemption fees, which are not shown in this section and would have resulted in higher total expenses. For more information, see your portfolio’s prospectus or talk to your financial adviser.
Review your portfolio’s expenses
|
The table below shows the expenses you would have paid on a $1,000 investment in Dreyfus Variable Investment Fund, Small Company Stock Portfolio from July 1, 2004 to December 31, 2004. It also shows how much a $1,000 investment would be worth at the close of the period, assuming actual returns and expenses.
| Expenses and Value of a $1,000 Investment | | |
| assuming actual returns for the six months ended December 31, 2004 |
| | | Initial Shares | | Service Shares |
| |
| |
|
| Expenses paid per $1,000 † | | $ 5.02 | | $ 6.34 |
| Ending value (after expenses) | | $1,102.80 | | $1,101.20 |
COMPARING YOUR PORTFOLIO’S EXPENSES WITH THOSE OF OTHER FUNDS (Unaudited)
Using the SEC’s method to compare expenses
The Securities and Exchange Commission (SEC) has established guidelines to help investors assess fund expenses. Per these guidelines, the table below shows your portfolio’s expenses based on a $1,000 investment, assuming a hypothetical 5% annualized return. You can use this information to compare the ongoing expenses (but not transaction expenses or total cost) of investing in the portfolio with those of other funds. All mutual fund shareholder reports will provide this information to help you make this comparison. Please note that you cannot use this information to estimate your actual ending account balance and expenses paid during the period.
Expenses and Value of a $1,000 Investment assuming a hypothetical 5% annualized return for the six months ended December 31, 2004
| | | Initial Shares | | Service Shares |
| |
| |
|
| Expenses paid per $1,000 † | | $ 4.82 | | $ 6.09 |
| Ending value (after expenses) | | $1,020.36 | | $1,019.10 |
† Expenses are equal to the portfolio’s annualized expense ratio of .95% for Initial shares and 1.20% for Service shares, multiplied by the average account value over the period, multiplied by 184/366 (to reflect the one-half year period).
STATEMENT OF INVESTMENTS
December 31, 2004
|
| Common Stocks—99.7% | | Shares | | Value ($) |
| |
| |
|
| Consumer Cyclical—15.0% | | | | |
| Alaska Air Group | | 10,100 a,b | | 338,249 |
| Brookstone | | 8,700 a | | 170,085 |
| CEC Entertainment | | 6,700 a | | 267,799 |
| Callaway Golf | | 13,500 | | 182,250 |
| Choice Hotels International | | 5,140 | | 298,120 |
| Claire’s Stores | | 7,000 | | 148,750 |
| Continental Airlines Cl. B | | 14,100 a | | 190,914 |
| Delta Air Lines | | 18,800 a,b | | 140,624 |
| Dick’s Sporting Goods | | 3,230 a | | 113,535 |
| ExpressJet Holdings | | 13,640 a | | 175,683 |
| GameStop, Cl. A | | 7,970 a | | 178,209 |
| Hibbett Sporting Goods | | 8,700 a | | 231,507 |
| Kerzner International | | 4,280 a | | 257,014 |
| Leapfrog Enterprises | | 6,600 a,b | | 89,760 |
| Lone Star Steakhouse & Saloon | | 8,580 | | 240,240 |
| Magna Entertainment, Cl. A | | 30,700 a | | 184,814 |
| NBTY | | 10,930 a | | 262,429 |
| Oakley | | 13,220 | | 168,555 |
| Oshkosh Truck | | 3,270 | | 223,603 |
| Pep Boys-Manny, Moe & Jack | | 13,800 | | 235,566 |
| Polaris Industries | | 3,770 | | 256,435 |
| Scientific Games, Cl. A | | 4,900 a | | 116,816 |
| SCP Pool | | 6,335 | | 202,086 |
| Shuffle Master | | 4,395 a,b | | 207,004 |
| Sonic | | 12,790 a | | 390,095 |
| Sonic Automotive | | 9,400 | | 233,120 |
| Stage Stores | | 5,050 a | | 209,676 |
| Steak n Shake | | 11,010 a | | 221,081 |
| Stein Mart | | 10,900 a | | 185,954 |
| Toro | | 3,980 | | 323,773 |
| West Marine | | 6,600 a | | 163,350 |
| Wolverine World Wide | | 8,490 | | 266,756 |
| Yankee Candle | | 3,190 a | | 105,844 |
| Zale | | 8,720 a | | 260,466 |
| | | | | 7,240,162 |
The Portfolio 9
S T A T E M E N T O F I N V E S T M E N T S (continued)
| Common Stocks (continued) | | Shares | | Value ($) |
| |
| |
|
| Consumer Staples—1.0% | | | | |
| Chiquita Brands International | | 11,700 | | 258,102 |
| Flowers Foods | | 3,900 | | 123,162 |
| Sensient Technologies | | 4,100 | | 98,359 |
| | | | | 479,623 |
| Energy—7.8% | | | | |
| AGL Resources | | 5,020 | | 166,865 |
| Bill Barrett | | 1,400 a | | 44,786 |
| Cal Dive International | | 7,110 a | | 289,733 |
| Cimarex Energy | | 8,320 a | | 315,328 |
| Energen | | 5,680 | | 334,836 |
| Energy Partners | | 12,150 a | | 246,281 |
| Foundation Coal | | 5,100 a,b | | 117,606 |
| Frontier Oil | | 6,870 | | 183,154 |
| Headwaters | | 3,640 a | | 103,740 |
| Magnum Hunter Resources | | 14,700 a | | 189,630 |
| New Jersey Resources | | 6,460 | | 279,976 |
| Oil States International | | 8,960 a | | 172,838 |
| Patina Oil & Gas | | 6,550 | | 245,625 |
| Southwestern Energy | | 3,220 a | | 163,222 |
| Stone Energy | | 4,800 a | | 216,432 |
| UGI | | 8,200 | | 335,462 |
| Unit | | 9,520 a | | 363,759 |
| | | | | 3,769,273 |
| Health Care—11.3% | | | | |
| AMERIGROUP | | 4,010 a | | 303,397 |
| Advanced Medical Optics | | 6,010 a,b | | 247,251 |
| Amedisys | | 6,200 a | | 200,818 |
| American Pharmaceutical Partners | | 4,700 a,b | | 175,827 |
| Biosite | | 2,100 a,b | | 129,234 |
| CONMED | | 9,720 a | | 276,242 |
| Cambrex | | 7,600 | | 205,960 |
| Cooper Cos. | | 2,950 | | 208,241 |
| Diagnostic Products | | 4,180 | | 230,109 |
| Given Imaging | | 3,200 a,b | | 114,912 |
| Haemonetics | | 4,740 a | | 171,635 |
| Common Stocks (continued) | | Shares | | Value ($) |
| |
| |
|
| Health Care (continued) | | | | |
| IDEXX Laboratories | | 5,020 a | | 274,042 |
| Invacare | | 2,700 | | 124,902 |
| Kensey Nash | | 5,000 a | | 172,650 |
| Kindred Healthcare | | 6,500 a | | 194,675 |
| Lumenis | | 111 a,b | | 215 |
| Medicis Pharmaceutical, Cl. A | | 5,100 | | 179,061 |
| Merit Medical Systems | | 11,501 a | | 175,735 |
| Mine Safety Appliances | | 2,630 | | 133,341 |
| Myogen | | 28,600 a | | 230,802 |
| Owens & Minor | | 6,300 | | 177,471 |
| Pharmaceutical Product Development | | 6,500 a | | 268,385 |
| PolyMedica | | 6,450 | | 240,521 |
| RehabCare Group | | 8,220 a | | 230,078 |
| Res-Care | | 7,890 a | | 120,086 |
| Sierra Health Services | | 2,970 a | | 163,677 |
| Sybron Dental Specialties | | 8,100 a | | 286,578 |
| United Therapeutics | | 2,200 a | | 99,330 |
| Vicuron Pharmaceuticals | | 7,100 a | | 123,611 |
| | | | | 5,458,786 |
| Interest Sensitive—14.6% | | | | |
| BankUnited Financial, Cl. A | | 8,970 a | | 286,591 |
| Capital Automotive | | 5,590 | | 198,585 |
| Commerce Group | | 2,960 | | 180,678 |
| Downey Financial | | 3,700 | | 210,900 |
| East West Bancorp | | 4,400 | | 184,624 |
| Endurance Specialty Holdings | | 4,100 | | 140,220 |
| Equity One | | 10,860 | | 257,708 |
| First Bancorp | | 3,650 | | 231,811 |
| First Midwest Bancorp | | 6,260 | | 227,175 |
| First Niagara Financial Group | | 9,300 | | 129,735 |
| FirstFed Financial | | 5,170 a | | 268,168 |
| Flagstar Bancorp | | 15,570 | | 351,882 |
| Fremont General | | 16,600 | | 417,988 |
| Horace Mann Educators | | 9,610 | | 183,359 |
| Hudson United Bancorp | | 3,770 | | 148,463 |
S T A T E M E N T O F I N V E S T M E N T S (continued)
| Common Stocks (continued) | | Shares | | Value ($) |
| |
| |
|
| Interest Sensitive (continued) | | | | |
| Jackson Hewitt Tax Service | | 10,460 | | 264,115 |
| La Quinta | | 17,150 a | | 155,894 |
| MeriStar Hospitality | | 22,600 a | | 188,710 |
| New Century Financial | | 4,280 | | 273,535 |
| Newcastle Investment | | 7,250 | | 230,405 |
| Northwest Bancorp | | 6,290 | | 157,816 |
| Ohio Casualty | | 7,600 a | | 176,396 |
| Phoenix Companies | | 13,500 | | 168,750 |
| Platinum Underwriters Holdings | | 5,500 | | 171,050 |
| PrivateBancorp | | 6,900 | | 222,387 |
| R&G Financial, Cl. B | | 4,320 | | 167,962 |
| Raymond James Financial | | 5,700 | | 176,586 |
| Republic Bancorp | | 9,910 | | 151,425 |
| Rewards Network | | 18,000 a | | 126,000 |
| South Financial Group | | 5,400 | | 175,662 |
| UCBH Holdings | | 4,170 | | 191,069 |
| UICI | | 3,870 | | 131,193 |
| Umpqua Holdings | | 10,900 | | 274,789 |
| Wintrust Financial | | 3,930 | | 223,853 |
| | | | | 7,045,484 |
| Other—.8% | | | | |
| iShares Russell 2000 Index Fund | | 2,800 b | | 362,600 |
| Producer Goods—23.0% | | | | |
| A. Schulman | | 6,600 | | 141,306 |
| AMCOL International | | 6,890 | | 138,420 |
| Acuity Brands | | 6,380 | | 202,884 |
| Albemarle | | 4,200 | | 162,582 |
| Applied Industrial Technologies | | 6,600 | | 180,840 |
| AptarGroup | | 4,320 | | 228,010 |
| Armor Holdings | | 2,760 a | | 129,775 |
| Briggs & Stratton | | 4,840 | | 201,247 |
| Building Materials Holding | | 5,550 | | 212,510 |
| CLARCOR | | 5,100 | | 279,327 |
| Carpenter Technology | | 5,930 | | 346,668 |
| Common Stocks (continued) | | Shares | | Value ($) |
| |
| |
|
| Producer Goods (continued) | | | | |
| Chesapeake | | 6,100 | | 165,676 |
| Commercial Metals | | 6,060 | | 306,394 |
| Compass Minerals International | | 5,020 | | 121,635 |
| Corrections Corporation of America | | 3,860 a | | 156,137 |
| Curtiss-Wright | | 4,530 | | 260,067 |
| Dycom Industries | | 6,400 a | | 195,328 |
| EnPro Industries | | 7,070 a | | 209,060 |
| FMC | | 5,260 a | | 254,058 |
| Florida Rock Industries | | 3,900 | | 232,167 |
| Genlyte Group | | 2,500 a | | 214,200 |
| Georgia Gulf | | 5,310 | | 264,438 |
| Griffon | | 6,970 a | | 188,190 |
| Heartland Express | | 10,440 | | 234,587 |
| Hughes Supply | | 5,820 | | 188,277 |
| IDEX | | 4,300 | | 174,150 |
| Innovative Solutions and Support | | 7,600 a | | 253,536 |
| Landstar System | | 2,780 a | | 204,719 |
| Longview Fibre | | 10,500 | | 190,470 |
| M.D.C. Holdings | | 2,593 | | 224,139 |
| Methanex | | 11,500 | | 209,990 |
| Offshore Logistics | | 5,130 a | | 166,571 |
| Overnite | | 6,610 | | 246,157 |
| Overseas Shipholding Group | | 4,430 | | 244,536 |
| Pope & Talbot | | 11,700 | | 200,187 |
| Potlach | | 3,600 | | 182,088 |
| Quanex | | 4,660 | | 319,536 |
| RTI International Metals | | 10,980 a | | 225,529 |
| Reliance Steel & Aluminum | | 3,090 | | 120,387 |
| Simpson Manufacturing | | 10,100 | | 352,490 |
| Southern Peru Copper | | 2,200 b | | 103,862 |
| Standard Pacific | | 5,330 | | 341,866 |
| Steel Dynamics | | 5,640 | | 213,643 |
| Tecumseh Products, Cl. A | | 3,600 | | 172,080 |
| Teledyne Technologies | | 10,310 a | | 303,423 |
S T A T E M E N T O F I N V E S T M E N T S (continued)
| Common Stocks (continued) | | Shares | | Value ($) |
| |
| |
|
| Producer Goods (continued) | | | | |
| Thomas & Betts | | 4,940 a | | 151,905 |
| Timken | | 16,420 | | 427,248 |
| URS | | 3,790 a | | 121,659 |
| Watsco | | 6,370 | | 224,351 |
| Westmoreland Coal | | 3,900 a | | 118,794 |
| Woodward Governor | | 2,830 | | 202,656 |
| Yellow Roadway | | 4,290 a | | 238,996 |
| | | | | 11,148,751 |
| Services—8.8% | | | | |
| Acxiom | | 6,150 | | 161,745 |
| American Greetings, Cl. A | | 6,130 | | 155,395 |
| CACI International, Cl. A | | 2,570 a | | 175,094 |
| CIBER | | 20,200 a | | 194,728 |
| Carmike Cinemas | | 3,700 | | 135,050 |
| Cerner | | 3,610 a | | 191,944 |
| Consolidated Graphics | | 5,030 a | | 230,877 |
| Corillian | | 28,400 a | | 139,728 |
| Cox Radio, Cl. A | | 11,400 a | | 187,872 |
| eFunds | | 10,870 a | | 260,989 |
| FactSet Research Systems | | 3,330 | | 194,605 |
| G & K Services, Cl. A | | 4,660 | | 202,337 |
| Global Payments | | 3,470 b | | 203,134 |
| Healthcare Services Group | | 7,330 | | 152,757 |
| Korn/Ferry International | | 5,110 a | | 106,032 |
| Kronos | | 3,900 a | | 199,407 |
| Labor Ready | | 16,450 a | | 278,334 |
| Metal Management | | 8,380 | | 225,171 |
| Navigant Consulting | | 6,640 a | | 176,624 |
| PEC Solutions | | 11,600 a | | 164,372 |
| Regal Entertainment Group, Cl. A | | 8,700 | | 180,525 |
| Regis | | 3,220 | | 148,603 |
| WCA Waste | | 5,140 a | | 53,713 |
| Watson Wyatt & Company Holdings | | 5,990 | | 161,431 |
| | | | | 4,280,467 |
| Common Stocks (continued) | | Shares | | Value ($) |
| |
| |
|
| Technology—15.3% | | | | |
| ANSYS | | 6,260 a | | 200,696 |
| Agilysys | | 13,470 | | 230,876 |
| Anixter International | | 5,910 | | 212,701 |
| Avid Technology | | 4,680 a | | 288,990 |
| Bel Fuse, Cl. B | | 6,500 | | 219,635 |
| Benchmark Electronics | | 3,700 a | | 126,170 |
| Black Box | | 2,060 | | 98,921 |
| Brooktrout Technology | | 10,500 a | | 126,105 |
| C-COR.net | | 12,620 a | | 117,366 |
| Catapult Communications | | 7,800 a | | 188,448 |
| Cognex | | 4,190 | | 116,901 |
| Cree | | 3,800 a,b | | 152,304 |
| DoubleClick | | 20,500 a | | 159,490 |
| ECI Telecom | | 16,700 a | | 136,422 |
| Esterline Technologies | | 4,130 a | | 134,844 |
| FileNet | | 4,200 a | | 108,192 |
| Global Imaging Systems | | 5,940 a | | 234,630 |
| Informatica | | 20,000 a | | 162,400 |
| InfoSpace | | 2,400 a | | 114,120 |
| Inter-Tel | | 8,900 | | 243,682 |
| Internet Security Systems | | 8,800 a | | 204,600 |
| j2 Global Communications | | 4,190 a | | 144,555 |
| LTX | | 18,100 a | | 139,189 |
| M-Systems Flash Disk Pioneers | | 8,800 a | | 173,536 |
| Mercury Computer Systems | | 5,020 a | | 148,994 |
| Methode Electronics, Cl. A | | 14,850 | | 190,822 |
| OmniVision Technologies | | 8,400 a,b | | 154,140 |
| Packeteer | | 12,600 a | | 182,070 |
| Photronics | | 11,570 a | | 190,905 |
| Quest Software | | 9,800 a | | 156,310 |
| SeaChange International | | 9,890 a,b | | 172,482 |
| Sigmatel | | 4,340 a | | 154,200 |
| Skyworks Solutions | | 30,900 a,b | | 291,387 |
| Standard Microsystems | | 8,700 a | | 155,121 |
S T A T E M E N T O F I N V E S T M E N T S (continued)
| Common Stocks (continued) | | Shares | | Value ($) |
| |
| |
|
| Technology (continued) | | | | |
| Supertex | | 6,710 a | | 145,607 |
| TALX | | 6,480 | | 167,119 |
| Take-Two Interactive Software | | 4,180 a,b | | 145,422 |
| Tradestation Group | | 20,900 a | | 146,718 |
| Trimble Navigation | | 6,100 a | | 201,544 |
| UTStarcom | | 6,600 a | | 146,190 |
| Vishay Intertechnology | | 8,000 a | | 120,160 |
| WebEx Communications | | 7,300 a | | 173,594 |
| Western Digital | | 13,000 a | | 140,920 |
| X-Rite | | 12,880 | | 206,209 |
| | | | | 7,424,687 |
| Utilities—2.1% | | | | |
| ALLETE | | 5,000 | | 183,750 |
| CH Energy Group | | 3,510 | | 168,655 |
| CMS Energy | | 11,100 a | | 115,995 |
| Calpine | | 32,000 a,b | | 126,080 |
| Cleco | | 10,830 | | 219,416 |
| OGE Energy | | 8,450 | | 224,010 |
| | | | | 1,037,906 |
| Total Common Stocks | | | | |
| (cost $36,606,984) | | | | 48,247,739 |
| |
| |
|
| | | Principal | | |
| Short-Term Investments—.2% | | Amount ($) | | Value ($) |
| |
| |
|
| Repurchase Agreement; | | | | |
| Greenwich Capital Markets, Tri-Party Repurchase | | |
| Agreement, 1.6%, dated 12/31/2004, due | | |
| 1/3/2005 in the amount of $100,013 (fully | | |
| collateralized by $105,000 Federal Home Loan | | |
| Bank, 2.625%, 10/16/2006, value $104,706) | | |
| (cost $100,000) | | 100,000 | | 100,000 |
| Investment of Cash Collateral | | | | |
| for Securities Loaned—6.4% | | Shares | | Value ($) |
| |
| |
|
| Registered Investment Company; | | | | |
| Dreyfus Institutional Cash Advantage Plus Fund | | |
| (cost $3,107,910) | | | | 3,107,910 c | | 3,107,910 |
| |
| |
| |
|
| |
| Total Investments (cost $39,814,894) | | 106.3% | | 51,455,649 |
| Liabilities, Less Cash and Receivables | | (6.3%) | | (3,042,802) |
| Net Assets | | | | 100.0% | | 48,412,847 |
| |
| a | | Non-income producing. | | | | | | |
| b | | All or a portion of these securities are on loan.At December 31, 2004, the total market value of the portfolio’s |
| | | securities on loan is $2,996,200 and the total market value of the collateral held by the portfolio is $3,107,910. |
| c | | Investment in affiliated money market mutual fund. | | | | |
| |
| |
| |
|
| |
| |
| |
| Portfolio Summary† | | | | | | |
| | | | | Value (%) | | | | Value (%) |
| |
| |
| |
| |
|
| Producer Goods | | 23.0 | | Energy | | 7.8 |
| Technology | | 15.3 | | Short-Term/Money | | |
| Consumer Cyclical | | 15.0 | | Market Investments | | 6.6 |
| Interest Sensitive | | 14.6 | | Other | | 3.9 |
| Health Care | | 11.3 | | | | |
| Services | | 8.8 | | | | 106.3 |
| |
| † | | Based on net assets. | | | | | | |
| See notes to financial statements. | | | | | | |
STATEMENT OF ASSETS AND LIABILITIES
December 31, 2004
| | | Cost | | Value |
| |
| |
|
| Assets ($): | | | | |
| Investments in securities—See Statement | | | | |
| of Investments (including securities on loan, | | |
| valued at $2,996,200)—Note 1(b): | | | | |
| Unaffiliated issuers | | 36,706,984 | | 48,347,739 |
| Affiliated issuers | | 3,107,910 | | 3,107,910 |
| Cash | | | | 115,681 |
| Dividends and interest receivable | | | | 30,828 |
| Receivable for shares of Beneficial Interest subscribed | | 10,568 |
| | | | | 51,612,726 |
| |
| |
|
| Liabilities ($): | | | | |
| Due to The Dreyfus Corporation and affiliates—Note 3(b) | | 35,631 |
| Liability for securities on loan—Note 1(b) | | | | 3,107,910 |
| Payable for shares of Beneficial Interest redeemed | | 2,438 |
| Accrued expenses | | | | 53,900 |
| | | | | 3,199,879 |
| |
| |
|
| Net Assets ($) | | | | 48,412,847 |
| |
| |
|
| Composition of Net Assets ($): | | | | |
| Paid-in capital | | | | 34,622,593 |
| Accumulated undistributed investment income—net | | 7,597 |
| Accumulated net realized gain (loss) on investments | | 2,141,902 |
| Accumulated net unrealized appreciation | | | | |
| (depreciation) on investments | | | | 11,640,755 |
| |
| |
|
| Net Assets ($) | | | | 48,412,847 |
| |
| |
|
| |
| |
| Net Asset Value Per Share | | | | |
| | | Initial Shares | | Service Shares |
| |
| |
|
| Net Assets ($) | | 41,534,214 | | 6,878,633 |
| Shares Outstanding | | 1,833,124 | | 306,357 |
| |
| |
|
| Net Asset Value Per Share ($) | | 22.66 | | 22.45 |
See notes to financial statements.
|
STATEMENT OF OPERATIONS
Year Ended December 31, 2004
|
| Investment Income ($): | | |
| Income: | | |
| Cash dividends (net of $642 foreign taxes withheld at source) | | 396,409 |
| Income from securities lending | | 11,586 |
| Interest | | 4,681 |
| Total Income | | 412,676 |
| Expenses: | | |
| Investment advisory fee—Note 3(a) | | 325,603 |
| Auditing fees | | 33,319 |
| Custodian fees—Note 3(b) | | 25,560 |
| Prospectus and shareholders’ reports | | 16,070 |
| Distribution fees—Note 3(b) | | 14,694 |
| Trustees’ fees and expenses—Note 3(c) | | 4,646 |
| Shareholder servicing costs—Note 3(b) | | 3,700 |
| Loan commitment fees—Note 2 | | 431 |
| Legal fees | | 21 |
| Miscellaneous | | 2,079 |
| Total Expenses | | 426,123 |
| Less—reduction in custody fees due | | |
| to earnings credits—Note 1(b) | | (138) |
| Net Expenses | | 425,985 |
| Investment (Loss)—Net | | (13,309) |
| |
|
| Realized and Unrealized Gain (Loss) on Investments—Note 4 ($): |
| Net realized gain (loss) on investments | | 5,768,704 |
| Net unrealized appreciation (depreciation) on investments | | 1,812,799 |
| Net Realized and Unrealized Gain (Loss) on Investments | | 7,581,503 |
| Net Increase in Net Assets Resulting from Operations | | 7,568,194 |
See notes to financial statements.
|
STATEMENT OF CHANGES IN NET ASSETS
| | | Year Ended December 31, |
| |
|
| | | 2004 | | 2003 |
| |
| |
|
| Operations ($): | | | | |
| Investment (loss)—net | | (13,309) | | (37,705) |
| Net realized gain (loss) on investments | | 5,768,704 | | 1,851,665 |
| Net unrealized appreciation | | | | |
| (depreciation) on investments | | 1,812,799 | | 9,992,799 |
| Net Increase (Decrease) in Net Assets | | | | |
| Resulting from Operations | | 7,568,194 | | 11,806,759 |
| |
| |
|
| Dividends to Shareholders from ($): | | | | |
| Investment income—net: | | | | |
| Initial shares | | — | | (32,617) |
| Service shares | | — | | (4,132) |
| Net realized gain on investments: | | | | |
| Initial shares | | (2,482,168) | | — |
| Service shares | | (414,059) | | — |
| Total Dividends | | (2,896,227) | | (36,749) |
| |
| |
|
| Beneficial Interest Transactions ($): | | | | |
| Net proceeds from shares sold: | | | | |
| Initial shares | | 5,675,897 | | 4,960,895 |
| Service shares | | 3,986,665 | | 2,514,254 |
| Dividends reinvested: | | | | |
| Initial shares | | 2,482,168 | | 32,617 |
| Service shares | | 414,059 | | 4,132 |
| Cost of shares redeemed: | | | | |
| Initial shares | | (6,864,790) | | (4,584,627) |
| Service shares | | (3,712,388) | | (1,513,120) |
| Increase (Decrease) in Net Assets from | | | | |
| Beneficial Interest Transactions | | 1,981,611 | | 1,414,151 |
| Total Increase (Decrease) in Net Assets | | 6,653,578 | | 13,184,161 |
| |
| |
|
| Net Assets ($): | | | | |
| Beginning of Period | | 41,759,269 | | 28,575,108 |
| End of Period | | 48,412,847 | | 41,759,269 |
| Undistributed investment income—net | | 7,597 | | 613 |
| | | Year Ended December 31, |
| |
|
| | | 2004 | | 2003 |
| |
| |
|
| Capital Share Transactions: | | | | |
| Initial Shares | | | | |
| Shares sold | | 265,284 | | 279,181 |
| Shares issued for dividends reinvested | | 110,368 | | 2,379 |
| Shares redeemed | | (322,098) | | (288,174) |
| Net Increase (Decrease) in Shares Outstanding | | 53,554 | | (6,614) |
| |
| |
|
| Service Shares | | | | |
| Shares sold | | 188,954 | | 141,806 |
| Shares issued for dividends reinvested | | 18,576 | | 303 |
| Shares redeemed | | (176,121) | | (86,607) |
| Net Increase (Decrease) in Shares Outstanding | | 31,409 | | 55,502 |
See notes to financial statements.
|
The following tables describe the performance for each share class for the fiscal periods indicated.All information (except portfolio turnover rate) reflects financial results for a single portfolio share.Total return shows how much your investment in the portfolio would have increased (or decreased) during each period, assuming you had reinvested all dividends and distributions.These figures have been derived from the portfolio’s financial statements.
| | | | | | | Year Ended December 31, | | |
| | | |
| |
| |
|
| Initial Shares | | 2004 | | 2003 | | 2002 | | 2001 | | 2000 |
| |
| |
| |
| |
| |
|
| Per Share Data ($): | | | | | | | | | | |
| Net asset value, beginning of period | | 20.34 | | 14.25 | | 17.79 | | 18.08 | | 16.69 |
| Investment Operations: | | | | | | | | | | |
| Investment income (loss)—net a | | .00b | | (.01) | | .05 | | .03 | | .02 |
| Net realized and unrealized | | | | | | | | | | |
| gain (loss) on investments | | 3.76 | | 6.12 | | (3.55) | | (.31) | | 1.40 |
| Total from Investment Operations | | 3.76 | | 6.11 | | (3.50) | | (.28) | | 1.42 |
| Distributions: | | | | | | | | | | |
| Dividends from investment income—net | | — | | (.02) | | (.04) | | (.01) | | (.03) |
| Dividends from net realized | | | | | | | | | | |
| gain on investments | | (1.44) | | — | | — | | — | | — |
| Total Distributions | | (1.44) | | (.02) | | (.04) | | (.01) | | (.03) |
| Net asset value, end of period | | 22.66 | | 20.34 | | 14.25 | | 17.79 | | 18.08 |
| |
| |
| |
| |
| |
|
| Total Return (%) | | 18.52 | | 42.94 | | (19.71) | | (1.53) | | 8.53 |
| |
| |
| |
| |
| |
|
| Ratios/Supplemental Data (%): | | | | | | | | | | |
| Ratio of total expenses | | | | | | | | | | |
| to average net assets | | .95 | | 1.12 | | .98 | | 1.03 | | .93 |
| Ratio of net expenses | | | | | | | | | | |
| to average net assets | | .95 | | 1.12 | | .98 | | 1.03 | | .93 |
| Ratio of net investment income | | | | | | | | | | |
| (loss) to average net assets | | .00c | | (.09) | | .28 | | .16 | | .09 |
| Portfolio Turnover Rate | | 112.27 | | 171.34 | | 71.76 | | 60.40 | | 84.47 |
| |
| |
| |
| |
| |
|
| Net Assets, end of period ($ x 1,000) | | 41,534 | | 36,200 | | 25,458 | | 33,341 | | 35,956 |
| |
| a | | Based on average shares outstanding at each month end. | | | | | | | | |
| b | | Amount represents less than $.01 per share. | | | | | | | | |
| c | | Amount represents less than .01%. | | | | | | | | | | |
| See notes to financial statements. | | | | | | | | | | |
| | | | | | | Year Ended December 31, | | |
| | | |
| |
| |
|
| Service Shares | | 2004 | | 2003 | | 2002 | | 2001 | | 2000 a |
| |
| |
| |
| |
| |
|
| Per Share Data ($): | | | | | | | | | | |
| Net asset value, beginning of period | | 20.22 | | 14.20 | | 17.73 | | 18.08 | | 18.08 |
| Investment Operations: | | | | | | | | | | |
| Investment income (loss)—net | | (.05)b | | (.06)b | | .01b | | (.03)b | | — |
| Net realized and unrealized | | | | | | | | | | |
| gain (loss) on investments | | 3.72 | | 6.10 | | (3.54) | | (.31) | | — |
| Total from Investment Operations | | 3.67 | | 6.04 | | (3.53) | | (.34) | | — |
| Distributions: | | | | | | | | | | |
| Dividends from investment income—net | | — | | (.02) | | (.00)c | | (.01) | | — |
| Dividends from net realized | | | | | | | | | | |
| gain on investments | | (1.44) | | — | | — | | — | | — |
| Total Distributions | | (1.44) | | (.02) | | (.00)c | | (.01) | | — |
| Net asset value, end of period | | 22.45 | | 20.22 | | 14.20 | | 17.73 | | 18.08 |
| |
| |
| |
| |
| |
|
| Total Return (%) | | 18.18 | | 42.60 | | (19.89) | | (1.86) | | — |
| |
| |
| |
| |
| |
|
| Ratios/Supplemental Data (%): | | | | | | | | | | |
| Ratio of total expenses | | | | | | | | | | |
| to average net assets | | 1.20 | | 1.37 | | 1.22 | | 1.39 | | — |
| Ratio of net expenses | | | | | | | | | | |
| to average net assets | | 1.20 | | 1.37 | | 1.22 | | 1.39 | | — |
| Ratio of net investment income | | | | | | | | | | |
| (loss) to average net assets | | (.25) | | (.34) | | .04 | | (.18) | | — |
| Portfolio Turnover Rate | | 112.27 | | 171.34 | | 71.76 | | 60.40 | | 84.47 |
| |
| |
| |
| |
| |
|
| Net Assets, end of period ($ x 1,000) | | 6,879 | | 5,559 | | 3,117 | | 1,944 | | 1 |
| |
| a | | The portfolio commenced offering Service shares on December 31, 2000. | | | | | | |
| b | | Based on average shares outstanding at each month end. | | | | | | | | |
| c | | Amount represents less than $.01 per share. | | | | | | | | |
| See notes to financial statements. | | | | | | | | | | |
NOTES TO FINANCIAL STATEMENTS
NOTE 1—Significant Accounting Policies:
Dreyfus Variable Investment Fund (the “fund”) is registered under the Investment Company Act of 1940, as amended (the “Act”), as an open-end management investment company, operating as a series company currently offering twelve series, including the Small Company Stock Portfolio (the “portfolio”). The portfolio is only offered to separate accounts established by insurance companies to fund variable annuity contracts and variable life insurance policies.The portfolio is a diversified series.The portfolio’s investment objective is to provide capital appreciation. The Dreyfus Corporation (the “Manager” or “Dreyfus “) serves as the portfolio’s investment adviser. The Manager is a wholly-owned subsidiary of Mellon Financial Corporation (“Mellon Financial”).
Dreyfus Service Corporation (the “Distributor”), a wholly-owned subsidiary of the Manager, is the distributor of the portfolio’s shares, which are sold without a sales charge.The portfolio is authorized to issue an unlimited number of $.001 par value shares of Beneficial Interest in each of the following classes of shares: Initial and Service. Each class of shares has identical rights and privileges, except with respect to the distribution plan and the expenses borne by each class and certain voting rights. Income, expenses (other than expenses attributable to a specific class), and realized and unrealized gains or losses on investments are allocated to each class of shares based on its relative net assets.
The fund accounts separately for the assets, liabilities and operations of each series. Expenses directly attributable to each series are charged to that series’ operations; expenses which are applicable to all series are allocated among them on a pro rata basis.
The portfolio’s financial statements are prepared in accordance with U.S. generally accepted accounting principles, which may require the use of management estimates and assumptions. Actual results may differ from those estimates.
The fund enters into contracts that contain a variety of indemnifica-tions.The portfolio’s maximum exposure under these arrangements is unknown. The portfolio does not anticipate recognizing any loss related to these arrangements.
(a) Portfolio valuation: Investments in securities are valued at the last sales price on the securities exchange or national securities market on which such securities are primarily traded. Securities listed on the National Market System for which market quotations are available are valued at the official closing price or, if there is no official closing price that day, at the last sales price. Securities not listed on an exchange or the national securities market, or securities for which there were no transactions, are valued at the average of the most recent bid and asked prices, except for open short positions, where the asked price is used for valuation purposes. Bid price is used when no asked price is available. Investments in registered investment companies are valued at their net asset value. When market quotations or official closing prices are not readily available, or are determined not to reflect accurately fair value, such as when the value of a security has been significantly affected by events after the close of the exchange or market on which the security is principally traded (for example,a foreign exchange or market),but before the portfolio calculates its net asset value, the portfolio may value these investments at fair value as determined in accordance with the procedures approved by the Board of Trustees. Fair valuing of securities may be determined with the assistance of a pricing service using calculations based on indices of domestic securities and other appropriate indicators, such as prices of relevant ADR’s and futures contracts. For other securities that are fair valued by the Board of Trustees, certain factors may be considered such as: fundamental analytical data, the nature and duration of restrictions on disposition, an evaluation of the forces that influence the market in which the securities are purchased and sold and public trading in similar securities of the issuer or comparable issuers.
NOTES TO FINANCIAL STATEMENTS (continued)
|
(b) Securities transactions and investment income: Securities transactions are recorded on a trade date basis. Realized gain and loss from securities transactions are recorded on the identified cost basis. Dividend income is recognized on the ex-dividend date and interest income, including, where applicable, accretion of discount and amortization of premium on investments, is recognized on the accrual basis.
The portfolio has an arrangement with the custodian bank whereby the portfolio receives earnings credits from the custodian when positive cash balances are maintained, which are used to offset custody fees. For financial reporting purposes, the portfolio includes net earnings credits as an expense offset in the Statement of Operations.
Pursuant to a securities lending agreement with Mellon Bank, N.A., an affiliate of the Manager, the portfolio may lend securities to qualified institutions.At origination, all loans are secured by collateral of at least 102% of the value of U.S. securities loaned and 105% of the value of foreign securities loaned. Collateral equivalent to at least 100% of the market value of securities on loan will be maintained at all times. Cash collateral is invested in certain money market mutual funds managed by the Manager. The portfolio will be entitled to receive all income on securities loaned, in addition to income earned as a result of the lending transaction. Although each security loaned is fully collateralized, the portfolio would bear the risk of delay in recovery of, or loss of rights in, the securities loaned should a borrower fail to return the securities in a timely manner.
The portfolio may enter into repurchase agreements with financial institutions, deemed to be creditworthy by the Manager, subject to the seller’s agreement to repurchase and the portfolio’s agreement to resell such securities at a mutually agreed upon price. Securities purchased subject to repurchase agreements are deposited with the portfolio’s custodian and, pursuant to the terms of the repurchase agreement, must have an aggregate market value greater than or equal to the terms of the repurchase price plus accrued interest at all times. If the value of the underlying securities falls below the value of the repurchase price plus accrued interest, the portfolio will require the seller to deposit
additional collateral by the next business day. If the request for additional collateral is not met, or the seller defaults on its repurchase obligation, the portfolio maintains its right to sell the underlying securities at market value and may claim any resulting loss against the seller.
(c) Affiliated issuers: Investments in other investment companies advised by the Manager are defined as “affiliated” in the Act.
(d) Dividends to shareholders: Dividends are recorded on the ex-dividend date. Dividends from investment income-net and dividends from net realized capital gain, if any, are normally declared and paid annually, but the portfolio may make distributions on a more frequent basis to comply with the distribution requirements of the Internal Revenue Code of 1986, as amended (the “Code”).To the extent that net realized capital gain can be offset by capital loss carryovers, if any, it is the policy of the portfolio not to distribute such gain. Income and capital gain distributions are determined in accordance with income tax regulations, which may differ from U.S. generally accepted accounting principles.
(e) Federal income taxes: It is the policy of the portfolio to continue to qualify as a regulated investment company, if such qualification is in the best interests of its shareholders, by complying with the applicable provisions of the Code, and to make distributions of taxable income sufficient to relieve it from substantially all federal income and excise taxes.
At December 31, 2004, the components of accumulated earnings on a tax basis were as follows: undistributed ordinary income $398,838, undistributed capital gains $1,789,398 and unrealized appreciation $11,602,018.
The tax character of distributions paid to shareholders during the fiscal periods ended December 31, 2004 and December 31, 2003 were as follows: ordinary income $0 and $36,749 and long-term capital gains $2,896,227 and $0, respectively.
During the period ended December 31, 2004, as a result of permanent book to tax differences primarily due to the tax treatment for net operating losses and real estate investment trusts, the portfolio increased
NOTES TO FINANCIAL STATEMENTS (continued)
|
accumulated undistributed investment income-net by $20,293 and decreased accumulated net realized gain (loss) on investments by the same amount. Net assets were not affected by this reclassification.
NOTE 2—Bank Line of Credit:
|
The portfolio participates with other Dreyfus-managed funds in a $350 million redemption credit facility (the “Facility”) to be utilized for temporary or emergency purposes, including the financing of redemptions. In connection therewith, the portfolio has agreed to pay commitment fees on its pro rata portion of the Facility. Interest is charged to the portfolio based on prevailing market rates in effect at the time of borrowings. During the period ended December 31, 2004, the portfolio did not borrow under the Facility.
NOTE 3—Investment Advisory Fee and Other Transactions with Affiliates:
(a) Pursuant to an Investment Advisory Agreement with the Manager, the investment advisory fee is computed at the annual rate of .75 of 1% of the value of the portfolio’s average daily net assets and is payable monthly.
(b) Under the Distribution Plan (the “Plan”) adopted pursuant to Rule 12b-1 under the Act, Service shares pay the Distributor for distributing their shares, for servicing and/or maintaining Service shares shareholder accounts and for advertising and marketing for Service shares.The Plan provides for payments to be made at an annual rate of .25 of 1% of the value of the Service shares’ average daily net assets.The Distributor may make payments to Participating Insurance Companies and to brokers and dealers acting as principal underwriter for their variable insurance products.The fees payable under the Plan are payable without regard to actual expenses incurred. During the period ended December 31, 2004, Service shares were charged $14,694 pursuant to the Plan.
The portfolio compensates Dreyfus Transfer, Inc., a wholly-owned subsidiary of the Manager, under a transfer agency agreement for providing personnel and facilities to perform transfer agency services for
the portfolio. During the period ended December 31, 2004, the portfolio was charged $354 pursuant to the transfer agency agreement.
The portfolio compensates Mellon Bank, N.A., an affiliate of the Manager, under a custody agreement for providing custodial services for the portfolio. During the period ended December 31, 2004, the portfolio was charged $25,560 pursuant to the custody agreement.
The components of Due to The Dreyfus Corporation and affiliates in the Statement of Assets and Liabilities consist of: investment advisory fees $30,329, Rule 12b-1 distribution plan fees $1,439, custodian fees $3,812 and transfer agency per account fees $51.
(c) Each Board member also serves as a Board member of other funds within the Dreyfus complex. Annual retainer fees and attendance fees are allocated to each fund based on net assets.
NOTE 4—Securities Transactions:
The aggregate amount of purchases and sales of investment securities, excluding short-term securities, during the period ended December 31, 2004, amounted to $48,429,322 and $48,678,162, respectively.
At December 31, 2004, the cost of investments for federal income tax purposes was $39,853,631; accordingly, accumulated net unrealized appreciation on investments was $11,602,018, consisting of $11,918,846 gross unrealized appreciation and $316,828 gross unrealized depreciation.
In early 2004, two purported class and derivative actions were filed against Mellon Financial, Mellon Bank, N.A., Dreyfus, Founders Asset Management LLC, and certain directors of the Dreyfus Funds and the Dreyfus Founders Funds (together, the “Funds”). In September 2004, plaintiffs served a Consolidated Amended Complaint (the “Amended Complaint”) on behalf of a purported class of all persons who acquired interests in any of the Funds between January 30, 1999 and
NOTES TO FINANCIAL STATEMENTS (continued)
|
November 17, 2003, and derivatively on behalf of the Funds. The Amended Complaint in the newly styled In re Dreyfus Mutual Funds Fee Litigation also named the Distributor, Premier Mutual Fund Services, Inc. and two additional Fund directors as defendants and alleges violations of the Investment Company Act of 1940, the Investment Advisers Act of 1940, the Pennsylvania Unfair Trade Practices and Consumer Protection Law and common-law claims. Plaintiffs seek to recover allegedly improper and excessive Rule 12b-1 and advisory fees allegedly charged to the Funds for marketing and distribution services. More specifically, plaintiffs claim, among other things, that 12b-1 fees and directed brokerage were improperly used to pay brokers to recommend the Funds over other funds, and that such payments were not disclosed to investors. In addition, plaintiffs assert that economies of scale and soft-dollar benefits were not passed on to the Funds. Plaintiffs further allege that 12b-1 fees were improperly charged to certain of the Funds that were closed to new investors.The Amended Complaint seeks compensatory and punitive damages, rescission of the advisory contracts, and an accounting and restitution of any unlawful fees, as well as an award of attorneys’ fees and litigation expenses. As noted, some of the claims in this litigation are asserted derivatively on behalf of the Funds that have been named as nominal defendants.With respect to such derivative claims, no relief is sought against the Funds. Dreyfus believes the allegations to be totally without merit and intends to defend the action vigorously. Defendants filed motions to dismiss the Amended Complaint on November 12, 2004, and those motions are pending.
Additional lawsuits arising out of these circumstances and presenting similar allegations and requests for relief may be filed against the defendants in the future. Neither Dreyfus nor the Funds believe that any of the pending actions will have a material adverse effect on the Funds or Dreyfus’ ability to perform its contract with the Funds.
| REPORT OF INDEPENDENT REGISTERED |
| PUBLIC ACCOUNTING FIRM |
Shareholders and Board of Trustees
Dreyfus Variable Investment Fund, Small Company Stock Portfolio
We have audited the accompanying statement of assets and liabilities, including the statement of investments, of Dreyfus Variable Investment Fund, Small Company Stock Portfolio (one of the funds comprising Dreyfus Variable Investment Fund) as of December 31, 2004, and the related statement of operations for the year then ended, the statement of changes in net assets for each of the two years in the period then ended, and financial highlights for each of the periods indicated therein.These financial statements and financial highlights are the responsibility of the Fund’s management. Our responsibility is to express an opinion on these financial statements and financial highlights based on our audits.
We conducted our audits in accordance with the standards of the Public Company Accounting Oversight Board (United States).Those standards require that we plan and perform the audit to obtain reasonable assurance about whether the financial statements and financial highlights are free of material misstatement. An audit includes examining, on a test basis, evidence supporting the amounts and disclosures in the financial statements and financial highlights. Our procedures included verification by examination of securities held by the custodian as of December 31, 2004 and confirmation of securities not held by the custodian by correspondence with others. An audit also includes assessing the accounting principles used and significant estimates made by management, as well as evaluating the overall financial statement presentation.We believe that our audits provide a reasonable basis for our opinion.
In our opinion, the financial statements and financial highlights referred to above present fairly, in all material respects, the financial position of Dreyfus Variable Investment Fund, Small Company Stock Portfolio at December 31, 2004, the results of its operations for the year then ended, the changes in its net assets for each of the two years in the period then ended, and the financial highlights for each of the indicated periods, in conformity with U. S. generally accepted accounting principles.

| | New York, New York
February 4, 2005
|
IMPORTANT TAX INFORMATION (Unaudited)
For federal tax purposes, the portfolio hereby designates $1.4359 per share as a long-term capital gain distribution paid on December 21,2004.
BOARD MEMBERS INFORMATION (Unaudited)
Joseph S. DiMartino (61) Chairman of the Board (1995)
Principal Occupation During Past 5 Years:
• Corporate Director and Trustee
Other Board Memberships and Affiliations:
- The Muscular Dystrophy Association, Director
- Levcor International, Inc., an apparel fabric processor, Director
- Century Business Services, Inc., a provider of outsourcing functions for small and medium size companies, Director
- The Newark Group, a provider of a national market of paper recovery facilities, paperboard mills and paperboard converting plants, Director
- Azimuth Trust, an institutional asset management firm, Member of Board of Managers and Advisory Board
No. of Portfolios for which Board Member Serves: 186
David P. Feldman (65)
Board Member (1994)
|
Principal Occupation During Past 5 Years:
• Corporate Director and Trustee
Other Board Memberships and Affiliations:
- BBH Mutual Funds Group (11 funds), Director
- The Jeffrey Company, a private investment company, Director
- QMED, a medical device company, Director
No. of Portfolios for which Board Member Serves: 51
———————
James F. Henry (74) Board Member (1990)
Principal Occupation During Past 5 Years:
- President, CPR Institute for Dispute Resolution, a non-profit organization principally engaged in the development of alternatives to business litigation (Retired 2003)
No. of Portfolios for which Board Member Serves: 22
———————
Rosalind Gersten Jacobs (79) Board Member (1990)
Principal Occupation During Past 5 Years:
• Merchandise and marketing consultant
No. of Portfolios for which Board Member Serves: 33
BOARD MEMBERS INFORMATION (Unaudited) (continued)
Dr. Paul A. Marks (78) Board Member (1990)
Principal Occupation During Past 5 Years:
• President and Chief Executive Officer of Memorial Sloan-Kettering Cancer Center (Retired 1999)
Other Board Memberships and Affiliations:
|
- Pfizer, Inc., a pharmaceutical company, Director-Emeritus
- Atom Pharm, Director
- Lazard Freres & Company, LLC, Senior Adviser
- Merck, Consultant
No. of Portfolios for which Board Member Serves: 22
|
Dr. Martin Peretz (65)
Board Member (1990)
|
Principal Occupation During Past 5 Years:
|
- Editor-in-Chief of The New Republic Magazine
- Lecturer in Social Studies at Harvard University (1965-2001)
- Co-Chairman of TheStreet.com, a financial daily on the web
Other Board Memberships and Affiliations:
|
- Academy for Liberal Education, an accrediting agency for colleges and universities certified by the U.S. Department of Education, Director
- Digital Learning Group, LLC, an online publisher of college textbooks, Director
- Harvard Center for Blood Research,Trustee
- Bard College,Trustee
- YIVO Institute for Jewish Research,Trustee
No. of Portfolios for which Board Member Serves: 22
|
———————
Bert W.Wasserman (72) Board Member (1993)
Principal Occupation During Past 5 Years:
• Financial Consultant
Other Board Memberships and Affiliations:
• Lillian Vernon Corporation, Director
|
No. of Portfolios for which Board Member Serves: 22
|
———————
Once elected all Board Members serve for an indefinite term.The address of the Board Members and Officers is in c/o The Dreyfus Corporation, 200 Park Avenue, New York, New York 10166.Additional information about the Board Members is available in the fund’s Statement of Additional Information which can be obtained from Dreyfus free of charge by calling this toll free number: 1-800-554-4611.
John M. Fraser, Jr., Emeritus Board Member Irving Kristol, Emeritus Board Member
OFFICERS OF THE FUND (Unaudited)
| STEPHEN E. CANTER, President since | | MICHAEL A. ROSENBERG, Secretary since |
| March 2000. | | March 2000. |
| Chairman of the Board, Chief Executive | | Associate General Counsel of the Manager, |
| Officer and Chief Operating Officer of the | | and an officer of 90 investment companies |
| Manager, and an officer of 92 investment | | (comprised of 194 portfolios) managed by the |
| companies (comprised of 185 portfolios) | | Manager. He is 44 years old and has been an |
| managed by the Manager. Mr. Canter also is a | | employee of the Manager since October 1991. |
| |
| Board member and, where applicable, an | | ROBERT R. MULLERY, Assistant Secretary |
| Executive Committee Member of the other | | since March 2000. |
| investment management subsidiaries of Mellon | | |
| Financial Corporation, each of which is an | | Associate General Counsel of the Manager, |
| affiliate of the Manager. He is 59 years old and | | and an officer of 26 investment companies |
| has been an employee of the Manager since | | (comprised of 60 portfolios) managed by the |
| May 1995. | | Manager. He is 52 years old and has been an |
| | | employee of the Manager since May 1986. |
| STEPHEN R. BYERS, Executive Vice | | |
| President since November 2002. | | STEVEN F. NEWMAN, Assistant Secretary |
| | | since March 2000. |
| Chief Investment Officer,Vice Chairman and a | | |
| director of the Manager, and an officer of 92 | | Associate General Counsel and Assistant |
| investment companies (comprised of 185 | | Secretary of the Manager, and an officer of 93 |
| portfolios) managed by the Manager. Mr. Byers | �� | investment companies (comprised of 201 |
| also is an officer, director or an Executive | | portfolios) managed by the Manager. He is 55 |
| Committee Member of certain other | | years old and has been an employee of the |
| investment management subsidiaries of Mellon | | Manager since July 1980. |
| Financial Corporation, each of which is an | | JAMES WINDELS, Treasurer since |
| affiliate of the Manager. He is 51 years old and | | November 2001. |
| has been an employee of the Manager since | | |
| January 2000. Prior to joining the Manager, he | | Director – Mutual Fund Accounting of the |
| served as an Executive Vice President-Capital | | Manager, and an officer of 93 investment |
| Markets, Chief Financial Officer and Treasurer | | companies (comprised of 201 portfolios) |
| at Gruntal & Co., L.L.C. | | managed by the Manager. He is 46 years old |
| | | and has been an employee of the Manager |
| MARK N. JACOBS, Vice President since | | since April 1985. |
| March 2000. | | |
| | | RICHARD CASSARO, Assistant Treasurer |
| Executive Vice President, Secretary and | | since August 2003. |
| General Counsel of the Manager, and an | | |
| officer of 93 investment companies (comprised | | Senior Accounting Manager – Equity Funds of |
| of 201 portfolios) managed by the Manager. | | the Manager, and an officer of 26 investment |
| He is 58 years old and has been an employee | | companies (comprised of 102 portfolios) |
| of the Manager since June 1977. | | managed by the Manager. He is 44 years old |
| | | and has been an employee of the Manager |
| | | since September 1982. |
The Portfolio 35
OFFICERS OF THE FUND (Unaudited) (continued)
| ERIK D. NAVILOFF, Assistant Treasurer | | JOSEPH W. CONNOLLY, Chief Compliance |
| since December 2002. | | Officer since October 2004. |
| Senior Accounting Manager – Taxable Fixed | | Chief Compliance Officer of the Manager and |
| Income Funds of the Manager, and an officer | | The Dreyfus Family of Funds (93 investment |
| of 19 investment companies (comprised of 75 | | companies, comprising 201 portfolios). From |
| portfolios) managed by the Manager. He is 36 | | November 2001 through March 2004, Mr. |
| years old and has been an employee of the | | Connolly was first Vice-President, Mutual Fund |
| Manager since November 1992. | | Servicing for Mellon Global Securities |
| |
| ROBERT ROBOL, Assistant Treasurer | | Services. In that capacity, Mr. Connolly was |
| since August 2003. | | responsible for managing Mellon’s Custody, |
| | | Fund Accounting and Fund Administration |
| Senior Accounting Manager – Money Market | | services to third-party mutual fund clients. He |
| Funds of the Manager, and an officer of 39 | | is 47 years old and has served in various |
| investment companies (comprised of 84 | | capacities with the Manager since 1980, |
| portfolios) managed by the Manager. He is 40 | | including manager of the firm’s Fund |
| years old and has been an employee of the | | Accounting Department from 1997 through |
| Manager since October 1988. | | October 2001. |
| |
| ROBERT SVAGNA, Assistant Treasurer | | WILLIAM GERMENIS, Anti-Money |
| since December 2002. | | Laundering Compliance Officer since |
| Senior Accounting Manager – Equity Funds of | | September 2002. |
| the Manager, and an officer of 27 investment | | Vice President and Anti-Money Laundering |
| companies (comprised of 107 portfolios) | | Compliance Officer of the Distributor, and the |
| managed by the Manager. He is 37 years old | | Anti-Money Laundering Compliance Officer |
| and has been an employee of the Manager | | of 88 investment companies (comprised of 196 |
| since November 1990. | | portfolios) managed by the Manager. He is 34 |
| KENNETH J. SANDGREN, Assistant | | years old and has been an employee of the |
| Treasurer since November 2001. | | Distributor since October 1998. |
| Mutual Funds Tax Director of the Manager, | | |
| and an officer of 93 investment companies | | |
| (comprised of 201 portfolios) managed by the | | |
| Manager. He is 50 years old and has been an | | |
| employee of the Manager since June 1993. | | |
36
For More Information
| Dreyfus Variable | | Transfer Agent & |
| |
| Investment Fund, | | Dividend Disbursing Agent |
| |
| Small Company Stock Portfolio |
| | | Dreyfus Transfer, Inc. |
| 200 Park Avenue | | |
| | | 200 Park Avenue |
| New York, NY 10166 | | |
| | | New York, NY 10166 |
| |
| |
| Investment Adviser | | Distributor |
| |
| The Dreyfus Corporation | | |
| | | Dreyfus Service Corporation |
| 200 Park Avenue | | |
| | | 200 Park Avenue |
| New York, NY 10166 | | |
| | | New York, NY 10166 |
| |
| Custodian | | |
| |
| Mellon Bank, N.A. | | |
| |
| One Mellon Bank Center | | |
| |
| Pittsburgh, PA 15258 | | |
Telephone 1-800-554-4611 or 516-338-3300
Mail The Dreyfus Family of Funds, 144 Glenn Curtiss Boulevard, Uniondale, NY 11556-0144 Attn: Institutional Servicing
The portfolio files its complete schedule of portfolio holdings with the Securities and
Exchange Commission (“SEC”) for the first and third quarters of each fiscal year on Form N-Q. The portfolio’s Forms N-Q are available on the SEC’s website at http://www.sec.gov and may be reviewed and copied at the SEC’s Public Reference Room in Washington, DC. Information on the operation of the Public Reference Room may be obtained by calling 1-800-SEC-0330.
A description of the policies and procedures that the portfolio uses to determine how to vote proxies relating to portfolio securities, and information regarding how the portfolio voted these proxies for the 12-month period ended June 30, 2004, is available through the portfolio’s website at http://www.dreyfus.com and on the SEC’s website at http://www.sec.gov. The description of the policies and procedures is also available without charge, upon request, by calling 1-800-645-6561.

© 2005 Dreyfus Service Corporation
| Dreyfus Variable |
| Investment Fund, |
| Special Value Portfolio |
ANNUAL REPORT December 31, 2004

The views expressed in this report reflect those of the portfolio manager only through the end of the period covered and do not necessarily represent the views of Dreyfus or any other person in the Dreyfus organization.Any such views are subject to change at any time based upon market or other conditions and Dreyfus disclaims any responsibility to update such views. These views may not be relied on as investment advice and, because investment decisions for a Dreyfus portfolio are based on numerous factors, may not be relied on as an indication of trading intent on behalf of any Dreyfus portfolio.
Not FDIC-Insured • Not Bank-Guaranteed • May Lose Value
| | | Contents |
| |
| | | T H E P O R T F O L I O |
| |
|
| 2 | | Letter from the Chairman |
| 3 | | Discussion of Performance |
| 6 | | Portfolio Performance |
| 8 | | Understanding Your Portfolio’s Expenses |
| 8 | | Comparing Your Portfolio’s Expenses |
| | | With Those of Other Funds |
| 9 | | Statement of Investments |
| 13 | | Statement of Assets and Liabilities |
| 14 | | Statement of Operations |
| 15 | | Statement of Changes in Net Assets |
| 17 | | Financial Highlights |
| 19 | | Notes to Financial Statements |
| 26 | | Report of Independent Registered |
| | | Public Accounting Firm |
| 27 | | Important Tax Information |
| 28 | | Board Members Information |
| 30 | | Officers of the Fund |
| | | F O R M O R E I N F O R M AT I O N |
| |
|
| | | Back Cover |
Dreyfus Variable Investment Fund,
Special Value Portfolio
The Portfolio

LETTER FROM THE CHAIRMAN
We are pleased to present this annual report for Dreyfus Variable Investment Fund, Special Value Portfolio, covering the 12-month period from January 1, 2004, through December 31, 2004. Inside, you’ll find valuable information about how the portfolio was managed during the reporting period, including a discussion with portfolio managers Mark G. DeFranco and Brian M. Gillott of Jennison Associates LLC, the portfolio’s sub-investment adviser.
2004 represented the second consecutive year of positive stock market performance. Unlike the 2003 rally, however, in which most stocks rose as general business conditions improved,2004’s market performance largely reflected the strengths and weaknesses of individual companies and industries. As a result, fundamental research and professional judgment became more important determinants of mutual fund performance in 2004.
What’s ahead for stocks in 2005? No one knows for certain.Positive influences remain in place, including moderately expanding U.S. and global economies and low inflation. Nonetheless, a number of risks — such as rising short-term interest rates, currency fluctuations and generally slowing corporate earnings — could threaten the market environment.
As always, we urge our shareholders to view the stock market from a long-term perspective, measured in years rather than weeks or months. One of the best ways to ensure a long-term perspective is to establish an investment plan with the help of your financial advisor, and review it periodically to track your progress toward your financial goals.
Thank you for your continued confidence and support.

| Stephen E. Canter |
| Chairman and Chief Executive Officer |
| The Dreyfus Corporation |

DISCUSSION OF PERFORMANCE
Mark G. DeFranco and Brian M. Gillott, Portfolio Managers Jennison Associates LLC, Sub-Investment Adviser
How did Dreyfus Variable Investment Fund, Special Value Portfolio perform relative to its benchmark?
For the 12-month period ended December 31, 2004, the portfolio produced total returns of 13.08% for its Initial shares and 12.96% for its Service shares.1 For the same period, the total return of the Russell 1000 Value Index (the “Index”), the portfolio’s benchmark, was 16.49% .2
After relatively lackluster performance for much of 2004, stocks rallied late in the year when uncertainty related to the U.S. presidential election dissipated.The value-oriented, midcap stocks that comprise the Index fared particularly well. The portfolio’s returns lagged its benchmark, primarily due to disappointing results from a handful of individual stocks in the media industry and other areas.
What is the portfolio’s investment approach?
The portfolio seeks to maximize total return, consisting of capital appreciation and current income. To pursue this goal, the portfolio normally invests at least 80% of its assets in stocks.The portfolio’s stock investments may include common stocks, preferred stocks and convertible securities of both U.S. and foreign companies of any size, including those purchased in initial public offerings or shortly thereafter.
The portfolio managers seek to identify attractively valued companies with current or emerging earnings growth that may not be fully recognized or appreciated by the market. Generally, there are two types of companies which may exhibit the characteristics the portfolio managers are seeking.The first type is a company that is out of favor with investors but which the portfolio managers expect will experience an improved earnings cycle over the next 12 to 18 months due to corporate restructuring, new product development, an industry cycle turn, increased management focus on shareholder value or improving balance sheet and cash flow.The second type is a company currently delivering good growth characteristics but which the portfolio managers believe is being mispriced by the market based on short-term
DISCUSSION OF PERFORMANCE (continued)
|
earnings results relative to “street” expectations or market uncertainty regarding the sustainability of earnings growth.
What other factors influenced the portfolio’s performance?
The portfolio was positively influenced by a strengthening global economy, including China’s transformation from a third-world country into a major industrial trading partner. China’s torrid growth sparked greater demand for basic materials and energy, which benefited the portfolio’s holdings in the chemicals, metals and mining, and energy equipment and services industries. For example, the drilling equipment manufacturer National Oilwell saw demand for its products improve as oil and gas prices surged. Brazilian mining company Companhia Vale do Rio Doce enjoyed greater pricing power as demand rose for iron ore. Similarly, Lyondell Chemical posted gains as demand for performance and specialty chemicals intensified in the manufacturing, agriculture and consumer-related industry groups.
The portfolio’s investments in the financials, industrials, health care and information technology sectors also contributed positively to its total return. In fact, the top contributor to the portfolio’s 2004 results was computer security company McAfee, which benefited from a renewed focus on anti-virus software and took market share from its main competitor. In the health care sector, pharmacy benefits manager Medco Health Solutions performed well when it signed more new business than expected.The financials sector provided strong results from financial products distributor National Financial Partners and asset manager Eaton Vance. The consumer discretionary area was the only sector in the portfolio that finished the year with negative absolute returns, mainly due to weakness among a small number of media stocks. Nonetheless, the portfolio enjoyed good results from its investment in apparel and luxury goods seller Polo Ralph Lauren, which enjoyed strong growth in its retail and wholesale divisions.
Harmony Gold Mining Co. represented the portfolio’s greatest single detractor from performance, accounting for a significant portion of its lagging performance relative to the Index. The South African gold producer was hurt by the effects of local currency fluctuations on its cost structure and profit margins. Results also were constrained by disappointing returns from media holdings — including diversified media
conglomerate Viacom, advertising leader Interpublic Group of Companies and radio programmer Westwood One — caused by a lackluster recovery in advertising spending. In the health care area, the stock of pharmaceutical giant Pfizer lost value when safety-related concerns arose regarding arthritis drug Celebrex.
What is the portfolio’s current strategy?
Our disciplined, bottom-up security selection strategy has continued to help us identify stocks that we expect to benefit from company-specific catalysts but may have been overlooked during the recent market rally. For example, despite higher stock prices for materials companies serving the Chinese market, we have continued to find favorable supply-and-demand fundamentals for many companies in this diverse sector. On the other hand, we reduced the portfolio’s holdings of energy-related companies after they rose to prices we considered fully valued. In all areas of the market, we believe that the ability to identify growing, reasonably valued individual companies — instead of following broader economic or market trends — has become a more important key to successful investing in today’s stock market.
| | | The portfolio is only available as a funding vehicle under variable life insurance policies or variable |
| | | annuity contracts issued by insurance companies. Individuals may not purchase shares of the |
| | | portfolio directly.A variable annuity is an insurance contract issued by an insurance company that |
| | | enables investors to accumulate assets on a tax-deferred basis for retirement or other long-term |
| | | goals.The investment objective and policies of Dreyfus Variable Investment Fund, Special Value |
| | | Portfolio made available through insurance products may be similar to other funds/portfolios |
| | | managed or advised by Dreyfus. However, the investment results of the portfolio may be higher or |
| | | lower than, and may not be comparable to, those of any other Dreyfus fund/portfolio. |
| 1 | | Total return includes reinvestment of dividends and any capital gains paid. Past performance is no |
| | | guarantee of future results. Share price and investment return fluctuate such that upon redemption, |
| | | portfolio shares may be worth more or less than their original cost.The portfolio’s performance does |
| | | not reflect the deduction of additional charges and expenses imposed in connection with investing |
| | | in variable insurance contracts, which will reduce returns. Return figures provided reflect the |
| | | absorption of portfolio expenses by The Dreyfus Corporation pursuant to an agreement in effect |
| | | through December 31, 2005, at which time it may be extended, terminated or modified. Had |
| | | these expenses not been absorbed, the portfolio’s returns would have been lower. |
| | | Part of the portfolio’s recent performance is attributable to positive returns from its initial |
| | | public offering (IPO) investments.There can be no guarantee that IPOs will have or |
| | | continue to have a positive effect on the portfolio’s performance. |
| 2 | | SOURCE: LIPPER INC. — Reflects the reinvestment of dividends and, where applicable, |
| | | capital gain distributions.The Russell 1000 Value Index is an unmanaged index which measures |
| | | the performance of those Russell 1000 companies with lower price-to-book ratios and lower |
| | | forecasted growth values. |
The Portfolio 5
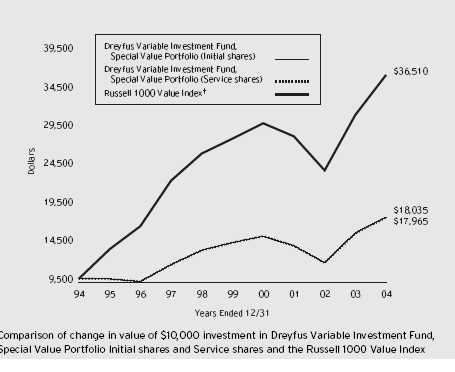
| Average Annual Total Returns as of | | 12/31/04 | | | | |
| |
| | | 1 Year | | 5 Years | | 10 Years |
| |
| |
| |
|
| Initial shares | | 13.08% | | 4.19% | | 6.07% |
| Service shares | | 12.96% | | 4.11% | | 6.03% |
| |
| The data for Service shares includes the results of Initial shares for the period prior to December 31, 2000 |
| (inception date of Service shares). Actual Service shares’ average annual total return and hypothetical growth |
| results would have been lower. See notes below. | | | | | | |
| † Source: Lipper Inc. | | | | | | |
| Past performance is not predictive of future performance.The portfolio’s performance shown in the graph and table does not |
| reflect the deduction of taxes that a shareholder would pay on portfolio distributions or the redemption of portfolio shares. |
| Part of the portfolio’s recent performance is attributable to positive returns from its initial public offering (IPO) investments. |
| There can be no guarantee that IPOs will have or continue to have a positive effect on the portfolio’s performance. |
| The portfolio’s performance does not reflect the deduction of additional charges and expenses imposed in |
| connection with investing in variable insurance contracts which will reduce returns. | | |
| The above graph compares a $10,000 investment made in Initial and Service shares of Dreyfus Variable Investment |
| Fund, Special Value Portfolio on 12/31/94 to a $10,000 investment made in the Russell 1000 Value Index |
| (the “Index”) on that date. | | | | | | |
6
The portfolio’s Initial shares are not subject to a Rule 12b-1 fee.The portfolio’s Service shares are subject to a 0.25% annual Rule 12b-1 fee.The performance figures for Service shares reflect the performance of the portfolio’s Initial shares from their inception date through December 30, 2000, and the performance of the portfolio’s Service shares from December 31, 2000 (inception date of Service shares) to December 31, 2004 (blended performance figures).The performance figures for each share class reflect certain expense reimbursements, without which the performance of each share class would have been lower. In addition, the blended performance figures have not been adjusted to reflect the higher operating expenses of the Service shares. If these expenses had been reflected, the blended performance figures would have been lower. All dividends and capital gain distributions are reinvested.
The portfolio’s performance shown in the line graph takes into account all applicable portfolio fees and expenses (after any expense reimbursements).The Index is an unmanaged index which measures the performance of those Russell 1000 companies with lower price-to-book ratios and lower forecasted growth values.The Index does not take into account charges, fees and other expenses. Further information relating to portfolio performance, including expense reimbursements, if applicable, is contained in the Financial Highlights section of the prospectus and elsewhere in this report.
As a mutual fund investor,you pay ongoing expenses,such as management fees and other expenses.Using the information below,you can estimate how these expenses affect your investment and compare them with the expenses of other funds.You also may pay one-time transaction expenses,including sales charges (loads) and redemption fees, which are not shown in this section and would have resulted in higher total expenses. For more information, see your portfolio’s prospectus or talk to your financial adviser.
Review your portfolio’s expenses
|
The table below shows the expenses you would have paid on a $1,000 investment in Dreyfus Variable Investment Fund, Special Value Portfolio from July 1, 2004 to December 31, 2004. It also shows how much a $1,000 investment would be worth at the close of the period, assuming actual returns and expenses.
| Expenses and Value of a $1,000 Investment | | |
| assuming actual returns for the six months ended December 31, 2004 |
| | | Initial Shares | | Service Shares |
| |
| |
|
| Expenses paid per $1,000 † | | $ 4.61 | | $ 5.24 |
| Ending value (after expenses) | | $1,085.60 | | $1,085.00 |
COMPARING YOUR PORTFOLIO’S EXPENSES WITH THOSE OF OTHER FUNDS (Unaudited)
Using the SEC’s method to compare expenses
The Securities and Exchange Commission (SEC) has established guidelines to help investors assess fund expenses. Per these guidelines, the table below shows your portfolio’s expenses based on a $1,000 investment, assuming a hypothetical 5% annualized return. You can use this information to compare the ongoing expenses (but not transaction expenses or total cost) of investing in the portfolio with those of other funds. All mutual fund shareholder reports will provide this information to help you make this comparison. Please note that you cannot use this information to estimate your actual ending account balance and expenses paid during the period.
Expenses and Value of a $1,000 Investment assuming a hypothetical 5% annualized return for the six months ended December 31, 2004
| | | Initial Shares | | Service Shares |
| |
| |
|
| Expenses paid per $1,000 † | | $ 4.47 | | $ 5.08 |
| Ending value (after expenses) | | $1,020.71 | | $1,020.11 |
† Expenses are equal to the portfolio’s annualized expense ratio of .88% for Initial shares and 1.00% for Service shares, multiplied by the average account value over the period, multiplied by 184/366 (to reflect the one-half year period).
STATEMENT OF INVESTMENTS
December 31, 2004
|
| Common Stocks—93.2% | | Shares | | Value ($) |
| |
| |
|
| Aerospace & Defense—.2% | | | | |
| Lockheed Martin | | 1,300 | | 72,215 |
| Biotechnology—1.0% | | | | |
| MedImmune | | 13,000 a | | 352,430 |
| Capital Markets—9.1% | | | | |
| Bank of New York | | 32,100 | | 1,072,782 |
| Eaton Vance | | 11,400 | | 594,510 |
| Janus Capital Group | | 32,200 | | 541,282 |
| Merrill Lynch | | 7,200 | | 430,344 |
| National Financial Partners | | 4,200 | | 162,960 |
| Schwab (Charles) | | 25,300 | | 302,588 |
| | | | | 3,104,466 |
| Chemicals—9.0% | | | | |
| du Pont (EI) de Nemours | | 15,300 | | 750,465 |
| Great Lakes Chemical | | 23,700 | | 675,213 |
| Lyondell Chemical | | 17,700 | | 511,884 |
| Nalco | | 22,300 a | | 435,296 |
| Olin | | 23,200 | | 510,864 |
| Terra Industries | | 25,300 a,c | | 213,431 |
| | | | | 3,097,153 |
| Commercial Services & Supplies—5.7% | | | | |
| Education Management | | 9,000 a | | 297,090 |
| Hewitt Associates, Cl. A | | 15,700 a | | 502,557 |
| ITT Educational Services | | 10,900 a | | 518,295 |
| Manpower | | 12,800 | | 618,240 |
| | | | | 1,936,182 |
| Communications Equipment—1.0% | | | | |
| Nokia Oyj, ADR | | 21,400 | | 335,338 |
| Diversified Financial Services—4.4% | | | | |
| Assured Guaranty | | 25,500 | | 501,585 |
| J.P. Morgan Chase & Co. | | 10,136 | | 395,405 |
| Principal Financial Group | | 15,200 | | 622,288 |
| | | | | 1,519,278 |
| Diversified Telecommunications—2.3% | | | | |
| IDT, Cl. B | | 12,100 a | | 187,308 |
| SBC Communications | | 22,900 | | 590,133 |
| | | | | 777,441 |
The Portfolio 9
S T A T E M E N T O F I N V E S T M E N T S (continued)
| Common Stocks (continued) | | Shares | | | | Value ($) |
| |
| |
| |
|
| Electronic Equipment & Instruments—2.9% | | | | |
| Agilent Technologies | | 14,800 | | a | | 356,680 |
| Symbol Technologies | | 37,700 | | | | 652,210 |
| | | | | | | 1,008,890 |
| Energy Equipment & Services—7.5% | | | | |
| Cooper Cameron | | 14,400 | | a | | 774,864 |
| National-Oilwell | | 7,900 | | a | | 278,791 |
| Rowan Cos. | | 23,900 | | a | | 619,010 |
| Schlumberger | | 10,400 | | | | 696,280 |
| Todco, Cl. A | | 11,500 | | a | | 211,830 |
| | | | | | | 2,580,775 |
| Food & Staples Retailing—1.9% | | | | | | |
| Kroger | | 37,500 | | a | | 657,750 |
| Healthcare Providers & Services—6.1% | | | | |
| CIGNA | | 6,900 | | | | 562,833 |
| Community Health Systems | | 8,300 | | a | | 231,404 |
| Medco Health Solutions | | 20,300 | | a | | 844,480 |
| Tenet Healthcare | | 41,400 | | a | | 454,572 |
| | | | | | | 2,093,289 |
| Household Products—.7% | | | | | | |
| Kimberly-Clark | | 3,700 | | | | 243,497 |
| Insurance—9.0% | | | | | | |
| Axis Capital Holdings | | 20,400 | | | | 558,144 |
| Conseco | | 20,900 | | a | | 416,955 |
| UnumProvident | | 46,000 | | | | 825,240 |
| Willis Group Holdings | | 11,700 | | | | 481,689 |
| XL Capital, Cl. A | | 10,300 | | | | 799,795 |
| �� | | | | | | 3,081,823 |
| Internet & Catalog Retail—1.5% | | | | | | |
| IAC/InterActive | | 19,100 | | a | | 527,542 |
| Machinery—1.1% | | | | | | |
| Navistar International | | 8,200 | | a | | 360,636 |
| Media—7.6% | | | | | | |
| DIRECTV Group | | 34,300 | | a | | 574,182 |
| Interpublic Group of Companies | | 34,600 | | a | | 463,640 |
| Radio One, Cl. D | | 25,200 | | a | | 406,224 |
| Common Stocks (continued) | | Shares | | Value ($) |
| |
| |
|
| Media (continued) | | | | |
| Viacom, Cl. B | | 14,274 | | 519,431 |
| Westwood One | | 24,400 a | | 657,092 |
| | | | | 2,620,569 |
| Metals & Mining—6.4% | | | | |
| Alcoa | | 20,800 | | 653,536 |
| Aluminum of China, ADR | | 7,000 | | 409,850 |
| Companhia Vale do Rio Doce, ADR | | 15,900 | | 461,259 |
| GrafTech International | | 21,600 a | | 204,336 |
| Harmony Gold Mining Co., ADR | | 51,000 | | 472,770 |
| | | | | 2,201,751 |
| Multi-Utilities—.6% | | | | |
| Aquila | | 54,200 a | | 199,998 |
| Paper & Forest Products—3.0% | | | | |
| International Paper | | 13,500 | | 567,000 |
| MeadWestvaco | | 13,100 | | 443,959 |
| | | | | 1,010,959 |
| Pharmaceuticals—4.4% | | | | |
| Eli Lilly & Co. | | 6,500 | | 368,875 |
| GlaxoSmithKline, ADR | | 9,100 | | 431,249 |
| Merck & Co. | | 13,700 | | 440,318 |
| Watson Pharmaceuticals | | 7,900 a | | 259,199 |
| | | | | 1,499,641 |
| Road & Rail—1.5% | | | | |
| CSX | | 12,500 | | 501,000 |
| Software—3.8% | | | | |
| Manhattan Associates | | 17,100 a | | 408,348 |
| Microsoft | | 32,800 | | 876,088 |
| | | | | 1,284,436 |
| Specialty Retail—1.4% | | | | |
| Toys “R” Us | | 23,600 a | | 483,092 |
| Textiles, Apparel & Luxury Goods—1.1% | | |
| Polo Ralph Lauren | | 8,900 | | 379,140 |
| Total Common Stocks | | | | |
| (cost $27,192,276) | | | | 31,929,291 |
S T A T E M E N T O F I N V E S T M E N T S (continued)
| Other Investments—7.5% | | | | Shares | | Value ($) |
| |
| |
| |
|
| Registered Investment Company: | | | | | | |
| Dreyfus Institutional Preferred | | | | | | |
| Plus Money Market Fund | | | | | | | | |
| (cost $2,561,000) | | | | 2,561,000 b | | 2,561,000 |
| |
| |
| |
|
| |
| Total Investments (cost $29,753,276) | | 100.7% | | 34,490,291 |
| |
| Liabilities, Less Cash and Receivables | | | | (.7%) | | (225,969) |
| |
| Net Assets | | | | 100.0% | | 34,264,322 |
| |
| ADR—American Depository Receipts | | | | | | |
| a | | Non-income producing. | | | | | | | | |
| b | | Investment in affiliated money market mutual fund. | | | | | | |
| c | | Securities restricted as to public resale. Investment in restricted securities with an aggregate market value of $213,431 |
| | | representing approximately .62% of net assets (see below). | | | | | | |
| |
| | | | | Acquisition | | Purchase | | | | |
| Issuer | | Date | | Price ($) | | Valuation ($) † |
| |
| |
| |
|
| Terra Industries | | 12/14/2004 | | 7.50 | | 8.44 per share |
| |
| † | | The valuation of these securities has been determined in good faith under the direction of the Board of Trustees. |
| |
|
| |
| |
| |
| Portfolio Summary † | | | | | | | | |
| | | | | Value (%) | | | | | | Value (%) |
| |
| |
| |
| |
| |
|
| Capital Markets | | 9.1 | | Healthcare Providers & Services | | 6.1 |
| Chemicals | | 9.0 | | Commercial Services & Supplies | | 5.7 |
| Insurance | | 9.0 | | Diversified Financial Services | | 4.4 |
| Media | | 7.6 | | Pharmaceuticals | | | | 4.4 |
| Energy Equipment & Services | | 7.5 | | Other | | | | 24.0 |
| Money Market Investments | | 7.5 | | | | | | |
| Metals & Mining | | 6.4 | | | | | | 100.7 |
| |
| † | | Based on net assets. | | | | | | | | |
| See notes to financial statements. | | | | | | | | |
STATEMENT OF ASSETS AND LIABILITIES
December 31, 2004
| | | Cost | | Value |
| |
| |
|
| Assets ($): | | | | |
| Investments in securities—See Statement of Investments | | |
| Unaffiliated issuers | | 27,192,276 | | 31,929,291 |
| Affiliated issuers | | 2,561,000 | | 2,561,000 |
| Cash | | | | 1,152 |
| Receivable for investment securities sold | | 259,270 |
| Dividends receivable | | | | 24,858 |
| | | | | 34,775,571 |
| |
| |
|
| Liabilities ($): | | | | |
| Due to The Dreyfus Corporation and affiliates—Note 3(b) | | 22,582 |
| Payable for investment securities purchased | | 441,171 |
| Payable for shares of Beneficial Interest redeemed | | 9,109 |
| Accrued expenses | | | | 38,387 |
| | | | | 511,249 |
| |
| |
|
| Net Assets ($) | | | | 34,264,322 |
| |
| |
|
| Composition of Net Assets ($): | | | | |
| Paid-in capital | | | | 28,740,808 |
| Accumulated undistributed investment income—net | | 35,889 |
| Accumulated net realized gain (loss) on investments | | 750,610 |
| Accumulated net unrealized appreciation | | |
| (depreciation) on investments | | | | 4,737,015 |
| |
| |
|
| Net Assets ($) | | | | 34,264,322 |
| |
| |
|
| |
| |
| Net Asset Value Per Share | | | | |
| | | Initial Shares | | Service Shares |
| |
| |
|
| Net Assets ($) | | 28,948,798 | | 5,315,524 |
| Shares Outstanding | | 1,978,947 | | 364,428 |
| |
| |
|
| Net Asset Value Per Share ($) | | 14.63 | | 14.59 |
See notes to financial statements.
|
STATEMENT OF OPERATIONS
Year Ended December 31, 2004
|
| Investment Income ($): | | |
| Income: | | |
| Cash dividends (net of $579 foreign taxes withheld at source): | | |
| Unaffiliated issuers | | 469,495 |
| Affiliated issuers | | 26,886 |
| Total Income | | 496,381 |
| Expenses: | | |
| Investment advisory fee—Note 3(a) | | 262,283 |
| Auditing fees | | 24,082 |
| Custodian fees | | 14,448 |
| Distribution fees—Note 3(b) | | 13,230 |
| Prospectus and shareholders’ reports | | 11,154 |
| Shareholder servicing costs—Note 3(b) | | 7,541 |
| Trustees’ fees and expenses—Note 3(c) | | 3,604 |
| Legal fees | | 508 |
| Miscellaneous | | 2,362 |
| Total Expenses | | 339,212 |
| Less—waiver of fees due to undertaking—Note 3(a) | | (14,003) |
| Less—reduction in custody fees | | |
| due to earnings credits—Note 1(b) | | (76) |
| Net Expenses | | 325,133 |
| Investment Income—Net | | 171,248 |
| |
|
| Realized and Unrealized Gain (Loss) on Investments—Note 4 ($): |
| Net realized gain (loss) on investments | | 4,777,637 |
| Net unrealized appreciation (depreciation) on investments | | (866,908) |
| Net Realized and Unrealized Gain (Loss) on Investments | | 3,910,729 |
| Net Increase in Net Assets Resulting from Operations | | 4,081,977 |
See notes to financial statements.
|
STATEMENT OF CHANGES IN NET ASSETS
| | | Year Ended December 31, |
| |
|
| | | 2004 | | 2003 |
| |
| |
|
| Operations ($): | | | | |
| Investment income—net | | 171,248 | | 72,657 |
| Net realized gain (loss) on investments | | 4,777,637 | | 2,539,286 |
| Net unrealized appreciation | | | | |
| (depreciation) on investments | | (866,908) | | 6,258,934 |
| Net Increase (Decrease) in Net Assets | | | | |
| Resulting from Operations | | 4,081,977 | | 8,870,877 |
| |
| |
|
| Dividends to Shareholders from ($): | | | | |
| Investment income—net: | | | | |
| Initial shares | | (178,813) | | (257,277) |
| Service shares | | (28,674) | | (38,181) |
| Net realized gain on investments: | | | | |
| Initial shares | | (2,756,165) | | — |
| Service shares | | (507,560) | | — |
| Total Dividends | | (3,471,212) | | (295,458) |
| |
| |
|
| Beneficial Interest Transactions ($): | | | | |
| Net proceeds from shares sold: | | | | |
| Initial shares | | 1,068,137 | | 1,681,630 |
| Service shares | | 713,100 | | 865,869 |
| Dividends reinvested: | | | | |
| Initial shares | | 2,934,978 | | 257,277 |
| Service shares | | 536,234 | | 38,181 |
| Cost of shares redeemed: | | | | |
| Initial shares | | (7,150,023) | | (5,035,050) |
| Service shares | | (1,201,875) | | (795,403) |
| Increase (Decrease) in Net Assets from | | | | |
| Beneficial Interest Transactions | | (3,099,449) | | (2,987,496) |
| Total Increase (Decrease) in Net Assets | | (2,488,684) | | 5,587,923 |
| |
| |
|
| Net Assets ($): | | | | |
| Beginning of Period | | 36,753,006 | | 31,165,083 |
| End of Period | | 34,264,322 | | 36,753,006 |
| Undistributed investment income—net | | 35,889 | | 72,128 |
STATEMENT OF CHANGES IN NET ASSETS (continued)
|
| | | Year Ended December 31, |
| |
|
| | | 2004 | | 2003 |
| |
| |
|
| Capital Share Transactions: | | | | |
| Initial Shares | | | | |
| Shares sold | | 71,441 | | 132,568 |
| Shares issued for dividends reinvested | | 200,454 | | 25,027 |
| Shares redeemed | | (485,958) | | (432,668) |
| Net Increase (Decrease) in Shares Outstanding | | (214,063) | | (275,073) |
| |
| |
|
| Service Shares | | | | |
| Shares sold | | 48,492 | | 72,043 |
| Shares issued for dividends reinvested | | 36,724 | | 3,725 |
| Shares redeemed | | (82,737) | | (68,650) |
| Net Increase (Decrease) in Shares Outstanding | | 2,479 | | 7,118 |
See notes to financial statements.
|
The following tables describe the performance for each share class for the fiscal periods indicated.All information (except portfolio turnover rate) reflects financial results for a single portfolio share.Total return shows how much your investment in the portfolio would have increased (or decreased) during each period, assuming you had reinvested all dividends and distributions.These figures have been derived from the portfolio’s financial statements.
| | | | | Year Ended December 31, | | |
| |
| |
| |
|
| Initial Shares | | 2004 | | 2003 | | 2002 | | 2001 | | 2000 |
| |
| |
| |
| |
| |
|
| Per Share Data ($): | | | | | | | | | | |
| Net asset value, beginning of period | | 14.39 | | 11.04 | | 13.07 | | 14.65 | | 14.64 |
| Investment Operations: | | | | | | | | | | |
| Investment income—net a | | .07 | | .03 | | .10 | | .14 | | .12 |
| Net realized and unrealized | | | | | | | | | | |
| gain (loss) on investments | | 1.82 | | 3.43 | | (2.09) | | (1.30) | | .70 |
| Total from Investment Operations | | 1.89 | | 3.46 | | (1.99) | | (1.16) | | .82 |
| Distributions: | | | | | | | | | | |
| Dividends from investment income—net | | (.10) | | (.11) | | (.04) | | (.11) | | (.14) |
| Dividends from net realized | | | | | | | | | | |
| gain on investments | | (1.55) | | — | | — | | (.31) | | (.67) |
| Total Distributions | | (1.65) | | (.11) | | (.04) | | (.42) | | (.81) |
| Net asset value, end of period | | 14.63 | | 14.39 | | 11.04 | | 13.07 | | 14.65 |
| |
| |
| |
| |
| |
|
| Total Return (%) | | 13.08 | | 31.74 | | (15.28) | | (7.97) | | 5.70 |
| |
| |
| |
| |
| |
|
| Ratios/Supplemental Data (%): | | | | | | | | | | |
| Ratio of total expenses | | | | | | | | | | |
| to average net assets | | .93 | | 1.01 | | .99 | | .91 | | .87 |
| Ratio of net expenses | | | | | | | | | | |
| to average net assets | | .91 | | .97 | | .92 | | .90 | | .87 |
| Ratio of net investment income | | | | | | | | | | |
| to average net assets | | .50 | | .23 | | .81 | | 1.00 | | .81 |
| Portfolio Turnover Rate | | 90.27 | | 108.01 | | 148.29 | | 59.85 | | 149.83 |
| |
| |
| |
| |
| |
|
| Net Assets, end of period ($ x 1,000) | | 28,949 | | 31,557 | | 27,255 | | 39,854 | | 50,671 |
| |
| a Based on average shares outstanding at each month end. | | | | | | | | |
| See notes to financial statements. | | | | | | | | | | |
FINANCIAL HIGHLIGHTS (continued)
|
| | | | | | | Year Ended December 31, | | |
| | | |
| |
| |
|
| Service Shares | | 2004 | | 2003 | | 2002 | | 2001 | | 2000 a |
| |
| |
| |
| |
| |
|
| Per Share Data ($): | | | | | | | | | | |
| Net asset value, beginning of period | | 14.36 | | 11.02 | | 13.05 | | 14.65 | | 14.65 |
| Investment Operations: | | | | | | | | | | |
| Investment income—net | | .06b | | .02b | | .08b | | .12b | | — |
| Net realized and unrealized | | | | | | | | | | |
| gain (loss) on investments | | 1.80 | | 3.43 | | (2.07) | | (1.31) | | — |
| Total from Investment Operations | | 1.86 | | 3.45 | | (1.99) | | (1.19) | | — |
| Distributions: | | | | | | | | | | |
| Dividends from investment income—net | | (.08) | | (.11) | | (.04) | | (.10) | | — |
| Dividends from net realized | | | | | | | | | | |
| gain on investments | | (1.55) | | — | | — | | (.31) | | — |
| Total Distributions | | (1.63) | | (.11) | | (.04) | | (.41) | | — |
| Net asset value, end of period | | 14.59 | | 14.36 | | 11.02 | | 13.05 | | 14.65 |
| |
| |
| |
| |
| |
|
| Total Return (%) | | 12.96 | | 31.71 | | (15.32) | | (8.17) | | — |
| |
| |
| |
| |
| |
|
| Ratios/Supplemental Data (%): | | | | | | | | | | |
| Ratio of total expenses | | | | | | | | | | |
| to average net assets | | 1.18 | | 1.27 | | 1.26 | | 1.24 | | — |
| Ratio of net expenses | | | | | | | | | | |
| to average net assets | | 1.00 | | 1.00 | | .99 | | 1.00 | | — |
| Ratio of net investment income | | | | | | | | | | |
| to average net assets | | .42 | | .21 | | .69 | | .92 | | — |
| Portfolio Turnover Rate | | 90.27 | | 108.01 | | 148.29 | | 59.85 | | 149.83 |
| |
| |
| |
| |
| |
|
| Net Assets, end of period ($ x 1,000) | | 5,316 | | 5,196 | | 3,910 | | 2,585 | | 1 |
| |
| a | | The portfolio commenced offering Service shares on December 31, 2000. | | | | | | |
| b | | Based on average shares outstanding at each month end. | | | | | | | | |
| See notes to financial statements. | | | | | | | | | | |
NOTES TO FINANCIAL STATEMENTS
NOTE 1—Significant Accounting Policies:
Dreyfus Variable Investment Fund (the “fund”) is registered under the Investment Company Act of 1940, as amended (the “Act”), as an open-end management investment company, operating as a series company currently offering twelve series, including the Special Value Portfolio (the “portfolio”). The portfolio is only offered to separate accounts established by insurance companies to fund variable annuity contracts and variable life insurance policies.The portfolio is a diversified series. The portfolio’s investment objective is to maximize total return, consisting of capital appreciation and current income. The Dreyfus Corporation (“Dreyfus”) serves as the portfolio’s investment adviser. Dreyfus is a wholly-owned subsidiary of Mellon Financial Corporation (“Mellon Financial”). Jennison Associates LLC (“Jennison”) serves as the portfolio’s sub-investment adviser.
Dreyfus Service Corporation (the “Distributor”), a wholly-owned subsidiary of Dreyfus, is the distributor of the portfolio’s shares, which are sold without a sales charge.The portfolio is authorized to issue an unlimited number of $.001 par value shares of Beneficial Interest in each of the following classes of shares: Initial and Service. Each class of shares has identical rights and privileges, except with respect to the distribution plan and the expenses borne by each class and certain voting rights. Income, expenses (other than expenses attributable to a specific class), and realized and unrealized gains or losses on investments are allocated to each class of shares based on its relative net assets.
The fund accounts separately for the assets, liabilities and operations of each series. Expenses directly attributable to each series are charged to that series’ operations; expenses which are applicable to all series are allocated among them on a pro rata basis.
The portfolio’s financial statements are prepared in accordance with U.S. generally accepted accounting principles, which may require the use of management estimates and assumptions.Actual results could differ from those estimates.
NOTES TO FINANCIAL STATEMENTS (continued)
|
The fund enters into contracts that contain a variety of indemnifica-tions.The portfolio’s maximum exposure under these arrangements is unknown. The portfolio does not anticipate recognizing any loss related to these arrangements.
(a) Portfolio valuation: Investments in securities are valued at the last sales price on the securities exchange or national securities market on which such securities are primarily traded. Securities listed on the National Market System for which market quotations are available are valued at the official closing price or, if there is no official closing price that day, at the last sales price. Securities not listed on an exchange or the national securities market, or securities for which there were no transactions, are valued at the average of the most recent bid and asked prices, except for open short positions, where the asked price is used for valuation purposes. Bid price is used when no asked price is available. Investments in registered investment companies are valued at their net asset value. When market quotations or official closing prices are not readily available, or are determined not to reflect accurately fair value, such as when the value of a security has been significantly affected by events after the close of the exchange or market on which the security is principally traded (for example, a foreign exchange or market), but before the portfolio calculates its net asset value, the portfolio may value these investments at fair value as determined in accordance with the procedures approved by the Board of Trustees. Fair valuing of securities may be determined with the assistance of a pricing service using calculations based on indices of domestic securities and other appropriate indicators, such as prices of relevant ADR’s and futures contracts. For other securities that are fair valued by the Board of Trustees, certain factors may be considered such as: fundamental analytical data, the nature and duration of restrictions on disposition, an evaluation of the forces that influence the market in which the securities are purchased and sold, and public trading in similar securities of the issuer or comparable issuers. Financial futures are valued at the last sales price.
(b) Foreign currency transactions: The portfolio does not isolate that portion of the results of operations resulting from changes in foreign
exchange rates on investments from the fluctuations arising from changes in market prices of securities held. Such fluctuations are included with the net realized and unrealized gain or loss on investments.
Net realized foreign exchange gains or losses arise from sales and maturities of short-term securities, sales of foreign currencies, currency gains or losses realized on securities transactions and the difference between the amounts of dividends, interest and foreign withholding taxes recorded on the portfolio’s books and the U.S. dollar equivalent of the amounts actually received or paid. Net unrealized foreign exchange gains or losses arise from changes in the value of assets and liabilities other than investments in securities, resulting from changes in exchange rates. Such gains and losses are included with net realized and unrealized gain or loss on investments.
(c) Securities transactions and investment income: Securities transactions are recorded on a trade date basis. Realized gain and loss from securities transactions are recorded on the identified cost basis. Dividend income is recognized on the ex-dividend date and interest income, including, where applicable, accretion of discount and amortization of premium on investments, is recognized on the accrual basis.
The portfolio has an arrangement with the custodian bank whereby the portfolio receives earnings credits from the custodian when positive cash balances are maintained, which are used to offset custody fees. For financial reporting purposes, the portfolio includes net earnings credits as an expense offset in the Statement of Operations.
(d) Affiliated issuers: Investments in other investment companies advised by Dreyfus are defined as “affiliated” in the Act.
(e) Dividends to shareholders: Dividends are recorded on the ex-dividend date. Dividends from investment income-net and dividends from net realized capital gain, if any, are normally declared and paid annually, but the portfolio may make distributions on a more frequent basis to comply with the distribution requirements of the Internal Revenue Code of 1986, as amended (the “Code”).To the extent that net realized
NOTES TO FINANCIAL STATEMENTS (continued)
|
capital gain can be offset by capital loss carryovers, it is the policy of the portfolio not to distribute such gain. Income and capital gain distributions are determined in accordance with income tax regulations, which may differ from U.S. generally accepted accounting principles.
(f) Federal income taxes: It is the policy of the portfolio to continue to qualify as a regulated investment company, if such qualification is in the best interests of its shareholders, by complying with the applicable provisions of the Code, and to make distributions of taxable income sufficient to relieve it from substantially all federal income and excise taxes.
At December 31, 2004, the components of accumulated earnings on a tax basis were as follows: undistributed ordinary income $474,816, undistributed capital gains $412,245 and unrealized appreciation $4,636,453.
The tax character of distributions paid to shareholders during the fiscal periods ended December 31, 2004 and December 31, 2003, were as follows: ordinary income $1,237,803 and $295,458 and long-term capital gain $2,233,409 and $0, respectively.
NOTE 2—Bank Lines of Credit:
|
The portfolio may borrow up to $5 million for leveraging purposes under a short-term unsecured line of credit and participates with other Dreyfus managed funds in a $100 million unsecured line of credit primarily to be utilized for temporary or emergency purposes including the financing of redemptions. Interest is charged to the portfolio based on prevailing market rates in effect at the time of borrowings. During the period ended December 31, 2004, the portfolio did not borrow under either line of credit.
NOTE 3—Investment Advisory Fee and Other Transactions With Affiliates:
(a) Pursuant to an Investment Advisory Agreement with Dreyfus, the investment advisory fee is computed at the annual rate of .75 of 1% of the value of the portfolio’s average daily net assets and is payable monthly.
Pursuant to a Sub-Investment Advisory Agreement between Dreyfus and Jennison, the sub-investment advisory fee is payable monthly by Dreyfus, and is based upon the value of the portfolio’s average daily net assets, computed at the following annual rates: .50 of 1% of the first $300 million and .45 of 1% over $300 million.
Dreyfus has agreed, from January 1, 2004 to December 31, 2005 to waive receipt of its fees and/or assume the expenses of the portfolio so that the expenses of neither class, exclusive of taxes, brokerage commissions, interest expense and extraordinary expenses, exceed 1% of the value of the average daily net assets of their class. During the period ended December 31, 2004, Dreyfus waived receipt of fees of $14,003, pursuant to the undertaking.
(b) Under the Distribution Plan (the “Plan”) adopted pursuant to Rule 12b-1 under the Act, Service shares pay the Distributor for distributing their shares, for servicing and/or maintaining Service shares shareholder accounts and for advertising and marketing for Service shares.The Plan provides for payments to be made at an annual rate of .25 of 1% of the value of the Service shares’ average daily net assets.The Distributor may make payments to Participating Insurance Companies and to brokers and dealers acting as principal underwriter for their variable insurance products.The fees payable under the Plan are payable without regard to actual expenses incurred. During the period ended December 31, 2004, Service shares were charged $13,230 pursuant to the Plan.
The portfolio compensates Dreyfus Transfer, Inc., a wholly-owned subsidiary of Dreyfus, under a transfer agency agreement for providing personnel and facilities to perform transfer agency services for the portfolio. During the period ended December 31, 2004, the portfolio was charged $64 pursuant to the transfer agency agreement.
The components of Due to The Dreyfus Corporation and affiliates in the Statement of Assets and Liabilities consist of: investment advisory fees $21,494, Rule 12b-1 distribution plan fees $1,107, and transfer
NOTES TO FINANCIAL STATEMENTS (continued)
|
agency per account fees $10, which are offset against an expense reimbursement currently in effect in the amount of $29.
(c) Each Board member also serves as a Board member of other funds within the Dreyfus complex. Annual retainer fees and attendance fees are allocated to each fund based on net assets.
(d) Pursuant to an exemptive order from the Securities and Exchange Commission, the portfolio may invest its available cash balances in affiliated money market mutual funds. Management fees of the underlying money market mutual funds have been waived by Dreyfus.
NOTE 4—Securities Transactions:
|
The aggregate amount of purchases and sales of investment securities, excluding short-term securities, during the period ended December 31, 2004, amounted to $29,710,169 and $34,938,466, respectively.
At December 31, 2004, the cost of investments for federal income tax purposes was $29,853,838; accordingly, accumulated net unrealized appreciation on investments was $4,636,453, consisting of $5,073,000 gross unrealized appreciation and $436,547 gross unrealized depreciation.
In early 2004, two purported class and derivative actions were filed against Mellon Financial, Mellon Bank, N.A., Dreyfus, Founders Asset Management LLC, and certain directors of the Dreyfus Funds and the Dreyfus Founders Funds (together, the “Funds”). In September 2004, plaintiffs served a Consolidated Amended Complaint (the “Amended Complaint”) on behalf of a purported class of all persons who acquired interests in any of the Funds between January 30, 1999 and November 17, 2003, and derivatively on behalf of the Funds. The Amended Complaint in the newly styled In re Dreyfus Mutual Funds Fee Litigation also named the Distributor, Premier Mutual Fund Services, Inc. and two additional Fund directors as defendants and
alleges violations of the Investment Company Act of 1940, the Investment Advisers Act of 1940, the Pennsylvania Unfair Trade Practices and Consumer Protection Law and common-law claims. Plaintiffs seek to recover allegedly improper and excessive Rule 12b-1 and advisory fees allegedly charged to the Funds for marketing and distribution services. More specifically, plaintiffs claim, among other things, that 12b-1 fees and directed brokerage were improperly used to pay brokers to recommend the Funds over other funds, and that such payments were not disclosed to investors. In addition, plaintiffs assert that economies of scale and soft-dollar benefits were not passed on to the Funds. Plaintiffs further allege that 12b-1 fees were improperly charged to certain of the Funds that were closed to new investors.The Amended Complaint seeks compensatory and punitive damages, rescission of the advisory contracts, and an accounting and restitution of any unlawful fees, as well as an award of attorneys’ fees and litigation expenses. As noted, some of the claims in this litigation are asserted derivatively on behalf of the Funds that have been named as nominal defendants.With respect to such derivative claims, no relief is sought against the Funds. Dreyfus believes the allegations to be totally without merit and intends to defend the action vigorously. Defendants filed motions to dismiss the Amended Complaint on November 12, 2004, and those motions are pending.
Additional lawsuits arising out of these circumstances and presenting similar allegations and requests for relief may be filed against the defendants in the future. Neither Dreyfus nor the Funds believe that any of the pending actions will have a material adverse effect on the Funds or Dreyfus’ ability to perform its contract with the Funds.
| REPORT OF INDEPENDENT REGISTERED |
| PUBLIC ACCOUNTING FIRM |
Shareholders and Board of Trustees
Dreyfus Variable Investment Fund, Special Value Portfolio
We have audited the accompanying statement of assets and liabilities, including the statement of investments, of Dreyfus Variable Investment Fund, Special Value Portfolio (one of the funds comprising Dreyfus Variable Investment Fund) as of December 31, 2004, and the related statement of operations for the year then ended, the statement of changes in net assets for each of the two years in the period then ended, and financial highlights for each of the periods indicated therein.These financial statements and financial highlights are the responsibility of the Fund’s management. Our responsibility is to express an opinion on these financial statements and financial highlights based on our audits.
We conducted our audits in accordance with the standards of the Public Company Accounting Oversight Board (United States).Those standards require that we plan and perform the audit to obtain reasonable assurance about whether the financial statements and financial highlights are free of material misstatement. An audit includes examining, on a test basis, evidence supporting the amounts and disclosures in the financial statements and financial highlights. Our procedures included confirmation of securities owned as of December 31, 2004 by correspondence with the custodian and others. An audit also includes assessing the accounting principles used and significant estimates made by management, as well as evaluating the overall financial statement presentation. We believe that our audits provide a reasonable basis for our opinion.
In our opinion, the financial statements and financial highlights referred to above present fairly, in all material respects, the financial position of Dreyfus Variable Investment Fund, Special Value Portfolio at December 31, 2004, the results of its operations for the year then ended, the changes in its net assets for each of the two years in the period then ended, and the financial highlights for each of the indicated periods, in conformity with U.S. generally accepted accounting principles.
New York, New York
February 4, 2005
|
IMPORTANT TAX INFORMATION (Unaudited)
For federal tax purposes, the portfolio hereby designates $1.0574 per share as a long-term capital gain distribution paid on December 30, 2004 and also the fund hereby designates 30.12% of the ordinary dividends paid during the fiscal year ended December 31, 2004 as qualifying for the corporate dividends received deduction. Shareholders will receive notification in January 2005 of the percentage applicable to the preparation of their 2004 income tax returns.
BOARD MEMBERS INFORMATION (Unaudited)
Joseph S. DiMartino (61)
Chairman of the Board (1995)
|
Principal Occupation During Past 5 Years:
• Corporate Director and Trustee
|
Other Board Memberships and Affiliations:
|
- The Muscular Dystrophy Association, Director
- Levcor International, Inc., an apparel fabric processor, Director
- Century Business Services, Inc., a provider of outsourcing functions for small and medium size companies, Director
- The Newark Group, a provider of a national market of paper recovery facilities, paperboard mills and paperboard converting plants, Director
- Azimuth Trust, an institutional asset management firm, Member of Board of Managers and Advisory Board
No. of Portfolios for which Board Member Serves: 186
David P. Feldman (65)
Board Member (1994)
|
Principal Occupation During Past 5 Years:
• Corporate Director and Trustee
|
Other Board Memberships and Affiliations:
|
- BBH Mutual Funds Group (11 funds), Director
- The Jeffrey Company, a private investment company, Director
- QMED, a medical device company, Director
No. of Portfolios for which Board Member Serves: 51
———————
James F. Henry (74) Board Member (1990)
Principal Occupation During Past 5 Years:
|
- President, CPR Institute for Dispute Resolution, a non-profit organization principally engaged in the development of alternatives to business litigation (Retired 2003)
No. of Portfolios for which Board Member Serves: 22
|
———————
Rosalind Gersten Jacobs (79) Board Member (1990)
Principal Occupation During Past 5 Years:
• Merchandise and marketing consultant
|
No. of Portfolios for which Board Member Serves: 33
|
Dr. Paul A. Marks (78)
Board Member (1990)
|
Principal Occupation During Past 5 Years:
• President and Chief Executive Officer of Memorial Sloan-Kettering Cancer Center (Retired 1999)
Other Board Memberships and Affiliations:
- Pfizer, Inc., a pharmaceutical company, Director-Emeritus
- Atom Pharm, Director
- Lazard Freres & Company, LLC, Senior Adviser
- Merck, Consultant
No. of Portfolios for which Board Member Serves: 22
Dr. Martin Peretz (65)
Board Member (1990)
|
Principal Occupation During Past 5 Years:
- Editor-in-Chief of The New Republic Magazine
- Lecturer in Social Studies at Harvard University (1965-2001)
- Co-Chairman of TheStreet.com, a financial daily on the web
Other Board Memberships and Affiliations:
- Academy for Liberal Education, an accrediting agency for colleges and universities certified by the U.S. Department of Education, Director
- Digital Learning Group, LLC, an online publisher of college textbooks, Director
- Harvard Center for Blood Research,Trustee
- Bard College,Trustee
- YIVO Institute for Jewish Research,Trustee
No. of Portfolios for which Board Member Serves: 22
Bert W.Wasserman (72)
Board Member (1993)
|
Principal Occupation During Past 5 Years:
• Financial Consultant
Other Board Memberships and Affiliations:
• Lillian Vernon Corporation, Director
No. of Portfolios for which Board Member Serves: 22
———————
Once elected all Board Members serve for an indefinite term.The address of the Board Members and Officers is in c/o The Dreyfus Corporation, 200 Park Avenue, New York, New York 10166.Additional information about the Board Members is available in the fund’s Statement of Additional Information which can be obtained from Dreyfus free of charge by calling this toll free number: 1-800-554-4611.
John M. Fraser, Jr., Emeritus Board Member Irving Kristol, Emeritus Board Member
OFFICERS OF THE FUND (Unaudited)
| STEPHEN E. CANTER, President since | | MICHAEL A. ROSENBERG, Secretary since |
| March 2000. | | March 2000. |
| Chairman of the Board, Chief Executive | | Associate General Counsel of Dreyfus, and an |
| Officer and Chief Operating Officer of | | officer of 90 investment companies (comprised |
| Dreyfus, and an officer of 92 investment | | of 194 portfolios) managed by Dreyfus. He is |
| companies (comprised of 185 portfolios) | | 44 years old and has been an employee of |
| managed by Dreyfus. Mr. Canter also is a | | Dreyfus since October 1991. |
| |
| Board member and, where applicable, an | | ROBERT R. MULLERY, Assistant Secretary |
| Executive Committee Member of the other | | since March 2000. |
| investment management subsidiaries of Mellon | | |
| Financial Corporation, each of which is an | | Associate General Counsel of Dreyfus, and an |
| affiliate of Dreyfus. He is 59 years old and has | | officer of 26 investment companies (comprised |
| been an employee of Dreyfus since May 1995. | | of 60 portfolios) managed by Dreyfus. He is 52 |
| | | years old and has been an employee of Dreyfus |
| STEPHEN R. BYERS, Executive Vice | | since May 1986. |
| President since November 2002. | | |
| | | STEVEN F. NEWMAN, Assistant Secretary |
| Chief Investment Officer,Vice Chairman and a | | since March 2000. |
| director of Dreyfus, and an officer of 92 | | |
| investment companies (comprised of 185 | | Associate General Counsel and Assistant |
| portfolios) managed by Dreyfus. Mr. Byers also | | Secretary of Dreyfus, and an officer of 93 |
| is an officer, director or an Executive | | investment companies (comprised of 201 |
| Committee Member of certain other | | portfolios) managed by Dreyfus. He is 55 years |
| investment management subsidiaries of Mellon | | old and has been an employee of Dreyfus since |
| Financial Corporation, each of which is an | | July 1980. |
| affiliate of Dreyfus. He is 51 years old and has | | JAMES WINDELS, Treasurer since |
| been an employee of Dreyfus since January | | November 2001. |
| 2000. Prior to joining Dreyfus, he served as an | | |
| Executive Vice President-Capital Markets, | | Director – Mutual Fund Accounting of |
| Chief Financial Officer and Treasurer at | | Dreyfus, and an officer of 93 investment |
| Gruntal & Co., L.L.C. | | companies (comprised of 201 portfolios) |
| | | managed by Dreyfus. He is 46 years old and has |
| MARK N. JACOBS, Vice President since | | been an employee of Dreyfus since April 1985. |
| March 2000. | | |
| | | RICHARD CASSARO, Assistant Treasurer |
| Executive Vice President, Secretary and | | since August 2003. |
| General Counsel of Dreyfus, and an officer of | | |
| 93 investment companies (comprised of 201 | | Senior Accounting Manager – Equity Funds of |
| portfolios) managed by Dreyfus. He is 58 years | | Dreyfus, and an officer of 26 investment |
| old and has been an employee of Dreyfus since | | companies (comprised of 102 portfolios) |
| June 1977. | | managed by Dreyfus. He is 44 years old and |
| | | has been an employee of Dreyfus since |
| | | September 1982. |
30
| ERIK D. NAVILOFF, Assistant Treasurer | | JOSEPH W. CONNOLLY, Chief Compliance |
| since December 2002. | | Officer since October 2004. |
| Senior Accounting Manager – Taxable Fixed | | Chief Compliance Officer of Dreyfus and The |
| Income Funds of Dreyfus, and an officer of 19 | | Dreyfus Family of Funds (93 investment |
| investment companies (comprised of 75 | | companies, comprising 201 portfolios). From |
| portfolios) managed by Dreyfus. He is 36 years | | November 2001 through March 2004, Mr. |
| old and has been an employee of Dreyfus since | | Connolly was first Vice-President, Mutual Fund |
| November 1992. | | Servicing for Mellon Global Securities |
| |
| ROBERT ROBOL, Assistant Treasurer | | Services. In that capacity, Mr. Connolly was |
| since August 2003. | | responsible for managing Mellon’s Custody, |
| | | Fund Accounting and Fund Administration |
| Senior Accounting Manager – Money Market | | services to third-party mutual fund clients. He |
| Funds of Dreyfus, and an officer of 39 | | is 47 years old and has served in various |
| investment companies (comprised of 84 | | capacities with Dreyfus since 1980, including |
| portfolios) managed by Dreyfus. He is 40 years | | manager of the firm’s Fund Accounting |
| old and has been an employee of Dreyfus since | | Department from 1997 through October 2001. |
| October 1988. | | |
| | | WILLIAM GERMENIS, Anti-Money |
| ROBERT SVAGNA, Assistant Treasurer | | Laundering Compliance Officer since |
| since December 2002. | | September 2002. |
| Senior Accounting Manager – Equity Funds of | | Vice President and Anti-Money Laundering |
| Dreyfus, and an officer of 27 investment | | Compliance Officer of the Distributor, and the |
| companies (comprised of 107 portfolios) | | Anti-Money Laundering Compliance Officer |
| managed by Dreyfus. He is 37 years old and | | of 88 investment companies (comprised of 196 |
| has been an employee of Dreyfus since | | portfolios) managed by Dreyfus. He is 34 years |
| November 1990. | | old and has been an employee of the |
| KENNETH J. SANDGREN, Assistant | | Distributor since October 1998. |
| Treasurer since November 2001. | | |
| Mutual Funds Tax Director of Dreyfus, and an | | |
| officer of 93 investment companies (comprised | | |
| of 201 portfolios) managed by Dreyfus. He is | | |
| 50 years old and has been an employee of | | |
| Dreyfus since June 1993. | | |
The Portfolio 31
NOTES
For More Information
| Dreyfus Variable | | Custodian |
| |
| Investment Fund, | | |
| | | The Bank of New York |
| Special Value Portfolio | | |
| | | One Wall Street |
| 200 Park Avenue | | |
| | | New York, NY 10286 |
| New York, NY 10166 | | |
| |
| | | Transfer Agent & |
| |
| Investment Adviser | | Dividend Disbursing Agent |
| |
| The Dreyfus Corporation | | |
| | | Dreyfus Transfer, Inc. |
| 200 Park Avenue | | |
| | | 200 Park Avenue |
| New York, NY 10166 | | |
| | | New York, NY 10166 |
| |
| |
| Sub-Investment Adviser | | Distributor |
| |
| Jennison Associates LLC | | |
| | | Dreyfus Service Corporation |
| 466 Lexington Avenue | | |
| | | 200 Park Avenue |
| New York, NY 10017 | | |
| | | New York, NY 10166 |
Telephone 1-800-554-4611 or 516-338-3300
Mail The Dreyfus Family of Funds, 144 Glenn Curtiss Boulevard, Uniondale, NY 11556-0144 Attn: Institutional Servicing
The portfolio files its complete schedule of portfolio holdings with the Securities and
Exchange Commission (“SEC”) for the first and third quarters of each fiscal year on Form N-Q. The portfolio’s Forms N-Q are available on the SEC’s website at http://www.sec.gov and may be reviewed and copied at the SEC’s Public Reference Room in Washington, DC. Information on the operation of the Public Reference Room may be obtained by calling 1-800-SEC-0330.
A description of the policies and procedures that the portfolio uses to determine how to vote proxies relating to portfolio securities, and information regarding how the portfolio voted these proxies for the 12-month period ended June 30, 2004, is available through the portfolio’s website at http://www.dreyfus.com and on the SEC’s website at http://www.sec.gov. The description of the policies and procedures is also available without charge, upon request, by calling 1-800-645-6561.

© 2005 Dreyfus Service Corporation
The Registrant has adopted a code of ethics that applies to the Registrant's principal executive officer, principal financial officer, principal accounting officer or controller, or persons performing similar functions. There have been no amendments to, or waivers in connection with, the Code of Ethics during the period covered by this Report.
| Item 3. | | Audit Committee Financial Expert. |
The Registrant's Board has determined that Bert W. Wasserman, a member of the Audit Committee of the Board, is an audit committee financial expert as defined by the Securities and Exchange Commission (the "SEC"). Bert W. Wasserman is "independent" as defined by the SEC for purposes of audit committee financial expert determinations.
| Item 4. | | Principal Accountant Fees and Services |
(a) Audit Fees. The aggregate fees billed for each of the last two fiscal years (the "Reporting Periods") for professional services rendered by the Registrant's principal accountant (the "Auditor") for the audit of the Registrant's annual financial statements, or services that are normally provided by the Auditor in connection with the statutory and regulatory filings or engagements for the Reporting Periods, were $213,800 in 2003 and $224,990 in 2004.
(b) Audit-Related Fees. The aggregate fees billed in the Reporting Periods for assurance and related services by the Auditor that are reasonably related to the performance of the audit of the Registrant's financial statements and are not reported under paragraph (a) of this Item 4 were $90,050 in 2003 and $78,768 in 2004. These services consisted of [(i) agreed-upon procedures related to compliance with Internal Revenue Code section 817(h) and (ii) security counts required by Rule 17f-2 under the Investment Company Act of 1940.
The aggregate fees billed in the Reporting Periods for non-audit assurance and related services by the Auditor to the Registrant's investment adviser (not including any sub-investment adviser whose role is primarily portfolio management and is subcontracted with or overseen by another investment adviser), and any entity controlling, controlled by or under common control with the investment adviser that provides ongoing services to the Registrant ("Service Affiliates"), that were reasonably related to the performance of the annual audit of the Service Affiliate, which required pre-approval by the Audit Committee were $288,500 in 2003 and $-0- in 2004.
Note: For the second paragraph in each of (b) through (d) of this Item 4, certain of such services were not pre-approved prior to May 6, 2003, when such services were required to be pre-approved. On and after May 6, 2003, 100% of all services provided by the Auditor were pre-approved as required. For comparative purposes, the fees shown assume that all such services were pre-approved, including services that were not pre-approved prior to the compliance date of the pre-approval requirement.
(c) Tax Fees. The aggregate fees billed in the Reporting Periods for professional services rendered by the Auditor for tax compliance, tax advice and tax planning ("Tax Services") were $39,604 in 2003 and $39,182 in 2004. [These services consisted of (i) review or preparation of U.S. federal, state, local and excise tax
returns; (ii) U.S. federal, state and local tax planning, advice and assistance regarding statutory, regulatory or administrative developments, (iii) tax advice regarding tax qualification matters and/or treatment of various financial instruments held or proposed to be acquired or held, and (iv) determination of Passive Foreign Investment Companies.]
The aggregate fees billed in the Reporting Periods for Tax Services by the Auditor to Service Affiliates which required pre-approval by the Audit Committee were $-0- in 2003 and $-0- in 2004.
(d) All Other Fees. The aggregate fees billed in the Reporting Periods for products and services provided by the Auditor, other than the services reported in paragraphs (a) through (c) of this Item, were $10 in 2003 and less than $200 in 2004. These services consisted of a review of the Registrant's anti-money laundering program.
The aggregate fees billed in the Reporting Periods for Non-Audit Services by the Auditor to Service Affiliates, other than the services reported in paragraphs (b) through (c) of this Item, which required pre-approval by the Audit Committee were $-0- in 2003 and $-0-in 2004.
Audit Committee Pre-Approval Policies and Procedures. The Registrant's Audit Committee has established policies and procedures (the "Policy") for pre-approval (within specified fee limits) of the Auditor's engagements for non-audit services to the Registrant and Service Affiliates without specific case-by-case consideration. Pre-approval considerations include whether the proposed services are compatible with maintaining the Auditor's independence. Pre-approvals pursuant to the Policy are considered annually.
Non-Audit Fees. The aggregate non-audit fees billed by the Auditor for services rendered to the Registrant, and rendered to Service Affiliates, for the Reporting Periods were $521,764 in 2003 and $592,101 in 2004.
Auditor Independence. The Registrant's Audit Committee has considered whether the provision of non-audit services that were rendered to Service Affiliates which were not pre-approved (not requiring pre-approval) is compatible with maintaining the Auditor's independence.
| Item 5. | | Audit Committee of Listed Registrants. |
| | | Not applicable. | | [CLOSED-END FUNDS ONLY] |
| Item 6. | | Schedule of Investments. |
| | | Not applicable. | | |
| Item 7. | | Disclosure of Proxy Voting Policies and Procedures for Closed-End Management |
| | | Investment Companies. |
| | | Not applicable. | | [CLOSED-END FUNDS ONLY] |
| Item 8. | | Purchases of Equity Securities by Closed-End Management Investment Companies and |
| | | Affiliated Purchasers. |
| | | Not applicable. | | [CLOSED-END FUNDS ONLY] |
| Item 9. | | Submission of Matters to a Vote of Security Holders. |
The Registrant has a Nominating Committee (the "Committee"), which is responsible for selecting and nominating persons for election or appointment by the Registrant's Board as Board members. The
Committee has adopted a Nominating Committee Charter (the "Charter"). Pursuant to the Charter, the Committee will consider recommendations for nominees from shareholders submitted to the Secretary of the Registrant, c/o The Dreyfus Corporation Legal Department, 200 Park Avenue, 8th Floor West, New York, New York 10166. A nomination submission must include information regarding the recommended nominee as specified in the Charter. This information includes all information relating to a recommended nominee that is required to be disclosed in solicitations or proxy statements for the election of Board members, as well as information sufficient to evaluate the factors to be considered by the Committee, including character and integrity, business and professional experience, and whether the person has the ability to apply sound and independent business judgment and would act in the interests of the Registrant and its shareholders.
Nomination submissions are required to be accompanied by a written consent of the individual to stand for election if nominated by the Board and to serve if elected by the shareholders, and such additional information must be provided regarding the recommended nominee as reasonably requested by the Committee.
| Item 10. | | Controls and Procedures. |
(a) The Registrant's principal executive and principal financial officers have concluded, based on their evaluation of the Registrant's disclosure controls and procedures as of a date within 90 days of the filing date of this report, that the Registrant's disclosure controls and procedures are reasonably designed to ensure that information required to be disclosed by the Registrant on Form N-CSR is recorded, processed, summarized and reported within the required time periods and that information required to be disclosed by the Registrant in the reports that it files or submits on Form N-CSR is accumulated and communicated to the Registrant's management, including its principal executive and principal financial officers, as appropriate to allow timely decisions regarding required disclosure.
(b) There were no changes to the Registrant's internal control over financial reporting that occurred during the second fiscal quarter of the period covered by this report that have materially affected, or are reasonably likely to materially affect, the Registrant's internal control over financial reporting.
| (a)(1) | | Code of ethics referred to in Item 2. |
| (a)(2) | | Certifications of principal executive and principal financial officers as required by Rule 30a-2(a) |
| under the Investment Company Act of 1940. |
| (a)(3) | | Not applicable. |
| (b) | | Certification of principal executive and principal financial officers as required by Rule 30a-2(b) |
| under the Investment Company Act of 1940. |
Pursuant to the requirements of the Securities Exchange Act of 1934 and the Investment Company Act of 1940, the Registrant has duly caused this Report to be signed on its behalf by the undersigned, thereunto duly authorized.
Dreyfus Variable Investment Fund
| By: | | /s/Stephen E. Canter |
| | | Stephen E. Canter |
| President |
| |
| Date: | | February 23, 2005 |
Pursuant to the requirements of the Securities Exchange Act of 1934 and the Investment Company Act of 1940, this Report has been signed below by the following persons on behalf of the Registrant and in the capacities and on the dates indicated.
| By: | | /s/ Stephen E. Canter |
| | | Stephen E. Canter |
| | | Chief Executive Officer |
| |
| Date: | | February 23, 2005 |
| |
| By: | | /s/ James Windels |
| James Windels |
| | | Chief Financial Officer |
| |
| Date: | | February 23, 2005 |
| | | EXHIBIT INDEX |
| (a)(1) | | Code of ethics referred to in Item 2. |
| (a)(2) | | Certifications of principal executive and principal financial officers as required by Rule 30a- |
| 2(a) under the Investment Company Act of 1940. (EX-99.CERT) |
| (b) | | Certification of principal executive and principal financial officers as required by Rule 30a- |
| 2(b) under the Investment Company Act of 1940. (EX-99.906CERT) |