| | | UNITED STATES |
| | | SECURITIES AND EXCHANGE COMMISSION |
| | | Washington, D.C. 20549 |
| |
| |
| | | FORM N-CSR |
| |
| CERTIFIED SHAREHOLDER REPORT OF REGISTERED MANAGEMENT |
| | | INVESTMENT COMPANIES |
| |
| Investment Company Act file number 811-5125 |
| |
| | | Dreyfus Variable Investment Fund |
| | | (Exact name of Registrant as specified in charter) |
| |
| |
| | | c/o The Dreyfus Corporation |
| | | 200 Park Avenue |
| | | New York, New York 10166 |
| | | (Address of principal executive offices) (Zip code) |
| |
| | | Mark N. Jacobs, Esq. |
| | | 200 Park Avenue |
| | | New York, New York 10166 |
| | | (Name and address of agent for service) |
| |
| Registrant's telephone number, including area code: (212) 922-6000 |
| |
| Date of fiscal year end: | | 12/31 |
| |
| Date of reporting period: | | 6/30/06 |
| | | | | FORM N-CSR |
| Item 1. | | Reports to Stockholders. | | |

The views expressed in this report reflect those of the portfolio manager only through the end of the period covered and do not necessarily represent the views of Dreyfus or any other person in the Dreyfus organization.Any such views are subject to change at any time based upon market or other conditions and Dreyfus disclaims any responsibility to update such views. These views may not be relied on as investment advice and, because investment decisions for a Dreyfus portfolio are based on numerous factors, may not be relied on as an indication of trading intent on behalf of any Dreyfus portfolio.
Not FDIC-Insured • Not Bank-Guaranteed • May Lose Value
| | | Contents |
| |
| | | T H E P O R T F O L I O |
| |
|
| 2 | | Letter from the Chairman |
| 3 | | Discussion of Performance |
| 6 | | Understanding Your Portfolio’s Expenses |
| 6 | | Comparing Your Portfolio’s Expenses |
| | | With Those of Other Funds |
| 7 | | Statement of Investments |
| 10 | | Statement of Assets and Liabilities |
| 11 | | Statement of Operations |
| 12 | | Statement of Changes in Net Assets |
| 14 | | Financial Highlights |
| 16 | | Notes to Financial Statements |
| 23 | | Proxy Results |
| 24 | | Information About the Review |
| and Approval of the Portfolio’s |
| Investment Advisory Agreement |
| | | F O R M O R E I N F O R M AT I O N |
| |
|
| | | Back Cover |
| Dreyfus Variable Investment Fund, |
| Appreciation Portfolio |

LETTER FROM THE CHAIRMAN
We are pleased to present this semiannual report for Dreyfus Variable Investment Fund, Appreciation Portfolio, covering the six-month period from January 1, 2006, through June 30, 2006.
Stock market gains over the first four months of 2006 were given back in May and June, when investors reacted negatively to suggestions that the U.S. Federal Reserve Board (the “Fed”) and other central banks, in their fight against inflation, might raise short-term interest rates more than previously expected. In the judgment of our Chief Economist, Richard Hoey, the recent correction reflects an adjustment among leveraged investors toward lower risk levels as the U.S. economy moves into a more mature phase with milder rates of growth. In our view, corrections such as these generally are healthy mechanisms that help wring speculative excesses from the financial markets, potentially setting the stage for future rallies.
While a recession currently appears unlikely, a number of economic uncertainties remain. Indicators to watch in the months ahead include the outlook for inflation, the extent of softness in the U.S. housing market, the impact of slower economic growth on consumer spending, additional changes in interest rates from the Fed and other central banks, and the strength of the U.S. dollar relative to other major currencies. As always, we encourage you to discuss these and other investment-related issues with your financial advisor, who can help you prepare for the challenges and opportunities that lie ahead.
For information about how the fund performed during the reporting period, as well as market perspectives, we have provided a Discussion of Fund Performance given by the fund’s portfolio manager.
Thank you for your continued confidence and support.

DISCUSSION OF PERFORMANCE
Fayez Sarofim, Portfolio Manager
Fayez Sarofim & Co., Sub-Investment Adviser
How did Dreyfus Variable Investment Fund, Appreciation Portfolio perform relative to its benchmark?
For the six-month period ended June 30, 2006, the portfolio’s Initial shares produced a total return of 2.52%, and its Service shares produced a total return of 2.40% .1 For the same period, the total return of the portfolio’s benchmark, the Standard & Poor’s 500 Composite Stock Price Index (“S&P 500 Index”), was 2.71% .2
Although stocks generally rallied over the first four months of 2006, heightened inflation and economic concerns sparked a downturn in May and June, erasing many of the stock market’s earlier gains. The portfolio produced only slightly lower returns than the S&P 500 Index, mainly due to a shift in investor sentiment toward large, high-quality companies, similar to those invested in by the fund, and away from the smaller, more speculative stocks that previously led the market.
What is the portfolio’s investment approach?
The portfolio normally invests at least 80% of its assets in common stocks. The portfolio focuses on large, well-established multinational growth companies that have demonstrated sustained patterns of profitability, strong balance sheets, an expanding global presence and the potential to achieve predictable above-average earnings growth. We focus on purchasing reasonably priced growth stocks of fundamentally sound companies in economic sectors that we believe will expand over the next three to five years or longer.
What other factors influenced the portfolio’s performance?
In our last report to shareholders, we noted that valuations of large-cap companies had compressed beyond historical norms compared to small- and midcap stocks, and that we believed a shift in investor sentiment toward high-quality multinationals might be overdue. We are pleased to report that this long-awaited shift appears to have begun in earnest during the first half of 2006.
The Portfolio 3
DISCUSSION OF PERFORMANCE (continued)
|
The reporting period began with investors generally continuing to favor more speculative companies over the well-established business leaders in which the portfolio primarily invests. Despite additional increases in short-term interest rates from the Federal Reserve Board (the “Fed”) and resurgent energy prices, stocks rallied over the first four months of the year, led by small- and midcap issues. In early May, however, investors’ attitudes toward risk appeared to change dramatically when comments by Fed Chairman Ben Bernanke were interpreted as a signal that interest rates might climb more than previously expected, potentially choking off the robust economic growth that had supported corporate earnings. Signs of impending economic weakness already had begun to emerge in the spring when the housing market began to cool and consumer spending moderated. At the same time, inflationary pressures seemed to intensify, as reflected by higher prices for energy, industrial commodities and precious metals.
The resulting “flight to quality” among investors helped the portfolio weather increased market volatility during the second quarter better than the S&P 500 Index.The portfolio’s health care and energy holdings provided particularly attractive results in the changing market environment. Large pharmaceutical companies had been hard-hit over the past several years, declining to valuations that we considered oversold relative to their fundamental long-term strengths.These stocks began to rebound in 2006 as more investors recognized the value of their generous dividend yields, high levels of free cash flow and the promise of new products under development. Portfolio holdings such as Merck & Co., Abbott Laboratories and Roche Holdings benefited from the sector’s rebound.
Integrated oil giant Exxon Mobil was one of the portfolio’s larger holdings and the greatest contributor to its performance for the reporting period. Rising crude oil and natural gas prices also helped support gains in other energy holdings, including industry leaders Chevron, ConocoPhillips and BP.
The industrials sector also advanced, but the portfolio’s relatively light holdings in the area prevented it from participating fully in its gains. Nonetheless, the portfolio received strong contributions from
Emerson Electric, which achieved higher earnings from its role as a supplier to China’s growing industrial infrastructure, and United Parcel Service, which benefited from higher shipping volumes. Similarly, the portfolio did not participate in gains within the telecommunications sector, where no companies met our investment criteria.
What is the portfolio’s current strategy?
We have maintained our longstanding buy-and-hold strategy and our focus on high-quality multinationals that have the resources to reinvest in their businesses and extend their established records of earnings and dividend increases. However, we recently sold the portfolio’s position in household goods provider Colgate-Palmolive, which encountered unexpected competitive pressures in Latin America, one of its larger markets. Instead, we allocated those assets to holdings in which we have a higher level of confidence, including new positions in industrial giant Fluor and hotelier Hilton Hotels. Fluor has enjoyed stronger sales to its customers in the energy sector, which we believe will continue as long as fuel prices remain high. Hilton Hotels recently reacquired its former international properties, and we expect the company to achieve greater operating efficiencies as they are integrated into its network.
| | | The portfolio is only available as a funding vehicle under variable life insurance policies or variable |
| | | annuity contracts issued by insurance companies. Individuals may not purchase shares of the |
| | | portfolio directly. A variable annuity is an insurance contract issued by an insurance company that |
| | | enables investors to accumulate assets on a tax-deferred basis for retirement or other long-term |
| | | goals.The investment objective and policies of Dreyfus Variable Investment Fund, Appreciation |
| | | Portfolio made available through insurance products may be similar to other funds/portfolios |
| | | managed or advised by Dreyfus. However, the investment results of the portfolio may be higher or |
| | | lower than, and may not be comparable to, those of any other Dreyfus fund/portfolio. |
| 1 | | Total return includes reinvestment of dividends and any capital gains paid. Past performance is no |
| | | guarantee of future results. Share price and investment return fluctuate such that upon redemption, |
| | | portfolio shares may be worth more or less than their original cost.The portfolio’s performance does |
| | | not reflect the deduction of additional charges and expenses imposed in connection with investing |
| | | in variable insurance contracts, which will reduce returns. |
| 2 | | SOURCE: LIPPER INC. — Reflects monthly reinvestment of dividends and, where |
| | | applicable, capital gain distributions.The Standard & Poor’s 500 Composite Stock Price Index is |
| | | a widely accepted, unmanaged index of U.S. stock market performance. |
The Portfolio 5
UNDERSTANDING YOUR PORTFOLIO’S EXPENSES (Unaudited)
As a mutual fund investor, you pay ongoing expenses, such as management fees and other expenses. Using the information below, you can estimate how these expenses affect your investment and compare them with the expenses of other funds.You also may pay one-time transaction expenses, including sales charges (loads) and redemption fees,which are not shown in this section and would have resulted in higher total expenses. For more information, see your portfolio’s prospectus or talk to your financial adviser.
Review your portfolio’s expenses
|
The table below shows the expenses you would have paid on a $1,000 investment in Dreyfus Variable Investment Fund, Appreciation Portfolio from January 1, 2006 to June 30, 2006. It also shows how much a $1,000 investment would be worth at the close of the period, assuming actual returns and expenses.
| Expenses and Value of a $1,000 Investment | | |
| assuming actual returns for the six months ended June 30, 2006 | | |
| | | Initial Shares | | Service Shares |
| |
| |
|
| Expenses paid per $1,000 † | | $ 4.02 | | $ 5.27 |
| Ending value (after expenses) | | $1,025.20 | | $1,024.00 |
COMPARING YOUR PORTFOLIO’S EXPENSES WITH THOSE OF OTHER FUNDS (Unaudited)
Using the SEC’s method to compare expenses
The Securities and Exchange Commission (SEC) has established guidelines to help investors assess fund expenses. Per these guidelines, the table below shows your portfolio’s expenses based on a $1,000 investment, assuming a hypothetical 5% annualized return. You can use this information to compare the ongoing expenses (but not transaction expenses or total cost) of investing in the portfolio with those of other funds. All mutual fund shareholder reports will provide this information to help you make this comparison. Please note that you cannot use this information to estimate your actual ending account balance and expenses paid during the period.
Expenses and Value of a $1,000 Investment assuming a hypothetical 5% annualized return for the six months ended June 30, 2006
| | | Initial Shares | | Service Shares |
| |
| |
|
| Expenses paid per $1,000 † | | $ 4.01 | | $ 5.26 |
| Ending value (after expenses) | | $1,020.83 | | $1,019.59 |
| † Expenses are equal to the portfolio’s annualized expense ratio of .80% for Initial shares and 1.05% for Service shares, |
| multiplied by the average account value over the period, multiplied by 181/365 (to reflect the one-half year period). |
STATEMENT OF INVESTMENTS
June 30, 2006 (Unaudited)
|
| Common Stocks—99.9% | | Shares | | Value ($) |
| |
| |
|
| Consumer Discretionary—17.0% | | | | |
| Altria Group | | 720,400 | | 52,898,972 |
| CBS, Cl. B | | 75,150 | | 2,032,808 |
| Christian Dior | | 72,700 a | | 7,127,170 |
| Hilton Hotels | | 100,000 | | 2,828,000 |
| McDonald’s | | 304,500 | | 10,231,200 |
| McGraw-Hill Cos. | | 441,600 | | 22,181,568 |
| News, Cl. A | | 606,436 | | 11,631,443 |
| News, Cl. B | | 9,800 a | | 197,764 |
| Polo Ralph Lauren | | 40,000 | | 2,196,000 |
| Target | | 216,900 | | 10,599,903 |
| Time Warner | | 16,800 | | 290,640 |
| Viacom, Cl. B | | 75,150 b | | 2,693,376 |
| | | | | 124,908,844 |
| Consumer Staples—23.9% | | | | |
| Anheuser-Busch Cos. | | 195,100 | | 8,894,609 |
| Coca-Cola | | 664,500 | | 28,586,790 |
| Estee Lauder Cos., Cl. A | | 130,000 | | 5,027,100 |
| Nestle, ADR | | 291,000 | | 22,834,770 |
| PepsiCo | | 445,900 | | 26,771,836 |
| Procter & Gamble | | 500,000 | | 27,800,000 |
| SYSCO | | 80,000 | | 2,444,800 |
| Wal-Mart Stores | | 439,700 | | 21,180,349 |
| Walgreen | | 649,900 | | 29,141,516 |
| Whole Foods Market | | 48,000 | | 3,102,720 |
| | | | | 175,784,490 |
| Energy—18.8% | | | | |
| BP, ADR | | 360,000 | | 25,059,600 |
| Chevron | | 445,800 | | 27,666,348 |
| ConocoPhillips | | 215,000 | | 14,088,950 |
| Exxon Mobil | | 845,064 | | 51,844,676 |
| Occidental Petroleum | | 75,000 | | 7,691,250 |
| Royal Dutch Shell, Cl. A, ADR | | 59,800 | | 4,005,404 |
| Total, ADR | | 120,000 | | 7,862,400 |
| | | | | 138,218,628 |
The Portfolio 7
STATEMENT OF INVESTMENTS (Unaudited) (continued)
| Common Stocks (continued) | | Shares | | Value ($) |
| |
| |
|
| Financial—14.1% | | | | |
| American Express | | 250,500 | | 13,331,610 |
| American International Group | | 105,920 | | 6,254,576 |
| Ameriprise Financial | | 61,500 | | 2,747,205 |
| Bank of America | | 291,216 | | 14,007,489 |
| Citigroup | | 601,524 | | 29,017,518 |
| HSBC Holdings, ADR | | 30,000 | | 2,650,500 |
| JPMorgan Chase & Co. | | 375,100 | | 15,754,200 |
| Merrill Lynch & Co. | | 145,500 | | 10,120,980 |
| SunTrust Banks | | 128,600 | | 9,807,036 |
| | | | | 103,691,114 |
| Health Care—10.4% | | | | |
| Abbott Laboratories | | 324,100 | | 14,134,001 |
| Eli Lilly & Co. | | 211,900 | | 11,711,713 |
| Johnson & Johnson | | 360,000 | | 21,571,200 |
| Merck & Co. | | 200,000 | | 7,286,000 |
| Pfizer | | 575,000 | | 13,495,250 |
| Roche Holding, ADR | | 64,000 | | 5,286,400 |
| UnitedHealth Group | | 60,000 | | 2,686,800 |
| | | | | 76,171,364 |
| Industrial—8.5% | | | | |
| Emerson Electric | | 164,900 | | 13,820,269 |
| Fluor | | 40,000 | | 3,717,200 |
| General Electric | | 1,065,500 | | 35,118,880 |
| United Parcel Service, Cl. B | | 116,800 | | 9,616,144 |
| | | | | 62,272,493 |
| Information Technology—6.3% | | | | |
| Automatic Data Processing | | 90,000 | | 4,081,500 |
| Intel | | 1,354,700 | | 25,671,565 |
| Microsoft | | 722,300 | | 16,829,590 |
| | | | | 46,582,655 |
| Materials—.9% | | | | |
| Arkema, ADR | | 3,000 b,c | | 117,067 |
| Praxair | | 121,000 | | 6,534,000 |
| | | | | 6,651,067 |
| Total Common Stocks | | | | |
| (cost $563,556,051) | | | | 734,280,655 |
| |
| |
| 8 | | | | |
| Investment of Cash Collateral | | | | |
| for Securities Loaned—1.0% | | Shares | | Value ($) |
| |
| |
|
| Registered Investment Company; | | | | |
| Dreyfus Institutional Cash Advantage Fund | | | | |
| (cost $7,303,230) | | 7,303,230 d | | 7,303,230 |
| |
| |
|
| Total Investments (cost $570,859,281) | | 100.9% | | 741,583,885 |
| Liabilities, Less Cash and Receivables | | (.9%) | | (6,814,933) |
| Net Assets | | 100.0% | | 734,768,952 |
| ADR—American Depository Receipts |
| a All or a portion of these securities are on loan. At June 30, 2006, the total market value of the portfolio’s securities |
| on loan is $7,236,702 and the total market value of the collateral held by the portfolio is $7,303,230. |
| b Non-income producing security. |
| c The value of this security has been determined in good faith under the direction of the Board of Trustees. |
| d Investment in affiliated money market mutual fund. |
| Portfolio Summary | | (Unaudited) † | | | | |
| |
| | | Value (%) | | | | Value (%) |
| |
| |
| |
|
| Consumer Staples | | 23.9 | | Industrial | | 8.5 |
| Energy | | 18.8 | | Information Technology | | 6.3 |
| Consumer Discretionary | | 17.0 | | Money Market Investment | | 1.0 |
| Financial | | 14.1 | | Materials | | .9 |
| Health Care | | 10.4 | | | | 100.9 |
| |
| † Based on net assets. | | | | | | |
| See notes to financial statements. | | | | |
The Portfolio 9
STATEMENT OF ASSETS AND LIABILITIES
June 30, 2006 (Unaudited)
| | | Cost | | Value |
| |
| |
|
| Assets ($): | | | | |
| Investments in securities— | | | | |
| See Statement of Investments | | | | |
| (including securities on loan, | | | | |
| valued at $7,236,702)—Note 1(c): | | |
| Unaffiliated issuers | | 563,556,051 | | 734,280,655 |
| Affiliated issuers | | 7,303,230 | | 7,303,230 |
| Cash | | | | 183,932 |
| Receivable for investment securities sold | | 1,776,343 |
| Dividends receivable | | | | 1,216,748 |
| Receivable for shares of Beneficial Interest subscribed | | 36,264 |
| Prepaid expenses | | | | 71,172 |
| | | | | 744,868,344 |
| |
| |
|
| Liabilities ($): | | | | |
| Due to The Dreyfus Corporation and affiliates—Note 3(b) | | 300,512 |
| Due to Fayez Sarofim & Co. | | | | 187,391 |
| Liability for securities on loan—Note 1(c) | | 7,303,230 |
| Payable for shares of Beneficial Interest redeemed | | 1,267,291 |
| Bank note payable—Note 2 | | | | 975,000 |
| Interest payable—Note 2 | | | | 4,736 |
| Accrued expenses | | | | 61,232 |
| | | | | 10,099,392 |
| |
| |
|
| Net Assets ($) | | | | 734,768,952 |
| |
| |
|
| Composition of Net Assets ($): | | | | |
| Paid-in capital | | | | 574,704,939 |
| Accumulated undistributed investment income—net | | 6,311,629 |
| Accumulated net realized gain (loss) on investments | | (16,972,220) |
| Accumulated net unrealized appreciation | | |
| (depreciation) on investments | | | | 170,724,604 |
| |
| |
|
| Net Assets ($) | | | | 734,768,952 |
| |
| |
|
| |
| |
| Net Asset Value Per Share | | | | |
| | | Initial Shares | | Service Shares |
| |
| |
|
| Net Assets ($) | | 655,338,067 | | 79,430,885 |
| Shares Outstanding | | 17,501,046 | | 2,130,323 |
| |
| |
|
| Net Asset Value Per Share ($) | | 37.45 | | 37.29 |
See notes to financial statements.
|
STATEMENT OF OPERATIONS
Six Months Ended June 30, 2006 (Unaudited)
|
| Investment Income ($): | | |
| Income: | | |
| Cash dividends: | | |
| Unaffiliated issuers (net of $133,477 foreign taxes withheld at source) | | 9,404,716 |
| Affiliated issuers | | 31,654 |
| Income from securities lending | | 37,298 |
| Total Income | | 9,473,668 |
| Expenses: | | |
| Investment advisory fee—Note 3(a) | | 1,642,110 |
| Sub-investment advisory fee—Note 3(a) | | 1,195,809 |
| Distribution fees—Note 3(b) | | 114,857 |
| Trustees’ fees and expenses—Note 3(c) | | 49,093 |
| Prospectus and shareholders’ reports | | 41,214 |
| Custodian fees—Note 3(b) | | 31,808 |
| Interest expense—Note 2 | | 30,909 |
| Professional fees | | 30,592 |
| Shareholder servicing costs—Note 3(b) | | 7,986 |
| Loan commitment fees—Note 2 | | 3,181 |
| Miscellaneous | | 12,752 |
| Total Expenses | | 3,160,311 |
| Less—reduction in custody fees | | |
| due to earnings credits—Note 1(c) | | (1,144) |
| Net Expenses | | 3,159,167 |
| Investment Income—Net | | 6,314,501 |
| |
|
| Realized and Unrealized Gain (Loss) on Investments—Note 4 ($): |
| Net realized gain (loss) on investments and foreign currency transactions | | 23,839,343 |
| Net unrealized appreciation (depreciation) on investments | | |
| and foreign currency transactions | | (11,599,070) |
| Net Realized and Unrealized Gain (Loss) on Investments | | 12,240,273 |
| Net Increase in Net Assets Resulting from Operations | | 18,554,774 |
See notes to financial statements.
|
The Portfolio 11
STATEMENT OF CHANGES IN NET ASSETS
| | | Six Months Ended | | |
| | | June 30, 2006 | | Year Ended |
| | | (Unaudited) | | December 31, 2005 |
| |
| |
|
| Operations ($): | | | | |
| Investment income—net | | 6,314,501 | | 11,949,265 |
| Net realized gain (loss) on investments | | 23,839,343 | | 16,190,739 |
| Net unrealized appreciation | | | | |
| (depreciation) on investments | | (11,599,070) | | 6,752,030 |
| Net Increase (Decrease) in Net Assets | | | | |
| Resulting from Operations | | 18,554,774 | | 34,892,034 |
| |
| |
|
| Dividends to Shareholders from ($): | | | | |
| Investment income—net: | | | | |
| Initial shares | | (10,501,808) | | (135,857) |
| Service shares | | (1,443,243) | | — |
| Total Dividends | | (11,945,051) | | (135,857) |
| |
| |
|
| Beneficial Interest Transactions ($): | | | | |
| Net proceeds from shares sold: | | | | |
| Initial shares | | 37,974,242 | | 56,572,319 |
| Service shares | | 7,454,615 | | 29,036,589 |
| Dividends reinvested: | | | | |
| Initial shares | | 10,501,808 | | 135,857 |
| Service shares | | 1,443,243 | | — |
| Cost of shares redeemed: | | | | |
| Initial shares | | (82,616,618) | | (170,386,472) |
| Service shares | | (31,437,415) | | (11,972,455) |
| Increase (Decrease) in Net Assets from | | | | |
| Beneficial Interest Transactions | | (56,680,125) | | (96,614,162) |
| Total Increase (Decrease) in Net Assets | | (50,070,402) | | (61,857,985) |
| |
| |
|
| Net Assets ($): | | | | |
| Beginning of Period | | 784,839,354 | | 846,697,339 |
| End of Period | | 734,768,952 | | 784,839,354 |
| Undistributed investment income—net | | 6,311,629 | | 11,942,179 |
| | | Six Months Ended | | |
| | | June 30, 2006 | | Year Ended |
| | | (Unaudited) | | December 31, 2005 |
| |
| |
|
| Capital Share Transactions: | | | | |
| Initial Shares | | | | |
| Shares sold | | 1,005,092 | | 1,561,261 |
| Shares issued for dividends reinvested | | 280,272 | | 3,818 |
| Shares redeemed | | (2,206,359) | | (4,688,720) |
| Net Increase (Decrease) in Shares Outstanding | | (920,995) | | (3,123,641) |
| |
| |
|
| Service Shares | | | | |
| Shares sold | | 199,349 | | 799,853 |
| Shares issued for dividends reinvested | | 38,630 | | — |
| Shares redeemed | | (847,699) | | (330,659) |
| Net Increase (Decrease) in Shares Outstanding | | (609,720) | | 469,194 |
See notes to financial statements.
|
The Portfolio 13
The following tables describe the performance for each share class for the fiscal periods indicated. All information (except portfolio turnover rate) reflects financial results for a single portfolio share.Total return shows how much your investment in the portfolio would have increased (or decreased) during each period, assuming you had reinvested all dividends and distributions.These figures have been derived from the portfolio’s financial statements.
| | | Six Months Ended | | | | | | | | |
| | | June 30, 2006 | | Year Ended December 31, | | |
| | | |
| |
| |
|
| Initial Shares | | (Unaudited) | | 2005 | | 2004 | | 2003 | | 2002 | | 2001 |
| |
| |
| |
| |
| |
| |
|
| Per Share Data ($): | | | | | | | | | | | | |
| Net asset value, | | | | | | | | | | | | |
| beginning of period | | 37.11 | | 35.56 | | 34.42 | | 28.79 | | 34.98 | | 38.91 |
| Investment Operations: | | | | | | | | | | | | |
| Investment income—net a | | .32 | | .54 | | .56 | | .43 | | .36 | | .30 |
| Net realized and unrealized gain | | | | | | | | | | | | |
| (loss) on investments | | .61 | | 1.02 | | 1.18 | | 5.64 | | (6.19) | | (3.93) |
| Total from Investment Operations | | .93 | | 1.56 | | 1.74 | | 6.07 | | (5.83) | | (3.63) |
| Distributions: | | | | | | | | | | | | |
| Dividends from investment | | | | | | | | | | | | |
| income—net | | (.59) | | (.01) | | (.60) | | (.44) | | (.36) | | (.30) |
| Net asset value, end of period | | 37.45 | | 37.11 | | 35.56 | | 34.42 | | 28.79 | | 34.98 |
| |
| |
| |
| |
| |
| |
|
| Total Return (%) | | 2.52b | | 4.38 | | 5.05 | | 21.17 | | (16.71) | | (9.31) |
| |
| |
| |
| |
| |
| |
|
| Ratios/Supplemental Data (%): | | | | | | | | | | |
| Ratio of total expenses | | | | | | | | | | | | |
| to average net assets | | .40b | | .80 | | .79 | | .80 | | .78 | | .78 |
| Ratio of net expenses | | | | | | | | | | | | |
| to average net assets | | .40b | | .80 | | .79 | | .80 | | .78 | | .78 |
| Ratio of net investment income | | | | | | | | | | | | |
| to average net assets | | .84b | | 1.48 | | 1.60 | | 1.41 | | 1.10 | | .84 |
| Portfolio Turnover Rate | | 2.06b | | 2.67 | | 1.64 | | 4.60 | | 6.61 | | 4.19 |
| |
| |
| |
| |
| |
| |
|
| Net Assets, end of period | | | | | | | | | | | | |
| ($ x 1,000) | | 655,338 | | 683,667 | | 766,169 | | 821,319 | | 722,706 | | 897,535 |
| |
| a | | Based on average shares outstanding at each month end. | | | | | | | | |
| b | | Not annualized. | | | | | | | | | | | | |
| See notes to financial statements. | | | | | | | | | | | | |
| | | Six Months Ended | | | | | | | | |
| | | June 30, 2006 | | Year Ended December 31, | | |
| | | |
| |
| |
|
| Service Shares | | (Unaudited) | | 2005 | | 2004 | | 2003 | | 2002 | | 2001 |
| |
| |
| |
| |
| |
| |
|
| Per Share Data ($): | | | | | | | | | | | | |
| Net asset value, | | | | | | | | | | | | |
| beginning of period | | 36.92 | | 35.46 | | 34.31 | | 28.71 | | 34.89 | | 38.91 |
| Investment Operations: | | | | | | | | | | | | |
| Investment income—net a | | .26 | | .45 | | .46 | | .36 | | .29 | | .18 |
| Net realized and unrealized | | | | | | | | | | | | |
| gain (loss) on investments | | .63 | | 1.01 | | 1.19 | | 5.61 | | (6.17) | | (3.94) |
| Total from Investment Operations | | .89 | | 1.46 | | 1.65 | | 5.97 | | (5.88) | | (3.76) |
| Distributions: | | | | | | | | | | | | |
| Dividends from investment | | | | | | | | | | | | |
| income—net | | (.52) | | — | | (.50) | | (.37) | | (.30) | | (.26) |
| Net asset value, end of period | | 37.29 | | 36.92 | | 35.46 | | 34.31 | | 28.71 | | 34.89 |
| |
| |
| |
| |
| |
| |
|
| Total Return (%) | | 2.40b | | 4.12 | | 4.80 | | 20.83 | | (16.89) | | (9.63) |
| |
| |
| |
| |
| |
| |
|
| Ratios/Supplemental Data (%): | | | | | | | | | | |
| Ratio of total expenses | | | | | | | | | | | | |
| to average net assets | | .52b | | 1.05 | | 1.04 | | 1.05 | | 1.02 | | 1.10 |
| Ratio of net expenses | | | | | | | | | | | | |
| to average net assets | | .52b | | 1.05 | | 1.04 | | 1.05 | | 1.02 | | 1.10 |
| Ratio of net investment income | | | | | | | | | | | | |
| to average net assets | | .72b | | 1.24 | | 1.34 | | 1.16 | | .91 | | .53 |
| Portfolio Turnover Rate | | 2.06b | | 2.67 | | 1.64 | | 4.60 | | 6.61 | | 4.19 |
| |
| |
| |
| |
| |
| |
|
| Net Assets, end of period | | | | | | | | | | | | |
| ($ x 1,000) | | 79,431 | | 101,172 | | 80,529 | | 89,121 | | 60,572 | | 35,632 |
| |
| a | | Based on average shares outstanding at each month end. | | | | | | | | |
| b | | Not annualized. | | | | | | | | | | | | |
| See notes to financial statements. | | | | | | | | | | | | |
The Portfolio 15
NOTES TO FINANCIAL STATEMENTS (Unaudited)
NOTE 1—Significant Accounting Policies:
Dreyfus Variable Investment Fund (the “fund”) is registered under the Investment Company Act of 1940, as amended (the “Act”), as an open-end management investment company, operating as a series company currently offering twelve series, including the Appreciation Portfolio (the “portfolio”). The portfolio is only offered to separate accounts established by insurance companies to fund variable annuity contracts and variable life insurance policies.The portfolio is a diversified series. The portfolio’s investment objective is to provide long-term capital growth consistent with the preservation of capital. The Dreyfus Corporation (“the Manager” or “Dreyfus”) serves as the portfolio’s investment adviser. Dreyfus is a wholly-owned subsidiary of Mellon Financial Corporation (“Mellon Financial”). Fayez Sarofim & Co. (“Sarofim & Co.”) serves as the portfolio’s sub-investment adviser.
Dreyfus Service Corporation (the “Distributor”), a wholly-owned subsidiary of Dreyfus, is the distributor of the portfolio’s shares, which are sold without a sales charge.The portfolio is authorized to issue an unlimited number of $.001 par value shares of Beneficial Interest in each of the following classes of shares: Initial and Service. Each class of shares has identical rights and privileges, except with respect to the distribution plan and the expenses borne by each class and certain voting rights. Income, expenses (other than expenses attributable to a specific class), and realized and unrealized gains or losses on investments are allocated to each class of shares based on its relative net assets.
The fund accounts separately for the assets, liabilities and operations of each series. Expenses directly attributable to each series are charged to that series’ operations; expenses which are applicable to all series are allocated among them on a pro rata basis.
The portfolio’s financial statements are prepared in accordance with U.S. generally accepted accounting principles, which may require the use of management estimates and assumptions.Actual results could differ from those estimates.
The fund enters into contracts that contain a variety of indemnifica-tions.The portfolio’s maximum exposure under these arrangements is unknown. The portfolio does not anticipate recognizing any loss related to these arrangements.
(a) Portfolio valuation: Investments in securities are valued at the last sales price on the securities exchange or national securities market on which such securities are primarily traded. Securities listed on the National Market System for which market quotations are available are valued at the official closing price or, if there is no official closing price that day, at the last sales price. Securities not listed on an exchange or the national securities market, or securities for which there were no transactions, are valued at the average of the most recent bid and asked prices, except for open short positions, where the asked price is used for valuation purposes. Bid price is used when no asked price is available. Investments in registered investment companies are valued at their net asset value.When market quotations or official closing prices are not readily available, or are determined not to reflect accurately fair value, such as when the value of a security has been significantly affected by events after the close of the exchange or market on which the security is principally traded (for example, a foreign exchange or market), but before the portfolio calculates its net asset value, the portfolio may value these investments at fair value as determined in accordance with the procedures approved by the Board of Trustees. Fair valuing of securities may be determined with the assistance of a pricing service using calculations based on indices of domestic securities and other appropriate indicators, such as prices of relevant ADR’s and futures contracts. For other securities that are fair valued by the Board of Trustees, certain factors may be considered such as: fundamental analytical data, the nature and duration of restrictions on disposition, an evaluation of the forces that influence the market in which the securities are purchased and sold and public trading in similar securities of the issuer or comparable issuers. Financial futures are valued at the last sales price. Investments denominated in foreign currencies are
The Portfolio 17
NOTES TO FINANCIAL STATEMENTS (Unaudited) (continued)
translated to U.S. dollars at the prevailing rates of exchange. Forward currency exchange contracts are valued at the forward rate.
(b) Foreign currency transactions: The portfolio does not isolate that portion of the results of operations resulting from changes in foreign exchange rates on investments from the fluctuations arising from changes in market prices of securities held. Such fluctuations are included with the net realized and unrealized gain or loss on investments.
Net realized foreign exchange gains or losses arise from sales and maturities of short-term securities, sales of foreign currencies, currency gains or losses realized on securities transactions and the difference between the amounts of dividends, interest and foreign withholding taxes recorded on the portfolio’s books and the U.S. dollar equivalent of the amounts actually received or paid. Net unrealized foreign exchange gains and losses arise from changes in the value of assets and liabilities other than investments in securities, resulting from changes in exchange rates. Such gains and losses are included with net realized and unrealized gain or loss on investments.
(c) Securities transactions and investment income: Securities transactions are recorded on a trade date basis. Realized gain and loss from securities transactions are recorded on the identified cost basis. Dividend income is recognized on the ex-dividend date and interest income, including, where applicable, accretion of discount and amortization of premium on investments, is recognized on the accrual basis.
The portfolio has an arrangement with the custodian bank whereby the portfolio receives earnings credits from the custodian when positive cash balances are maintained, which are used to offset custody fees. For financial reporting purposes, the portfolio includes net earnings credits as an expense offset in the Statement of Operations.
Pursuant to a securities lending agreement with Mellon Bank, N.A., an affiliate of Dreyfus, the portfolio may lend securities to qualified institutions. It is the portfolio’s policy, that at origination, all loans are secured by collateral of at least 102% of the value of U.S. securities
loaned and 105% of the value of foreign securities loaned. Collateral equivalent to at least 100% of the market value of securities on loan is maintained at all times. Cash collateral is invested in certain money market mutual funds managed by Dreyfus.The portfolio is entitled to receive all income on securities loaned, in addition to income earned as a result of the lending transaction.Although each security loaned is fully collateralized, the portfolio bears the risk of delay in recovery of, or loss of rights in, the securities loaned should a borrower fail to return the securities in a timely manner.
(d) Affiliated issuers: Investments in other investment companies advised by Dreyfus are defined as “affiliated” in the Act.
(e) Dividends to shareholders: Dividends are recorded on the ex-dividend date. Dividends from investment income-net and dividends from net realized capital gain, if any, are normally declared and paid annually, but the portfolio may make distributions on a more frequent basis to comply with the distribution requirements of the Internal Revenue Code of 1986, as amended (the “Code”).To the extent that net realized capital gain can be offset by capital loss carryovers, it is the policy of the portfolio not to distribute such gain. Income and capital gain distributions are determined in accordance with income tax regulations, which may differ from U.S. generally accepted accounting principles.
(e) Federal income taxes: It is the policy of the portfolio to continue to qualify as a regulated investment company, if such qualification is in the best interests of its shareholders, by complying with the applicable provisions of the Code, and to make distributions of taxable income sufficient to relieve it from substantially all federal income and excise taxes.
The portfolio has an unused capital loss carryover of $40,811,549 available for federal income tax purposes to be applied against future net securities profits, if any, realized subsequent to December 31, 2005. If not applied, $13,419,000 of the carryover expires in fiscal 2010, $20,683,522 expires in fiscal 2011 and $6,709,027 expires in fiscal 2012.
The Portfolio 19
NOTES TO FINANCIAL STATEMENTS (Unaudited) (continued)
The tax character of distributions paid to shareholders during the fiscal year ended December 31, 2005 were as follows: ordinary income $135,857.The tax character of current year distributions will be determined at the end of the current fiscal year.
NOTE 2—Bank Line of Credit:
|
The portfolio participates with other Dreyfus-managed funds in a $350 million redemption credit facility (the “Facility”) to be utilized for temporary or emergency purposes, including the financing of redemptions. In connection therewith, the portfolio has agreed to pay commitment fees on its pro rata portion of the Facility. Interest is charged to the portfolio at rates based on prevailing market rates in effect at the time of borrowings.
The average daily amount of borrowings outstanding under the Facility during the period ended June 30, 2006 was approximately $1,222,000, with a related weighted average annualized interest rate of 5.10% .
NOTE 3—Investment Advisory Fee, Sub-Investment Advisory Fee and Other Transactions With Affiliates:
(a) Pursuant to an Investment Advisory Agreement with Dreyfus, the investment advisory fee is based on the value of the portfolio’s average daily net assets and is computed at the following annual rates: .55% of the first $150 million; .50% of the next $150 million; and .375% over $300 million.The fee is payable monthly. Pursuant to a Sub-Investment Advisory Agreement with Sarofim & Co., the sub-investment advisory fee is based upon the value of the portfolio’s average daily net assets and is computed at the following annual rates: .20% of the first $150 million; .25% of the next $150 million; and .375% over $300 million.The fee is payable monthly.
(b) Under the Distribution Plan (the “Plan”) adopted pursuant to Rule 12b-1 under the Act, Service shares pay the Distributor for distributing their shares, for servicing and/or maintaining Service shares shareholder accounts and for advertising and marketing for Service shares.The Plan
provides for payments to be made at an annual rate of .25% of the value of the Service shares’ average daily net assets.The Distributor may make payments to Participating Insurance Companies and to brokers and dealers acting as principal underwriter for their variable insurance products.The fees payable under the Plan are payable without regard to actual expenses incurred. During the period ended June 30, 2006, Service shares were charged $114,857 pursuant to the Plan.
The portfolio compensates Dreyfus Transfer, Inc., a wholly-owned subsidiary of Dreyfus, under a transfer agency agreement for providing personnel and facilities to perform transfer agency services for the portfolio. During the period ended June 30, 2006, the portfolio was charged $482 pursuant to the transfer agency agreement.
The portfolio compensates Mellon Bank, N.A., an affiliate of Dreyfus, under a custody agreement for providing custodial services for the portfolio. During the period ended June 30, 2006, the portfolio was charged $31,808 pursuant to the custody agreement.
During the period ended June 30, 2006, the portfolio was charged $1,926 for services performed by the Chief Compliance Officer.
The components of Due to The Dreyfus Corporation and affiliates in the Statement of Assets and Liabilities consist of: investment advisory fees $261,364, Rule 12b-1 distribution plan fees $16,168, custodian fees $20,869, chief compliance officer fees $1,926 and transfer agency per account fees $185.
(c) Each Board member also serves as a Board member of other funds within the Dreyfus complex. Annual retainer fees and attendance fees are allocated to each fund based on net assets.
(d) Pursuant to an exemptive order from the SEC, the portfolio may invest its available cash balances in affiliated money market mutual funds. Management fees of the underlying money market mutual funds have been waived by Dreyfus.
The Portfolio 21
NOTES TO FINANCIAL STATEMENTS (Unaudited) (continued)
NOTE 4—Securities Transactions:
|
The aggregate amount of purchases and sales of investment securities, excluding short-term securities, during the period ended June 30, 2006, amounted to $15,691,073 and $74,480,751, respectively.
At June 30, 2006, accumulated net unrealized appreciation on investments was $170,724,604, consisting of $207,259,133 gross unrealized appreciation and $36,534,529 gross unrealized depreciation.
At June 30, 2006, the cost of investments for federal income tax purposes was substantially the same as the cost for financial reporting purposes (see the Statement of Investments).
PROXY RESULTS ( U n a u d i t e d )
|
Dreyfus Variable Investment Fund held a special meeting of shareholders on June 29, 2006.The proposal considered at the meeting, and the results, are as follows:
| | | | | Shares | | |
| |
| |
| |
|
| | | For | | | | Authority Withheld |
| |
| |
| |
|
| To elect additional Board Members: | | | | | | |
| Peggy C. Davis † | | 171,078,926.558 | | | | 7,687,714.085 |
| Joseph S. DiMartino | | 170,946,484.400 | | | | 7,820,156.243 |
| David P. Feldman | | 170,959,920.714 | | | | 7,806,719.929 |
| Ehud Houminer † | | 170,132,086.682 | | | | 8,634,553.961 |
| Gloria Messinger † | | 170,187,240.710 | | | | 8,579,399.933 |
| Anne Wexler † | | 170,212,607.472 | | | | 8,554,033.171 |
| † Each will serve as an Independent Board member of the fund commencing, subject to the discretion of the Board, on |
| or about January 1, 2007. |
| In addition to Joseph S. DiMartino and David P. Feldman, James F. Henry, Dr. Paul A. Marks and Dr. Martin |
| Peretz continue as Board members of the fund. |
The Portfolio 23
INFORMATION ABOUT THE REVIEW AND APPROVAL OF THE PORTFOLIO’S
I N V E S T M E N T A D V I S O R Y A G R E E M E N T (Unaudited)
At a meeting of the fund’s Board of Trustees held on June 7 and 8, 2006, the Board considered the re-approval for an annual period (through July 31, 2007) of the fund’s Investment Advisory Agreement with Dreyfus for the portfolio, pursuant to which Dreyfus provides the portfolio with investment advisory and administrative services, and the Sub-Investment Advisory Agreement (the “Sub-Advisory Agreement”) between the fund and Fayez Sarofim & Co. (the “Sub-Adviser”), pursuant to which the Sub-Adviser provides day-to-day management of the portfolio’s investments subject to Dreyfus’ oversight.The Board members, none of whom are “interested persons” (as defined in the Investment Company Act of 1940, as amended) of the fund were assisted in their review by independent legal counsel and met with counsel in executive session separate from representatives of Dreyfus and the Sub-Adviser.
Analysis of Nature, Extent and Quality of Services Provided to the Portfolio. The Board members received a presentation from representatives of Dreyfus regarding services provided to the portfolio and other funds in the Dreyfus fund complex, and discussed the nature, extent and quality of the services provided to the portfolio pursuant to its Investment Advisory Agreement and by the Sub-Adviser pursuant to the Sub-Advisory Agreement. Dreyfus’ representatives reviewed the portfolio’s distribution of accounts and the relationships Dreyfus has with various intermediaries and the different needs of each.The Board noted that the portfolio’s shares were offered only to separate accounts established by insurance companies to fund variable annuity contracts and variable life insurance policies. Dreyfus’ representatives noted the diversity of distribution among the funds in the Dreyfus fund complex, and Dreyfus’ corresponding need for broad, deep, and diverse resources to be able to provide ongoing shareholder services to each distribution channel, including that of the portfolio. Dreyfus also provided the number of separate accounts investing in the portfolio, as well as the portfolio’s asset size.
The Board members also considered the Sub-Adviser’s research and portfolio management capabilities, including Dreyfus’ recent review of the Sub-Adviser as reported by representatives of Dreyfus and the Sub-
Adviser, and that Dreyfus also provides oversight of day-to-day portfolio operations, including fund accounting and administration and assistance in meeting legal and regulatory requirements. The Board members also considered Dreyfus’ extensive administrative, accounting and compliance infrastructure, as well as Dreyfus’ supervisory activities over the Sub-Adviser.
Comparative Analysis of the Portfolio’s Performance, Advisory Fee and Expense Ratio. The Board members reviewed the portfolio’s performance and placed significant emphasis on comparisons to a group of large-cap core funds underlying variable insurance products (the “Performance Group”) and to a larger universe of funds, consisting of all large-cap core funds underlying variable insurance products (the “Performance Universe”) selected and provided by Lipper, Inc., an independent provider of investment company data.The Board was provided with a description of the methodology Lipper used to select the Performance Group and Performance Universe, as well as the Expense Group and Expense Universe (discussed below). The Board members discussed the results of the comparisons for various periods ended April 30, 2006, and noted that the portfolio’s total return performance for its Initial shares was below the medians of the Performance Group and the Performance Universe in each of the periods within the last five years. The Board also noted that for the ten-year period the Initial shares total return performance was in the first quintile of the Performance Group and the Performance Universe.The Board discussed with representatives of Dreyfus and the Sub-Adviser the investment strategy employed in the management of the portfolio’s assets and how that strategy affected the portfolio’s relative performance. The Board members noted that the Sub-Adviser is an experienced manager with a good long-term track record based on a long-term “buy-and-hold” investment approach to investing in what generally are known as “mega-cap” companies. The Sub-Adviser’s considerable reputation, based on following this investment approach, was noted.A representative of Dreyfus noted an industry-related analysis from a third party, non-affiliated entity which noted the underperformance of mega-cap companies and the consistent
The Portfolio 25
I N FO R M AT I O N A B O U T T H E R E V I E W A N D A P P R OVA L O F T H E P O R T FO L I O ’ S I N V E S T M E N T A DV I S O RY A G R E E M E N T ( U n a u d i t e d ) ( c o n t i n u e d )
process of the Sub-Adviser. Representatives of Dreyfus noted that, generally, the Sub-Adviser and its investment style are a primary factor for insurance companies including the portfolio as an investment alternative for its variable annuity contracts and variable life insurance policies and that it was expected that the portfolio would be sub-advised by, and its performance consistent with, the Sub-Adviser’s long-term buy-and-hold investment approach to investing in “mega-cap” companies.A representative of the Sub-Adviser informed the Board members that the Sub-Adviser believes the valuations of the portfolio’s portfolio holdings are relatively attractive, noting the aggregate fundamentals of the portfolio’s portfolio holdings, as well as those of certain securities in the portfolio, as compared to the Standard & Poor’s 500 Composite Stock Price Index, including, among other things, price/earnings ratios, earnings growth and capital ratios.The Dreyfus representatives also presented the Board with the portfolio’s total return performance and the quartile, percentile and rank of the portfolio’s total return within its Lipper category (as provided by Lipper) for certain other periods ended April 30, 2006, and noted that, for the most recent three-month period, the portfolio’s relative performance was showing some improvement and that otherwise the portfolio’s relative performance was generally consistent with the relative total return information provided by Lipper.
The Board members also discussed the portfolio’s advisory fee and sub-advisory fee and the expense ratio for each class of shares and reviewed the range of advisory fees and expense ratios of a comparable group of funds (the “Expense Group”) and a broader group of funds (the “Expense Universe”), each selected and provided by Lipper.The Board members noted that the portfolio’s aggregate advisory and sub-advisory fees were higher than its Expense Group and Expense Universe medians, and that the expense ratios for the Initial shares and Service shares were higher than the Expense Group, and the Service shares expense ratio was higher than the Expense Group median, while the Initial share expense ratio was lower than the Expense Universe median.
Representatives of Dreyfus reviewed with the Board members the advisory fees paid by mutual funds managed by Dreyfus or its affiliates with similar investment objectives, policies and strategies and included within the portfolio’s Lipper category (the “Similar Funds”), and by other accounts managed by Dreyfus or its affiliates or the Sub-Adviser or its affiliates with similar investment objectives, policies and strategies as the portfolio (the “Similar Accounts”). Dreyfus representatives explained the nature of the Similar Accounts and the differences, from Dreyfus’ and the Sub-Adviser’s perspective, as applicable, in providing services to such Similar Accounts as compared to managing and providing services to the portfolio. Dreyfus’ representatives also reviewed the costs associated with distribution through intermediaries.The Board analyzed differences in fees paid to Dreyfus and the Sub-Adviser and discussed the relationship of the fees paid in light of the services provided. The Board members considered the relevance of the fee information provided for the Similar Funds and Similar Accounts managed by Dreyfus and the Sub-Adviser to evaluate the appropriateness and reasonableness of the portfolio’s investment advisory fee and sub-advisory fee.The Board acknowledged that the differences in fees paid by the Similar Accounts seemed to be consistent with the services provided.The Board considered the fee paid to the Sub-Adviser in relation to the fee paid to Dreyfus and the respective services provided by the Sub-Adviser and Dreyfus.
Analysis of Profitability and Economies of Scale. Dreyfus’ representatives reviewed the dollar amount of expenses allocated and profit received by Dreyfus and the Sub-Adviser and the method used to determine such expenses and profit. The Board considered information, previously provided and discussed, prepared by an independent consulting firm regarding Dreyfus’ approach to allocating costs to, and determining the profitability of, individual funds and the entire Dreyfus mutual fund complex. The Board members also considered that the methodology had also been reviewed by an independent registered public accounting firm which, like the consultant, found the
The Portfolio 27
I N FO R M AT I O N A B O U T T H E R E V I E W A N D A P P R OVA L O F T H E P O R T FO L I O ’ S I N V E S T M E N T A DV I S O RY A G R E E M E N T ( U n a u d i t e d ) ( c o n t i n u e d )
methodology to be reasonable. The consulting firm also analyzed where any economies of scale might emerge in connection with the management of the portfolio.The Board members evaluated the profitability analysis in light of the relevant circumstances for the portfolio and the extent to which economies of scale would be realized if the portfolio grows and whether fee levels reflect these economies of scale for the benefit of portfolio investors.The Board members also considered potential benefits to Dreyfus from acting as investment adviser and to the Sub-Adviser from acting as sub-adviser and noted the soft dollar arrangements with respect to trading the portfolio’s investments.
It was noted that the Board members should consider Dreyfus’ and the Sub-Adviser’s profitability with respect to the portfolio as part of their evaluation of whether the fees under the Investment Advisory Agreement and the Sub-Advisory Agreement bear a reasonable relationship to the mix of services provided by Dreyfus and the Sub-Adviser, including the nature, extent and quality of such services and that a discussion of economies of scale is predicated on increasing assets and that, if a fund’s assets had been decreasing, the possibility that Dreyfus or the Sub-Adviser may have realized any economies of scale would be less. It also was noted that the profitability percentages for managing the portfolio were within ranges determined by appropriate court cases to be reasonable given the services rendered and generally superior service levels provided by Dreyfus and the Sub-Adviser.
At the conclusion of these discussions, the Board agreed that it had been furnished with sufficient information to make an informed business decision with respect to continuation of the Investment Advisory Agreement and Sub-Advisory Agreement, with respect to the portfolio. Based on the discussions and considerations as described above, the Board made the following conclusions and determinations.
- The Board concluded that the nature, extent and quality of the ser- vices provided by Dreyfus and the Sub-Adviser are adequate and appropriate.
- The Board was concerned with the portfolio’s performance, but noted that management had assured the Board members that it was expected by insurance companies that the portfolio would be sub- advised by, and its performance consistent with, the Sub-Adviser’s long-term buy-and-hold investment approach; the portfolio’s good long-term performance; and the portfolio’s recently improving short-term performance.
- The Board concluded that the fee paid by the portfolio to Dreyfus, and the fee paid by the portfolio to the Sub-Adviser, were reasonable in light of the services provided, comparative performance, expense and advisory fee information, costs of the services provided and profits to be realized and benefits derived or to be derived by Dreyfus and the Sub-Adviser from their relationships with the portfolio.
- The Board determined that the economies of scale which may accrue to Dreyfus and its affiliates and the Sub-Adviser and its affil- iates in connection with the management of the portfolio had been adequately considered by Dreyfus and the Sub-Adviser in connec- tion with the advisory fee rate and sub-advisory fee rate charged to the portfolio and that, to the extent in the future it were determined that material economies of scale had not been shared with the port- folio, the Board would seek to have those economies of scale shared with the portfolio.
The Board members considered these conclusions and determinations, along with information received on a routine and regular basis throughout the year, and, without any one factor being dispositive, the Board determined that re-approval of the portfolio’s Investment Advisory Agreement and Sub-Advisory Agreement was in the best interests of the portfolio and its shareholders.
The Portfolio 29
| Dreyfus Variable |
| Investment Fund, |
| Appreciation Portfolio |
| 200 Park Avenue |
| New York, NY 10166 |
| |
| Investment Adviser |
| The Dreyfus Corporation |
| 200 Park Avenue |
| New York, NY 10166 |
| |
| Sub-Investment Advisor |
| Fayez Sarofim & Co. |
| Two Houston Center |
| Suite 2907 |
| Houston,TX 77010 |
| Custodian |
| Mellon Bank, N.A. |
| One Mellon Bank Center |
| Pittsburgh, PA 15258 |
| |
| Transfer Agent & |
| Dividend Disbursing Agent |
| Dreyfus Transfer, Inc. |
| 200 Park Avenue |
| New York, NY 10166 |
| |
| Distributor |
| Dreyfus Service Corporation |
| 200 Park Avenue |
| New York, NY 10166 |
Telephone 1-800-554-4611 or 516-338-3300
Mail The Dreyfus Family of Funds, 144 Glenn Curtiss Boulevard, Uniondale, NY 11556-0144 Attn: Investments Division
The portfolio files its complete schedule of portfolio holdings with the Securities and Exchange Commission (“SEC”) for the first and third quarters of each fiscal year on Form N-Q. The portfolio’s Forms N-Q are available on the SEC’s website at http://www.sec.gov and may be reviewed and copied at the SEC’s Public Reference Room in Washington, DC. Information on the operation of the Public Reference Room may be obtained by calling 1-202-551-8090.
A description of the policies and procedures that the portfolio uses to determine how to vote proxies relating to portfolio securities, and information regarding how the portfolio voted these proxies for the 12-month period ended June 30, 2006, is available at http://www.dreyfus.com and on the SEC’s website at http://www.sec.gov. The description of the policies and procedures is also available without charge, upon request, by calling 1-800-645-6561.
| © 2006 Dreyfus Service Corporation |

The views expressed in this report reflect those of the portfolio manager only through the end of the period covered and do not necessarily represent the views of Dreyfus or any other person in the Dreyfus organization.Any such views are subject to change at any time based upon market or other conditions and Dreyfus disclaims any responsibility to update such views. These views may not be relied on as investment advice and, because investment decisions for a Dreyfus portfolio are based on numerous factors, may not be relied on as an indication of trading intent on behalf of any Dreyfus portfolio.
Not FDIC-Insured • Not Bank-Guaranteed • May Lose Value
| | | Contents |
| |
| | | T H E P O R T F O L I O |
| |
|
| 2 | | Letter from the Chairman |
| 3 | | Discussion of Performance |
| 6 | | Understanding Your Portfolio’s Expenses |
| 6 | | Comparing Your Portfolio’s Expenses |
| | | With Those of Other Funds |
| 7 | | Statement of Investments |
| 28 | | Statement of Financial Futures |
| 28 | | Statement of Options Written |
| 29 | | Statement of Assets and Liabilities |
| 30 | | Statement of Operations |
| 31 | | Statement of Changes in Net Assets |
| 33 | | Financial Highlights |
| 37 | | Notes to Financial Statements |
| | | F O R M O R E I N F O R M AT I O N |
| |
|
| | | Back Cover |
| Dreyfus Variable Investment Fund, |
| Balanced Portfolio |

LETTER FROM THE CHAIRMAN
We are pleased to present this semiannual report for Dreyfus Variable Investment Fund, Balanced Portfolio, covering the six-month period from January 1, 2006, through June 30, 2006.
The U.S. stock and bond markets encountered heightened volatility during the first half of 2006. In the judgment of our Chief Economist, Richard Hoey, recent turbulence among longer-term bonds reflects shifts in interest-rate and inflation expectations, while the correction in the stock market signals an adjustment among leveraged investors toward lower risk levels as the U.S. economy moves into a more mature phase with milder rates of growth. In our view, corrections such as these generally are healthy mechanisms that help wring speculative excesses from the financial markets, potentially setting the stage for future rallies.
While a recession currently appears unlikely, a number of economic uncertainties remain as investors look toward 2007. Indicators to watch in the months ahead include the outlook for inflation in the United States and overseas, the extent of softness in the U.S. housing market, the impact of slower economic growth on consumer spending, additional changes in short-term interest rates from the Fed and other central banks, and the strength of the U.S. dollar relative to other major currencies. As always, we encourage you to discuss these and other investment-related issues with your financial advisor, who can help you prepare for the challenges and opportunities that lie ahead.
For information about how the fund performed during the reporting period, as well as market perspectives, we have provided a Discussion of Fund Performance given by the fund’s portfolio manager.
Thank you for your continued confidence and support.

DISCUSSION OF PERFORMANCE
Thomas Plumb, Primary Portfolio Manager
Wisconsin Capital Management, LLC, Sub-Investment Adviser
How did Dreyfus Variable Investment Fund, Balanced Portfolio perform relative to its benchmarks?
For the six-month period ended June 30, 2006, the portfolio’s total returns were 1.15% for its Initial shares and 1.02% for its Service shares.1 In comparison, the portfolio’s benchmark, a hybrid index composed of 60% Standard & Poor’s 500 Composite Stock Price Index (the “S&P 500 Index”) and 40% Lehman Brothers Intermediate Government/Credit Bond Index (the “Lehman Intermediate Bond Index”), achieved a total return of 1.55% for the reporting period.2 Separately, the S&P 500 Index and the Lehman Intermediate Bond Index achieved total returns of 2.71% and -0.17%, respectively, for the reporting period.
While stocks rallied in a robust economic environment over the first four months of 2006, heightened concerns regarding inflation and interest rates led to a sharp decline in many stock prices in May and June. Bonds also generally lost a modest amount of value due to inflation and interest rate worries.The portfolio’s returns were roughly in line with its blended benchmark, as better-than-average performance in its bond portfolio was offset by modestly lagging results in its equity portion.
What is the portfolio’s investment approach?
The portfolio seeks high total return through a combination of capital appreciation and current income.To pursue this goal, the portfolio invests in a diversified mix of stocks and fixed-income securities.The portfolio will vary the mix of stocks and bonds from time to time, but normally the portfolio will allocate more than 50% of its assets to stocks and the remainder to bonds and other fixed-income securities.
In allocating portfolio assets between stocks and bonds, the portfolio manager assesses the relative return and risk of each asset class, analyzing several factors, including general economic conditions, anticipated future changes in interest rates and the outlook for stocks generally.
In choosing stocks for the portfolio, the manager looks for high-quality companies that possess most of the following characteristics: leading
The Portfolio 3
DISCUSSION OF PERFORMANCE (continued)
|
market positions, high barriers to market entry and other competitive or technological advantages, high returns on equity and assets, good growth prospects, strong management, and relatively low debt burdens.
The portfolio normally invests at least 25% of its assets in fixed-income securities.The fixed-income securities in which the portfolio may invest include corporate bonds and other debt instruments, mortgage-related securities, asset-backed securities, debt securities issued or guaranteed by the U.S. government (including its agencies and instrumentalities), convertible debt securities and preferred stock that is convertible into common stock.
What other factors influenced the portfolio’s performance?
Both stocks and bonds encountered headwinds related to investors’ concerns that recent inflationary pressures might compel the Federal Reserve Board (the “Fed”) to raise interest rates more than previously expected, potentially choking off future economic growth. Indeed, on June 29, the Fed implemented its seventeenth consecutive increase in short-term interest rates, raising the overnight federal funds rate to 5.25% .While the rate-tightening campaign is intended to forestall inflation, recent data suggested that inflationary pressures may be gathering, possibly requiring further Fed action.As a result, stocks declined sharply in May and June, erasing a portion of the gains achieved earlier in the year, and longer-term bond prices fell after a prolonged period of resilience.
The portfolio’s asset mix of approximately 70% stocks and 30% bonds enabled it to participate more fully than the blended benchmark in the relative strength of equities. However, the portfolio’s emphasis on the consumer discretionary sector, which lagged the averages, caused its equity returns to fall short of the S&P 500 Index. For-profit education companies, such as Corinthian Colleges and Career Education, produced mixed and volatile results despite improving industry fundamentals.In the financial sector, insurance giants American International Group and Marsh & McLennan were hurt by concerns regarding pricing pressures.
Some of the shortfall in the consumer discretionary area was offset by retailers, such as Kohl’s and Cabela’s, which fared well when consumer spending held up better than many expected. In addition, the portfolio achieved better-than-average performance in the technol-
ogy sector, where financial software firms, such as Fiserv and First Data, and peripheral equipment providers, including Lexmark International, boosted returns.
Among bonds, we focused primarily on investment-grade corporate securities with relatively short maturities, which helped the portfolio avoid weakness in more interest rate-sensitive areas of the market.
What is the portfolio’s current strategy?
We have intensified our focus on large, leading multinational companies, which appear more likely to weather an economic slowdown and are more attractively valued than midcap and small-cap companies. In addition, many appear to be well positioned to participate in stronger economies outside of the United States.Therefore, we currently intend to take advantage of any additional bouts of market weakness to increase existing large-cap positions. As for bonds, we believe that shorter-maturity corporate securities may continue to help the portfolio weather the effects of intensifying inflationary pressures while generating competitive levels of current income.
| | | The portfolio is only available as a funding vehicle under variable life insurance policies or variable |
| | | annuity contracts issued by insurance companies. Individuals may not purchase shares of the |
| | | portfolio directly. A variable annuity is an insurance contract issued by an insurance company that |
| | | enables investors to accumulate assets on a tax-deferred basis for retirement or other long-term |
| | | goals.The investment objective and policies of Dreyfus Variable Investment Fund, Balanced |
| | | Portfolio made available through insurance products may be similar to other funds/portfolios |
| | | managed or advised by Dreyfus. However, the investment results of the portfolio may be higher or |
| | | lower than, and may not be comparable to, those of any other Dreyfus fund/portfolio. |
| 1 | | Total return includes reinvestment of dividends and any capital gains paid. Past performance is no |
| | | guarantee of future results. Share price and investment return fluctuate such that upon redemption, |
| | | portfolio shares may be worth more or less than their original cost.The portfolio’s performance does |
| | | not reflect the deduction of additional charges and expenses imposed in connection with investing |
| | | in variable insurance contracts, which will reduce returns. Return figures provided reflect the |
| | | absorption of certain portfolio expenses by The Dreyfus Corporation pursuant to an agreement in |
| | | effect through December 31, 2006, at which time it may be extended, terminated or modified. |
| | | Had these expenses not been absorbed, the portfolio’s returns would have been lower. |
| 2 | | SOURCE: LIPPER, INC. — Reflects reinvestment of dividends and, where applicable, capital |
| | | gain distributions.The Standard & Poor’s 500 Composite Stock Price Index is a widely accepted, |
| | | unmanaged index of U.S. stock market performance.The Lehman Brothers Intermediate |
| | | Government/Credit Bond Index is a widely accepted, unmanaged index of government and |
| | | corporate bond market performance composed of U.S. government,Treasury and agency securities, |
| | | fixed-income securities and nonconvertible investment-grade corporate debt, with an average |
| | | maturity of 1-10 years. |
The Portfolio 5
| UNDERSTANDING YOUR |
| PORTFOLIO’S EXPENSES (Unaudited) |
As a mutual fund investor, you pay ongoing expenses, such as management fees and other expenses. Using the information below, you can estimate how these expenses affect your investment and compare them with the expenses of other funds.You also may pay one-time transaction expenses, including sales charges (loads) and redemption fees,which are not shown in this section and would have resulted in higher total expenses. For more information, see your portfolio’s prospectus or talk to your financial adviser.
Review your portfolio’s expenses
|
The table below shows the expenses you would have paid on a $1,000 investment in Dreyfus Variable Investment Fund, Balanced Portfolio from January 1, 2006 to June 30, 2006. It also shows how much a $1,000 investment would be worth at the close of the period, assuming actual returns and expenses.
| Expenses and Value of a $1,000 Investment | | |
| assuming actual returns for the six months ended June 30, 2006 | | |
| | | Initial Shares | | Service Shares |
| |
| |
|
| Expenses paid per $1,000 † | | $ 4.39 | | $ 4.98 |
| Ending value (after expenses) | | $1,011.50 | | $1,010.20 |
| COMPARING YOUR PORTFOLIO’S EXPENSES |
| WITH THOSE OF OTHER FUNDS (Unaudited) |
Using the SEC’s method to compare expenses
The Securities and Exchange Commission (SEC) has established guidelines to help investors assess fund expenses. Per these guidelines, the table below shows your portfolio’s expenses based on a $1,000 investment, assuming a hypothetical 5% annualized return. You can use this information to compare the ongoing expenses (but not transaction expenses or total cost) of investing in the portfolio with those of other funds. All mutual fund shareholder reports will provide this information to help you make this comparison. Please note that you cannot use this information to estimate your actual ending account balance and expenses paid during the period.
Expenses and Value of a $1,000 Investment assuming a hypothetical 5% annualized return for the six months ended June 30, 2006
| | | Initial Shares | | Service Shares |
| |
| |
|
| Expenses paid per $1,000 † | | $ 4.41 | | $ 5.01 |
| Ending value (after expenses) | | $1,020.43 | | $1,019.84 |
| † Expenses are equal to the portfolio’s annualized expense ratio of .88% for Initial shares and 1.00% for Service shares, |
| multiplied by the average account value over the period, multiplied by 181/365 (to reflect the one-half year period). |
STATEMENT OF INVESTMENTS
June 30, 2006 (Unaudited)
|
| Common Stocks—70.0% | | Shares | | | | Value ($) |
| |
| |
| |
|
| Consumer Discretionary—14.9% | | | | |
| Apollo Group, Cl. A | | 23,000a | | | | 1,188,410 |
| Cabela’s, Cl. A | | 60,000 a,b | | | | 1,155,600 |
| Career Education | | 42,500 a | | | | 1,270,325 |
| Corinthian Colleges | | 130,000 a | | | | 1,866,800 |
| Hewitt Associates, Cl. A | | 40,000 a | | | | 899,200 |
| Interpublic Group of Cos. | | 30,000 a | | | | 250,500 |
| Kohl’s | | 13,000 a | | | | 768,560 |
| Viacom, Cl. B | | 17,000 a | | | | 609,280 |
| Wal-Mart Stores | | 21,500 | | | | 1,035,655 |
| | | | | | | 9,044,330 |
| Consumer Staples—3.4% | | | | | | |
| Coca-Cola | | 22,300 | | | | 959,346 |
| Nestle, ADR | | 14,500 | | | | 1,137,815 |
| | | | | | | 2,097,161 |
| Energy—4.6% | | | | | | |
| Chevron | | 23,000 | | | | 1,427,380 |
| Exxon Mobil | | 22,000 | | | | 1,349,700 |
| | | | | | | 2,777,080 |
| Financial—14.7% | | | | | | |
| American International Group | | 22,500 | | | | 1,328,625 |
| Bank of America | | 26,500 | | | | 1,274,650 |
| Berkshire Hathaway, Cl. A | | 10 a | | | | 916,590 |
| Citigroup | | 25,000 | | | | 1,206,000 |
| Doral Financial | | 82,300 a | | | | 527,543 |
| Fannie Mae | | 35,000 | | | | 1,683,500 |
| JPMorgan Chase & Co. | | 29,200 | | | | 1,226,400 |
| Marsh & McLennan Cos. | | 30,000 | | | | 806,700 |
| | | | | | | 8,970,008 |
| Health Care—13.7% | | | | | | |
| Bausch & Lomb | | 16,000 | | | | 784,640 |
| Cardinal Health | | 26,800 | | | | 1,724,044 |
| Johnson & Johnson | | 16,100 | | | | 964,712 |
| Merck & Co. | | 22,800 | | | | 830,604 |
| Pfizer | | 75,000 | | | | 1,760,250 |
| Wright Medical Group | | 37,500 a | | | | 784,875 |
The Portfolio 7
STATEMENT OF INVESTMENTS (Unaudited) (continued)
| Common Stocks (continued) | | Shares | | Value ($) |
| |
| |
|
| Health Care (continued) | | | | |
| Wyeth | | 15,000 | | 666,150 |
| Zimmer Holdings | | 14,500 a | | 822,440 |
| | | | | 8,337,715 |
| Industrial—5.6% | | | | |
| Cendant | | 63,000 | | 1,026,270 |
| General Electric | | 36,000 | | 1,186,560 |
| Tyco International | | 44,000 | | 1,210,000 |
| | | | | 3,422,830 |
| Information Technology—13.1% | | | | |
| BISYS Group | | 60,000 a | | 822,000 |
| Dell | | 10,000 a | | 244,100 |
| Electronic Data Systems | | 60,000 | | 1,443,600 |
| First Data | | 21,000 | | 945,840 |
| Fiserv | | 28,000 a | | 1,270,080 |
| Lexmark International, Cl. A | | 15,000 a | | 837,450 |
| Microchip Technology | | 12,500 | | 419,375 |
| Microsoft | | 84,000 | | 1,957,200 |
| | | | | 7,939,645 |
| Total Common Stocks | | | | |
| (cost $40,650,645) | | | | 42,588,769 |
| |
| |
|
| |
| Preferred Stocks—2.1% | | | | |
| |
| |
|
| Consumer Discretionary—.6% | | | | |
| General Motors, | | | | |
| Cum., $1.84 | | 22,300 | | 377,706 |
| Financial—1.0% | | | | |
| Citigroup Capital VII, | | | | |
| Cum., $1.78 | | 22,300 | | 568,650 |
| Telecommunication Services—.5% | | | | |
| Verizon South, | | | | |
| Ser. F, Cum. $1.75 | | 12,800 | | 316,401 |
| Total Preferred Stocks | | | | |
| (cost $1,467,251) | | | | 1,262,757 |
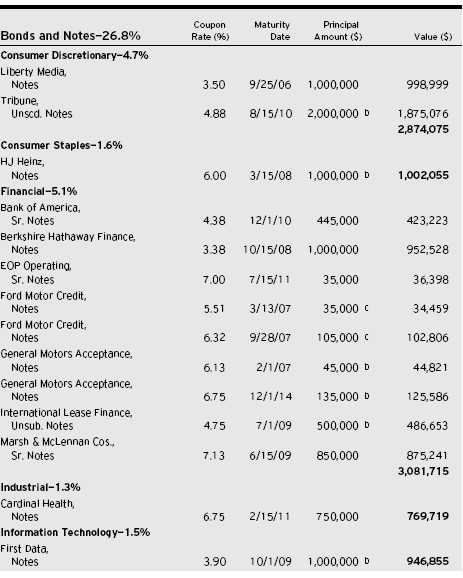
The Portfolio 9
STATEMENT OF INVESTMENTS (Unaudited) (continued)
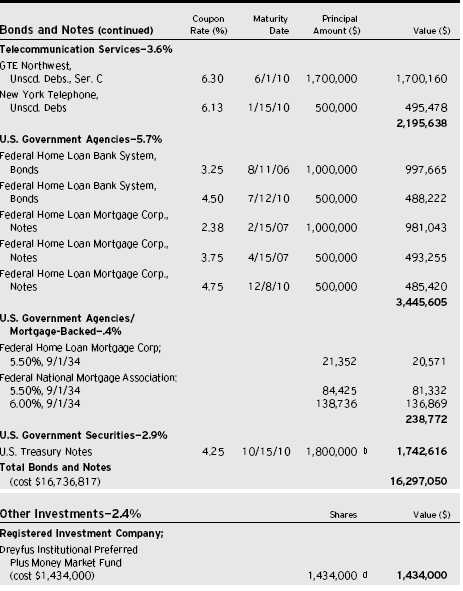
| Investment of Cash Collateral | | | | |
| for Securities Loaned—9.8% | | Shares | | Value ($) |
| |
| |
|
| Registered Investment Company; | | | | |
| Dreyfus Institutional Cash | | | | | | |
| Advantage Plus Fund | | | | | | |
| (cost $5,960,100) | | | | 5,960,100 d | | 5,960,100 |
| |
| |
| |
|
| |
| Total Investments (cost $66,248,813) | | 111.1% | | 67,542,676 |
| |
| Liabilities, Less Cash and Receivables | | (11.1%) | | (6,720,546) |
| |
| Net Assets | | | | 100.0% | | 60,822,130 |
| |
| ADR—American Depository Receipts | | | | |
| a | | Non-income producing security. | | | | |
| b | | All or a portion of these securities are on loan. At June 30, 2006, the total market value of the portfolio’s securities |
| | | on loan is $5,745,281 and the total market value of the collateral held by the portfolio is $5,960,100. |
| c | | Variable rate security—interest rate subject to periodic change. | | |
| d | | Investment in affiliated money market mutual fund. | | | | |
| |
| |
| |
|
| |
| |
| |
| |
| Portfolio Summary (Unaudited) † | | | | |
| |
| | | | | Value (%) | | | | Value (%) |
| |
| |
| |
| |
|
| Financial | | 20.8 | | Industrial | | 6.9 |
| Consumer Discretionary | | 20.2 | | Consumer Staples | | 5.0 |
| Information Technology | | 14.6 | | Energy | | 4.6 |
| Health Care | | 13.7 | | Telecommunication Services | | 4.1 |
| Money Market Investments | | 12.2 | | U.S. Government Agencies/ | | |
| U.S. Government Agencies/ | | | | Mortgage-Backed | | .4 |
| Securities | | 8.6 | | | | 111.1 |
| |
| † | | Based on net assets. | | | | | | |
| See notes to financial statements. | | | | | | |
The Portfolio 11
| STATEMENT OF ASSETS AND LIABILITIES |
| June 30, 2006 (Unaudited) |
| | | Cost | | Value |
| |
| |
|
| Assets ($): | | | | |
| Investments in securities—See Statement | | | | |
| of Investments (including securities on loan, | | |
| valued at $5,745,281)—Note 1(c): | | | | |
| Unaffiliated issuers | | 58,854,713 | | 60,148,576 |
| Affiliated issuers | | 7,394,100 | | 7,394,100 |
| Cash | | | | 4,257 |
| Receivable for investment securities sold | | | | 540,785 |
| Dividends and interest receivable | | | | 250,402 |
| Prepaid expenses and other assets | | | | 8,655 |
| | | | | 68,346,775 |
| |
| |
|
| Liabilities ($): | | | | |
| Due to The Dreyfus Corporation and affiliates—Note 3(b) | | 44,473 |
| Liability for securities on loan—Note 1(c) | | | | 5,960,100 |
| Payable for investment securities purchased | | 1,449,520 |
| Payable for shares of Beneficial Interest redeemed | | 27,919 |
| Accrued expenses | | | | 42,633 |
| | | | | 7,524,645 |
| |
| |
|
| Net Assets ($) | | | | 60,822,130 |
| |
| |
|
| Composition of Net Assets ($): | | | | |
| Paid-in capital | | | | 75,666,668 |
| Accumulated undistributed investment income—net | | 280,022 |
| Accumulated net realized gain (loss) on investments | | (16,418,423) |
| Accumulated net unrealized appreciation | | | | |
| (depreciation) on investments | | | | 1,293,863 |
| |
| |
|
| Net Assets ($) | | | | 60,822,130 |
| |
| |
|
| |
| |
| Net Asset Value Per Share | | | | |
| | | Initial Shares | | Service Shares |
| |
| |
|
| Net Assets ($) | | 43,783,534 | | 17,038,596 |
| Shares Outstanding | | 3,392,608 | | 1,318,073 |
| |
| |
|
| Net Assets Value Per Share ($) | | 12.91 | | 12.93 |
See notes to financial statements.
|
STATEMENT OF OPERATIONS
Six Months Ended June 30, 2006 (Unaudited)
|
| Investment Income ($): | | |
| Income: | | |
| Cash dividends (net of $5,059 foreign taxes withheld at source): | | |
| Unaffiliated issuers | | 422,393 |
| Affiliated issuers | | 10,251 |
| Interest | | 401,211 |
| Income from securities lending | | 31,848 |
| Total Income | | 865,703 |
| Expenses: | | |
| Investment advisory fee—Note 3(a) | | 242,533 |
| Distribution fees—Note 3(b) | | 22,074 |
| Auditing fees | | 19,918 |
| Prospectus and shareholders’ reports | | 9,646 |
| Trustees’ fees and expenses—Note 3(c) | | 4,240 |
| Custodian fees—Note 3(b) | | 3,560 |
| Legal fees | | 966 |
| Loan commitment fees—Note 2 | | 444 |
| Interest expense—Note 2 | | 340 |
| Shareholder servicing costs—Note 3(b) | | 132 |
| Miscellaneous | | 5,454 |
| Total Expenses | | 309,307 |
| Less—waiver of fees due to undertaking—Note 3(a) | | (14,923) |
| Net Expenses | | 294,384 |
| Investment Income—Net | | 571,319 |
| |
|
| Realized and Unrealized Gain (Loss) on Investments—Note 4 ($): |
| Net realized gain (loss) on investments | | (63,924) |
| Net unrealized appreciation (depreciation) on investments | | 286,848 |
| Net Realized and Unrealized Gain (Loss) on Investments | | 222,924 |
| Net Increase in Net Assets Resulting from Operations | | 794,243 |
See notes to financial statements.
|
The Portfolio 13
STATEMENT OF CHANGES IN NET ASSETS
| | | Six Months Ended | | |
| | | June 30, 2006 | | Year Ended |
| | | (Unaudited) | | December 31, 2005 |
| |
| |
|
| Operations ($): | | | | |
| Investment income—net | | 571,319 | | 1,052,254 |
| Net realized gain (loss) on investments | | (63,924) | | 305,484 |
| Net unrealized appreciation | | | | |
| (depreciation) on investments | | 286,848 | | (2,479,092) |
| Net Increase (Decrease) in Net Assets | | | | |
| Resulting from Operations | | 794,243 | | (1,121,354) |
| |
| |
|
| Dividends to Shareholders from ($): | | | | |
| Investment income—net: | | | | |
| Initial shares | | (567,450) | | (933,459) |
| Service shares | | (191,562) | | (316,209) |
| Total Dividends | | (759,012) | | (1,249,668) |
| |
| |
|
| Beneficial Interest Transactions ($): | | | | |
| Net proceeds from shares sold: | | | | |
| Initial shares | | 611,865 | | 763,690 |
| Service shares | | 178,409 | | 588,316 |
| Dividends reinvested: | | | | |
| Initial shares | | 567,450 | | 933,459 |
| Service shares | | 191,562 | | 316,209 |
| Cost of shares redeemed: | | | | |
| Initial shares | | (6,516,500) | | (11,888,473) |
| Service shares | | (1,480,448) | | (4,057,658) |
| Increase (Decrease) in Net Assets from | | | | |
| Beneficial Interest Transactions | | (6,447,662) | | (13,344,457) |
| Total Increase (Decrease) in Net Assets | | (6,412,431) | | (15,715,479) |
| |
| |
|
| Net Assets ($): | | | | |
| Beginning of Period | | 67,234,561 | | 82,950,040 |
| End of Period | | 60,822,130 | | 67,234,561 |
| Undistributed investment income—net | | 280,022 | | 467,715 |
| | | Six Months Ended | | |
| | | June 30, 2006 | | Year Ended |
| | | (Unaudited) | | December 31, 2005 |
| |
| |
|
| Capital Share Transactions: | | | | |
| Initial Shares | | | | |
| Shares sold | | 45,902 | | 58,603 |
| Shares issued for dividends reinvested | | 43,189 | | 72,180 |
| Shares redeemed | | (495,334) | | (916,292) |
| Net Increase (Decrease) in Shares Outstanding | | (406,243) | | (785,509) |
| |
| |
|
| Service Shares | | | | |
| Shares sold | | 13,481 | | 45,287 |
| Shares issued for dividends reinvested | | 14,570 | | 24,427 |
| Shares redeemed | | (112,317) | | (311,605) |
| Net Increase (Decrease) in Shares Outstanding | | (84,266) | | (241,891) |
See notes to financial statements.
|
The Portfolio 15
The following tables describe the performance for each share class for the fiscal periods indicated. All information (except portfolio turnover rate) reflects financial results for a single portfolio share.Total return shows how much your investment in the portfolio would have increased (or decreased) during each period, assuming you had reinvested all dividends and distributions.These figures have been derived from the portfolio’s financial statements.
| | | | | Six Months Ended | | | | | | | | |
| | | | | June 30, 2006 | | | | Year Ended December 31, | | |
| | | | | |
| |
| |
|
| Initial Shares | | (Unaudited) | | 2005 | | 2004 | | 2003 | | 2002 | | 2001 |
| |
| |
| |
| |
| |
| |
|
| Per Share Data ($): | | | | | | | | | | | | |
| Net asset value, | | | | | | | | | | | | |
| beginning of period | | 12.92 | | 13.31 | | 12.87 | | 11.09 | | 13.34 | | 15.00 |
| Investment Operations: | | | | | | | | | | | | |
| Investment income—net a | | .12 | | .19 | | .22 | | .15 | | .19 | | .27 |
| Net realized and unrealized | | | | | | | | | | | | |
| gain (loss) on investments | | .03 | | (.35) | | .50 | | 1.84 | | (2.25) | | (1.65) |
| Total from Investment Operations .15 | | (.16) | | .72 | | 1.99 | | (2.06) | | (1.38) |
| Distributions: | | | | | | | | | | | | |
| Dividends from investment | | | | | | | | | | | | |
| income—net | | (.16) | | (.23) | | (.28) | | (.21) | | (.19) | | (.28) |
| Net asset value, end of period | | 12.91 | | 12.92 | | 13.31 | | 12.87 | | 11.09 | | 13.34 |
| |
| |
| |
| |
| |
| |
|
| Total Return (%) | | 1.15b | | (1.21) | | 5.64 | | 18.14 | | (15.48) | | (9.12) |
| |
| |
| |
| |
| |
| |
|
| Ratios/Supplemental Data (%): | | | | | | | | | | |
| Ratio of total expenses | | | | | | | | | | | | |
| to average net assets | | .44b | | .91 | | .88 | | .89 | | .85 | | .85 |
| Ratio of net expenses | | | | | | | | | | | | |
| to average net assets | | .43b | | .90 | | .88 | | .89 | | .85 | | .85 |
| Ratio of net investment income | | | | | | | | | | |
| to average net assets | | .90b | | 1.45 | | 1.73 | | 1.26 | | 1.58 | | 1.92 |
| Portfolio Turnover Rate | | 18.10b | | 41.89 | | 281.51c | | 363.02c | | 388.26 | | 128.44 |
| |
| |
| |
| |
| |
| |
|
| Net Assets, end of period | | | | | | | | | | | | |
| ($ x 1,000) | | 43,784 | | 49,094 | | 61,038 | | 67,239 | | 64,865 | | 96,290 |
| |
| a | | Based on average shares outstanding at each month end. | | | | | | | | |
| b | | Not annulaized. | | | | | | | | | | | | |
| c | | The portfolio turnover rate excluding mortgage dollar roll transactions for the years ended December 31, 2004 and |
| | | December 31, 2003 were 266.40% and 305.71%, respectively. | | | | | | |
| See notes to financial statements. | | | | | | | | | | | | |
| | | | | Six Months Ended | | | | | | |
| | | | | June 30, 2006 | | | | Year Ended December 31, | | |
| | | | | |
| |
| |
|
| Service Shares | | (Unaudited) | | 2005 | | 2004 | | 2003 | | 2002 | | 2001 |
| |
| |
| |
| |
| |
| |
|
| Per Share Data ($): | | | | | | | | | | | | |
| Net asset value, | | | | | | | | | | | | |
| beginning of period | | 12.94 | | 13.33 | | 12.87 | | 11.08 | | 13.33 | | 15.00 |
| Investment Operations: | | | | | | | | | | | | |
| Investment income—net a | | .11 | | .17 | | .21 | | .14 | | .17 | | .22 |
| Net realized and unrealized | | | | | | | | | | | | |
| gain (loss) on investments | | .02 | | (.34) | | .50 | | 1.84 | | (2.24) | | (1.63) |
| Total from Investment Operations .13 | | (.17) | | .71 | | 1.98 | | (2.07) | | (1.41) |
| Distributions: | | | | | | | | | | | | |
| Dividends from investment | | | | | | | | | | | | |
| income—net | | (.14) | | (.22) | | (.25) | | (.19) | | (.18) | | (.26) |
| Net asset value, end of period | | 12.93 | | 12.94 | | 13.33 | | 12.87 | | 11.08 | | 13.33 |
| |
| |
| |
| |
| |
| |
|
| Total Return (%) | | 1.02b | | (1.30) | | 5.57 | | 18.02 | | (15.63) | | (9.31) |
| |
| |
| |
| |
| |
| |
|
| Ratios/Supplemental Data (%): | | | | | | | | | | |
| Ratio of total expenses | | | | | | | | | | | | |
| to average net assets | | .57b | | 1.16 | | 1.13 | | 1.14 | | 1.09 | | 1.16 |
| Ratio of net expenses | | | | | | | | | | | | |
| to average net assets | | .50b | | 1.00 | | 1.00 | | 1.00 | | 1.00 | | 1.00 |
| Ratio of net investment income | | | | | | | | | | |
| to average net assets | | .83b | | 1.35 | | 1.62 | | 1.15 | | 1.45 | | 1.66 |
| Portfolio Turnover Rate | | 18.10b | | 41.89 | | 281.51c | | 363.02c | | 388.26 | | 128.44 |
| |
| |
| |
| |
| |
| |
|
| Net Assets, end of period | | | | | | | | | | | | |
| ($ x 1,000) | | 17,039 | | 18,141 | | 21,912 | | 23,313 | | 22,040 | | 15,396 |
| |
| a | | Based on average shares outstanding at each month end. | | | | | | | | |
| b | | Not annualized. | | | | | | | | | | | | |
| c | | The portfolio turnover rate excluding mortgage dollar roll transactions for the years ended December 31, 2004 and |
| | | December 31, 2003 were 266.40% and 305.71%, respectively. | | | | | | |
| See notes to financial statements. | | | | | | | | | | | | |
The Portfolio 17
NOTES TO FINANCIAL STATEMENTS (Unaudited)
NOTE 1—Significant Accounting Policies:
Dreyfus Variable Investment Fund (the “fund”) is registered under the Investment Company Act of 1940, as amended (the “Act”), as an open-end management investment company, operating as a series company currently offering twelve series, including the Balanced Portfolio (the “portfolio”).The portfolio is only offered to separate accounts established by insurance companies to fund variable annuity contracts and variable life insurance policies.The portfolio is a diversified series.The portfolio’s investment objective seeks high total return through a combination of capital appreciation and current income.The Dreyfus Corporation (the “Manager” or “Dreyfus”) serves as the portfolio’s investment adviser. Dreyfus is a wholly-owned subsidiary of Mellon Financial Corporation (“Mellon Financial”).Wisconsin Capital Management LLC (“Wisconsin Capital”) serves as the portfolio’s sub-investment adviser.
Dreyfus Service Corporation (the “Distributor”), a wholly-owned subsidiary of the Manager, is the distributor of the portfolio’s shares, which are sold without a sales charge. The portfolio is authorized to issue an unlimited number of $.001 par value shares of Beneficial Interest in each of the following classes of shares: Initial and Service. Each class of shares has identical rights and privileges, except with respect to the distribution plan and the expenses borne by each class and certain voting rights. Income, expenses (other than expenses attributable to a specific class), and realized and unrealized gains or losses on investments are allocated to each class of shares based on its relative net assets.
The fund accounts separately for the assets, liabilities and operations of each series. Expenses directly attributable to each series are charged to that series’ operations; expenses which are applicable to all series are allocated among them on a pro rata basis.
The portfolio’s financial statements are prepared in accordance with U.S. generally accepted accounting principles, which may require the use of management estimates and assumptions.Actual results could differ from those estimates.
The fund enters into contracts that contain a variety of indemnifica-tions.The portfolio’s maximum exposure under these arrangements is unknown. The portfolio does not anticipate recognizing any loss related to these arrangements.
(a) Portfolio valuation: Most debt securities are valued each business day by an independent pricing service (the “Service”) approved by the Board of Trustees. Securities listed on the National Market System, for which market quotations are available are valued at the official closing price or, if there is no official closing price that day,at the last sale price.Debt securities for which quoted bid prices are readily available and are representative of the bid side of the market in the judgment of the Service are valued at the mean between the quoted bid prices (as obtained by the Service from dealers in such securities) and asked prices (as calculated by the Service based upon its evaluation of the market for such securities). Other debt securities are carried at fair value as determined by the Service, based on methods which include consideration of: yields or prices of securities of comparable quality, coupon, maturity and type; indications as to values from dealers; and general market conditions. Other securities are valued at the last sales price on the securities exchange or on the national securities market on which such securities are primarily traded. Securities listed on the National Market System for which market quotations are available are valued at the official closing price or, if there is no official closing price that day, at the last sales price. Securities not listed on an exchange or the national securities market, or securities for which there were no transactions, are valued at the average of the most recent bid and asked prices, except for open short positions, where the asked price is used for valuation purposes. Bid price is used when no asked price is available. Investments in registered companies are valued at their net asset value.When market quotations or official closing prices are not readily available, or are determined not to reflect accurately fair value, such as when the value of a security has been significantly affected by events after the close of the exchange or market on which the security is principally traded (for example, a foreign exchange or market), but before the portfolio calculates its net asset value, the portfolio may
The Portfolio 19
NOTES TO FINANCIAL STATEMENTS (Unaudited) (continued)
value these investments at fair value as determined in accordance with the procedures approved by the Board of Trustees. Fair valuing of securities may be determined with the assistance of a pricing service using calculations based on indices of domestic securities and other appropriate indicators, such as prices of relevant ADR’s and futures contracts. Investments denominated in foreign currencies are translated to U.S. dollars at the prevailing rates of exchange. For other securities that are fair valued by the Board of Trustees, certain factors may be considered such as: fundamental analytical data, the nature and duration of restrictions on disposition, an evaluation of the forces that influence the market in which the securities are purchased and sold, and public trading in similar securities of the issuer or comparable issuers. Financial futures are valued at the last sales price. Investments denominated in foreign currencies are translated to U.S. dollars at the prevailing rates of exchange. Forward currency exchange contracts are valued at the forward rate.
(b) Foreign currency transactions: The portfolio does not isolate that portion of the results of operations resulting from changes in foreign exchange rates on investments from the fluctuations arising from changes in market prices of securities held. Such fluctuations are included with the net realized and unrealized gain or loss on investments.
Net realized foreign exchange gains or losses arise from sales and maturities of short-term securities, sales of foreign currencies, currency gains or losses realized on securities transactions and the difference between the amounts of dividends, interest and foreign withholding taxes recorded on the portfolio’s books and the U.S. dollar equivalent of the amounts actually received or paid. Net unrealized foreign exchange gains or losses arise from changes in the value of assets and liabilities other than investments in securities, resulting from changes in exchange rates. Such gains and losses are included with net realized and unrealized gain or loss on investments.
(c) Securities transactions and investment income: Securities transactions are recorded on a trade date basis. Realized gain and loss from securities transactions are recorded on the identified cost basis. Dividend income is recognized on the ex-dividend date and interest income,
including, where applicable, accretion of discount and amortization of premium on investments, is recognized on the accrual basis.
The portfolio has an arrangement with the custodian bank whereby the portfolio receives earnings credits from the custodian when positive cash balances are maintained, which are used to offset custody fees. For financial reporting purposes, the portfolio includes net earnings credits, if any, as an expense offset in the Statement of Operations.
Pursuant to a securities lending agreement with Mellon Bank, N.A., an affiliate of Dreyfus, the portfolio may lend securities to qualified institutions. It is the portfolio’s policy, that at origination, all loans are secured by collateral of at least 102% of the value of U.S. securities loaned and 105% of the value of foreign securities loaned. Collateral equivalent to at least 100% of the market value of securities on loan is maintained at all times. Cash collateral is invested in certain money market mutual funds managed by Dreyfus.The portfolio is entitled to receive all income on securities loaned, in addition to income earned as a result of the lending transaction. Although each security loaned is fully collateralized, the portfolio bears the risk of delay in recovery of, or loss of rights in, the securities loaned should a borrower fail to return the securities in a timely manner.
(d) Affiliated issuers: Investments in other investment companies advised by Dreyfus are defined as “affiliated” in the Act.
(e) Dividends to shareholders: Dividends are recorded on the ex-dividend date. Dividends from investment income-net are declared and paid quarterly. Dividends from net realized capital gain, if any, are normally declared and paid annually, but the portfolio may make distributions on a more frequent basis to comply with the distribution requirements of the Internal Revenue Code of 1986, as amended (the “Code”).To the extent that net realized capital gain can be offset by capital loss carryovers, it is the policy of the portfolio not to distribute such gain. Income and capital gain distributions are determined in accordance with income tax regulations, which may differ from U.S. generally accepted accounting principles.
The Portfolio 21
NOTES TO FINANCIAL STATEMENTS (Unaudited) (continued)
(f) Federal income taxes: It is the policy of the portfolio to continue to qualify as a regulated investment company, if such qualification is in the best interests of its shareholders, by complying with the applicable provisions of the Code, and to make distributions of taxable income sufficient to relieve it from substantially all federal income and excise taxes.
The portfolio has an unused capital loss carryover of $14,909,425 available for federal income tax purposes to be applied against future net securities profits, if any, realized subsequent to December 31, 2005. If not applied, $2,741,702 of the carryover expires in fiscal 2009, $8,289,370 expires in fiscal 2010 and $3,878,353 expires in fiscal 2011.
The tax character of distributions paid to shareholders during the fiscal year ended December 31, 2005 were as follows: ordinary income $1,249,668. The tax character of current year distributions will be determined at the end of the current fiscal year.
NOTE 2—Bank Line of Credit:
|
The portfolio participates with other Dreyfus-managed funds in a $350 million redemption credit facility (the “Facility”) to be utilized for temporary or emergency purposes, including the financing of redemptions. In connection therewith, the portfolio has agreed to pay commitment fees on its pro rata portion of the Facility. Interest is charged to the portfolio based on prevailing market rates in effect at the time of borrowing.
The average daily amount of borrowings outstanding under the Facility during the period ended June 30, 2006, was approximately $12,800, with a related weighted average annualized interested rate of 5.33% .
NOTE 3—Investment Advisory Fee and Other Transactions With Affiliates:
(a) Pursuant to an Investment Advisory Agreement with Dreyfus, the investment advisory fee is computed at the annual rate of .75% of the value of the portfolio’s average daily net assets and is payable monthly.
Dreyfus has agreed, from January 1, 2006 to December 31, 2006, to waive receipt of its fees and/or assume the expenses of the portfolio so
that the expenses of neither class, exclusive of taxes, brokerage fees, interest on borrowings, commitment fees and extraordinary expenses, exceed 1% of the value of the average daily net assets of their class. During the period ended June 30, 2006, Dreyfus waived receipt of fees of $14,923 pursuant to the undertaking.
Pursuant to a Sub-Investment Advisory Agreement between Dreyfus and Wisconsin Capital, the sub-investment advisory fee is payable monthly by Dreyfus, and is based upon the value of the portfolio’s average daily net assets, computed at the following annual rates:
| Average Net Assets | | |
| 0 to $300 million | | .25% |
| In excess of $300 million | | .20% |
(b) Under the Distribution Plan (the “Plan”) adopted pursuant to Rule 12b-1 under the Act, Service shares pay the Distributor for distributing their shares, for servicing and/or maintaining Service shares shareholder accounts and for advertising and marketing for Service shares.The Plan provides for payments to be made at an annual rate of .25% of the value of the Service shares’ average daily net assets.The Distributor may make payments to Participating Insurance Companies and to brokers and dealers acting as principal underwriter for their variable insurance products.The fees payable under the Plan are payable without regard to actual expenses incurred. During the period ended June 30, 2006, Service shares were charged $22,074 pursuant to the Plan.
The portfolio compensates Dreyfus Transfer, Inc., a wholly-owned subsidiary of Dreyfus, under a transfer agency agreement for providing personnel and facilities to perform transfer agency services for the portfolio. During the period ended June 30, 2006, the portfolio was charged $26 pursuant to the transfer agency agreement.
The portfolio compensates Mellon Bank, N.A., an affiliate of Dreyfus, under a custody agreement for providing custodial services for the portfolio. During the period ended June 30, 2006, the portfolio was charged $3,560 pursuant to the custody agreement.
The Portfolio 23
NOTES TO FINANCIAL STATEMENTS (Unaudited) (continued)
During the period ended June 30, 2006, the portfolio was charged $1,926 for services performed by the Chief Compliance Officer.
The components of Due to The Dreyfus Corporation and affiliates in the Statement of Assets and Liabilities consist of: investment advisory fees $37,852, Rule 12b-1 distribution plan fees $3,516, custodian fees $3,092, chief compliance officer fees $1,926 and transfer agency per account fees $10, which are offset against an expense reimbursement currently in effect in the amount of $1,923.
(c) Each Board member also serves as a Board member of other funds within the Dreyfus complex. Annual retainer fees and attendance fees are allocated to each fund based on net assets.
(d) Pursuant to an exemptive order from the SEC, the portfolio may invest its available cash balances in affiliated money market mutual funds. Management fees of the underlying money market mutual fund have been waived by Dreyfus.
NOTE 4—Securities Transactions:
|
The aggregate amount of purchases and sales (including paydowns) of investment securities, excluding short-term securities, during the period ended June 30, 2006, amounted to $11,647,198 and $17,429,932, respectively.
At June 30, 2006, accumulated net unrealized appreciation on investments was $1,293,863, consisting of $4,238,772 gross unrealized appreciation and $2,944,909 gross unrealized depreciation.
At June 30,2006,the cost of investments for federal income tax purposes was substantially the same as the cost for financial reporting purposes (see the Statement of Investments).
PROXY RESULTS ( U n a u d i t e d )
|
Dreyfus Variable Investment Fund held a special meeting of shareholders on June 29, 2006.The proposal considered at the meeting, and the results, are as follows:
| | | | | Shares | | |
| |
| |
| |
|
| | | For | | | | Authority Withheld |
| |
| |
| |
|
| To elect additional Board Members: | | | | | | |
| Peggy C. Davis † | | 171,078,926.558 | | | | 7,687,714.085 |
| Joseph S. DiMartino | | 170,946,484.400 | | | | 7,820,156.243 |
| David P. Feldman | | 170,959,920.714 | | | | 7,806,719.929 |
| Ehud Houminer † | | 170,132,086.682 | | | | 8,634,553.961 |
| Gloria Messinger † | | 170,187,240.710 | | | | 8,579,399.933 |
| Anne Wexler † | | 170,212,607.472 | | | | 8,554,033.171 |
| † Each will serve as an Independent Board member of the fund commencing, subject to the discretion of the Board, on |
| or about January 1, 2007. |
| In addition to Joseph S. DiMartino and David P. Feldman, James F. Henry, Dr. Paul A. Marks and Dr. Martin |
| Peretz continue as Board members of the fund. |
The Portfolio 25
| INFORMATION ABOUT THE REVIEW | | |
| AND APPROVAL OF THE PORTFOLIO’S | | |
| I N V E S T M E N T A DV I S O RY A G R E E M E N T | | (Unaudited) |
At a meeting of the fund’s Board of Trustees held on June 7 and 8, 2006, the Board considered the re-approval for an annual period (through July 31, 2007) of the fund’s Investment Advisory Agreement with Dreyfus for the portfolio, pursuant to which Dreyfus provides the portfolio with investment advisory and administrative services, and the Sub-Investment Advisory Agreement (the “Sub-Advisory Agreement”) between Dreyfus and Wisconsin Capital Management LLC (the “Sub-Adviser”), pursuant to which the Sub-Adviser provides day-to-day management of the portfolio’s investments subject to Dreyfus’ over-sight.The Board members, none of whom are “interested persons” (as defined in the Investment Company Act of 1940, as amended) of the fund were assisted in their review by independent legal counsel and met with counsel in executive session separate from representatives of Dreyfus and the Sub-Adviser.
Analysis of Nature, Extent and Quality of Services Provided to the Portfolio. The Board members received a presentation from representatives of Dreyfus regarding services provided to the portfolio and other funds in the Dreyfus fund complex, and discussed the nature, extent and quality of the services provided to the portfolio pursuant to its Investment Advisory Agreement and by the Sub-Adviser pursuant to the Sub-Advisory Agreement. Dreyfus’ representatives reviewed the portfolio’s distribution of accounts and the relationships Dreyfus has with various intermediaries and the different needs of each.The Board noted that the portfolio’s shares were offered only to separate accounts established by insurance companies to fund variable annuity contracts and variable life insurance policies. Dreyfus’ representatives noted the diversity of distribution among the funds in the Dreyfus fund complex, and Dreyfus’ corresponding need for broad, deep, and diverse resources to be able to provide ongoing shareholder services to each distribution channel, including that of the portfolio. Dreyfus also provided the number of separate accounts investing in the portfolio, as well as the portfolio’s asset size.
The Board members also considered the Sub-Adviser’s research and portfolio management capabilities and that Dreyfus also provides over-
sight of day-to-day portfolio operations, including fund accounting and administration and assistance in meeting legal and regulatory requirements.The Board members also considered Dreyfus’ extensive administrative, accounting and compliance infrastructure, as well as Dreyfus’ supervisory activities over the Sub-Adviser.
Comparative Analysis of the Portfolio’s Performance and Advisory Fee and Expense Ratio. The Board members reviewed the portfolio’s performance and placed significant emphasis on comparisons to a group of mixed-asset target allocation growth funds underlying variable insurance products (the “Performance Group”) and to a larger universe of funds, consisting of all mixed-asset target allocation growth funds underlying variable insurance products (the “Performance Universe”) selected and provided by Lipper, Inc., an independent provider of investment company data.The Board was provided with a description of the methodology Lipper used to select the Performance Group and Performance Universe, as well as the Expense Group and Expense Universe (discussed below).The Board members discussed the results of the comparisons for various periods ended April 30, 2006, and noted that the portfolio’s total return performance for its Initial shares below the medians of the Performance Group and the Performance Universe in each of the last five years, which included the period from December 2004 when the Sub-Adviser became the portfolio’s sub-adviser. The Board discussed with the representatives of Dreyfus and the Sub-Adviser the investment strategy employed by the Sub-Adviser in the management of the portfolio’s assets and how that strategy affected the portfolio’s performance since December 2004. The Board noted that the portfolio produced lower returns than its benchmark, primarily due to the portfolio’s focus on blue-chip stocks, which, despite attractive valuations and strong business fundamentals, continued to lag smaller, more economically sensitive companies.The Board members took into account the Sub-Adviser’s experience and generally competitive performance of the Sub-Adviser, as compared to the benchmark, over the last eight calendar years of a similarly managed balanced fund managed by the Sub-Adviser. The Dreyfus representatives noted that the Sub-
The Portfolio 27
| I N FO R M AT I O N A B O U T T H E R E V I E W A N D A P P R OVA L O F T H E P O R T FO L I O ’ S |
| I N V E S T M E N T A DV I S O RY A G R E E M E N T ( U n a u d i t e d ) ( c o n t i n u e d ) |
Adviser’s investment approach has historically tended to be better in down markets than in up markets and referred to the performance of the similar balanced fund compared to the benchmark. The Dreyfus representatives also presented the Board with the portfolio’s total return performance and the quartile, percentile and rank of the portfolio’s total return within its Lipper category (as provided by Lipper) for certain other periods ended April 30, 2006, and noted that, for the most recent three-, four- and six-month periods, the portfolio’s relative performance was showing some improvement.
The Board members also discussed the portfolio’s advisory fee and the sub-advisory fee (paid by Dreyfus) and the expense ratio for each class of shares and reviewed the range of advisory fees and expense ratios of a comparable group of funds (the “Expense Group”) and a broader group of funds (the “Expense Universe”), each selected and provided by Lipper.The Board members noted that the portfolio’s advisory fee was higher than its Expense Group and Expense Universe medians, and that the expense ratios for the Initial shares and Service shares were higher than the Expense Group and Expense Universe medians. The Board noted Dreyfus’ current undertaking to waive or reimburse certain fees and expenses, which reduced the expense ratio for each share class.The Board also noted that the Sub-Adviser’s fee is paid by Dreyfus and not the portfolio.
Representatives of Dreyfus reviewed with the Board members the advisory fees paid to Dreyfus or its affiliates by mutual funds managed by Dreyfus or its affiliates with similar investment objectives, policies and strategies and included within the portfolio’s Lipper category (the “Similar Funds”), and by other accounts managed by Dreyfus or its affiliates or the Sub-Adviser or its affiliates with similar investment objectives, policies and strategies as the portfolio (the “Similar Accounts”). Dreyfus representatives explained the nature of the Similar Accounts and the differences, from Dreyfus’ and the Sub-Adviser’s perspective, as applicable, in providing services to such Similar Accounts as compared to managing and providing services to the portfolio. Dreyfus’
representatives also reviewed the costs associated with distribution through intermediaries.The Board analyzed differences in fees paid to Dreyfus and the Sub-Adviser and discussed the relationship of the fees paid in light of the services provided.The Board members considered the relevance of the fee information provided for the Similar Funds and Similar Accounts managed by Dreyfus and the Sub-Adviser to evaluate the appropriateness and reasonableness of the portfolio’s investment advisory fee and sub-advisory fee. The Board acknowledged that the differences in fees paid by the Similar Accounts seemed to be consistent with the services provided.The Board considered the fee paid to the Sub-Adviser in relation to the fee paid to Dreyfus and the respective services provided by the Sub-Adviser and Dreyfus.
Analysis of Profitability and Economies of Scale. Dreyfus’ representatives reviewed the dollar amount of expenses allocated and profit received by Dreyfus and the method used to determine such expenses and profit.The Board considered information, previously provided and discussed, prepared by an independent consulting firm regarding Dreyfus’ approach to allocating costs to, and determining the profitability of, individual funds and the entire Dreyfus mutual fund complex. The Board members also considered that the methodology had also been reviewed by an independent registered public accounting firm which, like the consultant, found the methodology to be reasonable. The consulting firm also analyzed where any economies of scale might emerge in connection with the management of the portfolio. The Board members evaluated the profitability analysis in light of the relevant circumstances for the portfolio and the extent to which economies of scale would be realized if the portfolio grows and whether fee levels reflect these economies of scale for the benefit of portfolio investors. The Board members also considered potential benefits to Dreyfus from acting as investment adviser and to the Sub-Adviser from acting as sub-adviser and noted the soft dollar arrangements with respect to trading the portfolio’s investments.
The Portfolio 29
| I N FO R M AT I O N A B O U T T H E R E V I E W A N D A P P R OVA L O F T H E P O R T FO L I O ’ S |
| I N V E S T M E N T A DV I S O RY A G R E E M E N T ( U n a u d i t e d ) ( c o n t i n u e d ) |
It was noted that the Board members should consider Dreyfus’ profitability with respect to the portfolio as part of their evaluation of whether the fees under the Investment Advisory Agreement and the Sub-Advisory Agreement bear a reasonable relationship to the mix of services provided by Dreyfus and the Sub-Adviser, including the nature, extent and quality of such services and that a discussion of economies of scale is predicated on increasing assets and that, if a fund’s assets had been decreasing, the possibility that Dreyfus may have realized any economies of scale would be less. It also was noted that the profitability percentage for managing the portfolio was within ranges determined by appropriate court cases to be reasonable given the services rendered and generally superior service levels provided by Dreyfus and the Sub-Adviser. The Board also noted the fee waiver and expense reimbursement arrangements and its effect on Dreyfus’ profitability.
At the conclusion of these discussions, the Board agreed that it had been furnished with sufficient information to make an informed business decision with respect to continuation of the Investment Advisory Agreement and Sub-Advisory Agreement, with respect to the portfolio. Based on the discussions and considerations as described above, the Board made the following conclusions and determinations.
- The Board concluded that the nature, extent and quality of the services provided by Dreyfus and the Sub-Adviser are adequate and appropriate.
- While the Board was concerned with the portfolio’s performance, it noted the portfolio’s focus on blue chip stocks, the Sub-Adviser’s investment approach and longer-term performance record with a similar fund, and recent performance improvement, but stressed the need to continue to improve the portfolio’s performance.
- The Board concluded that the fee paid by the portfolio to Dreyfus, and the fee paid by Dreyfus to the Sub-Adviser, were reasonable in light of the services provided, comparative performance, expense and advisory fee information, including Dreyfus’s undertaking to waive or reimburse certain fees and expenses (which reduced the expense ratios of the Initial shares and the Service shares), costs of the services provided and profits to be realized and benefits derived or to be derived by Dreyfus and the Sub-Adviser from their rela- tionships with the portfolio.
- The Board determined that the economies of scale which may accrue to Dreyfus and its affiliates in connection with the management of the portfolio had been adequately considered by Dreyfus in connection with the advisory fee rate charged to the portfolio and that, to the extent in the future it were determined that material economies of scale had not been shared with the portfolio, the Board would seek to have those economies of scale shared with the portfolio.
The Board members considered these conclusions and determinations, along with information received on a routine and regular basis throughout the year, and, without any one factor being dispositive, the Board determined that re-approval of the portfolio’s Investment Advisory Agreement and Sub-Advisory Agreement was in the best interests of the portfolio and its shareholders.
The Portfolio 31
NOTES
| Dreyfus Variable |
| Investment Fund, |
| Balanced Portfolio |
| 200 Park Avenue |
| New York, NY 10166 |
| |
| Investment Adviser |
| The Dreyfus Corporation |
| 200 Park Avenue |
| New York, NY 10166 |
| |
| Sub-Investment Adviser |
| Wisconsin Capital Management LLC |
| 1200 John Q. Hammons Drive |
| Madison,Wisconsin 53717 |
| Custodian |
| Mellon Bank, N.A. |
| One Mellon Bank Center |
| Pittsburgh, PA 15258 |
| |
| Transfer Agent & |
| Dividend Disbursing Agent |
| Dreyfus Transfer, Inc. |
| 200 Park Avenue |
| New York, NY 10166 |
| |
| Distributor |
| Dreyfus Service Corporation |
| 200 Park Avenue |
| New York, NY 10166 |
Telephone 1-800-554-4611 or 516-338-3300
Mail The Dreyfus Family of Funds, 144 Glenn Curtiss Boulevard, Uniondale, NY 11556-0144 Attn: Investments Division
The portfolio files its complete schedule of portfolio holdings with the Securities and Exchange Commission (“SEC”) for the first and third quarters of each fiscal year on Form N-Q. The portfolio’s Forms N-Q are available on the SEC’s website at http://www.sec.gov and may be reviewed and copied at the SEC’s Public Reference Room in Washington, DC. Information on the operation of the Public Reference Room may be obtained by calling 1-202-551-8090.
A description of the policies and procedures that the portfolio uses to determine how to vote proxies relating to portfolio securities, and information regarding how the portfolio voted these proxies for the 12-month period ended June 30, 2006, is available at http://www.dreyfus.com and on the SEC’s website at http://www.sec.gov. The description of the policies and procedures is also available without charge, upon request, by calling 1-800-645-6561.
| © 2006 Dreyfus Service Corporation |

The views expressed in this report reflect those of the portfolio manager only through the end of the period covered and do not necessarily represent the views of Dreyfus or any other person in the Dreyfus organization.Any such views are subject to change at any time based upon market or other conditions and Dreyfus disclaims any responsibility to update such views. These views may not be relied on as investment advice and, because investment decisions for a Dreyfus portfolio are based on numerous factors, may not be relied on as an indication of trading intent on behalf of any Dreyfus portfolio.
Not FDIC-Insured • Not Bank-Guaranteed • May Lose Value
| | | Contents |
| |
| | | T H E P O R T F O L I O |
| |
|
| 2 | | Letter from the Chairman |
| 3 | | Discussion of Performance |
| 6 | | Understanding Your Portfolio’s Expenses |
| 6 | | Comparing Your Portfolio’s Expenses |
| | | With Those of Other Funds |
| 7 | | Statement of Investments |
| 15 | | Statement of Assets and Liabilities |
| 16 | | Statement of Operations |
| 17 | | Statement of Changes in Net Assets |
| 19 | | Financial Highlights |
| 21 | | Notes to Financial Statements |
| 27 | | Proxy Results |
| 28 | | Information About the Review |
| and Approval of the Portfolio’s |
| Investment Advisory Agreement |
| | | F O R M O R E I N F O R M AT I O N |
| |
|
| | | Back Cover |
| Dreyfus Variable Investment Fund, |
| Developing Leaders Portfolio |

LETTER FROM THE CHAIRMAN
We are pleased to present this semiannual report for Dreyfus Variable Investment Fund, Developing Leaders Portfolio, covering the six-month period from January 1, 2006, through June 30, 2006.
Stock market gains over the first four months of 2006 were given back in May and June, when investors reacted negatively to suggestions that the U.S. Federal Reserve Board (the “Fed”) and other central banks, in their fight against inflation, might raise short-term interest rates more than previously expected. In the judgment of our Chief Economist, Richard Hoey, the recent correction reflects an adjustment among leveraged investors toward lower risk levels as the U.S. economy moves into a more mature phase with milder rates of growth. In our view, corrections such as these generally are healthy mechanisms that help wring speculative excesses from the financial markets, potentially setting the stage for future rallies.
While a recession currently appears unlikely, a number of economic uncertainties remain. Indicators to watch in the months ahead include the outlook for inflation, the extent of softness in the U.S. market, the impact of slower economic growth on consumer spending, additional changes in interest rates from the Fed and other central banks, and the strength of the U.S. dollar relative to other major currencies. As always, we encourage you to discuss these and other investment-related issues with your financial advisor, who can help you prepare for the challenges and opportunities that lie ahead.
For information about how the fund performed during the reporting period, as well as market perspectives, we have provided a Discussion of Fund Performance given by the fund’s portfolio manager.
Thank you for your continued confidence and support.

DISCUSSION OF PERFORMANCE
Franklin Portfolio Associates Smallcap Team, Portfolio Managers
How did Dreyfus Variable Investment Fund, Developing Leaders Portfolio perform relative to its benchmark?
For the six-month period ended June 30, 2006, the portfolio produced total returns of –1.73% for its Initial shares and –1.86% for its Service shares.1 In comparison, the Russell 2000 Index (the “Index”), the portfolio’s benchmark, produced a total return of 8.21% for the same period.2
We attribute the small-cap market’s gains to continuing U.S. economic growth, which helped many small-cap companies achieve better-than-expected earnings and revenues. However, the market’s advance proved to be choppy in the face of rising interest rates, increasing inflationary pressures and volatile investor sentiment. In this challenging environment, the market tended to reward companies that exceeded earnings expectations and offered positive guidance. Stocks of companies that reported disappointing financial results or weak business conditions were sharply punished, particularly in areas out of favor with investors.While the portfolio invested in some of the market’s better performers, several notably weak holdings concentrated in the consumer durables and technology sectors caused returns to lag substantially behind the benchmark.
What is the portfolio’s investment approach?
The portfolio employs an investment process based on a “bottom-up” approach that seeks to identify undervalued small-cap stocks using a quantitative screening process. This process is driven by a proprietary quantitative model which uses over 40 factors to identify and rank stocks based on:
- fundamental momentum, meaning measures that reflect the changes in short-term earnings outlook through factors such as revised earn- ings estimates and earnings surprises;
- relative value, such as current and forecasted price-to-earnings ratios, price-to-book ratios, yields and other price-sensitive data for a stock compared to its past, its peers and the models’ overall stock universe;
- future value, such as discounted present value measures;
- long-term growth, based on measures that reflect the changes in esti- mated long-term earnings growth over multiple horizons; and
The Portfolio 3
DISCUSSION OF PERFORMANCE (continued)
|
- additional factors, such as technical factors, trading by company insiders or share issuance/buy-back data.
Next, through a bottom-up approach, the portfolio managers focus on stock selection as opposed to making proactive decisions about industry or sector exposure. Over time, the portfolio managers attempt to construct a portfolio that has exposure to industries and market capitalizations that is generally similar to the portfolio’s benchmark. Finally, within each sector, the portfolio managers seek to overweight the most attractive stocks and underweight or not hold the stocks that have been ranked least attractive.
What other factors influenced the portfolio’s performance?
The small-cap stock market encountered heightened volatility during the reporting period, rising and falling in response to changing economic news and shifting investor sentiment. For example, after climbing more than 10% during the first four months of the reporting period, the Index dipped close to its January 1, 2006, level in early June. Only a late surge during the final week of June enabled the market to post a significant gain.
The portfolio’s sector-neutral profile closely mirrored that of its benchmark, sharply limiting its relative exposure to fluctuations among industries and sectors. Accordingly, returns compared to the benchmark were largely determined by our security selection strategy. Unfortunately, several of the portfolio’s holdings in the consumer discretionary and technology sectors, two of the market’s weaker sectors, announced earnings disappointments or issued negative guidance regarding future business prospects. Disappointments in the consumer discretionary sector included apparel manufacturer Warnaco and specialty retailers Talbots, Pacific Sunwear of California, Finish Line and Conn’s. Among technology holdings, returns were adversely affected by declines in semiconductor makers Power Integrations and PortalPlayer; mapping software developer Intergraph; and electronics manufacturer Multi-Fineline Electronix. In addition, the portfolio’s shares in homebuilder Brookfield Homes declined over concerns regarding a slowdown in the housing market.
On a more positive note, the portfolio captured relatively strong returns from individual holdings in several other areas, particularly in the better-performing industrial and energy sectors. Among industrial stocks, robust economic growth helped boost the fortunes of some top per-
formers, such as machinery parts manufacturers Gardner Denver and Intevac, as well as defense and aerospace contractors Triumph Group and Armor Holdings. In the energy sector, rising oil and gas prices benefited the financial results of oilfield services provider W-H Energy Services as well as several oil refiners. Finally, in the financials sector,Texas Regional Bancshares gained ground when it agreed to be acquired by Spanish financial services provider Banco Bilbao Vizcaya Argentaria SA.
What is the portfolio’s current strategy?
We have remained focused on adding value through our bottom-up, quantitatively based investment process, which strives to identify the market’s more promising small-cap investment opportunities within each sector and industry. In addition, our disciplined investment approach is designed to evenly balance growth and value factors when identifying stocks that we consider reasonably valued and poised for above-average growth. At the same time, we have maintained the portfolio’s sector-neutral profile, approximating both the sector and industry composition of the benchmark.
| | | The portfolio is only available as a funding vehicle under various life insurance policies or variable |
| | | annuity contracts issued by insurance companies. Individuals may not purchase shares of the |
| | | portfolio directly.A variable annuity is an insurance contract issued by an insurance company that |
| | | enables investors to accumulate assets on a tax-deferred basis for retirement or other long-term goals. |
| | | The investment objective and policies of Dreyfus Variable Investment Fund, Developing Leaders |
| | | Portfolio made available through insurance products may be similar to other funds/portfolios |
| | | managed or advised by Dreyfus. However, the investment results of the portfolio may be higher or |
| | | lower than, and may not be comparable to, those of any other Dreyfus fund/portfolio. |
| 1 | | Total return includes reinvestment of dividends and any capital gains paid. Past performance is no |
| | | guarantee of future results. Share price and investment return fluctuate such that upon redemption, |
| | | portfolio shares may be worth more or less than their original cost.The portfolio’s performance does |
| | | not reflect the deduction of additional charges and expenses imposed in connection with investing |
| | | in variable insurance contracts, which will reduce returns. |
| | | Part of the portfolio’s recent performance is attributable to positive returns from its initial |
| | | public offering (IPO) investments.There can be no guarantee that IPOs will have or |
| | | continue to have a positive effect on portfolio performance. |
| 2 | | SOURCE: LIPPER INC. — Reflects reinvestment of dividends and, where applicable, capital |
| | | gain distributions.The Russell 2000 Index is an unmanaged index of small-cap stock |
| | | performance and is composed of the 2,000 smallest companies in the Russell 3000 Index.The |
| | | Russell 3000 Index is composed of the 3,000 largest U.S. companies based on total market |
| | | capitalization. |
| | | Franklin Portfolio Associates is an independently managed, wholly owned subsidiary of Mellon |
| | | Financial Corporation. Franklin Portfolio Associates has no affiliation to the Franklin Templeton |
| | | Group of Funds or Franklin Resources, Inc.The portfolio’s managers are dual employees of |
| | | Franklin Portfolio Associates and Dreyfus. |
The Portfolio 5
UNDERSTANDING YOUR
PORTFOLIO’S EXPENSES (Unaudited)
As a mutual fund investor, you pay ongoing expenses, such as management fees and other expenses. Using the information below, you can estimate how these expenses affect your investment and compare them with the expenses of other funds.You also may pay one-time transaction expenses, including sales charges (loads) and redemption fees,which are not shown in this section and would have resulted in higher total expenses. For more information, see your portfolio’s prospectus or talk to your financial adviser.
Review your portfolio’s expenses
|
The table below shows the expenses you would have paid on a $1,000 investment in Dreyfus Variable Investment Fund, Developing Leaders Portfolio from January 1, 2006 to June 30, 2006. It also shows how much a $1,000 investment would be worth at the close of the period, assuming actual returns and expenses.
| Expenses and Value of a $1,000 Investment | | |
| assuming actual returns for the six months ended June 30, 2006 | | |
| | | Initial Shares | | Service Shares |
| |
| |
|
| Expenses paid per $1,000 † | | $ 3.88 | | $ 5.11 |
| Ending value (after expenses) | | $982.70 | | $981.40 |
COMPARING YOUR PORTFOLIO’S EXPENSES WITH THOSE OF OTHER FUNDS (Unaudited)
Using the SEC’s method to compare expenses
The Securities and Exchange Commission (SEC) has established guidelines to help investors assess fund expenses. Per these guidelines, the table below shows your portfolio’s expenses based on a $1,000 investment, assuming a hypothetical 5% annualized return. You can use this information to compare the ongoing expenses (but not transaction expenses or total cost) of investing in the portfolio with those of other funds. All mutual fund shareholder reports will provide this information to help you make this comparison. Please note that you cannot use this information to estimate your actual ending account balance and expenses paid during the period.
Expenses and Value of a $1,000 Investment assuming a hypothetical 5% annualized return for the six months ended June 30, 2006
| | | Initial Shares | | Service Shares |
| |
| |
|
| Expenses paid per $1,000 † | | $ 3.96 | | $ 5.21 |
| Ending value (after expenses) | | $1,020.88 | | $1,019.64 |
| † Expenses are equal to the portfolio’s annualized expense ratio of .79% for Initial shares and 1.04% for Service shares, |
| multiplied by the average account value over the period, multiplied by 181/365 (to reflect the one-half year period). |
STATEMENT OF INVESTMENTS
June 30, 2006 (Unaudited)
|
| Common Stocks—99.8% | | Shares | | Value ($) |
| |
| |
|
| Commercial & Professional Services—7.1% | | |
| Agilysys | | 223,100 | | 4,015,800 |
| Brightpoint | | 295,180 a | | 3,993,785 |
| CRA International | | 29,200 a | | 1,318,088 |
| Handleman | | 116,600 b | | 950,290 |
| IKON Office Solutions | | 458,500 b | | 5,777,100 |
| Kforce | | 205,600 a | | 3,184,744 |
| LECG | | 48,800 a | | 901,336 |
| MPS Group | | 179,500 a | | 2,703,270 |
| Performance Food Group | | 234,800 a,b | | 7,133,224 |
| Portfolio Recovery Associates | | 121,100 a,b | | 5,534,270 |
| Resources Connection | | 95,700 a | | 2,394,414 |
| Ritchie Brothers Auctioneers | | 78,300 | | 4,163,994 |
| Rush Enterprises, Cl. A | | 113,200 a | | 2,056,844 |
| Spherion | | 450,700 a | | 4,110,384 |
| Viad | | 46,400 | | 1,452,320 |
| | | | | 49,689,863 |
| Communications—1.9% | | | | |
| Centennial Communications | | 222,700 | | 1,158,040 |
| Commonwealth Telephone Enterprises | | 90,600 b | | 3,004,296 |
| CT Communications | | 74,000 | | 1,692,380 |
| SBA Communications, Cl. A | | 216,276 a | | 5,653,455 |
| Talk America Holdings | | 275,800 a,b | | 1,707,202 |
| | | | | 13,215,373 |
| Consumer Durables—2.6% | | | | |
| Brookfield Homes | | 133,500 b | | 4,398,825 |
| Charles & Colvard | | 90,625 b | | 954,281 |
| Thor Industries | | 153,700 | | 7,446,765 |
| WMS Industries | | 202,600 a,b | | 5,549,214 |
| | | | | 18,349,085 |
| Consumer Non-Durables—1.2% | | | | |
| Mannatech | | 211,000 b | | 2,660,710 |
| USANA Health Sciences | | 151,200 a,b | | 5,730,480 |
| | | | | 8,391,190 |
The Portfolio 7
STATEMENT OF INVESTMENTS (Unaudited) (continued)
| Common Stocks (continued) | | Shares | | Value ($) |
| |
| |
|
| Consumer Services—4.3% | | | | |
| Corinthian Colleges | | 261,600 a | | 3,756,576 |
| Jack in the Box | | 100,000 a,b | | 3,920,000 |
| Lakes Entertainment | | 59,500 a | | 719,355 |
| Pinnacle Entertainment | | 210,400 a | | 6,448,760 |
| Ryan’s Restaurant Group | | 95,300 a | | 1,135,023 |
| Sinclair Broadcast Group, Cl. A | | 511,400 | | 4,377,584 |
| Six Flags | | 347,300 a,b | | 1,951,826 |
| Vail Resorts | | 138,000 a | | 5,119,800 |
| World Wrestling Entertainment | | 146,700 | | 2,477,763 |
| | | | | 29,906,687 |
| Electronic Technology—12.5% | | | | |
| AAR | | 81,500 a,b | | 1,811,745 |
| ADE | | 128,500 a | | 4,174,965 |
| ADTRAN | | 216,800 b | | 4,862,824 |
| Aeroflex | | 382,300 a,b | | 4,461,441 |
| American Science & Engineering | | 76,800 a,b | | 4,448,256 |
| Armor Holdings | | 73,200 a,b | | 4,013,556 |
| Broadwing | | 250,700 a | | 2,594,745 |
| Coherent | | 113,300 a,b | | 3,821,609 |
| Exar | | 392,066 a | | 5,202,716 |
| Foundry Networks | | 425,500 a | | 4,535,830 |
| Intevac | | 170,700 a | | 3,700,776 |
| Komag | | 79,300 a,b | | 3,662,074 |
| MIPS Technologies | | 270,200 a | | 1,640,114 |
| Multi-Fineline Electronix | | 143,700 a,b | | 4,769,403 |
| Newport | | 118,600 a | | 1,911,832 |
| Orbital Sciences | | 220,400 a | | 3,557,256 |
| Power Integrations | | 303,500 a | | 5,305,180 |
| Semtech | | 88,100 a | | 1,273,045 |
| Silicon Image | | 493,100 a,b | | 5,315,618 |
| Spectralink | | 263,900 | | 2,327,598 |
| Trident Microsystems | | 347,000 a | | 6,586,060 |
| Triumph Group | | 112,800 a | | 5,414,400 |
| Common Stocks (continued) | | Shares | | | | Value ($) |
| |
| |
| |
|
| Electronic Technology (continued) | | | | | | |
| Vicor | | 131,000 | | | | 2,170,670 |
| | | | | | | 87,561,713 |
| Energy Minerals—1.3% | | | | | | |
| Cabot Oil & Gas | | 80,850 | | | | 3,961,650 |
| Harvest Natural Resources | | 397,800 | | a,b | | 5,386,212 |
| | | | | | | 9,347,862 |
| Finance—23.1% | | | | | | |
| Arbor Realty Trust | | 156,300 | | | | 3,915,315 |
| BankUnited Financial, Cl. A | | 80,400 | | | | 2,453,808 |
| Boston Private Financial Holdings | | 194,300 | | | | 5,420,970 |
| Boykin Lodging | | 154,100 | | a | | 1,678,149 |
| Citizens Banking | | 72,300 | | b | | 1,764,843 |
| CompuCredit | | 144,600 | | a,b | | 5,558,424 |
| Corus Bankshares | | 264,000 | | b | | 6,911,520 |
| Equity Inns | | 248,300 | | | | 4,111,848 |
| FelCor Lodging Trust | | 309,200 | | | | 6,722,008 |
| First Bancorp/Puerto Rico | | 275,900 | | | | 2,565,870 |
| First Community Bancorp/CA | | 103,600 | | | | 6,120,688 |
| First Midwest Bancorp/IL | | 131,200 | | | | 4,864,896 |
| First Niagara Financial Group | | 450,900 | | b | | 6,321,618 |
| First Republic Bank/San Francisco, CA | | 47,800 | | b | | 2,189,240 |
| FirstFed Financial | | 127,800 | | a,b | | 7,370,226 |
| Fremont General | | 374,800 | | b | | 6,956,288 |
| Getty Realty | | 97,400 | | | | 2,770,056 |
| HomeBanc/Atlanta, GA | | 236,800 | | b | | 1,880,192 |
| Inland Real Estate | | 326,700 | | b | | 4,861,296 |
| Innkeepers USA Trust | | 298,000 | | | | 5,149,440 |
| Investment Technology Group | | 41,000 | | a | | 2,085,260 |
| Knight Capital Group, Cl. A | | 511,200 | | a | | 7,785,576 |
| LandAmerica Financial Group | | 51,200 | | b | | 3,307,520 |
| LaSalle Hotel Properties | | 95,800 | | | | 4,435,540 |
| LTC Properties | | 80,400 | | | | 1,796,940 |
| MAF Bancorp | | 143,600 | | | | 6,151,824 |
The Portfolio 9
STATEMENT OF INVESTMENTS (Unaudited) (continued)
| Common Stocks (continued) | | Shares | | Value ($) |
| |
| |
|
| Finance (continued) | | | | |
| National Health Investors | | 75,900 | | 2,040,951 |
| National Retail Properties | | 253,900 | | 5,065,305 |
| Ohio Casualty | | 155,200 | | 4,614,096 |
| Omega Healthcare Investors | | 476,500 b | | 6,299,330 |
| Pacific Capital Bancorp | | 102,700 | | 3,196,024 |
| Phoenix Cos. | | 253,300 | | 3,566,464 |
| Ramco-Gershenson Properties | | 65,500 | | 1,763,915 |
| Republic Bancorp/MI | | 168,700 | | 2,090,193 |
| Senior Housing Properties Trust | | 147,200 b | | 2,636,352 |
| Spirit Finance | | 163,900 | | 1,845,514 |
| Sunterra | | 112,300 a,b | | 1,149,952 |
| Texas Regional Bancshares, Cl. A | | 135,210 | | 5,127,163 |
| Trustco Bank NY | | 99,400 b | | 1,095,388 |
| W Holding | | 278,000 | | 1,848,700 |
| Wintrust Financial | | 69,900 | | 3,554,415 |
| Zenith National Insurance | | 29,400 | | 1,166,298 |
| | | | | 162,209,415 |
| Health Technology—8.0% | | | | |
| Alpharma, Cl. A | | 224,400 | | 5,394,576 |
| Analogic | | 51,000 | | 2,377,110 |
| Angiodynamics | | 171,700 a | | 4,644,485 |
| Aspect Medical Systems | | 238,900 a | | 4,166,416 |
| Biosite | | 39,000 a | | 1,780,740 |
| CNS | | 67,900 b | | 1,663,550 |
| Exelixis | | 199,600 a,b | | 2,005,980 |
| Geron | | 394,300 a,b | | 2,720,670 |
| ICU Medical | | 41,000 a | | 1,731,840 |
| Immucor | | 260,500 a | | 5,009,415 |
| Impax Laboratories | | 217,100 a | | 1,356,875 |
| Molecular Devices | | 53,500 a | | 1,634,960 |
| Myogen | | 98,600 a | | 2,859,400 |
| Neurometrix | | 97,700 a | | 2,975,942 |
| Palomar Medical Technologies | | 115,900 a,b | | 5,288,517 |
| Common Stocks (continued) | | Shares | | Value ($) |
| |
| |
|
| Health Technology (continued) | | | | |
| PRA International | | 75,000 a | | 1,670,250 |
| Progenics Pharmaceuticals | | 104,900 a | | 2,523,894 |
| Renovis | | 96,300 a,b | | 1,474,353 |
| Thoratec | | 153,600 a,b | | 2,130,432 |
| United Therapeutics | | 52,200 a | | 3,015,594 |
| | | | | 56,424,999 |
| Industrial Services—2.4% | | | | |
| Grey Wolf | | 874,300 a,b | | 6,732,110 |
| Hornbeck Offshore Services | | 79,000 a | | 2,806,080 |
| Trico Marine Services | | 25,900 a | | 880,600 |
| W-H Energy Services | | 125,200 a | | 6,363,916 |
| | | | | 16,782,706 |
| Non-Energy Minerals—3.9% | | | | |
| Metal Management | | 138,900 | | 4,253,118 |
| NS Group | | 123,800 a | | 6,818,904 |
| Olin | | 400,000 b | | 7,172,000 |
| Steel Dynamics | | 99,300 | | 6,527,982 |
| Universal Forest Products | | 48,000 | | 3,011,040 |
| | | | | 27,783,044 |
| Process Industries—4.8% | | | | |
| Albany International, Cl. A | | 142,900 | | 6,057,531 |
| Chesapeake | | 181,800 b | | 2,983,338 |
| GrafTech International | | 729,100 a,b | | 4,228,780 |
| Headwaters | | 264,600 a,b | | 6,763,176 |
| Myers Industries | | 163,400 | | 2,808,846 |
| Pioneer Cos. | | 137,700 a | | 3,756,456 |
| Rogers | | 45,200 a | | 2,546,568 |
| Silgan Holdings | | 62,300 | | 2,305,723 |
| Spartech | | 103,400 | | 2,336,840 |
| | | | | 33,787,258 |
| Producer Manufacturing—7.6% | | | | |
| Actuant, Cl. A | | 117,400 | | 5,864,130 |
| American Woodmark | | 86,800 | | 3,041,472 |
The Portfolio 11
STATEMENT OF INVESTMENTS (Unaudited) (continued)
| Common Stocks (continued) | | Shares | | Value ($) |
| |
| |
|
| Producer Manufacturing (continued) | | | | |
| Dynamic Materials | | 113,500 | | 3,828,355 |
| Encore Wire | | 187,000 a,b | | 6,720,780 |
| Freightcar America | | 44,200 | | 2,453,542 |
| Gardner Denver | | 178,200 a | | 6,860,700 |
| Herman Miller | | 167,200 | | 4,308,744 |
| Lennox International | | 133,300 | | 3,529,784 |
| Simpson Manufacturing | | 212,600 b | | 7,664,230 |
| Steel Technologies | | 112,600 | | 2,188,944 |
| Wabtec | | 178,600 | | 6,679,640 |
| | | | | 53,140,321 |
| Retail Trade—5.6% | | | | |
| Charlotte Russe Holding | | 153,700 a | | 3,679,578 |
| Conn’s | | 238,400 a,b | | 6,329,520 |
| Finish Line, Cl. A | | 325,400 | | 3,849,482 |
| Great Atlantic & Pacific Tea | | 122,100 | | 2,774,112 |
| Gymboree | | 177,300 a | | 6,162,948 |
| Hibbett Sporting Goods | | 197,250 a | | 4,714,275 |
| Pacific Sunwear of California | | 173,900 a | | 3,118,027 |
| Sonic Automotive | | 179,400 | | 3,979,092 |
| Stein Mart | | 96,400 | | 1,426,720 |
| Talbots | | 167,200 | | 3,084,840 |
| | | | | 39,118,594 |
| Technology Services—11.5% | | | | |
| Albany Molecular Research | | 196,900 a,b | | 2,102,892 |
| Ansoft | | 84,800 a | | 1,736,704 |
| Apria Healthcare Group | | 132,400 a,b | | 2,502,360 |
| Click Commerce | | 176,100 a,b | | 3,474,453 |
| CSG Systems International | | 123,700 a | | 3,060,338 |
| eCollege.com | | 241,100 a,b | | 5,096,854 |
| Genesis HealthCare | | 91,200 a | | 4,320,144 |
| InfoSpace | | 204,300 a | | 4,631,481 |
| Intergraph | | 140,100 a | | 4,411,749 |
| Common Stocks (continued) | | Shares | | Value ($) |
| |
| |
|
| Technology Services (continued) | | | | |
| Internet Capital Group | | 201,800 a | | 1,816,200 |
| Lawson Software | | 304,700 a | | 2,041,490 |
| Magellan Health Services | | 158,200 a | | 7,168,042 |
| Odyssey HealthCare | | 27,800 a | | 488,446 |
| Open Solutions | | 145,300 a | | 3,866,433 |
| Per-Se Technologies | | 127,845 a | | 3,219,137 |
| Quest Software | | 206,700 a | | 2,902,068 |
| RealNetworks | | 256,100 a | | 2,740,270 |
| SPSS | | 162,300 a | | 5,216,322 |
| SYKES Enterprises | | 332,300 a | | 5,369,968 |
| Trizetto Group | | 229,500 a | | 3,394,305 |
| Tyler Technologies | | 59,700 a | | 668,640 |
| United Online | | 142,600 | | 1,711,200 |
| Vignette | | 346,700 a | | 5,054,886 |
| Websense | | 178,900 a | | 3,674,606 |
| | | | | 80,668,988 |
| Transportation—.8% | | | | |
| Mesa Air Group | | 143,900 a | | 1,417,415 |
| Skywest | | 159,800 | | 3,963,040 |
| | | | | 5,380,455 |
| Utilities—1.2% | | | | |
| CH Energy Group | | 26,200 | | 1,257,600 |
| New Jersey Resources | | 61,500 | | 2,876,970 |
| Vectren | | 161,500 | | 4,400,875 |
| | | | | 8,535,445 |
| Total Common Stocks | | | | |
| (cost $685,023,064) | | | | 700,292,998 |
| |
| |
|
| |
| Other Investment—.3% | | | | |
| |
| |
|
| Registered Investment Company; | | | | |
| Dreyfus Institutional Preferred Plus Money Market Fund | | |
| (cost $2,068,000) | | 2,068,000 c | | 2,068,000 |
The Portfolio 13
STATEMENT OF INVESTMENTS (Unaudited) (continued)
| Investment of Cash Collateral | | | | |
| for Securities Loaned—20.5% | | Shares | | Value ($) |
| |
| |
|
| Registered Investment Company; | | | | | | |
| Dreyfus Institutional Cash Advantage Fund | | | | |
| (cost $143,946,087) | | | | 143,946,087 c | | 143,946,087 |
| |
| |
| |
|
| |
| Total Investments (cost $831,037,151) | | 120.6% | | 846,307,085 |
| |
| Liabilities, Less Cash and Receivables | | (20.6%) | | (144,626,752) |
| |
| Net Assets | | | | 100.0% | | 701,680,333 |
| |
| a | | Non-income producing security. | | | | | | |
| b | | All or a portion of these securities are on loan. At June 30, 2006, the total market value of the portfolio’s securities |
| | | on loan is $139,817,817 and the total market value of the collateral held by the portfolio is $145,238,087, |
| | | consisting of cash collateral of $143,946,087 and U.S. Government and agency securities valued at $1,292,000. |
| c | | Investment in affiliated money market mutual fund. | | | | |
| |
| |
| |
|
| |
| |
| |
| |
| Portfolio Summary (Unaudited) † | | | | |
| |
| | | | | Value (%) | | | | Value (%) |
| |
| |
| |
| |
|
| Finance | | 23.1 | | Retail Trade | | 5.6 |
| Money Market Investments | | 20.8 | | Process Industries | | 4.8 |
| Electronic Technology | | 12.5 | | Consumer Services | | 4.3 |
| Technology Services | | 11.5 | | Non-Energy Minerals | | 3.9 |
| Health Technology | | 8.0 | | Other | | 11.4 |
| Producer Manufacturing | | 7.6 | | | | |
| Commercial & Professional Services | | 7.1 | | | | 120.6 |
| |
| † | | Based on net assets. | | | | | | |
| See notes to financial statements. | | | | | | |
STATEMENT OF ASSETS AND LIABILITIES
June 30, 2006 (Unaudited)
| | | Cost | | Value |
| |
| |
|
| Assets ($): | | | | |
| Investments in securities— | | | | |
| See Statement of Investments (including securities | | |
| on loan, valued at $139,817,817)—Note 1(c): | | |
| Unaffiliated issuers | | 685,023,064 | | 700,292,998 |
| Affiliated issuers | | 146,014,087 | | 146,014,087 |
| Cash | | | | 82,282 |
| Dividends and interest receivable | | | | 830,307 |
| Receivable for shares of Beneficial Interest subscribed | | 27,851 |
| Prepaid expenses | | | | 34,019 |
| | | | | 847,281,544 |
| |
| |
|
| Liabilities ($): | | | | |
| Due to The Dreyfus Corporation and affiliates—Note 3(b) | | 455,510 |
| Liability for securities on loan—Note 1(c) | | 143,946,087 |
| Payable for shares of Beneficial Interest redeemed | | 1,124,345 |
| Accrued expenses | | | | 75,269 |
| | | | | 145,601,211 |
| |
| |
|
| Net Assets ($) | | | | 701,680,333 |
| |
| |
|
| Composition of Net Assets ($): | | | | |
| Paid-in capital | | | | 616,591,241 |
| Accumulated undistributed investment income—net | | 2,860,879 |
| Accumulated net realized gain (loss) on investments | | 66,958,279 |
| Accumulated net unrealized appreciation | | |
| (depreciation) on investments | | | | 15,269,934 |
| |
| |
|
| Net Assets ($) | | | | 701,680,333 |
| |
| |
|
| |
| |
| Net Asset Value Per Share | | | | |
| | | Initial Shares | | Service Shares |
| |
| |
|
| Net Assets ($) | | 679,405,767 | | 22,274,566 |
| Shares Outstanding | | 17,068,826 | | 565,280 |
| |
| |
|
| Net Asset Value Per Share ($) | | 39.80 | | 39.40 |
See notes to financial statements.
|
The Portfolio 15
STATEMENT OF OPERATIONS
Six Months Ended June 30, 2006 (Unaudited)
|
| Investment Income ($): | | |
| Income: | | |
| Cash dividends (net of $11,325 foreign taxes withheld at source): | | |
| Unaffiliated issuers | | 4,493,183 |
| Affiliated issuers | | 78,469 |
| Income from securities lending | | 647,754 |
| Total Income | | 5,219,406 |
| Expenses: | | |
| Investment advisory fee—Note 3(a) | | 2,869,926 |
| Trustees’ fees and expenses—Note 3(c) | | 49,770 |
| Prospectus and shareholders’ reports | | 44,605 |
| Professional fees | | 33,754 |
| Custodian fees—Note 3(b) | | 33,600 |
| Distribution fees—Note 3(b) | | 29,563 |
| Loan commitment fees—Note 2 | | 4,716 |
| Interest expense—Note 2 | | 1,659 |
| Miscellaneous | | 3,782 |
| Total Expenses | | 3,071,375 |
| Less—reduction in custody fees | | |
| due to earnings credits—Note 1(c) | | (3,009) |
| Net Expenses | | 3,068,366 |
| Investment Income—Net | | 2,151,040 |
| |
|
| Realized and Unrealized Gain (Loss) on Investments—Note 4 ($): |
| Net realized gain (loss) on investments | | 67,091,647 |
| Net unrealized appreciation (depreciation) on investments | | (79,211,730) |
| Net Realized and Unrealized Gain (Loss) on Investments | | (12,120,083) |
| Net (Decrease) in Net Assets Resulting from Operations | | (9,969,043) |
See notes to financial statements.
|
STATEMENT OF CHANGES IN NET ASSETS
| | | Six Months Ended | | |
| | | June 30, 2006 | | Year Ended |
| | | (Unaudited) | | December 31, 2005 |
| |
| |
|
| Operations ($): | | | | |
| Investment income—net | | 2,151,040 | | 3,227,022 |
| Net realized gain (loss) on investments | | 67,091,647 | | 118,134,175 |
| Net unrealized appreciation | | | | |
| (depreciation) on investments | | (79,211,730) | | (79,064,153) |
| Net Increase (Decrease) in Net Assets | | | | |
| Resulting from Operations | | (9,969,043) | | 42,297,044 |
| |
| |
|
| Dividends to Shareholders from ($): | | | | |
| Investment income—net: | | | | |
| Initial shares | | (2,859,929) | | — |
| Service shares | | (36,704) | | — |
| Net realized gain on investments: | | | | |
| Initial shares | | (59,143,340) | | — |
| Service shares | | (1,897,570) | | — |
| Total Dividends | | (63,937,543) | | — |
| |
| |
|
| Beneficial Interest Transactions ($): | | | | |
| Net proceeds from shares sold: | | | | |
| Initial shares | | 14,455,144 | | 33,642,117 |
| Service shares | | 2,580,188 | | 2,846,538 |
| Dividends reinvested: | | | | |
| Initial shares | | 62,003,269 | | — |
| Service shares | | 1,934,274 | | — |
| Cost of shares redeemed: | | | | |
| Initial shares | | (70,177,408) | | (119,050,790) |
| Service shares | | (2,588,168) | | (3,359,312) |
| Increase (Decrease) in Net Assets from | | | | |
| Beneficial Interest Transactions | | 8,207,299 | | (85,921,447) |
| Total Increase (Decrease) in Net Assets | | (65,699,287) | | (43,624,403) |
| |
| |
|
| Net Assets ($): | | | | |
| Beginning of Period | | 767,379,620 | | 811,004,023 |
| End of Period | | 701,680,333 | | 767,379,620 |
| Undistributed investment income—net | | 2,860,879 | | 3,606,472 |
The Portfolio 17
STATEMENT OF CHANGES IN NET ASSETS (continued)
|
| | | Six Months Ended | | |
| | | June 30, 2006 | | Year Ended |
| | | (Unaudited) | | December 31, 2005 |
| |
| |
|
| Capital Share Transactions: | | | | |
| Initial Shares | | | | |
| Shares sold | | 332,419 | | 820,825 |
| Shares issued for dividends reinvested | | 1,394,899 | | — |
| Shares redeemed | | (1,598,541) | | (2,869,844) |
| Net Increase (Decrease) in Shares Outstanding | | 128,777 | | (2,049,019) |
| |
| |
|
| Service Shares | | | | |
| Shares sold | | 59,837 | | 69,052 |
| Shares issued for dividends reinvested | | 43,931 | | — |
| Shares redeemed | | (61,611) | | (81,086) |
| Net Increase (Decrease) in Shares Outstanding | | 42,157 | | (12,034) |
See notes to financial statements.
|
The following tables describe the performance for each share class for the fiscal periods indicated. All information (except portfolio turnover rate) reflects financial results for a single portfolio share.Total return shows how much your investment in the portfolio would have increased (or decreased) during each period, assuming you had reinvested all dividends and distributions.These figures have been derived from the portfolio’s financial statements.
| | | Six Months Ended | | | | | | | | |
| | | | | June 30, 2006 | | Year Ended December 31, | | |
| | | |
| |
| |
|
| Initial Shares | | (Unaudited) | | 2005 | | 2004 | | 2003 | | 2002 | | 2001 |
| |
| |
| |
| |
| |
| |
|
| Per Share Data ($): | | | | | | | | | | | | |
| Net asset value, | | | | | | | | | | | | |
| beginning of period | | 43.96 | | 41.55 | | 37.39 | | 28.40 | | 35.13 | | 40.30 |
| Investment Operations: | | | | | | | | | | | | |
| Investment income—net a | | .12 | | .18 | | .08 | | .01 | | .01 | | .11 |
| Net realized and unrealized | | | | | | | | | | | | |
| gain (loss) on investments | | (.48) | | 2.23 | | 4.16 | | 8.99 | | (6.73) | | (2.63) |
| Total from Investment Operations | | (.36) | | 2.41 | | 4.24 | | 9.00 | | (6.72) | | (2.52) |
| Distributions: | | | | | | | | | | | | |
| Dividends from | | | | | | | | | | | | |
| investment income—net | | (.18) | | — | | (.08) | | (.01) | | (.01) | | (.17) |
| Dividends from net realized | | | | | | | | | | | | |
| gain on investments | | (3.62) | | — | | — | | — | | — | | (1.38) |
| Dividends in excess of net | | | | | | | | | | | | |
| realized gain on investments | | — | | — | | — | | — | | — | | (1.10) |
| Total Distributions | | (3.80) | | — | | (.08) | | (.01) | | (.01) | | (2.65) |
| Net asset value, end of period | | 39.80 | | 43.96 | | 41.55 | | 37.39 | | 28.40 | | 35.13 |
| |
| |
| |
| |
| |
| |
|
| Total Return (%) | | (1.73)b | | 5.80 | | 11.34 | | 31.69 | | (19.12) | | (6.12) |
| |
| |
| |
| |
| |
| |
|
| Ratios/Supplemental Data (%): | | | | | | | | | | |
| Ratio of total expenses | | | | | | | | | | | | |
| to average net assets | | .39b | | .81 | | .79 | | .82 | | .81 | | .79 |
| Ratio of net expenses | | | | | | | | | | | | |
| to average net assets | | .39b | | .81 | | .79 | | .82 | | .81 | | .79 |
| Ratio of net investment income | | | | | | | | | | | | |
| to average net assets | | .28b | | .43 | | .20 | | .03 | | .02 | | .29 |
| Portfolio Turnover Rate | | 60.90b | | 67.11 | | 56.06 | | 69.34 | | 52.41 | | 84.45 |
| |
| |
| |
| |
| |
| |
|
| Net Assets, end of period | | | | | | | | | | | | |
| ($ x 1,000) | | 679,406 | | 744,621 | | 788,943 | | 744,866 | | 577,468 | | 687,283 |
| |
| a | | Based on average shares outstanding at each month end. | | | | | | | | |
| b | | Not annualized. | | | | | | | | | | | | |
| See notes to financial statements. | | | | | | | | | | | | |
The Portfolio 19
FINANCIAL HIGHLIGHTS (continued)
|
| | | Six Months Ended | | | | | | | | |
| | | June 30, 2006 | | | Year Ended December 31, | | |
| | | |
| |
| |
|
| Service Shares | | (Unaudited) | | 2005 | | 2004 | | 2003 | | 2002 | | 2001 |
| |
| |
| |
| |
| |
| |
|
| Per Share Data ($): | | | | | | | | | | | | |
| Net asset value, | | | | | | | | | | | | |
| beginning of period | | 43.51 | | 41.22 | | 37.12 | | 28.26 | | 35.02 | | 40.30 |
| Investment Operations: | | | | | | | | | | | | |
| Investment income (loss)—net a | | .07 | | .07 | | (.02) | | (.07) | | (.03) | | (.01) |
| Net realized and unrealized | | | | | | | | | | | | |
| gain (loss) on investments | | (.49) | | 2.22 | | 4.12 | | 8.93 | | (6.72) | | (2.67) |
| Total from Investment Operations | | (.42) | | 2.29 | | 4.10 | | 8.86 | | (6.75) | | (2.68) |
| Distributions: | | | | | | | | | | | | |
| Dividends from | | | | | | | | | | | | |
| investment income—net | | (.07) | | — | | — | | — | | (.01) | | (.12) |
| Dividends from net realized | | | | | | | | | | | | |
| gain on investments | | (3.62) | | — | | — | | — | | — | | (1.38) |
| Dividends in excess of net | | | | | | | | | | | | |
| realized gain on investments | | — | | — | | — | | — | | — | | (1.10) |
| Total Distributions | | (3.69) | | — | | — | | — | | (.01) | | (2.60) |
| Net asset value, end of period | | 39.40 | | 43.51 | | 41.22 | | 37.12 | | 28.26 | | 35.02 |
| |
| |
| |
| |
| |
| |
|
| Total Return (%) | | (1.86)b | | 5.56 | | 11.05 | | 31.35 | | (19.31) | | (6.47) |
| |
| |
| |
| |
| |
| |
|
| Ratios/Supplemental Data (%): | | | | | | | | | | |
| Ratio of total expenses | | | | | | | | | | | | |
| to average net assets | | .52b | | 1.06 | | 1.04 | | 1.07 | | 1.05 | | 1.11 |
| Ratio of net expenses | | | | | | | | | | | | |
| to average net assets | | .52b | | 1.06 | | 1.04 | | 1.07 | | 1.05 | | 1.11 |
| Ratio of net investment income | | | | | | | | | | | | |
| (loss) to average net assets | | .16b | | .18 | | (.04) | | (.22) | | (.11) | | (.02) |
| Portfolio Turnover Rate | | 60.90b | | 67.11 | | 56.06 | | 69.34 | | 52.41 | | 84.45 |
| |
| |
| |
| |
| |
| |
|
| Net Assets, end of period | | | | | | | | | | | | |
| ($ x 1,000) | | 22,275 | | 22,759 | | 22,061 | | 17,523 | | 10,896 | | 5,796 |
| |
| a | | Based on average shares outstanding at each month end. | | | | | | | | |
| b | | Not annualized. | | | | | | | | | | | | |
| See notes to financial statements. | | | | | | | | | | | | |
| |
| |
| 20 | | | | | | | | | | | | | | |
NOTES TO FINANCIAL STATEMENTS (Unaudited)
NOTE 1—Significant Accounting Policies:
Dreyfus Variable Investment Fund (the “fund”) is registered under the Investment Company Act of 1940, as amended (the “Act”), as an open-end management investment company, operating as a series company currently offering twelve series, including the Developing Leaders Portfolio (the “portfolio”). The portfolio is only offered to separate accounts established by insurance companies to fund variable annuity contracts and variable life insurance policies.The portfolio is a diversified series. The portfolio’s investment objective is capital growth.The Dreyfus Corporation (the “Manager” or “Dreyfus”) serves as the portfolio’s investment adviser.The Manager is a wholly-owned subsidiary of Mellon Financial Corporation (“Mellon Financial”).
Dreyfus Service Corporation (the “Distributor”), a wholly-owned subsidiary of the Manager, is the distributor of the portfolio’s shares, which are sold without a sales charge. The portfolio is authorized to issue an unlimited number of $.001 par value shares of Beneficial Interest in the following classes of shares: Initial and Service. Each class of shares has identical rights and privileges, except with respect to the distribution plan and the expenses borne by each class and certain voting rights. Income, expenses (other than expenses attributable to a specific class), and realized and unrealized gains or losses on investments are allocated to each class of shares based on its relative net assets.
The fund accounts separately for the assets, liabilities and operations of each series. Expenses directly attributable to each series are charged to that series’ operations; expenses which are applicable to all series are allocated among them on a pro rata basis.
The portfolio’s financial statements are prepared in accordance with U.S. generally accepted accounting principles, which may require the use of management estimates and assumptions.Actual results could differ from those estimates.
The Portfolio 21
NOTES TO FINANCIAL STATEMENTS (Unaudited) (continued)
The fund enters into contracts that contain a variety of indemnifica-tions.The portfolio’s maximum exposure under these arrangements is unknown. The portfolio does not anticipate recognizing any loss related to these arrangements.
(a) Portfolio valuation: Investments in securities are valued at the last sales price on the securities exchange or national securities market on which such securities are primarily traded. Securities listed on the National Market System for which market quotations are available are valued at the official closing price or, if there is no official closing price that day, at the last sale price. Securities not listed on an exchange or the national securities market, or securities for which there were no transactions, are valued at the average of the most recent bid and asked prices, except for open short positions, where the asked price is used for valuation purposes. Bid price is used when no asked price is available. Investments in registered investment companies are valued at their net asset value.When market quotations or official closing prices are not readily available, or are determined not to reflect accurately fair value, such as when the value of a security has been significantly affected by events after the close of the exchange or market on which the security is principally traded (for example, a foreign exchange or market), but before the portfolio calculates its net asset value, the portfolio may value these investments at fair value as determined in accordance with the procedures approved by the Board of Trustees. Fair valuing of securities may be determined with the assistance of a pricing service using calculations based on indices of domestic securities and other appropriate indicators, such as prices of relevant ADR’s and futures contracts. For other securities that are fair valued by the Board of Trustees, certain factors may be considered such as: fundamental analytical data, the nature and duration of restrictions on disposition, an evaluation of the forces that influence the market in which the securities are purchased and sold, and public trading in similar securities of the issuer or comparable issuers. Financial futures are valued at
the last sales price. Investments denominated in foreign currencies are translated to U.S. dollars at the prevailing rates of exchange. Forward currency exchange contracts are valued at the forward rate.
(b) Foreign currency transactions: The portfolio does not isolate that portion of the results of operations resulting from changes in foreign exchange rates on investments from the fluctuations arising from changes in market prices of securities held. Such fluctuations are included with the net realized and unrealized gain or loss on investments.
Net realized foreign exchange gains or losses arise from sales and maturities of short-term securities, sales of foreign currencies, currency gains or losses realized on securities transactions and the difference between the amounts of dividends, interest and foreign withholding taxes recorded on the portfolio’s books and the U.S. dollar equivalent of the amounts actually received or paid. Net unrealized foreign exchange gains or losses arise from changes in the value of assets and liabilities other than investments in securities resulting from changes in exchange rates. Such gains and losses are included with net realized and unrealized gain or loss on investments.
(c) Securities transactions and investment income: Securities transactions are recorded on a trade date basis. Realized gain and loss from securities transactions are recorded on the identified cost basis. Dividend income is recognized on the ex-dividend date and interest income, including, where applicable, accretion of discount and amortization of premium on investments, is recognized on the accrual basis.
The portfolio has an arrangement with the custodian bank whereby the portfolio receives earnings credits from the custodian when positive cash balances are maintained, which are used to offset custody fees. For financial reporting purposes, the portfolio includes net earnings credits as an expense offset in the Statement of Operations.
The Portfolio 23
NOTES TO FINANCIAL STATEMENTS (Unaudited) (continued)
Pursuant to a securities lending agreement with Mellon Bank, N.A., an affiliate of the Manager, the portfolio may lend securities to qualified institutions. It is the portfolio’s policy, that at origination, all loans are secured by collateral of at least 102% of the value of U.S. securities loaned and 105% of the value of foreign securities loaned. Collateral equivalent to at least 100% of the market value of securities on loan is maintained at all times. Cash collateral is invested in certain money market mutual funds managed by the Manager.The portfolio is entitled to receive all income on securities loaned, in addition to income earned as a result of the lending transaction. Although each security loaned is fully collateralized, the portfolio bears the risk of delay in recovery of, or loss of rights in, the securities loaned should a borrower fail to return the securities in a timely manner.
(d) Affiliated issuers: Investments in other investment companies advised by the Manager are defined as “affiliated” in the Act.
(e) Dividends to shareholders: Dividends are recorded on the ex-dividend date. Dividends from investment income-net and dividends from net realized capital gain, if any, are normally declared and paid annually, but the portfolio may make distributions on a more frequent basis to comply with the distribution requirements of the Internal Revenue Code of 1986, as amended (the “Code”).To the extent that net realized capital gain can be offset by capital loss carryovers, if any, it is the policy of the portfolio not to distribute such gain. Income and capital gain distributions are determined in accordance with income tax regulations, which may differ from U.S. generally accepted accounting principles.
(f) Federal income taxes: It is the policy of the portfolio to continue to qualify as a regulated investment company, if such qualification is in the best interests of its shareholders, by complying with the applicable provisions of the Code, and to make distributions of taxable income sufficient to relieve it from substantially all federal income and excise taxes.
The tax character of current year distributions will be determined at the end of the current fiscal year.
NOTE 2—Bank Line of Credit:
|
The portfolio participates with other Dreyfus-managed funds in a $350 million redemption credit facility (the “Facility”) to be utilized for temporary or emergency purposes, including the financing of redemptions. In connection therewith, the portfolio has agreed to pay commitment fees on its pro rata portion of the Facility. Interest is charged to the portfolio based on prevailing market rates in effect at the time of borrowing.
The average daily amount of borrowings outstanding under the Facility during the period ended June 30, 2006, was $64,700 with a related weighted average annualized interest rate of 5.17% .
NOTE 3—Investment Advisory Fee and Other Transactions With Affiliates:
(a) Pursuant to an Investment Advisory Agreement with the Manager, the investment advisory fee is computed at the annual rate of .75% of the value of the portfolio’s average daily net assets and is payable monthly.
(b) Under the Distribution Plan (the “Plan”) adopted pursuant to Rule 12b-1 under the Act, Service shares pay the Distributor for distributing their shares, for servicing and/or maintaining Service shares shareholder accounts and for advertising and marketing for Service shares.The Plan provides for payments to be made at an annual rate of .25% of the value of the Service shares’ average daily net assets.The Distributor may make payments to Participating Insurance Companies and to brokers and dealers acting as principal underwriter for their variable insurance products.The fees payable under the Plan are payable without regard to actual expenses incurred. During the period ended June 30, 2006, Service shares were charged $29,563 pursuant to the Plan.
The portfolio compensates Dreyfus Transfer, Inc., a wholly-owned subsidiary of the Manager, under a transfer agency agreement for providing personnel and facilities to perform transfer agency services for the portfolio. During the period ended June 30, 2006, the portfolio was charged $439 pursuant to the transfer agency agreement.
The Portfolio 25
NOTES TO FINANCIAL STATEMENTS (Unaudited) (continued)
The portfolio compensates Mellon Bank, N.A., an affiliate of the Manager, under a custody agreement for providing custodial services for the portfolio. During the period ended June 30, 2006, the portfolio was charged $33,600 pursuant to the custody agreement.
During the period ended June 30, 2006, the portfolio was charged $1,926 for services performed by the Chief Compliance Officer.
The components of Due to The Dreyfus Corporation and affiliates in the Statement of Assets and Liabilities consist of: investment advisory fees $425,287, Rule 12b-1 distribution plan fees $4,523, custodian fees $23,628, chief compliance officer fees $1,926 and transfer agency per account fees $146.
(c) Each Board member also serves as a Board member of other funds within the Dreyfus complex. Annual retainer fees and attendance fees are allocated to each fund based on net assets.
(d) Pursuant to an exemptive order from the Securities and Exchange Commission, the portfolio invests its available cash balances in affiliated money market mutual funds. Management fees of the underlying money market mutual funds have been waived by the Manager.
NOTE 4—Securities Transactions:
|
The aggregate amount of purchases and sales of investment securities, excluding short-term securities, during the period ended June 30, 2006, amounted to $467,597,303 and $521,082,251, respectively.
At June 30, 2006, accumulated net unrealized appreciation on investments was $15,269,934, consisting of $76,803,423 gross unrealized appreciation and $61,533,489 gross unrealized depreciation.
At June 30,2006,the cost of investments for federal income tax purposes was substantially the same as the cost for financial reporting purposes (see the Statement of Investments).
PROXY RESULTS ( U n a u d i t e d )
|
Dreyfus Variable Investment Fund held a special meeting of shareholders on June 29, 2006.The proposal considered at the meeting, and the results, are as follows:
| | | | | Shares | | |
| |
| |
| |
|
| | | For | | | | Authority Withheld |
| |
| |
| |
|
| To elect additional Board Members: | | | | | | |
| Peggy C. Davis † | | 171,078,926.558 | | | | 7,687,714.085 |
| Joseph S. DiMartino | | 170,946,484.400 | | | | 7,820,156.243 |
| David P. Feldman | | 170,959,920.714 | | | | 7,806,719.929 |
| Ehud Houminer † | | 170,132,086.682 | | | | 8,634,553.961 |
| Gloria Messinger † | | 170,187,240.710 | | | | 8,579,399.933 |
| Anne Wexler † | | 170,212,607.472 | | | | 8,554,033.171 |
| † Each will serve as an Independent Board member of the fund commencing, subject to the discretion of the Board, on |
| or about January 1, 2007. |
| In addition to Joseph S. DiMartino and David P. Feldman, James F. Henry, Dr. Paul A. Marks and Dr. Martin |
| Peretz continue as Board members of the fund. |
The Portfolio 27
INFORMATION ABOUT THE REVIEW AND APPROVAL OF THE PORTFOLIO’S
I N V E S T M E N T A D V I S O R Y A G R E E M E N T (Unaudited)
At a meeting of the fund’s Board of Trustees held on June 7 and 8, 2006, the Board considered the re-approval for an annual period (through July 31, 2007) of the fund’s Investment Advisory Agreement with Dreyfus for the portfolio, pursuant to which Dreyfus provides the portfolio with investment advisory and administrative services. The Board members, none of whom are “interested persons” (as defined in the Investment Company Act of 1940, as amended) of the fund were assisted in their review by independent legal counsel and met with counsel in executive session separate from representatives of Dreyfus.
Analysis of Nature, Extent and Quality of Services Provided to the Portfolio. The Board members received a presentation from representatives of Dreyfus regarding services provided to the portfolio and other funds in the Dreyfus fund complex, and discussed the nature, extent and quality of the services provided to the portfolio pursuant to its Investment Advisory Agreement. Dreyfus’ representatives reviewed the portfolio’s distribution of accounts and the relationships Dreyfus has with various intermediaries and the different needs of each.The Board noted that the portfolio’s shares were offered only to separate accounts established by insurance companies to fund variable annuity contracts and variable life insurance policies. Dreyfus’ representatives noted the diversity of distribution among the funds in the Dreyfus fund complex, and Dreyfus’ corresponding need for broad, deep, and diverse resources to be able to provide ongoing shareholder services to each distribution channel, including that of the portfolio. Dreyfus also provided the number of separate accounts investing in the portfolio, as well as the portfolio’s asset size.
The Board members also considered Dreyfus’ research and portfolio management capabilities, including certain recent modifications that have been made to the portfolio management team’s investment approach, and that Dreyfus also provides oversight of day-to-day portfolio operations, including fund accounting and administration and assistance in meeting legal and regulatory requirements. The Board members also considered Dreyfus’ extensive administrative, accounting and compliance infrastructure.
Comparative Analysis of the Portfolio’s Performance and Advisory Fee and Expense Ratio. The Board members reviewed the portfolio’s performance and placed significant emphasis on comparisons to a group of small-cap core funds underlying variable insurance products (the “Performance Group”) and to a larger universe of funds, consisting of all small-cap core funds underlying variable insurance products (the “Performance Universe”) selected and provided by Lipper, Inc., an independent provider of investment company data.The Board was provided with a description of the methodology Lipper used to select the Performance Group and Performance Universe, as well as the Expense Group and Expense Universe (discussed below). The Board members discussed the results of the comparisons for various periods ended April 30, 2006, and noted that the portfolio’s total return performance for its Initial shares was below the medians of the Performance Group and the Performance Universe for each of the periods. The Board noted that the current portfolio management team was appointed to manage the portfolio in June 2005. Dreyfus representatives noted that, for calendar year 2005, the portfolio was in the second quartile of its Lipper category and outperformed its benchmark. The Dreyfus representatives noted that, while the portfolio’s more recent in performance in 2006 had not been as favorable on a relative basis, the portfolio still had good performance on an absolute basis for the 12-month period ended April 30, 2006. Dreyfus also provided the Board with the portfolio’s total return performance and the quartile, percentile and rank of the portfolio’s total return within its Lipper category (as provided by Lipper) for certain other periods ended April 30, 2006, which generally were consistent with the relative total return information provided by Lipper.
The Board members also discussed the portfolio’s advisory fee and expense ratio for each class of shares and reviewed the range of advisory fees and expense ratios of a comparable group of funds (the “Expense Group”) and a broader group of funds (the “Expense Universe”), each selected and provided by Lipper. The Board members noted that the portfolio’s advisory fee was lower than its Expense Group and Expense Universe medians, and that the expense ratio for the Initial shares was
The Portfolio 29
I N FO R M AT I O N A B O U T T H E R E V I E W A N D A P P R OVA L O F T H E P O R T FO L I O ’ S I N V E S T M E N T A DV I S O RY A G R E E M E N T ( U n a u d i t e d ) ( c o n t i n u e d )
lower than Expense Group and Expense Universe medians, and that the expense ratio for the Service shares was higher than the Expense Group median and lower than the Expense Universe median.
Representatives of Dreyfus reviewed with the Board members the advisory fees paid by mutual funds managed by Dreyfus or its affiliates with similar investment objectives, policies and strategies, and included within the portfolio’s Lipper category (the “Similar Funds”), and by other accounts managed by Dreyfus or its affiliates with similar investment objectives, policies and strategies as the portfolio (the “Similar Accounts”). Dreyfus’ representatives explained the nature of the Similar Accounts and the differences, from Dreyfus’ perspective, in providing services to such Similar Accounts as compared to managing and providing services to the portfolio. Dreyfus’ representatives also reviewed the costs associated with distribution through intermediaries. The Board analyzed differences in fees paid to Dreyfus and discussed the relationship of the fees paid in light the services provided. The Board members considered the relevance of the fee information provided for the Similar Funds and the Similar Accounts to evaluate the appropriateness and reasonableness of the portfolio’s investment advisory fee.The Board acknowledged that differences in fees paid by the Similar Accounts seemed to be consistent with the services provided.
Analysis of Profitability and Economies of Scale. Dreyfus’ representatives reviewed the dollar amount of expenses allocated and profit received by Dreyfus and the method used to determine such expenses and profit.The Board considered information, previously provided and discussed, prepared by an independent consulting firm regarding Dreyfus’ approach to allocating costs to, and determining the profitability of, individual funds and the entire Dreyfus mutual fund complex. The Board members also considered that the methodology had also been reviewed by an independent registered public accounting firm which, like the consultant, found the methodology to be reasonable. The consulting firm also analyzed where any economies of scale might emerge in connection with the management of the portfolio. The
Board members evaluated the profitability analysis in light of the relevant circumstances for the portfolio and the extent to which economies of scale would be realized if the portfolio grows and whether fee levels reflect these economies of scale for the benefit of portfolio investors. The Board members also considered potential benefits to Dreyfus from acting as investment adviser and noted the soft dollar arrangements with respect to trading the portfolio’s investments.
It was noted that the Board members should consider Dreyfus’ profitability with respect to the portfolio as part of their evaluation of whether the fees under the Investment Advisory Agreement bear a reasonable relationship to the mix of services provided by Dreyfus, including the nature, extent and quality of such services and that a discussion of economies of scale is predicated on increasing assets and that, if a fund’s assets had been decreasing, the possibility that Dreyfus may have realized any economies of scale would be less. It also was noted that the profitability percentage for managing the portfolio was within ranges determined by appropriate court cases to be reasonable given the services rendered and generally superior service levels provided.
At the conclusion of these discussions, the Board agreed that it had been furnished with sufficient information to make an informed business decision with respect to continuation of the Investment Advisory Agreement, with respect to the portfolio. Based on the discussions and considerations as described above, the Board made the following conclusions and determinations.
- The Board concluded that the nature, extent and quality of the ser- vices provided by Dreyfus are adequate and appropriate.
- The Board generally was satisfied with the portfolio’s relative perfor- mance in calendar year 2005 and with its absolute performance for the one-year period ended April 30, 2006, which periods included the period from June 2005 when the current portfolio management team began managing the portfolio.
The Portfolio 31
I N FO R M AT I O N A B O U T T H E R E V I E W A N D A P P R OVA L O F T H E P O R T FO L I O ’ S I N V E S T M E N T A DV I S O RY A G R E E M E N T ( U n a u d i t e d ) ( c o n t i n u e d )
- The Board concluded that the fee paid by the portfolio to Dreyfus was reasonable in light of the services provided, comparative perfor- mance, expense and advisory fee information, costs of the services provided and profits to be realized and benefits derived or to be derived by Dreyfus from its relationship with the portfolio.
- The Board determined that the economies of scale which may accrue to Dreyfus and its affiliates in connection with the management of the portfolio had been adequately considered by Dreyfus in connection with the advisory fee rate charged to the portfolio and that, to the extent in the future it were determined that material economies of scale had not been shared with the portfolio, the Board would seek to have those economies of scale shared with the portfolio.
The Board members considered these conclusions and determinations, along with information received on a routine and regular basis throughout the year, and, without any one factor being dispositive, the Board determined that re-approval of the portfolio’s Investment Advisory Agreement was in the best interests of the portfolio and its shareholders.
| Dreyfus Variable |
| Investment Fund, |
| Developing Leaders Portfolio |
| 200 Park Avenue |
| New York, NY 10166 |
| |
| Investment Adviser |
| The Dreyfus Corporation |
| 200 Park Avenue |
| New York, NY 10166 |
| |
| Custodian |
| Mellon Bank, N.A. |
| One Mellon Bank Center |
| Pittsburgh, PA 15258 |
| Transfer Agent & |
| Dividend Disbursing Agent |
| Dreyfus Transfer, Inc. |
| 200 Park Avenue |
| New York, NY 10166 |
| |
| Distributor |
| Dreyfus Service Corporation |
| 200 Park Avenue |
| New York, NY 10166 |
Telephone 1-800-554-4611 or 516-338-3300
Mail The Dreyfus Family of Funds, 144 Glenn Curtiss Boulevard, Uniondale, NY 11556-0144 Attn: Investments Division
The portfolio files its complete schedule of portfolio holdings with the Securities and Exchange Commission (“SEC”) for the first and third quarters of each fiscal year on Form N-Q. The portfolio’s Forms N-Q are available on the SEC’s website at http://www.sec.gov and may be reviewed and copied at the SEC’s Public Reference Room in Washington, DC. Information on the operation of the Public Reference Room may be obtained by calling 1-202-551-8090.
A description of the policies and procedures that the portfolio uses to determine how to vote proxies relating to portfolio securities, and information regarding how the portfolio voted these proxies for the 12-month period ended June 30, 2006, is available at http://www.dreyfus.com and on the SEC’s website at http://www.sec.gov. The description of the policies and procedures is also available without charge, upon request, by calling 1-800-645-6561.
| © 2006 Dreyfus Service Corporation |


The views expressed in this report reflect those of the portfolio manager only through the end of the period covered and do not necessarily represent the views of Dreyfus or any other person in the Dreyfus organization.Any such views are subject to change at any time based upon market or other conditions and Dreyfus disclaims any responsibility to update such views. These views may not be relied on as investment advice and, because investment decisions for a Dreyfus portfolio are based on numerous factors, may not be relied on as an indication of trading intent on behalf of any Dreyfus portfolio.
Not FDIC-Insured • Not Bank-Guaranteed • May Lose Value
| | | Contents |
| |
| | | T H E P O R T F O L I O |
| |
|
| 2 | | Letter from the Chairman |
| 3 | | Discussion of Performance |
| 6 | | Understanding Your Portfolio’s Expenses |
| 6 | | Comparing Your Portfolio’s Expenses |
| | | With Those of Other Funds |
| 7 | | Statement of Investments |
| 12 | | Statement of Assets and Liabilities |
| 13 | | Statement of Operations |
| 14 | | Statement of Changes in Net Assets |
| 16 | | Financial Highlights |
| 18 | | Notes to Financial Statements |
| 24 | | Proxy Results |
| 25 | | Information About the Review |
| and Approval of the Portfolio’s |
| Investment Advisory Agreement |
| | | F O R M O R E I N F O R M AT I O N |
| |
|
| | | Back Cover |
| Dreyfus Variable Investment Fund, |
| Disciplined Stock Portfolio |

LETTER FROM THE CHAIRMAN
We are pleased to present this semiannual report for Dreyfus Variable Investment Fund, Disciplined Stock Portfolio, covering the six-month period from January 1, 2006, through June 30, 2006.
Stock market gains over the first four months of 2006 were given back in May and June, when investors reacted negatively to suggestions that the U.S. Federal Reserve Board (the “Fed”) and other central banks, in their fight against inflation, might raise short-term interest rates more than previously expected. In the judgment of our Chief Economist, Richard Hoey, the recent correction reflects an adjustment among leveraged investors toward lower risk levels as the U.S. economy moves into a more mature phase with milder rates of growth. In our view, corrections such as these generally are healthy mechanisms that help wring speculative excesses from the financial markets, potentially setting the stage for future rallies.
While a recession currently appears unlikely, a number of economic uncertainties remain. Indicators to watch in the months ahead include the outlook for inflation, the extent of softness in the U.S. housing market, the impact of slower economic growth on consumer spending, additional changes in interest rates from the Fed and other central banks, and the strength of the U.S. dollar relative to other major currencies. As always, we encourage you to discuss these and other investment-related issues with your financial advisor, who can help you prepare for the challenges and opportunities that lie ahead.
For information about how the fund performed during the reporting period, as well as market perspectives, we have provided a Discussion of Fund Performance given by the fund’s portfolio manager.
Thank you for your continued confidence and support.

DISCUSSION OF PERFORMANCE
Sean P. Fitzgibbon, Portfolio Manager
How did Dreyfus Variable Investment Fund, Disciplined Stock Portfolio perform relative to its benchmark?
For the six-month period ended June 30, 2006, the portfolio achieved total returns of 2.38% for its Initial shares and 2.29% for its Service shares.1 For the same period, the total return of the Standard & Poor’s 500 Composite Stock Price Index (“S&P 500 Index”), the portfolio’s benchmark, was 2.71% .2
Stocks achieved modest gains during the reporting period on the strength of continued U.S. and global economic growth. However, intensifying investor concerns regarding the threat of inflation and the sustainability of future economic growth limited the market’s gains. While the portfolio participated in the market’s advance, relatively weak returns in the telecommunications services and consumer staples sectors caused the portfolio’s performance to lag slightly behind the benchmark.
What is the portfolio’s investment approach?
The portfolio seeks investment returns (consisting of capital appreciation and income) that are consistently superior to the S&P 500 Index. The portfolio normally invests at least 80% of its assets in stocks, and focuses on stocks of large-cap companies. The portfolio invests in growth and value stocks, which are chosen through a disciplined investment process that combines computer modeling techniques, fundamental analysis and risk management.
When selecting securities, we use a computer model to identify and rank stocks within an industry or sector, based on several characteristics, including: value, or how a stock is priced relative to its perceived value; growth, in this case the sustainability or growth of earnings; financial profile, which measures the financial health of a company. Next, based on fundamental analysis, we generally select the most attractive of the higher ranked securities, drawing on a variety of sources, including internal as well as Wall Street research, and company management.
The Portfolio 3
DISCUSSION OF PERFORMANCE (continued)
|
In addition to identifying what we believe are attractive investment opportunities, we also attempt to manage risks by diversifying across companies and industries.The portfolio is structured so that its sector weightings and risk characteristics are generally similar to those of the S&P 500 Index.
What other factors influenced the portfolio’s performance?
Energy stocks generated the market’s greatest gains, fueled by high oil and gas prices and strong industrial demand for energy supplies. The portfolio participated heavily in the energy sector’s rise, led by investments in oilfield services providers, such as Weatherford International, Ltd. and GlobalSantaFe.The portfolio also participated heavily, as did the benchmark, in the basic materials sector, with relatively weak returns from some holdings, such as paper packaging maker Smurfit-Stone Container, more than offset by better results from others, such as steel manufacturer Steel Dynamics, Inc.
The portfolio added value compared to its benchmark in the industrial sector, primarily due to strong individual stock selections.Top performers included diversified industrial companies, such as Textron and United Technologies; cyclical producers, such as farm and construction machinery maker Caterpillar; and rail carriers, such as Norfolk Southern.The portfolio’s financial holdings also outperformed due to the portfolio’s emphasis—particularly during the first four months of the period—on capital markets-related companies, such as E*TRADE Financial and JPMorgan Chase & Co.
The health care sector provided mixed performance relative to the benchmark.Among health care services, the portfolio benefited from its move away from managed care and medical device companies. Instead, we focused on laboratory equipment providers, such as Fisher Scientific International and Thermo Electron, which performed well. However, these gains were offset by the portfolio’s relative lack of exposure to large pharmaceutical companies, which rose in response to the market’s shift in favor of relatively defensive stocks late in the reporting period.
On the negative side, the portfolio’s relative performance suffered due to its underweighted exposure to the telecommunications services area, a position that reflected our concerns regarding a tangled competitive land-
scape and apparently negative fundamentals. However, the sector staged a modest recovery in the wake of declines in 2005, causing the portfolio to underperform in the sector. Finally, consumer staple holdings proved a drag on performance due to company-specific issues. Most notably,The Procter & Gamble Co. lost ground after the company’s merger with Gillette slowed top-line earnings growth, and Altria Group delivered sluggish returns due to delays in the company’s expected reorganization.
What is the portfolio’s current strategy?
While we remain vigilant with regard to inflationary pressures and rising interest rates, we believe U.S. economic fundamentals remain basically strong.While consumer spending may be somewhat undermined by high fuel prices, we expect corporate capital spending to offset any weakness in the consumer sector. Accordingly, we remain committed to the portfolio’s generally sector-neutral strategy, taking a balanced approach to our growth and value investment approach. The portfolio’s only significant deviation from the benchmark’s sector composition occurs in the telecommunications services sector, where, as of the end of the reporting period, the portfolio has relatively few assets in light of increasing competitive pressures from cable companies and other new business entrants.
| | | The portfolio is only available as a funding vehicle under variable life insurance policies or variable |
| | | annuity contracts issued by insurance companies. Individuals may not purchase shares of the |
| | | portfolio directly. A variable annuity is an insurance contract issued by an insurance company that |
| | | enables investors to accumulate assets on a tax-deferred basis for retirement or other long-term |
| | | goals.The investment objective and policies of Dreyfus Variable Investment Fund, Disciplined |
| | | Stock Portfolio made available through insurance products may be similar to other funds/portfolios |
| | | managed or advised by Dreyfus. However, the investment results of the portfolio may be higher or |
| | | lower than, and may not be comparable to, those of any other Dreyfus fund/portfolio. |
| 1 | | Total return includes reinvestment of dividends and any capital gains paid. Past performance is no |
| | | guarantee of future results. Share price and investment return fluctuate such that upon redemption, |
| | | portfolio shares may be worth more or less than their original cost.The portfolio’s performance does |
| | | not reflect the deduction of additional charges and expenses imposed in connection with investing |
| | | in variable insurance contracts, which will reduce returns. Return figures provided reflect the |
| | | absorption of certain portfolio expenses by The Dreyfus Corporation pursuant to an agreement in |
| | | effect through December 31, 2006, at which time it may be extended, terminated or modified. |
| | | Had these expenses not been absorbed, the portfolio’s returns would have been lower. |
| 2 | | SOURCE: LIPPER INC. — Reflects reinvestment of dividends and, where applicable, capital |
| | | gain distributions.The Standard & Poor’s 500 Composite Stock Price Index is a widely accepted, |
| | | unmanaged index of U.S. stock market performance. |
The Portfolio 5
UNDERSTANDING YOUR PORTFOLIO’S EXPENSES (Unaudited)
As a mutual fund investor, you pay ongoing expenses, such as management fees and other expenses. Using the information below, you can estimate how these expenses affect your investment and compare them with the expenses of other funds.You also may pay one-time transaction expenses, including sales charges (loads) and redemption fees,which are not shown in this section and would have resulted in higher total expenses. For more information, see your portfolio’s prospectus or talk to your financial adviser.
Review your portfolio’s expenses
|
The table below shows the expenses you would have paid on a $1,000 investment in Dreyfus Variable Investment Fund, Disciplined Stock Portfolio from January 1, 2006 to June 30, 2006. It also shows how much a $1,000 investment would be worth at the close of the period, assuming actual returns and expenses.
| Expenses and Value of a $1,000 Investment | | |
| assuming actual returns for the six months ended June 30, 2006 | | |
| | | Initial Shares | | Service Shares |
| |
| |
|
| Expenses paid per $1,000 † | | $ 4.06 | | $ 5.02 |
| Ending value (after expenses) | | $1,023.80 | | $1,022.90 |
COMPARING YOUR PORTFOLIO’S EXPENSES WITH THOSE OF OTHER FUNDS (Unaudited)
Using the SEC’s method to compare expenses
The Securities and Exchange Commission (SEC) has established guidelines to help investors assess fund expenses. Per these guidelines, the table below shows your portfolio’s expenses based on a $1,000 investment, assuming a hypothetical 5% annualized return. You can use this information to compare the ongoing expenses (but not transaction expenses or total cost) of investing in the portfolio with those of other funds. All mutual fund shareholder reports will provide this information to help you make this comparison. Please note that you cannot use this information to estimate your actual ending account balance and expenses paid during the period.
Expenses and Value of a $1,000 Investment assuming a hypothetical 5% annualized return for the six months ended June 30, 2006
| | | Initial Shares | | Service Shares |
| |
| |
|
| Expenses paid per $1,000 † | | $ 4.06 | | $ 5.01 |
| Ending value (after expenses) | | $1,020.78 | | $1,019.84 |
| † Expenses are equal to the portfolio’s annualized expense ratio of .81% for Initial shares and 1.00% for Service shares, |
| multiplied by the average account value over the period, multiplied by 181/365 (to reflect the one-half year period). |
STATEMENT OF INVESTMENTS
June 30, 2006 (Unaudited)
|
| Common Stocks—99.2% | | Shares | | Value ($) |
| |
| |
|
| Consumer Discretionary—9.9% | | | | |
| Circuit City Stores | | 16,950 | | 461,379 |
| Coach | | 13,850 a | | 414,115 |
| Fortune Brands | | 7,440 | | 528,315 |
| Hilton Hotels | | 33,430 | | 945,401 |
| Home Depot | | 21,970 | | 786,306 |
| JC Penney | | 12,320 | | 831,723 |
| McDonald’s | | 32,980 | | 1,108,128 |
| Omnicom Group | | 5,970 | | 531,867 |
| Target | | 27,890 | | 1,362,984 |
| Time Warner | | 67,170 | | 1,162,041 |
| Walt Disney | | 28,290 | | 848,700 |
| | | | | 8,980,959 |
| Consumer Staples—9.8% | | | | |
| Altria Group | | 41,440 | | 3,042,939 |
| Cadbury Schweppes, ADR | | 36,030 | | 1,398,685 |
| CVS | | 35,180 | | 1,080,026 |
| Energizer Holdings | | 7,560 a | | 442,789 |
| Kroger | | 35,230 | | 770,128 |
| PepsiCo | | 21,210 | | 1,273,449 |
| Procter & Gamble | | 16,914 | | 940,418 |
| | | | | 8,948,434 |
| Energy—10.2% | | | | |
| Chesapeake Energy | | 19,800 | | 598,950 |
| Chevron | | 10,330 | | 641,080 |
| ConocoPhillips | | 23,140 | | 1,516,364 |
| Exxon Mobil | | 53,420 | | 3,277,317 |
| GlobalSantaFe | | 9,570 | | 552,668 |
| Hess | | 11,940 | | 631,029 |
| Marathon Oil | | 6,470 | | 538,951 |
| Nabors Industries | | 14,400 a | | 486,576 |
| Weatherford International | | 21,370 a | | 1,060,379 |
| | | | | 9,303,314 |
The Portfolio 7
STATEMENT OF INVESTMENTS (Unaudited) (continued)
| Common Stocks (continued) | | Shares | | Value ($) |
| |
| |
|
| Exchange Traded—.6% | | | | |
| Standard & Poor’s Depository | | | | |
| Receipts (Tr. Ser. 1) | | 4,400 b | | 560,032 |
| Financial—21.8% | | | | |
| Allstate | | 17,380 | | 951,207 |
| AMBAC Financial Group | | 11,330 | | 918,863 |
| American International Group | | 13,991 | | 826,169 |
| AmeriCredit | | 30,320 a | | 846,534 |
| Bank of America | | 54,490 | | 2,620,969 |
| Capital One Financial | | 13,110 | | 1,120,249 |
| Chubb | | 17,720 | | 884,228 |
| Citigroup | | 34,660 | | 1,671,998 |
| Countrywide Financial | | 19,430 | | 739,894 |
| E*Trade Financial | | 47,380 a | | 1,081,212 |
| Hartford Financial Services Group | | 11,140 | | 942,444 |
| JPMorgan Chase & Co. | | 60,220 | | 2,529,240 |
| MetLife | | 24,260 | | 1,242,355 |
| Morgan Stanley | | 21,860 | | 1,381,771 |
| PNC Financial Services Group | | 13,510 | | 947,997 |
| SunTrust Banks | | 14,410 | | 1,098,907 |
| | | | | 19,804,037 |
| Health Care—12.7% | | | | |
| AmerisourceBergen | | 20,230 | | 848,042 |
| Amgen | | 16,830 a | | 1,097,821 |
| Barr Pharmaceuticals | | 11,300 a | | 538,897 |
| Becton, Dickinson & Co. | | 7,610 | | 465,199 |
| Cerner | | 10,100 a | | 374,811 |
| Fisher Scientific International | | 14,070 a | | 1,027,813 |
| Johnson & Johnson | | 15,250 | | 913,780 |
| Medtronic | | 14,290 | | 670,487 |
| Novartis, ADR | | 16,500 | | 889,680 |
| Pfizer | | 32,944 | | 773,196 |
| Sanofi-Aventis, ADR | | 14,900 b | | 725,630 |
| Common Stocks (continued) | | Shares | | Value ($) |
| |
| |
|
| Health Care (continued) | | | | |
| Thermo Electron | | 13,140 a | | 476,194 |
| UnitedHealth Group | | 12,530 | | 561,093 |
| WellPoint | | 14,910 a | | 1,085,001 |
| Wyeth | | 24,930 | | 1,107,141 |
| | | | | 11,554,785 |
| Industrial—12.5% | | | | |
| American Standard Cos. | | 10,890 | | 471,210 |
| Cendant | | 47,930 | | 780,780 |
| Eaton | | 7,390 | | 557,206 |
| Emerson Electric | | 14,280 | | 1,196,807 |
| Empresa Brasileira de Aeronautica | | | | |
| (Embraer), ADR | | 14,870 b | | 542,309 |
| General Electric | | 83,080 | | 2,738,317 |
| Lockheed Martin | | 10,930 | | 784,118 |
| Mueller Water Products, Cl. A | | 27,520 a | | 479,123 |
| Norfolk Southern | | 15,980 | | 850,455 |
| Textron | | 8,370 | | 771,547 |
| Tyco International | | 28,370 | | 780,175 |
| United Technologies | | 8,880 | | 563,170 |
| US Airways Group | | 16,140 a | | 815,715 |
| | | | | 11,330,932 |
| Information Technology—14.5% | | | | |
| Accenture, Cl. A | | 29,920 | | 847,334 |
| Amphenol, Cl. A | | 8,140 | | 455,514 |
| Autodesk | | 13,950 | | 480,717 |
| CheckFree | | 11,780 a | | 583,817 |
| Cisco Systems | | 129,300 a | | 2,525,229 |
| Citrix Systems | | 15,220 a | | 610,931 |
| Cognizant Technology Solutions, Cl. A | | 7,110 a | | 479,001 |
| Hewlett-Packard | | 49,690 | | 1,574,179 |
| International Business Machines | | 18,500 | | 1,421,170 |
| Mettler-Toledo International | | 7,810 a | | 473,052 |
The Portfolio 9
STATEMENT OF INVESTMENTS (Unaudited) (continued)
| Common Stocks (continued) | | Shares | | Value ($) |
| |
| |
|
| Information Technology (continued) | | | | |
| Microsoft | | 70,220 | | 1,636,126 |
| Oracle | | 72,760 a | | 1,054,292 |
| Qualcomm | | 12,940 | | 518,506 |
| Texas Instruments | | 17,910 | | 542,494 |
| | | | | 13,202,362 |
| Materials—3.1% | | | | |
| Air Products & Chemicals | | 7,540 | | 481,957 |
| Dow Chemical | | 11,550 | | 450,796 |
| EI Du Pont de Nemours & Co. | | 8,980 | | 373,568 |
| Phelps Dodge | | 5,350 | | 439,556 |
| PPG Industries | | 4,590 | | 302,940 |
| Smurfit-Stone Container | | 20,410 a | | 223,285 |
| Steel Dynamics | | 7,870 | | 517,374 |
| | | | | 2,789,476 |
| Telecommunication Services—.9% | | | | |
| AT & T | | 30,320 | | 845,625 |
| Utilities—3.2% | | | | |
| Constellation Energy Group | | 13,110 | | 714,757 |
| PG & E | | 25,730 | | 1,010,674 |
| Sempra Energy | | 25,960 | | 1,180,661 |
| | | | | 2,906,092 |
| Total Common Stocks | | | | |
| (cost $78,710,307) | | | | 90,226,048 |
| |
| |
|
| |
| Other Investment—.5% | | | | |
| |
| |
|
| Registered Investment Company; | | | | |
| Dreyfus Institutional Preferred | | | | |
| Plus Money Market Fund | | | | |
| (cost $458,000) | | 458,000 c | | 458,000 |
| Investment of Cash Collateral | | | | |
| for Securities Loaned—2.1% | | Shares | | Value ($) |
| |
| |
|
| Registered Investment Company; | | | | |
| Dreyfus Institutional Cash | | | | | | |
| Advantage Plus Fund | | | | | | |
| (cost $1,867,190) | | | | 1,867,190 c | | 1,867,190 |
| |
| |
| |
|
| |
| Total Investments (cost $81,035,497) | | 101.8% | | 92,551,238 |
| |
| Liabilities, Less Cash and Receivables | | (1.8%) | | (1,651,614) |
| |
| Net Assets | | | | 100.0% | | 90,899,624 |
| |
| ADR—American Depository Receipts | | | | |
| a | | Non-income producing security. | | | | |
| b | | All or a portion of these securities are on loan. At June 30, 2006, the total market value of the portfolio’s securities |
| | | on loan is $1,827,971 and the total market value of the collateral held by the portfolio is $1,867,190. |
| c | | Investment in affiliated money market mutual fund. | | | | |
| |
| |
| |
|
| |
| |
| |
| |
| Portfolio Summary (Unaudited) † | | | | |
| |
| | | | | Value (%) | | | | Value (%) |
| |
| |
| |
| |
|
| Financial | | 21.8 | | Utilities | | 3.2 |
| Information Technology | | 14.5 | | Materials | | 3.1 |
| Health Care | | 12.7 | | Money Market Investments | | 2.6 |
| Industrial | | 12.5 | | Telecommunication Services | | .9 |
| Energy | | 10.2 | | Exchange Traded | | .6 |
| Consumer Discretionary | | 9.9 | | | | |
| Consumer Staples | | 9.8 | | | | 101.8 |
| |
| † | | Based on net assets. | | | | | | |
| See notes to financial statements. | | | | | | |
The Portfolio 11
STATEMENT OF ASSETS AND LIABILITIES
June 30, 2006 (Unaudited)
| | | Cost | | Value |
| |
| |
|
| Assets ($): | | | | |
| Investments in securities—See Statement | | | | |
| of Investments (including securities on loan, | | |
| valued at $1,827,971)—Note 1(b): | | | | |
| Unaffiliated issuers | | 78,710,307 | | 90,226,048 |
| Affiliated issuers | | 2,325,190 | | 2,325,190 |
| Cash | | | | 7,447 |
| Receivable for shares of Beneficial Interest subscribed | | 62,326 |
| Receivable for investment securities sold | | | | 1,673,623 |
| Dividends and interest receivable | | | | 130,339 |
| Prepaid expenses | | | | 14,419 |
| | | | | 94,439,392 |
| |
| |
|
| Liabilities ($): | | | | |
| Due to The Dreyfus Corporation and affiliates—Note 3(b) | | 67,617 |
| Liability for securities on loan—Note 1(b) | | | | 1,867,190 |
| Payable for investment securities purchased | | 1,548,479 |
| Payable for shares of Beneficial Interest redeemed | | 24,330 |
| Interest payable—Note 2 | | | | 21 |
| Accrued expenses | | | | 32,131 |
| | | | | 3,539,768 |
| |
| |
|
| Net Assets ($) | | | | 90,899,624 |
| |
| |
|
| Composition of Net Assets ($): | | | | |
| Paid-in capital | | | | 91,369,546 |
| Accumulated undistributed of investment income—net | | 462,480 |
| Accumulated net realized gain (loss) on investments | | (12,448,143) |
| Accumulated net unrealized appreciation | | | | |
| (depreciation) on investments | | | | 11,515,741 |
| |
| |
|
| Net Assets ($) | | | | 90,899,624 |
| |
| |
|
| |
| |
| Net Asset Value Per Share | | | | |
| | | Initial Shares | | Service Shares |
| |
| |
|
| Net Assets ($) | | 82,535,949 | | 8,363,675 |
| Shares Outstanding | | 3,655,110 | | 371,286 |
| |
| |
|
| Net Asset Value Per Share ($) | | 22.58 | | 22.53 |
See notes to financial statements.
|
STATEMENT OF OPERATIONS
Six Months Ended June 30, 2006 (Unaudited)
|
| Investment Income ($): | | |
| Income: | | |
| Cash dividends (net of $5,186 foreign taxes withheld at source): | | |
| Unaffiliated issuers | | 849,760 |
| Affiliated issuers | | 2,276 |
| Interest | | 8,982 |
| Income from securities lending | | 1,285 |
| Total Income | | 862,303 |
| Expenses: | | |
| Investment advisory fee—Note 3(a) | | 359,193 |
| Professional fees | | 17,058 |
| Distribution fees—Note 3(b) | | 11,005 |
| Trustees’ fees and expenses—Note 3(c) | | 6,514 |
| Custodian fees—Note 3(b) | | 5,445 |
| Loan commitment fees—Note 2 | | 545 |
| Interest expense—Note 2 | | 284 |
| Total Expenses | | 400,044 |
| Less—waiver of fees due to undertaking—Note 3(a) | | (2,660) |
| Net Expenses | | 397,384 |
| Investment Income—Net | | 464,919 |
| |
|
| Realized and Unrealized Gain (Loss) on Investments—Note 4 ($): |
| Net realized gain (loss) on investments | | 5,674,525 |
| Net unrealized appreciation (depreciation) on investments | | (3,737,322) |
| Net Realized and Unrealized Gain (Loss) on Investments | | 1,937,203 |
| Net Increase in Net Assets Resulting from Operations | | 2,402,122 |
See notes to financial statements.
|
The Portfolio 13
STATEMENT OF CHANGES IN NET ASSETS
| | | Six Months Ended | | |
| | | June 30, 2006 | | Year Ended |
| | | (Unaudited) | | December 31, 2005 |
| |
| |
|
| Operations ($): | | | | |
| Investment income—net | | 464,919 | | 812,180 |
| Net realized gain (loss) on investments | | 5,674,525 | | 10,150,869 |
| Net unrealized appreciation | | | | |
| (depreciation) on investments | | (3,737,322) | | (4,868,955) |
| Net Increase (Decrease) in Net Assets | | | | |
| Resulting from Operations | | 2,402,122 | | 6,094,094 |
| |
| |
|
| Dividends to Shareholders from ($): | | | | |
| Investment income—net: | | | | |
| Initial shares | | (747,950) | | — |
| Service shares | | (66,669) | | — |
| Total Dividends | | (814,619) | | — |
| |
| |
|
| Beneficial Interest Transactions ($): | | | | |
| Net proceeds from shares sold: | | | | |
| Initial shares | | 1,244,275 | | 3,453,325 |
| Service shares | | 230,806 | | 300,528 |
| Dividends reinvested: | | | | |
| Initial shares | | 747,950 | | — |
| Service shares | | 66,669 | | — |
| Cost of shares redeemed: | | | | |
| Initial shares | | (9,506,618) | | (23,812,339) |
| Service shares | | (1,024,446) | | (1,646,452) |
| Increase (Decrease) in Net Assets from | | | | |
| Beneficial Interest Transactions | | (8,241,364) | | (21,704,938) |
| Total Increase (Decrease) in Net Assets | | (6,653,861) | | (15,610,844) |
| |
| |
|
| Net Assets ($): | | | | |
| Beginning of Period | | 97,553,485 | | 113,164,329 |
| End of Period | | 90,899,624 | | 97,553,485 |
| Undistributed investment income—net | | 462,480 | | 812,180 |
| | | Six Months Ended | | |
| | | June 30, 2006 | | Year Ended |
| | | (Unaudited) | | December 31, 2005 |
| |
| |
|
| Capital Share Transactions: | | | | |
| Initial Shares | | | | |
| Shares sold | | 54,024 | | 164,137 |
| Shares issued for dividends reinvested | | 32,295 | | — |
| Shares redeemed | | (415,637) | | (1,121,420) |
| Net Increase (Decrease) in Shares Outstanding | | (329,318) | | (957,283) |
| |
| |
|
| Service Shares | | | | |
| Shares sold | | 9,965 | | 14,394 |
| Shares issued for dividends reinvested | | 2,883 | | — |
| Shares redeemed | | (44,782) | | (77,648) |
| Net Increase (Decrease) in Shares Outstanding | | (31,934) | | (63,254) |
See notes to financial statements.
|
The Portfolio 15
The following tables describe the performance for each share class for the fiscal periods indicated. All information (except portfolio turnover rate) reflects financial results for a single portfolio share.Total return shows how much your investment in the portfolio would have increased (or decreased) during each period, assuming you had reinvested all dividends and distributions.These figures have been derived from the portfolio’s financial statements.
| | | Six Months Ended | | | | | | | | | |
| | | | | June 30, 2006 | | | | Year Ended December 31, | | |
| | | | | |
| |
| |
|
| Initial Shares | | (Unaudited) | | 2005 | | 2004 | | 2003 | | 2002 | | 2001 |
| |
| |
| |
| |
| |
| |
|
| Per Share Data ($): | | | | | | | | | | | | |
| Net asset value, | | | | | | | | | | | | |
| beginning of period | | 22.24 | | 20.93 | | 19.66 | | 16.04 | | 20.89 | | 24.19 |
| Investment Operations: | | | | | | | | | | | | |
| Investment income—net a | | .11 | | .17 | | .21 | | .14 | | .12 | | .09 |
| Net realized and unrealized | | | | | | | | | | | | |
| gain (loss) on investments | | .43 | | 1.14 | | 1.34 | | 3.63 | | (4.84) | | (3.30) |
| Total from Investment Operations | | .54 | | 1.31 | | 1.55 | | 3.77 | | (4.72) | | (3.21) |
| Distributions: | | | | | | | | | | | | |
| Dividends from investment | | | | | | | | | | | | |
| income—net | | (.20) | | — | | (.28) | | (.15) | | (.13) | | (.09) |
| Net asset value, end of period | | 22.58 | | 22.24 | | 20.93 | | 19.66 | | 16.04 | | 20.89 |
| |
| |
| |
| |
| |
| |
|
| Total Return (%) | | 2.38b | | 6.26 | | 7.87 | | 23.53 | | (22.61) | | (13.27) |
| |
| |
| |
| |
| |
| |
|
| Ratios/Supplemental Data (%): | | | | | | | | | | |
| Ratio of total expenses | | | | | | | | | | | | |
| to average net assets | | .40b | | .90 | | .85 | | .85 | | .83 | | .81 |
| Ratio of net expenses | | | | | | | | | | | | |
| to average net assets | | .40b | | .90 | | .85 | | .85 | | .83 | | .81 |
| Ratio of net investment income | | | | | | | | | | |
| to average net assets | | .49b | | .79 | | 1.04 | | .81 | | .64 | | .40 |
| Portfolio Turnover Rate | | 43.09b | | 74.33 | | 83.64 | | 52.74 | | 47.47 | | 48.22 |
| |
| |
| |
| |
| |
| |
|
| Net Assets, end of period | | | | | | | | | | | | |
| ($ x 1,000) | | 82,536 | | 88,608 | | 103,417 | | 111,352 | | 106,404 | | 172,360 |
| |
| a | | Based on average shares outstanding at each month end. | | | | | | | | |
| b | | Not annualized. | | | | | | | | | | | | |
| See notes to financial statements. | | | | | | | | | | | | |
| | | Six Months Ended | | | | | | | | |
| | | | | June 30, 2006 | | | | Year Ended December 31, | | |
| | | | | |
| |
| |
|
| Service Shares | | (Unaudited) | | 2005 | | 2004 | | 2003 | | 2002 | | 2001 |
| |
| |
| |
| |
| |
| |
|
| Per Share Data ($): | | | | | | | | | | | | |
| Net asset value, | | | | | | | | | | | | |
| beginning of period | | 22.18 | | 20.90 | | 19.63 | | 16.02 | | 20.86 | | 24.19 |
| Investment Operations: | | | | | | | | | | | | |
| Investment income—net a | | .09 | | .15 | | .18 | | .11 | | .09 | | .05 |
| Net realized and unrealized | | | | | | | | | | | | |
| gain (loss) on investments | | .43 | | 1.13 | | 1.33 | | 3.62 | | (4.83) | | (3.30) |
| Total from Investment Operations | | .52 | | 1.28 | | 1.51 | | 3.73 | | (4.74) | | (3.25) |
| Distributions: | | | | | | | | | | | | |
| Dividends from investment | | | | | | | | | | | | |
| income—net | | (.17) | | — | | (.24) | | (.12) | | (.10) | | (.08) |
| Net asset value, end of period | | 22.53 | | 22.18 | | 20.90 | | 19.63 | | 16.02 | | 20.86 |
| |
| |
| |
| |
| |
| |
|
| Total Return (%) | | 2.29b | | 6.22 | | 7.64 | | 23.31 | | (22.72) | | (13.46) |
| |
| |
| |
| |
| |
| |
|
| Ratios/Supplemental Data (%): | | | | | | | | | | |
| Ratio of total expenses | | | | | | | | | | | | |
| to average net assets | | .53b | | 1.15 | | 1.10 | | 1.09 | | 1.06 | | 1.13 |
| Ratio of net expenses | | | | | | | | | | | | |
| to average net assets | | .50b | | 1.00 | | 1.00 | | 1.00 | | 1.00 | | 1.00 |
| Ratio of net investment income | | | | | | | | | | |
| to average net assets | | .40b | | .69 | | .90 | | .65 | | .49 | | .26 |
| Portfolio Turnover Rate | | 43.09b | | 74.33 | | 83.64 | | 52.74 | | 47.47 | | 48.22 |
| |
| |
| |
| |
| |
| |
|
| Net Assets, end of period | | | | | | | | | | | | |
| ($ x 1,000) | | 8,364 | | 8,945 | | 9,748 | | 10,299 | | 9,150 | | 7,929 |
| |
| a | | Based on average shares outstanding at each month end. | | | | | | | | |
| b | | Not annualized. | | | | | | | | | | | | |
| See notes to financial statements. | | | | | | | | | | | | |
The Portfolio 17
NOTES TO FINANCIAL STATEMENTS (Unaudited)
NOTE 1—Significant Accounting Policies:
Dreyfus Variable Investment Fund (the “fund”) is registered under the Investment Company Act of 1940, as amended (the “Act”), as an open-end management investment company, operating as a series company currently offering twelve series, including the Disciplined Stock Portfolio (the “portfolio”). The portfolio is only offered to separate accounts established by insurance companies to fund variable annuity contracts and variable life insurance policies.The portfolio is a diversified series.The portfolio’s investment objective is to provide investment returns (consisting of capital appreciation and income) that are consistently superior to the Standard & Poor’s 500 Composite Stock Price Index.The Dreyfus Corporation (the “Manager” or “Dreyfus”) serves as the portfolio’s investment adviser. The Manager is a wholly-owned subsidiary of Mellon Financial Corporation (“Mellon Financial”).
Dreyfus Service Corporation (the “Distributor”), a wholly-owned subsidiary of the Manager, is the distributor of the portfolio’s shares, which are sold without a sales charge.The portfolio is authorized to issue an unlimited number of $.001 par value shares of Beneficial Interest in each of the following classes of shares: Initial and Service. Each class of shares has identical rights and privileges, except with respect to the distribution plan and the expenses borne by each class and certain voting rights. Income, expenses (other than expenses attributable to a specific class), and realized and unrealized gains or losses on investments are allocated to each class of shares based on its relative net assets.
The fund accounts separately for the assets, liabilities and operations of each series. Expenses directly attributable to each series are charged to that series’ operations; expenses which are applicable to all series are allocated among them on a pro rata basis.
The portfolio’s financial statements are prepared in accordance with U.S. generally accepted accounting principles, which may require the use of management estimates and assumptions.Actual results could differ from those estimates.
The fund enters into contracts that contain a variety of indemnifica-tions.The portfolio’s maximum exposure under these arrangements is unknown. The portfolio does not anticipate recognizing any loss related to these arrangements.
(a) Portfolio valuation: Investments in securities are valued at the last sales price on the securities exchange or national securities market on which such securities are primarily traded. Securities listed on the National Market System for which market quotations are available are valued at the official closing price or, if there is no official closing price that day, at the last sales price. Securities not listed on an exchange or the national securities market, or securities for which there were no transactions, are valued at the average of the most recent bid and asked prices, except for open short positions, where the asked price is used for valuation purposes. Bid price is used when no asked price is available. Investments in registered investment companies are valued at their net asset value. When market quotations or official closing prices are not readily available, or are determined not to reflect accurately fair value, such as when the value of a security has been significantly affected by events after the close of the exchange or market on which the security is principally traded (for example, a foreign exchange or market), but before the portfolio calculates its net asset value, the portfolio may value these investments at fair value as determined in accordance with the procedures approved by the Board of Trustees. Fair valuing of securities may be determined with the assistance of a pricing service using calculations based on indices of domestic securities and other appropriate indicators, such as prices of relevant ADR’s and futures contracts. For other securities that are fair valued by the Board of Trustees, certain factors may be considered such as: fundamental analytical data, the nature and duration of restrictions on disposition, an evaluation of the forces that influence the market in which the securities are purchased and sold and public trading in similar securities of the issuer or comparable issuers. Investments denominated in foreign cur-
The Portfolio 19
NOTES TO FINANCIAL STATEMENTS (Unaudited) (continued)
rencies are translated to U.S. dollars at the prevailing rates of exchange. Forward currency exchange contracts are valued at the forward rate.
(b) Securities transactions and investment income: Securities transactions are recorded on a trade date basis. Realized gain and loss from securities transactions are recorded on the identified cost basis. Dividend income is recognized on the ex-dividend date and interest income, including, where applicable, accretion of discount and amortization of premium on investments, is recognized on the accrual basis.
The portfolio has an arrangement with the custodian bank whereby the portfolio receives earnings credits from the custodian when positive cash balances are maintained, which are used to offset custody fees. For financial reporting purposes, the portfolio includes net earnings credits, if any, as an expense offset in the Statement of Operations.
Pursuant to a securities lending agreement with Mellon Bank, N.A., an affiliate of the Manager, the portfolio may lend securities to qualified institutions. It is the portfolio’s policy, that at origination, all loans are secured by collateral of at least 102% of the value of U.S. securities loaned and 105% of the value of foreign securities loaned. Collateral equivalent to at least 100% of the market value of securities on loan is maintained at all times. Cash collateral is invested in certain money market mutual funds managed by the Manager.The portfolio is entitled to receive all income on securities loaned, in addition to income earned as a result of the lending transaction. Although each security loaned is fully collateralized, the portfolio bears the risk of delay in recovery of, or loss of rights in, the securities loaned should a borrower fail to return the securities in a timely manner.
(c) Affiliated issuers: Investments in other investment companies advised by the Manager are defined as “affiliated” in the Act.
(d) Dividends to shareholders: Dividends are recorded on the ex-dividend date. Dividends from investment income-net and dividends from net realized capital gain, if any, are normally declared and paid annually,
but the portfolio may make distributions on a more frequent basis to comply with the distribution requirements of the Internal Revenue Code of 1986, as amended (the “Code”).To the extent that net realized capital gain can be offset by capital loss carryovers, it is the policy of the portfolio not to distribute such gain. Income and capital gain distributions are determined in accordance with income tax regulations, which may differ from U.S. generally accepted accounting principles.
(e) Federal income taxes: It is the policy of the portfolio to continue to qualify as a regulated investment company, if such qualification is in the best interests of its shareholders, by complying with the applicable provisions of the Code, and to make distributions of taxable income sufficient to relieve it from substantially all federal income and excise taxes.
The portfolio has an unused capital loss carryover of $17,278,113 available for federal income tax purposes to be applied against future net securities profits, if any, realized subsequent to December 31, 2005. If not applied, $13,192,745 of the carryover expires in fiscal 2010 and $4,085,368 expires in fiscal 2011.
There were no distributions paid to shareholders during the fiscal year ended December 31, 2005.The tax character of current year distributions will be determined at the end of the current fiscal year.
NOTE 2—Bank Line of Credit:
|
The portfolio participates with other Dreyfus-managed funds in a $350 million redemption credit facility (the “Facility”) to be utilized for temporary or emergency purposes, including the financing of redemptions. In connection therewith, the portfolio has agreed to pay commitment fees on its pro rata portion of the Facility. Interest is charged to the portfolio based on prevailing market rates in effect at the time of borrowing.
The average daily amount of borrowings outstanding under the Facility during the period ended June 30, 2006 was approximately $10,500, with a related weighted average annualized rate of 5.45% .
The Portfolio 21
NOTES TO FINANCIAL STATEMENTS (Unaudited) (continued)
NOTE 3—Investment Advisory Fee and Other Transactions With Affiliates:
(a) Pursuant to an Investment Advisory Agreement with the Manager, the investment advisory fee is computed at the annual rate of .75% of the value of the portfolio’s average daily net assets and is payable monthly.
The Manager has undertaken, from January 1, 2006 to December 31, 2006, to waive receipt of its fees and/or assume the expenses of the portfolio so that the expenses of neither class, exclusive of taxes, brokerage fees, interest on borrowings, commitment fees and extraordinary expenses, exceed an annual rate of 1% of the value of the average daily net assets of their class. During the period ended June 30, 2006, the Manager waived receipt of fees of $2,660, pursuant to the undertaking.
(b) Under the Distribution Plan (the “Plan”) adopted pursuant to Rule 12b-1 under the Act, Service shares pay the Distributor for distributing their shares, for servicing and/or maintaining Service shares shareholder accounts and for advertising and marketing for Service shares.The Plan provides for payments to be made at an annual rate of .25% of the value of the Service shares’ average daily net assets.The Distributor may make payments to Participating Insurance Companies and to brokers and dealers acting as principal underwriter for their variable insurance products.The fees payable under the Plan are payable without regard to actual expenses incurred. During the period ended June 30, 2006, Service shares were charged $11,005 pursuant to the Plan.
The portfolio compensates Dreyfus Transfer, Inc., a wholly-owned subsidiary of the Manager, under a transfer agency agreement for providing personnel and facilities to perform transfer agency services for the portfolio. During the period ended June 30, 2006, the portfolio was charged $112 pursuant to the transfer agency agreement.
The portfolio compensates Mellon Bank, N.A., an affiliate of the Manager, under a custody agreement to provide custodial services for the portfolio. During the period ended June 30, 2006, the portfolio was charged $5,445 pursuant to the custody agreement.
During the period ended June 30, 2006, the fund was charged $1,926 for services performed by the Chief Compliance Officer.
The components of Due to The Dreyfus Corporation and affiliates in the Statement of Assets and Liabilities consist of: investment advisory fees $57,470, Rule 12b-1 distribution plan fees $1,706, custodian fees $6,479, chief compliance officer fees $1,926 and transfer agency per account fees $36.
(c) Each Board member also serves as a Board member of other funds within the Dreyfus complex. Annual retainer fees and attendance fees are allocated to each fund based on net assets.
(d) Pursuant to an exemptive order from the SEC, the portfolio may invest its available cash balances in affiliated money market mutual funds. Management fees of the underlying money market mutual funds have been waived by the Manager.
NOTE 4—Securities Transactions:
The aggregate amount of purchases and sales of investment securities, excluding short-term securities, during the period ended June 30, 2006, amounted to $41,307,741 and $49,445,096, respectively.
At June 30, 2006, accumulated net unrealized appreciation on investments was $11,515,741, consisting of $12,992,669 gross unrealized appreciation and $1,476,928 gross unrealized depreciation.
At June 30,2006,the cost of investments for federal income tax purposes was substantially the same as the cost for financial reporting purposes (see Statement of Investment).
The Portfolio 23
PROXY RESULTS ( U n a u d i t e d )
|
Dreyfus Variable Investment Fund held a special meeting of shareholders on June 29, 2006.The proposal considered at the meeting, and the results, are as follows:
| | | | | Shares | | |
| |
| |
| |
|
| | | For | | | | Authority Withheld |
| |
| |
| |
|
| To elect additional Board Members: | | | | | | |
| Peggy C. Davis † | | 171,078,926.558 | | | | 7,687,714.085 |
| Joseph S. DiMartino | | 170,946,484.400 | | | | 7,820,156.243 |
| David P. Feldman | | 170,959,920.714 | | | | 7,806,719.929 |
| Ehud Houminer † | | 170,132,086.682 | | | | 8,634,553.961 |
| Gloria Messinger † | | 170,187,240.710 | | | | 8,579,399.933 |
| Anne Wexler † | | 170,212,607.472 | | | | 8,554,033.171 |
| † Each will serve as an Independent Board member of the fund commencing, subject to the discretion of the Board, on |
| or about January 1, 2007. |
| In addition to Joseph S. DiMartino and David P. Feldman, James F. Henry, Dr. Paul A. Marks and Dr. Martin |
| Peretz continue as Board members of the fund. |
INFORMATION ABOUT THE REVIEW AND APPROVAL OF THE PORTFOLIO’S
I N V E S T M E N T A D V I S O R Y A G R E E M E N T (Unaudited)
At a meeting of the fund’s Board of Trustees held on June 7 and 8, 2006, the Board considered the re-approval for an annual period (through July 31, 2007) of the fund’s Investment Advisory Agreement with Dreyfus for the portfolio, pursuant to which Dreyfus provides the portfolio with investment advisory and administrative services. The Board members, none of whom are “interested persons” (as defined in the Investment Company Act of 1940, as amended) of the fund were assisted in their review by independent legal counsel and met with counsel in executive session separate from representatives of Dreyfus.
Analysis of Nature, Extent and Quality of Services Provided to the Portfolio. The Board members received a presentation from representatives of Dreyfus regarding services provided to the portfolio and other funds in the Dreyfus fund complex, and discussed the nature, extent and quality of the services provided to the portfolio pursuant to its Investment Advisory Agreement. Dreyfus’ representatives reviewed the portfolio’s distribution of accounts and the relationships Dreyfus has with various intermediaries and the different needs of each.The Board noted that the portfolio’s shares were offered only to separate accounts established by insurance companies to fund variable annuity contracts and variable life insurance policies. Dreyfus’ representatives noted the diversity of distribution among the funds in the Dreyfus fund complex, and Dreyfus’ corresponding need for broad, deep, and diverse resources to be able to provide ongoing shareholder services to each distribution channel, including that of the portfolio. Dreyfus also provided the number of separate accounts investing in the portfolio, as well as the portfolio’s asset size.
The Board members also considered Dreyfus’ research and portfolio management capabilities and that Dreyfus also provides oversight of day-to-day portfolio operations, including fund accounting and administration and assistance in meeting legal and regulatory requirements. The Board members also considered Dreyfus’ extensive administrative, accounting and compliance infrastructure.
The Portfolio 25
I N FO R M AT I O N A B O U T T H E R E V I E W A N D A P P R OVA L O F T H E P O R T FO L I O ’ S I N V E S T M E N T A DV I S O RY A G R E E M E N T ( U n a u d i t e d ) ( c o n t i n u e d )
Comparative Analysis of the Portfolio’s Performance and Advisory Fee and Expense Ratio. The Board members reviewed the portfolio’s performance and placed significant emphasis on comparisons to a group of large-cap core funds underlying variable insurance products (the “Performance Group”) and to a larger universe of funds, consisting of all large-cap core funds underlying variable insurance products (the “Performance Universe”) selected and provided by Lipper, Inc., an independent provider of investment company data. The Board was provided with a description of the methodology Lipper used to select the Performance Group and Performance Universe, as well as the Expense Group and Expense Universe (discussed below). The Board members discussed the results of the comparisons for various periods ended April 30, 2006, and noted that the portfolio’s total return performance for its Initial shares was variously at, above or below median (but in the third quintile) of the Performance Group for each period and variously above or below the Performance Universe median for each period. The Board members noted that the portfolio’s current portfolio manager assumed that role in October 2004 and that performance was above the medians for the one- and two-year periods. Dreyfus also provided the Board with the portfolio’s total return performance and the quartile, percentile and rank of the portfolio’s total return within its Lipper category (as provided by Lipper) for certain other periods ended April 30, 2006, which generally were consistent with the relative total return information provided by Lipper.
The Board members also discussed the portfolio’s advisory fee and expense ratio for each class of shares and reviewed the range of advisory fees and expense ratios of a comparable group of funds (the “Expense Group”) and a broader group of funds (the “Expense Universe”), each selected and provided by Lipper.The Board members noted that the portfolio’s advisory fee and the expense ratios for the Initial shares and Service shares were higher than the Expense Group and Expense Universe medians.
Representatives of Dreyfus reviewed with the Board members the advisory fees paid by mutual funds managed by Dreyfus or its affiliates with similar investment objectives, policies and strategies, and included within the portfolio’s Lipper category (the “Similar Funds”), and by other accounts managed by Dreyfus or its affiliates with similar investment objectives, policies and strategies as the portfolio (the “Similar Accounts”). Dreyfus’ representatives explained the nature of the Similar Accounts and the differences, from Dreyfus’ perspective, in providing services to such Similar Accounts as compared to managing and providing services to the portfolio. Dreyfus’ representatives also reviewed the costs associated with distribution through intermediaries. The Board analyzed differences in fees paid to Dreyfus and discussed the relationship of the fees paid in light the services provided. The Board members considered the relevance of the fee information provided for the Similar Funds and the Similar Accounts to evaluate the appropriateness and reasonableness of the portfolio’s investment advisory fee.The Board acknowledged that differences in fees paid by the Similar Accounts seemed to be consistent with the services provided.
Analysis of Profitability and Economies of Scale. Dreyfus’ representatives reviewed the dollar amount of expenses allocated and profit received by Dreyfus and the method used to determine such expenses and profit.The Board considered information, previously provided and discussed, prepared by an independent consulting firm regarding Dreyfus’ approach to allocating costs to, and determining the profitability of, individual funds and the entire Dreyfus mutual fund complex. The Board members also considered that the methodology had also been reviewed by an independent registered public accounting firm which, like the consultant, found the methodology to be reason-able.The consulting firm also analyzed where any economies of scale might emerge in connection with the management of the portfolio. The Board members evaluated the profitability analysis in light of the relevant circumstances for the portfolio and the extent to which
The Portfolio 27
I N FO R M AT I O N A B O U T T H E R E V I E W A N D A P P R OVA L O F T H E P O R T FO L I O ’ S I N V E S T M E N T A DV I S O RY A G R E E M E N T ( U n a u d i t e d ) ( c o n t i n u e d )
economies of scale would be realized if the portfolio grows and whether fee levels reflect these economies of scale for the benefit of portfolio investors.The Board members also considered potential benefits to Dreyfus from acting as investment adviser and noted the soft dollar arrangements with respect to trading the portfolio’s investments.
It was noted that the Board members should consider Dreyfus’ profitability with respect to the portfolio as part of their evaluation of whether the fees under the Investment Advisory Agreement bear a reasonable relationship to the mix of services provided by Dreyfus, including the nature, extent and quality of such services and that a discussion of economies of scale is predicated on increasing assets and that, if a fund’s assets had been decreasing, the possibility that Dreyfus may have realized any economies of scale would be less. It also was noted that the profitability percentage for managing the portfolio was within ranges determined by appropriate court cases to be reasonable given the services rendered and generally superior service levels provided by Dreyfus.
At the conclusion of these discussions, the Board agreed that it had been furnished with sufficient information to make an informed business decision with respect to continuation of the Investment Advisory Agreement, with respect to the portfolio. Based on the discussions and considerations as described above, the Board made the following conclusions and determinations.
- The Board concluded that the nature, extent and quality of the ser- vices provided by Dreyfus are adequate and appropriate.
- The Board generally was satisfied with the portfolio’s overall perfor- mance, noting that the portfolio’s current portfolio manager assumed that role in October 2004 and the fund’s performance since that time.
- The Board concluded that the fee paid by the portfolio to Dreyfus was reasonable in light of the services provided, comparative perfor- mance, expense and advisory fee information, including costs of the services provided and profits to be realized and benefits derived or to be derived by Dreyfus from its relationship with the portfolio.
- The Board determined that the economies of scale which may accrue to Dreyfus and its affiliates in connection with the management of the portfolio had been adequately considered by Dreyfus in connection with the advisory fee rate charged to the portfolio and that, to the extent in the future it were determined that material economies of scale had not been shared with the portfolio, the Board would seek to have those economies of scale shared with the portfolio.
The Board members considered these conclusions and determinations, along with information received on a routine and regular basis throughout the year, and, without any one factor being dispositive, the Board determined that re-approval of the portfolio’s Investment Advisory Agreement was in the best interests of the portfolio and its shareholders.
The Portfolio 29
| Dreyfus Variable |
| Investment Fund, |
| Disciplined Stock Portfolio |
| 200 Park Avenue |
| New York, NY 10166 |
| |
| Investment Adviser |
| The Dreyfus Corporation |
| 200 Park Avenue |
| New York, NY 10166 |
| |
| Custodian |
| Mellon Bank, N.A. |
| One Mellon Bank Center |
| Pittsburgh, PA 15258 |
| Transfer Agent & |
| Dividend Disbursing Agent |
| Dreyfus Transfer, Inc. |
| 200 Park Avenue |
| New York, NY 10166 |
| |
| Distributor |
| Dreyfus Service Corporation |
| 200 Park Avenue |
| New York, NY 10166 |
Telephone 1-800-554-4611 or 516-338-3300
Mail The Dreyfus Family of Funds, 144 Glenn Curtiss Boulevard, Uniondale, NY 11556-0144 Attn: Investments Division
The portfolio files its complete schedule of portfolio holdings with the Securities and Exchange Commission (“SEC”) for the first and third quarters of each fiscal year on Form N-Q. The portfolio’s Forms N-Q are available on the SEC’s website at http://www.sec.gov and may be reviewed and copied at the SEC’s Public Reference Room in Washington, DC. Information on the operation of the Public Reference Room may be obtained by calling 1-202-551-8090.
A description of the policies and procedures that the portfolio uses to determine how to vote proxies relating to portfolio securities, and information regarding how the portfolio voted these proxies for the 12-month period ended June 30, 2006, is available at http://www.dreyfus.com and on the SEC’s website at http://www.sec.gov. The description of the policies and procedures is also available without charge, upon request, by calling 1-800-645-6561.
| © 2006 Dreyfus Service Corporation |


The views expressed in this report reflect those of the portfolio manager only through the end of the period covered and do not necessarily represent the views of Dreyfus or any other person in the Dreyfus organization.Any such views are subject to change at any time based upon market or other conditions and Dreyfus disclaims any responsibility to update such views. These views may not be relied on as investment advice and, because investment decisions for a Dreyfus portfolio are based on numerous factors, may not be relied on as an indication of trading intent on behalf of any Dreyfus portfolio.
Not FDIC-Insured • Not Bank-Guaranteed • May Lose Value
| | | Contents |
| |
| | | T H E P O R T F O L I O |
| |
|
| 2 | | Letter from the Chairman |
| 3 | | Discussion of Performance |
| 6 | | Understanding Your Portfolio’s Expenses |
| 6 | | Comparing Your Portfolio’s Expenses |
| | | With Those of Other Funds |
| 7 | | Statement of Investments |
| 11 | | Statement of Assets and Liabilities |
| 12 | | Statement of Operations |
| 13 | | Statement of Changes in Net Assets |
| 15 | | Financial Highlights |
| 17 | | Notes to Financial Statements |
| 24 | | Proxy Results |
| 25 | | Information About the Review |
| and Approval of the Portfolio’s |
| Investment Advisory Agreement |
| | | F O R M O R E I N F O R M AT I O N |
| |
|
| | | Back Cover |
| Dreyfus Variable Investment Fund, |
| Growth and Income Portfolio |

LETTER FROM THE CHAIRMAN
We are pleased to present this semiannual report for Dreyfus Variable Investment Fund, Growth and Income Portfolio, covering the six-month period from January 1, 2006, through June 30, 2006.
Stock market gains over the first four months of 2006 were given back in May and June, when investors reacted negatively to suggestions that the U.S. Federal Reserve Board (the “Fed”) and other central banks, in their fight against inflation, might raise short-term interest rates more than previously expected. In the judgment of our Chief Economist, Richard Hoey, the recent correction reflects an adjustment among leveraged investors toward lower risk levels as the U.S. economy moves into a more mature phase with milder rates of growth. In our view, corrections such as these generally are healthy mechanisms that help wring speculative excesses from the financial markets, potentially setting the stage for future rallies.
While a recession currently appears unlikely, a number of economic uncertainties remain. Indicators to watch in the months ahead include the outlook for inflation, the extent of softness in the U.S. housing market, the impact of slower economic growth on consumer spending, additional changes in interest rates from the Fed and other central banks, and the strength of the U.S. dollar relative to other major currencies. As always, we encourage you to discuss these and other investment-related issues with your financial advisor, who can help you prepare for the challenges and opportunities that lie ahead.
For information about how the fund performed during the reporting period, as well as market perspectives, we have provided a Discussion of Fund Performance given by the fund’s portfolio manager.
Thank you for your continued confidence and support.


DISCUSSION OF PERFORMANCE
L. Emerson Tuttle, Portfolio Manager
How did Dreyfus Variable Investment Fund, Growth and Income Portfolio perform relative to its benchmark?
For the six-month period ended June 30, 2006, the portfolio achieved total returns of 0.00% for its Initial shares and –0.14% for its Service shares.1 For the same period, the total return of the Standard & Poor’s 500 Composite Stock Price Index (“S&P 500 Index”), the portfolio’s benchmark, was 2.71% .2 Conflicting macroeconomic forces produced high levels of volatility in the stock market, but on average left stock prices roughly unchanged from where the reporting period began. In this uncertain environment, traditionally defensive, value-oriented stocks tended to outperform their growth-oriented counterparts. Because the portfolio maintained a modest tilt in favor of growth-oriented stocks, its performance trailed that of the benchmark.
On a separate note, effective on or about August 1, 2006, John B. Jares, an employee of Dreyfus and The Boston Company Asset Management, LLC, will be the fund’s primary portfolio manager.
What is the portfolio’s investment approach?
The portfolio seeks long-term capital growth, current income and growth of income consistent with reasonable investment risk.To pursue these goals, the portfolio invests primarily in stocks, bonds and money market instruments of domestic and foreign issuers.The portfolio’s stock investments may include common stocks, preferred stocks and convertible securities, including those purchased in initial public offerings or shortly thereafter.
The portfolio’s investment strategy combines market economics with fundamental research.The portfolio manager begins by assessing current economic conditions and forecasting economic expectations. Each economic sector of the S&P 500 Index is examined to determine the sector’s market-capitalized weighting and to estimate the performance of the sector relative to the S&P 500 Index as a whole. A balance is determined for the portfolio, giving greater weight to sectors that are expected to outperform the overall market and less weight to sectors that are expected to underperform the overall market. In choosing stocks, the portfolio employs fundamental analysis, generally seeking companies with strong positions in their industries, and
The Portfolio 3
DISCUSSION OF PERFORMANCE (continued)
|
companies with a catalyst that can trigger a price increase (such as accelerating earnings growth, a corporate restructuring or change in management).The portfolio manager seeks to create a broadly diversified core portfolio comprised of growth stocks, value stocks and stocks that exhibit characteristics of both investment styles. Income is generated primarily from dividend-paying stocks in which the portfolio may invest. The manager selects stocks based on: value, or how a stock is priced relative to its perceived intrinsic worth; growth, in this case the sustainability or growth of earnings or cash flow; and financial profile, which measures the financial health of the company.
On or about August 1, 2006, in choosing stocks, the portfolio manager will use a “growth style” of investing, seeking companies whose fundamental strengths suggest the potential to provide superior earnings growth time.The portfolio manager will use a consistent, bottom-up approach that emphasizes individual stock selection. The portfolio manager will go beyond Wall Street analysis and perform qualitative and quantitative in-house research to determine whether a stock meets his investment criteria. Income is generated primarily from dividend-paying stocks in which the portfolio may invest.
The portfolio manager will monitor the stocks in the portfolio and will consider selling a security if the company’s business momentum deteriorates or valuation becomes excessive.The portfolio manager will also sell a security if an event occurs that contradicts the portfolio manager’s rationale for owning it, such as deterioration in the company’s financial fundamentals. In addition, the portfolio manager may sell a security if better investment opportunities emerge elsewhere, or to effect a change in the industry or sector weightings.
What other factors influenced the portfolio’s performance?
Although continued economic growth positioned most companies to meet or exceed analysts’ revenue and earnings expectations, mounting inflationary pressures, rising interest rates and a slowing housing market cast doubt on the sustainability of future economic growth.These concerns undermined investor sentiment and hurt the performance of traditionally growth-oriented areas, especially within the technology, health care and consumer discretionary sectors.
Disappointing stock selections further detracted from the portfolio’s relative performance, particularly in the three areas cited above. Within the technology sector, notably weak holdings included software giant Microsoft,which faced strong competition and rising costs in the development of Internet-based products; and communications semiconductor maker Broadcom, which encountered problems related to corporate gov-
ernance and increasing competition. In the health care area, ocular product developer Alcon was hurt by high marketing costs and increasing competitive pressures, while medical device maker Medtronic faced unfavorable Medicare reimbursement trends that led us to sell the portfolio’s position in the stock. Finally, the consumer discretionary sector accounted for several of the portfolio’s more disappointing investments. Retailers Advance Auto Parts,Home Depot and Target suffered declines due to concerns over consumer spending, while digital game maker Electronic Arts lost ground due to delays in the release of Sony’s latest gaming platform. However, the success of our sector allocation and security selection strategies in other areas offset most losses, enabling the portfolio to preserve its value during the reporting period. Energy stocks generated strong returns in response to high oil and gas prices. The portfolio benefited from this trend through relatively heavy exposure to energy companies and good individual selections, such as drilling services provider Weatherford International. Similarly, an overweighted position in the robust industrial sector boosted returns, as did individual holdings such as rail carrier Burlington Northern Santa Fe and diversified industrial conglomerate Danaher.
What is the portfolio’s current strategy?
As of June 30, 2006, the portfolio held modestly overweighted positions in the energy and technology areas, and slightly underweighted positions in the financial, consumer discretionary, telecommunications services and utility sectors.
| | | The portfolio is only available as a funding vehicle under variable life insurance policies or variable |
| | | annuity contracts issued by insurance companies. Individuals may not purchase shares of the |
| | | portfolio directly.A variable annuity is an insurance contract issued by an insurance company that |
| | | enables investors to accumulate assets on a tax-deferred basis for retirement or other long-term goals. |
| | | The investment objective and policies of Dreyfus Variable Investment Fund, Growth and Income |
| | | Portfolio made available through insurance products may be similar to other funds/portfolios |
| | | managed or advised by Dreyfus. However, the investment results of the portfolio may be higher or |
| | | lower than, and may not be comparable to, those of any other Dreyfus fund/portfolio. |
| 1 | | Total return includes reinvestment of dividends and any capital gains paid. Past performance is no |
| | | guarantee of future results. Share price and investment return fluctuate such that upon redemption, |
| | | portfolio shares may be worth more or less than their original cost.The portfolio’s performance does |
| | | not reflect the deduction of additional charges and expenses imposed in connection with investing |
| | | in variable insurance contracts, which will reduce returns. Return figures provided reflect the |
| | | absorption of certain portfolio expenses by The Dreyfus Corporation pursuant to an agreement in |
| | | effect through December 31, 2006, at which time it may be extended, terminated or modified. |
| | | Had these expenses not been absorbed, the portfolio’s returns would have been lower. |
| 2 | | SOURCE: LIPPER INC. — Reflects the reinvestment of dividends and, where applicable, |
| | | capital gain distributions.The Standard & Poor’s 500 Composite Stock Price Index is a widely |
| | | accepted, unmanaged index of U.S. stock market performance. |
The Portfolio 5
UNDERSTANDING YOUR PORTFOLIO’S EXPENSES (Unaudited)
As a mutual fund investor, you pay ongoing expenses, such as management fees and other expenses. Using the information below, you can estimate how these expenses affect your investment and compare them with the expenses of other funds.You also may pay one-time transaction expenses, including sales charges (loads) and redemption fees,which are not shown in this section and would have resulted in higher total expenses. For more information, see your portfolio’s prospectus or talk to your financial adviser.
Review your portfolio’s expenses
|
The table below shows the expenses you would have paid on a $1,000 investment in Dreyfus Variable Investment Fund, Growth and Income Portfolio from January 1, 2006 to June 30, 2006. It also shows how much a $1,000 investment would be worth at the close of the period, assuming actual returns and expenses.
| Expenses and Value of a $1,000 Investment | | | | |
| assuming actual returns for the six months ended June 30, 2006 | | | | |
| | | Initial Shares | | Service Shares |
| |
| |
|
| Expenses paid per $1,000 † | | $ 4.07 | | $ | | 4.96 |
| Ending value (after expenses) | | $1,000.00 | | $ | | 998.60 |
COMPARING YOUR PORTFOLIO’S EXPENSES WITH THOSE OF OTHER FUNDS (Unaudited)
Using the SEC’s method to compare expenses
The Securities and Exchange Commission (SEC) has established guidelines to help investors assess fund expenses. Per these guidelines, the table below shows your portfolio’s expenses based on a $1,000 investment, assuming a hypothetical 5% annualized return. You can use this information to compare the ongoing expenses (but not transaction expenses or total cost) of investing in the portfolio with those of other funds. All mutual fund shareholder reports will provide this information to help you make this comparison. Please note that you cannot use this information to estimate your actual ending account balance and expenses paid during the period.
Expenses and Value of a $1,000 Investment assuming a hypothetical 5% annualized return for the six months ended June 30, 2006
| | | Initial Shares | | Service Shares |
| |
| |
|
| Expenses paid per $1,000 † | | $ 4.11 | | $ 5.01 |
| Ending value (after expenses) | | $1,020.73 | | $1,019.84 |
| † Expenses are equal to the portfolio’s annualized expense ratio of .82% for Initial shares and 1.00% for Service shares, |
| multiplied by the average account value over the period, multiplied by 181/365 (to reflect the one-half year period). |
STATEMENT OF INVESTMENTS
June 30, 2006 (Unaudited)
|
| Common Stocks—98.6% | | Shares | | Value ($) |
| |
| |
|
| Consumer Discretionary—8.9% | | | | |
| Advance Auto Parts | | 69,600 | | 2,011,440 |
| Hilton Hotels | | 128,100 | | 3,622,668 |
| Home Depot | | 70,500 | | 2,523,195 |
| McDonald’s | | 60,800 | | 2,042,880 |
| News, Cl. A | | 131,400 | | 2,520,252 |
| Target | | 68,900 | | 3,367,143 |
| | | | | 16,087,578 |
| Consumer Staples—9.0% | | | | |
| Altria Group | | 71,900 | | 5,279,617 |
| Cadbury Schweppes, ADR | | 49,000 | | 1,902,180 |
| CVS | | 122,300 | | 3,754,610 |
| PepsiCo | | 38,900 | | 2,335,556 |
| Procter & Gamble | | 53,600 | | 2,980,160 |
| | | | | 16,252,123 |
| Energy—10.6% | | | | |
| Chesapeake Energy | | 52,600 a | | 1,591,150 |
| ConocoPhillips | | 40,800 | | 2,673,624 |
| Exxon Mobil | | 84,400 | | 5,177,940 |
| Grant Prideco | | 52,700 a,b | | 2,358,325 |
| Schlumberger | | 44,200 | | 2,877,862 |
| Transocean | | 27,300 b | | 2,192,736 |
| Weatherford International | | 47,300 b | | 2,347,026 |
| | | | | 19,218,663 |
| Financial—19.7% | | | | |
| Affiliated Managers Group | | 29,300 a,b | | 2,545,877 |
| Axis Capital Holdings | | 75,900 | | 2,171,499 |
| Bank of America | | 149,400 | | 7,186,140 |
| Capital One Financial | | 50,700 | | 4,332,315 |
| Countrywide Financial | | 104,500 | | 3,979,360 |
| JPMorgan Chase & Co. | | 141,200 | | 5,930,400 |
| Merrill Lynch & Co. | | 66,300 | | 4,611,828 |
| Wachovia | | 90,100 | | 4,872,608 |
| | | | | 35,630,027 |
The Portfolio 7
STATEMENT OF INVESTMENTS (Unaudited) (continued)
| Common Stocks (continued) | | Shares | | Value ($) |
| |
| |
|
| Health Care—12.7% | | | | |
| Abbott Laboratories | | 72,000 | | 3,139,920 |
| Alcon | | 26,900 | | 2,650,995 |
| Amgen | | 40,400 b | | 2,635,292 |
| Caremark Rx | | 14,300 | | 713,141 |
| Fisher Scientific International | | 24,300 b | | 1,775,115 |
| Genzyme | | 31,100 b | | 1,898,655 |
| Johnson & Johnson | | 56,600 | | 3,391,472 |
| WellPoint | | 42,200 b | | 3,070,894 |
| Wyeth | | 82,500 | | 3,663,825 |
| | | | | 22,939,309 |
| Industrial—12.6% | | | | |
| 3M | | 39,800 | | 3,214,646 |
| Burlington Northern Santa Fe | | 40,900 | | 3,241,325 |
| Danaher | | 60,800 | | 3,910,656 |
| Emerson Electric | | 40,800 | | 3,419,448 |
| General Electric | | 275,400 | | 9,077,184 |
| | | | | 22,863,259 |
| Information Technology—17.5% | | | | |
| Adobe Systems | | 116,000 b | | 3,521,760 |
| Apple Computer | | 31,800 b | | 1,816,416 |
| Autodesk | | 76,600 a,b | | 2,639,636 |
| Broadcom, Cl. A | | 50,400 b | | 1,514,520 |
| Cisco Systems | | 145,000 b | | 2,831,850 |
| Citrix Systems | | 40,800 b | | 1,637,712 |
| Corning | | 59,800 b | | 1,446,562 |
| Electronic Arts | | 43,000 b | | 1,850,720 |
| EMC/Massachusetts | | 70,700 b | | 775,579 |
| Google, Cl. A | | 3,964 b | | 1,662,224 |
| Common Stocks (continued) | | Shares | | Value ($) |
| |
| |
|
| Information Technology (continued) | | |
| Intel | | 78,100 | | 1,479,995 |
| Microchip Technology | | 63,400 | | 2,127,070 |
| Microsoft | | 217,000 | | 5,056,100 |
| Motorola | | 43,800 | | 882,570 |
| Qualcomm | | 60,800 | | 2,436,256 |
| | | | | 31,678,970 |
| Materials—2.7% | | | | |
| Air Products & Chemicals | | 35,000 | | 2,237,200 |
| EI Du Pont de Nemours & Co. | | 63,100 | | 2,624,960 |
| | | | | 4,862,160 |
| Telecommunications—2.5% | | | | |
| AT & T | | 101,000 | | 2,816,890 |
| Verizon Communications | | 52,400 | | 1,754,876 |
| | | | | 4,571,766 |
| Utilities—2.4% | | | | |
| PG & E | | 26,200 a | | 1,029,136 |
| Sempra Energy | | 37,000 | | 1,682,760 |
| Southern | | 51,700 | | 1,656,985 |
| | | | | 4,368,881 |
| Total Common Stocks | | | | |
| (cost $164,403,486) | | | | 178,472,736 |
| |
| |
|
| |
| Other Investment—1.1% | | | | |
| |
| |
|
| Registered Investment Company; | | | | |
| Dreyfus Institutional Preferred | | | | |
| Plus Money Market Fund | | | | |
| (cost $1,987,000) | | 1,987,000 c | | 1,987,000 |
The Portfolio 9
STATEMENT OF INVESTMENTS (Unaudited) (continued)
| Investment of Cash Collateral | | | | |
| for Securities Loaned—3.0% | | Shares | | Value ($) |
| |
| |
|
| Registered Investment Company; | | | | |
| Dreyfus Institutional Cash Advantage Fund | | | | |
| (cost $5,506,602) | | 5,506,602 c | | 5,506,602 |
| |
| |
|
| Total Investments (cost $171,897,088) | | 102.7% | | 185,966,338 |
| Liabilities, Less Cash and Receivables | | (2.7%) | | (4,942,053) |
| Net Assets | | 100.0% | | 181,024,285 |
| ADR—American Depository Receipts. |
| a All or a portion of these securities are on loan. At June 30, 2006, the total market value of the portfolio’s securities |
| on loan is $5,352,849 and the total market value of the collateral held by the portfolio is $5,506,602. |
| b Non-income producing security. |
| c Investment in affiliated money market mutual fund. |
| Portfolio Summary (Unaudited) † | | | | |
| |
| | | Value (%) | | | | Value (%) |
| |
| |
| |
|
| Financial | | 19.7 | | Consumer Discretionary | | 8.9 |
| Information Technology | | 17.5 | | Money Market Investments | | 4.1 |
| Health Care | | 12.7 | | Materials | | 2.7 |
| Industrial | | 12.6 | | Telecommunications | | 2.5 |
| Energy | | 10.6 | | Utilities | | 2.4 |
| Consumer Staples | | 9.0 | | | | 102.7 |
| |
| † Based on net assets. | | | | | | |
| See notes to financial statements. | | | | | | |
STATEMENT OF ASSETS AND LIABILITIES
June 30, 2006 (Unaudited)
| | | Cost | | Value |
| |
| |
|
| Assets ($): | | | | |
| Investments in securities— | | | | |
| See Statement of Investments (including securities | | |
| on loan, valued at $5,352,849)—Note 1(c): | | |
| Unaffiliated issuers | | 164,403,486 | | 178,472,736 |
| Affiliated issuers | | 7,493,602 | | 7,493,602 |
| Cash | | | | 8,252 |
| Receivable for investment securities sold | | 2,466,880 |
| Dividends and interest receivable | | | | 198,691 |
| Receivable for shares of Beneficial Interest subscribed | | 4,922 |
| Prepaid expenses | | | | 19,853 |
| | | | | 188,664,936 |
| |
| |
|
| Liabilities ($): | | | | |
| Due to The Dreyfus Corporation and affiliates—Note 3(b) | | 123,854 |
| Liability for securities on loan—Note 1(c) | | 5,506,602 |
| Payable for investment securities purchased | | 1,874,550 |
| Payable for shares of Beneficial Interest redeemed | | 91,001 |
| Accrued expenses | | | | 44,644 |
| | | | | 7,640,651 |
| |
| |
|
| Net Assets ($) | | | | 181,024,285 |
| |
| |
|
| Composition of Net Assets ($): | | | | |
| Paid-in capital | | | | 176,288,962 |
| Accumulated undistributed investment income—net | | 53,409 |
| Accumulated net realized gain | | | | |
| (loss) on investments | | | | (9,387,336) |
| Accumulated net unrealized appreciation | | |
| (depreciation) on investments | | | | 14,069,250 |
| |
| |
|
| Net Assets ($) | | | | 181,024,285 |
| |
| |
|
| |
| |
| Net Asset Value Per Share | | | | |
| | | Initial Shares | | Service Shares |
| |
| |
|
| Net Assets ($) | | 162,460,141 | | 18,564,144 |
| Shares Outstanding | | 7,483,329 | | 854,969 |
| |
| |
|
| Net Asset Value Per Share ($) | | 21.71 | | 21.71 |
See notes to financial statements.
|
The Portfolio 11
STATEMENT OF OPERATIONS
Six Months Ended June 30, 2006 (Unaudited)
|
| Investment Income ($): | | |
| Income: | | |
| Cash dividends (net of $14,959 foreign taxes withheld at source): | | |
| Unaffiliated issuers | | 1,715,035 |
| Affiliated issuers | | 46,322 |
| Income from securities lending | | 5,430 |
| Total Income | | 1,766,787 |
| Expenses: | | |
| Investment advisory fee—Note 3(a) | | 733,455 |
| Professional fees | | 30,744 |
| Distribution fees—Note 3(b) | | 24,755 |
| Trustees’ fees and expenses—Note 3(c) | | 13,019 |
| Custodian fees—Note 3(b) | | 8,210 |
| Prospectus and shareholders’ reports | | 7,724 |
| Shareholder servicing costs—Note 3(b) | | 2,977 |
| Loan commitment fees—Note 2 | | 916 |
| Miscellaneous | | 4,398 |
| Total Expenses | | 826,198 |
| Less—waiver of fees due to undertaking—Note 3(a) | | (6,749) |
| Less—reduction in custody fees | | |
| due to earnings credits—Note 1(c) | | (528) |
| Net Expenses | | 818,921 |
| Investment Income—Net | | 947,866 |
| |
|
| Realized and Unrealized Gain (Loss) on Investments—Note 4 ($): |
| Net realized gain (loss) on investments | | 10,635,227 |
| Net unrealized appreciation (depreciation) on investments | | (11,064,978) |
| Net Realized and Unrealized Gain (Loss) on Investments | | (429,751) |
| Net Increase in Net Assets Resulting from Operations | | 518,115 |
See notes to financial statements.
|
STATEMENT OF CHANGES IN NET ASSETS
| | | Six Months Ended | | |
| | | June 30, 2006 | | Year Ended |
| | | (Unaudited) | | December 31, 2005 |
| |
| |
|
| Operations ($): | | | | |
| Investment income—net | | 947,866 | | 2,863,598 |
| Net realized gain (loss) on investments | | 10,635,227 | | 19,846,942 |
| Net unrealized appreciation | | | | |
| (depreciation) on investments | | (11,064,978) | | (16,388,140) |
| Net Increase (Decrease) in Net Assets | | | | |
| Resulting from Operations | | 518,115 | | 6,322,400 |
| |
| |
|
| Dividends to Shareholders from ($): | | | | |
| Investment income—net: | | | | |
| Initial shares | | (863,231) | | (2,613,010) |
| Service shares | | (80,283) | | (245,151) |
| Total Dividends | | (943,514) | | (2,858,161) |
| |
| |
|
| Beneficial Interest Transactions ($): | | | | |
| Net proceeds from shares sold: | | | | |
| Initial shares | | 1,682,996 | | 5,508,762 |
| Service shares | | 408,838 | | 684,376 |
| Dividends reinvested: | | | | |
| Initial shares | | 863,231 | | 2,613,010 |
| Service shares | | 80,283 | | 245,151 |
| Cost of shares redeemed: | | | | |
| Initial shares | | (23,634,313) | | (47,764,428) |
| Service shares | | (2,094,666) | | (4,528,127) |
| Increase (Decrease) in Net Assets from | | | | |
| Beneficial Interest Transactions | | (22,693,631) | | (43,241,256) |
| Total Increase (Decrease) in Net Assets | | (23,119,030) | | (39,777,017) |
| |
| |
|
| Net Assets ($): | | | | |
| Beginning of Period | | 204,143,315 | | 243,920,332 |
| End of Period | | 181,024,285 | | 204,143,315 |
| Undistributed investment income—net | | 53,409 | | 49,057 |
The Portfolio 13
STATEMENT OF CHANGES IN NET ASSETS (continued)
|
| | | Six Months Ended | | |
| | | June 30, 2006 | | Year Ended |
| | | (Unaudited) | | December 31, 2005 |
| |
| |
|
| Capital Share Transactions: | | | | |
| Initial Shares | | | | |
| Shares sold | | 75,572 | | 261,996 |
| Shares issued for dividends reinvested | | 39,028 | | 123,642 |
| Shares redeemed | | (1,058,559) | | (2,260,103) |
| Net Increase (Decrease) in Shares Outstanding | | (943,959) | | (1,874,465) |
| |
| |
|
| Service Shares | | | | |
| Shares sold | | 18,101 | | 32,737 |
| Shares issued for dividends reinvested | | 3,631 | | 11,596 |
| Shares redeemed | | (94,123) | | (213,741) |
| Net Increase (Decrease) in Shares Outstanding | | (72,391) | | (169,408) |
See notes to financial statements.
|
The following tables describe the performance for each share class for the fiscal periods indicated. All information (except portfolio turnover rate) reflects financial results for a single portfolio share.Total return shows how much your investment in the portfolio would have increased (or decreased) during each period, assuming you had reinvested all dividends and distributions.These figures have been derived from the portfolio’s financial statements.
| | | Six Months Ended | | | | | | | | |
| | | June 30, 2006 | | Year Ended December 31, | | |
| | | |
| |
| |
|
| Initial Shares | | (Unaudited) | | 2005 | | 2004 | | 2003 | | 2002 | | 2001 |
| |
| |
| |
| |
| |
| |
|
| Per Share Data ($): | | | | | | | | | | | | |
| Net asset value, | | | | | | | | | | | | |
| beginning of period | | 21.82 | | 21.40 | | 20.16 | | 16.06 | | 21.65 | | 23.48 |
| Investment Operations: | | | | | | | | | | | | |
| Investment income—net a | | .11 | | .28 | | .24 | | .14 | | .11 | | .11 |
| Net realized and unrealized | | | | | | | | | | | | |
| gain (loss) on investments | | (.11) | | .43 | | 1.25 | | 4.11 | | (5.59) | | (1.49) |
| Total from Investment Operations | | .00b | | .71 | | 1.49 | | 4.25 | | (5.48) | | (1.38) |
| Distributions: | | | | | | | | | | | | |
| Dividends from investment | | | | | | | | | | | | |
| income—net | | (.11) | | (.29) | | (.25) | | (.15) | | (.11) | | (.11) |
| Dividends from net realized | | | | | | | | | | | | |
| gain on investments | | — | | — | | — | | — | | — | | (.11) |
| Dividends in excess of net realized | | | | | | | | | | |
| gain on investments | | — | | — | | — | | — | | — | | (.23) |
| Total Distributions | | (.11) | | (.29) | | (.25) | | (.15) | | (.11) | | (.45) |
| Net asset value, end of period | | 21.71 | | 21.82 | | 21.40 | | 20.16 | | 16.06 | | 21.65 |
| |
| |
| |
| |
| |
| |
|
| Total Return (%) | | .00c,d | | 3.35 | | 7.47 | | 26.57 | | (25.33) | | (5.85) |
| |
| |
| |
| |
| |
| |
|
| Ratios/Supplemental Data (%): | | | | | | | | | | |
| Ratio of total expenses | | | | | | | | | | | | |
| to average net assets | | .41d | | .81 | | .82 | | .82 | | .80 | | .80 |
| Ratio of net expenses | | | | | | | | | | | | |
| to average net assets | | .41d | | .81 | | .82 | | .82 | | .80 | | .80 |
| Ratio of net investment income | | | | | | | | | | | | |
| to average net assets | | .49d | | 1.33 | | 1.21 | | .81 | | .58 | | .48 |
| Portfolio Turnover Rate | | 31.22d | | 65.91 | | 52.74 | | 40.68 | | 34.61 | | 33.82 |
| |
| |
| |
| |
| |
| |
|
| Net Assets, end of period | | | | | | | | | | | | |
| ($ x 1,000) | | 162,460 183,903 | | 220,447 | | 243,973 | | 226,548 | | 385,569 |
| |
| a | | Based on average shares outstanding at each month end. | | | | | | | | |
| b | | Amount represents less than $.01 per share. | | | | | | | | | | |
| c | | Amount represents less than .01%. | | | | | | | | | | | | |
| d | | Not annualized. | | | | | | | | | | | | |
| See notes to financial statements. | | | | | | | | | | | | |
The Portfolio 15
FINANCIAL HIGHLIGHTS (continued)
|
| | | Six Months Ended | | | | | | | | |
| | | June 30, 2006 | | Year Ended December 31, | | |
| | | |
| |
| |
|
| Service Shares | | (Unaudited) | | 2005 | | 2004 | | 2003 | | 2002 | | 2001 |
| |
| |
| |
| |
| |
| |
|
| Per Share Data ($): | | | | | | | | | | | | |
| Net asset value, | | | | | | | | | | | | |
| beginning of period | | 21.83 | | 21.40 | | 20.15 | | 16.03 | | 21.61 | | 23.48 |
| Investment Operations: | | | | | | | | | | | | |
| Investment income—net | | .09a | | .24a | | .21a | | .11a | | .08a | | .06 |
| Net realized and unrealized | | | | | | | | | | | | |
| gain (loss) on investments | | (.12) | | .44 | | 1.24 | | 4.10 | | (5.58) | | (1.51) |
| Total from Investment Operations | | (.03) | | .68 | | 1.45 | | 4.21 | | (5.50) | | (1.45) |
| Distributions: | | | | | | | | | | | | |
| Dividends from investment | | | | | | | | | | | | |
| income—net | | (.09) | | (.25) | | (.20) | | (.09) | | (.08) | | (.08) |
| Dividends from net realized | | | | | | | | | | | | |
| gain on investments | | — | | — | | — | | — | | — | | (.11) |
| Dividends in excess of net | | | | | | | | | | | | |
| realized gain on investments | | — | | — | | — | | — | | — | | (.23) |
| Total Distributions | | (.09) | | (.25) | | (.20) | | (.09) | | (.08) | | (.42) |
| Net asset value, end of period | | 21.71 | | 21.83 | | 21.40 | | 20.15 | | 16.03 | | 21.61 |
| |
| |
| |
| |
| |
| |
|
| Total Return (%) | | (.14)b | | 3.21 | | 7.22 | | 26.36 | | (25.46) | | (6.14) |
| |
| |
| |
| |
| |
| |
|
| Ratios/Supplemental Data (%): | | | | | | | | | | |
| Ratio of total expenses | | | | | | | | | | | | |
| to average net assets | | .53b | | 1.07 | | 1.07 | | 1.07 | | 1.03 | | 1.12 |
| Ratio of net expenses | | | | | | | | | | | | |
| to average net assets | | .50b | | 1.00 | | 1.00 | | 1.01 | | .98 | | 1.01 |
| Ratio of net investment income | | | | | | | | | | | | |
| to average net assets | | .40b | | 1.14 | | 1.05 | | .63 | | .43 | | .28 |
| Portfolio Turnover Rate | | 31.22b | | 65.91 | | 52.74 | | 40.68 | | 34.61 | | 33.82 |
| |
| |
| |
| |
| |
| |
|
| Net Assets, end of period | | | | | | | | | | | | |
| ($ x 1,000) | | 18,564 | | 20,241 | | 23,473 | | 24,188 | | 20,388 | | 16,185 |
| |
| a | | Based on average shares outstanding at each month end. | | | | | | | | |
| b | | Not annualized. | | | | | | | | | | | | |
| See notes to financial statements. | | | | | | | | | | | | |
| |
| |
| 16 | | | | | | | | | | | | | | |
NOTES TO FINANCIAL STATEMENTS (Unaudited)
NOTE 1—Significant Accounting Policies:
Dreyfus Variable Investment Fund (the “fund”) is registered under the Investment Company Act of 1940, as amended (the “Act”), as an open-end management investment company, operating as a series company currently offering twelve series, including the Growth and Income Portfolio (the “portfolio”). The portfolio is only offered to separate accounts established by insurance companies to fund variable annuity contracts and variable life insurance policies.The portfolio is a non-diversified series.The portfolio’s investment objective is to provide long-term capital growth, current income and growth of income, consistent with reasonable investment risk. The Dreyfus Corporation (the “Manager” or “Dreyfus”) serves as the portfolio’s investment adviser. The Manager is a wholly-owned subsidiary of Mellon Financial Corporation (“Mellon Financial”).
Dreyfus Service Corporation (the “Distributor”), a wholly-owned subsidiary of the Manager, is the distributor of the portfolio’s shares, which are sold without a sales charge. The portfolio is authorized to issue an unlimited number of $.001 par value shares of Beneficial Interest in each of the following classes of shares: Initial and Service. Each class of shares has identical rights and privileges, except with respect to the distribution plan and the expenses borne by each class and certain voting rights. Income, expenses (other than expenses attributable to a specific class), and realized and unrealized gains or losses on investments are allocated to each class of shares based on its relative net assets.
The fund accounts separately for the assets, liabilities and operations of each series. Expenses directly attributable to each series are charged to that series’ operations; expenses which are applicable to all series are allocated among them on a pro rata basis.
The portfolio’s financial statements are prepared in accordance with U.S. generally accepted accounting principles, which may require the use of management estimates and assumptions. Actual results could differ from those estimates.
The Portfolio 17
NOTES TO FINANCIAL STATEMENTS (Unaudited) (continued)
The fund enters into contracts that contain a variety of indemnifica-tions.The portfolio’s maximum exposure under these arrangements is unknown. The portfolio does not anticipate recognizing any loss related to these arrangements.
(a) Portfolio valuation: Investments in securities are valued at the last sales price on the securities exchange or national securities market on which such securities are primarily traded. Securities listed on the National Market System for which market quotations are available are valued at the official closing price or, if there is no official closing price that day, at the last sale price. Securities not listed on an exchange or the national securities market, or securities for which there were no transactions, are valued at the average of the most recent bid and asked prices, except for open short positions, where the asked price is used for valuation purposes. Bid price is used when no asked price is available. Investments in registered investment companies are valued at their net asset value.When market quotations or official closing prices are not readily available, or are determined not to reflect accurately fair value, such as when the value of a security has been significantly affected by events after the close of the exchange or market on which the security is principally traded (for example, a foreign exchange or market), but before the portfolio calculates its net asset value, the portfolio may value these investments at fair value as determined in accordance with the procedures approved by the Board of Trustees. Fair valuing of securities may be determined with the assistance of a pricing service using calculations based on indices of domestic securities and other appropriate indicators, such as prices of relevant ADR’s and futures contracts. For other securities that are fair valued by the Board of Trustees, certain factors may be considered such as: fundamental analytical data, the nature and duration of restrictions on disposition, an evaluation of the forces that influence the market in which the securities are purchased and sold, and public trading in similar securities of the issuer or comparable issuers. Financial futures are valued at the last sales price. Investments denominated in foreign currencies are translated to U.S. dollars at the prevailing rates of exchange. Forward currency exchange contracts are valued at the forward rate.
(b) Foreign currency transactions: The portfolio does not isolate that portion of the results of operations resulting from changes in foreign exchange rates on investments from the fluctuations arising from changes in the market prices of securities held. Such fluctuations are included with the net realized and unrealized gain or loss on investments.
Net realized foreign exchange gains or losses arise from sales and maturities of short-term securities, sales of foreign currencies, currency gains or losses realized on securities transactions and the difference between the amounts of dividends, interest and foreign withholding taxes recorded on the portfolios’ books and the U.S. dollar equivalent of the amounts actually received or paid. Net unrealized foreign exchange gains and losses arise from changes in the value of assets and liabilities other than investments in securities, resulting from changes in exchange rates. Such gains and losses are included with net realized and unrealized gain or loss on investments.
(c) Securities transactions and investment income: Securities transactions are recorded on a trade date basis. Realized gain and loss from securities transactions are recorded on the identified cost basis. Dividend income is recognized on the ex-dividend date and interest income, including, where applicable, accretion of discount and amortization of premium on investments, is recognized on the accrual basis.
The portfolio has an arrangement with the custodian bank whereby the portfolio receives earnings credits from the custodian when positive cash balances are maintained, if any, which are used to offset custody fees. For financial reporting purposes, the portfolio includes net earnings credits as an expense offset in the Statement of Operations.
Pursuant to a securities lending agreement with Mellon Bank, N.A., an affiliate of the Manager, the portfolio may lend securities to qualified institutions. It is the portfolio’s policy, that at origination, all loans are secured by collateral of at least 102% of the value of U.S. securities loaned and 105% of the value of foreign securities loaned. Collateral equivalent to at least 100% of the market value of securities on loan is maintained at all times. Cash collateral is invested in certain money
The Portfolio 19
NOTES TO FINANCIAL STATEMENTS (Unaudited) (continued)
market mutual funds managed by the Manager.The portfolio is entitled to receive all income on securities loaned, in addition to income earned as a result of the lending transaction. Although each security loaned is fully collateralized, the portfolio bears the risk of delay in recovery of, or loss of rights in, the securities loaned should a borrower fail to return the securities in a timely manner.
(d) Affiliated issuers: Investments in other investment companies advised by the Manager are defined as “affiliated” in the Act.
(e) Dividends to shareholders: Dividends are recorded on the ex-dividend date.The portfolio declares and pays dividends from investment income-net on a quarterly basis. Dividends from net realized capital gain, if any, are normally declared and paid annually, but the portfolio may make distributions on a more frequent basis to comply with the distribution requirements of the Internal Revenue Code of 1986, as amended (the “Code”).To the extent that net realized capital gain can be offset by capital loss carryovers, it is the policy of the portfolio not to distribute such gain. Income and capital gain distributions are determined in accordance with income tax regulations, which may differ from U.S. generally accepted accounting principles.
(f) Federal income taxes: It is the policy of the portfolio to continue to qualify as a regulated investment company, if such qualification is in the best interests of its shareholders, by complying with the applicable provisions of the Code and to make distributions of taxable income sufficient to relieve it from substantially all federal income and excise taxes.
The portfolio has an unused capital loss carryover $19,953,795 available for federal income tax purposes to be applied against future net securities profits, if any, realized subsequent to December 31, 2005. If not applied, $5,702,414 of the carryover expires in fiscal 2010 and $14,251,381 expires in fiscal 2011.
The tax character of distributions paid to shareholders during the fiscal year ended December 31, 2005 were as follows: ordinary income $2,858,161. The tax character of current year distributions will be determined at the end of the current fiscal year.
NOTE 2—Bank Line of Credit:
|
The portfolio participates with other Dreyfus-managed funds in a $350 million redemption credit facility (the “Facility”) to be utilized for temporary or emergency purposes, including the financing of redemptions. In connection therewith, the portfolio has agreed to pay commitment fees on its pro rata portion of the Facility. Interest is charged to the portfolio based on prevailing market rates in effect at the time of borrowing. During the period ended June 30, 2006, the portfolio did not borrow under the Facility.
NOTE 3—Investment Advisory Fee and Other Transactions With Affiliates:
(a) Pursuant to an Investment Advisory Agreement with the Manager, the investment advisory fee is computed at the annual rate of .75% of the value of the portfolios’ average daily net assets and is payable monthly.
The Manager has agreed, from January 1, 2006 to December 31, 2006 to waive receipt of its fees and/or assume the expenses of the portfolio so that the expenses of neither class, exclusive of taxes, brokerage fees, interest on borrowings, commitment fees and extraordinary expenses, exceed 1% of the value of the average daily net assets of their class. During the period ended June 30, 2006, the Manager waived receipt of fees of $6,749, pursuant to the undertaking.
(b) Under the Distribution Plan (the “Plan”) adopted pursuant to Rule 12b-1 under the Act, Service shares pay the Distributor for distributing their shares, for servicing and/or maintaining Service shares shareholder accounts and for advertising and marketing for Service shares.The Plan provides for payments to be made at an annual rate of .25% of the value of the Service shares’ average daily net assets.The Distributor may make payments to Participating Insurance Companies and to brokers and dealers acting as principal underwriter for their variable insurance products.The fees payable under the Plan are payable without regard to actual expenses incurred. During the period ended June 30, 2006, Service shares were charged $24,755 pursuant to the Plan.
The Portfolio 21
NOTES TO FINANCIAL STATEMENTS (Unaudited) (continued)
The portfolio compensates Dreyfus Transfer, Inc., a wholly-owned subsidiary of the Manager, under a transfer agency agreement for providing personnel and facilities to perform transfer agency services for the portfolio. During the period ended June 30, 2006, the portfolio was charged $206 pursuant to the transfer agency agreement.
The portfolio compensates Mellon Bank, N.A., an affiliate of the Manager, under a custody agreement for providing custodial services for the portfolio. During the period ended June 30, 2006, the portfolio was charged $8,210 pursuant to the custody agreement.
During the period ended June 30, 2006, the portfolio was charged $1,926 for services performed by the Chief Compliance Officer.
The components of Due to The Dreyfus Corporation and affiliates in the Statement of Assets and Liabilities consist of: investment advisory fees $111,834, Rule 12b-1 distribution plan fees $3,843, custodian fees $6,590, chief compliance officer fees $1,926 and transfer agency per account fees $68, which are offset against an expense reimbursement currently in effect in the amount of $407.
(c) Each Board member also serves as a Board member of other funds within the Dreyfus complex. Annual retainer fees and attendance fees are allocated to each fund based on net assets.
(d) Pursuant to an exemptive order from the SEC, the portfolio may invest its available cash balances in affiliated money market mutual funds. Management fees of the underlying money market mutual funds have been waived by the Manager.
NOTE 4—Securities Transactions:
The aggregate amount of purchases and sales of investment securities, excluding short-term securities, during the period ended June 30, 2006, amounted to $60,676,171 and $82,991,663, respectively.
At June 30, 2006, accumulated net unrealized appreciation on investments was $14,069,250, consisting of $19,583,951 gross unrealized appreciation and $5,514,701 gross unrealized depreciation.
At June 30, 2006, the cost of investment for federal income tax purposes was substantially the same as the cost of financial reporting purposes (see the Statement of Investments).
The Portfolio 23
PROXY RESULTS ( U n a u d i t e d )
|
Dreyfus Variable Investment Fund held a special meeting of shareholders on June 29, 2006.The proposal considered at the meeting, and the results, are as follows:
| | | | | Shares | | |
| |
| |
| |
|
| | | For | | | | Authority Withheld |
| |
| |
| |
|
| To elect additional Board Members: | | | | | | |
| Peggy C. Davis † | | 171,078,926.558 | | | | 7,687,714.085 |
| Joseph S. DiMartino | | 170,946,484.400 | | | | 7,820,156.243 |
| David P. Feldman | | 170,959,920.714 | | | | 7,806,719.929 |
| Ehud Houminer † | | 170,132,086.682 | | | | 8,634,553.961 |
| Gloria Messinger † | | 170,187,240.710 | | | | 8,579,399.933 |
| Anne Wexler † | | 170,212,607.472 | | | | 8,554,033.171 |
| † Each will serve as an Independent Board member of the fund commencing, subject to the discretion of the Board, on |
| or about January 1, 2007. |
| In addition to Joseph S. DiMartino and David P. Feldman, James F. Henry, Dr. Paul A. Marks and Dr. Martin |
| Peretz continue as Board members of the fund. |
INFORMATION ABOUT THE REVIEW AND APPROVAL OF THE PORTFOLIO’S
I N V E S T M E N T A D V I S O R Y A G R E E M E N T (Unaudited)
At a meeting of the fund’s Board of Trustees held on June 7 and 8, 2006, the Board considered the re-approval for an annual period (through July 31, 2007) of the fund’s Investment Advisory Agreement with Dreyfus for the portfolio, pursuant to which Dreyfus provides the portfolio with investment advisory and administrative services. The Board members, none of whom are “interested persons” (as defined in the Investment Company Act of 1940, as amended) of the fund were assisted in their review by independent legal counsel and met with counsel in executive session separate from representatives of Dreyfus.
Analysis of Nature, Extent and Quality of Services Provided to the Portfolio. The Board members received a presentation from representatives of Dreyfus regarding services provided to the portfolio and other funds in the Dreyfus fund complex, and discussed the nature, extent and quality of the services provided to the portfolio pursuant to its Investment Advisory Agreement. Dreyfus’ representatives reviewed the portfolio’s distribution of accounts and the relationships Dreyfus has with various intermediaries and the different needs of each.The Board noted that the portfolio’s shares were offered only to separate accounts established by insurance companies to fund variable annuity contracts and variable life insurance policies. Dreyfus’ representatives noted the diversity of distribution among the funds in the Dreyfus fund complex, and Dreyfus’ corresponding need for broad, deep, and diverse resources to be able to provide ongoing shareholder services to each distribution channel, including that of the portfolio. Dreyfus also provided the number of separate accounts investing in the portfolio, as well as the portfolio’s asset size.
The Board members also considered Dreyfus’ research and portfolio management capabilities and that Dreyfus also provides oversight of day-to-day portfolio operations, including fund accounting and administration and assistance in meeting legal and regulatory requirements. The Board members also considered Dreyfus’ extensive administrative, accounting and compliance infrastructure.
The Portfolio 25
I N FO R M AT I O N A B O U T T H E R E V I E W A N D A P P R OVA L O F T H E P O R T FO L I O ’ S I N V E S T M E N T A DV I S O RY A G R E E M E N T ( U n a u d i t e d ) ( c o n t i n u e d )
Comparative Analysis of the Portfolio’s Performance and Advisory Fee and Expense Ratio. The Board members reviewed the portfolio’s performance and placed significant emphasis on comparisons to a group of large-cap core funds underlying variable insurance products (the “Performance Group”) and to a larger universe of funds, consisting of all large-cap core funds underlying variable insurance products (the “Performance Universe”) selected and provided by Lipper, Inc., an independent provider of investment company data.The Board was provided with a description of the methodology Lipper used to select the Performance Group and Performance Universe, as well as the Expense Group and Expense Universe (discussed below). The Board members discussed the results of the comparisons for various periods ended April 30, 2006, and noted that the portfolio’s total return performance for its Initial shares was below the medians of the Performance Group and the Performance Universe for each of the periods.The Dreyfus representatives also presented the Board with the portfolio’s total return performance and the quartile, percentile and rank of the portfolio’s total return within its Lipper category (as provided by Lipper) for certain other periods ended April 30, 2006, and noted that the recent three- and four-month comparative total return performance was in the second quartile.
The Board members have been concerned about the portfolio’s performance for some time and had requested that Dreyfus take steps to improve the portfolio’s performance.The Board noted its approval of a new portfolio manager proposed by Dreyfus in October 2004.While there had been some improvement in performance for certain short periods of time since then, the portfolio’s overall performance continued to pose concern.At the June 7-8, 2006 meeting, the Board members considered and approved Dreyfus’ proposal for a new primary and an additional portfolio manager for the portfolio, along with changes to the portfolio’s investment approach and benchmark. The Board reviewed biographies of the proposed portfolio managers and the historical comparative performance of a fund that the proposed primary portfolio manager has managed using the same investment approach proposed to the Board, including comparison of the fund’s performance to that of the portfolio and the S&P 500 Stock Index. The
Board noted that the historical performance of the fund was generally superior to that of the portfolio.
The Board members also discussed the portfolio’s advisory fee and expense ratio for each class of shares and reviewed the range of advisory fees and expense ratios of a comparable group of funds (the “Expense Group”) and a broader group of funds (the “Expense Universe”), each selected and provided by Lipper.The Board members noted that the portfolio’s advisory fee was higher than its Expense Group and Expense Universe medians, that the expense ratio for the Initial shares was lower than the Expense Group and Expense Universe medians, and that the expense ratio for the Service shares was higher than the Expense Group and the Expense Universe medians. The Board members noted Dreyfus’ current undertaking to waive or reimburse certain fees and expenses, which reduced the expense ratio for the portfolio’s Service shares.
Representatives of Dreyfus reviewed with the Board members the advisory fees paid by mutual funds managed by Dreyfus or its affiliates with similar investment objectives, policies and strategies, and included within the portfolio’s Lipper category (the “Similar Funds”), and by other accounts managed by Dreyfus or its affiliates with similar investment objectives, policies and strategies as the portfolio, of which there was one (the “Similar Account”). Dreyfus’ representatives explained the nature of the Similar Account and the differences, from Dreyfus’ perspective, in providing services to such Similar Account as compared to managing and providing services to the portfolio. Dreyfus’ representatives also reviewed the costs associated with distribution through intermediaries. The Board analyzed differences in fees paid to Dreyfus and discussed the relationship of the fees paid in light of the services provided.The Board members considered the relevance of the fee information provided for the Similar Funds and the Similar Account to evaluate the appropriateness and reasonableness of the portfolio’s investment advisory fee. The Board acknowledged that the difference in fees paid by the Similar Account seemed to be consistent with the services provided.
The Portfolio 27
I N FO R M AT I O N A B O U T T H E R E V I E W A N D A P P R OVA L O F T H E P O R T FO L I O ’ S I N V E S T M E N T A DV I S O RY A G R E E M E N T ( U n a u d i t e d ) ( c o n t i n u e d )
Analysis of Profitability and Economies of Scale. Dreyfus’ representatives reviewed the dollar amount of expenses allocated and profit received by Dreyfus and the method used to determine such expenses and profit.The Board considered information, previously provided and discussed, prepared by an independent consulting firm regarding Dreyfus’ approach to allocating costs to, and determining the profitability of, individual funds and the entire Dreyfus mutual fund complex. The Board members also considered that the methodology had also been reviewed by an independent registered public accounting firm which, like the consultant, found the methodology to be reasonable. The consulting firm also analyzed where any economies of scale might emerge in connection with the management of the portfolio. The Board members evaluated the profitability analysis in light of the relevant circumstances for the portfolio and the extent to which economies of scale would be realized if the portfolio grows and whether fee levels reflect these economies of scale for the benefit of portfolio investors. The Board members also considered potential benefits to Dreyfus from acting as investment adviser and noted the soft dollar arrangements with respect to trading the portfolio’s investments.
It was noted that the Board members should consider Dreyfus’ profitability with respect to the portfolio as part of their evaluation of whether the fees under the Investment Advisory Agreement bear a reasonable relationship to the mix of services provided by Dreyfus, including the nature, extent and quality of such services and that a discussion of economies of scale is predicated on increasing assets and that, if a fund’s assets had been decreasing, the possibility that Dreyfus may have realized any economies of scale would be less. It also was noted that the profitability percentage for managing the portfolio was within ranges determined by appropriate court cases to be reasonable given the services rendered and generally superior service levels provided by Dreyfus. The Board also noted the fee waiver and expense reimbursement arrangements and its effect on Dreyfus’ profitability.
At the conclusion of these discussions, the Board agreed that it had been furnished with sufficient information to make an informed busi-
ness decision with respect to continuation of the Investment Advisory Agreement, with respect to the portfolio. Based on the discussions and considerations as described above, the Board made the following conclusions and determinations.
- The Board concluded that the nature, extent and quality of the ser- vices provided by Dreyfus are adequate and appropriate.
- The Board noted its concern with the portfolio’s performance and approved Dreyfus’ proposal, including, among other things, a new primary portfolio manager, in an effort to improve the portfolio’s performance; the Board also noted the portfolio’s improving short- term performance.
- The Board concluded that the fee paid by the portfolio to Dreyfus was reasonable in light of the services provided, comparative perfor- mance, expense and advisory fee information, including Dreyfus’ undertaking to waive or reimburse certain fees and expenses (which reduced the expense ratio of the Service shares), costs of the services provided and profits to be realized and benefits derived or to be derived by Dreyfus from its relationship with the portfolio.
- The Board determined that the economies of scale which may accrue to Dreyfus and its affiliates in connection with the management of the portfolio had been adequately considered by Dreyfus in connection with the advisory fee rate charged to the portfolio and that, to the extent in the future it were determined that material economies of scale had not been shared with the portfolio, the Board would seek to have those economies of scale shared with the portfolio.
The Board members considered these conclusions and determinations, along with information received on a routine and regular basis throughout the year, and, without any one factor being dispositive, the Board determined that re-approval of the portfolio’s Investment Advisory Agreement was in the best interests of the portfolio and its shareholders.
The Portfolio 29
| Dreyfus Variable |
| Investment Fund, |
| Growth and Income Portfolio |
| 200 Park Avenue |
| New York, NY 10166 |
| |
| Investment Adviser |
| The Dreyfus Corporation |
| 200 Park Avenue |
| New York, NY 10166 |
| |
| Custodian |
| Mellon Bank, N.A. |
| One Mellon Bank Center |
| Pittsburgh, PA 15258 |
| Transfer Agent & |
| Dividend Disbursing Agent |
| Dreyfus Transfer, Inc. |
| 200 Park Avenue |
| New York, NY 10166 |
| |
| Distributor |
| Dreyfus Service Corporation |
| 200 Park Avenue |
| New York, NY 10166 |
Telephone 1-800-554-4611 or 516-338-3300
Mail The Dreyfus Family of Funds, 144 Glenn Curtiss Boulevard, Uniondale, NY 11556-0144 Attn: Investments Division
The portfolio files its complete schedule of portfolio holdings with the Securities and Exchange Commission (“SEC”) for the first and third quarters of each fiscal year on Form N-Q. The portfolio’s Forms N-Q are available on the SEC’s website at http://www.sec.gov and may be reviewed and copied at the SEC’s Public Reference Room in Washington, DC. Information on the operation of the Public Reference Room may be obtained by calling 1-202-551-8090.
A description of the policies and procedures that the portfolio uses to determine how to vote proxies relating to portfolio securities, and information regarding how the portfolio voted these proxies for the 12-month period ended June 30, 2006, is available at http://www.dreyfus.com and on the SEC’s website at http://www.sec.gov. The description of the policies and procedures is also available without charge, upon request, by calling 1-800-645-6561.
| © 2006 Dreyfus Service Corporation |

The views expressed in this report reflect those of the portfolio manager only through the end of the period covered and do not necessarily represent the views of Dreyfus or any other person in the Dreyfus organization.Any such views are subject to change at any time based upon market or other conditions and Dreyfus disclaims any responsibility to update such views. These views may not be relied on as investment advice and, because investment decisions for a Dreyfus portfolio are based on numerous factors, may not be relied on as an indication of trading intent on behalf of any Dreyfus portfolio.
Not FDIC-Insured • Not Bank-Guaranteed • May Lose Value
| | | Contents |
| |
| | | T H E P O R T F O L I O |
| |
|
| 2 | | Letter from the Chairman |
| 3 | | Discussion of Performance |
| 6 | | Understanding Your Portfolio’s Expenses |
| 6 | | Comparing Your Portfolio’s Expenses |
| | | With Those of Other Funds |
| 7 | | Statement of Investments |
| 12 | | Statement of Assets and Liabilities |
| 13 | | Statement of Operations |
| 14 | | Statement of Changes in Net Assets |
| 16 | | Financial Highlights |
| 18 | | Notes to Financial Statements |
| 25 | | Proxy Results |
| 26 | | Information About the Review |
| and Approval of the Portfolio’s |
| Investment Advisory Agreement |
| | | F O R M O R E I N F O R M AT I O N |
| |
|
| | | Back Cover |
| Dreyfus Variable Investment Fund, |
| International Equity Portfolio |

LETTER FROM THE CHAIRMAN
We are pleased to present this semiannual report for Dreyfus Variable Investment Fund, International Equity Portfolio, covering the six-month period from January 1, 2006, through June 30, 2006.
International stock market gains over the first four months of 2006 were given back in May and June, when investors reacted negatively to suggestions that the U.S. Federal Reserve Board (the “Fed”) and other central banks, in their fight against inflation, might raise short-term interest rates more than previously expected. In the judgment of our Chief Economist, Richard Hoey, the recent correction reflects an adjustment among leveraged investors toward lower risk levels as the U.S. and global economies move into more mature phases. In our view, corrections such as these generally are healthy mechanisms that help wring speculative excesses from the financial markets, potentially setting the stage for future rallies.
While a global recession currently appears unlikely, we expect slower growth in the United States and Europe in 2007. Economic expansion in Japan and China seems likely to continue, but lower demand for exports could contribute to a slowdown elsewhere in Asia. Indicators to watch in the months ahead include the outlook for inflation in the United States and overseas, the extent of softness in the U.S. housing market, the impact of slower economic growth on consumer spending, additional changes in short-term interest rates from the Fed and other central banks, and the strength of the U.S. dollar relative to other major currencies. As always, we encourage you to discuss these and other investment-related issues with your financial advisor, who can help you prepare for the challenges and opportunities that lie ahead.
For information about how the fund performed during the reporting period, as well as market perspectives, we have provided a Discussion of Fund Performance given by the fund’s portfolio manager.
Thank you for your continued confidence and support.

DISCUSSION OF PERFORMANCE
Paul Butler, Portfolio Manager
Newton Capital Management Limited, Sub-Investment Adviser
How did Dreyfus Variable Investment Fund, International Equity Portfolio perform relative to its benchmark?
For the six-month period ended June 30, 2006, the portfolio produced total returns of 9.00% for its Initial shares and 8.94% for its Service shares.1This compares with a 10.16% total return produced by the portfolio’s benchmark, the Morgan Stanley Capital International Europe, Australasia, Far East Index (“MSCI EAFE Index”), for the same period.2
After rallying over the first four months of 2006, international equities encountered turbulence in May and June, which proved to be especially severe in the emerging markets. The portfolio produced lower returns than its benchmark in this challenging environment,primarily due to pronounced weakness in its holdings of metals and mining companies in emerging markets,which were particularly hard-hit during the downturn.
What is the portfolio’s investment approach?
The portfolio seeks capital growth. To pursue its goal, the portfolio primarily invests in growth stocks of foreign companies. Normally, the portfolio invests at least 80% of its assets in stocks, including common stocks, preferred stocks and convertible securities, including those purchased in initial public offerings.
In choosing stocks, we consider: key trends in global economic variables, such as gross domestic product, inflation and interest rates; investment themes, such as the impact of new technologies and the globalization of industries and brands; relative values of equity securities, bonds and cash; and long-term trends in currency movements.
Within the markets and sectors determined to be relatively attractive, we seek what we believe to be attractively priced companies that possess a sustainable competitive advantage in their market or sector.We generally will sell securities when themes or strategies change, or when we determine that the company’s prospects have changed, or that its stock is fully valued by the market.
The Portfolio 3
DISCUSSION OF PERFORMANCE (continued)
|
What other factors influenced the portfolio’s performance?
Robust global economic conditions supported stock prices in most international markets over the first four months of 2006, including producers of raw materials that enjoyed high levels of industrial demand from China,India and the United States.However,concerns regarding mounting inflationary pressures, higher interest rates and signs of a potential economic slowdown led many investors to question the sustainability of the U.S. economic expansion. These concerns sent ripples of volatility throughout the world, as international investors worried about the future prospects of companies that export to U.S. markets. Just as the emerging markets had led the markets’ advance over the past several years, they also bore the brunt of the correction in May and June 2006.
Shifting investor sentiment was especially damaging to the portfolio’s investments in Brazil, including a number of mining and materials companies. In addition, the portfolio’s position in Brasil Telecom suffered despite a low valuation and high levels of free cash flow, as uncertainty persisted regarding the company’s ownership. Old Mutual, a U.K.-based insurance company with significant operations in South Africa, lost value when the rand declined against most major currencies. Although the portfolio’s relatively light exposure to Japan was a positive factor overall, the portfolio’s performance was hindered by Mitsubishi UFJ Financial, which declined as investors took profits after the bank’s stock advanced strongly in 2005.
On a more positive note, the portfolio scored successes in a number of different countries and industry groups. For example, U.K.-based inter-dealer bond broker ICAP saw its profits rise as volatility increased in global financial markets. In Brazil, rail carrier All America Latina Logistica gained market share in the transport of soybeans as fuel prices rose. Japan Tobacco achieved a higher stock price on the strength of its positive cash flows and the achievement of greater pricing power in its domestic market. Finally, Cable & Wireless, the U.K. owner of telephone lines, benefited from a corporate restructuring and a more intent focus on its higher-margin businesses.
What is the portfolio’s current strategy?
We have continued to employ our longstanding investment approach, which combines top-down and bottom-up analysis to find the
regions, industry groups and companies that, in our judgment, are poised for gains. Despite recently heightened market volatility and economic uncertainty, we have continued to find opportunities in the emerging markets of Latin America and Asia, where a new middle class of consumers is emerging and a number of banks have attracted our interest.We also remain optimistic regarding global energy companies, where business fundamentals appear to be strong despite conservation and alternative-fuel development efforts in some markets.
On the other hand, we are less enthusiastic about the prospects of companies in and exporters to English-speaking countries, including United Kingdom and Australia, where domestic economies may be slowing and consumers and businesses appear to be highly leveraged. Although economic conditions have improved in Japan, we believe that its stock market may be richly valued. Finally, we are concerned that deficit spending in some European countries may hamper their economies.
| | | Investing in foreign companies involves special risks, including changes in currency rates, |
| | | political, economic and social instability, a lack of comprehensive company information, |
| | | differing auditing and legal standards and less market liquidity. An investment in this fund |
| | | should be considered only as a supplement to an overall investment program. |
| | | The portfolio is only available as a funding vehicle under variable life insurance policies or variable |
| | | annuity contracts issued by insurance companies. Individuals may not purchase shares of the |
| | | portfolio directly. A variable annuity is an insurance contract issued by an insurance company that |
| | | enables investors to accumulate assets on a tax-deferred basis for retirement or other long-term |
| | | goals.The investment objective and policies of Dreyfus Variable Investment Fund, International |
| | | Equity Portfolio made available through insurance products may be similar to other |
| | | funds/portfolios managed or advised by Dreyfus. However, the investment results of the portfolio |
| | | may be higher or lower than, and may not be comparable to, those of any other Dreyfus |
| | | fund/portfolio. |
| 1 | | Total return includes reinvestment of dividends and any capital gains paid. Past performance is no |
| | | guarantee of future results. Share price and investment return fluctuate such that upon redemption, |
| | | portfolio shares may be worth more or less than their original cost.The portfolio’s performance does |
| | | not reflect the deduction of additional charges and expenses imposed in connection with investing |
| | | in variable insurance contracts, which will reduce returns. |
| | | Part of the portfolio’s recent performance is attributable to positive returns from its initial |
| | | public offering (IPO) investments.There can be no guarantee that IPOs will have or |
| | | continue to have a positive effect on the portfolio’s performance. Currently, the portfolio is |
| | | relatively small in asset size. IPOs tend to have a reduced effect on performance as a |
| | | portfolio’s asset base grows. |
| 2 | | SOURCE: LIPPER INC. — Reflects reinvestment of net dividends and, where applicable, |
| | | capital gain distributions.The Morgan Stanley Capital International Europe, Australasia, Far |
| | | East (MSCI EAFE) Index is an unmanaged index composed of a sample of companies |
| | | representative of the market structure of European and Pacific Basin countries. |
The Portfolio 5
UNDERSTANDING YOUR PORTFOLIO’S EXPENSES (Unaudited)
As a mutual fund investor, you pay ongoing expenses, such as management fees and other expenses. Using the information below, you can estimate how these expenses affect your investment and compare them with the expenses of other funds.You also may pay one-time transaction expenses, including sales charges (loads) and redemption fees,which are not shown in this section and would have resulted in higher total expenses. For more information, see your portfolio’s prospectus or talk to your financial adviser.
Review your portfolio’s expenses
|
The table below shows the expenses you would have paid on a $1,000 investment in Dreyfus Variable Investment Fund, International Equity Portfolio from January 1, 2006 to June 30, 2006. It also shows how much a $1,000 investment would be worth at the close of the period, assuming actual returns and expenses.
| Expenses and Value of a $1,000 Investment | | |
| assuming actual returns for the six months ended June 30, 2006 | | |
| | | Initial Shares | | Service Shares |
| |
| |
|
| Expenses paid per $1,000 † | | $ 5.03 | | $ 6.32 |
| Ending value (after expenses) | | $1,090.00 | | $1,089.40 |
COMPARING YOUR PORTFOLIO’S EXPENSES WITH THOSE OF OTHER FUNDS (Unaudited)
Using the SEC’s method to compare expenses
The Securities and Exchange Commission (SEC) has established guidelines to help investors assess fund expenses. Per these guidelines, the table below shows your portfolio’s expenses based on a $1,000 investment, assuming a hypothetical 5% annualized return. You can use this information to compare the ongoing expenses (but not transaction expenses or total cost) of investing in the portfolio with those of other funds. All mutual fund shareholder reports will provide this information to help you make this comparison. Please note that you cannot use this information to estimate your actual ending account balance and expenses paid during the period.
Expenses and Value of a $1,000 Investment assuming a hypothetical 5% annualized return for the six months ended June 30, 2006
| | | Initial Shares | | Service Shares |
| |
| |
|
| Expenses paid per $1,000 † | | $ 4.86 | | $ 6.11 |
| Ending value (after expenses) | | $1,019.98 | | $1,018.74 |
| † Expenses are equal to the portfolio’s annualized expense ratio of .97% for Initial shares and 1.22% for Service |
| shares; multiplied by the average account value over the period, multiplied by 181/365 (to reflect the one-half |
| year period). |
STATEMENT OF INVESTMENTS
June 30, 2006 (Unaudited)
|
| Common Stocks—97.7% | | Shares | | Value ($) |
| |
| |
|
| Australia—1.7% | | | | |
| ABC Learning Centres | | 89,200 | | 424,335 |
| Excel Coal | | 92,447 | | 554,537 |
| | | | | 978,872 |
| Belgium—.7% | | | | |
| KBC Groep | | 4,044 | | 433,954 |
| Brazil—9.0% | | | | |
| All America Latina Logistica (Units) | | 13,060 | | 885,781 |
| Brasil Telecom Participacoes, ADR | | 17,236 | | 561,377 |
| Cia Vale do Rio Doce, ADR | | 36,366 | | 874,239 |
| Diagnosticos da America | | 22,490 a | | 446,498 |
| Gafisa | | 33,388 a | | 363,801 |
| Natura Cosmeticos | | 68,600 | | 718,971 |
| Petroleo Brasileiro, ADR (Pfd. Block) | | 17,701 | | 1,413,248 |
| | | | | 5,263,915 |
| Canada—3.9% | | | | |
| Canadian Pacific Railway | | 8,049 | | 410,125 |
| EnCana | | 8,408 | | 442,495 |
| Goldcorp | | 19,370 | | 583,580 |
| Oncolytics Biotech | | 151,225 a | | 431,917 |
| Paramount Resources, Cl. A | | 13,235 a | | 426,591 |
| | | | | 2,294,708 |
| France—11.0% | | | | |
| Accor | | 7,996 | | 486,697 |
| AXA | | 21,414 | | 702,789 |
| AXA (Rights) | | 21,414 a | | 18,076 |
| Carrefour | | 15,037 | | 881,610 |
| L’Oreal | | 6,406 | | 605,073 |
| Sanofi-Aventis | | 6,291 | | 613,924 |
| Societe Generale | | 6,923 | | 1,018,269 |
| Total | | 18,599 | | 1,223,899 |
| Vivendi | | 26,433 | | 926,334 |
| | | | | 6,476,671 |
The Portfolio 7
STATEMENT OF INVESTMENTS (Unaudited) (continued)
| Common Stocks (continued) | | Shares | | Value ($) |
| |
| |
|
| Germany—6.9% | | | | |
| Comdirect Bank | | 48,957 | | 473,377 |
| Deutsche Boerse | | 5,403 | | 735,962 |
| Deutsche Post | | 25,078 | | 673,891 |
| Deutsche Postbank | | 8,002 | | 575,796 |
| Deutsche Wohnen | | 1,476 a | | 452,979 |
| MLP | | 18,154 | | 374,058 |
| Praktiker Bau—und | | | | |
| Heimwerkermaerkte Holding, Cl. A | | 14,280 | | 397,062 |
| Tipp24 | | 13,428 a | | 345,893 |
| | | | | 4,029,018 |
| Hong Kong—1.5% | | | | |
| Esprit Holdings | | 52,000 | | 425,165 |
| Melco International Development | | 173,000 | | 434,371 |
| | | | | 859,536 |
| Ireland—1.2% | | | | |
| Irish Life & Permanent | | 29,833 | | 709,709 |
| Italy—1.8% | | | | |
| Telecom Italia (RNC) | | 160,033 | | 413,458 |
| UniCredito Italiano | | 79,585 | | 622,950 |
| | | | | 1,036,408 |
| Japan—13.0% | | | | |
| Hakuhodo DY Holdings | | 4,800 | | 353,102 |
| Japan Tobacco | | 260 | | 947,230 |
| Kao | | 23,000 | | 601,826 |
| Keihin Electric Express Railway | | 53,000 | | 375,066 |
| Misawa Homes Holdings | | 6,900 a | | 227,267 |
| Mitsubishi | | 29,000 | | 578,936 |
| Mitsubishi UFJ Financial Group | | 81 | | 1,132,273 |
| Mizuno | | 55,000 | | 378,167 |
| Nikko Cordial | | 41,500 | | 530,806 |
| Nippon Express | | 66,000 | | 356,352 |
| Nippon System Development | | 12,300 | | 426,621 |
| Nissan Motor | | 51,300 | | 560,239 |
| Toyota Motor | | 22,800 | | 1,193,185 |
| | | | | 7,661,070 |
| Common Stocks (continued) | | Shares | | Value ($) |
| |
| |
|
| Malaysia—.7% | | | | |
| Bursa Malaysia | | 250,000 | | 391,210 |
| Netherlands—3.9% | | | | |
| ASML Holding | | 17,738 a | | 359,361 |
| ING Groep | | 18,893 | | 742,564 |
| Koninklijke Philips Electronics | | 14,242 | | 445,005 |
| Royal Numico | | 9,990 | | 448,352 |
| SNS Reaal | | 14,900 a | | 324,733 |
| | | | | 2,320,015 |
| Norway—3.5% | | | | |
| Acergy | | 31,322 a | | 476,572 |
| Norsk Hydro | | 29,658 | | 785,825 |
| Statoil | | 28,175 | | 798,562 |
| | | | | 2,060,959 |
| Russia—2.3% | | | | |
| LUKOIL, ADR | | 10,322 | | 858,790 |
| Sistema JSFC, GDR | | 25,028 | | 503,063 |
| | | | | 1,361,853 |
| Singapore—2.6% | | | | |
| DBS Group Holdings | | 58,000 | | 663,046 |
| MobileOne | | 720 | | 941 |
| Singapore Airlines | | 54,000 | | 433,146 |
| Singapore Post | | 609,000 | | 415,411 |
| | | | | 1,512,544 |
| South Africa—.6% | | | | |
| MTN Group | | 48,300 | | 357,653 |
| South Korea—3.6% | | | | |
| KT & G, GDR | | 32,018 b | | 917,316 |
| Samsung | | 21,680 | | 595,303 |
| Samsung Electronics, GDR | | 1,851 b | | 581,677 |
| | | | | 2,094,296 |
| Switzerland—8.4% | | | | |
| Nestle | | 3,155 | | 990,289 |
| Novartis | | 17,992 | | 973,574 |
| Roche Holding | | 7,057 | | 1,165,784 |
The Portfolio 9
STATEMENT OF INVESTMENTS (Unaudited) (continued)
| Common Stocks (continued) | | Shares | | Value ($) |
| |
| |
|
| Switzerland (continued) | | | | |
| UBS | | 10,633 | | 1,164,641 |
| Zurich Financial Services | | 2,896 | | 634,402 |
| | | | | 4,928,690 |
| Thailand—3.6% | | | | |
| Advanced Info Service | | 262,100 | | 618,809 |
| Bank of Ayudhya | | 1,223,600 | | 552,097 |
| Banpu | | 119,100 | | 403,040 |
| Siam Commercial Bank | | 362,800 | | 547,246 |
| | | | | 2,121,192 |
| United Kingdom—17.8% | | | | |
| Anglo American | | 11,672 | | 478,394 |
| Barclays | | 81,035 | | 920,180 |
| BHP Billiton | | 65,165 | | 1,263,189 |
| BP | | 78,572 | | 915,443 |
| British American Tobacco | | 29,790 | | 749,767 |
| Cable & Wireless | | 295,183 | | 627,289 |
| GlaxoSmithKline | | 43,890 | | 1,225,486 |
| ICAP | | 111,730 | | 1,028,200 |
| Old Mutual | | 283,015 | | 853,770 |
| Prudential | | 79,441 | | 896,942 |
| Standard Chartered | | 36,493 | | 890,147 |
| Tesco | | 99,152 | | 611,965 |
| | | | | 10,460,772 |
| Total Common Stocks | | | | |
| (cost $47,826,565) | | | | 57,353,045 |
| Preferred Stocks—1.1% | | Shares | | Value ($) |
| |
| |
|
| Germany | | | | | | |
| Henkel | | | | | | |
| (cost $463,908) | | | | 5,398 | | 617,152 |
| |
| |
| |
|
| |
| Total Investments (cost $48,290,473) | | 98.8% | | 57,970,197 |
| |
| Cash and Receivables (Net) | | 1.2% | | 734,280 |
| |
| Net Assets | | | | 100.0% | | 58,704,477 |
| |
| ADR—American Depository Receipts | | | | |
| GDR—Global Depository Receipts | | | | |
| a | | Non-income producing security. | | | | |
| b | | Securities exempt from registration under Rule 144A of the Securities Act of 1933.These securities may be resold in |
| | | transactions exempt from registration, normally to qualified institutional buyers. At June 30, 2006, these securities |
| | | amounted to $1,498,993 or 2.6% of net assets. | | | | |
| |
| |
| |
|
| |
| |
| |
| |
| Portfolio Summary | | (Unaudited) † | | | | |
| |
| | | | | Value (%) | | | | Value (%) |
| |
| |
| |
| |
|
| Consumer Goods | | 16.1 | | Health Care | | 8.3 |
| Financial | | 15.8 | | Industrial | | 7.3 |
| Banking | | 14.5 | | Telecommunications | | 5.3 |
| Oil & Gas | | 11.2 | | Technology | | 2.3 |
| Consumer Services | | 9.6 | | | | |
| Materials | | 8.4 | | | | 98.8 |
| |
| † | | Based on net assets. | | | | | | |
| See notes to financial statements. | | | | |
The Portfolio 11
STATEMENT OF ASSETS AND LIABILITIES
June 30, 2006 (Unaudited)
| | | Cost | | Value |
| |
| |
|
| Assets ($): | | | | |
| Investments in securities—See Statement of Investments | | 48,290,473 | | 57,970,197 |
| Cash | | | | 542,994 |
| Cash denominated in foreign currencies | | 2,825 | | 2,829 |
| Dividends receivable | | | | 194,256 |
| Unrealized appreciation on forward | | | | |
| currency exchange contracts—Note 4 | | | | 51,031 |
| Receivable for investment securities sold | | | | 32,344 |
| Receivable for shares of Beneficial Interest subscribed | | | | 12,932 |
| Prepaid expenses | | | | 5,460 |
| | | | | 58,812,043 |
| |
| |
|
| Liabilities ($): | | | | |
| Due to The Dreyfus Corporation and affiliates—Note 3(b) | | | | 38,108 |
| Unrealized depreciation on forward currency exchange contracts—Note 4 | | 26,488 |
| Payable for shares of Beneficial Interest redeemed | | | | 10,699 |
| Accrued expenses | | | | 32,271 |
| | | | | 107,566 |
| |
| |
|
| Net Assets ($) | | | | 58,704,477 |
| |
| |
|
| Composition of Net Assets ($): | | | | |
| Paid-in capital | | | | 59,357,643 |
| Accumulated undistributed investment income—net | | | | 710,109 |
| Accumulated net realized gain (loss) on investments | | | | (11,068,279) |
| Accumulated net unrealized appreciation (depreciation) | | | | |
| on investments and foreign currency transactions | | | | 9,705,004 |
| |
| |
|
| Net Assets ($) | | | | 58,704,477 |
| |
| |
|
| |
| |
| Net Asset Value Per Share | | | | |
| | | Initial Shares | | Service Shares |
| |
| |
|
| Net Assets ($) | | 51,691,357 | | 7,013,120 |
| Shares Outstanding | | 2,911,501 | | 395,153 |
| |
| |
|
| Net Asset Value Per Share ($) | | 17.75 | | 17.75 |
See notes to financial statements.
|
STATEMENT OF OPERATIONS
Six Months Ended June 30, 2006 (Unaudited)
|
| Investment Income ($): | | |
| Income: | | |
| Cash dividends (net of $92,108 foreign taxes withheld at source) | | 948,424 |
| Interest | | 171 |
| Total Income | | 948,595 |
| Expenses: | | |
| Investment advisory fee—Note 3(a) | | 213,317 |
| Custodian fees | | 53,625 |
| Auditing fees | | 18,780 |
| Distribution fees—Note 3(b) | | 8,562 |
| Trustees’ fees and expenses—Note 3(c) | | 3,437 |
| Prospectus and shareholders’ reports | | 1,024 |
| Legal fees | | 938 |
| Loan commitment fees—Note 2 | | 296 |
| Registration fees | | 18 |
| Miscellaneous | | 4,970 |
| Total Expenses | | 304,967 |
| Less—reduction in custody fees due to | | |
| earnings credits—Note 1(c) | | (21,452) |
| Net Expenses | | 283,515 |
| Investment Income—Net | | 665,080 |
| |
|
| Realized and Unrealized Gain (Loss) on Investments—Note 4 ($): |
| Net realized gain (loss) on investments and foreign currency transactions | | 2,982,217 |
| Net realized gain (loss) on forward currency exchange contracts | | 92,077 |
| Net Realized Gain (Loss) | | 3,074,294 |
| Net unrealized appreciation (depreciation) on | | |
| investments and foreign currency transactions | | 556,944 |
| Net Realized and Unrealized Gain (Loss) on Investments | | 3,631,238 |
| Net Increase in Net Assets Resulting from Operations | | 4,296,318 |
See notes to financial statements.
|
The Portfolio 13
STATEMENT OF CHANGES IN NET ASSETS
| | | Six Months Ended | | |
| | | June 30, 2006 | | Year Ended |
| | | (Unaudited) | | December 31, 2005 |
| |
| |
|
| Operations ($): | | | | |
| Investment income—net | | 665,080 | | 767,342 |
| Net realized gain (loss) on investments | | 3,074,294 | | 7,725,069 |
| Net unrealized appreciation | | | | |
| (depreciation) on investments | | 556,944 | | (2,244,526) |
| Net Increase (Decrease) in Net Assets | | | | |
| Resulting from Operations | | 4,296,318 | | 6,247,885 |
| |
| |
|
| Dividends to Shareholders from ($): | | | | |
| Investment income—net: | | | | |
| Initial shares | | (397,562) | | (160,712) |
| Service shares | | (41,615) | | (9,235) |
| Total Dividends | | (439,177) | | (169,947) |
| |
| |
|
| Beneficial Interest Transactions ($): | | | | |
| Net proceeds from shares sold: | | | | |
| Initial shares | | 11,562,799 | | 5,791,282 |
| Service shares | | 1,571,036 | | 1,742,456 |
| Dividends reinvested: | | | | |
| Initial shares | | 397,562 | | 160,712 |
| Service shares | | 41,615 | | 9,235 |
| Cost of shares redeemed: | | | | |
| Initial shares | | (5,953,649) | | (7,886,743) |
| Service shares | | (930,524) | | (874,791) |
| Increase (Decrease) in Net Assets from | | | | |
| Beneficial Interest Transactions | | 6,688,839 | | (1,057,849) |
| Total Increase (Decrease) in Net Assets | | 10,545,980 | | 5,020,089 |
| |
| |
|
| Net Assets ($): | | | | |
| Beginning of Period | | 48,158,497 | | 43,138,408 |
| End of Period | | 58,704,477 | | 48,158,497 |
| Undistributed investment income—net | | 710,109 | | 484,206 |
| | | Six Months Ended | | |
| | | June 30, 2006 | | Year Ended |
| | | (Unaudited) | | December 31, 2005 |
| |
| |
|
| Capital Share Transactions: | | | | |
| Initial Shares | | | | |
| Shares sold | | 644,994 | | 391,336 |
| Shares issued for dividends reinvested | | 21,630 | | 11,334 |
| Shares redeemed | | (332,855) | | (531,886) |
| Net Increase (Decrease) in Shares Outstanding | | 333,769 | | (129,216) |
| |
| |
|
| Service Shares | | | | |
| Shares sold | | 86,926 | | 119,792 |
| Shares issued for dividends reinvested | | 2,264 | | 651 |
| Shares redeemed | | (52,144) | | (59,441) |
| Net Increase (Decrease) in Shares Outstanding | | 37,046 | | 61,002 |
See notes to financial statements.
|
The Portfolio 15
The following tables describe the performance for each share class for the fiscal periods indicated. All information (except portfolio turnover rate) reflects financial results for a single portfolio share.Total return shows how much your investment in the portfolio would have increased (or decreased) during each period, assuming you had reinvested all dividends and distributions.These figures have been derived from the portfolio’s financial statements.
| | | Six Months Ended | | | | | | | | |
| | | June 30, 2006 | | Year Ended December 31, | | |
| | | |
| |
| |
|
| Initial Shares | | (Unaudited) | | 2005 | | 2004 | | 2003 | | 2002 | | 2001 |
| |
| |
| |
| |
| |
| |
|
| Per Share Data ($): | | | | | | | | | | | | |
| Net asset value, | | | | | | | | | | | | |
| beginning of period | | 16.41 | | 14.36 | | 11.97 | | 8.75 | | 10.76 | | 15.34 |
| Investment Operations: | | | | | | | | | | | | |
| Investment income—net a | | .21 | | .26 | | .27 | | .14 | | .10 | | .03 |
| Net realized and unrealized | | | | | | | | | | | | |
| gain (loss) on investments | | 1.27 | | 1.85 | | 2.64 | | 3.55 | | (1.81) | | (4.50) |
| Total from Investment Operations | | 1.48 | | 2.11 | | 2.91 | | 3.69 | | (1.71) | | (4.47) |
| Distributions: | | | | | | | | | | | | |
| Dividends from | | | | | | | | | | | | |
| investment income—net | | (.14) | | (.06) | | (.52) | | (.47) | | (.30) | | (.11) |
| Net asset value, end of period | | 17.75 | | 16.41 | | 14.36 | | 11.97 | | 8.75 | | 10.76 |
| |
| |
| |
| |
| |
| |
|
| Total Return (%) | | 9.00b | | 14.75 | | 24.57 | | 42.89 | | (15.94) | | (29.18) |
| |
| |
| |
| |
| |
| |
|
| Ratios/Supplemental Data (%): | | | | | | | | | | |
| Ratio of total expenses | | | | | | | | | | | | |
| to average net assets | | .52b | | 1.10 | | 1.04 | | 1.19 | | 1.14 | | 1.08 |
| Ratio of net expenses | | | | | | | | | | | | |
| to average net assets | | .48b | | 1.09 | | 1.04 | | 1.19 | | 1.14 | | 1.08 |
| Ratio of net investment income | | | | | | | | | | | | |
| to average net assets | | 1.17b | | 1.76 | | 2.13 | | 1.42 | | .96 | | .25 |
| Portfolio Turnover Rate | | 47.58b | | 92.82 | | 96.55 | | 101.02 | | 116.65 | | 238.88 |
| |
| |
| |
| |
| |
| |
|
| Net Assets, end of period | | | | | | | | | | | | |
| ($ x 1,000) | | 51,691 | | 42,289 | | 38,874 | | 32,892 | | 27,117 | | 39,961 |
| |
| a | | Based on average shares outstanding at each month end. | | | | | | | | |
| b | | Not annualized. | | | | | | | | | | | | |
| See notes to financial statements. | | | | | | | | | | | | |
| | | Six Months Ended | | | | | | | | |
| | | June 30, 2006 | | Year Ended December 31, | | |
| | | |
| |
| |
|
| Service Shares | | (Unaudited) | | 2005 | | 2004 | | 2003 | | 2002 | | 2001 |
| |
| |
| |
| |
| |
| |
|
| Per Share Data ($): | | | | | | | | | | | | |
| Net asset value, | | | | | | | | | | | | |
| beginning of period | | 16.39 | | 14.35 | | 11.95 | | 8.74 | | 10.75 | | 15.34 |
| Investment Operations: | | | | | | | | | | | | |
| Investment income (loss)—net a | | .19 | | .22 | | .24 | | .12 | | .07 | | (.03) |
| Net realized and unrealized | | | | | | | | | | | | |
| gain (loss) on investments | | 1.28 | | 1.85 | | 2.63 | | 3.54 | | (1.80) | | (4.47) |
| Total from Investment Operations | | 1.47 | | 2.07 | | 2.87 | | 3.66 | | (1.73) | | (4.50) |
| Distributions: | | | | | | | | | | | | |
| Dividends from | | | | | | | | | | | | |
| investment income—net | | (.11) | | (.03) | | (.47) | | (.45) | | (.28) | | (.09) |
| Net asset value, end of period | | 17.75 | | 16.39 | | 14.35 | | 11.95 | | 8.74 | | 10.75 |
| |
| |
| |
| |
| |
| |
|
| Total Return (%) | | 8.94b | | 14.45 | | 24.20 | | 42.56 | | (16.20) | | (29.35) |
| |
| |
| |
| |
| |
| |
|
| Ratios/Supplemental Data (%): | | | | | | | | | | |
| Ratio of total expenses | | | | | | | | | | | | |
| to average net assets | | .64b | | 1.34 | | 1.29 | | 1.44 | | 1.41 | | 1.47 |
| Ratio of net expenses | | | | | | | | | | | | |
| to average net assets | | .60b | | 1.33 | | 1.29 | | 1.44 | | 1.41 | | 1.47 |
| Ratio of net investment income | | | | | | | | | | | | |
| (loss) to average net assets | | 1.05b | | 1.50 | | 1.89 | | 1.17 | | .74 | | (.27) |
| Portfolio Turnover Rate | | 47.58b | | 92.82 | | 96.55 | | 101.02 | | 116.65 | | 238.88 |
| |
| |
| |
| |
| |
| |
|
| Net Assets, end of period | | | | | | | | | | | | |
| ($ x 1,000) | | 7,013 | | 5,870 | | 4,265 | | 3,375 | | 2,017 | | 1,644 |
| |
| a | | Based on average shares outstanding at each month end. | | | | | | | | |
| b | | Not annualized. | | | | | | | | | | | | |
| See notes to financial statements. | | | | | | | | | | | | |
The Portfolio 17
NOTES TO FINANCIAL STATEMENTS (Unaudited)
NOTE 1—Significant Accounting Policies:
Dreyfus Variable Investment Fund (the “fund”) is registered under the Investment Company Act of 1940, as amended (the “Act”), as an open-end management investment company, operating as a series company currently offering twelve series, including the International Equity Portfolio (the “portfolio”). The portfolio is only offered to separate accounts established by insurance companies to fund variable annuity contracts and variable life insurance policies. The portfolio is a non-diversified series. The portfolio’s investment objective is to maximize capital growth.The Dreyfus Corporation (the “Manager” or “Dreyfus”) serves as the portfolio’s investment adviser. Dreyfus is a wholly-owned subsidiary of Mellon Financial Corporation (“Mellon Financial”). Newton Capital Management Limited (“Newton”) is the portfolio’s sub-investment adviser. Newton is also a wholly-owned subsidiary of Mellon Bank, N.A., and an affiliate of Dreyfus.
Dreyfus Service Corporation (the “Distributor”), a wholly-owned subsidiary of Dreyfus, is the distributor of the portfolio’s shares, which are sold without a sales charge.The portfolio is authorized to issue an unlimited number of $.001 par value shares of Beneficial Interest in each of the following classes of shares: Initial and Service. Each class of shares has identical rights and privileges, except with respect to the distribution plan and the expenses borne by each class and certain voting rights. Income, expenses (other than expenses attributable to a specific class), and realized and unrealized gains or losses on investments are allocated to each class of shares based on its relative net assets.
The fund accounts separately for the assets, liabilities and operations of each series. Expenses directly attributable to each series are charged to that series’ operations; expenses which are applicable to all series are allocated among them on a pro rata basis.
The portfolio’s financial statements are prepared in accordance with U.S. generally accepted accounting principles, which may require the use of management estimates and assumptions.Actual results could differ from those estimates.
The fund enters into contracts that contain a variety of indemnifica-tions.The portfolio’s maximum exposure under these arrangements is unknown. The portfolio does not anticipate recognizing any loss related to these arrangements.
(a) Portfolio valuation: Investments in securities are valued at the last sales price on the securities exchange or national securities market on which such securities are primarily traded. Securities listed on the National Market System for which market quotations are available are valued at the official closing price or, if there is no official closing price that day, at the last sales price. Securities not listed on an exchange or the national securities market, or securities for which there were no transactions, are valued at the average of the most recent bid and asked prices, except for open short positions, where the asked price is used for valuation purposes. Bid price is used when no asked price is available. Investments in registered investment companies are valued at their net asset value.When market quotations or official closing prices are not readily available, or are determined not to reflect accurately fair value, such as when the value of a security has been significantly affected by events after the close of the exchange or market on which the security is principally traded (for example, a foreign exchange or market), but before the portfolio calculates its net asset value, the portfolio may value these investments at fair value as determined in accordance with the procedures approved by the Board of Trustees. Fair valuing of securities may be determined with the assistance of a pricing service using calculations based on indices of domestic securities and other appropriate indicators, such as prices of relevant ADR’s and futures contracts. For other securities that are fair valued by the Board of Trustees, certain factors may be considered such as: fundamental analytical data, the nature and duration of restrictions on disposition, an evaluation of the forces that influence the market in which the securities are purchased and sold and public trading in similar securities of the issuer or comparable issuers. Financial futures are valued at the last sales price. Investments denominated in foreign currencies are
The Portfolio 19
NOTES TO FINANCIAL STATEMENTS (Unaudited) (continued)
translated to U.S. dollars at the prevailing rates of exchange. Forward currency exchange contracts are valued at the forward rate.
(b) Foreign currency transactions: The portfolio does not isolate that portion of the results of operations resulting from changes in foreign exchange rates on investments from the fluctuations arising from changes in market prices of securities held. Such fluctuations are included with the net realized and unrealized gain or loss on investments.
Net realized foreign exchange gains or losses arise from sales and maturities of short-term securities, sales of foreign currencies, currency gains or losses realized on securities transactions and the difference between the amounts of dividends, interest and foreign withholding taxes recorded on the portfolio’s books and the U.S. dollar equivalent of the amounts actually received or paid. Net unrealized foreign exchange gains or losses arise from changes in the value of assets and liabilities other than investments in securities, resulting from changes in exchange rates. Such gains and losses are included with net realized and unrealized gain or loss on investments.
(c) Securities transactions and investment income: Securities transactions are recorded on a trade date basis. Realized gain and loss from securities transactions are recorded on the identified cost basis. Dividend income is recognized on the ex-dividend date and interest income, including, where applicable, accretion of discount and amortization of premium on investments, is recognized on the accrual basis.
The portfolio has an arrangement with the custodian bank whereby the portfolio receives earnings credits from the custodian when positive cash balances are maintained, which are used to offset custody fees. For financial reporting purposes, the portfolio includes net earnings credits as an expense offset in the Statement of Operations.
(d) Dividends to shareholders: Dividends are recorded on the ex-dividend date. Dividends from investment income-net and dividends from net realized capital gain, if any, are normally declared and paid annually,
but the portfolio may make distributions on a more frequent basis to comply with the distribution requirements of the Internal Revenue Code of 1986, as amended (the “Code”).To the extent that net realized capital gain can be offset by capital loss carryovers, it is the policy of the portfolio not to distribute such gain. Income and capital gain distributions are determined in accordance with income tax regulations, which may differ from U.S. generally accepted accounting principles.
(e) Federal income taxes: It is the policy of the portfolio to continue to qualify as a regulated investment company, if such qualification is in the best interests of its shareholders, by complying with the applicable provisions of the Code, and to make distributions of taxable income sufficient to relieve it from substantially all federal income and excise taxes.
The portfolio has an unused capital loss carryover of $14,111,202 available for federal income tax purposes to be applied against future net securities profits, if any, realized subsequent to December 31, 2005. If not applied, $9,013,748 of the carryover expires in fiscal 2009, $3,933,328 expires in fiscal 2010 and $1,164,126 expires in fiscal 2011.
The tax character of distributions paid to shareholders during the fiscal year ended December 31, 2005 were as follows: ordinary income $169,947.The tax character of current year distributions will be determined at the end of the current fiscal year.
NOTE 2—Bank Line of Credit:
|
The portfolio participates with other Dreyfus-managed funds in a $350 million redemption credit facility (the “Facility”) to be utilized for temporary or emergency purposes, including the financing of redemptions. In connection therewith, the portfolio has agreed to pay commitment fees on its pro rata portion of the Facility. Interest is charged to the portfolio based on prevailing market rates in effect at the time of borrowing. During the period ended June 30, 2006, the portfolio did not borrow under the Facility.
The Portfolio 21
NOTES TO FINANCIAL STATEMENTS (Unaudited) (continued)
NOTE 3—Investment Advisory Fee, Sub-Investment Advisory Fee and Other Transactions with Affiliates:
(a) Pursuant to an Investment Advisory Agreement with Dreyfus, the investment advisory fee is computed at the annual rate of .75% of the value of the portfolio’s average daily net assets and is payable monthly.
Pursuant to a Sub-Investment Advisory Agreement between Dreyfus and Newton, the sub-investment advisory fee is payable monthly by Dreyfus, and is based upon the value of the portfolio’s average daily net assets, computed at the following annual rates:
| Average Net Assets | | |
| 0 to $100 million | | .35% |
| $100 million to $1 billion | | .30% |
| $1 billion to $1.5 billion | | .26% |
| In excess of $1.5 billion | | .20% |
(b) Under the Distribution Plan (the “Plan”) adopted pursuant to Rule 12b-1 under the Act, Service shares pay the Distributor for distributing their shares, for servicing and/or maintaining Service shares shareholder accounts and for advertising and marketing for Service shares.The Plan provides for payments to be made at an annual rate of .25% of the value of Service shares’ average daily net assets. The Distributor may make payments to Participating Insurance Companies and to brokers and dealers acting as principal underwriter for their variable insurance products.The fees payable under the Plan are payable without regard to actual expenses incurred. During the period ended June 30, 2006, Service shares were charged $8,562 pursuant to the Plan.
The portfolio compensates Dreyfus Transfer, Inc., a wholly-owned subsidiary of Dreyfus, under a transfer agency agreement for providing personnel and facilities to perform transfer agency services for the portfolio. During the period ended June 30, 2006, the portfolio was charged $66 pursuant to the transfer agency agreement.
During the period ended June 30, 2006, the portfolio was charged $1,926 for services performed by the Chief Compliance Officer.
The components of Due to The Dreyfus Corporation and affiliates in the Statement of Assets and Liabilities consist of: investment advisory fees $34,766, Rule 12b-1 distribution plan fees $1,391, chief compliance officer fees $1,926 and transfer agency per account fees $25.
(c) Each Board member also serves as a Board member of other funds within the Dreyfus complex. Annual retainer fees and attendance fees are allocated to each portfolio based on net assets.
NOTE 4—Securities Transactions:
The aggregate amount of purchases and sales of investment securities, excluding short-term securities and forward currency exchange contracts, during the period ended June 30, 2006, amounted to $33,712,286 and $26,595,204, respectively.
The portfolio enters into forward currency exchange contracts in order to hedge its exposure to changes in foreign currency exchange rates on its foreign portfolio holdings and to settle foreign currency transactions. When executing forward currency exchange contracts, the portfolio is obligated to buy or sell a foreign currency at a specified rate on a certain date in the future. With respect to sales of forward currency exchange contracts, the portfolio would incur a loss if the value of the contract increases between the date the forward contract is opened and the date the forward contract is closed.The portfolio realizes a gain if the value of the contract decreases between those dates.With respect to purchases of forward currency exchange contracts, the portfolio would incur a loss if the value of the contract decreases between the date the forward contract is opened and the date the forward contract is closed. The portfolio realizes a gain if the value of the contract increases between those dates.The portfolio is also exposed to credit risk associ-
The Portfolio 23
NOTES TO FINANCIAL STATEMENTS (Unaudited) (continued)
ated with counterparty nonperformance on these forward currency exchange contracts which is typically limited to the unrealized gain on each open contract.The following summarizes open forward currency exchange contracts at June 30, 2006:
| | | Foreign | | | | | | Unrealized |
| Forward Currency | | Currency | | | | | | Appreciation |
| Exchange Contracts | | Amounts | | Cost ($) | | Value ($) | | (Depreciation) ($) |
| |
| |
| |
| |
|
| Purchases: | | | | | | | | |
| British Pound, | | | | | | | | |
| expiring 7/14/2006 | | 592,436 | | 1,049,000 | | 1,095,000 | | 46,000 |
| Euro, expiring | | | | | | | | |
| 11/15/2006 | | 1,580,644 | | 2,034,000 | | 2,039,031 | | 5,031 |
| Norwegian Krone, | | | | | | | | |
| expiring 10/13/2006 | | 7,373,366 | | 1,214,000 | | 1,192,214 | | (21,786) |
| Swiss Franc, | | | | | | | | |
| expiring 12/15/2006 | | 592,797 | | 498,000 | | 493,298 | | (4,702) |
| Total | | | | | | | | 24,543 |
At June 30, 2006, accumulated net unrealized appreciation on investments was $9,679,724, consisting of $10,563,907 gross unrealized appreciation and $884,183 gross unrealized depreciation.
At June 30,2006,the cost of investments for federal income tax purposes was substantially the same as the cost for financial reporting purposes (see the Statement of Investments).
PROXY RESULTS ( U n a u d i t e d )
|
Dreyfus Variable Investment Fund held a special meeting of shareholders on June 29, 2006.The proposal considered at the meeting, and the results, are as follows:
| | | | | Shares | | |
| |
| |
| |
|
| | | For | | | | Authority Withheld |
| |
| |
| |
|
| To elect additional Board Members: | | | | | | |
| Peggy C. Davis † | | 171,078,926.558 | | | | 7,687,714.085 |
| Joseph S. DiMartino | | 170,946,484.400 | | | | 7,820,156.243 |
| David P. Feldman | | 170,959,920.714 | | | | 7,806,719.929 |
| Ehud Houminer † | | 170,132,086.682 | | | | 8,634,553.961 |
| Gloria Messinger † | | 170,187,240.710 | | | | 8,579,399.933 |
| Anne Wexler † | | 170,212,607.472 | | | | 8,554,033.171 |
| † Each will serve as an Independent Board member of the fund commencing, subject to the discretion of the Board, on |
| or about January 1, 2007. |
| In addition to Joseph S. DiMartino and David P. Feldman, James F. Henry, Dr. Paul A. Marks and Dr. Martin |
| Peretz continue as Board members of the fund. |
The Portfolio 25
INFORMATION ABOUT THE REVIEW AND APPROVAL OF THE PORTFOLIO’S
I N V E S T M E N T A D V I S O R Y A G R E E M E N T (Unaudited)
At a meeting of the fund’s Board of Trustees held on June 7 and 8, 2006, the Board considered the re-approval for an annual period (through July 31,2007) of the fund’s Investment Advisory Agreement with Dreyfus for the portfolio, pursuant to which Dreyfus provides the portfolio with investment advisory and administrative services, and the Sub-Investment Advisory Agreement (the “Sub-Advisory Agreement”) between Dreyfus and Newton Capital Management Limited (the “Sub-Adviser”), pursuant to which the Sub-Adviser provides day-to-day management of the portfolio’s investments subject to Dreyfus’oversight.The Board members, none of whom are “interested persons” (as defined in the Investment Company Act of 1940, as amended) of the fund were assisted in their review by independent legal counsel and met with counsel in executive session separate from representatives of Dreyfus and the Sub-Adviser.
Analysis of Nature, Extent and Quality of Services Provided to the Portfolio. The Board members received a presentation from representatives of Dreyfus regarding services provided to the portfolio and other funds in the Dreyfus fund complex, and discussed the nature, extent and quality of the services provided to the portfolio pursuant to its Investment Advisory Agreement and by the Sub-Adviser pursuant to the Sub-Advisory Agreement. Dreyfus’ representatives reviewed the portfolio’s distribution of accounts and the relationships Dreyfus has with various intermediaries and the different needs of each.The Board noted that the portfolio’s shares were offered only to separate accounts established by insurance companies to fund variable annuity contracts and variable life insurance policies. Dreyfus’ representatives noted the diversity of distribution among the funds in the Dreyfus fund complex, and Dreyfus’ corresponding need for broad, deep, and diverse resources to be able to provide ongoing shareholder services to each distribution channel, including that of the portfolio. Dreyfus also provided the number of separate accounts investing in the portfolio, as well as the portfolio’s asset size.
The Board members also considered the Sub-Adviser’s research and portfolio management capabilities and that Dreyfus also provides oversight of day-to-day portfolio operations, including fund accounting and administration and assistance in meeting legal and regulatory requirements.The Board members also considered Dreyfus’ extensive administrative, accounting and compliance infrastructure, as well as Dreyfus’ supervisory activities over the Sub-Adviser.
Comparative Analysis of the Portfolio’s Performance and Advisory Fee and Expense Ratio. The Board members reviewed the portfolio’s performance and placed significant emphasis on comparisons to a group of international core funds underlying variable insurance products (the “Performance Group”) and to a larger universe of funds, consisting of all international core funds underlying variable insurance products (the “Performance Universe”) selected and provided by Lipper, Inc., an independent provider of investment company data.The Board was provided with a description of the methodology Lipper used to select the Performance Group and Performance Universe, as well as the Expense Group and Expense Universe (discussed below). The Board members discussed the results of the comparisons for various periods ended April 30, 2006, and noted that the portfolio’s total return performance for its Initial shares was in the first or second quintiles of the Performance Group and the Performance Universe (higher than the Performance Group and Performance Universe medians) for each of the periods. Dreyfus also provided the Board with the portfolio’s total return performance and the quartile, percentile and rank of the portfolio’s total return within its Lipper category (as provided by Lipper) for certain other periods ended April 30, 2006, which were generally consistent with the relative total return information provided by Lipper.
The Board members also discussed the portfolio’s advisory fee and the sub-advisory fee (paid by Dreyfus) and the expense ratio for each class of shares and reviewed the range of advisory fees and expense ratios of a comparable group of funds (the “Expense Group”) and a broader group of funds (the “Expense Universe”), each selected and provided by Lipper.The Board members noted that the portfolio’s advisory fee was lower than its Expense Group and Expense Universe medians, that the expense ratio for the Initial shares was at or lower than the Expense Group and Expense Universe medians, and that the expense ratio for the Service shares was higher than the Expense Group and the Expense Universe medians.
Representatives of Dreyfus reviewed with the Board members the advisory fees paid by mutual funds managed by Dreyfus or its affiliates with similar investment objectives, policies and strategies, and included within the portfolio’s Lipper category, of which there was one (the
The Portfolio 27
I N FO R M AT I O N A B O U T T H E R E V I E W A N D A P P R OVA L O F T H E P O R T FO L I O ’ S I N V E S T M E N T A DV I S O RY A G R E E M E N T ( U n a u d i t e d ) ( c o n t i n u e d )
“Similar Fund”), and stated that there were no other accounts managed by Dreyfus or its affiliates with similar investment objectives, policies and strategies as the portfolio. Dreyfus’ representatives also reviewed the costs associated with distribution through intermediaries. It was noted that the portfolio’s advisory fee was lower than the advisory fee for the Similar Fund.The Board considered the fee paid to the Sub-Adviser in relation to the fee paid to Dreyfus and the respective services provided by the Sub-Adviser and Dreyfus. The Board also noted that the Sub-Adviser’s fee is paid by Dreyfus and not the portfolio.
Analysis of Profitability and Economies of Scale. Dreyfus’ representatives reviewed the dollar amount of expenses allocated and profit received by Dreyfus and the method used to determine such expenses and profit.The Board considered information, previously provided and discussed, prepared by an independent consulting firm regarding Dreyfus’ approach to allocating costs to, and determining the profitability of, individual funds and the entire Dreyfus mutual fund complex. The Board members also considered that the methodology had also been reviewed by an independent registered public accounting firm which, like the consultant, found the methodology to be reason-able.The consulting firm also analyzed where any economies of scale might emerge in connection with the management of the portfolio. The Board members evaluated the profitability analysis in light of the relevant circumstances for the portfolio and the extent to which economies of scale would be realized if the portfolio grows and whether fee levels reflect these economies of scale for the benefit of portfolio investors.The Board members also considered potential benefits to Dreyfus from acting as investment adviser and to the Sub-Adviser from acting as sub-adviser and noted that there were no soft dollar arrangements with respect to trading the portfolio’s investments.
It was noted that the Board members should consider Dreyfus’ profitability with respect to the portfolio as part of their evaluation of whether the fees under the Investment Advisory Agreement and the Sub-Advisory Agreement bear a reasonable relationship to the mix of services provided by Dreyfus and the Sub-Adviser, including the nature, extent and quality of such services and that a discussion of economies of scale is predicated on increasing assets and that, if a fund’s
assets had been decreasing, the possibility that Dreyfus may have realized any economies of scale would be less. It also was noted that the profitability percentage for managing the portfolio was within ranges determined by appropriate court cases to be reasonable given the services rendered and generally superior service levels provided by Dreyfus and the Sub-Adviser.
At the conclusion of these discussions, the Board agreed that it had been furnished with sufficient information to make an informed business decision with respect to continuation of the Investment Advisory Agreement and Sub-Advisory Agreement, with respect to the portfolio. Based on the discussions and considerations as described above, the Board made the following conclusions and determinations.
- The Board concluded that the nature, extent and quality of the ser- vices provided by Dreyfus and the Sub-Adviser are adequate and appropriate.
- The Board was satisfied with the portfolio’s performance.
- The Board concluded that the fee paid by the portfolio to Dreyfus, and the fee paid by Dreyfus to the Sub-Adviser, were reasonable in light of the services provided, comparative performance, expense and advisory fee information, costs of the services provided and profits to be realized and benefits derived or to be derived by Dreyfus and the Sub-Adviser from their relationships with the portfolio.
- The Board determined that the economies of scale which may accrue to Dreyfus and its affiliates in connection with the management of the portfolio had been adequately considered by Dreyfus in connection with the advisory fee rate charged to the portfolio and that, to the extent in the future it were determined that material economies of scale had not been shared with the portfolio, the Board would seek to have those economies of scale shared with the portfolio.
The Board members considered these conclusions and determinations, along with information received on a routine and regular basis throughout the year, and, without any one factor being dispositive, the Board determined that re-approval of the portfolio’s Investment Advisory Agreement and Sub-Advisory Agreement was in the best interests of the portfolio and its shareholders.
The Portfolio 29
| Dreyfus Variable Investment Fund, |
| International Equity Portfolio |
| 200 Park Avenue |
| New York, NY 10166 |
| |
| Investment Adviser |
| The Dreyfus Corporation |
| 200 Park Avenue |
| New York, NY 10166 |
| |
| Sub-Investment Adviser |
| Newton Capital Management Limited |
| 160 Queen Victoria Street |
| London, EC4V 4LA |
| England |
| Custodian |
| The Bank of New York |
| One Wall Street |
| New York, NY 10286 |
| |
| Transfer Agent & |
| Dividend Disbursing Agent |
| Dreyfus Transfer, Inc. |
| 200 Park Avenue |
| New York, NY 10166 |
| |
| Distributor |
| Dreyfus Service Corporation |
| 200 Park Avenue |
| New York, NY 10166 |
Telephone 1-800-554-4611 or 516-338-3300
Mail The Dreyfus Family of Funds, 144 Glenn Curtiss Boulevard, Uniondale, NY 11556-0144 Attn: Investments Division
The portfolio files its complete schedule of portfolio holdings with the Securities and Exchange Commission (“SEC”) for the first and third quarters of each fiscal year on Form N-Q. The portfolio’s Forms N-Q are available on the SEC’s website at http://www.sec.gov and may be reviewed and copied at the SEC’s Public Reference Room in Washington, DC. Information on the operation of the Public Reference Room may be obtained by calling 1-202-551-8090.
A description of the policies and procedures that the portfolio uses to determine how to vote proxies relating to portfolio securities, and information regarding how the portfolio voted these proxies for the 12-month period ended June 30, 2006, is available at http://www.dreyfus.com and on the SEC’s website at http://www.sec.gov. The description of the policies and procedures is also available without charge, upon request, by calling 1-800-645-6561.
| © 2006 Dreyfus Service Corporation |


The views expressed in this report reflect those of the portfolio manager only through the end of the period covered and do not necessarily represent the views of Dreyfus or any other person in the Dreyfus organization.Any such views are subject to change at any time based upon market or other conditions and Dreyfus disclaims any responsibility to update such views. These views may not be relied on as investment advice and, because investment decisions for a Dreyfus portfolio are based on numerous factors, may not be relied on as an indication of trading intent on behalf of any Dreyfus portfolio.
Not FDIC-Insured • Not Bank-Guaranteed • May Lose Value
| | | Contents |
| |
| | | T H E P O R T F O L I O |
| |
|
| 2 | | Letter from the Chairman |
| 3 | | Discussion of Performance |
| 6 | | Understanding Your Portfolio’s Expenses |
| 6 | | Comparing Your Portfolio’s Expenses |
| | | With Those of Other Funds |
| 7 | | Statement of Investments |
| 13 | | Statement of Assets and Liabilities |
| 14 | | Statement of Operations |
| 15 | | Statement of Changes in Net Assets |
| 17 | | Financial Highlights |
| 19 | | Notes to Financial Statements |
| 26 | | Proxy Results |
| 27 | | Information About the Review |
| and Approval of the Portfolio’s |
| Investment Advisory Agreement |
| | | F O R M O R E I N F O R M AT I O N |
| |
|
| | | Back Cover |
| Dreyfus Variable Investment Fund, |
| International Value Portfolio |

LETTER FROM THE CHAIRMAN
We are pleased to present this semiannual report for Dreyfus Variable Investment Fund, International Value Portfolio, covering the six-month period from January 1, 2006, through June 30, 2006.
International stock market gains over the first four months of 2006 were given back in May and June, when investors reacted negatively to suggestions that the U.S. Federal Reserve Board (the “Fed”) and other central banks, in their fight against inflation, might raise short-term interest rates more than previously expected. In the judgment of our Chief Economist, Richard Hoey, the recent correction reflects an adjustment among leveraged investors toward lower risk levels as the U.S. and global economies move into more mature phases. In our view, corrections such as these generally are healthy mechanisms that help wring speculative excesses from the financial markets, potentially setting the stage for future rallies.
While a global recession currently appears unlikely, we expect slower growth in the United States and Europe in 2007. Economic expansion in Japan and China seems likely to continue, but lower demand for exports could contribute to a slowdown elsewhere in Asia. Indicators to watch in the months ahead include the outlook for inflation in the United States and overseas, the extent of softness in the U.S. housing market, the impact of slower economic growth on consumer spending, additional changes in short-term interest rates from the Fed and other central banks, and the strength of the U.S. dollar relative to other major currencies. As always, we encourage you to discuss these and other investment-related issues with your financial advisor, who can help you prepare for the challenges and opportunities that lie ahead.
For information about how the fund performed during the reporting period, as well as market perspectives, we have provided a Discussion of Fund Performance given by the fund’s portfolio manager.
Thank you for your continued confidence and support.

DISCUSSION OF PERFORMANCE
D. Kirk Henry, Senior Portfolio Manager
How did Dreyfus Variable Investment Fund, International Value Portfolio perform relative to its benchmark?
For the six-month period ended June 30, 2006, the portfolio produced total returns of 9.33% for its Initial shares and 9.25% for its Service shares.1 This compares with a 10.16% return for the portfolio’s benchmark, the Morgan Stanley Capital International Europe, Australasia, Far East Index (“MSCI EAFE Index”), for the same period.2
While a growing global economy, improved corporate earnings and greater mergers-and-acquisitions activity helped support international stock prices during the early part of the reporting period, stocks generally fell sharply in May and June due to mounting concerns regarding a potential economic slowdown in the United States. The portfolio’s returns were slightly below its benchmark due to the fund’s stock selection in France, Switzerland and Norway.
What is the portfolio’s investment approach?
The portfolio seeks long-term capital growth.To pursue this goal, we normally invest at least 80% of the portfolio’s assets in stocks. We ordinarily invest most of the portfolio’s assets in securities of foreign companies which we consider to be value companies.The portfolio’s stock investments may include common stocks, preferred stocks and convertible securities, including those purchased in initial public offerings or shortly thereafter.We may invest in companies of any size, and may also invest in companies located in emerging markets.
The portfolio’s investment approach is value-oriented and research-dri-ven.In selecting stocks,we identify potential investments through extensive quantitative and fundamental research. Emphasizing individual stock selection rather than economic and industry trends, the portfolio focuses on three key factors: value, or how a stock is valued relative to its intrinsic worth based on traditional value measures; business health, or overall efficiency and profitability as measured by return on assets and return on equity; business momentum, or the presence of a catalyst (such as
The Portfolio 3
DISCUSSION OF PERFORMANCE (continued)
|
corporate restructuring, change in management or spin-off) that potentially will trigger a price increase near term or midterm.
What other factors influenced the portfolio’s performance?
For the first four months of the reporting period, international stocks posted generally positive returns in an environment of robust global economic growth, low inflation expectations and relatively benign monetary policies. In Europe, firms also benefited from corporate rising mergers-and-acquisitions activity. Japan’s stock market advanced as a long-awaited domestic economic recovery began to take hold.
However, the global equity markets sold off sharply during the final two months of the reporting period, primarily due to concerns that rising inflation, higher short-term interest rates and a housing-market slowdown in the United States might choke off export activity from various overseas markets. Investors moved relatively quickly to shed what they perceived to be riskier investments, such as emerging-market equities. In more developed markets, some formerly high-flying stocks also fell sharply during the downturn.
In this changing market environment, some of the portfolio’s stronger gains were achieved by German consumer stocks, including automobile manufacturer Volkswagen and airline Lufthansa, both of which benefited from improving domestic economic conditions. Stocks in the Netherlands also posted strong returns, including beer maker Heineken, which launched a light beer in the U.S. market.
On the other hand, the portfolio’s holdings in France, Switzerland and Norway generally hindered its relative performance. France Telecom’s stock price fell when it reduced earnings guidance and downgraded its sales forecast. French electronics firm Thomson, which manufactures DVDs and other digital equipment, also disappointed due to a lack of demand for the company’s after-market products. In Switzerland, Ciba Specialty Chemicals was hurt by higher fuel prices, while Swiss Reinsurance suffered from higher-than-expected property-and-casualty claims in the aftermath of hurricanes Katrina and Rita. Finally, the portfolio’s lack of exposure to Norwegian oil companies prevented it from participating in the regional industry’s gains.
Contributions to performance from the portfolio’s holdings in Japan and the United Kingdom were mixed. The portfolio outperformed the averages in the Japanese market mainly due to its relatively light exposure to some of the market’s more fully valued stocks, which fell sharply in May and June.While the portfolio’s generally underweighted position in the United Kingdom hurt its overall performance, the success of our stock selection strategy helped limit any allocation-related weakness.
What is the portfolio’s current strategy?
We viewed the recent sell-off in international stocks not as the onset of a secular bear market, but as a healthy, cyclical correction that helped to digest gains achieved over the past several years. In fact, we used recent market weakness as an opportunity to add to the portfolio’s Japanese financial exposure and U.K. banks that, in our view, became more attractively priced. Conversely, we trimmed a number of consumer stocks as they gained value amid improved business performance.
| | | Investing in foreign companies involves special risks, including changes in currency rates, |
| | | political, economic and social instability, a lack of comprehensive company information, |
| | | differing auditing and legal standards and less market liquidity. An investment in this fund |
| | | should be considered only as a supplement to an overall investment program. |
| | | The portfolio is only available as a funding vehicle under variable life insurance policies or variable |
| | | annuity contracts issued by insurance companies. Individuals may not purchase shares of the |
| | | portfolio directly. A variable annuity is an insurance contract issued by an insurance company that |
| | | enables investors to accumulate assets on a tax-deferred basis for retirement or other long-term |
| | | goals.The investment objective and policies of Dreyfus Variable Investment Fund, International |
| | | Value Portfolio made available through insurance products may be similar to other funds/portfolios |
| | | managed or advised by Dreyfus. However, the investment results of the portfolio may be higher or |
| | | lower than, and may not be comparable to, those of any other Dreyfus fund/portfolio. |
| 1 | | Total return includes reinvestment of dividends and any capital gains paid. Past performance is no |
| | | guarantee of future results. Share price and investment return fluctuate such that upon redemption, |
| | | portfolio shares may be worth more or less than their original cost.The portfolio’s performance does |
| | | not reflect the deduction of additional charges and expenses imposed in connection with investing |
| | | in variable insurance contracts, which will reduce returns. Return figures provided reflect the |
| | | absorption of certain portfolio expenses by The Dreyfus Corporation pursuant to an agreement in |
| | | effect through December 31, 2006, at which time it may be extended, terminated or modified. |
| | | Had these expenses not been absorbed, the portfolio’s returns would have been lower. |
| 2 | | SOURCE: LIPPER INC. — Reflects reinvestment of net dividends and, where applicable, capital |
| | | gain distributions.The Morgan Stanley Capital International Europe,Australasia, Far East (MSCI |
| | | EAFE) Index is an unmanaged index composed of a sample of companies representative of the |
| | | market structure of European and Pacific Basin countries. |
The Portfolio 5
UNDERSTANDING YOUR PORTFOLIO’S EXPENSES (Unaudited)
As a mutual fund investor, you pay ongoing expenses, such as management fees and other expenses. Using the information below, you can estimate how these expenses affect your investment and compare them with the expenses of other funds.You also may pay one-time transaction expenses, including sales charges (loads) and redemption fees,which are not shown in this section and would have resulted in higher total expenses. For more information, see your portfolio’s prospectus or talk to your financial adviser.
Review your portfolio’s expenses
|
The table below shows the expenses you would have paid on a $1,000 investment in Dreyfus Variable Investment Fund, International Value Portfolio from January 1, 2006 to June 30, 2006. It also shows how much a $1,000 investment would be worth at the close of the period, assuming actual returns and expenses.
| Expenses and Value of a $1,000 Investment | | |
| assuming actual returns for the six months ended June 30, 2006 | | |
| | | Initial Shares | | Service Shares |
| |
| |
|
| Expenses paid per $1,000 † | | $ 6.12 | | $ 7.16 |
| Ending value (after expenses) | | $1,093.30 | | $1,092.50 |
COMPARING YOUR PORTFOLIO’S EXPENSES WITH THOSE OF OTHER FUNDS (Unaudited)
Using the SEC’s method to compare expenses
The Securities and Exchange Commission (SEC) has established guidelines to help investors assess fund expenses. Per these guidelines, the table below shows your portfolio’s expenses based on a $1,000 investment, assuming a hypothetical 5% annualized return. You can use this information to compare the ongoing expenses (but not transaction expenses or total cost) of investing in the portfolio with those of other funds. All mutual fund shareholder reports will provide this information to help you make this comparison. Please note that you cannot use this information to estimate your actual ending account balance and expenses paid during the period.
Expenses and Value of a $1,000 Investment assuming a hypothetical 5% annualized return for the six months ended June 30, 2006
| | | Initial Shares | | Service Shares |
| |
| |
|
| Expenses paid per $1,000 † | | $ 5.91 | | $ 6.90 |
| Ending value (after expenses) | | $1,018.94 | | $1,017.95 |
| † Expenses are equal to the portfolio’s annualized expense ratio of 1.18% for Initial shares and 1.38% for Service shares, |
| multiplied by the average account value over the period, multiplied by 181/365 (to reflect the one-half year period). |
STATEMENT OF INVESTMENTS
June 30, 2006 (Unaudited)
|
| Common Stocks—94.4% | | Shares | | Value ($) |
| |
| |
|
| Australia—2.7% | | | | |
| Amcor | | 261,120 | | 1,296,525 |
| Coca-Cola Amatil | | 137,950 | | 726,996 |
| Insurance Australia Group | | 113,380 | | 450,873 |
| National Australia Bank | | 50,526 | | 1,320,468 |
| Qantas Airways | | 72,500 | | 159,512 |
| TABCORP Holdings | | 94,700 | | 1,069,936 |
| | | | | 5,024,310 |
| Belgium—.8% | | | | |
| Fortis | | 45,050 | | 1,536,697 |
| Brazil—.6% | | | | |
| Petroleo Brasileiro, ADR | | 12,170 | | 1,086,903 |
| Finland—1.1% | | | | |
| M-real, Cl. B | | 117,120 | | 579,712 |
| Nokia | | 17,200 | | 351,101 |
| Nokia, ADR | | 6,220 | | 126,017 |
| UPM-Kymmene | | 47,188 | | 1,016,956 |
| | | | | 2,073,786 |
| France—9.8% | | | | |
| BNP Paribas | | 17,930 | | 1,716,495 |
| Carrefour | | 32,050 | | 1,879,071 |
| Credit Agricole | | 42,800 | | 1,628,551 |
| France Telecom | | 130,210 | | 2,799,514 |
| Lafarge | | 3,340 | | 419,283 |
| Lagardere | | 7,570 | | 558,653 |
| Peugeot | | 17,470 | | 1,087,042 |
| Sanofi-Aventis | | 20,720 | | 2,022,017 |
| Thomson | | 54,590 | | 902,780 |
| Total | | 50,920 | | 3,350,768 |
| Valeo | | 44,558 | | 1,586,593 |
| | | | | 17,950,767 |
| Germany—8.8% | | | | |
| Allianz | | 6,900 | | 1,089,017 |
| Deutsche Bank | | 15,530 | | 1,747,138 |
| Deutsche Lufthansa | | 4,637 | | 85,580 |
The Portfolio 7
STATEMENT OF INVESTMENTS (Unaudited) (continued)
| Common Stocks (continued) | | Shares | | Value ($) |
| |
| |
|
| Germany (continued) | | | | |
| Deutsche Post | | 108,600 | | 2,918,276 |
| Deutsche Telekom | | 92,710 | | 1,490,501 |
| E.ON | | 8,099 | | 932,276 |
| Hannover Rueckversicherung | | 45,640 | | 1,596,517 |
| Infineon Technologies | | 136,970 a | | 1,525,858 |
| Medion | | 9,600 | | 123,889 |
| Metro | | 18,880 | | 1,071,425 |
| Siemens | | 31,550 | | 2,745,984 |
| Volkswagen | | 10,090 | | 707,200 |
| | | | | 16,033,661 |
| Greece—.6% | | | | |
| Public Power | | 43,840 | | 1,038,442 |
| Hong Kong—.9% | | | | |
| Bank of East Asia | | 167,411 | | 687,630 |
| BOC Hong Kong Holdings | | 312,000 | | 610,630 |
| Citic Pacific | | 116,500 | | 343,512 |
| | | | | 1,641,772 |
| Ireland—1.3% | | | | |
| Bank of Ireland | | 131,376 | | 2,344,017 |
| Italy—4.3% | | | | |
| Enel | | 83,840 | | 722,739 |
| ENI | | 72,295 | | 2,129,476 |
| Mediaset | | 126,600 | | 1,492,915 |
| Saras | | 54,900 a | | 351,788 |
| UniCredito Italiano | | 254,790 | | 1,994,364 |
| Unipol | | 342,750 | | 1,102,519 |
| | | | | 7,793,801 |
| Japan—26.0% | | | | |
| 77 Bank | | 154,500 | | 1,075,804 |
| Aeon | | 79,900 | | 1,752,132 |
| Aiful | | 27,812 | | 1,484,635 |
| Ajinomoto | | 62,900 | | 696,263 |
| Astellas Pharma | | 37,500 | | 1,376,027 |
| Canon | | 25,559 | | 1,252,717 |
| Common Stocks (continued) | | Shares | | Value ($) |
| |
| |
|
| Japan (continued) | | | | |
| Dentsu | | 688 | | 1,899,423 |
| Fuji Photo Film | | 76,800 | | 2,576,551 |
| Funai Electric | | 13,500 | | 1,309,191 |
| Hino Motors | | 277,100 | | 1,612,341 |
| JS Group | | 53,300 | | 1,119,924 |
| Kao | | 69,500 | | 1,818,561 |
| KDDI | | 174 | | 1,068,688 |
| Kuraray | | 68,200 | | 762,677 |
| Lawson | | 3,800 | | 138,441 |
| Mabuchi Motor | | 15,600 | | 932,238 |
| Matsumotokiyoshi | | 37,340 | | 949,322 |
| Minebea | | 67,400 | | 366,855 |
| Mitsubishi UFJ Financial Group | | 119 | | 1,663,463 |
| Mitsui Trust Holdings | | 28,900 | | 347,174 |
| Nippon Express | | 506,600 | | 2,735,268 |
| Nippon Paper Group | | 174 | | 711,445 |
| Nissan Motor | | 193,200 | | 2,109,907 |
| ORIX | | 1,120 | | 273,493 |
| Ricoh | | 91,300 | | 1,790,743 |
| Rinnai | | 31,900 | | 844,461 |
| Rohm | | 28,400 | | 2,538,284 |
| Sekisui Chemical | | 201,500 | | 1,739,315 |
| Sekisui House | | 125,400 | | 1,721,155 |
| SFCG | | 3,508 | | 796,855 |
| Shinsei Bank | | 240,000 | | 1,520,182 |
| Sumitomo Mitsui Financial Group | | 238 | | 2,515,988 |
| Takefuji | | 33,870 | | 2,018,115 |
| TDK | | 19,400 | | 1,474,576 |
| Toyoda Gosei | | 33,300 | | 667,687 |
| | | | | 47,659,901 |
| Mexico—1.0% | | | | |
| Coca-Cola Femsa, ADR | | 25,600 | | 755,712 |
| Telefonos de Mexico, ADR | | 47,472 | | 988,842 |
| | | | | 1,744,554 |
The Portfolio 9
STATEMENT OF INVESTMENTS (Unaudited) (continued)
| Common Stocks (continued) | | Shares | | Value ($) |
| |
| |
|
| Netherlands—4.9% | | | | |
| ABN AMRO Holding | | 60,177 | | 1,646,311 |
| Aegon | | 74,740 | | 1,278,071 |
| Heineken | | 33,939 | | 1,438,975 |
| Koninklijke Philips Electronics | | 58,850 | | 1,838,825 |
| Royal Dutch Shell, Cl. A | | 77,993 | | 2,623,505 |
| Wolters Kluwer | | 5,405 | | 127,683 |
| | | | | 8,953,370 |
| Singapore—2.4% | | | | |
| DBS Group Holdings | | 221,930 | | 2,537,064 |
| United Overseas Bank | | 184,000 | | 1,812,922 |
| | | | | 4,349,986 |
| South Africa—.4% | | | | |
| Nedbank Group | | 42,517 | | 672,511 |
| South Korea—1.2% | | | | |
| Korea Electric Power, ADR | | 37,640 | | 713,654 |
| KT, ADR | | 39,500 | | 847,275 |
| SK Telecom, ADR | | 30,450 | | 713,139 |
| | | | | 2,274,068 |
| Spain—2.3% | | | | |
| Banco Santander Central Hispano | | 66,590 | | 972,626 |
| Gamesa Corp Tecnologica | | 5,580 | | 119,613 |
| Gas Natural SDG | | 34,060 | | 1,039,843 |
| Repsol YPF | | 39,790 | | 1,139,459 |
| Repsol YPF, ADR | | 35,340 | | 991,640 |
| | | | | 4,263,181 |
| Sweden—.5% | | | | |
| Svenska Cellulosa, Cl. B | | 21,830 | | 902,166 |
| Switzerland—6.7% | | | | |
| Ciba Specialty Chemicals | | 37,116 | | 2,067,562 |
| Clariant | | 52,460 | | 743,977 |
| Nestle | | 9,325 | | 2,926,925 |
| Novartis | | 42,510 | | 2,300,280 |
| Common Stocks (continued) | | Shares | | Value ($) |
| |
| |
|
| Switzerland (continued) | | | | |
| Swiss Reinsurance | | 32,260 | | 2,253,243 |
| UBS | | 18,500 | | 2,026,320 |
| | | | | 12,318,307 |
| Taiwan—.6% | | | | |
| United Microelectronics, ADR | | 338,099 | | 1,051,488 |
| United Kingdom—17.5% | | | | |
| Anglo American | | 52,963 | | 2,170,764 |
| Barclays | | 65,977 | | 749,192 |
| Boots Group | | 37,433 | | 532,282 |
| BP | | 229,441 | | 2,673,219 |
| BT Group | | 160,681 | | 710,387 |
| Cadbury Schweppes | | 4,900 | | 47,220 |
| Centrica | | 339,120 | | 1,787,547 |
| Debenhams | | 192,440 a | | 668,547 |
| Diageo | | 49,111 | | 825,391 |
| GKN | | 131,381 | | 662,787 |
| GlaxoSmithKline | | 119,977 | | 3,349,970 |
| HBOS | | 91,440 | | 1,588,337 |
| HSBC Holdings | | 109,170 | | 1,919,511 |
| Reed Elsevier | | 161,020 | | 1,624,617 |
| Rentokil Initial | | 355,360 | | 1,024,405 |
| Royal Bank of Scotland Group | | 87,553 | | 2,876,612 |
| Royal Dutch Shell, Cl. A | | 10,750 | | 361,542 |
| Sainsbury (J) | | 133,925 | | 827,821 |
| Smiths Group | | 84,420 | | 1,389,957 |
| Travis Perkins | | 10,440 | | 291,889 |
| Trinity Mirror | | 120,580 | | 1,087,361 |
| Unilever | | 105,345 | | 2,367,151 |
| Vodafone Group | | 1,212,022 | | 2,581,249 |
| | | | | 32,117,758 |
| Total Common Stocks | | | | |
| (cost $151,255,902) | | | | 172,831,446 |
The Portfolio 11
STATEMENT OF INVESTMENTS (Unaudited) (continued)
| Other Investment—3.0% | | | | Shares | | Value ($) |
| |
| |
| |
|
| Registered Investment Company; | | | | |
| Dreyfus Institutional Preferred Plus Money Market Fund | | |
| (cost $5,560,000) | | | | 5,560,000 b | | 5,560,000 |
| |
| |
| |
|
| |
| Total Investments (cost $156,815,902) | | 97.4% | | 178,391,446 |
| |
| Cash and Receivables (Net) | | | | 2.6% | | 4,770,107 |
| |
| Net Assets | | | | 100.0% | | 183,161,553 |
| |
| ADR—American Depository Receipts | | | | |
| a | | Non-income producing security. | | | | | | |
| b | | Investment in affiliated money market mutual fund. | | | | |
| |
| |
| |
|
| |
| |
| |
| |
| Portfolio Summary (Unaudited) † | | | | |
| |
| | | | | Value (%) | | | | Value (%) |
| |
| |
| |
| |
|
| Financial | | 14.4 | | Information Technology | | 6.7 |
| Banking | | 13.0 | | Telecommunications | | 6.1 |
| Consumer Discretionary | | 12.5 | | Health Care | | 4.9 |
| Consumer Staples | | 10.6 | | Utilities | | 3.4 |
| Energy | | 8.0 | | Money Market Investment | | 3.0 |
| Industrials | | 8.0 | | | | |
| Materials | | 6.8 | | | | 97.4 |
| |
| † | | Based on net assets. | | | | | | |
| See notes to financial statements. | | | | | | |
STATEMENT OF ASSETS AND LIABILITIES
June 30, 2006 (Unaudited)
| | | Cost | | Value |
| |
| |
|
| Assets ($): | | | | |
| Investments in securities—See Statement of Investments: | | |
| Unaffiliated issuers | | 151,255,902 | | 172,831,446 |
| Affiliated issuers | | 5,560,000 | | 5,560,000 |
| Cash | | | | 905,580 |
| Cash denominated in foreign currencies | | 2,972,496 | | 2,987,316 |
| Receivable for investment securities sold | | | | 1,002,416 |
| Receivable for shares of Beneficial Interest subscribed | | 661,056 |
| Dividends and interest receivable | | | | 438,518 |
| Unrealized appreciation on forward currency exchange contracts—Note 4 | | 3,660 |
| Prepaid expenses | | | | 5,900 |
| | | | | 184,395,892 |
| |
| |
|
| Liabilities ($): | | | | |
| Due to The Dreyfus Corporation and affiliates—Note 3(b) | | 159,167 |
| Payable for investment securities purchased | | 969,525 |
| Payable for shares of Beneficial Interest redeemed | | 32,803 |
| Unrealized depreciation on forward currency exchange contracts—Note 4 | | 102 |
| Accrued expenses | | | | 72,742 |
| | | | | 1,234,339 |
| |
| |
|
| Net Assets ($) | | | | 183,161,553 |
| |
| |
|
| Composition of Net Assets ($): | | | | |
| Paid-in capital | | | | 149,471,337 |
| Accumulated undistributed investment income—net | | 1,909,056 |
| Accumulated net realized gain (loss) on investments | | 10,188,907 |
| Accumulated net unrealized appreciation (depreciation) | | |
| on investments and foreign currency transactions | | 21,592,253 |
| |
|
| Net Assets ($) | | | | 183,161,553 |
| |
| |
|
| |
| |
| Net Asset Value Per Share | | | | |
| | | Initial Shares | | Service Shares |
| |
| |
|
| Net Assets ($) | | 114,539,906 | | 68,621,647 |
| Shares Outstanding | | 6,587,248 | | 3,948,554 |
| |
| |
|
| Net Asset Value Per Share ($) | | 17.39 | | 17.38 |
See notes to financial statements.
|
The Portfolio 13
STATEMENT OF OPERATIONS
Six Months Ended June 30, 2006 (Unaudited)
|
| Investment Income ($): | | |
| Income: | | |
| Cash dividends (net of $300,853 foreign taxes withheld at source): | | |
| Unaffiliated issuers | | 3,200,269 |
| Affiliated issuers | | 39,394 |
| Interest | | 52,488 |
| Total Income | | 3,292,151 |
| Expenses: | | |
| Investment advisory fee—Note 3(a) | | 836,860 |
| Custodian fees | | 111,183 |
| Distribution fees—Note 3(b) | | 77,945 |
| Professional fees | | 20,265 |
| Trustees’ fees and expenses—Note 3(c) | | 17,051 |
| Prospectus and shareholders’ reports | | 6,150 |
| Shareholder servicing costs—Note 3(b) | | 1,513 |
| Loan commitment fees—Note 2 | | 672 |
| Registration fees | | 664 |
| Miscellaneous | | 10,336 |
| Total Expenses | | 1,082,639 |
| Less—waiver of fees due to | | |
| undertaking—Note 3(a) | | (15,398) |
| Less—reduction in custody fees due to | | |
| earnings credits—Note 1(c) | | (20,311) |
| Net Expenses | | 1,046,930 |
| Investment Income—Net | | 2,245,221 |
| |
|
| Realized and Unrealized Gain (Loss) on Investments—Note 4 ($): |
| Net realized gain (loss) on investments and foreign currency transactions | | 11,692,691 |
| Net realized gain (loss) on forward currency exchange contracts | | (24,872) |
| Net Realized Gain (Loss) | | 11,667,819 |
| Net unrealized appreciation (depreciation) on investments | | |
| and foreign currency transactions | | (18,477) |
| Net Realized and Unrealized Gain (Loss) on Investments | | 11,649,342 |
| Net Increase in Net Assets Resulting from Operations | | 13,894,563 |
See notes to financial statements.
|
STATEMENT OF CHANGES IN NET ASSETS
| | | Six Months Ended | | |
| | | June 30, 2006 | | Year Ended |
| | | (Unaudited) | | December 31, 2005 |
| |
| |
|
| Operations ($): | | | | |
| Investment income—net | | 2,245,221 | | 1,757,635 |
| Net realized gain (loss) on investments | | 11,667,819 | | 14,093,737 |
| Net unrealized appreciation | | | | |
| (depreciation) on investments | | (18,477) | | (669,066) |
| Net Increase (Decrease) in Net Assets | | | | |
| Resulting from Operations | | 13,894,563 | | 15,182,306 |
| |
| |
|
| Dividends to Shareholders from ($): | | | | |
| Investment income—net: | | | | |
| Initial shares | | (1,436,717) | | — |
| Service shares | | (774,661) | | — |
| Net realized gain on investments: | | | | |
| Initial shares | | (8,117,897) | | (1,331,789) |
| Service shares | | (4,855,489) | | (527,874) |
| Total Dividends | | (15,184,764) | | (1,859,663) |
| |
| |
|
| Beneficial Interest Transactions ($): | | | | |
| Net proceeds from shares sold: | | | | |
| Initial shares | | 27,432,681 | | 37,251,329 |
| Service shares | | 17,916,522 | | 25,773,157 |
| Dividends reinvested: | | | | |
| Initial shares | | 9,554,614 | | 1,331,789 |
| Service shares | | 5,630,150 | | 527,874 |
| Cost of shares redeemed: | | | | |
| Initial shares | | (16,796,156) | | (40,886,960) |
| Service shares | | (8,528,912) | | (10,908,937) |
| Increase (Decrease) in Net Assets from | | | | |
| Beneficial Interest Transactions | | 35,208,899 | | 13,088,252 |
| Total Increase (Decrease) in Net Assets | | 33,918,698 | | 26,410,895 |
| |
| |
|
| Net Assets ($): | | | | |
| Beginning of Period | | 149,242,855 | | 122,831,960 |
| End of Period | | 183,161,553 | | 149,242,855 |
| Undistributed investment income—net | | 1,909,056 | | 1,875,213 |
The Portfolio 15
STATEMENT OF CHANGES IN NET ASSETS (continued)
|
| | | Six Months Ended | | |
| | | June 30, 2006 | | Year Ended |
| | | (Unaudited) | | December 31, 2005 |
| |
| |
|
| Capital Share Transactions: | | | | |
| Initial Shares | | | | |
| Shares sold | | 1,534,872 | | 2,332,353 |
| Shares issued for dividends reinvested | | 552,929 | | 85,481 |
| Shares redeemed | | (932,731) | | (2,584,421) |
| Net Increase (Decrease) in Shares Outstanding | | 1,155,070 | | (166,587) |
| |
| |
|
| Service Shares | | | | |
| Shares sold | | 1,001,065 | | 1,598,408 |
| Shares issued for dividends reinvested | | 325,819 | | 33,860 |
| Shares redeemed | | (483,788) | | (677,869) |
| Net Increase (Decrease) in Shares Outstanding | | 843,096 | | 954,399 |
See notes to financial statements.
|
The following tables describe the performance for each share class for the fiscal periods indicated. All information (except portfolio turnover rate) reflects financial results for a single portfolio share.Total return shows how much your investment in the portfolio would have increased (or decreased) during each period, assuming you had reinvested all dividends and distributions.These figures have been derived from the portfolio’s financial statements.
| | | Six Months Ended | | | | | | | | |
| | | June 30, 2006 | | Year Ended December 31, | | |
| | | |
| |
| |
|
| Initial Shares | | (Unaudited) | | 2005 | | 2004 | | 2003 | | 2002 | | 2001 |
| |
| |
| |
| |
| |
| |
|
| Per Share Data ($): | | | | | | | | | | | | |
| Net asset value, | | | | | | | | | | | | |
| beginning of period | | 17.49 | | 15.85 | | 13.54 | | 10.04 | | 11.56 | | 13.52 |
| Investment Operations: | | | | | | | | | | | | |
| Investment income—net a | | .25 | | .22 | | .16 | | .12 | | .12 | | .12 |
| Net realized and unrealized | | | | | | | | | | | | |
| gain (loss) on investments | | 1.37 | | 1.64 | | 2.54 | | 3.51 | | (1.53) | | (1.90) |
| Total from Investment Operations 1.62 | | 1.86 | | 2.70 | | 3.63 | | (1.41) | | (1.78) |
| Distributions: | | | | | | | | | | | | |
| Dividends from investment | | | | | | | | | | | | |
| income—net | | (.26) | | — | | (.16) | | (.13) | | (.11) | | (.11) |
| Dividends from net realized | | | | | | | | | | | | |
| gain on investments | | (1.46) | | (.22) | | (.23) | | — | | — | | — |
| Dividends in excess of net | | | | | | | | | | | | |
| realized gain on investments | | — | | — | | — | | — | | — | | (.07) |
| Total Distributions | | (1.72) | | (.22) | | (.39) | | (.13) | | (.11) | | (.18) |
| Net asset value, end of period | | 17.39 | | 17.49 | | 15.85 | | 13.54 | | 10.04 | | 11.56 |
| |
| |
| |
| |
| |
| |
|
| Total Return (%) | | 9.33b | | 11.89 | | 20.02 | | 36.36 | | (12.23) | | (13.22) |
| |
| |
| |
| |
| |
| |
|
| Ratios/Supplemental Data (%): | | | | | | | | | | |
| Ratio of total expenses | | | | | | | | | | | | |
| to average net assets | | .60b | | 1.20 | | 1.25 | | 1.49 | | 1.47 | | 1.60 |
| Ratio of net expenses | | | | | | | | | | | | |
| to average net assets | | .58b | | 1.17 | | 1.24 | | 1.41 | | 1.40 | | 1.40 |
| Ratio of net investment income | | | | | | | | | | |
| to average net assets | | 1.36b | | 1.39 | | 1.08 | | 1.11 | | 1.10 | | .97 |
| Portfolio Turnover Rate | | 25.63b | | 54.32 | | 44.05 | | 107.73 | | 47.18 | | 49.34 |
| |
| |
| |
| |
| |
| |
|
| Net Assets, end of period | | | | | | | | | | | | |
| ($ x 1,000) | | 114,540 | | 94,988 | | 88,713 | | 58,849 | | 27,549 | | 21,602 |
| |
| a | | Based on average shares outstanding at each month end. | | | | | | | | |
| b | | Not annualized. | | | | | | | | | | | | |
| See notes to financial statements. | | | | | | | | | | | | |
The Portfolio 17
FINANCIAL HIGHLIGHTS (continued)
|
| | | Six Months Ended | | | | | | | | |
| | | June 30, 2006 | | Year Ended December 31, | | |
| | | |
| |
| |
|
| Service Shares | | (Unaudited) | | 2005 | | 2004 | | 2003 | | 2002 | | 2001 |
| |
| |
| |
| |
| |
| |
|
| Per Share Data ($): | | | | | | | | | | | | |
| Net asset value, | | | | | | | | | | | | |
| beginning of period | | 17.47 | | 15.86 | | 13.56 | | 10.06 | | 11.58 | | 13.52 |
| Investment Operations: | | | | | | | | | | | | |
| Investment income—net a | | .23 | | .18 | | .06 | | .14 | | .12 | | .05 |
| Net realized and unrealized | | | | | | | | | | | | |
| gain (loss) on investments | | 1.37 | | 1.65 | | 2.62 | | 3.49 | | (1.54) | | (1.81) |
| Total from Investment Operations 1.60 | | 1.83 | | 2.68 | | 3.63 | | (1.42) | | (1.76) |
| Distributions: | | | | | | | | | | | | |
| Dividends from investment | | | | | | | | | | | | |
| income—net | | (.23) | | — | | (.15) | | (.13) | | (.10) | | (.11) |
| Dividends from net realized | | | | | | | | | | | | |
| gain on investments | | (1.46) | | (.22) | | (.23) | | — | | — | | — |
| Dividends in excess of net | | | | | | | | | | | | |
| realized gain on investments | | — | | — | | — | | — | | — | | (.07) |
| Total Distributions | | (1.69) | | (.22) | | (.38) | | (.13) | | (.10) | | (.18) |
| Net asset value, end of period | | 17.38 | | 17.47 | | 15.86 | | 13.56 | | 10.06 | | 11.58 |
| |
| |
| |
| |
| |
| |
|
| Total Return (%) | | 9.25b | | 11.69 | | 19.83 | | 36.28 | | (12.25) | | (13.07) |
| |
| |
| |
| |
| |
| |
|
| Ratios/Supplemental Data (%): | | | | | | | | | | |
| Ratio of total expenses | | | | | | | | | | | | |
| to average net assets | | .72b | | 1.45 | | 1.49 | | 1.75 | | 1.66 | | 1.99 |
| Ratio of net expenses | | | | | | | | | | | | |
| to average net assets | | .68b | | 1.36 | | 1.39 | | 1.41 | | 1.40 | | 1.40 |
| Ratio of net investment income | | | | | | | | | | |
| to average net assets | | 1.27b | | 1.10 | | .44 | | 1.29 | | 1.07 | | .44 |
| Portfolio Turnover Rate | | 25.63b | | 54.32 | | 44.05 | | 107.73 | | 47.18 | | 49.34 |
| |
| |
| |
| |
| |
| |
|
| Net Assets, end of period | | | | | | | | | | | | |
| ($ x 1,000) | | 68,622 | | 54,255 | | 34,119 | | 6,713 | | 4,441 | | 2,148 |
| |
| a | | Based on average shares outstanding at each month end. | | | | | | | | |
| b | | Not annualized. | | | | | | | | | | | | |
| See notes to financial statements. | | | | | | | | | | | | |
| |
| |
| 18 | | | | | | | | | | | | | | |
NOTES TO FINANCIAL STATEMENTS (Unaudited)
NOTE 1—Significant Accounting Policies:
Dreyfus Variable Investment Fund (the “fund”) is registered under the Investment Company Act of 1940, as amended (the “Act”), as an open-end management investment company, operating as a series company currently offering twelve series, including the International Value Portfolio (the “portfolio”). The portfolio is only offered to separate accounts established by insurance companies to fund variable annuity contracts and variable life insurance policies.The portfolio is a diversified series. The portfolio’s investment objective is long-term capital growth.The Dreyfus Corporation (the “Manager” or “Dreyfus”) serves as the portfolio’s investment adviser. The Manager is a wholly-owned subsidiary of Mellon Financial Corporation (“Mellon Financial”).
Dreyfus Service Corporation (the “Distributor”), a wholly-owned subsidiary of the Manager, is the distributor of the portfolio’s shares, which are sold without a sales charge.The portfolio is authorized to issue an unlimited number of $.001 par value shares of Beneficial Interest in each of the following classes of shares: Initial and Service. Each class of shares has identical rights and privileges, except with respect to the distribution plan and the expenses borne by each class and certain voting rights. Income, expenses (other than expenses attributable to a specific class), and realized and unrealized gains or losses on investments are allocated to each class of shares based on its relative net assets.
The fund accounts separately for the assets, liabilities and operations of each series. Expenses directly attributable to each series are charged to that series’ operations; expenses which are applicable to all series are allocated among them on a pro rata basis.
The portfolio’s financial statements are prepared in accordance with U.S. generally accepted accounting principles, which may require the use of management estimates and assumptions.Actual results could differ from those estimates.
The Portfolio 19
NOTES TO FINANCIAL STATEMENTS (Unaudited) (continued)
The fund enters into contracts that contain a variety of indemnifica-tions.The portfolio’s maximum exposure under these arrangements is unknown. The portfolio does not anticipate recognizing any loss related to these arrangements.
(a) Portfolio valuation: Investments in securities are valued at the last sales price on the securities exchange or national securities market on which such securities are primarily traded. Securities listed on the National Market System for which market quotations are available are valued at the official closing price or, if there is no official closing price that day, at the last sales price. Securities not listed on an exchange or the national securities market, or securities for which there were no transactions, are valued at the average of the most recent bid and asked prices, except for open short positions, where the asked price is used for valuation purposes. Bid price is used when no asked price is available. Investments in registered investment companies are valued at their net asset value.When market quotations or official closing prices are not readily available, or are determined not to reflect accurately fair value, such as when the value of a security has been significantly affected by events after the close of the exchange or market on which the security is principally traded (for example, a foreign exchange or market), but before the portfolio calculates its net asset value, the portfolio may value these investments at fair value as determined in accordance with the procedures approved by the Board of Trustees. Fair valuing of securities may be determined with the assistance of a pricing service using calculations based on indices of domestic securities and other appropriate indicators, such as prices of relevant ADR’s and futures contracts. For other securities that are fair valued by the Board of Trustees, certain factors may be considered such as: fundamental analytical data, the nature and duration of restrictions on disposition, an evaluation of the forces that influence the market in which the securities are purchased and sold and public trading in similar securities of the issuer or comparable issuers. Financial futures are valued at the last sales price. Investments denominated in foreign currencies are translated to U.S. dollars at the prevailing rates of exchange. Forward currency exchange contracts are valued at the forward rate.
(b) Foreign currency transactions: The portfolio does not isolate that portion of the results of operations resulting from changes in foreign exchange rates on investments from the fluctuations arising from changes in market prices of securities held. Such fluctuations are included with the net realized and unrealized gain or loss on investments.
Net realized foreign exchange gains or losses arise from sales and maturities of short-term securities, sales of foreign currencies, currency gains or losses realized on securities transactions and the difference between the amounts of dividends, interest and foreign withholding taxes recorded on the portfolio’s books and the U.S. dollar equivalent of the amounts actually received or paid. Net unrealized foreign exchange gains or losses arise from changes in the value of assets and liabilities other than investments in securities, resulting from changes in exchange rates. Such gains and losses are included with net realized and unrealized gain or loss on investments.
(c) Securities transactions and investment income: Securities transactions are recorded on a trade date basis. Realized gain and loss from securities transactions are recorded on the identified cost basis. Dividend income is recognized on the ex-dividend date and interest income, including, where applicable, accretion of discount and amortization of premium on investments, is recognized on the accrual basis.
The portfolio has an arrangement with the custodian bank whereby the portfolio receives earnings credits from the custodian when positive cash balances are maintained, which are used to offset custody fees. For financial reporting purposes, the portfolio includes net earnings credits as an expense offset in the Statement of Operations.
(d) Affiliated issuers: Investments in other investment companies advised by the Manager are defined as “affiliated” in the Act.
(e) Dividends to shareholders: Dividends are recorded on the ex-dividend date. Dividends from investment income-net and dividends from net realized capital gain, if any, are normally declared and paid annually, but the portfolio may make distributions on a more frequent basis to comply with the distribution requirements of the Internal
The Portfolio 21
NOTES TO FINANCIAL STATEMENTS (Unaudited) (continued)
Revenue Code of 1986, as amended (the “Code”).To the extent that net realized capital gain can be offset by capital loss carryovers, if any, it is the policy of the portfolio not to distribute such gain. Income and capital gain distributions are determined in accordance with income tax regulations, which may differ from U.S. generally accepted accounting principles.
(f) Federal income taxes: It is the policy of the portfolio to continue to qualify as a regulated investment company, if such qualification is in the best interests of its shareholders, by complying with the applicable provisions of the Code, and to make distributions of taxable income sufficient to relieve it from substantially all federal income and excise taxes.
The tax character of distributions paid to shareholders during the fiscal year ended December 31, 2005 were as follows: ordinary income $639,526 and long-term capital gains $1,220,137.The tax character of current year distributions will be determined at the end of the current fiscal year.
NOTE 2—Bank Line of Credit:
|
The portfolio participates with other Dreyfus-managed funds in a $350 million redemption credit facility (the “Facility”) to be utilized for temporary or emergency purposes, including the financing of redemptions. In connection therewith, the portfolio has agreed to pay commitment fees on its pro rata portion of the Facility. Interest is charged to the portfolio based on prevailing market rates in effect at the time of borrowing. During the period ended June 30, 2006, the portfolio did not borrow under the Facility.
NOTE 3—Investment Advisory Fee and Other Transactions With Affiliates:
(a) Pursuant to an Investment Advisory Agreement with the Manager, the investment advisory fee is computed at the annual rate of 1% of the value of the portfolio’s average daily net assets and is payable monthly.
The Manager has agreed, from January 1, 2006 to December 31, 2006, to waive receipt of its fees and/or assume the expenses of the portfolio so that the expenses of neither class, exclusive of taxes, brokerage fees, interest on borrowings, commitment fees and extraordinary expenses, exceed an annual rate of 1.40% of the value of the average daily net assets of their class. During the period ended June 30, 2006, the Manager waived receipt of fees of $15,398, pursuant to the undertaking.
(b) Under the Distribution Plan (the “Plan”) adopted pursuant to Rule 12b-1 under the Act, Service shares pay the Distributor for distributing their shares, for servicing and/or maintaining Service shares shareholder accounts and for advertising and marketing for Service shares.The Plan provides for payments to be made at an annual rate of .25% of the value of the Service shares’ average daily net assets.The Distributor may make payments to Participating Insurance Companies and to brokers and dealers acting as principal underwriter for their variable insurance products.The fees payable under the Plan are payable without regard to actual expenses incurred. During the period ended June 30, 2006, Service shares were charged $77,945 pursuant to the Plan.
The portfolio compensates Dreyfus Transfer, Inc., a wholly-owned subsidiary of the Manager, under a transfer agency agreement for providing personnel and facilities to perform transfer agency services for the portfolio. During the period ended June 30, 2006, the portfolio was charged $215 pursuant to the transfer agency agreement.
During the period ended June 30, 2006, the portfolio was charged $1,926 for services performed by the Chief Compliance Officer.
The components of Due to The Dreyfus Corporation and affiliates in the Statement of Assets and Liabilities consist of: investment advisory fees $144,541, Rule 12b-1 distribution plan fees $13,592, chief compliance officer fees $1,926 and transfer agency per account fees $68, which are offset against an expense reimbursement currently in effect in the amount of $960.
The Portfolio 23
NOTES TO FINANCIAL STATEMENTS (Unaudited) (continued)
(c) Each Board member also serves as a Board member of other funds within the Dreyfus complex. Annual retainer fees and attendance fees are allocated to each fund based on net assets.
(d) Pursuant to an exemptive order from the SEC, the portfolio may invest its available cash balances in affiliated money market mutual funds. Management fees of the underlying money market mutual funds have been waived by the Manager.
NOTE 4—Securities Transactions:
|
The aggregate amount of purchases and sales of investment securities, excluding short-term securities and forward currency exchange contracts, during the period ended June 30, 2006, amounted to $57,704,670 and $41,348,556, respectively.
The portfolio enters into forward currency exchange contracts in order to hedge its exposure to changes in foreign currency exchange rates on its foreign portfolio holdings and to settle foreign currency transactions. When executing forward currency exchange contracts, the portfolio is obligated to buy or sell a foreign currency at a specified rate on a certain date in the future.With respect to sales of forward currency exchange contracts, the portfolio would incur a loss if the value of the contract increases between the date the forward contract is opened and the date the forward contract is closed.The portfolio realizes a gain if the value of the contract decreases between those dates.With respect to purchases of forward currency exchange contracts, the portfolio would incur a loss if the value of the contract decreases between the date the forward contract is opened and the date the forward contract is closed.The portfolio realizes a gain if the value of the contract increases between those dates.The portfolio is also exposed to credit risk associated with counterparty nonperformance on these forward currency exchange contracts which is typically limited
to the unrealized gain on each open contract.The following summarizes open forward currency exchange contracts at June 30, 2006:
| | | Foreign | | | | | | Unrealized |
| Forward Currency | | Currency | | | | | | Appreciation |
| Exchange Contracts | | Amounts | | Cost ($) | | Value ($) | | (Depreciation) ($) |
| |
| |
| |
| |
|
| Purchases: | | | | | | | | |
| Australian Dollar, | | | | | | | | |
| expiring 7/3/2006 | | 103,709 | | 77,183 | | 77,087 | | (96) |
| Japanese Yen, | | | | | | | | |
| expiring 7/3/2006 | | 29,840,000 | | 257,042 | | 260,702 | | 3,660 |
| Sales; | | | | Proceeds ($) | | | | |
| Hong Kong Dollar, | | | | | | | | |
| expiring 7/3/2006 | | 163,235 | | 21,012 | | 21,018 | | (6) |
| Total | | | | | | | | 3,558 |
At June 30, 2006, accumulated net unrealized appreciation on investments was $21,575,544, consisting of $25,232,102 gross unrealized appreciation and $3,656,558 gross unrealized depreciation.
At June 30, 2006, the cost of investments for federal income tax purposes was substantially the same as the cost for financial reporting purposes (see the Statement of Investments).
The Portfolio 25
PROXY RESULTS ( U n a u d i t e d )
|
Dreyfus Variable Investment Fund held a special meeting of shareholders on June 29, 2006.The proposal considered at the meeting, and the results, are as follows:
| | | | | Shares | | |
| |
| |
| |
|
| | | For | | | | Authority Withheld |
| |
| |
| |
|
| To elect additional Board Members: | | | | | | |
| Peggy C. Davis † | | 171,078,926.558 | | | | 7,687,714.085 |
| Joseph S. DiMartino | | 170,946,484.400 | | | | 7,820,156.243 |
| David P. Feldman | | 170,959,920.714 | | | | 7,806,719.929 |
| Ehud Houminer † | | 170,132,086.682 | | | | 8,634,553.961 |
| Gloria Messinger † | | 170,187,240.710 | | | | 8,579,399.933 |
| Anne Wexler † | | 170,212,607.472 | | | | 8,554,033.171 |
| † Each will serve as an Independent Board member of the fund commencing, subject to the discretion of the Board, on |
| or about January 1, 2007. |
| In addition to Joseph S. DiMartino and David P. Feldman, James F. Henry, Dr. Paul A. Marks and Dr. Martin |
| Peretz continue as Board members of the fund. |
INFORMATION ABOUT THE REVIEW AND APPROVAL OF THE PORTFOLIO’S
I N V E S T M E N T A D V I S O R Y A G R E E M E N T (Unaudited)
At a meeting of the fund’s Board of Trustees held on June 7 and 8, 2006, the Board considered the re-approval for an annual period (through July 31, 2007) of the fund’s Investment Advisory Agreement with Dreyfus for the portfolio, pursuant to which Dreyfus provides the portfolio with investment advisory and administrative services. The Board members, none of whom are “interested persons” (as defined in the Investment Company Act of 1940, as amended) of the fund were assisted in their review by independent legal counsel and met with counsel in executive session separate from representatives of Dreyfus.
Analysis of Nature, Extent and Quality of Services Provided to the Portfolio. The Board members received a presentation from representatives of Dreyfus regarding services provided to the portfolio and other funds in the Dreyfus fund complex, and discussed the nature, extent and quality of the services provided to the portfolio pursuant to its Investment Advisory Agreement. Dreyfus’ representatives reviewed the portfolio’s distribution of accounts and the relationships Dreyfus has with various intermediaries and the different needs of each.The Board noted that the portfolio’s shares were offered only to separate accounts established by insurance companies to fund variable annuity contracts and variable life insurance policies. Dreyfus’ representatives noted the diversity of distribution among the funds in the Dreyfus fund complex, and Dreyfus’ corresponding need for broad, deep, and diverse resources to be able to provide ongoing shareholder services to each distribution channel, including that of the portfolio. Dreyfus also provided the number of separate accounts investing in the portfolio, as well as the portfolio’s asset size.
The Board members also considered Dreyfus’ research and portfolio management capabilities and that Dreyfus also provides oversight of day-to-day portfolio operations, including fund accounting and administration and assistance in meeting legal and regulatory require-ments.The Board members also considered Dreyfus’ extensive administrative, accounting and compliance infrastructure.
The Portfolio 27
I N FO R M AT I O N A B O U T T H E R E V I E W A N D A P P R OVA L O F T H E P O R T FO L I O ’ S I N V E S T M E N T A DV I S O RY A G R E E M E N T ( U n a u d i t e d ) ( c o n t i n u e d )
Comparative Analysis of the Portfolio’s Performance,Advisory Fee and Expense Ratio. The Board members reviewed the portfolio’s performance and placed significant emphasis on comparisons to a group of international value funds underlying variable insurance products (the “Performance Group”) and to a larger universe of funds, consisting of all international value funds underlying variable insurance products (the “Performance Universe”) selected and provided by Lipper, Inc., an independent provider of investment company data.The Board was provided with a description of the methodology Lipper used to select the Performance Group and Performance Universe, as well as the Expense Group and Expense Universe (discussed below). The Board members discussed the results of the comparisons for various periods ended April 30, 2006, and noted that the portfolio’s total return performance for its Initial shares variously was at or below the Performance Group median for each of the periods and at, below or above the Performance Universe medians. The Board noted the portfolio’s attractive absolute return in recent periods and that in certain periods when performance was below median the spread between median and the portfolio’s performance was relatively narrow on a percentage basis.The Dreyfus representatives noted that, because of the portfolio manager’s investment approach, the portfolio’s relative performance has historically tended to be better in down markets than in up markets and reviewed calendar year performance relative to the portfolio’s benchmark. Dreyfus also provided the Board with the portfolio’s total return performance and the quartile, percentile and rank of the portfolio’s total return within its Lipper category (as provided by Lipper) for certain other periods ended April 30, 2006, and noted that they were generally consistent with the relative total return information provided by Lipper.
The Board members also discussed the portfolio’s advisory fee and expense ratio for each class of shares and reviewed the range of advisory fees and expense ratios of a comparable group of funds (the “Expense Group”) and a broader group of funds (the “Expense Universe”), each selected and provided by Lipper. The Board members noted that the portfolio’s advisory fee was higher than its Expense Group and Expense
Universe medians, and that the expense ratios for the Initial shares and the Service shares were higher than the Expense Group and the Expense Universe medians.The Board members noted Dreyfus’ current undertaking to waive or reimburse certain fees and expenses, which reduced the expense ratio for the portfolio’s Service shares.
Representatives of Dreyfus stated that there are no other mutual funds managed by Dreyfus or its affiliates with similar investment objectives, policies and strategies and included within the portfolio’s Lipper category. Representatives of Dreyfus reviewed with the Board members the fees paid by other accounts managed by Dreyfus or its affiliates with similar investment objectives, policies and strategies as the portfolio (the “Similar Accounts”). Dreyfus’ representatives explained the nature of the Similar Accounts and the differences, from Dreyfus’ perspective, in providing services to such Similar Accounts as compared to managing and providing services to the portfolio. Dreyfus’ representatives also reviewed the costs associated with distribution through inter-mediaries.The Board analyzed differences in fees paid to Dreyfus and discussed the relationship of the fees paid in light of the services pro-vided.The Board members considered the relevance of the fee information provided for the Similar Accounts to evaluate the appropriateness and reasonableness of the portfolio’s investment advisory fee.The Board acknowledged that differences in fees paid by the Similar Accounts seemed to be consistent with the services provided.
Analysis of Profitability and Economies of Scale. Dreyfus’ representatives reviewed the dollar amount of expenses allocated and profit received by Dreyfus and the method used to determine such expenses and profit.The Board considered information, previously provided and discussed, prepared by an independent consulting firm regarding Dreyfus’ approach to allocating costs to, and determining the profitability of, individual funds and the entire Dreyfus mutual fund complex. The Board members also considered that the methodology had also been reviewed by an independent registered public accounting firm which, like the consultant, found the methodology to be reasonable.
The Portfolio 29
I N FO R M AT I O N A B O U T T H E R E V I E W A N D A P P R OVA L O F T H E P O R T FO L I O ’ S I N V E S T M E N T A DV I S O RY A G R E E M E N T ( U n a u d i t e d ) ( c o n t i n u e d )
The consulting firm also analyzed where any economies of scale might emerge in connection with the management of the portfolio. The Board members evaluated the profitability analysis in light of the relevant circumstances for the portfolio and the extent to which economies of scale would be realized if the portfolio grows and whether fee levels reflect these economies of scale for the benefit of portfolio investors. The Board members also considered potential benefits to Dreyfus from acting as investment adviser and noted that there were no soft dollar arrangements with respect to trading the portfolio’s investments.
It was noted that the Board members should consider Dreyfus’ profitability with respect to the portfolio as part of their evaluation of whether the fees under the Investment Advisory Agreement bear a reasonable relationship to the mix of services provided by Dreyfus, including the nature, extent and quality of such services and that a discussion of economies of scale is predicated on increasing assets and that, if a fund’s assets had been decreasing, the possibility that Dreyfus may have realized any economies of scale would be less. It also was noted that the profitability percentage for managing the portfolio was within ranges determined by appropriate court cases to be reasonable given the services rendered and generally superior service levels provided by Dreyfus. The Board also noted the fee waiver and expense reimbursement arrangement and its effect on Dreyfus’ profitability.
At the conclusion of these discussions, the Board agreed that it had been furnished with sufficient information to make an informed business decision with respect to continuation of the Investment Advisory Agreement, with respect to the portfolio. Based on the discussions and considerations as described above, the Board made the following conclusions and determinations.
- The Board concluded that the nature, extent and quality of the ser- vices provided by Dreyfus are adequate and appropriate.
- The Board generally was satisfied with the portfolio’s overall perfor- mance evaluated on an absolute basis and in light of the portfolio manager’s investment approach as discussed above.
- The Board concluded that the fee paid by the portfolio to Dreyfus was reasonable in light of the services provided, comparative perfor- mance, expense and advisory fee information, including Dreyfus’ undertaking to waive or reimburse certain fees and expenses (which reduced the expense ratio of the Service shares), costs of the services provided and profits to be realized and benefits derived or to be derived by Dreyfus from its relationship with the portfolio.
- The Board determined that the economies of scale which may accrue to Dreyfus and its affiliates in connection with the management of the portfolio had been adequately considered by Dreyfus in connection with the advisory fee rate charged to the portfolio and that, to the extent in the future it were determined that material economies of scale had not been shared with the portfolio, the Board would seek to have those economies of scale shared with the portfolio.
The Board members considered these conclusions and determinations, along with information received on a routine and regular basis throughout the year, and, without any one factor being dispositive, the Board determined that re-approval of the portfolio’s Investment Advisory Agreement was in the best interests of the portfolio and its shareholders.
The Portfolio 31
NOTES
| Dreyfus Variable |
| Investment Fund, |
| International Value Portfolio |
| 200 Park Avenue |
| New York, NY 10166 |
| |
| Investment Adviser |
| The Dreyfus Corporation |
| 200 Park Avenue |
| New York, NY 10166 |
| |
| Custodian |
| The Bank of New York |
| One Wall Street |
| New York, NY 10286 |
| Transfer Agent & |
| Dividend Disbursing Agent |
| Dreyfus Transfer, Inc. |
| 200 Park Avenue |
| New York, NY 10166 |
| |
| Distributor |
| Dreyfus Service Corporation |
| 200 Park Avenue |
| New York, NY 10166 |
Telephone 1-800-554-4611 or 516-338-3300
Mail The Dreyfus Family of Funds, 144 Glenn Curtiss Boulevard, Uniondale, NY 11556-0144 Attn: Investments Division
The portfolio files its complete schedule of portfolio holdings with the Securities and Exchange Commission (“SEC”) for the first and third quarters of each fiscal year on Form N-Q. The portfolio’s Forms N-Q are available on the SEC’s website at http://www.sec.gov and may be reviewed and copied at the SEC’s Public Reference Room in Washington, DC. Information on the operation of the Public Reference Room may be obtained by calling 1-202-551-8090.
A description of the policies and procedures that the portfolio uses to determine how to vote proxies relating to portfolio securities, and information regarding how the portfolio voted these proxies for the 12-month period ended June 30, 2006, is available at http://www.dreyfus.com and on the SEC’s website at http://www.sec.gov. The description of the policies and procedures is also available without charge, upon request, by calling 1-800-645-6561.
| © 2006 Dreyfus Service Corporation |


The views expressed in this report reflect those of the portfolio manager only through the end of the period covered and do not necessarily represent the views of Dreyfus or any other person in the Dreyfus organization.Any such views are subject to change at any time based upon market or other conditions and Dreyfus disclaims any responsibility to update such views. These views may not be relied on as investment advice and, because investment decisions for a Dreyfus portfolio are based on numerous factors, may not be relied on as an indication of trading intent on behalf of any Dreyfus portfolio.
Not FDIC-Insured • Not Bank-Guaranteed • May Lose Value
| | | Contents |
| |
| | | T H E P O R T F O L I O |
| |
|
| 2 | | Letter from the Chairman |
| 3 | | Discussion of Performance |
| 6 | | Understanding Your Portfolio’s Expenses |
| 6 | | Comparing Your Portfolio’s Expenses |
| | | With Those of Other Funds |
| 7 | | Statement of Investments |
| 23 | | Statement of Assets and Liabilities |
| 24 | | Statement of Operations |
| 25 | | Statement of Changes in Net Assets |
| 27 | | Financial Highlights |
| 29 | | Notes to Financial Statements |
| 38 | | Proxy Results |
| 39 | | Information About the Review |
| and Approval of the Portfolio’s |
| Investment Advisory Agreement |
| | | F O R M O R E I N F O R M AT I O N |
| |
|
| | | Back Cover |
| Dreyfus Variable Investment Fund, |
| Limited Term High Yield Portfolio |

LETTER FROM THE CHAIRMAN
We are pleased to present this semiannual report for Dreyfus Variable Investment Fund, Limited Term High Yield Portfolio, covering the six-month period from January 1, 2006, through June 30, 2006.
After a long period of remarkable resilience, the U.S. bond market encountered heightened volatility during the first half of 2006,as investors reacted to each new release of economic data or comment from members of the Federal Reserve Board (the “Fed”). The economic data often painted a contradictory picture, sometimes suggesting that inflationary pressures were increasing and, at other times, seeming to point to milder economic growth.The Fed also sent mixed signals as investors attempted to determine whether the U.S. central bank might pause in its tightening campaign after seventeen consecutive rate hikes since June 2004.
In the judgment of our Chief Economist, Richard Hoey, the U.S. economy may be moving into a more mature, slower-growth phase. However, a number of economic uncertainties remain. Indicators to watch in the months ahead include the outlook for inflation, the extent of softness in the U.S. housing market, the impact of slower economic growth on consumer spending, additional changes in interest rates from the Fed and other central banks, and the strength of the U.S. dollar relative to other major currencies.As always, we encourage you to discuss these and other investment-related issues with your financial advisor, who can help you prepare for the challenges and opportunities that lie ahead.
For information about how the portfolio performed during the reporting period, as well as market perspectives, we have provided a Discussion of Performance given by the portfolio manager.
Thank you for your continued confidence and support.


DISCUSSION OF PERFORMANCE
Jonathan Uhrig, Portfolio Manager
How did Dreyfus Variable Investment Fund, Limited Term High Yield Portfolio perform during the period?
For the six-month period ended June 30, 2006, the portfolio’s Initial shares achieved a total return of 2.03%, and its Service shares achieved a total return of 1.93% .The portfolio generated aggregate income dividends of $0.27 for both its Initial shares and Service shares.1 In comparison, the Merrill Lynch U.S. High Yield Master II Constrained Index (the “Index”), achieved a total return of 2.53% for the same period.2
During the first half of the year,prices of high yield bonds were primarily affected by intensifying inflation fears, particularly during May and June. However, the high yield market delivered higher returns than most fixed-income sectors and was one of the few to outperform U.S.Treasury securities over the first half of 2006.The portfolio produced lower returns than its benchmark, primarily due to its focus on higher-quality credits during a period in which lower-quality bonds fared better.
What is the portfolio’s investment approach?
The portfolio seeks to maximize total return consisting of capital appreciation and current income. To pursue this goal, we normally invest at least 80% of the portfolio’s assets in fixed-income securities rated below investment grade (“high yield” or “junk” bonds).We may invest in various types of fixed-income securities, including corporate bonds and notes, mortgage-related securities, asset-backed securities, zero coupon securities, inflation-indexed bonds, convertible securities, preferred stocks and other debt securities of U.S. and foreign issuers.
In choosing securities, we seek to capture higher yields offered by junk bonds, while managing credit risk and the volatility caused by interest-rate movements.We seek to reduce interest-rate risk by maintaining an average effective portfolio maturity of 5.5 years or less, although there is no limit on the maturity of individual securities.
The Portfolio 3
DISCUSSION OF PERFORMANCE (continued)
|
Our investment process is based on fundamental credit research. We look at a variety of factors when assessing a potential investment, including the company’s financial strength, the state of the industry or sector it belongs to, the long-term fundamentals of that industry or sector, the company’s management, and whether there is sufficient equity value in the company.
What other factors influenced the portfolio’s performance?
Strong relative performance among lower-priced and lower-rated high yield bonds during the first six months of the year was led by previously battered industry groups, including the automotive, fixed-line telecommunications and airline areas.Although inflation and economic concerns caused most high yield bonds to experience price declines over the reporting period, their relatively generous coupons generally enabled them to deliver mildly positive total returns.
For the first four months of the reporting period, and as they had for some time, investors demonstrated an ample appetite for risk in an environment of robust economic growth. Beginning in May, however, a degree of risk aversion returned to the market as investors became more concerned about the potential effects of rising interest rates and mounting inflationary pressures on future business conditions. As a result, high yield bonds in the lower credit-rating categories fared slightly worse than higher-rated securities in June.
In anticipation of less favorable economic forces, we repositioned the portfolio to have less exposure to lower-rated credits. While this bias toward higher quality constrained performance early in the reporting period, it helped the portfolio weather the downturn more effectively. The portfolio did not participate in some of the better-performing areas of the market for the reporting period overall, as we avoided the bonds of airlines and troubled automakers General Motors and Ford Motor Company. However, we also avoided the poorer performers in the insurance and oil refining and marketing industries.
We took advantage of bouts of market weakness in June to purchase newly issued high yield bonds at attractive prices.The capital markets saw a surge in mergers-and-acquisitions activity in the spring, some of
which was financed in the high yield bond market. Weaker market fundamentals combined with favorable technical factors, notably a sharp increase in supply and weak demand from hedge funds, caused some high yield deals to be priced at lower levels and with stronger covenants than originally expected. Many of these new issues rallied soon after they came to market as investors sold seasoned credits and replaced them with newly issued bonds offering higher yields.
What is the portfolio’s current strategy?
We have maintained the portfolio’s relatively conservative credit positioning, which we believe will allow us to capture opportunities in the new issue market if pricing and terms remain favorable to investors.
Despite signs of a potential economic slowdown, credit conditions in the high yield market appear to be fundamentally stable. However, recent volatility in global equity and currency markets has the potential to adversely affect supply-and-demand forces in the U.S. high yield market.Therefore, we are monitoring economic developments carefully, and we are prepared to adjust our strategies as conditions change.
| | | The portfolio is only available as a funding vehicle under variable life insurance policies or variable |
| | | annuity contracts issued by insurance companies. Individuals may not purchase shares of these |
| | | portfolios directly. A variable annuity is an insurance contract issued by an insurance company that |
| | | enables investors to accumulate assets on a tax-deferred basis for retirement or other long-term |
| | | goals.The investment objective and policies of Dreyfus Variable Investment Fund, Limited Term |
| | | High Yield Portfolio may be similar to other funds/portfolios managed or advised by Dreyfus. |
| | | However, the investment results of the portfolio may be higher or lower than, and may not be |
| | | comparable to, those of any other Dreyfus fund/portfolio. |
| 1 | | Total return includes reinvestment of dividends and any capital gains paid. Past performance is no |
| | | guarantee of future results. Share price and investment return fluctuate such that upon redemption, |
| | | portfolio shares may be worth more or less than their original cost.The portfolio’s performance does |
| | | not reflect the deduction of additional charges and expenses imposed in connection with investing |
| | | in variable insurance contracts, which will reduce returns. Return figures provided reflect the |
| | | absorption of certain portfolio expenses by The Dreyfus Corporation pursuant to an agreement |
| | | that was in effect through o December 31, 2006, at which time it may be extended, modified or |
| | | terminated. Had these expenses not been absorbed, the portfolio’s returns would have been lower. |
| 2 | | SOURCE: BLOOMBERG — Reflects reinvestment of dividends and, where applicable, capital |
| | | gain distributions.The Merrill Lynch U.S. High Yield Master II Constrained Index is an |
| | | unmanaged performance benchmark composed of U.S. dollar-denominated domestic and Yankee |
| | | bonds rated below investment grade with at least $100 million par amount outstanding and at least |
| | | one year remaining to maturity. Bonds are capitalization-weighted.Total allocations to an issuer are |
| | | capped at 2%. |
The Portfolio 5
| UNDERSTANDING YOUR |
| PORTFOLIO’S EXPENSES (Unaudited) |
As a mutual fund investor, you pay ongoing expenses, such as management fees and other expenses. Using the information below, you can estimate how these expenses affect your investment and compare them with the expenses of other funds.You also may pay one-time transaction expenses, including sales charges (loads) and redemption fees,which are not shown in this section and would have resulted in higher total expenses. For more information, see your portfolio’s prospectus or talk to your financial adviser.
Review your portfolio’s expenses
|
The table below shows the expenses you would have paid on a $1,000 investment in Dreyfus Variable Investment Fund, Limited Term High Yield Portfolio from January 1, 2006 to June 30, 2006. It also shows how much a $1,000 investment would be worth at the close of the period, assuming actual returns and expenses.
| Expenses and Value of a $1,000 Investment | | |
| assuming actual returns for the six months ended June 30, 2006 | | |
| | | Initial Shares | | Service Shares |
| |
| |
|
| Expenses paid per $1,000 † | | $ 4.51 | | $ 4.51 |
| Ending value (after expenses) | | $1,020.30 | | $1,019.30 |
| COMPARING YOUR PORTFOLIO’S EXPENSES |
| WITH THOSE OF OTHER FUNDS (Unaudited) |
Using the SEC’s method to compare expenses
The Securities and Exchange Commission (SEC) has established guidelines to help investors assess fund expenses. Per these guidelines, the table below shows your portfolio’s expenses based on a $1,000 investment, assuming a hypothetical 5% annualized return. You can use this information to compare the ongoing expenses (but not transaction expenses or total cost) of investing in the portfolio with those of other funds. All mutual fund shareholder reports will provide this information to help you make this comparison. Please note that you cannot use this information to estimate your actual ending account balance and expenses paid during the period.
Expenses and Value of a $1,000 Investment assuming a hypothetical 5% annualized return for the six months ended June 30, 2006
| | | Initial Shares | | Service Shares |
| |
| |
|
| Expenses paid per $1,000 † | | $ 4.51 | | $ 4.51 |
| Ending value (after expenses) | | $1,020.33 | | $1,020.33 |
| † Expenses are equal to the portfolio’s annualized expense ratio of .90% for Initial shares and .90% for Service shares, |
| multiplied by the average account value over the period, multiplied by 181/365 (to reflect the one-half year period). |
STATEMENT OF INVESTMENTS
June 30, 2006 (Unaudited)
|
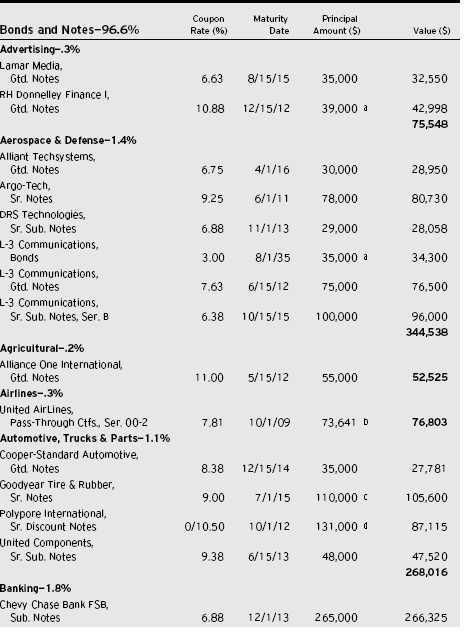
The Portfolio 7
STATEMENT OF INVESTMENTS (Unaudited) (continued)

8
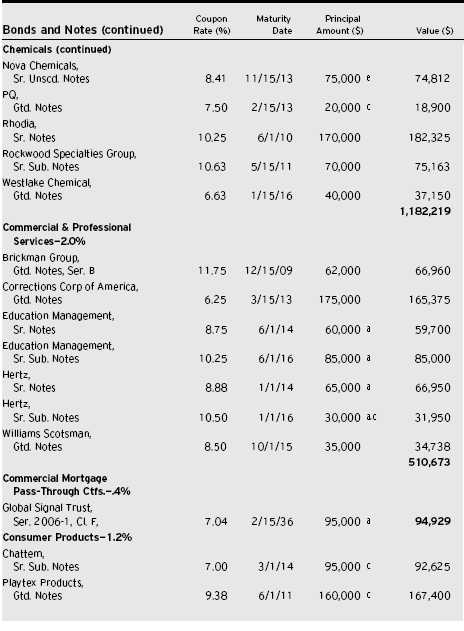
The Portfolio 9
STATEMENT OF INVESTMENTS (Unaudited) (continued)
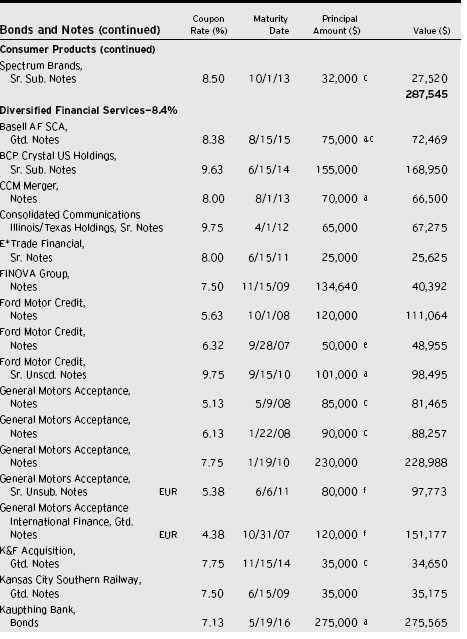
10
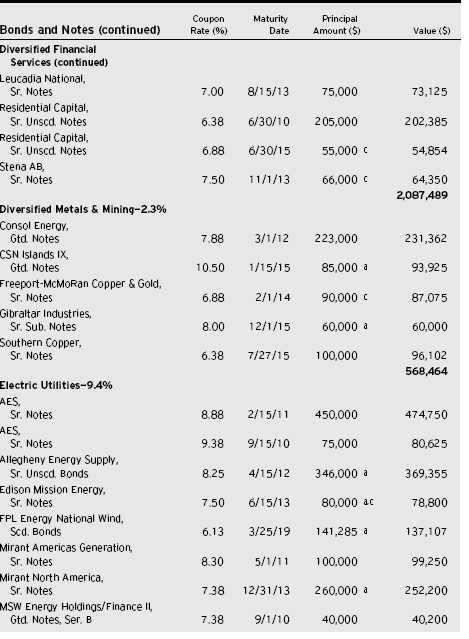
The Portfolio 11
STATEMENT OF INVESTMENTS (Unaudited) (continued)
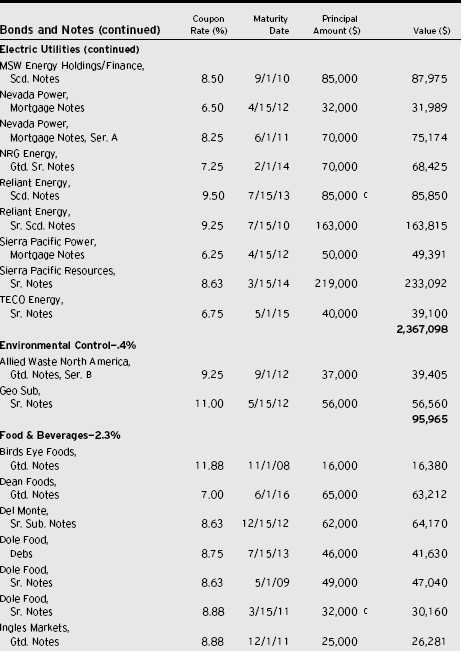
12
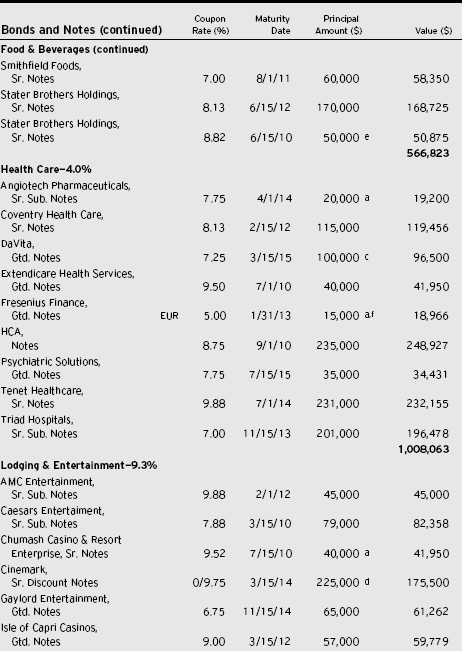
The Portfolio 13
STATEMENT OF INVESTMENTS (Unaudited) (continued)

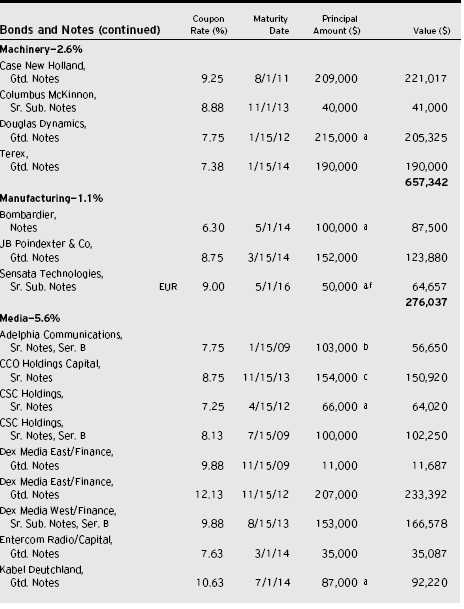
The Portfolio 15
STATEMENT OF INVESTMENTS (Unaudited) (continued)
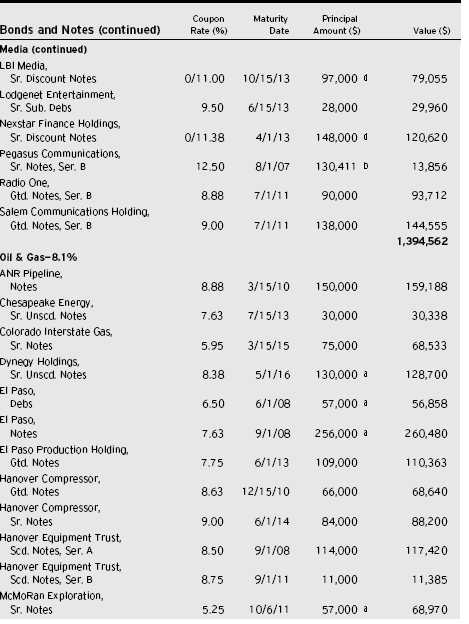
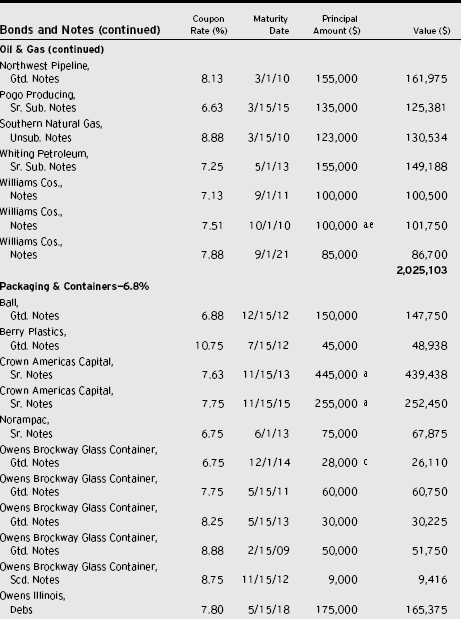
The Portfolio 17
STATEMENT OF INVESTMENTS (Unaudited) (continued)
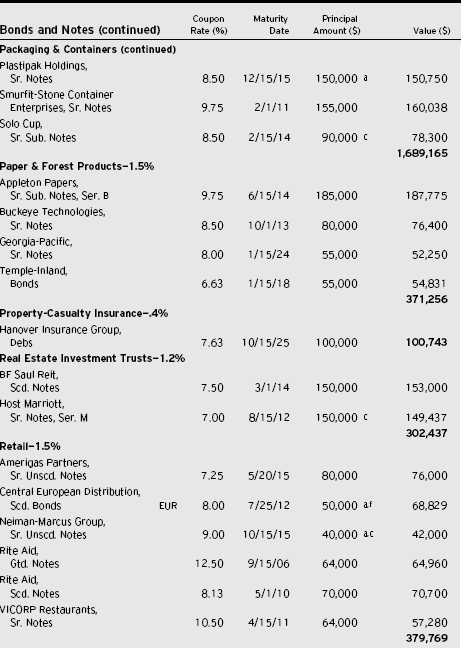
18

The Portfolio 19
STATEMENT OF INVESTMENTS (Unaudited) (continued)
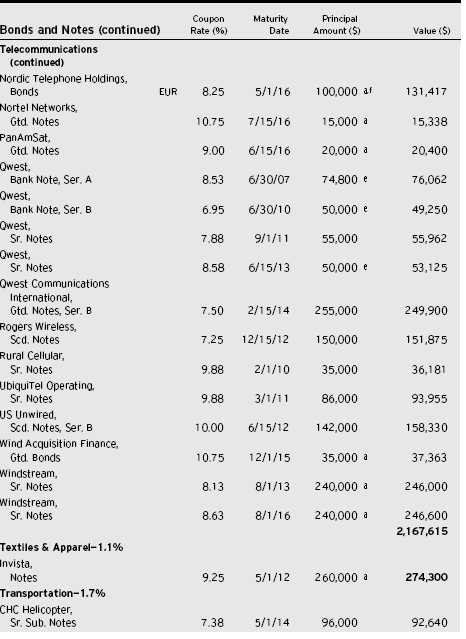
20
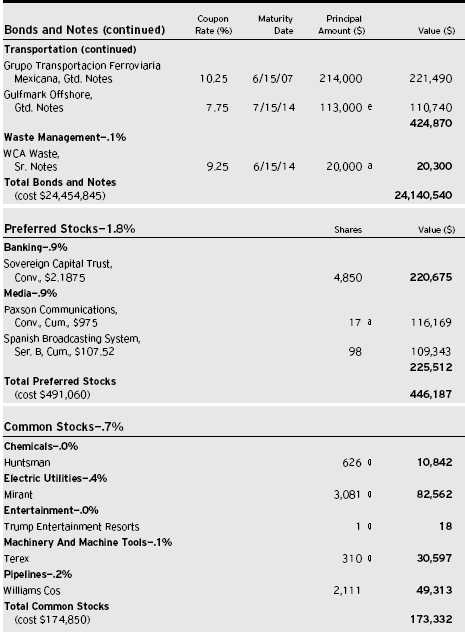
The Portfolio 21
STATEMENT OF INVESTMENTS (Unaudited) (continued)
| Other Investment—1.2% | | Shares | | Value ($) |
| |
| |
|
| Registered Investment Company; | | | | |
| Dreyfus Institutional Preferred | | | | |
| Plus Money Market Fund | | | | | | |
| (cost $299,000) | | | | 299,000 h | | 299,000 |
| |
| |
| |
|
| |
| Investment of Cash Collateral | | | | |
| for Securities Loaned—9.7% | | | | |
| |
| |
|
| Registered Investment Company; | | | | |
| Dreyfus Institutional Cash | | | | | | |
| Advantage Plus Fund | | | | | | |
| (cost $2,428,250) | | | | 2,428,250 h | | 2,428,250 |
| |
| |
| |
|
| |
| Total Investments (cost $27,848,005) | | 110.0% | | 27,487,309 |
| |
| Liabilities, Less Cash and Receivables | | (10.0%) | | (2,493,867) |
| |
| Net Assets | | | | 100.0% | | 24,993,442 |
| |
| a | | Securities exempt from registration under Rule 144A of the Securities Act of 1933.These securities may be resold in |
| | | transactions exempt from registration, normally to qualified institutional buyers. At June 30, 2006, these securities |
| | | amounted to $6,093,251 or 24.4% of net assets. | | | | |
| b | | Non-income producing—security in default. | | | | |
| c | | All or a portion of these securities are on loan. At June 30, 2006, the total market value of the portfolio’s securities |
| | | on loan is $2,331,443 and the total market value of the collateral held by the portfolio is $2,428,250. |
| d | | Zero coupon until a specified date at which time the stated coupon rate becomes effective until maturity. |
| e | | Variable rate security—interest rate subject to periodic change. | | |
| f | | Principal amount stated in U.S. Dollars unless otherwise noted. EUR—Euro | | |
| g | | Non-income producing security. | | | | |
| h | | Investment in affiliated money market mutual fund. | | | | |
| |
| |
| |
|
| |
| |
| |
| |
| Portfolio Summary (Unaudited) † | | | | |
| |
| | | | | Value (%) | | | | Value (%) |
| |
| |
| |
| |
|
| Corporate Bonds | | 94.8 | | Common Stocks | | .7 |
| Money Market Investments | | 10.9 | | Asset/Mortgage Backed | | .4 |
| Preferred Stocks | | 1.8 | | Forward Currency Exchange | | |
| State/Government | | | | Contracts/Swaps | | (.1) |
| General Obligations | | 1.4 | | | | 109.9 |
| |
| † | | Based on net assets. | | | | | | |
| See notes to financial statements. | | | | | | |
| |
| |
| 22 | | | | | | | | |
| STATEMENT OF ASSETS AND LIABILITIES |
| June 30, 2006 (Unaudited) |
| | | Cost | | Value |
| |
| |
|
| Assets ($): | | | | |
| Investments in securities—See Statement of Investments (including | | |
| securities on loan valued at $2,331,443)—Note 1(c): | | |
| Unaffiliated issuers | | 25,120,755 | | 24,760,059 |
| Affiliated issuers | | 2,727,250 | | 2,727,250 |
| Cash | | | | 46,781 |
| Cash denominated in foreign currencies | | 7,984 | | 8,113 |
| Dividends and interest receivable | | | | 458,451 |
| Receivable for investment securities sold | | | | 123,493 |
| Swaps premiums paid | | | | 8,726 |
| Unrealized appreciation on swap contracts—Note 4 | | 4,711 |
| Prepaid expenses | | | | 4,181 |
| | | | | 28,141,765 |
| |
| |
|
| Liabilities ($): | | | | |
| Due to The Dreyfus Corporation and affiliates—Note 3(b) | | 3,702 |
| Liability for securities on loan—Note 1(c) | | | | 2,428,250 |
| Payable for investment securities purchased | | 673,625 |
| Unrealized depreciation on swap contracts—Note 4 | | 14,502 |
| Unrealized depreciation on forward | | | | |
| currency exchange contracts—Note 4 | | | | 7,792 |
| Payable for shares of Beneficial Interest redeemed | | 2,618 |
| Accrued expenses | | | | 17,834 |
| | | | | 3,148,323 |
| |
| |
|
| Net Assets ($) | | | | 24,993,442 |
| |
| |
|
| Composition of Net Assets ($): | | | | |
| Paid-in capital | | | | 60,639,684 |
| Accumulated distributions in excess of investment income—net | | (116,522) |
| Accumulated net realized gain (loss) on investments | | (35,151,881) |
| Accumulated net unrealized appreciation (depreciation) | | |
| on investments and foreign currency transactions | | (377,839) |
| |
|
| Net Assets ($) | | | | 24,993,442 |
| |
| |
|
| |
| |
| Net Asset Value Per Share | | | | |
| | | Initial Shares | | Service Shares |
| |
| |
|
| Net Assets ($) | | 16,844,607 | | 8,148,835 |
| Shares Outstanding | | 2,649,816 | | 1,278,361 |
| |
| |
|
| Net Asset Value Per Share ($) | | 6.36 | | 6.37 |
See notes to financial statements.
|
The Portfolio 23
STATEMENT OF OPERATIONS
Six Months Ended June 30, 2006 (Unaudited)
|
| Investment Income ($): | | |
| Income: | | |
| Interest | | 959,263 |
| Dividends: | | |
| Unaffiliated issuers | | 21,472 |
| Affiliated issuers | | 6,294 |
| Income from securities lending | | 6,120 |
| Total Income | | 993,149 |
| Expenses: | | |
| Investment advisory fee—Note 3(a) | | 86,231 |
| Auditing fees | | 17,240 |
| Distribution fees—Note 3(b) | | 10,812 |
| Prospectus and shareholders’ reports | | 5,089 |
| Custodian fees—Note 3(b) | | 2,704 |
| Trustees’ fees and expenses—Note 3(c) | | 1,882 |
| Legal fees | | 591 |
| Shareholder servicing costs—Note 3(b) | | 317 |
| Miscellaneous | | 15,429 |
| Total Expenses | | 140,295 |
| Less—waiver of fees due to undertaking—Note 3(a) | | (20,780) |
| Less—reduction in custody fees due to | | |
| earnings credits—Note 1(c) | | (533) |
| Net Expenses | | 118,982 |
| Investment Income—Net | | 874,167 |
| |
|
| Realized and Unrealized Gain (Loss) on Investments—Note 4 ($): |
| Net realized gain (loss) on investments and foreign currency transactions | | 169,552 |
| Net realized gain (loss) on swap transactions | | 7,263 |
| Net realized gain (loss) on forward currency exchange contracts | | (12,062) |
| Net Realized Gain (Loss) | | 164,753 |
| Net unrealized appreciation (depreciation) on investments, | | |
| foreign currency transactions, forward currency | | |
| exchange contracts and swap transactions | | (498,518) |
| Net Realized and Unrealized Gain (Loss) on Investments | | (333,765) |
| Net Increase in Net Assets Resulting from Operations | | 540,402 |
See notes to financial statements.
|
STATEMENT OF CHANGES IN NET ASSETS
| | | Six Months Ended | | |
| | | June 30, 2006 | | Year Ended |
| | | (Unaudited) | | December 31, 2005 |
| |
| |
|
| Operations ($): | | | | |
| Investment income—net | | 874,167 | | 2,023,379 |
| Net realized gain (loss) on investments | | 164,753 | | (260,534) |
| Net unrealized appreciation | | | | |
| (depreciation) on investments | | (498,518) | | (1,095,928) |
| Net Increase (Decrease) in Net Assets | | | | |
| Resulting from Operations | | 540,402 | | 666,917 |
| |
| |
|
| Dividends to Shareholders from ($): | | | | |
| Investment income—net: | | | | |
| Initial shares | | (723,827) | | (1,531,558) |
| Service shares | | (343,548) | | (660,967) |
| Total Dividends | | (1,067,375) | | (2,192,525) |
| |
| |
|
| Beneficial Interest Transactions ($): | | | | |
| Net proceeds from shares sold: | | | | |
| Initial shares | | 280,094 | | 1,336,313 |
| Service shares | | 953,035 | | 1,804,074 |
| Dividends reinvested: | | | | |
| Initial shares | | 723,827 | | 1,531,558 |
| Service shares | | 343,548 | | 660,967 |
| Cost of shares redeemed: | | | | |
| Initial shares | | (2,944,134) | | (6,535,964) |
| Service shares | | (1,905,404) | | (2,523,884) |
| Increase (Decrease) in Net Assets from | | | | |
| Beneficial Interest Transactions | | (2,549,034) | | (3,726,936) |
| Total Increase (Decrease) in Net Assets | | (3,076,007) | | (5,252,544) |
| |
| |
|
| Net Assets ($): | | | | |
| Beginning of Period | | 28,069,449 | | 33,321,993 |
| End of Period | | 24,993,442 | | 28,069,449 |
| Undistributed (distributions in excess of) | | | | |
| investment income—net | | (116,522) | | 76,686 |
The Portfolio 25
STATEMENT OF CHANGES IN NET ASSETS (continued)
|
| | | Six Months Ended | | |
| | | June 30, 2006 | | Year Ended |
| | | (Unaudited) | | December 31, 2005 |
| |
| |
|
| Capital Share Transactions: | | | | |
| Initial Shares | | | | |
| Shares sold | | 42,875 | | 197,550 |
| Shares issued for dividends reinvested | | 112,561 | | 233,424 |
| Shares redeemed | | (449,632) | | (982,751) |
| Net Increase (Decrease) in Shares Outstanding | | (294,196) | | (551,777) |
| |
| |
|
| Service Shares | | | | |
| Shares sold | | 145,019 | | 269,680 |
| Shares issued for dividends reinvested | | 53,346 | | 100,639 |
| Shares redeemed | | (290,628) | | (380,156) |
| Net Increase (Decrease) in Shares Outstanding | | (92,263) | | (9,837) |
See notes to financial statements.
|
The following tables describe the performance for each share class for the fiscal periods indicated.All information (except portfolio turnover rate) reflects financial results for a single portfolio share. Total return shows how much your investment in the portfolio would have increased (or decreased) during each period, assuming you had reinvested all dividends and distributions.These figures have been derived from the portfolio’s financial statements.
| | | Six Months Ended | | | | | | |
| | | June 30, 2006 | | Year Ended December 31, | | |
| |
| |
| |
|
| Initial Shares | | (Unaudited) | | 2005 | | 2004 a | | 2003 | | 2002 | | 2001 |
| |
| |
| |
| |
| |
| |
|
| Per Share Data ($): | | | | | | | | | | | | |
| Net asset value, | | | | | | | | | | | | |
| beginning of period | | 6.50 | | 6.83 | | 6.68 | | 5.63 | | 7.33 | | 8.47 |
| Investment Operations: | | | | | | | | | | | | |
| Investment income—net b | | .21 | | .43 | | .46 | | .53 | | .69 | | .84 |
| Net realized and unrealized | | | | | | | | | | | | |
| gain (loss) on investments | | (.08) | | (.27) | | .19 | | 1.12 | | (1.64) | | (1.07) |
| Total from Investment Operations | | .13 | | .16 | | .65 | | 1.65 | | (.95) | | (.23) |
| Distributions: | | | | | | | | | | | | |
| Dividends from | | | | | | | | | | | | |
| investment income—net | | (.27) | | (.49) | | (.50) | | (.60) | | (.75) | | (.91) |
| Net asset value, end of period | | 6.36 | | 6.50 | | 6.83 | | 6.68 | | 5.63 | | 7.33 |
| |
| |
| |
| |
| |
| |
|
| Total Return (%) | | 2.03c | | 2.42 | | 10.10 | | 30.00 | | (13.01) | | (2.90) |
| |
| |
| |
| |
| |
| |
|
| Ratios/Supplemental Data (%): | | | | | | | | | | |
| Ratio of total expenses | | | | | | | | | | | | |
| to average net assets | | .97d | | .90 | | .89 | | .96 | | .94 | | .91 |
| Ratio of net expenses | | | | | | | | | | | | |
| to average net assets | | .90d | | .88 | | .89 | | .90 | | .92 | | .91 |
| Ratio of net investment income | | | | | | | | | | | | |
| to average net assets | | 6.58d | | 6.53 | | 6.82 | | 8.43 | | 10.69 | | 10.37 |
| Portfolio Turnover Rate | | 20.17c | | 60.64 | | 78.90 | | 258.88 | | 436.35 | | 198.14 |
| |
| |
| |
| |
| |
| |
|
| Net Assets, end of period | | | | | | | | | | | | |
| ($ x 1,000) | | 16,845 | | 19,142 | | 23,881 | | 25,571 | | 20,033 | | 30,146 |
| a As of January 1, 2004, the portfolio has adopted the method of accounting for interim payments on swap contracts in |
| accordance with Financial Accounting Standards Board Statement No. 133.These interim payments are reflected |
| within net realized and unrealized gain (loss) on swap contracts, however, prior to January 1, 2004, these interim |
| payments were reflected within interest income/expense in the Statement of Operations.The effect of this change for |
| the period ended December 31, 2004, was to increase net investment income per share by less than $.01, decrease net |
| realized and unrealized gain (loss) on investments per share by less than $.01 and increase the ratio of net |
| investment income to average net assets from 6.81% to 6.82%. Per share data and ratios/supplemental data for |
| periods prior to January 1, 2004 have not been restated to reflect this change in presentation. |
| b Based on average shares outstanding at each month end. |
| c Not annualized. |
| d Annualized. |
See notes to financial statements.
The Portfolio 27
FINANCIAL HIGHLIGHTS (continued)
|
| | | Six Months Ended | | | | | | |
| | | June 30, 2006 | | Year Ended December 31, | | |
| |
| |
| |
|
| Service Shares | | (Unaudited) | | 2005 | | 2004 a | | 2003 | | 2002 | | 2001 |
| |
| |
| |
| |
| |
| |
|
| Per Share Data ($): | | | | | | | | | | | | |
| Net asset value, | | | | | | | | | | | | |
| beginning of period | | 6.51 | | 6.84 | | 6.68 | | 5.63 | | 7.33 | | 8.46 |
| Investment Operations: | | | | | | | | | | | | |
| Investment income—net b | | .21 | | .44 | | .46 | | .53 | | .68 | | .79 |
| Net realized and unrealized | | | | | | | | | | | | |
| gain (loss) on investments | | (.08) | | (.29) | | .19 | | 1.12 | | (1.63) | | (1.02) |
| Total from Investment Operations | | .13 | | .15 | | .65 | | 1.65 | | (.95) | | (.23) |
| Distributions: | | | | | | | | | | | | |
| Dividends from | | | | | | | | | | | | |
| investment income—net | | (.27) | | (.48) | | (.49) | | (.60) | | (.75) | | (.90) |
| Net asset value, end of period | | 6.37 | | 6.51 | | 6.84 | | 6.68 | | 5.63 | | 7.33 |
| |
| |
| |
| |
| |
| |
|
| Total Return (%) | | 1.93c | | 2.34 | | 10.06 | | 30.28 | | (13.12) | | (2.95) |
| |
| |
| |
| |
| |
| |
|
| Ratios/Supplemental Data (%): | | | | | | | | | | |
| Ratio of total expenses | | | | | | | | | | | | |
| to average net assets | | 1.22d | | 1.15 | | 1.14 | | 1.22 | | 1.25 | | 1.15 |
| Ratio of net expenses | | | | | | | | | | | | |
| to average net assets | | .90d | | .90 | | .90 | | .90 | | .92 | | .91 |
| Ratio of net investment income | | | | | | | | | | | | |
| to average net assets | | 6.59d | | 6.54 | | 6.80 | | 8.34 | | 10.73 | | 10.35 |
| Portfolio Turnover Rate | | 20.17c | | 60.64 | | 78.90 | | 258.88 | | 436.35 | | 198.14 |
| |
| |
| |
| |
| |
| |
|
| Net Assets, end of period | | | | | | | | | | | | |
| ($ x 1,000) | | 8,149 | | 8,928 | | 9,441 | | 9,062 | | 4,933 | | 2,797 |
| a | | As of January 1, 2004, the portfolio has adopted the method of accounting for interim payments on swap contracts |
| | | in accordance with Financial Accounting Standards Board Statement No. 133.These interim payments are reflected |
| | | within net realized and unrealized gain (loss) on swap contracts, however, prior to January 1, 2004, these interim |
| | | payments were reflected within interest income/expense in the Statement of Operations.The effect of these changes for |
| | | the fiscal year ended December 31, 2004, was to increase net investment income per share by less than $.01, |
| | | decrease net realized and unrealized gain (loss) on investments per share by less than $.01 and had no effect on the |
| | | ratio of net investment income to average net assets. Per share data and ratios/supplemental data for periods prior to |
| | | January 1, 2004 have not been restated to reflect this change in presentation. |
| b | | Based on average shares outstanding at each month end. |
| c | | Not annualized. |
| d | | Annualized. |
| See notes to financial statements. |
| 28 | | |
NOTES TO FINANCIAL STATEMENTS (Unaudited)
NOTE 1—Significant Accounting Policies:
Dreyfus Variable Investment Fund (the “fund”) is registered under the Investment Company Act of 1940 as amended (the “Act”), as an open-end management investment company, operating as a series company currently offering twelve series, including the Limited Term High Yield Portfolio (the “portfolio”). The portfolio is only offered to separate accounts established by insurance companies to fund variable annuity contracts and variable life insurance policies.The portfolio is a diversified series. The portfolio’s investment objective is to maximize total return, consisting of capital appreciation and current income. The Dreyfus Corporation (the “Manager” or “Dreyfus”) serves as the portfolio’s investment adviser.The Manager is a wholly-owned subsidiary of Mellon Financial Corporation (“Mellon Financial”).
Dreyfus Service Corporation (the “Distributor”), a wholly-owned subsidiary of the Manager, is the distributor of the portfolio’s shares, which are sold without a sales charge. The portfolio is authorized to issue an unlimited number of $.001 par value shares of Beneficial Interest in the following classes of shares: Initial and Service. Each class of shares has identical rights and privileges, except with respect to the distribution plan and the expenses borne by each class and certain voting rights. Income, expenses (other than expenses attributable to a specific class), and realized and unrealized gains or losses on investments are allocated to each class of shares based on its relative net assets.
The fund accounts separately for the assets, liabilities and operations of each series. Expenses directly attributable to each series are charged to that series’ operations; expenses which are applicable to all series are allocated among them on a pro rata basis.
The portfolio’s financial statements are prepared in accordance with U.S. generally accepted accounting principles, which may require the use of management estimates and assumptions.Actual results could differ from those estimates.
The Portfolio 29
NOTES TO FINANCIAL STATEMENTS (Unaudited) (continued)
The fund enters into contracts that contain a variety of indemnifica-tions.The portfolio’s maximum exposure under these arrangements is unknown. The portfolio does not anticipate recognizing any loss related to these arrangements.
(a) Portfolio valuation: Investments in securities (excluding short-term investments other than U.S.Treasury Bills), swap transactions and forward currency exchange contracts) are valued each business day by an independent pricing service (the “Service”) approved by the Board of Trustees. Investments for which quoted bid prices are readily available and are representative of the bid side of the market in the judgment of the Service are valued at the mean between the quoted bid prices (as obtained by the Service from dealers in such securities) and asked prices (as calculated by the Service based upon its evaluation of the market for such securities). Other investments (which constitute a majority of the portfolio securities) are valued as determined by the Service, based on methods which include consideration of: yields or prices of securities of comparable quality, coupon, maturity and type; indications as to values from dealers; and general market conditions. Securities for which there are no such valuations are valued at fair value as determined in good faith under the direction of the Board of Trustees. Restricted securities, as well as securities or other assets for which recent market quotations are not readily available, that are not valued by a pricing service approved by the Board of Trustees, or are determined by the portfolio not to reflect accurately fair value (such as when an event occurs after the close of the exchange on which the security is principally traded and that is determined by the portfolio to have changed the value of the security), are valued at fair value as determined in good faith under the direction of the Board of Trustees.The factors that may be considered when fair valuing a security include fundamental analytical data, the nature and duration of restrictions on disposition, an evaluation of the forces that influence the market in which
the securities are purchased and sold and public trading in similar securities of the issuer or comparable issuers. Short-term investments, excluding U.S. Treasury Bills, are carried at amortized cost, which approximates value. Investments in registered investment companies are valued at their net asset value. Investments in swap transactions are valued each business day by an independent pricing service approved by the Board of Trustees. Swaps are valued by the service by using a swap pricing model which incorporates among other factors, default probabilities, recovery rates, credit curves of the underlying issuer and swap spreads on interest rates. Investments denominated in foreign currencies are translated to U.S. dollars at the prevailing rates of exchange. Forward currency exchange contracts are valued at the forward rate.
(b) Foreign currency transactions: The portfolio does not isolate that portion of the results of operations resulting from changes in foreign exchange rates on investments from the fluctuations arising from changes in the market prices of securities held. Such fluctuations are included with the net realized and unrealized gain or loss on investments.
Net realized foreign exchange gains or losses arise from sales and maturities of short-term securities, sales of foreign currencies, currency gains or losses realized on securities transactions and the difference between the amounts of dividends, interest and foreign withholding taxes recorded on the fund’s books and the U.S. dollar equivalent of the amounts actually received or paid. Net unrealized foreign exchange gains and losses arise from changes in the value of assets and liabilities, other than investments in securities, resulting from changes in exchange rates. Such gains and losses are included with net realized and unrealized gain or loss on investments.
(c) Securities transactions and investment income: Securities transactions are recorded on a trade date basis. Realized gain and loss from securities transactions are recorded on the identified cost basis.
The Portfolio 31
NOTES TO FINANCIAL STATEMENTS (Unaudited) (continued)
Dividend income is recognized on the ex-dividend date and interest income, including, where applicable, accretion of discount and amortization of premium on investments, is recognized on the accrual basis.
The portfolio has an arrangement with the custodian bank whereby the portfolio receives earnings credits from the custodian when positive cash balances are maintained, which are used to offset custody fees. For financial reporting purposes, the portfolio includes net earnings credits as an expense offset in the Statement of Operations.
Pursuant to a securities lending agreement with Mellon Bank, N.A., an affiliate of the Manager, the portfolio may lend securities to qualified institutions. It is the portfolio’s policy, that at origination, all loans are secured by collateral of at least 102% of the value of U.S. securities loaned and 105% of the value of foreign securities loaned. Collateral equivalent to at least 100% of the market value of securities on loan is maintained at all times. Cash collateral is invested in certain money market mutual funds managed by the Manager.The portfolio is entitled to receive all income on securities loaned, in addition to income earned as a result of the lending transaction. Although each security loaned is fully collateralized, the portfolio bears the risk of delay in recovery of, or loss of rights in, the securities loaned should a borrower fail to return the securities in a timely manner.
(d) Affiliated issuers: Investments in other investment companies advised by the Manager are defined as “affiliated” in the Act.
(e) Dividends to shareholders: It is the policy of the portfolio to declare and pay dividends quarterly from investment income-net. Dividends from net realized capital gain, if any, are normally declared and paid annually, but the portfolio may make distributions on a more frequent basis to comply with the distribution requirements of the Internal Revenue Code of 1986, as amended (the “Code”). To the extent that net realized capital gain can be offset by capital loss carry-
overs, it is the policy of the portfolio not to distribute such gain. Income and capital gain distributions are determined in accordance with income tax regulations, which may differ from U.S. generally accepted accounting principles.
(f) Federal income taxes: It is the policy of the portfolio to continue to qualify as a regulated investment company, if such qualification is in the best interests of its shareholders, by complying with the applicable provisions of the Code, and to make distributions of taxable income sufficient to relieve it from substantially all federal income and excise taxes.
The portfolio has an unused capital loss carryover of $35,162,624 available for federal income tax purposes to be applied against future net securities profits, if any, realized subsequent to December 31, 2005. If not applied, $4,814,711 of the carryover expires in fiscal 2007, $4,480,534 expires in fiscal 2008, $10,613,045 expires in fiscal 2009, $10,693,853 expires in fiscal 2010, $4,059,439 expires in fiscal 2011 and $501,042 expires in fiscal 2013.
The tax character of distributions paid to shareholders during the fiscal year ended December 31, 2005 were as follows: ordinary income $2,192,525. The tax character of current year distributions will be determined at the end of the current fiscal year.
NOTE 2—Bank Lines of Credit:
|
The portfolio may borrow up to $10 million for leveraging purposes under a short-term unsecured line of credit and participates with other Dreyfus-managed funds in a $100 million unsecured line of credit primarily to be utilized for temporary or emergency purposes, including the financing of redemptions. Interest is charged to the portfolio based on prevailing market rates in effect at the time of borrowing. During the period ended June 30, 2006, the portfolio did not borrow under either line of credit.
The Portfolio 33
NOTES TO FINANCIAL STATEMENTS (Unaudited) (continued)
NOTE 3—Investment Advisory Fee and Other Transactions With Affiliates:
(a) Pursuant to an Investment Advisory Agreement (“Agreement”) with Dreyfus, the investment advisory fee is computed at the annual rate of .65% of the value of the portfolio’s average daily net assets and is payable monthly.
The Manager has agreed, from January 1, 2006 to December 31, 2006, to waive receipt of its fees and/or assume the expenses of the portfolio so that the expenses of neither class, exclusive of taxes, brokerage commissions, extraordinary expenses, interest expenses and commitment fees on borrowings exceed .90% of the value of the average daily net assets of their class. During the period ended June 30, 2006, the Manager waived receipt of fees of $20,780, pursuant to the undertaking.
(b) Under the Distribution Plan (the “Plan”) adopted pursuant to Rule 12b-1 under the Act, Service shares pay the Distributor for distributing their shares, for servicing and/or maintaining Service shares shareholder accounts and for advertising and marketing for Service shares.The Plan provides for payments to be made at an annual rate of .25% of the value of the Service shares’ average daily net assets.The Distributor may make payments to Participating Insurance Companies and to brokers and dealers acting as principal underwriter for their variable insurance products.The fees payable under the Plan are payable without regard to actual expenses incurred. During the period ended June 30, 2006, Service shares were charged $10,812 pursuant to the Plan.
The portfolio compensates Dreyfus Transfer, Inc., a wholly-owned subsidiary of the Manager, under a transfer agency agreement for providing personnel and facilities to perform transfer agency services for the portfolio. During the period ended June 30, 2006, the portfolio was charged $32 pursuant to the transfer agency agreement.
The portfolio compensates Mellon Bank, N.A., an affiliate of the Manager, under a custody agreement to provide custodial services for the portfolio. During the period ended June 30, 2006, the portfolio was charged $2,704 pursuant to the custody agreement.
During the period ended June 30, 2006, the portfolio was charged $1,926 for services performed by the Chief Compliance Officer.
The components of Due to The Dreyfus Corporation and affiliates in the Statement of Assets and Liabilities consist of: investment advisory fee $13,406, Rule 12b-1 distribution plan fees $1,695, custodian fees $1,668, chief compliance officer fees $1,926 and transfer agency per account fees $11, which are offset against an expense reimbursement currently in effect in the amount of $15,004.
(c) Each Board member also serves as a Board member of other funds within the Dreyfus complex. Annual retainer fees and attendance fees are allocated to each fund based on net assets.
(d) Pursuant to an exemptive order from the SEC, the portfolio may invest its available cash balances in affiliated money market mutual funds. Management fees of the underlying money market mutual funds have been waived by the Manager.
NOTE 4—Securities Transactions:
The aggregate amount of purchases and sales of investment securities, excluding short-term securities, forward currency exchange contracts, and swap transactions,during the period ended June 30,2006,amounted to $5,258,586 and $7,053,584, respectively.
The portfolio enters into forward currency exchange contracts in order to hedge its exposure to changes in foreign currency exchange rates on its foreign portfolio holdings and to settle foreign currency transactions. When executing forward currency exchange contracts, the portfolio is obligated to buy or sell a foreign currency at a specified rate on a certain date in the future. With respect to sales of forward currency exchange contracts, the portfolio would incur a loss if the value of the contract increases between the date the forward contract is opened and the date the forward contract is closed.The portfolio realizes a gain if the value of the contract decreases between those dates.With respect to purchases of forward currency exchange contracts, the portfolio would incur a loss if the value of the contract decreases between the date the
The Portfolio 35
NOTES TO FINANCIAL STATEMENTS (Unaudited) (continued)
forward contract is opened and the date the forward contract is closed. The portfolio realizes a gain if the value of the contract increases between those dates.The portfolio is also exposed to credit risk associated with counterparty nonperformance on these forward currency exchange contracts which is typically limited to the unrealized gain on each open contract.The following summarizes open forward currency exchange contracts at June 30, 2006:
| | | Foreign | | | | | | |
| Forward Currency | | Currency | | | | | | Unrealized |
| Exchange Contracts | | Amounts | | Proceeds ($) | | Value ($) | | (Depreciation) ($) |
| |
| |
| |
| |
|
| Sales: | | | | | | | | |
| Euro, | | | | | | | | |
| expiring 9/20/2006 | | 430,000 | | 545,016 | | 552,808 | | (7,792) |
The portfolio may enter into swap agreements to exchange the interest rate on, or return generated by, one nominal instrument for the return generated by another nominal instrument.
The portfolio accrues for interim payments on a daily basis, with the net amount recorded within unrealized appreciation (depreciation) of swap contracts on the Statement of Assets and Liabilities. Once the interim payments are settled in cash, the net amount is recorded as realized gain (loss) on swaps, in addition to realized gain (loss) recorded upon the termination of swap contracts in the Statement of Operations. Fluctuations in the value of swap contracts are recorded as a component of net charge in unrealized appreciation (depreciation) on investments.
Credit default swaps involve commitments to pay a fixed interest rate in exchange for payment if a credit event affecting a third party (the referenced company) occurs. Credit events may include a failure to pay interest or principal, bankruptcy, or restructuring. For those credit default swaps in which the portfolio is receiving a fixed rate, the portfolio is providing credit protection on the underlying instrument.The
maximum payouts for these contracts are limited to the notional amount of each swap.The following summarizes credit default swaps entered into by the portfolio at June 30, 2006:
| | | | | | | | | | | Unrealized |
| Notional | | Reference | | | | (Pay) Receive | | Expiration | | Appreciation |
| Amount ($) | | Entity | | Counterparty | | Fixed Rate (%) | Date | (Depreciation)($) |
| |
| |
| |
| |
|
| 268,293 | | Dow Jones | | J.P. Morgan | | | | | | |
| | | CDX.NA.HY.BB.5 | | Chase | | (2.50) | | 12/20/10 | | (6,630) |
| 264,000 | | Dow Jones | | J.P. Morgan | | | | | | |
| | | CDX.NA.HY.4 | | Chase | | 3.60 | | 12/20/10 | | 3,143 |
| 527,700 | | Dow Jones | | Morgan | | | | | | |
| | | CDX.NA.IG.4 | | Stanley | | (.35) | | 6/20/10 | | (4,421) |
| 332,300 | | Dow Jones | | Merrill | | | | | | |
| | | CDX.NA.IG.4 | | Lynch | | (.31) | | 6/20/10 | | (2,242) |
| 150,000 | | Owens-Brockway | | | | | | | | |
| | | Glass Container, | | J.P. Morgan | | | | | | |
| | | 8.875%, 2/15/2009 | | Chase | | (1.95) | | 6/20/10 | | 1,568 |
| 150,000 | | Owens-Illinois, | | J.P. Morgan | | | | | | |
| | | 7.5%, 5/15/2010 | | Chase | | 2.60 | | 6/20/10 | | (1,209) |
| Total | | | | | | | | | | (9,791) |
Risks may arise upon entering into these agreements from the potential inability of the counterparties to meet the terms of the agreement and are generally limited to the amount of net payments to be received, if any, at the date of default.
At June 30, 2006, accumulated net unrealized depreciation on investments was $360,696, consisting of $487,044 gross unrealized appreciation and $847,740 gross unrealized depreciation.
At June 30,2006,the cost of investments for federal income tax purposes was substantially the same as the cost for financial reporting purposes (see the Statement of Investments).
The Portfolio 37
PROXY RESULTS ( U n a u d i t e d )
|
Dreyfus Variable Investment Fund held a special meeting of shareholders on June 29, 2006.The proposal considered at the meeting, and the results, are as follows:
| | | | | Shares | | |
| |
| |
| |
|
| | | For | | | | Authority Withheld |
| |
| |
| |
|
| To elect additional Board Members: | | | | | | |
| Peggy C. Davis † | | 171,078,926.558 | | | | 7,687,714.085 |
| Joseph S. DiMartino | | 170,946,484.400 | | | | 7,820,156.243 |
| David P. Feldman | | 170,959,920.714 | | | | 7,806,719.929 |
| Ehud Houminer † | | 170,132,086.682 | | | | 8,634,553.961 |
| Gloria Messinger † | | 170,187,240.710 | | | | 8,579,399.933 |
| Anne Wexler † | | 170,212,607.472 | | | | 8,554,033.171 |
| † Each will serve as an Independent Board member of the fund commencing, subject to the discretion of the Board, on |
| or about January 1, 2007. |
| In addition to Joseph S. DiMartino and David P. Feldman, James F. Henry, Dr. Paul A. Marks and Dr. Martin |
| Peretz continue as Board members of the fund. |
| INFORMATION ABOUT THE REVIEW | | |
| AND APPROVAL OF THE PORTFOLIO’S | | |
| I N V E S T M E N T A DV I S O RY A G R E E M E N T | | (Unaudited) |
At a meeting of the fund’s Board of Trustees held on June 7 and 8, 2006, the Board considered the re-approval for an annual period (through July 31, 2007) of the fund’s Investment Advisory Agreement with Dreyfus for the portfolio, pursuant to which Dreyfus provides the portfolio with investment advisory and administrative services. The Board members, none of whom are “interested persons” (as defined in the Investment Company Act of 1940, as amended) of the fund were assisted in their review by independent legal counsel and met with counsel in executive session separate from representatives of Dreyfus.
Analysis of Nature, Extent and Quality of Services Provided to the Portfolio. The Board members received a presentation from representatives of Dreyfus regarding services provided to the portfolio and other funds in the Dreyfus fund complex, and discussed the nature, extent and quality of the services provided to the portfolio pursuant to its Investment Advisory Agreement. Dreyfus’ representatives reviewed the portfolio’s distribution of accounts and the relationships Dreyfus has with various intermediaries and the different needs of each.The Board noted that the portfolio’s shares were offered only to separate accounts established by insurance companies to fund variable annuity contracts and variable life insurance policies. Dreyfus’ representatives noted the diversity of distribution among the funds in the Dreyfus fund complex, and Dreyfus’ corresponding need for broad, deep, and diverse resources to be able to provide ongoing shareholder services to each distribution channel, including that of the portfolio. Dreyfus also provided the number of separate accounts investing in the portfolio, as well as the portfolio’s asset size.
The Board members also considered Dreyfus’ research and portfolio management capabilities and that Dreyfus also provides oversight of day-to-day portfolio operations, including fund accounting and administration and assistance in meeting legal and regulatory requirements. The Board members also considered Dreyfus’ extensive administrative, accounting and compliance infrastructure.
The Portfolio 39
| I N FO R M AT I O N A B O U T T H E R E V I E W A N D A P P R OVA L O F T H E P O R T FO L I O ’ S |
| I N V E S T M E N T A DV I S O RY A G R E E M E N T ( U n a u d i t e d ) ( c o n t i n u e d ) |
Comparative Analysis of the Portfolio’s Performance and Advisory Fee and Expense Ratio. The Board members reviewed the portfolio’s performance and placed significant emphasis on comparisons to a group of high current yield funds underlying variable insurance products (the “Performance Group”) and to a larger universe of funds, consisting of all high current yield funds underlying variable insurance products (the “Performance Universe”) selected and provided by Lipper, Inc., an independent provider of investment company data.The Board was provided with a description of the methodology Lipper used to select the Performance Group and Performance Universe, as well as the Expense Group and Expense Universe (discussed below). The Board members discussed the results of the yield and total return comparisons for various periods through April 30, 2006.The Board members noted that the portfolio’s current portfolio manager assumed that role in January 2005. The Board noted that the portfolio’s yield for one-year periods ended April 30th for 1998 - 2006 for its Initial shares was above the median of the Performance Group for all periods and was above the Performance Universe median in each period except for one in which it was slightly below.The total return performance for its Initial shares was at or below the Performance Group and Performance Universe medians for each period.The representatives of Dreyfus discussed with the Board the portfolio manager’s efforts to have less portfolio exposure to lower-rated high yield issues by concentrating primarily on investments with “single-B” and “double B” ratings (or unrated equivalents) and how that strategy affected the portfolio’s relative performance under management of the new portfolio manager since January 2005. Dreyfus also provided the Board with the portfolio’s total return performance and the quartile, percentile and rank of the portfolio’s total return within its Lipper category (as provided by Lipper) for certain other periods ended April 30, 2006, which generally were consistent with the relative return information provided by Lipper.
The Board members also discussed the portfolio’s investment advisory fee and expense ratio for each class of shares and reviewed the range of advisory fees and expense ratios as compared to a comparable group
of funds (the “Expense Group”) and a broader group of funds (the “Expense Universe”), each selected and provided by Lipper. The Board members noted that the portfolio’s advisory fee was lower than the Expense Group median and higher than the Expense Universe median, and that the expense ratio for the Initial shares was at the Expense Group median and higher than the Expense Universe median and the expense ratio for the Service shares was higher than the Expense Group and Expense Universe medians. The Board noted Dreyfus’ current undertaking to waive or reimburse certain fees and expenses, which reduced the expense ratio for each share class.
Representatives of Dreyfus reviewed with the Board members the advisory fees paid by mutual funds managed by Dreyfus or its affiliates with similar investment objectives, policies and strategies, and included within the portfolio’s Lipper category (the “Similar Funds”), and by other accounts managed by Dreyfus or its affiliates with similar investment objectives, policies and strategies as the portfolio (the “Similar Accounts”). Dreyfus’ representatives explained the nature of the Similar Accounts and the differences, from Dreyfus’ perspective, in providing services to such Similar Accounts as compared to managing and providing services to the portfolio. Dreyfus’ representatives also reviewed the costs associated with distribution through intermediaries. The Board analyzed differences in fees paid to Dreyfus and discussed the relationship of the fees paid in light the services provided. The Board members considered the relevance of the fee information provided for the Similar Funds and the Similar Accounts to evaluate the appropriateness and reasonableness of the portfolio’s investment advisory fee.The Board acknowledged that differences in fees paid by the Similar Accounts seemed to be consistent with the services provided.
Analysis of Profitability and Economies of Scale. Dreyfus’ representatives reviewed the dollar amount of expenses allocated and profit received by Dreyfus and the method used to determine such expenses and profit.The Board considered information, previously provided and discussed, prepared by an independent consulting firm regarding
The Portfolio 41
| I N FO R M AT I O N A B O U T T H E R E V I E W A N D A P P R OVA L O F T H E P O R T FO L I O ’ S |
| I N V E S T M E N T A DV I S O RY A G R E E M E N T ( U n a u d i t e d ) ( c o n t i n u e d ) |
Dreyfus’ approach to allocating costs to, and determining the profitability of, individual funds and the entire Dreyfus mutual fund complex. The Board members also considered that the methodology had also been reviewed by an independent registered public accounting firm which, like the consultant, found the methodology to be reasonable. The consulting firm also analyzed where any economies of scale might emerge in connection with the management of the portfolio. The Board members evaluated the profitability analysis in light of the relevant circumstances for the portfolio and the extent to which economies of scale would be realized if the portfolio grows and whether fee levels reflect these economies of scale for the benefit of portfolio investors. The Board members also considered potential benefits to Dreyfus from acting as investment adviser and noted that there were no soft dollar arrangements with respect to trading the portfolio’s investments.
It was noted that the Board members should consider Dreyfus’ profitability with respect to the portfolio as part of their evaluation of whether the fees under the Investment Advisory Agreement bear a reasonable relationship to the mix of services provided by Dreyfus, including the nature, extent and quality of such services and that a discussion of economies of scale is predicated on increasing assets and that, if a fund’s assets had been decreasing, the possibility that Dreyfus may have realized any economies of scale would be less. It also was noted that the profitability percentage for managing the portfolio was within ranges determined by appropriate court cases to be reasonable given the services rendered and generally superior service levels provided. The Board also noted the fee waiver and expense reimbursement arrangements and its effect on Dreyfus’ profitability.
At the conclusion of these discussions, the Board agreed that it had been furnished with sufficient information to make an informed business decision with respect to continuation of the Investment Advisory
Agreement, with respect to the portfolio. Based on the discussions and considerations as described above, the Board made the following conclusions and determinations.
- The Board concluded that the nature, extent and quality of the ser- vices provided by Dreyfus are adequate and appropriate.
- The Board generally was satisfied with the portfolio’s income per- formance and noted the portfolio manager’s efforts to upgrade the overall credit quality of the portfolio and its effect on the total return performance.
- The Board concluded that the fee paid by the portfolio to Dreyfus was reasonable in light of the services provided, comparative perfor- mance, expense and advisory fee information, including Dreyfus’ reduced undertaking to waive or reimburse certain fess and expenses (which reduced the expense ratio of each class of shares), costs of the services provided and profits to be realized and benefits derived or to be derived by Dreyfus from its relationship with the portfolio.
- The Board determined that the economies of scale which may accrue to Dreyfus and its affiliates in connection with the management of the portfolio had been adequately considered by Dreyfus in connection with the advisory fee rate charged to the portfolio and that, to the extent in the future it were determined that material economies of scale had not been shared with the portfolio, the Board would seek to have those economies of scale shared with the portfolio.
The Board members considered these conclusions and determinations, along with information received on a routine and regular basis throughout the year, and, without any one factor being dispositive, the Board determined that re-approval of the portfolio’s Investment Advisory Agreement was in the best interests of the portfolio and its shareholders.
The Portfolio 43
NOTES
| Dreyfus Variable |
| Investment Fund, |
| Limited Term |
| High Yield Portfolio |
| 200 Park Avenue |
| New York, NY 10166 |
| |
| Investment Adviser |
| The Dreyfus Corporation |
| 200 Park Avenue |
| New York, NY 10166 |
| |
| Custodian |
| Mellon Bank, N.A. |
| One Mellon Bank Center |
| Pittsburgh, PA 15258 |
| Transfer Agent & |
| Dividend Disbursing Agent |
| Dreyfus Transfer, Inc. |
| 200 Park Avenue |
| New York, NY 10166 |
| |
| Distributor |
| Dreyfus Service Corporation |
| 200 Park Avenue |
| New York, NY 10166 |
Telephone 1-800-554-4611 or 516-338-3300
Mail The Dreyfus Family of Funds, 144 Glenn Curtiss Boulevard, Uniondale, NY 11556-0144 Attn: Investments Division
The portfolio files its complete schedule of portfolio holdings with the Securities and Exchange Commission (“SEC”) for the first and third quarters of each fiscal year on Form N-Q. The portfolio’s Forms N-Q are available on the SEC’s website at http://www.sec.gov and may be reviewed and copied at the SEC’s Public Reference Room in Washington, DC. Information on the operation of the Public Reference Room may be obtained by calling 1-202-551-8090.
A description of the policies and procedures that the portfolio uses to determine how to vote proxies relating to portfolio securities, and information regarding how the portfolio voted these proxies for the 12-month period ended June 30, 2006, is available at http://www.dreyfus.com and on the SEC’s website at http://www.sec.gov. The description of the policies and procedures is also available without charge, upon request, by calling 1-800-645-6561.
| © 2006 Dreyfus Service Corporation |

The views expressed in this report reflect those of the portfolio manager only through the end of the period covered and do not necessarily represent the views of Dreyfus or any other person in the Dreyfus organization.Any such views are subject to change at any time based upon market or other conditions and Dreyfus disclaims any responsibility to update such views. These views may not be relied on as investment advice and, because investment decisions for a Dreyfus portfolio are based on numerous factors, may not be relied on as an indication of trading intent on behalf of any Dreyfus portfolio.
Not FDIC-Insured • Not Bank-Guaranteed • May Lose Value
| | | Contents |
| |
| | | T H E P O R T F O L I O |
| |
|
| 2 | | Letter from the Chairman |
| 3 | | Discussion of Performance |
| 6 | | Understanding Your Portfolio’s Expenses |
| 6 | | Comparing Your Portfolio’s Expenses |
| | | With Those of Other Funds |
| 7 | | Statement of Investments |
| 10 | | Statement of Assets and Liabilities |
| 11 | | Statement of Operations |
| 12 | | Statement of Changes in Net Assets |
| 13 | | Financial Highlights |
| 14 | | Notes to Financial Statements |
| 18 | | Proxy Results |
| 19 | | Information About the Review |
| and Approval of the Portfolio’s |
| Investment Advisory Agreement |
| | | F O R M O R E I N F O R M AT I O N |
| |
|
| | | Back Cover |
| Dreyfus Variable Investment Fund, |
| Money Market Portfolio |

LETTER FROM THE CHAIRMAN
We are pleased to present this semiannual report for Dreyfus Variable Investment Fund, Money Market Portfolio, covering the six-month period from January 1, 2006, through June 30, 2006.
Although yields on money market securities continued to rise steadily, other financial markets encountered heightened volatility during the first half of 2006. In the judgment of our Chief Economist, Richard Hoey, the recent turbulence among longer-term bonds reflects shifts in interest-rate and inflation expectations, while the correction in the stock market signals an adjustment among leveraged investors toward lower risk levels as the U.S. economy moves into a more mature phase with milder rates of growth. In our view, corrections such as these generally are healthy mechanisms that help wring speculative excesses from the financial markets, potentially setting the stage for future rallies.
While a recession currently appears unlikely, a number of economic uncertainties remain as investors look toward 2007. Indicators to watch in the months ahead include the outlook for inflation in the United States and overseas, the extent of softness in the U.S. housing market, the impact of slower economic growth on consumer spending, additional changes in short-term interest rates from the Fed and other central banks, and the strength of the U.S. dollar relative to other major currencies. As always, we encourage you to discuss these and other investment-related issues with your financial advisor, who can help you prepare for the challenges and opportunities that lie ahead.
Thank you for your continued confidence and support.


DISCUSSION OF PERFORMANCE
Bernard W. Kiernan, Jr., Senior Portfolio Manager
How did Dreyfus Variable Investment Fund, Money Market Portfolio perform during the period?
During the six-month period ended June 30, 2006, the portfolio produced an annualized yield of 4.18% .Taking into account the effects of compounding, the portfolio also provided an annualized effective yield of 4.26% for the same period.1
What is the portfolio’s investment approach?
The portfolio seeks as high a level of current income as is consistent with the preservation of capital and the maintenance of liquidity. To pursue this goal, the portfolio invests in a diversified selection of high-quality, short-term debt securities, including securities issued or guaranteed by the U.S. government or its agencies or instrumentalities, certificates of deposit, time deposits, bankers’ acceptances and other short-term securities issued by domestic or foreign banks, repurchase agreements, asset-backed securities, domestic and dollar-denominated foreign commercial paper and other short-term corporate and bank obligations of domestic and foreign issuers and dollar-denominated obligations issued or guaranteed by one or more foreign governments or their agencies, including obligations of supranational entities.
Normally, the portfolio invests at least 25% of its net assets in domestic or dollar-denominated foreign bank obligations.
What other factors influenced the portfolio’s performance?
Despite 13 rate hikes since June 2004 that had driven the overnight federal funds to 4.25%, the U.S. economy continued to show signs of strength at the start of 2006. Yet, a change in the language of the announcement accompanying the Federal Reserve Board’s (the “Fed”) December rate hike had convinced some investors that the Fed might pause in its tightening campaign at its January meeting.A lower-than-
The Portfolio 3
DISCUSSION OF PERFORMANCE (continued)
|
expected GDP growth rate of 1.7% for the fourth quarter of 2005 appeared to lend credence to this view.
Expectations of a pause soon dissipated, however, when the unemployment rate slid to 4.7%, a multi-year low. Indeed, the Fed raised the federal funds rate to 4.5% at its January meeting. Although a robust employment report for February helped to address fears of a potential economic slowdown, the Treasury yield curve continued to flatten.At times during the first quarter of 2006, the yield curve inverted, which in the past has been considered a harbinger of recession.
By the end of March, it had become apparent the inversion of the yield curve was more likely a result of robust demand for U.S.Treasury securities from overseas investors, not a sign of impending economic weakness. Accordingly, the Fed increased the federal funds rate to 4.75% in late March. It later was announced that U.S. GDP grew at a robust 5.6% annualized rate during the first quarter.
After a sustained period in which long-term rates remained surprisingly stable in the recovering economy, the U.S. Treasury securities yield curve began to steepen in April as low unemployment, strong consumer confidence and brisk retail sales more than offset reports of a slowing housing market, fuelling inflation concerns. In addition, energy prices surged to new record highs in advance of the summer driving season and amid heightened geopolitical turmoil.
Inflation-related worries continued to mount in May, sparking sharp declines in both stocks and U.S. Treasury securities. Although it was later announced that a lower-than-expected number of jobs was created during the month, the unemployment rate fell to 4.6%, stoking additional concerns that wage inflation might accelerate. Accordingly, the Fed’s rate hike in May, to 5%, was widely anticipated. The Fed’s post-meeting statement left open the possibility that further rate increases may be needed to address inflation risks.
June saw a greater shift in market sentiment, as investors became increasingly risk-averse due to signs of intensifying inflationary pressures and potential economic weakness. U.S. and global equity
markets corrected sharply and bond yields across the yield curve moved higher as investors revised upward their inflation and interest-rate expectations. Although investors widely expected the Fed’s June 29 rate hike to 5.25%, the outlook for future action became cloudier as investors alternately worried that the Fed might become too aggressive, possibly triggering a recession, or too lenient, potentially allowing inflation to take firmer root in the economy.
In this environment, most money market investors continued to focus primarily on securities with maturities of six months or less.We have maintained a similar strategy, generally keeping the portfolio’s weighted average maturity shorter than industry averages.
What is the portfolio’s current strategy?
It is clear to us that monetary policy is now in the neutral range, and any further changes in interest rates are likely to depend on incoming economic data, in our view. A substantial slowdown in economic growth could preclude further rate increases, but additional gains in global commodity prices might make the Fed more inclined to tighten. Therefore, while we have maintained the portfolio’s relatively short weighted average maturity, we are prepared to adjust our strategy when we become convinced that short-term interest rates have peaked.
| | | An investment in the portfolio is not insured or guaranteed by the FDIC or any other |
| | | government agency. Although the portfolio seeks to preserve the value of your investment at $1.00 |
| | | per share, it is possible to lose money by investing in the portfolio. |
| | | The portfolio is only available as a funding vehicle under variable life insurance policies or variable |
| | | annuity contracts issued by insurance companies. Individuals may not purchase shares of the |
| | | portfolio directly. A variable annuity is an insurance contract issued by an insurance company that |
| | | enables investors to accumulate assets on a tax-deferred basis for retirement or other long-term |
| | | goals.The investment objective and policies of Dreyfus Variable Investment Fund, Money Market |
| | | Portfolio made available through insurance products may be similar to other funds/portfolios |
| | | managed or advised by Dreyfus. However, the investment results of the portfolio may be higher or |
| | | lower than, and may not be comparable to, those of any other Dreyfus fund/portfolio. |
| 1 | | Annualized effective yield is based upon dividends declared daily and reinvested monthly. Past |
| | | performance is no guarantee of future results.Yields fluctuate.The portfolio’s performance does not |
| | | reflect the deduction of additional charges and expenses imposed in connection with investing in |
| | | variable insurance contracts, which will reduce returns. |
The Portfolio 5
UNDERSTANDING YOUR PORTFOLIO’S EXPENSES (Unaudited)
As a mutual fund investor, you pay ongoing expenses, such as management fees and other expenses. Using the information below, you can estimate how these expenses affect your investment and compare them with the expenses of other funds.You also may pay one-time transaction expenses, including sales charges (loads) and redemption fees,which are not shown in this section and would have resulted in higher total expenses. For more information, see your portfolio’s prospectus or talk to your financial adviser.
Review your portfolio’s expenses
|
The table below shows the expenses you would have paid on a $1,000 investment in Dreyfus Variable Investment Fund, Money Market Portfolio from January 1, 2006 to June 30, 2006. It also shows how much a $1,000 investment would be worth at the close of the period, assuming actual returns and expenses.
Expenses and Value of a $1,000 Investment assuming actual returns for the six months ended June 30, 2006
| Expenses paid per $1,000 † | | $ 2.91 |
| Ending value (after expenses) | | $1,021.00 |
COMPARING YOUR PORTFOLIO’S EXPENSES WITH THOSE OF OTHER FUNDS (Unaudited)
Using the SEC’s method to compare expenses
The Securities and Exchange Commission (SEC) has established guidelines to help investors assess fund expenses. Per these guidelines, the table below shows your portfolio’s expenses based on a $1,000 investment, assuming a hypothetical 5% annualized return. You can use this information to compare the ongoing expenses (but not transaction expenses or total cost) of investing in the portfolio with those of other funds. All mutual fund shareholder reports will provide this information to help you make this comparison. Please note that you cannot use this information to estimate your actual ending account balance and expenses paid during the period.
Expenses and Value of a $1,000 Investment assuming a hypothetical 5% annualized return for the six months ended June 30, 2006
| Expenses paid per $1,000 † | | $ 2.91 |
| Ending value (after expenses) | | $1,021.92 |
| † Expenses are equal to the portfolio’s annualized expense ratio of .58%, multiplied by the average account value over |
| the period, multiplied by 181/365 (to reflect the one-half year period). |
STATEMENT OF INVESTMENTS
June 30, 2006 (Unaudited)
|
| | | Principal | | |
| Negotiable Bank Certificates of Deposit—3.5% | | Amount ($) | | Value ($) |
| |
| |
|
| Bank of America N.A. | | | | |
| 5.32%, 3/21/07 | | | | |
| (cost $5,000,000) | | 5,000,000 a | | 5,000,000 |
| |
| |
|
| |
| Commercial Paper—59.6% | | | | |
| |
| |
|
| Atlantis One Funding Corp. | | | | |
| 5.34%, 8/21/06 | | 5,000,000 b | | 4,962,529 |
| Barclays U.S. Funding Corp. | | | | |
| 5.11%, 8/8/06 | | 5,000,000 | | 4,973,347 |
| Bear Stearns Cos. Inc. | | | | |
| 5.35%, 8/21/06 | | 5,000,000 | | 4,962,458 |
| Citigroup Global Markets Holdings Inc. | | | | |
| 5.11%, 8/8/06 | | 5,000,000 | | 4,973,374 |
| Concord Minutemen Capital Co. LLC | | | | |
| 5.34%, 8/21/06 | | 5,000,000 b | | 4,962,529 |
| CRC Funding LLC | | | | |
| 5.33%, 8/17/06 | | 5,000,000 b | | 4,965,468 |
| Deutsche Bank Financial LLC | | | | |
| 5.30%, 7/3/06 | | 5,000,000 | | 4,998,528 |
| Gemini Securitization Corp., LLC | | | | |
| 5.11%, 8/2/06 | | 5,000,000 b | | 4,977,600 |
| Grampian Funding Ltd. | | | | |
| 5.35%, 8/22/06 | | 5,000,000 b | | 4,961,722 |
| Greenwich Capital Holdings Inc. | | | | |
| 5.27%, 7/3/06 | | 5,000,000 | | 4,998,536 |
| Harrier Finance Funding Ltd. | | | | |
| 5.20%, 8/29/06 | | 5,000,000 b | | 4,957,963 |
| K2 (USA) LLC | | | | |
| 5.11%, 8/7/06 | | 4,800,000 b | | 4,775,087 |
| Picaros Funding LLC | | | | |
| 5.11%, 8/3/06 | | 5,000,000 b | | 4,976,900 |
| Premier Asset Collateralized Entity LLC | | | | |
| 5.12%, 8/4/06 | | 5,000,000 b | | 4,976,106 |
| Scaldis Capital Ltd. | | | | |
| 5.10%, 8/3/06 | | 5,000,000 b | | 4,976,922 |
The Portfolio 7
STATEMENT OF INVESTMENTS (Unaudited) (continued)
| | | Principal | | |
| Commercial Paper (continued) | | Amount ($) | | Value ($) |
| |
| |
|
| Sigma Finance Inc. | | | | |
| 5.20%, 9/1/06 | | 5,000,000 b | | 4,955,825 |
| UBS Finance Delaware LLC | | | | |
| 5.27%, 7/3/06 | | 5,000,000 | | 4,998,536 |
| Total Commercial Paper | | | | |
| (cost $84,353,430) | | | | 84,353,430 |
| |
| |
|
| |
| |
| Corporate Notes—5.7% | | | | |
| |
| |
|
| Toyota Motor Credit Corp. | | | | |
| 5.06%, 8/8/06 | | 4,000,000 a,b | | 4,000,000 |
| Wells Fargo & Co. | | | | |
| 5.09%, 7/3/06 | | 4,000,000 a | | 4,000,000 |
| Total Corporate Notes | | | | |
| (cost $8,000,000) | | | | 8,000,000 |
| |
| |
|
| |
| |
| Time Deposits—24.8% | | | | |
| |
| |
|
| AmSouth Bank, Birmingham, AL (Grand Cayman) | | |
| 5.28%, 7/3/06 | | 5,000,000 | | 5,000,000 |
| Branch Banking & Trust Co. (Grand Cayman) | | |
| 5.25%, 7/3/06 | | 5,000,000 | | 5,000,000 |
| Key Bank U.S.A., N.A. (Grand Cayman) | | | | |
| 5.28%, 7/3/06 | | 5,000,000 | | 5,000,000 |
| M&I Marshall & Ilsley Bank Milwaukee, WI | | | | |
| (Grand Cayman) | | | | |
| 5.25%, 7/3/06 | | 5,000,000 | | 5,000,000 |
| Manufacturers & Traders Trust Company | | | | |
| (Grand Cayman) | | | | |
| 5.25%, 7/3/06 | | 5,000,000 | | 5,000,000 |
| National City Bank, Cleveland, OH | | | | |
| (Grand Cayman) | | | | |
| 5.25%, 7/3/06 | | 5,000,000 | | 5,000,000 |
| State Street Bank and Trust Co., Boston, MA | | |
| (Grand Cayman) | | | | |
| 5.31%, 7/3/06 | | 5,000,000 | | 5,000,000 |
| Total Time Deposits | | | | |
| (cost $35,000,000) | | | | 35,000,000 |
| | | | | | | Principal | | |
| Repurchase Agreement—7.1% | | Amount ($) | | Value ($) |
| |
| |
|
| Morgan Stanley | | | | | | |
| 5.20%, dated 6/30/06, due 7/3/06 in the amount of | | |
| $10,004,333 (fully collateralized by $11,060,000 | | |
| Federal Home Loan Bank System, Bonds, 5%-6.20%, | | |
| due 5/21/18-11/23/20, value $10,246,627) | | |
| (cost $10,000,000) | | | | 10,000,000 | | 10,000,000 |
| |
| |
| |
|
| |
| Total Investments (cost $142,353,430) | | 100.7% | | 142,353,430 |
| |
| Liabilities, Less Cash and Receivables | | (.7%) | | (994,026) |
| |
| Net Assets | | | | 100.0% | | 141,359,404 |
| |
| a | | Variable rate security—interest rate subject to periodic change. | | |
| b | | Securities exempt from registration under Rule 144A of the Securities Act of 1933.These securities may be resold in |
| | | transactions exempt from registration, normally to qualified institutional buyers. At June 30, 2006, these securities |
| | | amounted to $58,448,651 or 41.3% of net assets. | | | | |
| |
| |
| |
|
| |
| |
| |
| |
| Portfolio Summary (Unaudited) † | | | | |
| |
| | | | | Value (%) | | | | Value (%) |
| |
| |
| |
| |
|
| Banking | | 59.4 | | Asset-Backed/Securities | | |
| Asset-Backed/Structured | | | | Arbitrage Vehicles | | 3.5 |
| Investment Vehicles | | 13.9 | | Finance | | 2.8 |
| Brokerage Firms | | 10.6 | | | | |
| Asset-Backed/Multi-Seller Programs | | 10.5 | | | | 100.7 |
| |
| † | | Based on net assets. | | | | | | |
| See notes to financial statements. | | | | | | |
The Portfolio 9
STATEMENT OF ASSETS AND LIABILITIES
June 30, 2006 (Unaudited)
| | | Cost | | Value |
| |
| |
|
| Assets ($): | | | | |
| Investments in securities-See Statement of Investments | | 142,353,430 | | 142,353,430 |
| Cash | | | | 225,902 |
| Interest receivable | | | | 79,719 |
| Prepaid expenses | | | | 12,214 |
| | | | | 142,671,265 |
| |
| |
|
| Liabilities ($): | | | | |
| Due to The Dreyfus Corporation and affiliates—Note 2(a) | | | | 60,454 |
| Payable for shares of Beneficial Interest redeemed | | | | 1,176,804 |
| Accrued expenses | | | | 74,603 |
| | | | | 1,311,861 |
| |
| |
|
| Net Assets ($) | | | | 141,359,404 |
| |
| |
|
| Composition of Net Assets ($): | | | | |
| Paid-in capital | | | | 141,382,233 |
| Accumulated net realized gain (loss) on investments | | | | (22,829) |
| |
| |
|
| Net Assets ($) | | | | 141,359,404 |
| |
| |
|
| Shares Outstanding | | | | |
| (unlimited number of $.001 par value shares of Beneficial Interest authorized) | | 141,382,233 |
| Net Asset Value, offering and redemption price per share ($) | | 1.00 |
See notes to financial statements.
|
STATEMENT OF OPERATIONS
Six Months Ended June 30, 2006 (Unaudited)
|
| Investment Income ($): | | |
| Interest Income: | | 3,124,428 |
| Expenses: | | |
| Investment advisory fee—Note 2(a) | | 326,817 |
| Auditing fees | | 21,582 |
| Custodian fees | | 11,992 |
| Trustees’ fees and expenses—Note 2(b) | | 8,733 |
| Prospectus and shareholders’ reports | | 4,909 |
| Shareholder servicing costs—Note 2(a) | | 3,182 |
| Legal fees | | 1,858 |
| Miscellaneous | | 3,823 |
| Total Expenses | | 382,896 |
| Less—reduction in custody fees due to | | |
| earnings credits—Note 1(b) | | (963) |
| Net Expenses | | 381,933 |
| Investment Income—Net, representing net increase | | |
| in net assets resulting from operations | | 2,742,495 |
See notes to financial statements.
|
The Portfolio 11
STATEMENT OF CHANGES IN NET ASSETS
| | | Six Months Ended | | |
| | | June 30, 2006 | | Year Ended |
| | | (Unaudited) | | December 31, 2005 |
| |
| |
|
| Operations ($): | | | | |
| Investment income—net | | 2,742,495 | | 3,347,189 |
| Net realized gain (loss) on investments | | — | | (65) |
| Net Increase (Decrease) in Net Assets | | | | |
| Resulting from Operations | | 2,742,495 | | 3,347,124 |
| |
| |
|
| Dividends to Shareholders from ($): | | | | |
| Investment income—net | | (2,755,898) | | (3,333,786) |
| |
| |
|
| Beneficial Interest Transactions ($1.00 per share): | | |
| Net proceeds from shares sold | | 84,340,135 | | 224,565,495 |
| Dividends reinvested | | 2,757,393 | | 3,333,786 |
| Cost of shares redeemed | | (76,934,672) | | (200,931,351) |
| Increase (Decrease) in Net Assets from | | | | |
| Beneficial Interest Transactions | | 10,162,856 | | 26,967,930 |
| Total Increase (Decrease) in Net Assets | | 10,149,453 | | 26,981,268 |
| |
| |
|
| Net Assets ($): | | | | |
| Beginning of Period | | 131,209,951 | | 104,228,683 |
| End of Period | | 141,359,404 | | 131,209,951 |
| Undistributed investment income—net | | — | | 13,403 |
See notes to financial statements.
|
The following table describe the performance for the fiscal periods indicated.Total return shows how much your investment in the portfolio would have increased (or decreased) during each period, assuming you had reinvested all dividends and dis-tributions.These figures have been derived from the portfolio’s financial statements.
| | | Six Months Ended | | | | | | | | | | |
| | | June 30, 2006 | | | | Year Ended December 31, | | |
| | | |
| |
| |
|
| | | (Unaudited) | | 2005 | | 2004 | | 2003 | | 2002 | | 2001 |
| |
| |
| |
| |
| |
| |
|
| Per Share Data ($): | | | | | | | | | | | | |
| Net asset value, | | | | | | | | | | | | |
| beginning of period | | 1.00 | | 1.00 | | 1.00 | | 1.00 | | 1.00 | | 1.00 |
| Investment Operations: | | | | | | | | | | | | |
| Investment income—net | | .021 | | .026 | | .008 | | .007 | | .015 | | .039 |
| Distributions: | | | | | | | | | | | | |
| Dividends from | | | | | | | | | | | | |
| investment income—net | | (.021) | | (.026) | | (.008) | | (.007) | | (.015) | | (.039) |
| Net asset value, end of period | | 1.00 | | 1.00 | | 1.00 | | 1.00 | | 1.00 | | 1.00 |
| |
| |
| |
| |
| |
| |
|
| Total Return (%) | | 4.23a | | 2.65 | | .80 | | .70 | | 1.46 | | 3.97 |
| |
| |
| |
| |
| |
| |
|
| Ratios/Supplemental Data (%): | | | | | | | | | | |
| Ratio of total expenses | | | | | | | | | | | | |
| to average net assets | | .59a | | .59 | | .60 | | .57 | | .56 | | .58 |
| Ratio of net expenses | | | | | | | | | | | | |
| to average net assets | | .58a | | .59 | | .60 | | .57 | | .56 | | .58 |
| Ratio of net investment income | | | | | | | | | | |
| to average net assets | | 4.20a | | 2.66 | | .77 | | .71 | | 1.44 | | 3.72 |
| |
| |
| |
| |
| |
| |
|
| Net Assets, end of period | | | | | | | | | | | | |
| ($ x 1,000) | | 141,359 | | 131,210 | | 104,229 | | 152,559 | | 196,217 | | 190,449 |
| |
| a Annualized. | | | | | | | | | | | | |
| See notes to financial statements. | | | | | | | | | | | | |
The Portfolio 13
NOTES TO FINANCIAL STATEMENTS (Unaudited)
NOTE 1—Significant Accounting Policies:
Dreyfus Variable Investment Fund (the “fund”) is registered under the Investment Company Act of 1940, as amended (the “Act”), as an open-end management investment company, operating as a series company currently offering twelve series, including the Money Market Portfolio (the “portfolio”).The portfolio is only offered to separate accounts established by insurance companies to fund variable annuity contracts and variable life insurance policies.The portfolio is a diversified series.The portfolio’s investment objective is to provide as high a level of current income as is consistent with the preservation of capital and the maintenance of liquidity.The Dreyfus Corporation (the “Manager” or “Dreyfus”) serves as the portfolio’s investment adviser. The Manager is a wholly-owned subsidiary of Mellon Financial Corporation (“Mellon Financial”). Dreyfus Service Corporation (the “Distributor”), a wholly-owned subsidiary of the Manager, is the distributor of the portfolio’s shares, which are sold without a sales charge.
It is the portfolio’s policy to maintain a continuous net asset value per share of $1.00; the portfolio has adopted certain investment, portfolio valuation and dividend and distribution policies to enable it to do so. There is no assurance, however, that the portfolio will be able to maintain a stable net asset value per share of $1.00.
The fund accounts separately for the assets, liabilities and operations of each series. Expenses directly attributable to each series are charged to that series’ operations; expenses which are applicable to all series are allocated among them on a pro rata basis.
The portfolio’s financial statements are prepared in accordance with U.S. generally accepted accounting principles, which may require the use of management estimates and assumptions.Actual results could differ from those estimates.
The fund enters into contracts that contain a variety of indemnifica-tions.The portfolio’s maximum exposure under these arrangements is unknown.The portfolio does not anticipate recognizing any loss related to these arrangements.
(a) Portfolio valuation: Investments in securities are valued at amortized cost in accordance with Rule 2a-7 of the Act, which has been determined by the fund’s Board of Trustees to represent the fair value of the portfolio’s investments.
(b) Securities transactions and investment income: Securities transactions are recorded on a trade date basis. Realized gain and loss from securities transactions are recorded on the identified cost basis. Interest income, adjusted for accretion of discount and amortization of premium on investments, is earned from settlement date and recognized on the accrual basis. Cost of investments represents amortized cost.
The portfolio has an arrangement with the custodian bank whereby the portfolio receives earnings credits from the custodian when positive cash balances are maintained, which are used to offset custody fees. For financial reporting purposes, the portfolio includes net earnings credits as an expense offset in the Statement of Operations.
The portfolio may enter into repurchase agreements with financial institutions, deemed to be creditworthy by the Manager, subject to the seller’s agreement to repurchase and the portfolio’s agreement to resell such securities at a mutually agreed upon price. Securities purchased subject to repurchase agreements are deposited with the portfolio’s custodian and, pursuant to the terms of the repurchase agreement, must have an aggregate market value greater than or equal to the terms of the repurchase price plus accrued interest at all times. If the value of the underlying securities falls below the value of the repurchase price plus accrued interest, the portfolio will require the seller to deposit additional collateral by the next business day. If the request for additional collateral is not met, or the seller defaults on its repurchase obligation, the portfolio maintains its right to sell the underlying securities at market value and may claim any resulting loss against the seller.
(c) Dividends to shareholders: It is the policy of the portfolio to declare dividends daily from investment income-net. Such dividends are paid monthly. Dividends from net realized capital gain, if any, are normally declared and paid annually, but the portfolio may make dis-
The Portfolio 15
NOTES TO FINANCIAL STATEMENTS (Unaudited) (continued)
tributions on a more frequent basis to comply with the distribution requirements of the Internal Revenue Code of 1986, as amended (the “Code”). To the extent that net realized capital gain can be offset by capital loss carryovers, it is the policy of the portfolio not to distribute such gain.
(d) Federal income taxes: It is the policy of the portfolio to continue to qualify as a regulated investment company, if such qualification is in the best interests of its shareholders, by complying with the applicable provisions of the Code, and to make distributions of taxable income sufficient to relieve it from substantially all federal income and excise taxes.
The portfolio has an unused capital loss carryover of $22,898 available to be applied against future net securities profits, if any, realized subsequent to December 31, 2005. If not applied, $783 of the carryover expires in fiscal 2007, $11,060 expires in fiscal 2008, $10,973 expires in fiscal 2010, $17 expires in fiscal 2011 and $65 expires in fiscal 2013.
The tax character of distributions paid to shareholders during the fiscal year ended December 31, 2005, were all ordinary income.The tax character of current year distributions will be determined at the end of the current fiscal year.
At June 30,2006,the cost of investments for federal income tax purposes was substantially the same as the cost for financial reporting purposes (see the Statement of Investments).
NOTE 2—Investment Advisory Fee and Other Transactions With Affiliates:
(a) Pursuant to an Investment Advisory Agreement with the Manager, the investment advisory fee is computed at the annual rate of .50% of the value of the portfolio’s average daily net assets and is payable monthly.
The portfolio compensates Dreyfus Transfer, Inc., a wholly-owned subsidiary of the Manager, under a transfer agency agreement for providing personnel and facilities to perform transfer agency services for the portfolio. During the period ended June 30, 2006, the portfolio was charged $115 pursuant to the transfer agency agreement.
During the period ended June 30, 2006, the portfolio was charged $1,926 for services performed by the Chief Compliance Officer.
The components of Due to The Dreyfus Corporation and affiliates in the Statement of Assets and Liabilities consist of: investment advisory fee $58,478, chief compliance officer fees $1,926 and transfer agency per account fees $50.
(b) Each Board member also serves as a Board member of other funds within the Dreyfus complex. Annual retainer fees and attendance fees are allocated to each fund based on net assets.
The Portfolio 17
PROXY RESULTS ( U n a u d i t e d )
|
Dreyfus Variable Investment Fund held a special meeting of shareholders on June 29, 2006.The proposal considered at the meeting, and the results, are as follows:
| | | | | Shares | | |
| |
| |
| |
|
| | | For | | | | Authority Withheld |
| |
| |
| |
|
| To elect additional Board Members: | | | | | | |
| Peggy C. Davis † | | 171,078,926.558 | | | | 7,687,714.085 |
| Joseph S. DiMartino | | 170,946,484.400 | | | | 7,820,156.243 |
| David P. Feldman | | 170,959,920.714 | | | | 7,806,719.929 |
| Ehud Houminer † | | 170,132,086.682 | | | | 8,634,553.961 |
| Gloria Messinger † | | 170,187,240.710 | | | | 8,579,399.933 |
| Anne Wexler † | | 170,212,607.472 | | | | 8,554,033.171 |
| † Each will serve as an Independent Board member of the fund commencing, subject to the discretion of the Board, on |
| or about January 1, 2007. |
| In addition to Joseph S. DiMartino and David P. Feldman, James F. Henry, Dr. Paul A. Marks and Dr. Martin |
| Peretz continue as Board members of the fund. |
INFORMATION ABOUT THE REVIEW AND APPROVAL OF THE PORTFOLIO’S
I N V E S T M E N T A D V I S O R Y A G R E E M E N T (Unaudited)
At a meeting of the fund’s Board of Trustees held on June 7 and 8, 2006, the Board considered the re-approval for an annual period (through July 31, 2007) of the fund’s Investment Advisory Agreement with Dreyfus for the portfolio, pursuant to which Dreyfus provides the portfolio with investment advisory and administrative services. The Board members, none of whom are “interested persons” (as defined in the Investment Company Act of 1940, as amended) of the fund were assisted in their review by independent legal counsel and met with counsel in executive session separate from representatives of Dreyfus.
Analysis of Nature, Extent and Quality of Services Provided to the Portfolio. The Board members received a presentation from representatives of Dreyfus regarding services provided to the portfolio and other funds in the Dreyfus fund complex, and discussed the nature, extent and quality of the services provided to the portfolio pursuant to its Investment Advisory Agreement. Dreyfus’ representatives reviewed the portfolio’s distribution of accounts and the relationships Dreyfus has with various intermediaries and the different needs of each.The Board noted that the portfolio’s shares were offered only to separate accounts established by insurance companies to fund variable annuity contracts and variable life insurance policies. Dreyfus’ representatives noted the diversity of distribution among the funds in the Dreyfus fund complex, and Dreyfus’ corresponding need for broad, deep, and diverse resources to be able to provide ongoing shareholder services to each distribution channel, including that of the portfolio. Dreyfus also provided the number of separate accounts investing in the portfolio, as well as the portfolio’s asset size.
The Board members also considered Dreyfus’ research and portfolio management capabilities and that Dreyfus also provides oversight of day-to-day portfolio operations, including fund accounting and administration and assistance in meeting legal and regulatory requirements. The Board members also considered Dreyfus’ extensive administrative, accounting and compliance infrastructure.
The Portfolio 19
I N FO R M AT I O N A B O U T T H E R E V I E W A N D A P P R OVA L O F T H E P O R T FO L I O ’ S I N V E S T M E N T A DV I S O RY A G R E E M E N T ( U n a u d i t e d ) ( c o n t i n u e d )
Comparative Analysis of the Portfolio’s Performance and Advisory Fee and Expense Ratio. The Board members reviewed the portfolio’s performance and placed significant emphasis on comparisons to a group of money market funds underlying variable insurance products (the “Performance Group”) and to a larger universe of funds, consisting of all money market funds underlying variable insurance products (the “Performance Universe”) selected and provided by Lipper, Inc., an independent provider of investment company data.The Board was provided with a description of the methodology Lipper used to select the Performance Group and Performance Universe, as well as the Expense Group and Expense Universe (discussed below). The Board members discussed the results of the comparisons for various periods ended April 30, 2006, and noted that the portfolio’s total return performance as compared to the Performance Group and the Performance Universe variously was at, below and above the medians for all periods; the Board also noted that, in those instances where the portfolio’s performance was below the medians, in several cases there was a spread of only a few basis points between the fund’s performance and median performance. The Dreyfus representatives also presented the Board with the portfolio’s total return performance and the quartile, percentile and rank of the portfolio’s total return within its Lipper category (as provided by Lipper) for certain other periods ended April 30, 2006, and noted the generally improving performance for more recent periods.The Dreyfus representatives discussed managing the fund in the rising interest rate environment that has existed over the last two years.
The Board members also discussed the portfolio’s advisory fee and the expense ratio and reviewed the range of advisory fees and expense ratios of a comparable group of funds (the “Expense Group”) and a broader group of funds (the “Expense Universe”), each selected and provided by Lipper. The Board members noted that the portfolio’s advisory fee and expense ratio were higher than its Expense Group and Expense Universe medians.
Representatives of Dreyfus stated there are no other mutual funds managed by Dreyfus or its affiliates with similar investment objectives, policies and strategies and included within the portfolio’s Lipper category and no other accounts managed by Dreyfus or its affiliates with similar investment objectives, policies and strategies as the portfolio.
Analysis of Profitability and Economies of Scale. Dreyfus’ representatives reviewed the dollar amount of expenses allocated and profit received by Dreyfus and the method used to determine such expenses and profit.The Board considered information, previously provided and discussed, prepared by an independent consulting firm regarding Dreyfus’ approach to allocating costs to, and determining the profitability of, individual funds and the entire Dreyfus mutual fund complex. The Board members also considered that the methodology had also been reviewed by an independent registered public accounting firm which, like the consultant, found the methodology to be reasonable. The consulting firm also analyzed where any economies of scale might emerge in connection with the management of the portfolio. The Board members evaluated the profitability analysis in light of the relevant circumstances for the portfolio and the extent to which economies of scale would be realized if the portfolio grows and whether fee levels reflect these economies of scale for the benefit of portfolio investors. The Board members also considered potential benefits to Dreyfus from acting as investment adviser and noted that there were no soft dollar arrangements with respect to trading the portfolio’s investments.
It was noted that the Board members should consider Dreyfus’ profitability with respect to the portfolio as part of their evaluation of whether the fees under the Investment Advisory Agreement bear a reasonable relationship to the mix of services provided by Dreyfus, including the nature, extent and quality of such services and that a discussion of economies of scale is predicated on increasing assets and that, if a fund’s assets had been decreasing, the possibility that Dreyfus may have
The Portfolio 21
I N FO R M AT I O N A B O U T T H E R E V I E W A N D A P P R OVA L O F T H E P O R T FO L I O ’ S I N V E S T M E N T A DV I S O RY A G R E E M E N T ( U n a u d i t e d ) ( c o n t i n u e d )
realized any economies of scale would be less. It also was noted that the profitability percentage for managing the portfolio was within ranges determined by appropriate court cases to be reasonable given the services rendered and generally superior service levels provided by Dreyfus.
At the conclusion of these discussions, the Board agreed that it had been furnished with sufficient information to make an informed business decision with respect to continuation of the Investment Advisory Agreement, with respect to the portfolio. Based on the discussions and considerations as described above, the Board made the following conclusions and determinations.
- The Board concluded that the nature, extent and quality of the ser- vices provided by Dreyfus are adequate and appropriate.
- The Board was generally satisfied with the portfolio’s performance.
- The Board concluded that the fee paid by the portfolio to Dreyfus was reasonable in light of the services provided, comparative perfor- mance, expense and advisory fee information, including costs of the services provided and profits to be realized and benefits derived or to be derived by Dreyfus from its relationship with the portfolio.
- The Board determined that the economies of scale which may accrue to Dreyfus and its affiliates in connection with the management of the portfolio had been adequately considered by Dreyfus in connection with the advisory fee rate charged to the portfolio and that, to the extent in the future it were determined that material economies of scale had not been shared with the portfolio, the Board would seek to have those economies of scale shared with the portfolio.
The Board members considered these conclusions and determinations, along with information received on a routine and regular basis throughout the year, and, without any one factor being dispositive, the Board determined that re-approval of the portfolio’s Investment Advisory Agreement, with respect to the portfolio, was in the best interests of the portfolio and its shareholders.
NOTES
| Dreyfus Variable |
| Investment Fund, |
| Money Market Portfolio |
| 200 Park Avenue |
| New York, NY 10166 |
| |
| Investment Adviser |
| The Dreyfus Corporation |
| 200 Park Avenue |
| New York, NY 10166 |
| |
| Custodian |
| The Bank of New York |
| One Wall Street |
| New York, NY 10286 |
| Transfer Agent & |
| Dividend Disbursing Agent |
| Dreyfus Transfer, Inc. |
| 200 Park Avenue |
| New York, NY 10166 |
| |
| Distributor |
| Dreyfus Service Corporation |
| 200 Park Avenue |
| New York, NY 10166 |
Telephone 1-800-554-4611 or 516-338-3300
Mail The Dreyfus Family of Funds, 144 Glenn Curtiss Boulevard, Uniondale, NY 11556-0144 Attn: Investments Division
The portfolio files its complete schedule of portfolio holdings with the Securities and Exchange Commission (“SEC”) for the first and third quarters of each fiscal year on Form N-Q. The portfolio’s Forms N-Q are available on the SEC’s website at http://www.sec.gov and may be reviewed and copied at the SEC’s Public Reference Room in Washington, DC. Information on the operation of the Public Reference Room may be obtained by calling 1-202-551-8090.
Information regarding how the fund voted proxies relating to portfolio securities for the 12-month period ended June 30, 2006, is available on the SEC’s website at http://www.sec.gov and without charge, upon request, by calling 1-800-645-6561.
| © 2006 Dreyfus Service Corporation |


The views expressed in this report reflect those of the portfolio manager only through the end of the period covered and do not necessarily represent the views of Dreyfus or any other person in the Dreyfus organization.Any such views are subject to change at any time based upon market or other conditions and Dreyfus disclaims any responsibility to update such views. These views may not be relied on as investment advice and, because investment decisions for a Dreyfus portfolio are based on numerous factors, may not be relied on as an indication of trading intent on behalf of any Dreyfus portfolio.
Not FDIC-Insured • Not Bank-Guaranteed • May Lose Value
| | | Contents |
| |
| | | T H E P O R T F O L I O |
| |
|
| 2 | | Letter from the Chairman |
| 3 | | Discussion of Performance |
| 6 | | Understanding Your Portfolio’s Expenses |
| 6 | | Comparing Your Portfolio’s Expenses |
| | | With Those of Other Funds |
| 7 | | Statement of Investments |
| 28 | | Statement of Financial Futures |
| 28 | | Statement of Options Written |
| 29 | | Statement of Assets and Liabilities |
| 30 | | Statement of Operations |
| 31 | | Statement of Changes in Net Assets |
| 33 | | Financial Highlights |
| 37 | | Notes to Financial Statements |
| 49 | | Proxy Results |
| 50 | | Information About the Review |
| and Approval of the Portfolio’s |
| Investment Advisory Agreement |
| | | F O R M O R E I N F O R M AT I O N |
| |
|
| | | Back Cover |
| Dreyfus Variable Investment Fund, |
| Quality Bond Portfolio |

LETTER FROM THE CHAIRMAN
We are pleased to present this semiannual report for Dreyfus Variable Investment Fund, Quality Bond Portfolio, covering the six-month period from January 1, 2006, through June 30, 2006.
After a long period of remarkable resilience, the U.S. bond market encountered heightened volatility during the first half of 2006, as investors reacted to each new release of economic data or comment from members of the Federal Reserve Board (the “Fed”). The economic data often painted a contradictory picture, sometimes suggesting that inflationary pressures were increasing and, at other times, seeming to point to milder economic growth.The Fed also sent mixed signals as investors attempted to determine whether the U.S. central bank might pause in its tightening campaign after seventeen consecutive rate hikes since June 2004.
In the judgment of our Chief Economist, Richard Hoey, the U.S. economy may be moving into a more mature, slower-growth phase. However, a number of economic uncertainties remain. Indicators to watch in the months ahead include the outlook for inflation, the extent of softness in the U.S. housing market, the impact of slower economic growth on consumer spending, additional changes in interest rates from the Fed and other central banks, and the strength of the U.S. dollar relative to other major currencies.As always, we encourage you to discuss these and other investment-related issues with your financial advisor, who can help you prepare for the challenges and opportunities that lie ahead.
For information about how the portfolio performed during the reporting period, as well as market perspectives, we have provided a Discussion of Performance given by the portfolio manager.
Thank you for your continued confidence and support.


DISCUSSION OF PERFORMANCE
Catherine Powers, Portfolio Manager
How did Dreyfus Variable Investment Fund, Quality Bond Portfolio perform relative to its benchmark?
For the six-month period ended June 30, 2006, the portfolio’s Initial shares achieved a total return of –0.84%, and its Service shares achieved a total return of –0.97% .1 The portfolio produced aggregate income dividends of $0.25 per share and $0.23 per share for its Initial and Service shares, respectively. In comparison, the portfolio’s benchmark, the Lehman Brothers U.S. Aggregate Index (the “Index”), achieved a total return of –0.72% for the same period.2 The portfolio’s returns were slightly lower that the benchmark, which does not reflect portfolio fees and expenses.
Amid heightened inflation concerns and a strong economic backdrop, bond yields moved significantly higher and prices fell over the past six months resulting in negative nominal returns for both the portfolio and the Index.
What is the portfolio’s investment approach?
The portfolio seeks to maximize total return consisting of capital appreciation and current income. To achieve this objective, the portfolio normally invests at least 80% of its assets in bonds, including corporate bonds, mortgage-related securities, collateralized mortgage obligations and asset-backed securities that, when purchased, are A-rated or better or what we believe are the unrated equivalent, and in securities issued or guaranteed by the U.S. government or its agencies or its instrumentalities. The portfolio may also invest up to 10% of its net assets in non-dollar-denominated foreign securities and up to 20% of its assets in the securities of foreign issues collectively.
The Portfolio 3
DISCUSSION OF PERFORMANCE (continued)
|
What other factors affected the portfolio’s performance?
As it has since June 2004, the Federal Reserve Board (the “Fed”) continued to raise short-term interest rates, driving the overnight federal funds rate to 5.25% by the reporting period’s end. Despite rising interest rates, the U.S. economy continued to grow at a fairly robust pace, expanding by 5.6% in the first quarter alone.
Although earlier in the year, Fed Chairman Bernanke hinted at an eventual pause in rate hikes, investor sentiment shifted with rising inflation data. Hawkish comments by Bernanke and other Fed governors were interpreted as a signal that interest rates might move higher than previously expected, especially in the wake of rising energy prices.
Over the first half of the year, broad sectors marginally outperformed comparable duration Treasuries. Lower-quality bonds posted stronger excess returns versus Treasuries given their incremental yield advantage over higher-quality sectors. Emerging market bonds gave up some of their gains from earlier in the year as fears of more rate hikes by both the Fed and central banks abroad resulted in significant selling pressure.
During a period of high event risk as evidenced by leveraged buy-outs and mega-mergers, the portfolio benefited from our strong security selection among investment-grade corporate bonds. The portfolio’s overweight position in high yield also positively contributed to performance. A tactical allocation to Treasury Inflation Protected Securities, which benefited from high inflation accruals and rising inflation expectations, has added to excess returns. An underweight position in mortgage-backed securities relative to an overweight position in commercial mortgages and asset-backed securities also benefited returns. In international bond markets, the portfolio profited from defensive positions in Europe and Japan that have capitalized on rising rates abroad.
What is the portfolio’s current strategy?
When the Fed implemented its seventeenth consecutive rate hike in late June, changes in the accompanying statement suggested that the
tightening campaign may be nearing completion. In our view, further rate increases will depend on incoming economic data, especially on the inflation front.
We have maintained the portfolio’s bulleted yield-curve positioning and look for an opportunity to extend duration once the Fed pauses. In an environment where risk premiums are low but event risk is high, we are finding opportunities in the credit default market to buy protection for companies where we anticipate a negative event will cause wider spreads.We also favor “REITS” with covenants to protect bondholders. We have sought to take advantage of market volatility in emerging markets by establishing attractively priced positions in Brazil and Mexico.
| | | The portfolio is only available as a funding vehicle under variable life insurance policies or variable |
| | | annuity contracts issued by insurance companies. Individuals may not purchase shares of the |
| | | portfolio directly. A variable annuity is an insurance contract issued by an insurance company that |
| | | enables investors to accumulate assets on a tax-deferred basis for retirement or other long-term |
| | | goals.The investment objective and policies of Dreyfus Variable Investment Fund, Quality Bond |
| | | Portfolio may be similar to other funds/portfolios managed or advised by Dreyfus. However, the |
| | | investment results of the portfolio may be higher or lower than, and may not be comparable to, |
| | | those of any other Dreyfus fund/portfolio. |
| 1 | | Total return includes reinvestment of dividends and any capital gains paid. Past performance is no |
| | | guarantee of future results. Share price and investment return fluctuate such that upon redemption, |
| | | portfolio shares may be worth more or less than their original cost.The portfolio’s performance does |
| | | not reflect the deduction of additional charges and expenses imposed in connection with investing |
| | | in variable insurance contracts, which will reduce returns. Return figures provided reflect the |
| | | absorption of certain portfolio expenses by The Dreyfus Corporation pursuant to an agreement in |
| | | effect through June 30, 2007, at which time it may be extended, modified or terminated. Had |
| | | these expenses not been absorbed, the portfolio’s returns would have been lower. |
| 2 | | SOURCE: LIPPER INC. — Reflects reinvestment of dividends and, where applicable, capital |
| | | gain distributions.The Lehman Brothers U.S. Aggregate Index is a widely accepted, unmanaged |
| | | total return index of corporate, U.S. government and U.S. government agency debt instruments, |
| | | mortgage-backed securities and asset-backed securities with an average maturity of 1-10 years. |
The Portfolio 5
| UNDERSTANDING YOUR |
| PORTFOLIO’S EXPENSES (Unaudited) |
As a mutual fund investor, you pay ongoing expenses, such as management fees and other expenses. Using the information below, you can estimate how these expenses affect your investment and compare them with the expenses of other funds.You also may pay one-time transaction expenses, including sales charges (loads) and redemption fees,which are not shown in this section and would have resulted in higher total expenses. For more information, see your portfolio’s prospectus or talk to your financial adviser.
Review your portfolio’s expenses
|
The table below shows the expenses you would have paid on a $1,000 investment in Dreyfus Variable Investment Fund, Quality Bond Portfolio from January 1, 2006 to June 30, 2006. It also shows how much a $1,000 investment would be worth at the close of the period, assuming actual returns and expenses.
| Expenses and Value of a $1,000 Investment | | |
| assuming actual returns for the six months ended June 30, 2006 | | |
| | | Initial Shares | | Service Shares |
| |
| |
|
| Expenses paid per $1,000 † | | $ 2.96 | | $ 4.19 |
| Ending value (after expenses) | | $991.60 | | $990.30 |
| COMPARING YOUR PORTFOLIO’S EXPENSES |
| WITH THOSE OF OTHER FUNDS (Unaudited) |
Using the SEC’s method to compare expenses
The Securities and Exchange Commission (SEC) has established guidelines to help investors assess fund expenses. Per these guidelines, the table below shows your portfolio’s expenses based on a $1,000 investment, assuming a hypothetical 5% annualized return. You can use this information to compare the ongoing expenses (but not transaction expenses or total cost) of investing in the portfolio with those of other funds. All mutual fund shareholder reports will provide this information to help you make this comparison. Please note that you cannot use this information to estimate your actual ending account balance and expenses paid during the period.
Expenses and Value of a $1,000 Investment assuming a hypothetical 5% annualized return for the six months ended June 30, 2006
| | | Initial Shares | | Service Shares |
| |
| |
|
| Expenses paid per $1,000 † | | $ 3.01 | | $ 4.26 |
| Ending value (after expenses) | | $1,021.82 | | $1,020.58 |
| † Expenses are equal to the fund’s annualized expense ratio of .60% for Initial shares and .85% for Service shares; |
| multiplied by the average account value over the period, multiplied by 181/365 (to reflect the one-half year period). |
STATEMENT OF INVESTMENTS
June 30, 2006 (Unaudited)
|
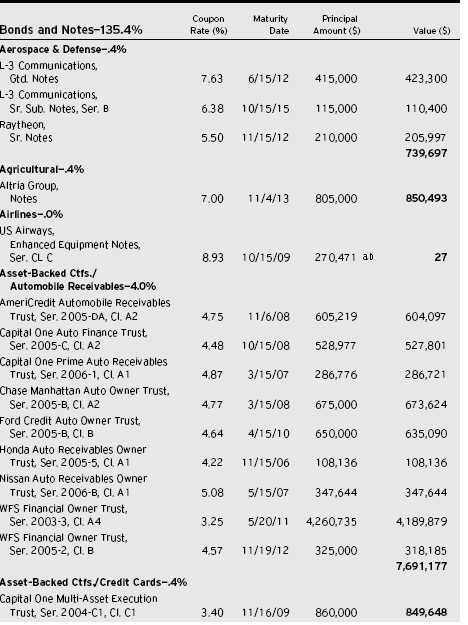
The Portfolio 7
STATEMENT OF INVESTMENTS (Unaudited) (continued)

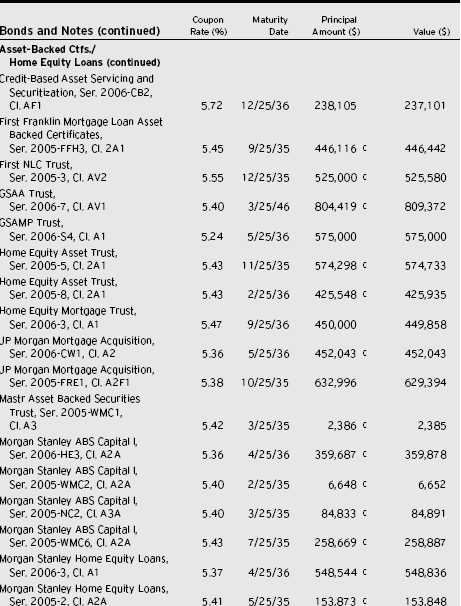
The Portfolio 9
STATEMENT OF INVESTMENTS (Unaudited)(continued)
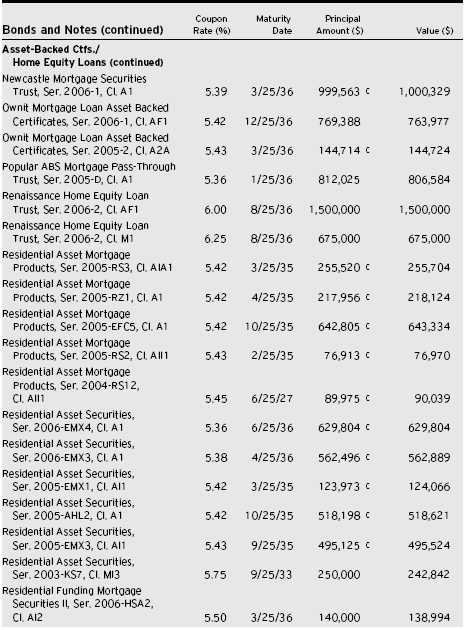
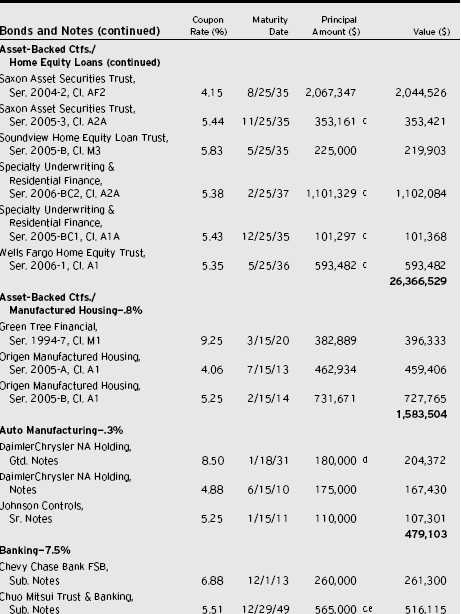
The Portfolio 11
STATEMENT OF INVESTMENTS (Unaudited) (continued)
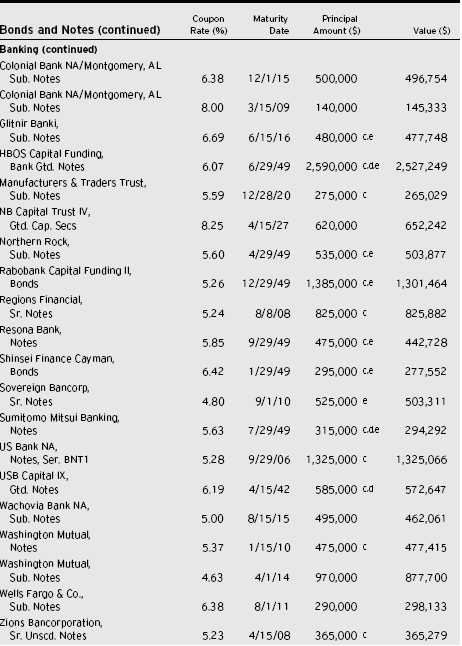
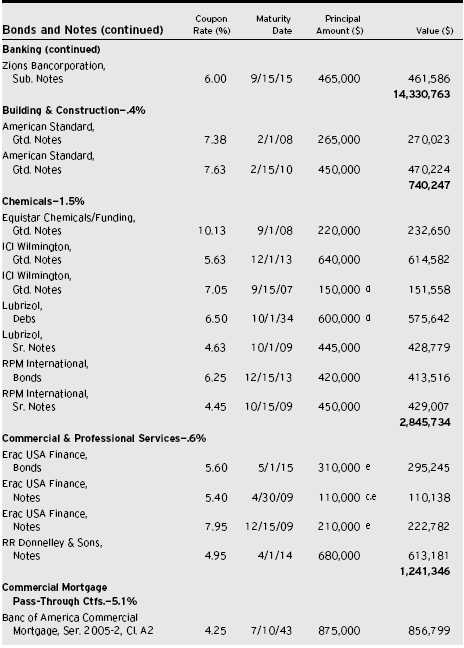
The Portfolio 13
STATEMENT OF INVESTMENTS (Unaudited) (continued)
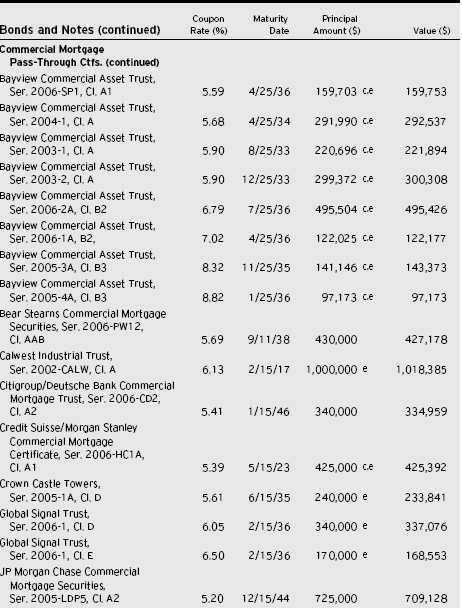
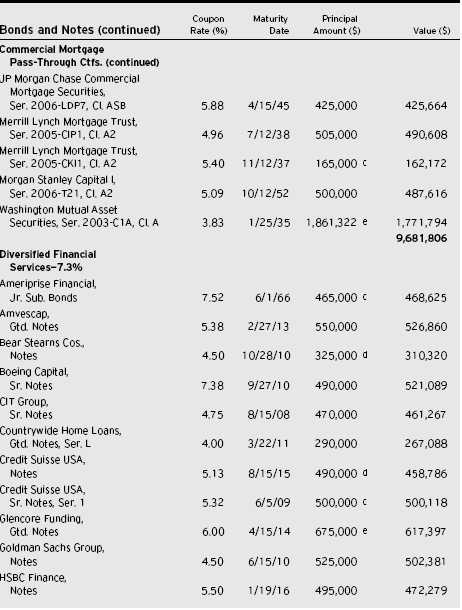
The Portfolio 15
STATEMENT OF INVESTMENTS (Unaudited) (continued)
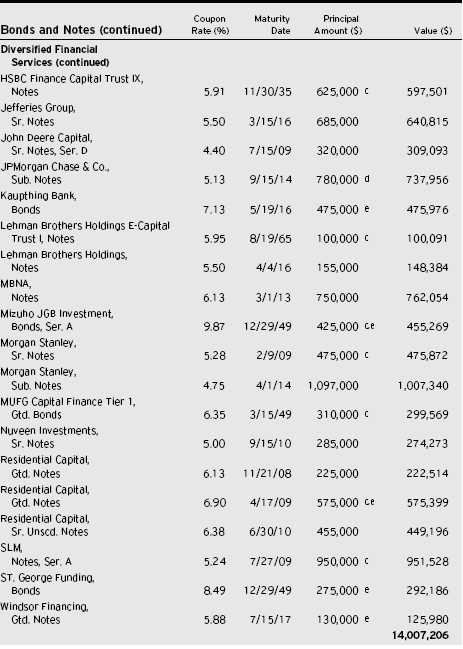
16
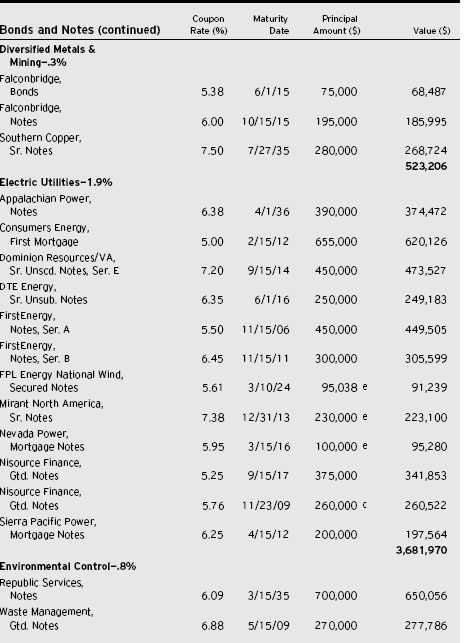
The Portfolio 17
STATEMENT OF INVESTMENTS (Unaudited) (continued)
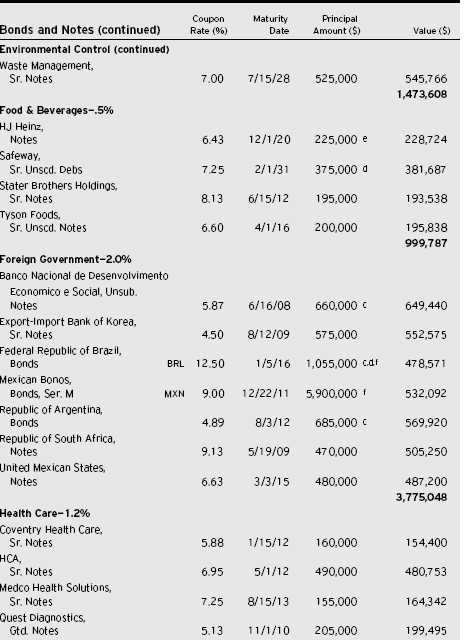
18
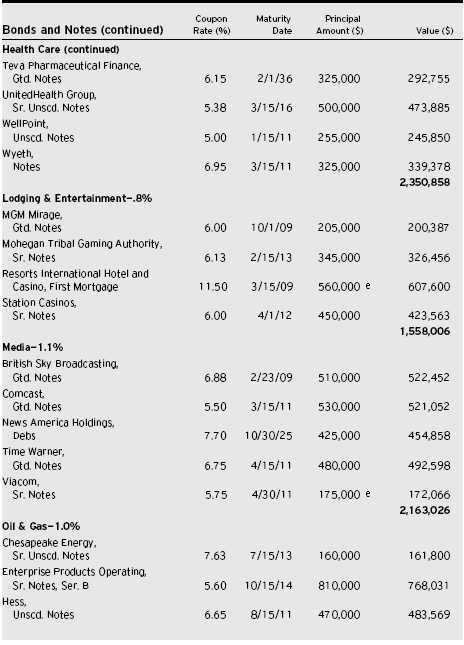
The Portfolio 19
STATEMENT OF INVESTMENTS (Unaudited) (continued)
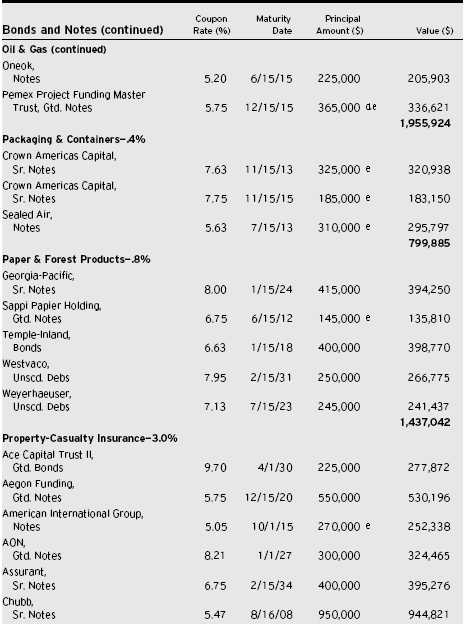
20
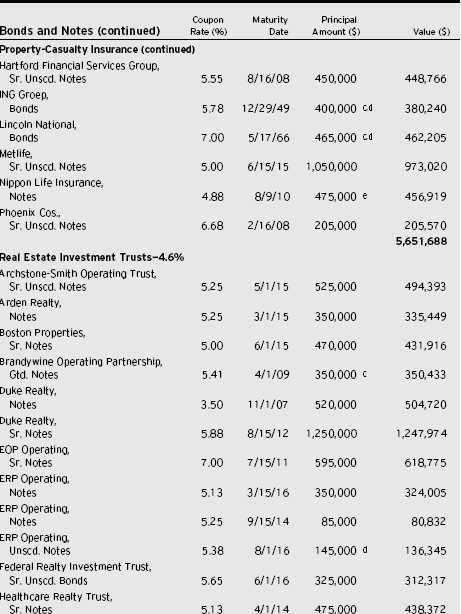
The Portfolio 21
STATEMENT OF INVESTMENTS (Unaudited)(continued)
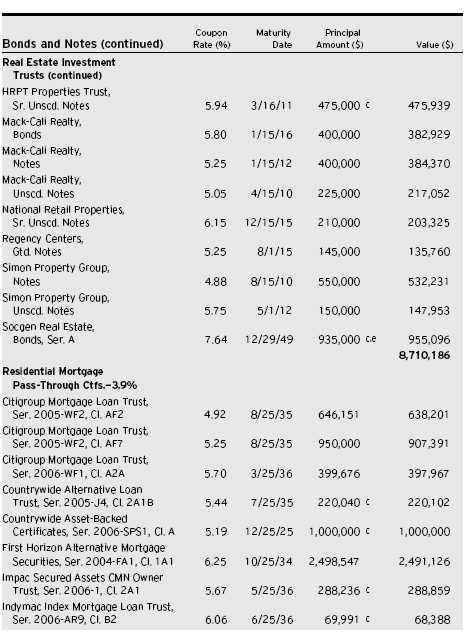

The Portfolio 23
STATEMENT OF INVESTMENTS (Unaudited) (continued)

| | | Principal | | |
| Bonds and Notes (continued) | | Amount ($) | | Value ($) |
| |
| |
|
| U.S. Government Agencies/ | | | | |
| Mortgage-Backed—34.1% | | | | |
| Federal Home Loan Mortgage Corp | | | | |
| 3.50%, 9/1/10 | | 192,099 | | 179,373 |
| Multiclass Mortgage Participation Ctfs. REMIC, | | |
| Ser. 2586, Cl. WE 4.00%, 12/15/32 | | 964,558 | | 875,121 |
| Multiclass Mortgage (Interest Only Obligation) | | |
| Participation Ctfs. REMIC, | | | | |
| Ser. 2764, Cl. IT 5.00%, 6/15/27 | | 7,390,400 g | | 1,263,120 |
| Federal National Mortgage Association | | | | |
| 4.50% | | 11,415,000 h | | 10,790,719 |
| 5.00% | | 21,125,000 h | | 20,012,688 |
| 5.50% | | 14,755,000 h | | 14,272,366 |
| 6.00% | | 7,550,000 h | | 7,575,939 |
| 4.00%, 5/1/10 | | 1,014,201 | | 963,166 |
| 5.50%, 9/1/34 | | 413,594 | | 398,442 |
| 7.00%, 6/1/29—9/1/29 | | 159,592 | | 163,682 |
| Government National Mortgage Association I | | | | |
| 5.50%, 4/15/33—3/15/34 | | 3,414,903 | | 3,315,225 |
| 8.00%, 9/15/08 | | 15,938 | | 15,963 |
| Ser. 2005-90, Cl. A, 3.76%, 9/16/28 | | 815,331 | | 776,645 |
| Ser. 2005-29, Cl. A, 4.02%, 7/16/27 | | 492,420 | | 472,817 |
| Ser. 2006-6, Cl. A, 4.05%, 10/16/23 | | 123,586 | | 119,348 |
| Ser. 2006-3, Cl. A, 4.21%, 1/16/28 | | 989,776 | | 952,773 |
| Ser. 2006-5, Cl. A, 4.24%, 7/16/29 | | 716,865 | | 690,113 |
| Ser. 2005-32, Cl. B, 4.39%, 8/16/30 | | 675,000 | | 652,698 |
| Ser. 2005-87, Cl. A, 4.45%, 3/16/25 | | 589,775 | | 571,655 |
| Ser. 2004-39, | | | | |
| Cl. LC, 5.50%, 12/20/29 | | 1,000,000 | | 987,812 |
| Government National Mortgage Association II | | | | |
| 7.00%, 9/20/28—7/20/29 | | 24,146 | | 24,758 |
| | | | | 65,074,423 |
| U.S. Government Securities—31.0% | | | | |
| U.S. Treasury Bonds: | | | | |
| 4.50%, 2/15/36 | | 3,450,000 i | | 3,094,491 |
| 5.25%, 11/15/28 | | 450,000 | | 448,029 |
| U.S. Treasury Inflation Protection; | | | | |
| Security 3.00%, 7/15/12 | | 5,669,072 j | | 5,840,473 |
The Portfolio 25
STATEMENT OF INVESTMENTS (Unaudited) (continued)
| | | Principal | | |
| Bonds and Notes (continued) | | Amount ($) | | Value ($) |
| |
| |
|
| U.S. Government Securities (continued) | | |
| U.S. Treasury Notes: | | | | |
| 2.75%, 7/31/06 | | 26,000,000 d | | 25,966,486 |
| 4.38%, 12/31/07 | | 2,845,000 d | | 2,811,995 |
| 4.75%, 5/15/14 | | 40,000 | | 39,033 |
| 5.13%, 6/30/11 | | 1,185,000 i | | 1,186,760 |
| 5.13%, 5/15/16 | | 12,865,000 i | | 12,853,949 |
| 7.00%, 7/15/06 | | 7,040,000 | | 7,044,928 |
| | | | | 59,286,144 |
| Total Bonds and Notes | | | | |
| (cost $263,441,273) | | | | 258,802,508 |
| |
| |
|
| |
| | | Face Amount | | |
| | | Covered by | | |
| Options—.1% | | Contracts ($) | | Value ($) |
| |
| |
|
| Call Options—.0% | | | | |
| Dow Jones CDX.EM.5, | | | | |
| September 2006 @ .981 | | 3,870,000 | | 27,090 |
| U.S. Treasury Notes, 4.5%, 2/28/2011 | | |
| September 2006 @ 101.070313 | | 7,850,000 | | 613 |
| | | | | 27,703 |
| Put Options—.1% | | | | |
| 6 Month Euribor Interest Swap, | | | | |
| January 2007 @ 3.56 | | 1,600,000 | | 54,289 |
| 3-Month Capped USD-Libor-BBA | | | | |
| Interest Rate Swap, | | | | |
| June 2007 @ 5.75 | | 38,000,000 | | 30,563 |
| | | | | 84,852 |
| Total Options | | | | |
| (cost $106,245) | | | | 112,555 |
| |
| |
|
| |
| Other Investment—.3% | | Shares | | Value ($) |
| |
| |
|
| Registered Investment Company; | | | | |
| Dreyfus Institutional Preferred | | | | |
| Plus Money Market Fund | | | | |
| (cost $609,000) | | 609,000 k | | 609,000 |
| Investment of Cash Collateral | | | | |
| for Securities Loaned—18.9% | | Shares | | Value ($) |
| |
| |
|
| Registered Investment Company; | | | | |
| Dreyfus Institutional Cash | | | | | | |
| Advantage Fund | | | | | | |
| (cost $36,145,543) | | | | 36,145,543 k | | 36,145,543 |
| |
| |
| |
|
| |
| Total Investments (cost $300,302,061) | | 154.7% | | 295,669,606 |
| |
| Liabilities, Less Cash and Receivables | | (54.7%) | | (104,501,533) |
| |
| Net Assets | | | | 100.0% | | 191,168,073 |
| |
| a | | Non-income producing—security in default. | | | | |
| b | | The value of this security has been determined in good faith under the direction of the Board of Trustees. |
| c | | Variable rate security—interest rate subject to periodic change. | | |
| d | | All or a portion of these securities are on loan. At June 30, 2006, the total market value of the portfolio’s securities |
| | | on loan is $35,177,490 and the total market value of the collateral held by the portfolio is $36,360,006, consisting |
| | | of collateral cash of $36,145,543 and U.S. Government and agency securities valued at $214,463. |
| e | | Securities exempt from registration under Rule 144A of the Securities Act of 1933.These securities may be resold in |
| | | transactions exempt from registration, normally to qualified institutional buyers. At June 30, 2006, these securities |
| | | amounted to $20,880,782 or 10.9% of net assets. | | | | |
| f | | Principal amount stated in U.S. Dollars unless otherwise noted. BRL—Brazilian Cruziero MXN—Mexican |
| | | New Peso | | | | | | |
| | | EUR—Euro | | | | | | |
| g | | Notional face amount shown. | | | | | | |
| h | | Purchased on a forward commitment basis. | | | | |
| i | | Purchased on a delayed delivery basis. | | | | |
| j | | Principal amount for accrual purposes is periodically adjusted based on changes in the Consumer Price Index. |
| k | | Investment in affiliated money market mutual fund. | | | | |
| |
| |
| |
|
| |
| |
| |
| |
| Portfolio Summary (Unaudited) † | | | | |
| |
| | | | | Value (%) | | | | Value (%) |
| |
| |
| |
| |
|
| U.S. Government | | | | State/Government | | |
| Securities/Agencies | | 65.1 | | General Obligations | | 1.5 |
| Corporate Bonds | | 38.8 | | Futures/Options/Forward Currency |
| Asset/Mortgage Backed | | 28.0 | | Exchange Contracts/Swaps | | .1 |
| MoneyMarket Investments | | 19.2 | | | | |
| Foreign Government | | 2.0 | | | | 154.7 |
| |
| † | | Based on net assets. | | | | | | |
| See notes to financial statements. | | | | | | |
The Portfolio 27
| STATEMENT OF FINANCIAL FUTURES |
| June 30, 2006 (Unaudited) |
| | | | | | | | | Unrealized |
| | | | | Market Value | | | | Appreciation |
| | | | | Covered by | | | | (Depreciation) |
| | | Contracts | | Contracts ($) | | Expiration | | at 6/30/2006 ($) |
| |
| |
| |
| |
|
| Financial Futures Long | | | | | | | | |
| U.S. Treasury 5 year Notes | | 271 | | 28,023,094 | | September 2006 | | (171,172) |
| Financial Futures Short | | | | | | | | |
| U.S. Treasury 2 year Notes | | 37 | | (7,502,907) | | September 2006 | | 26,593 |
| U.S. Treasury 10 year Notes | | 254 | | (26,634,281) | | September 2006 | | 87,313 |
| U.S. Treasury 30 year Bonds | | 18 | | (1,919,813) | | September 2006 | | (14,063) |
| | | | | | | | | (71,329) |
See notes to financial statements.
|
| STATEMENT OF OPTIONS WRITTEN |
| June 30, 2006 (Unaudited) |
| | | Face Amount | | |
| | | Covered by | | |
| | | Contracts | | Value ($) |
| | |
| |
|
| Dow Jones CDX.EM.5 | | | | |
| September 2006 @ .9905 | | 7,740,000 | | (27,864) |
| Dow Jones CDX.IG.4 | | | | |
| September 2006 @ .45 | | 9,650,000 | | (21,616) |
| Peru, 8.75%, 11/21/2033 Swap | | | | |
| pay @ 1.70 exp. 12/20/2010 | | | | |
| July 2006 @ 3.05 | | 485,000 | | — |
| Put Options: | | | | |
| Dow Jones CDX.IG.4 | | | | |
| September 2006 @ .45 | | 9,650,000 | | (12,255) |
| U.S. Treasury Notes, 4.50%, 2/28/2011, | | |
| September 2006 @ 96.164063 | | 7,850,000 | | (13,186) |
| (premiums received $76,312) | | | | (74,921) |
See notes to financial statements.
|
| STATEMENT OF ASSETS AND LIABILITIES |
| June 30, 2006 (Unaudited) |
| | | Cost | | Value |
| |
| |
|
| Assets ($): | | | | |
| Investments in securities—See Statement of Investments (including | | |
| securities on loan, valued at $35,177,490)—Note 1(c): | | |
| Unaffiliated issuers | | 263,547,518 | | 258,915,063 |
| Affiliated issuers | | 36,754,543 | | 36,754,543 |
| Cash | | | | 33,134 |
| Cash denominated in foreign currencies | | 23,721 | | 23,688 |
| Receivable for investment securities sold | | | | 6,119,095 |
| Dividends and interest receivable | | | | 2,418,262 |
| Swap premiums paid | | | | 153,641 |
| Unrealized appreciation on swaps—Note 4 | | | | 337,415 |
| Receivable for shares of Beneficial Interest subscribed | | 57,752 |
| Receivable from broker for swap transactions—Note 4 | | 22,756 |
| Prepaid expenses | | | | 22,442 |
| | | | | 304,857,791 |
| |
| |
|
| Liabilities ($): | | | | |
| Due to The Dreyfus Corporation and affiliates—Note 3(b) | | 105,985 |
| Payable for investment securities purchased | | 76,764,758 |
| Liability for securities on loan—Note 1(c) | | | | 36,145,543 |
| Payable for shares of Beneficial Interest redeemed | | 186,237 |
| Unrealized depreciation on swaps—Note 4 | | | | 310,859 |
| Outstanding options written, at value (premiums | | |
| received $76,312)—See Statement of Options Written | | 74,921 |
| Payable for futures variation margin—Note 4 | | 71,424 |
| Net unrealized depreciation of forward currency exchange contracts—Note 4 | | 3,443 |
| Accrued expenses and other liabilities | | | | 26,548 |
| | | | | 113,689,718 |
| |
| |
|
| Net Assets ($) | | | | 191,168,073 |
| |
| |
|
| Composition of Net Assets ($): | | | | |
| Paid-in capital | | | | 200,603,185 |
| Accumulated undistributed investment income—net | | 2,041,263 |
| Accumulated net realized gain (loss) on investments | | (6,809,512) |
| Accumulated net unrealized appreciation (depreciation) on investments | | |
| [including ($71,329) net unrealized depreciation on financial futures] | | (4,666,863) |
| |
|
| Net Assets ($) | | | | 191,168,073 |
| |
| |
|
| |
| |
| Net Asset Value Per Share | | | | |
| | | Initial Shares | | Service Shares |
| |
| |
|
| Net Assets ($) | | 148,458,699 | | 42,709,374 |
| Shares Outstanding | | 13,559,982 | | 3,913,627 |
| |
| |
|
| Net Asset Value Per Share ($) | | 10.95 | | 10.91 |
See notes to financial statements.
The Portfolio 29
STATEMENT OF OPERATIONS
Six Months Ended June 30, 2006 (Unaudited)
|
| Investment Income ($): | | |
| Income: | | |
| Interest | | 4,712,128 |
| Dividends; | | |
| Affiliated issuers | | 167,452 |
| Income from securities lending | | 1,695 |
| Total Income | | 4,881,275 |
| Expenses: | | |
| Investment advisory fee—Note 3(a) | | 642,246 |
| Distribution fees—Note 3(b) | | 56,067 |
| Custodian fees—Note 3(b) | | 20,916 |
| Prospectus and shareholders’ reports | | 20,220 |
| Professional fees | | 18,323 |
| Trustees’ fees and expenses—Note 3(c) | | 12,726 |
| Shareholder servicing costs—Note 3(b) | | 1,167 |
| Miscellaneous | | 23,354 |
| Total Expenses | | 795,019 |
| Less—reduction in investment advisory fee | | |
| due to undertaking—Note 3 (a) | | (148,253) |
| Net Expenses | | 646,766 |
| Investment Income—Net | | 4,234,509 |
| |
|
| Realized and Unrealized Gain (Loss) on Investments—Note 4 ($): |
| Net realized gain (loss) on investments and foreign currency transactions | | (2,443,279) |
| Net realized gain (loss) on options transactions | | (30,030) |
| Net realized gain (loss) on financial futures | | 155,375 |
| Net realized gain (loss) on swap transactions | | 47,142 |
| Net realized gain (loss) on forward currency exchange contracts | | 1,179 |
| Net Realized Gain (Loss) | | (2,269,613) |
| Net unrealized appreciation (depreciation) on investments, | | |
| foreign currency transactions, options and swap transactions | | |
| [including ($102,704) net unrealized (depreciation) on financial futures] | | (3,693,838) |
| Net Realized and Unrealized Gain (Loss) on Investments | | (5,963,451) |
| Net (Decrease) in Net Assets Resulting from Operations | | (1,728,942) |
See notes to financial statements.
|
STATEMENT OF CHANGES IN NET ASSETS
| | | Six Months Ended | | |
| | | June 30, 2006 | | Year Ended |
| | | (Unaudited) | | December 31, 2005 |
| |
| |
|
| Operations ($): | | | | |
| Investment income—net | | 4,234,509 | | 7,383,631 |
| Net realized gain (loss) on investments | | (2,269,613) | | 1,338,482 |
| Net unrealized appreciation | | | | |
| (depreciation) on investments | | (3,693,838) | | (3,502,310) |
| Net Increase (Decrease) in Net Assets | | | | |
| Resulting from Operations | | (1,728,942) | | 5,219,803 |
| |
| |
|
| Dividends to Shareholders from ($): | | | | |
| Investment income—net: | | | | |
| Initial shares | | (3,412,142) | | (5,953,689) |
| Service shares | | (950,690) | | (1,742,786) |
| Total Dividends | | (4,362,832) | | (7,696,475) |
| |
| |
|
| Beneficial Interest Transactions ($): | | | | |
| Net proceeds from shares sold: | | | | |
| Initial shares | | 10,439,879 | | 15,895,953 |
| Service shares | | 1,438,829 | | 2,170,592 |
| Dividends reinvested: | | | | |
| Initial shares | | 3,412,142 | | 5,953,689 |
| Service shares | | 950,690 | | 1,742,786 |
| Cost of shares redeemed: | | | | |
| Initial shares | | (19,687,930) | | (32,401,995) |
| Service shares | | (6,049,503) | | (11,137,633) |
| Increase (Decrease) in Net Assets from | | | | |
| Beneficial Interest Transactions | | (9,495,893) | | (17,776,608) |
| Total Increase (Decrease) in Net Assets | | (15,587,667) | | (20,253,280) |
| |
| |
|
| Net Assets ($): | | | | |
| Beginning of Period | | 206,755,740 | | 227,009,020 |
| End of Period | | 191,168,073 | | 206,755,740 |
| Undistributed investment income—net | | 2,041,263 | | 2,169,586 |
The Portfolio 31
STATEMENT OF CHANGES IN NET ASSETS (continued)
|
| | | Six Months Ended | | |
| | | June 30, 2006 | | Year Ended |
| | | (Unaudited) | | December 31, 2005 |
| |
| |
|
| Capital Share Transactions: | | | | |
| Initial Shares | | | | |
| Shares sold | | 943,772 | | 1,400,032 |
| Shares issued for dividends reinvested | | 307,518 | | 525,289 |
| Shares redeemed | | (1,777,556) | | (2,856,400) |
| Net Increase (Decrease) in Shares Outstanding | | (526,266) | | (931,079) |
| |
| |
|
| Service Shares | | | | |
| Shares sold | | 129,876 | | 191,927 |
| Shares issued for dividends reinvested | | 85,957 | | 154,203 |
| Shares redeemed | | (546,654) | | (984,701) |
| Net Increase (Decrease) in Shares Outstanding | | (330,821) | | (638,571) |
See notes to financial statements.
|
The following tables describe the performance for each share class for the fiscal periods indicated.All information (except portfolio turnover rate) reflects financial results for a single portfolio share. Total return shows how much your investment in the portfolio would have increased (or decreased) during each period, assuming you had reinvested all dividends and distributions.These figures have been derived from the portfolio’s financial statements.
| | | Six Months Ended | | | | | | | | | | |
| | | June 30, 2006 | | | | Year Ended December 31, | | |
| |
| |
| |
|
| Initial Shares | | (Unaudited) | | 2005 | | 2004 a | | 2003 | | 2002 | | 2001 |
| |
| |
| |
| |
| |
| |
|
| Per Share Data ($): | | | | | | | | | | | | |
| Net asset value, | | | | | | | | | | | | |
| beginning of period | | 11.29 | | 11.42 | | 11.50 | | 11.65 | | 11.37 | | 11.39 |
| Investment Operations: | | | | | | | | | | | | |
| Investment income—net b | | .24 | | .39 | | .37 | | .35 | | .54 | | .65 |
| Net realized and unrealized | | | | | | | | | | | | |
| gain (loss) on investments | | (.33) | | (.11) | | .01 | | .21 | | .32 | | .10 |
| Total from Investment Operations | | (.09) | | .28 | | .38 | | .56 | | .86 | | .75 |
| Distributions: | | | | | | | | | | | | |
| Dividends from | | | | | | | | | | | | |
| investment income—net | | (.25) | | (.41) | | (.46) | | (.46) | | (.58) | | (.69) |
| Dividends from net realized | | | | | | | | | | | | |
| gain on investments | | — | | — | | — | | (.25) | | — | | (.08) |
| Total Distributions | | (.25) | | (.41) | | (.46) | | (.71) | | (.58) | | (.77) |
| Net asset value, end of period | | 10.95 | | 11.29 | | 11.42 | | 11.50 | | 11.65 | | 11.37 |
| |
| |
| |
| |
| |
| |
|
| Total Return (%) | | (.84)c | | 2.48 | | 3.37 | | 4.94 | | 7.76 | | 6.69 |
The Portfolio 33
FINANCIAL HIGHLIGHTS (continued)
|
| | | Six Months Ended | | | | | | | | | | |
| | | June 30, 2006 | | | | Year Ended December 31, | | |
| | | |
| |
| |
|
| Initial Shares (continued) | | (Unaudited) | | 2005 | | 2004 a | | 2003 | | 2002 | | 2001 |
| |
| |
| |
| |
| |
| |
|
| Ratios/Supplemental Data (%): | | | | | | | | | | |
| Ratio of total expenses | | | | | | | | | | | | |
| to average net assets | | .74d | | .75 | | .74 | | .74 | | .72 | | .75 |
| Ratio of net expenses | | | | | | | | | | | | |
| to average net assets | | .60d | | .60 | | .74 | | .74 | | .72 | | .75 |
| Ratio of net investment income | | | | | | | | | | |
| to average net assets | | 4.34d | | 3.45 | | 3.30 | | 2.96 | | 4.70 | | 5.57 |
| Portfolio Turnover Rate | | 292.38c,e 504.21e | | 819.75e | | 898.18e | | 877.87 | | 1,105.61 |
| |
| |
| |
| |
| |
|
| Net Assets, end of period | | | | | | | | | | | | |
| ($ x 1,000) | | 148,459 | | 158,999 | | 171,424 | | 173,534 | | 194,519 | | 191,089 |
| a | | As of January 1, 2004, the portfolio has adopted the method of accounting for interim payments on swap contracts in |
| | | accordance with Financial Accounting Standards Board Statement No. 133.These interim payments are reflected |
| | | within net realized and unrealized gain (loss) on swap contracts, however, prior to January 1, 2004, these interim |
| | | payments were reflected within interest income/expense in the Statement of Operations.The effect of this change for |
| | | the period ended December 31, 2004, was to increase net investment income per share by less than $.01, decrease net |
| | | realized and unrealized gain (loss) on investments per share by less than $.01 and increase the ratio of net |
| | | investment income to average net assets from 3.28% to 3.30%. Per share data and ratios/supplemental data for |
| | | periods prior to January 1, 2004 have not been restated to reflect this change in presentation. |
| b | | Based on average shares outstanding at each month end. |
| c | | Not annualized. |
| d | | Annualized. |
| e | | The portfolio turnover rates excluding mortgage dollar roll transactions for the periods ended June 30, 2006, |
| | | December 31, 2005, December 31, 2004 and December 31, 2003, were 176.04%, 393.37%, 761.92% and |
| | | 755.08%, respectively. |
| See notes to financial statements. |
| | | Six Months Ended | | | | | | | | | | |
| | | June 30, 2006 | | | | Year Ended December 31, | | |
| |
| |
| |
|
| Service Shares | | (Unaudited) | | 2005 | | 2004 a | | 2003 | | 2002 | | 2001 |
| |
| |
| |
| |
| |
| |
|
| Per Share Data ($): | | | | | | | | | | | | |
| Net asset value, | | | | | | | | | | | | |
| beginning of period | | 11.25 | | 11.38 | | 11.48 | | 11.62 | | 11.35 | | 11.39 |
| Investment Operations: | | | | | | | | | | | | |
| Investment income—net b | | .22 | | .36 | | .35 | | .31 | | .50 | | .58 |
| Net realized and unrealized | | | | | | | | | | | | |
| gain (loss) on investments | | (.33) | | (.11) | | (.01) | | .24 | | .32 | | .14 |
| Total from Investment Operations | | (.11) | | .25 | | .34 | | .55 | | .82 | | .72 |
| Distributions: | | | | | | | | | | | | |
| Dividends from | | | | | | | | | | | | |
| investment income—net | | (.23) | | (.38) | | (.44) | | (.44) | | (.55) | | (.68) |
| Dividends from net realized | | | | | | | | | | | | |
| gain on investments | | — | | — | | — | | (.25) | | — | | (.08) |
| Total Distributions | | (.23) | | (.38) | | (.44) | | (.69) | | (.55) | | (.76) |
| Net asset value, end of period | | 10.91 | | 11.25 | | 11.38 | | 11.48 | | 11.62 | | 11.35 |
| |
| |
| |
| |
| |
| |
|
| Total Return (%) | | (.97)c | | 2.26 | | 3.05 | | 4.78 | | 7.47 | | 6.37 |
The Portfolio 35
FINANCIAL HIGHLIGHTS (continued)
|
| | | Six Months Ended | | | | | | | | | | |
| | | June 30, 2006 | | | | Year Ended December 31, | | |
| | | |
| |
| |
|
| Service Shares (continued) | | (Unaudited) | | 2005 | | 2004 a | | 2003 | | 2002 | | 2001 |
| |
| |
| |
| |
| |
| |
|
| Ratios/Supplemental Data (%): | | | | | | | | | | |
| Ratio of total expenses | | | | | | | | | | | | |
| to average net assets | | .99d | | .99 | | .99 | | .99 | | .97 | | 1.01 |
| Ratio of net expenses | | | | | | | | | | | | |
| to average net assets | | .85d | | .84 | | .99 | | .99 | | .97 | | 1.01 |
| Ratio of net investment income | | | | | | | | | | |
| to average net assets | | 4.09d | | 3.21 | | 3.06 | | 2.66 | | 4.39 | | 5.24 |
| Portfolio Turnover Rate | | 292.38c,e 504.21e | | 819.75e | | 898.18e | | 877.87 | | 1,105.61 |
| |
| |
| |
| |
| |
|
| Net Assets, end of period | | | | | | | | | | | | |
| ($ x 1,000) | | 42,709 | | 47,757 | | 55,585 | | 60,561 | | 57,966 | | 23,431 |
| a | | As of January 1, 2004, the portfolio has adopted the method of accounting for interim payments on swap contracts |
| | | in accordance with Financial Accounting Standards Board Statement No. 133.These interim payments are reflected |
| | | within net realized and unrealized gain (loss) on swap contracts, however, prior to January 1, 2004, these interim |
| | | payments were reflected within interest income/expense in the Statement of Operations.The effect of this change for |
| | | the period ended December 31, 2004, was to increase net investment income per share by $.01, decrease net |
| | | realized and unrealized gain (loss) on investments per share by $.01 and increase the ratio of net investment income |
| | | to average net assets from 3.03% to 3.06%. Per share data and ratios/supplemental data for periods prior to |
| | | January 1, 2004 have not been restated to reflect these changes in presentation. |
| b | | Based on average shares outstanding at each month end. |
| c | | Not annualized. |
| d | | Annualized. |
| e | | The portfolio turnover rates excluding mortgage dollar roll transactions for the periods ended June 30, 2006, |
| | | December 31, 2005, December 31, 2004 and December 31, 2003, were 176.04%, 393.37%, 761.92% and |
| | | 755.08%, respectively. |
| See notes to financial statements. |
NOTES TO FINANCIAL STATEMENTS (Unaudited)
NOTE 1—Significant Accounting Policies:
Dreyfus Variable Investment Fund (the “fund”) is registered under the Investment Company Act of 1940, as amended (the “Act”), as an open-end management investment company, operating as a series company currently offering twelve series, including the Quality Bond Portfolio (the “portfolio”). The portfolio is only offered to separate accounts established by insurance companies to fund variable annuity contracts and variable life insurance policies.The portfolio is a diversified series.The portfolio’s investment objective is to maximize total return, consisting of capital appreciation and current income. The Dreyfus Corporation (the “Manager” or “Dreyfus”) serves as the portfolio’s investment adviser.The Manager is a wholly-owned subsidiary of Mellon Financial Corporation (“Mellon Financial”).
Dreyfus Service Corporation (the “Distributor”), a wholly-owned subsidiary of the Manager, is the distributor of the portfolio’s shares, which are sold without a sales charge.The portfolio is authorized to issue an unlimited number of $.001 par value shares of Beneficial Interest in each of the following classes of shares: Initial and Service. Each class of shares has identical rights and privileges, except with respect to the distribution plan and the expenses borne by each class and certain voting rights. Income, expenses (other than expenses attributable to a specific class), and realized and unrealized gains or losses on investments are allocated to each class of shares based on its relative net assets.
The fund accounts separately for the assets, liabilities and operations of each series. Expenses directly attributable to each series are charged to that series’ operations, expenses which are applicable to all series are allocated among them on a pro rata basis.
The portfolio’s financial statements are prepared in accordance with U.S. generally accepted accounting principles, which may require the use of management estimates and assumptions.Actual results could differ from those estimates.
The Portfolio 37
NOTES TO FINANCIAL STATEMENTS (Unaudited) (continued)
The fund enters into contracts that contain a variety of indemnifica-tions.The portfolio’s maximum exposure under these arrangements is unknown. The portfolio does not anticipate recognizing any loss related to these arrangements.
(a) Portfolio valuation: Investments in securities (excluding short-term investments (other than U.S. Treasury Bills), financial futures, options, swap transactions and forward currency exchange contracts) are valued each business day by an independent pricing service (the “Service”) approved by the Board of Trustees. Investments for which quoted bid prices are readily available and are representative of the bid side of the market in the judgment of the Service are valued at the mean between the quoted bid prices (as obtained by the Service from dealers in such securities) and asked prices (as calculated by the Service based upon its evaluation of the market for such securities). Other investments (which constitute a majority of the portfolio securities) are valued as determined by the Service, based on methods which include consideration of: yields or prices of securities of comparable quality, coupon, maturity and type; indications as to values from dealers; and general market conditions. Securities for which there are no such valuations are valued at fair value as determined in good faith under the direction of the Board of Trustees. Restricted securities, as well as securities or other assets for which recent market quotations are not readily available, not valued by a pricing service approved by the Board of Trustees, or determined by the portfolio not to reflect accurately fair value (such as when an event occurs after the close of the exchange on which the security is principally traded and that is determined by the portfolio to have changed the value of the security), are valued at fair value as determined in good faith under the direction of the Board of Trustees.The factors that may be considered when fair valuing a security include fundamental analytical data, the nature and duration of restrictions on disposition, an evaluation of the forces that influence the market in which the securities are purchased and sold, and public trading in similar securities of the issuer or comparable issuers. Short-term investments, excluding U.S. Treasury Bills, are carried at amortized cost, which approximates value.
Investments in registered investment companies are valued at their net asset value. Financial futures and options, which are traded on an exchange, are valued at the last sales price on the securities exchange on which such securities are primarily traded or at the last sales price on the national securities market on each business day. Options traded over-the-counter are priced at the mean between the bid prices and asked prices. Investments in swap transactions are valued each business day by an independent pricing service approved by the Board of Trustees.Swaps are valued by the service by using a swap pricing model which incorporates among other factors, default probabilities, recovery rates, credit curves of the underlying issuers and swap spreads on interest rates. Investments denominated in foreign currencies are translated to U.S. dollars at the prevailing rates of exchange. Forward currency exchange contracts are valued at the forward rate.
(b) Foreign currency transactions: The portfolio does not isolate that portion of the results of operations resulting from changes in foreign exchange rates on investments from the fluctuations arising from changes in the market prices of securities held. Such fluctuations are included with the net realized and unrealized gain or loss on investments.
Net realized foreign exchange gains or losses arise from sales and maturities of short-term securities, sales of foreign currencies, currency gains or losses realized on securities transactions and the difference between the amounts of dividends, interest and foreign withholding taxes recorded on the portfolios’ books and the U.S. dollar equivalent of the amounts actually received or paid. Net unrealized foreign exchange gains and losses arise from changes in the value of assets and liabilities other than investments in securities, resulting from changes in exchange rates. Such gains and losses are included with net realized and unrealized gain or loss on investments.
(c) Securities transactions and investment income: Securities transactions are recorded on a trade date basis. Realized gain and loss from securities transactions are recorded on the identified cost basis. Dividend income is recognized on the ex-dividend date and interest
The Portfolio 39
NOTES TO FINANCIAL STATEMENTS (Unaudited) (continued)
income, including, where applicable, accretion of discount and amortization of premium on investments, is recognized on the accrual basis.
The portfolio has an arrangement with the custodian bank whereby the portfolio receives earnings credits from the custodian when positive cash balances are maintained, which are used to offset custody fees. For financial reporting purposes, the portfolio includes net earnings credits, as an expense offset in the Statement of Operations.
Pursuant to a securities lending agreement with Mellon Bank, N.A., an affiliate of the Manager, the portfolio may lend securities to qualified institutions.At origination, all loans are secured by collateral of at least 102% of the value of U.S. securities loaned and 105% of the value of foreign securities loaned. Collateral equivalent to at least 100% of the market value of securities on loan will be maintained at all times. Cash collateral is invested in certain money market mutual funds managed by the Manager. The portfolio will be entitled to receive all income on securities loaned, in addition to income earned as a result of the lending transaction. Although each security loaned is fully collateralized, the portfolio would bear the risk of delay in recovery of, or loss of rights in, the securities loaned should a borrower fail to return the securities in a timely manner.
(d) Affiliated issuers: Investments in other investment companies advised by the Manager are defined as “affiliated” in the Act.
(e) Dividends to shareholders: Dividends are recorded on the ex-dividend date. Dividends from investment income-net are declared and paid monthly. Dividends from net realized capital gain, if any, are normally declared and paid annually, but the portfolio may make distributions on a more frequent basis to comply with the distribution requirements of the Internal Revenue Code of 1986, as amended (the “Code”).To the extent that net realized capital gain can be offset by capital loss carryovers, it is the policy of the portfolio not to distribute such gain. Income and capital gain distributions are determined in
accordance with income tax regulations, which may differ from U.S. generally accepted accounting principles.
On June 30, 2006, the Board of Trustees declared a cash dividend of .045 and .043 per share for the Initial shares and Service shares respectively, from undistributed investment income-net payable on July 3, 2006 (ex-dividend date) to shareholders of record as of the close of business on June 30, 2006.
(f) Federal income taxes: It is the policy of the portfolio to continue to qualify as a regulated investment company, if such qualification is in the best interests of its shareholders, by complying with the applicable provisions of the Code, and to make distributions of taxable income sufficient to relieve it from substantially all federal income and excise taxes.
The portfolio has an unused capital loss carryover of $3,233,574 available for federal income tax purposes to be applied against future net securities profits, if any, realized subsequent to December 31, 2005. If not applied, $3,171,594 of the carryover expires in fiscal 2012 and $61,980 expires in fiscal 2013.
The tax character of distributions paid to shareholders during the fiscal year ended December 31, 2005 were as follows: ordinary income $7,696,475.The tax character of current year distributions will be determined at the end of the current fiscal year.
NOTE 2—Bank Lines of Credit:
|
The portfolio may borrow up to $10 million for leveraging purposes under a short-term unsecured line of credit and participates with other Dreyfus-managed funds in a $100 million unsecured line of credit primarily to be utilized for temporary or emergency purposes, including the financing of redemptions. Interest is charged to the portfolio based on prevailing market rates in effect at the time of borrowing. During the period ended June 30, 2006, the portfolio did not borrow under the Facility.
The Portfolio 41
NOTES TO FINANCIAL STATEMENTS (Unaudited) (continued)
NOTE 3—Investment Advisory Fee and Other Transactions With Affiliates:
(a) Pursuant to an Investment Advisory Agreement with the Manager, the investment advisory fee is computed at the annual rate of .65% of the value of the portfolio’s average daily net assets and is payable monthly.The Manager had agreed from January 1, 2006 until June 30, 2006, to waive receipt of a portion of the portfolio’s investment advisory fee, in the amount of .15% of the value of the portfolio’s average net assets.The Manager has agreed from July 1, 2006 through June 30, 2007 to waive receipt of a portion of the portfolio’s investment advisory fee, in the amount of .10% of the value of the portfolio’s average net assets. The reduction in investment advisory fee, pursuant to the undertaking, amounted to $148,253 during the period ended June 30, 2006.
(b) Under the Distribution Plan (the “Plan”) adopted pursuant to Rule 12b-1 under the Act, Service shares pay the Distributor for distributing their shares, for servicing and/or maintaining Service shares shareholder accounts and for advertising and marketing for Service shares.The Plan provides for payments to be made at an annual rate of .25% of the value of the Service shares’ average daily net assets.The Distributor may make payments to Participating Insurance Companies and to brokers and dealers acting as principal underwriter for their variable insurance products.The fees payable under the Plan are payable without regard to actual expenses incurred. During the period ended June 30, 2006, Service shares were charged $56,067 pursuant to the Plan.
The portfolio compensates Dreyfus Transfer, Inc., a wholly-owned subsidiary of the Manager, under a transfer agency agreement for providing personnel and facilities to perform transfer agency services for the portfolio. During the period ended June 30, 2006, the portfolio was charged $243 pursuant to the transfer agency agreement.
The portfolio compensates Mellon Bank, N.A., an affiliate of the Manager, under a custody agreement to provide custodial services for the portfolio. During the period ended June 30, 2006, the portfolio was charged $20,916 pursuant to the custody agreement.
During the period ended June 30, 2006, the portfolio was charged $1,926 for services performed by the Chief Compliance Officer.
The components of Due to The Dreyfus Corporation and affiliates in the Statement of Assets and Liabilities consist of: investment advisory fees $103,642, Rule 12b-1 distribution plan fees $8,809, custodian fees $20,658, chief compliance officer fees $1,926 and transfer agency per account fees $66, which are offset against an expense reimbursement currently in effect in the amount of $29,116.
(c) Each Board member also serves as a Board member of other funds within the Dreyfus complex. Annual retainer fees and attendance fees are allocated to each fund based on net assets.
(d) Pursuant to an exemptive order from the Securities and Exchange Commission, the portfolio may invest its available cash balances in affiliated money market mutual funds. Management fees of the underlying money market mutual funds have been waived by the Manager.
NOTE 4—Securities Transactions:
The aggregate amount of purchases and sales (including paydowns) of investment securities, excluding short-term securities, financial futures, forward currency exchange contracts, options transactions and swap transactions, during the period ended June 30, 2006, amounted to $764,328,669 and $750,756,064, respectively, of which $298,519,872 in purchases and $298,732,757 in sales were from mortgage dollar roll transactions.
The Portfolio 43
NOTES TO FINANCIAL STATEMENTS (Unaudited) (continued)
A mortgage dollar roll transaction involves a sale by the portfolio of mortgage related securities that it holds with an agreement by the portfolio to repurchase similar securities at an agreed upon price and date.The securities purchased will bear the same interest rate as those sold, but generally will be collateralized by pools of mortgages with different prepayment histories than those securities sold.
The portfolio may invest in financial futures contracts in order to gain exposure to or protect against changes in the market.The portfolio is exposed to market risk as a result of changes in the value of the underlying financial instruments. Investments in financial futures require the portfolio to “mark to market” on a daily basis, which reflects the change in market value of the contracts at the close of each day’s trading. Accordingly, variation margin payments are received or made to reflect daily unrealized gains or losses.When the contracts are closed, the portfolio recognizes a realized gain or loss. These investments require initial margin deposits with a broker, which consist of cash or cash equivalents. The amount of these deposits is determined by the exchange or Board of Trade on which the contract is traded and is subject to change. Contracts open at June 30, 2006, are set forth in the Statement of Financial Futures.
The portfolio may purchase and write (sell) put and call options in order to gain exposure to or to protect against changes in the market.
As a writer of call options, the portfolio receives a premium at the outset and then bears the market risk of unfavorable changes in the price of the financial instrument underlying the option. Generally, the portfolio would incur a gain, to the extent of the premium, if the price of the underlying financial instrument decreases between the date the option is written and the date on which the option is terminated. Generally, the portfolio would realize a loss, if the price of the financial instrument increases between those dates.
As a writer of put options, the portfolio receives a premium at the outset and then bears the market risk of unfavorable changes in the price of the financial instrument underlying the option. Generally, the portfolio would incur a gain, to the extent of the premium, if the price of the underlying financial instrument increases between the date the option is written and the date on which the option is terminated. Generally, the portfolio would realize a loss, if the price of the financial instrument decreases between those dates.The following summarizes the portfolio’s call/put options written for the period ended June 30, 2006.
| | | Face Amount | | | | Options Terminated |
| | | | | |
|
| | | Covered by | | Premiums | | | | Net Realized |
| Options Written: | | Contracts ($) | | Received ($) | | Cost ($) | | Gain ($) |
| |
| |
| |
| |
|
| Contracts outstanding | | | | | | | | |
| December 31, 2005 | | 12,110,000 | | 49,688 | | | | |
| Contracts written | | 265,795,000 | | 130,136 | | | | |
| Contracts terminated: | | | | | | | | |
| Contracts closed | | 15,710,000 | | 41,153 | | 137,274 | | (96,121) |
| Contracts expired | | 226,820,000 | | 62,359 | | — | | 62,359 |
| Total contracts | | | | | | | | |
| terminated | | 242,530,000 | | 103,512 | | 137,274 | | (33,762) |
| Contracts outstanding | | | | | | | | |
| June 30, 2006 | | 35,375,000 | | 76,312 | | | | |
The portfolio may enter into forward currency exchange contracts in order to hedge its exposure to changes in foreign currency exchange rates on its foreign portfolio holdings and to settle foreign currency transactions.When executing forward currency exchange contracts, the portfolio is obligated to buy or sell a foreign currency at a specified rate on a certain date in the future.With respect to sales of forward currency exchange contracts, the portfolio would incur a loss if the value of the contract increases between the date the forward contract is opened and the date the forward contract is closed.The portfolio realizes a gain if the value of the contract decreases between those dates.With respect to purchases of forward currency exchange contracts, the portfolio would
The Portfolio 45
NOTES TO FINANCIAL STATEMENTS (Unaudited) (continued)
incur a loss if the value of the contract decreases between the date the forward contract is opened and the date the forward contract is closed. The portfolio realizes a gain if the value of the contract increases between those dates.The portfolio is also exposed to credit risk associated with counterparty nonperformance on these forward currency exchange contracts which is typically limited to the unrealized gain on each open contract.The following summarizes open forward currency exchange contracts at June 30, 2006:
| | | Foreign | | | | | | |
| Forward Currency | | Currency | | | | | | Unrealized |
| Exchange Contracts | | Amounts | | Proceeds ($) | | Value ($) | | (Depreciation) ($) |
| |
| |
| |
| |
|
| Sales: | | | | | | | | |
| Euro, expiring | | | | | | | | |
| 9/20/2006 | | 190,000 | | 240,821 | | 244,264 | | (3,443) |
The portfolio may enter into swap agreements to exchange the interest rate on, or return generated by, one nominal instrument for the return generated by another nominal instrument.
The portfolio accrues for the interim payments on swap contracts on a daily basis, with the net amount recorded within unrealized appreciation (depreciation) of swap contracts in the Statement of Assets and Liabilities. Once the interim payments are settled in cash, the net amount is recorded as realized gain (loss) on swaps, in addition to realized gain (loss) recorded upon the termination of swap contracts in the Statement of Operations. Fluctuations in the value of swap contracts are recorded as a component of net change in unrealized appreciation (depreciation) on investments.
Credit default swaps involve commitments to pay a fixed interest rate in exchange for payment if a credit event affecting a third party (the referenced company) occurs. Credit events may include a failure to pay interest or principal, bankruptcy, or restructuring.The following summarizes credit default swaps entered into by the portfolio at June 30, 2006:
| | | | | | | | | Unrealized |
| Notional | | Reference | | | | (Pay) Receive | | Appreciation |
| Amount ($) | | Entity | | Counterparty | | Fixed Rate (%) Expiration | | (Depreciation)($) |
| |
| |
| |
| |
|
| |
| 4,436,000 | | Dow Jones | | Deutsche | | | | |
| | | CDX.EM.5 | | Bank | | (1.35) 6/20/2011 | | 4,811 |
| | | | | | | | | | | Unrealized |
| Notional | | Reference | | | | (Pay) Receive | | Appreciation |
| Amount ($) | | Entity | | Counterparty | | Fixed Rate (%) Expiration | | (Depreciation)($) |
| |
| |
| |
| |
|
| |
| 845,000 | | Dow Jones | | J.P. Morgan | | | | | | |
| | | CDX.EM.5 | | Chase Bank | | (1.35) | | 6/20/2011 | | 1,742 |
| 3,983,000 | | Dow Jones | | J.P. Morgan | | | | | | |
| | | CDX.EM.5 | | Chase Bank | | (1.35) | | 6/20/2011 | | 21,798 |
| 407,000 | | CenturyTel, | | | | | | | | |
| | | 7.875%, | | | | | | | | |
| | | 8/15/2012 | | Citigroup | | (1.16) | | 9/20/2015 | | (996) |
| 118,000 | | CenturyTel, | | | | | | | | |
| | | 7.875%, | | Morgan | | | | | | |
| | | 8/15/2012 | | Stanley | | (1.15) | | 9/20/2015 | | (207) |
| 900,000 | | CenturyTel, | | | | | | | | |
| | | 7.875%, | | | | | | | | |
| | | 8/15/2012 | | Citigroup | | (1.19) | | 9/20/2015 | | (4,068) |
| 1,570,000 | | Koninklijke | | | | | | | | |
| | | KPN N.V., | | J.P. Morgan | | | | | | |
| | | 8%, 10/1/2010 | | Chase Bank | | (.86) | | 12/20/2010 | | (9,536) |
| 1,050,000 | | Koninklijke | | | | | | | | |
| | | KPN N.V., | | Deutsche | | | | | | |
| | | 8%, 10/1/2010 | | Bank | | (.86) | | 12/20/2010 | | (14,876) |
| 600,000 | | VF, 8.5%, | | Morgan | | | | | | |
| | | 10/1/2010 | | Stanley | | (.72) | | 6/20/2016 | | (7,098) |
| 1,710,000 | | VF, 8.5%, | | Morgan | | | | | | |
| | | 10/1/2010 | | Stanley | | (.46) | | 6/20/2016 | | (12,523) |
| 400,000 | | VF, 8.5%, | | Morgan | | | | | | |
| | | 10/1/2010 | | Stanley | | (.45) | | 6/20/2011 | | (2,746) |
| 760,000 | | Dow Jones | | Morgan | | | | | | |
| | | CDX.NA.IG.4 | | Stanley | | (.69) | | 6/20/2010 | | (15,589) |
| 760,000 | | Dow Jones | | | | | | | | |
| | | CDX.NA.IG.4 | | Citigroup | | (.69) | | 6/20/2010 | | (15,589) |
| | | | | | | | | | | (54,877) |
The portfolio may enter into interest rate swaps which involve the exchange of commitments to pay and receive interest based on a notional principal amount. The following summarizes interest rate swaps entered into by the portfolio at June 30, 2006:
| | | | | | | | | | | Unrealized |
| Notional | | Reference | | | | (Pay) Receive | | | | Appreciation |
| Amount | | Entity/Currency | | Counterparty | | Fixed Rate (%) Expiration | | (Depreciation)($) |
| |
| |
| |
| |
|
| |
| 1,057,000,000 | | JPY-6 Month | | | | | | | | |
| | | LIBOR BBA | | UBS Warburg | | (.88) | | 5/11/2008 | | 9,889 |
| 4,169,000 | | USD-3 Month | | | | | | | | |
| | | LIBOR BBA | | Merrill Lynch | | (4.64) | | 5/13/2015 | | 299,175 |
| 4,169,000 | | USD-3 Month | | | | | | | | |
| | | LIBOR BBA | | Merrill Lynch | | 4.17 | | 5/13/2008 | | (108,273) |
| | | | | | | | | | | 200,791 |
The Portfolio 47
NOTES TO FINANCIAL STATEMENTS (Unaudited) (continued)
Total return swaps involve commitments to pay interest in exchange for a market-linked return based on a notional amount.To the extent the total return of the security or index underlying the transaction exceeds or falls short of the offsetting interest rate obligation, the portfolio will receive a payment from or make a payment to the counter-party, respectively. The following summarizes total return swaps entered into by the portfolio at June 30, 2006:
| Notional | | Reference | | | | (Pay) Floating | | Unrealized |
| Amount ($) | | Entity | | Counterparty | | Rate (%) | | Expiration (Depreciation)($) |
| |
| |
| |
| |
|
| |
| 4,116,000 | | Emerging Market | | | | | | | | |
| | | Bond Index Plus | | J.P. Morgan | | | | | | |
| | | @ 370.4091 | | Chase Bank | | (4.55) | | 11/14/2006 | | (59,386) |
| 5,534,000 | | Emerging Market | | | | | | | | |
| | | Bond Index Plus | | J.P. Morgan | | | | | | |
| | | @ 369.025 | | Chase Bank | | (4.55) | | 11/14/2006 | | (59,972) |
| | | | | | | | | | | (119,358) |
Risks may arise upon entering into these agreements from the potential inability of the counterparties to meet the terms of the agreement and are generally limited to the amount of net payments to be received, if any, at the date of default.
At June 30, 2006, accumulated net unrealized depreciation on investments was $4,632,455, consisting of $769,890 gross unrealized appreciation and $5,402,345 gross unrealized depreciation.
At June 30,2006,the cost of investments for federal income tax purposes was substantially the same as the cost for financial reporting purposes (see the Statement of Investments).
PROXY RESULTS ( U n a u d i t e d )
|
Dreyfus Variable Investment Fund held a special meeting of shareholders on June 29, 2006.The proposal considered at the meeting, and the results, are as follows:
| | | | | Shares | | |
| |
| |
| |
|
| | | For | | | | Authority Withheld |
| |
| |
| |
|
| To elect additional Board Members: | | | | | | |
| Peggy C. Davis † | | 171,078,926.558 | | | | 7,687,714.085 |
| Joseph S. DiMartino | | 170,946,484.400 | | | | 7,820,156.243 |
| David P. Feldman | | 170,959,920.714 | | | | 7,806,719.929 |
| Ehud Houminer † | | 170,132,086.682 | | | | 8,634,553.961 |
| Gloria Messinger † | | 170,187,240.710 | | | | 8,579,399.933 |
| Anne Wexler † | | 170,212,607.472 | | | | 8,554,033.171 |
| † Each will serve as an Independent Board member of the fund commencing, subject to the discretion of the Board, on |
| or about January 1, 2007. |
| In addition to Joseph S. DiMartino and David P. Feldman, James F. Henry, Dr. Paul A. Marks and Dr. Martin |
| Peretz continue as Board members of the fund. |
The Portfolio 49
| INFORMATION ABOUT THE REVIEW | | |
| AND APPROVAL OF THE PORTFOLIO’S | | |
| I N V E S T M E N T A DV I S O RY A G R E E M E N T | | (Unaudited) |
At a meeting of the fund’s Board of Trustees held on June 7 and 8, 2006, the Board considered the re-approval for an annual period (through July 31, 2007) of the fund’s Investment Advisory Agreement with Dreyfus for the portfolio, pursuant to which Dreyfus provides the portfolio with investment advisory and administrative services. The Board members, none of whom are “interested persons” (as defined in the Investment Company Act of 1940, as amended) of the fund were assisted in their review by independent legal counsel and met with counsel in executive session separate from representatives of Dreyfus.
Analysis of Nature, Extent and Quality of Services Provided to the Portfolio. The Board members received a presentation from representatives of Dreyfus regarding services provided to the portfolio and other funds in the Dreyfus fund complex, and discussed the nature, extent and quality of the services provided to the portfolio pursuant to its Investment Advisory Agreement. Dreyfus’ representatives reviewed the portfolio’s distribution of accounts and the relationships Dreyfus has with various intermediaries and the different needs of each.The Board noted that the portfolio’s shares were offered only to separate accounts established by insurance companies to fund variable annuity contracts and variable life insurance policies. Dreyfus’ representatives noted the diversity of distribution among the funds in the Dreyfus fund complex, and Dreyfus’ corresponding need for broad, deep, and diverse resources to be able to provide ongoing shareholder services to each distribution channel, including that of the portfolio. Dreyfus also provided the number of separate accounts investing in the portfolio, as well as the portfolio’s asset size.
The Board members also considered Dreyfus’ research and portfolio management capabilities and that Dreyfus also provides oversight of day-to-day portfolio operations, including fund accounting and administration and assistance in meeting legal and regulatory requirements. The Board members also considered Dreyfus’ extensive administrative, accounting and compliance infrastructure.
Comparative Analysis of the Portfolio’s Performance and Advisory Fee and Expense Ratio. The Board members reviewed the portfolio’s performance and placed significant emphasis on comparisons to a group of A-rated corporate debt funds underlying variable insurance products (the “Performance Group”) and to a larger universe of funds, consisting of all A-rated corporate debt funds underlying variable insurance products (the “Performance Universe”) selected and provided by Lipper, Inc., an independent provider of investment company data.The Board was provided with a description of the methodology Lipper used to select the Performance Group and Performance Universe, as well as the Expense Group and Expense Universe (discussed below). The Board members discussed the results of the yield and total return comparisons for various periods ended April 30, 2006.The Board members noted that the portfolio’s current portfolio manager assumed that role in January 2005.The Board noted that the portfolio’s yield for one-year periods through April 30th for 1997 - 2006 for its Initial shares variously was above or below the medians of the Performance Group and the Performance Universe for all periods; the Board noted that the income performance (yield) during each of the two most recent annual periods (which included the period for which the current portfolio manager has managed the portfolio) was above the median of the Performance Group and in the third quintile (below median) of the Performance Universe. The total return performance for its Initial shares variously was above or below the medians for the Performance Group and the Performance Universe; the Board noted that the one-and two-year total return performance (which included the period for which the current portfolio manager has managed the portfolio) was above the medians of the Performance Group and the Performance Universe. Dreyfus also provided the Board with the portfolio’s total return performance and the quartile, percentile and rank of the portfolio’s total return within its Lipper category (as provided by Lipper) for
The Portfolio 51
| I N FO R M AT I O N A B O U T T H E R E V I E W A N D A P P R OVA L O F T H E P O R T FO L I O ’ S |
| I N V E S T M E N T A DV I S O RY A G R E E M E N T ( U n a u d i t e d ) ( c o n t i n u e d ) |
certain other periods ended April 30, 2006, which were generally consistent with the relative return information provided by Lipper.
The Board members also discussed the portfolio’s investment advisory fee and expense ratio for each class of shares and reviewed the range of advisory fees and expense ratios as compared to a comparable group of funds (the “Expense Group”) and a broader group of funds (the “Expense Universe”), each selected and provided by Lipper. The Board members noted that the portfolio’s advisory fee was higher than its Expense Group and Expense Universe medians, and that the expense ratio for the Initial shares was lower that the Expense Group and Expense Universe medians and the expense ratio for the Service shares was higher than the Expense Group and Expense Universe medians. The Board noted Dreyfus’ current undertaking to waive or reimburse certain fees and expenses, which reduced the expense ratio each class of shares. Following discussions with representatives of Dreyfus, the Board determined to partially reduce the amount of Dreyfus’ current undertaking to waive or reimburse certain fees and expenses, noting that such a reduction would not change the portfolio’s total return quintile ranking in the portfolio’s Performance Group presented to the Board.
Representatives of Dreyfus stated there are no other mutual funds managed by Dreyfus or its affiliates with similar investment objectives, policies and strategies and included within the portfolio’s Lipper category and no other accounts managed by Dreyfus or its affiliates with similar investment objectives, policies and strategies as the portfolio.
Analysis of Profitability and Economies of Scale. Dreyfus’ representatives reviewed the dollar amount of expenses allocated and profit received by Dreyfus and the method used to determine such expenses and profit.The Board considered information, previously provided and discussed, prepared by an independent consulting firm regarding Dreyfus’ approach to allocating costs to, and determining the profitability of, individual funds and the entire Dreyfus mutual fund complex. The Board members also considered that the methodology had also
been reviewed by an independent registered public accounting firm which, like the consultant, found the methodology to be reasonable. The consulting firm also analyzed where any economies of scale might emerge in connection with the management of the portfolio. The Board members evaluated the profitability analysis in light of the relevant circumstances for the portfolio and the extent to which economies of scale would be realized if the portfolio grows and whether fee levels reflect these economies of scale for the benefit of portfolio investors. The Board members also considered potential benefits to Dreyfus from acting as investment adviser and noted that there were no soft dollar arrangements with respect to trading the portfolio’s investments.
It was noted that the Board members should consider Dreyfus’ profitability with respect to the portfolio as part of their evaluation of whether the fees under the Investment Advisory Agreement bear a reasonable relationship to the mix of services provided by Dreyfus, including the nature, extent and quality of such services and that a discussion of economies of scale is predicated on increasing assets and that, if a fund’s assets had been decreasing, the possibility that Dreyfus may have realized any economies of scale would be less. It also was noted that the profitability percentage for managing the portfolio was within ranges determined by appropriate court cases to be reasonable given the services rendered and generally superior service levels provided. The Board also noted the fee waiver and expense reimbursement arrangements and its effect on Dreyfus’ profitability.
At the conclusion of these discussions, the Board agreed that it had been furnished with sufficient information to make an informed business decision with respect to continuation of the Investment Advisory Agreement, with respect to the portfolio. Based on the discussions and considerations as described above, the Board made the following conclusions and determinations.
- The Board concluded that the nature, extent and quality of the ser- vices provided by Dreyfus are adequate and appropriate.
The Portfolio 53
| I N FO R M AT I O N A B O U T T H E R E V I E W A N D A P P R OVA L O F T H E P O R T FO L I O ’ S |
| I N V E S T M E N T A DV I S O RY A G R E E M E N T ( U n a u d i t e d ) ( c o n t i n u e d ) |
- The Board generally was satisfied with the portfolio’s income perfor- mance and with the one- and two-year total return performance, which includes the period from January 2005 when the current port- folio manager began managing the portfolio.
- The Board concluded that the fee paid by the portfolio to Dreyfus was reasonable in light of the services provided, comparative perfor- mance, expense and advisory fee information, including Dreyfus’ reduced undertaking to waive or reimburse certain fess and expenses (which reduced the expense ratio of each class of shares), costs of the services provided and profits to be realized and benefits derived or to be derived by Dreyfus from its relationship with the portfolio.
- The Board determined that the economies of scale which may accrue to Dreyfus and its affiliates in connection with the management of the portfolio had been adequately considered by Dreyfus in connection with the advisory fee rate charged to the portfolio and that, to the extent in the future it were determined that material economies of scale had not been shared with the portfolio, the Board would seek to have those economies of scale shared with the portfolio.
The Board members considered these conclusions and determinations, along with information received on a routine and regular basis throughout the year, and, without any one factor being dispositive, the Board determined that re-approval of the portfolio’s Investment Advisory Agreement was in the best interests of the portfolio and its shareholders.
NOTES
| Dreyfus Variable |
| Investment Fund, |
| Quality Bond Portfolio |
| 200 Park Avenue |
| New York, NY 10166 |
| |
| Investment Adviser |
| The Dreyfus Corporation |
| 200 Park Avenue |
| New York, NY 10166 |
| |
| Custodian |
| Mellon Bank, N.A. |
| One Mellon Bank Center |
| Pittsburgh, PA 15258 |
| Transfer Agent & |
| Dividend Disbursing Agent |
| Dreyfus Transfer, Inc. |
| 200 Park Avenue |
| New York, NY 10166 |
| |
| Distributor |
| Dreyfus Service Corporation |
| 200 Park Avenue |
| New York, NY 10166 |
Telephone 1-800-554-4611 or 516-338-3300
Mail The Dreyfus Family of Funds, 144 Glenn Curtiss Boulevard, Uniondale, NY 11556-0144 Attn: Investments Division
The portfolio files its complete schedule of portfolio holdings with the Securities and Exchange Commission (“SEC”) for the first and third quarters of each fiscal year on Form N-Q. The portfolio’s Forms N-Q are available on the SEC’s website at http://www.sec.gov and may be reviewed and copied at the SEC’s Public Reference Room in Washington, DC. Information on the operation of the Public Reference Room may be obtained by calling 1-202-551-8090.
A description of the policies and procedures that the portfolio uses to determine how to vote proxies relating to portfolio securities, and information regarding how the portfolio voted these proxies for the 12-month period ended June 30, 2006, is available at http://www.dreyfus.com and on the SEC’s website at http://www.sec.gov. The description of the policies and procedures is also available without charge, upon request, by calling 1-800-645-6561.
| © 2006 Dreyfus Service Corporation |


The views expressed in this report reflect those of the portfolio manager only through the end of the period covered and do not necessarily represent the views of Dreyfus or any other person in the Dreyfus organization.Any such views are subject to change at any time based upon market or other conditions and Dreyfus disclaims any responsibility to update such views. These views may not be relied on as investment advice and, because investment decisions for a Dreyfus portfolio are based on numerous factors, may not be relied on as an indication of trading intent on behalf of any Dreyfus portfolio.
Not FDIC-Insured • Not Bank-Guaranteed • May Lose Value
| | | Contents |
| |
| | | T H E P O R T F O L I O |
| |
|
| 2 | | Letter from the Chairman |
| 3 | | Discussion of Performance |
| 6 | | Understanding Your Portfolio’s Expenses |
| 6 | | Comparing Your Portfolio’s Expenses |
| | | With Those of Other Funds |
| 7 | | Statement of Investments |
| 13 | | Statement of Assets and Liabilities |
| 14 | | Statement of Operations |
| 15 | | Statement of Changes in Net Assets |
| 17 | | Financial Highlights |
| 19 | | Notes to Financial Statements |
| 25 | | Proxy Results |
| 26 | | Information About the Review |
| and Approval of the Portfolio’s |
| Investment Advisory Agreement |
| | | F O R M O R E I N F O R M AT I O N |
| |
|
| | | Back Cover |
| Dreyfus Variable Investment Fund, |
| Small Company Stock Portfolio |

LETTER FROM THE CHAIRMAN
We are pleased to present this semiannual report for Dreyfus Variable Investment Fund, Small Company Stock Portfolio, covering the six-month period from January 1, 2006, through June 30, 2006.
Stock market gains over the first four months of 2006 were given back in May and June, when investors reacted negatively to suggestions that the U.S. Federal Reserve Board (the “Fed”) and other central banks, in their fight against inflation, might raise short-term interest rates more than previously expected. In the judgment of our Chief Economist, Richard Hoey, the recent correction reflects an adjustment among leveraged investors toward lower risk levels as the U.S. economy moves into a more mature phase with milder rates of growth. In our view, corrections such as these generally are healthy mechanisms that help wring speculative excesses from the financial markets, potentially setting the stage for future rallies.
While a recession currently appears unlikely, a number of economic uncertainties remain. Indicators to watch in the months ahead include the outlook for inflation, the extent of softness in the U.S. housing market, the impact of slower economic growth on consumer spending, additional changes in interest rates from the Fed and other central banks, and the strength of the U.S. dollar relative to other major currencies. As always, we encourage you to discuss these and other investment-related issues with your financial advisor, who can help you prepare for the challenges and opportunities that lie ahead.
For information about how the fund performed during the reporting period, as well as market perspectives, we have provided a Discussion of Fund Performance given by the fund’s portfolio manager.
Thank you for your continued confidence and support.

DISCUSSION OF PERFORMANCE
Dwight Cowden, Portfolio Manager
How did Dreyfus Variable Investment Fund, Small Company Stock Portfolio perform relative to its benchmark?
For the six-month period ended June 30, 2006, the portfolio produced total returns of 7.54% for its Initial shares and 7.53% for its Service shares.1 This compares with a total return of 7.70% for the portfolio’s benchmark, the S&P SmallCap 600 Index, for the same period.2
As they have for some time, small-cap stocks continued to outperform their larger-cap counterparts in an environment of generally robust economic growth.While later concerns regarding inflation and rising interest rates dampened investor sentiment, it was not enough to erase earlier gains. The portfolio shared in the small-cap market’s gains, nearly matching the benchmark’s returns. Relatively strong performance in the consumer discretionary, technology, telecommunications services and industrial sectors largely balanced underperformance in the health care, energy and basic materials areas.
What is the portfolio’s investment approach?
The portfolio seeks capital appreciation.To pursue this goal, the portfolio normally invests at least 80% of its assets in the stocks of small-capitalization companies. Small-capitalization companies are generally new and often entrepreneurial companies with market capitalizations ranging from $100 million to $3 billion at the time of purchase. We may continue to hold the securities of companies as their market capitalization grows. Small-cap companies can, if successful, grow faster than larger-cap companies and typically use any profits for expansion rather than for paying dividends.
Stocks are chosen through a disciplined investment process that combines computer modeling techniques, fundamental analysis and risk management. In selecting securities, we use a computer model to identify and rank stocks within an industry or sector, based on several characteristics, including: value, or how a stock is priced relative to its
The Portfolio 3
DISCUSSION OF PERFORMANCE (continued)
|
perceived intrinsic worth; growth, in this case the sustainability or growth of earnings; and financial profile, which measures the financial health of the company.
We then use fundamental analysis and generally select what we believe are the most attractive of the higher-ranked securities and determine those issues that should be sold.We use a variety of sources, including internal as well as Wall Street research, and company management to stay abreast of current developments.We attempt to manage risk by diversifying across companies and industries, limiting the potential adverse impact from any one stock or industry.The portfolio is structured so that its sector weightings and risk characteristics, such as growth, size and yield, are generally similar to those of the S&P SmallCap 600 Index.
What other factors influenced the portfolio’s performance?
Companies in the energy and basic materials sectors generated many of the market’s greater gains, as rising commodity prices and strong industrial demand worldwide created an environment of strong earnings growth. While the portfolio’s absolute performance benefited from this trend, relative returns suffered from having too little exposure to the offshore oil service and equipment industry as well as disappointing stock selection in the metals and mining industry.
Within the consumer discretionary sector, good stock selections among retailers bolstered the portfolio’s results compared to the benchmark. In particular, Coldwater Creek and GameStop both benefited from strong same store sales growth. Top performers also included The Children’s Place Retail Stores, which continued to mount a successful turnaround of its Disney Store operations. New product cycles and improving margins drove relatively strong gains in several technology holdings, including Advanced Energy Industries, Atheros Communications, Axcelis Technologies and Silicon Laboratories. Among telecommunications services holdings, SBA Communications produced notably positive returns due to cellular subscriber growth and accretive acquisitions. Finally, among industrial stocks, the portfolio derived relatively good returns from capital goods companies, such as Wesco International and Terex.
Performance was also impaired from disappointing individual stock selections, particularly in the health care sector where DOV Pharmaceutical and Syneron Medical experienced substantial stock price declines based on negative product announcements.
What is the portfolio’s current strategy?
In light of recent heightened market volatility, we have maintained a generally neutral sector allocation strategy, but with a slight tilt toward industry groups we consider relatively defensive.Accordingly, the portfolio is positioned with slightly less exposure than the benchmark to information technology and consumer discretionary stocks, while having an increased emphasis on consumer staples.We also have allocated a slightly greater proportion of assets than the benchmark to investments in the energy and basic materials sectors, where we see a likelihood of strong, sustainable global demand over the long term. The portfolio also holds relatively few companies in the financials sector that, in our judgment, may be vulnerable to rising interest rates and other macroeconomic forces.
| | | The portfolio is only available as a funding vehicle under various life insurance policies or variable |
| | | annuity contracts issued by insurance companies. Individuals may not purchase shares of the |
| | | portfolio directly. A variable annuity is an insurance contract issued by an insurance company that |
| | | enables investors to accumulate assets on a tax-deferred basis for retirement or other long-term |
| | | goals.The investment objective and policies of Dreyfus Variable Investment Fund, Small Company |
| | | Stock Portfolio made available through insurance products may be similar to other funds/portfolios |
| | | managed or advised by Dreyfus. However, the investment results of the portfolio may be higher or |
| | | lower than, and may not be comparable to, those of any other Dreyfus fund/portfolio. |
| 1 | | Total return includes reinvestment of dividends and any capital gains paid. Past performance is no |
| | | guarantee of future results. Share price and investment return fluctuate such that upon redemption, |
| | | portfolio shares may be worth more or less than their original cost.The portfolio’s performance does |
| | | not reflect the deduction of additional charges and expenses imposed in connection with investing |
| | | in variable insurance contracts, which will reduce returns. Return figures provided reflect the |
| | | absorption of certain portfolio expenses by The Dreyfus Corporation pursuant to an agreement in |
| | | effect through December 31, 2006, at which time it may be extended, terminated or modified. |
| | | Had these expenses not been absorbed, the portfolio’s returns would have been lower. |
| 2 | | SOURCE: LIPPER INC. — Reflects reinvestment of dividends and, where applicable, capital |
| | | gain distributions.The Standard and Poor’s SmallCap 600 Index is a widely accepted, |
| | | unmanaged index of small-cap stock market performance. |
The Portfolio 5
UNDERSTANDING YOUR PORTFOLIO’S EXPENSES (Unaudited)
As a mutual fund investor, you pay ongoing expenses, such as management fees and other expenses. Using the information below, you can estimate how these expenses affect your investment and compare them with the expenses of other funds.You also may pay one-time transaction expenses, including sales charges (loads) and redemption fees,which are not shown in this section and would have resulted in higher total expenses. For more information, see your portfolio’s prospectus or talk to your financial adviser.
Review your portfolio’s expenses
|
The table below shows the expenses you would have paid on a $1,000 investment in Dreyfus Variable Investment Fund, Small Company Stock Portfolio from January 1, 2006 to June 30, 2006. It also shows how much a $1,000 investment would be worth at the close of the period, assuming actual returns and expenses.
| Expenses and Value of a $1,000 Investment | | |
| assuming actual returns for the six months ended June 30, 2006 | | |
| | | Initial Shares | | Service Shares |
| |
| |
|
| Expenses paid per $1,000 † | | $ 4.73 | | $ 4.89 |
| Ending value (after expenses) | | $1,075.40 | | $1,075.30 |
COMPARING YOUR PORTFOLIO’S EXPENSES WITH THOSE OF OTHER FUNDS (Unaudited)
Using the SEC’s method to compare expenses
The Securities and Exchange Commission (SEC) has established guidelines to help investors assess fund expenses. Per these guidelines, the table below shows your portfolio’s expenses based on a $1,000 investment, assuming a hypothetical 5% annualized return. You can use this information to compare the ongoing expenses (but not transaction expenses or total cost) of investing in the portfolio with those of other funds. All mutual fund shareholder reports will provide this information to help you make this comparison. Please note that you cannot use this information to estimate your actual ending account balance and expenses paid during the period.
Expenses and Value of a $1,000 Investment assuming a hypothetical 5% annualized return for the six months ended June 30, 2006
| | | Initial Shares | | Service Shares |
| |
| |
|
| Expenses paid per $1,000 † | | $ 4.61 | | $ 4.76 |
| Ending value (after expenses) | | $1,020.23 | | $1,020.08 |
| † Expenses are equal to the portfolio’s annualized expense ratio of .92% for Initial shares and .95% for Service shares, |
| multiplied by the average account value over the period, multiplied by 181/365 (to reflect the one-half year period). |
STATEMENT OF INVESTMENTS
June 30, 2006 (Unaudited)
|
| Common Stocks—97.4% | | Shares | | | | Value ($) |
| |
| |
| |
|
| Consumer Discretionary—14.7% | | | | | | |
| 99 Cents Only Stores | | 31,700 a | | | | 331,582 |
| AnnTaylor Stores | | 12,400 a | | | | 537,912 |
| Children’s Place Retail Stores | | 14,000 a,b | | | | 840,700 |
| Coldwater Creek | | 26,485 a | | | | 708,739 |
| Dick’s Sporting Goods | | 19,380 a,b | | | | 767,448 |
| DSW, Cl. A | | 7,700 a,b | | | | 280,434 |
| GameStop, Cl. A | | 15,970 a | | | | 670,740 |
| Life Time Fitness | | 5,000 a | | | | 231,350 |
| Nautilus | | 12,800 | | | | 201,088 |
| Panera Bread, Cl. A | | 2,610 a | | | | 175,496 |
| Pinnacle Entertainment | | 12,200 a | | | | 373,930 |
| Pool | | 7,600 | | | | 331,588 |
| RC2 | | 5,820 a | | | | 225,001 |
| Ruth’s Chris Steak House | | 18,900 a | | | | 385,938 |
| Scientific Games, Cl. A | | 7,500 a | | | | 267,150 |
| Thor Industries | | 4,500 | | | | 218,025 |
| | | | | | | 6,547,121 |
| Consumer Staples—3.6% | | | | | | |
| Hain Celestial Group | | 17,600 a | | | | 453,376 |
| Hansen Natural | | 1,800 a,b | | | | 342,666 |
| Performance Food Group | | 14,580 a,b | | | | 442,940 |
| Rite Aid | | 88,700 a,b | | | | 376,088 |
| | | | | | | 1,615,070 |
| Energy—9.1% | | | | | | |
| Acergy, ADR | | 11,200 a | | | | 171,360 |
| Atwood Oceanics | | 4,800 a | | | | 238,080 |
| Cabot Oil & Gas | | 4,400 | | | | 215,600 |
| Cimarex Energy | | 7,740 | | | | 332,820 |
| Foundation Coal Holdings | | 4,500 | | | | 211,185 |
| Frontier Oil | | 9,340 | | | | 302,616 |
| Helix Energy Solutions Group | | 13,240 a | | | | 534,366 |
| Massey Energy | | 6,360 | | | | 228,960 |
| Oceaneering International | | 4,500 a | | | | 206,325 |
| St. Mary Land & Exploration | | 12,430 b | | | | 500,308 |
| Tetra Technologies | | 5,400 a | | | | 163,566 |
The Portfolio 7
STATEMENT OF INVESTMENTS (Unaudited) (continued)
| Common Stocks (continued) | | Shares | | Value ($) |
| |
| |
|
| Energy (continued) | | | | |
| Todco, Cl. A | | 5,500 | | 224,675 |
| Unit | | 3,810 a | | 216,751 |
| Veritas DGC | | 7,600 a | | 392,008 |
| W-H Energy Services | | 2,700 a | | 137,241 |
| | | | | 4,075,861 |
| Financial—15.6% | | | | |
| AmerUs Group | | 3,240 | | 189,702 |
| Apollo Investment | | 18,647 | | 344,597 |
| Bank of Hawaii | | 7,200 | | 357,120 |
| BankUnited Financial, Cl. A | | 8,310 | | 253,621 |
| Cullen/Frost Bankers | | 4,420 | | 253,266 |
| East West Bancorp | | 4,090 | | 155,052 |
| Equity Inns | | 34,120 | | 565,027 |
| FelCor Lodging Trust | | 20,420 | | 443,931 |
| First Midwest Bancorp/IL | | 5,740 | | 212,839 |
| International Securities Exchange, Cl. A | | 5,700 | | 216,999 |
| Investment Technology Group | | 3,800 a | | 193,268 |
| Lazard, Cl. A | | 10,200 | | 412,080 |
| Max Re Capital | | 6,020 | | 131,477 |
| Montpelier Re Holdings | | 13,100 b | | 226,630 |
| New Century Financial | | 4,300 b | | 196,725 |
| Ohio Casualty | | 7,000 | | 208,110 |
| Philadelphia Consolidated Holding | | 7,010 a | | 212,824 |
| Phoenix Cos. | | 12,560 | | 176,845 |
| Sunstone Hotel Investors | | 18,830 | | 547,200 |
| SVB Financial Group | | 4,390 a | | 199,569 |
| Texas Regional Bancshares, Cl. A | | 12,970 | | 491,822 |
| UCBH Holdings | | 25,600 | | 423,424 |
| Whitney Holding | | 10,370 | | 366,787 |
| Wintrust Financial | | 3,670 | | 186,619 |
| | | | | 6,965,534 |
| Health Care—10.1% | | | | |
| Alkermes | | 10,200 a | | 192,984 |
| AMERIGROUP | | 11,500 a | | 356,960 |
| Cerner | | 3,460 a | | 128,401 |
| Chemed | | 2,100 | | 114,513 |
| |
| |
| 8 | | | | |
| Common Stocks (continued) | | Shares | | Value ($) |
| |
| |
|
| Health Care (continued) | | | | |
| Cooper Cos. | | 2,790 | | 123,569 |
| Healthways | | 2,970 a | | 156,341 |
| IDEXX Laboratories | | 6,100 a | | 458,293 |
| ImClone Systems | | 6,600 a,b | | 255,024 |
| inVentiv Health | | 16,180 a | | 465,660 |
| Merit Medical Systems | | 1 a | | 14 |
| MGI Pharma | | 10,300 a | | 221,450 |
| Myogen | | 7,300 a | | 211,700 |
| Pediatrix Medical Group | | 3,700 a | | 167,610 |
| Pharmaceutical Product Development | | 6,820 | | 239,518 |
| Psychiatric Solutions | | 11,320 a | | 324,431 |
| Resmed | | 11,240 a | | 527,718 |
| Respironics | | 5,660 a | | 193,685 |
| Sierra Health Services | | 4,420 a,b | | 199,033 |
| Sunrise Senior Living | | 6,300 a | | 174,195 |
| | | | | 4,511,099 |
| Industrial—18.1% | | | | |
| Actuant, Cl. A | | 7,130 | | 356,144 |
| Airtran Holdings | | 15,000 a | | 222,900 |
| Armor Holdings | | 2,560 a | | 140,365 |
| BE Aerospace | | 17,700 a | | 404,622 |
| Clean Harbors | | 8,500 a,b | | 342,635 |
| Corrections Corp. of America | | 4,200 a | | 222,348 |
| Drew Industries | | 8,990 a | | 291,276 |
| DRS Technologies | | 4,200 | | 204,750 |
| ESCO Technologies | | 4,700 a | | 251,215 |
| Gevity HR | | 8,000 | | 212,400 |
| Hexcel | | 10,500 a | | 164,955 |
| IDEX | | 4,000 | | 188,800 |
| JB Hunt Transport Services | | 15,760 | | 392,582 |
| Kansas City Southern | | 6,160 a | | 170,632 |
| Labor Ready | | 19,440 a | | 440,316 |
| Landstar System | | 4,670 | | 220,564 |
| Manitowoc | | 6,400 | | 284,800 |
| NCI Building Systems | | 5,600 a | | 297,752 |
| Oshkosh Truck | | 5,970 | | 283,694 |
The Portfolio 9
STATEMENT OF INVESTMENTS (Unaudited) (continued)
| Common Stocks (continued) | | Shares | | Value ($) |
| |
| |
|
| Industrial (continued) | | | | |
| Pacer International | | 12,230 | | 398,453 |
| Quanta Services | | 17,880 a,b | | 309,860 |
| Shaw Group | | 14,600 a | | 405,880 |
| Skywest | | 7,900 | | 195,920 |
| Teledyne Technologies | | 9,600 a | | 314,496 |
| Terex | | 2,500 a | | 246,750 |
| URS | | 8,090 a | | 339,780 |
| Walter Industries | | 4,680 | | 269,802 |
| Watsco | | 3,590 | | 214,754 |
| WESCO International | | 4,550 a | | 313,950 |
| | | | | 8,102,395 |
| Information Technology—13.6% | | | | |
| Agere Systems | | 17,100 a | | 251,370 |
| Ansys | | 5,800 a | | 277,356 |
| aQuantive | | 9,300 a | | 235,569 |
| Axcelis Technologies | | 50,880 a | | 300,192 |
| Benchmark Electronics | | 13,500 a | | 325,620 |
| CommScope | | 12,940 a | | 406,575 |
| Electronics for Imaging | | 18,490 a | | 386,071 |
| Factset Research Systems | | 2,915 | | 137,879 |
| Flir Systems | | 16,000 a | | 352,960 |
| j2 Global Communications | | 8,300 a | | 259,126 |
| JDS Uniphase | | 127,150 a,b | | 321,690 |
| Mantech International, Cl. A | | 7,300 a | | 225,278 |
| Micros Systems | | 6,070 a | | 265,138 |
| Microsemi | | 5,120 a | | 124,826 |
| Netlogic Microsystems | | 7,000 a | | 225,750 |
| Polycom | | 21,600 a | | 473,472 |
| Quest Software | | 13,100 a | | 183,924 |
| RealNetworks | | 23,800 a | | 254,660 |
| Common Stocks (continued) | | Shares | | Value ($) |
| |
| |
|
| Information Technology (continued) | | | | |
| Rudolph Technologies | | 15,800 a | | 229,100 |
| Valueclick | | 12,800 a | | 196,480 |
| Varian Semiconductor Equipment Associates | | 19,165 a | | 624,971 |
| | | | | 6,058,007 |
| Materials—6.4% | | | | |
| Airgas | | 7,800 | | 290,550 |
| AK Steel Holding | | 47,500 a | | 656,925 |
| Cleveland-Cliffs | | 5,560 | | 440,852 |
| Commercial Metals | | 11,420 | | 293,494 |
| Nalco Holding | | 26,200 a | | 461,906 |
| RTI International Metals | | 8,600 a | | 480,224 |
| Texas Industries | | 4,400 | | 233,640 |
| | | | | 2,857,591 |
| Telecommunication Services—2.1% | | | | |
| Alaska Communications Systems Group | | 21,240 | | 268,686 |
| SBA Communications, Cl. A | | 25,200 a | | 658,728 |
| | | | | 927,414 |
| Utilities—4.1% | | | | |
| Dynegy, Cl. A | | 78,700 a | | 430,489 |
| Energen | | 6,130 | | 235,453 |
| OGE Energy | | 15,580 | | 545,767 |
| UGI | | 24,800 | | 610,576 |
| | | | | 1,822,285 |
| Total Common Stocks | | | | |
| (cost $36,336,404) | | | | 43,482,377 |
| |
| |
|
| |
| Other Investment—3.2% | | | | |
| |
| |
|
| Registered Investment Company; | | | | |
| Dreyfus Institutional Preferred Plus Money Market Fund | | |
| (cost $1,451,000) | | 1,451,000 c | | 1,451,000 |
The Portfolio 11
STATEMENT OF INVESTMENTS (Unaudited) (continued)
| Investment of Cash Collateral | | | | |
| for Securities Loaned—8.1% | | Shares | | Value ($) |
| |
| |
|
| Registered Investment Company; | | | | |
| Dreyfus Institutional Cash Advantage Plus Fund | | |
| (cost $3,596,238) | | | | 3,596,238 c | | 3,596,238 |
| |
| |
| |
|
| |
| Total Investments (cost $41,383,642) | | 108.7% | | 48,529,615 |
| |
| Liabilities, Less Cash and Receivables | | (8.7%) | | (3,874,108) |
| |
| Net Assets | | | | 100.0% | | 44,655,507 |
| |
| ADR—American Depository Receipts | | | | |
| a | | Non-income producing security. | | | | | | |
| b | | All or a portion of these securities are on loan. At June 30, 2006, the total market value of the portfolio’s securities |
| | | on loan is $4,121,465 and the total market value of the collateral held by the portfolio is $4,276,528, consisting of |
| | | cash collateral of $3,596,238 and U.S. Government and agency securities valued at $680,290. |
| c | | Investment in affiliated money market mutual fund. | | | | |
| |
| |
| |
|
| |
| |
| |
| |
| Portfolio Summary (Unaudited) † | | | | |
| |
| | | | | Value (%) | | | | Value (%) |
| |
| |
| |
| |
|
| Industrial | | 18.1 | | Energy | | 9.1 |
| Financial | | 15.6 | | Materials | | 6.4 |
| Consumer Discretionary | | 14.7 | | Utilities | | 4.1 |
| Information Technology | | 13.6 | | Consumer Staples | | 3.6 |
| Money Market Investments | | 11.3 | | Telecommunication Services | | 2.1 |
| Health Care | | 10.1 | | | | 108.7 |
| |
| † | | Based on net assets. | | | | | | |
| See notes to financial statements. | | | | | | |
STATEMENT OF ASSETS AND LIABILITIES
June 30, 2006 (Unaudited)
| | | Cost | | Value |
| |
| |
|
| Assets ($): | | | | |
| Investments in securities—See Statement | | | | |
| of Investments (including securities on loan, | | |
| valued at $4,121,465)—Note 1(b): | | | | |
| Unaffiliated issuers | | 36,336,404 | | 43,482,377 |
| Affiliated issuers | | 5,047,238 | | 5,047,238 |
| Cash | | | | 8,836 |
| Receivable for investment securities sold | | | | 561,051 |
| Dividends and interest receivable | | | | 57,348 |
| Receivable for shares of Beneficial Interest subscribed | | 1,049 |
| Prepaid expenses | | | | 5,237 |
| | | | | 49,163,136 |
| |
| |
|
| Liabilities ($): | | | | |
| Due to The Dreyfus Corporation and affiliates—Note 3(b) | | 34,281 |
| Liability for securities on loan—Note 1(b) | | | | 3,596,238 |
| Payable for investment securities purchased | | 620,280 |
| Payable for shares of Beneficial Interest redeemed | | 212,282 |
| Accrued expenses | | | | 44,548 |
| | | | | 4,507,629 |
| |
| |
|
| Net Assets ($) | | | | 44,655,507 |
| |
| |
|
| Composition of Net Assets ($): | | | | |
| Paid-in capital | | | | 34,810,315 |
| Accumulated undistributed investment income—net | | 4,798 |
| Accumulated net realized gain (loss) on investments | | 2,694,421 |
| Accumulated net unrealized appreciation | | | | |
| (depreciation) on investments | | | | 7,145,973 |
| |
| |
|
| Net Assets ($) | | | | 44,655,507 |
| |
| |
|
| |
| |
| Net Asset Value Per Share | | | | |
| | | Initial Shares | | Service Shares |
| |
| |
|
| Net Assets ($) | | 38,809,214 | | 5,846,293 |
| Shares Outstanding | | 1,875,265 | | 286,089 |
| |
| |
|
| Net Asset Value Per Share ($) | | 20.70 | | 20.44 |
See notes to financial statements.
|
The Portfolio 13
STATEMENT OF OPERATIONS
Six Months Ended June 30, 2006 (Unaudited)
|
| Investment Income ($): | | |
| Income: | | |
| Cash dividends: | | |
| Unaffiliated issuers (net of $299 foreign taxes withheld at source) | | 159,436 |
| Affiliated issuers | | 22,608 |
| Income from securities lending | | 12,565 |
| Interest | | 6,642 |
| Total Income | | 201,251 |
| Expenses: | | |
| Investment advisory fee—Note 3(a) | | 173,782 |
| Auditing fees | | 15,194 |
| Prospectus and shareholders’ reports | | 14,463 |
| Custodian fees—Note 3(b) | | 9,689 |
| Distribution fees—Note 3(b) | | 7,528 |
| Trustees’ fees and expenses—Note 3(c) | | 2,879 |
| Shareholder servicing costs—Note 3(b) | | 1,080 |
| Legal fees | | 699 |
| Loan commitment fees—Note 2 | | 292 |
| Miscellaneous | | 3,265 |
| Total Expenses | | 228,871 |
| Less—waiver of fees due to | | |
| undertaking—Note 3(a) | | (14,055) |
| Less—reduction in custody fees due to | | |
| earnings credits—Note 1(b) | | (344) |
| Net Expenses | | 214,472 |
| Investment (Loss)—Net | | (13,221) |
| |
|
| Realized and Unrealized Gain (Loss) on Investments—Note 4 ($): |
| Net realized gain (loss) on investments | | 2,807,740 |
| Net unrealized appreciation (depreciation) on investments | | 601,046 |
| Net Realized and Unrealized Gain (Loss) on Investments | | 3,408,786 |
| Net Increase in Net Assets Resulting from Operations | | 3,395,565 |
See notes to financial statements.
|
STATEMENT OF CHANGES IN NET ASSETS
| | | Six Months Ended | | |
| | | June 30, 2006 | | Year Ended |
| | | (Unaudited) | | December 31, 2005 |
| |
| |
|
| Operations ($): | | | | |
| Investment (loss)—net | | (13,221) | | (22,216) |
| Net realized gain (loss) on investments | | 2,807,740 | | 5,572,770 |
| Net unrealized appreciation | | | | |
| (depreciation) on investments | | 601,046 | | (5,095,828) |
| Net Increase (Decrease) in Net Assets | | | | |
| Resulting from Operations | | 3,395,565 | | 454,726 |
| |
| |
|
| Dividends to Shareholders from ($): | | | | |
| Net realized gain on investments: | | | | |
| Initial shares | | (4,889,034) | | (1,889,620) |
| Service shares | | (716,009) | | (300,690) |
| Total Dividends | | (5,605,043) | | (2,190,310) |
| |
| |
|
| Beneficial Interest Transactions ($): | | | | |
| Net proceeds from shares sold: | | | | |
| Initial shares | | 2,909,005 | | 5,992,695 |
| Service shares | | 926,848 | | 1,085,909 |
| Dividends reinvested: | | | | |
| Initial shares | | 4,889,034 | | 1,889,620 |
| Service shares | | 716,009 | | 300,690 |
| Cost of shares redeemed: | | | | |
| Initial shares | | (6,113,321) | | (8,889,197) |
| Service shares | | (1,472,642) | | (2,046,928) |
| Increase (Decrease) in Net Assets from | | | | |
| Beneficial Interest Transactions | | 1,854,933 | | (1,667,211) |
| Total Increase (Decrease) in Net Assets | | (354,545) | | (3,402,795) |
| |
| |
|
| Net Assets ($): | | | | |
| Beginning of Period | | 45,010,052 | | 48,412,847 |
| End of Period | | 44,655,507 | | 45,010,052 |
| Undistributed investment income—net | | 4,798 | | 18,019 |
The Portfolio 15
STATEMENT OF CHANGES IN NET ASSETS (continued)
|
| | | Six Months Ended | | |
| | | June 30, 2006 | | Year Ended |
| | | (Unaudited) | | December 31, 2005 |
| |
| |
|
| Capital Share Transactions: | | | | |
| Initial Shares | | | | |
| Shares sold | | 132,748 | | 285,421 |
| Shares issued for dividends reinvested | | 226,764 | | 90,585 |
| Shares redeemed | | (278,661) | | (414,716) |
| Net Increase (Decrease) in Shares Outstanding | | 80,851 | | (38,710) |
| |
| |
|
| Service Shares | | | | |
| Shares sold | | 43,427 | | 52,466 |
| Shares issued for dividends reinvested | | 33,631 | | 14,561 |
| Shares redeemed | | (67,497) | | (96,856) |
| Net Increase (Decrease) in Shares Outstanding | | 9,561 | | (29,829) |
See notes to financial statements.
|
The following tables describe the performance for each share class for the fiscal periods indicated.All information (except portfolio turnover rate) reflects financial results for a single portfolio share. Total return shows how much your investment in the portfolio would have increased (or decreased) during each period, assuming you had reinvested all dividends and distributions.These figures have been derived from the portfolio’s financial statements.
| | | Six Months Ended | | | | | | | | |
| | | June 30, 2006 | | Year Ended December 31, | | |
| | | |
| |
| |
|
| Initial Shares | | (Unaudited) | | 2005 | | 2004 | | 2003 | | 2002 | | 2001 |
| |
| |
| |
| |
| |
| |
|
| Per Share Data ($): | | | | | | | | | | | | |
| Net asset value, | | | | | | | | | | | | |
| beginning of period | | 21.77 | | 22.66 | | 20.34 | | 14.25 | | 17.79 | | 18.08 |
| Investment Operations: | | | | | | | | | | | | |
| Investment income (loss)—net a | | (.01) | | (.01) | | .00b | | (.01) | | .05 | | .03 |
| Net realized and unrealized | | | | | | | | | | | | |
| gain (loss) on investments | | 1.76 | | .17 | | 3.76 | | 6.12 | | (3.55) | | (.31) |
| Total from Investment Operations | | 1.75 | | .16 | | 3.76 | | 6.11 | | (3.50) | | (.28) |
| Distributions: | | | | | | | | | | | | |
| Dividends from investment | | | | | | | | | | | | |
| income—net | | — | | — | | — | | (.02) | | (.04) | | (.01) |
| Dividends from net realized | | | | | | | | | | | | |
| gain on investments | | (2.82) | | (1.05) | | (1.44) | | — | | — | | — |
| Total Distributions | | (2.82) | | (1.05) | | (1.44) | | (.02) | | (.04) | | (.01) |
| Net asset value, end of period | | 20.70 | | 21.77 | | 22.66 | | 20.34 | | 14.25 | | 17.79 |
| |
| |
| |
| |
| |
| |
|
| Total Return (%) | | 7.54c | | .91 | | 18.52 | | 42.94 | | (19.71) | | (1.53) |
| |
| |
| |
| |
| |
| |
|
| Ratios/Supplemental Data (%): | | | | | | | | | | |
| Ratio of total expenses | | | | | | | | | | | | |
| to average net assets | | .47c | | .99 | | .95 | | 1.12 | | .98 | | 1.03 |
| Ratio of net expenses | | | | | | | | | | | | |
| to average net assets | | .46c | | .98 | | .95 | | 1.12 | | .98 | | 1.03 |
| Ratio of net investment income | | | | | | | | | | | | |
| (loss) to average net assets | | (.03)c | | (.03) | | .00d | | (.09) | | .28 | | .16 |
| Portfolio Turnover Rate | | 46.48c | | 157.60 | | 112.27 | | 171.34 | | 71.76 | | 60.40 |
| |
| |
| |
| |
| |
| |
|
| Net Assets, end of period | | | | | | | | | | | | |
| ($ x 1,000) | | 38,809 | | 39,057 | | 41,534 | | 36,200 | | 25,458 | | 33,341 |
| |
| a | | Based on average shares outstanding at each month end. | | | | | | | | |
| b | | Amount represents less than $.01 per share. | | | | | | | | | | |
| c | | Not annualized. | | | | | | | | | | | | |
| d | | Amount represents less than .01%. | | | | | | | | | | | | |
| See notes to financial statements. | | | | | | | | | | | | |
The Portfolio 17
FINANCIAL HIGHLIGHTS (continued)
|
| | | Six Months Ended | | | | | | | | |
| | | June 30, 2006 | | Year Ended December 31, | | |
| | | |
| |
| |
|
| Service Shares | | (Unaudited) | | 2005 | | 2004 | | 2003 | | 2002 | | 2001 |
| |
| |
| |
| |
| |
| |
|
| Per Share Data ($): | | | | | | | | | | | | |
| Net asset value, | | | | | | | | | | | | |
| beginning of period | | 21.53 | | 22.45 | | 20.22 | | 14.20 | | 17.73 | | 18.08 |
| Investment Operations: | | | | | | | | | | | | |
| Investment income (loss)—net a | | (.01) | | (.04) | | (.05) | | (.06) | | .01 | | (.03) |
| Net realized and unrealized | | | | | | | | | | | | |
| gain (loss) on investments | | 1.74 | | .17 | | 3.72 | | 6.10 | | (3.54) | | (.31) |
| Total from Investment Operations | | 1.73 | | .13 | | 3.67 | | 6.04 | | (3.53) | | (.34) |
| Distributions: | | | | | | | | | | | | |
| Dividends from investment | | | | | | | | | | | | |
| income—net | | — | | — | | — | | (.02) | | (.00)b | | (.01) |
| Dividends from net realized | | | | | | | | | | | | |
| gain on investments | | (2.82) | | (1.05) | | (1.44) | | — | | — | | — |
| Total Distributions | | (2.82) | | (1.05) | | (1.44) | | (.02) | | (.00)b | | (.01) |
| Net asset value, end of period | | 20.44 | | 21.53 | | 22.45 | | 20.22 | | 14.20 | | 17.73 |
| |
| |
| |
| |
| |
| |
|
| Total Return (%) | | 7.53c | | .77 | | 18.18 | | 42.60 | | (19.89) | | (1.86) |
| |
| |
| |
| |
| |
| |
|
| Ratios/Supplemental Data (%): | | | | | | | | | | |
| Ratio of total expenses | | | | | | | | | | | | |
| to average net assets | | .60c | | 1.25 | | 1.20 | | 1.37 | | 1.22 | | 1.39 |
| Ratio of net expenses | | | | | | | | | | | | |
| to average net assets | | .47c | | 1.14 | | 1.20 | | 1.37 | | 1.22 | | 1.39 |
| Ratio of net investment income | | | | | | | | | | | | |
| (loss) to average net assets | | (.04)c | | (.19) | | (.25) | | (.34) | | .04 | | (.18) |
| Portfolio Turnover Rate | | 46.48c | | 157.60 | | 112.27 | | 171.34 | | 71.76 | | 60.40 |
| |
| |
| |
| |
| |
| |
|
| Net Assets, end of period | | | | | | | | | | | | |
| ($ x 1,000) | | 5,846 | | 5,953 | | 6,879 | | 5,559 | | 3,117 | | 1,944 |
| |
| a | | Based on average shares outstanding at each month end. | | | | | | | | |
| b | | Amount represents less than $.01 per share. | | | | | | | | | | |
| c | | Not annualized. | | | | | | | | | | | | |
| See notes to financial statements. | | | | | | | | | | | | |
NOTES TO FINANCIAL STATEMENTS (Unaudited)
NOTE 1—Significant Accounting Policies:
Dreyfus Variable Investment Fund (the “fund”) is registered under the Investment Company Act of 1940, as amended (the “Act”), as an open-end management investment company, operating as a series company currently offering twelve series, including the Small Company Stock Portfolio (the “portfolio”). The portfolio is only offered to separate accounts established by insurance companies to fund variable annuity contracts and variable life insurance policies.The portfolio is a diversified series.The portfolio’s investment objective is to provide capital appreciation. The Dreyfus Corporation (the “Manager” or “Dreyfus”) serves as the portfolio’s investment adviser.The Manager is a wholly-owned subsidiary of Mellon Financial Corporation (“Mellon Financial”).
Dreyfus Service Corporation (the “Distributor”), a wholly-owned subsidiary of the Manager, is the distributor of the portfolio’s shares, which are sold without a sales charge.The portfolio is authorized to issue an unlimited number of $.001 par value shares of Beneficial Interest in each of the following classes of shares: Initial and Service. Each class of shares has identical rights and privileges, except with respect to the distribution plan and the expenses borne by each class and certain voting rights. Income, expenses (other than expenses attributable to a specific class), and realized and unrealized gains or losses on investments are allocated to each class of shares based on its relative net assets.
The fund accounts separately for the assets, liabilities and operations of each series. Expenses directly attributable to each series are charged to that series’ operations; expenses which are applicable to all series are allocated among them on a pro rata basis.
The portfolio’s financial statements are prepared in accordance with U.S. generally accepted accounting principles, which may require the use of management estimates and assumptions. Actual results may differ from those estimates.
The Portfolio 19
NOTES TO FINANCIAL STATEMENTS (Unaudited) (continued)
The fund enters into contracts that contain a variety of indemnifica-tions.The portfolio’s maximum exposure under these arrangements is unknown. The portfolio does not anticipate recognizing any loss related to these arrangements.
(a) Portfolio valuation: Investments in securities are valued at the last sales price on the securities exchange or national securities market on which such securities are primarily traded. Securities listed on the National Market System for which market quotations are available are valued at the official closing price or, if there is no official closing price that day, at the last sales price. Securities not listed on an exchange or the national securities market, or securities for which there were no transactions, are valued at the average of the most recent bid and asked prices, except for open short positions, where the asked price is used for valuation purposes. Bid price is used when no asked price is available. Investments in registered investment companies are valued at their net asset value.When market quotations or official closing prices are not readily available, or are determined not to reflect accurately fair value, such as when the value of a security has been significantly affected by events after the close of the exchange or market on which the security is principally traded (for example, a foreign exchange or market), but before the portfolio calculates its net asset value, the portfolio may value these investments at fair value as determined in accordance with the procedures approved by the Board of Trustees. Fair valuing of securities may be determined with the assistance of a pricing service using calculations based on indices of domestic securities and other appropriate indicators, such as prices of relevant ADR’s and futures contracts. For other securities that are fair valued by the Board of Trustees, certain factors may be considered such as: fundamental analytical data, the nature and duration of restrictions on disposition, an evaluation of the forces that influence the market in which the securities are purchased and sold and public trading in similar securities of the issuer or comparable issuers. Financial futures are valued at the last sales price.
(b) Securities transactions and investment income: Securities transactions are recorded on a trade date basis. Realized gain and loss from securities transactions are recorded on the identified cost basis. Dividend income is recognized on the ex-dividend date and interest income, including, where applicable, accretion of discount and amortization of premium on investments, is recognized on the accrual basis.
The portfolio has an arrangement with the custodian bank whereby the portfolio receives earnings credits from the custodian when positive cash balances are maintained, which are used to offset custody fees. For financial reporting purposes, the portfolio includes net earnings credits as an expense offset in the Statement of Operations.
Pursuant to a securities lending agreement with Mellon Bank, N.A., an affiliate of the Manager, the portfolio may lend securities to qualified institutions. It is the portfolio’s policy, that at origination, all loans are secured by collateral of at least 102% of the value of U.S. securities loaned and 105% of the value of foreign securities loaned. Collateral equivalent to at least 100% of the market value of securities on loan is maintained at all times. Cash collateral is invested in certain money market mutual funds managed by the Manager.The portfolio is entitled to receive all income on securities loaned, in addition to income earned as a result of the lending transaction. Although each security loaned is fully collateralized, the portfolio bears the risk of delay in recovery of, or loss of rights in, the securities loaned should a borrower fail to return the securities in a timely manner.
(c) Affiliated issuers: Investments in other investment companies advised by the Manager are defined as “affiliated” in the Act.
(d) Dividends to shareholders: Dividends are recorded on the ex-dividend date. Dividends from investment income-net and dividends from net realized capital gain, if any, are normally declared and paid annually, but the portfolio may make distributions on a more frequent basis to comply with the distribution requirements of the Internal Revenue
The Portfolio 21
NOTES TO FINANCIAL STATEMENTS (Unaudited) (continued)
Code of 1986, as amended (the “Code”).To the extent that net realized capital gain can be offset by capital loss carryovers, if any, it is the policy of the portfolio not to distribute such gain. Income and capital gain distributions are determined in accordance with income tax regulations, which may differ from U.S. generally accepted accounting principles.
(e) Federal income taxes: It is the policy of the portfolio to continue to qualify as a regulated investment company, if such qualification is in the best interests of its shareholders, by complying with the applicable provisions of the Code, and to make distributions of taxable income sufficient to relieve it from substantially all federal income and excise taxes.
The tax character of distributions paid to shareholders during the fiscal year ended December 31, 2005 were as follows: ordinary income $400,440 and long-term capital gains $1,789,870. The tax character of current year distributions will be determined at the end of the current fiscal year.
NOTE 2—Bank Line of Credit:
|
The portfolio participates with other Dreyfus-managed funds in a $350 million redemption credit facility (the “Facility”) to be utilized for temporary or emergency purposes, including the financing of redemptions. In connection therewith, the portfolio has agreed to pay commitment fees on its pro rata portion of the Facility. Interest is charged to the portfolio based on prevailing market rates in effect at the time of borrowing. During the period ended June 30, 2006, the portfolio did not borrow under the Facility.
NOTE 3—Investment Advisory Fee and Other Transactions with Affiliates:
(a) Pursuant to an Investment Advisory Agreement with the Manager, the investment advisory fee is computed at the annual rate of .75% of the value of the portfolio’s average daily net assets and is payable monthly.
The Manager has agreed, from January 1, 2006 to December 31, 2006, to waive receipt of its fees and/or assume the expenses of the portfolio so that the expenses of neither class, exclusive of taxes, brokerage fees,
interest on borrowings, commitment fees and extraordinary expenses, exceed an annual rate of .95% of the value of the average daily net assets of their class. During the period ended June 30, 2006, the Manager waived receipt of fees of $14,055, pursuant to the undertaking.
(b) Under the Distribution Plan (the “Plan”) adopted pursuant to Rule 12b-1 under the Act, Service shares pay the Distributor for distributing their shares, for servicing and/or maintaining Service shares shareholder accounts and for advertising and marketing for Service shares.The Plan provides for payments to be made at an annual rate of .25% of the value of the Service shares’ average daily net assets.The Distributor may make payments to Participating Insurance Companies and to brokers and dealers acting as principal underwriter for their variable insurance products.The fees payable under the Plan are payable without regard to actual expenses incurred. During the period ended June 30, 2006, Service shares were charged $7,528 pursuant to the Plan.
The portfolio compensates Dreyfus Transfer, Inc., a wholly-owned subsidiary of the Manager, under a transfer agency agreement for providing personnel and facilities to perform transfer agency services for the portfolio. During the period ended June 30, 2006, the portfolio was charged $162 pursuant to the transfer agency agreement.
The portfolio compensates Mellon Bank, N.A., an affiliate of the Manager, under a custody agreement for providing custodial services for the portfolio. During the period ended June 30, 2006, the portfolio was charged $9,689 pursuant to the custody agreement.
During the period ended June 30, 2006, the portfolio was charged $1,926 for services performed by the Chief Compliance Officer.
The components of Due to The Dreyfus Corporation and affiliates in the Statement of Assets and Liabilities consist of: investment advisory fees $26,793, Rule 12b-1 distribution plan fees $1,169, custodian fees $5,702, chief compliance officer fees $1,926 and transfer agency per account fees $47, which are offset against an expense reimbursement currently in effect in the amount of $1,356.
The Portfolio 23
NOTES TO FINANCIAL STATEMENTS (Unaudited) (continued)
(c) Each Board member also serves as a Board member of other funds within the Dreyfus complex. Annual retainer fees and attendance fees are allocated to each fund based on net assets.
(d) Pursuant to an exemptive order from the SEC, the portfolio may invest its available cash balances in affiliated money market mutual funds. Management fees of the underlying money market mutual funds have been waived by the Manager.
NOTE 4—Securities Transactions:
|
The aggregate amount of purchases and sales of investment securities, excluding short-term securities, during the period ended June 30, 2006, amounted to $21,199,206, and $25,471,926, respectively.
At June 30, 2006, accumulated net unrealized appreciation on investments was $7,145,973, consisting of $8,110,367 gross unrealized appreciation and $964,394 gross unrealized depreciation.
At June 30,2006,the cost of investments for federal income tax purposes was substantially the same as the cost for financial reporting purposes (see the Statement of Investments).
PROXY RESULTS (Unaudited)
|
Dreyfus Variable Investment Fund held a special meeting of shareholders on June 29, 2006.The proposal considered at the meeting, and the results, are as follows:
| | | | | Shares | | |
| |
| |
| |
|
| | | For | | | | Authority Withheld |
| |
| |
| |
|
| To elect additional Board Members: | | | | | | |
| Peggy C. Davis † | | 171,078,926.558 | | | | 7,687,714.085 |
| Joseph S. DiMartino | | 170,946,484.400 | | | | 7,820,156.243 |
| David P. Feldman | | 170,959,920.714 | | | | 7,806,719.929 |
| Ehud Houminer † | | 170,132,086.682 | | | | 8,634,553.961 |
| Gloria Messinger † | | 170,187,240.710 | | | | 8,579,399.933 |
| Anne Wexler † | | 170,212,607.472 | | | | 8,554,033.171 |
| † Each will serve as an Independent Board member of the fund commencing, subject to the discretion of the Board, on |
| or about January 1, 2007. |
| In addition to Joseph S. DiMartino and David P. Feldman, James F. Henry, Dr. Paul A. Marks and Dr. Martin |
| Peretz continue as Board members of the fund. |
The Portfolio 25
INFORMATION ABOUT THE REVIEW AND APPROVAL OF THE PORTFOLIO’S
I N V E S T M E N T A D V I S O R Y A G R E E M E N T (Unaudited)
At a meeting of the fund’s Board of Trustees held on June 7 and 8, 2006, the Board considered the re-approval for an annual period (through July 31, 2007) of the fund’s Investment Advisory Agreement with Dreyfus for the portfolio, pursuant to which Dreyfus provides the portfolio with investment advisory and administrative services. The Board members, none of whom are “interested persons” (as defined in the Investment Company Act of 1940, as amended) of the fund were assisted in their review by independent legal counsel and met with counsel in executive session separate from representatives of Dreyfus.
Analysis of Nature, Extent and Quality of Services Provided to the Portfolio. The Board members received a presentation from representatives of Dreyfus regarding services provided to the portfolio and other funds in the Dreyfus fund complex, and discussed the nature, extent and quality of the services provided to the portfolio pursuant to its Investment Advisory Agreement. Dreyfus’ representatives reviewed the portfolio’s distribution of accounts and the relationships Dreyfus has with various intermediaries and the different needs of each.The Board noted that the portfolio’s shares were offered only to separate accounts established by insurance companies to fund variable annuity contracts and variable life insurance policies. Dreyfus’ representatives noted the diversity of distribution among the funds in the Dreyfus fund complex, and Dreyfus’ corresponding need for broad, deep, and diverse resources to be able to provide ongoing shareholder services to each distribution channel, including that of the portfolio. Dreyfus also provided the number of separate accounts investing in the portfolio, as well as the portfolio’s asset size.
The Board members also considered Dreyfus’ research and portfolio management capabilities, including certain recent modifications that have been made to the portfolio management team’s investment process, and that Dreyfus also provides oversight of day-to-day portfolio operations, including fund accounting and administration and assistance in meeting legal and regulatory requirements.The Board members also considered Dreyfus’ extensive administrative, accounting and compliance infrastructure.
Comparative Analysis of the Portfolio’s Performance,Advisory Fee and Expense Ratio. The Board members reviewed the portfolio’s performance and placed significant emphasis on comparisons to a group of small-cap core funds underlying variable insurance products (the “Performance Group”) and to a larger universe of funds, consisting of all small-cap core funds underlying variable insurance products (the “Performance Universe”) selected and provided by Lipper, Inc., an independent provider of investment company data.The Board was provided with a description of the methodology Lipper used to select the Performance Group and Performance Universe, as well as the Expense Group and Expense Universe (discussed below). The Board members discussed the results of the comparisons for various periods ended April 30, 2006, and noted that the portfolio’s total return performance for its Initial shares was below the medians of the Performance Group and Performance Universe for each period other than the four-year period. The Board noted that the portfolio had attractive absolute performance during the last three years, noting that the current portfolio manager had been appointed in January 2004. The Dreyfus representatives also discussed certain investment process changes made in an effort to improve the portfolio’s relative performance. Dreyfus also presented the Board with the portfolio’s total return performance and the quartile, percentile and rank of the portfolio’s total return within its Lipper category (as provided by Lipper) for certain other periods ended April 30, 2006, and noted that more recent three- and four-month relative performance generally showed improvement.
The Board members also discussed the portfolio’s investment advisory fee and expense ratio for each class of shares and reviewed the range of advisory fees and expense ratios of a comparable group of funds (the “Expense Group”) and a broader group of funds (the “Expense Universe”), each selected and provided by Lipper.The Board members noted that the portfolio’s advisory fee and the expense ratio for Initial shares was lower than its Expense Group and Expense Universe medians, and that the expense ratio for the Service shares was higher than the Expense Group and Expense Universe medians. The Board members
The Portfolio 27
I N FO R M AT I O N A B O U T T H E R E V I E W A N D A P P R OVA L O F T H E P O R T FO L I O ’ S I N V E S T M E N T A DV I S O RY A G R E E M E N T ( U n a u d i t e d ) ( c o n t i n u e d )
noted Dreyfus’ current undertaking to waive or reimburse certain fees and expenses, which reduced the expense ratio for each class of shares.
Representatives of Dreyfus reviewed with the Board members the advisory fees paid by mutual funds managed by Dreyfus or its affiliates with similar investment objectives, policies and strategies, and included within the portfolio’s Lipper category (the “Similar Funds”), and by other accounts managed by Dreyfus or its affiliates with similar investment objectives, policies and strategies as the portfolio (the “Similar Accounts”). Dreyfus’ representatives explained the nature of the Similar Accounts and the differences, from Dreyfus’ perspective, in providing services to such Similar Accounts as compared to managing and providing services to the portfolio. Dreyfus’ representatives also reviewed the costs associated with distribution through intermediaries. The Board analyzed differences in fees paid to Dreyfus and discussed the relationship of the fees paid in light of the services provided.The Board members considered the relevance of the fee information provided for the Similar Funds and the Similar Accounts to evaluate the appropriateness and reasonableness of the portfolio’s investment advisory fee.The Board acknowledged that differences in fees paid by the Similar Accounts seemed to be consistent with the services provided.
Analysis of Profitability and Economies of Scale. Dreyfus’ representatives reviewed the dollar amount of expenses allocated and profit received by Dreyfus and the method used to determine such expenses and profit.The Board considered information, previously provided and discussed, prepared by an independent consulting firm regarding Dreyfus’ approach to allocating costs to, and determining the profitability of, individual funds and the entire Dreyfus mutual fund complex. The Board members also considered that the methodology had also been reviewed by an independent registered public accounting firm which, like the consultant, found the methodology to be reason-able.The consulting firm also analyzed where any economies of scale might emerge in connection with the management of the portfolio. The Board members evaluated the profitability analysis in light of the
relevant circumstances for the portfolio and the extent to which economies of scale would be realized if the portfolio grows and whether fee levels reflect these economies of scale for the benefit of portfolio investors.The Board members also considered potential benefits to Dreyfus from acting as investment adviser and noted the soft dollar arrangements with respect to trading the portfolio’s investments.
It was noted that the Board members should consider Dreyfus’ profitability with respect to the portfolio as part of their evaluation of whether the fees under the Investment Advisory Agreement bear a reasonable relationship to the mix of services provided by Dreyfus, including the nature, extent and quality of such services and that a discussion of economies of scale is predicated on increasing assets and that, if a fund’s assets had been decreasing, the possibility that Dreyfus may have realized any economies of scale would be less. It also was noted that the profitability percentage for managing the portfolio was within ranges determined by appropriate court cases to be reasonable given the services rendered and generally superior service levels provided. The Board also noted the fee waiver and expense reimbursement arrangement and its effect on Dreyfus’ profitability.
At the conclusion of these discussions, the Board agreed that it had been furnished with sufficient information to make an informed business decision with respect to continuation of the Investment Advisory Agreement, with respect to the portfolio. Based on the discussions and considerations as described above, the Board made the following conclusions and determinations.
- The Board concluded that the nature, extent and quality of the ser- vices provided by Dreyfus are adequate and appropriate.
- The Board generally was satisfied with the portfolio’s overall per- formance, noting absolute performance during the last three years and that the current portfolio manager had been appointed in January 2004.
The Portfolio 29
I N FO R M AT I O N A B O U T T H E R E V I E W A N D A P P R OVA L O F T H E P O R T FO L I O ’ S I N V E S T M E N T A DV I S O RY A G R E E M E N T ( U n a u d i t e d ) ( c o n t i n u e d )
- The Board concluded that the fee paid by the portfolio to Dreyfus was reasonable in light of the services provided, comparative perfor- mance, expense and advisory fee information, including Dreyfus’ undertaking to waive or reimburse certain fees and expenses (which reduced the expense ratio of each class of shares), costs of the ser- vices provided and profits to be realized and benefits derived or to be derived by Dreyfus from its relationship with the portfolio.
- The Board determined that the economies of scale which may accrue to Dreyfus and its affiliates in connection with the manage- ment of the portfolio had been adequately considered by Dreyfus in connection with the investment advisory fee rate charged to the portfolio and that, to the extent in the future it were determined that material economies of scale had not been shared with the port- folio, the Board would seek to have those economies of scale shared with the portfolio.
The Board members considered these conclusions and determinations, along with information received on a routine and regular basis throughout the year, and, without any one factor being dispositive, the Board determined that re-approval of the portfolio’s Investment Advisory Agreement, with respect to the portfolio, was in the best interests of the portfolio and its shareholders.
NOTES
| Dreyfus Variable |
| Investment Fund, |
| Small Company Stock Portfolio |
| 200 Park Avenue |
| New York, NY 10166 |
| |
| Investment Adviser |
| The Dreyfus Corporation |
| 200 Park Avenue |
| New York, NY 10166 |
| |
| Custodian |
| Mellon Bank, N.A. |
| One Mellon Bank Center |
| Pittsburgh, PA 15258 |
| Transfer Agent & |
| Dividend Disbursing Agent |
| Dreyfus Transfer, Inc. |
| 200 Park Avenue |
| New York, NY 10166 |
| |
| Distributor |
| Dreyfus Service Corporation |
| 200 Park Avenue |
| New York, NY 10166 |
Telephone 1-800-554-4611 or 516-338-3300
Mail The Dreyfus Family of Funds, 144 Glenn Curtiss Boulevard, Uniondale, NY 11556-0144 Attn: Investments Division
The portfolio files its complete schedule of portfolio holdings with the Securities and Exchange Commission (“SEC”) for the first and third quarters of each fiscal year on Form N-Q. The portfolio’s Forms N-Q are available on the SEC’s website at http://www.sec.gov and may be reviewed and copied at the SEC’s Public Reference Room in Washington, DC. Information on the operation of the Public Reference Room may be obtained by calling 1-202-551-8090.
A description of the policies and procedures that the portfolio uses to determine how to vote proxies relating to portfolio securities, and information regarding how the portfolio voted these proxies for the 12-month period ended June 30, 2006, is available at http://www.dreyfus.com and on the SEC’s website at http://www.sec.gov. The description of the policies and procedures is also available without charge, upon request, by calling 1-800-645-6561.
| © 2006 Dreyfus Service Corporation |


The views expressed in this report reflect those of the portfolio manager only through the end of the period covered and do not necessarily represent the views of Dreyfus or any other person in the Dreyfus organization.Any such views are subject to change at any time based upon market or other conditions and Dreyfus disclaims any responsibility to update such views. These views may not be relied on as investment advice and, because investment decisions for a Dreyfus portfolio are based on numerous factors, may not be relied on as an indication of trading intent on behalf of any Dreyfus portfolio.
Not FDIC-Insured • Not Bank-Guaranteed • May Lose Value
| | | Contents |
| |
| | | T H E P O R T F O L I O |
| |
|
| 2 | | Letter from the Chairman |
| 3 | | Discussion of Performance |
| 6 | | Understanding Your Portfolio’s Expenses |
| 6 | | Comparing Your Portfolio’s Expenses |
| | | With Those of Other Funds |
| 7 | | Statement of Investments |
| 11 | | Statement of Assets and Liabilities |
| 12 | | Statement of Operations |
| 13 | | Statement of Changes in Net Assets |
| 15 | | Financial Highlights |
| 17 | | Notes to Financial Statements |
| 23 | | Proxy Results |
| 24 | | Information About the Review |
| and Approval of the Portfolio’s |
| Investment Advisory Agreement |
| | | F O R M O R E I N F O R M AT I O N |
| |
|
| | | Back Cover |
| Dreyfus Variable Investment Fund, |
| Special Value Portfolio |

LETTER FROM THE CHAIRMAN
We are pleased to present this semiannual report for Dreyfus Variable Investment Fund, Special Value Portfolio, covering the six-month period from January 1, 2006, through June 30, 2006.
Stock market gains over the first four months of 2006 were given back in May and June, when investors reacted negatively to suggestions that the U.S. Federal Reserve Board (the “Fed”) and other central banks, in their fight against inflation, might raise short-term interest rates more than previously expected. In the judgment of our Chief Economist, Richard Hoey, the recent correction reflects an adjustment among leveraged investors toward lower risk levels as the U.S. economy moves into a more mature phase with milder rates of growth. In our view, corrections such as these generally are healthy mechanisms that help wring speculative excesses from the financial markets, potentially setting the stage for future rallies.
While a recession currently appears unlikely, a number of economic uncertainties remain. Indicators to watch in the months ahead include the outlook for inflation, the extent of softness in the U.S. housing market, the impact of slower economic growth on consumer spending, additional changes in interest rates from the Fed and other central banks, and the strength of the U.S. dollar relative to other major currencies. As always, we encourage you to discuss these and other investment-related issues with your financial advisor, who can help you prepare for the challenges and opportunities that lie ahead.
For information about how the fund performed during the reporting period, as well as market perspectives, we have provided a Discussion of Fund Performance given by the fund’s portfolio manager.
Thank you for your continued confidence and support.


DISCUSSION OF PERFORMANCE
Mark G. DeFranco and Brian M. Gillott, Portfolio Managers Jennison Associates LLC, Sub-Investment Adviser
How did Dreyfus Variable Investment Fund, Special Value Portfolio perform relative to its benchmark?
For the six-month period ended June 30, 2006, the portfolio produced total returns of 6.19% for its Initial shares and 6.06% for its Service shares.1 For the same period, the total return of the Russell 1000 Value Index (the “Index”), the portfolio’s benchmark, was 6.56% .2
Although stocks generally rallied over the first four months of 2006 in an environment of robust economic growth, investor sentiment shifted in May and June, when rising interest rates, mounting inflationary pressures and signs of a slowing economy took their toll on stock prices.The portfolio’s returns were modestly lower than the benchmark, which we attribute to fees and expenses that are not reflected in the Index’s results.
What is the portfolio’s investment approach?
The portfolio seeks to maximize total return, consisting of capital appreciation and current income.To pursue this goal, the portfolio normally invests at least 80% of its assets in stocks. The portfolio’s stock investments may include common stocks, preferred stocks and convertible securities of both U.S. and foreign companies of any size, including those purchased in initial public offerings or shortly thereafter.
The portfolio managers seek to identify attractively valued companies with current or emerging earnings growth that may not be fully recognized or appreciated by the market. Generally, there are two types of companies which may exhibit the characteristics the portfolio managers are seeking.The first type is a company that is out of favor with investors but which the portfolio managers expect will experience an improved earnings cycle over the next 12 to 18 months due to corporate restructuring, new product development, an industry cycle turn, increased management focus on shareholder value or improving balance sheet and cash flow.The second type is a company currently delivering good growth characteristics but which the portfolio managers believe is being mispriced by the market based on short-term
The Portfolio 3
DISCUSSION OF PERFORMANCE (continued)
|
earnings results relative to “street” expectations or market uncertainty regarding the sustainability of earnings growth.
What other factors influenced the portfolio’s performance?
Stocks encountered headwinds in May and June after rallying earlier in the reporting period. Investors grew increasingly concerned that emerging inflationary pressures might compel the Federal Reserve Board (the “Fed”) to raise interest rates more than previously expected, potentially choking off future economic growth.At the same time, new economic data seemed to suggest that soaring energy costs and higher rates on adjustable mortgages might be constraining consumer spending, one of the primary pillars of support for the current economic expansion. The result was a shift in investor sentiment away from the more speculative, growth-oriented companies that previously had led the stock market, toward better-established companies with the ability to achieve consistent earnings under a variety of economic conditions.
In this changing market environment, our security selection strategy enabled the portfolio to score successes among individual companies in a number of market sectors. However, the portfolio fared especially well in the industrials area, which benefited over the first half of 2006 from robust global economic growth. Rail carrier CSX, which we had acquired during a period of relative weakness for the company’s operations and valuation, gained ground as favorable pricing for coal allowed the company to push through price increases in the transportation of the commodity, and a new management team set the railroad on a firmer operational footing. In another turnaround, staffing services provider Manpower fared well when a new management team, easing regulatory headwinds and rising customer demand in Europe boosted the company’s fortunes.Waste management firm Allied Waste and diversified manufacturer Dover Corp. also ranked among the portfolio’s top performers.
Demand for energy exploration, production and refining services grew along with oil and gas prices, benefiting oil services leader Schlumberger. Among oil producers, portfolio holding Occidental Petroleum proved to be well positioned in the Middle East. Strong results from the health care sector came from Andrx, a generic drug maker and distributor that will be acquired by another portfolio holding, Watson Pharmaceuticals. Biotechnology firm Imclone and pharmaceutical developers Sanofi and Abbott Laboratories also did well.
Detractors from the portfolio’s performance over the first half of 2006 included media company Radio One, which suffered from poor results in its Los Angeles radio market. Deteriorating business fundamentals hurt the stock price of semiconductor maker Intel, prompting us to sell the portfolio’s position.Although insurance leader American International Group and software giant Microsoft also pulled back, we regard their stocks as attractively valued and their businesses as under-appreciated by investors.
What is the portfolio’s current strategy?
We have continued to employ our bottom-up investment approach to find attractively valued companies that appear poised for growth. We recently have found a number of opportunities among health care companies with promising products under development. Conversely, we have found fewer companies meeting our criteria in the materials sector, where stocks have become more richly valued.
| | | The portfolio is only available as a funding vehicle under variable life insurance policies or variable |
| | | annuity contracts issued by insurance companies. Individuals may not purchase shares of the |
| | | portfolio directly. A variable annuity is an insurance contract issued by an insurance company that |
| | | enables investors to accumulate assets on a tax-deferred basis for retirement or other long-term |
| | | goals.The investment objective and policies of Dreyfus Variable Investment Fund, Special Value |
| | | Portfolio made available through insurance products may be similar to other funds/portfolios |
| | | managed or advised by Dreyfus. However, the investment results of the portfolio may be higher or |
| | | lower than, and may not be comparable to, those of any other Dreyfus fund/portfolio. |
| 1 | | Total return includes reinvestment of dividends and any capital gains paid. Past performance is no |
| | | guarantee of future results. Share price and investment return fluctuate such that upon redemption, |
| | | portfolio shares may be worth more or less than their original cost.The portfolio’s performance does |
| | | not reflect the deduction of additional charges and expenses imposed in connection with investing |
| | | in variable insurance contracts, which will reduce returns. Return figures provided reflect the |
| | | absorption of certain portfolio expenses by The Dreyfus Corporation pursuant to an agreement in |
| | | effect through December 31, 2006, at which time it may be extended, terminated or modified. |
| | | Had these expenses not been absorbed, the portfolio’s returns would have been lower. |
| | | Part of the portfolio’s recent performance is attributable to positive returns from its initial |
| | | public offering (IPO) investments.There can be no guarantee that IPOs will have or |
| | | continue to have a positive effect on the portfolio’s performance. Currently, the portfolio is |
| | | relatively small in asset size. IPOs tend to have a reduced effect on performance as a |
| | | portfolio’s asset base grows. |
| 2 | | SOURCE: LIPPER INC. — Reflects the reinvestment of dividends and, where applicable, |
| | | capital gain distributions.The Russell 1000 Value Index is an unmanaged index which measures |
| | | the performance of those Russell 1000 companies with lower price-to-book ratios and lower |
| | | forecasted growth values. |
The Portfolio 5
UNDERSTANDING YOUR PORTFOLIO’S EXPENSES (Unaudited)
As a mutual fund investor, you pay ongoing expenses, such as management fees and other expenses. Using the information below, you can estimate how these expenses affect your investment and compare them with the expenses of other funds.You also may pay one-time transaction expenses, including sales charges (loads) and redemption fees,which are not shown in this section and would have resulted in higher total expenses. For more information, see your portfolio’s prospectus or talk to your financial adviser.
Review your portfolio’s expenses
|
The table below shows the expenses you would have paid on a $1,000 investment in Dreyfus Variable Investment Fund, Special Value Portfolio from January 1, 2006 to June 30, 2006. It also shows how much a $1,000 investment would be worth at the close of the period, assuming actual returns and expenses.
| Expenses and Value of a $1,000 Investment | | |
| assuming actual returns for the six months ended June 30, 2006 | | |
| | | Initial Shares | | Service Shares |
| |
| |
|
| Expenses paid per $1,000 † | | $ 4.60 | | $ 5.11 |
| Ending value (after expenses) | | $1,061.90 | | $1,060.60 |
COMPARING YOUR PORTFOLIO’S EXPENSES WITH THOSE OF OTHER FUNDS (Unaudited)
Using the SEC’s method to compare expenses
The Securities and Exchange Commission (SEC) has established guidelines to help investors assess fund expenses. Per these guidelines, the table below shows your portfolio’s expenses based on a $1,000 investment, assuming a hypothetical 5% annualized return. You can use this information to compare the ongoing expenses (but not transaction expenses or total cost) of investing in the portfolio with those of other funds. All mutual fund shareholder reports will provide this information to help you make this comparison. Please note that you cannot use this information to estimate your actual ending account balance and expenses paid during the period.
Expenses and Value of a $1,000 Investment assuming a hypothetical 5% annualized return for the six months ended June 30, 2006
| | | Initial Shares | | Service Shares |
| |
| |
|
| Expenses paid per $1,000 † | | $ 4.51 | | $ 5.01 |
| Ending value (after expenses) | | $1,020.33 | | $1,019.84 |
| † Expenses are equal to the portfolio’s annualized expense ratio of .90% for Initial shares and 1.00% for Service |
| shares, multiplied by the average account value over the period, multiplied by 181/365 (to reflect the one-half |
| year period). |
STATEMENT OF INVESTMENTS
June 30, 2006 (Unaudited)
|
| Common Stocks—97.1% | | Shares | | | | Value ($) |
| |
| |
| |
|
| Consumer Discretionary—15.4% | | | | | | |
| Bally Technologies | | 13,900a | | | | 228,933 |
| Blockbuster, Cl. A | | 44,700 | | | | 222,606 |
| Career Education | | 13,500 a | | | | 403,515 |
| DeVry | | 12,400 a | | | | 272,428 |
| Discovery Holding, Cl. A | | 23,500 a | | | | 343,805 |
| Expedia | | 5,600 a | | | | 83,832 |
| Gemstar-TV Guide International | | 113,300 a | | | | 398,816 |
| IAC/InterActiveCorp. | | 17,700 a | | | | 468,873 |
| Liberty Global, Ser. C | | 14,112 a | | | | 290,284 |
| OSI Restaurant Partners | | 7,700 | | | | 266,420 |
| Pearson, ADR | | 27,500 | | | | 375,375 |
| Radio One, Cl. D | | 34,000 a | | | | 251,600 |
| Tribune | | 8,400 | | | | 272,412 |
| Viacom, Cl. B | | 12,087 a | | | | 433,198 |
| | | | | | | 4,312,097 |
| Consumer Staples—8.6% | | | | | | |
| Cadbury Schweppes | | 45,300 | | | | 436,547 |
| ConAgra Foods | | 18,600 | | | | 411,246 |
| Kroger | | 31,500 | | | | 688,590 |
| Performance Food Group | | 15,300 a | | | | 464,814 |
| Wal-Mart Stores | | 8,200 | | | | 394,994 |
| | | | | | | 2,396,191 |
| Energy—10.8% | | | | | | |
| Alpha Natural Resources | | 10,200 a | | | | 200,124 |
| Apache | | 6,700 | | | | 457,275 |
| Exxon Mobil | | 4,300 | | | | 263,805 |
| Massey Energy | | 11,100 | | | | 399,600 |
| National Oilwell Varco | | 3,500 a | | | | 221,620 |
| Occidental Petroleum | | 3,600 | | | | 369,180 |
| Range Resources | | 13,600 | | | | 369,784 |
| Schlumberger | | 6,600 | | | | 429,726 |
| Veritas DGC | | 5,800 a | | | | 299,164 |
| | | | | | | 3,010,278 |
| Financial—18.1% | | | | | | |
| American International Group | | 9,500 | | | | 560,975 |
The Portfolio 7
STATEMENT OF INVESTMENTS (Unaudited) (continued)
| Common Stocks (continued) | | Shares | | Value ($) |
| |
| |
|
| Financial (continued) | | | | |
| Axis Capital Holdings | | 17,500 | | 500,675 |
| Bank of New York | | 10,000 | | 322,000 |
| Benfield Group | | 49,900 | | 317,895 |
| Charles Schwab | | 32,000 | | 511,360 |
| Citigroup | | 8,900 | | 429,336 |
| Eaton Vance | | 10,300 | | 257,088 |
| JPMorgan Chase & Co. | | 8,236 | | 345,912 |
| KKR Private Equity Investors, LLP (Units) | | 18,000 d | | 394,200 |
| Lazard, Cl. A | | 6,800 | | 274,720 |
| Montpelier Re Holdings | | 15,300 | | 264,690 |
| Nuveen Investments, Cl. A | | 8,100 | | 348,705 |
| Royal Bank of Scotland Group | | 15,526 | | 510,117 |
| | | | | 5,037,673 |
| Health Care—10.8% | | | | |
| Abbott Laboratories | | 13,000 | | 566,930 |
| Community Health Systems | | 8,100 a | | 297,675 |
| Endo Pharmaceuticals Holdings | | 10,400 a | | 342,992 |
| ImClone Systems | | 5,500 a | | 212,520 |
| Medco Health Solutions | | 7,900 a | | 452,512 |
| Pfizer | | 20,400 | | 478,788 |
| Sanofi-Aventis | | 3,700 | | 361,074 |
| Watson Pharmaceuticals | | 12,700 a | | 295,656 |
| | | | | 3,008,147 |
| Industrial—11.5% | | | | |
| Allied Waste Industries | | 36,500 a | | 414,640 |
| CSX | | 9,400 | | 662,136 |
| Dover | | 12,800 | | 632,704 |
| Honeywell International | | 12,100 | | 487,630 |
| Manpower | | 7,100 | | 458,660 |
| Navigant Consulting | | 11,500 a | | 260,475 |
| Waste Management | | 8,200 | | 294,216 |
| | | | | 3,210,461 |
| Common Stocks (continued) | | Shares | | Value ($) |
| |
| |
|
| Information Technology—10.3% | | | | |
| Agilent Technologies | | 8,695 a | | 274,414 |
| BEA Systems | | 24,100 a | | 315,469 |
| CA | | 8,600 | | 176,730 |
| Diebold | | 11,300 | | 459,006 |
| Manhattan Associates | | 17,200 a | | 348,988 |
| Maxim Integrated Products | | 5,400 | | 173,394 |
| Microsoft | | 18,600 | | 433,380 |
| Nokia, ADR | | 23,100 | | 468,006 |
| TIBCO Software | | 34,000 a | | 239,700 |
| | | | | 2,889,087 |
| Materials—7.3% | | | | |
| EI Du Pont de Nemours & Co. | | 14,700 | | 611,520 |
| Huntsman | | 13,800 a | | 239,016 |
| Nalco Holding | | 19,200 a | | 338,496 |
| Rockwood Holdings | | 10,000 | | 230,100 |
| Temple-Inland | | 14,500 | | 621,615 |
| | | | | 2,040,747 |
| Telecommunication Services—2.6% | | |
| Citizens Communications | | 32,600 | | 425,430 |
| IDT, Cl. B | | 21,800 a | | 300,622 |
| | | | | 726,052 |
| Utilities—1.7% | | | | |
| Sempra Energy | | 10,400 | | 472,992 |
| Total Common Stocks | | | | |
| (cost $24,970,599) | | | | 27,103,725 |
| |
| |
|
| | | Principal | | |
| Bonds and Notes—1.4% | | Amount ($) | | Value ($) |
| |
| |
|
| Health Care | | | | |
| Amgen, | | | | |
| Sr. Notes, .13%, 2/1/11 | | | | |
| (cost $390,811) | | 410,000 b | | 385,400 |
The Portfolio 9
STATEMENT OF INVESTMENTS (Unaudited) (continued)
| Other Investment—.8% | | | | Shares | | Value ($) |
| |
| |
| |
|
| Registered Investment Company; | | | | | | |
| Dreyfus Institutional Preferred | | | | | | |
| Plus Money Market Fund | | | | | | |
| (cost $227,000) | | | | | | 227,000 c | | 227,000 |
| |
| |
| |
| |
|
| |
| Total Investments (cost $25,588,410) | | | | 99.3% | | 27,716,125 |
| |
| Cash and Receivables (Net) | | | | .7% | | 198,313 |
| |
| Net Assets | | | | | | 100.0% | | 27,914,438 |
| |
| ADR—American Depository Receipts | | | | | | |
| a Non-income producing security. | | | | | | |
| b Security exempt from registration under Rule 144A of the Securities Act of 1933.This security may be resold in |
| transactions exempt from registration, normally to qualified institutional buyers. At June 30, 2006, this security |
| amounted to $385,400 or 1.4% of net assets. | | | | | | |
| c Investment in affiliated money market mutual fund. | | | | | | |
| d Securities restricted as to public resale. Investment in restricted securities with aggregated market value assets of |
| $394,200 representing 1.4% of net assets (see below). | | | | | | |
| |
| |
| |
|
| |
| |
| |
| | | | | | | Net | | |
| | | Acquisition | | Purchase | | Assets | | |
| Issuer | | Date | | Price ($) † | | (%) | | Valuation ($) †† |
| |
| |
| |
| |
|
| KKR Private Equity | | | | | | | | |
| Investors, LLP (Units) | | 5/3/06-5/5/06 | | 24.97 | | 1.4 | | 21.90 per unit |
† Average cost per unit.
The valuation of these securities has been determined in good faith under the direction of the Board of Trustees.
| Portfolio Summary | | (Unaudited) † | | | | |
| |
| | | Value (%) | | | | Value (%) |
| |
| |
| |
|
| Financial | | 18.1 | | Consumer Staples | | 8.6 |
| Consumer Discretionary | | 15.4 | | Materials | | 7.3 |
| Health Care | | 12.2 | | Telecommunication Services | | 2.6 |
| Industrial | | 11.5 | | Utilities | | 1.7 |
| Energy | | 10.8 | | Money Market Investment | | .8 |
| Information Technology | | 10.3 | | | | 99.3 |
| |
| † Based on net assets. | | | | | | |
| See notes to financial statements. | | | | |
| |
| |
| |
| 10 | | | | | | |
STATEMENT OF ASSETS AND LIABILITIES
June 30, 2006 (Unaudited)
| | | Cost | | Value |
| |
| |
|
| Assets ($): | | | | |
| Investments in securities—See Statement of Investments: | | |
| Unaffiliated issuers | | 25,361,410 | | 27,489,125 |
| Affiliated issuers | | 227,000 | | 227,000 |
| Cash | | | | 52,347 |
| Receivable for investment securities sold | | 408,355 |
| Dividends and interest receivable | | | | 12,202 |
| Prepaid expenses | | | | 4,390 |
| | | | | 28,193,419 |
| |
| |
|
| Liabilities ($): | | | | |
| Due to The Dreyfus Corporation and affiliates—Note 3(b) | | 24,639 |
| Payable for investment securities purchased | | 221,516 |
| Payable for shares of Beneficial Interest redeemed | | 11,028 |
| Accrued expenses | | | | 21,798 |
| | | | | 278,981 |
| |
| |
|
| Net Assets ($) | | | | 27,914,438 |
| |
| |
|
| Composition of Net Assets ($): | | | | |
| Paid-in capital | | | | 23,734,571 |
| Accumulated undistributed investment income—net | | 86,186 |
| Accumulated net realized gain (loss) on investments | | 1,965,987 |
| Accumulated net unrealized appreciation (depreciation) | | |
| on investments and foreign currency transactions | | 2,127,694 |
| |
|
| Net Assets ($) | | | | 27,914,438 |
| |
| |
|
| |
| |
| Net Asset Value Per Share | | | | |
| | | Initial Shares | | Service Shares |
| |
| |
|
| Net Assets ($) | | 23,250,398 | | 4,664,040 |
| Shares Outstanding | | 1,675,577 | | 337,182 |
| |
| |
|
| Net Asset Value Per Share ($) | | 13.88 | | 13.83 |
See notes to financial statements.
|
The Portfolio 11
STATEMENT OF OPERATIONS
Six Months Ended June 30, 2006 (Unaudited)
|
| Investment Income ($): | | |
| Income: | | |
| Cash dividends (net of $2,613 foreign taxes withheld at source): | | |
| Unaffiliated issuers | | 200,799 |
| Affiliated issuers | | 19,228 |
| Interest | | 726 |
| Total Income | | 220,753 |
| Expenses: | | |
| Investment advisory fee—Note 3(a) | | 109,903 |
| Auditing fees | | 19,195 |
| Custodian fees | | 8,571 |
| Distribution fees—Note 3(b) | | 6,189 |
| Trustees’ fees and expenses—Note 3(c) | | 2,145 |
| Prospectus and shareholders’ reports | | 622 |
| Legal fees | | 437 |
| Miscellaneous | | 293 |
| Total Expenses | | 147,355 |
| Less—waiver of fees due to undertaking—Note 3(a) | | (12,156) |
| Less—reduction in custody fees due to | | |
| earnings credits—Note 1(c) | | (784) |
| Net Expenses | | 134,415 |
| Investment Income—Net | | 86,338 |
| |
|
| Realized and Unrealized Gain (Loss) on Investments—Note 4 ($): |
| Net realized gain (loss) on investments and foreign currency transactions | | 2,066,438 |
| Net unrealized appreciation (depreciation) on | | |
| investments and foreign currency transactions | | (329,024) |
| Net Realized and Unrealized Gain (Loss) on Investments | | 1,737,414 |
| Net Increase in Net Assets Resulting from Operations | | 1,823,752 |
See notes to financial statements.
|
STATEMENT OF CHANGES IN NET ASSETS
| | | Six Months Ended | | |
| | | June 30, 2006 | | Year Ended |
| | | (Unaudited) | | December 31, 2005 |
| |
| |
|
| Operations ($): | | | | |
| Investment income—net | | 86,338 | | 147,886 |
| Net realized gain (loss) on investments | | 2,066,438 | | 3,663,489 |
| Net unrealized appreciation | | | | |
| (depreciation) on investments | | (329,024) | | (2,280,297) |
| Net Increase (Decrease) in Net Assets | | | | |
| Resulting from Operations | | 1,823,752 | | 1,531,078 |
| |
| |
|
| Dividends to Shareholders from ($): | | | | |
| Investment income—net: | | | | |
| Initial shares | | (125,482) | | (33,620) |
| Service shares | | (22,153) | | (2,523) |
| Net realized gain on investments: | | | | |
| Initial shares | | (3,049,073) | | (720,459) |
| Service shares | | (614,098) | | (131,069) |
| Total Dividends | | (3,810,806) | | (887,671) |
| |
| |
|
| Beneficial Interest Transactions ($): | | | | |
| Net proceeds from shares sold: | | | | |
| Initial shares | | 305,022 | | 1,498,805 |
| Service shares | | 139,493 | | 771,389 |
| Dividends reinvested: | | | | |
| Initial shares | | 3,174,555 | | 754,079 |
| Service shares | | 636,251 | | 133,592 |
| Cost of shares redeemed: | | | | |
| Initial shares | | (3,493,914) | | (6,803,276) |
| Service shares | | (987,017) | | (1,135,216) |
| Increase (Decrease) in Net Assets from | | | | |
| Beneficial Interest Transactions | | (225,610) | | (4,780,627) |
| Total Increase (Decrease) in Net Assets | | (2,212,664) | | (4,137,220) |
| |
| |
|
| Net Assets ($): | | | | |
| Beginning of Period | | 30,127,102 | | 34,264,322 |
| End of Period | | 27,914,438 | | 30,127,102 |
| Undistributed investment income—net | | 86,186 | | 147,483 |
The Portfolio 13
STATEMENT OF CHANGES IN NET ASSETS (continued)
|
| | | Six Months Ended | | |
| | | June 30, 2006 | | Year Ended |
| | | (Unaudited) | | December 31, 2005 |
| |
| |
|
| Capital Share Transactions: | | | | |
| Initial Shares | | | | |
| Shares sold | | 21,624 | | 105,018 |
| Shares issued for dividends reinvested | | 226,269 | | 54,683 |
| Shares redeemed | | (235,953) | | (475,011) |
| Net Increase (Decrease) in Shares Outstanding | | 11,940 | | (315,310) |
| |
| |
|
| Service Shares | | | | |
| Shares sold | | 9,910 | | 54,193 |
| Shares issued for dividends reinvested | | 45,479 | | 9,716 |
| Shares redeemed | | (66,330) | | (80,214) |
| Net Increase (Decrease) in Shares Outstanding | | (10,941) | | (16,305) |
See notes to financial statements.
|
The following tables describe the performance for each share class for the fiscal periods indicated.All information (except portfolio turnover rate) reflects financial results for a single portfolio share. Total return shows how much your investment in the portfolio would have increased (or decreased) during each period, assuming you had reinvested all dividends and distributions.These figures have been derived from the portfolio’s financial statements.
| | | Six Months Ended | | | | | | | | |
| | | June 30, 2006 | | Year Ended December 31, | | |
| | | |
| |
| |
|
| Initial Shares | | (Unaudited) | | 2005 | | 2004 | | 2003 | | 2002 | | 2001 |
| |
| |
| |
| |
| |
| |
|
| Per Share Data ($): | | | | | | | | | | | | |
| Net asset value, | | | | | | | | | | | | |
| beginning of period | | 14.98 | | 14.63 | | 14.39 | | 11.04 | | 13.07 | | 14.65 |
| Investment Operations: | | | | | | | | | | | | |
| Investment income—net a | | .04 | | .07 | | .07 | | .03 | | .10 | | .14 |
| Net realized and unrealized | | | | | | | | | | | | |
| gain (loss) on investments | | .91 | | .68 | | 1.82 | | 3.43 | | (2.09) | | (1.30) |
| Total from Investment Operations | | .95 | | .75 | | 1.89 | | 3.46 | | (1.99) | | (1.16) |
| Distributions: | | | | | | | | | | | | |
| Dividends from | | | | | | | | | | | | |
| investment income—net | | (.08) | | (.02) | | (.10) | | (.11) | | (.04) | | (.11) |
| Dividends from net realized | | | | | | | | | | | | |
| gain on investments | | (1.97) | | (.38) | | (1.55) | | — | | — | | (.31) |
| Total Distributions | | (2.05) | | (.40) | | (1.65) | | (.11) | | (.04) | | (.42) |
| Net asset value, end of period | | 13.88 | | 14.98 | | 14.63 | | 14.39 | | 11.04 | | 13.07 |
| |
| |
| |
| |
| |
| |
|
| Total Return (%) | | 6.19b | | 5.34 | | 13.08 | | 31.74 | | (15.28) | | (7.97) |
| |
| |
| |
| |
| |
| |
|
| Ratios/Supplemental Data (%): | | | | | | | | | | |
| Ratio of total expenses | | | | | | | | | | | | |
| to average net assets | | .48b | | .94 | | .93 | | 1.01 | | .99 | | .91 |
| Ratio of net expenses | | | | | | | | | | | | |
| to average net assets | | .45b | | .93 | | .91 | | .97 | | .92 | | .90 |
| Ratio of net investment income | | | | | | | | | | | | |
| to average net assets | | .30b | | .48 | | .50 | | .23 | | .81 | | 1.00 |
| Portfolio Turnover Rate | | 41.48b | | 83.27 | | 90.27 | | 108.01 | | 148.29 | | 59.85 |
| |
| |
| |
| |
| |
| |
|
| Net Assets, end of period | | | | | | | | | | | | |
| ($ x 1,000) | | 23,250 | | 24,926 | | 28,949 | | 31,557 | | 27,255 | | 39,854 |
| |
| a | | Based on average shares outstanding at each month end. | | | | | | | | |
| b | | Not annualized. | | | | | | | | | | | | |
| See notes to financial statements. | | | | | | | | | | | | |
The Portfolio 15
FINANCIAL HIGHLIGHTS (continued)
|
| | | Six Months Ended | | | | | | | | |
| | | June 30, 2006 | | Year Ended December 31, | | |
| | | |
| |
| |
|
| Service Shares | | (Unaudited) | | 2005 | | 2004 | | 2003 | | 2002 | | 2001 |
| |
| |
| |
| |
| |
| |
|
| Per Share Data ($): | | | | | | | | | | | | |
| Net asset value, | | | | | | | | | | | | |
| beginning of period | | 14.94 | | 14.59 | | 14.36 | | 11.02 | | 13.05 | | 14.65 |
| Investment Operations: | | | | | | | | | | | | |
| Investment income—net a | | .04 | | .06 | | .06 | | .02 | | .08 | | .12 |
| Net realized and unrealized | | | | | | | | | | | | |
| gain (loss) on investments | | .89 | | .68 | | 1.80 | | 3.43 | | (2.07) | | (1.31) |
| Total from Investment Operations | | .93 | | .74 | | 1.86 | | 3.45 | | (1.99) | | (1.19) |
| Distributions: | | | | | | | | | | | | |
| Dividends from | | | | | | | | | | | | |
| investment income—net | | (.07) | | (.01) | | (.08) | | (.11) | | (.04) | | (.10) |
| Dividends from net realized | | | | | | | | | | | | |
| gain on investments | | (1.97) | | (.38) | | (1.55) | | — | | — | | (.31) |
| Total Distributions | | (2.04) | | (.39) | | (1.63) | | (.11) | | (.04) | | (.41) |
| Net asset value, end of period | | 13.83 | | 14.94 | | 14.59 | | 14.36 | | 11.02 | | 13.05 |
| |
| |
| |
| |
| |
| |
|
| Total Return (%) | | 6.06b | | 5.28 | | 12.96 | | 31.71 | | (15.32) | | (8.17) |
| |
| |
| |
| |
| |
| |
|
| Ratios/Supplemental Data (%): | | | | | | | | | | |
| Ratio of total expenses | | | | | | | | | | | | |
| to average net assets | | .60b | | 1.19 | | 1.18 | | 1.27 | | 1.26 | | 1.24 |
| Ratio of net expenses | | | | | | | | | | | | |
| to average net assets | | .50b | | 1.00 | | 1.00 | | 1.00 | | .99 | | 1.00 |
| Ratio of net investment income | | | | | | | | | | | | |
| to average net assets | | .25b | | .41 | | .42 | | .21 | | .69 | | .92 |
| Portfolio Turnover Rate | | 41.48b | | 83.27 | | 90.27 | | 108.01 | | 148.29 | | 59.85 |
| |
| |
| |
| |
| |
| |
|
| Net Assets, end of period | | | | | | | | | | | | |
| ($ x 1,000) | | 4,664 | | 5,201 | | 5,316 | | 5,196 | | 3,910 | | 2,585 |
| |
| a | | Based on average shares outstanding at each month end. | | | | | | | | |
| b | | Not annualized. | | | | | | | | | | | | |
| See notes to financial statements. | | | | | | | | | | | | |
NOTES TO FINANCIAL STATEMENTS (Unaudited)
NOTE 1—Significant Accounting Policies:
Dreyfus Variable Investment Fund (the “fund”) is registered under the Investment Company Act of 1940, as amended (the “Act”), as an open-end management investment company, operating as a series company currently offering twelve series, including the Special Value Portfolio (the “portfolio”). The portfolio is only offered to separate accounts established by insurance companies to fund variable annuity contracts and variable life insurance policies.The portfolio is a diversified series. The portfolio’s investment objective is to maximize total return, consisting of capital appreciation and current income. The Dreyfus Corporation (the “Manager” or “Dreyfus”) serves as the portfolio’s investment adviser. Dreyfus is a wholly-owned subsidiary of Mellon Financial Corporation (“Mellon Financial”). Jennison Associates LLC (“Jennison”) serves as the portfolio’s sub-investment adviser.
Dreyfus Service Corporation (the “Distributor”), a wholly-owned subsidiary of Dreyfus, is the distributor of the portfolio’s shares, which are sold without a sales charge.The portfolio is authorized to issue an unlimited number of $.001 par value shares of Beneficial Interest in each of the following classes of shares: Initial and Service. Each class of shares has identical rights and privileges, except with respect to the distribution plan and the expenses borne by each class and certain voting rights. Income, expenses (other than expenses attributable to a specific class), and realized and unrealized gains or losses on investments are allocated to each class of shares based on its relative net assets.
The fund accounts separately for the assets, liabilities and operations of each series. Expenses directly attributable to each series are charged to that series’ operations; expenses which are applicable to all series are allocated among them on a pro rata basis.
The portfolio’s financial statements are prepared in accordance with U.S. generally accepted accounting principles, which may require the use of management estimates and assumptions.Actual results could differ from those estimates.
The Portfolio 17
NOTES TO FINANCIAL STATEMENTS (Unaudited) (continued)
The fund enters into contracts that contain a variety of indemnifica-tions.The portfolio’s maximum exposure under these arrangements is unknown. The portfolio does not anticipate recognizing any loss related to these arrangements.
(a) Portfolio valuation: Investments in securities are valued at the last sales price on the securities exchange or national securities market on which such securities are primarily traded. Securities listed on the National Market System for which market quotations are available are valued at the official closing price or, if there is no official closing price that day, at the last sales price. Securities not listed on an exchange or the national securities market, or securities for which there were no transactions, are valued at the average of the most recent bid and asked prices, except for open short positions, where the asked price is used for valuation purposes. Bid price is used when no asked price is available. Investments in registered investment companies are valued at their net asset value. When market quotations or official closing prices are not readily available, or are determined not to reflect accurately fair value, such as when the value of a security has been significantly affected by events after the close of the exchange or market on which the security is principally traded (for example, a foreign exchange or market), but before the portfolio calculates its net asset value, the portfolio may value these investments at fair value as determined in accordance with the procedures approved by the Board of Trustees. Fair valuing of securities may be determined with the assistance of a pricing service using calculations based on indices of domestic securities and other appropriate indicators, such as prices of relevant ADR’s and futures contracts. For other securities that are fair valued by the Board of Trustees, certain factors may be considered such as: fundamental analytical data, the nature and duration of restrictions on disposition, an evaluation of the forces that influence the market in which the securities are purchased and sold, and public trading in similar securities of the issuer or comparable issuers. Financial futures are valued at the last sales price. Investments denominated in foreign currencies are translated to U.S. dollars at the
prevailing rates of exchange. Forward currency exchange contracts are valued at the forward rate.
(b) Foreign currency transactions: The portfolio does not isolate that portion of the results of operations resulting from changes in foreign exchange rates on investments from the fluctuations arising from changes in market prices of securities held. Such fluctuations are included with the net realized and unrealized gain or loss on investments.
Net realized foreign exchange gains or losses arise from sales and maturities of short-term securities, sales of foreign currencies, currency gains or losses realized on securities transactions and the difference between the amounts of dividends, interest and foreign withholding taxes recorded on the portfolio’s books and the U.S. dollar equivalent of the amounts actually received or paid. Net unrealized foreign exchange gains or losses arise from changes in the value of assets and liabilities other than investments in securities, resulting from changes in exchange rates. Such gains and losses are included with net realized and unrealized gain or loss on investments.
(c) Securities transactions and investment income: Securities transactions are recorded on a trade date basis. Realized gain and loss from securities transactions are recorded on the identified cost basis. Dividend income is recognized on the ex-dividend date and interest income, including, where applicable, accretion of discount and amortization of premium on investments, is recognized on the accrual basis.
The portfolio has an arrangement with the custodian bank whereby the portfolio receives earnings credits from the custodian when positive cash balances are maintained, which are used to offset custody fees. For financial reporting purposes, the portfolio includes net earnings credits as an expense offset in the Statement of Operations.
(d) Affiliated issuers: Investments in other investment companies advised by Dreyfus are defined as “affiliated” in the Act.
The Portfolio 19
NOTES TO FINANCIAL STATEMENTS (Unaudited) (continued)
(e) Dividends to shareholders: Dividends are recorded on the ex-dividend date. Dividends from investment income-net and dividends from net realized capital gain, if any, are normally declared and paid annually, but the portfolio may make distributions on a more frequent basis to comply with the distribution requirements of the Internal Revenue Code of 1986, as amended (the “Code”).To the extent that net realized capital gain can be offset by capital loss carryovers, if any, it is the policy of the portfolio not to distribute such gain. Income and capital gain distributions are determined in accordance with income tax regulations, which may differ from U.S. generally accepted accounting principles.
(f) Federal income taxes: It is the policy of the portfolio to continue to qualify as a regulated investment company, if such qualification is in the best interests of its shareholders, by complying with the applicable provisions of the Code, and to make distributions of taxable income sufficient to relieve it from substantially all federal income and excise taxes.
The tax character of distributions paid to shareholders during the fiscal year ended December 31, 2005 were as follows: ordinary income $475,265 and long-term capital gains $412,406. The tax character of current year distributions will be determined at the end of the current fiscal year.
NOTE 2—Bank Lines of Credit:
|
The portfolio may borrow up to $5 million for leveraging purposes under a short-term unsecured line of credit and participates with other Dreyfus managed funds in a $100 million unsecured line of credit primarily to be utilized for temporary or emergency purposes including the financing of redemptions. Interest is charged to the portfolio based on prevailing market rates in effect at the time of borrowing. During the period ended June 30, 2006, the portfolio did not borrow under either line of credit.
NOTE 3—Investment Advisory Fee and Other Transactions With Affiliates:
(a) Pursuant to an Investment Advisory Agreement with Dreyfus, the investment advisory fee is computed at the annual rate of .75% of the value of the portfolio’s average daily net assets and is payable monthly.
Pursuant to a Sub-Investment Advisory Agreement between Dreyfus and Jennison, the sub-investment advisory fee is payable monthly by Dreyfus, and is based upon the value of the portfolio’s average daily net assets, computed at the following annual rates: .50% of the first $300 million and .45% over $300 million.
Dreyfus has agreed, from January 1, 2006 to December 31, 2006 to waive receipt of its fees and/or assume the expenses of the portfolio so that the expenses of neither class, exclusive of taxes, brokerage commissions, interest expense and extraordinary expenses, exceed 1% of the value of the average daily net assets of their class. During the period ended June 30, 2006, Dreyfus waived receipt of fees of $12,156, pursuant to the undertaking.
(b) Under the Distribution Plan (the “Plan”) adopted pursuant to Rule 12b-1 under the Act, Service shares pay the Distributor for distributing their shares, for servicing and/or maintaining Service shares shareholder accounts and for advertising and marketing for Service shares.The Plan provides for payments to be made at an annual rate of .25% of the value of the Service shares’ average daily net assets.The Distributor may make payments to Participating Insurance Companies and to brokers and dealers acting as principal underwriter for their variable insurance products.The fees payable under the Plan are payable without regard to actual expenses incurred. During the period ended June 30, 2006, Service shares were charged $6,189 pursuant to the Plan.
The Portfolio 21
NOTES TO FINANCIAL STATEMENTS (Unaudited) (continued)
The portfolio compensates Dreyfus Transfer, Inc., a wholly-owned subsidiary of Dreyfus, under a transfer agency agreement for providing personnel and facilities to perform transfer agency services for the portfolio. During the period ended June 30, 2006, the portfolio was charged $31 pursuant to the transfer agency agreement.
During the period ended June 30, 2006, the portfolio was charged $1,926 for services performed by the Chief Compliance Officer.
The components of Due to The Dreyfus Corporation and affiliates in the Statement of Assets and Liabilities consist of: investment advisory fees $16,943, Rule 12b-1 distribution plan fees $944, custodian fees $5,771, chief compliance officer fees $1,926 and transfer agency per account fees $10, which are offset against an expense reimbursement currently in effect in the amount of $955.
(c) Each Board member also serves as a Board member of other funds within the Dreyfus complex. Annual retainer fees and attendance fees are allocated to each fund based on net assets.
(d) Pursuant to an exemptive order from the SEC, the portfolio may invest its available cash balances in affiliated money market mutual funds. Management fees of the underlying money market mutual funds have been waived by Dreyfus.
NOTE 4—Securities Transactions:
|
The aggregate amount of purchases and sales of investment securities, excluding short-term securities, during the period ended June 30, 2006, amounted to $11,949,165 and $15,660,891, respectively.
At June 30, 2006, accumulated net unrealized appreciation on investments was $2,127,715, consisting of $3,140,665 gross unrealized appreciation and $1,012,950 gross unrealized depreciation.
At June 30,2006,the cost of investments for federal income tax purposes was substantially the same as the cost for financial reporting purposes (see the Statement of Investments).
PROXY RESULTS ( U n a u d i t e d )
|
Dreyfus Variable Investment Fund held a special meeting of shareholders on June 29, 2006.The proposal considered at the meeting, and the results, are as follows:
| | | | | Shares | | |
| |
| |
| |
|
| | | For | | | | Authority Withheld |
| |
| |
| |
|
| To elect additional Board Members: | | | | | | |
| Peggy C. Davis † | | 171,078,926.558 | | | | 7,687,714.085 |
| Joseph S. DiMartino | | 170,946,484.400 | | | | 7,820,156.243 |
| David P. Feldman | | 170,959,920.714 | | | | 7,806,719.929 |
| Ehud Houminer † | | 170,132,086.682 | | | | 8,634,553.961 |
| Gloria Messinger † | | 170,187,240.710 | | | | 8,579,399.933 |
| Anne Wexler † | | 170,212,607.472 | | | | 8,554,033.171 |
| † Each will serve as an Independent Board member of the fund commencing, subject to the discretion of the Board, on |
| or about January 1, 2007. |
| In addition to Joseph S. DiMartino and David P. Feldman, James F. Henry, Dr. Paul A. Marks and Dr. Martin |
| Peretz continue as Board members of the fund. |
The Portfolio 23
INFORMATION ABOUT THE REVIEW AND APPROVAL OF THE PORTFOLIO’S
I N V E S T M E N T A D V I S O R Y A G R E E M E N T (Unaudited)
At a meeting of the fund’s Board of Trustees held on June 7 and 8, 2006, the Board considered the re-approval for an annual period (through July 31, 2007) of the fund’s Investment Advisory Agreement with Dreyfus for the portfolio, pursuant to which Dreyfus provides the portfolio with investment advisory and administrative services, and the Sub-Investment Advisory Agreement (“Sub-Advisory Agreement”) between Dreyfus and Jennison Associates LLC (the “Sub-Adviser”), pursuant to which the Sub-Adviser provides day-to-day management of the portfolio’s investments subject to Dreyfus’ oversight.The Board members, none of whom are “interested persons” (as defined in the Investment Company Act of 1940, as amended) of the fund were assisted in their review by independent legal counsel and met with counsel in executive session separate from representatives of Dreyfus and the Sub-Adviser.
Analysis of Nature, Extent and Quality of Services Provided to the Portfolio. The Board members received a presentation from representatives of Dreyfus regarding services provided to the portfolio and other funds in the Dreyfus fund complex, and discussed the nature, extent and quality of the services provided to the portfolio pursuant to its Investment Advisory Agreement and by the Sub-Adviser pursuant to the Sub-Advisory Agreement. Dreyfus’ representatives reviewed the portfolio’s distribution of accounts and the relationships Dreyfus has with various intermediaries and the different needs of each.The Board noted that the portfolio’s shares were offered only to separate accounts established by insurance companies to fund variable annuity contracts and variable life insurance policies. Dreyfus’ representatives noted the diversity of distribution among the funds in the Dreyfus fund complex, and Dreyfus’ corresponding need for broad, deep, and diverse resources to be able to provide ongoing shareholder services to each distribution channel, including that of the portfolio. Dreyfus also provided the number of separate accounts investing in the portfolio, as well as the portfolio’s asset size.
The Board members also considered the Sub-Adviser’s research and portfolio management capabilities and that Dreyfus also provides over-
sight of day-to-day portfolio operations, including fund accounting and administration and assistance in meeting legal and regulatory requirements.The Board members also considered Dreyfus’ extensive administrative, accounting and compliance infrastructure, as well as Dreyfus’ supervisory activities over the Sub-Adviser.
Comparative Analysis of the Portfolio’s Performance and Advisory Fee and Expense Ratio. The Board members reviewed the portfolio’s performance and placed significant emphasis on comparisons to a group of multi-cap core funds underlying variable insurance products (the “Performance Group”) and to a larger universe of funds, consisting of all multi-cap core funds underlying variable insurance products (the “Performance Universe”) selected and provided by Lipper, Inc., an independent provider of investment company data. The Board was provided with a description of the methodology Lipper used to select the Performance Group and Performance Universe, as well as the Expense Group and Expense Universe (discussed below). The Board members discussed the results of the comparisons for various periods ended April 30, 2006, and noted that the portfolio’s total return performance for its Initial shares was in the first quintile of the Performance Group and Performance Universe for most periods. Dreyfus also provided the Board with the portfolio’s total return performance and the quartile, percentile and rank of the portfolio’s total return within its Lipper category (as provided by Lipper) for certain other periods ended April 30, 2006, which generally were consistent with the total return information provided by Lipper.
The Board members also discussed the portfolio’s advisory and the sub-advisory fee (paid by Dreyfus) and the expense ratio for each class of shares and reviewed the range of advisory fees and expense ratios of a comparable group of funds (the “Expense Group”) and a broader group of funds (the “Expense Universe”), each selected and provided by Lipper.The Board members noted that the portfolio’s advisory fee was lower than its Expense Group median and higher than its Expense Universe median, and that the expense ratios for the Initial shares and
The Portfolio 25
I N FO R M AT I O N A B O U T T H E R E V I E W A N D A P P R OVA L O F T H E P O R T FO L I O ’ S I N V E S T M E N T A DV I S O RY A G R E E M E N T ( U n a u d i t e d ) ( c o n t i n u e d )
Service shares were higher than the Expense Group and Expense Universe medians. The Board noted Dreyfus’ current undertaking to waive or reimburse certain fees and expenses, which reduced the expense ratio for each share class.The Board also noted that the Sub-Adviser’s fee is paid by Dreyfus and not the portfolio.
Representatives of Dreyfus noted that there are no other mutual funds managed by Dreyfus or its affiliates with similar investment objectives, policies and strategies and included within the portfolio’s Lipper cate-gory.The representatives of Dreyfus also noted that there are no other accounts managed by Dreyfus or its affiliates or the Sub-Adviser or its affiliates with similar investment objectives, policies and strategies as the portfolio.
Analysis of Profitability and Economies of Scale. Dreyfus’ representatives reviewed the dollar amount of expenses allocated and profit received by Dreyfus and the method used to determine such expenses and profit.The Board considered information, previously provided and discussed, prepared by an independent consulting firm regarding Dreyfus’ approach to allocating costs to, and determining the profitability of, individual funds and the entire Dreyfus mutual fund complex. The Board members also considered that the methodology had also been reviewed by an independent registered public accounting firm which, like the consultant, found the methodology to be reason-able.The consulting firm also analyzed where any economies of scale might emerge in connection with the management of the portfolio. The Board members evaluated the profitability analysis in light of the relevant circumstances for the portfolio and the extent to which economies of scale would be realized if the portfolio grows and whether fee levels reflect these economies of scale for the benefit of portfolio investors.The Board members also considered potential benefits to Dreyfus from acting as investment adviser and to the Sub-Adviser from acting as sub-adviser and noted the soft dollar arrangements with respect to trading the portfolio’s investments.
It was noted that the Board members should consider Dreyfus’ profitability with respect to the portfolio as part of their evaluation of whether the fees under the Investment Advisory Agreement and the Sub-Advisory Agreement bear a reasonable relationship to the mix of services provided by Dreyfus and the Sub-Adviser, including the nature, extent and quality of such services and that a discussion of economies of scale is predicated on increasing assets and that, if a fund’s assets had been decreasing, the possibility that Dreyfus may have realized any economies of scale would be less. It also was noted that the profitability percentage for managing the portfolio was within ranges determined by appropriate court cases to be reasonable given the services rendered and generally superior service levels provided by Dreyfus and the Sub-Adviser. The Board also noted the fee waiver and expense reimbursement arrangements and its effect on Dreyfus’ profitability.
At the conclusion of these discussions, the Board agreed that it had been furnished with sufficient information to make an informed business decision with respect to continuation of the Investment Advisory Agreement and Sub-Advisory Agreement, with respect to the portfolio. Based on the discussions and considerations as described above, the Board made the following conclusions and determinations.
- The Board concluded that the nature, extent and quality of the services provided by Dreyfus and the Sub-Adviser are adequate and appropriate.
- The Board was satisfied with the portfolio’s performance.
- The Board concluded that the fee paid by the portfolio to Dreyfus, and the fee paid by Dreyfus to the Sub-Adviser, were reasonable in light of the services provided, comparative performance, expense and advisory fee information, including Dreyfus’ undertaking to waive or reimburse certain fees and expenses (which reduced the expense ratio of the portfolio’s share classes), costs of the services provided and profits to be realized and benefits derived or to be derived by Dreyfus and the Sub-Adviser from their relationship with the portfolio.
The Portfolio 27
I N FO R M AT I O N A B O U T T H E R E V I E W A N D A P P R OVA L O F T H E P O R T FO L I O ’ S I N V E S T M E N T A DV I S O RY A G R E E M E N T ( U n a u d i t e d ) ( c o n t i n u e d )
- The Board determined that the economies of scale which may accrue to Dreyfus and its affiliates in connection with the management of the portfolio had been adequately considered by Dreyfus in connection with the advisory fee rate charged to the portfolio and that, to the extent in the future it were determined that material economies of scale had not been shared with the portfolio, the Board would seek to have those economies of scale shared with the portfolio.
The Board members considered these conclusions and determinations, along with information received on a routine and regular basis throughout the year, and, without any one factor being dispositive, the Board determined that re-approval of the portfolio’s Investment Advisory Agreement and Sub-Advisory Agreement was in the best interests of the portfolio and its shareholders.
| Dreyfus Variable |
| Investment Fund, |
| Special Value Portfolio |
| 200 Park Avenue |
| New York, NY 10166 |
| |
| Investment Adviser |
| The Dreyfus Corporation |
| 200 Park Avenue |
| New York, NY 10166 |
| |
| Sub-Investment Adviser |
| Jennison Associates LLC |
| 466 Lexington Avenue |
| New York, NY 10017 |
| Custodian |
| The Bank of New York |
| One Wall Street |
| New York, NY 10286 |
| |
| Transfer Agent & |
| Dividend Disbursing Agent |
| Dreyfus Transfer, Inc. |
| 200 Park Avenue |
| New York, NY 10166 |
| |
| Distributor |
| Dreyfus Service Corporation |
| 200 Park Avenue |
| New York, NY 10166 |
Telephone 1-800-554-4611 or 516-338-3300
Mail The Dreyfus Family of Funds, 144 Glenn Curtiss Boulevard, Uniondale, NY 11556-0144 Attn: Investments Division
The portfolio files its complete schedule of portfolio holdings with the Securities and Exchange Commission (“SEC”) for the first and third quarters of each fiscal year on Form N-Q. The portfolio’s Forms N-Q are available on the SEC’s website at http://www.sec.gov and may be reviewed and copied at the SEC’s Public Reference Room in Washington, DC. Information on the operation of the Public Reference Room may be obtained by calling 1-202-551-8090.
A description of the policies and procedures that the portfolio uses to determine how to vote proxies relating to portfolio securities, and information regarding how the portfolio voted these proxies for the 12-month period ended June 30, 2006, is available at http://www.dreyfus.com and on the SEC’s website at http://www.sec.gov. The description of the policies and procedures is also available without charge, upon request, by calling 1-800-645-6561.
| © 2006 Dreyfus Service Corporation |

| Item 2. | | Code of Ethics. |
| | | Not applicable. |
| Item 3. | | Audit Committee Financial Expert. |
| | | Not applicable. |
| Item 4. | | Principal Accountant Fees and Services. |
| | | Not applicable. |
| Item 5. | | Audit Committee of Listed Registrants. |
| | | Not applicable. |
| Item 6. | | Schedule of Investments. |
| | | Not applicable. |
| Item 7. | | Disclosure of Proxy Voting Policies and Procedures for Closed-End Management |
| | | Investment Companies. |
| | | Not applicable. |
| Item 8. | | Portfolio Managers of Closed-End Management Investment Companies. |
| | | Not applicable. |
| Item 9. | | Purchases of Equity Securities by Closed-End Management Investment Companies and |
| | | Affiliated Purchasers. |
| | | Not applicable. [CLOSED-END FUNDS ONLY] |
| Item 10. | | Submission of Matters to a Vote of Security Holders. |
The Registrant has a Nominating Committee (the "Committee"), which is responsible for selecting and nominating persons for election or appointment by the Registrant's Board as Board members. The Committee has adopted a Nominating Committee Charter (the "Charter"). Pursuant to the Charter, the Committee will consider recommendations for nominees from shareholders submitted to the Secretary of the Registrant, c/o The Dreyfus Corporation Legal Department, 200 Park Avenue, 8th Floor East, New York, New York 10166. A nomination submission must include information regarding the recommended nominee as specified in the Charter. This information includes all information relating to a recommended nominee that is required to be disclosed in solicitations or proxy statements for the election of Board members, as well as information sufficient to evaluate the factors to be considered by the Committee, including character and integrity, business and professional experience, and whether the person has the ability to apply sound and independent business judgment and would act in the interests of the Registrant and its shareholders.
Nomination submissions are required to be accompanied by a written consent of the individual to stand for election if nominated by the Board and to serve if elected by the shareholders, and such additional information must be provided regarding the recommended nominee as reasonably requested by the Committee.
| Item 11. | | Controls and Procedures. |
(a) The Registrant's principal executive and principal financial officers have concluded, based on their evaluation of the Registrant's disclosure controls and procedures as of a date within 90 days of the filing date of this report, that the Registrant's disclosure controls and procedures are reasonably designed to ensure that information required to be disclosed by the Registrant on Form N-CSR is recorded, processed, summarized and reported within the required time periods and that information required to be disclosed by the Registrant in the reports that it files or submits on Form N-CSR is accumulated and communicated to the Registrant's management, including its principal executive and principal financial officers, as appropriate to allow timely decisions regarding required disclosure.
(b) There were no changes to the Registrant's internal control over financial reporting that occurred during the second fiscal quarter of the period covered by this report that have materially affected, or are reasonably likely to materially affect, the Registrant's internal control over financial reporting.
| (a)(1) | | Not applicable. |
| (a)(2) | | Certifications of principal executive and principal financial officers as required by Rule 30a-2(a) |
| under the Investment Company Act of 1940. |
| (a)(3) | | Not applicable. |
| (b) | | Certification of principal executive and principal financial officers as required by Rule 30a-2(b) |
| under the Investment Company Act of 1940. |
Pursuant to the requirements of the Securities Exchange Act of 1934 and the Investment Company Act of 1940, the Registrant has duly caused this Report to be signed on its behalf by the undersigned, thereunto duly authorized.
| Dreyfus Variable Investment Fund |
| |
| By: | | /s/Stephen E. Canter |
| | | Stephen E. Canter |
| | | President |
| |
| Date: | | August 17, 2006 |
Pursuant to the requirements of the Securities Exchange Act of 1934 and the Investment Company Act of 1940, this Report has been signed below by the following persons on behalf of the Registrant and in the capacities and on the dates indicated.
| By: | | /s/ Stephen E. Canter |
| | | Stephen E. Canter |
| | | Chief Executive Officer |
| |
| Date: | | August 17, 2006 |
| |
| By: | | /s/James Windels |
| | | James Windels |
| | | Chief Financial Officer |
| |
| Date: | | August 17, 2006 |
(a)(2) Certifications of principal executive and principal financial officers as required by Rule 30a-2(a) under the Investment Company Act of 1940. (EX-99.CERT)
(b) Certification of principal executive and principal financial officers as required by Rule 30a-2(b) under the Investment Company Act of 1940. (EX-99.906CERT)