| UNITED STATES |
| SECURITIES AND EXCHANGE COMMISSION |
| Washington, D.C. 20549 |
| |
| |
| FORM N-CSR |
| |
| CERTIFIED SHAREHOLDER REPORT OF REGISTERED MANAGEMENT |
| INVESTMENT COMPANIES |
| |
| Investment Company Act file number 811-5125 |
| |
| DREYFUS VARIABLE INVESTMENT FUND |
| (Exact name of Registrant as specified in charter) |
| |
| |
| c/o The Dreyfus Corporation |
| 200 Park Avenue |
| New York, New York 10166 |
| (Address of principal executive offices) (Zip code) |
| |
| Mark N. Jacobs, Esq. |
| 200 Park Avenue |
| New York, New York 10166 |
| (Name and address of agent for service) |
| Registrant's telephone number, including area code: | | (212) 922-6000 |
| Date of fiscal year end: | | 12/31 | | |
| Date of reporting period: | | 06/30/05 | | |
FORM N-CSR
| Item 1. | | Reports to Stockholders. |
| Dreyfus Variable |
| Investment Fund, |
| Appreciation Portfolio |
SEMIANNUAL REPORT June 30, 2005

The views expressed in this report reflect those of the portfolio manager only through the end of the period covered and do not necessarily represent the views of Dreyfus or any other person in the Dreyfus organization.Any such views are subject to change at any time based upon market or other conditions and Dreyfus disclaims any responsibility to update such views. These views may not be relied on as investment advice and, because investment decisions for a Dreyfus portfolio are based on numerous factors, may not be relied on as an indication of trading intent on behalf of any Dreyfus portfolio.
Not FDIC-Insured • Not Bank-Guaranteed • May Lose Value
| | | Contents |
| |
| | | T H E P O R T F O L I O |
| |
|
| 2 | | Letter from the Chairman |
| 3 | | Discussion of Performance |
| 6 | | Understanding Your Portfolio's Expenses |
| 6 | | Comparing Your Portfolio's Expenses |
| | | With Those of Other Funds |
| 7 | | Statement of Investments |
| 10 | | Statement of Assets and Liabilities |
| 11 | | Statement of Operations |
| 12 | | Statement of Changes in Net Assets |
| 14 | | Financial Highlights |
| 16 | | Notes to Financial Statements |
| 24 | | Information About the Review |
| and Approval of the Portfolio's |
| Investment Advisory Agreement |
| | | F O R M O R E I N F O R M AT I O N |
| |
|
| | | Back Cover |
| Dreyfus Variable Investment Fund, |
| Appreciation Portfolio |
The Portfolio

L E T T E R F R O M T H E C H A I R M A N
Dear Shareholder:
We are pleased to present this semiannual report for Dreyfus Variable Investment Fund,Appreciation Portfolio, covering the six-month period from January 1, 2005, through June 30, 2005. Inside, you'll find valuable information about how the portfolio was managed during the reporting period, including a discussion with the portfolio manager, Fayez Sarofim, of Fayez Sarofim & Co., the portfolio's sub-investment adviser.
On average, U.S. stock prices ended the first half of 2005 slightly lower than where they began, largely due to headwinds caused by higher energy prices, rising short-term interest rates and recent evidence of slower economic growth. While midcap stocks generally produced higher returns than large-cap stocks, and large-cap stocks generally outperformed small-cap stocks, these differences were relatively small. Conversely, value-oriented stocks continued to produce substantially better results than their more growth-oriented counterparts.
In some ways, market conditions at midyear remind us of those from one year ago, when stock prices languished due to economic and political concerns before rallying strongly later in the year. Currently, our economists expect the U.S. economy to continue to grow over the foreseeable future without significant new inflationary pressures, potentially setting the stage for better business conditions that could send stock prices higher.As always, we encourage you to discuss these and other matters with your financial advisor.
Thank you for your continued confidence and support.


D I S C U S S I O N O F P E R F O R M A N C E
Fayez Sarofim, Portfolio Manager
Fayez Sarofim & Co., Sub-Investment Adviser
How did Dreyfus Variable Investment Fund, Appreciation Portfolio perform relative to its benchmark?
For the six-month period ended June 30, 2005, the portfolio's Initial shares produced a total return of 0.66%, and its Service shares produced a total return of 0.54% .1 For the same period, the total return of the portfolio's benchmark, the Standard & Poor's 500 Composite Stock Price Index ("S&P 500 Index"), was –0.81% .2
Stocks ended the reporting period roughly unchanged from where they began, as the benefits of a growing economy and strong earnings reports were offset by concerns regarding higher interest rates and surging energy prices.The portfolio produced higher returns than the S&P 500 Index, primarily due to a shift in investor sentiment away from smaller, more speculative investments and toward the larger, better-established, multinational companies in which the portfolio primarily invests.
What is the portfolio's investment approach?
The portfolio normally invests at least 80% of its assets in common stocks. The portfolio focuses on large, well-established multinational growth companies that have demonstrated sustained patterns of profitability, strong balance sheets, an expanding global presence and the potential to achieve predictable above-average earnings growth. We focus on purchasing reasonably priced growth stocks of fundamentally sound companies in economic sectors that we believe will expand over the next three to five years or longer.
What other factors influenced the portfolio's performance?
Stocks traded in a relatively narrow range over the first half of 2005 as positive factors, such as a generally robust economy and encouraging corporate earnings, were offset by other, potentially adverse influences. Rising interest rates and inflationary pressures caused primarily by
T h e P o r t f o l i o 3
|
D I S C U S S I O N O F P E R F O R M A N C E (continued)
escalating energy prices proved to be particularly worrisome for investors, who grew concerned that higher borrowing and commodity costs might dampen future economic activity and financial results.
Perhaps due to these concerns, investors apparently began to shift their focus away from the smaller, more speculative investments that had done well over the past several years. Increasingly, they turned their attention to large, well-established companies with track records of consistent growth. Historically, companies with these characteristics have tended to generate profits under a variety of economic conditions. In addition, investors may have been attracted to relatively low valuations among large growth companies. Indeed, when 2005 began, stocks of large-cap growth companies were generally selling toward the low end of their historical valuation ranges.
In this changing environment, the portfolio's returns benefited from our sector allocation and stock selection strategies. Because the portfolio was more heavily exposed to energy companies than the benchmark, it participated more fully in the energy sector's gains when oil and gas prices reached new record highs. Conversely, the portfolio invested a substantially smaller percentage of its assets in technology stocks compared to the benchmark, which helped it avoid the full brunt of the technology area's weakness. Nonetheless, semiconductor leader Intel proved to be one of the portfolio's top performers for the reporting period, while software developer Microsoft provided more modest returns.
The portfolio also received positive contributions to performance from the consumer staples sector, an area we have emphasized for some time. Pharmacy chain Walgreen continued to enjoy strong operating results while recovering from earlier weakness, while food and tobacco giant Altria Group benefited from a more benign litigation environment and investors' expectations of a potential restructuring that could unlock shareholder value.
On the other hand, the portfolio's performance was constrained by sub-par returns from the financials sector, where global insurer American International Group and mortgage agency Fannie Mae both
were hurt by regulatory scrutiny of their accounting practices and changes in senior management. Because of the risks surrounding these developments, we reduced the portfolio's holdings of both companies. In addition, the portfolio held no utilities stocks, preventing it from participating in the sector's relatively robust gains.
What is the portfolio's current strategy?
We have remained fully invested in a diversified portfolio of large-cap growth companies that we regard as leaders in their markets.We eliminated the portfolio's holdings in food company Kraft Foods and computing giant International Business Machines due to disappointing financial results. In addition, we added two new positions.We expect industrial gasses producer Praxair to benefit from continued robust demand for its products from oil refiners and drug companies, and French integrated oil company TotalFinaElf gives the portfolio a way to participate in growing markets that U.S. oil companies currently do not serve. In our judgment, the portfolio is well positioned to benefit from companies, such as these, that have demonstrated their ability to deliver positive operating results in good economic times and bad.
| | | The portfolio is only available as a funding vehicle under variable life insurance policies or variable |
| | | annuity contracts issued by insurance companies. Individuals may not purchase shares of the |
| | | portfolio directly. A variable annuity is an insurance contract issued by an insurance company that |
| | | enables investors to accumulate assets on a tax-deferred basis for retirement or other long-term |
| | | goals.The investment objective and policies of Dreyfus Variable Investment Fund, Appreciation |
| | | Portfolio made available through insurance products may be similar to other funds/portfolios |
| | | managed or advised by Dreyfus. However, the investment results of the portfolio may be higher or |
| | | lower than, and may not be comparable to, those of any other Dreyfus fund/portfolio. |
| 1 | | Total return includes reinvestment of dividends and any capital gains paid. Past performance is no |
| | | guarantee of future results. Share price and investment return fluctuate such that upon redemption, |
| | | portfolio shares may be worth more or less than their original cost.The portfolio's performance does |
| | | not reflect the deduction of additional charges and expenses imposed in connection with investing |
| | | in variable insurance contracts, which will reduce returns. |
| 2 | | SOURCE: LIPPER INC. — Reflects monthly reinvestment of dividends and, where |
| | | applicable, capital gain distributions.The Standard & Poor's 500 Composite Stock Price Index is |
| | | a widely accepted, unmanaged index of U.S. stock market performance. |
T h e P o r t f o l i o 5
|

As a mutual fund investor, you pay ongoing expenses, such as management fees and other expenses. Using the information below, you can estimate how these expenses affect your investment and compare them with the expenses of other funds.You also may pay one-time transaction expenses, including sales charges (loads) and redemption fees, which are not shown in this section and would have resulted in higher total expenses. For more information, see your portfolio's prospectus or talk to your financial adviser.
Review your portfolio's expenses
|
The table below shows the expenses you would have paid on a $1,000 investment in Dreyfus Variable Investment Fund,Appreciation Portfolio from January 1, 2005 to June 30, 2005. It also shows how much a $1,000 investment would be worth at the close of the period, assuming actual returns and expenses.
| Expenses and Value of a $1,000 Investment | | |
| assuming actual returns for the six months ended June 30, 2005 | | |
| | | Initial Shares | | Service Shares |
| |
| |
|
| Expenses paid per $1,000 † | | $ 4.03 | | $ 5.27 |
| Ending value (after expenses) | | $1,006.60 | | $1,005.40 |
COMPARING YOUR PORTFOLIO'S EXPENSES WITH THOSE OF OTHER FUNDS (Unaudited)
Using the SEC's method to compare expenses
The Securities and Exchange Commission (SEC) has established guidelines to help investors assess fund expenses. Per these guidelines, the table below shows your portfolio's expenses based on a $1,000 investment, assuming a hypothetical 5% annualized return. You can use this information to compare the ongoing expenses (but not transaction expenses or total cost) of investing in the portfolio with those of other funds. All mutual fund shareholder reports will provide this information to help you make this comparison. Please note that you cannot use this information to estimate your actual ending account balance and expenses paid during the period.
Expenses and Value of a $1,000 Investment assuming a hypothetical 5% annualized return for the six months ended June 30, 2005
| | | Initial Shares | | Service Shares |
| |
| |
|
| Expenses paid per $1,000 † | | $ 4.06 | | $ 5.31 |
| Ending value (after expenses) | | $1,020.78 | | $1,019.54 |
† Expenses are equal to the portfolio's annualized expense ratio of .81% for Initial shares and 1.06% for Service shares, multiplied by the average account value over the period, multiplied by 181/365 (to reflect the one-half year period).
S TAT E M E N T O F I N V E S T M E N T S
J u n e 3 0 , 2 0 0 5 (Unaudited)
| Common Stocks—99.5% | | Shares | | Value ($) |
| |
| |
|
| Apparel—1.5% | | | | |
| Christian Dior | | 72,700 a | | 5,637,753 |
| Polo Ralph Lauren | | 145,500 | | 6,272,505 |
| | | | | 11,910,258 |
| Banking—4.9% | | | | |
| Bank of America | | 291,216 | | 13,282,362 |
| Federal Home Loan Mortgage | | 101,600 | | 6,627,368 |
| Federal National Mortgage Association | | 108,800 | | 6,353,920 |
| HSBC Holdings, ADR | | 30,000 | | 2,389,500 |
| SunTrust Banks | | 150,600 | | 10,879,344 |
| | | | | 39,532,494 |
| Capital Goods—6.1% | | | | |
| Emerson Electric | | 164,900 | | 10,327,687 |
| General Electric | | 1,115,500 | | 38,652,075 |
| | | | | 48,979,762 |
| Consumer Services—1.0% | | | | |
| McDonald's | | 304,500 | | 8,449,875 |
| Consumer Staples—6.7% | | | | |
| Sysco | | 80,000 | | 2,895,200 |
| Wal-Mart Stores | | 449,700 | | 21,675,540 |
| Walgreen | | 649,900 | | 29,888,901 |
| | | | | 54,459,641 |
| Diversified Financials—8.4% | | | | |
| American Express | | 307,500 | | 16,368,225 |
| Citigroup | | 601,524 | | 27,808,455 |
| J.P. Morgan Chase & Co. | | 451,100 | | 15,932,852 |
| Merrill Lynch | | 145,500 | | 8,003,955 |
| | | | | 68,113,487 |
| Energy—18.3% | | | | |
| BP, ADR | | 455,900 | | 28,439,042 |
| Chevron | | 445,800 | | 24,929,136 |
| ConocoPhillips | | 200,000 | | 11,498,000 |
| Exxon Mobil | | 1,176,564 | | 67,617,133 |
| Occidental Petroleum | | 60,000 | | 4,615,800 |
| Royal Dutch Petroleum | | 59,800 | | 3,881,020 |
| TotalFinaElf, ADR | | 60,000 a | | 7,011,000 |
| | | | | 147,991,131 |
T h e P o r t f o l i o 7
S TAT E M E N T O F I N V E S T M E N T S (Unaudited) (continued)
| Common Stocks (continued) | | Shares | | | | Value ($) |
| |
| |
| |
|
| Food, Beverage & Tobacco—17.3% | | | | | | |
| Altria Group | | 926,400 | | | | 59,901,024 |
| Anheuser-Busch Cos. | | 200,100 | | | | 9,154,575 |
| Coca-Cola | | 664,500 | | | | 27,742,875 |
| Nestle, ADR | | 291,000 | | | | 18,613,105 |
| PepsiCo | | 455,900 | | | | 24,586,687 |
| | | | | | | 139,998,266 |
| Household & Personal Products—5.3% | | | | |
| Colgate-Palmolive | | 154,600 | | | | 7,716,086 |
| Estee Lauder Cos., Cl. A | | 145,500 | | | | 5,693,415 |
| Procter & Gamble | | 565,000 | | | | 29,803,750 |
| | | | | | | 43,213,251 |
| Insurance—2.1% | | | | | | |
| American International Group | | 105,920 | | | | 6,153,952 |
| Berkshire Hathaway, Cl. A | | 100 | | b | | 8,350,000 |
| Marsh & McLennan Cos. | | 91,100 | | | | 2,523,470 |
| | | | | | | 17,027,422 |
| Materials—.3% | | | | | | |
| Praxair | | 50,000 | | | | 2,330,000 |
| Media—5.0% | | | | | | |
| McGraw-Hill Cos. | | 501,600 | | | | 22,195,800 |
| News, Cl. A | | 606,436 | | | | 9,812,134 |
| News, Cl. B | | 9,800 | | | | 165,228 |
| Time Warner | | 226,800 | | b | | 3,789,828 |
| Viacom, Cl. B | | 150,300 | | | | 4,812,606 |
| | | | | | | 40,775,596 |
| Pharmaceuticals & Biotechnology—12.4% | | | | |
| Abbott Laboratories | | 334,100 | | | | 16,374,241 |
| Johnson & Johnson | | 373,300 | | | | 24,264,500 |
| Eli Lilly & Co. | | 261,900 | | | | 14,590,449 |
| Merck & Co. | | 313,000 | | | | 9,640,400 |
| Pfizer | | 1,151,000 | | | | 31,744,580 |
| Roche Holding, ADR | | 64,000 | | | | 4,048,674 |
| | | | | | | 100,662,844 |
| Retailing—1.8% | | | | | | |
| Target | | 261,900 | | | | 14,249,979 |
| Common Stocks (continued) | | Shares | | Value ($) |
| |
| |
|
| Semiconductors & Semiconductor Equipment—4.6% | | |
| Intel | | 1,414,700 | | 36,867,082 |
| Software & Services—2.7% | | | | |
| Microsoft | | 867,300 | | 21,543,732 |
| Transportation—1.1% | | | | |
| United Parcel Service, Cl. B | | 126,800 | | 8,769,488 |
| Total Common Stocks | | | | |
| (cost $626,059,657) | | | | 804,874,308 |
| |
| |
|
| |
| Investment of Cash Collateral | | | | |
| for Securities Loaned—1.5% | | | | |
| |
| |
|
| Registered Investment Company; | | | | |
| Dreyfus Institutional Preferred Plus Money Market Fund | | |
| (cost $12,322,026) | | 12,322,026 c | | 12,322,026 |
| |
| |
|
| Total Investments (cost $638,381,683) | | 101.0% | | 817,196,334 |
| Liabilities, Less Cash and Receivables | | (1.0%) | | (8,246,352) |
| Net Assets | | 100.0% | | 808,949,982 |
| ADR—American Depository Receipts. |
| a All or a portion of these securities are on loan. At June 30, 2005 the total market value of the fund's securities on |
| loan is $11,905,675 and the total market value of the collateral held by the fund is $12,322,026. |
| b Non-Income Producing. |
| c Investment in affiliated money market mutual fund. |
| Portfolio Summary (Unaudited) † | | | | |
| |
| | | Value (%) | | | | Value (%) |
| |
| |
| |
|
| Energy | | 18.3 | | Capital Goods | | 6.1 |
| Food, Beverage & Tobacco | | 17.3 | | Household & Personal Products | | 5.3 |
| Pharmaceuticals & Biotechnology | | 12.4 | | Media | | 5.0 |
| Diversified Financials | | 8.4 | | Other | | 21.5 |
| Consumer Staples | | 6.7 | | | | 101.0 |
| |
| † Based on net assets. | | | | | | |
| See notes to financial statements. | | | | | | |
T h e P o r t f o l i o 9
|
S TAT E M E N T O F A S S E T S A N D L I A B I L I T I E S
| J u n e 3 0 , 2 0 0 5 (Unaudited) | | |
| |
|
| |
| |
| |
| |
| | | Cost | | Value |
| |
| |
|
| Assets ($): | | | | |
| Investments in securities—See Statement | | |
| of Investments (including securities on loan, | | |
| valued at $11,905,675)—Note 1(c): | | |
| Unaffiliated issuers | | 626,059,657 | | 804,874,308 |
| Affiliated issuers | | 12,322,026 | | 12,322,026 |
| Cash | | | | 202,141 |
| Receivable for shares of Beneficial Interest subscribed | | 2,902,330 |
| Receivable for investment securities sold | | 1,585,956 |
| Dividends and interest receivable | | | | 1,337,874 |
| Prepaid expenses | | | | 51,203 |
| | | | | 823,275,838 |
| |
| |
|
| Liabilities ($): | | | | |
| Due to The Dreyfus Corporation and affiliates—Note 3(b) | | 326,111 |
| Due to Fayez Sarofim & Co. | | | | 217,120 |
| Liability for securities on loan—Note 1(c) | | 12,322,026 |
| Bank loan payable—Note 2 | | | | 800,000 |
| Payable for shares of Beneficial Interest redeemed | | 575,702 |
| Interest payable—Note 2 | | | | 80 |
| Accrued expenses | | | | 84,817 |
| | | | | 14,325,856 |
| |
| |
|
| Net Assets ($) | | | | 808,949,982 |
| |
| |
|
| Composition of Net Assets ($): | | | | |
| Paid-in capital | | | | 685,143,745 |
| Accumulated undistributed investment income—net | | 6,121,406 |
| Accumulated net realized gain (loss) on investments | | (61,129,820) |
| Accumulated net unrealized appreciation (depreciation) | | |
| on investments and foreign currency transactions | | 178,814,651 |
| |
|
| Net Assets ($) | | | | 808,949,982 |
| |
| |
|
| |
| |
| Net Asset Value Per Share | | | | |
| | | Initial Shares | | Service Shares |
| |
| |
|
| Net Assets ($) | | 722,589,661 | | 86,360,321 |
| Shares Outstanding | | 20,191,256 | | 2,422,390 |
| |
| |
|
| Net Asset Value Per Share ($) | | 35.79 | | 35.65 |
See notes to financial statements.
|
| S TAT E M E N T | | O F | | O P E R AT I O N S | | |
| S i x M o n t h s E n d e d | | J u n e | | 3 0 , 2 0 0 5 (Unaudited) | | |
| |
| |
| |
|
| |
| |
| |
| |
| Investment Income ($): | | | | |
| Income: | | | | | | |
| Cash dividends (net of $125,630 foreign taxes withheld at source): |
| Unaffiliated issuers | | | | | | 9,521,220 |
| Affiliated issuers | | | | | | 29,138 |
| Income from securities lending | | | | 42,297 |
| Total Income | | | | | | 9,592,655 |
| Expenses: | | | | | | |
| Investment advisory fee—Note 3(a) | | 1,775,246 |
| Sub-investment advisory fee—Note 3(a) | | 1,328,944 |
| Prospectus and shareholders' reports | | 105,985 |
| Distribution fees—Note 3(b) | | | | 102,824 |
| Shareholder servicing costs—Note 3(b) | | 32,528 |
| Trustees' fees and expenses—Note 3(c) | | 32,168 |
| Custodian fees—Note 3(b) | | | | 30,484 |
| Professional fees | | | | | | 30,273 |
| Interest expense—Note 2 | | | | 10,601 |
| Loan commitment fees—Note 2 | | | | 3,646 |
| Registration fees | | | | | | 799 |
| Miscellaneous | | | | | | 12,257 |
| Total Expenses | | | | | | 3,465,755 |
| Investment Income—Net | | | | 6,126,900 |
| |
| |
|
| Realized and Unrealized Gain (Loss) on Investments—Note 4 ($): |
| Net realized gain (loss) on investments | | |
| and foreign currency transactions | | (4,125,926) |
| Net unrealized appreciation (depreciation) on investments | | 3,243,007 |
| Net Realized and Unrealized Gain (Loss) on Investments | | (882,919) |
| Net Increase in Net Assets Resulting from Operations | | 5,243,981 |
See notes to financial statements.
|
T h e P o r t f o l i o 11
|
S TAT E M E N T O F C H A N G E S I N N E T A S S E T S
| | | Six Months Ended | | |
| | | June 30, 2005 | | Year Ended |
| | | (Unaudited) | | December 31, 2004 |
| |
| |
|
| Operations ($): | | | | |
| Investment income—net | | 6,126,900 | | 13,729,438 |
| Net realized gain (loss) on investments | | (4,125,926) | | (5,994,905) |
| Net unrealized appreciation | | | | |
| (depreciation) on investments | | 3,243,007 | | 33,662,361 |
| Net Increase (Decrease) in Net Assets | | | | |
| Resulting from Operations | | 5,243,981 | | 41,396,894 |
| |
| |
|
| Dividends to Shareholders from ($): | | | | |
| Investment income—net: | | | | |
| Initial shares | | (135,857) | | (12,718,082) |
| Service shares | | — | | (1,102,158) |
| Total Dividends | | (135,857) | | (13,820,240) |
| |
| |
|
| Beneficial Interest Transactions ($): | | | | |
| Net proceeds from shares sold: | | | | |
| Initial shares | | 38,856,444 | | 58,196,296 |
| Service shares | | 10,779,373 | | 21,783,851 |
| Dividends reinvested: | | | | |
| Initial shares | | 135,857 | | 12,718,082 |
| Service shares | | — | | 1,102,158 |
| Cost of shares redeemed: | | | | |
| Initial shares | | (87,251,791) | | (150,984,809) |
| Service shares | | (5,375,364) | | (34,135,074) |
| Increase (Decrease) in Net Assets from | | | | |
| Beneficial Interest Transactions | | (42,855,481) | | (91,319,496) |
| Total Increase (Decrease) in Net Assets | | (37,747,357) | | (63,742,842) |
| |
| |
|
| Net Assets ($): | | | | |
| Beginning of Period | | 846,697,339 | | 910,440,181 |
| End of Period | | 808,949,982 | | 846,697,339 |
| Undistributed investment income—net | | 6,121,406 | | 130,363 |
| | | Six Months Ended | | |
| | | June 30, 2005 | | Year Ended |
| | | (Unaudited) | | December 31, 2004 |
| |
| |
|
| Capital Share Transactions: | | | | |
| Initial Shares | | | | |
| Shares sold | | 1,080,281 | | 1,672,805 |
| Shares issued for dividends reinvested | | 3,819 | | 357,874 |
| Shares redeemed | | (2,438,526) | | (4,347,023) |
| Net Increase (Decrease) in Shares Outstanding | | (1,354,426) | | (2,316,344) |
| |
| |
|
| Service Shares | | | | |
| Shares sold | | 302,133 | | 629,793 |
| Shares issued for dividends reinvested | | — | | 31,090 |
| Shares redeemed | | (150,592) | | (987,230) |
| Net Increase (Decrease) in Shares Outstanding | | 151,541 | | (326,347) |
See notes to financial statements.
|
T h e P o r t f o l i o 13
|
F I N A N C I A L H I G H L I G H T S
|
The following tables describe the performance for each share class for the fiscal periods indicated. All information (except portfolio turnover rate) reflects financial results for a single portfolio share.Total return shows how much your investment in the portfolio would have increased (or decreased) during each period, assuming you had reinvested all dividends and distributions.These figures have been derived from the portfolio's financial statements.
| | | Six Months Ended | | | | | | | | | | |
| | | June 30, 2005 | | | | Year Ended December 31, | | |
| | | |
| |
| |
|
| Initial Shares | | (Unaudited) | | 2004 | | 2003 | | 2002 | | 2001 | | 2000 |
| |
| |
| |
| |
| |
| |
|
| Per Share Data ($): | | | | | | | | | | | | |
| Net asset value, | | | | | | | | | | | | |
| beginning of period | | 35.56 | | 34.42 | | 28.79 | | 34.98 | | 38.91 | | 39.87 |
| Investment Operations: | | | | | | | | | | | | |
| Investment income—net a | | .27 | | .56 | | .43 | | .36 | | .30 | | .27 |
| Net realized and unrealized | | | | | | | | | | | | |
| gain (loss) on investments | | (.03) | | 1.18 | | 5.64 | | (6.19) | | (3.93) | | (.52) |
| Total from Investment Operations | | .24 | | 1.74 | | 6.07 | | (5.83) | | (3.63) | | (.25) |
| Distributions: | | | | | | | | | | | | |
| Dividends from investment | | | | | | | | | | | | |
| income—net | | (.01) | | (.60) | | (.44) | | (.36) | | (.30) | | (.26) |
| Dividends from net realized | | | | | | | | | | | | |
| gain on investments | | — | | — | | — | | — | | — | | (.45) |
| Total Distributions | | (.01) | | (.60) | | (.44) | | (.36) | | (.30) | | (.71) |
| Net asset value, end of period | | 35.79 | | 35.56 | | 34.42 | | 28.79 | | 34.98 | | 38.91 |
| |
| |
| |
| |
| |
| |
|
| Total Return (%) | | .66b | | 5.05 | | 21.17 | | (16.71) | | (9.31) | | (.65) |
| |
| |
| |
| |
| |
| |
|
| Ratios/Supplemental Data (%): | | | | | | | | | | |
| Ratio of total expenses | | | | | | | | | | | | |
| to average net assets | | .40b | | .79 | | .80 | | .78 | | .78 | | .78 |
| Ratio of net investment income | | | | | | | | | | | | |
| to average net assets | | .75b | | 1.60 | | 1.41 | | 1.10 | | .84 | | .67 |
| Portfolio Turnover Rate | | 1.72b | | 1.64 | | 4.60 | | 6.61 | | 4.19 | | 6.15 |
| |
| |
| |
| |
| |
| |
|
| Net Assets, end of period | | | | | | | | | | | | |
| ($ x 1,000) | | 722,590 | | 766,169 | | 821,319 | | 722,706 | | 897,535 | | 1,009,713 |
| a | | Based on average shares outstanding at each month end. | | | | | | | | |
| b | | Not annualized. | | | | | | | | | | | | |
| See notes to financial statements. | | | | | | | | | | | | |
| | | Six Months Ended | | | | | | | | | | |
| | | June 30, 2005 | | | | Year Ended December 31, | | |
| | | |
| |
| |
|
| Service Shares | | (Unaudited) | | 2004 | | 2003 | | 2002 | | 2001 | | 2000a |
| |
| |
| |
| |
| |
| |
|
| Per Share Data ($): | | | | | | | | | | | | |
| Net asset value, | | | | | | | | | | | | |
| beginning of period | | 35.46 | | 34.31 | | 28.71 | | 34.89 | | 38.91 | | 38.91 |
| Investment income—net | | .22b | | .46b | | .36b | | .29b | | .18b | | — |
| Net realized and unrealized | | | | | | | | | | | | |
| gain (loss) on investments | | (.03) | | 1.19 | | 5.61 | | (6.17) | | (3.94) | | — |
| Total from Investment Operations | | .19 | | 1.65 | | 5.97 | | (5.88) | | (3.76) | | — |
| Distributions: | | | | | | | | | | | | |
| Dividends from investment | | | | | | | | | | | | |
| income—net | | — | | (.50) | | (.37) | | (.30) | | (.26) | | — |
| Net asset value, end of period | | 35.65 | | 35.46 | | 34.31 | | 28.71 | | 34.89 | | 38.91 |
| |
| |
| |
| |
| |
| |
|
| Total Return (%) | | .54c | | 4.80 | | 20.83 | | (16.89) | | (9.63) | | — |
| |
| |
| |
| |
| |
| |
|
| Ratios/Supplemental Data (%): | | | | | | | | | | |
| Ratio of total expenses | | | | | | | | | | | | |
| to average net assets | | .53c | | 1.04 | | 1.05 | | 1.02 | | 1.10 | | — |
| Ratio of net investment income | | | | | | | | | | | | |
| to average net assets | | .63c | | 1.34 | | 1.16 | | .91 | | .53 | | — |
| Portfolio Turnover Rate | | 1.72c | | 1.64 | | 4.60 | | 6.61 | | 4.19 | | 6.15 |
| |
| |
| |
| |
| |
| |
|
| Net Assets, end of period | | | | | | | | | | | | |
| ($ x 1,000) | | 86,360 | | 80,529 | | 89,121 | | 60,572 | | 35,632 | | 1 |
| |
| a | | The portfolio commenced offering Service shares on December 31, 2000. | | | | | | |
| b | | Based on average shares outstanding at each month end. | | | | | | | | |
| c | | Not annualized. | | | | | | | | | | | | |
| See notes to financial statements. | | | | | | | | | | | | |
T h e P o r t f o l i o 15
|
N O T E S T O F I N A N C I A L S TAT E M E N T S (Unaudited)
NOTE 1—Significant Accounting Policies:
Dreyfus Variable Investment Fund (the "fund") is registered under the Investment Company Act of 1940, as amended (the "Act"), as an open-end management investment company, operating as a series company currently offering twelve series, including the Appreciation Portfolio (the "portfolio"). The portfolio is only offered to separate accounts established by insurance companies to fund variable annuity contracts and variable life insurance policies.The portfolio is a diversified series. The portfolio's investment objective is to provide long-term capital growth consistent with the preservation of capital. The Dreyfus Corporation ("Dreyfus") serves as the portfolio's investment adviser. Dreyfus is a wholly-owned subsidiary of Mellon Financial Corporation ("Mellon Financial"). Fayez Sarofim & Co. ("Sarofim") serves as the portfolio's sub-investment adviser.
Dreyfus Service Corporation (the "Distributor"), a wholly-owned subsidiary of the Manager, is the distributor of the portfolio's shares, which are sold without a sales charge.The portfolio is authorized to issue an unlimited number of $.001 par value shares of Beneficial Interest in each of the following classes of shares: Initial and Service. Each class of shares has identical rights and privileges, except with respect to the distribution plan and the expenses borne by each class and certain voting rights. Income, expenses (other than expenses attributable to a specific class), and realized and unrealized gains or losses on investments are allocated to each class of shares based on its relative net assets.
The fund accounts separately for the assets, liabilities and operations of each series. Expenses directly attributable to each series are charged to that series' operations; expenses which are applicable to all series are allocated among them on a pro rata basis.
The portfolio's financial statements are prepared in accordance with U.S. generally accepted accounting principles, which may require the use of management estimates and assumptions.Actual results could differ from those estimates.
The fund enters into contracts that contain a variety of indemnifica-tions.The portfolio's maximum exposure under these arrangements is unknown. The portfolio does not anticipate recognizing any loss related to these arrangements.
(a) Portfolio valuation: Investments in securities are valued at the last sales price on the securities exchange or national securities market on which such securities are primarily traded. Securities listed on the National Market System for which market quotations are available are valued at the official closing price or, if there is no official closing price that day, at the last sales price. Securities not listed on an exchange or the national securities market, or securities for which there were no transactions, are valued at the average of the most recent bid and asked prices, except for open short positions, where the asked price is used for valuation purposes. Bid price is used when no asked price is available. Investments in registered investment companies are valued at their net asset value.When market quotations or official closing prices are not readily available, or are determined not to reflect accurately fair value, such as when the value of a security has been significantly affected by events after the close of the exchange or market on which the security is principally traded (for example, a foreign exchange or market), but before the portfolio calculates its net asset value, the portfolio may value these investments at fair value as determined in accordance with the procedures approved by the Board of Trustees. Fair valuing of securities may be determined with the assistance of a pricing service using calculations based on indices of domestic securities and other appropriate indicators, such as prices of relevant ADR's and futures contracts. For other securities that are fair valued by the Board of Trustees, certain factors may be considered such as: fundamental analytical data, the nature and duration of restrictions on disposition, an evaluation of the forces that influence the market in which the securities are purchased and sold and public trading in similar securities of the issuer or comparable issuers. Financial futures are valued at the last sales price.
T h e P o r t f o l i o 17
|
N O T E S T O F I N A N C I A L S TAT E M E N T S ( U n a u d i t e d ) (continued)
(b) Foreign currency transactions: The portfolio does not isolate that portion of the results of operations resulting from changes in foreign exchange rates on investments from the fluctuations arising from changes in market prices of securities held. Such fluctuations are included with the net realized and unrealized gain or loss on investments.
Net realized foreign exchange gains or losses arise from sales and maturities of short-term securities, sales of foreign currencies, currency gains or losses realized on securities transactions and the difference between the amounts of dividends, interest and foreign withholding taxes recorded on the portfolio's books and the U.S. dollar equivalent of the amounts actually received or paid. Net unrealized foreign exchange gains or losses arise from changes in the value of assets and liabilities other than investments in securities, resulting from changes in exchange rates. Such gains and losses are included with net realized and unrealized gain or loss on investments.
(c) Securities transactions and investment income: Securities transactions are recorded on a trade date basis. Realized gain and loss from securities transactions are recorded on the identified cost basis. Dividend income is recognized on the ex-dividend date and interest income, including, where applicable, accretion of discount and amortization of premium on investments, is recognized on the accrual basis.
The portfolio has an arrangement with the custodian bank whereby the portfolio receives earnings credits from the custodian when positive cash balances are maintained, which are used to offset custody fees. For financial reporting purposes, the portfolio includes net earnings credits, if any, as an expense offset in the Statement of Operations.
Pursuant to a securities lending agreement with Mellon Bank, N.A., an affiliate of Dreyfus, the portfolio may lend securities to qualified institutions.At origination, all loans are secured by collateral of at least 102% of the value of U.S. securities loaned and 105% of the value of foreign securities loaned. Collateral equivalent to at least 100% of the market value of securities on loan will be maintained at all times. Cash collateral is invested in certain money market mutual funds managed by Dreyfus. The portfolio will be entitled to receive all income on
securities loaned, in addition to income earned as a result of the lending transaction. Although each security loaned is fully collateralized, the portfolio would bear the risk of delay in recovery of, or loss of rights in, the securities loaned should a borrower fail to return the securities in a timely manner.
(d) Affiliated issuers: Investments in other investment companies advised by Dreyfus are defined as "affiliated" in the Act.
(e) Dividends to shareholders: Dividends are recorded on the ex-dividend date. Dividends from investment income-net and dividends from net realized capital gain, if any, are normally declared and paid annually, but the portfolio may make distributions on a more frequent basis to comply with the distribution requirements of the Internal Revenue Code of 1986, as amended (the "Code").To the extent that net realized capital gain can be offset by capital loss carryovers, it is the policy of the portfolio not to distribute such gain. Income and capital gain distributions are determined in accordance with income tax regulations, which may differ from U.S. generally accepted accounting principles.
(e) Federal income taxes: It is the policy of the portfolio to continue to qualify as a regulated investment company, if such qualification is in the best interests of its shareholders, by complying with the applicable provisions of the Code, and to make distributions of taxable income sufficient to relieve it from substantially all federal income and excise taxes.
The portfolio has an unused capital loss carryover of $57,003,881 available for federal income tax purposes to be applied against future net securities profits, if any, realized subsequent to December 31, 2004. If not applied, $6,595,648 of the carryover expires in fiscal 2009, $23,015,684 expires in fiscal 2010, $20,683,522 expires in fiscal 2011 and $6,709,027 expires in fiscal 2012.
The tax character of distributions paid to shareholders during the fiscal year ended December 31, 2004 was as follows: ordinary income $13,820,240. The tax character of current year distributions will be determined at the end of the current fiscal year.
T h e P o r t f o l i o 19
|
N O T E S T O F I N A N C I A L S TAT E M E N T S ( U n a u d i t e d ) (continued)
NOTE 2—Bank Line of Credit:
|
The portfolio participates with other Dreyfus-managed funds in a $350 million redemption credit facility (the "Facility") to be utilized for temporary or emergency purposes, including the financing of redemptions. In connection therewith, the portfolio has agreed to pay commitment fees on its pro rata portion of the Facility. Interest is charged to the portfolio at rates based on prevailing market rates in effect at the time of borrowings.
The average daily amount of borrowings outstanding during the period ended June 30, 2005 was approximately $656,400, with a related weighted average annualized interest rate of 3.21% .
NOTE 3—Investment Advisory Fee, Sub-Investment Advisory Fee and Other Transactions With Affiliates:
(a) Pursuant to an Investment Advisory Agreement with Dreyfus, the investment advisory fee is based on the value of the portfolio's average daily net assets and is computed at the following annual rates: .55 of 1% of the first $150 million; .50 of 1% of the next $150 million; and .375 of 1% over $300 million.The fee is payable monthly. Pursuant to a Sub-Investment Advisory Agreement with Sarofim, the sub-investment advisory fee is based upon the value of the portfolio's average daily net assets and is computed at the following annual rates: .20 of 1% of the first $150 million; .25 of 1% of the next $150 million; and .375 of 1% over $300 million.The fee is payable monthly.
(b) Under the Distribution Plan (the "Plan") adopted pursuant to Rule 12b-1 under the Act, Service shares pay the Distributor for distributing their shares, for servicing and/or maintaining Service shares shareholder accounts and for advertising and marketing for Service shares.The Plan provides for payments to be made at an annual rate of .25 of 1% of the value of the Service shares' average daily net assets. The Distributor may make payments to Participating Insurance Companies and to brokers and dealers acting as principal underwriter for their variable insurance products.The fees payable under the Plan
are payable without regard to actual expenses incurred. During the period ended June 30, 2005, Service shares were charged $102,824 pursuant to the Plan.
The portfolio compensates Dreyfus Transfer, Inc., a wholly-owned subsidiary of Dreyfus, under a transfer agency agreement for providing personnel and facilities to perform transfer agency services for the portfolio. During the period ended June 30, 2005, the portfolio was charged $515 pursuant to the transfer agency agreement.
The portfolio compensates Mellon Bank, N.A., an affiliate of Dreyfus, under a custody agreement to provide custodial services for the portfolio. During the period ended June 30, 2005, the portfolio was charged $30,484 pursuant to the custody agreement.
During the period ended June 30, 2005, the portfolio was charged $1,998 for services performed by the Chief Compliance Officer.
The components of Due to The Dreyfus Corporation and affiliates in the Statement of Assets and Liabilities consist of: investment advisory fees $291,092, Rule 12b-1 distribution plan fees $17,445, custodian fees $15,424, chief compliance officer fees $1,998 and transfer agency per account fees $152.
(c) Each Board member also serves as a Board member of other funds within the Dreyfus complex. Annual retainer fees and attendance fees are allocated to each fund based on net assets.
(d) Pursuant to an exemptive order from the Securities and Exchange Commission, the portfolio may invest its available cash in affiliated money market mutual funds. Management fees of the underlying money market mutual funds have been waived by Dreyfus.
NOTE 4—Securities Transactions:
The aggregate amount of purchases and sales of investment securities, excluding short-term securities, during the period ended June 30, 2005, amounted to $14,279,610 and $55,424,039, respectively.
T h e P o r t f o l i o 21
|
N O T E S T O F I N A N C I A L S TAT E M E N T S ( U n a u d i t e d ) (continued)
At June 30, 2005, accumulated net unrealized appreciation on investments was $178,814,651, consisting of $214,174,260 gross unrealized appreciation and $35,359,609 gross unrealized depreciation.
At June 30, 2005, the cost of investments for federal income tax purposes was substantially the same as the cost for financial reporting purposes (see the Statement of Investments).
In early 2004, two purported class and derivative actions were filed against Mellon Financial, Mellon Bank, N.A., Dreyfus, Founders Asset Management LLC, and certain directors of the Dreyfus Funds and the Dreyfus Founders Funds (together, the "Funds") in the United States District Court for the Western District of Pennsylvania. In September 2004, plaintiffs served a Consolidated Amended Complaint (the "Amended Complaint") on behalf of a purported class of all persons who acquired interests in any of the Funds between January 30, 1999 and November 17, 2003, and derivatively on behalf of the Funds.The Amended Complaint in the newly styled In re Dreyfus Mutual Funds Fee Litigation also named the Distributor, Premier Mutual Fund Services, Inc. and two additional Fund directors as defendants and alleges violations of the Investment Company Act of 1940, the Investment Advisers Act of 1940, the Pennsylvania Unfair Trade Practices and Consumer Protection Law and common-law claims. Plaintiffs seek to recover allegedly improper and excessive Rule 12b-1 and advisory fees allegedly charged to the Funds for marketing and distribution services. More specifically, plaintiffs claim, among other things, that 12b-1 fees and directed brokerage were improperly used to pay brokers to recommend the Funds over other funds, and that such payments were not disclosed to investors. In addition, plaintiffs assert that economies of scale and soft-dollar benefits were not passed on to the Funds. Plaintiffs further allege that 12b-1 fees were improperly charged to certain of the Funds that were closed to new investors.The Amended Complaint seeks compensatory and punitive damages, rescission of the advisory contracts, and an accounting and restitution of any
unlawful fees, as well as an award of attorneys' fees and litigation expenses. As noted, some of the claims in this litigation are asserted derivatively on behalf of the Funds that have been named as nominal defendants. With respect to such derivative claims, no relief is sought against the Funds. Dreyfus believes the allegations to be totally without merit and intends to defend the action vigorously. In November 2004, all named defendants moved to dismiss the Amended Complaint in whole or substantial part. Briefing was completed in May 2005.
Additional lawsuits arising out of these circumstances and presenting similar allegations and requests for relief may be filed against the defendants in the future. Neither Dreyfus nor the Funds believe that any of the pending actions will have a material adverse effect on the Funds or Dreyfus' ability to perform its contract with the Funds.
T h e P o r t f o l i o 23
|
I N F O R M AT I O N A B O U T T H E R E V I E W
A N D A P P R O VA L O F T H E P O R T F O L I O ' S
I N V E S T M E N T A DV I S O RY A G R E E M E N T (Unaudited)
|
At separate meetings of the Board of Trustees for the fund held on June 8-9, 2005, the Board considered the re-approval, through its annual renewal date of July 31, 2006, of the Investment Advisory Agreement with Dreyfus for the portfolio, pursuant to which Dreyfus provides the portfolio with investment advisory and administrative services, and the portfolio's Sub-Investment Advisory Agreement ("Sub-Advisory Agreement") with Fayez Sarofim & Co. (the "Sub-Adviser"), pursuant to which the Sub-Adviser provides day-to-day management of the portfolio's investments subject to Dreyfus' oversight.The Board members who are not "interested persons" (as defined in the Act (the "Independent Trustees")) of the fund were assisted in their review by independent legal counsel and met with counsel in executive session separate from representatives of Dreyfus and the Sub-Adviser.
Analysis of Nature, Extent and Quality of Services Provided to the Portfolio. The Board members received a presentation from representatives of Dreyfus regarding services provided to the portfolio and other funds in the Dreyfus fund complex, and discussed the nature, extent and quality of the services provided to the portfolio pursuant to its Investment Advisory Agreement and by the Sub-Adviser pursuant to the Sub-Advisory Agreement. Dreyfus' representatives reviewed the portfolio's distribution of accounts and the relationships Dreyfus has with various intermediaries and the different needs of each.The Board noted that the portfolio's shares were offered only to separate accounts established by insurance companies to fund variable annuity contracts and variable life insurance policies. Dreyfus' representatives noted the diversity of distribution among the funds in the Dreyfus complex, and Dreyfus' corresponding need for broad, deep, and diverse resources to be able to provide ongoing shareholder services to each distribution channel, including that of the portfolio.The Board also reviewed the number of shareholder accounts in the portfolio, as well as the portfolio's asset size.
The Board members also considered Dreyfus' and the Sub-Adviser's research and portfolio management capabilities, with the Sub-Adviser subject to Dreyfus' oversight, and that Dreyfus also provides oversight of day-to-day portfolio operations, including fund accounting and administration and assistance in meeting legal and regulatory requirements. The Board members also considered Dreyfus' extensive administrative, accounting and compliance infrastructure.
Comparative Analysis of the Portfolio's Performance, Investment Advisory Fee and Expense Ratio. The Board members reviewed the portfolio's performance and expense ratios and placed significant emphasis on comparisons to two groups of comparable funds and Lipper category averages, as applicable.The Board reviewed the portfolio's performance, investment advisory and sub-investment advisory fees, and total expense ratios within these comparison groups and against the portfolio's Lipper category averages, as applicable.The groups of comparable funds were previously approved by the Board for this purpose, and were prepared using a Board-approved selection methodology that was based, in part, on selecting non-affiliated funds reported in the same Lipper category as the portfolio. The Board members discussed the results of the comparisons and noted that the portfolio's longer term performance (3-, 5-, and 10-years) for its Initial shares was above the averages of its comparison group and its Lipper category, that the portfolio's 5- and 10-year performance for its Initial shares was in the first quartile of the Lipper category, and that the recent 3-month and 4-month performance for its Initial shares improved significantly versus that of its comparison group and Lipper category rankings over its 1-year performance. The Board members also discussed the portfolio's expense ratio for each class of shares, noting it is higher than the average for its respective comparison group, but that several funds in the groups have higher expense ratios than the portfolio.They reviewed the
T h e P o r t f o l i o 25
|
I N FO R M AT I O N A B O U T T H E R E V I E W A N D A P P R OVA L O F T H E P O R T FO L I O ' S
INVESTMENT ADVISORY AGREEMENT (Unaudited) (continued)
|
range of management fees in the comparison groups and noted that the portfolio's aggregate investment advisory and sub-investment advisory fee is in the bottom half of the comparison groups, with several funds having the same or higher management fees than the portfolio.
Representatives of Dreyfus reviewed with the Board the fees paid to Dreyfus or its affiliates and to the Sub-Adviser or its affiliates by mutual funds managed by Dreyfus or its affiliates and the Sub-Adviser or its affiliates, as the case may be, with similar investment objectives, policies and strategies as the portfolio (the "Similar Funds") and the fees paid to the Sub-Adviser by separate accounts with similar investment objectives, policies and strategies as the portfolio (the "Separate Accounts" and, collectively with the Similar Funds, the "Similar Accounts") and explained the nature of each Similar Accounts and the differences, from Dreyfus' perspective,in management of such Similar Accounts as compared to the managing and providing other services to the portfolio. The Similar Funds' comparison group was composed exclusively of affiliated mutual funds of Dreyfus that were reported in the portfolio's Lipper category and in a similar Lipper category for non-insurance product funds. Dreyfus' representatives also reviewed the costs associated with distribution through intermediaries.The Board analyzed differences in fees paid to Dreyfus and the Sub-Adviser and discussed the relationship of the advisory fees paid in light of Dreyfus' and the Sub-Adviser's performance and the services provided. It was noted that the Similar Funds included four unitary fee structure funds that had higher management fees than the fee borne by the portfolio and that several of the other funds had the same management fee as the fee borne by the portfolio. The Board members considered the relevance of the fee information provided for the Separate Accounts managed by the Sub-Adviser to evaluate the appropriateness and reasonableness of the portfolio's advisory fees.The Board acknowledged that differences in fees paid by the Similar Accounts seemed to be consistent with the services provided.
Analysis of Profitability and Economies of Scale. Dreyfus' representatives reviewed the dollar amount of expenses allocated and profit received by Dreyfus and the method used to determine such expenses and profit. (The Board members subsequent to the meeting were provided a profitability statement for the Sub-Adviser with respect to the portfolio.) The Board received and considered information prepared by an independent consulting firm regarding Dreyfus' approach to allocating costs to, and determining the profitability of, individual funds and the entire Dreyfus mutual fund complex.The consulting firm also analyzed where any economies of scale might emerge as assets grow.The Board members evaluated the analysis in light of the relevant circumstances for the portfolio, including the decline in assets and the extent to which economies of scale would be realized as the portfolio grows and whether fee levels reflect these economies of scale for the benefit of portfolio investors. The Board members also considered potential benefits to Dreyfus from acting as investment adviser and to the Sub-Adviser from acting as sub-adviser and noted the soft dollar arrangements with respect to trading the portfolio's portfolio.
It was noted that the Board members should consider Dreyfus' and the Sub-Adviser's profitability with respect to the portfolio as part of their evaluation of whether the fees under the Investment Advisory Agreement and the Sub-Advisory Agreement bears a reasonable relationship to the mix of services provided by Dreyfus and the Sub-Adviser, including the nature, extent and quality of such services and that a discussion of economies of scale are predicated on increasing assets and that, if a fund's assets had been decreasing, the possibility that Dreyfus or Sub-Adviser may have realized any economies of scale would be less.The profitability percentages for managing the portfolio were within ranges determined by appropriate court cases to be reasonable given the services rendered and, given the portfolio's overall performance and generally superior service levels provided.
T h e P o r t f o l i o 27
|
I N FO R M AT I O N A B O U T T H E R E V I E W A N D A P P R OVA L O F T H E P O R T FO L I O ' S
INVESTMENT ADVISORY AGREEMENT (Unaudited) (continued)
|
At the conclusion of these discussions, each of the Independent Trustees expressed the opinion that he or she had been furnished with sufficient information to make an informed business decision with respect to continuation of the portfolio's Investment Advisory Agreement and Sub-Investment Advisory Agreement. Based on their discussions and considerations as described above, the Board made the following conclusions and determinations.
- The Board concluded that the nature, extent and quality of the ser- vices provided by Dreyfus and the Sub-Adviser are adequate and appropriate.
- The Board generally was satisfied with the portfolio's Initial shares longer term performance as compared to its comparison group and Lipper category averages, its Initial shares longer term performance rankings in its comparison group and its Lipper category, and the portfolio's recent 3-month and 4-month performance in its Initial shares comparison group.
- The Board concluded that the fees paid by the portfolio to Dreyfus and to the Sub-Adviser were reasonable in light of comparative per- formance and expense and advisory fee information, costs of the services provided and profits to be realized and benefits derived or to be derived by Dreyfus and the Sub-Adviser from their relation- ship with the portfolio.
- The Board determined that, to the extent that material economies of scale had not been shared with the portfolio, the Board would seek to do so.
The Board members considered these conclusions and determinations, along with information received on a routine and regular basis throughout the year, and, without any one factor being dispositive, the Board determined that approval of the portfolio's Investment Advisory Agreement and Sub-Advisory Agreement was in the best interests of the portfolio and its shareholders.
| For More | | Information |
| |
|
| |
| |
| |
| Dreyfus Variable | | Custodian |
| |
| Investment Fund, | | |
| | | Mellon Bank, N.A. |
| Appreciation Portfolio | | |
| | | One Mellon Bank Center |
| 200 Park Avenue | | |
| | | Pittsburgh, PA 15258 |
| New York, NY 10166 | | |
| |
| | | Transfer Agent & |
| |
| Investment Adviser | | Dividend Disbursing Agent |
| |
| The Dreyfus Corporation | | |
| | | Dreyfus Transfer, Inc. |
| 200 Park Avenue | | |
| | | 200 Park Avenue |
| New York, NY 10166 | | |
| | | New York, NY 10166 |
| |
| |
| Sub-Investment Advisor | | Distributor |
| |
| Fayez Sarofim & Co. | | |
| | | Dreyfus Service Corporation |
| Two Houston Center | | |
| | | 200 Park Avenue |
| Suite 2907 | | |
| | | New York, NY 10166 |
| Houston,TX 77010 | | |
Telephone 1-800-554-4611 or 516-338-3300
Mail The Dreyfus Family of Funds, 144 Glenn Curtiss Boulevard, Uniondale, NY 11556-0144 Attn: Institutional Servicing
The portfolio files its complete schedule of portfolio holdings with the Securities and Exchange Commission ("SEC") for the first and third quarters of each fiscal year on Form N-Q. The portfolio's Forms N-Q are available on the SEC's website at http://www.sec.gov and may be reviewed and copied at the SEC's Public Reference Room in Washington, DC. Information on the operation of the Public Reference Room may be obtained by calling 1-800-SEC-0330.
A description of the policies and procedures that the portfolio uses to determine how to vote proxies relating to portfolio securities, and information regarding how the portfolio voted these proxies for the 12-month period ended June 30, 2005, is available at http://www.dreyfus.com and on the SEC's website at http://www.sec.gov. The description of the policies and procedures is also available without charge, upon request, by calling 1-800-645-6561.
© 2005 Dreyfus Service Corporation

| Dreyfus Variable |
| Investment Fund, |
| Balanced Portfolio |
SEMIANNUAL REPORT June 30, 2005

The views expressed in this report reflect those of the portfolio manager only through the end of the period covered and do not necessarily represent the views of Dreyfus or any other person in the Dreyfus organization.Any such views are subject to change at any time based upon market or other conditions and Dreyfus disclaims any responsibility to update such views. These views may not be relied on as investment advice and, because investment decisions for a Dreyfus portfolio are based on numerous factors, may not be relied on as an indication of trading intent on behalf of any Dreyfus portfolio.
Not FDIC-Insured • Not Bank-Guaranteed • May Lose Value
| | | Contents |
| |
| | | T H E P O R T F O L I O |
| |
|
| 2 | | Letter from the Chairman |
| 3 | | Discussion of Performance |
| 6 | | Understanding Your Portfolio's Expenses |
| 6 | | Comparing Your Portfolio's Expenses |
| | | With Those of Other Funds |
| 7 | | Statement of Investments |
| 14 | | Statement of Assets and Liabilities |
| 15 | | Statement of Operations |
| 16 | | Statement of Changes in Net Assets |
| 18 | | Financial Highlights |
| 20 | | Notes to Financial Statements |
| 29 | | Information About the Review |
| and Approval of the Portfolio's |
| Investment Advisory Agreement |
| | | F O R M O R E I N F O R M AT I O N |
| |
|
| | | Back Cover |
| Dreyfus Variable Investment Fund, |
| Balanced Portfolio |
The Portfolio

LETTER FROM THE CHAIRMAN
We are pleased to present this semiannual report for Dreyfus Variable Investment Fund, Balanced Portfolio, covering the six-month period from January 1, 2005, through June 30, 2005. Inside, you'll find valuable information about how the portfolio was managed during the reporting period, including a discussion with the portfolio manager, Thomas Plumb of Wisconsin Capital Management, LLC, the portfolio's sub-investment adviser.
On average, stocks prices ended the first half of 2005 slightly lower than where they began, largely due to headwinds caused by higher energy prices, rising short-term interest rates and evidence of slower economic growth. In this same environment, contrary to historical norms, longer-term U.S. government securities rallied amid robust demand from overseas investors. As a result, the more interest-rate-sensitive parts of the bond market generally produced higher returns than stocks and corporate bonds.
In some ways, market conditions at midyear remind us of those from one year ago, when stock prices languished due to economic and political concerns before rallying strongly later in the year. Our economists currently expect the U.S. economy to continue to grow over the foreseeable future without significant new inflationary pressures, potentially setting the stage for market conditions that could affect the various sectors of the U.S. stock and bond markets in different ways. As always, we encourage you to discuss these and other matters with your financial advisor.
Thank you for your continued confidence and support.


DISCUSSION OF PERFORMANCE
Thomas Plumb, Primary Portfolio Manager
Wisconsin Capital Management, LLC, Sub-Investment Adviser
How did Dreyfus Variable Investment Fund, Balanced Portfolio perform relative to its benchmarks?
For the six-month period ended June 30, 2005, the portfolio's total returns were –1.32% for its Initial shares and –1.43% for its Service shares.1 In comparison, the portfolio's benchmark, a hybrid index composed of 60% Standard & Poor's 500 Composite Stock Price Index (the "S&P 500 Index") and 40% Lehman Brothers U.S. Aggregate Index (the "Lehman Aggregate Index"), achieved a total return of 0.52% for the reporting period.2 Separately, the S&P 500 Index and the Lehman Aggregate Index achieved total returns of –0.81% and 2.51%, respectively, for the reporting period.
Stocks and bonds produced mixed results during the reporting period as investor sentiment regarding the economy, inflation and interest rates shifted. The portfolio's returns were lower than those of its benchmark, primarily due to the portfolio's relatively light exposure to energy and utilities stocks.
What is the portfolio's investment approach?
The portfolio seeks high total return through a combination of capital appreciation and current income.To pursue this goal, the portfolio invests in a diversified mix of stocks and fixed-income securities.The portfolio will vary the mix of stocks and bonds from time to time, but normally the portfolio will allocate more than 50% of its assets to stocks and the remainder to bonds and other fixed-income securities.
In allocating portfolio assets between stocks and bonds, the portfolio manager assesses the relative return and risk of each asset class, analyzing several factors, including general economic conditions, anticipated future changes in interest rates and the outlook for stocks generally.
The Portfolio 3
DISCUSSION OF PERFORMANCE (continued)
|
In choosing stocks for the portfolio, the manager looks for high-quality companies that possess most of the following characteristics: leading market positions, high barriers to market entry and other competitive or technological advantages, high returns on equity and assets, good growth prospects, strong management, and relatively low debt burdens.
The portfolio normally invests at least 25% of its assets in fixed-income securities.The fixed-income securities in which the portfolio may invest include corporate bonds and other debt instruments, mortgage-related securities, asset-backed securities, debt securities issued or guaranteed by the U.S. government (including its agencies and instrumentalities), convertible debt securities and preferred stock that is convertible into common stock.
What other factors influenced the portfolio's performance?
Early in 2005, renewed inflationary pressures caused investors to worry that the Federal Reserve Board (the "Fed") might raise interest rates to a higher level than previously expected, potentially hurting corporate profits and eroding bond prices. Later in the reporting period, inflation and interest-rate concerns generally eased, but equity investors became worried that business conditions might deteriorate in a maturing economy.
As investor sentiment shifted, we intensified our focus with respect to the equity portion of the portfolio on high-quality companies selling at attractive valuations. Indeed, a number of the portfolio's "blue chip" holdings fared well, including pharmaceutical giant Merck & Co. and beverage leader Coca-Cola, which bounced back from earlier weakness. Pharmaceuticals distributor McKesson, a core position, also fared well as the company adapted to a changing marketplace.
On the other hand,because they seemed expensive to us,the portfolio was underweighted relative to the S&P 500 Index in energy or utilities stocks, which performed well in the period. In addition, for-profit education company, Corinthian Colleges, gave back some of the gains it achieved.
Because it was clear to us that the Fed was likely to continue raising interest rates, we set the average duration (a measure of sensitivity to changing interest rates) of the portfolio's bond portion in a range we
considered slightly shorter than average. This strategy helped performance early in the reporting period but prevented the portfolio from participating more fully in later bond market rally. Our emphasis on corporate bonds also detracted from relative performance amid weakness in the airline and automobile industries.
What is the portfolio's current strategy?
The difference in valuations between higher- and lower-quality companies has widened beyond historical norms, and we believe that investors currently are not being rewarded for incurring the risks of holding lower-quality stocks. Accordingly, we have continued to focus on well-established companies with strong cash flows, healthy balance sheets and high returns on capital. In addition, companies with these characteristics may be well-positioned to raise their dividends, which we potentially believe may become an increasingly important component of the stock market's total return. As for bonds, we have maintained the portfolio's relatively defensive posture, including short maturities, in anticipation of further rate hikes.
| | | The portfolio is only available as a funding vehicle under variable life insurance policies or variable |
| | | annuity contracts issued by insurance companies. Individuals may not purchase shares of the |
| | | portfolio directly. A variable annuity is an insurance contract issued by an insurance company that |
| | | enables investors to accumulate assets on a tax-deferred basis for retirement or other long-term |
| | | goals.The investment objective and policies of Dreyfus Variable Investment Fund, Balanced |
| | | Portfolio made available through insurance products may be similar to other funds/portfolios |
| | | managed or advised by Dreyfus. However, the investment results of the portfolio may be higher or |
| | | lower than, and may not be comparable to, those of any other Dreyfus fund/portfolio. |
| 1 | | Total return includes reinvestment of dividends and any capital gains paid. Past performance is no |
| | | guarantee of future results. Share price and investment return fluctuate such that upon redemption, |
| | | portfolio shares may be worth more or less than their original cost.The portfolio's performance does |
| | | not reflect the deduction of additional charges and expenses imposed in connection with investing |
| | | in variable insurance contracts, which will reduce returns. Return figures provided reflect the |
| | | absorption of portfolio expenses by The Dreyfus Corporation pursuant to an agreement in effect |
| | | through December 31, 2005, at which time it may be extended, terminated or modified. Had |
| | | these expenses not been absorbed, the portfolio's returns would have been lower. |
| 2 | | SOURCE: LIPPER INC. — Reflects the reinvestment of dividends and, where applicable, |
| | | capital gain distributions.The Standard & Poor's 500 Composite Stock Price Index ("S&P 500 |
| | | Index") is a widely accepted, unmanaged index of U.S. stock market performance.The Lehman |
| | | Brothers U.S. Aggregate Index is a widely accepted, unmanaged total return index of corporate, |
| | | U.S. government and U.S. government agency debt instruments, mortgage-backed securities and |
| | | asset-backed securities with an average maturity of 1-10 years. |
The Portfolio 5
UNDERSTANDING YOUR
PORTFOLIO'S EXPENSES (Unaudited)
|
As a mutual fund investor, you pay ongoing expenses,such as management fees and other expenses.Using the information below, you can estimate how these expenses affect your investment and compare them with the expenses of other funds.You also may pay one-time transaction expenses, including sales charges (loads) and redemption fees, which are not shown in this section and would have resulted in higher total expenses. For more information, see your portfolio's prospectus or talk to your financial adviser.
Review your portfolio's expenses
|
The table below shows the expenses you would have paid on a $1,000 investment in Dreyfus Variable Investment Fund, Balanced Portfolio from January 1, 2005 to June 30, 2005. It also shows how much a $1,000 investment would be worth at the close of the period, assuming actual returns and expenses.
| Expenses and Value of a $1,000 Investment | | |
| assuming actual returns for the six months ended June 30, 2005 | | |
| | | Initial Shares | | Service Shares |
| |
| |
|
| Expenses paid per $1,000 † | | $ 4.58 | | $ 4.92 |
| Ending value (after expenses) | | $986.80 | | $985.70 |
COMPARING YOUR PORTFOLIO'S EXPENSES WITH THOSE OF OTHER FUNDS (Unaudited)
Using the SEC's method to compare expenses
The Securities and Exchange Commission (SEC) has established guidelines to help investors assess fund expenses. Per these guidelines, the table below shows your portfolio's expenses based on a $1,000 investment, assuming a hypothetical 5% annualized return. You can use this information to compare the ongoing expenses (but not transaction expenses or total cost) of investing in the portfolio with those of other funds. All mutual fund shareholder reports will provide this information to help you make this comparison. Please note that you cannot use this information to estimate your actual ending account balance and expenses paid during the period.
Expenses and Value of a $1,000 Investment assuming a hypothetical 5% annualized return for the six months ended June 30, 2005
| | | Initial Shares | | Service Shares |
| |
| |
|
| Expenses paid per $1,000 † | | $ 4.66 | | $ 5.01 |
| Ending value (after expenses) | | $1,020.18 | | $1,019.84 |
† Expenses are equal to the portfolio's annualized expense ratio of .93% for Initial shares and 1.00% for Service shares, multiplied by the average account value over the period, multiplied by 181/365 (to reflect the one-half year period).
STATEMENT OF INVESTMENTS
June 30, 2005 (Unaudited)
|
| Common Stocks—67.0% | | Shares | | | | Value ($) |
| |
| |
| |
|
| Consumer Discretionary—7.9% | | | | | | |
| Catalina Marketing | | 34,000 | | | | 863,940 |
| Interpublic Group of Companies | | 65,000 | | a,b | | 791,700 |
| Kohl's | | 21,000 | | a | | 1,174,110 |
| Liberty Media, Cl.A | | 87,000 | | a | | 886,530 |
| Time Warner | | 61,500 | | a | | 1,027,665 |
| Viacom, Cl. B | | 36,000 | | | | 1,152,720 |
| | | | | | | 5,896,665 |
| Consumer Staples—4.8% | | | | | | |
| CVS | | 24,000 | | | | 697,680 |
| Coca-Cola | | 33,300 | | | | 1,390,275 |
| Nestle, ADR | | 23,400 | | | | 1,496,724 |
| | | | | | | 3,584,679 |
| Energy—4.0% | | | | | | |
| Chevron | | 28,900 | | | | 1,616,088 |
| Exxon Mobil | | 24,000 | | | | 1,379,280 |
| | | | | | | 2,995,368 |
| Financials—14.9% | | | | | | |
| American International Group | | 27,400 | | | | 1,591,940 |
| Bank of America | | 32,000 | | | | 1,459,520 |
| Berkshire Hathaway, Cl. A | | 7 | | a | | 584,500 |
| Citigroup | | 29,000 | | | | 1,340,670 |
| Doral Financial | | 75,000 | | | | 1,240,500 |
| Fannie Mae | | 26,600 | | | | 1,553,440 |
| Freddie Mac | | 12,000 | | | | 782,760 |
| J.P. Morgan Chase & Co. | | 34,000 | | | | 1,200,880 |
| Marsh & McLennan Cos. | | 46,800 | | | | 1,296,360 |
| | | | | | | 11,050,570 |
| Health Care—14.3% | | | | | | |
| Bristol-Myers Squibb | | 39,000 | | | | 974,220 |
| Cardinal Health | | 31,000 | | | | 1,784,980 |
| IMS Health | | 29,500 | | | | 730,715 |
The Portfolio 7
STATEMENT OF INVESTMENTS (Unaudited) (continued)
| Common Stocks (continued) | | Shares | | Value ($) |
| |
| |
|
| Health Care (continued) | | | | |
| McKesson | | 34,000 | | 1,522,860 |
| Merck & Co. | | 20,000 | | 616,000 |
| Pfizer | | 60,600 | | 1,671,348 |
| Schering-Plough | | 36,000 | | 686,160 |
| Wright Medical Group | | 58,000 a | | 1,548,600 |
| Wyeth | | 25,000 | | 1,112,500 |
| | | | | 10,647,383 |
| Industrials—8.1% | | | | |
| Career Education | | 48,500 a | | 1,775,585 |
| Cendant | | 25,000 | | 559,250 |
| Corinthian Colleges | | 165,000 a | | 2,107,050 |
| General Electric | | 45,000 | | 1,559,250 |
| | | | | 6,001,135 |
| Information Technology—13.0% | | | | |
| BISYS Group | | 105,000 a | | 1,568,700 |
| Electronic Data Systems | | 84,000 | | 1,617,000 |
| First Data | | 36,000 | | 1,445,040 |
| Fiserv | | 24,000 a | | 1,030,800 |
| Microsoft | | 75,500 | | 1,875,420 |
| Sabre Holdings | | 58,000 | | 1,157,100 |
| Unisys | | 150,000 a | | 949,500 |
| | | | | 9,643,560 |
| Total Common Stocks | | | | |
| (cost $49,029,719) | | | | 49,819,360 |
| |
| |
|
| |
| Preferred Stocks—2.1% | | | | |
| |
| |
|
| Auto Manufacturing—.6% | | | | |
| General Motors | | | | |
| Cum., $ 1.84 | | 21,000 | | 450,188 |
| Banking/Finance—1.5% | | | | |
| Citigroup Capital, | | | | |
| Cum., $ 1.78 | | 25,000 | | 650,782 |
| Preferred Stocks (continued) | | Shares | | Value ($) |
| |
| |
|
| Banking/Finance (continued) | | | | |
| General Motors Acceptance, | | | | |
| Cum., $ 1.84 | | 22,500 b | | 475,313 |
| | | | | 1,126,095 |
| Total Preferred Stocks | | | | |
| (cost $1,754,875) | | | | 1,576,283 |
| |
| |
|
| | | Principal | | |
| Bonds and Notes—29.4% | | Amount ($) | | Value ($) |
| |
| |
|
| Automotive—.4% | | | | |
| General Motors, | | | | |
| Notes, 7.1%, 3/15/2006 | | 270,000 | | 273,713 |
| Banks—.6% | | | | |
| Bank of America, | | | | |
| Sr. Notes, 4.375%, 12/1/2010 | | 445,000 | | 447,324 |
| Beverages—.1% | | | | |
| Miller Brewing, | | | | |
| Notes, 4.25%, 8/15/2008 | | 90,000 c | | 89,672 |
| Commercial Mortgage Pass-Through Ctfs.—1.1% | | |
| First Horizon Alternative Mortgage Securities Corp., | | |
| Ser. 2004-FA1, Cl. A1A, 6.25%, 10/25/2034 | | 533,172 | | 549,603 |
| Salomon Brothers Mortgage Securities Corp., | | | | |
| Ser. 2002-KEY2, Cl. A1, 3.222%, 3/18/2036 | | 280,841 | | 278,213 |
| | | | | 827,816 |
| Computers—.1% | | | | |
| International Business Machines, | | | | |
| Sr. Notes, 4.75%, 11/29/2012 | | 45,000 | | 46,059 |
| Cosmetics/Personal Care—.2% | | | | |
| Kimberly-Clark, | | | | |
| Notes, 5%, 8/15/2013 | | 165,000 | | 173,695 |
| Diversified Financial Services—3.6% | | | | |
| Boeing Capital, | | | | |
| Bonds, 5.8%, 1/15/2013 | | 53,000 b | | 57,785 |
| Berkshire Hathaway, | | | | |
| Notes, 3.375%, 10/15/2008 | | 1,000,000 | | 973,634 |
The Portfolio 9
STATEMENT OF INVESTMENTS (Unaudited) (continued)
| | | Principal | | |
| Bonds and Notes (continued) | | Amount ($) | | Value ($) |
| |
| |
|
| Diversified Financial Services (continued) | | |
| Ford Motor Credit: | | | | |
| Notes, 3.59%, 3/13/2007 | | 35,000 d | | 32,755 |
| Notes, 4.308%, 9/28/2007 | | 105,000 d | | 101,530 |
| General Motors Acceptance, | | | | |
| Notes, 6.125%, 2/1/2007 | | 45,000 | | 44,708 |
| Notes, 6.75%, 12/1/2014 | | 135,000 b | | 120,983 |
| Goldman Sachs, | | | | |
| Notes, 3.875%, 1/15/2009 | | 170,000 | | 167,860 |
| International Lease Finance, | | | | |
| Notes, 4.75%, 7/1/2009 | | 500,000 | | 503,494 |
| Marsh & McLennan, | | | | |
| Sr. Notes, 7.125%, 6/15/2009 | | 500,000 | | 542,580 |
| Morgan Stanley, | | | | |
| Sub. Notes, 4.75%, 4/1/2014 | | 165,000 | | 162,840 |
| | | | | 2,708,169 |
| Electric Utilities—1.2% | | | | |
| New York Telephone, | | | | |
| Notes, 6.125%, 1/15/2010 | | 500,000 | | 525,263 |
| Public Service Colorado, | | | | |
| Bonds, 4.875%, 3/1/2013 | | 101,000 | | 103,299 |
| TXU Energy, | | | | |
| Sr. Notes, 7%, 3/15/2013 | | 215,000 | | 240,136 |
| | | | | 868,698 |
| Electrical Components & Equipment—.2% | | |
| Emerson Electric, | | | | |
| Bonds, 4.5%, 5/1/2013 | | 120,000 | | 120,291 |
| Forest Products & Paper—.1% | | | | |
| International Paper, | | | | |
| Notes, 5.85%, 10/30/2012 | | 40,000 | | 41,880 |
| Health Care—1.1% | | | | |
| Cardinal Health, | | | | |
| Notes, 6.75%, 2/15/2011 | | 750,000 | | 826,917 |
| Insurance—.3% | | | | |
| Aspen Insurance, | | | | |
| Sr. Notes, 6%, 8/15/2014 | | 145,000 | | 150,353 |
| Chubb, | | | | |
| Notes, 6%, 11/15/2011 | | 50,000 | | 54,192 |
| | | | | 204,545 |
10
| | | Principal | | |
| Bonds and Notes (continued) | | Amount ($) | | Value ($) |
| |
| |
|
| Mining & Metals—.1% | | | | |
| Alcoa, | | | | |
| Notes, 4.25%, 8/15/2007 | | 35,000 | | 35,137 |
| Oil & Gas—.1% | | | | |
| ConocoPhillips, | | | | |
| Notes, 4.75%, 10/15/2012 | | 120,000 | | 122,988 |
| Real Estate—.1% | | | | |
| EOP Operating, | | | | |
| Sr. Notes, 7%, 7/15/2011 | | 60,000 | | 66,615 |
| Restaurants—.3% | | | | |
| Yum! Brands, | | | | |
| Sr. Notes, 8.875%, 4/15/2011 | | 180,000 | | 218,346 |
| Structured Index—1.6% | | | | |
| Morgan Stanley TRACERS, | | | | |
| Ser. 2002-1, 5.878%, 3/1/2007 | | 1,215,000 c,e | | 1,234,509 |
| Telecommunications—4.6% | | | | |
| British Telecommunications, | | | | |
| Notes, 8.375%, 12/15/2010 | | 172,000 | | 203,873 |
| GTE Northwest, | | | | |
| Debs., 6.3%, 6/1/2010 | | 1,700,000 | | 1,802,746 |
| Knight-Ridder | | | | |
| Notes, 4.625%, 11/1/2014 | | 197,000 | | 191,180 |
| Liberty Media, | | | | |
| Notes, 3.5%, 9/25/2006 | | 1,000,000 | | 986,817 |
| Sprint Capital, | | | | |
| Notes, 6.125%, 11/15/2008 | | 140,000 | | 147,602 |
| Verizon Florida, | | | | |
| Debs., 6.125%, 1/15/2013 | | 93,000 | | 99,861 |
| Verizon Wireless Capital, | | | | |
| Notes, 5.375%, 12/15/2006 | | 30,000 | | 30,584 |
| | | | | 3,462,663 |
| U.S. Governments—5.9% | | | | |
| U.S Treasury Inflation Protection Securities: | | |
| 2.014%, 7/15/2014 | | 3,290,494 f | | 3,400,249 |
| 3.562%, 4/15/2032 | | 731,092 f | | 1,000,054 |
| | | | | 4,400,303 |
| U.S. Government Agencies—2.0% | | | | |
| Federal Home Loan Bank, | | | | |
| Bonds, 4.5%, 7/12/2010 | | 500,000 | | 500,000 |
The Portfolio 11
STATEMENT OF INVESTMENTS (Unaudited) (continued)
| | | Principal | | |
| Bonds and Notes (continued) | | Amount ($) | | Value ($) |
| |
| |
|
| U.S. Government Agencies (continued) | | | | |
| Federal Home Loan Mortgage Corp., | | | | |
| Notes, 2.375%, 2/15/2007 | | 1,000,000 | | 978,149 |
| | | | | 1,478,149 |
| U.S. Government Agencies/Mortgage-Backed—5.7% | | |
| Federal Home Loan Mortgage Corp., | | | | |
| Mortgage Backed: | | | | |
| 5.5%, 9/1/2034 | | 23,401 | | 23,752 |
| Federal National Mortgage Association: | | | | |
| Mortgage Backed: | | | | |
| 5.5%, 9/1/2034 | | 100,000 | | 101,458 |
| 6%, 9/1/2034 | | 338,160 | | 346,912 |
| Government National Mortgage Association I: | | |
| Mortgage Backed: | | | | |
| 6%, 3/15/2029 | | 313,155 | | 323,724 |
| 6%, 6/15/2029 | | 40,608 | | 41,991 |
| 5.5%, 12/20/2029 | | 159,000 | | 164,454 |
| 6%, 12/15/2031 | | 237,863 | | 245,741 |
| 6%, 2/15/2032 | | 339,357 | | 350,491 |
| 6%, 3/15/2032 | | 51,450 | | 53,138 |
| 6%, 4/15/2032 | | 44,053 | | 45,498 |
| 6%, 5/15/2032 | | 50,280 | | 51,930 |
| 6%, 12/15/2032 | | 41,413 | | 42,772 |
| 6%, 12/15/2033 | | 845,827 | | 873,317 |
| 6%, 1/15/2034 | | 1,556,473 | | 1,607,059 |
| | | | | 4,272,237 |
| Total Bonds and Notes | | | | |
| (cost $21,792,764) | | | | 21,919,726 |
| |
| |
|
| |
| |
| Other Investment—1.9% | | Shares | | Value ($) |
| |
| |
|
| Registered Investment Company; | | | | |
| Dreyfus Institutional Preferred Plus Money Market Fund | | |
| (cost $1,389,000) | | 1,389,000 g | | 1,389,000 |
| Investment of Cash Collateral | | | | |
| for Securities Loaned—2.0% | | Shares | | Value ($) |
| |
| |
|
| Registered Investment Company; | | | | |
| Dreyfus Institutional Cash Advantage Plus Fund | | |
| (cost $1,471,270) | | 1,471,270 g | | 1,471,270 |
| |
| |
|
| Total Investments (cost $75,437,628) | | 102.4% | | 76,175,639 |
| Liabilities, Less Cash and Receivables | | (2.4%) | | (1,767,195) |
| Net Assets | | 100.0% | | 74,408,444 |
| ADR—American Depository Receipts. | | | | |
| a Non-income producing. | | | | |
| b | | All or a portion of these securities are on loan. At June 30, 2005, the total market value of the fund's securities on |
| | | loan is $1,397,060 and the total market value of the collateral held by the fund is $1,471,270. |
| c | | Securities exempt from registration under Rule 144A of the Securities Act of 1933.These securities may be resold in |
| | | transactions exempt from registration, normally to qualified institutional buyers. At June 30 ,2005 these securities |
| | | amounted to $1,324,181 or 1.8% of net assets. | | | | |
| d | | Variable rate security—interest rate subject to periodic change. | | |
| e | | Security linked to a portfolio of investment grade debt securities. | | |
| f | | Principal amount for accrual purposes is periodically adjusted based on changes in the Comsumer Price Index. |
| g | | Investments in affiliated money market mutual funds. | | |
| |
| |
|
| |
| |
| |
| |
| Portfolio Summary (Unaudited) † | | | | |
| |
| | | | | Value (%) | | | | Value (%) |
| |
| |
| |
| |
|
| Banking/Finance | | 17.0 | | U.S. Government | | 5.9 |
| Health Care | | 15.4 | | Consumer Staples | | 4.8 |
| Information Technology | | 13.0 | | Telecommunications | | 4.6 |
| Industrials | | 8.1 | | Other | | 18.0 |
| Consumer Discretionary | | 7.9 | | | | |
| U.S. Government Agencies/ | | | | | | |
| Mortgage-Backed | | 7.7 | | | | 102.4 |
| |
| † | | Based on net assets. | | | | | | |
| See notes to financial statements. | | | | | | |
The Portfolio 13
STATEMENT OF ASSETS AND LIABILITIES
June 30, 2005 (Unaudited)
| | | Cost | | Value |
| |
| |
|
| Assets ($): | | | | |
| Investments in securities— | | | | |
| See Statement of Investments (including securities | | |
| on loan, valued at $1,397,060)—Note 1(c): | | |
| Unauffiliated issuers | | 72,577,358 | | 73,315,369 |
| Affiliated issuers | | 2,860,270 | | 2,860,270 |
| Cash | | | | 139 |
| Dividends and interest receivable | | | | 277,647 |
| Prepaid expenses and other assets | | | | 9,226 |
| | | | | 76,462,651 |
| |
| |
|
| Liabilities ($): | | | | |
| Due to The Dreyfus Corporation and affiliates—Note 3(b) | | 50,662 |
| Liability for securities on loan—Note 1(c) | | 1,471,270 |
| Payable for investment securities purchased | | 500,000 |
| Accrued expenses | | | | 32,275 |
| | | | | 2,054,207 |
| |
| |
|
| Net Assets ($) | | | | 74,408,444 |
| |
| |
|
| Composition of Net Assets ($): | | | | |
| Paid-in capital | | | | 88,781,444 |
| Accumulated undistributed investment income—net | | 171,719 |
| Accumulated net realized gain (loss) on investments | | (15,282,730) |
| Accumulated net unrealized appreciation | | |
| (depreciation) on investments | | | | 738,011 |
| |
| |
|
| Net Assets ($) | | | | 74,408,444 |
| |
| |
|
| |
| |
| Net Asset Value Per Share | | | | |
| | | Initial Shares | | Service Shares |
| |
| |
|
| Net Assets ($) | | 54,608,325 | | 19,800,119 |
| Shares Outstanding | | 4,194,830 | | 1,519,495 |
| |
| |
|
| Net Assets Value Per Share ($) | | 13.02 | | 13.03 |
See notes to financial statements.
|
STATEMENT OF OPERATIONS
Six Months Ended June 30, 2005 (Unaudited)
|
| Investment Income ($): | | |
| Income: | | |
| Cash dividends (net of $5,258 foreign taxes withheld at source): | | |
| Unaffiliated issuers | | 488,181 |
| Affiliated issuers | | 27,728 |
| Interest | | 388,088 |
| Income on securities lending | | 8,382 |
| Total Income | | 912,379 |
| Expenses: | | |
| Investment advisory fee—Note 3(a) | | 288,435 |
| Prospectus and shareholders' reports | | 34,936 |
| Distribution fees—Note 3(b) | | 25,369 |
| Professional fees | | 19,251 |
| Custodian fees—Note 3(b) | | 6,434 |
| Shareholder servicing costs—Note 3(b) | | 4,346 |
| Trustees' fees and expenses—Note 3(c) | | 3,255 |
| Loan commitment fees—Note 2 | | 611 |
| Miscellaneous | | 6,178 |
| Total Expenses | | 388,815 |
| Less—waiver of fees due to undertaking—Note 3(a) | | (22,545) |
| Less—reduction in custody fees | | |
| due to earnings credits—Note 1(c) | | (1,037) |
| Net Expenses | | 365,233 |
| Investment Income—Net | | 547,146 |
| |
|
| Realized and Unrealized Gain (Loss) on Investments—Note 4 ($): |
| Net realized gain (loss) on investments | | 1,004,763 |
| Net unrealized appreciation (depreciation) on investments | | (2,748,096) |
| Net Realized and Unrealized Gain (Loss) on Investments | | (1,743,333) |
| Net (Decrease) in Net Assets Resulting from Operations | | (1,196,187) |
See notes to financial statements.
|
The Portfolio 15
STATEMENT OF CHANGES IN NET ASSETS
| | | Six Months Ended | | |
| | | June 30, 2005 | | Year Ended |
| | | (Unaudited) | | December 31, 2004 |
| |
| |
|
| Operations ($): | | | | |
| Investment income—net | | 547,146 | | 1,452,740 |
| Net realized gain (loss) on investments | | 1,004,763 | | 7,704,069 |
| Net unrealized appreciation | | | | |
| (depreciation) on investments | | (2,748,096) | | (4,614,377) |
| Net Increase (Decrease) in Net Assets | | | | |
| Resulting from Operations | | (1,196,187) | | 4,542,432 |
| |
| |
|
| Dividends to Shareholders from ($): | | | | |
| Investment income—net: | | | | |
| Initial shares | | (484,038) | | (1,313,856) |
| Service shares | | (165,698) | | (422,063) |
| Total Dividends | | (649,736) | | (1,735,919) |
| |
| |
|
| Beneficial Interest Transactions ($): | | | | |
| Net proceeds from shares sold: | | | | |
| Initial shares | | 435,181 | | 1,535,093 |
| Service shares | | 358,752 | | 1,598,254 |
| Dividends reinvested: | | | | |
| Initial shares | | 484,038 | | 1,313,856 |
| Service shares | | 165,698 | | 422,063 |
| Cost of shares redeemed: | | | | |
| Initial shares | | (5,992,033) | | (11,090,415) |
| Service shares | | (2,147,309) | | (4,186,838) |
| Increase (Decrease) in Net Assets from | | | | |
| Beneficial Interest Transactions | | (6,695,673) | | (10,407,987) |
| Total Increase (Decrease) in Net Assets | | (8,541,596) | | (7,601,474) |
| |
| |
|
| Net Assets ($): | | | | |
| Beginning of Period | | 82,950,040 | | 90,551,514 |
| End of Period | | 74,408,444 | | 82,950,040 |
| Undistributed investment income—net | | 171,719 | | 274,309 |
| | | Six Months Ended | | |
| | | June 30, 2005 | | Year Ended |
| | | (Unaudited) | | December 31, 2004 |
| |
| |
|
| Capital Share Transactions: | | | | |
| Initial Shares | | | | |
| Shares sold | | 33,465 | | 119,914 |
| Shares issued for dividends reinvested | | 37,423 | | 101,379 |
| Shares redeemed | | (460,418) | | (863,058) |
| Net Increase (Decrease) in Shares Outstanding | | (389,530) | | (641,765) |
| |
| |
|
| Service Shares | | | | |
| Shares sold | | 27,514 | | 124,997 |
| Shares issued for dividends reinvested | | 12,800 | | 32,575 |
| Shares redeemed | | (165,049) | | (325,263) |
| Net Increase (Decrease) in Shares Outstanding | | (124,735) | | (167,691) |
See notes to financial statements.
|
The Portfolio 17
The following tables describe the performance for each share class for the fiscal periods indicated. All information (except portfolio turnover rate) reflects financial results for a single portfolio share.Total return shows how much your investment in the portfolio would have increased (or decreased) during each period, assuming you had reinvested all dividends and distributions.These figures have been derived from the portfolio's financial statements.
| Six Months Ended | | | | | | | | | | |
| June 30, 2005 | | | | Year Ended December 31, | | |
| |
| |
| |
|
| Initial Shares | | (Unaudited) | | 2004 | | 2003 | | 2002 | | 2001 a | | 2000 |
| |
| |
| |
| |
| |
| |
|
| Per Share Data ($): | | | | | | | | | | | | |
| Net asset value, | | | | | | | | | | | | |
| beginning of period | | 13.31 | | 12.87 | | 11.09 | | 13.34 | | 15.00 | | 16.02 |
| Investment Operations: | | | | | | | | | | | | |
| Investment income—net b | | .09 | | .22 | | .15 | | .19 | | .27 | | .52 |
| Net realized and unrealized | | | | | | | | | | | | |
| gain (loss) on investments | | (.27) | | .50 | | 1.84 | | (2.25) | | (1.65) | | (.97) |
| Total from Investment Operations | | (.18) | | .72 | | 1.99 | | (2.06) | | (1.38) | | (.45) |
| Distributions: | | | | | | | | | | | | |
| Dividends from | | | | | | | | | | | | |
| investment income—net | | (.11) | | (.28) | | (.21) | | (.19) | | (.28) | | (.48) |
| Dividends from net realized | | | | | | | | | | | | |
| gain on investments | | — | | — | | — | | — | | — | | (.09) |
| Total Distributions | | (.11) | | (.28) | | (.21) | | (.19) | | (.28) | | (.57) |
| Net asset value, end of period | | 13.02 | | 13.31 | | 12.87 | | 11.09 | | 13.34 | | 15.00 |
| |
| |
| |
| |
| |
| |
|
| Total Return (%) | | (1.32)c | | 5.64 | | 18.14 | | (15.48) | | (9.12) | | (2.98) |
| |
| |
| |
| |
| |
| |
|
| Ratios/Supplemental Data (%): | | | | | | | | | | |
| Ratio of total expenses | | | | | | | | | | | | |
| to average net assets | | .47c | | .88 | | .89 | | .85 | | .85 | | .85 |
| Ratio of net expenses | | | | | | | | | | | | |
| to average net assets | | .46c | | .88 | | .89 | | .85 | | .85 | | .85 |
| Ratio of net investment income | | | | | | | | | | | | |
| to average net assets | | .71c | | 1.73 | | 1.26 | | 1.58 | | 1.92 | | 3.35 |
| Portfolio Turnover Rate | | 21.05c | | 281.51d | | 363.02d | | 388.26 | | 128.44 | | 111.66 |
| |
| |
| |
| |
| |
| |
|
| Net Assets, end of period | | | | | | | | | | | | |
| ($ x 1,000) | | 54,608 | | 61,038 | | 67,239 | | 64,865 | | 96,290 | | 105,569 |
| a | | As required, effective January 1, 2001, the portfolio has adopted the provisions of the AICPA Audit and Accounting |
| | | Guide for Investment Companies and began accreting discount or amortizing premium on debt securities on a |
| | | scientific basis and including paydown gains and losses in interest income.The effect of this change for the period |
| | | ended December 31, 2001 was to decrease net investment income per share by $.01, increase net realized and |
| | | unrealized gain (loss) on investments per share by $.01, and decrease the ratio of net investment income to average |
| | | net assets from 2.02% to 1.92%. Per share data and ratios/supplemental data for periods prior to January 1, 2001 |
| | | have not been restated to reflect this change in presentation. |
| b | | Based on average shares outstanding at each month end. |
| c | | Not annulaized. |
| d | | The portfolio turnover rate excluding mortgage dollar roll transactions for the years ended December 31, 2004 and |
| | | December 31, 2003 were 266.40% and 305.71%, respectively. |
| See notes to financial statements. |
18
| Six Months Ended | | | | | | | | | | |
| June 30, 2005 | | | | Year Ended December 31, | | |
| |
| |
| |
|
| Service Shares | | (Unaudited) | | 2004 | | 2003 | | 2002 | | 2001 a | | 2000 b |
| |
| |
| |
| |
| |
| |
|
| Per Share Data ($): | | | | | | | | | | | | |
| Net asset value, | | | | | | | | | | | | |
| beginning of period | | 13.33 | | 12.87 | | 11.08 | | 13.33 | | 15.00 | | 15.00 |
| Investment Operations: | | | | | | | | | | | | |
| Investment income—net | | .09c | | .21c | | .14c | | .17c | | .22c | | — |
| Net realized and unrealized | | | | | | | | | | | | |
| gain (loss) on investments | | (.28) | | .50 | | 1.84 | | (2.24) | | (1.63) | | — |
| Total from Investment Operations | | (.19) | | .71 | | 1.98 | | (2.07) | | (1.41) | | — |
| Distributions: | | | | | | | | | | | | |
| Dividends from | | | | | | | | | | | | |
| investment income—net | | (.11) | | (.25) | | (.19) | | (.18) | | (.26) | | — |
| Net asset value, end of period | | 13.03 | | 13.33 | | 12.87 | | 11.08 | | 13.33 | | 15.00 |
| |
| |
| |
| |
| |
| |
|
| Total Return (%) | | (1.43)d | | 5.57 | | 18.02 | | (15.63) | | (9.31) | | — |
| |
| |
| |
| |
| |
| |
|
| Ratios/Supplemental Data (%): | | | | | | | | | | |
| Ratio of total expenses | | | | | | | | | | | | |
| to average net assets | | .59d | | 1.13 | | 1.14 | | 1.09 | | 1.16 | | — |
| Ratio of net expenses | | | | | | | | | | | | |
| to average net assets | | .50d | | 1.00 | | 1.00 | | 1.00 | | 1.00 | | — |
| Ratio of net investment income | | | | | | | | | | | | |
| to average net assets | | .68d | | 1.62 | | 1.15 | | 1.45 | | 1.66 | | — |
| Portfolio Turnover Rate | | 21.05d | | 281.51e | | 363.02e | | 388.26 | | 128.44 | | 111.66 |
| |
| |
| |
| |
| |
| |
|
| Net Assets, end of period | | | | | | | | | | | | |
| ($ x 1,000) | | 19,800 | | 21,912 | | 23,313 | | 22,040 | | 15,396 | | —f |
| a | | As required, effective January 1, 2001, the portfolio has adopted the provisions of the AICPA Audit and Accounting |
| | | Guide for Investment Companies and began accreting discount or amortizing premium on debt securities on a |
| | | scientific basis and including paydown gains and losses in interest income.The effect of this change for the period |
| | | ended December 31, 2001 was to decrease net investment income per share by $.01, increase net realized and |
| | | unrealized gain (loss) on investments per share by $.01, and decrease the ratio of net investment income to average |
| | | net assets from 1.77% to 1.66%. Per share data and ratios/supplemental data for periods prior to January 1, 2001 |
| | | have not been restated to reflect this change in presentation. |
| b | | The portfolio commenced offering Service shares on December 31, 2000. |
| c | | Based on average shares outstanding at each month end. |
| d | | Not annualized. |
| e | | The portfolio turnover rate excluding mortgage dollar roll transactions for the years ended December 31, 2004 and |
| | | December 31, 2003 were 266.40% and 305.71%, respectively. |
| f | | Amount represents less than $1,000. |
| See notes to financial statements. |
The Portfolio 19
NOTES TO FINANCIAL STATEMENTS (Unaudited)
NOTE 1—Significant Accounting Policies:
Dreyfus Variable Investment Fund (the "fund") is registered under the Investment Company Act of 1940, as amended (the "Act"), as an open-end management investment company, operating as a series company currently offering twelve series, including the Balanced Portfolio (the "portfolio"). The portfolio is only offered to separate accounts established by insurance companies to fund variable annuity contracts and variable life insurance policies.The portfolio is a diversified series.The portfolio's investment objective seeks high total return through a combination of capital appreciation and current income. The Dreyfus Corporation ("Dreyfus") serves as the portfolio's investment adviser. Dreyfus is a wholly-owned subsidiary of Mellon Financial Corporation ("Mellon Financial"). Wisconsin Capital Management, Inc. ("Wisconsin Capital") serves as the portfolio's sub-investment adviser.
Dreyfus Service Corporation (the "Distributor"), a wholly-owned subsidiary of the Manager, is the distributor of the portfolio's shares, which are sold without a sales charge.The portfolio is authorized to issue an unlimited number of $.001 par value shares of Beneficial Interest in each of the following classes of shares: Initial and Service. Each class of shares has identical rights and privileges, except with respect to the distribution plan and the expenses borne by each class and certain voting rights. Income, expenses (other than expenses attributable to a specific class), and realized and unrealized gains or losses on investments are allocated to each class of shares based on its relative net assets.
The fund accounts separately for the assets, liabilities and operations of each series. Expenses directly attributable to each series are charged to that series' operations; expenses which are applicable to all series are allocated among them on a pro rata basis.
The portfolio's financial statements are prepared in accordance with U.S. generally accepted accounting principles, which may require the use of management estimates and assumptions.Actual results could differ from those estimates.
The fund enters into contracts that contain a variety of indemnifica-tions.The portfolio's maximum exposure under these arrangements is unknown. The portfolio does not anticipate recognizing any loss related to these arrangements.
(a) Portfolio valuation: Most debt securities are valued each business day by an independent pricing service (the "Service") approved by the Board of Trustees. Securities listed on the National Market System, for which market quotations are available are valued at the official closing price or, if there is no official closing price that day, at the last sale price. Debt securities for which quoted bid prices are readily available and are representative of the bid side of the market in the judgment of the Service are valued at the mean between the quoted bid prices (as obtained by the Service from dealers in such securities) and asked prices (as calculated by the Service based upon its evaluation of the market for such securities). Other debt securities are carried at fair value as determined by the Service, based on methods which include consideration of: yields or prices of securities of comparable quality, coupon, maturity and type; indications as to values from dealers; and general market conditions. Other securities are valued at the last sales price on the securities exchange or on the national securities market on which such securities are primarily traded. Securities listed on the National Market System for which market quotations are available are valued at the official closing price or, if there is no official closing price that day, at the last sales price. Securities not listed on an exchange or the national securities market, or securities for which there were no transactions, are valued at the average of the most recent bid and asked prices, except for open short positions, where the asked price is used for valuation purposes. Bid price is used when no asked price is available. Investments in registered companies are valued at their net asset value.When market quotations or official closing prices are not readily available, or are determined not to reflect accurately fair value, such as when the value of a security has been significantly affected by events after the close of the exchange or market on which the security is principally traded (for example, a foreign exchange or market),
The Portfolio 21
NOTES TO FINANCIAL STATEMENTS (Unaudited) (continued)
but before the portfolio calculates its net asset value, the portfolio may value these investments at fair value as determined in accordance with the procedures approved by the Board of Trustees. Fair valuing of securities may be determined with the assistance of a pricing service using calculations based on indices of domestic securities and other appropriate indicators, such as prices of relevant ADR's and futures contracts. Investments denominated in foreign currencies are translated to U.S. dollars at the prevailing rates of exchange. For other securities that are fair valued by the Board of Trustees, certain factors may be considered such as: fundamental analytical data, the nature and duration of restrictions on disposition, an evaluation of the forces that influence the market in which the securities are purchased and sold, and public trading in similar securities of the issuer or comparable issuers. Financial futures are valued at the last sales price. Investments denominated in foreign currencies are translated to U.S. dollars at the prevailing rates of exchange. Forward currency exchange contracts are valued at the forward rate.
(b) Foreign currency transactions: The portfolio does not isolate that portion of the results of operations resulting from changes in foreign exchange rates on investments from the fluctuations arising from changes in market prices of securities held. Such fluctuations are included with the net realized and unrealized gain or loss on investments.
Net realized foreign exchange gains or losses arise from sales and maturities of short-term securities, sales of foreign currencies, currency gains or losses realized on securities transactions and the difference between the amounts of dividends, interest and foreign withholding taxes recorded on the portfolio's books and the U.S. dollar equivalent of the amounts actually received or paid. Net unrealized foreign exchange gains or losses arise from changes in the value of assets and liabilities other than investments in securities, resulting from changes in exchange rates. Such gains and losses are included with net realized and unrealized gain or loss on investments.
(c) Securities transactions and investment income: Securities transactions are recorded on a trade date basis. Realized gain and loss from
securities transactions are recorded on the identified cost basis. Dividend income is recognized on the ex-dividend date and interest income, including, where applicable, accretion of discount and amortization of premium on investments, is recognized on the accrual basis.
The portfolio has an arrangement with the custodian bank whereby the portfolio receives earnings credits from the custodian when positive cash balances are maintained, which are used to offset custody fees. For financial reporting purposes, the portfolio includes net earnings credits as an expense offset in the Statement of Operations.
Pursuant to a securities lending agreement with Mellon Bank, N.A., an affiliate of Dreyfus, the portfolio may lend securities to qualified institutions.At origination, all loans are secured by collateral of at least 102% of the value of U.S. securities loaned and 105% of the value of foreign securities loaned. Collateral equivalent to at least 100% of the market value of securities on loan will be maintained at all times. Cash collateral is invested in certain money market mutual funds managed by Dreyfus. The portfolio will be entitled to receive all income on securities loaned, in addition to income earned as a result of the lending transaction. Although each security loaned is fully collateralized, the portfolio would bear the risk of delay in recovery of, or loss of rights in, the securities loaned should a borrower fail to return the securities in a timely manner.
(d) Affiliated issuers: Investments in other investment companies advised by Dreyfus are defined as "affiliated" in the Act.
(e) Dividends to shareholders: Dividends are recorded on the ex-dividend date. Dividends from investment income-net are declared and paid quarterly. Dividends from net realized capital gain, if any, are normally declared and paid annually, but the portfolio may make distributions on a more frequent basis to comply with the distribution requirements of the Internal Revenue Code of 1986, as amended (the "Code").To the extent that net realized capital gain can be offset by capital loss carryovers, it is the policy of the portfolio not to distribute
The Portfolio 23
NOTES TO FINANCIAL STATEMENTS (Unaudited) (continued)
such gain. Income and capital gain distributions are determined in accordance with income tax regulations, which may differ from U.S. generally accepted accounting principles.
(f) Federal income taxes: It is the policy of the portfolio to continue to qualify as a regulated investment company, if such qualification is in the best interests of its shareholders, by complying with the applicable provisions of the Code, and to make distributions of taxable income sufficient to relieve it from substantially all federal income and excise taxes.
The portfolio has an unused capital loss carryover of $15,657,150 available for federal income tax purposes to be applied against future net securities profits, if any, realized subsequent to December 31, 2004. If not applied, $3,489,427 of the carryover expires in fiscal 2009, $8,289,370 expires in fiscal 2010 and $3,878,353 expires in fiscal 2011.
The tax character of distributions paid to shareholders during the fiscal year ended December 31, 2004, was as follows: ordinary income $1,735,919. The tax character of current year distributions will be determined at the end of the current fiscal year.
NOTE 2—Bank Line of Credit:
|
The portfolio participates with other Dreyfus-managed funds in a $350 million redemption credit facility (the "Facility") to be utilized for temporary or emergency purposes, including the financing of redemptions. In connection therewith, the portfolio has agreed to pay commitment fees on its pro rata portion of the Facility. Interest is charged to the portfolio based on prevailing market rates in effect at the time of borrowings. During the period ended June 30, 2005, the portfolio did not borrow under the Facility.
NOTE 3—Investment Advisory Fee and Other Transactions With Affiliates:
(a) Pursuant to an Investment Advisory Agreement with Dreyfus, the investment advisory fee is computed at the annual rate of .75 of 1% of the value of the portfolio's average daily net assets and is payable monthly.
Dreyfus has agreed, from January 1, 2005 to December 31, 2005, to waive receipt of its fees and/or assume the expenses of the portfolio so that the expenses of neither class, exclusive of taxes, brokerage fees, interest on borrowings, commitment fees and extraordinary expenses, exceed 1% of the value of the average daily net assets of their class. During the period ended June 30, 2005, Dreyfus waived receipt of fees of $22,545 pursuant to the undertaking.
Pursuant to a Sub-Investment Advisory Agreement between Dreyfus and Wisconsin Capital, the sub-investment advisory fee is payable monthly by Dreyfus, and is based upon the value of the portfolio's average daily net assets, computed at the following annual rates:
| Average Net Assets | | |
| 0 to $300 million | | .25 of 1% |
| In excess of $300 million | | .20 of 1% |
(b) Under the Distribution Plan (the "Plan") adopted pursuant to Rule 12b-1 under the Act, Service shares pay the Distributor for distributing their shares, for servicing and/or maintaining Service shares shareholder accounts and for advertising and marketing for Service shares.The Plan provides for payments to be made at an annual rate of .25 of 1% of the value of the Service shares' average daily net assets.The Distributor may make payments to Participating Insurance Companies and to brokers and dealers acting as principal underwriter for their variable insurance products.The fees payable under the Plan are payable without regard to actual expenses incurred. During the period ended June 30, 2005, Service shares were charged $25,369 pursuant to the Plan.
The portfolio compensates Dreyfus Transfer, Inc., a wholly-owned subsidiary of the Manager, under a transfer agency agreement for providing personnel and facilities to perform transfer agency services for the portfolio. During the period ended June 30, 2005, the portfolio was charged $27 pursuant to the transfer agency agreement.
The Portfolio 25
NOTES TO FINANCIAL STATEMENTS (Unaudited) (continued)
The portfolio compensates Mellon Bank, N.A., an affiliate of the Manager, under a custody agreement for providing custodial services for the portfolio. During the period ended June 30, 2005, the portfolio was charged $6,434 pursuant to the custody agreement.
During the period ended June 30, 2005, the portfolio was charged $1,998 for services performed by the Chief Compliance Officer.
The components of Due to The Dreyfus Corporation and affiliates in the Statement of Assets and Liabilities consist of: investment advisory fees $46,434, Rule 12b-1 distribution plan fees $4,080, custodian fees $3,309, chief compliance officer fees $1,998 and transfer agency per account fees $10 which are offset against an expense reimbursement currently in effect in the amount of $5,169.
(c) Each Board member also serves as a Board member of other funds within the Dreyfus complex. Annual retainer fees and attendance fees are allocated to each fund based on net assets.
(d) Pursuant to an exemptive order from the Securities and Exchange Commission, the portfolio may invest its available cash balances in affiliated money market mutual funds. Management fees of the underlying money market mutual fund have been waived by Dreyfus.
NOTE 4—Securities Transactions:
|
The aggregate amount of purchases and sales (including paydowns) of investment securities, excluding short-term securities during the period ended June 30, 2005, amounted to $15,870,322 and $18,999,933, respectively.
At June 30, 2005, accumulated net unrealized appreciation on investments was $738,011, consisting of $4,245,606 gross unrealized appreciation and $3,507,595 gross unrealized depreciation.
At June 30,2005,the cost of investments for federal income tax purposes was substantially the same as the cost for financial reporting purposes (see the Statement of Investments).
In early 2004, two purported class and derivative actions were filed against Mellon Financial, Mellon Bank, N.A., Dreyfus, Founders Asset Management LLC, and certain directors of the Dreyfus Funds and the Dreyfus Founders Funds (together, the "Funds") in the United States District Court for the Western District of Pennsylvania. In September 2004, plaintiffs served a Consolidated Amended Complaint (the "Amended Complaint") on behalf of a purported class of all persons who acquired interests in any of the Funds between January 30, 1999 and November 17, 2003, and derivatively on behalf of the Funds.The Amended Complaint in the newly styled In re Dreyfus Mutual Funds Fee Litigation also named the Distributor, Premier Mutual Fund Services, Inc. and two additional Fund directors as defendants and alleges violations of the Investment Company Act of 1940, the Investment Advisers Act of 1940, the Pennsylvania Unfair Trade Practices and Consumer Protection Law and common-law claims. Plaintiffs seek to recover allegedly improper and excessive Rule 12b-1 and advisory fees allegedly charged to the Funds for marketing and distribution services. More specifically, plaintiffs claim, among other things, that 12b-1 fees and directed brokerage were improperly used to pay brokers to recommend the Funds over other funds, and that such payments were not disclosed to investors. In addition, plaintiffs assert that economies of scale and soft-dollar benefits were not passed on to the Funds. Plaintiffs further allege that 12b-1 fees were improperly charged to certain of the Funds that were closed to new investors.The Amended Complaint seeks compensatory and punitive damages, rescission of the advisory contracts, and an accounting and restitution of any unlawful fees, as well as an award of attorneys' fees and litigation expenses. As noted, some of the claims in this litigation are asserted derivatively on behalf of the Funds that have been named as nominal defendants. With respect to such derivative claims, no relief is sought against the Funds. Dreyfus believes the allegations to be totally without
The Portfolio 27
NOTES TO FINANCIAL STATEMENTS (Unaudited) (continued)
merit and intends to defend the action vigorously. In November 2004, all named defendants moved to dismiss the Amended Complaint in the whole or substantial part. Briefing was completed in May 2005.
Additional lawsuits arising out of these circumstances and presenting similar allegations and requests for relief may be filed against the defendants in the future. Neither Dreyfus nor the Funds believe that any of the pending actions will have a material adverse effect on the Funds or Dreyfus' ability to perform its contract with the Funds.
INFORMATION ABOUT THE REVIEW
AND APPROVAL OF THE PORTFOLIO'S
I N V E S T M E N T A DV I S O RY A G R E E M E N T (Unaudited)
|
At separate meetings of the Board of Trustees for the fund held on June 8-9, 2005, the Board considered the re-approval, through its annual renewal date of July 31, 2006, of the Investment Advisory Agreement with Dreyfus for the portfolio, pursuant to which Dreyfus provides the portfolio with investment advisory and administrative services.The Board members who are not "interested persons" (as defined in the Act (the "Independent Trustees")) of the fund were assisted in their review by independent legal counsel and met with counsel in executive session separate from representatives of Dreyfus.
Analysis of Nature, Extent and Quality of Services Provided to the Portfolio. The Board members received a presentation from representatives of Dreyfus regarding services provided to the portfolio and other funds in the Dreyfus fund complex, and discussed the nature, extent and quality of the services provided to the portfolio pursuant to its Investment Advisory Agreement and the Sub-Advisory Agreement (as defined below). Dreyfus's representatives reviewed the portfolio's distribution of accounts and the relationships Dreyfus has with various intermediaries and the different needs of each. The Board noted that the portfolio's shares were offered only to separate accounts established by insurance companies to fund variable annuity contracts and variable life insurance policies. Dreyfus's representatives noted the diversity of distribution among the funds in the Dreyfus complex, and Dreyfus's corresponding need for broad, deep, and diverse resources to be able to provide ongoing shareholder services to each distribution channel, including that of the portfolio.The Board also reviewed the number of shareholder accounts in the portfolio, as well as the portfolio's asset size.
The Board members also considered that Dreyfus had engaged Wisconsin Capital Management, LLC (the "Sub-Adviser"), to provide day-to-day management of the portfolio's investments subject to Dreyfus's oversight, pursuant to a Sub-Investment Advisory Agreement ("Sub-Advisory Agreement") which was approved by portfolio shareholders and effective as of December 10, 2004. It was noted that
The Portfolio 29
INFORMATION ABOUT THE REVIEW AND APPROVAL OF THE PORTFOLIO'S
INVESTMENT ADVISORY AGREEMENT (Unaudited) (continued)
|
Dreyfus also provides oversight of day-to-day portfolio operations, including fund accounting and administration and assistance in meeting legal and regulatory requirements.The Board members noted that the Sub-Advisory Agreement was not being presented for Board consideration this year, as the Board's and portfolio shareholders' initial approval of such agreement extends to the agreement anniversary date in 2006. The Board members also considered Dreyfus's extensive administrative, accounting and compliance infrastructure.
Comparative Analysis of the Portfolio's Performance, Investment Advisory Fee and Expense Ratio. The Board members reviewed the portfolio's performance and expense ratios and placed significant emphasis on comparisons to two groups of comparable funds and Lipper category averages, as applicable.The Board reviewed the portfolio's performance, investment advisory fee, and total expense ratios within these comparison groups and against the portfolio's Lipper category averages, as applicable.The groups of comparable funds were previously approved by the Board for this purpose, and were prepared using a Board-approved selection methodology that was based, in part, on selecting non-affiliated funds reported in the same Lipper category as the portfolio. The Board members discussed the results of the comparisons and noted that the portfolio's performance was below the averages of its comparison groups and Lipper category and that the portfolio's more recent performance did not show an improvement in its comparison group rankings.The Board members noted the change in the portfolio's portfolio management team in December 2004, when the Sub-Adviser became the portfolio's sub-investment adviser and that the Sub-Adviser has been providing sub-investment advisory services to the portfolio only for approximately six months. Under these circumstances, the Board members considered the generally competitive-to-good performance of the Sub-Adviser versus its benchmark for a similarly managed balanced fund that the Sub-Adviser has managed for the previous 10 calendar years, noting that the Sub-Adviser's performance generally was substantially in line with or outperformed the benchmark
in 7 of the previous 10 calendar years, including producing positive returns in 2 of the 3 years where the benchmark produced negative returns.The Board members also discussed the portfolio's expense ratio for each class of shares, noting it is higher than the average of its respective comparison group, and that it ranks in the bottom half of its respective comparison group, with a few other funds in the groups having higher expense ratios than the portfolio. They reviewed the range of management fees in the comparison groups and noted that the portfolio's investment advisory fee is in the bottom half of the comparison groups, with a few funds having a management fee that was the same as, or higher than, the portfolio. The Board members noted Dreyfus's current undertaking to waive or reimburse certain fees and expenses to limit the portfolio's expense ratio, which reduced the expense ratio for the portfolio's Service shares.
Representatives of Dreyfus reviewed with the Board members a comparison of the fees paid to Dreyfus or its affiliates by mutual funds managed by Dreyfus and its affiliates and by the Sub-Adviser and its affiliates with similar investment objectives, policies and strategies as the portfolio (the "Similar Funds") and the fees paid to the Sub-Adviser by separate accounts with similar investment objectives, policies and strategies as the portfolio (the "Separate Accounts" and, collectively with the Similar Funds, the "Similar Accounts") and explained the nature of each Similar Account and the differences, from Manager's perspective, in management of such Similar Accounts as compared to managing and providing other services to the portfolio.The Similar Funds comparison group was composed exclusively of mutual funds affiliated with Dreyfus that were reported as "balanced" funds by Lipper. Dreyfus's representatives also reviewed the costs associated with distribution through intermediaries.The Board analyzed differences in fees paid to Dreyfus and discussed the relationship of the advisory fees paid in light of Dreyfus's and the Sub-Adviser's performance and the services provided. It was noted that the Similar Funds included one unitary fee
The Portfolio 31
INFORMATION ABOUT THE REVIEW AND APPROVAL OF THE PORTFOLIO'S
INVESTMENT ADVISORY AGREEMENT (Unaudited) (continued)
|
structure fund that had a higher management fee than the portfolio and that the other funds had management fees relatively comparable to the fee borne by the portfolio. The Board members considered the relevance of the fee information provided for the Similar Accounts managed by Dreyfus or the Sub-Adviser to evaluate the appropriateness and reasonableness of the portfolio's advisory fees.The Board acknowledged that differences in fees paid by the Separate Accounts seemed to be consistent with the services provided.
Analysis of Profitability and Economies of Scale. Dreyfus's representatives reviewed the dollar amount of expenses allocated and profit received by Dreyfus and the method used to determine such expenses and profit.The Board received and considered information prepared by an independent consulting firm regarding Dreyfus' approach to allocating costs to, and determining the profitability of, individual funds and the entire Dreyfus mutual fund complex.The consulting firm also analyzed where any economies of scale might emerge as assets grow.The Board members evaluated the analysis in light of the relevant circumstances for the portfolio, including the decline in assets and the extent to which economies of scale would be realized as the portfolio grows and whether fee levels reflect these economies of scale for the benefit of portfolio investors. The Board members also considered potential benefits to Dreyfus from acting as investment adviser and to the Sub-Adviser from acting as sub-adviser and noted the soft dollar arrangements with respect to trading the portfolio's portfolio.
It was noted that the Board members should consider Dreyfus's profitability with respect to the portfolio as part of their evaluation of whether the fee under the Investment Advisory Agreement bears a reasonable relationship to the mix of services provided by Dreyfus and the Sub-Adviser, including the nature, extent and quality of such services and that a discussion of economies of scale are predicated on increasing assets and that, if a fund's assets had been decreasing, the possibility that Dreyfus or the Sub-Adviser may have realized any
economies of scale would be less. It also was noted that the profitability percentage for managing the portfolio was within ranges determined by appropriate court cases to be reasonable given the services rendered and, given the portfolio's generally superior service levels provided.The Board members noted Dreyfus's current undertaking to waive or reimburse certain fees and expenses, which reduced the expense ratio for the portfolio's Service shares.
At the conclusion of these discussions, each of the Independent Trustees expressed the opinion that he or she had been furnished with sufficient information to make an informed business decision with respect to continuation of the fund's Investment Advisory Agreement with respect to the portfolio. Based on their discussions and considerations as described above, the Board made the following conclusions and determinations.
- The Board concluded that the nature, extent and quality of the ser- vices provided by Dreyfus and the Sub-Adviser are adequate and appropriate.
- The Board was not satisfied with the portfolio's performance, but generally viewed the engagement of the Sub-Adviser as sub-invest- ment adviser for the portfolio in December 2004 as a positive development and agreed to allow the Sub-Adviser the time neces- sary to improve performance, noting the Sub-Adviser's generally competitive-to-good performance over the previous 10-year period for a similar fund.
- The Board concluded that the fee paid by the portfolio to Dreyfus was reasonable in light of comparative performance and expense and advisory fee information, including Dreyfus's current undertaking to waive or reimburse certain fees and expenses, which reduced the expense ratio of the Service shares, costs of the services provided and profits to be realized and benefits derived or to be derived by Dreyfus from its relationship with the portfolio.
The Portfolio 33
INFORMATION ABOUT THE REVIEW AND APPROVAL OF THE PORTFOLIO'S INVESTMENT ADVISORY AGREEMENT(Unaudited) (continued)
- The Board determined that, to the extent that material economies of scale had not been shared with the portfolio, the Board would seek to do so.
The Board members considered these conclusions and determinations, along with information received on a routine and regular basis throughout the year, and, without any one factor being dispositive, the Board determined that approval of the portfolio's Investment Advisory Agreement, with respect to the portfolio, was in the best interests of the portfolio and its shareholders.
NOTES
| For More | | Information |
| |
|
| |
| |
| |
| Dreyfus Variable | | Custodian |
| |
| Investment Fund, | | |
| | | Mellon Bank, N.A. |
| Balanced Portfolio | | |
| | | One Mellon Bank Center |
| 200 Park Avenue | | |
| | | Pittsburgh, PA 15258 |
| New York, NY 10166 | | |
| |
| | | Transfer Agent & |
| |
| Investment Adviser | | Dividend Disbursing Agent |
| |
| The Dreyfus Corporation | | |
| | | Dreyfus Transfer, Inc. |
| 200 Park Avenue | | |
| | | 200 Park Avenue |
| New York, NY 10166 | | |
| | | New York, NY 10166 |
| |
| |
| Sub-Investment Adviser | | Distributor |
| |
| Wisconsin Capital Management, Inc. |
| | | Dreyfus Service Corporation |
| 1200 John Q. Hammons Drive |
| | | 200 Park Avenue |
| Madison,Wisconsin 53717 | | |
| | | New York, NY 10166 |
Telephone 1-800-554-4611 or 516-338-3300
Mail The Dreyfus Family of Funds, 144 Glenn Curtiss Boulevard, Uniondale, NY 11556-0144 Attn: Institutional Servicing
The portfolio files its complete schedule of portfolio holdings with the Securities and Exchange Commission ("SEC") for the first and third quarters of each fiscal year on Form N-Q. The portfolio's Forms N-Q are available on the SEC's website at http://www.sec.gov and may be reviewed and copied at the SEC's Public Reference Room in Washington, DC. Information on the operation of the Public Reference Room may be obtained by calling 1-800-SEC-0330.
A description of the policies and procedures that the portfolio uses to determine how to vote proxies relating to portfolio securities, and information regarding how the portfolio voted these proxies for the 12-month period ended June 30, 2005, is available at http://www.dreyfus.com and on the SEC's website at http://www.sec.gov. The description of the policies and procedures is also available without charge, upon request, by calling 1-800-645-6561.
© 2005 Dreyfus Service Corporation

| Dreyfus Variable |
| Investment Fund, |
| Developing Leaders |
| Portfolio |
SEMIANNUAL REPORT June 30, 2005

The views expressed in this report reflect those of the portfolio manager only through the end of the period covered and do not necessarily represent the views of Dreyfus or any other person in the Dreyfus organization.Any such views are subject to change at any time based upon market or other conditions and Dreyfus disclaims any responsibility to update such views. These views may not be relied on as investment advice and, because investment decisions for a Dreyfus portfolio are based on numerous factors, may not be relied on as an indication of trading intent on behalf of any Dreyfus portfolio.
Not FDIC-Insured • Not Bank-Guaranteed • May Lose Value
| | | Contents |
| |
| | | T H E P O R T F O L I O |
| |
|
| 2 | | Letter from the Chairman |
| 3 | | Notice of Portfolio Manager Appointments |
| 5 | | Understanding Your Portfolio's Expenses |
| 5 | | Comparing Your Portfolio's Expenses |
| | | With Those of Other Funds |
| 6 | | Statement of Investments |
| 10 | | Statement of Assets and Liabilities |
| 11 | | Statement of Operations |
| 12 | | Statement of Changes in Net Assets |
| 13 | | Financial Highlights |
| 15 | | Notes to Financial Statements |
| 23 | | Information About the Review |
| | | and Approval of the Portfolio's |
| Investment Advisory Agreement |
| | | F O R M O R E I N F O R M AT I O N |
| |
|
| | | Back Cover |
| Dreyfus Variable Investment Fund, |
| Developing Leaders Portfolio |
The Portfolio

LETTER FROM THE CHAIRMAN
Dear Shareholder:
We are pleased to present this semiannual report for Dreyfus Variable Investment Fund, Developing Leaders Portfolio, covering the six-month period from January 1, 2005, through June 30, 2005. Inside, you'll find information about the portfolio's new management team. At the end of the reporting period, John S. Cone, Oliver Buckley, Langton C. Garvin and Kristin Crawford, each of whom is a member of the Smallcap Team of Franklin Portfolio Associates, LLC, were appointed to manage the portfolio.
On average, U.S. stock prices ended the first half of 2005 slightly lower than where they began, largely due to head winds caused by higher energy prices, rising short-term interest rates and recent evidence of slower economic growth. While midcap stocks generally produced higher returns than large-cap stocks, and large-cap stocks generally outperformed small-cap stocks, these differences were relatively small. Conversely, value-oriented stocks continued to produce substantially better results than their more growth-oriented counterparts.
In some ways, market conditions at midyear remind us of those from one year ago, when stock prices languished due to economic and political concerns before rallying strongly later in the year. Currently, our economists expect the U.S. economy to continue to grow over the foreseeable future without significant new inflationary pressures, potentially setting the stage for better business conditions that could send stock prices higher.As always, we encourage you to discuss these and other matters with your financial advisor.
Thank you for your continued confidence and support.
Sincerely,

| | Stephen E. Canter
Chairman and Chief Executive Officer
The Dreyfus Corporation
July 15, 2005
|
2

NOTICE OF PORTFOLIO MANAGER APPOINTMENTS
For the six-month period ended June 30, 2005, the portfolio produced total returns of 0.02% for its Initial shares and –0.10% for its Service shares.1 In comparison, the Russell 2000 Index (the "Index"), the portfolio's benchmark, produced a total return of –1.25% for the same period.2
Effective June 30, 2005, Franklin Portfolio Associates' Smallcap Team was appointed to make investment decisions for the portfolio. The committee of portfolio managers that comprise the Smallcap Team of Franklin Portfolio Associates are John S. Cone, Oliver Buckley, Langton C. Garvin and Kristin Crawford, each of whom also is an employee of Dreyfus and will manage the portfolio in that capacity for Dreyfus. Mr. Cone also is Chief Executive Officer, President and a Senior Portfolio Manager of Franklin Portfolio Associates where he has been employed since its inception in 1982. Mr. Buckley also is a Senior Vice President and Senior Portfolio Manager of Franklin Portfolio Associates which he joined in 2000. Mr. Garvin also is a Senior Vice President and Senior Portfolio Manager of Franklin Portfolio Associates which he joined in 2004; prior thereto, he was a portfolio manager with Batterymarch Financial Management. Ms. Crawford also is a Vice President and Portfolio Manager of Franklin Portfolio Associates, which she joined in 2000.
Following the appointment of the team, the portfolio now employs a new investment process under which the portfolio managers select stocks through a "bottom-up" approach that seeks to identify undervalued securities using a quantitative screening process.This process is driven by computer models that identify and rank stocks based on:
- fundamental momentum, meaning measures that reflect the changes in short-term earnings outlook through factors such as revised earn- ings estimates and earnings surprises;
- relative value, such as current and forecasted price-to-earnings ratios, price-to-book ratios, yields and other price-sensitive data for a stock compared to its past, its peers and the models' overall stock universe;
The Portfolio 3
NOTICE OF PORTFOLIO MANAGER APPOINTMENTS (continued)
- long-term growth, based on measures that reflect the changes in estimated long-term earnings growth over multiple horizons; and
- additional factors, such as technical factors, trading by company insiders or share issuance/buy-back data.
Next, through a "bottom-up" approach, the portfolio managers focus on stock selection as opposed to making proactive decisions about industry or sector exposure. Over time, the portfolio managers attempt to construct a portfolio whose exposure to industries and market capitalizations is generally similar to the portfolio's benchmark. Finally, within each sector, the portfolio managers seek to overweight the most attractive stocks and underweight or not hold the stocks that have been ranked least attractive.
July 15, 2005
| | | The portfolio is only available as a funding vehicle under various life insurance policies or variable |
| | | annuity contracts issued by insurance companies. Individuals may not purchase shares of the |
| | | portfolio directly. A variable annuity is an insurance contract issued by an insurance company that |
| | | enables investors to accumulate assets on a tax-deferred basis for retirement or other long-term |
| | | goals.The investment objective and policies of Dreyfus Variable Investment Fund, Developing |
| | | Leaders Portfolio made available through insurance products may be similar to other funds/ |
| | | portfolios managed or advised by Dreyfus. However, the investment results of the portfolio may be |
| | | higher or lower than, and may not be comparable to, those of any other Dreyfus fund/portfolio. |
| 1 | | Total return includes reinvestment of dividends and any capital gains paid. Past performance is no |
| | | guarantee of future results. Share price and investment return fluctuate such that upon redemption, |
| | | portfolio shares may be worth more or less than their original cost.The portfolio's performance does |
| | | not reflect the deduction of additional charges and expenses imposed in connection with investing |
| | | in variable insurance contracts, which will reduce returns. |
| | | Part of the portfolio's recent performance is attributable to positive returns from its initial |
| | | public offering (IPO) investments. There can be no guarantee that IPOs will have or |
| | | continue to have a positive effect on portfolio performance. |
| 2 | | SOURCE: LIPPER INC. — Reflects reinvestment of dividends and, where applicable, capital |
| | | gain distributions.The Russell 2000 Index is an unmanaged index of small-cap stock |
| | | performance and is composed of the 2,000 smallest companies in the Russell 3000 Index.The |
| | | Russell 3000 Index is composed of the 3,000 largest U.S. companies based on total market |
| | | capitalization. |
UNDERSTANDING YOUR
PORTFOLIO'S EXPENSES (Unaudited)
|
As a mutual fund investor, you pay ongoing expenses, such as management fees and other expenses. Using the information below, you can estimate how these expenses affect your investment and compare them with the expenses of other funds.You also may pay one-time transaction expenses, including sales charges (loads) and redemption fees, which are not shown in this section and would have resulted in higher total expenses. For more information, see your portfolio's prospectus or talk to your financial adviser.
Review your portfolio's expenses
The table below shows the expenses you would have paid on a $1,000 investment in Dreyfus Variable Investment Fund, Developing Leaders Portfolio from January 1, 2005 to June 30, 2005. It also shows how much a $1,000 investment would be worth at the close of the period, assuming actual returns and expenses.
| Expenses and Value of a $1,000 Investment | | | | |
| assuming actual returns for the six months ended June 30, 2005 | | | | |
| | | Initial Shares | | Service Shares |
| |
| |
|
| Expenses paid per $1,000 † | | $ 4.07 | | $ | | 5.30 |
| Ending value (after expenses) | | $1,000.20 | | $ | | 999.00 |
COMPARING YOUR PORTFOLIO'S EXPENSES
WITH THOSE OF OTHER FUNDS (Unaudited)
|
Using the SEC's method to compare expenses
The Securities and Exchange Commission (SEC) has established guidelines to help investors assess fund expenses. Per these guidelines, the table below shows your portfolio's expenses based on a $1,000 investment, assuming a hypothetical 5% annualized return. You can use this information to compare the ongoing expenses (but not transaction expenses or total cost) of investing in the portfolio with those of other funds. All mutual fund shareholder reports will provide this information to help you make this comparison. Please note that you cannot use this information to estimate your actual ending account balance and expenses paid during the period.
| Expenses and Value of a $1,000 Investment | | |
| assuming a hypothetical 5% annualized return for the six months ended June 30, 2005 |
| | | Initial Shares | | Service Shares |
| |
| |
|
| Expenses paid per $1,000 † | | $ 4.11 | | $ 5.36 |
| Ending value (after expenses) | | $1,020.73 | | $1,019.49 |
† Expenses are equal to the portfolio's annualized expense ratio of .82% for Initial shares and 1.07% for Service shares, multiplied by the average account value over the period, multiplied by 181/365 (to reflect the one-half year period).
The Portfolio 5
STATEMENT OF INVESTMENTS
June 30, 2005 (Unaudited)
|
| Common Stocks—93.8% | | Shares | | Value ($) |
| |
| |
|
| Autos & Transports—4.3% | | | | |
| Kansas City Southern | | 500,000 a,b | | 10,090,000 |
| SkyWest | | 554,500 | | 10,080,810 |
| Wabtec | | 610,000 | | 13,102,800 |
| | | | | 33,273,610 |
| Consumer—16.9% | | | | |
| Aeropostale | | 375,000 a | | 12,600,000 |
| Emmis Communications, Cl. A | | 91,097 a,b | | 1,609,684 |
| Finish Line, Cl. A | | 500,000 | | 9,460,000 |
| Intrawest | | 495,000 | | 11,919,600 |
| PETCO Animal Supplies | | 250,000 a | | 7,330,000 |
| Pacific Sunwear of California | | 490,000 a | | 11,265,100 |
| Performance Food Group | | 285,500 a | | 8,624,955 |
| Pinnacle Entertainment | | 400,000 a | | 7,824,000 |
| Ralcorp Holdings | | 125,000 a | | 5,143,750 |
| Talbots | | 300,000 | | 9,741,000 |
| United Natural Foods | | 365,000 a | | 11,085,050 |
| Valassis Communications | | 275,000 a | | 10,188,750 |
| WMS Industries | | 340,000 a,b | | 11,475,000 |
| Warnaco Group | | 532,000 a | | 12,369,000 |
| | | | | 130,635,889 |
| Energy—7.7% | | | | |
| Atwood Oceanics | | 150,000 a | | 9,234,000 |
| Cabot Oil & Gas | | 383,250 | | 13,298,775 |
| Denbury Resources | | 363,000 a | | 14,436,510 |
| TGS Nopec Geophysical | | 449,300 a | | 12,063,544 |
| W-H Energy Services | | 400,000 a | | 9,972,000 |
| | | | | 59,004,829 |
| Financial Services—18.4% | | | | |
| Amegy Bancorp | | 550,000 | | 12,309,000 |
| Arch Capital Group | | 240,000 a | | 10,812,000 |
| BankAtlantic Bancorp, Cl. A | | 600,000 | | 11,370,000 |
| Boston Private Financial Holdings | | 370,000 | | 9,324,000 |
| Cullen/Frost Bankers | | 205,000 | | 9,768,250 |
| Common Stocks (continued) | | Shares | | Value ($) |
| |
| |
|
| Financial Services (continued) | | | | |
| East West Bancorp | | 269,500 | | 9,052,505 |
| First Midwest Bancorp | | 330,000 | | 11,606,100 |
| Global Payments | | 169,000 | | 11,458,200 |
| MAF Bancorp | | 225,000 | | 9,591,750 |
| Montpelier Re Holdings | | 267,500 | | 9,250,150 |
| OMEGA Healthcare Investors | | 925,000 | | 11,895,500 |
| Saxon Capital | | 360,000 | | 6,145,200 |
| Texas Regional Bancshares, Cl. A | | 345,000 | | 10,515,600 |
| Wintrust Financial | | 175,000 b | | 9,161,250 |
| | | | | 142,259,505 |
| Health Care—12.8% | | | | |
| Alexion Pharmaceuticals | | 325,000 a | | 7,488,000 |
| Apria Healthcare Group | | 395,500 a | | 13,700,120 |
| Genesis HealthCare | | 300,000 a | | 13,884,000 |
| IDX Systems | | 350,000 a | | 10,549,000 |
| Impax Laboratories | | 600,000 a,b | | 9,420,000 |
| Magellan Health Services | | 275,000 a | | 9,710,250 |
| NDCHealth | | 235,000 | | 4,222,950 |
| Renal Care Group | | 289,500 a | | 13,345,950 |
| Syneron Medical | | 250,000 a,b | | 9,147,500 |
| Taro Pharmaceutical Industries | | 262,500 a | | 7,630,875 |
| | | | | 99,098,645 |
| Materials & Processing—8.0% | | | | |
| Agnico-Eagle Mines | | 825,000 | | 10,395,000 |
| Agrium | | 565,500 | | 11,089,455 |
| Armor Holdings | | 250,000 a | | 9,902,500 |
| Chesapeake | | 375,000 | | 7,852,500 |
| Goldcorp�� | | 675,000 | | 10,651,500 |
| GrafTech International | | 1,000,000 a | | 4,300,000 |
| Olin | | 400,000 | | 7,296,000 |
| | | | | 61,486,955 |
| Producer Durables—9.3% | | | | |
| AGCO | | 500,000 a | | 9,560,000 |
| Actuant, Cl. A | | 210,000 a,b | | 10,067,400 |
The Portfolio 7
STATEMENT OF INVESTMENTS (Unaudited) (continued)
| Common Stocks (continued) | | Shares | | Value ($) |
| |
| |
|
| Producer Durables (continued) | | | | |
| Albany International, Cl. A | | 270,000 | | 8,669,700 |
| Gardner Denver | | 205,400 a | | 7,205,432 |
| Ritchie Bros. Auctioneers | | 355,000 | | 13,685,250 |
| Triumph Group | | 298,000 a | | 10,358,480 |
| WESCO International | | 400,000 a | | 12,552,000 |
| | | | | 72,098,262 |
| Technology—11.0% | | | | |
| CACI International, Cl. A | | 150,000 a | | 9,474,000 |
| Exar | | 690,000 a | | 10,274,100 |
| Hutchinson Technology | | 225,000 a | | 8,664,750 |
| Hyperion Solutions | | 190,000 a | | 7,645,600 |
| InfoSpace | | 182,000 a,b | | 5,993,260 |
| Integrated Circuit Systems | | 325,000 a | | 6,708,000 |
| Integrated Device Technology | | 785,000 a | | 8,438,750 |
| Power Integrations | | 385,000 a | | 8,304,450 |
| Quest Software | | 635,500 a | | 8,661,865 |
| Varian Semiconductor Equipment Associates | | 289,000 a | | 10,693,000 |
| | | | | 84,857,775 |
| Utilities & Other—5.4% | | | | |
| Arch Coal | | 230,000 b | | 12,528,100 |
| OGE Energy | | 295,000 | | 8,537,300 |
| UIL Holdings | | 200,000 | | 10,762,000 |
| Vectren | | 335,000 | | 9,624,550 |
| | | | | 41,451,950 |
| Total Common Stocks | | | | |
| (cost $589,064,712) | | | | 724,167,420 |
| |
| |
|
| |
| Other Investment—6.2% | | | | |
| |
| |
|
| Registered Investment Company; | | | | |
| Dreyfus Institutional Preferred Plus Money Market Fund | | |
| (cost $47,665,000) | | 47,665,000 c | | 47,665,000 |
| Investment of Cash Collateral | | | | |
| for Securities Loaned—5.4% | | Shares | | Value ($) |
| |
| |
|
| Registered Investment Company; | | | | |
| Dreyfus Institutional Cash Advantage Fund | | | | |
| (cost $41,375,741) | | 41,375,741 c | | 41,375,741 |
| |
| |
|
| Total Investments (cost $678,105,453) | | 105.4% | | 813,208,161 |
| Liabilities, Less Cash and Receivables | | (5.4%) | | (41,645,356) |
| Net Assets | | 100.0% | | 771,562,805 |
| a Non-income producing. |
| b All or a portion of these securities are on loan. At June 30, 2005, the total market value of the portfolio's securities |
| on loan is $39,489,868 and the total market value of the collateral held by the portfolio is $41,375,741. |
| c Investments in affiliated money market mutual funds. |
| Portfolio Summary (Unaudited) † | | | | |
| |
| | | Value (%) | | | | Value (%) |
| |
| |
| |
|
| Financial Services | | 18.4 | | Materials & Processing | | 8.0 |
| Consumer | | 16.9 | | Energy | | 7.7 |
| Health Care | | 12.8 | | Utilities & Other | | 5.4 |
| Money Market Investments | | 11.6 | | Autos & Transports | | 4.3 |
| Technology | | 11.0 | | | | |
| Producer Durables | | 9.3 | | | | 105.4 |
† Based on net assets.
See notes to financial statements.
|
The Portfolio 9
| | STATEMENT OF ASSETS AND LIABILITIES
June 30, 2005 (Unaudited)
|
| | | Cost | | Value |
| |
| |
|
| Assets ($): | | | | |
| Investments in securities— | | | | |
| See Statement of Investments (including securities | | |
| on loan, valued at $39,489,868)—Note 1(c): | | |
| Unaffiliated issuers | | 589,064,712 | | 724,167,420 |
| Affiliated issuers | | 89,040,741 | | 89,040,741 |
| Cash | | | | 41,338 |
| Dividends and interest receivable | | | | 619,262 |
| Receivable for shares of Beneficial Interest subscribed | | 1,751 |
| Prepaid expenses | | | | 16,505 |
| | | | | 813,887,017 |
| |
| |
|
| Liabilities ($): | | | | |
| Due to The Dreyfus Corporation and affiliates—Note 3(b) | | 494,211 |
| Liability for securities on loan—Note 1(c) | | 41,375,741 |
| Payable for shares of Beneficial Interest redeemed | | 371,643 |
| Accrued expenses | | | | 82,617 |
| | | | | 42,324,212 |
| |
| |
|
| Net Assets ($) | | | | 771,562,805 |
| |
| |
|
| Composition of Net Assets ($): | | | | |
| Paid-in capital | | | | 655,917,443 |
| Accumulated undistributed investment income—net | | 2,421,028 |
| Accumulated net realized gain (loss) on investments | | (21,878,374) |
| Accumulated net unrealized appreciation | | |
| (depreciation) on investments | | | | 135,102,708 |
| |
| |
|
| Net Assets ($) | | | | 771,562,805 |
| Net Asset Value Per Share | | | | |
| | | Initial Shares | | Service Shares |
| |
| |
|
| Net Assets ($) | | 749,563,237 | | 21,999,568 |
| Shares Outstanding | | 18,036,151 | | 534,168 |
| |
| |
|
| Net Asset Value Per Share ($) | | 41.56 | | 41.18 |
See notes to financial statements.
10
STATEMENT OF OPERATIONS
Six Months Ended June 30, 2005 (Unaudited)
|
| Investment Income ($): | | |
| Income: | | |
| Cash dividends (net of $30,791 foreign taxes withheld at source): | | |
| Unaffiliated issuers | | 4,448,974 |
| Affiliated issuers | | 533,943 |
| Income from securities lending | | 62,317 |
| Total Income | | 5,045,234 |
| Expenses: | | |
| Investment advisory fee—Note 3(a) | | 2,855,842 |
| Prospectus and shareholders' reports | | 131,366 |
| Professional fees | | 34,608 |
| Trustees' fees and expenses—Note 3(c) | | 31,643 |
| Custodian fees—Note 3(b) | | 29,814 |
| Distribution fees—Note 3(b) | | 26,571 |
| Shareholder servicing costs—Note 3(b) | | 9,701 |
| Loan commitment fees—Note 2 | | 2,248 |
| Miscellaneous | | 11,163 |
| Total Expenses | | 3,132,956 |
| Investment Income—Net | | 1,912,278 |
| |
|
| Realized and Unrealized Gain (Loss) on Investments—Note 4 ($): |
| Net realized gain (loss) on investments | | 35,477,559 |
| Net unrealized appreciation (depreciation) on investments | | (38,443,109) |
| Net Realized and Unrealized Gain (Loss) on Investments | | (2,965,550) |
| Net (Decrease) in Net Assets Resulting from Operations | | (1,053,272) |
See notes to financial statements.
The Portfolio 11
STATEMENT OF CHANGES IN NET ASSETS
| | | Six Months Ended | | |
| | | June 30, 2005 | | Year Ended |
| | | (Unaudited) | | December 31, 2004 |
| |
| |
|
| Operations ($): | | | | |
| Investment income—net | | 1,912,278 | | 1,529,543 |
| Net realized gain (loss) on investments | | 35,477,559 | | 48,901,062 |
| Net unrealized appreciation | | | | |
| (depreciation) on investments | | (38,443,109) | | 33,039,125 |
| Net Increase (Decrease) in Net Assets | | | | |
| Resulting from Operations | | (1,053,272) | | 83,469,730 |
| |
| |
|
| Dividends to Shareholders from ($): | | | | |
| Investment income—net: | | | | |
| Initial shares | | — | | (1,506,023) |
| |
| |
|
| Beneficial Interest Transactions ($): | | | | |
| Net proceeds from shares sold: | | | | |
| Initial shares | | 20,705,278 | | 58,479,227 |
| Service shares | | 1,335,172 | | 7,722,696 |
| Dividends reinvested: | | | | |
| Initial shares | | — | | 1,506,023 |
| Cost of shares redeemed: | | | | |
| Initial shares | | (59,042,360) | | (95,845,376) |
| Service shares | | (1,386,036) | | (5,211,288) |
| Increase (Decrease) in Net Assets from | | | | |
| Beneficial Interest Transactions | | (38,387,946) | | (33,348,718) |
| Total Increase (Decrease) in Net Assets | | (39,441,218) | | 48,614,989 |
| |
| |
|
| Net Assets ($): | | | | |
| Beginning of Period | | 811,004,023 | | 762,389,034 |
| End of Period | | 771,562,805 | | 811,004,023 |
| Undistributed investment income—net | | 2,421,028 | | 508,750 |
| |
| |
|
| Capital Share Transactions (Shares): | | | | |
| Initial Shares | | | | |
| Shares sold | | 516,301 | | 1,499,986 |
| Shares issued for dividends reinvested | | — | | 36,750 |
| Shares redeemed | | (1,469,218) | | (2,467,053) |
| Net Increase (Decrease) in Shares Outstanding | | (952,917) | | (930,317) |
| |
| |
|
| Service Shares | | | | |
| Shares sold | | 33,494 | | 199,242 |
| Shares redeemed | | (34,483) | | (136,149) |
| Net Increase (Decrease) in Shares Outstanding | | (989) | | 63,093 |
See notes to financial statements.
FINANCIAL HIGHLIGHTS
The following tables describe the performance for each share class for the fiscal periods indicated. All information (except portfolio turnover rate) reflects financial results for a single portfolio share.Total return shows how much your investment in the portfolio would have increased (or decreased) during each period, assuming you had reinvested all dividends and distributions.These figures have been derived from the portfolio's financial statements.

| a | | Based on average shares outstanding at each month end. |
| b | | Not annualized. |
| See notes to financial statements. |
The Portfolio 13
FINANCIAL HIGHLIGHTS (continued)
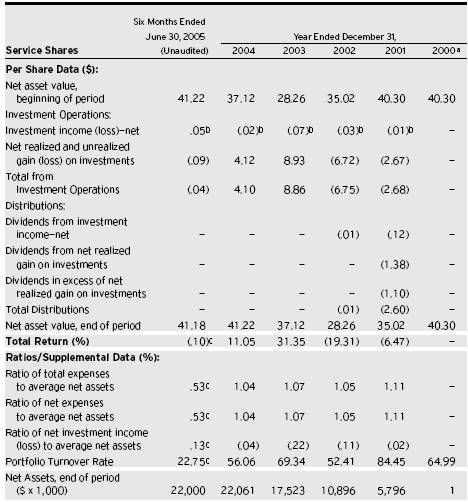
| a | | The portfolio commenced offering Service shares on December 31, 2000. |
| b | | Based on average shares outstanding at each month end. |
| c | | Not annualized. |
| See notes to financial statements. |
14
NOTES TO FINANCIAL STATEMENTS (Unaudited)
NOTE 1—Significant Accounting Policies:
Dreyfus Variable Investment Fund (the "fund") is registered under the Investment Company Act of 1940, as amended (the "Act"), as an open-end management investment company, operating as a series company currently offering twelve series, including the Developing Leaders Portfolio (the "portfolio"). The portfolio is only offered to separate accounts established by insurance companies to fund variable annuity contracts and variable life insurance policies.The portfolio is a diversified series. The portfolio's investment objective is capital growth.The Dreyfus Corporation (the "Manager" or "Dreyfus") serves as the portfolio's investment adviser.The Manager is a wholly-owned subsidiary of Mellon Financial Corporation ("Mellon Financial").
Dreyfus Service Corporation (the "Distributor"), a wholly-owned subsidiary of the Manager, is the distributor of the portfolio's shares, which are sold without a sales charge. The portfolio is authorized to issue an unlimited number of $.001 par value shares of Beneficial Interest in the following classes of shares: Initial and Service. Each class of shares has identical rights and privileges, except with respect to the distribution plan and the expenses borne by each class and certain voting rights. Income, expenses (other than expenses attributable to a specific class), and realized and unrealized gains or losses on investments are allocated to each class of shares based on its relative net assets.
The fund accounts separately for the assets, liabilities and operations of each series. Expenses directly attributable to each series are charged to that series' operations; expenses which are applicable to all series are allocated among them on a pro rata basis.
The portfolio's financial statements are prepared in accordance with U.S. generally accepted accounting principles, which may require the use of management estimates and assumptions. Actual results could differ from those estimates.
The Portfolio 15
NOTES TO FINANCIAL STATEMENTS (Unaudited) (continued)
The fund enters into contracts that contain a variety of indemnifica-tions.The portfolio's maximum exposure under these arrangements is unknown. The portfolio does not anticipate recognizing any loss related to these arrangements.
(a) Portfolio valuation: Investments in securities are valued at the last sales price on the securities exchange or national securities market on which such securities are primarily traded. Securities listed on the National Market System for which market quotations are available are valued at the official closing price or, if there is no official closing price that day, at the last sale price. Securities not listed on an exchange or the national securities market, or securities for which there were no transactions, are valued at the average of the most recent bid and asked prices, except for open short positions, where the asked price is used for valuation purposes. Bid price is used when no asked price is available. Investments in registered investment companies are valued at their net asset value. Investments in registered investment companies are valued at their net asset value.When market quotations or official closing prices are not readily available, or are determined not to reflect accurately fair value, such as when the value of a security has been significantly affected by events after the close of the exchange or market on which the security is principally traded (for example, a foreign exchange or market), but before the portfolio calculates its net asset value, the portfolio may value these investments at fair value as determined in accordance with the procedures approved by the Board of Trustees. Fair valuing of securities may be determined with the assistance of a pricing service using calculations based on indices of domestic securities and other appropriate indicators, such as prices of relevant ADR's and futures contracts. For other securities that are fair valued by the Board of Trustees, certain factors may be considered such as: fundamental analytical data, the nature and duration of restrictions on disposition, an evaluation of the forces that influence the market in which the securities are purchased and sold, and public trading in sim-
16
ilar securities of the issuer or comparable issuers. Financial futures are valued at the last sales price. Investments denominated in foreign currencies are translated to U.S. dollars at the prevailing rates of exchange. Forward currency exchange contracts are valued at the forward rate.
(b) Foreign currency transactions: The portfolio does not isolate that portion of the results of operations resulting from changes in foreign exchange rates on investments from the fluctuations arising from changes in market prices of securities held. Such fluctuations are included with the net realized and unrealized gain or loss on investments.
Net realized foreign exchange gains or losses arise from sales and maturities of short-term securities, sales of foreign currencies, currency gains or losses realized on securities transactions and the difference between the amounts of dividends, interest and foreign withholding taxes recorded on the portfolio's books and the U.S. dollar equivalent of the amounts actually received or paid. Net unrealized foreign exchange gains or losses arise from changes in the value of assets and liabilities other than investments in securities resulting from changes in exchange rates. Such gains and losses are included with net realized and unrealized gain or loss on investments.
(c) Securities transactions and investment income: Securities transactions are recorded on a trade date basis. Realized gain and loss from securities transactions are recorded on the identified cost basis. Dividend income is recognized on the ex-dividend date and interest income, including, where applicable, accretion of discount and amortization of premium on investments, is recognized on the accrual basis.
The portfolio has an arrangement with the custodian bank whereby the portfolio receives earnings credits from the custodian when positive cash balances are maintained, which are used to offset custody fees. For financial reporting purposes, the portfolio includes net earnings credits, if any, as an expense offset in the Statement of Operations.
The Portfolio 17
NOTES TO FINANCIAL STATEMENTS (Unaudited) (continued)
Pursuant to a securities lending agreement with Mellon Bank, N.A., an affiliate of the Manager, the portfolio may lend securities to qualified institutions.At origination, all loans are secured by collateral of at least 102% of the value of U.S. securities loaned and 105% of the value of foreign securities loaned. Collateral equivalent to at least 100% of the market value of securities on loan will be maintained at all times. Cash collateral is invested in certain money market mutual funds managed by the Manager. The portfolio will be entitled to receive all income on securities loaned, in addition to income earned as a result of the lending transaction. Although each security loaned is fully collateralized, the portfolio would bear the risk of delay in recovery of, or loss of rights in, the securities loaned should a borrower fail to return the securities in a timely manner.
(d) Affiliated issuers: Investments in other investment companies advised by the Manager are defined as "affiliated" in the Act.
(e) Dividends to shareholders: Dividends are recorded on the ex-dividend date. Dividends from investment income-net and dividends from net realized capital gain, if any, are normally declared and paid annually, but the portfolio may make distributions on a more frequent basis to comply with the distribution requirements of the Internal Revenue Code of 1986, as amended (the "Code").To the extent that net realized capital gain can be offset by capital loss carryovers, it is the policy of the portfolio not to distribute such gain. Income and capital gain distributions are determined in accordance with income tax regulations, which may differ from U.S. generally accepted accounting principles.
(f) Federal income taxes: It is the policy of the portfolio to continue to qualify as a regulated investment company, if such qualification is in the best interests of its shareholders, by complying with the applicable provisions of the Code, and to make distributions of taxable income sufficient to relieve it from substantially all federal income and excise taxes.
18
The portfolio has an unused capital loss carryover of $54,226,304 available for federal income tax purposes to be applied against future net securities profits, if any, realized subsequent to December 31, 2004. If not applied, $35,667,011 of the carryover expires in fiscal 2010 and $18,559,293 expires in fiscal 2011.
The tax character of distributions paid to shareholders during the fiscal year ended December 31, 2004 was as follows: ordinary income $1,506,023.The tax character of current year distributions, if any, will be determined at the end of the current fiscal year.
NOTE 2—Bank Line of Credit:
The portfolio participates with other Dreyfus-managed funds in a $350 million redemption credit facility (the "Facility") to be utilized for temporary or emergency purposes, including the financing of redemptions. In connection therewith, the portfolio has agreed to pay commitment fees on its pro rata portion of the Facility. Interest is charged to the portfolio based on prevailing market rates in effect at the time of borrowings. During the period ended June 30, 2005, the portfolio did not borrow under the Facility.
| | NOTE 3—Investment Advisory Fee and Other Transactions
With Affiliates:
|
(a) Pursuant to an Investment Advisory Agreement with the Manager, the investment advisory fee is computed at the annual rate of .75 of 1% of the value of the portfolio's average daily net assets and is payable monthly.
(b) Under the Distribution Plan (the "Plan") adopted pursuant to Rule 12b-1 under the Act, Service shares pay the Distributor for distributing their shares, for servicing and/or maintaining Service shares shareholder accounts and for advertising and marketing for Service
The Portfolio 19
NOTES TO FINANCIAL STATEMENTS (Unaudited) (continued)
shares.The Plan provides for payments to be made at an annual rate of .25 of 1% of the value of the Service shares' average daily net assets. The Distributor may make payments to Participating Insurance Companies and to brokers and dealers acting as principal underwriter for their variable insurance products.The fees payable under the Plan are payable without regard to actual expenses incurred. During the period ended June 30, 2005, Service shares were charged $26,571 pursuant to the Plan.
The portfolio compensates Dreyfus Transfer, Inc., a wholly-owned subsidiary of the Manager, under a transfer agency agreement for providing personnel and facilities to perform transfer agency services for the portfolio. During the period ended June 30, 2005, the portfolio was charged $446 pursuant to the transfer agency agreement.
The portfolio compensates Mellon Bank, N.A., an affiliate of the Manager, under a custody agreement for providing custodial services for the portfolio. During the period ended June 30, 2005, the portfolio was charged $29,814 pursuant to the custody agreement.
During the period ended June 30, 2005, the portfolio was charged $1,998 for services performed by the Chief Compliance Officer.
The components of Due to The Dreyfus Corporation and affiliates in the Statement of Assets and Liabilities consist of: investment advisory fees $474,234, Rule 12b-1 distribution plan fees $4,485, custodian fees $13,341, chief compliance officer fees $1,998 and transfer agency per account fees $153.
(c) Each Board member also serves as a Board member of other funds within the Dreyfus complex. Annual retainer fees and attendance fees are allocated to each fund based on net assets.
(d) Pursuant to an exemptive order from the Securities and Exchange Commission, the portfolio invests its available cash balances in affiliated money market mutual funds. Management fees of the underlying money market mutual funds have been waived by the Manager.
20
NOTE 4—Securities Transactions:
The aggregate amount of purchases and sales of investment securities, excluding short-term securities, during the period ended June 30, 2005, amounted to $166,362,277 and $213,926,580, respectively.
At June 30, 2005, accumulated net unrealized appreciation on investments was $135,102,708, consisting of $159,843,639 gross unrealized appreciation and $24,740,931 gross unrealized depreciation.
At June 30,2005,the cost of investments for federal income tax purposes was substantially the same as the cost for financial reporting purposes (see the Statement of Investments).
NOTE 5—Legal Matters:
In early 2004, two purported class and derivative actions were filed against Mellon Financial, Mellon Bank, N.A., Dreyfus, Founders Asset Management LLC, and certain directors of the Dreyfus Funds and the Dreyfus Founders Funds (together, the "Funds") in the United States District Court for the Western District of Pennsylvania. In September 2004, plaintiffs served a Consolidated Amended Complaint (the "Amended Complaint") on behalf of a purported class of all persons who acquired interests in any of the Funds between January 30, 1999 and November 17, 2003, and derivatively on behalf of the Funds.The Amended Complaint in the newly styled In re Dreyfus Mutual Funds Fee Litigation also named the Distributor, Premier Mutual Fund Services, Inc. and two additional Fund directors as defendants and alleges violations of the Investment Company Act of 1940, the Investment Advisers Act of 1940, the Pennsylvania Unfair Trade Practices and Consumer Protection Law and common-law claims. Plaintiffs seek to recover allegedly improper and excessive Rule 12b-1 and advisory fees allegedly charged to the Funds for marketing and distribution services. More specifically, plaintiffs claim, among other things, that 12b-1 fees and directed brokerage were improperly used to
The Portfolio 21
NOTES TO FINANCIAL STATEMENTS (Unaudited) (continued)
pay brokers to recommend the Funds over other funds, and that such payments were not disclosed to investors. In addition, plaintiffs assert that economies of scale and soft-dollar benefits were not passed on to the Funds. Plaintiffs further allege that 12b-1 fees were improperly charged to certain of the Funds that were closed to new investors.The Amended Complaint seeks compensatory and punitive damages, rescission of the advisory contracts, and an accounting and restitution of any unlawful fees, as well as an award of attorneys' fees and litigation expenses. As noted, some of the claims in this litigation are asserted derivatively on behalf of the Funds that have been named as nominal defendants. With respect to such derivative claims, no relief is sought against the Funds. Dreyfus believes the allegations to be totally without merit and intends to defend the action vigorously. In November 2004, all named defendants moved to dismiss the Amended Complaint in whole or substantial part. Briefing was completed in May 2005.
Additional lawsuits arising out of these circumstances and presenting similar allegations and requests for relief may be filed against the defendants in the future. Neither Dreyfus nor the Funds believe that any of the pending actions will have a material adverse effect on the Funds or Dreyfus' ability to perform its contract with the Funds.
22
INFORMATION ABOUT THE REVIEW
AND APPROVAL OF THE PORTFOLIO'S
INVESTMENT ADVISORY AGREEMENT (Unaudited)
|
At separate meetings of the Board of Trustees for the fund held on June 8-9, 2005, the Board considered the re-approval, through its annual renewal date of July 31, 2006, of the Investment Advisory Agreement with the Manager for the portfolio, pursuant to which the Manager provides the portfolio with investment advisory and administrative ser-vices.The Board members who are not "interested persons" (as defined in the Act (the "Independent Trustees")) of the fund were assisted in their review by independent legal counsel and met with counsel in executive session separate from representatives of the Manager.
Analysis of Nature, Extent and Quality of Services Provided to the Portfolio. The Board members received a presentation from representatives of the Manager regarding services provided to the portfolio and other funds in the Dreyfus fund complex, and discussed the nature, extent and quality of the services provided to the portfolio pursuant to its Investment Advisory Agreement. The Manager's representatives reviewed the portfolio's distribution of accounts and the relationships the Manager has with various intermediaries and the different needs of each.The Board noted that the portfolio's shares were offered only to separate accounts established by insurance companies to fund variable annuity contracts and variable life insurance policies. The Manager's representatives noted the diversity of distribution among the funds in the Dreyfus complex, and the Manager's corresponding need for broad, deep, and diverse resources to be able to provide ongoing shareholder services to each distribution channel, including that of the portfolio. The Board also reviewed the number of shareholder accounts in the portfolio, as well as the portfolio's asset size.
The Board members also considered the Manager's research and portfolio management capabilities and that the Manager also provides oversight of day-to-day portfolio operations, including fund accounting and administration and assistance in meeting legal and regulatory requirements. The Board members also considered the Manager's extensive administrative, accounting and compliance infrastructure.
The Portfolio 23
INFORMATION ABOUT THE REVIEW AND APPROVAL OF THE PORTFOLIO'S INVESTMENT ADVISORY AGREEMENT (Unaudited) (continued)
Comparative Analysis of the Portfolio's Performance, Investment Advisory Fee and Expense Ratio. The Board members reviewed the portfolio's performance and expense ratios and placed significant emphasis on comparisons to two groups of comparable funds and Lipper category averages, as applicable.The Board reviewed the portfolio's performance, investment advisory fee, and total expense ratios within these comparison groups and against the portfolio's Lipper category averages, as applicable. The groups of comparable funds were previously approved by the Board for this purpose, and were prepared using a Board-approved selection methodology that was based, in part, on selecting non-affiliated funds reported in the same Lipper category as the portfolio.The Board members discussed the results of the comparisons and noted that the portfolio's performance was below the averages of its comparison groups and Lipper category, but that the portfolio's more recent 3-month and 4-month performance showed an improvement in its Initial shares comparison group and Lipper category rankings.They noted that the portfolio outperformed its benchmark in 5 of the previous 10 calendar years.The Board members noted that the portfolio's management team would change on or about June 30, 2005. The Board members also discussed the portfolio's expense ratio for each class of shares, noting it is lower than the average of its respective comparison group, and that it ranks in the top half of its respective comparison group.They reviewed the range of management fees in the comparison groups and noted that the portfolio's investment advisory fee is in the top half (i.e., lower than most of the others) of the comparison groups.
Representatives of the Manager reviewed with the Board members the fees paid to the Manager or its affiliates by mutual funds managed by the Manager or its affiliates with similar investment objectives, policies and strategies as the portfolio (the "Similar Funds"), and noted that the Manager did not manage separate accounts with investment objectives, policies and strategies similar to that of the portfolio.The Similar Funds' comparison group was composed exclusively of mutual funds affiliated with the Manager and reported in the same Lipper category as the
24
portfolio.The Manager's representatives also reviewed the costs associated with distribution through intermediaries.The Board analyzed differences in fees paid to the Manager and discussed the relationship of the advisory fees paid in light of the Manager's performance and the services provided.The Board members considered the relevance of the fee information provided for the Similar Funds managed by the Manager to evaluate the appropriateness and reasonableness of the portfolio's advisory fees.
Analysis of Profitability and Economies of Scale. The Manager's representatives reviewed the dollar amount of expenses allocated and profit received by the Manager and the method used to determine such expenses and profit. The Board received and considered information prepared by an independent consulting firm regarding Dreyfus' approach to allocating costs to, and determining the profitability of, individual funds and the entire Dreyfus mutual fund complex.The consulting firm also analyzed where any economies of scale might emerge as assets grow.The Board members evaluated the analysis in light of the relevant circumstances for the portfolio, including the decline in assets and the extent to which economies of scale would be realized as the portfolio grows and whether fee levels reflect these economies of scale for the benefit of portfolio investors.The Board members also considered potential benefits to the Manager from acting as investment adviser and noted the soft dollar arrangements with respect to trading the portfolio's portfolio.
It was noted that the Board members should consider the Manager's profitability with respect to the portfolio as part of their evaluation of whether the fee under the Investment Advisory Agreement bears a reasonable relationship to the mix of services provided by the Manager, including the nature, extent and quality of such services and that a discussion of economies of scale are predicated on increasing assets and that, if a fund's assets had been decreasing, the possibility that the Manager may have realized any economies of scale would be less.
The Portfolio 25
It also was noted that the profitability percentage for managing the portfolio was within ranges determined by appropriate court cases to be reasonable given the services rendered and, given the portfolio's overall performance and generally superior service levels provided.
At the conclusion of these discussions, each of the Independent Trustees expressed the opinion that he or she had been furnished with sufficient information to make an informed business decision with respect to continuation of the fund's Investment Advisory Agreement with respect to the portfolio. Based on their discussions and considerations as described above, the Board made the following conclusions and determinations.
- The Board concluded that the nature, extent and quality of the ser- vices provided by the Manager are adequate and appropriate.
- The Board generally was satisfied with the Manager's recent improved performance, as well as the Manager putting a new portfolio man- agement team in place to become effective on or about June 30,2005, and viewed the portfolio's outperforming its benchmark in 5 of the previous 10 calendar years as a positive.
- The Board concluded that the fee paid by the portfolio to the Manager was reasonable in light of comparative performance and expense and advisory fee information, costs of the services provided and profits to be realized and benefits derived or to be derived by the Manager from its relationship with the portfolio.
- The Board determined that, to the extent that material economies of scale had not been shared with the portfolio, the Board would seek to do so.
The Board members considered these conclusions and determinations, along with information received on a routine and regular basis throughout the year, and, without any one factor being dispositive, the Board determined that approval of the fund's Investment Advisory Agreement with respect to the portfolio was in the best interests of the portfolio and its shareholders.
26
The Portfolio 27
NOTES
| For More | | Information |
| |
|
| |
| Dreyfus Variable | | Transfer Agent & |
| Investment Fund, | | Dividend Disbursing Agent |
| Developing Leaders Portfolio |
| | | Dreyfus Transfer, Inc. |
| 200 Park Avenue | | |
| | | 200 Park Avenue |
| New York, NY 10166 | | |
| | | New York, NY 10166 |
| |
| Investment Adviser | | Distributor |
| The Dreyfus Corporation | | |
| | | Dreyfus Service Corporation |
| 200 Park Avenue | | |
| | | 200 Park Avenue |
| New York, NY 10166 | | |
| | | New York, NY 10166 |
| Custodian | | |
| Mellon Bank, N.A. | | |
| One Mellon Bank Center | | |
| Pittsburgh, PA 15258 | | |
| Telephone 1-800-554-4611 or 516-338-3300 |
| Mail | | The Dreyfus Family of Funds, 144 Glenn Curtiss Boulevard, Uniondale, NY 11556-0144 |
| | | Attn: Institutional Servicing |
The portfolio files its complete schedule of portfolio holdings with the Securities and Exchange Commission ("SEC") for the first and third quarters of each fiscal year on Form N-Q. The portfolio's Forms N-Q are available on the SEC's website at http://www.sec.gov and may be reviewed and copied at the SEC's Public Reference Room in Washington, DC. Information on the operation of the Public Reference Room may be obtained by calling 1-800-SEC-0330.
A description of the policies and procedures that the portfolio uses to determine how to vote proxies relating to portfolio securities, and information regarding how the portfolio voted these proxies for the 12-month period ended June 30, 2005, is available at http://www.dreyfus.com and on the SEC's website at http://www.sec.gov. The description of the policies and procedures is also available without charge, upon request, by calling 1-800-645-6561.
| © 2005 Dreyfus Service Corporation |
| Dreyfus Variable |
| Investment Fund, |
| Disciplined Stock |
| Portfolio |

The views expressed in this report reflect those of the portfolio manager only through the end of the period covered and do not necessarily represent the views of Dreyfus or any other person in the Dreyfus organization.Any such views are subject to change at any time based upon market or other conditions and Dreyfus disclaims any responsibility to update such views. These views may not be relied on as investment advice and, because investment decisions for a Dreyfus portfolio are based on numerous factors, may not be relied on as an indication of trading intent on behalf of any Dreyfus portfolio.
Not FDIC-Insured • Not Bank-Guaranteed • May Lose Value
| | | Contents |
| |
| | | T H E P O R T F O L I O |
| |
|
| 2 | | Letter from the Chairman |
| 3 | | Discussion of Performance |
| 6 | | Understanding Your Portfolio's Expenses |
| 6 | | Comparing Your Portfolio's Expenses |
| | | With Those of Other Funds |
| 7 | | Statement of Investments |
| 12 | | Statement of Assets and Liabilities |
| 13 | | Statement of Operations |
| 14 | | Statement of Changes in Net Assets |
| 16 | | Financial Highlights |
| 18 | | Notes to Financial Statements |
| 25 | | Information About the Review |
| and Approval of the Portfolio's |
| Investment Advisory Agreement |
| | | F O R M O R E I N F O R M AT I O N |
| |
|
| | | Back Cover |
| Dreyfus Variable Investment Fund, |
| Disciplined Stock Portfolio |
The Portfolio

LETTER FROM THE CHAIRMAN
We are pleased to present this semiannual report for Dreyfus Variable Investment Fund, Disciplined Stock Portfolio, covering the six-month period from January 1, 2005, through June 30, 2005. Inside, you'll find valuable information about how the portfolio was managed during the reporting period, including a discussion with the portfolio manager, Sean Fitzgibbon.
On average, U.S. stock prices ended the first half of 2005 slightly lower than where they began, largely due to headwinds caused by higher energy prices, rising short-term interest rates and recent evidence of slower economic growth. While midcap stocks generally produced higher returns than large-cap stocks, and large-cap stocks generally outperformed small-cap stocks, these differences were relatively small. Conversely, value-oriented stocks continued to produce substantially better results than their more growth-oriented counterparts.
In some ways, market conditions at midyear remind us of those from one year ago, when stock prices languished due to economic and political concerns before rallying strongly later in the year. Currently, our economists expect the U.S. economy to continue to grow over the foreseeable future without significant new inflationary pressures, potentially setting the stage for better business conditions that could send stock prices higher.As always, we encourage you to discuss these and other matters with your financial advisor.
Thank you for your continued confidence and support.


DISCUSSION OF PERFORMANCE
Sean P. Fitzgibbon, Portfolio Manager
How did Dreyfus Variable Investment Fund, Disciplined Stock Portfolio perform relative to its benchmark?
For the six-month period ended June 30, 2005, the portfolio achieved total returns of 0.10% for its Initial shares and 0.10% for its Service shares.1 For the same period, the total return of the Standard & Poor's 500 Composite Stock Price Index ("S&P 500 Index"), the portfolio's benchmark, was –0.81% .2
We attribute these results to a market environment in which concerns regarding rising interest rates and high energy prices offset news of continuing U.S. economic growth and generally better-than-expected corporate earnings. These conflicting pressures led stock prices through several short-term advances and declines. However, by June 30, 2005, the overall market stood at roughly the same level at which it started the reporting period.While the portfolio experienced fluctuations similar to those that affected the market, relatively good stock selections in the health care, consumer discretionary and utility sectors enabled it to produce higher returns than the S&P 500 Index.
What is the portfolio's investment approach?
The portfolio seeks investment returns (consisting of capital appreciation and income) that are consistently superior to the S&P 500 Index. The portfolio normally invests at least 80% of its assets in stocks, and focuses on stocks of large-cap companies. The portfolio invests in growth and value stocks, which are chosen through a disciplined investment process that combines computer modeling techniques, fundamental analysis and risk management.
When selecting securities, we use a computer model to identify and rank stocks within an industry or sector, based on several characteristics, including: value, or how a stock is priced relative to its perceived value; growth, in this case the sustainability or growth of earnings; financial pro-
The Portfolio 3
DISCUSSION OF PERFORMANCE (continued)
|
file, which measures the financial health of a company. Next, based on fundamental analysis, we generally select the most attractive of the higher ranked securities, drawing on a variety of sources, including internal as well as Wall Street research, and company management.
In addition to identifying what we believe are attractive investment opportunities, we also attempt to manage risks by diversifying across companies and industries.The portfolio is structured so that its sector weightings and risk characteristics are generally similar to those of the S&P 500 Index.
What other factors influenced the portfolio's performance?
The portfolio received particularly strong contributions to its relative performance from the health care sector, primarily due to our decisions to de-emphasize medical device makers, a group that came under pressure as a result of reimbursement-related pricing concerns during the first few months of 2005. Instead, we emphasized medical service providers, such as WellPoint and Triad Hospitals, that benefited from stabilizing cost trends and rising demand. The portfolio's returns also were supported by its increased exposure to major pharmaceutical firms, such as Wyeth, which began the reporting period at valuations we considered attractive in light of an improving earnings outlook.
Retail stocks helped drive the portfolio's gains in the consumer discretionary sector. Top performers included high-end specialty retailers Coach and Nordstrom, and auto parts dealer Advance Auto Parts, which rose substantially when the company reported success in its efforts to expand into new commercial markets.The portfolio further enhanced consumer discretionary returns by avoiding automobile manufacturers and suppliers, a group that suffered substantial declines when General Motors and Ford Motor Company announced disappointing financial results.Among utility holdings, Constellation Energy generated exceptional gains, bolstered by the company's diversified exposure to both nuclear and traditional energy generation facilities.
On the negative side, the portfolio suffered significant declines among industrial stocks, a sector that came under pressure after posting strong gains in the final weeks of 2004. In particular, early in 2005 the portfolio
emphasized companies that have historically performed well early in the economic growth cycle, such as machinery manufacturers PACCAR and Eaton. Although such holdings generally reported solid earnings, the market tended to discount their performance in favor of traditionally later-cycle industrial companies, such as diversified conglomerates, a group in which the portfolio held relatively little exposure.
What is the portfolio's current strategy?
While the portfolio has remained largely true to its sector-neutral investment strategy and profile, our bottom-up stock selection process has led to slightly heavier-than-average positions in the consumer discretionary sector. Conversely, stock-specific concerns have led us to invest a relatively small percentage of the portfolio's assets in the consumer staples and financials areas.Within the financials sector, concerns regarding rising interest rates have prompted us to emphasize non-interest-rate sensitive companies, such as brokerage and asset management firms, rather than banks and insurers.Within most sectors, we generally have responded to an apparent deceleration of economic expansion in the United States by focusing on companies that have track records of stable, long-term growth under a variety of economic conditions.
| | | The portfolio is only available as a funding vehicle under variable life insurance policies or variable |
| | | annuity contracts issued by insurance companies. Individuals may not purchase shares of the |
| | | portfolio directly. A variable annuity is an insurance contract issued by an insurance company that |
| | | enables investors to accumulate assets on a tax-deferred basis for retirement or other long-term |
| | | goals.The investment objective and policies of Dreyfus Variable Investment Fund, Disciplined |
| | | Stock Portfolio made available through insurance products may be similar to other funds/portfolios |
| | | managed or advised by Dreyfus. However, the investment results of the portfolio may be higher or |
| | | lower than, and may not be comparable to, those of any other Dreyfus fund/portfolio. |
| 1 | | Total return includes reinvestment of dividends and any capital gains paid. Past performance is no |
| | | guarantee of future results. Share price and investment return fluctuate such that upon redemption, |
| | | portfolio shares may be worth more or less than their original cost.The portfolio's performance does |
| | | not reflect the deduction of additional charges and expenses imposed in connection with investing |
| | | in variable insurance contracts, which will reduce returns. Return figures provided reflect the |
| | | absorption of portfolio expenses by The Dreyfus Corporation pursuant to an agreement in effect |
| | | through December 31, 2005, at which time it may be extended, terminated or modified. Had |
| | | these expenses not been absorbed, the portfolio's returns would have been lower. |
| 2 | | SOURCE: LIPPER INC. — Reflects reinvestment of dividends and, where applicable, capital |
| | | gain distributions.The Standard & Poor's 500 Composite Stock Price Index is a widely accepted, |
| | | unmanaged index of U.S. stock market performance. |
The Portfolio 5
UNDERSTANDING YOUR PORTFOLIO'S EXPENSES (Unaudited)
As a mutual fund investor, you pay ongoing expenses, such as management fees and other expenses. Using the information below, you can estimate how these expenses affect your investment and compare them with the expenses of other funds.You also may pay one-time transaction expenses, including sales charges (loads) and redemption fees, which are not shown in this section and would have resulted in higher total expenses. For more information, see your portfolio's prospectus or talk to your financial adviser.
| | Review your portfolio's expenses
|
The table below shows the expenses you would have paid on a $1,000 investment in Dreyfus Variable Investment Fund, Disciplined Stock Portfolio from January 1, 2005 to June 30, 2005. It also shows how much a $1,000 investment would be worth at the close of the period, assuming actual returns and expenses.
| Expenses and Value of a $1,000 Investment | | |
| assuming actual returns for the six months ended June 30, 2005 | | |
| | | Initial Shares | | Service Shares |
| |
| |
|
| Expenses paid per $1,000 † | | $ 4.61 | | $ 4.96 |
| Ending value (after expenses) | | $1,001.00 | | $1,001.00 |
COMPARING YOUR PORTFOLIO'S EXPENSES WITH THOSE OF OTHER FUNDS (Unaudited)
Using the SEC's method to compare expenses
The Securities and Exchange Commission (SEC) has established guidelines to help investors assess fund expenses. Per these guidelines, the table below shows your portfolio's expenses based on a $1,000 investment, assuming a hypothetical 5% annualized return. You can use this information to compare the ongoing expenses (but not transaction expenses or total cost) of investing in the portfolio with those of other funds. All mutual fund shareholder reports will provide this information to help you make this comparison. Please note that you cannot use this information to estimate your actual ending account balance and expenses paid during the period.
Expenses and Value of a $1,000 Investment assuming a hypothetical 5% annualized return for the six months ended June 30, 2005
| | | Initial Shares | | Service Shares |
| |
| |
|
| Expenses paid per $1,000 † | | $ 4.66 | | $ 5.01 |
| Ending value (after expenses) | | $1,020.18 | | $1,019.84 |
† Expenses are equal to the portfolio's annualized expense ratio of .93% for Initial shares and 1.00% for Service shares, multiplied by the average account value over the period, multiplied by 181/365 (to reflect the one-half year period).
STATEMENT OF INVESTMENTS
June 30, 2005 (Unaudited)
|
| Common Stocks—99.7% | | Shares | | Value ($) |
| |
| |
|
| Consumer Discretionary—13.1% | | | | |
| Advance Auto Parts | | 20,920 a | | 1,350,386 |
| Carnival | | 10,390 | | 566,775 |
| Coach | | 36,680 a | | 1,231,348 |
| Comcast, Cl. A | | 28,510 a | | 875,257 |
| Dollar General | | 35,900 | | 730,924 |
| Hilton Hotels | | 21,870 | | 521,600 |
| Home Depot | | 23,450 | | 912,205 |
| J. C. Penney | | 22,270 | | 1,170,957 |
| Marriott International, Cl. A | | 8,280 | | 564,862 |
| McDonald's | | 35,250 | | 978,187 |
| Nordstrom | | 11,240 | | 763,983 |
| Omnicom Group | | 6,400 | | 511,104 |
| Time Warner | | 90,250 a | | 1,508,077 |
| Viacom, Cl. B | | 15,280 | | 489,266 |
| Walt Disney | | 55,270 | | 1,391,699 |
| | | | | 13,566,630 |
| Consumer Staples—8.9% | | | | |
| Altria Group | | 19,610 | | 1,267,983 |
| CVS | | 22,600 | | 656,982 |
| Diageo, ADR | | 9,380 | | 556,234 |
| Estee Lauder Cos., Cl. A | | 17,030 | | 666,384 |
| Gillette | | 24,740 | | 1,252,586 |
| Kellogg | | 12,260 | | 544,834 |
| PepsiCo | | 22,880 | | 1,233,918 |
| Procter & Gamble | | 36,300 | | 1,914,825 |
| Wal-Mart Stores | | 22,480 | | 1,083,536 |
| | | | | 9,177,282 |
| Energy Related—8.4% | | | | |
| Anadarko Petroleum | | 4,920 | | 404,178 |
| Chevron | | 13,830 | | 773,374 |
| ConocoPhillips | | 25,160 | | 1,446,448 |
| Devon Energy | | 21,580 | | 1,093,674 |
| Exxon Mobil | | 59,030 | | 3,392,454 |
The Portfolio 7
STATEMENT OF INVESTMENTS (Unaudited) (continued)
| Common Stocks (continued) | | Shares | | Value ($) |
| |
| |
|
| Energy Related (continued) | | | | |
| Transocean | | 13,610 a | | 734,532 |
| Weatherford International | | 15,410 a | | 893,472 |
| | | | | 8,738,132 |
| Financials—19.9% | | | | |
| American Express | | 15,080 | | 802,708 |
| American International Group | | 13,391 | | 778,017 |
| AmeriCredit | | 21,840 a | | 556,920 |
| Axis Capital Holdings | | 29,290 | | 828,907 |
| Bank of America | | 60,670 | | 2,767,159 |
| CIT Group | | 25,360 | | 1,089,719 |
| Capital One Financial | | 6,610 | | 528,866 |
| Chubb | | 12,630 | | 1,081,254 |
| Citigroup | | 71,440 | | 3,302,671 |
| Countrywide Financial | | 13,890 | | 536,293 |
| Fannie Mae | | 22,800 | | 1,331,520 |
| Franklin Resources | | 7,530 | | 579,659 |
| Freddie Mac | | 7,700 | | 502,271 |
| Goldman Sachs Group | | 13,710 | | 1,398,694 |
| JP Morgan Chase | | 14,630 | | 516,732 |
| Lehman Brothers Holdings | | 8,860 b | | 879,621 |
| Merrill Lynch | | 9,240 | | 508,292 |
| Northern Trust | | 11,530 | | 525,653 |
| Radian Group | | 17,120 | | 808,406 |
| Wachovia | | 27,130 | | 1,345,648 |
| | | | | 20,669,010 |
| Health Care—14.1% | | | | |
| Aetna | | 6,240 | | 516,797 |
| Charles River Laboratories International | | 11,890 a | | 573,693 |
| Fisher Scientific International | | 16,560 a | | 1,074,744 |
| Genzyme | | 6,980 a | | 419,428 |
| Hospira | | 23,590 a | | 920,010 |
| Johnson & Johnson | | 29,520 | | 1,918,800 |
| Laboratory Corporation of America Holdings | | 8,920 a | | 445,108 |
| Common Stocks (continued) | | Shares | | Value ($) |
| |
| |
|
| Health Care (continued) | | | | |
| McKesson | | 14,550 | | 651,694 |
| Pfizer | | 82,204 | | 2,267,186 |
| St. Jude Medical | | 12,450 a | | 542,944 |
| Sanofi-Aventis, ADR | | 26,130 | | 1,071,069 |
| Triad Hospitals | | 9,200 a | | 502,688 |
| WebMD | | 72,900 a | | 748,683 |
| WellPoint | | 18,420 a | | 1,282,769 |
| Wyeth | | 38,800 | | 1,726,600 |
| | | | | 14,662,213 |
| Industrials—12.3% | | | | |
| Burlington Northern Santa Fe | | 12,960 | | 610,157 |
| Caterpillar | | 4,660 | | 444,145 |
| Danaher | | 18,220 | | 953,635 |
| Deere | | 10,720 | | 702,053 |
| Emerson Electric | | 6,520 | | 408,348 |
| FedEx | | 6,430 | | 520,894 |
| General Dynamics | | 6,660 | | 729,536 |
| General Electric | | 104,540 | | 3,622,311 |
| Honeywell International | | 10,300 | | 377,289 |
| Lockheed Martin | | 5,830 | | 378,192 |
| Norfolk Southern | | 17,080 | | 528,797 |
| Rockwell Automation | | 13,200 | | 642,972 |
| Textron | | 12,210 | | 926,128 |
| Tyco International | | 34,920 | | 1,019,664 |
| United Technologies | | 16,880 b | | 866,788 |
| | | | | 12,730,909 |
| Materials—2.9% | | | | |
| Air Products & Chemicals | | 12,590 | | 759,177 |
| Alcoa | | 36,260 | | 947,474 |
| Dow Chemical | | 12,310 | | 548,164 |
| E. I. du Pont de Nemours | | 9,570 | | 411,606 |
| PPG Industries | | 4,900 | | 307,524 |
| | | | | 2,973,945 |
The Portfolio 9
STATEMENT OF INVESTMENTS (Unaudited) (continued)
| Common Stocks (continued) | | Shares | | Value ($) |
| |
| |
|
| Technology—14.6% | | | | |
| Altera | | 35,940 a | | 712,331 |
| Cisco Systems | | 68,090 a | | 1,301,200 |
| EMC | | 106,410 a | | 1,458,881 |
| Global Payments | | 9,730 | | 659,694 |
| Intel | | 74,100 | | 1,931,046 |
| International Business Machines | | 33,010 | | 2,449,342 |
| Lucent Technologies (warrants) | | 288 a | | 222 |
| Microsoft | | 81,920 | | 2,034,893 |
| Motorola | | 50,490 | | 921,947 |
| National Semiconductor | | 32,180 | | 708,925 |
| Texas Instruments | | 55,330 | | 1,553,113 |
| VeriSign | | 13,230 a | | 380,495 |
| Yahoo! | | 30,580 a,b | | 1,059,597 |
| | | | | 15,171,686 |
| Telecommunication Services—2.2% | | | | |
| SBC Communications | | 32,970 | | 783,037 |
| Verizon Communications | | 43,240 | | 1,493,942 |
| | | | | 2,276,979 |
| Utilities—3.3% | | | | |
| Constellation Energy Group | | 14,070 | | 811,698 |
| Exelon | | 10,290 | | 528,186 |
| PG&E | | 37,780 | | 1,418,261 |
| Sempra Energy | | 15,900 | | 656,829 |
| | | | | 3,414,974 |
| Total Common Stocks | | | | |
| (cost $88,491,659) | | | | 103,381,760 |
| Investment of Cash Collateral | | | | |
| for Securities Loaned—2.4% | | Shares | | Value ($) |
| |
| |
|
| Registered Investment Company; | | | | |
| Dreyfus Institutional Cash Advantage Plus Fund | | |
| (cost $2,479,800) | | | | 2,479,800 c | | 2,479,800 |
| |
| |
| |
|
| |
| Total Investments (cost $90,971,459) | | 102.1% | | 105,861,560 |
| Liabilities, Less Cash and Receivables | | (2.1%) | | (2,211,117) |
| Net Assets | | | | 100.0% | | 103,650,443 |
| |
| ADR—American Depository Receipts. | | | | |
| a | | Non-income producing. | | | | | | |
| b | | All or a portion of these securities are on loan. At June 30, 2005, the total market value of the portfolio's securities |
| | | on loan is $2,391,098 and the total market value of the collateral held by the fund is $2,479,800. |
| c | | Investment in affiliated money market mutual fund. | | | | |
| |
| |
| |
|
| |
| |
| |
| Portfolio Summary (Unaudited) † | | | | |
| | | | | Value (%) | | | | Value (%) |
| |
| |
| |
| |
|
| Financials | | 19.9 | | Consumer Staples | | 8.9 |
| Technology | | 14.6 | | Energy Related | | 8.4 |
| Health Care | | 14.1 | | Other | | 10.8 |
| Consumer Discretionary | | 13.1 | | | | |
| Industrials | | 12.3 | | | | 102.1 |
| |
| † | | Based on net assets. | | | | | | |
| See notes to financial statements. | | | | |
The Portfolio 11
STATEMENT OF ASSETS AND LIABILITIES
June 30, 2005 (Unaudited)
| | | Cost | | Value |
| |
| |
|
| Assets ($): | | | | |
| Investments in securities—See Statement | | | | |
| of Investments (including securities on loan, | | |
| valued at $2,391,098)—Note 1(b): | | | | |
| Unaffiliated issuers | | 88,491,659 | | 103,381,760 |
| Affiliated issuers | | 2,479,800 | | 2,479,800 |
| Receivable for investment securities sold | | | | 926,017 |
| Dividends and interest receivable | | | | 128,172 |
| Prepaid expenses | | | | 3,729 |
| | | | | 106,919,478 |
| |
| |
|
| Liabilities ($): | | | | |
| Due to The Dreyfus Corporation and affiliates—Note 3(b) | | 71,615 |
| Cash Overdraft due to custodian | | | | 120,390 |
| Liability for securities on loan—Note 1(b) | | | | 2,479,800 |
| Payable for investment securities purchased | | 523,440 |
| Payable for shares of Beneficial Interest redeemed | | 40,073 |
| Accrued expenses | | | | 33,717 |
| | | | | 3,269,035 |
| |
| |
|
| Net Assets ($) | | | | 103,650,443 |
| |
| |
|
| Composition of Net Assets ($): | | | | |
| Paid-in capital | | | | 111,754,899 |
| Accumulated undistributed of investment income—net | | 390,095 |
| Accumulated net realized gain (loss) on investments | | (23,384,652) |
| Accumulated net unrealized appreciation | | | | |
| (depreciation) on investments | | | | 14,890,101 |
| |
| |
|
| Net Assets ($) | | | | 103,650,443 |
| |
| |
|
| |
| |
| Net Asset Value Per Share | | | | |
| | | Initial Shares | | Service Shares |
| |
| |
|
| Net Assets ($) | | 94,580,030 | | 9,070,413 |
| Shares Outstanding | | 4,515,401 | | 433,829 |
| |
| |
|
| Net Asset Value Per Share ($) | | 20.95 | | 20.91 |
See notes to financial statements.
|
STATEMENT OF OPERATIONS
Six Months Ended June 30, 2005 (Unaudited)
|
| Investment Income ($): | | |
| Income: | | |
| Cash dividends | | 878,938 |
| Interest | | 6,534 |
| Income from securities lending | | 1,162 |
| Total Income | | 886,634 |
| Expenses: | | |
| Investment advisory fee—Note 3(a) | | 400,910 |
| Prospectus and shareholders' reports | | 53,543 |
| Professional fees | | 19,550 |
| Distribution fees—Note 3(b) | | 11,585 |
| Trustees' fees and expenses—Note 3(c) | | 7,805 |
| Custodian fees���Note 3(b) | | 5,383 |
| Shareholder servicing costs—Note 3(b) | | 4,391 |
| Loan commitment fees—Note 2 | | 50 |
| Miscellaneous | | 3,357 |
| Total Expenses | | 506,574 |
| Less—waiver of fees due to undertaking—Note 3(a) | | (8,039) |
| Less—reduction in custody fees | | |
| due to earnings credits—Note 1(b) | | (41) |
| Net Expenses | | 498,494 |
| Investment Income—Net | | 388,140 |
| |
|
| Realized and Unrealized Gain (Loss) on Investments—Note 4 ($): |
| Net realized gain (loss) on investments | | 4,890,840 |
| Net unrealized appreciation (depreciation) on investments | | (5,231,917) |
| Net Realized and Unrealized Gain (Loss) on Investments | | (341,077) |
| Net Increase in Net Assets Resulting from Operations | | 47,063 |
See notes to financial statements.
|
The Portfolio 13
STATEMENT OF CHANGES IN NET ASSETS
| | | Six Months Ended | | |
| | | June 30, 2005 | | Year Ended |
| | | (Unaudited) | | December 31, 2004 |
| |
| |
|
| Operations ($): | | | | |
| Investment income—net | | 388,140 | | 1,188,966 |
| Net realized gain (loss) on investments | | 4,890,840 | | 15,349,371 |
| Net unrealized appreciation | | | | |
| (depreciation) on investments | | (5,231,917) | | (8,166,167) |
| Net Increase (Decrease) in Net Assets | | | | |
| Resulting from Operations | | 47,063 | | 8,372,170 |
| |
| |
|
| Dividends to Shareholders from ($): | | | | |
| Investment income—net: | | | | |
| Initial shares | | — | | (1,359,657) |
| Service shares | | — | | (110,438) |
| Total Dividends | | — | | (1,470,095) |
| |
| |
|
| Beneficial Interest Transactions ($): | | | | |
| Net proceeds from shares sold: | | | | |
| Initial shares | | 2,272,057 | | 2,270,271 |
| Service shares | | 216,845 | | 433,322 |
| Dividends reinvested: | | | | |
| Initial shares | | — | | 1,359,657 |
| Service shares | | — | | 110,438 |
| Cost of shares redeemed: | | | | |
| Initial shares | | (11,150,415) | | (17,871,990) |
| Service shares | | (899,436) | | (1,690,439) |
| Increase (Decrease) in Net Assets from | | | | |
| Beneficial Interest Transactions | | (9,560,949) | | (15,388,741) |
| Total Increase (Decrease) in Net Assets | | (9,513,886) | | (8,486,666) |
| |
| |
|
| Net Assets ($): | | | | |
| Beginning of Period | | 113,164,329 | | 121,650,995 |
| End of Period | | 103,650,443 | | 113,164,329 |
| Undistributed investment income—net | | 390,095 | | 1,955 |
| | | Six Months Ended | | |
| | | June 30, 2005 | | Year Ended |
| | | (Unaudited) | | December 31, 2004 |
| |
| |
|
| Capital Share Transactions: | | | | |
| Initial Shares | | | | |
| Shares sold | | 109,921 | | 114,692 |
| Shares issued for dividends reinvested | | — | | 65,032 |
| Shares redeemed | | (536,231) | | (900,487) |
| Net Increase (Decrease) in Shares Outstanding | | (426,310) | | (720,763) |
| |
| |
|
| Service Shares | | | | |
| Shares sold | | 10,478 | | 21,907 |
| Shares issued for dividends reinvested | | — | | 5,286 |
| Shares redeemed | | (43,123) | | (85,389) |
| Net Increase (Decrease) in Shares Outstanding | | (32,645) | | (58,196) |
See notes to financial statements.
The Portfolio 15
The following tables describe the performance for each share class for the fiscal periods indicated. All information (except portfolio turnover rate) reflects financial results for a single portfolio share.Total return shows how much your investment in the portfolio would have increased (or decreased) during each period, assuming you had reinvested all dividends and distributions.These figures have been derived from the portfolio's financial statements.
| | | Six Months Ended | | | | | | | | | | |
| | | June 30, 2005 | | | | Year Ended December 31, | | |
| | | |
| |
| |
|
| Initial Shares | | (Unaudited) | | 2004 | | 2003 | | 2002 | | 2001 | | 2000 |
| |
| |
| |
| |
| |
| |
|
| Per Share Data ($): | | | | | | | | | | | | |
| Net asset value, | | | | | | | | | | | | |
| beginning of period | | 20.93 | | 19.66 | | 16.04 | | 20.89 | | 24.19 | | 26.92 |
| Investment Operations: | | | | | | | | | | | | |
| Investment income—net a | | .08 | | .21 | | .14 | | .12 | | .09 | | .06 |
| Net realized and unrealized | | | | | | | | | | | | |
| gain (loss) on investments | | (.06) | | 1.34 | | 3.63 | | (4.84) | | (3.30) | | (2.53) |
| Total from Investment Operations | | .02 | | 1.55 | | 3.77 | | (4.72) | | (3.21) | | (2.47) |
| Distributions: | | | | | | | | | | | | |
| Dividends from investment | | | | | | | | | | | | |
| income—net | | — | | (.28) | | (.15) | | (.13) | | (.09) | | (.05) |
| Dividends from net realized | | | | | | | | | | | | |
| gain on investments | | — | | — | | — | | — | | — | | (.21) |
| Total Distributions | | — | | (.28) | | (.15) | | (.13) | | (.09) | | (.26) |
| Net asset value, end of period | | 20.95 | | 20.93 | | 19.66 | | 16.04 | | 20.89 | | 24.19 |
| |
| |
| |
| |
| |
| |
|
| Total Return (%) | | .10b | | 7.87 | | 23.53 | | (22.61) | | (13.27) | | (9.14) |
| |
| |
| |
| |
| |
| |
|
| Ratios/Supplemental Data (%): | | | | | | | | | | |
| Ratio of total expenses | | | | | | | | | | | | |
| to average net assets | | .46b | | .85 | | .85 | | .83 | | .81 | | .81 |
| Ratio of net investment income | | | | | | | | | | | | |
| to average net assets | | .36b | | 1.04 | | .81 | | .64 | | .40 | | .21 |
| Portfolio Turnover Rate | | 32.48b | | 83.64 | | 52.74 | | 47.47 | | 48.22 | | 51.44 |
| |
| |
| |
| |
| |
| |
|
| Net Assets, end of period | | | | | | | | | | | | |
| ($ x 1,000) | | 94,580 | | 103,417 | | 111,352 | | 106,404 | | 172,360 | | 222,920 |
| a | | Based on average shares outstanding at each month end. | | | | | | | | |
| b | | Not annualized. | | | | | | | | | | | | |
| See notes to financial statements. | | | | | | | | | | | | |
| | | Six Months Ended | | | | | | | | | | |
| | | June 30, 2005 | | | | Year Ended December 31, | | |
| | | |
| |
| |
|
| Service Shares | | (Unaudited) | | 2004 | | 2003 | | 2002 | | 2001 | | 2000a |
| |
| |
| |
| |
| |
| |
|
| Per Share Data ($): | | | | | | | | | | | | |
| Net asset value, | | | | | | | | | | | | |
| beginning of period | | 20.90 | | 19.63 | | 16.02 | | 20.86 | | 24.19 | | 24.19 |
| Investment Operations: | | | | | | | | | | | | |
| Investment income—net | | .07b | | .18b | | .11b | | .09b | | .05b | | — |
| Net realized and unrealized | | | | | | | | | | | | |
| gain (loss) on investments | | (.06) | | 1.33 | | 3.62 | | (4.83) | | (3.30) | | — |
| Total from Investment Operations | | .01 | | 1.51 | | 3.73 | | (4.74) | | (3.25) | | — |
| Distributions: | | | | | | | | | | | | |
| Dividends from investment | | | | | | | | | | | | |
| income—net | | — | | (.24) | | (.12) | | (.10) | | (.08) | | — |
| Net asset value, end of period | | 20.91 | | 20.90 | | 19.63 | | 16.02 | | 20.86 | | 24.19 |
| |
| |
| |
| |
| |
| |
|
| Total Return (%) | | .10c | | 7.64 | | 23.31 | | (22.72) | | (13.46) | | — |
| |
| |
| |
| |
| |
| |
|
| Ratios/Supplemental Data (%): | | | | | | | | | | |
| Ratio of total expenses | | | | | | | | | | | | |
| to average net assets | | .58c | | 1.10 | | 1.09 | | 1.06 | | 1.13 | | |
| Ratio of net expenses | | | | | | | | | | | | |
| to average net assets | | .50c | | 1.00 | | 1.00 | | 1.00 | | 1.00 | | — |
| Ratio of net investment income | | | | | | | | | | | | |
| to average net assets | | .32c | | .90 | | .65 | | .49 | | .26 | | — |
| Portfolio Turnover Rate | | 32.48c | | 83.64 | | 52.74 | | 47.47 | | 48.22 | | 51.44 |
| |
| |
| |
| |
| |
| |
|
| Net Assets, end of period | | | | | | | | | | | | |
| ($ x 1,000) | | 9,070 | | 9,748 | | 10,299 | | 9,150 | | 7,929 | | 1 |
| |
| a | | The portfolio commenced offering Service shares on December 31, 2000. | | | | | | |
| b | | Based on average shares outstanding at each month end. | | | | | | | | |
| c | | Not annualized. | | | | | | | | | | | | |
| See notes to financial statements. | | | | | | | | | | | | |
The Portfolio 17
NOTES TO FINANCIAL STATEMENTS (Unaudited)
NOTE 1—Significant Accounting Policies:
Dreyfus Variable Investment Fund (the "fund") is registered under the Investment Company Act of 1940, as amended (the "Act"), as an open-end management investment company, operating as a series company currently offering twelve series, including the Disciplined Stock Portfolio (the "portfolio"). The portfolio is only offered to separate accounts established by insurance companies to fund variable annuity contracts and variable life insurance policies.The portfolio is a diversified series.The portfolio's investment objective is to provide investment returns (consisting of capital appreciation and income) that are consistently superior to the Standard & Poor's 500 Composite Stock Price Index.The Dreyfus Corporation (the "Manager"or "Dreyfus") serves as the portfolio's investment adviser. The Manager is a wholly-owned subsidiary of Mellon Financial Corporation ("Mellon Financial").
Dreyfus Service Corporation (the "Distributor"), a wholly-owned subsidiary of the Manager, is the distributor of the portfolio's shares, which are sold without a sales charge.The portfolio is authorized to issue an unlimited number of $.001 par value shares of Beneficial Interest in each of the following classes of shares: Initial and Service. Each class of shares has identical rights and privileges, except with respect to the distribution plan and the expenses borne by each class and certain voting rights. Income, expenses (other than expenses attributable to a specific class), and realized and unrealized gains or losses on investments are allocated to each class of shares based on its relative net assets.
The fund accounts separately for the assets, liabilities and operations of each series. Expenses directly attributable to each series are charged to that series' operations; expenses which are applicable to all series are allocated among them on a pro rata basis.
The portfolio's financial statements are prepared in accordance with U.S. generally accepted accounting principles, which may require the use of management estimates and assumptions.Actual results could differ from those estimates.
The fund enters into contracts that contain a variety of indemnifica-tions.The portfolio's maximum exposure under these arrangements is unknown. The portfolio does not anticipate recognizing any loss related to these arrangements.
(a) Portfolio valuation: Investments in securities are valued at the last sales price on the securities exchange or national securities market on which such securities are primarily traded. Securities listed on the National Market System for which market quotations are available are valued at the official closing price or, if there is no official closing price that day, at the last sales price. Securities not listed on an exchange or the national securities market, or securities for which there were no transactions, are valued at the average of the most recent bid and asked prices, except for open short positions, where the asked price is used for valuation purposes. Bid price is used when no asked price is available. Investments in registered investment companies are valued at their net asset value. When market quotations or official closing prices are not readily available, or are determined not to reflect accurately fair value, such as when the value of a security has been significantly affected by events after the close of the exchange or market on which the security is principally traded (for example, a foreign exchange or market), but before the portfolio calculates its net asset value, the portfolio may value these investments at fair value as determined in accordance with the procedures approved by the Board of Trustees. Fair valuing of securities may be determined with the assistance of a pricing service using calculations based on indices of domestic securities and other appropriate indicators, such as prices of relevant ADR's and futures contracts. For other securities that are fair valued by the Board of Trustees, certain factors may be considered such as: fundamental analytical data, the nature and duration of restrictions on disposition, an evaluation of the forces that influence the market in which the securities are purchased and sold and public trading in similar securities of the issuer or comparable issuers. Financial futures are valued at the last sales
The Portfolio 19
NOTES TO FINANCIAL STATEMENTS (Unaudited) (continued)
price. Investments denominated in foreign currencies are translated to U.S. dollars at the prevailing rates of exchange. Forward currency exchange contracts are valued at the forward rate.
(b) Securities transactions and investment income: Securities transactions are recorded on a trade date basis. Realized gain and loss from securities transactions are recorded on the identified cost basis. Dividend income is recognized on the ex-dividend date and interest income, including, where applicable, accretion of discount and amortization of premium on investments, is recognized on the accrual basis.
The portfolio has an arrangement with the custodian bank whereby the portfolio receives earnings credits from the custodian when positive cash balances are maintained, which are used to offset custody fees. For financial reporting purposes, the portfolio includes net earnings credits, as an expense offset in the Statement of Operations.
Pursuant to a securities lending agreement with Mellon Bank, N.A., an affiliate of the Manager, the portfolio may lend securities to qualified institutions.At origination, all loans are secured by collateral of at least 102% of the value of U.S. securities loaned and 105% of the value of foreign securities loaned. Collateral equivalent to at least 100% of the market value of securities on loan will be maintained at all times. Cash collateral is invested in certain money market mutual funds managed by the Manager. The portfolio will be entitled to receive all income on securities loaned, in addition to income earned as a result of the lending transaction. Although each security loaned is fully collateralized, the portfolio would bear the risk of delay in recovery of, or loss of rights in, the securities loaned should a borrower fail to return the securities in a timely manner.
(c) Affiliated issuers: Investments in other investment companies advised by the Manager are defined as "affiliated" in the Act.
(d) Dividends to shareholders: Dividends are recorded on the ex-dividend date. Dividends from investment income-net and dividends from net realized capital gain, if any, are normally declared and paid annually,
but the portfolio may make distributions on a more frequent basis to comply with the distribution requirements of the Internal Revenue Code of 1986, as amended (the "Code").To the extent that net realized capital gain can be offset by capital loss carryovers, it is the policy of the portfolio not to distribute such gain. Income and capital gain distributions are determined in accordance with income tax regulations, which may differ from U.S. generally accepted accounting principles.
(e) Federal income taxes: It is the policy of the portfolio to continue to qualify as a regulated investment company, if such qualification is in the best interests of its shareholders, by complying with the applicable provisions of the Code, and to make distributions of taxable income sufficient to relieve it from substantially all federal income and excise taxes.
The portfolio has an unused capital loss carryover of $27,308,551 available for federal income tax purposes to be applied against future net securities profits, if any, realized subsequent to December 31, 2004. If not applied, $6,839,557 of the carryover expires in fiscal 2009, $16,383,626 expires in fiscal 2010 and $4,085,368 expires in fiscal 2011.
The tax character of distributions paid to shareholders during the fiscal year ended December 31, 2004 was as follows: ordinary income $1,470,095. The tax character of current year distributions will be determined at the end of the current fiscal year.
NOTE 2—Bank Line of Credit:
|
The portfolio participates with other Dreyfus-managed funds in a $350 million redemption credit facility (the "Facility") to be utilized for temporary or emergency purposes, including the financing of redemptions. In connection therewith, the portfolio has agreed to pay commitment fees on its pro rata portion of the Facility. Interest is charged to the portfolio based on prevailing market rates in effect at the time of borrowings. During the period ended June 30, 2005, the portfolio did not borrow under the Facility.
The Portfolio 21
NOTES TO FINANCIAL STATEMENTS (Unaudited) (continued)
NOTE 3—Investment Advisory Fee and Other Transactions With Affiliates:
(a) Pursuant to an Investment Advisory Agreement with the Manager,the investment advisory fee is computed at the annual rate of .75 of 1% of the value of the portfolio's average daily net assets and is payable monthly.
The Manager has undertaken, from January 1, 2005, to December 31, 2005, to waive receipt of its fees and/or assume the expenses of the portfolio so that the expenses of neither class, exclusive of taxes, brokerage fees, interest on borrowings, commitment fees and extraordinary expenses, exceed an annual rate of 1% of the value of the average daily net assets of their class. During the period ended June 30, 2005, the Manager waived receipt of fees of $8,039, pursuant to the undertaking.
(b) Under the Distribution Plan (the "Plan") adopted pursuant to Rule 12b-1 under the Act, Service shares pay the Distributor for distributing their shares, for servicing and/or maintaining Service shares shareholder accounts and for advertising and marketing for Service shares.The Plan provides for payments to be made at an annual rate of .25 of 1% of the value of the Service shares' average daily net assets.The Distributor may make payments to Participating Insurance Companies and to brokers and dealers acting as principal underwriter for their variable insurance products.The fees payable under the Plan are payable without regard to actual expenses incurred. During the period ended June 30, 2005, Service shares were charged $11,585 pursuant to the Plan.
The portfolio compensates Dreyfus Transfer, Inc., a wholly-owned subsidiary of the Manager, under a transfer agency agreement for providing personnel and facilities to perform transfer agency services for the portfolio. During the period ended June 30, 2005, the portfolio was charged $84 pursuant to the transfer agency agreement.
The portfolio compensates Mellon Bank, N.A., an affiliate of the Manager, under a custody agreement to provide custodial services for the portfolio. During the period ended June 30, 2005, the portfolio
was charged $5,383 pursuant to the custody agreement.
During the period ended June 30, 2005, the portfolio was charged $1,998 for services performed by the Chief Compliance Officer.
The components of Due to The Dreyfus Corporation and affiliates in the Statement of Assets and Liabilities consist of: investment advisory fees $65,634, chief compliance officer fees $1,998, Rule 12b-1 distribution plan fees $1,904, custodian fees $2,988 and transfer agency per account fees $32, which are offset against an expense reimbursement currently in effect in the amount of $941.
(c) Each Board member also serves as a Board member of other funds within the Dreyfus complex. Annual retainer fees and attendance fees are allocated to each fund based on net assets.
NOTE 4—Securities Transactions:
The aggregate amount of purchases and sales of investment securities, excluding short-term securities, during the period ended June 30, 2005, amounted to $34,755,102 and $43,317,938, respectively.
At June 30, 2005, accumulated net unrealized appreciation on investments was $14,890,101, consisting of $16,316,816 gross unrealized appreciation and $1,426,715 gross unrealized depreciation.
At June 30, 2005, the cost of investments for federal income tax purposes was substantially the same as the cost for financial reporting purposes (see the Statement of Investments).
In early 2004, two purported class and derivative actions were filed against Mellon Financial, Mellon Bank, N.A., Dreyfus, Founders Asset Management LLC, and certain directors of the Dreyfus Funds and the Dreyfus Founders Funds (together, the "Funds") in the United States District Court for the Western District of Pennsylvania. In September
The Portfolio 23
NOTES TO FINANCIAL STATEMENTS (Unaudited) (continued)
2004, plaintiffs served a Consolidated Amended Complaint (the "Amended Complaint") on behalf of a purported class of all persons who acquired interests in any of the Funds between January 30, 1999 and November 17, 2003, and derivatively on behalf of the Funds.The Amended Complaint in the newly styled In re Dreyfus Mutual Funds Fee Litigation also named the Distributor, Premier Mutual Fund Services, Inc. and two additional Fund directors as defendants and alleges violations of the Investment Company Act of 1940, the Investment Advisers Act of 1940, the Pennsylvania Unfair Trade Practices and Consumer Protection Law and common-law claims. Plaintiffs seek to recover allegedly improper and excessive Rule 12b-1 and advisory fees allegedly charged to the Funds for marketing and distribution services. More specifically, plaintiffs claim, among other things, that 12b-1 fees and directed brokerage were improperly used to pay brokers to recommend the Funds over other funds, and that such payments were not disclosed to investors. In addition, plaintiffs assert that economies of scale and soft-dollar benefits were not passed on to the Funds. Plaintiffs further allege that 12b-1 fees were improperly charged to certain of the Funds that were closed to new investors.The Amended Complaint seeks compensatory and punitive damages, rescission of the advisory contracts, and an accounting and restitution of any unlawful fees, as well as an award of attorneys' fees and litigation expenses. As noted, some of the claims in this litigation are asserted derivatively on behalf of the Funds that have been named as nominal defendants. With respect to such derivative claims, no relief is sought against the Funds. Dreyfus believes the allegations to be totally without merit and intends to defend the action vigorously. In November 2004, all named defendants moved to dismiss the Amended Complaint in whole or substantial part. Briefing was completed in May 2005.
Additional lawsuits arising out of these circumstances and presenting similar allegations and requests for relief may be filed against the defendants in the future. Neither Dreyfus nor the Funds believe that any of the pending actions will have a material adverse effect on the Funds or Dreyfus' ability to perform its contract with the Funds.
| INFORMATION ABOUT THE REVIEW | | |
| AND APPROVAL OF THE PORTFOLIO'S | | |
| I N V E S T M E N T A DV I S O RY A G R E E M E N T | | (Unaudited) |
At separate meetings of the Board of Trustees for the fund held on June 8-9, 200, the Board considered the re-approval, through its annual renewal date of July 31, 2006, of the Investment Advisory Agreement with the Manager for the portfolio, pursuant to which the Manager provides the portfolio with investment advisory and administrative services. The Board members who are not "interested persons" (as defined in the Act , (the "Independent Trustees")) of the portfolio were assisted in their review by independent legal counsel and met with counsel in executive session separate from representatives of the Manager.
Analysis of Nature, Quality, and Extent of Services Provided to the Portfolio. The Board members received a presentation from representatives of the Manager regarding services provided to the portfolio and other funds in the Dreyfus fund complex, and discussed the nature, quality and extent of the services provided to the portfolio pursuant to its Investment Advisory Agreement. The Manager's representatives reviewed the portfolio's distribution of accounts and the relationships the Manager has with various intermediaries and the different needs of each.The Board noted that the portfolio's shares were offered only to separate accounts established by insurance companies to fund variable annuity contracts and variable life insurance policies. The Manager's representatives noted the diversity of distribution among the funds in the Dreyfus complex, and the Manager's corresponding need for broad, deep, and diverse resources to be able to provide ongoing shareholder services to each distribution channel, including that of the portfolio. The Board also reviewed the number of shareholder accounts in the portfolio, as well as the portfolio's asset size.
The Board members also considered the Manager's research and portfolio management capabilities and that the Manager also provides oversight of day-to-day portfolio operations, including fund accounting and administration and assistance in meeting legal and regulatory requirements. The Board members also considered the Manager's extensive administrative, accounting and compliance infrastructure.
The Portfolio 25
| I N FO R M AT I O N A B O U T T H E R E V I E W A N D A P P R OVA L O F T H E P O R T FO L I O ' S |
| I N V E S T M E N T A DV I S O RY A G R E E M E N T (Unaudited) (continued) |
Comparative Analysis of the Portfolio's Performance, Investment Advisory Fee and Expense Ratio. The Board members reviewed the portfolio's performance and expense ratios and placed significant emphasis on comparisons to a group of comparable funds and Lipper category averages, as applicable. The Board reviewed the portfolio's performance, investment advisory fee, and total expense ratios within these comparison groups and against the portfolio's Lipper category averages, as applicable. The groups of comparable funds were previously approved by the Board for this purpose, and were prepared using a Board-approved selection methodology that was based, in part, on selecting non-affiliated funds reported in the same Lipper category as the portfolio. The Board members discussed the results of the comparisons and noted that the portfolio's performance was above that of the averages of the comparison groups and its Lipper category for the 1-year period and above that of the averages of the comparison groups for the 3-year period.The Board noted that the portfolio's continued improved performance with its recent 3-month and 4-month performance for its Initial shares, which were in the 1st quartile of its Lipper category and in the top half of its comparison group.The Board members noted that the portfolio's current primary portfolio manager assumed that role in October 2004.The Board members also discussed the portfolio's expense ratio for each class of shares, noting it is below the average of its respective comparison group and ranks in the top half (i.e., lower than most of the others) of its respective comparison group.They reviewed the range of management fees in the comparison groups and noted that the portfolio's management fee generally is in the middle or in the bottom half of its comparison groups, with several funds having a investment advisory fee that was the same as, or higher than, the portfolio. The Board members noted the Manager's current undertaking to waive or reimburse certain fees and expenses to limit the portfolio's expense ratio, which lowered the portfolio's expense ratio for its Service shares.
Representatives of the Manager reviewed with the Board members the fees paid to the Manager or its affiliates by mutual funds managed
by the Manager or its affiliates (the "Similar Funds") and by separate accounts, or mutual funds which the Manager or its affiliates serve as sub-investment adviser, with similar investment objectives, policies and strategies as the portfolio (the "Separate Accounts" and, collectively with the Similar Funds, the "Similar Accounts") and explained the nature of each Similar Account and the differences, from the Manager's perspective, in management of such Similar Accounts as compared to managing and providing other services to the portfolio. The Similar Funds' comparison group was composed exclusively of mutual funds affiliated with the Manager that are reported as "large cap core" funds by Lipper.The Manager's representatives also reviewed the costs associated with distribution through intermediaries. The Board analyzed differences in fees paid to the Manager and discussed the relationship of the advisory fees paid in light of the Manager's performance and the services provided. It was noted that the Similar Funds include four unitary fee structure funds that had higher management fees than the fee borne by the portfolio and that several of the other funds had the same management fee as the fee borne by the portfolio. The Board members considered the relevance of the fee information provided for the Similar Accounts managed by the Manager to evaluate the appropriateness and reasonableness of the portfolio's advisory fees. The Board acknowledged that differences in fees paid by the Similar Accounts seemed to be consistent with the services provided.
Analysis of Profitability and Economies of Scale. The Manager's representatives reviewed the dollar amount of expenses allocated and profit received by the Manager and the method used to determine such expenses and profit.The Board received and considered information prepared by an independent consulting firm regarding Dreyfus' approach to allocating costs to, and determining the profitability of, individual funds and the entire Dreyfus mutual fund complex. The consulting firm also analyzed where any economies of scale might emerge as assets grow. The Board members evaluated the analysis in light of the relevant circumstances for the portfolio, including the decline in assets and the extent to which economies of scale would be
| INFORMATION ABOUT THE REVIEW AND APPROVAL OF THE PORTFOLIO'S |
| INVESTMENT ADVISORY AGREEMENT (Unaudited) (continued) |
realized as the portfolio grows and whether fee levels reflect these economies of scale for the benefit of portfolio investors. The Board members also considered potential benefits to the Manager from acting as investment adviser and noted the soft dollar arrangements with respect to trading the portfolio's portfolio.
It was noted that the Board members should consider the Manager's profitability with respect to the portfolio as part of their evaluation of whether the fee under the Investment Advisory Agreement bears a reasonable relationship to the mix of services provided by the Manager, including the nature, quality and extent of such services and that a discussion of economies of scale are predicated on increasing assets and that, if a fund's assets had been decreasing, the possibility that the Manager may have realized any economies of scale would be less. It also was noted that the profitability percentage for managing the portfolio was within ranges determined by appropriate court cases to be reasonable given the services rendered and, given the portfolio's overall performance and generally superior service levels provided. It also was noted that the current fee waiver expense reimbursment reduced the expense ratio for the portfolio's Service shares.
At the conclusion of these discussions, each of the Independent Trustees expressed the opinion that he or she had been furnished with sufficient information to make an informed business decision with respect to continuation of the fund's Investment Advisory Agreement with respect to the portfolio. Based on their discussions and considerations as described above, the Board made the following conclusions and determinations.
- The Board concluded that the nature, quality, and extent of the ser- vices provided by the Manager are adequate and appropriate.
- The Board generally was satisfied with the portfolio's performance for its 1-year and 3-year periods and the continued recent improve- ment in its short-term performance, as well as the change in the portfolio's primary portfolio manager in October 2004.
- The Board concluded that the portfolio's fee paid to the Manager
28
- was reasonable in light of comparative performance and expense and advisory fee information, including the Manager's undertaking to waive or reimburse certain fees and expenses (which reduced the expense ratio of the Service shares), costs of the services provided and profits to be realized and benefits derived or to be derived by the Manager from its relationship with the portfolio.
- The Board determined that, to the extent that material economies of scale had not been shared with the portfolio, the Board would seek to do so.
The Board members considered these conclusions and determinations, along with information received on a routine and regular basis throughout the year, and, without any one factor being dispositive, the Board determined that approval of the fund's Investment Advisory Agreement with respect to the portfolio was in the best interests of the portfolio and its shareholders.
The Portfolio 29
| For More | | Information |
| |
|
| |
| Dreyfus Variable | | Transfer Agent & |
| Investment Fund, | | Dividend Disbursing Agent |
| Disciplined Stock Portfolio | | |
| | | Dreyfus Transfer, Inc. |
| 200 Park Avenue | | |
| | | 200 Park Avenue |
| New York, NY 10166 | | |
| | | New York, NY 10166 |
| |
| Investment Adviser | | Distributor |
| The Dreyfus Corporation | | |
| | | Dreyfus Service Corporation |
| 200 Park Avenue | | |
| | | 200 Park Avenue |
| New York, NY 10166 | | |
| | | New York, NY 10166 |
| Custodian | | |
| Mellon Bank, N.A. | | |
| One Mellon Bank Center | | |
| Pittsburgh, PA 15258 | | |
Telephone 1-800-554-4611 or 516-338-3300
Mail The Dreyfus Family of Funds, 144 Glenn Curtiss Boulevard, Uniondale, NY 11556-0144 Attn: Institutional Servicing
The portfolio files its complete schedule of portfolio holdings with the Securities and Exchange Commission ("SEC") for the first and third quarters of each fiscal year on Form N-Q. The portfolio's Forms N-Q are available on the SEC's website at http://www.sec.gov and may be reviewed and copied at the SEC's Public Reference Room in Washington, DC. Information on the operation of the Public Reference Room may be obtained by calling 1-800-SEC-0330.
A description of the policies and procedures that the portfolio uses to determine how to vote proxies relating to portfolio securities, and information regarding how the portfolio voted these proxies for the 12-month period ended June 30, 2005, is available at http://www.dreyfus.com and on the SEC's website at http://www.sec.gov. The description of the policies and procedures is also available without charge, upon request, by calling 1-800-645-6561.
© 2005 Dreyfus Service Corporation

| Dreyfus Variable |
| Investment Fund, |
| Growth and Income |
| Portfolio |

The views expressed in this report reflect those of the portfolio manager only through the end of the period covered and do not necessarily represent the views of Dreyfus or any other person in the Dreyfus organization.Any such views are subject to change at any time based upon market or other conditions and Dreyfus disclaims any responsibility to update such views. These views may not be relied on as investment advice and, because investment decisions for a Dreyfus portfolio are based on numerous factors, may not be relied on as an indication of trading intent on behalf of any Dreyfus portfolio.
Not FDIC-Insured • Not Bank-Guaranteed • May Lose Value
| | | Contents |
| |
| | | T H E P O R T F O L I O |
| |
|
| 2 | | Letter from the Chairman |
| 3 | | Discussion of Performance |
| 6 | | Understanding Your Portfolio's Expenses |
| 6 | | Comparing Your Portfolio's Expenses |
| | | With Those of Other Funds |
| 7 | | Statement of Investments |
| 11 | | Statement of Assets and Liabilities |
| 12 | | Statement of Operations |
| 13 | | Statement of Changes in Net Assets |
| 15 | | Financial Highlights |
| 17 | | Notes to Financial Statements |
| 25 | | Information About the Review |
| and Approval of the Portfolio's |
| Investment Advisory Agreement |
| | | F O R M O R E I N F O R M AT I O N |
| |
|
| | | Back Cover |
| Dreyfus Variable Investment Fund, |
| Growth and Income Portfolio |
The Portfolio

LETTER FROM THE CHAIRMAN
We are pleased to present this semiannual report for Dreyfus Variable Investment Fund, Growth and Income Portfolio, covering the six-month period from January 1, 2005, through June 30, 2005. Inside, you'll find valuable information about how the portfolio was managed during the reporting period, including a discussion with the portfolio manager, L. Emerson Tuttle.
On average, U.S. stock prices ended the first half of 2005 slightly lower than where they began, largely due to headwinds caused by higher energy prices, rising short-term interest rates and recent evidence of slower economic growth. While midcap stocks generally produced higher returns than large-cap stocks, and large-cap stocks generally outperformed small-cap stocks, these differences were relatively small. Conversely, value-oriented stocks continued to produce substantially better results than their more growth-oriented counterparts.
In some ways, market conditions at midyear remind us of those from one year ago, when stock prices languished due to economic and political concerns before rallying strongly later in the year. Currently, our economists expect the U.S. economy to continue to grow over the foreseeable future without significant new inflationary pressures, potentially setting the stage for better business conditions that could send stock prices higher.As always, we encourage you to discuss these and other matters with your financial advisor.
Thank you for your continued confidence and support.


DISCUSSION OF PERFORMANCE
L. Emerson Tuttle, Portfolio Manager
How did Dreyfus Variable Investment Fund, Growth and Income Portfolio perform relative to its benchmark?
For the six-month period ended June 30, 2005, the portfolio achieved total returns of –2.00% for its Initial shares and –2.08% for its Service shares.1 For the same period, the total return of the Standard & Poor's 500 Composite Stock Price Index ("S&P 500 Index"), the portfolio's benchmark, was –0.81% .2
We attribute these results to conflicting economic forces. Stocks were generally boosted by global economic growth and generally low inflation, but undermined by rising interest rates, high energy prices and concerns regarding future growth rates. In this environment, markets experienced little overall change. However, some stocks fell sharply on news of negative business developments or prospects. Such individual stock declines detracted from the portfolio's performance, particularly in the industrial and financial sectors, causing returns to lag the benchmark.
What is the portfolio's investment approach?
The portfolio seeks long-term capital growth, current income and growth of income consistent with reasonable investment risk.To pursue these goals, the portfolio invests primarily in stocks, bonds and money market instruments of domestic and foreign issuers.The portfolio's stock investments may include common stocks, preferred stocks and convertible securities, including those purchased in initial public offerings or shortly thereafter.
The portfolio's investment strategy combines market economics with fundamental research. The portfolio manager begins by assessing current economic conditions and forecasting economic expectations. Each economic sector of the S&P 500 Index is examined to determine the sector's market-capitalized weighting and to estimate the performance of the sector relative to the S&P 500 Index as a whole. A balance is
DISCUSSION OF PERFORMANCE (continued)
|
determined for the portfolio, giving greater weight to sectors that are expected to outperform the overall market and less weight to sectors that are expected to underperform the overall market.
In choosing stocks, the portfolio employs fundamental analysis, generally seeking companies with strong positions in their industries, and companies with a catalyst that can trigger a price increase (such as accelerating earnings growth, a corporate restructuring or change in management).The portfolio manager seeks to create a broadly diversified core portfolio comprised of growth stocks, value stocks and stocks that exhibit characteristics of both investment styles. Income is generated primarily from dividend-paying stocks in which the portfolio may invest.The manager selects stocks based on:
- value, or how a stock is priced relative to its perceived intrinsic worth
- growth, in this case the sustainability or growth of earnings or cash flow
- financial profile, which measures the financial health of the company
What other factors influenced the portfolio's performance?
Among industrial stocks, the portfolio's returns suffered partly from a lack of exposure to the aerospace industry and defense contractors, reflecting our concerns regarding the competitive environment for such companies. However, the greater part of the portfolio's weakness among industrial companies illustrated the market's heightened sensitivity to investor perceptions. Holdings such as Tyco International, Danaher and Emerson Electric all lost ground despite little or no change to company fundamentals. Rather, the market discounted the stocks in anticipation of the possibility that future growth might slow as the economic cycle matures. In the financial sector, several insurance industry holdings declined sharply when accounting problems at American International Group led to a lawsuit and its CEO's ouster.
On the other hand, the portfolio achieved enhanced returns in several other areas. Most notably, performance was supported by good individual stock selections and the portfolio's modestly light exposure to consumer discretionary stocks. Top individual contributors included Hilton Hotels, which experienced rising occupancy rates and an
improved pricing environment; the timely purchase and sale of a position in Internet retailer eBay; and the portfolio's lack of exposure to the troubled automotive industry. Good stock selections, such as Air Products and Chemicals, boosted returns in the materials and processing area. Successful individual stock selections, such as PepsiCo and Altria Group, were also instrumental in producing relatively good returns in the consumer staples area. By contrast, individual stock selections proved less positive in the health care sector, where a few negative performers limited otherwise solid gains. Nevertheless, the portfolio's relatively heavy exposure to health care companies more than offset disappointing stock selections.
What is the portfolio's current strategy?
As of the end of the reporting period, we have placed mild emphasis on the health care and energy sectors, and we have found relatively few opportunities in consumer staples stocks, where valuations appear high to us compared to growth prospects.The portfolio also holds relatively few financial stocks, which we believe are vulnerable to rising interest rates.We have continued to consolidate the portfolio's holdings, emphasizing specific stocks in which we have the highest degree of confidence.
| | | The portfolio is only available as a funding vehicle under variable life insurance policies or variable |
| | | annuity contracts issued by insurance companies. Individuals may not purchase shares of the |
| | | portfolio directly. A variable annuity is an insurance contract issued by an insurance company that |
| | | enables investors to accumulate assets on a tax-deferred basis for retirement or other long-term |
| | | goals.The investment objective and policies of Dreyfus Variable Investment Fund, Growth and |
| | | Income Portfolio made available through insurance products may be similar to other funds/ |
| | | portfolios managed or advised by Dreyfus. However, the investment results of the portfolio may be |
| | | higher or lower than, and may not be comparable to, those of any other Dreyfus fund/portfolio. |
| 1 | | Total return includes reinvestment of dividends and any capital gains paid. Past performance is no |
| | | guarantee of future results. Share price and investment return fluctuate such that upon redemption, |
| | | portfolio shares may be worth more or less than their original cost.The portfolio's performance does |
| | | not reflect the deduction of additional charges and expenses imposed in connection with investing |
| | | in variable insurance contracts, which will reduce returns. Return figures provided reflect the |
| | | absorption of portfolio expenses by The Dreyfus Corporation pursuant to an agreement in effect |
| | | through December 31, 2005, at which time it may be extended, terminated or modified. Had |
| | | these expenses not been absorbed, the portfolio's returns would have been lower. |
| 2 | | SOURCE: LIPPER INC. — Reflects the reinvestment of dividends and, where applicable, |
| | | capital gain distributions.The Standard & Poor's 500 Composite Stock Price Index is a widely |
| | | accepted, unmanaged index of U.S. stock market performance. |
UNDERSTANDING YOUR
PORTFOLIO'S EXPENSES (Unaudited)
|
As a mutual fund investor,you pay ongoing expenses,such as management fees and other expenses.Using the information below, you can estimate how these expenses affect your investment and compare them with the expenses of other funds.You also may pay one-time transaction expenses, including sales charges (loads) and redemption fees, which are not shown in this section and would have resulted in higher total expenses. For more information, see your portfolio's prospectus or talk to your financial adviser.
Review your portfolio's expenses
|
The table below shows the expenses you would have paid on a $1,000 investment in Dreyfus Variable Investment Fund, Growth and Income Portfolio from January 1, 2005 to June 30, 2005. It also shows how much a $1,000 investment would be worth at the close of the period, assuming actual returns and expenses.
| Expenses and Value of a $1,000 Investment | | |
| assuming actual returns for the six months ended June 30, 2005 | | |
| | | Initial Shares | | Service Shares |
| |
| |
|
| Expenses paid per $1,000 † | | $ 4.03 | | $ 4.91 |
| Ending value (after expenses) | | $980.00 | | $979.20 |
COMPARING YOUR PORTFOLIO'S EXPENSES WITH THOSE OF OTHER FUNDS (Unaudited)
Using the SEC's method to compare expenses
The Securities and Exchange Commission (SEC) has established guidelines to help investors assess fund expenses. Per these guidelines, the table below shows your portfolio's expenses based on a $1,000 investment, assuming a hypothetical 5% annualized return. You can use this information to compare the ongoing expenses (but not transaction expenses or total cost) of investing in the portfolio with those of other funds. All mutual fund shareholder reports will provide this information to help you make this comparison. Please note that you cannot use this information to estimate your actual ending account balance and expenses paid during the period.
Expenses and Value of a $1,000 Investment assuming a hypothetical 5% annualized return for the six months ended June 30, 2005
| | | Initial Shares | | Service Shares |
| |
| |
|
| Expenses paid per $1,000 † | | $ 4.11 | | $ 5.01 |
| Ending value (after expenses) | | $1,020.73 | | $1,019.84 |
† Expenses are equal to the portfolio's annualized expense ratio of .82% for Initial shares and 1.00% for Service shares, multiplied by the average account value over the period, multiplied by 181/365 (to reflect the one-half year period).
STATEMENT OF INVESTMENTS
June 30, 2005 (Unaudited)
|
| Common Stocks—98.7% | | Shares | | Value ($) |
| |
| |
|
| Consumer Discretionary—10.8% | | | | |
| Advance Auto Parts | | 43,800 a | | 2,827,290 |
| Carnival | | 49,600 | | 2,705,680 |
| Disney (Walt) | | 117,100 | | 2,948,578 |
| Dollar General | | 111,400 | | 2,268,104 |
| Federated Department Stores | | 24,900 b | | 1,824,672 |
| Hilton Hotels | | 136,800 | | 3,262,680 |
| Home Depot | | 66,600 | | 2,590,740 |
| News, Cl. A | | 180,700 | | 2,923,726 |
| Target | | 35,900 | | 1,953,319 |
| | | | | 23,304,789 |
| Consumer Staples—9.8% | | | | |
| Altria Group | | 69,400 | | 4,487,404 |
| CVS | | 96,200 | | 2,796,534 |
| Estee Lauder Cos., Cl. A | | 45,500 | | 1,780,415 |
| PepsiCo | | 87,100 | | 4,697,303 |
| Procter & Gamble | | 77,500 | | 4,088,125 |
| Wal-Mart Stores | | 66,600 | | 3,210,120 |
| | | | | 21,059,901 |
| Energy—8.9% | | | | |
| Anadarko Petroleum | | 25,200 | | 2,070,180 |
| Chevron | | 95,300 | | 5,329,176 |
| ConocoPhillips | | 39,900 | | 2,293,851 |
| Exxon Mobil | | 165,200 | | 9,494,044 |
| | | | | 19,187,251 |
| Financials—20.0% | | | | |
| American Express | | 121,600 | | 6,472,768 |
| Bank of America | | 154,400 | | 7,042,184 |
| Capital One Financial | | 18,200 | | 1,456,182 |
| Citigroup | | 159,900 | | 7,392,177 |
| Countrywide Financial | | 97,400 | | 3,760,614 |
| Fidelity National Financial | | 84,300 | | 3,008,667 |
| Goldman Sachs Group | | 42,500 | | 4,335,850 |
| J.P. Morgan Chase & Co. | | 97,300 | | 3,436,636 |
STATEMENT OF INVESTMENTS (Unaudited) (continued)
| Common Stocks (continued) | | Shares | | Value ($) |
| |
| |
|
| Financials (continued) | | | | |
| Merrill Lynch | | 44,700 | | 2,458,947 |
| Radian Group | | 79,900 | | 3,772,878 |
| | | | | 43,136,903 |
| Health Care—13.3% | | | | |
| Alcon | | 36,600 | | 4,002,210 |
| Caremark Rx | | 46,800 a | | 2,083,536 |
| Fisher Scientific International | | 39,300 a | | 2,550,570 |
| Genzyme | | 57,300 a | | 3,443,157 |
| Johnson & Johnson | | 81,800 | | 5,317,000 |
| Novartis, ADR | | 89,400 | | 4,241,136 |
| Pfizer | | 84,200 | | 2,322,236 |
| WellPoint | | 32,000 a | | 2,228,480 |
| Wyeth | | 56,000 | | 2,492,000 |
| | | | | 28,680,325 |
| Industrials—11.3% | | | | |
| Burlington Northern Santa Fe | | 85,500 | | 4,025,340 |
| Caterpillar | | 27,400 | | 2,611,494 |
| Danaher | | 54,500 b | | 2,852,530 |
| Emerson Electric | | 24,900 | | 1,559,487 |
| General Electric | | 251,100 | | 8,700,615 |
| 3M | | 14,400 | | 1,041,120 |
| Tyco International | | 124,500 | | 3,635,400 |
| | | | | 24,425,986 |
| Information Technology—15.2% | | | | |
| Altera. | | 54,700 a | | 1,084,154 |
| Amdocs | | 35,200 a | | 930,336 |
| Cisco Systems | | 130,400 a | | 2,491,944 |
| EMC | | 278,900 a | | 3,823,719 |
| Enterasys Networks | | 169 b | | 152 |
| Intel | | 123,500 | | 3,218,410 |
| Common Stocks (continued) | | Shares | | Value ($) |
| |
| |
|
| Information Technology (continued) | | | | |
| International Business Machines | | 75,400 | | 5,594,680 |
| Microsoft | | 149,700 | | 3,718,548 |
| Motorola | | 196,800 | | 3,593,568 |
| National Semiconductor | | 55,300 | | 1,218,259 |
| Texas Instruments | | 94,700 | | 2,658,229 |
| VeriSign | | 68,600 a | | 1,972,936 |
| Yahoo! | | 73,500 a | | 2,546,775 |
| | | | | 32,851,710 |
| Materials—3.1% | | | | |
| Air Products & Chemicals | | 58,100 | | 3,503,430 |
| du Pont EI de Nemours | | 75,700 | | 3,255,857 |
| | | | | 6,759,287 |
| Telecommunication Services—3.1% | | | | |
| SBC Communications | | 129,900 | | 3,085,125 |
| Verizon Communications | | 103,600 | | 3,579,380 |
| | | | | 6,664,505 |
| Utilities—3.2% | | | | |
| Consolidated Edison | | 26,800 b | | 1,255,312 |
| PG&E | | 31,900 b | | 1,197,526 |
| Sempra Energy | | 41,000 | | 1,693,710 |
| Southern | | 79,600 | | 2,759,732 |
| | | | | 6,906,280 |
| Total Common Stocks | | | | |
| (cost $188,493,280) | | | | 212,976,937 |
| |
| |
|
| |
| Other Investment—.4% | | | | |
| |
| |
|
| Registered Investment Company; | | | | |
| Dreyfus Institutional Preferred | | | | |
| Plus Money Market Fund | | | | |
| (cost $783,000) | | 783,000 c | | 783,000 |
STATEMENT OF INVESTMENTS (Unaudited) (continued)
| Investment of Cash Collateral | | | | |
| for Securities Loaned—1.2% | | Shares | | Value ($) |
| |
| |
|
| Registered Investment Company; | | | | |
| Dreyfus Institutional Cash Advantage Fund | | | | |
| (cost $2,553,907) | | | | 2,553,907 c | | 2,553,907 |
| |
| |
| |
|
| |
| Total Investments (cost $191,830,187) | | 100.3% | | 216,313,844 |
| |
| Liabilities, Less Cash and Receivables | | (.3%) | | (660,678) |
| |
| Net Assets | | | | 100.0% | | 215,653,166 |
| |
| ADR—American Depository Receipts. | | | | |
| a | | Non-income producing. | | | | | | |
| b | | All or a portion of these securities are on loan. At June 30, 2005, the total market value of the portfolio's securities |
| | | on loan is $2,469,212 and the total market value of the collateral held by portfolio is $2,553,907. |
| c | | Investments in affiliated money market mutual funds. | | |
| |
| |
|
| |
| |
| |
| |
| Portfolio Summary (Unaudited) † | | | | |
| |
| | | | | Value (%) | | | | Value (%) |
| |
| |
| |
| |
|
| Financials | | 20.0 | | Consumer Staples | | 9.8 |
| Information Technology | | 15.2 | | Energy | | 8.9 |
| Health Care | | 13.3 | | Money Market Investmenrs | | 1.6 |
| Industrials | | 11.3 | | Other | | 9.4 |
| Consumer Discretionary | | 10.8 | | | | 100.3 |
| |
| † | | Based on net assets. | | | | | | |
| See notes to financial statements. | | | | |
STATEMENT OF ASSETS AND LIABILITIES
June 30, 2005 (Unaudited)
| | | Cost | | Value |
| |
| |
|
| Assets ($): | | | | |
| Investments in securities— | | | | |
| See Statement of Investments (including securities | | |
| on loan, valued at $2,469,212)—Note 1(c): | | |
| Unaffiliated issuers | | 188,493,280 | | 212,976,937 |
| Affiliated issuers | | 3,336,907 | | 3,336,907 |
| Cash | | | | 98,087 |
| Receivable for investment securities sold | | 2,482,931 |
| Dividends and interest receivable | | | | 227,160 |
| Receivable for shares of Beneficial Interest subscribed | | 80 |
| Prepaid expenses | | | | 5,202 |
| | | | | 219,127,304 |
| |
| |
|
| Liabilities ($): | | | | |
| Due to The Dreyfus Corporation and affiliates—Note 3(b) | | 148,260 |
| Liability for securities on loan—Note 1(c) | | 2,553,907 |
| Payable for investment securities purchased | | 627,821 |
| Payable for shares of Beneficial Interest redeemed | | 104,528 |
| Accrued expenses | | | | 39,622 |
| | | | | 3,474,138 |
| |
| |
|
| Net Assets ($) | | | | 215,653,166 |
| |
| |
|
| Composition of Net Assets ($): | | | | |
| Paid-in capital | | | | 220,410,130 |
| Accumulated undistributed investment income—net | | 41,733 |
| Accumulated net realized gain (loss) on investments | | (29,282,354) |
| Accumulated net unrealized appreciation | | |
| (depreciation) on investments | | | | 24,483,657 |
| |
| |
|
| Net Assets ($) | | | | 215,653,166 |
| |
| |
|
| |
| |
| Net Asset Value Per Share | | | | |
| | | Initial Shares | | Service Shares |
| |
| |
|
| Net Assets ($) | | 194,619,679 | | 21,033,487 |
| Shares Outstanding | | 9,344,445 | | 1,009,740 |
| |
| |
|
| Net Asset Value Per Share ($) | | 20.83 | | 20.83 |
See notes to financial statements.
|
STATEMENT OF OPERATIONS
Six Months Ended June 30, 2005 (Unaudited)
|
| Investment Income ($): | | |
| Income: | | |
| Cash dividends (net of $28,124 foreign taxes withheld at source): | | |
| Unaffiliated issuers | | 2,401,551 |
| Affiliated issuers | | 27,121 |
| Income from securities lending | | 5,734 |
| Total Income | | 2,434,406 |
| Expenses: | | |
| Investment advisory fee—Note 3(a) | | 846,700 |
| Distribution fees—Note 3(b) | | 27,401 |
| Prospectus and shareholders' reports | | 25,492 |
| Professional fees | | 20,690 |
| Custodian fees—Note 3(b) | | 13,435 |
| Trustees' fees and expenses—Note 3(c) | | 9,782 |
| Shareholder servicing costs—Note 3(b) | | 5,815 |
| Loan commitment fees—Note 2 | | 157 |
| Miscellaneous | | 3,599 |
| Total Expenses | | 953,071 |
| Less—waiver of fees due to undertaking—Note 3(a) | | (8,384) |
| Less—reduction in custody fees | | |
| due to earnings credits—Note 1(c) | | (33) |
| Net Expenses | | 944,654 |
| Investment Income—Net | | 1,489,752 |
| |
|
| Realized and Unrealized Gain (Loss) on Investments—Note 4 ($): |
| Net realized gain (loss) on investments | | 10,587,151 |
| Net Unrealized appreciation (depreciation) on investments | | (17,038,711) |
| Net Realized and Unrealized Gain (Loss) on Investments | | (6,451,560) |
| Net (Decrease) in Net Assets Resulting from Operations | | (4,961,808) |
See notes to financial statements.
|
STATEMENT OF CHANGES IN NET ASSETS
| | | Six Months Ended | | |
| | | June 30, 2005 | | Year Ended |
| | | (Unaudited) | | December 31, 2004 |
| |
| |
|
| Operations ($): | | | | |
| Investment income—net | | 1,489,752 | | 2,984,747 |
| Net realized gain (loss) on investments | | 10,587,151 | | 9,935,047 |
| Net unrealized appreciation | | | | |
| (depreciation) on investments | | (17,038,711) | | 3,922,915 |
| Net Increase (Decrease) in Net Assets | | | | |
| Resulting from Operations | | (4,961,808) | | 16,842,709 |
| |
| |
|
| Dividends to Shareholders from ($): | | | | |
| Investment income—net: | | | | |
| Initial shares | | (1,363,545) | | (2,740,259) |
| Service shares | | (128,094) | | (220,109) |
| Total Dividends | | (1,491,639) | | (2,960,368) |
| |
| |
|
| Beneficial Interest Transactions ($): | | | | |
| Net proceeds from shares sold: | | | | |
| Initial shares | | 3,595,967 | | 9,133,233 |
| Service shares | | 380,450 | | 1,120,251 |
| Dividends reinvested: | | | | |
| Initial shares | | 1,363,545 | | 2,740,259 |
| Service shares | | 128,094 | | 220,109 |
| Cost of shares redeemed: | | | | |
| Initial shares | | (24,937,655) | | (47,893,005) |
| Service shares | | (2,344,120) | | (3,444,004) |
| Increase (Decrease) in Net Assets from | | | | |
| Beneficial Interest Transactions | | (21,813,719) | | (38,123,157) |
| Total Increase (Decrease) in Net Assets | | (28,267,166) | | (24,240,816) |
| |
| |
|
| Net Assets ($): | | | | |
| Beginning of Period | | 243,920,332 | | 268,161,148 |
| End of Period | | 215,653,166 | | 243,920,332 |
| Undistributed investment income—net | | 41,733 | | 43,620 |
The Portfolio 13
STATEMENT OF CHANGES IN NET ASSETS (continued)
|
| | | Six Months Ended | | |
| | | June 30, 2005 | | Year Ended |
| | | (Unaudited) | | December 31, 2004 |
| |
| |
|
| Capital Share Transactions: | | | | |
| Initial Shares | | | | |
| Shares sold | | 172,878 | | 451,117 |
| Shares issued for dividends reinvested | | 65,972 | | 133,226 |
| Shares redeemed | | (1,196,158) | | (2,382,304) |
| Net Increase (Decrease) in Shares Outstanding | | (957,308) | | (1,797,961) |
| |
| |
|
| Service Shares | | | | |
| Shares sold | | 18,299 | | 55,328 |
| Shares issued for dividends reinvested | | 6,197 | | 10,725 |
| Shares redeemed | | (111,524) | | (169,880) |
| Net Increase (Decrease) in Shares Outstanding | | (87,028) | | (103,827) |
See notes to financial statements.
|
The following tables describe the performance for each share class for the fiscal periods indicated.All information (except portfolio turnover rate) reflects financial results for a single portfolio share. Total return shows how much your investment in the portfolio would have increased (or decreased) during each period, assuming you had reinvested all dividends and distributions.These figures have been derived from the portfolio's financial statements.
| | | Six Months Ended | | | | | | | | | | |
| | | June 30, 2005 | | | | Year Ended December 31, | | |
| | | |
| |
| |
|
| Initial Shares | | (Unaudited) | | 2004 | | 2003 | | 2002 | | 2001 | | 2000 |
| |
| |
| |
| |
| |
| |
|
| Per Share Data ($): | | | | | | | | | | | | |
| Net asset value, | | | | | | | | | | | | |
| beginning of period | | 21.40 | | 20.16 | | 16.06 | | 21.65 | | 23.48 | | 25.48 |
| Investment Operations: | | | | | | | | | | | | |
| Investment income—net a | | .14 | | .24 | | .14 | | .11 | | .11 | | .14 |
| Net realized and unrealized | | | | | | | | | | | | |
| gain (loss) on investments | | (.57) | | 1.25 | | 4.11 | | (5.59) | | (1.49) | | (1.10) |
| Total from Investment Operations | | (.43) | | 1.49 | | 4.25 | | (5.48) | | (1.38) | | (.96) |
| Distributions: | | | | | | | | | | | | |
| Dividends from | | | | | | | | | | | | |
| investment income—net | | (.14) | | (.25) | | (.15) | | (.11) | | (.11) | | (.15) |
| Dividends from net realized | | | | | | | | | | | | |
| gain on investments | | — | | — | | — | | — | | (.11) | | (.89) |
| Dividends in excess of net realized | | | | | | | | | | |
| gain on investments | | — | | — | | — | | — | | (.23) | | — |
| Total Distributions | | (.14) | | (.25) | | (.15) | | (.11) | | (.45) | | (1.04) |
| Net asset value, end of period | | 20.83 | | 21.40 | | 20.16 | | 16.06 | | 21.65 | | 23.48 |
| |
| |
| |
| |
| |
| |
|
| Total Return (%) | | (2.00)b | | 7.47 | | 26.57 | | (25.33) | | (5.85) | | (3.78) |
| |
| |
| |
| |
| |
| |
|
| Ratios/Supplemental Data (%): | | | | | | | | | | |
| Ratio of total expenses | | | | | | | | | | | | |
| to average net assets | | .41b | | .82 | | .82 | | .80 | | .80 | | .78 |
| Ratio of net expenses | | | | | | | | | | | | |
| to average net assets | | .41b | | .82 | | .82 | | .80 | | .80 | | .78 |
| Ratio of net investment income | | | | | | | | | | | | |
| to average net assets | | .66b | | 1.21 | | .81 | | .58 | | .48 | | .56 |
| Portfolio Turnover Rate | | 40.81b | | 52.74 | | 40.68 | | 34.61 | | 33.82 | | 60.90 |
| |
| |
| |
| |
| |
| |
|
| Net Assets, end of period | | | | | | | | | | | | |
| ($ x 1,000) | | 194,620 | | 220,447 | | 243,973 | | 226,548 | | 385,569 | | 437,407 |
| |
| a | | Based on average shares outstanding at each month end. | | | | | | | | |
| b | | Not annualized. | | | | | | | | | | | | |
| See notes to financial statements. | | | | | | | | | | | | |
The Portfolio 15
| | FINANCIAL HIGHLIGHTS (continued)
|
| | | Six Months Ended | | | | | | | | | | |
| | | June 30, 2005 | | | | Year Ended December 31, | | |
| | | |
| |
| |
|
| Service Shares | | (Unaudited) | | 2004 | | 2003 | | 2002 | | 2001 | | 2000 a |
| |
| |
| |
| |
| |
| |
|
| Per Share Data ($): | | | | | | | | | | | | |
| Net asset value, | | | | | | | | | | | | |
| beginning of period | | 21.40 | | 20.15 | | 16.03 | | 21.61 | | 23.48 | | 23.48 |
| Investment Operations: | | | | | | | | | | | | |
| Investment income—net | | .12b | | .21b | | .11b | | .08b | | .06b | | — |
| Net realized and unrealized | | | | | | | | | | | | |
| gain (loss) on investments | | (.57) | | 1.24 | | 4.10 | | (5.58) | | (1.51) | | — |
| Total from Investment Operations | | (.45) | | 1.45 | | 4.21 | | (5.50) | | (1.45) | | — |
| Distributions: | | | | | | | | | | | | |
| Dividends from | | | | | | | | | | | | |
| investment income—net | | (.12) | | (.20) | | (.09) | | (.08) | | (.08) | | — |
| Dividends from net realized | | | | | | | | | | | | |
| gain on investments | | — | | — | | — | | — | | (.11) | | — |
| Dividends in excess of net realized | | | | | | | | | | |
| gain on investments | | — | | — | | — | | — | | (.23) | | — |
| Total Distributions | | (.12) | | (.20) | | (.09) | | (.08) | | (.42) | | — |
| Net asset value, end of period | | 20.83 | | 21.40 | | 20.15 | | 16.03 | | 21.61 | | 23.48 |
| |
| |
| |
| |
| |
| |
|
| Total Return (%) | | (2.08)c | | 7.22 | | 26.36 | | (25.46) | | (6.14) | | — |
| |
| |
| |
| |
| |
| |
|
| Ratios/Supplemental Data (%): | | | | | | | | | | |
| Ratio of total expenses | | | | | | | | | | | | |
| to average net assets | | .53c | | 1.07 | | 1.07 | | 1.03 | | 1.12 | | — |
| Ratio of net expenses | | | | | | | | | | | | |
| to average net assets | | .49c | | 1.00 | | 1.01 | | .98 | | 1.01 | | — |
| Ratio of net investment income | | | | | | | | | | | | |
| to average net assets | | .58c | | 1.05 | | .63 | | .43 | | .28 | | — |
| Portfolio Turnover Rate | | 40.81c | | 52.74 | | 40.68 | | 34.61 | | 33.82 | | 60.90 |
| |
| |
| |
| |
| |
| |
|
| Net Assets, end of period | | | | | | | | | | | | |
| ($ x 1,000) | | 21,033 | | 23,473 | | 24,188 | | 20,388 | | 16,185 | | 1 |
| |
| a | | The portfolio commenced offering Service shares on December 31, 2000. | | | | | | |
| b | | Based on average shares outstanding at each month end. | | | | | | | | |
| c | | Not annualized. | | | | | | | | | | | | |
| See notes to financial statements. | | | | | | | | | | | | |
16
NOTES TO FINANCIAL STATEMENTS (Unaudited)
NOTE 1—Significant Accounting Policies:
Dreyfus Variable Investment Fund (the "fund") is registered under the Investment Company Act of 1940, as amended (the "Act"), as an open-end management investment company, operating as a series company currently offering twelve series, including the Growth and Income Portfolio (the "portfolio"). The portfolio is only offered to separate accounts established by insurance companies to fund variable annuity contracts and variable life insurance policies. The portfolio is a non-diversified series. The portfolio's investment objective is to provide long-term capital growth, current income and growth of income, consistent with reasonable investment risk.The Dreyfus Corporation (the "Manager" or "Dreyfus") serves as the portfolio's investment adviser. The Manager is a wholly-owned subsidiary of Mellon Financial Corporation ("Mellon Financial").
Dreyfus Service Corporation (the "Distributor"), a wholly-owned subsidiary of the Manager, is the distributor of the portfolio's shares, which are sold without a sales charge. The portfolio is authorized to issue an unlimited number of $.001 par value shares of Beneficial Interest in each of the following classes of shares: Initial and Service. Each class of shares has identical rights and privileges, except with respect to the distribution plan and the expenses borne by each class and certain voting rights. Income, expenses (other than expenses attributable to a specific class), and realized and unrealized gains or losses on investments are allocated to each class of shares based on its relative net assets.
The fund accounts separately for the assets, liabilities and operations of each series. Expenses directly attributable to each series are charged to that series' operations; expenses which are applicable to all series are allocated among them on a pro rata basis.
The portfolio's financial statements are prepared in accordance with U.S. generally accepted accounting principles, which may require the use of management estimates and assumptions.Actual results could differ from those estimates.
NOTES TO FINANCIAL STATEMENTS (Unaudited) (continued)
The fund enters into contracts that contain a variety of indemnifica-tions.The portfolio's maximum exposure under these arrangements is unknown. The portfolio does not anticipate recognizing any loss related to these arrangements.
(a) Portfolio valuation: Investments in securities are valued at the last sales price on the securities exchange or national securities market on which such securities are primarily traded. Securities listed on the National Market System for which market quotations are available are valued at the official closing price or, if there is no official closing price that day, at the last sale price. Securities not listed on an exchange or the national securities market, or securities for which there were no transactions, are valued at the average of the most recent bid and asked prices, except for open short positions, where the asked price is used for valuation purposes. Bid price is used when no asked price is available. Investments in registered investment companies are valued at their net asset value. When market quotations or official closing prices are not readily available, or are determined not to reflect accurately fair value, such as when the value of a security has been significantly affected by events after the close of the exchange or market on which the security is principally traded (for example,a foreign exchange or market),but before the portfolio calculates its net asset value, the portfolio may value these investments at fair value as determined in accordance with the procedures approved by the Board of Trustees. Fair valuing of securities may be determined with the assistance of a pricing service using calculations based on indices of domestic securities and other appropriate indicators, such as prices of relevant ADR's and futures contracts. For other securities that are fair valued by the Board of Trustees, certain factors may be considered such as: fundamental analytical data, the nature and duration of restrictions on disposition,an evaluation of the forces that influence the market in which the securities are purchased and sold, and public trading in similar securities of the issuer or comparable issuers. Financial futures are valued at the last sales price. Investments denominated in foreign currencies are translated to U.S. dollars at the prevailing rates of exchange. Forward currency exchange contracts are valued at the forward rate.
(b) Foreign currency transactions: The portfolio does not isolate that portion of the results of operations resulting from changes in foreign exchange rates on investments from the fluctuations arising from changes in the market prices of securities held. Such fluctuations are included with the net realized and unrealized gain or loss on investments.
Net realized foreign exchange gains or losses arise from sales and maturities of short-term securities, sales of foreign currencies, currency gains or losses realized on securities transactions and the difference between the amount of dividends, interest and foreign withholding taxes recorded on the portfolios' books and the U.S. dollar equivalent of the amounts actually received or paid. Net unrealized foreign exchange gains and losses arise from changes in the value of assets and liabilities other than investments in securities, resulting from changes in exchange rates. Such gains and losses are included with net realized and unrealized gain or loss on investments.
(c) Securities transactions and investment income: Securities transactions are recorded on a trade date basis. Realized gain and loss from securities transactions are recorded on the identified cost basis. Dividend income is recognized on the ex-dividend date and interest income, including, where applicable, accretion of discount and amortization of premium on investments, is recognized on the accrual basis.
The portfolio has an arrangement with the custodian bank whereby the portfolio receives earnings credits from the custodian when positive cash balances are maintained, which are used to offset custody fees. For financial reporting purposes, the portfolio includes net earnings credits as an expense offset in the Statement of Operations.
Pursuant to a securities lending agreement with Mellon Bank, N.A., an affiliate of the Manager, the portfolio may lend securities to qualified institutions.At origination, all loans are secured by collateral of at least 102% of the value of U.S. securities loaned and 105% of the value of foreign securities loaned. Collateral equivalent to at least 100% of the market value of securities on loan will be maintained at all times.
NOTES TO FINANCIAL STATEMENTS (Unaudited) (continued)
Cash collateral is invested in certain money market mutual funds managed by the Manager. The portfolio will be entitled to receive all income on securities loaned, in addition to income earned as a result of the lending transaction. Although each security loaned is fully collateralized, the portfolio would bear the risk of delay in recovery of, or loss of rights in, the securities loaned should a borrower fail to return the securities in a timely manner.
(d) Affiliated issuers: Investments in other investment companies advised by the Manager are defined as "affiliated" in the Act.
(e) Dividends to shareholders: Dividends are recorded on the ex-dividend date.The portfolio declares and pays dividends from investment income-net on a quarterly basis. Dividends from net realized capital gain, if any, are normally declared and paid annually, but the portfolio may make distributions on a more frequent basis to comply with the distribution requirements of the Internal Revenue Code of 1986, as amended (the "Code").To the extent that net realized capital gain can be offset by capital loss carryovers, it is the policy of the portfolio not to distribute such gain. Income and capital gain distributions are determined in accordance with income tax regulations, which may differ from U.S. generally accepted accounting principles.
(f) Federal income taxes: It is the policy of the portfolio to continue to qualify as a regulated investment company, if such qualification is in the best interests of its shareholders, by complying with the applicable provisions of the Code and to make distributions of taxable income sufficient to relieve it from substantially all federal income and excise taxes.
The portfolio has an unused capital loss carryover of $39,279,033 available for federal income tax purposes to be applied against future net securities profits, if any, realized subsequent to December 31, 2004. If not applied, $25,027,652 of the carryover expires in fiscal 2010 and $14,251,381 expires in fiscal 2011.
The tax character of distributions paid to shareholders during the fiscal year ended December 31, 2004 was as follows: ordinary income $2,960,368. The tax character of current year distributions will be determined at the end of the current fiscal year.
NOTE 2—Bank Line of Credit:
|
The portfolio participates with other Dreyfus-managed funds in a $350 million redemption credit facility (the "Facility") to be utilized for temporary or emergency purposes, including the financing of redemptions. In connection therewith, the portfolio has agreed to pay commitment fees on its pro rata portion of the Facility. Interest is charged to the portfolio based on prevailing market rates in effect at the time of borrowings. During the period ended June 30, 2005, the portfolio did not borrow under the Facility.
NOTE 3—Investment Advisory Fee and Other Transactions With Affiliates:
(a) Pursuant to an Investment Advisory Agreement with the Manager, the investment advisory fee is computed at the annual rate of .75 of 1% of the value of the portfolios' average daily net assets and is payable monthly.
The Manager has agreed, from January 1, 2005 to December 31, 2005 to waive receipt of its fees and/or assume the expenses of the portfolio so that the expenses of neither class, exclusive of taxes, brokerage fees, interest on borrowings, commitment fees and extraordinary expenses, exceed 1% of the value of the average daily net assets of their class. During the period ended June 30, 2005, the Manager waived receipt of fees of $8,384, pursuant to the undertaking.
(b) Under the Distribution Plan (the "Plan") adopted pursuant to Rule 12b-1 under the Act, Service shares pay the Distributor for distributing their shares, for servicing and/or maintaining Service shares shareholder accounts and for advertising and marketing for Service shares.The Plan provides for payments to be made at an annual rate of .25 of 1% of the value of the Service shares' average daily net assets.The Distributor may make payments to Participating Insurance Companies and to brokers and dealers acting as principal underwriter for their variable insurance products.The fees payable under the Plan are payable without regard to actual expenses incurred. During the period ended June 30, 2005, Service shares were charged $27,401 pursuant to the Plan.
NOTES TO FINANCIAL STATEMENTS (Unaudited) (continued)
The portfolio compensates Dreyfus Transfer, Inc., a wholly-owned subsidiary of the Manager, under a transfer agency agreement for providing personnel and facilities to perform transfer agency services for the portfolio. During the period ended June 30, 2005, the portfolio was charged $218 pursuant to the transfer agency agreement.
The portfolio compensates Mellon Bank, N.A., an affiliate of the Manager, under a custody agreement for providing custodial services for the portfolio. During the period ended June 30, 2005, the portfolio was charged $13,435 pursuant to the custody agreement.
During the period ended June 30, 2005, the portfolio was charged $1,998 for services performed by the Chief Compliance Officer.
The components of Due to The Dreyfus Corporation and affiliates in the Statement of Assets and Liabilities consist of: investment advisory fees $136,344, Rule 12b-1 distribution plan fees $4,453, custodian fees $6,610, chief compliance officer fees $1,998 and transfer agency per account fees $69, which are offset against an expense reimbursement currently in effect in the amount of $1,214.
(c) Each Board member also serves as a Board member of other funds within the Dreyfus complex. Annual retainer fees and attendance fees are allocated to each fund based on net assets.
(d) Pursuant to an exemptive order from the Securities and Exchange Commission, the portfolio may invest its available cash balances in affiliated money market mutual funds. Management fees of the underlying money market mutual funds have been waived by the Manager.
NOTE 4—Securities Transactions:
|
The aggregate amount of purchases and sales of investment securities, excluding short-term securities, during the period ended June 30, 2005, amounted to $91,795,551 and $111,999,040, respectively.
At June 30, 2005, accumulated net unrealized appreciation on investments was $24,483,657, consisting of $28,118,914 gross unrealized appreciation and $3,635,257 gross unrealized depreciation.
At June 30,2005,the cost of investments for federal income tax purposes was substantially the same as the cost for financial reporting purposes (see the Statement of Investments).
In early 2004, two purported class and derivative actions were filed against Mellon Financial, Mellon Bank, N.A., Dreyfus, Founders Asset Management LLC, and certain directors of the Dreyfus Funds and the Dreyfus Founders Funds (together, the "Funds") in the United States District Court for the Western District of Pennsylvania. In September 2004, plaintiffs served a Consolidated Amended Complaint (the "Amended Complaint") on behalf of a purported class of all persons who acquired interests in any of the Funds between January 30, 1999 and November 17, 2003, and derivatively on behalf of the Funds.The Amended Complaint in the newly styled In re Dreyfus Mutual Funds Fee Litigation also named the Distributor, Premier Mutual Fund Services, Inc. and two additional Fund directors as defendants and alleges violations of the Investment Company Act of 1940, the Investment Advisers Act of 1940, the Pennsylvania Unfair Trade Practices and Consumer Protection Law and common-law claims. Plaintiffs seek to recover allegedly improper and excessive Rule 12b-1 and advisory fees allegedly charged to the Funds for marketing and distribution services. More specifically, plaintiffs claim, among other things, that 12b-1 fees and directed brokerage were improperly used to pay brokers to recommend the Funds over other funds, and that such payments were not disclosed to investors. In addition, plaintiffs assert that economies of scale and soft-dollar benefits were not passed on to the Funds. Plaintiffs further allege that 12b-1 fees were improperly charged to certain of the Funds that were closed to new investors.The Amended Complaint seeks compensatory and punitive damages, rescission of the advisory contracts, and an accounting and restitution of any unlawful fees, as well as an award of attorneys' fees and litigation expenses. As noted, some of the claims in this litigation are asserted derivatively on behalf of the Funds that have been named as nominal
NOTES TO FINANCIAL STATEMENTS (Unaudited) (continued)
defendants. With respect to such derivative claims, no relief is sought against the Funds. Dreyfus believes the allegations to be totally without merit and intends to defend the action vigorously. In November 2004, all named defendants moved to dismiss the Amended Complaint in whole or substantial part. Briefing was completed in May 2005.
Additional lawsuits arising out of these circumstances and presenting similar allegations and requests for relief may be filed against the defendants in the future. Neither Dreyfus nor the Funds believe that any of the pending actions will have a material adverse effect on the Funds or Dreyfus' ability to perform its contract with the Funds.
INFORMATION ABOUT THE REVIEW
AND APPROVAL OF THE PORTFOLIO'S
I N V E S T M E N T A DV I S O RY A G R E E M E N T (Unaudited)
|
At separate meetings of the Board of Trustees for the fund held on June 8-9, 2005, the Board considered the re-approval, through its annual renewal date of July 31, 2006, of the Investment Advisory Agreement with the Manager for the portfolio, pursuant to which the Manager provides the portfolio with investment advisory and administrative ser-vices.The Board members who are not "interested persons" (as defined in the Act , (the "Independent Trustees")) of the fund were assisted in their review by independent legal counsel and met with counsel in executive session separate from representatives of the Manager.
Analysis of Nature, Extent and Quality of Services Provided to the Portfolio. The Board members received a presentation from representatives of the Manager regarding services provided to the portfolio and other funds in the Dreyfus fund complex, and discussed the nature, extent and quality of the services provided to the portfolio pursuant to its Investment Advisory Agreement. The Manager's representatives reviewed the portfolio's distribution of accounts and the relationships the Manager has with various intermediaries and the different needs of each.The Board noted that the portfolio's shares were offered only to separate accounts established by insurance companies to fund variable annuity contracts and variable life insurance policies. The Manager's representatives noted the diversity of distribution among the funds in the Dreyfus complex, and the Manager's corresponding need for broad, deep, and diverse resources to be able to provide ongoing shareholder services to each distribution channel, including that of the portfolio. The Board also reviewed the number of shareholder accounts in the portfolio, as well as the portfolio's asset size.
The Board members also considered the Manager's research and portfolio management capabilities and that the Manager also provides oversight of day-to-day portfolio operations, including fund accounting and administration and assistance in meeting legal and regulatory requirements. The Board members also considered the Manager's extensive administrative, accounting and compliance infrastructure.
The Portfolio 25
INFORMATION ABOUT THE REVIEW AND APPROVAL OF THE PORTFOLIO'S
INVESTMENT ADVISORY AGREEMENT (Unaudited) (continued)
|
Comparative Analysis of the Portfolio's Performance, Investment Advisory Fee and Expense Ratio. The Board members reviewed the portfolio's performance and expense ratios and placed significant emphasis on comparisons to two groups of comparable funds and Lipper category averages, as applicable.The Board reviewed the portfolio's performance, investment advisory fee, and total expense ratios within these comparison groups and against the portfolio's Lipper category averages, as applicable.The groups of comparable funds were previously approved by the Board for this purpose, and were prepared using a Board-approved selection methodology that was based, in part, on selecting non-affiliated funds reported in the same Lipper category as the portfolio.The Board members discussed the results of the comparisons and noted that the portfolio's performance generally was below the averages of its comparison groups, that the portfolio's 1-year and 5-year performance for its Initial shares was above its Lipper category average, the portfolio's 10-year performance for its Initial shares was above its comparison group average, and its more recent 3-month performance generally showed an improvement in its Initial shares comparison group ranking and outperformed its Lipper category average. The Board noted that the portfolio's management team was changed in October 2004.The Board members also discussed the portfolio's expense ratio for each class of shares, noting it is higher than its Initial shares comparison group average and lower than its Service shares comparison group average.They reviewed the range of management fees in the comparison groups and noted that the portfolio's investment advisory fee is in the bottom half (i.e., higher than most of the others) of the comparison groups.The Board members noted the Manager's current undertaking to waive or reimburse certain fees and expenses to limit the portfolio's expense ratio, which reduced the expense ratio of the portfolio's Service shares.
Representatives of the Manager reviewed with the Board the fees paid to the Manager or its affiliates by mutual funds managed by the Manager or its affiliates with similar investment objectives, policies and strategies as the portfolio (the "Similar Funds") and by separate accounts with similar investment objectives, policies and strategies as
the portfolio (the "Separate Accounts" and, collectively with the Similar Funds, the "Similar Accounts") and explained the nature of each Similar Account and the differences, from the Manager's perspective, in management of such Similar Accounts as compared to managing and providing other services to the portfolio.The Similar Funds' comparison group was composed exclusively of mutual funds affiliated with the Manager and reported in the portfolio's Lipper category and a similar Lipper category for non-insurance product funds.The Manager's representatives also reviewed the costs associated with distribution through intermediaries. The Board analyzed differences in fees paid to the Manager and discussed the relationship of the advisory fees paid in light of the Manager's performance and the services provided. It was noted that the Similar Funds included four unitary fee structure funds that had higher management fees than the fee borne by the portfolio and that several of the other Similar Funds had the same management fee as the fee borne by the portfolio.The Board members considered the relevance of the fee information provided for the Separate Accounts managed by the Manager (of which there was one) to evaluate the appropriateness and reasonableness of the portfolio's advisory fees.The Board acknowledged that differences in fees paid by the Similar Accounts seemed to be consistent with the services provided.
Analysis of Profitability and Economies of Scale. The Manager's representatives reviewed the dollar amount of expenses allocated and profit received by the Manager and the method used to determine such expenses and profit.The Board received and considered information prepared by an independent consulting firm regarding Dreyfus' approach to allocating costs to, and determining the profitability of, individual funds and the entire Dreyfus mutual fund complex. The consulting firm also analyzed where any economies of scale might emerge as assets grow. The Board members evaluated the analysis in light of the relevant circumstances for the portfolio, including the decline in assets and the extent to which economies of scale would be realized as the portfolio grows and whether fee levels reflect these economies of scale for the benefit of portfolio investors. The Board
INFORMATION ABOUT THE REVIEW AND APPROVAL OF THE PORTFOLIO'S
INVESTMENT ADVISORY AGREEMENT (Unaudited) (continued)
|
members also considered potential benefits to the Manager from acting as investment adviser and noted the soft dollar arrangements with respect to trading the portfolio's portfolio.
It was noted that the Board members should consider the Manager's profitability with respect to the portfolio as part of their evaluation of whether the fee under the Investment Advisory Agreement bears a reasonable relationship to the mix of services provided by the Manager, including the nature, extent and quality of such services and that a discussion of economies of scale are predicated on increasing assets and that, if a fund's assets had been decreasing, the possibility that the Manager may have realized any economies of scale would be less. It also was noted that the profitability percentage for managing the portfolio was within ranges determined by appropriate court cases to be reasonable given the services rendered and, given the portfolio's overall performance and generally superior service levels provided.The Board also noted the current fee waiver and expense reimbursement arrangement and its effect on the profitability of the Manager.
At the conclusion of these discussions, each of the Independent Trustees expressed the opinion that he or she had been furnished with sufficient information to make an informed business decision with respect to continuation of the fund's Investment Advisory Agreement with respect to the portfolio. Based on their discussions and considerations as described above, the Board made the following conclusions and determinations.
- The Board concluded that the nature, extent and quality of the ser- vices provided by the Manager are adequate and appropriate.
- The Board generally was satisfied with the portfolio's 1-year and 5-year performance for its Initial shares as compared to its Lipper category average, the portfolio's recent 3-month performance for its Initial shares versus its comparison group and the change in the portfolio's management team in October 2004.
- The Board concluded that the fee paid by the portfolio to the Manager was reasonable in light of comparative performance and expense and advisory fee information, particularly given the Manager's current undertaking to waive or reimburse certain fees and expenses, which reduced the expense ratio of the Service shares, costs of the services provided and profits to be realized and benefits derived or to be derived by the Manager from its relationship with the portfolio.
- The Board and determined that, to the extent that material economies of scale had not been shared with the portfolio, the Board would seek to do so.
The Board members considered these conclusions and determinations, along with information received on a routine and regular basis throughout the year, and, without any one factor being dispositive, the Board determined that approval of the fund's Investment Advisory Agreement, with respect to the portfolio, was in the best interests of the portfolio and its shareholders.
| For More | | Information |
| |
|
| |
| Dreyfus Variable | | Transfer Agent & |
| Investment Fund, | | Dividend Disbursing Agent |
| Growth and Income Portfolio |
| | | Dreyfus Transfer, Inc. |
| 200 Park Avenue | | |
| | | 200 Park Avenue |
| New York, NY 10166 | | |
| | | New York, NY 10166 |
| |
| Investment Adviser | | Distributor |
| The Dreyfus Corporation | | |
| | | Dreyfus Service Corporation |
| 200 Park Avenue | | |
| | | 200 Park Avenue |
| New York, NY 10166 | | |
| | | New York, NY 10166 |
| Custodian | | |
| Mellon Bank, N.A. | | |
| One Mellon Bank Center | | |
| Pittsburgh, PA 15258 | | |
Telephone 1-800-554-4611 or 516-338-3300
Mail The Dreyfus Family of Funds, 144 Glenn Curtiss Boulevard, Uniondale, NY 11556-0144 Attn: Institutional Servicing
The portfolio files its complete schedule of portfolio holdings with the Securities and Exchange Commission ("SEC") for the first and third quarters of each fiscal year on Form N-Q. The portfolio's Forms N-Q are available on the SEC's website at http://www.sec.gov and may be reviewed and copied at the SEC's Public Reference Room in Washington, DC. Information on the operation of the Public Reference Room may be obtained by calling 1-800-SEC-0330.
A description of the policies and procedures that the portfolio uses to determine how to vote proxies relating to portfolio securities, and information regarding how the portfolio voted these proxies for the 12-month period ended June 30, 2005, is available at http://www.dreyfus.com and on the SEC's website at http://www.sec.gov. The description of the policies and procedures is also available without charge, upon request, by calling 1-800-645-6561.
© 2005 Dreyfus Service Corporation

| Dreyfus Variable |
| Investment Fund, |
| International |
| Equity Portfolio |

The views expressed in this report reflect those of the portfolio manager only through the end of the period covered and do not necessarily represent the views of Dreyfus or any other person in the Dreyfus organization.Any such views are subject to change at any time based upon market or other conditions and Dreyfus disclaims any responsibility to update such views. These views may not be relied on as investment advice and, because investment decisions for a Dreyfus portfolio are based on numerous factors, may not be relied on as an indication of trading intent on behalf of any Dreyfus portfolio.
Not FDIC-Insured • Not Bank-Guaranteed • May Lose Value
| | | Contents |
| |
| | | T H E P O R T F O L I O |
| |
|
| 2 | | Letter from the Chairman |
| 3 | | Discussion of Performance |
| 6 | | Understanding Your Portfolio's Expenses |
| 6 | | Comparing Your Portfolio's Expenses |
| | | With Those of Other Funds |
| 7 | | Statement of Investments |
| 12 | | Statement of Assets and Liabilities |
| 13 | | Statement of Operations |
| 14 | | Statement of Changes in Net Assets |
| 16 | | Financial Highlights |
| 18 | | Notes to Financial Statements |
| 26 | | Information About the Review |
| and Approval of the Portfolio's |
| Investment Advisory Agreement |
| | | F O R M O R E I N F O R M AT I O N |
| |
|
| | | Back Cover |
| Dreyfus Variable Investment Fund, |
| International Equity Portfolio |
The Portfolio

LETTER FROM THE CHAIRMAN
We are pleased to present this semiannual report for Dreyfus Variable Investment Fund, International Equity Portfolio, covering the six-month period from January 1, 2005, through June 30, 2005. Inside, you'll find valuable information about how the fund was managed during the reporting period, including a discussion with the fund's portfolio manager, Paul Butler of Newton Capital Management Limited, the portfolio's sub-investment adviser.
On average, international stock prices in local currency terms ended the first half of 2005 modestly higher than where they began. However, a strengthening U.S. dollar eroded those returns for U.S. investors, presenting them with generally modest losses. While stocks in the emerging markets produced higher returns than stocks from industrialized nations, these differences were relatively small. Conversely, within the developed markets, European companies generally produced substantially better results than their counterparts in Japan.
In some ways, market conditions at midyear remind us of those from one year ago, when stock prices languished due to economic and geopolitical concerns before rallying strongly later in the year. Currently, our economists expect the global economy to continue to grow over the foreseeable future, driven by the ongoing industrialization of China and other emerging markets and potentially setting the stage for better business conditions that could send international stock prices higher. As always, we encourage you to discuss these and other matters with your financial advisor.
Thank you for your continued confidence and support.

DISCUSSION OF PERFORMANCE
Paul Butler, Portfolio Manager
Newton Capital Management Limited, Sub-Investment Adviser
How did Dreyfus Variable Investment Fund, International Equity Portfolio perform relative to its benchmark?
For the six-month period ended June 30, 2005, the portfolio produced total returns of 0.00% for its Initial shares and –0.14% for its Service shares.1 This compares with a –1.17% total return produced by the portfolio's benchmark, the Morgan Stanley Capital International Europe, Australasia, Far East Index ("MSCI EAFE Index"), for the same period.2 In addition, the portfolio is reported in the Lipper International Core category. Over the reporting period, the average total for all funds reported in the category was –0.86% ..3
After posting strong returns in the final months of 2004, international equities generally failed to advance over the first half of 2005 as sluggish economies in Europe and Japan dampened investor sentiment. In addition, a strengthening U.S. dollar eroded returns for U.S. investors. The portfolio produced higher returns than the MSCI EAFE Index, primarily due to its generally defensive investment posture, including relatively light exposure to the consumer discretionary and technology sectors.
What is the portfolio's investment approach?
The portfolio seeks capital growth. To pursue its goal, the portfolio primarily invests in growth stocks of foreign companies. Normally, the portfolio invests at least 80% of its assets in stocks, including common stocks, preferred stocks and convertible securities, including those purchased in initial public offerings.
In choosing stocks, the portfolio establishes a global framework within which to select investments. This involves identifying and forecasting key trends in global economic variables, such as gross domestic product, inflation and interest rates; investment themes, such as the impact of new technologies and the globalization of industries and brands; relative values of equity securities, bonds and cash; and long-term trends in currency movements.
The Portfolio 3
DISCUSSION OF PERFORMANCE (continued)
|
Within the markets and sectors determined to be relatively attractive, the portfolio seeks what it believes to be attractively priced companies that possess a sustainable competitive advantage in their market or sector.The portfolio manager generally will sell securities when themes or strategies change, or when the portfolio manager determines that the company's prospects have changed, or if the portfolio manager believes that the company's stock is fully valued by the market.
What other factors influenced the portfolio's performance?
Although we choose stocks through research into individual companies, and not according to broad market or economic trends, international equities were influenced over the first half of 2005 by investors' changing economic expectations.As energy prices surged and interest rates in some regions rose, investors grew increasingly concerned that global economic growth and corporate earnings might suffer. Indeed, industrialized economies in Europe and Japan proved to be weaker than expected.As a result, investors turned their attention away from faster-growing, economically sensitive industry groups and toward those that tend to fare relatively well in slower economic environments.
The portfolio was well positioned for this change in investor sentiment. Our stock selection process led us toward stocks in traditionally defensive areas, including utilities and consumer staples, and away from more cyclical sectors, such as technology and consumer discretionary companies. For example, the portfolio received strong contributions from tobacco companies, which have boosted profits and benefited from waning litigation concerns. Among utilities, environmentally-friendly power producers in Europe fared well. The portfolio also enjoyed strong results from its emphasis on the energy sector as oil and gas prices hit new record highs.
On the other hand, the portfolio received disappointing results from the telecommunications sector, an area of particular emphasis. Despite strong levels of free cash flow and high dividends, telecommunications companies were hurt by concerns regarding the possibility of greater government regulation.
From a geographical perspective, we found a number of attractive opportunities in the Asia/Pacific region,where valuations appeared to be
relatively low.The portfolio's investments in Brazil fared well as the local economy became increasingly independent of more developed markets. In addition, we added to the portfolio's holdings in Germany, where high savings rates imply that consumer spending could rise.
What is the portfolio's current strategy?
As they reached higher valuations, we recently reduced the portfolio's exposure to tobacco and mining companies. Conversely, we increased the portfolio's participation in the technology sector, where some companies may benefit from a rebound in consumer spending.We also established positions in some of Japan's major automobile manufacturers, which should see greater demand for fuel-efficient vehicles in the United States. Finally, we have maintained the portfolio's regional emphasis on Asia and sector emphasis on the telecommunications area. In our judgment, these strategies position the portfolio well for a market environment in which we believe selectivity is likely to be a more important driver of performance.
| | | The portfolio is only available as a funding vehicle under variable life insurance policies or variable |
| | | annuity contracts issued by insurance companies. Individuals may not purchase shares of the |
| | | portfolio directly. A variable annuity is an insurance contract issued by an insurance company that |
| | | enables investors to accumulate assets on a tax-deferred basis for retirement or other long-term |
| | | goals.The investment objective and policies of Dreyfus Variable Investment Fund, International |
| | | Equity Portfolio made available through insurance products may be similar to other funds/ |
| | | portfolios managed or advised by Dreyfus. However, the investment results of the portfolio may be |
| | | higher or lower than, and may not be comparable to, those of any other Dreyfus fund/portfolio. |
| 1 | | Total return includes reinvestment of dividends and any capital gains paid. Past performance is no |
| | | guarantee of future results. Share price and investment return fluctuate such that upon redemption, |
| | | portfolio shares may be worth more or less than their original cost.The portfolio's performance does |
| | | not reflect the deduction of additional charges and expenses imposed in connection with investing |
| | | in variable insurance contracts, which will reduce returns. |
| | | Part of the portfolio's recent performance is attributable to positive returns from its initial |
| | | public offering (IPO) investments. There can be no guarantee that IPOs will have or |
| | | continue to have a positive effect on the portfolio's performance. Currently, the portfolio is |
| | | relatively small in asset size. IPOs tend to have a reduced effect on performance as a |
| | | portfolio's asset base grows. |
| 2 | | SOURCE: LIPPER INC. — Reflects reinvestment of net dividends and, where applicable, |
| | | capital gain distributions.The Morgan Stanley Capital International Europe, Australasia, Far |
| | | East (MSCI EAFE) Index is an unmanaged index composed of a sample of companies |
| | | representative of the market structure of European and Pacific Basin countries. |
| 3 | | Source: Lipper Inc. |
The Portfolio 5
| UNDERSTANDING YOUR |
| PORTFOLIO'S EXPENSES (Unaudited) |
As a mutual fund investor,you pay ongoing expenses,such as management fees and other expenses.Using the information below, you can estimate how these expenses affect your investment and compare them with the expenses of other funds.You also may pay one-time transaction expenses, including sales charges (loads) and redemption fees, which are not shown in this section and would have resulted in higher total expenses. For more information, see your portfolio's prospectus or talk to your financial adviser.
Review your portfolio's expenses
|
The table below shows the expenses you would have paid on a $1,000 investment in Dreyfus Variable Investment Fund, International Equity Portfolio from January 1, 2005 to June 30, 2005. It also shows how much a $1,000 investment would be worth at the close of the period, assuming actual returns and expenses.
| Expenses and Value of a $1,000 Investment | | |
| assuming actual returns for the six months ended June 30, 2005 | | |
| | | Initial Shares | | Service Shares |
| |
| |
|
| Expenses paid per $1,000 † | | $ 5.85 | | $ 7.09 |
| Ending value (after expenses) | | $1,000.00 | | $998.60 |
COMPARING YOUR PORTFOLIO'S EXPENSES WITH THOSE OF OTHER FUNDS (Unaudited)
Using the SEC's method to compare expenses
The Securities and Exchange Commission (SEC) has established guidelines to help investors assess fund expenses. Per these guidelines, the table below shows your portfolio's expenses based on a $1,000 investment, assuming a hypothetical 5% annualized return. You can use this information to compare the ongoing expenses (but not transaction expenses or total cost) of investing in the portfolio with those of other funds. All mutual fund shareholder reports will provide this information to help you make this comparison. Please note that you cannot use this information to estimate your actual ending account balance and expenses paid during the period.
Expenses and Value of a $1,000 Investment assuming a hypothetical 5% annualized return for the six months ended June 30, 2005
| | | Initial Shares | | Service Shares |
| |
| |
|
| Expenses paid per $1,000 † | | $ 5.91 | | $ 7.15 |
| Ending value (after expenses) | | $1,018.94 | | $1,017.70 |
† Expenses are equal to the fund's annualized expense ratio of 1.18% for Initial shares and 1.43% for Service shares; multiplied by the average account value over the period, multiplied by 181/365 (to reflect the one-half year period).
STATEMENT OF INVESTMENTS
June 30, 2005 (Unaudited)
|
| Common Stocks—97.5% | | Shares | | | | Value ($) |
| |
| |
| |
|
| Australia—.6% | | | | | | |
| Multiplex Group | | 109,252 | | | | 241,654 |
| Austria—.7% | | | | | | |
| Erste Bank der Oesterreichischen Sparkassen | | 5,887 | | | | 294,641 |
| Belgium—1.3% | | | | | | |
| KBC Groep | | 7,081 | | | | 559,399 |
| Brazil—4.8% | | | | | | |
| Brasil Telecom Participacoes, ADR | | 16,923 | | | | 610,920 |
| Natura Cosmeticos | | 21,400 | | | | 685,771 |
| Petroleo Brasileiro, ADR | | 16,426 | | | | 756,253 |
| | | | | | | 2,052,944 |
| Canada—2.9% | | | | | | |
| Bank of Nova Scotia | | 8,073 | | | | 266,558 |
| EnCana | | 11,950 | | | | 470,389 |
| Oncolytics Biotech | | 151,225 | | a | | 508,682 |
| Oncolytics Biotech | | | | | | |
| (Purchase Warrants October 2005) | | 30,134 | | a | | — |
| | | | | | | 1,245,629 |
| France—8.5% | | | | | | |
| AXA | | 17,187 | | | | 429,788 |
| Air Liquide | | 1,657 | | | | 282,454 |
| France Telecom | | 18,556 | | | | 542,369 |
| Sanofi-Aventis | | 9,565 | | | | 785,721 |
| Societe Generale | | 5,014 | | | | 510,449 |
| Total | | 2,748 | | | | 645,956 |
| Vinci | | 5,382 | | | | 447,967 |
| | | | | | | 3,644,704 |
| Germany—6.2% | | | | | | |
| Bayerische Hypo-und Vereinsbank | | 22,557 | | a | | 586,996 |
| Celesio | | 3,604 | | | | 283,364 |
| Deutsche Boerse | | 4,304 | | | | 337,100 |
| Deutsche Postbank | | 11,791 | | | | 580,147 |
| E.ON | | 4,910 | | | | 437,668 |
| Metro | | 8,554 | | | | 424,190 |
| Premiere | | 700 | | | | 24,220 |
| | | | | | | 2,673,685 |
The Portfolio 7
STATEMENT OF INVESTMENTS (Unaudited) (continued)
| Common Stocks (continued) | | Shares | | Value ($) |
| |
| |
|
| Greece—1.1% | | | | |
| EFG Eurobank Ergasias | | 14,846 | | 456,920 |
| Hong Kong—1.0% | | | | |
| China Netcom Group (Hong Kong) | | 292,000 | | 424,610 |
| India—.8% | | | | |
| Reliance Industries, GDR | | 11,686 | | 340,179 |
| Italy—4.6% | | | | |
| Assicurazioni Generali | | 8,853 | | 276,327 |
| ENI | | 14,812 | | 381,866 |
| Enel | | 47,261 | | 411,670 |
| Telecom Italia | | 165,524 | | 429,538 |
| UniCredito Italiano | | 90,388 | | 477,592 |
| | | | | 1,976,993 |
| Japan—13.6% | | | | |
| Acom | | 6,570 | | 421,120 |
| Asahi Breweries | | 31,200 | | 371,840 |
| Canon | | 8,200 | | 431,715 |
| Honda Motor | | 6,500 | | 320,532 |
| Japan Retail Fund Investment | | 76 | | 651,575 |
| Japan Tobacco | | 39 | | 520,352 |
| KDDI | | 62 | | 286,734 |
| Matsui Securities | | 30,000 | | 322,380 |
| Mitsubishi Tokyo Financial Group | | 43 | | 364,778 |
| NEC Electronics | | 5,400 | | 243,408 |
| Nippon Building Fund | | 60 | | 540,906 |
| Promise | | 7,100 | | 455,091 |
| Secom | | 9,500 | | 408,519 |
| Toyota Motor | | 15,100 | | 540,428 |
| | | | | 5,879,378 |
| Malaysia—1.1% | | | | |
| Astro All Asia Networks | | 177,700 | | 254,859 |
| Maxis Communications | | 88,000 | | 224,632 |
| | | | | 479,491 |
| Common Stocks (continued) | | Shares | | Value ($) |
| |
| |
|
| Netherlands—2.3% | | | | |
| ASML Holding | | 21,289 a | | 335,336 |
| Royal Dutch Petroleum | | 5,331 | | 348,270 |
| TNT | | 11,504 | | 291,572 |
| | | | | 975,178 |
| New Zealand—.7% | | | | |
| Sky City Entertainment Group | | 99,591 | | 310,399 |
| Norway—1.1% | | | | |
| Norsk Hydro | | 5,171 | | 474,665 |
| Russia—.9% | | | | |
| AFK Sistema, GDR | | 25,028 | | 410,459 |
| Singapore—4.4% | | | | |
| MobileOne | | 284,720 | | 367,991 |
| Singapore Airlines | | 53,000 | | 351,930 |
| Singapore Post | | 771,000 | | 454,820 |
| Singapore Press Holdings | | 111,500 | | 284,253 |
| United Overseas Bank | | 49,000 | | 412,521 |
| United Overseas Land | | 4,900 | | 6,624 |
| | | | | 1,878,139 |
| South Korea—3.3% | | | | |
| KT&G, GDR | | 48,875 b | | 970,169 |
| Samsung Electronics, GDR | | 1,802 | | 431,129 |
| | | | | 1,401,298 |
| Spain—3.4% | | | | |
| Abertis Infraestrusturas | | 10,705 | | 272,876 |
| Acciona | | 3,800 | | 376,974 |
| Altadis | | 10,454 | | 438,480 |
| Iberdrola | | 13,951 | | 368,276 |
| | | | | 1,456,606 |
| Sweden—1.7% | | | | |
| Investor, Cl. B | | 21,540 | | 292,236 |
| Telefonaktiebolaget LM Ericsson, Cl. B | | 134,360 | | 431,644 |
| | | | | 723,880 |
The Portfolio 9
STATEMENT OF INVESTMENTS (Unaudited) (continued)
| Common Stocks (continued) | | Shares | | Value ($) |
| |
| |
|
| Switzerland—4.6% | | | | |
| Nestle | | 2,130 | | 544,961 |
| Novartis | | 8,082 | | 384,872 |
| Roche Holding | | 3,007 | | 380,449 |
| UBS | | 8,508 | | 663,651 |
| | | | | 1,973,933 |
| Taiwan—3.1% | | | | |
| Chunghwa Telecom, ADR | | 19,686 | | 421,871 |
| Fubon Financial Holding, GDR | | 62,462 | | 602,758 |
| Taiwan Semiconductor Manufacturing, ADR | | 35,541 | | 324,138 |
| | | | | 1,348,767 |
| Thailand—3.4% | | | | |
| Advanced Info Service | | 222,500 | | 527,647 |
| Bank of Ayudhya | | 1,368,200 a | | 407,232 |
| Siam Cement | | 87,400 | | 511,816 |
| | | | | 1,446,695 |
| United Kingdom—21.4% | | | | |
| Admiral Group | | 63,769 | | 425,124 |
| AstraZeneca | | 8,106 | | 335,264 |
| BHP Billiton | | 63,135 | | 804,508 |
| BP | | 130,499 | | 1,356,948 |
| British American Tobacco | | 23,347 | | 449,597 |
| GlaxoSmithKline | | 36,993 | | 894,448 |
| HSBC Holdings | | 77,359 | | 1,232,200 |
| Imperial Tobacco Group | | 9,457 | | 254,386 |
| National Grid Transco | | 57,395 | | 555,714 |
| Old Mutual | | 159,192 | | 346,425 |
| Shell Transport & Trading | | 125,682 | | 1,220,823 |
| Smith & Nephew | | 42,675 | | 420,829 |
| Tesco | | 45,135 | | 257,480 |
| Vodafone Group | | 347,248 | | 845,199 |
| | | | | 9,398,945 |
| Total Common Stocks | | | | |
| (cost $35,221,945) | | | | 42,069,191 |
| Preferred Stocks—2.2% | | Shares | | Value ($) |
| |
| |
|
| Brazil—1.1% | | | | |
| All America Latina Logistica | | 92,000 | | 464,527 |
| Germany—1.1% | | | | |
| Henkel KGaA | | 5,657 | | 506,102 |
| Total Preferred Stocks | | | | |
| (cost $905,899) | | | | 970,629 |
| |
| |
|
| Total Investments (cost $36,127,844) | | 99.7% | | 43,039,820 |
| Cash and Receivables (Net) | | .3% | | 114,750 |
| Net Assets | | 100.0% | | 43,154,570 |
| ADR—American Depository Receipts. |
| GDR—Global Depository Receipts. |
| a Non-income producing. |
| b Security exempt from registration under Rule 144A of Securities Act of 1933.This security may be resold in |
| transactions exempt from registration, normally to qualified institutional buyers. At June 30, 2005, this security |
| amounted to $970,169 or 2.2% of net assets. |
| Portfolio Summary (Unaudited) † | | | | |
| |
| | | Value (%) | | | | Value (%) |
| |
| |
| |
|
| Banks | | 16.1 | | Information Technology Hardware | | 3.7 |
| Oil & Gas | | 13.5 | | Insurance | | 3.6 |
| Telecommunication Services | | 10.3 | | Construction & Building Materials | | 3.0 |
| Pharmaceuticals & Biotechnology | | 8.3 | | Other | | 30.2 |
| Tobacco | | 6.0 | | | | |
| Specialty & Other Finance | | 5.0 | | | | 99.7 |
† Based on net assets.
See notes to financial statements.
The Portfolio 11
STATEMENT OF ASSETS AND LIABILITIES
June 30, 2005 (Unaudited)
|
| | | Cost | | Value |
| |
| |
|
| Assets ($): | | | | |
| Investments in securities—See Statement of Investments | | 36,127,844 | | 43,039,820 |
| Cash | | | | 127,772 |
| Cash denominated in foreign currencies | | 2,764 | | 2,740 |
| Receivable for investment securities sold | | | | 135,147 |
| Dividends receivable | | | | 103,633 |
| Prepaid expenses | | | | 1,069 |
| | | | | 43,410,181 |
| |
| |
|
| Liabilities ($): | | | | |
| Due to The Dreyfus Corporation and affiliates—Note 3(b) | | | | 29,765 |
| Payable for investment securities purchased | | | | 154,501 |
| Payable for shares of Beneficial Interest redeemed | | | | 4,306 |
| Unrealized depreciation on forward | | | | |
| currency exchange contracts—Note 4 | | | | 35,826 |
| Accrued expenses | | | | 31,213 |
| | | | | 255,611 |
| |
| |
|
| Net Assets ($) | | | | 43,154,570 |
| |
| |
|
| Composition of Net Assets ($): | | | | |
| Paid-in capital | | | | 53,931,897 |
| Accumulated distributions in excess of investment income—net | | (284,209) |
| Accumulated net realized gain (loss) on investments | | | | (17,366,387) |
| Accumulated net unrealized appreciation (depreciation) | | | | |
| on investments and foreign currency transactions | | | | 6,873,269 |
| |
| |
|
| Net Assets ($) | | | | 43,154,570 |
| |
| |
|
| |
| |
| Net Asset Value Per Share | | | | |
| | | Initial Shares | | Service Shares |
| |
| |
|
| Net Assets ($) | | 38,100,607 | | 5,053,963 |
| Shares Outstanding | | 2,665,169 | | 353,379 |
| |
| |
|
| Net Asset Value Per Share ($) | | 14.30 | | 14.30 |
See notes to financial statements.
|
STATEMENT OF OPERATIONS
Six Months Ended June 30, 2005 (Unaudited)
|
| Investment Income ($): | | |
| Income: | | |
| Cash dividends (net of $105,832 foreign taxes withheld at source) | | 767,130 |
| Expenses: | | |
| Investment advisory fee—Note 3(a) | | 160,316 |
| Custodian fees | | 38,040 |
| Prospectus and shareholders' reports | | 33,712 |
| Auditing fees | | 14,483 |
| Distribution fees—Note 3(b) | | 5,661 |
| Shareholder servicing costs—Note 3(b) | | 2,382 |
| Trustees' fees and expenses—Note 3(c) | | 1,864 |
| Legal fees | | 610 |
| Registration fees | | 172 |
| Loan commitment fees—Note 2 | | 123 |
| Miscellaneous | | 5,275 |
| Total Expenses | | 262,638 |
| Less—reduction in custody fees due to | | |
| earnings credits—Note 1(c) | | (4,737) |
| Net Expenses | | 257,901 |
| Investment Income—Net | | 509,229 |
| |
|
| Realized and Unrealized Gain (Loss) on Investments—Note 4 ($): |
| Net realized gain (loss) on investments and foreign currency transactions | | 3,873,251 |
| Net realized gain (loss) on forward currency exchange contracts | | 117,702 |
| Net Realized Gain (Loss) | | 3,990,953 |
| Net unrealized appreciation (depreciation) | | |
| on investments and foreign currency transactions | | (4,519,317) |
| Net Realized and Unrealized Gain (Loss) on Investments | | (528,364) |
| Net (Decrease) in Net Assets Resulting from Operations | | (19,135) |
See notes to financial statements.
|
The Portfolio 13
STATEMENT OF CHANGES IN NET ASSETS
| | | Six Months Ended | | |
| | | June 30, 2005 | | Year Ended |
| | | (Unaudited) | | December 31, 2004 |
| |
| |
|
| Operations ($): | | | | |
| Investment income—net | | 509,229 | | 793,607 |
| Net realized gain (loss) on investments | | 3,990,953 | | 5,531,332 |
| Net unrealized appreciation | | | | |
| (depreciation) on investments | | (4,519,317) | | 2,245,710 |
| Net Increase (Decrease) in Net Assets | | | | |
| Resulting from Operations | | (19,135) | | 8,570,649 |
| |
| |
|
| Dividends to Shareholders from ($): | | | | |
| Investment income—net: | | | | |
| Initial shares | | (160,712) | | (1,378,991) |
| Service shares | | (9,235) | | (137,306) |
| Total Dividends | | (169,947) | | (1,516,297) |
| |
| |
|
| Beneficial Interest Transactions ($): | | | | |
| Net proceeds from shares sold: | | | | |
| Initial shares | | 3,005,168 | | 4,222,550 |
| Service shares | | 1,251,314 | | 1,471,321 |
| Dividends reinvested: | | | | |
| Initial shares | | 160,712 | | 1,378,991 |
| Service shares | | 9,235 | | 137,306 |
| Cost of shares redeemed: | | | | |
| Initial shares | | (3,761,125) | | (5,980,727) |
| Service shares | | (460,060) | | (1,412,444) |
| Increase (Decrease) in Net Assets from | | | | |
| Beneficial Interest Transactions | | 205,244 | | (183,003) |
| Total Increase (Decrease) in Net Assets | | 16,162 | | 6,871,349 |
| |
| |
|
| Net Assets ($): | | | | |
| Beginning of Period | | 43,138,408 | | 36,267,059 |
| End of Period | | 43,154,570 | | 43,138,408 |
| Distributions in excess of investment income—net | | (284,209) | | (623,491) |
| | | Six Months Ended | | |
| | | June 30, 2005 | | Year Ended |
| | | (Unaudited) | | December 31, 2004 |
| |
| |
|
| Capital Share Transactions: | | | | |
| Initial Shares | | | | |
| Shares sold | | 209,938 | | 334,613 |
| Shares issued for dividends reinvested | | 11,334 | | 100,613 |
| Shares redeemed | | (263,051) | | (475,177) |
| Net Increase (Decrease) in Shares Outstanding | | (41,779) | | (39,951) |
| |
| |
|
| Service Shares | | | | |
| Shares sold | | 88,063 | | 117,142 |
| Shares issued for dividends reinvested | | 651 | | 9,989 |
| Shares redeemed | | (32,440) | | (112,465) |
| Net Increase (Decrease) in Shares Outstanding | | 56,274 | | 14,666 |
See notes to financial statements.
|
The Portfolio 15
The following tables describe the performance for each share class for the fiscal periods indicated. All information (except portfolio turnover rate) reflects financial results for a single portfolio share.Total return shows how much your investment in the portfolio would have increased (or decreased) during each period, assuming you had reinvested all dividends and distributions.These figures have been derived from the portfolio's financial statements.
| | | Six Months Ended | | | | | | | | | | |
| | | June 30, 2005 | | | | Year Ended December 31, | | |
| | | |
| |
| |
|
| Initial Shares | | (Unaudited) | | 2004 | | 2003 | | 2002 | | 2001 | | 2000 |
| |
| |
| |
| |
| |
| |
|
| Per Share Data ($): | | | | | | | | | | | | |
| Net asset value, | | | | | | | | | | | | |
| beginning of period | | 14.36 | | 11.97 | | 8.75 | | 10.76 | | 15.34 | | 22.34 |
| Investment Operations: | | | | | | | | | | | | |
| Investment income—net a | | .17 | | .27 | | .14 | | .10 | | .03 | | .07 |
| Net realized and unrealized | | | | | | | | | | | | |
| gain (loss) on investments | | (.17) | | 2.64 | | 3.55 | | (1.81) | | (4.50) | | (3.45) |
| Total from Investment Operations | | — | | 2.91 | | 3.69 | | (1.71) | | (4.47) | | (3.38) |
| Distributions: | | | | | | | | | | | | |
| Dividends from | | | | | | | | | | | | |
| investment income—net | | (.06) | | (.52) | | (.47) | | (.30) | | (.11) | | (.05) |
| Dividends from net realized | | | | | | | | | | | | |
| gain on investments | | — | | — | | — | | — | | — | | (2.66) |
| Dividends in excess of net realized | | | | | | | | | | |
| gain on investments | | — | | — | | — | | — | | — | | (.91) |
| Total Distributions | | (.06) | | (.52) | | (.47) | | (.30) | | (.11) | | (3.62) |
| Net asset value, end of period | | 14.30 | | 14.36 | | 11.97 | | 8.75 | | 10.76 | | 15.34 |
| |
| |
| |
| |
| |
| |
|
| Total Return (%) | | .00b,c | | 24.57 | | 42.89 | | (15.94) | | (29.18) | | (16.40) |
| |
| |
| |
| |
| |
| |
|
| Ratios/Supplemental Data (%): | | | | | | | | | | |
| Ratio of total expenses | | | | | | | | | | | | |
| to average net assets | | .60b | | 1.04 | | 1.19 | | 1.14 | | 1.08 | | .99 |
| Ratio of net expenses | | | | | | | | | | | | |
| to average net assets | | .59b | | 1.04 | | 1.19 | | 1.14 | | 1.08 | | .99 |
| Ratio of net investment income | | | | | | | | | | | | |
| to average net assets | | 1.19b | | 2.13 | | 1.42 | | .96 | | .25 | | .33 |
| Portfolio Turnover Rate | | 40.01b | | 96.55 | | 101.02 | | 116.65 | | 238.88 | | 192.42 |
| |
| |
| |
| |
| |
| |
|
| Net Assets, end of period | | | | | | | | | | | | |
| ($ x 1,000) | | 38,101 | | 38,874 | | 32,892 | | 27,117 | | 39,961 | | 65,854 |
| |
| a | | Based on average shares outstanding at each month end. | | | | | | | | |
| b | | Not annualized. | | | | | | | | | | | | |
| c | | Amount represents less than .01%. | | | | | | | | | | | | |
| See notes to financial statements. | | | | | | | | | | | | |
16
| | | Six Months Ended | | | | | | | | | | |
| | | June 30, 2005 | | | | Year Ended December 31, | | |
| | | |
| |
| |
|
| Service Shares | | (Unaudited) | | 2004 | | 2003 | | 2002 | | 2001 | | 2000 a |
| |
| |
| |
| |
| |
| |
|
| Per Share Data ($): | | | | | | | | | | | | |
| Net asset value, | | | | | | | | | | | | |
| beginning of period | | 14.35 | | 11.95 | | 8.74 | | 10.75 | | 15.34 | | 15.34 |
| Investment Operations: | | | | | | | | | | | | |
| Investment income (loss)—net | | .16b | | .24b | | .12b | | .07b | | (.03)b | | — |
| Net realized and unrealized | | | | | | | | | | | | |
| gain (loss) on investments | | (.18) | | 2.63 | | 3.54 | | (1.80) | | (4.47) | | — |
| Total from Investment Operations | | (.02) | | 2.87 | | 3.66 | | (1.73) | | (4.50) | | — |
| Distributions: | | | | | | | | | | | | |
| Dividends from | | | | | | | | | | | | |
| investment income—net | | (.03) | | (.47) | | (.45) | | (.28) | | (.09) | | — |
| Net asset value, end of period | | 14.30 | | 14.35 | | 11.95 | | 8.74 | | 10.75 | | 15.34 |
| |
| |
| |
| |
| |
| |
|
| Total Return (%) | | (.14)c | | 24.20 | | 42.56 | | (16.20) | | (29.35) | | — |
| |
| |
| |
| |
| |
| |
|
| Ratios/Supplemental Data (%): | | | | | | | | | | |
| Ratio of total expenses | | | | | | | | | | | | |
| to average net assets | | .72c | | 1.29 | | 1.44 | | 1.41 | | 1.47 | | — |
| Ratio of net expenses | | | | | | | | | | | | |
| to average net assets | | .71c | | 1.29 | | 1.44 | | 1.41 | | 1.47 | | — |
| Ratio of net investment income | | | | | | | | | | | | |
| (loss) to average net assets | | 1.10c | | 1.89 | | 1.17 | | .74 | | (.27) | | — |
| Portfolio Turnover Rate | | 40.01c | | 96.55 | | 101.02 | | 116.65 | | 238.88 | | 192.42 |
| |
| |
| |
| |
| |
| |
|
| Net Assets, end of period | | | | | | | | | | | | |
| ($ x 1,000) | | 5,054 | | 4,265 | | 3,375 | | 2,017 | | 1,644 | | 1 |
| |
| a | | The portfolio commenced offering Service shares on December 31, 2000. | | | | | | |
| b | | Based on average shares outstanding at each month end. | | | | | | | | |
| c | | Not annualized. | | | | | | | | | | | | |
| See notes to financial statements. | | | | | | | | | | | | |
The Portfolio 17
NOTES TO FINANCIAL STATEMENTS (Unaudited)
NOTE 1—Significant Accounting Policies:
Dreyfus Variable Investment Fund (the "fund") is registered under the Investment Company Act of 1940, as amended (the "Act"), as an open-end management investment company, operating as a series company currently offering twelve series, including the International Equity Portfolio (the "portfolio"). The portfolio is only offered to separate accounts established by insurance companies to fund variable annuity contracts and variable life insurance policies.The portfolio is a non-diversified series. The portfolio's investment objective is to maximize capital growth. The Dreyfus Corporation ("Dreyfus") serves as the portfolio's investment adviser. Dreyfus is a wholly-owned subsidiary of Mellon Financial Corporation ("Mellon Financial"). Newton Capital Management Limited ("Newton") is the portfolio's sub-investment adviser. Newton is also a wholly-owned subsidiary of Mellon Bank, N. A., and an affiliate of Dreyfus.
Dreyfus Service Corporation (the "Distributor"), a wholly-owned subsidiary of Dreyfus, is the distributor of the portfolio's shares, which are sold without a sales charge.The portfolio is authorized to issue an unlimited number of $.001 par value shares of Beneficial Interest in each of the following classes of shares: Initial and Service. Each class of shares has identical rights and privileges, except with respect to the distribution plan and the expenses borne by each class and certain voting rights. Income, expenses (other than expenses attributable to a specific class), and realized and unrealized gains or losses on investments are allocated to each class of shares based on its relative net assets.
The fund accounts separately for the assets, liabilities and operations of each series. Expenses directly attributable to each series are charged to that series' operations; expenses which are applicable to all series' are allocated among them on a pro rata basis.
The portfolio's financial statements are prepared in accordance with U.S. generally accepted accounting principles, which may require the use of management estimates and assumptions.Actual results could differ from those estimates.
The fund enters into contracts that contain a variety of indemnifica-tions.The portfolio's maximum exposure under these arrangements is unknown. The portfolio does not anticipate recognizing any loss related to these arrangements.
(a) Portfolio valuation: Investments in securities are valued at the last sales price on the securities exchange or national securities market on which such securities are primarily traded. Securities listed on the National Market System for which market quotations are available are valued at the official closing price or, if there is no official closing price that day, at the last sales price. Securities not listed on an exchange or the national securities market, or securities for which there were no transactions, are valued at the average of the most recent bid and asked prices, except for open short positions, where the asked price is used for valuation purposes. Bid price is used when no asked price is available. Investments in registered investment companies are valued at their net asset value. When market quotations or official closing prices are not readily available, or are determined not to reflect accurately fair value, such as when the value of a security has been significantly affected by events after the close of the exchange or market on which the security is principally traded (for example, a foreign exchange or market), but before the portfolio calculates its net asset value, the portfolio may value these investments at fair value as determined in accordance with the procedures approved by the Board of Trustees. Fair valuing of securities may be determined with the assistance of a pricing service using calculations based on indices of domestic securities and other appropriate indicators, such as prices of relevant ADR's and futures contracts. For other securities that are fair valued by the Board of Trustees, certain factors may be considered such as: fundamental analytical data, the nature and duration of restrictions on disposition,an evaluation of the forces that influence the market in which the securities are purchased and sold and public trading in similar securities of the issuer or comparable issuers. Financial futures are valued at the last sales price. Investments denominated in foreign currencies are translated to U.S. dollars at the prevailing rates of exchange. Forward currency exchange contracts are valued at the forward rate.
The Portfolio 19
NOTES TO FINANCIAL STATEMENTS (Unaudited) (continued)
(b) Foreign currency transactions: The portfolio does not isolate that portion of the results of operations resulting from changes in foreign exchange rates on investments from the fluctuations arising from changes in market prices of securities held. Such fluctuations are included with the net realized and unrealized gain or loss on investments.
Net realized foreign exchange gains or losses arise from sales and maturities of short-term securities, sales of foreign currencies, currency gains or losses realized on securities transactions and the difference between the amounts of dividends, interest and foreign withholding taxes recorded on the portfolio's books and the U.S. dollar equivalent of the amounts actually received or paid. Net unrealized foreign exchange gains or losses arise from changes in the value of assets and liabilities other than investments in securities, resulting from changes in exchange rates. Such gains and losses are included with net realized and unrealized gain or loss on investments.
(c) Securities transactions and investment income: Securities transactions are recorded on a trade date basis. Realized gain and loss from securities transactions are recorded on the identified cost basis. Dividend income is recognized on the ex-dividend date and interest income, including, where applicable, accretion of discount and amortization of premium on investments, is recognized on the accrual basis.
The portfolio has an arrangement with the custodian bank whereby the portfolio receives earnings credits from the custodian when positive cash balances are maintained, which are used to offset custody fees. For financial reporting purposes, the portfolio includes net earnings credits as an expense offset in the Statement of Operations.
(d) Dividends to shareholders: Dividends are recorded on the ex-dividend date. Dividends from investment income-net and dividends from net realized capital gain, if any, are normally declared and paid annually, but the portfolio may make distributions on a more frequent basis to
comply with the distribution requirements of the Internal Revenue Code of 1986, as amended (the "Code").To the extent that net realized capital gain can be offset by capital loss carryovers, it is the policy of the portfolio not to distribute such gain. Income and capital gain distributions are determined in accordance with income tax regulations, which may differ from U.S. generally accepted accounting principles.
(e) Federal income taxes: It is the policy of the portfolio to continue to qualify as a regulated investment company, if such qualification is in the best interests of its shareholders, by complying with the applicable provisions of the Code, and to make distributions of taxable income sufficient to relieve it from substantially all federal income and excise taxes.
The portfolio has an unused capital loss carryover of $21,344,259 available for federal income tax purposes to be applied against future net securities profits, if any, realized subsequent to December 31, 2004. If not applied, $16,246,805 of the carryover expires in fiscal 2009, $3,933,328 expires in fiscal 2010 and $1,164,126 expires in fiscal 2011.
The tax character of distributions paid to shareholders during the fiscal year ended December 31, 2004 was as follows: ordinary income $1,516,297. The tax character of current year distributions will be determined at the end of the current fiscal year.
NOTE 2—Bank Line of Credit:
|
The portfolio participates with other Dreyfus-managed funds in a $350 million redemption credit facility (the "Facility") to be utilized for temporary or emergency purposes, including the financing of redemptions. In connection therewith, the portfolio has agreed to pay commitment fees on its pro rata portion of the Facility. Interest is charged to the portfolio based on prevailing market rates in effect at the time of borrowings. During the period ended June 30, 2005, the portfolio did not borrow under the Facility.
The Portfolio 21
NOTES TO FINANCIAL STATEMENTS (Unaudited) (continued)
NOTE 3—Investment Advisory Fee, Sub-Investment Advisory Fee and Other Transactions with Affiliates:
(a) Pursuant to an Investment Advisory Agreement with Dreyfus, the investment advisory fee is computed at the annual rate of .75 of 1% of the value of the portfolio's average daily net assets and is payable monthly.
Pursuant to a Sub-Investment Advisory Agreement between Dreyfus and Newton, the sub-investment advisory fee is payable monthly by Dreyfus, and is based upon the value of the portfolio's average daily net assets, computed at the following annual rates:
| Average Net Assets | | |
| 0 to $100 million | | .35 of 1% |
| $100 million to $1 billion | | .30 of 1% |
| $1 billion to $1.5 billion | | .26 of 1% |
| In excess of $1.5 billion | | .20 of 1% |
(b) Under the Distribution Plan (the "Plan") adopted pursuant to Rule 12b-1 under the Act, Service shares pay the Distributor for distributing their shares, for servicing and/or maintaining Service shares shareholder accounts and for advertising and marketing for Service shares.The Plan provides for payments to be made at an annual rate of .25 of 1% of the value of Service shares' average daily net assets. The Distributor may make payments to Participating Insurance Companies and to brokers and dealers acting as principal underwriter for their variable insurance products.The fees payable under the Plan are payable without regard to actual expenses incurred. During the period ended June 30, 2005, Service shares were charged $5,661 pursuant to the Plan.
The portfolio compensates Dreyfus Transfer, Inc., a wholly-owned subsidiary of Dreyfus, under a transfer agency agreement for providing personnel and facilities to perform transfer agency services for the portfolio. During the period ended June 30, 2005, the portfolio was charged $75 pursuant to the transfer agency agreement.
During the period ended June 30, 2005, the portfolio was charged $1,998 for services performed by the Chief Compliance Officer.
The components of Due to The Dreyfus Corporation and affiliates in the Statement of Assets and Liabilities consist of: investment advisory fee $26,695, Rule 12b-1 distribution plan fees $1,043, chief compliance officer fees $1,998 and transfer agency per account fees $29.
(c) Each Board member also serves as a Board member of other funds within the Dreyfus complex. Annual retainer fees and attendance fees are allocated to each portfolio based on net assets.
NOTE 4— Securities Transactions:
The aggregate amount of purchases and sales of investment securities, excluding short-term securities and forward currency exchange contracts, during the period ended June 30, 2005, amounted to $17,071,797 and $17,574,944, respectively.
The portfolio enters into forward currency exchange contracts in order to hedge its exposure to changes in foreign currency exchange rates on its foreign portfolio holdings and to settle foreign currency transactions. When executing forward currency exchange contracts, the portfolio is obligated to buy or sell a foreign currency at a specified rate on a certain date in the future. With respect to sales of forward currency exchange contracts, the portfolio would incur a loss if the value of the contract increases between the date the forward contract is opened and the date the forward contract is closed.The portfolio realizes a gain if the value of the contract decreases between those dates.With respect to purchases of forward currency exchange contracts, the portfolio would incur a loss if the value of the contract decreases between the date the forward contract is opened and the date the forward contract is closed. The portfolio realizes a gain if the value of the contract increases between those dates.The portfolio is also exposed to credit risk associ-
The Portfolio 23
NOTES TO FINANCIAL STATEMENTS (Unaudited) (continued)
ated with counterparty nonperformance on these forward currency exchange contracts which is typically limited to the unrealized gain on each open contract.The following summarizes open forward currency exchange contracts at June 30, 2005:
| | | Foreign | | | | | | |
| Forward Currency | | Currency | | | | | | Unrealized |
| Exchange Contracts | | Amounts | | Cost ($) | | Value ($) | | (Depreciation) ($) |
| |
| |
| |
| |
|
| Purchases; | | | | | | | | |
| Singapore Dollar, | | | | | | | | |
| expiring 11/15/2005 | | 2,400,767 | | 1,468,000 | | 1,432,182 | | (35,818) |
| Sales; | | | | Proceeds ($) | | | | |
| Malaysian Ringgit, | | | | | | | | |
| expiring 7/5/2005 | | 242,234 | | 63,738 | | 63,746 | | (8) |
| Total | | | | | | | | (35,826) |
At June 30, 2005, accumulated net unrealized appreciation on investments was $6,911,976, consisting of $7,572,583 gross unrealized appreciation and $660,607 gross unrealized depreciation.
At June 30,2005,the cost of investments for federal income tax purposes was substantially the same as the cost for financial reporting purposes (see the Statement of Investments).
In early 2004, two purported class and derivative actions were filed against Mellon Financial, Mellon Bank, N.A., Dreyfus, Founders Asset Management LLC, and certain directors of the Dreyfus Funds and the Dreyfus Founders Funds (together, the "Funds") in the United States District Court for the Western District of Pennsylvania. In September 2004, plaintiffs served a Consolidated Amended Complaint (the "Amended Complaint") on behalf of a purported class of all persons who acquired interests in any of the Funds between January 30, 1999 and November 17, 2003, and derivatively on behalf of the Funds.The Amended Complaint in the newly styled In re Dreyfus Mutual Funds Fee Litigation also named the Distributor, Premier Mutual Fund Services, Inc. and two additional Fund directors as defendants and
alleges violations of the Investment Company Act of 1940, the Investment Advisers Act of 1940, the Pennsylvania Unfair Trade Practices and Consumer Protection Law and common-law claims. Plaintiffs seek to recover allegedly improper and excessive Rule 12b-1 and advisory fees allegedly charged to the Funds for marketing and distribution services. More specifically, plaintiffs claim, among other things, that 12b-1 fees and directed brokerage were improperly used to pay brokers to recommend the Funds over other funds, and that such payments were not disclosed to investors. In addition, plaintiffs assert that economies of scale and soft-dollar benefits were not passed on to the Funds. Plaintiffs further allege that 12b-1 fees were improperly charged to certain of the Funds that were closed to new investors.The Amended Complaint seeks compensatory and punitive damages, rescission of the advisory contracts, and an accounting and restitution of any unlawful fees, as well as an award of attorneys' fees and litigation expenses. As noted, some of the claims in this litigation are asserted derivatively on behalf of the Funds that have been named as nominal defendants. With respect to such derivative claims, no relief is sought against the Funds. Dreyfus believes the allegations to be totally without merit and intends to defend the action vigorously. In November 2004, all named defendants moved to dismiss the Amended Complaint in whole or substantial part. Briefing was completed in May 2005.
Additional lawsuits arising out of these circumstances and presenting similar allegations and requests for relief may be filed against the defendants in the future. Neither Dreyfus nor the Funds believe that any of the pending actions will have a material adverse effect on the Funds or Dreyfus' ability to perform its contract with the Funds.
The Portfolio 25
INFORMATION ABOUT THE REVIEW
AND APPROVAL OF THE PORTFOLIO'S
I N V E S T M E N T A DV I S O RY A G R E E M E N T (Unaudited)
|
At separate meetings of the Board of Trustees for the fund held on June 8-9, 2005, the Board considered the re-approval, through its annual renewal date of July 31, 2006, of the Investment Advisory Agreement with Dreyfus for the portfolio, pursuant to which Dreyfus provides the portfolio with investment advisory and administrative services, and the Sub-Investment Advisory Agreement ("Sub-Advisory Agreement") between Dreyfus and Newton Capital Management Limited (the "Sub-Adviser"), pursuant to which the Sub-Adviser provides day-to-day management of the portfolio's portfolio subject to Dreyfus' oversight. The Board members who are not "interested persons" (as defined in the Act (the "Independent Trustees")) of the fund were assisted in their review by independent legal counsel and met with counsel in executive session separate from representatives of Dreyfus and the Sub-Adviser.
Analysis of Nature, Extent and Quality of Services Provided to the Portfolio. The Board members received a presentation from representatives of Dreyfus regarding services provided to the portfolio and other funds in the Dreyfus fund complex, and discussed the nature, extent and quality of the services provided to the portfolio pursuant to its Investment Advisory Agreement and by the Sub-Adviser pursuant to the Sub-Advisory Agreement. Dreyfus' representatives reviewed the portfolio's distribution of accounts and the relationships Dreyfus has with various intermediaries and the different needs of each.The Board noted that the portfolio's shares were offered only to separate accounts established by insurance companies to fund variable annuity contracts and variable life insurance policies. Dreyfus' representatives noted the diversity of distribution among the funds in the Dreyfus complex, and Dreyfus' corresponding need for broad, deep, and diverse resources to be able to provide ongoing shareholder services to each distribution channel, including that of the portfolio. The Board also reviewed the number of shareholder accounts in the portfolio, as well as the portfolio's asset size.
The Board members also considered Dreyfus' and the Sub-Adviser's research and portfolio management capabilities and that Dreyfus also provides oversight of day-to-day portfolio operations, including fund
accounting and administration and assistance in meeting legal and regulatory requirements. The Board members also considered Dreyfus' extensive administrative, accounting and compliance infrastructure, as well as Dreyfus' supervisory activities over the Sub-Adviser.
Comparative Analysis of the Portfolio's Performance, Investment Advisory Fee and Expense Ratio. The Board members reviewed the portfolio's performance and expense ratios and placed significant emphasis on comparisons to two groups of comparable funds and Lipper category averages, as applicable.The Board reviewed the portfolio's performance, investment advisory and sub-advisory fees, and total expense ratios within these comparison groups and against the portfolio's Lipper category averages, as applicable.The groups of comparable funds were previously approved by the Board for this purpose, and were prepared using a Board-approved selection methodology that was based, in part, on selecting non-affiliated funds reported in the same Lipper category as the portfolio. The Board members discussed the results of the comparisons and noted the portfolio's good overall performance, including that the portfolio's performance was higher than the averages of its comparison groups and its Lipper category for the 1-year, 3-year, 5-year and 10-year periods, and the portfolio's performance was first or otherwise in the top half of its comparison group rankings for those periods. The Board members also discussed the portfolio's expense ratio for each class of shares, noting that the Initial shares expense ratio was lower than its comparison group average and that the Service shares expense ratio was higher than its comparison group average. They reviewed the range of management fees in the comparison groups and noted that the portfolio's aggregate investment advisory and sub-advisory fee is in the top half (i.e., lower than most of the others) of the comparison groups.
Representatives of Dreyfus reviewed with the Board the fees paid to Dreyfus or its affiliates by mutual funds managed by Dreyfus or its affiliates with similar investment objectives, policies and strategies as the portfolio (the "Similar Funds"), of which there was one.The represen-
The Portfolio 27
I N FO R M AT I O N A B O U T T H E R E V I E W A N D A P P R OVA L O F T H E P O R T FO L I O ' S
I N V E S T M E N T A DV I S O RY A G R E E M E N T (Unaudited) (continued)
|
tatives of Dreyfus noted the Sub-Adviser's standard management charges for non-UK institutional separate accounts (the "Separate Accounts" and, collectively with the Similar Fund, the "Similar Accounts") and that there were no separate accounts managed by Dreyfus or its affiliates with similar investment objectives, policies and strategies as the portfolio.The Similar Funds' comparison group was composed exclusively of mutual funds affiliated with Dreyfus that are contained in the same Lipper category as the portfolio. Dreyfus' representatives also reviewed the costs associated with distribution through intermediaries.The Board analyzed differences in fees paid to Dreyfus and the Sub-Adviser and discussed the relationship of the advisory fees paid in light of Dreyfus' and the Sub-Adviser's performance and the services provided. It was noted that the portfolio's aggregate investment advisory and sub-advisory fee was lower than the management fee of the Similar Fund.The Board members considered the relevance of the fee information provided for the Similar Accounts to evaluate the appropriateness and reasonableness of the portfolio's advisory fees. The Board acknowledged that differences in fees paid by the Separate Accounts seemed to be consistent with the services that typically would be provided.
Analysis of Profitability and Economies of Scale. Dreyfus' representatives reviewed the dollar amount of expenses allocated and profit received by Dreyfus and the Sub-Adviser and the method used to determine such expenses and profit. The Board received and considered information prepared by an independent consulting firm regarding Dreyfus' approach to allocating costs to, and determining the profitability of, individual funds and the entire Dreyfus mutual fund com-plex.The consulting firm also analyzed where any economies of scale might emerge as assets grow.The Board members evaluated the analysis in light of the relevant circumstances for the portfolio, including the increase in assets and the extent to which economies of scale would be realized as the portfolio grows and whether fee levels reflect these economies of scale for the benefit of portfolio investors. The Board
members also considered potential benefits to Dreyfus from acting as investment adviser and to the Sub-Adviser from acting as sub-adviser and noted that there were no soft dollar arrangements with respect to trading the portfolio's portfolio.
It was noted that the Board members should consider Dreyfus' and the Sub-Adviser's profitability with respect to the portfolio as part of their evaluation of whether the fee under the Investment Advisory Agreement and the Sub-Advisory Agreement bears a reasonable relationship to the mix of services provided by Dreyfus and the Sub-Adviser, including the nature, extent and quality of such services and that a discussion of economies of scale are predicated on increasing assets and that, if a fund's assets had been decreasing, the possibility that Dreyfus may have realized any economies of scale would be less. It also was noted that the profitability percentage for managing the portfolio was within ranges determined by appropriate court cases to be reasonable given the services rendered and, given the portfolio's overall performance and generally superior service levels provided.
At the conclusion of these discussions, each of the Independent Trustees expressed the opinion that he or she had been furnished with sufficient information to make an informed business decision with respect to continuation of the portfolio's Investment Advisory Agreement and Sub-Advisory Agreement, with respect to the portfolio. Based on their discussions and considerations as described above, the Board made the following conclusions and determinations.
- The Board concluded that the nature, extent and quality of the services provided by Dreyfus and the Sub-Adviser are adequate and appropriate.
- The Board generally was satisfied with the portfolio's overall per- formance as compared to its comparison groups and its Lipper category averages.
The Portfolio 29
INFORMATION ABOUT THE REVIEW AND APPROVAL OF THE PORTFOLIO'S
INVESTMENT ADVISORY AGREEMENT (Unaudited) (continued)
|
- The Board concluded that the fee paid by the portfolio to Dreyfus, and the fee paid by Dreyfus to the Sub-Adviser, were reasonable in light of comparative performance and expense and advisory fee information, costs of the services provided and profits to be realized and benefits derived or to be derived by Dreyfus and the Sub- Adviser from their relationship with the portfolio.
- The Board determined that, to the extent that material economies of scale had not been shared with the portfolio, the Board would seek to do so.
The Board members considered these conclusions and determinations, along with information received on a regular and routine basis throughout the year, and, without any one factor being dispositive, the Board determined that approval of the portfolio's Investment Advisory Agreement and Sub-Advisory Agreement, with respect to the portfolio, was in the best interests of the portfolio and its shareholders.
NOTES
For More Information
| Dreyfus Variable Investment Fund, | | Custodian |
| |
| International Equity Portfolio | | |
| | | The Bank of New York |
| 200 Park Avenue | | |
| | | One Wall Street |
| New York, NY 10166 | | |
| | | New York, NY 10286 |
| |
| |
| Investment Adviser | | Transfer Agent & |
| |
| The Dreyfus Corporation | | Dividend Disbursing Agent |
| |
| 200 Park Avenue | | |
| | | Dreyfus Transfer, Inc. |
| New York, NY 10166 | | |
| | | 200 Park Avenue |
| |
| Sub-Investment Adviser | | New York, NY 10166 |
| |
| Newton Capital Management Limited | | Distributor |
| |
| 160 Queen Victoria Street | | |
| | | Dreyfus Service Corporation |
| London, EC4V 4LA | | |
| | | 200 Park Avenue |
| England | | |
| | | New York, NY 10166 |
Telephone 1-800-554-4611 or 516-338-3300
Mail The Dreyfus Family of Funds, 144 Glenn Curtiss Boulevard, Uniondale, NY 11556-0144 Attn: Institutional Servicing
The portfolio files its complete schedule of portfolio holdings with the Securities and Exchange Commission ("SEC") for the first and third quarters of each fiscal year on Form N-Q. The portfolio's Forms N-Q are available on the SEC's website at http://www.sec.gov and may be reviewed and copied at the SEC's Public Reference Room in Washington, DC. Information on the operation of the Public Reference Room may be obtained by calling 1-800-SEC-0330.
A description of the policies and procedures that the portfolio uses to determine how to vote proxies relating to portfolio securities, and information regarding how the portfolio voted these proxies for the 12-month period ended June 30, 2005, is available at http://www.dreyfus.com and on the SEC's website at http://www.sec.gov. The description of the policies and procedures is also available without charge, upon request, by calling 1-800-645-6561.
© 2005 Dreyfus Service Corporation

| Dreyfus Variable |
| Investment Fund, |
| International Value |
| Portfolio |
The views expressed in this report reflect those of the portfolio manager only through the end of the period covered and do not necessarily represent the views of Dreyfus or any other person in the Dreyfus organization.Any such views are subject to change at any time based upon market or other conditions and Dreyfus disclaims any responsibility to update such views. These views may not be relied on as investment advice and, because investment decisions for a Dreyfus portfolio are based on numerous factors, may not be relied on as an indication of trading intent on behalf of any Dreyfus portfolio.
Not FDIC-Insured • Not Bank-Guaranteed • May Lose Value
| | | Contents |
| |
| | | T H E P O R T F O L I O |
| |
|
| 2 | | Letter from the Chairman |
| 3 | | Discussion of Performance |
| 6 | | Understanding Your Portfolio's Expenses |
| 6 | | Comparing Your Portfolio's Expenses |
| | | With Those of Other Funds |
| 7 | | Statement of Investments |
| 13 | | Statement of Assets and Liabilities |
| 14 | | Statement of Operations |
| 15 | | Statement of Changes in Net Assets |
| 17 | | Financial Highlights |
| 19 | | Notes to Financial Statements |
| 27 | | Information About the Review |
| and Approval of the Portfolio's |
| Investment Advisory Agreement |
| | | F O R M O R E I N F O R M AT I O N |
| |
|
| | | Back Cover |
| Dreyfus Variable Investment Fund, |
| International Value Portfolio |
The Portfolio

LETTER FROM THE CHAIRMAN
We are pleased to present this semiannual report for Dreyfus Variable Investment Fund, International Value Portfolio, covering the six-month period from January 1, 2005, through June 30, 2005. Inside, you'll find valuable information about how the portfolio was managed during the reporting period, including a discussion with the portfolio manager, D. Kirk Henry.
On average, international stock prices in local currency terms ended the first half of 2005 modestly higher than where they began. However, a strengthening U.S. dollar eroded those returns for U.S. investors, presenting them with generally modest losses. While stocks in the emerging markets produced higher returns than stocks from industrialized nations, these differences were relatively small. Conversely, within the developed markets, European companies generally produced substantially better results than their counterparts in Japan.
In some ways, market conditions at midyear remind us of those from one year ago, when stock prices languished due to economic and geopolitical concerns before rallying strongly later in the year. Currently, our economists expect the global economy to continue to grow over the foreseeable future, driven by the ongoing industrialization of China and other emerging markets and potentially setting the stage for better business conditions that could send international stock prices higher. As always, we encourage you to discuss these and other matters with your financial advisor.
Thank you for your continued confidence and support.

DISCUSSION OF PERFORMANCE
D. Kirk Henry, Senior Portfolio Manager
How did Dreyfus Variable Investment Fund, International Value Portfolio perform relative to its benchmark?
For the six-month period ended June 30, 2005, the portfolio produced total returns of –1.16% for its Initial shares and –1.16% for its Service shares.1 This compares with a –1.17% return for the portfolio's benchmark, the Morgan Stanley Capital International Europe, Australasia, Far East Index ("MSCI EAFE Index"), for the same period.2
We attribute the portfolio's performance to investors' concerns regarding the potential effects of rising energy prices, a less accommodative U.S. monetary policy, a strengthening U.S. dollar and expectations that corporate earnings and economic growth may have peaked.The portfolio produced returns that were generally in line with its benchmark.
What is the portfolio's investment approach?
The portfolio invests in an internationally diversified portfolio of value stocks; that is, stocks selling at what we think are attractive valuations relative to their perceived intrinsic worth in their home markets or global sectors based on historical measures. These measures typically include price-to-earnings, price-to-book value and price-to-cash flow ratios. Discrepancies from historical norms can be the result of short-term factors that affect market perception; that is, a stock falls out of general market favor, creating what we perceive to be a buying opportunity.The portfolio purchases the security at the depressed price, seeking to profit when perceptions change and the stock price rises to its perceived value.
The portfolio's investment approach is value-oriented and research-driven. In selecting stocks, we identify potential investments through extensive quantitative and fundamental research. Emphasizing individual stock selection rather than economic and industry trends, the portfolio focuses on three key factors: value, or how a stock is valued relative to its intrinsic worth based on traditional value measures; business health, or overall efficiency and profitability as measured by return on assets
The Portfolio 3
DISCUSSION OF PERFORMANCE (continued)
|
and return on equity; business momentum, or the presence of a catalyst (such as corporate restructuring, change in management or spin-off) that potentially will trigger a price increase near term or midterm.
What other factors influenced the portfolio's performance?
During the first quarter of 2005, rising energy prices, mounting inflationary pressures and higher interest rates in many regions caused investors to worry that global economic growth might slow. As a result, international equities gave back some of the gains they achieved during the final months of 2004.
While stocks in the larger, developed European markets generally foundered during the second quarter, many of the emerging markets posted gains due to rising exports of oil and gas, minerals and raw materials. Oil companies in Brazil, Russia and Argentina continued to benefit from rising oil prices. In addition, India benefited from efforts by its newly elected government to liberalize major industries and address social imbalances. India's domestic consumption also grew, providing a stable foundation for widespread corporate profitability. As a result, the portfolio's emerging market investments contributed strongly to its returns.
However, the bulk of the portfolio's positive relative performance stemmed from its holdings in Germany, where corporate restructurings, cost-cutting measures and increased export activity helped companies achieve higher profit margins. In addition, the prospect of a new political party in Germany has traditionally produced a stock market rally in hope that tax and labor reforms will be more business friendly.
In France, as in Germany, companies whose businesses rely heavily on exports tended to produce stronger returns, including auto parts component distributor Valeo, integrated oil company Total and electrical systems exporter Schneider Electric, which benefited from increased global construction trends.
The favorable European export trend also helped boost performance in the portfolio's U.K. holdings, where Rio Tinto, a large mining firm, gained value as did Shell Transport and Trading, which we eliminated later in the reporting period when the stock reached our price target.
Defense contractor BAE Systems and drug producer GlaxoSmithKline also fared well due to shifting investor sentiment toward more traditionally defensive investments during the reporting period.
On the other hand, the portfolio's returns were hindered by its investments in Japan.The country moved back into a recession at the end of 2004 due to a drop in industrial production, high unemployment and weak consumer spending.The portfolio's returns were constrained by its emphasis on Japan's domestic consumer companies, including home-builders, makers of personal care products and large supermarket chains.
What is the portfolio's current strategy?
As of the end of the reporting period, we believe that recent volatility in the international markets has created a number of attractively valued investment opportunities.For example,within the U.K.we recently established a position in BP,the large integrated oil company.We initiated a new position in HSBC Holdings,the global commercial banking firm,after we sold the portfolio's investment in the banking concern Lloyds.Otherwise, we continue to favor domestic-oriented companies in Japan, where we are encouraged by recent improvements in consumer spending.
| | | The portfolio is only available as a funding vehicle under variable life insurance policies or variable |
| | | annuity contracts issued by insurance companies. Individuals may not purchase shares of the |
| | | portfolio directly. A variable annuity is an insurance contract issued by an insurance company that |
| | | enables investors to accumulate assets on a tax-deferred basis for retirement or other long-term |
| | | goals.The investment objective and policies of Dreyfus Variable Investment Fund, International |
| | | Value Portfolio made available through insurance products may be similar to other funds/portfolios |
| | | managed or advised by Dreyfus. However, the investment results of the portfolio may be higher or |
| | | lower than, and may not be comparable to, those of any other Dreyfus fund/portfolio. |
| 1 | | Total return includes reinvestment of dividends and any capital gains paid. Past performance is no |
| | | guarantee of future results. Share price and investment return fluctuate such that upon redemption, |
| | | portfolio shares may be worth more or less than their original cost.The portfolio's performance does |
| | | not reflect the deduction of additional charges and expenses imposed in connection with investing |
| | | in variable insurance contracts, which will reduce returns. Return figures provided reflect the |
| | | absorption of portfolio expenses by The Dreyfus Corporation pursuant to an agreement in effect |
| | | through December 31, 2005, at which time it may be extended, terminated or modified. Had |
| | | these expenses not been absorbed, the portfolio's returns would have been lower. |
| 2 | | SOURCE: LIPPER INC. — Reflects reinvestment of net dividends and, where applicable, |
| | | capital gain distributions.The Morgan Stanley Capital International Europe, Australasia, Far |
| | | East (MSCI EAFE) Index is an unmanaged index composed of a sample of companies |
| | | representative of the market structure of European and Pacific Basin countries. |
The Portfolio 5
UNDERSTANDING YOUR
PORTFOLIO'S EXPENSES (Unaudited)
|
As a mutual fund investor, you pay ongoing expenses, such as management fees and other expenses. Using the information below, you can estimate how these expenses affect your investment and compare them with the expenses of other funds.You also may pay one-time transaction expenses, including sales charges (loads) and redemption fees, which are not shown in this section and would have resulted in higher total expenses. For more information, see your portfolio's prospectus or talk to your financial adviser.
Review your portfolio's expenses
|
The table below shows the expenses you would have paid on a $1,000 investment in Dreyfus Variable Investment Fund, International Value Portfolio from January 1, 2005 to June 30, 2005. It also shows how much a $1,000 investment would be worth at the close of the period, assuming actual returns and expenses.
| Expenses and Value of a $1,000 Investment | | |
| assuming actual returns for the six months ended June 30, 2005 | | |
| | | Initial Shares | | Service Shares |
| |
| |
|
| Expenses paid per $1,000 † | | $ 6.11 | | $ 6.85 |
| Ending value (after expenses) | | $988.40 | | $988.40 |
COMPARING YOUR PORTFOLIO'S EXPENSES WITH THOSE OF OTHER FUNDS (Unaudited)
Using the SEC's method to compare expenses
The Securities and Exchange Commission (SEC) has established guidelines to help investors assess fund expenses. Per these guidelines, the table below shows your portfolio's expenses based on a $1,000 investment, assuming a hypothetical 5% annualized return. You can use this information to compare the ongoing expenses (but not transaction expenses or total cost) of investing in the portfolio with those of other funds. All mutual fund shareholder reports will provide this information to help you make this comparison. Please note that you cannot use this information to estimate your actual ending account balance and expenses paid during the period.
Expenses and Value of a $1,000 Investment assuming a hypothetical 5% annualized return for the six months ended June 30, 2005
| | | Initial Shares | | Service Shares |
| |
| |
|
| Expenses paid per $1,000 † | | $ 6.21 | | $ 6.95 |
| Ending value (after expenses) | | $1,018.65 | | $1,017.90 |
† Expenses are equal to the portfolio's annualized expense ratio of 1.24% for Initial shares and 1.39% for Service shares, multiplied by the average account value over the period, multiplied by 181/365 (to reflect the one-half year period).
STATEMENT OF INVESTMENTS
June 30, 2005 (Unaudited)
|
| Common Stocks—98.1% | | Shares | | Value ($) |
| |
| |
|
| Australia—1.6% | | | | |
| Amcor | | 178,273 | | 907,885 |
| National Australia Bank | | 50,817 | | 1,188,136 |
| | | | | 2,096,021 |
| Belgium—1.0% | | | | |
| Fortis | | 46,070 | | 1,278,014 |
| Brazil—1.2% | | | | |
| Petroleo Brasileiro, ADR | | 14,720 | | 767,354 |
| Telecomunicacoes Brasileiras, ADR | | 24,630 | | 751,215 |
| | | | | 1,518,569 |
| Finland—1.7% | | | | |
| M-real, Cl. B | | 157,800 | | 855,261 |
| Nokia | | 17,200 | | 288,199 |
| Nokia, ADR | | 17,530 | | 291,699 |
| UPM-Kymmene | | 38,088 | | 731,271 |
| | | | | 2,166,430 |
| France—8.4% | | | | |
| BNP Paribas | | 18,950 | | 1,299,888 |
| Carrefour | | 31,220 | | 1,514,575 |
| Credit Agricole | | 45,370 | | 1,150,466 |
| France Telecom | | 57,810 | | 1,689,715 |
| Sanofi-Aventis | | 14,310 | | 1,175,501 |
| Schneider Electric | | 9,890 | | 746,013 |
| Total | | 8,730 | | 2,052,110 |
| Valeo | | 26,908 | | 1,207,727 |
| | | | | 10,835,995 |
| Germany—8.4% | | | | |
| Allianz | | 8,400 | | 967,453 |
| Deutsche Bank | | 17,110 | | 1,339,476 |
| Deutsche Lufthansa | | 71,177 | | 874,877 |
| Deutsche Post | | 71,470 | | 1,668,763 |
| Deutsche Postbank | | 15,895 | | 782,075 |
| Deutsche Telekom | | 46,980 | | 868,460 |
| E.ON | | 12,499 | | 1,114,137 |
| Heidelberger Druckmaschinen | | 19,400 | | 567,977 |
STATEMENT OF INVESTMENTS (Unaudited) (continued)
| Common Stocks (continued) | | Shares | | Value ($) |
| |
| |
|
| Germany (continued) | | | | |
| Infineon Technologies | | 90,550 a | | 845,706 |
| KarstadtQuelle | | 20,564 | | 273,662 |
| Medion | | 9,600 | | 160,506 |
| Volkswagen | | 28,120 | | 1,281,858 |
| | | | | 10,744,950 |
| Hong Kong—1.2% | | | | |
| Bank of East Asia | | 294,812 | | 870,676 |
| China Mobile (Hong Kong) | | 150,400 | | 560,306 |
| Citic Pacific | | 41,400 | | 121,202 |
| | | | | 1,552,184 |
| Ireland—1.5% | | | | |
| Bank of Ireland | | 122,176 | | 1,968,810 |
| Italy—4.1% | | | | |
| Banche Popolari Unite Scrl | | 13,715 | | 272,115 |
| Banco Popolare di Verona e Novara Scrl | | 26,710 | | 454,978 |
| Benetton Group | | 70,810 | | 653,203 |
| ENI | | 59,095 | | 1,523,518 |
| Finmeccanica | | 866,800 | | 810,086 |
| UniCredito Italiano | | 294,000 | | 1,553,438 |
| | | | | 5,267,338 |
| Japan—26.4% | | | | |
| Aeon | | 72,200 | | 1,100,655 |
| Alps Electric | | 40,100 | | 613,836 |
| Canon | | 23,000 | | 1,210,908 |
| Credit Saison | | 26,500 | | 881,542 |
| Dentsu | | 256 | | 632,355 |
| Fuji Heavy Industries | | 224,900 | | 936,703 |
| Fuji Photo Film | | 32,100 | | 1,033,103 |
| Funai Electric | | 8,900 | | 913,067 |
| JS Group | | 38,200 | | 646,740 |
| KDDI | | 258 | | 1,193,185 |
| Kao | | 52,200 | | 1,230,588 |
| Kuraray | | 69,400 | | 657,556 |
| Lawson | | 8,100 | | 282,596 |
| Common Stocks (continued) | | Shares | | Value ($) |
| |
| |
|
| Japan (continued) | | | | |
| Mabuchi Motor | | 19,000 | | 1,094,523 |
| Matsumotokiyoshi | | 19,400 | | 528,177 |
| Minebea | | 183,800 | | 742,325 |
| Mitsubishi Tokyo Financial Group | | 98 | | 831,355 |
| Murata Manufacturing | | 15,500 | | 789,497 |
| Nippon Express | | 386,500 | | 1,679,450 |
| Nippon Telegraph & Telephone | | 207 | | 886,410 |
| ORIX | | 6,100 | | 915,069 |
| Rinnai | | 34,300 | | 845,711 |
| Rohm | | 13,100 | | 1,263,647 |
| Sekisui House | | 97,400 | | 984,317 |
| 77 Bank | | 147,500 | | 908,204 |
| Shin-Etsu Chemical | | 34,400 | | 1,305,603 |
| Skylark | | 55,700 | | 847,614 |
| Sohgo Security Services | | 32,094 | | 425,316 |
| Sumitomo Bakelite | | 108,700 | | 703,598 |
| Sumitomo Chemical | | 168,300 | | 773,793 |
| Sumitomo Mitsui Financial Group | | 276 | | 1,866,126 |
| TDK | | 7,900 | | 538,418 |
| Takeda Pharmaceutical | | 22,400 | | 1,110,660 |
| Takefuji | | 18,550 | | 1,254,226 |
| Toyoda Gosei | | 48,300 | | 777,677 |
| Toyota Motor | | 27,800 | | 994,961 |
| Yamaha Motor | | 29,100 | | 533,861 |
| | | | | 33,933,372 |
| Mexico—1.4% | | | | |
| Coca-Cola Femsa, ADR | | 33,400 | | 892,114 |
| Telefonos de Mexico, ADR | | 46,512 | | 878,612 |
| | | | | 1,770,726 |
| Netherlands—6.3% | | | | |
| ABN AMRO Holding | | 42,743 | | 1,052,308 |
| Aegon | | 88,749 | | 1,149,917 |
| Heineken | | 40,459 | | 1,250,067 |
| Koninklijke Philips Electronics | | 58,050 | | 1,467,784 |
STATEMENT OF INVESTMENTS (Unaudited) (continued)
| Common Stocks (continued) | | Shares | | Value ($) |
| |
| |
|
| Netherlands (continued) | | | | |
| Koninklijke Philips Electronics | | | | |
| (New York Shares) | | 5,780 | | 145,598 |
| Royal Dutch Petroleum | | 24,730 | | 1,615,591 |
| VNU | | 10,300 | | 287,474 |
| Wolters Kluwer | | 60,555 | | 1,158,964 |
| | | | | 8,127,703 |
| New Zealand—.1% | | | | |
| Carter Holt Harvey | | 121,595 | | 192,873 |
| Portugal—.8% | | | | |
| Energias de Portugal | | 415,260 | | 1,044,954 |
| Singapore—2.1% | | | | |
| DBS Group Holdings | | 188,230 | | 1,595,831 |
| United Overseas Bank | | 126,000 | | 1,060,770 |
| United Overseas Land | | 12,600 | | 17,032 |
| | | | | 2,673,633 |
| South Africa—1.4% | | | | |
| Anglo American | | 52,778 | | 1,236,439 |
| Nedbank Group | | 52,382 | | 584,651 |
| | | | | 1,821,090 |
| South Korea—1.1% | | | | |
| KT, ADR | | 35,100 | | 754,650 |
| Korea Electric Power, ADR | | 39,740 | | 622,726 |
| | | | | 1,377,376 |
| Spain—2.7% | | | | |
| Banco Sabadell | | 20,320 | | 525,342 |
| Endesa | | 67,460 | | 1,584,110 |
| Repsol YPF | | 21,000 | | 537,587 |
| Repsol YPF, ADR | | 35,340 | | 888,094 |
| | | | | 3,535,133 |
| Sweden—1.0% | | | | |
| Svenska Cellulosa, Cl. B | | 38,140 | | 1,220,402 |
| Switzerland—6.8% | | | | |
| Ciba Specialty Chemicals | | 25,946 | | 1,511,830 |
| Clariant | | 33,790 | | 449,348 |
| Common Stocks (continued) | | Shares | | Value ($) |
| |
| |
|
| Switzerland (continued) | | | | |
| Lonza Group | | 7,720 | | 427,250 |
| Nestle | | 6,305 | | 1,613,136 |
| Novartis | | 39,070 | | 1,860,549 |
| Swiss Reinsurance | | 21,840 | | 1,342,427 |
| UBS | | 19,930 | | 1,554,602 |
| | | | | 8,759,142 |
| Taiwan—.6% | | | | |
| United Microelectronics, ADR | | 182,786 a | | 751,250 |
| United Kingdom—18.3% | | | | |
| BAA | | 81,700 | | 906,555 |
| BAE Systems | | 158,889 | | 816,124 |
| BOC Group | | 38,737 | | 696,049 |
| BP | | 160,800 | | 1,672,024 |
| BT Group | | 276,053 | | 1,136,320 |
| Barclays | | 151,951 | | 1,510,664 |
| Boots Group | | 122,695 | | 1,337,286 |
| Bunzl | | 16,565 | | 154,464 |
| Centrica | | 325,190 | | 1,348,768 |
| Diageo | | 90,343 | | 1,330,683 |
| Filtrona | | 19,457 | | 84,616 |
| GKN | | 238,780 | | 1,102,549 |
| GlaxoSmithKline | | 93,673 | | 2,264,905 |
| HSBC Holdings | | 60,370 | | 961,593 |
| J Sainsbury | | 151,849 | | 775,207 |
| Marks & Spencer Group | | 75,000 | | 483,890 |
| Rexam | | 62,006 | | 534,608 |
| Rio Tinto | | 38,525 | | 1,177,635 |
| Royal Bank of Scotland Group | | 56,109 | | 1,693,052 |
| Unilever | | 145,000 | | 1,397,442 |
| Vodafone Group | | 908,289 | | 2,210,768 |
| | | | | 23,595,202 |
| Total Common Stocks | | | | |
| (cost $111,951,763) | | | | 126,231,167 |
STATEMENT OF INVESTMENTS (Unaudited) (continued)
| | | | | Principal | | |
| Short-Term Investments—.4% | | Amount ($) | | Value ($) |
| |
| |
|
| U.S. Treasury Bills; | | | | | | |
| 2.79%, 8/4/2005 | | | | | | |
| (cost $500,677) | | | | 502,000 | | 500,630 |
| |
| |
| |
|
| |
| Total Investments (cost $112,452,440) | | 98.5% | | 126,731,797 |
| |
| Cash and Receivables (Net) | | | | 1.5% | | 1,921,942 |
| |
| Net Assets | | | | 100.0% | | 128,653,739 |
| |
| ADR—American Depository Receipts. | | | | |
| a Non-income producing. | | | | | | |
| |
| |
| |
|
| |
| |
| |
| |
| Portfolio Summary (Unaudited) † | | | | |
| |
| | | Value (%) | | | | Value (%) |
| |
| |
| |
|
| Banking | | 15.7 | | Automobiles | | 3.8 |
| Financial Services | | 7.8 | | Transportation | | 3.3 |
| Telecommunications | | 7.6 | | Electronic Components | | |
| Energy | | 6.4 | | and Instruments | | 3.2 |
| Food and Household Products | | 6.0 | | Forest and Paper Products | | 3.0 |
| Chemicals | | 5.5 | | Other | | 27.7 |
| Utilities | | 4.4 | | | | |
| Health Care | | 4.1 | | | | 98.5 |
| |
| † Based on net assets. | | | | | | |
| See notes to financial statements. | | | | | | |
STATEMENT OF ASSETS AND LIABILITIES
June 30, 2005 (Unaudited)
|
| | | Cost | | Value |
| |
| |
|
| Assets ($): | | | | |
| Investments in securities—See Statement of Investments | | 112,452,440 | | 126,731,797 |
| Cash | | | | 265,023 |
| Cash denominated in foreign currencies | | 1,421,730 | | 1,406,781 |
| Receivable for investment securities sold | | | | 684,130 |
| Dividends receivable | | | | 360,273 |
| Receivable for shares of Beneficial Interest subscribed | | | | 85,894 |
| Unrealized appreciation on forward currency exchange contracts—Note 4 | | 400 |
| Prepaid expenses | | | | 3,625 |
| | | | | 129,537,923 |
| |
| |
|
| Liabilities ($): | | | | |
| Due to The Dreyfus Corporation and affiliates—Note 3(b) | | | | 108,109 |
| Payable for shares of Beneficial Interest redeemed | | | | 435,517 |
| Payable for investment securities purchased | | | | 267,664 |
| Unrealized depreciation on forward currency exchange contracts—Note 4 | | 180 |
| Accrued expenses | | | | 72,714 |
| | | | | 884,184 |
| |
| |
|
| Net Assets ($) | | | | 128,653,739 |
| |
| |
|
| Composition of Net Assets ($): | | | | |
| Paid-in capital | | | | 110,726,232 |
| Accumulated undistributed investment income—net | | | | 1,482,233 |
| Accumulated net realized gain (loss) on investments | | | | 2,189,347 |
| Accumulated net unrealized appreciation (depreciation) | | | | |
| on investments and foreign currency transactions | | | | 14,255,927 |
| |
| |
|
| Net Assets ($) | | | | 128,653,739 |
| |
| |
|
| |
| |
| Net Asset Value Per Share | | | | |
| | | Initial Shares | | Service Shares |
| |
| |
|
| Net Assets ($) | | 85,989,443 | | 42,664,296 |
| Shares Outstanding | | 5,564,259 | | 2,759,805 |
| |
| |
|
| Net Asset Value Per Share ($) | | 15.45 | | 15.46 |
See notes to financial statements.
|
STATEMENT OF OPERATIONS
Six Months Ended June 30, 2005 (Unaudited)
|
| Investment Income ($): | | |
| Income: | | |
| Cash dividends (net of $248,550 foreign taxes withheld at source) | | 2,314,081 |
| Interest | | 46,111 |
| Total Income | | 2,360,192 |
| Expenses: | | |
| Investment advisory fee—Note 3(a) | | 658,189 |
| Custodian fees | | 125,230 |
| Distribution fees—Note 3(b) | | 47,467 |
| Professional fees | | 16,454 |
| Prospectus and shareholders' reports | | 10,724 |
| Trustees' fees and expenses—Note 3(c) | | 4,750 |
| Shareholder servicing costs—Note 3(b) | | 3,281 |
| Registration fees | | 425 |
| Loan commitment fees—Note 2 | | 305 |
| Miscellaneous | | 7,830 |
| Total Expenses | | 874,655 |
| Less—waiver of fees due to | | |
| undertaking—Note 3(a) | | (21,419) |
| Less—reduction in custody fees due | | |
| to earnings credits—Note 1(c) | | (7,224) |
| Net Expenses | | 846,012 |
| Investment Income—Net | | 1,514,180 |
| |
|
| Realized and Unrealized Gain (Loss) on Investments—Note 4 ($): |
| Net realized gain (loss) on investments | | |
| and foreign currency transactions | | 4,730,715 |
| Net realized gain (loss) on forward | | |
| currency exchange contracts | | (91,630) |
| Net Realized Gain (Loss) | | 4,639,085 |
| Net unrealized appreciation (depreciation) on | | |
| investments and foreign currency transactions | | (8,023,869) |
| Net Realized and Unrealized Gain (Loss) on Investments | | (3,384,784) |
| Net (Decrease) in Net Assets Resulting from Operations | | (1,870,604) |
See notes to financial statements.
|
STATEMENT OF CHANGES IN NET ASSETS
| | | Six Months Ended | | |
| | | June 30, 2005 | | Year Ended |
| | | (Unaudited) | | December 31, 2004 |
| |
| |
|
| Operations ($): | | | | |
| Investment income—net | | 1,514,180 | | 865,155 |
| Net realized gain (loss) on investments | | 4,639,085 | | 7,632,545 |
| Net unrealized appreciation | | | | |
| (depreciation) on investments | | (8,023,869) | | 9,969,437 |
| Net Increase (Decrease) in Net Assets | | | | |
| Resulting from Operations | | (1,870,604) | | 18,467,137 |
| |
| |
|
| Dividends to Shareholders from ($): | | | | |
| Investment income—net: | | | | |
| Initial shares | | — | | (870,666) |
| Service shares | | — | | (257,284) |
| Net realized gain on investments: | | | | |
| Initial shares | | (1,331,789) | | (1,271,294) |
| Service shares | | (527,874) | | (468,090) |
| Total Dividends | | (1,859,663) | | (2,867,334) |
| |
| |
|
| Beneficial Interest Transactions ($): | | | | |
| Net proceeds from shares sold: | | | | |
| Initial shares | | 25,895,098 | | 40,833,715 |
| Service shares | | 14,241,748 | | 28,518,845 |
| Dividends reinvested: | | | | |
| Initial shares | | 1,331,789 | | 2,141,960 |
| Service shares | | 527,874 | | 725,374 |
| Cost of shares redeemed: | | | | |
| Initial shares | | (27,329,244) | | (25,431,592) |
| Service shares | | (5,115,219) | | (5,117,977) |
| Increase (Decrease) in Net Assets from | | | | |
| Beneficial Interest Transactions | | 9,552,046 | | 41,670,325 |
| Total Increase (Decrease) in Net Assets | | 5,821,779 | | 57,270,128 |
| |
| |
|
| Net Assets ($): | | | | |
| Beginning of Period | | 122,831,960 | | 65,561,832 |
| End of Period | | 128,653,739 | | 122,831,960 |
| Undistributed (distributions in | | | | |
| excess of) investment income—net | | 1,482,233 | | (31,947) |
STATEMENT OF CHANGES IN NET ASSETS (continued)
|
| | | Six Months Ended | | |
| | | June 30, 2005 | | Year Ended |
| | | (Unaudited) | | December 31, 2004 |
| |
| |
|
| Capital Share Transactions: | | | | |
| Initial Shares | | | | |
| Shares sold | | 1,643,681 | | 2,873,243 |
| Shares issued for dividends reinvested | | 85,481 | | 140,767 |
| Shares redeemed | | (1,763,668) | | (1,762,671) |
| Net Increase (Decrease) in Shares Outstanding | | (34,506) | | 1,251,339 |
| |
| |
|
| Service Shares | | | | |
| Shares sold | | 902,721 | | 1,966,357 |
| Shares issued for dividends reinvested | | 33,860 | | 47,425 |
| Shares redeemed | | (327,835) | | (357,787) |
| Net Increase (Decrease) in Shares Outstanding | | 608,746 | | 1,655,995 |
See notes to financial statements.
|
The following tables describe the performance for each share class for the fiscal periods indicated. All information (except portfolio turnover rate) reflects financial results for a single portfolio share. Total return shows how much your investment in the portfolio would have increased (or decreased) during each period, assuming you had reinvested all dividends and distributions.These figures have been derived from the portfolio's financial statements.
| | | Six Months Ended | | | | | | | | | | |
| | | June 30, 2005 | | | | Year Ended December 31, | | |
| | | |
| |
| |
|
| Initial Shares | | (Unaudited) | | 2004 | | 2003 | | 2002 | | 2001 | | 2000 |
| |
| |
| |
| |
| |
| |
|
| Per Share Data ($): | | | | | | | | | | | | |
| Net asset value, | | | | | | | | | | | | |
| beginning of period | | 15.85 | | 13.54 | | 10.04 | | 11.56 | | 13.52 | | 15.67 |
| Investment Operations: | | | | | | | | | | | | |
| Investment income—net a | | .18 | | .16 | | .12 | | .12 | | .12 | | .11 |
| Net realized and unrealized | | | | | | | | | | | | |
| gain (loss) on investments | | (.36) | | 2.54 | | 3.51 | | (1.53) | | (1.90) | | (.74) |
| Total from Investment Operations | | (.18) | | 2.70 | | 3.63 | | (1.41) | | (1.78) | | (.63) |
| Distributions: | | | | | | | | | | | | |
| Dividends from investment | | | | | | | | | | | | |
| income—net | | — | | (.16) | | (.13) | | (.11) | | (.11) | | (.06) |
| Dividends from net realized | | | | | | | | | | | | |
| gain on investments | | (.22) | | (.23) | | — | | — | | — | | (1.40) |
| Dividends in excess of net | | | | | | | | | | | | |
| realized gain on investments | | — | | — | | — | | — | | (.07) | | (.06) |
| Total Distributions | | (.22) | | (.39) | | (.13) | | (.11) | | (.18) | | (1.52) |
| Net asset value, end of period | | 15.45 | | 15.85 | | 13.54 | | 10.04 | | 11.56 | | 13.52 |
| |
| |
| |
| |
| |
| |
|
| Total Return (%) | | (1.16)b | | 20.02 | | 36.36 | | (12.23) | | (13.22) | | (3.69) |
| |
| |
| |
| |
| |
| |
|
| Ratios/Supplemental Data (%): | | | | | | | | | | |
| Ratio of total expenses | | | | | | | | | | | | |
| to average net assets | | .62b | | 1.25 | | 1.49 | | 1.47 | | 1.60 | | 1.39 |
| Ratio of net expenses | | | | | | | | | | | | |
| to average net assets | | .62b | | 1.24 | | 1.41 | | 1.40 | | 1.40 | | 1.39 |
| Ratio of net investment income | | | | | | | | | | | | |
| to average net assets | | 1.15b | | 1.08 | | 1.11 | | 1.10 | | .97 | | .78 |
| Portfolio Turnover Rate | | 27.54b | | 44.05 | | 107.73 | | 47.18 | | 49.34 | | 37.33 |
| |
| |
| |
| |
| |
| |
|
| Net Assets, end of period | | | | | | | | | | | | |
| ($ x 1,000) | | 85,989 | | 88,713 | | 58,849 | | 27,549 | | 21,602 | | 25,765 |
| |
| a | | Based on average shares outstanding at each month end. | | | | | | | | |
| b | | Not annualized. | | | | | | | | | | | | |
| See notes to financial statements. | | | | | | | | | | | | |
The Portfolio 17
| | FINANCIAL HIGHLIGHTS (continued)
|
| | | Six Months Ended | | | | | | | | | | |
| | | June 30, 2005 | | | | Year Ended December 31, | | |
| | | |
| |
| |
|
| Service Shares | | (Unaudited) | | 2004 | | 2003 | | 2002 | | 2001 | | 2000 a |
| |
| |
| |
| |
| |
| |
|
| Per Share Data ($): | | | | | | | | | | | | |
| Net asset value, | | | | | | | | | | | | |
| beginning of period | | 15.86 | | 13.56 | | 10.06 | | 11.58 | | 13.52 | | 13.52 |
| Investment Operations: | | | | | | | | | | | | |
| Investment income—net | | .18b | | .06b | | .14b | | .12b | | .05b | | — |
| Net realized and unrealized | | | | | | | | | | | | |
| gain (loss) on investments | | (.36) | | 2.62 | | 3.49 | | (1.54) | | (1.81) | | — |
| Total from Investment Operations | | (.18) | | 2.68 | | 3.63 | | (1.42) | | (1.76) | | — |
| Distributions: | | | | | | | | | | | | |
| Dividends from investment | | | | | | | | | | | | |
| income—net | | — | | (.15) | | (.13) | | (.10) | | (.11) | | — |
| Dividends from net realized | | | | | | | | | | | | |
| gain on investments | | (.22) | | (.23) | | — | | — | | — | | — |
| Dividends in excess of net | | | | | | | | | | | | |
| realized gain on investments | | — | | — | | — | | — | | (.07) | | — |
| Total Distributions | | (.22) | | (.38) | | (.13) | | (.10) | | (.18) | | — |
| Net asset value, end of period | | 15.46 | | 15.86 | | 13.56 | | 10.06 | | 11.58 | | 13.52 |
| |
| |
| |
| |
| |
| |
|
| Total Return (%) | | (1.16)c | | 19.83 | | 36.28 | | (12.25) | | (13.07) | | — |
| |
| |
| |
| |
| |
| |
|
| Ratios/Supplemental Data (%): | | | | | | | | | | |
| Ratio of total expenses | | | | | | | | | | | | |
| to average net assets | | .75c | | 1.49 | | 1.75 | | 1.66 | | 1.99 | | — |
| Ratio of net expenses | | | | | | | | | | | | |
| to average net assets | | .69c | | 1.39 | | 1.41 | | 1.40 | | 1.40 | | — |
| Ratio of net investment income | | | | | | | | | | | | |
| to average net assets | | 1.12c | | .44 | | 1.29 | | 1.07 | | .44 | | — |
| Portfolio Turnover Rate | | 27.54c | | 44.05 | | 107.73 | | 47.18 | | 49.34 | | 37.33 |
| |
| |
| |
| |
| |
| |
|
| Net Assets, end of period | | | | | | | | | | | | |
| ($ x 1,000) | | 42,664 | | 34,119 | | 6,713 | | 4,441 | | 2,148 | | 1 |
| |
| a | | The portfolio commenced offering Service shares on December 31, 2000. | | | | | | |
| b | | Based on average shares outstanding at each month end. | | | | | | | | |
| c | | Not annualized. | | | | | | | | | | | | |
| See notes to financial statements. | | | | | | | | | | | | |
18
NOTES TO FINANCIAL STATEMENTS (Unaudited)
NOTE 1—Significant Accounting Policies:
Dreyfus Variable Investment Fund (the "fund") is registered under the Investment Company Act of 1940, as amended (the "Act"), as an open-end management investment company, operating as a series company currently offering twelve series, including the International Value Portfolio (the "portfolio"). The portfolio is only offered to separate accounts established by insurance companies to fund variable annuity contracts and variable life insurance policies.The portfolio is a diversified series. The portfolio's investment objective is long-term capital growth.The Dreyfus Corporation (the "Manager" or "Dreyfus") serves as the portfolio's investment adviser. The Manager is a wholly-owned subsidiary of Mellon Financial Corporation ("Mellon Financial").
Dreyfus Service Corporation (the "Distributor"), a wholly-owned subsidiary of the Manager, is the distributor of the portfolio's shares, which are sold without a sales charge.The portfolio is authorized to issue an unlimited number of $.001 par value shares of Beneficial Interest in each of the following classes of shares: Initial and Service. Each class of shares has identical rights and privileges, except with respect to the distribution plan and the expenses borne by each class and certain voting rights. Income, expenses (other than expenses attributable to a specific class), and realized and unrealized gains or losses on investments are allocated to each class of shares based on its relative net assets.
The fund accounts separately for the assets, liabilities and operations of each series. Expenses directly attributable to each series are charged to that series' operations; expenses which are applicable to all series are allocated among them on a pro rata basis.
The portfolio's financial statements are prepared in accordance with U.S. generally accepted accounting principles, which may require the use of management estimates and assumptions.Actual results could differ from those estimates.
NOTES TO FINANCIAL STATEMENTS (Unaudited) (continued)
The fund enters into contracts that contain a variety of indemnifica-tions.The portfolio's maximum exposure under these arrangements is unknown. The portfolio does not anticipate recognizing any loss related to these arrangements.
(a) Portfolio valuation: Investments in securities are valued at the last sales price on the securities exchange or national securities market on which such securities are primarily traded. Securities listed on the National Market System for which market quotations are available are valued at the official closing price or, if there is no official closing price that day, at the last sales price. Securities not listed on an exchange or the national securities market, or securities for which there were no transactions, are valued at the average of the most recent bid and asked prices, except for open short positions, where the asked price is used for valuation purposes. Bid price is used when no asked price is available. Investments in registered investment companies are valued at their net asset value.When market quotations or official closing prices are not readily available, or are determined not to reflect accurately fair value, such as when the value of a security has been significantly affected by events after the close of the exchange or market on which the security is principally traded (for example, a foreign exchange or market), but before the portfolio calculates its net asset value, the portfolio may value these investments at fair value as determined in accordance with the procedures approved by the Board of Trustees. Fair valuing of securities may be determined with the assistance of a pricing service using calculations based on indices of domestic securities and other appropriate indicators, such as prices of relevant ADR's and futures contracts. For other securities that are fair valued by the Board of Trustees, certain factors may be considered such as: fundamental analytical data, the nature and duration of restrictions on disposition, an evaluation of the forces that influence the market in which the securities are purchased and sold and public trading in similar securities of the issuer or comparable issuers. Financial futures are
valued at the last sales price. Investments denominated in foreign currencies are translated to U.S. dollars at the prevailing rates of exchange. Forward currency exchange contracts are valued at the forward rate.
(b) Foreign currency transactions: The portfolio does not isolate that portion of the results of operations resulting from changes in foreign exchange rates on investments from the fluctuations arising from changes in market prices of securities held. Such fluctuations are included with the net realized and unrealized gain or loss on investments.
Net realized foreign exchange gains or losses arise from sales and maturities of short-term securities, sales of foreign currencies, currency gains or losses realized on securities transactions and the difference between the amounts of dividends, interest and foreign withholding taxes recorded on the portfolio's books and the U.S. dollar equivalent of the amounts actually received or paid. Net unrealized foreign exchange gains or losses arise from changes in the value of assets and liabilities other than investments in securities, resulting from changes in exchange rates. Such gains and losses are included with net realized and unrealized gain or loss on investments.
(c) Securities transactions and investment income: Securities transactions are recorded on a trade date basis. Realized gain and loss from securities transactions are recorded on the identified cost basis. Dividend income is recognized on the ex-dividend date and interest income, including, where applicable, accretion of discount and amortization of premium on investments, is recognized on the accrual basis.
The portfolio has an arrangement with the custodian bank whereby the portfolio receives earnings credits from the custodian when positive cash balances are maintained, which are used to offset custody fees. For financial reporting purposes, the portfolio includes net earnings credits as an expense offset in the Statement of Operations.
The Portfolio 21
NOTES TO FINANCIAL STATEMENTS (Unaudited) (continued)
(d) Dividends to shareholders: Dividends are recorded on the ex-dividend date. Dividends from investment income-net and dividends from net realized capital gain, if any, are normally declared and paid annually, but the portfolio may make distributions on a more frequent basis to comply with the distribution requirements of the Internal Revenue Code of 1986, as amended (the "Code").To the extent that net realized capital gain can be offset by capital loss carryovers, if any, it is the policy of the portfolio not to distribute such gain. Income and capital gain distributions are determined in accordance with income tax regulations, which may differ from U.S. generally accepted accounting principles.
(e) Federal income taxes: It is the policy of the portfolio to continue to qualify as a regulated investment company, if such qualification is in the best interests of its shareholders, by complying with the applicable provisions of the Code, and to make distributions of taxable income sufficient to relieve it from substantially all federal income and excise taxes.
The tax character of distributions paid to shareholders during the fiscal year ended December 31, 2004 was as follows: ordinary income $1,127,950 and long-term capital gains $1,739,384.The tax character of current year distributions will be determined at the end of the current fiscal year.
NOTE 2—Bank Line of Credit:
|
The portfolio participates with other Dreyfus-managed funds in a $350 million redemption credit facility (the "Facility") to be utilized for temporary or emergency purposes, including the financing of redemptions. In connection therewith, the portfolio has agreed to pay commitment fees on its pro rata portion of the Facility. Interest is charged to the portfolio based on prevailing market rates in effect at the time of borrowings. During the period ended June 30, 2005, the portfolio did not borrow under the Facility.
NOTE 3—Investment Advisory Fee and Other Transactions With Affiliates:
(a) Pursuant to an Investment Advisory Agreement with the Manager, the investment advisory fee is computed at the annual rate of 1% of the value of the portfolio's average daily net assets and is payable monthly.
The Manager has agreed, from January 1, 2005 to December 31, 2005, to waive receipt of its fees and/or assume the expenses of the portfolio so that the expenses of neither class, exclusive of taxes, brokerage fees, interest on borrowings, commitment fees and extraordinary expenses, exceed an annual rate of 1.40% of the value of the average daily net assets of their class. During the period ended June 30, 2005, the Manager waived receipt of fees of $21,419, pursuant to the undertaking.
(b) Under the Distribution Plan (the "Plan") adopted pursuant to Rule 12b-1 under the Act, Service shares pay the Distributor for distributing their shares, for servicing and/or maintaining Service shares shareholder accounts and for advertising and marketing for Service shares.The Plan provides for payments to be made at an annual rate of .25 of 1% of the value of the Service shares' average daily net assets.The Distributor may make payments to Participating Insurance Companies and to brokers and dealers acting as principal underwriter for their variable insurance products.The fees payable under the Plan are payable without regard to actual expenses incurred. During the period ended June 30, 2005, Service shares were charged $47,467 pursuant to the Plan.
The portfolio compensates Dreyfus Transfer, Inc., a wholly-owned subsidiary of the Manager, under a transfer agency agreement for providing personnel and facilities to perform transfer agency services for the portfolio. During the period ended June 30, 2005, the portfolio was charged $164 pursuant to the transfer agency agreement.
NOTES TO FINANCIAL STATEMENTS (Unaudited) (continued)
During the period ended June 30, 2005, the portfolio was charged $1,998 for services performed by the Chief Compliance Officer.
The components of Due to The Dreyfus Corporation and affiliates in the Statement of Assets and Liabilities consist of: investment advisory fees $110,125, Rule 12b-1 distribution plan fees $8,716, chief compliance officer fees $1,998 and transfer agency per account fees $56, which are offset against an expense reimbursement currently in effect in the amount of $12,786.
(c) Each Board member also serves as a Board member of other funds within the Dreyfus complex. Annual retainer fees and attendance fees are allocated to each fund based on net assets.
NOTE 4—Securities Transactions:
|
The aggregate amount of purchases and sales of investment securities, excluding short-term securities and forward currency exchange contracts, during the period ended June 30, 2005, amounted to $42,371,007 and $34,869,702, respectively.
The portfolio enters into forward currency exchange contracts in order to hedge its exposure to changes in foreign currency exchange rates on its foreign portfolio holdings and to settle foreign currency transactions. When executing forward currency exchange contracts, the portfolio is obligated to buy or sell a foreign currency at a specified rate on a certain date in the future. With respect to sales of forward currency exchange contracts, the portfolio would incur a loss if the value of the contract increases between the date the forward contract is opened and the date the forward contract is closed.The portfolio realizes a gain if the value of the contract decreases between those dates.With respect to purchases of forward currency exchange contracts, the portfolio would incur a loss if the value of the contract decreases between the date the forward contract is opened and the date the forward contract is closed. The portfolio realizes a gain if the value of the contract increases between those dates.The portfolio is also exposed to credit risk associ-
ated with counterparty nonperformance on these forward currency exchange contracts which is typically limited to the unrealized gain on each open contract.The following summarizes open forward currency exchange contracts at June 30, 2005:
| | | Foreign | | | | | | Unrealized |
| Forward Currency | | Currency | | | | | | Appreciation |
| Exchange Contracts | | Amounts | | Cost ($) | | Value ($) | | (Depreciation) ($) |
| |
| |
| |
| |
|
| Purchases; | | | | | | | | |
| Swiss Franc, | | | | | | | | |
| expiring 7/1/2005 | | 49,399 | | 38,461 | | 38,533 | | 72 |
| Sales: | | | | Proceeds ($) | | | | |
| Japanese Yen, | | | | | | | | |
| expiring 7/5/2005 | | 7,008,991 | | 63,218 | | 63,187 | | 31 |
| New Zealand Dollar, | | | | | | | | |
| expiring 7/1/2005 | | 134,954 | | 94,184 | | 93,887 | | 297 |
| New Zealand Dollar, | | | | | | | | |
| expiring 7/5/2005 | | 112,567 | | 78,133 | | 78,313 | | (180) |
| Total | | | | | | | | 220 |
At June 30, 2005, accumulated net unrealized appreciation on investments was $14,279,357, consisting of $16,895,678 gross unrealized appreciation and $2,616,321 gross unrealized depreciation.
At June 30,2005,the cost of investments for federal income tax purposes was substantially the same as the cost for financial reporting purposes (see the Statement of Investments).
In early 2004, two purported class and derivative actions were filed against Mellon Financial, Mellon Bank, N.A., Dreyfus, Founders Asset Management LLC, and certain directors of the Dreyfus Funds and the Dreyfus Founders Funds (together, the "Funds") in the United States District Court for the Western District of Pennsylvania. In September 2004, plaintiffs served a Consolidated Amended Complaint (the "Amended Complaint") on behalf of a purported class of all persons who acquired interests in any of the Funds between January 30, 1999
The Portfolio 25
NOTES TO FINANCIAL STATEMENTS (Unaudited) (continued)
and November 17, 2003, and derivatively on behalf of the Funds.The Amended Complaint in the newly styled In re Dreyfus Mutual Funds Fee Litigation also named the Distributor, Premier Mutual Fund Services, Inc. and two additional Fund directors as defendants and alleges violations of the Investment Company Act of 1940, the Investment Advisers Act of 1940, the Pennsylvania Unfair Trade Practices and Consumer Protection Law and common-law claims. Plaintiffs seek to recover allegedly improper and excessive Rule 12b-1 and advisory fees allegedly charged to the Funds for marketing and distribution services. More specifically, plaintiffs claim, among other things, that 12b-1 fees and directed brokerage were improperly used to pay brokers to recommend the Funds over other funds, and that such payments were not disclosed to investors. In addition, plaintiffs assert that economies of scale and soft-dollar benefits were not passed on to the Funds. Plaintiffs further allege that 12b-1 fees were improperly charged to certain of the Funds that were closed to new investors.The Amended Complaint seeks compensatory and punitive damages, rescission of the advisory contracts, and an accounting and restitution of any unlawful fees, as well as an award of attorneys' fees and litigation expenses. As noted, some of the claims in this litigation are asserted derivatively on behalf of the Funds that have been named as nominal defendants. With respect to such derivative claims, no relief is sought against the Funds. Dreyfus believes the allegations to be totally without merit and intends to defend the action vigorously. In November 2004, all named defendants moved to dismiss the Amended Complaint in whole or substantial part. Briefing was completed in May 2005.
Additional lawsuits arising out of these circumstances and presenting similar allegations and requests for relief may be filed against the defendants in the future. Neither Dreyfus nor the Funds believe that any of the pending actions will have a material adverse effect on the Funds or Dreyfus' ability to perform its contract with the Funds.
INFORMATION ABOUT THE REVIEW
AND APPROVAL OF THE PORTFOLIO'S
I N V E S T M E N T A DV I S O RY A G R E E M E N T (Unaudited)
|
At separate meetings of the Board of Trustees for the fund held on June 8-9, 2005, the Board considered the re-approval, through its annual renewal date of July 31, 2006, of the Investment Advisory Agreement with the Manager for the portfolio, pursuant to which the Manager provides the portfolio with investment advisory and administrative ser-vices.The Board members who are not "interested persons" (as defined in the Act (the "Independent Trustees")) of the fund were assisted in their review by independent legal counsel and met with counsel in executive session separate from representatives of the Manager.
Analysis of Nature, Extent and Quality of Services Provided to the Portfolio. The Board members received a presentation from representatives of the Manager regarding services provided to the portfolio and other funds in the Dreyfus fund complex, and discussed the nature, extent and quality of the services provided to the portfolio pursuant to its Investment Advisory Agreement. The Manager's representatives reviewed the portfolio's distribution of accounts and the relationships the Manager has with various intermediaries and the different needs of each.The Board noted that the portfolio's shares were offered only to separate accounts established by insurance companies to fund variable annuity contracts and variable life insurance policies. The Manager's representatives noted the diversity of distribution among the funds in the Dreyfus complex, and the Manager's corresponding need for broad, deep, and diverse resources to be able to provide ongoing shareholder services to each distribution channel, including that of the portfolio. The Board also reviewed the number of shareholder accounts in the portfolio as well as the portfolio's asset size.
The Board members also considered the Manager's research and portfolio management capabilities and that the Manager also provides oversight of day-to-day portfolio operations, including fund accounting and administration and assistance in meeting legal and regulatory requirements. The Board members also considered the Manager's extensive administrative, accounting and compliance infrastructure.
INFORMATION ABOUT THE REVIEW AND APPROVAL OF THE PORTFOLIO'S
INVESTMENT ADVISORY AGREEMENT (Unaudited) (continued)
|
Comparative Analysis of the Portfolio's Performance, Investment Advisory Fee and Expense Ratio. The Board members reviewed the portfolio's performance and expense ratios and placed significant emphasis on comparisons to two groups of comparable funds and Lipper category averages, as applicable.The Board reviewed the portfolio's performance, investment advisory fee, and total expense ratios within these comparison groups and against the portfolio's Lipper category averages, as applicable.The groups of comparable funds were previously approved by the Board for this purpose, and were prepared using a Board-approved selection methodology that was based, in part, on selecting non-affiliated funds reported in the same Lipper category as the portfolio.The Board members discussed the results of the comparisons and noted that the portfolio's 1-year and 3-year performance was below the averages of its comparison groups and Lipper category, but, that its 5-year performance was above the Lipper category average, although below the comparison group average.The Board noted that the portfolio's recent short-term performance (3-months and year-to-date as of April 30, 2005) compared favorably to that of its Lipper category average and comparison group for the same periods.The Board members noted that the portfolio's performance generally outperformed or slightly underperformed its benchmark in 7 of the previous 8 calendar years. The Board members also discussed the portfolio's expense ratio for each class of shares, noting it is higher than the average of its respective comparison group. They reviewed the range of management fees in the comparison groups and noted that the portfolio's investment advisory fee was higher than most of the fees paid by the funds in the comparison groups. The Board members noted the Manager's current undertaking to waive or reimburse certain fees and expenses to limit the portfolio's expense ratio, which reduced the expense ratio of the portfolio's Service shares.
Representatives of the Manager stated that there are no other mutual funds managed by the Manager or its affiliates with similar investment objectives, policies and strategies that were reported in the same Lipper
category as the portfolio. Representatives of the Manager reviewed with the Board the fees paid to the Manager or its affiliates by separate accounts, or mutual funds for which the Manager or its affiliates serve as sub-investment adviser, with similar investment objectives, policies and strategies as the portfolio ("Separate Accounts") and explained the nature of each Separate Account and the differences, from the Manager's perspective, in management of such Separate Accounts as compared to the managing and providing other services to the portfolio.The Manager's representatives also reviewed the costs associated with distribution through intermediaries. The Board analyzed differences in fees paid to the Manager and discussed the relationship of the advisory fees paid in light of the Manager's performance and the services provided.The Board members considered the relevance of the fee information provided for the Separate Accounts managed by the Manager or its affiliates to evaluate the appropriateness and reasonableness of the portfolio's advisory fees. The Board acknowledged that differences in fees paid by the Separate Accounts seemed to be consistent with the services provided.
Analysis of Profitability and Economies of Scale. The Manager's representatives reviewed the dollar amount of expenses allocated and profit received by the Manager and the method used to determine such expenses and profit. The Board received and considered information prepared by an independent consulting firm regarding Dreyfus' approach to allocating costs to, and determining the profitability of, the individual funds and the entire Dreyfus mutual fund complex.The consulting firm also analyzed where any economies of scale might emerge as assets grow.The Board members evaluated the analysis in light of the relevant circumstances for the portfolio, including the increase in portfolio assets and the extent to which economies of scale would be realized as the portfolio continues to grow and whether fee levels reflect these economies of scale for the benefit of portfolio investors. The Board members also considered potential benefits to the Manager from
The Portfolio 29
INFORMATION ABOUT THE REVIEW AND APPROVAL OF THE PORTFOLIO'S
INVESTMENT ADVISORY AGREEMENT (Unaudited) (continued)
|
acting as investment adviser and noted that there were no soft dollar arrangements with respect to trading the portfolio's portfolio.
It was noted that the Board members should consider the Manager's profitability with respect to the portfolio as part of their evaluation of whether the fee under the Investment Advisory Agreement bears a reasonable relationship to the mix of services provided by the Manager, including the nature, extent and quality of such services and that a discussion of economies of scale are predicated on increasing assets and that, if a fund's assets had been decreasing, the possibility that the Manager may have realized any economies of scale would be less. It also was noted that the profitability percentage for managing the portfolio was within ranges determined by appropriate court cases to be reasonable given the services rendered and, given the portfolio's overall performance and generally superior service levels provided.The Board also noted the current fee waiver and expense reimbursement arrangement and its effect on profitability of the Manager.
At the conclusion of these discussions, each of the Independent Trustees expressed the opinion that he or she had been furnished with sufficient information to make an informed business decision with respect to continuation of the fund's Investment Advisory Agreement, with respect to the portfolio. Based on their discussions and considerations as described above, the Board made the following conclusions and determinations.
- The Board concluded that the nature, extent and quality of the services provided by the Manager are adequate and appropriate.
- The Board generally was satisfied with the Manager's recent per- formance versus its Lipper category average and comparison group, the portfolio's longer term performance as compared to its Lipper category average and the portfolio's calendar year performance as compared to its benchmark.
- The Board concluded that the fee paid by the portfolio to the Manager was reasonable in light of comparative performance and expense and advisory fee information, particularly given the Manager's current undertaking to waive or reimburse certain fees and expenses, which reduced the expense ratio of the Service shares, costs of the services provided and profits to be realized and benefits derived or to be derived by the Manager from its relationship with the portfolio.
- The Board determined that, to the extent that material economies of scale had not been shared with the portfolio, the Board would seek to do so.
The Board members considered these conclusions and determinations, along with information received on a routine and regular basis throughout the year, and, without any one factor being dispositive, the Board determined that approval of the fund's Investment Advisory Agreement, with respect to the portfolio, was in the best interests of the portfolio and its shareholders.
The Portfolio 31
NOTES
| For More | | Information |
| |
|
| |
| Dreyfus Variable | | Transfer Agent & |
| Investment Fund, | | Dividend Disbursing Agent |
| International Value Portfolio |
| | | Dreyfus Transfer, Inc. |
| 200 Park Avenue | | |
| | | 200 Park Avenue |
| New York, NY 10166 | | |
| | | New York, NY 10166 |
| |
| Investment Adviser | | Distributor |
| The Dreyfus Corporation | | |
| | | Dreyfus Service Corporation |
| 200 Park Avenue | | |
| | | 200 Park Avenue |
| New York, NY 10166 | | |
| | | New York, NY 10166 |
| Custodian | | |
| The Bank of New York | | |
| One Wall Street | | |
| New York, NY 10286 | | |
Telephone 1-800-554-4611 or 516-338-3300
Mail The Dreyfus Family of Funds, 144 Glenn Curtiss Boulevard, Uniondale, NY 11556-0144 Attn: Institutional Servicing
The portfolio files its complete schedule of portfolio holdings with the Securities and Exchange Commission ("SEC") for the first and third quarters of each fiscal year on Form N-Q. The portfolio's Forms N-Q are available on the SEC's website at http://www.sec.gov and may be reviewed and copied at the SEC's Public Reference Room in Washington, DC. Information on the operation of the Public Reference Room may be obtained by calling 1-800-SEC-0330.
A description of the policies and procedures that the portfolio uses to determine how to vote proxies relating to portfolio securities, and information regarding how the portfolio voted these proxies for the 12-month period ended June 30, 2005, is available at http://www.dreyfus.com and on the SEC's website at http://www.sec.gov. The description of the policies and procedures is also available without charge, upon request, by calling 1-800-645-6561.
© 2005 Dreyfus Service Corporation

| Dreyfus Variable |
| Investment Fund, |
| Limited Term |
| High Yield Portfolio |

The views expressed in this report reflect those of the portfolio manager only through the end of the period covered and do not necessarily represent the views of Dreyfus or any other person in the Dreyfus organization.Any such views are subject to change at any time based upon market or other conditions and Dreyfus disclaims any responsibility to update such views. These views may not be relied on as investment advice and, because investment decisions for a Dreyfus portfolio are based on numerous factors, may not be relied on as an indication of trading intent on behalf of any Dreyfus portfolio.
Not FDIC-Insured • Not Bank-Guaranteed • May Lose Value
| | | Contents |
| |
| | | THE PORTFOLIO |
| |
|
| 2 | | Letter from the Chairman |
| 3 | | Discussion of Performance |
| 6 | | Understanding Your Portfolio's Expenses |
| 6 | | Comparing Your Portfolio's Expenses |
| | | With Those of Other Funds |
| 7 | | Statement of Investments |
| 21 | | Statement of Assets and Liabilities |
| 22 | | Statement of Operations |
| 23 | | Statement of Changes in Net Assets |
| 24 | | Financial Highlights |
| 28 | | Notes to Financial Statements |
| 39 | | Information About the Review |
| and Approval of the Portfolio's |
| Investment Advisory Agreement |
| | | FOR MORE INFORMATION |
| |
|
| | | Back Cover |
| Dreyfus Variable Investment Fund, |
| Limited Term High Yield Portfolio |
The Portfolio

LETTER FROM THE CHAIRMAN
Dear Shareholder:
We are pleased to present this semiannual report for Dreyfus Variable Investment Fund, Limited Term High Yield Portfolio, covering the six-month period from January 1, 2005, through June 30, 2005. Inside, you'll find valuable information about how the portfolio was managed during the reporting period, including a discussion with the portfolio manager, Jonathan Uhrig.
The first half of 2005 proved to be an unusual time for fixed-income securities. Contrary to historical norms, yields of longer-term U.S. government securities fell — and their prices rose — even as the Federal Reserve Board attempted to forestall inflationary pressures by raising short-term interest rates.Signs of potential economic weakness,a strengthening U.S. dollar and robust investor demand appear to have fueled the rally in the more interest-rate-sensitive parts of the market. Conversely, prices in the corporate bond market declined despite an expanding economy, improved balance sheets and persistently low default rates.
In our view, these factors may have created new opportunities and challenges for fixed-income investors. Our economists currently expect the U.S. economy to continue to grow over the foreseeable future without significant new inflationary pressures, potentially setting the stage for market conditions that could affect the various sectors of the U.S. bond market in different ways. As always, we encourage you to discuss these and other matters with your financial advisor.
Thank you for your continued confidence and support.


DISCUSSION OF PERFORMANCE
Jonathan Uhrig, Primary Portfolio Manager
How did Dreyfus Variable Investment Fund, Limited Term High Yield Portfolio perform during the period?
For the six-month period ended June 30, 2005, the portfolio's Initial shares achieved a total return of 0.16%, and its Service shares achieved a total return of 0.03% .The portfolio generated aggregate income dividends of $0.239 for Initial shares and $0.230 for Service shares.1 The Merrill Lynch High Yield Master II Index (the "Index"), the portfolio's benchmark, achieved a total return of 1.13% for the same period.2
High-yield bonds were hurt during the first half of 2005 by weaker-than-expected financial results from major U.S. automotive companies, which led some of the credit-rating agencies to downgrade their unsecured debt securities to the high-yield range.The portfolio produced lower returns than the Index, primarily due to company-specific disappointments in January.
Note to shareholders: On January 31, 2005, Jonathan Uhrig and John McNichols became the fund's primary and secondary portfolio managers, respectively. Each manages the portfolio under a dual-employee relationship with Dreyfus, using the proprietary investment processes of Standish Mellon Asset Management, LLC (Standish) — an affiliate of Dreyfus. Mr. Uhrig is the high-yield portfolio manager and formerly the head of high-yield trading at Standish and has been employed by Standish Mellon since 1997. Mr. McNichols is the director of credit research and investment for Standish Mellon and has been employed by Standish Mellon since 1993.
What is the portfolio's investment approach?
The portfolio seeks to maximize total return consisting of capital appreciation and current income. To pursue this goal, we normally invest at least 80% of the portfolio's assets in fixed-income securities rated below investment-grade ("high-yield" or "junk" bonds).We may invest in various types of fixed-income securities, including corporate bonds and notes, mortgage-related securities, asset-backed securities, zero coupon securities, inflation-indexed bonds, convertible securities, preferred stocks and other debt securities of U.S. and foreign issuers.
In choosing securities, we seek to capture higher yields offered by junk bonds, while managing credit risk and the volatility caused by interest
DISCUSSION OF PERFORMANCE (continued)
rate movements.We reduce interest rate risk by maintaining an average effective portfolio maturity of 5.5 years or less, although there is no limit on the maturity of individual securities.
Our investment process is based on fundamental credit research. We look at a variety of factors when assessing a potential investment, including the company's financial strength, the state of the industry or sector it belongs to, the long-term fundamentals of that industry or sector, the company's management, and whether there is sufficient equity value in the company.
What other factors influenced the portfolio's performance?
High-yield bonds generally continued to rally early in the reporting period.At the end of February most broad high-yield market measures reached all-time lows for yield spreads to Treasuries. In March, however, cash outflows from the high-yield market and disappointing news from General Motors and Ford Motor Company and some of their supplier companies put pressure on the credit markets. During the reporting period the major bond rating agencies took action to downgrade the unsecured debt ratings of Ford and GM from the investment-grade category to the high-yield range. Because these companies rank among the market's higher-volume issuers of corporate bonds, the change in credit ratings created heightened volatility as the high-yield market absorbed their securities.
At the same time, fixed-income investors grew increasingly worried that the trend among corporations toward balance sheet repair and cost-cutting might have reached its end. In fact, investors detected an apparent shift toward more shareholder-friendly activities — including share buy-backs, dividend increases and asset acquisitions — that tend to put pressure on corporate balance sheets. As a result, investors became more risk averse,and higher-rated bonds tended to fare better than lower-rated ones.
In this environment, the portfolio began to lag its benchmark in January, when company-specific problems hurt the bonds of a limited number of energy and media companies that the fund owned.When we assumed responsibility for the portfolio at the end of that month, we began to reduce its holdings of CCC-rated and unrated securities in favor of higher-quality bonds.We cut back the portfolio's holdings of lower-rated issuers that did not meet our credit criteria. On the sector weighting front we also reduced holdings from broadcasters, which continued to suffer from an advertising slump, and chemical companies, which had reached prices we considered fairly valued.
Instead, we constructed a more broadly diversified portfolio in securities where the potential for credit improvement is higher.
These changes helped the portfolio avoid the full brunt of the market downturn in March and April, which was more severe at the lower end of the high-yield category.The portfolio's relative performance also benefited from its lack of exposure to the auto-parts sector. In the month of June, the relative performance of the portfolio was hurt by an underweighted position in the General Motors complex which rallied strongly in June.In addition,the traditional portfolio positioning of limiting exposure to interest rates caused some underperformance as yields on intermediate and long U.S.Treasuries dropped significantly in May and June.
What is the portfolio's current strategy?
In the wake of the rising market of the past few years, yield differences between corporate bonds and U.S. Treasury securities have narrowed beyond historical norms, leaving little room for disappointment. Accordingly, we have maintained a relatively cautious investment posture despite generally favorable market fundamentals, including low default rates and a growing economy.We believe that the portfolio's transition to a higher-quality credit profile is largely complete, and we have continued to search for new opportunities through intensive research into the financial conditions and business prospects of individual issuers.
| | | The portfolio is only available as a funding vehicle under variable life insurance policies or variable |
| | | annuity contracts issued by insurance companies. Individuals may not purchase shares of these |
| | | portfolios directly. A variable annuity is an insurance contract issued by an insurance company that |
| | | enables investors to accumulate assets on a tax-deferred basis for retirement or other long-term |
| | | goals.The investment objective and policies of Dreyfus Variable Investment Fund, Limited Term |
| | | High Yield Portfolio may be similar to other funds/portfolios managed or advised by Dreyfus. |
| | | However, the investment results of the portfolio may be higher or lower than, and may not be |
| | | comparable to, those of any other Dreyfus fund/portfolio. |
| 1 | | Total return includes reinvestment of dividends and any capital gains paid. Past performance is no |
| | | guarantee of future results. Share price and investment return fluctuate such that upon redemption, |
| | | portfolio shares may be worth more or less than their original cost.The portfolio's performance does |
| | | not reflect the deduction of additional charges and expenses imposed in connection with investing |
| | | in variable insurance contracts, which will reduce returns. Return figures provided reflect the |
| | | absorption of certain portfolio expenses by The Dreyfus Corporation pursuant to an agreement |
| | | that was in effect through December 31, 2004, and which was extended to December 31, 2005. |
| | | Had these expenses not been absorbed, the portfolio's returns would have been lower. |
| 2 | | SOURCE: LIPPER INC. — Reflects reinvestment of dividends and, where applicable, capital |
| | | gain distributions.The Merrill Lynch High Yield Master II Index is an unmanaged performance |
| | | benchmark composed of U.S. domestic and Yankee bonds rated below investment grade with at |
| | | least $100 million par amount outstanding and greater than or equal to one year to maturity. |
| | | Unlike the portfolio, it is not limited by any maximum average maturity. |
The Portfolio 5
UNDERSTANDING YOUR PORTFOLIO'S EXPENSES(Unaudited)
As a mutual fund investor,you pay ongoing expenses,such as management fees and other expenses.Using the information below,you can estimate how these expenses affect your investment and compare them with the expenses of other funds.You also may pay one-time transaction expenses, including sales charges (loads) and redemption fees, which are not shown in this section and would have resulted in higher total expenses. For more information, see your portfolio's prospectus or talk to your financial adviser.
Review your portfolio's expenses
|
The table below shows the expenses you would have paid on a $1,000 investment in Dreyfus Variable Investment Fund, Limited Term High Yield Portfolio from January 1, 2005 to June 30, 2005. It also shows how much a $1,000 investment would be worth at the close of the period, assuming actual returns and expenses.
| Expenses and Value of a $1,000 Investment | | |
| assuming actual returns for the six months ended June 30, 2005 | | |
| | | Initial Shares | | Service Shares |
| |
| |
|
| Expenses paid per $1,000 † | | $ 4.32 | | $ 4.46 |
| Ending value (after expenses) | | $1,001.60 | | $1,000.30 |
COMPARING YOUR PORTFOLIO'S EXPENSES WITH THOSE OF OTHER FUNDS (Unaudited)
Using the SEC's method to compare expenses
The Securities and Exchange Commission (SEC) has established guidelines to help investors assess fund expenses. Per these guidelines, the table below shows your portfolio's expenses based on a $1,000 investment, assuming a hypothetical 5% annualized return. You can use this information to compare the ongoing expenses (but not transaction expenses or total cost) of investing in the portfolio with those of other funds. All mutual fund shareholder reports will provide this information to help you make this comparison. Please note that you cannot use this information to estimate your actual ending account balance and expenses paid during the period.
Expenses and Value of a $1,000 Investment assuming a hypothetical 5% annualized return for the six months ended June 30, 2005
| | | Initial Shares | | Service Shares |
| |
| |
|
| Expenses paid per $1,000 † | | $ 4.36 | | $ 4.51 |
| Ending value (after expenses) | | $1,020.48 | | $1,020.33 |
† Expenses are equal to the fund's annualized expense ratio of .87% for Initial shares and .90% for Service shares; multiplied by the average account value over the period, multiplied by 181/365 (to reflect the one-half year period).
| | S TAT E M E N T O F I N V E S T M E N T S
J u n e 3 0 , 2 0 0 5 (Unaudited)
|
| | | Principal | | | | |
| Bonds and Notes—90.7% | | Amounta | | Value ($) |
| |
| |
|
| Advertising—.3% | | | | | | |
| RH Donnelley Financial: | | | | | | |
| Sr. Notes, 8.875%, 2010 | | 48,000 | | b | | 52,680 |
| Sr. Sub. Notes, 10.875%, 2012 | | 39,000 | | b | | 45,533 |
| | | | | | | 98,213 |
| Aerospace & Defense—.9% | | | | | | |
| Argo-Tech, | | | | | | |
| Sr. Notes, 9.25%, 2011 | | 78,000 | | | | 85,020 |
| DRS Technologies, | | | | | | |
| Sr. Sub. Notes, 6.875%, 2013 | | 29,000 | | | | 30,160 |
| Transdigm, | | | | | | |
| Sr. Sub Notes, 8.375%, 2011 | | 155,000 | | | | 165,075 |
| | | | | | | 280,255 |
| Agricultural—.2% | | | | | | |
| Alliance One International, | | | | | | |
| Notes, 11%, 2012 | | 55,000 | | b | | 56,925 |
| Airlines—.6% | | | | | | |
| Northwest Airlines: | | | | | | |
| Pass-Through Ctfs., Ser. 1996-1, 7.67%, 2015 | | 109,542 | | | | 82,141 |
| Sr. Notes, 10%, 2009 | | 130,000 | | c | | 57,200 |
| United AirLines, | | | | | | |
| Enhanced Pass-Through Ctfs., | | | | | | |
| Ser. 1997-1A, 1.34%, 2049 | | 45,118 | | d | | 43,654 |
| | | | | | | 182,995 |
| Auto Manufacturing—.3% | | | | | | |
| Navistar International, | | | | | | |
| Sr. Notes, 7.5%, 2011 | | 85,000 | | c | | 87,125 |
| Automotive, Trucks & Parts—1.4% | | | | | | |
| Airxcel, | | | | | | |
| Sr. Sub. Notes, Ser. B, 11%, 2007 | | 20,000 | | | | 19,900 |
| Goodyear Tire & Rubber, | | | | | | |
| Sr. Notes, 9%, 2015 | | 200,000 | | b | | 197,500 |
| HLI Operating, | | | | | | |
| Sr. Notes, 10.5%, 2010 | | 18,000 | | | | 17,730 |
| Polypore, | | | | | | |
| Sr. Discount Note, 0/10.50%, 2012 | | 131,000 | | b,e | | 72,050 |
| United Components, | | | | | | |
| Sr. Sub. Notes, 9.375%, 2013 | | 48,000 | | | | 48,600 |
| Visteon, | | | | | | |
| Sr. Notes, 8.25%, 2010 | | 90,000 | | | | 83,700 |
| | | | | | | 439,480 |
STATEMENT OF INVESTMENTS (Unaudited) (continued)
| | | Principal | | | | |
| Bonds and Notes (continued) | | Amounta | | Value ($) |
| |
| |
|
| Banking—1.0% | | | | | | |
| Chevy Chase Bank FSB, | | | | | | |
| Sub. Notes, 6.875%, 2013 | | 200,000 | | | | 207,500 |
| Colonial Bank Montgomery Alabama, | | | | | | |
| Sub. Notes, 9.375%, 2011 | | 75,000 | | | | 89,402 |
| | | | | | | 296,902 |
| Building & Construction—1.8% | | | | | | |
| Asia Aluminum, | | | | | | |
| Secured Notes, 8%, 2011 | | 34,000 | | b,c | | 33,575 |
| Beazer Homes USA, | | | | | | |
| Sr. Notes, 6.875%, 2015 | | 125,000 | | b | | 124,375 |
| Compression Polymers, | | | | | | |
| Sr. Notes, 10.5%, 2013 | | 65,000 | | b | | 65,000 |
| Goodman Global: | | | | | | |
| Sr. Notes, 6.41%, 2012 | | 25,000 | | b,d | | 24,750 |
| Sr. Sub. Notes, 7.875%, 2012 | | 29,000 | | b,c | | 26,970 |
| Nortek, | | | | | | |
| Sr. Sub. Notes, 8.5%, 2014 | | 85,000 | | | | 79,475 |
| Owens Corning, | | | | | | |
| Notes, 7.7%, 2008 | | 175,000 | | f | | 128,625 |
| Texas Industries, | | | | | | |
| Sr. Notes, 7.25%, 2013 | | 15,000 | | b | | 15,375 |
| WCI Communities, | | | | | | |
| Sr. Sub. Notes, 10.625%, 2011 | | 67,000 | | | | 72,695 |
| | | | | | | 570,840 |
| Chemicals—3.7% | | | | | | |
| Huntsman ICI Chemicals, | | | | | | |
| Sr. Sub. Notes, 10.125%, 2009 | | 239,000 | | | | 247,066 |
| Huntsman International: | | | | | | |
| Sr. Notes, 9.875%, 2009 | | 29,000 | | | | 31,175 |
| Sr. Secured Notes, 11.625%, 2010 | | 14,000 | | | | 16,468 |
| Nalco: | | | | | | |
| Sr. Notes, 7.75%, 2011 | | 50,000 | | | | 53,500 |
| Sr. Sub. Notes, 8.875%, 2013 | | 275,000 | | | | 296,312 |
| PQ, | | | | | | |
| Sr. Sub. Notes, 7.5%, 2013 | | 20,000 | | b | | 19,750 |
| Rhodia, | | | | | | |
| Sr. Notes, 10.25%, 2010 | | 262,000 | | c | | 282,305 |
| Rockwood Specialties, | | | | | | |
| Sr. Sub. Notes, 10.625%, 2011 | | 96,000 | | | | 106,320 |
8
| | | | | Principal | | | | |
| Bonds and Notes (continued) | | | | Amounta | | Value ($) |
| |
| |
| |
|
| Chemicals (continued) | | | | | | | | |
| Westlake Chemical, | | | | | | | | |
| Sr. Notes, 8.75%, 2011 | | | | 85,000 | | | | 92,862 |
| | | | | | | | | 1,145,758 |
| Commercial & Professional Services—.9% | | | | | | | | |
| Brickman, | | | | | | | | |
| Sr. Sub. Notes, Ser. B, 11.75%, 2009 | | | | 62,000 | | | | 70,525 |
| Corrections Corp of America, | | | | | | | | |
| Sr. Sub. Notes, 6.25%, 2013 | | | | 175,000 | | | | 174,563 |
| Service Corp International, | | | | | | | | |
| Sr. Notes, 7%, 2017 | | | | 45,000 | | b | | 46,462 |
| | | | | | | | | 291,550 |
| Consumer Products—1.2% | | | | | | | | |
| Ames True Temper, | | | | | | | | |
| Sr. Sub. Notes, 10%, 2012 | | | | 85,000 | | c | | 68,850 |
| Amscan, | | | | | | | | |
| Sr. Sub. Notes, 8.75%, 2014 | | | | 110,000 | | | | 101,200 |
| Playtex Products, | | | | | | | | |
| Sr. Sub. Notes, 9.375%, 2011 | | | | 160,000 | | | | 169,200 |
| Rayovac, | | | | | | | | |
| Sr. Sub. Notes, 8.5%, 2013 | | | | 32,000 | | | | 33,600 |
| | | | | | | | | 372,850 |
| Diversified Financial Service—5.5% | | | | | | | | |
| BCP Crystal US, | | | | | | | | |
| Sr. Sub. Notes, 9.625%, 2014 | | | | 155,000 | | | | 174,375 |
| Consolidated Communications Illinois/Texas, | | | | | | | | |
| Sr. Notes, 9.75%, 2012 | | | | 100,000 | | b | | 105,250 |
| FINOVA, | | | | | | | | |
| Notes, 7.5%, 2009 | | | | 161,040 | | | | 72,468 |
| Ford Motor Credit: | | | | | | | | |
| Global Landmark Securities, 7.375%, 2009 | | | | 120,000 | | | | 117,369 |
| Notes, 3.75%, 2006 | | | | 315,000 | | d | | 312,351 |
| General Electric Capital, | | | | | | | | |
| Notes, 7.75%, 2012 | | | | 230,000 | | | | 225,046 |
| Glencore Funding, | | | | | | | | |
| Notes, 6%, 2014 | | | | 100,000 | | b | | 96,050 |
| GMAC, | | | | | | | | |
| Sr. Notes, 5.375%, 2011 | | EUR | | 80,000 | | | | 86,920 |
STATEMENT OF INVESTMENTS (Unaudited) (continued)
| | | Principal | | | | |
| Bonds and Notes (continued) | | Amounta | | Value ($) |
| |
| |
|
| Diversified Financial Service (continued) | | | | |
| K&F Acquisition, | | | | | | |
| Sr. Sub. Notes, 7.75%, 2014 | | 35,000 | | | | 35,962 |
| Kansas City Southern Railway, | | | | | | |
| Sr. Notes, 9.5%, 2008 | | 70,000 | | | | 76,650 |
| Leucadia National, | | | | | | |
| Sr. Notes, 7%, 2013 | | 75,000 | | | | 75,375 |
| Residential Capital: | | | | | | |
| Notes, 6.375%, 2010 | | 205,000 | | b | | 206,204 |
| Notes, 6.875%, 2015 | | 55,000 | | b | | 56,511 |
| Stena AB, | | | | | | |
| Sr. Notes, 7.5%, 2013 | | 66,000 | | | | 65,340 |
| | | | | | | 1,705,871 |
| Diversified Metals & Mining—1.4% | | | | | | |
| CSN Islands VIII, | | | | | | |
| Sr. Notes, 10%, 2015 | | 85,000 | | b | | 92,225 |
| Consol Energy, | | | | | | |
| Notes, 7.875%, 2012 | | 223,000 | | | | 243,070 |
| International Steel, | | | | | | |
| Sr. Notes, 6.5%, 2014 | | 90,000 | | | | 86,850 |
| | | | | | | 422,145 |
| Electric Utilities—8.5% | | | | | | |
| AES, | | | | | | |
| Sr. Sub. Notes, 8.875%, 2011 | | 450,000 | | | | 504,000 |
| Allegheny Energy Statutory Trust 2001 | | | | | | |
| Secured Notes, 10.25%, 2007 | | 226,999 | | b | | 250,876 |
| Allegheny Energy Supply: | | | | | | |
| Bonds, 8.25%, 2012 | | 418,000 | | b,c | | 470,250 |
| Notes, 7.8%, 2011 | | 56,000 | | c | | 61,320 |
| CMS Energy, | | | | | | |
| Sr. Notes, 9.875%, 2007 | | 159,000 | | | | 174,105 |
| Calpine Generating, | | | | | | |
| Secured Notes, 12.39%, 2011 | | 17,000 | | c,d | | 15,555 |
| Mirant, | | | | | | |
| Sr. Notes, 7.4%, 2004 | | 100,000 | | b,f | | 81,500 |
| NRG Energy, | | | | | | |
| Secured Bonds, 8%, 2013 | | 140,000 | | b | | 148,400 |
| Nevada Power: | | | | | | |
| First Mortgage, 6.50%, 2012 | | 32,000 | | | | 33,600 |
| Mortgage, Bonds Ser. A, 8.25%, 2011 | | 70,000 | | | | 79,275 |
| Notes, Ser. E, 10.875%, 2009 | | 63,000 | | | | 70,718 |
10
| | | Principal | | | | |
| Bonds and Notes (continued) | | Amounta | | Value ($) |
| |
| |
|
| Electric Utilities (continued) | | | | | | |
| Reliant Energy, | | | | | | |
| Sr. Secured, Notes, 9.25%, 2010 | | 270,000 | | | | 295,650 |
| Sierra Pacific Power: | | | | | | |
| Mortgage Notes, 6.25%, 2012 | | 50,000 | | | | 51,625 |
| Sr. Notes, 8.625%, 2014 | | 129,000 | | | | 143,190 |
| TECO Energy, | | | | | | |
| Sr. Notes, 6.75%, 2015 | | 40,000 | | b | | 42,600 |
| Texas Genco/Financing, | | | | | | |
| Sr. Notes, 6.875%, 2014 | | 50,000 | | b | | 52,875 |
| TXU, | | | | | | |
| Notes, 5.55%, 2014 | | 150,000 | | b | | 146,228 |
| | | | | | | 2,621,767 |
| Electrical & Electronics—1.6% | | | | | | |
| Dresser, | | | | | | |
| Sr. Sub. Notes, 9.375%, 2011 | | 137,000 | | | | 144,878 |
| Fisher Scientific International: | | | | | | |
| Sr. Sub. Notes, 8%, 2013 | | 162,000 | | | | 185,895 |
| Sr. Sub. Notes, 6.125%, 2015 | | 100,000 | | b | | 100,625 |
| Imax, | | | | | | |
| Sr. Notes, 9.625%, 2010 | | 66,000 | | | | 69,630 |
| | | | | | | 501,028 |
| Entertainment—2.8% | | | | | | |
| Argosy Gaming, | | | | | | |
| Sr. Sub. Notes, 9%, 2011 | | 110,000 | | c | | 120,863 |
| Cinemark, | | | | | | |
| Sr. Discount Notes, 0/9.75%, 2014 | | 90,000 | | e | | 60,300 |
| Intrawest, | | | | | | |
| Sr. Notes, 7.5%, 2013 | | 9,000 | | | | 9,281 |
| Isle of Capri Casinos, | | | | | | |
| Sr. Sub. Notes, 9%, 2012 | | 57,000 | | c | | 62,272 |
| Mohegan Tribal Gaming Authority: | | | | | | |
| Sr. Notes, 6.125%, 2013 | | 170,000 | | b | | 172,550 |
| Sr. Sub. Notes, 6.375%, 2009 | | 157,000 | | | | 160,925 |
| Sr. Sub. Notes, 8%, 2012 | | 85,000 | | c | | 91,375 |
| Penn National Gaming: | | | | | | |
| Sr. Sub. Notes, 6.75%, 2015 | | 35,000 | | b | | 34,912 |
| Sr. Sub. Notes, 6.875%, 2011 | | 80,000 | | | | 82,400 |
| Seneca Gaming, | | | | | | |
| Sr. Notes, 7.25%, 2012 | | 60,000 | | b | | 62,325 |
| | | | | | | 857,203 |
STATEMENT OF INVESTMENTS (Unaudited) (continued)
| | | Principal | | | | |
| Bonds and Notes (continued) | | Amounta | | Value ($) |
| |
| |
|
| Environmental Control—1.8% | | | | | | |
| Allied Waste: | | | | | | |
| Sr. Notes, Ser. B, 8.5%, 2008 | | 425,000 | | | | 447,844 |
| Sr. Notes, Ser. B, 9.25%, 2012 | | 37,000 | | | | 40,145 |
| Geo Sub, | | | | | | |
| Sr. Notes, 11%, 2012 | | 56,000 | | | | 56,560 |
| | | | | | | 544,549 |
| Food & Beverages—2.0% | | | | | | |
| Agrilink Foods, | | | | | | |
| Sr. Sub. Notes, 11.875%, 2008 | | 16,000 | | | | 16,620 |
| Corn Products International: | | | | | | |
| Sr. Notes, 8.25%, 2007 | | 57,000 | | | | 61,202 |
| Sr. Notes, 8.45%, 2009 | | 57,000 | | | | 64,228 |
| Del Monte, | | | | | | |
| Sr. Sub. Notes, 8.625%, 2012 | | 62,000 | | | | 68,510 |
| Dole Food: | | | | | | |
| Debs., 8.75%, 2013 | | 46,000 | | | | 50,025 |
| Sr. Notes, 8.625%, 2009 | | 49,000 | | | | 52,430 |
| Sr. Notes, 8.875%, 2011 | | 32,000 | | | | 34,320 |
| Ingles Markets, | | | | | | |
| Sr. Sub. Notes, 8.875%, 2011 | | 25,000 | | | | 25,531 |
| Pinnacle Foods, | | | | | | |
| Sr. Sub. Notes, 8.25%, 2013 | | 80,000 | | c | | 72,000 |
| Stater Brothers, | | | | | | |
| Sr. Notes, 8.125%, 2012 | | 170,000 | | c | | 166,600 |
| | | | | | | 611,466 |
| Gaming & Lodging—6.2% | | | | | | |
| Chumash Casino & Resort Enterprise, | | | | |
| Sr. Notes, 9.26%, 2010 | | 40,000 | | b | | 43,500 |
| Inn of the Mountain Gods Resort & Casino, | | | | |
| Sr. Notes, 12%, 2010 | | 174,000 | | | | 201,840 |
| Kerzner International, | | | | | | |
| Notes, 8.875%, 2011 | | 207,000 | | | | 222,525 |
| Mandalay Resort, | | | | | | |
| Sr. Notes, 6.5%, 2009 | | 127,000 | | | | 130,492 |
| MGM Mirage, | | | | | | |
| Notes, 8.5%, 2010 | | 129,000 | | | | 143,835 |
| Park Place Entertainment: | | | | | | |
| Sr. Sub. Notes, 7.875%, 2005 | | 152,000 | | | | 154,660 |
| Sr. Sub. Notes, 7.875%, 2010 | | 79,000 | | c | | 88,875 |
| Sr. Sub. Notes, 8.875%, 2008 | | 321,000 | | | | 359,119 |
12
| | | Principal | | | | |
| Bonds and Notes (continued) | | Amounta | | Value ($) |
| |
| |
|
| Gaming & Lodging (continued) | | | | | | |
| Resorts International Hotel and Casino, | | | | | | |
| First Mortgage, 11.5%, 2009 | | 194,000 | | | | 221,887 |
| Trump Entertainment Resorts, | | | | | | |
| Secured Notes, 8.5%, 2015 | | 243,000 | | | | 238,444 |
| Turning Stone Casino Entertainment, | | | | | | |
| Sr. Notes, 9.125%, 2010 | | 45,000 | | b | | 47,812 |
| Wynn Las Vegas Capital, | | | | | | |
| First Mortgage Notes, 6.625%, 2014 | | 85,000 | | b | | 83,087 |
| | | | | | | 1,936,076 |
| Health Care—3.9% | | | | | | |
| Beverly Enterprises, | | | | | | |
| Sr. Sub. Notes, 7.875%, 2014 | | 57,000 | | | | 62,415 |
| Coventry Health Care, | | | | | | |
| Sr. Notes, 8.125%, 2012 | | 115,000 | | | | 124,775 |
| DaVita, | | | | | | |
| Sr. Sub. Notes, 7.25%, 2015 | | 100,000 | | b,c | | 103,250 |
| Extendicare Health Services, | | | | | | |
| Sr. Notes, 9.5%, 2010 | | 40,000 | | | | 43,400 |
| Healthsouth: | | | | | | |
| Notes, 7.625%, 2012 | | 100,000 | | | | 97,500 |
| Sr. Notes, 8.375%, 2011 | | 95,000 | | | | 94,762 |
| Psychiatric Solutions, | | | | | | |
| Sr. Sub. Notes, 7.75%, 2015 | | 15,000 | | b | | 15,000 |
| Tenet Healthcare, | | | | | | |
| Sr. Notes, 9.875%, 2014 | | 431,000 | | | | 464,403 |
| Triad Hospitals, | | | | | | |
| Sr. Sub. Notes, 7%, 2013 | | 201,000 | | c | | 207,532 |
| | | | | | | 1,213,037 |
| Machinery—1.4% | | | | | | |
| Case New Holland, | | | | | | |
| Sr. Notes, 9.25%, 2011 | | 209,000 | | b | | 220,495 |
| Douglas Dynamics, | | | | | | |
| Sr. Notes, 7.75%, 2012 | | 215,000 | | b | | 211,775 |
| | | | | | | 432,270 |
| Manufacturing—.9% | | | | | | |
| Bombardier, | | | | | | |
| Notes, 6.3%, 2014 | | 100,000 | | b | | 91,000 |
| JB Poindexter & Co, | | | | | | |
| Sr. Notes, 8.75%, 2014 | | 152,000 | | | | 139,080 |
STATEMENT OF INVESTMENTS (Unaudited) (continued)
| | | Principal | | | | |
| Bonds and Notes (continued) | | Amounta | | Value ($) |
| |
| |
|
| Manufacturing (continued) | | | | | | |
| Polypore, | | | | | | |
| Sr. Sub. Notes, 8.75%, 2012 | | 68,000 | | | | 63,920 |
| | | | | | | 294,000 |
| Media—7.3% | | | | | | |
| Adelphia Communications, | | | | | | |
| Sr. Notes, Ser. B, 7.75%, 2009 | | 103,000 | | f | | 89,610 |
| American Media Operation, | | | | | | |
| Sr. Sub. Notes, Ser. B, 10.25%, 2009 | | 60,000 | | | | 60,300 |
| CSC Holdings: | | | | | | |
| Sr. Notes, 6.75%, 2012 | | 66,000 | | b | | 62,370 |
| Sr. Notes, 7.875%, 2007 | | 123,000 | | | | 127,612 |
| Sr. Notes, Ser.B, 8.125%, 2009 | | 100,000 | | | | 101,750 |
| Charter Communications: | | | | | | |
| Sr. Notes, 8.75%, 2013 | | 249,000 | | | | 246,510 |
| Sr. Discount Notes, 0/11.75%, 2011 | | 55,000 | | e | | 36,713 |
| Dex Media East Finance: | | | | | | |
| Sr. Sub. Notes, Ser. B, 9.875%, 2009 | | 11,000 | | c | | 12,182 |
| Sr. Sub. Notes, Ser. B, 12.125%, 2012 | | 207,000 | | | | 248,917 |
| Dex Media West/Finance, | | | | | | |
| Sr. Sub. Notes, Ser. B, 9.875%, 2013 | | 153,000 | | | | 175,185 |
| DirecTV Holdings LLC, | | | | �� | | |
| Sr. Notes, 8.375%, 2013 | | 116,000 | | | | 129,050 |
| Entercom Radio Capital, | | | | | | |
| Sr. Sub. Notes, 7.625%, 2014 | | 35,000 | | | | 36,662 |
| Gray Television, | | | | | | |
| Sr. Sub. Notes, 9.25%, 2011 | | 30,000 | | | | 32,700 |
| Kabel Deutschland, | | | | | | |
| Sr. Notes, 10.625%, 2014 | | 87,000 | | b | | 94,830 |
| LBI Media, | | | | | | |
| Sr. Discount Notes, 0/11%, 2013 | | 97,000 | | e | | 72,386 |
| Lodgenet Entertainment, | | | | | | |
| Sr. Sub. Deb., 9.5%, 2013 | | 28,000 | | | | 30,660 |
| Nexstar Finance: | | | | | | |
| Sr. Discount Notes, 0/11.375%, 2013 | | 148,000 | | e | | 111,925 |
| Sr. Sub. Notes, 7%, 2014 | | 215,000 | | | | 200,219 |
| Pegasus Communications, | | | | | | |
| Sr. Sub. Notes, Ser. B, 12.5%, 2007 | | 228,000 | | f | | 126,255 |
| Radio One, | | | | | | |
| Sr. Sub. Notes, Ser. B, 8.875%, 2011 | | 90,000 | | | | 97,087 |
| Salem Communications, | | | | | | |
| Sr. Sub. Notes, Ser. B, 9%, 2011 | | 138,000 | | | | 149,385 |
14
| | | Principal | | | | |
| Bonds and Notes (continued) | | Amounta | | Value ($) |
| |
| |
|
| Media (continued) | | | | | | |
| Young Broadcasting, | | | | | | |
| Sr. Sub. Notes, 10%, 2011 | | 30,000 | | | | 28,650 |
| | | | | | | 2,270,958 |
| Oil & Gas—7.2% | | | | | | |
| Coastal: | | | | | | |
| Notes, 7.625%, 2008 | | 256,000 | | c | | 263,040 |
| Notes, 7.75%, 2010 | | 257,000 | | | | 263,425 |
| Sr. Debs., 6.5%, 2008 | | 57,000 | | | | 56,858 |
| Colorado Interstate Gas, | | | | | | |
| Sr. Notes, 5.95%, 2015 | | 75,000 | | b | | 74,316 |
| El Paso Production, | | | | | | |
| Sr. Notes, 7.75%, 2013 | | 109,000 | | | | 116,903 |
| Hanover Compressor: | | | | | | |
| Sr. Notes, 8.625%, 2010 | | 66,000 | | | | 70,125 |
| Sr. Notes, 9%, 2014 | | 84,000 | | | | 89,880 |
| Hanover Equipment Trust: | | | | | | |
| Sr. Secured Notes, | | | | | | |
| Ser A., 8.5%, 2008 | | 257,000 | | | | 268,565 |
| Sr. Secured Notes, | | | | | | |
| Ser. B, 8.75%, 2011 | | 11,000 | | | | 11,742 |
| McMoRan Exploration: | | | | | | |
| Sr. Notes, 5.25%, 2011 | | 57,000 | | b | | 75,881 |
| Sr. Notes, 6%, 2008 | | 316,000 | | | | 472,025 |
| Petroleum Geo-Services, | | | | | | |
| Notes, 10%, 2010 | | 120,000 | | | | 135,000 |
| Pogo Producing, | | | | | | |
| Sr. Sub. Notes, 6.625%, 2015 | | 135,000 | | b | | 140,062 |
| Whiting Petroleum, | | | | | | |
| Sr. Sub. Notes, 7.25%, 2013 | | 155,000 | | | | 158,875 |
| | | | | | | 2,196,697 |
| Packaging & Containers—4.3% | | | | | | |
| Ball, | | | | | | |
| Notes, 6.875%, 2012 | | 150,000 | | | | 158,250 |
| Berry Plastics, | | | | | | |
| Sr. Sub. Notes, 10.75%, 2012 | | 35,000 | | | | 38,369 |
| Crown European, | | | | | | |
| Sr. Secured Notes, 9.5%, 2011 | | 230,000 | | | | 255,300 |
| Jefferson Smurfit, | | | | | | |
| Sr. Notes, 8.25%, 2012 | | 57,000 | | | | 57,570 |
| Norampac, | | | | | | |
| Sr. Notes, 6.75%, 2013 | | 75,000 | | | | 75,563 |
STATEMENT OF INVESTMENTS (Unaudited) (continued)
| | | Principal | | | | |
| Bonds and Notes (continued) | | Amounta | | Value ($) |
| |
| |
|
| Packaging & Containers (continued) | | | | | | |
| Owens-Brockway: | | | | | | |
| Sr. Notes, 8.25%, 2013 | | 30,000 | | | | 32,738 |
| Sr. Secured Notes, 6.75%, 2014 | | 28,000 | | | | 28,455 |
| Sr. Secured Notes, 7.75%, 2011 | | 60,000 | | | | 64,050 |
| Sr. Secured Notes, 8.75%, 2012 | | 9,000 | | | | 9,968 |
| Sr. Secured Notes, 8.875%, 2009 | | 50,000 | | | | 53,375 |
| Owens-Illinois, | | | | | | |
| Debs., 7.8%, 2018 | | 125,000 | | | | 131,875 |
| Pliant, | | | | | | |
| Sr. Secured Discount Notes, 0/11.125%, 2009 | | 97,000 | | e | | 85,845 |
| Solo Cup, | | | | | | |
| Sr. Sub. Notes, 8.5%, 2014 | | 90,000 | | c | | 84,600 |
| Stone Containers: | | | | | | |
| Sr. Notes, 8.375%, 2012 | | 75,000 | | | | 76,125 |
| Sr. Notes, 9.75%, 2011 | | 180,000 | | | | 191,250 |
| | | | | | | 1,343,333 |
| Paper & Forest Products—3.0% | | | | | | |
| Appleton Papers, | | | | | | |
| Sr. Sub Notes, 9.75%, 2014 | | 185,000 | | c | | 179,450 |
| Buckeye Technologies, | | | | | | |
| Sr. Notes, 8.5%, 2013 | | 80,000 | | | | 82,000 |
| Georgia-Pacific: | | | | | | |
| Sr. Notes, 7.375%, 2008 | | 123,000 | | | | 131,456 |
| Sr. Notes, 8.875%, 2010 | | 485,000 | | | | 552,900 |
| | | | | | | 945,806 |
| Pipelines—3.7% | | | | | | |
| ANR Pipeline, | | | | | | |
| Notes, 8.875%, 2010 | | 150,000 | | | | 165,289 |
| Dynegy: | | | | | | |
| Secured Notes, 9.875%, 2010 | | 153,000 | | b | | 169,830 |
| Secured Notes, 10.125%, 2013 | | 134,000 | | b | | 152,090 |
| Northwest Pipeline, | | | | | | |
| Notes, 8.125%, 2010 | | 155,000 | | | | 168,950 |
| Southern Natural Gas, | | | | | | |
| Notes, 8.875%, 2010 | | 123,000 | | | | 135,537 |
| Williams Cos.: | | | | | | |
| Notes, 7.125%, 2011 | | 100,000 | | | | 108,500 |
| Notes, 7.875%, 2021 | | 150,000 | | | | 171,375 |
| Notes, 8.75%, 2032 | | 50,000 | | | | 60,313 |
| | | | | | | 1,131,884 |
16
| | | Principal | | | | |
| Bonds and Notes (continued) | | Amounta | | Value ($) |
| |
| |
|
| Real Estate Investment Trust—1.0% | | | | | | |
| BF Saul, | | | | | | |
| Sr. Secured Notes, 7.5%, 2014 | | 150,000 | | | | 156,000 |
| Host Marriott, | | | | | | |
| Sr. Notes, Ser. M, 7%, 2012 | | 150,000 | | c | | 156,375 |
| | | | | | | 312,375 |
| Retail—1.3% | | | | | | |
| Amerigas Partners, | | | | | | |
| Sr. Notes, 7.25%, 2015 | | 80,000 | | b,c | | 83,600 |
| JC Penney, | | | | | | |
| Sr. Notes, 8%, 2010 | | 101,000 | | | | 111,605 |
| Rite Aid: | | | | | | |
| Sr. Secured Notes, 8.125%, 2010 | | 70,000 | | | | 72,450 |
| Sr. Secured Notes, 12.5%, 2006 | | 64,000 | | c | | 69,440 |
| VICORP Restaurants, | | | | | | |
| Sr. Notes, 10.5%, 2011 | | 64,000 | | | | 64,960 |
| | | | | | | 402,055 |
| Structured Index—4.1% | | | | | | |
| AB Svensk Exportkredit, | | | | | | |
| GSNE-ER Indexed Notes, 0%, 2007 | | 190,000 | | b,g | | 177,365 |
| Dow Jones CDX, | | | | | | |
| Credit Linked Notes, Ser. 4-T2, 6.75%, 2010 | | 1,073,000 | | b,h | | 1,079,036 |
| | | | | | | 1,256,401 |
| Technology— .8% | | | | | | |
| Freescale Semiconductor, | | | | | | |
| Sr. Notes, 6.875%, 2011 | | 230,000 | | | | 244,950 |
| Telecommunications—7.7% | | | | | | |
| American Tower: | | | | | | |
| Sr. Notes, 7.125%, 2012 | | 86,000 | | | | 91,375 |
| Sr. Notes, 9.375%, 2009 | | 123,000 | | | | 129,611 |
| Sr. Sub. Notes, 7.25%, 2011 | | 42,000 | | | | 44,520 |
| American Tower Escrow, | | | | | | |
| Discount Notes, 0%, 2008 | | 30,000 | | | | 23,175 |
| Hawaiian Telcom Communications, | | | | | | |
| Sr. Notes, 8.91375%, 2013 | | 75,000 | | b,d | | 77,625 |
| Innova S de RL, | | | | | | |
| Notes, 9.375%, 2013 | | 128,000 | | | | 144,960 |
| Intelsat Bermuda, | | | | | | |
| Sr. Notes, 7.805%, 2012 | | 85,000 | | b,d | | 86,913 |
| Sr. Notes, 8.25%, 2013 | | 105,000 | | b | | 108,938 |
STATEMENT OF INVESTMENTS (Unaudited) (continued)
| | | Principal | | | | |
| Bonds and Notes (continued) | | Amounta | | Value ($) |
| |
| |
|
| Telecommunications (continued) | | | | | | |
| Nextel Partners, | | | | | | |
| Sr. Notes, 12.5%, 2009 | | 77,000 | | | | 84,026 |
| Qwest, | | | | | | |
| Bank Note, Ser. A, 6.5%, 2007 | | 74,800 | | d | | 77,044 |
| Bank Note, Ser. B, 6.95%, 2010 | | 50,000 | | d | | 49,500 |
| Qwest Communications International, | | | | | | |
| Sr. Notes, 7.5%, 2014 | | 255,000 | | b | | 242,569 |
| Qwest Services, | | | | | | |
| Secured Notes, 14%, 2014 | | 135,000 | | | | 164,363 |
| Rogers Wireless Communications, | | | | | | |
| Secured Notes, 7.25%, 2012 | | 150,000 | | | | 162,750 |
| SBA Telecommunications, | | | | | | |
| Sr. Discount Notes, 0/9.75%, 2011 | | 310,000 | | e | | 286,750 |
| Spectrasite, | | | | | | |
| Sr. Notes, 8.25%, 2010 | | 121,000 | | | | 128,865 |
| US Unwired, | | | | | | |
| Second Priority Sr. Secured Notes, | | | | | | |
| Ser. B, 10%, 2012 | | 142,000 | | | | 158,685 |
| UbiquiTel Operating, | | | | | | |
| Sr. Notes, 9.875%, 2011 | | 86,000 | | | | 94,815 |
| Western Wireless, | | | | | | |
| Sr. Notes, 9.25%, 2013 | | 201,000 | | | | 229,894 |
| | | | | | | 2,386,378 |
| Textiles & Apparel—.3% | | | | | | |
| Dan River, | | | | | | |
| Sr. Notes, 12.75%, 2009 | | 135,000 | | c,f | | — |
| INVISTA, | | | | | | |
| Notes, 9.25%, 2012 | | 80,000 | | b | | 87,800 |
| | | | | | | 87,800 |
| Transportation—1.7% | | | | | | |
| CHC Helicopter, | | | | | | |
| Sr. Sub. Notes, 7.375%, 2014 | | 96,000 | | | | 96,240 |
| Greenbrier, | | | | | | |
| Sr. Notes, 8.375%, 2015 | | 100,000 | | b | | 102,250 |
| Gulfmark Offshore, | | | | | | |
| Sr. Sub. Notes, 7.75%, 2014 | | 113,000 | | | | 119,498 |
| TFM, S.A. de C.V., | | | | | | |
| Sr. Notes, 10.25%, 2007 | | 214,000 | | | | 230,050 |
| | | | | | | 548,038 |
| Total Bonds and Notes | | | | | | |
| (cost $27,217,234) | | | | | | 28,088,980 |
18
| Preferred Stocks—2.3 | | Shares | | Value ($) |
| |
| |
|
| Diversified Financial Service—1.1% | | |
| Sovereign Capital Trust II, | | | | |
| Cum. Conv., $2.1875 4 | | 6,850 | | 303,113 |
| Williams Holdings Of Delaware, | | | | |
| Cum. Conv., $2.75 | | 460 b | | 41,975 |
| | | | | 345,088 |
| Media—1.2% | | | | |
| Paxson Communications, | | | | |
| Cum. Conv., $975 | | 34 b | | 131,828 |
| Spanish Broadcasting System (Units) | | |
| Cum. Conv., Ser. B, $107.5 | | 213 | | 227,984 |
| | | | | 359,812 |
| Total Preferred Stocks | | | | |
| (cost $888,479) | | | | 704,900 |
| |
| |
|
| |
| Common Stocks—.4% | | | | |
| |
| |
|
| Chemicals—.0% | | | | |
| Huntsman | | 626 i | | 12,689 |
| Gaming & Lodging—.0% | | | | |
| Trump Entertainment Resorts | | 333 i | | 4,528 |
| Telecommunications—.4% | | | | |
| AboveNet | | 3,991 c,i | | 111,748 |
| Horizon PCS, Cl. A | | 36 j | | 936 |
| | | | | 112,684 |
| Textiles & Apparel—.0% | | | | |
| Dan River | | 4,342 c,i | | 5,210 |
| Total Common Stocks | | | | |
| (cost $226,672) | | | | 135,111 |
| |
| |
|
| |
| Other—.0% | | | | |
| |
| |
|
| Telecommunications: | | | | |
| AboveNet (warrants) | | 297 c,i | | 2,376 |
| AboveNet (warrants) | | 350 j | | 1,400 |
| Total Other | | | | |
| (cost $11,055) | | | | 3,776 |
STATEMENT OF INVESTMENTS (Unaudited) (continued)
| Other Investments—5.7% | | Shares | | Value ($) |
| |
| |
|
| Registered Investment Company; | | | | |
| Dreyfus Institutional Preferred | | | | |
| Plus Money Market Fund | | | | |
| (cost 1,751,000) | | 1,751,000 j | | 1,751,000 |
| |
| |
|
| |
| Investment of Cash Collateral | | | | |
| for Securities Loaned—8.7% | | | | |
| |
| |
|
| Registered Investment Company; | | | | |
| Dreyfus Institutional Cash Advanatage Plus Fund | | |
| (cost $2,697,196) | | 2,697,196 j | | 2,697,196 |
| |
| |
|
| |
| Total Investment (cost $32,780,581) | | 107.8% | | 33,380,963 |
| Liabilites, Less Cash and Receivables | | (7.8%) | | (2,406,566) |
| Net Assets | | 100.0% | | 30,974,397 |
| a Principal amount stated in U.S. Dollars unless otherwise noted. |
| Eur—Euro |
| b Securities exempt from registration under Rule 144A of the Securities Act of 1933.These securities may be resold in |
| transactions exempt from registration, normally to qualified institutional buyers. At June 30, 2005, these securities |
| amounted to $6,705,523 or 21.6% of net assets. |
| c All or a portion of these securities are on loan. At June 30, 2005, the total market value of the fund's securities on |
| loan is $2,564,766 and the total market value of the collateral held by the fund is $2,697,196. |
| d Variable rate security—interest rate subject to periodic change. |
| e Zero coupon until a specified date at which time the stated coupon rate becomes effective until maturity date. |
| f Non-income producing—security in default. |
| g Security linked to Goldman Sachs Non-Energy-Excess Return Index. |
| h Security linked to a portfolio of debt securities. |
| i Non-income producing security. |
| j Investments in affiliated money market funds. |
| Portfolio Summary (Unaudited) † | | | | |
| |
| | | Value (%) | | | | Value (%) |
| |
| |
| |
|
| Corporate Bonds | | 86.6 | | Common Stocks | | .4 |
| Money Market Investments | | 14.4 | | Swaps, Foreign Currency | | |
| Structured Index | | 4.1 | | Exchange Contracts | | .0 |
| Preferred Stocks | | 2.3 | | | | 107.8 |
| |
| † Based on net assets. | | | | | | |
| See notes to financial statements. | | | | | | |
20
S TAT E M E N T O F A S S E T S A N D L I A B I L I T I E S
J u n e 3 0 , 2 0 0 5 (Unaudited)
|
| | | Cost | | Value |
| |
| |
|
| Assets ($): | | | | |
| Investments in securities— | | | | |
| See Statement of Investments (including securities | | |
| on loan valued at $2,564,766)—Note 1(c): | | | | |
| Unaffiliated issuers | | 28,332,385 | | 28,932,767 |
| Affiliated issuers | | 4,448,196 | | 4,448,196 |
| Cash denominated in foreign currencies | | 43 | | 43 |
| Dividends and interest receivable | | | | 537,880 |
| Receivable for investment securities sold | | | | 51,150 |
| Receivable from broker for swap transaction | | | | 813 |
| Unrealized appreciation on forward currency | | | | |
| exchange contracts—Note 4 | | | | 402 |
| Prepaid expenses | | | | 1,500 |
| | | | | 33,972,751 |
| |
| |
|
| Liabilities ($): | | | | |
| Due to The Dreyfus Corporation and affiliates—Note 3(b) | | 19,669 |
| Cash overdraft due to custodian | | | | 74,654 |
| Liability for securities on loan—Note 1(c) | | | | 2,697,196 |
| Payable for investment securities purchased | | | | 194,087 |
| Unrealized depreciation on swap contracts—Note 4 | | 2,146 |
| Accrued expenses | | | | 10,602 |
| | | | | 2,998,354 |
| |
| |
|
| Net Assets ($) | | | | 30,974,397 |
| |
| |
|
| Composition of Net Assets ($): | | | | |
| Paid-in capital | | | | 65,655,355 |
| Accumulated distributions in excess of investment income—net | | (18,996) |
| Accumulated net realized gain (loss) on investments | | (35,260,600) |
| Accumulated net unrealized appreciation (depreciation) | | |
| on investments and foreign currency transactions | | 598,638 |
| |
|
| Net Assets ($) | | | | 30,974,397 |
| |
| |
|
| |
| |
| Net Asset Value Per Share | | | | |
| | | Initial Shares | | Service Shares |
| |
| |
|
| Net Assets ($) | | 21,875,696 | | 9,098,701 |
| Shares Outstanding | | 3,312,803 | | 1,374,587 |
| |
| |
|
| Net Asset Value Per Share ($) | | 6.60 | | 6.62 |
See notes to financial statements.
|
S TAT E M E N T O F O P E R AT I O N S
S i x M o n t h s E n d e d J u n e 3 0 , 2 0 0 5 (Unaudited)
|
| Investment Income ($): | | |
| Income: | | |
| Interest | | 1,119,141 |
| Dividends: | | |
| Unaffiliated issuers | | 26,514 |
| Affiliated issuers | | 49,742 |
| Income from securities lending | | 11,824 |
| Total Income | | 1,207,221 |
| Expenses: | | |
| Investment advisory fee—Note 3(a) | | 103,695 |
| Auditing fees | | 14,476 |
| Distribution fees—Note 3(b) | | 11,506 |
| Prospectus and shareholders' reports | | 4,671 |
| Trustees' fees and expenses—Note 3(c) | | 1,968 |
| Custodian fees—Note 3(b) | | 1,644 |
| Shareholder servicing costs—Note 3(b) | | 1,219 |
| Legal fees | | 497 |
| Miscellaneous | | 10,389 |
| Total Expenses | | 150,065 |
| Less—waiver of fees due to undertaking—Note 3(a) | | (9,997) |
| Net Expenses | | 140,068 |
| Investment Income—Net | | 1,067,153 |
| |
|
| Realized and Unrealized Gain (Loss) on Investments—Note 4 ($): |
| Net realized gain (loss) on investments and foreign currency transactions | | (428,475) |
| Net realized gain (loss) on swap transactions | | 203 |
| Net realized gain (loss) on forward currency exchange contracts | | 22 |
| Net Realized Gain (Loss) | | (428,250) |
| Net unrealized appreciation (depreciation) on investments, | | |
| foreign currency transactions, forward currency exchange | | |
| contracts and swap transactions | | (617,969) |
| Net Realized and Unrealized Gain (Loss) on Investments | | (1,046,219) |
| Net Increase in Net Assets Resulting from Operations | | 20,934 |
| | See notes to financial statements.
|
S TAT E M E N T O F C H A N G E S I N N E T A S S E T S
| | | Six Months Ended | | |
| | | June 30, 2005 | | Year Ended |
| | | (Unaudited) | | December 31, 2004 |
| |
| |
|
| Operations ($): | | | | |
| Investment income—net | | 1,067,153 | | 2,260,746 |
| Net realized gain (loss) on investments | | (428,250) | | 1,126,311 |
| Net unrealized appreciation | | | | |
| (depreciation) on investments | | (617,969) | | (211,372) |
| Net Increase (Decrease) in Net Assets | | | | |
| Resulting from Operations | | 20,934 | | 3,175,685 |
| |
| |
|
| Dividends to Shareholders from ($): | | | | |
| Investment income—net: | | | | |
| Initial shares | | (794,677) | | (1,757,277) |
| Service shares | | (313,841) | | (642,542) |
| Total Dividends | | (1,108,518) | | (2,399,819) |
| |
| |
|
| Beneficial Interest Transactions ($): | | | | |
| Net proceeds from shares sold: | | | | |
| Initial shares | | 1,060,704 | | 1,502,127 |
| Service shares | | 819,702 | | 2,407,679 |
| Dividends reinvested: | | | | |
| Initial shares | | 794,677 | | 1,757,277 |
| Service shares | | 313,841 | | 642,542 |
| Cost of shares redeemed: | | | | |
| Initial shares | | (3,081,781) | | (5,508,371) |
| Service shares | | (1,167,155) | | (2,887,368) |
| Increase (Decrease) in Net Assets | | | | |
| from Beneficial Interest Transactions | | (1,260,012) | | (2,086,114) |
| Total Increase (Decrease) in Net Assets | | (2,347,596) | | (1,310,248) |
| |
| |
|
| Net Assets ($): | | | | |
| Beginning of Period | | 33,321,993 | | 34,632,241 |
| End of Period | | 30,974,397 | | 33,321,993 |
| Undistributed (distributions in excess of) | | | | |
| investment income (loss)—net | | (18,996) | | 22,369 |
| |
| |
|
| Capital Share Transactions: | | | | |
| Initial Shares | | | | |
| Shares sold | | 155,624 | | 225,131 |
| Shares issued for dividends reinvested | | 120,406 | | 263,707 |
| Shares redeemed | | (459,016) | | (821,797) |
| Net Increase (Decrease) in Shares Outstanding | | (182,986) | | (332,959) |
| |
| |
|
| Service Shares | | | | |
| Shares sold | | 121,072 | | 357,890 |
| Shares issued for dividends reinvested | | 47,480 | | 96,282 |
| Shares redeemed | | (174,426) | | (431,163) |
| Net Increase (Decrease) in Shares Outstanding | | (5,874) | | 23,009 |
See notes to financial statements.
|
F I N A N C I A L H I G H L I G H T S
|
The following tables describe the performance for each share class for the fiscal periods indicated. All information (except portfolio turnover rate) reflects financial results for a single portfolio share.Total return shows how much your investment in the portfolio would have increased (or decreased) during each period, assuming you had reinvested all dividends and distributions.These figures have been derived from the portfolio's financial statements.
| Six Months Ended | | | | | | | | | | |
| June 30, 2005 | | | | Year Ended December 31, | | |
| |
| |
| |
|
| Initial Shares | | (Unaudited) | | 2004 a | | 2003 | | 2002 | | 2001 b | | 2000 |
| |
| |
| |
| |
| |
| |
|
| Per Share Data ($): | | | | | | | | | | | | |
| Net asset value, | | | | | | | | | | | | |
| beginning of period | | 6.83 | | 6.68 | | 5.63 | | 7.33 | | 8.47 | | 10.44 |
| Investment Operations: | | | | | | | | | | | | |
| Investment income—net | | .24c | | .46c | | .53c | | .69c | | .84c | | 1.15 |
| Net realized and unrealized | | | | | | | | | | | | |
| gain (loss) on investments | | (.23) | | .19 | | 1.12 | | (1.64) | | (1.07) | | (1.95) |
| Total from Investment Operations .01 | | .65 | | 1.65 | | (.95) | | (.23) | | (.80) |
| Distributions: | | | | | | | | | | | | |
| Dividends from investment | | | | | | | | | | | | |
| income—net | | (.24) | | (.50) | | (.60) | | (.75) | | (.91) | | (1.17) |
| Net asset value, end of period | | 6.60 | | 6.83 | | 6.68 | | 5.63 | | 7.33 | | 8.47 |
| |
| |
| |
| |
| |
| |
|
| Total Return (%) | | .16d | | 10.10 | | 30.00 | | (13.01) | | (2.90) | | (8.27) |
| | | Six Months Ended | | | | | | | | | | |
| | | June 30, 2005 | | | | Year Ended December 31, | | |
| | | |
| |
| |
|
| Initial Shares | | (Unaudited) | | 2004 a | | 2003 | | 2002 | | 2001 b | | 2000 |
| |
| |
| |
| |
| |
| |
|
| Ratios/Supplemental Data (%): | | | | | | | | | | |
| Ratio of total expenses | | | | | | | | | | | | |
| to average net assets | | .87e | | .89 | | .96 | | .94 | | .91 | | .99 |
| Ratio of net expenses | | | | | | | | | | | | |
| to average net assets | | .87e | | .89 | | .90 | | .92 | | .91 | | .99 |
| Ratio of net investment income | | | | | | | | | | |
| to average net assets | | 7.12e | | 6.82 | | 8.43 | | 10.69 | | 10.37 | | 11.10 |
| Portfolio Turnover Rate | | 35.96d | | 78.90 | | 258.88 | | 436.35 | | 198.14 | | 15.29 |
| |
| |
| |
| |
| |
| |
|
| Net Assets, end of period | | | | | | | | | | | | |
| ($ x 1,000) | | 21,876 | | 23,881 | | 25,571 | | 20,033 | | 30,146 | | 39,529 |
| a | | As of January 1, 2004, the portfolio has adopted the method of accounting for interim payments on swap contracts in |
| | | accordance with Financial Accounting Standards Board Statement No. 133.These interim payments are reflected |
| | | within net realized and unrealized gain (loss) on swap contracts, however, prior to January 1, 2004, these interim |
| | | payments were reflected within interest income/expense in the Statement of Operations.The effect of this change for |
| | | the period ended December 31, 2004, was to increase net investment income per share by less than $.01, decrease net |
| | | realized and unrealized gain (loss) on investments per share by less than $.01 and increase the ratio of net |
| | | investment income to average net assets from 6.81% to 6.82%. Per share data and ratios/supplemental data for |
| | | periods prior to January 1, 2004 have not been restated to reflect this change in presentation. |
| b | | As required, effective January 1, 2001, the portfolio has adopted the provisions of the AICPA Audit and Accounting |
| | | Guide for Investment Companies and began accreting discount or amortizing premium on fixed income securities on a |
| | | scientific basis and including paydown gains and losses in interest income.The effect of this change for the period |
| | | ended December 31, 2001 was to decrease net investment income per share by $.05, increase net realized and |
| | | unrealized gain (loss) on investments per share by $.05 and decrease the ratio of net investment income to average net |
| | | assets from 11.07% to 10.37%. Per share data and ratios/supplemental data for periods prior to January 1, 2001 |
| | | have not been restated to reflect these changes in presentation. |
| c | | Based on average shares outstanding at each month end. |
| d | | Not annualized. |
| e | | Annualized. |
| See notes to financial statements. |
F I N A N C I A L H I G H L I G H T S (continued)
|
| Six Months Ended | | | | | | | | | | |
| June 30, 2005 | | | | Year Ended December 31, | | |
| |
| |
| |
|
| Service Shares | | (Unaudited) | | 2004 a | | 2003 | | 2002 | | 2001 b | | 2000 |
| |
| |
| |
| |
| |
| |
|
| Per Share Data ($): | | | | | | | | | | | | |
| Net asset value, | | | | | | | | | | | | |
| beginning of period | | 6.84 | | 6.68 | | 5.63 | | 7.33 | | 8.46 | | 8.46 |
| Investment Operations: | | | | | | | | | | | | |
| Investment income—net | | .24c | | .46c | | .53c | | .68c | | .79c | | — |
| Net realized and unrealized | | | | | | | | | | | | |
| gain (loss) on investments | | (.23) | | .19 | | 1.12 | | (1.63) | | (1.02) | | — |
| Total from Investment Operations .01 | | .65 | | 1.65 | | (.95) | | (.23) | | — |
| Distributions: | | | | | | | | | | | | |
| Dividends from investment | | | | | | | | | | | | |
| income—net | | (.23) | | (.49) | | (.60) | | (.75) | | (.90) | | — |
| Net asset value, end of period | | 6.62 | | 6.84 | | 6.68 | | 5.63 | | 7.33 | | 8.46 |
| |
| |
| |
| |
| |
| |
|
| Total Return (%) | | .03d | | 10.06 | | 30.28 | | (13.12) | | (2.95) | | — |
| | | Six Months Ended | | | | | | | | | | |
| | | June 30, 2005 | | | | Year Ended December 31, | | |
| | | |
| |
| |
|
| Service Shares | | (Unaudited) | | 2004 a | | 2003 | | 2002 | | 2001 b | | 2000 |
| |
| |
| |
| |
| |
| |
|
| Ratios/Supplemental Data (%): | | | | | | | | | | |
| Ratio of total expenses | | | | | | | | | | | | |
| to average net assets | | 1.12e | | 1.14 | | 1.22 | | 1.25 | | 1.15 | | — |
| Ratio of net expenses | | | | | | | | | | | | |
| to average net assets | | .90e | | .90 | | .90 | | .92 | | .91 | | — |
| Ratio of net investment income | | | | | | | | | | |
| to average net assets | | 7.10e | | 6.80 | | 8.34 | | 10.73 | | 10.35 | | — |
| Portfolio Turnover Rate | | 35.96d | | 78.90 | | 258.88 | | 436.35 | | 198.14 | | 15.29 |
| |
| |
| |
| |
| |
| |
|
| Net Assets, end of period | | | | | | | | | | | | |
| ($ x 1,000) | | 9,099 | | 9,441 | | 9,062 | | 4,933 | | 2,797 | | 1 |
| a | | As of January 1, 2004, the portfolio has adopted the method of accounting for interim payments on swap contracts |
| | | in accordance with Financial Accounting Standards Board Statement No. 133.These interim payments are reflected |
| | | within net realized and unrealized gain (loss) on swap contracts, however, prior to January 1, 2004, these interim |
| | | payments were reflected within interest income/expense in the Statement of Operations.The effect of these changes |
| | | for the fiscal year ended December 31, 2004, was to increase net investment income per share by less than $.01, |
| | | decrease net realized and unrealized gain (loss) on investments per share by less than $.01 and had no effect on the |
| | | ratio of net investment income to average net assets. Per share data and ratios/supplemental data for periods prior to |
| | | January 1, 2004 have not been restated to reflect this change in presentation. |
| b | | As required, effective January 1, 2001, the portfolio has adopted the provisions of the AICPA Audit and Accounting |
| | | Guide for Investment Companies and began accreting discount or amortizing premium on fixed income securities on a |
| | | scientific basis and including paydown gains and losses in interest income.The effect of these changes for the period |
| | | ended December 31, 2001 was to decrease net investment income per share by $.05, increase net realized and |
| | | unrealized gain (loss) on investments per share by $.05 and decrease the ratio of net investment income to average net |
| | | assets from 11.04% to 10.35%. Per share data and ratios/supplemental data for periods prior to January 1, 2001 |
| | | have not been restated to reflect these changes in presentation. |
| c | | Based on average shares outstanding at each month end. |
| d | | Not annualized. |
| e | | Annualized. |
| See notes to financial statements. |
NOTES TO FINANCIAL STATEMENTS (Unaudited)
NOTE 1—Significant Accounting Policies:
Dreyfus Variable Investment Fund (the "fund") is registered under the Investment Company Act of 1940 as amended (the "Act"), as an open-end management investment company, operating as a series company currently offering twelve series, including the Limited Term High Yield Portfolio (the "portfolio").The portfolio is only offered to separate accounts established by insurance companies to fund variable annuity contracts and variable life insurance policies.The portfolio is a diversified series.The portfolio's investment objective is to maximize total return, consisting of capital appreciation and current income.The Dreyfus Corporation (the "Manager" or "Dreyfus") serves as the portfolio's investment adviser.The Manager is a wholly-owned subsidiary of Mellon Financial Corporation ("Mellon Financial").
Dreyfus Service Corporation (the "Distributor"), a wholly-owned subsidiary of the Manager, is the distributor of the portfolio's shares, which are sold without a sales charge. The portfolio is authorized to issue an unlimited number of $.001 par value shares of Beneficial Interest in the following classes of shares: Initial and Service. Each class of shares has identical rights and privileges, except with respect to the distribution plan and the expenses borne by each class and certain voting rights. Income, expenses (other than expenses attributable to a specific class), and realized and unrealized gains or losses on investments are allocated to each class of shares based on its relative net assets.
The fund accounts separately for the assets, liabilities and operations of each series. Expenses directly attributable to each series are charged to that series' operations; expenses which are applicable to all series are allocated among them on a pro rata basis.
The portfolio's financial statements are prepared in accordance with U.S. generally accepted accounting principles, which may require the use of management estimates and assumptions.Actual results could differ from those estimates.
The fund enters into contracts that contain a variety of indemnifica-tions.The portfolio's maximum exposure under these arrangements is unknown. The portfolio does not anticipate recognizing any loss related to these arrangements.
(a) Portfolio valuation: Investments in securities (excluding short-term investments other than financial futures, options, swap transactions and forward currency exchange contracts) are valued each business day by an independent pricing service (the "Service") approved by the Board of Trustees. Investments for which quoted bid prices are readily available and are representative of the bid side of the market in the judgment of the Service are valued at the mean between the quoted bid prices (as obtained by the Service from dealers in such securities) and asked prices (as calculated by the Service based upon its evaluation of the market for such securities). Other investments (which constitute a majority of the portfolio securities) are valued as determined by the Service, based on methods which include consideration of: yields or prices of securities of comparable quality, coupon, maturity and type; indications as to values from dealers; and general market conditions. Securities for which there are no such valuations are valued at fair value as determined in good faith under the direction of the Board of Trustees. Restricted securities, as well as securities or other assets for which recent market quotations are not readily available, that are not valued by a pricing service approved by the Board of Trustees, or are determined by the portfolio not to reflect accurately fair value (such as when an event occurs after the close of the exchange on which the security is principally traded and that is determined by the portfolio to have changed the value of the security), are valued at fair value as determined in good faith under the direction of the Board of Trustees.The factors that may be considered when fair valuing a security include fundamental analytical data, the nature and duration of restrictions on disposition, an evaluation of the forces that influence the market in which the securities are purchased
NOTES TO FINANCIAL STATEMENTS (Unaudited) (continued)
and sold and public trading in similar securities of the issuer or comparable issuers. Short-term investments, excluding U.S.Treasury Bills, are carried at amortized cost, which approximates value. Investments in registered investment companies are valued at their net asset value.Financial futures and options, which are traded on an exchange, are valued at the last sales price on the securities exchange on which such securities are primarily traded or at the last sales price on the national securities market on each business day. Options traded over-the-counter are priced at the mean between the bid and asked price. Swap transactions are valued daily based upon future cash flows and other factors, such as interest rates and underlying securities. Investments denominated in foreign currencies are translated to U.S. dollars at the prevailing rates of exchange. Forward currency exchange contracts are valued at the forward rate.
(b) Foreign currency transactions: The portfolio does not isolate that portion of the results of operations resulting from changes in foreign exchange rates on investments from the fluctuations arising from changes in the market prices of securities held. Such fluctuations are included with the net realized and unrealized gain or loss on investments.
Net realized foreign exchange gains or losses arise from sales and maturities of short-term securities, sales of foreign currencies, currency gains or losses realized on securities transactions and the difference between the amounts of dividends, interest and foreign withholding taxes recorded on the fund's books and the U.S. dollar equivalent of the amounts actually received or paid. Net unrealized foreign exchange gains and losses arise from changes in the value of assets and liabilities, other than investments in securities, resulting from changes in exchange rates. Such gains and losses are included with net realized and unrealized gain or loss on investments.
(c) Securities transactions and investment income: Securities transactions are recorded on a trade date basis. Realized gain and loss from securities transactions are recorded on the identified cost basis.
Dividend income is recognized on the ex-dividend date and interest income, including, where applicable, accretion of discount and amortization of premium on investments, is recognized on the accrual basis.
The portfolio has an arrangement with the custodian bank whereby the portfolio receives earnings credits from the custodian when positive cash balances are maintained, which are used to offset custody fees. For financial reporting purposes, the portfolio includes net earnings credits, if any, as an expense offset in the Statement of Operations.
Pursuant to a securities lending agreement with Mellon Bank, N.A., an affiliate of the Manager, the portfolio may lend securities to qualified institutions.At origination, all loans are secured by collateral of at least 102% of the value of U.S. securities loaned and 105% of the value of foreign securities loaned. Collateral equivalent to at least 100% of the market value of securities on loan will be maintained at all times. Cash collateral is invested in certain money market mutual funds managed by the Manager. The portfolio will be entitled to receive all income on securities loaned, in addition to income earned as a result of the lending transaction. Although each security loaned is fully collateralized, the portfolio would bear the risk of delay in recovery of, or loss of rights in, the securities loaned should a borrower fail to return the securities in a timely manner.
(d) Affiliated issuers: Investments in other investment companies advised by the Manager are defined as "affiliated" in the Act.
(e) Dividends to shareholders: It is the policy of the portfolio to declare and pay dividends quarterly from investment income-net. Dividends from net realized capital gain, if any, are normally declared and paid annually, but the portfolio may make distributions on a more frequent basis to comply with the distribution requirements of the Internal Revenue Code of 1986, as amended (the "Code"). To the extent that net realized capital gain can be offset by capital loss carryovers, it is the policy of the portfolio not to distribute such gain.
NOTES TO FINANCIAL STATEMENTS (Unaudited) (continued)
Income and capital gain distributions are determined in accordance with income tax regulations, which may differ from U.S. generally accepted accounting principles.
(f) Federal income taxes: It is the policy of the portfolio to continue to qualify as a regulated investment company, if such qualification is in the best interests of its shareholders, by complying with the applicable provisions of the Code, and to make distributions of taxable income sufficient to relieve it from substantially all federal income and excise taxes.
The portfolio has an unused capital loss carryover of $34,661,582 available for federal income tax purposes to be applied against future net securities profits, if any, realized subsequent to December 31, 2004. If not applied, $4,814,711 of the carryover expires in fiscal 2007, $4,480,534 expires in fiscal 2008, $10,613,045 expires in fiscal 2009, $10,693,853 expires in fiscal 2010 and $4,059,439 expires in fiscal 2011.
The tax character of distributions paid to shareholders during the fiscal year ended December 31, 2004 was as follows: ordinary income $2,399,819. The tax character of current year distributions will be determined at the end of the current fiscal year.
NOTE 2—Bank Lines of Credit:
|
The portfolio may borrow up to $10 million for leveraging purposes under a short-term unsecured line of credit and participates with other Dreyfus-managed funds in a $100 million unsecured line of credit primarily to be utilized for temporary or emergency purposes, including the financing of redemptions. Interest is charged to the portfolio based on prevailing market rates in effect at the time of borrowings. During the period ended June 30, 2005, the portfolio did not borrow under either line of credit.
NOTE 3—Investment Advisory Fee and Other Transactions With Affiliates:
(a) Pursuant to an Investment Advisory Agreement ("Agreement") with Dreyfus, the investment advisory fee is computed at the annual rate of .65 of 1% of the value of the portfolio's average daily net assets and is payable monthly.
The Manager has agreed, from January 1, 2005 to December 31, 2005, to waive receipt of its fees and/or assume the expenses of the portfolio so that the expenses of neither class, exclusive of taxes, brokerage commissions, extraordinary expenses, interest expenses and commitment fees on borrowings exceed .90 of 1% of the value of the average daily net assets of their class. During the period ended June 30, 2005, the Manager waived receipt of fees of $9,997, pursuant to the undertaking.
(b) Under the Distribution Plan (the "Plan") adopted pursuant to Rule 12b-1 under the Act, Service shares pay the Distributor for distributing their shares, for servicing and/or maintaining Service shares shareholder accounts and for advertising and marketing for Service shares.The Plan provides for payments to be made at an annual rate of .25 of 1% of the value of the Service shares' average daily net assets.The Distributor may make payments to Participating Insurance Companies and to brokers and dealers acting as principal underwriter for their variable insurance products.The fees payable under the Plan are payable without regard to actual expenses incurred. During the period ended June 30, 2005, Service shares were charged $11,506 pursuant to the Plan.
The portfolio compensates Dreyfus Transfer, Inc., a wholly-owned subsidiary of the Manager, under a transfer agency agreement for providing personnel and facilities to perform transfer agency services for
NOTES TO FINANCIAL STATEMENTS (Unaudited) (continued)
the portfolio. During the period ended June 30, 2005, the portfolio was charged $38 pursuant to the transfer agency agreement.
The portfolio compensates Mellon Bank, N.A., an affiliate of the Manager, under a custody agreement to provide custodial services for the portfolio. During the period ended June 30, 2005, the portfolio was charged $1,644 pursuant to the custody agreement.
During the period ended June 30, 2005, the portfolio was charged $1,998 for services performed by the Chief Compliance Officer.
The components of Due to The Dreyfus Corporation and affiliates in the Statement of Assets and Liabilities consist of: management fees $16,534, chief compliance officer fees $1,998, Rule 12b-1 distribution plan fees $1,858, custodian fees $1,187 and transfer agency per account fees $814, which are offset against an expense reimbursement currently in effect in the amount of $2,722.
(c) Each Board member also serves as a Board member of other funds within the Dreyfus complex. Annual retainer fees and attendance fees are allocated to each fund based on net assets.
(d) Pursuant to an exemptive order from the Securities and Exchange Commission, the portfolio may invest its available cash balances in affiliated money market mutual funds. Management fees of the underlying money market mutual funds have been waived by the Manager.
NOTE 4—Securities Transactions:
|
The aggregate amount of purchases and sales of investment securities, excluding short-term securities, forward currency exchange contracts, and swap transactions, during the period ended June 30, 2005, amounted to $12,004,975 and $10,064,110, respectively.
The portfolio enters into forward currency exchange contracts in order to hedge its exposure to changes in foreign currency exchange rates on its foreign portfolio holdings and to settle foreign currency transactions.
When executing forward currency exchange contracts, the portfolio is obligated to buy or sell a foreign currency at a specified rate on a certain date in the future. With respect to sales of forward currency exchange contracts, the portfolio would incur a loss if the value of the contract increases between the date the forward contract is opened and the date the forward contract is closed.The portfolio realizes a gain if the value of the contract decreases between those dates.With respect to purchases of forward currency exchange contracts, the portfolio would incur a loss if the value of the contract decreases between the date the forward contract is opened and the date the forward contract is closed. The portfolio realizes a gain if the value of the contract increases between those dates.The portfolio is also exposed to credit risk associated with counterparty nonperformance on these forward currency exchange contracts which is typically limited to the unrealized gain on each open contract.The following summarizes open forward currency exchange contracts at June 30, 2005.
| | | Foreign | | | | | | |
| Forward Currency | | Currency | | | | | | Unrealized |
| Sales Contracts | | Amounts | | Proceeds ($) | | Value ($) | | Appreciation ($) |
| |
| |
| |
| |
|
| Sales: | | | | | | | | |
| Euro | | | | | | | | |
| expiring 9/21/2005 | | 80,000 | | 97,482 | | 97,080 | | 402 |
The portfolio may enter into swap agreements to exchange the interest rate on, or return generated by, one nominal instrument for the return generated by another nominal instrument.
The portfolio has adopted the method of accounting for interim payments on swap contracts in accordance with Financial Accounting Standards Board Statement No. 133. The portfolio accrues for the interim payments on swap contracts on a daily basis, with the net amount recorded within unrealized appreciation (depreciation) of swap contracts on the Statement of Assets and Liabilities. Once the interim payments are settled in cash, the net
NOTES TO FINANCIAL STATEMENTS (Unaudited) (continued)
amount is recorded as realized gain (loss) on swaps, in addition to realized gain (loss) recorded upon the termination of swap contracts, in the Statement of Operations.
Credit default swaps involve commitments to pay a fixed interest rate in exchange for payment if a credit event affecting a third party (the referenced company) occurs. Credit events may include a failure to pay interest or principal, bankruptcy, or restructuring. For those credit default swaps in which the fund is receiving a fixed rate, the fund is providing credits protection on the underlying instrument.The maximum payouts for these contracts are limited to the notional amount of each swap.The following summarizes credit default swaps entered into by the portfolio at June 30, 2005:
| | | | | Unrealized |
| Notional Amount ($) | | Description | | (Depreciation) ($) |
| |
| |
|
| 150,000 | | Agreement with JP Morgan terminating | | (1,042) |
| June 20, 2010 to pay a fixed rate of 1.95% |
| and receive the notional amount as a result |
| | | of interest payment default totaling | | |
| | | $1,000,000 or principal payment default | | |
| | | of $10,000,000 on Owens Brockaway, | | |
| | | 8.25%, 5/15/2013 | | |
| 150,000 | | Agreement with JP Morgan terminating | | (1,104) |
| June 20, 2010 to receive a fixed rate of 2.6% |
| | | and pay the notional amount as a result | | |
| | | of interest payment default totaling | | |
| | | $1,000,000 or principal payment | | |
| | | default of $10,000,000 on | | |
| | | Owens Illinois, 7.5%, 5/15/2010 | | |
| Total | | | | (2,146) |
Risks may arise upon entering into these agreements from the potential inability of the counterparties to meet the terms of the agreement and are generally limited to the amount of net payments to be received, if any, at the date of default.
At June 30, 2005, accumulated net unrealized appreciation on investments was $600,382, consisting of $1,391,659 gross unrealized appreciation and $791,277 gross unrealized depreciation.
At June 30, 2005, the cost of investments for federal income tax purposes was substantially the same as the cost for financial reporting purposes (see the Statement of Investments).
In early 2004, two purported class and derivative actions were filed against Mellon Financial, Mellon Bank, N.A., Dreyfus, Founders Asset Management LLC, and certain directors of the Dreyfus Funds and the Dreyfus Founders Funds (together, the "Funds") in the United States District Court for the Western District of Pennsylvania. In September 2004, plaintiffs served a Consolidated Amended Complaint (the "Amended Complaint") on behalf of a purported class of all persons who acquired interests in any of the Funds between January 30, 1999 and November 17, 2003, and derivatively on behalf of the Funds.The Amended Complaint in the newly styled In re Dreyfus Mutual Funds Fee Litigation also named the Distributor, Premier Mutual Fund Services, Inc. and two additional Fund directors as defendants and alleges violations of the Investment Company Act of 1940, the Investment Advisers Act of 1940, the Pennsylvania Unfair Trade Practices and Consumer Protection Law and common-law claims. Plaintiffs seek to recover allegedly improper and excessive Rule 12b-1 and advisory fees allegedly charged to the Funds for marketing and distribution services. More specifically, plaintiffs claim, among other things, that 12b-1 fees and directed brokerage were improperly used to pay brokers to recommend the Funds over other funds, and that such payments were not disclosed to investors. In addition, plaintiffs assert that economies of scale and soft-dollar benefits were not passed on to the Funds. Plaintiffs further allege that 12b-1 fees were improperly charged to certain of the Funds that were closed to new investors.The Amended Complaint seeks compensatory and punitive damages, rescission of the advisory contracts, and an accounting and restitution of any unlawful fees, as well as an award of attorneys' fees and litigation
NOTES TO FINANCIAL STATEMENTS (Unaudited) (continued)
expenses. As noted, some of the claims in this litigation are asserted derivatively on behalf of the Funds that have been named as nominal defendants. With respect to such derivative claims, no relief is sought against the Funds. Dreyfus believes the allegations to be totally without merit and intends to defend the action vigorously. In November 2004, all named defendants moved to dismiss the Amended Complaint in whole or substantial part. Briefing was completed in May 2005.
Additional lawsuits arising out of these circumstances and presenting similar allegations and requests for relief may be filed against the defendants in the future. Neither Dreyfus nor the Funds believe that any of the pending actions will have a material adverse effect on the Funds or Dreyfus' ability to perform its contract with the Funds.
INFORMATION ABOUT THE REVIEW
AND APPROVAL OF THE PORTFOLIO'S
INVESTMENT ADVISORY AGREEMENT (Unaudited)
|
At separate meetings of the Board of Trustees for the Fund held on June 8-9, 200, the Board considered the re-approval, through its annual renewal date of July 31, 2006, of the Investment Advisory Agreement with the Manager for the portfolio, pursuant to which the Manager provides the portfolio with investment advisory and administrative ser-vices.The Board members who are not "interested persons" (as defined in the Act (the "Independent Trustees")) of the portfolio were assisted in their review by independent legal counsel and met with counsel in executive session separate from representatives of the Manager.
Analysis of Nature, Extent and Quality of Services Provided to the Portfolio. The Board members received a presentation from representatives of the Manager regarding services provided to the portfolio and other funds in the Dreyfus fund complex, and discussed the nature, extent and quality of the services provided to the portfolio pursuant to its Investment Advisory Agreement. The Manager's representatives reviewed the portfolio's distribution of accounts and the relationships the Manager has with various intermediaries and the different needs of each.The Board noted that the portfolio's shares were offered only to separate accounts established by insurance companies to fund variable annuity contracts and variable life insurance policies. The Manager's representatives noted the diversity of distribution among the funds in the Dreyfus complex, and the Manager's corresponding need for broad, deep, and diverse resources to be able to provide ongoing shareholder services to each distribution channel, including that of the portfolio. The Board also reviewed the number of shareholder accounts in the portfolio, as well as the portfolio's asset size.
The Board members also considered the Manager's research and portfolio management capabilities and that the Manager also provides oversight of day-to-day Fund operations, including fund accounting and administration and assistance in meeting legal and regulatory requirements. The Board members also considered the Manager's extensive administrative, accounting and compliance infrastructure.
| INFORMATION ABOUT THE REVIEW AND APPROVAL OF THE PORTFOLIO'S |
| INVESTMENT ADVISORY AGREEMENT (Unaudited) (continued) |
Comparative Analysis of the Portfolio's Performance, Investment Advisory Fee and Expense Ratio. The Board members reviewed the portfolio's performance and expense ratios and placed significant emphasis on comparisons to a group of comparable funds and Lipper category averages, as applicable.The Board reviewed the portfolio's performance, investment advisory fee, and total expense ratios within these comparison groups and against the portfolio's Lipper category averages, as applicable.The groups of comparable funds were previously approved by the Board for this purpose, and were prepared using a Board-approved selection methodology that was based, in part, on selecting non-affiliated funds reported in the same Lipper category as the port-folio.The Board members discussed the results of the comparisons and noted that the portfolio's income yield performance during the review periods was above the averages for its comparison groups and Lipper category. The Board members noted that the portfolio's total return performance was below the averages of its comparison groups and Lipper category for the 3-year and 5-year periods, but that the portfolio's more recent 1-year total return performance was above the averages of its comparison groups and Lipper category, and its recent 3-month and 1-month Initial share total return performance was consistent with this improved performance.The Board members noted that the portfolio's management team was changed in January 2005. The Board members also discussed the portfolio's expense ratio for each class of shares, noting it is higher than the average of its respective comparison group, but that several funds have higher expense ratios than the portfolio.They reviewed the range of management fees in the comparison group, noting that the portfolio's investment advisory fee generally ranked in the top half (i.e., lower than most) or in the middle of its comparison groups, depending on the group. The Board members noted that the Manager has a current undertaking to waive or reimburse certain fees and expenses to limit the portfolio's expense ratio, which lowered the portfolio's expense ratio for its Service shares.
Representatives of the Manager reviewed with the Board members the fees paid to the Manager or its affiliates by mutual funds managed by the Manager or its affiliates with similar investment objectives, poli-
cies and strategies as the portfolio (the "Similar Funds") and by separate accounts or mutual funds for which the Manager or its affiliates serve as sub-investment adviser with similar investment objectives, policies and strategies as the portfolio (the "Separate Accounts" and, collectively with the Similar Funds, the "Similar Accounts") and explained the nature of each Similar Account and the differences, from the Manager's perspective, in management of such Similar Accounts as compared to managing and providing other services to the portfolio. The Similar Funds' were those mutual funds reported as "high current yield" funds by Lipper.The Manager's representatives also reviewed the costs associated with distribution through intermediaries. The Board analyzed differences in fees paid to the Manager and discussed the relationship of the advisory fees paid in light of the Manager's performance and the services provided.The Board members considered the relevance of the fee information provided for the Similar Accounts managed by the Manager or its affiliates to evaluate the appropriateness and reasonableness of the portfolio's advisory fees. The Board acknowledged that differences in fees paid by the Similar Accounts seemed to be consistent with the services provided.
Analysis of Profitability and Economies of Scale. The Manager's representatives reviewed the dollar amount of expenses allocated and profit received by the Manager and the method used to determine such expenses and profit.The Board received and considered information prepared by an independent consulting firm regarding Dreyfus' approach to allocating costs to, and determining the profitability of, individual funds and the entire Dreyfus mutual fund complex. The consulting firm also analyzed where any economies of scale might emerge as assets grow. The Board members evaluated the analysis in light of the relevant circumstances for the portfolio, including the decline in fund assets and the extent to which economies of scale would be realized as the portfolio grows and whether fee levels reflect these economies of scale for the benefit of portfolio investors. The Board members also considered potential benefits to the Manager from acting as investment adviser and noted that there were no soft dollar arrangements with respect to trading the portfolio's portfolio.
| INFORMATION ABOUT THE REVIEW AND APPROVAL OF THE PORTFOLIO'S |
| INVESTMENT ADVISORY AGREEMENT (Unaudited) (continuedS) |
It was noted that the Board members should consider the Manager's profitability with respect to the portfolio as part of their evaluation of whether the fee under the Investment Advisory Agreement bears a reasonable relationship to the mix of services provided by the Manager, including the nature, extent and quality of such services and that a discussion of economies of scale are predicated on increasing assets and that, if a fund's assets had been decreasing, the possibility that the Manager may have realized any economies of scale would be less. It also was noted that the profitability percentage for managing the portfolio was within ranges determined by appropriate court cases to be reasonable given the services rendered and, given the portfolio's overall performance and generally superior service levels provided.The current fee waiver and expense reimbursement arrangement, which reduced the expense ratio for the portfolio's Service shares, and its effect on the profitability of the Manager, also was noted.
At the conclusion of these discussions, each of the Independent Trustees expressed the opinion that he or she had been furnished with sufficient information to make an informed business decision with respect to continuation of the portfolio's Investment Advisory Agreement, with respect to the portfolio. Based on their discussions and considerations as described above, the Board made the following conclusions and determinations.
- The Board concluded that the nature, extent and quality of the ser- vices provided by the Manager are adequate and appropriate.
- The Board generally was satisfied with the portfolio's overall income performance and the recent improvement in the 1-year total return performance and the more recent Initial shares total return perfor- mance, as well as the recent change in the portfolio's management team in January 2005.
- The Board concluded that the fee paid by the portfolio to the Manager was reasonable in light of comparative performance and expense and advisory fee information, including the Manager's undertaking to waive or reimburse certain fees and expenses, which reduced the expense ratio of the Service shares, costs of the services provided and profits to be realized and benefits derived or to be derived by the Manager from its relationship with the portfolio.
- The Board determined that, to the extent that material economies of scale had not been shared with the portfolio, the Board would seek to do so.
The Board members considered these conclusions and determinations, along with information received on a routine and regular basis throughout the year, and, without any one factor being dispositive, the Board determined that approval of the portfolio's Investment Advisory Agreement, with respect to the portfolio, was in the best interests of the portfolio and its shareholders.
NOTES
| For More | | Information |
| |
|
| |
| |
| |
| Dreyfus Variable | | Transfer Agent & |
| |
| Investment Fund, | | Dividend Disbursing Agent |
| |
| Limited Term | | |
| | | Dreyfus Transfer, Inc. |
| High Yield Portfolio | | |
| | | 200 Park Avenue |
| 200 Park Avenue | | |
| | | New York, NY 10166 |
| New York, NY 10166 | | |
| |
| | | Distributor |
| Investment Adviser | | |
| |
| | | Dreyfus Service Corporation |
| The Dreyfus Corporation | | |
| | | 200 Park Avenue |
| 200 Park Avenue | | |
| | | New York, NY 10166 |
| New York, NY 10166 | | |
| |
| |
| Custodian | | |
| |
| |
| Mellon Bank, N.A. | | |
| |
| One Mellon Bank Center | | |
| |
| Pittsburgh, PA 15258 | | |
Telephone 1-800-554-4611 or 516-338-3300
Mail The Dreyfus Family of Funds, 144 Glenn Curtiss Boulevard, Uniondale, NY 11556-0144 Attn: Institutional Servicing
The portfolio files its complete schedule of portfolio holdings with the Securities and Exchange Commission ("SEC") for the first and third quarters of each fiscal year on Form N-Q. The portfolio's Forms N-Q are available on the SEC's website at http://www.sec.gov and may be reviewed and copied at the SEC's Public Reference Room in Washington, DC. Information on the operation of the Public Reference Room may be obtained by calling 1-800-SEC-0330.
A description of the policies and procedures that the portfolio uses to determine how to vote proxies relating to portfolio securities, and information regarding how the portfolio voted these proxies for the 12-month period ended June 30, 2005, is available at http://www.dreyfus.com and on the SEC's website at http://www.sec.gov. The description of the policies and procedures is also available without charge, upon request, by calling 1-800-645-6561.
© 2005 Dreyfus Service Corporation

| Dreyfus Variable |
| Investment Fund, |
| Money Market |
| Portfolio |

The views expressed in this report reflect those of the portfolio manager only through the end of the period covered and do not necessarily represent the views of Dreyfus or any other person in the Dreyfus organization.Any such views are subject to change at any time based upon market or other conditions and Dreyfus disclaims any responsibility to update such views. These views may not be relied on as investment advice and, because investment decisions for a Dreyfus portfolio are based on numerous factors, may not be relied on as an indication of trading intent on behalf of any Dreyfus portfolio.
Not FDIC-Insured • Not Bank-Guaranteed • May Lose Value
| | | Contents |
| |
| | | T H E P O R T F O L I O |
| |
|
| 2 | | Letter from the Chairman |
| 3 | | Discussion of Performance |
| 6 | | Understanding Your Portfolio's Expenses |
| 6 | | Comparing Your Portfolio's Expenses |
| | | With Those of Other Funds |
| 7 | | Statement of Investments |
| 10 | | Statement of Assets and Liabilities |
| 11 | | Statement of Operations |
| 12 | | Statement of Changes in Net Assets |
| 13 | | Financial Highlights |
| 14 | | Notes to Financial Statements |
| 19 | | Information About the Review |
| and Approval of the Portfolio's |
| Investment Advisory Agreement |
| | | F O R M O R E I N F O R M AT I O N |
| |
|
| | | Back Cover |
| Dreyfus Variable Investment Fund, |
| Money Market Portfolio |
The Portfolio

LETTER FROM THE CHAIRMAN
We are pleased to present this semiannual report for Dreyfus Variable Investment Fund, Money Market Portfolio, covering the six-month period from January 1, 2005, through June 30, 2005. Inside, you'll find valuable information about how the portfolio was managed during the reporting period, including a discussion with the portfolio manager, Bernard W. Kiernan, Jr.
The Federal Reserve Board continued to raise short-term interest rates steadily and gradually over the first half of 2005 in its ongoing effort to move away from its previously accommodative monetary policy. As the federal funds rate climbed, so have yields of money market instruments, providing a much-needed boost to money market fund yields, which were at historically low levels this same time last year.
Despite recent evidence that the U.S. economy might be slowing, most analysts currently believe that the Fed is likely to continue to raise short-term interest rates until they reach a level that neither stimulates nor restricts economic activity.This view is consistent with that of our economists, who are calling for the U.S. economy to continue to grow over the foreseeable future without significant new inflationary pressures. As always, we encourage you to discuss these and other matters with your financial advisor.
Thank you for your continued confidence and support.


DISCUSSION OF PERFORMANCE
Bernard W. Kiernan, Jr., Portfolio Manager
How did Dreyfus Variable Investment Fund, Money Market Portfolio perform during the period?
During the six-month period ended June 30, 2005, the portfolio produced an annualized yield of 2.08% .Taking into account the effects of compounding, the portfolio also provided an annualized effective yield of 2.10% for the same period.1
What is the portfolio's investment approach?
The portfolio seeks as high a level of current income as is consistent with the preservation of capital and the maintenance of liquidity. To pursue this goal, the portfolio invests in a diversified selection of high-quality, short-term debt securities, including securities issued or guaranteed by the U.S. government or its agencies or instrumentalities, certificates of deposit, securities issued by domestic or foreign banks, repurchase agreements, asset-backed securities, domestic and dollar-denominated foreign commercial paper and dollar-denominated obligations issued or guaranteed by foreign governments.
Normally, the portfolio invests at least 25% of its net assets in domestic or dollar-denominated foreign bank obligations.
What other factors influenced the portfolio's performance?
The portfolio's performance was influenced primarily by rising short-term interest rates in a recovering economy.The Federal Reserve Board (the "Fed") raised interest rates at each of four meetings of its Federal Open Market Committee ("FOMC") during the reporting period, continuing its gradual move away from the aggressively accommodative monetary policy that had prevailed over the past several years.
In early February, the Fed increased the overnight federal funds rate from 2.25% to 2.5% . Although the move was widely expected, many analysts at the time believed that inflationary pressures remained low in a moderately growing economy. By the time of the next FOMC
The Portfolio 3
DISCUSSION OF PERFORMANCE (continued)
|
meeting in late March, however, surging energy prices and healthy employment gains had rekindled investors' inflation concerns. In its announcement of the March rate increase to 2.75%, the Fed adopted a more hawkish tone, noting,"Pressures on inflation have picked up in recent months and pricing power is more evident." It was later estimated that the U.S. economy expanded at a 3.5% annualized rate during the first quarter of 2005.
Even as the Fed's inflation concerns appeared to intensify, weaker-than-expected data in April suggested that the U.S. economy might be hitting another soft patch. However, it later was estimated that the U.S. labor market added more jobs than expected in April, and employment statistics for February and March were revised upward. While these data provided some encouragement that high energy prices had not hindered the economic expansion, difficulties encountered by the airline and automotive industries were regarded as potential threats to consumer and business confidence and spending.
At its FOMC meeting in early May, the Fed implemented its eighth consecutive rate hike, driving the federal funds rate to 3%. However, evidence of slower economic growth in global markets weighed on investor sentiment in May. Signs that China's torrid growth rate may be moderating and the impending rejection of the European Union's proposed constitution contributed to worries of weakness in the U.S. economy's manufacturing sector. As a result, the 10-year U.S. Treasury bond rallied strongly, ending the reporting period with a yield below 4%.
Economic expectations appeared to improve in June, when the U.S. labor market posted another relatively impressive performance. On the other hand, oil prices broke the $60/barrel barrier during the month, and investors continued to worry that higher energy and borrowing costs might hinder economic activity. In fact, some analysts believed that the Fed was near the end of its credit tightening cycle. However, when the Fed hiked the federal funds rate to 3.25% on June 30, the reporting period's last day, it left the language in its accompanying statement unchanged, suggesting that additional rate increases remained in store.
In this changing environment, many money market investors focused primarily on securities with maturities of six months or less in an attempt to maintain liquidity and keep funds available for higher-yielding instruments as they became available. As a result, demand for shorter-term money market instruments was robust, while demand for instruments with one-year maturities was relatively low. This caused yield differences between overnight instruments and one-year securities to steepen significantly.
As interest rates rose, we maintained a relatively defensive investment posture by setting the portfolio's weighted average maturity in a range we considered shorter than industry averages. However, we occasionally shortened or extended the portfolio's weighted average maturity to reflect prevailing market conditions and the proximity of upcoming FOMC meetings.
What is the portfolio's current strategy?
While the U.S. economy recently has sent mixed signals regarding the sustainability of its current growth rate, it appears likely that the Fed will continue to raise short-term interest rates during the second half of the year. Accordingly, we have continued to maintain the portfolio's relatively short weighted average maturity in an attempt to foster liquidity and capture potential investment opportunities if interest rates rise.
| | | The portfolio is only available as a funding vehicle under variable life insurance policies or variable |
| | | annuity contracts issued by insurance companies. Individuals may not purchase shares of the |
| | | portfolio directly. A variable annuity is an insurance contract issued by an insurance company that |
| | | enables investors to accumulate assets on a tax-deferred basis for retirement or other long-term |
| | | goals.The investment objective and policies of Dreyfus Variable Investment Fund, Money Market |
| | | Portfolio made available through insurance products may be similar to other funds/portfolios |
| | | managed or advised by Dreyfus. However, the investment results of the portfolio may be higher or |
| | | lower than, and may not be comparable to, those of any other Dreyfus fund/portfolio. |
| | | An investment in the portfolio is not insured or guaranteed by the FDIC or any other |
| | | government agency. Although the portfolio seeks to preserve the value of your investment at $1.00 |
| | | per share, it is possible to lose money by investing in the portfolio. |
| 1 | | Annualized effective yield is based upon dividends declared daily and reinvested monthly. Past |
| | | performance is no guarantee of future results.Yields fluctuate.The portfolio's performance does not |
| | | reflect the deduction of additional charges and expenses imposed in connection with investing in |
| | | variable insurance contracts, which will reduce returns. |
UNDERSTANDING YOUR
PORTFOLIO'S EXPENSES (Unaudited)
|
As a mutual fund investor, you pay ongoing expenses, such as management fees and other expenses. Using the information below, you can estimate how these expenses affect your investment and compare them with the expenses of other funds.You also may pay one-time transaction expenses, including sales charges (loads) and redemption fees, which are not shown in this section and would have resulted in higher total expenses. For more information, see your portfolio's prospectus or talk to your financial adviser.
Review your portfolio's expenses
|
The table below shows the expenses you would have paid on a $1,000 investment in Dreyfus Variable Investment Fund, Money Market Portfolio from January 1, 2005 to June 30, 2005. It also shows how much a $1,000 investment would be worth at the close of the period, assuming actual returns and expenses.
Expenses and Value of a $1,000 Investment assuming actual returns for the six months ended June 30, 2005
| Expenses paid per $1,000 † | | $ 2.99 |
| Ending value (after expenses) | | $1,010.40 |
COMPARING YOUR PORTFOLIO'S EXPENSES WITH THOSE OF OTHER FUNDS (Unaudited)
Using the SEC's method to compare expenses
The Securities and Exchange Commission (SEC) has established guidelines to help investors assess fund expenses. Per these guidelines, the table below shows your portfolio's expenses based on a $1,000 investment, assuming a hypothetical 5% annualized return. You can use this information to compare the ongoing expenses (but not transaction expenses or total cost) of investing in the portfolio with those of other funds. All mutual fund shareholder reports will provide this information to help you make this comparison. Please note that you cannot use this information to estimate your actual ending account balance and expenses paid during the period.
Expenses and Value of a $1,000 Investment assuming a hypothetical 5% annualized return for the six months ended June 30, 2005
| Expenses paid per $1,000 † | | $ 3.01 |
| Ending value (after expenses) | | $1,021.82 |
† Expenses are equal to the portfolio's annualized expense ratio of .60%, multiplied by the average account value over the period, multiplied by 181/365 (to reflect the one-half year period).
STATEMENT OF INVESTMENTS
June 30, 2005 (Unaudited)
|
| | | Principal | | |
| Negotiable Bank Certificates of Deposit—9.8% | | Amount ($) | | Value ($) |
| |
| |
|
| American Express Bank FSB (Yankee) | | | | |
| 3.30%, 9/6/2005 | | 4,000,000 | | 4,000,000 |
| Citibank N.A. | | | | |
| 3.14%, 8/4/2005 | | 4,000,000 | | 4,000,000 |
| World Savings Bank | | | | |
| 3.10%, 7/11/2005 | | 4,000,000 | | 3,999,989 |
| Total Negotiable Bank Certificates of Deposit | | | | |
| (cost $11,999,989) | | | | 11,999,989 |
| |
| |
|
| |
| Commercial Paper—77.6% | | | | |
| |
| |
|
| Amstel Funding Corp. | | | | |
| 3.45%, 9/30/2005 | | 4,000,000 a | | 3,965,420 |
| Atlantis One Funding Corp. | | | | |
| 3.13%, 7/19/2005 | | 4,021,000 a | | 4,014,737 |
| Barclays US Funding Corp. | | | | |
| 3.11%, 7/11/2005 | | 4,000,000 | | 3,996,561 |
| Beta Finance Inc. | | | | |
| 3.27%, 9/6/2005 | | 4,000,000 a | | 3,975,880 |
| CRC Funding LLC | | | | |
| 3.13%, 7/20/2005 | | 4,000,000 a | | 3,993,434 |
| CSFB (USA) Inc. | | | | |
| 3.10%, 7/13/2005 | | 4,000,000 | | 3,995,887 |
| Cafco LLC | | | | |
| 3.10%, 7/8/2005 | | 4,000,000 a | | 3,997,604 |
| Charta LLC | | | | |
| 3.11%, 7/12/2005 | | 4,000,000 a | | 3,996,223 |
| Crown Point Capital LLC | | | | |
| 3.30%, 9/7/2005 | | 4,000,000 a | | 3,975,293 |
| Deutsche Financial LLC | | | | |
| 3.40%, 7/1/2005 | | 4,000,000 | | 4,000,000 |
| Dexia Delaware LLP | | | | |
| 3.30%, 9/6/2005 | | 4,000,000 | | 3,975,657 |
| Govco Inc. | | | | |
| 3.30%, 9/7/2005 | | 4,000,000 a | | 3,975,293 |
| Grampian Funding LLC | | | | |
| 3.12%, 7/28/2005 | | 4,000,000 a | | 3,990,730 |
| HSBC Bank USA | | | | |
| 3.30%, 9/6/2005 | | 4,000,000 | | 3,975,657 |
STATEMENT OF INVESTMENTS (Unaudited) (continued)
| | | Principal | | |
| Commercial Paper (continued) | | Amount ($) | | Value ($) |
| |
| |
|
| K2 USA LLC | | | | |
| 3.27%, 9/6/2005 | | 4,000,000 a | | 3,975,880 |
| Links Finance Corp. | | | | |
| 3.44%, 9/29/2005 | | 4,000,000 a | | 3,965,900 |
| Morgan Stanley | | | | |
| 3.11%, 7/13/2005 | | 4,000,000 | | 3,995,880 |
| Nordea North America Inc. | | | | |
| 3.30%, 9/6/2005 | | 4,000,000 | | 3,975,657 |
| San Paolo IMI US Financial Co. | | | | |
| 3.45%, 9/26/2005 | | 3,000,000 | | 2,975,205 |
| Scaldis Capital LLC | | | | |
| 3.12%, 7/25/2005 | | 4,000,000 a | | 3,991,733 |
| Sigma Finance Inc. | | | | |
| 3.13%, 7/19/2005 | | 4,000,000 a | | 3,993,770 |
| Solitaire Funding LLC | | | | |
| 3.45%, 9/30/2005 | | 4,000,000 a | | 3,965,420 |
| Three Pillars Funding Corp. | | | | |
| 3.11%, 7/11/2005 | | 4,000,000 a | | 3,996,567 |
| White Pine Corp. | | | | |
| 3.12%, 7/25/2005 | | 4,000,000 a | | 3,991,734 |
| Total Commercial Paper | | | | |
| (cost $94,656,122) | | | | 94,656,122 |
| |
| |
|
| |
| Corporate Notes—9.8% | | | | |
| |
| |
|
| Harrier Finance Funding | | | | |
| 3.27%, 4/13/2006 | | 4,000,000 a, b | | 4,000,000 |
| Lehman Brothers Inc. | | | | |
| 3.06%, 2/23/2006 | | 4,000,000 b | | 4,000,000 |
| Wells Fargo & Co. | | | | |
| 3.14%, 7/3/2011 | | 4,000,000 b | | 4,000,000 |
| Total Corporate Notes | | | | |
| (cost $12,000,000) | | | | 12,000,000 |
| | | Principal | | |
| Time Deposits—4.0% | | Amount ($) | | Value ($) |
| |
| |
|
| Amsouth Bank (Grand Cayman) | | | | |
| 3.31%, 7/1/2005 | | | | |
| (cost $4,900,000) | | 4,900,000 | | 4,900,000 |
| |
| |
|
| Total Investments (cost $123,556,111) | | 101.2% | | 123,556,111 |
| Liabilities, Less Cash and Receivables | | (1.2%) | | (1,495,363) |
| Net Assets | | 100.0% | | 122,060,748 |
| a Securities exempt from registration under Rule 144A of the Securities Act of 1933.These securities may be resold in |
| transactions exempt from registration, normally to qualified institutional buyers. At June 30, 2005, these securities |
| amounted to $67,765,618 or 55.5% of net assets. |
| b Variable interest rate—subject to periodic change. |
| Portfolio Summary (Unaudited) † | | | | |
| |
| | | Value (%) | | | | Value (%) |
| |
| |
| |
|
| Banking | | 49.0 | | Brokerage Firms | | 6.6 |
| Asset-Backed-Multiseller | | 22.7 | | Asset-Backed-Securities Arbitrage | | 3.3 |
| Asset-Backed-Structured | | | | | | |
| Investment Vehicles | | 19.6 | | | | 101.2 |
| |
| † Based on net assets. | | | | | | |
| See notes to financial statements. | | | | | | |
STATEMENT OF ASSETS AND LIABILITIES
June 30, 2005 (Unaudited)
|
| | | Cost | | Value |
| |
| |
|
| Assets ($): | | | | |
| Investments in securities—See Statement of Investments | | 123,556,111 | | 123,556,111 |
| Cash | | | | 1,069,325 |
| Interest receivable | | | | 84,375 |
| Prepaid expenses | | | | 2,737 |
| | | | | 124,712,548 |
| |
| |
|
| Liabilities ($): | | | | |
| Due to The Dreyfus Corporation and affiliates—Note 2(a) | | | | 53,915 |
| Payable for shares of Beneficial Interest redeemed | | | | 2,544,118 |
| Accrued expenses | | | | 53,767 |
| | | | | 2,651,800 |
| |
| |
|
| Net Assets ($) | | | | 122,060,748 |
| |
| |
|
| Composition of Net Assets ($): | | | | |
| Paid-in capital | | | | 122,083,577 |
| Accumulated net realized gain (loss) on investments | | | | (22,829) |
| |
| |
|
| Net Assets ($) | | | | 122,060,748 |
| |
| |
|
| Shares Outstanding | | | | |
| (unlimited number of $.001 par value shares of Beneficial Interest authorized) | | 122,083,577 |
| Net Asset Value, offering and redemption price per share ($) | | 1.00 |
See notes to financial statements.
|
STATEMENT OF OPERATIONS
Six Months Ended June 30, 2005 (Unaudited)
|
| Investment Income ($): | | |
| Interest Income | | 1,611,104 |
| Expenses: | | |
| Investment advisory fee—Note 2(a) | | 300,325 |
| Custodian fees | | 16,449 |
| Professional fees | | 14,733 |
| Prospectus and shareholders' reports | | 14,429 |
| Shareholder servicing costs—Note 2(a) | | 5,976 |
| Trustees' fees and expenses—Note 2(b) | | 4,315 |
| Miscellaneous | | 3,436 |
| Total Expenses | | 359,663 |
| Investment Income—Net | | 1,251,441 |
| |
|
| Net Realized Gain (Loss) on Investments—Note 1(b) ($) | | (65) |
| Net Increase in Net Assets Resulting from Operations | | 1,251,376 |
See notes to financial statements.
|
STATEMENT OF CHANGES IN NET ASSETS
| | | Six Months Ended | | |
| | | June 30, 2005 | | Year Ended |
| | | (Unaudited) | | December 31, 2004 |
| |
| |
|
| Operations ($): | | | | |
| Investment income—net | | 1,251,441 | | 993,834 |
| Net realized gain (loss) on investments | | (65) | | 1,438 |
| Net Increase (Decrease) in Net Assets | | | | |
| Resulting from Operations | | 1,251,376 | | 995,272 |
| |
| |
|
| Dividends to Shareholders from ($): | | | | |
| Investment income—net | | (1,251,441) | | (993,834) |
| |
| |
|
| Beneficial Interest Transactions ($1.00 per share): | | |
| Net proceeds from shares sold | | 114,086,309 | | 246,007,735 |
| Dividends reinvested | | 1,252,860 | | 993,834 |
| Cost of shares redeemed | | (97,507,039) | | (295,333,389) |
| Increase (Decrease) in Net Assets from | | | | |
| Beneficial Interest Transactions | | 17,832,130 | | (48,331,820) |
| Total Increase (Decrease) in Net Assets | | 17,832,065 | | (48,330,382) |
| |
| |
|
| Net Assets ($): | | | | |
| Beginning of Period | | 104,228,683 | | 152,559,065 |
| End of Period | | 122,060,748 | | 104,228,683 |
See notes to financial statements.
|
The following table describes the performance for the fiscal periods indicated. Total return shows how much your investment in the portfolio would have increased (or decreased) during each period, assuming you had reinvested all dividends and distributions.These figures have been derived from the portfolio's financial statements.
| Six Months Ended | | | | | | | | | | |
| | | June 30, 2005 | | | | Year Ended December 31, | | |
| | | |
| |
| |
|
| | | (Unaudited) | | 2004 | | 2003 | | 2002 | | 2001 | | 2000 |
| |
| |
| |
| |
| |
| |
|
| Per Share Data ($): | | | | | | | | | | | | |
| Net asset value, | | | | | | | | | | | | |
| beginning of period | | 1.00 | | 1.00 | | 1.00 | | 1.00 | | 1.00 | | 1.00 |
| Investment Operations: | | | | | | | | | | | | |
| Investment income—net | | .010 | | .008 | | .007 | | .015 | | .039 | | .058 |
| Distributions: | | | | | | | | | | | | |
| Dividends from | | | | | | | | | | | | |
| investment income—net | | (.010) | | (.008) | | (.007) | | (.015) | | (.039) | | (.058) |
| Net asset value, end of period | | 1.00 | | 1.00 | | 1.00 | | 1.00 | | 1.00 | | 1.00 |
| |
| |
| |
| |
| |
| |
|
| Total Return (%) | | 2.10a | | .80 | | .70 | | 1.46 | | 3.97 | | 5.98 |
| |
| |
| |
| |
| |
| |
|
| Ratios/Supplemental Data (%): | | | | | | | | | | |
| Ratio of total expenses | | | | | | | | | | | | |
| to average net assets | | .60a | | .60 | | .57 | | .56 | | .58 | | .60 |
| Ratio of net expenses | | | | | | | | | | | | |
| to average net assets | | .60a | | .60 | | .57 | | .56 | | .58 | | .60 |
| Ratio of net investment income | | | | | | | | | | |
| to average net assets | | 2.08a | | .77 | | .71 | | 1.44 | | 3.72 | | 5.87 |
| |
| |
| |
| |
| |
| |
|
| Net Assets, end of period | | | | | | | | | | | | |
| ($ x 1,000) | | 122,061 | | 104,229 | | 152,559 | | 196,217 | | 190,449 | | 124,375 |
| |
| a Annualized. | | | | | | | | | | | | |
| See notes to financial statements. | | | | | | | | | | | | |
NOTES TO FINANCIAL STATEMENTS (Unaudited)
NOTE 1—Significant Accounting Policies:
Dreyfus Variable Investment Fund (the "fund") is registered under the Investment Company Act of 1940, as amended (the "Act"), as an open-end management investment company, operating as a series company currently offering twelve series, including the Money Market Portfolio (the "portfolio").The portfolio is only offered to separate accounts established by insurance companies to fund variable annuity contracts and variable life insurance policies.The portfolio is a diversified series.The portfolio's investment objective is to provide as high a level of current income as is consistent with the preservation of capital and the maintenance of liquidity.The Dreyfus Corporation (the "Manager" or "Dreyfus") serves as the portfolio's investment adviser. The Manager is a wholly-owned subsidiary of Mellon Financial Corporation ("Mellon Financial"). Dreyfus Service Corporation (the "Distributor"), a wholly-owned subsidiary of the Manager, is the distributor of the portfolio's shares, which are sold without a sales charge.
It is the portfolio's policy to maintain a continuous net asset value per share of $1.00; the portfolio has adopted certain investment, portfolio valuation and dividend and distribution policies to enable it to do so. There is no assurance, however, that the portfolio will be able to maintain a stable net asset value per share of $1.00.
The fund accounts separately for the assets, liabilities and operations of each series. Expenses directly attributable to each series are charged to that series' operations; expenses which are applicable to all series are allocated among them on a pro rata basis.
The portfolio's financial statements are prepared in accordance with U.S. generally accepted accounting principles, which may require the use of management estimates and assumptions.Actual results could differ from those estimates.
The fund enters into contracts that contain a variety of indemnifica-tions.The portfolio's maximum exposure under these arrangements is
unknown. The portfolio does not anticipate recognizing any loss related to these arrangements.
(a) Portfolio valuation: Investments in securities are valued at amortized cost in accordance with Rule 2a-7 of the Act, which has been determined by the fund's Board of Trustees to represent the fair value of the portfolio's investments.
(b) Securities transactions and investment income: Securities transactions are recorded on a trade date basis. Realized gain and loss from securities transactions are recorded on the identified cost basis. Interest income, adjusted for accretion of discount and amortization of premium on investments, is earned from settlement date and recognized on the accrual basis. Cost of investments represents amortized cost.
The portfolio has an arrangement with the custodian bank whereby the portfolio receives earnings credits from the custodian when positive cash balances are maintained, which are used to offset custody fees. For financial reporting purposes, the portfolio includes net earnings credits, if any, as an expense offset in the Statement of Operations.
The portfolio may enter into repurchase agreements with financial institutions, deemed to be creditworthy by the Manager, subject to the seller's agreement to repurchase and the portfolio's agreement to resell such securities at a mutually agreed upon price. Securities purchased subject to repurchase agreements are deposited with the portfolio's custodian and, pursuant to the terms of the repurchase agreement, must have an aggregate market value greater than or equal to the terms of the repurchase price plus accrued interest at all times. If the value of the underlying securities falls below the value of the repurchase price plus accrued interest, the portfolio will require the seller to deposit additional collateral by the next business day. If the request for additional collateral is not met, or the seller defaults on its repurchase obligation, the portfolio maintains its right to sell the underlying securities at market value and may claim any resulting loss against the seller.
NOTES TO FINANCIAL STATEMENTS (Unaudited) (continued)
(c) Dividends to shareholders: It is the policy of the portfolio to declare dividends daily from investment income-net. Such dividends are paid monthly. Dividends from net realized capital gain, if any, are normally declared and paid annually, but the portfolio may make distributions on a more frequent basis to comply with the distribution requirements of the Internal Revenue Code of 1986 as amended (the "Code").To the extent that net realized capital gain can be offset by capital loss carryovers, it is the policy of the portfolio not to distribute such gain.
(d) Federal income taxes: It is the policy of the portfolio to continue to qualify as a regulated investment company, if such qualification is in the best interests of its shareholders, by complying with the applicable provisions of the Code, and to make distributions of taxable income sufficient to relieve it from substantially all federal income and excise taxes.
The portfolio has an unused capital loss carryover of $22,833 available to be applied against future net securities profits, if any, realized subsequent to December 31, 2004. If not applied, $783 of the carryover expires in fiscal 2007, $11,060 expires in fiscal 2008, $10,973 expires in fiscal 2010 and $17 expires in fiscal 2011.
The tax character of distributions paid to shareholders during the fiscal year ended December 31, 2004 was all ordinary income.The tax character of current year distributions will be determined at the end of the current fiscal year.
At June 30,2005,the cost of investments for federal income tax purposes was substantially the same as the cost for financial reporting purposes (see the Statement of Investments).
NOTE 2—Investment Advisory Fee and Other Transactions With Affiliates:
(a) Pursuant to an Investment Advisory Agreement with the Manager, the investment advisory fee is computed at the annual rate of .50 of 1% of the value of the portfolio's average daily net assets and is payable monthly.
The portfolio compensates Dreyfus Transfer, Inc., a wholly-owned subsidiary of the Manager, under a transfer agency agreement for providing personnel and facilities to perform transfer agency services for the portfolio. During the period ended June 30, 2005, the portfolio was charged $155 pursuant to the transfer agency agreement.
During the period ended June 30, 2005, the fund was charged $1,998 for services performed by the Chief Compliance Officer.
The components of Due to The Dreyfus Corporation and affiliates in the Statement of Assets and Liabilities consist of: investment advisory fees $51,873, chief compliance officer fees $1,998 and transfer agency per account fees $44.
(b) Each Board member also serves as a Board member of other funds within the Dreyfus complex. Annual retainer fees and attendance fees are allocated to each fund based on net assets.
In early 2004, two purported class and derivative actions were filed against Mellon Financial, Mellon Bank, N.A., Dreyfus, Founders Asset Management LLC, and certain directors of the Dreyfus Funds and the Dreyfus Founders Funds (together, the "Funds") in the United States District Court for the Western District of Pennsylvania. In September 2004, plaintiffs served a Consolidated Amended Complaint (the "Amended Complaint") on behalf of a purported class of all persons who acquired interests in any of the Funds between January 30, 1999 and November 17, 2003, and derivatively on behalf of the Funds.The Amended Complaint in the newly styled In re Dreyfus Mutual Funds Fee Litigation also named the Distributor, Premier Mutual Fund Services, Inc. and two additional Fund directors as defendants and alleges violations of the Investment Company Act of 1940, the Investment Advisers Act of 1940, the Pennsylvania Unfair Trade Practices and Consumer Protection Law and common-law claims. Plaintiffs seek to recover allegedly improper and excessive Rule 12b-1 and advisory fees allegedly charged to the Funds for marketing and
NOTES TO FINANCIAL STATEMENTS (Unaudited) (continued)
distribution services. More specifically, plaintiffs claim, among other things, that 12b-1 fees and directed brokerage were improperly used to pay brokers to recommend the Funds over other funds, and that such payments were not disclosed to investors. In addition, plaintiffs assert that economies of scale and soft-dollar benefits were not passed on to the Funds. Plaintiffs further allege that 12b-1 fees were improperly charged to certain of the Funds that were closed to new investors.The Amended Complaint seeks compensatory and punitive damages, rescission of the advisory contracts, and an accounting and restitution of any unlawful fees, as well as an award of attorneys' fees and litigation expenses. As noted, some of the claims in this litigation are asserted derivatively on behalf of the Funds that have been named as nominal defendants. With respect to such derivative claims, no relief is sought against the Funds. Dreyfus believes the allegations to be totally without merit and intends to defend the action vigorously. In November 2004, all named defendants moved to dismiss the Amended Compliant in whole or substantial part. Briefing was completed in May 2005.
Additional lawsuits arising out of these circumstances and presenting similar allegations and requests for relief may be filed against the defendants in the future. Neither Dreyfus nor the Funds believe that any of the pending actions will have a material adverse effect on the Funds or Dreyfus' ability to perform its contract with the Funds.
INFORMATION ABOUT THE REVIEW
AND APPROVAL OF THE PORTFOLIO'S
I N V E S T M E N T A DV I S O RY A G R E E M E N T (Unaudited)
|
At separate meetings of the Board of Trustees for the fund held on June 8-9, 2005, the Board considered the re-approval, through its annual renewal date of July 31, 2006, of the Investment Advisory Agreement with the Manager for the portfolio, pursuant to which the Manager provides the portfolio with investment advisory and administrative services. The Board members who are not "interested persons" (as defined in the Act (the "Independent Trustees")) of the fund were assisted in their review by independent legal counsel and met with counsel in executive session separate from representatives of the Manager.
Analysis of Nature, Extent and Quality of Services Provided to the Portfolio. The Board members received a presentation from representatives of the Manager regarding services provided to the portfolio and other funds in the Dreyfus fund complex, and discussed the nature, extent and quality of the services provided to the portfolio pursuant to its Investment Advisory Agreement. The Manager's representatives reviewed the portfolio's distribution of accounts and the relationships the Manager has with various intermediaries and the different needs of each.The Board noted that the portfolio's shares were offered only to separate accounts established by insurance companies to fund variable annuity contracts and variable life insurance policies. The Manager's representatives noted the diversity of distribution among the funds in the Dreyfus complex, and the Manager's corresponding need for broad, deep, and diverse resources to be able to provide ongoing shareholder services to each distribution channel, including that of the portfolio. The Board also reviewed the number of shareholder accounts in the portfolio, as well as the portfolio's asset size.
The Board members also considered the Manager's research and portfolio management capabilities and that the Manager also provides oversight of day-to-day portfolio operations, including fund accounting and administration and assistance in meeting legal and regulatory requirements. The Board members also considered the Manager's extensive administrative, accounting and compliance infrastructure.
INFORMATION ABOUT THE REVIEW AND APPROVAL OF THE PORTFOLIO'S
INVESTMENT ADVISORY AGREEMENT (Unaudited) (continued)
|
Comparative Analysis of the Portfolio's Performance, Investment Advisory Fee and Expense Ratio. The Board members reviewed the portfolio's performance and expense ratios and placed significant emphasis on comparisons to a group of comparable funds and Lipper category averages, as applicable.The Board members reviewed the portfolio's performance, investment advisory fee, and total expense ratios within its comparison group and against the portfolio's Lipper category averages, as applicable.The group of comparable funds was previously approved by the Board for this purpose, and was prepared using a Board-approved selection methodology that was based, in part, on selecting non-affiliated funds reported in the same Lipper category as the portfolio.The Board members discussed the results of the comparisons and took note of the portfolio's generally competitive performance noting that the portfolio's performance was above the comparison group and Lipper category averages for the 5-year and 10-year periods, was in the top half of its comparison group and Lipper category rankings for the 5-year and 10-year periods, and was in the top half of its Lipper category ranking for the 3-year period. The Board members also discussed the portfolio's expense ratio, noting it is higher than the average of its comparison group and that it ranks in the bottom half (i.e., higher than most of the other funds) of its comparison group.They reviewed the range of management fees in the comparison group and noted that the portfolio's investment advisory fee was in the bottom half (i.e., higher than most of the other funds) of the comparison group rankings, but that the fees paid by most of the other funds were close to what the portfolio pays in management fees.
Representatives of the Manager stated that there are no other mutual funds managed by the Manager or its affiliates with similar investment objectives, policies and strategies as the portfolio, which were reported in the same Lipper category as the portfolio, and that there were no separate accounts managed by the Manager or its affiliates with similar investment objectives, policies and strategies as the portfolio. The Manager or its affiliates do not manage other money market funds for insurance products. The Manager's representatives also reviewed the costs associated with distribution through intermediaries.
Analysis of Profitability and Economies of Scale. The Manager's representatives reviewed the dollar amount of expenses allocated and profit received by the Manager and the method used to determine such expenses and profit.The Board received and considered information prepared by an independent consulting firm regarding Dreyfus' approach to allocating costs to, and determining the profitability of, individual funds and the entire Dreyfus mutual fund complex. The consulting firm also analyzed where any economies of scale might emerge as assets grow. The Board members evaluated the analysis in light of the relevant circumstances for the portfolio, including the decline in assets and the extent to which economies of scale would be realized as the portfolio grows and whether fee levels reflect these economies of scale for the benefit of portfolio investors. The Board members also considered potential benefits to the Manager from acting as investment adviser and noted that there were no soft dollar arrangements with respect to trading the portfolio's portfolio.
It was noted that the Board members should consider the Manager's profitability with respect to the portfolio as part of their evaluation of whether the fee under the Investment Advisory Agreement bears a reasonable relationship to the mix of services provided by the Manager, including the nature, quality and extent of such services and that a discussion of economies of scale are predicated on increasing assets and that, if a fund's assets had been decreasing, the possibility that the Manager may have realized any economies of scale would be less. It also was noted that the profitability percentage for managing the portfolio was within ranges determined by appropriate court cases to be reasonable given the services rendered and, given the portfolio's overall performance and generally superior service levels provided.
At the conclusion of these discussions, each of the Independent Trustees expressed the opinion that he or she had been furnished with sufficient information to make an informed business decision with respect to continuation of the fund's Investment Advisory Agreement with respect to the portfolio. Based on their discussions and considerations as described above, the Board made the following conclusions and determinations.
INFORMATION ABOUT THE REVIEW AND APPROVAL OF THE PORTFOLIO'S
INVESTMENT ADVISORY AGREEMENT (Unaudited) (continued)
|
- The Board concluded that the nature, quality, and extent of the ser- vices provided by the Manager are adequate and appropriate.
- The Board generally was satisfied with the portfolio's performance, noting its longer term performance where the portfolio outper- formed its comparison group and Lipper category.
- The Board concluded that the fee paid by the portfolio to the Manager was reasonable in light of comparative performance and expense and advisory fee information, costs of the services provided and profits to be realized and benefits derived or to be derived by the Manager from its relationship with the portfolio.
- The Board determined that, to the extent that material economies of scale had not been shared with the portfolio, the Board would seek to do so.
The Board members considered these conclusions and determinations, along with information received on a routine and regular basis throughout the year, and, without any one factor being dispositive, the Board determined that approval of the fund's Investment Advisory Agreement, with respect to the portfolio, was in the best interests of the portfolio and its shareholders.
NOTES
| For More | | Information |
| |
|
| |
| Dreyfus Variable | | Transfer Agent & |
| Investment Fund, | | Dividend Disbursing Agent |
| Money Market Portfolio | | |
| | | Dreyfus Transfer, Inc. |
| 200 Park Avenue | | |
| | | 200 Park Avenue |
| New York, NY 10166 | | |
| | | New York, NY 10166 |
| |
| Investment Adviser | | Distributor |
| The Dreyfus Corporation | | |
| | | Dreyfus Service Corporation |
| 200 Park Avenue | | |
| | | 200 Park Avenue |
| New York, NY 10166 | | |
| | | New York, NY 10166 |
| Custodian | | |
| The Bank of New York | | |
| One Wall Street | | |
| New York, NY 10286 | | |
Telephone 1-800-554-4611 or 516-338-3300
Mail The Dreyfus Family of Funds, 144 Glenn Curtiss Boulevard, Uniondale, NY 11556-0144 Attn: Institutional Servicing
The portfolio files its complete schedule of portfolio holdings with the Securities and Exchange Commission ("SEC") for the first and third quarters of each fiscal year on Form N-Q. The portfolio's Forms N-Q are available on the SEC's website at http://www.sec.gov and may be reviewed and copied at the SEC's Public Reference Room in Washington, DC. Information on the operation of the Public Reference Room may be obtained by calling 1-800-SEC-0330.
Information regarding how the portfolio voted proxies relating to portfolio securities for the 12-month period ended June 30, 2005, is available on the SEC's website at http://www.sec.gov and without charge, upon request, by calling 1-800-645-6561.
© 2005 Dreyfus Service Corporation

| Dreyfus Variable |
| Investment Fund, |
| Quality Bond Portfolio |
SEMIANNUAL REPORT June 30, 2005

The views expressed in this report reflect those of the portfolio manager only through the end of the period covered and do not necessarily represent the views of Dreyfus or any other person in the Dreyfus organization.Any such views are subject to change at any time based upon market or other conditions and Dreyfus disclaims any responsibility to update such views. These views may not be relied on as investment advice and, because investment decisions for a Dreyfus portfolio are based on numerous factors, may not be relied on as an indication of trading intent on behalf of any Dreyfus portfolio.
Not FDIC-Insured • Not Bank-Guaranteed • May Lose Value
| | | Contents |
| |
| | | T H E P O R T F O L I O |
| |
|
| 2 | | Letter from the Chairman |
| 3 | | Discussion of Performance |
| 6 | | Understanding Your Portfolio's Expenses |
| 6 | | Comparing Your Portfolio's Expenses |
| | | With Those of Other Funds |
| 7 | | Statement of Investments |
| 19 | | Statement of Financial Futures |
| 19 | | Statement of Options Written |
| 20 | | Statement of Assets and Liabilities |
| 21 | | Statement of Operations |
| 22 | | Statement of Changes in Net Assets |
| 24 | | Financial Highlights |
| 28 | | Notes to Financial Statements |
| 41 | | Information About the Review |
| and Approval of the Portfolio's |
| Investment Advisory Agreement |
| | | F O R M O R E I N F O R M AT I O N |
| |
|
| | | Back Cover |
| Dreyfus Variable Investment Fund, |
| Quality Bond Portfolio |
The Portfolio

LETTER FROM THE CHAIRMAN
We are pleased to present this semiannual report for Dreyfus Variable Investment Fund, Quality Bond Portfolio, covering the six-month period from January 1, 2005, through June 30, 2005. Inside, you'll find valuable information about how the portfolio was managed during the reporting period, including a discussion with the portfolio manager, Catherine Powers.
The first half of 2005 proved to be an unusual time for fixed-income securities. Contrary to historical norms, yields of longer-term U.S. government securities fell — and their prices rose — even as the Federal Reserve Board attempted to forestall inflationary pressures by raising short-term interest rates. Signs of potential economic weakness, a strengthening U.S. dollar and robust investor demand appear to have fueled the rally in the more interest-rate-sensitive parts of the market. Conversely, prices in the corporate bond market declined despite an expanding economy, improved balance sheets and persistently low default rates.
In our view, these factors may have created new opportunities and challenges for fixed-income investors. Our economists currently expect the U.S. economy to continue to grow over the foreseeable future without significant new inflationary pressures, potentially setting the stage for market conditions that could affect the various sectors of the U.S. bond market in different ways. As always, we encourage you to discuss these and other matters with your financial advisor.
Thank you for your continued confidence and support.


DISCUSSION OF PERFORMANCE
Catherine Powers, Primary Portfolio Manager
How did Dreyfus Variable Investment Fund, Quality Bond Portfolio perform relative to its benchmark?
For the six-month period ended June 30, 2005, the portfolio's Initial shares achieved a total return of 2.28%, and its Service shares achieved a total return of 2.17% .1 The portfolio produced aggregate income dividends of $0.177 per share and $0.164 per share for its Initial and Service shares, respectively. In comparison, the portfolio's benchmark, the Lehman Brothers U.S. Aggregate Index (the "Index"), achieved a total return of 2.51% for the same period.2
During the reporting period, short-term interest rates continued to rise amid additional Federal Reserve Board ("the Fed") rate hikes. Despite higher short-term rates, the yields of longer-term Treasuries fell. Broad sectors posted lackluster returns relative to Treasuries over the last six months. In particular, corporate bonds returns were disappointing as the sector's returns were pressured by increased event risk and ratings downgrades in the auto industry. Although this environment has been difficult for non-Treasury assets, the portfolio's returns kept reasonable pace with the benchmark.The major positive contribution to performance results has been from the portfolio's barbell yield-curve strategy which benefited from the significant flattening of the Treasury curve over the last six months.
Note to shareholders: On January 31, 2005, Catherine Powers and Christopher Pellegrino became the fund's primary and secondary portfolio managers, respectively. Each manages the portfolio under a dual-employee relationship with Dreyfus, using the proprietary investment processes of Standish Mellon Asset Management, LLC (Standish) — an affiliate of Dreyfus. Ms. Powers also is a Senior Portfolio Manager for Active Core Strategies, responsible for high-grade core and core-plus fixed-income strategies, with Standish. Mr. Pellegrino also is a Senior Portfolio Manager for Active Core Strategies, responsible for the management of high-grade core strategies, with Standish.
DISCUSSION OF PERFORMANCE (continued)
|
What is the portfolio's investment approach?
The portfolio seeks to maximize total return consisting of capital appreciation and current income. To achieve this objective, the portfolio normally invests at least 80% of its assets in bonds, including corporate bonds, mortgage-related securities, collateralized mortgage obligations and asset-backed securities that, when purchased, are A-rated or better or what we believe are the unrated equivalent, and in securities issued or guaranteed by the U.S. government or its agencies or its instru-mentalities.The portfolio may also invest up to 10% of its net assets in non-dollar-denominated foreign securities and up to 20% of its assets in the securities of foreign issues collectively.
What other factors affected the portfolio's performance?
The Fed continued to raise short-term interest rates, implementing rate hikes at each of four meetings of its Federal Open Market Committee. As a result, the federal funds rate climbed from 2.25% at the start of the reporting period to 3.25% at the end. As expected, rising interest rates eroded prices of most short-term fixed-income securities. Contrary to historical tightening cycles, however, prices of longer-term bonds rose, and the yield of the 10-year U.S. Treasury bond ended the reporting period below 4%.
The corporate sector began the reporting period with historically narrow yield spreads, particularly in lower-quality bonds.As this left little room for disappointment, the corporate bond market sold off sharply in March and April, when major U.S. automotive companies released disappointing financial results, and bond-rating agencies downgraded General Motors' unsecured debt to below investment grade.
In this difficult environment for non-Treasury assets, the portfolio's relative performance benefited from its defensive posture across spread sectors.A bias toward higher-rated corporate bonds helped the portfolio's returns as well as strong bottom-up security selection.The relatively small allocation to high yield was a modest negative.The barbell yield-curve positioning strategy helped boost returns as yield differences between short- and long-term securities narrowed. In the Treasury Inflation
Protected Securities ("TIPS") sector, the advantage of seasonally high inflation accruals was offset by declining inflation expectations.As a result, the higher allocation to TIPS has been only a marginal benefit to the portfolio. Finally, the portfolio's modest underweight to better-performing mortgage-backed securities was a slight drag on relative performance.
What is the portfolio's current strategy?
Recently, we have shifted portfolio positioning for the next phase of monetary policy. Although we expect the Fed to continue raising interest rates, we believe that we are nearing the end of the tightening cycle.Accordingly, we have adopted a "bulleted" yield curve positioning, with a focus on securities in the intermediate area.We also have reduced the portfolio's holdings of TIPS in favor of nominal U.S. Treasury securities.
As of the reporting period's end, we continue to view risk premiums across broad market sectors as relatively rich. Consequently, we believe that a generally defensive investment posture is prudent until the Fed makes clearer its intentions for monetary policy.
| | | The portfolio is only available as a funding vehicle under variable life insurance policies or variable |
| | | annuity contracts issued by insurance companies. Individuals may not purchase shares of the |
| | | portfolio directly. A variable annuity is an insurance contract issued by an insurance company that |
| | | enables investors to accumulate assets on a tax-deferred basis for retirement or other long-term |
| | | goals.The investment objective and policies of Dreyfus Variable Investment Fund, Quality Bond |
| | | Portfolio may be similar to other funds/portfolios managed or advised by Dreyfus. However, the |
| | | investment results of the portfolio may be higher or lower than, and may not be comparable to, |
| | | those of any other Dreyfus fund/portfolio. |
| 1 | | Total return includes reinvestment of dividends and any capital gains paid. Past performance is no |
| | | guarantee of future results. Share price and investment return fluctuate such that upon redemption, |
| | | portfolio shares may be worth more or less than their original cost.The portfolio's performance does |
| | | not reflect the deduction of additional charges and expenses imposed in connection with investing |
| | | in variable insurance contracts, which will reduce returns. Return figures provided reflect the |
| | | absorption of certain portfolio expenses by The Dreyfus Corporation pursuant to an agreement in |
| | | effect through December 31, 2005, at which time it may be extended or terminated. Had these |
| | | expenses not been absorbed, the portfolio's returns would have been lower. |
| 2 | | SOURCE: LIPPER INC. — Reflects reinvestment of dividends and, where applicable, capital |
| | | gain distributions.The Lehman Brothers U.S. Aggregate Index is a widely accepted, unmanaged |
| | | total return index of corporate, U.S. government and U.S. government agency debt instruments, |
| | | mortgage-backed securities and asset-backed securities with an average maturity of 1-10 years. |
The Portfolio 5
UNDERSTANDING YOUR
PORTFOLIO'S EXPENSES (Unaudited)
|
As a mutual fund investor,you pay ongoing expenses,such as management fees and other expenses.Using the information below, you can estimate how these expenses affect your investment and compare them with the expenses of other funds.You also may pay one-time transaction expenses, including sales charges (loads) and redemption fees, which are not shown in this section and would have resulted in higher total expenses. For more information, see your portfolio's prospectus or talk to your financial adviser.
Review your portfolio's expenses
|
The table below shows the expenses you would have paid on a $1,000 investment in Dreyfus Variable Investment Fund, Quality Bond Portfolio from January 1, 2005 to June 30, 2005. It also shows how much a $1,000 investment would be worth at the close of the period, assuming actual returns and expenses.
| Expenses and Value of a $1,000 Investment | | |
| assuming actual returns for the six months ended June 30, 2005 | | |
| | | Initial Shares | | Service Shares |
| |
| |
|
| Expenses paid per $1,000 † | | $ 3.11 | | $ 4.31 |
| Ending value (after expenses) | | $1,022.80 | | $1,021.70 |
COMPARING YOUR PORTFOLIO'S EXPENSES WITH THOSE OF OTHER FUNDS (Unaudited)
Using the SEC's method to compare expenses
The Securities and Exchange Commission (SEC) has established guidelines to help investors assess fund expenses. Per these guidelines, the table below shows your portfolio's expenses based on a $1,000 investment, assuming a hypothetical 5% annualized return. You can use this information to compare the ongoing expenses (but not transaction expenses or total cost) of investing in the portfolio with those of other funds. All mutual fund shareholder reports will provide this information to help you make this comparison. Please note that you cannot use this information to estimate your actual ending account balance and expenses paid during the period.
Expenses and Value of a $1,000 Investment assuming a hypothetical 5% annualized return for the six months ended June 30, 2005
| | | Initial Shares | | Service Shares |
| |
| |
|
| Expenses paid per $1,000 † | | $ 3.11 | | $ 4.31 |
| Ending value (after expenses) | | $1,021.72 | | $1,020.53 |
† Expenses are equal to the portfolio's annualized expense ratio of .62% for Initial shares and .86% for Service shares, multiplied by the average account value over the period, multiplied by 181/365 (to reflect the one-half year period).
STATEMENT OF INVESTMENTS
June 30, 2005 (Unaudited)
|
| | | Principal | | | | |
| Bonds and Notes—117.6% | | Amounta | | Value ($) |
| |
| |
|
| Aerospace & Defense—.3% | | | | | | |
| L-3 Communications, | | | | | | |
| Sr. Sub. Notes, 7.625%, 2012 | | 415,000 | | | | 444,050 |
| Raytheon, | | | | | | |
| Notes, 5.5%, 2012 | | 210,000 | | | | 221,279 |
| | | | | | | 665,329 |
| Agricultural—.4% | | | | | | |
| Altria, | | | | | | |
| Notes, 7%, 2013 | | 805,000 | | | | 902,319 |
| Airlines—.0% | | | | | | |
| USAir, | | | | | | |
| Enhanced Equipment Notes, Ser. C, 8.93%, 2009 | | 270,471 | | b,c | | 27 |
| Asset-Backed Ctfs.-Automobile Receivables—2.5% | | | | |
| Ford Credit Auto Owner Trust, | | | | | | |
| Ser. 2005-B, Cl. B, 4.64%, 2010 | | 650,000 | | | | 656,653 |
| WFS Financial Owner Trust: | | | | | | |
| Ser. 2003-3, Cl. A4, 3.25%, 2011 | | 4,525,000 | | | | 4,480,306 |
| Ser. 2005-2, Cl. B, 4.57%, 2012 | | 325,000 | | | | 328,926 |
| | | | | | | 5,465,885 |
| Asset-Backed Ctfs.-Home Equity Loans—3.8% | | | | | | |
| ACE Securities, | | | | | | |
| Ser. 2005-HE1, Cl. A2A, 3.43%, 2035 | | 433,503 | | d | | 433,802 |
| Accredited Mortgage Loan Trust: | | | | | | |
| Ser. 2005-1, Cl. A2A, 3.41%, 2035 | | 487,743 | | d | | 488,133 |
| Ser. 2005-2, Cl. A2A, 3.41%, 2035 | | 675,000 | | d | | 675,215 |
| Ameriquest Mortgage Securities, | | | | | | |
| Ser. 2003-11, Cl. AF6, 5.14%, 2034 | | 525,000 | | | | 533,681 |
| Bear Stearns Asset Backed Securities: | | | | | | |
| Ser. 2005-HE2, Cl. A1, 3.42%, 2035 | | 399,992 | | d | | 400,325 |
| Ser. 2005-HE3, Cl. A1, 3.39%, 2035 | | 349,147 | | d | | 349,414 |
| Ser. 2005-HE4, Cl. 1A1, 3.41%, 2035 | | 639,173 | | d | | 639,616 |
| Ser. 2005-TC1, Cl. A1, 3.42%, 2035 | | 657,021 | | d | | 657,008 |
| Fremont Home Loan Trust II, | | | | | | |
| Ser. 2005-1, Cl. A1, 3.42%, 2035 | | 774,787 | | d | | 775,728 |
| Home Equity Asset Trust, | | | | | | |
| Ser. 2005-5, Cl. 2A1, 3.51%, 2035 | | 1,075,000 | | d | | 1,075,000 |
| Mastr Asset Backed Securities Trust, | | | | | | |
| Ser. 2005-WMC1, Cl. A3, 3.41%, 2035 | | 520,351 | | d | | 520,382 |
| Morgan Stanley ABS Capital I, | | | | | | |
| Ser. 2005-NC2, Cl. A3A, 3.39%, 2035 | | 694,032 | | d | | 694,453 |
STATEMENT OF INVESTMENTS (Unaudited) (continued)
| | | Principal | | | | |
| Bonds and Notes (continued) | | Amounta | | Value ($) |
| |
| |
|
| Asset-Backed Ctfs.-Home Equity Loans (continued) | | | | |
| Morgan Stanley Home Equity Loans, | | | | | | |
| Ser. 2005-2, Cl. A2A, 3.4%, 2035 | | 500,000 | | d | | 499,615 |
| Residential Asset Securities, | | | | | | |
| Ser. 2005-EMX1, Cl. AI1, 3.41%, 2035 | | 585,040 | | d | | 585,487 |
| | | | | | | 8,327,859 |
| Asset-Backed Ctfs.-Manufactured Housing—.7% | | | | |
| Green Tree Financial, | | | | | | |
| Ser. 1994-7, Cl. M1, 9.25%, 2020 | | 550,000 | | | | 589,837 |
| Origen Manufactured Housing, | | | | | | |
| Ser. 2005-A, Cl. A1, 4.06%, 2013 | | 996,513 | | | | 994,360 |
| | | | | | | 1,584,197 |
| Asset-Backed-Other—4.0% | | | | | | |
| Citigroup Mortgage Loan Trust, | | | | | | |
| Ser. 2005-OPT3, Cl. A1A, 3.30625%, 2035 | | 725,000 | | d | | 725,000 |
| Countrywide, | | | | | | |
| Ser. 2005-2, Cl. 2A1, 3.4%, 2035 | | 590,881 | | d | | 590,911 |
| Morgan Stanley ABS Capital I, | | | | | | |
| Ser. 2005-WMC2, Cl. A2A, 3.39%, 2014 | | 450,701 | | d | | 450,974 |
| Ownit Mortgage Loan Asset Backed Ctfs., | | | | | | |
| Ser. 2005-2, Cl. A2A, 3.42%, 2036 | | 920,167 | | d | | 920,222 |
| Residential Asset Mortgage Products: | | | | | | |
| Ser. 2004-RS12, Cl.AII1, 3.44%, 2027 | | 997,568 | | d | | 998,640 |
| Ser. 2005-RS3, Cl. AIA1, 3.41%, 2035 | | 1,073,357 | | d | | 1,074,182 |
| Ser. 2005-RS2, Cl. AII1, 3.42%, 2035 | | 691,241 | | d | | 691,907 |
| Ser. 2005-RZ1, Cl. A1, 3.41%, 2034 | | 580,638 | | d | | 581,038 |
| Saxon Asset Securities Trust, | | | | | | |
| Ser. 2004-2, Cl. AF2, 4.15%, 2035 | | 2,298,000 | | | | 2,282,535 |
| Specialty Underwriting & Residential Finance, | | | | | | |
| Ser. 2005-BC1, Cl. A1A, 3.42%, 2035 | | 474,480 | | d | | 474,804 |
| | | | | | | 8,790,213 |
| Auto Manufacturing—.2% | | | | | | |
| DaimlerChrysler: | | | | | | |
| Notes, 4.875%, 2010 | | 175,000 | | | | 174,385 |
| Notes, 8.5%, 2031 | | 180,000 | | | | 228,721 |
| | | | | | | 403,106 |
| Banking—3.8% | | | | | | |
| Chevy Chase Bank FSB, | | | | | | |
| Sub. Notes, 6.875%, 2013 | | 260,000 | | | | 269,750 |
| Chuo Mitsui Trust & Banking, | | | | | | |
| Sub. Notes, 5.506%, 2049 | | 565,000 | | e | | 556,106 |
8
| | | Principal | | |
| Bonds and Notes (continued) | | Amounta | | Value ($) |
| |
| |
|
| Banking (continued) | | | | |
| HBOS Capital, | | | | |
| Notes, 6.071%, 2049 | | 2,590,000 e,f | | 2,800,621 |
| Northern Rock, | | | | |
| Notes, 5.6%, 2008 | | 535,000 e | | 556,174 |
| Rabobank Capital Funding II, | | | | |
| Bonds, 5.26%, 2049 | | 1,385,000 e | | 1,427,243 |
| US Bank, | | | | |
| Notes, Ser. BNT1, 3.25%, 2006 | | 1,325,000 d | | 1,325,384 |
| Union Planters, | | | | |
| Notes, 4.375%, 2010 | | 700,000 | | 699,133 |
| Wells Fargo & Co., | | | | |
| Sub. Notes, 6.375%, 2011 | | 290,000 | | 321,068 |
| Zions Bancorporation, | | | | |
| Sub. Notes, 6%, 2015 | | 465,000 | | 507,993 |
| | | | | 8,463,472 |
| Building & Construction—.1% | | | | |
| American Standard, | | | | |
| Sr. Notes, 7.375%, 2008 | | 265,000 | | 282,320 |
| Chemicals—1.2% | | | | |
| ICI Wilmington, | | | | |
| Notes, 5.625%, 2013 | | 640,000 | | 665,134 |
| Lubrizol: | | | | |
| Debs., 6.5%, 2034 | | 600,000 | | 664,643 |
| Sr. Notes, 4.625%, 2009 | | 445,000 | | 445,479 |
| RPM International: | | | | |
| Bonds, 6.25%, 2013 | | 420,000 | | 442,621 |
| Sr. Notes, 4.45%, 2009 | | 450,000 | | 443,693 |
| | | | | 2,661,570 |
| Commercial & Professional Services—1.0% | | |
| Aramark Services, | | | | |
| Notes, 5%, 2012 | | 785,000 | | 787,185 |
| Deluxe, | | | | |
| Notes, Ser. B, 3.5%, 2007 | | 90,000 | | 88,008 |
| RR Donnelley & Sons, | | | | |
| Notes, 4.95%, 2014 | | 680,000 | | 666,030 |
| Erac USA Finance: | | | | |
| Bonds, 5.6%, 2015 | | 310,000 e | | 320,931 |
| Notes, 7.95%, 2009 | | 210,000 e | | 237,920 |
| | | | | 2,100,074 |
STATEMENT OF INVESTMENTS (Unaudited) (continued)
| | | Principal | | | | |
| Bonds and Notes (continued) | | Amounta | | Value ($) |
| |
| |
|
| Commercial Mortgage Pass-Through Ctfs.—1.0% | | | | |
| Banc of America Commercial Mortgage, | | | | | | |
| Ser. 2005-2, Cl. A2, 4.247%, 2042 | | 875,000 | | | | 877,187 |
| Calwest Industrial Trust, | | | | | | |
| Ser. 2002-CALW, Cl. A, 6.127%, 2017 | | 1,000,000 | | e | | 1,094,697 |
| Crown Castle Towers, | | | | | | |
| Ser. 2005-1A, Cl. D, 5.612%, 2035 | | 240,000 | | e | | 240,966 |
| | | | | | | 2,212,850 |
| Diversified Financial Service—5.3% | | | | | | |
| Amvescap, | | | | | | |
| Notes, 5.375%, 2013 | | 550,000 | | | | 566,760 |
| Bear Stearns & Cos., | | | | | | |
| Notes, 4.5%, 2010 | | 325,000 | | | | 327,109 |
| Boeing Capital, | | | | | | |
| Sr. Notes, 7.375%, 2010 | | 490,000 | | | | 561,119 |
| Countrywide Home Loans, | | | | | | |
| Notes, Ser. L, 4%, 2011 | | 1,155,000 | | | | 1,115,312 |
| Ford Motor Credit: | | | | | | |
| Global Landmark Securities, 6.5%, 2007 | | 465,000 | | | | 468,509 |
| Notes, 7.75%, 2007 | | 200,000 | | | | 203,966 |
| Sr. Notes, 7.2%, 2007 | | 405,000 | | | | 409,836 |
| Glencore Funding, | | | | | | |
| Notes, 6%, 2014 | | 675,000 | | e | | 648,338 |
| Goldman Sachs, | | | | | | |
| Notes, 5.7%, 2012 | | 625,000 | | | | 665,992 |
| HSBC Finance, | | | | | | |
| Notes, 4.75%, 2010 | | 365,000 | | | | 370,574 |
| International Lease Finance, | | | | | | |
| Notes, 4.75%, 2012 | | 850,000 | | | | 848,312 |
| JPMorgan Chase & Co., | | | | | | |
| Sub. Notes, 5.125%, 2014 | | 780,000 | | | | 799,358 |
| Jefferies, | | | | | | |
| Sr. Notes, 5.5%, 2016 | | 685,000 | | | | 694,456 |
| Morgan Stanley, | | | | | | |
| Sub. Notes, 4.75%, 2014 | | 2,077,000 | | | | 2,049,812 |
| Pearson Dollar Finance, | | | | | | |
| Notes, 4.7%, 2009 | | 335,000 | | e | | 336,444 |
| Residential Capital, | | | | | | |
| Notes, 6.375%, 2010 | | 1,070,000 | | e | | 1,076,283 |
| | | | | Principal | | |
| Bonds and Notes (continued) | | | | Amounta | | Value ($) |
| |
| |
| |
|
| Diversified Financial Service (continued) | | | | |
| SLM, | | | | | | |
| Notes, 5.375%, 2013 | | | | 575,000 | | 606,176 |
| | | | | | | 11,748,356 |
| Electric Utilities—1.6% | | | | | | |
| Consumers Energy, | | | | | | |
| First Mortgage, 5%, 2012 | | | | 655,000 | | 666,727 |
| Dominion Resources, | | | | | | |
| Sr. Notes, Ser. A, 7.195%, 2014 | | | | 575,000 | | 668,933 |
| FPL Energy National Wind, | | | | | | |
| Notes, 5.608%, 2024 | | | | 100,000 e | | 102,336 |
| FirstEnergy, | | | | | | |
| Notes, Ser. B, 6.45%, 2011 | | | | 300,000 | | 328,218 |
| Nisource Finance, | | | | | | |
| Sr. Notes, 7.875%, 2010 | | | | 390,000 | | 448,636 |
| Public Service Co. of Colorado, | | | | | | |
| First Mortgage, Ser. 12, 4.875%, 2013 | | | | 1,057,000 | | 1,081,056 |
| Sierra Pacific Power, | | | | | | |
| Mortgage Notes, 6.25%, 2012 | | | | 200,000 | | 206,500 |
| | | | | | | 3,502,406 |
| Environmental Control—.8% | | | | | | |
| Republic Services, | | | | | | |
| Notes, 6.086%, 2035 | | | | 700,000 e | | 739,200 |
| Waste Management: | | | | | | |
| Sr. Notes, 6.875%, 2009 | | | | 270,000 | | 292,561 |
| Sr. Notes, 7%, 2028 | | | | 525,000 | | 610,779 |
| | | | | | | 1,642,540 |
| Food & Beverages—.6% | | | | | | |
| Kroger, | | | | | | |
| Sr. Notes, 8%, 2029 | | | | 525,000 | | 662,417 |
| Safeway, | | | | | | |
| Debs., 7.25%, 2031 | | | | 375,000 | | 435,597 |
| Stater Brothers, | | | | | | |
| Sr. Notes, 8.125%, 2012 | | | | 195,000 | | 191,100 |
| | | | | | | 1,289,114 |
| Foreign Governmental—6.4% | | | | | | |
| Australia Government, | | | | | | |
| Bonds, Ser. 121, 5.25%, 2010 | | AUD | | 4,875,000 | | 3,730,826 |
STATEMENT OF INVESTMENTS (Unaudited) (continued)
| | | | | Principal | | | | |
| Bonds and Notes (continued) | | | | Amounta | | Value ($) |
| |
| |
| |
|
| Foreign Governmental (continued) | | | | | | | | |
| Banco Nacional de Desenvolvimento | | | | | | | | |
| Economico e Social, | | | | | | | | |
| Notes, 5.822%, 2008 | | | | 660,000 | | d | | 670,044 |
| Deutsche Bundesrepublik: | | | | | | | | |
| Bonds, Ser. 03, 4.75%, 2034 | | EUR | | 1,560,000 | | | | 2,252,658 |
| Bonds, Ser. 03, 4.5%, 2013 | | EUR | | 770,000 | | | | 1,033,791 |
| Bonds, Ser. 98, 4.125%, 2008 | | EUR | | 790,000 | | | | 1,009,201 |
| Export-Import Bank Of Korea, | | | | | | | | |
| Sr. Notes, 4.5%, 2009 | | | | 575,000 | | | | 577,713 |
| Russian Federation: | | | | | | | | |
| Bonds, 10%, 2007 | | | | 985,000 | | e | | 1,090,887 |
| Bonds, 12.75%, 2028 | | | | 840,000 | | | | 1,521,673 |
| South Africa Government, | | | | | | | | |
| Notes, 9.125%, 2009 | | | | 470,000 | | | | 546,375 |
| United Mexican States: | | | | | | | | |
| Notes, 6.625%, 2015 | | | | 1,230,000 | | f | | 1,356,690 |
| Notes, 9.875%, 2010 | | | | 300,000 | | | | 363,600 |
| | | | | | | | | 14,153,458 |
| Gaming & Lodging—1.0% | | | | | | | | |
| Harrah's Operating, | | | | | | | | |
| Sr. Notes, 8%, 2011 | | | | 380,000 | | | | 436,222 |
| MGM Mirage, | | | | | | | | |
| Sr. Notes, 6%, 2009 | | | | 205,000 | | | | 207,050 |
| Mohegan Tribal Gaming Authority, | | | | | | | | |
| Sr. Notes, 6.125%, 2013 | | | | 345,000 | | e | | 350,175 |
| Resorts International Hotel and Casino, | | | | | | |
| First Mortgage, 11.5%, 2009 | | | | 560,000 | | e | | 640,500 |
| Station Casinos, | | | | | | | | |
| Sr. Notes, 6%, 2012 | | | | 450,000 | | | | 459,000 |
| | | | | | | | | 2,092,947 |
| Health Care—.2% | | | | | | | | |
| American Home Products, | | | | | | | | |
| Notes, 6.7%, 2011 | | | | 325,000 | | d | | 363,642 |
| Medco Health Solutions, | | | | | | | | |
| Sr. Notes, 7.25%, 2013 | | | | 155,000 | | | | 174,755 |
| | | | | | | | | 538,397 |
| | | Principal | | |
| Bonds and Notes (continued) | | Amounta | | Value ($) |
| |
| |
|
| Manufacturing—.5% | | | | |
| Bombardier, | | | | |
| Notes, 6.3%, 2014 | | 780,000 e,f | | 709,800 |
| Tyco International, | | | | |
| Notes, 6%, 2013 | | 425,000 | | 462,948 |
| | | | | 1,172,748 |
| Media—1.5% | | | | |
| AOL Time Warner, | | | | |
| Notes, 6.75%, 2011 | | 480,000 | | 532,570 |
| British Sky Broadcasting, | | | | |
| Notes, 6.875%, 2009 | | 510,000 | | 549,110 |
| Clear Channel Communications, | | | | |
| Sr. Notes, 5%, 2012 | | 575,000 | | 544,579 |
| Comcast, | | | | |
| Notes, 5.5%, 2011 | | 530,000 | | 553,637 |
| News America, | | | | |
| Debs., 7.7%, 2025 | | 425,000 | | 515,860 |
| Univision Communications, | | | | |
| Sr. Notes, 7.85%, 2011 | | 560,000 | | 636,932 |
| | | | | 3,332,688 |
| Metals & Mining—.5% | | | | |
| International Steel, | | | | |
| Sr. Notes, 6.5%, 2014 | | 485,000 | | 468,025 |
| Ispat Inland, | | | | |
| Secured Notes, 9.75%, 2014 | | 115,000 | | 134,550 |
| Teck Cominco, | | | | |
| Notes, 7%, 2012 | | 500,000 | | 559,129 |
| | | | | 1,161,704 |
| Oil & Gas—1.4% | | | | |
| Amerada Hess: | | | | |
| Notes, 6.65%, 2011 | | 240,000 | | 264,434 |
| Notes, 7.3%, 2031 | | 405,000 | | 490,230 |
| Enterprise Products Operating, | | | | |
| Sr. Notes, Ser. B, 6.65%, 2034 | | 775,000 | | 853,730 |
| Halliburton, | | | | |
| Notes, 5.5%, 2010% | | 325,000 | | 341,227 |
STATEMENT OF INVESTMENTS (Unaudited) (continued)
| | | Principal | | |
| Bonds and Notes (continued) | | Amounta | | Value ($) |
| |
| |
|
| Oil & Gas (continued) | | | | |
| Oneok, | | | | |
| Sr. Notes, 5.2%, 2015 | | 225,000 | | 228,678 |
| PC Financial Partnership, | | | | |
| Notes, 5%, 2014 | | 440,000 | | 444,924 |
| XTO Energy, | | | | |
| Sr. Notes, 7.5%, 2012 | | 475,000 | | 547,058 |
| | | | | 3,170,281 |
| Packaging & Containers—.1% | | | | |
| Sealed Air, | | | | |
| Notes, 5.625%, 2013 | | 310,000 e | | 319,062 |
| Paper & Forest Products—1.3% | | | | |
| Celulosa Arauco y Constitucion SA: | | | | |
| Notes, 5.125%, 2013 | | 360,000 | | 357,226 |
| Notes, 5.625%, 2015 | | 170,000 e | | 173,979 |
| Georgia-Pacific: | | | | |
| Sr. Notes, 8%, 2014 | | 415,000 | | 479,325 |
| Sr. Notes, 8.875%, 2010 | | 365,000 | | 416,100 |
| International Paper, | | | | |
| Notes, 5.3%, 2015 | | 565,000 | | 567,725 |
| Sappi Papier, | | | | |
| Notes, 6.75%, 2012 | | 315,000 e | | 337,097 |
| Westvaco, | | | | |
| Debs., 7.95%, 2031 | | 250,000 | | 322,220 |
| Weyerhaeuser, | | | | |
| Debs., 7.375%, 2032 | | 245,000 | | 289,818 |
| | | | | 2,943,490 |
| Property-Casualty Insurance—1.4% | | |
| AON, | | | | |
| Capital Sec., 8.205%, 2027 | | 300,000 | | 352,405 |
| Ace Capital Trust II, | | | | |
| Bonds, 9.7%, 2030 | | 225,000 | | 311,402 |
| Assurant, | | | | |
| Sr. Notes, 6.75%, 2034 | | 400,000 | | 458,580 |
| Metlife, | | | | |
| Notes, 5%, 2015 | | 1,050,000 f | | 1,067,687 |
| North Front Pass-Through Trust, | | | | |
| Notes, 5.81%, 2024 | | 870,000 e | | 898,093 |
| | | | | 3,088,167 |
14
| | | Principal | | | | |
| Bonds and Notes (continued) | | Amounta | | Value ($) |
| |
| |
|
| Real Estate Investment Trust—2.3% | | | | | | |
| Archstone-Smith Operating Trust, | | | | | | |
| Notes, 5.25%, 2015 | | 425,000 | | | | 434,628 |
| Arden Realty, | | | | | | |
| Notes, 5.25%, 2015 | | 350,000 | | | | 353,006 |
| Boston Properties, | | | | | | |
| Sr. Notes, 5%, 2015 | | 470,000 | | | | 470,788 |
| Duke Realty, | | | | | | |
| Sr. Notes, 5.875%, 2012 | | 1,250,000 | | | | 1,323,806 |
| EOP Operating, | | | | | | |
| Sr. Notes, 7%, 2011 | | 595,000 | | | | 660,594 |
| ERP Operating, | | | | | | |
| Notes, 5.25%, 2014 | | 560,000 | | | | 572,542 |
| Healthcare Realty Trust, | | | | | | |
| Sr. Notes, 5.125%, 2014 | | 475,000 | | | | 470,429 |
| Mack-Cali Realty, | | | | | | |
| Notes, 5.05%, 2010 | | 225,000 | | | | 228,041 |
| Simon Property, | | | | | | |
| Notes, 4.875%, 2010 | | 550,000 | | | | 556,384 |
| | | | | | | 5,070,218 |
| Residential Mortgage Pass-Through Ctfs.—3.5% | | | | |
| Countrywide Alternative Loan Trust II, | | | | | | |
| Ser. 2005-J4, Cl. A1B, 3.43%, 2035 | | 775,000 | | d | | 775,000 |
| First Horizon Alternative Mortgage Securities I, | | | | |
| Ser. 2004-FA1, Cl. A1, 6.25%, 2034 | | 3,804,801 | | | | 3,922,057 |
| Nomura Asset Acceptance: | | | | | | |
| Ser. 2005-WF1, CL. 2A5, 5.159%, 2035 | | 475,000 | | | | 482,477 |
| Ser. 2005-AP2, Cl. A5, 4.976%, 2035 | | 425,000 | | | | 432,504 |
| Structured Adjustable Rate Mortgage Loan Trust, | | | | |
| Ser. 2005-8XS, Cl. A1, 3.41%, 2035 | | 1,464,064 | | d | | 1,464,064 |
| Washington Mutual, | | | | | | |
| Ser. 2005-AR4, Cl. A4B, 4.684%, 2035 | | 575,000 | | d | | 575,809 |
| | | | | | | 7,651,911 |
| Retail—.3% | | | | | | |
| May Department Stores, | | | | | | |
| Notes, 6.65%, 2024 | | 575,000 | | | | 634,702 |
| Structured Index—1.0% | | | | | | |
| AB Svensk Exportkredit, | | | | | | |
| GSNE-ER Indexed Notes, 0%, 2007 | | 2,275,000 | | e,g | | 2,123,713 |
The Portfolio 15
STATEMENT OF INVESTMENTS (Unaudited) (continued)
| | | Principal | | |
| Bonds and Notes (continued) | | Amounta | | Value ($) |
| |
| |
|
| Technology—.1% | | | | |
| Freescale Semiconductor, | | | | |
| Sr. Notes, 6.875%, 2011 | | 160,000 | | 170,400 |
| Telecommunications—2.0% | | | | |
| AT&T Wireless Services, | | | | |
| Sr. Notes, 8.75%, 2031 | | 235,000 | | 330,403 |
| Alltel, | | | | |
| Notes, 4.656%, 2007 | | 280,000 | | 282,321 |
| Deutsche Telekom International Finance, | | |
| Bonds, 8.75%, 2030 | | 635,000 d | | 862,447 |
| France Telecom, | | | | |
| Notes, 8%, 2011 | | 275,000 d | | 319,502 |
| Nextel Communications, | | | | |
| Sr. Notes, 5.95%, 2014 | | 505,000 | | 527,094 |
| SBC Communications, | | | | |
| Notes, 5.625%, 2016 | | 315,000 | | 332,814 |
| Sprint Capital, | | | | |
| Notes, 8.75%, 2032 | | 800,000 | | 1,116,370 |
| Verizon Global Funding, | | | | |
| Notes, 7.75%, 2032 | | 520,000 | | 676,815 |
| | | | | 4,447,766 |
| Transportation—.2% | | | | |
| Ryder System, | | | | |
| Bonds, 5%, 2012 | | 325,000 | | 325,736 |
| U.S. Government—36.7% | | | | |
| U.S. Treasury Bonds, | | | | |
| 6.25%, 5/15/2031 | | 2,710,000 | | 3,530,723 |
| U.S. Treasury Notes: | | | | |
| 1.625%, 9/30/2005 | | 150,000 h | | 149,478 |
| 2%, 8/31/2005 | | 41,000,000 | | 40,931,120 |
| 2.25%, 2/15/2007 | | 555,000 | | 543,267 |
| 3.375%, 2/28/20076 | | 8,060,000 | | 8,027,260 |
| 3.375%, 9/15/2009 | | 6,580,000 | | 6,493,901 |
| 3.625%, 4/30/2007 | | 16,465,000 | | 16,461,048 |
| 4.25%, 8/15/2013 | | 4,555,000 | | 4,670,301 |
| | | | | 80,807,098 |
| U.S. Government Agencies/Mortgage Backed—29.9% | | |
| Federal Home Loan Mortgage Corp.: | | | | |
| Ser. 2586, Cl. WE, 4%, 12/15/2032 | | 1,411,707 | | 1,369,258 |
| (Interest Only Obligation) | | | | |
| Ser. 2764, Cl. IT, 5%, 6/15/2027 | | 7,390,400 i | | 1,379,551 |
16
| | | Principal | | |
| Bonds and Notes (continued) | | Amounta | | Value ($) |
| |
| |
|
| U.S. Government Agencies/ | | | | |
| Mortgage Backed (continued) | | | | |
| Federal National Mortgage Association: | | | | |
| 4%, 5/10/2010 | | 1,278,211 | | 1,263,423 |
| 4.5% | | 8,850,000 j | | 8,811,237 |
| 5% | | 20,325,000 j | | 20,386,548 |
| 5.5% | | 6,475,000 j | | 6,646,976 |
| 5.5%, 9/1/2034 | | 5,526,976 | | 5,607,579 |
| 6% | | 6,625,000 j | | 6,812,152 |
| 6%, 9/1/2034 | | 824,324 | | 845,662 |
| 7%, 6/1/2029-9/1/2029 | | 275,871 | | 291,215 |
| Government National Mortgage Association I: | | | | |
| 5.5%, 4/15/2033-3/15/2034 | | 7,306,621 | | 7,472,141 |
| 6%, 2/15/2029-2/15/2033 | | 2,554,760 | | 2,638,871 |
| Project Loan, | | | | |
| 8%, 9/15/2008 | | 44,545 | | 45,409 |
| Ser. 2004-39, Cl. LC, 5.5%, 12/20/2029 | | 1,000,000 | | 1,034,304 |
| Ser. 2005-29, Cl. A, 4.016%, 7/16/2027 | | 514,907 | | 509,475 |
| Ser, 2005-32, Cl. B, 4.385%, 8/16/2030 | | 675,000 | | 675,250 |
| Government National Mortgage Association II: | | | | |
| 7%, 9/20/2028-7/20209 | | 35,704 | | 37,683 |
| | | | | 65,826,734 |
| Total Bonds and Notes | | | | |
| (cost $258,447,140) | | | | 259,072,857 |
| |
| |
|
| |
| | | Face Amount | | |
| | | Covered by | | |
| Options—.0% | | Contracts ($) | | Value ($) |
| |
| |
|
| Call Options—.0% | | | | |
| Dow Jones CDX.NA.IG.4 | | | | |
| September 2005 @ .575 | | 5,000,000 | | 7,500 |
| U.S. Treasury Notes, 4%, 2/15/2015 | | | | |
| August 2005 @ 98.453125 | | 2,175,000 | | 43,369 |
| U.S. Treasury Notes, 4.125%, 2/15/2015 | | | | |
| August 2005 @ 101.328125 | | 2,175,000 | | 21,598 |
| | | | | 72,467 |
| Put Options—.0% | | | | |
| U.S. Treasury Notes, 4.125%, 5/15/2015 | | | | |
| August 2005 @ 99.578125 | | 2,175,000 | | 6,185 |
| Total Options | | | | |
| (cost $84,965) | | | | 78,652 |
The Portfolio 17
STATEMENT OF INVESTMENTS (Unaudited) (continued)
| Other Investments—2.0% | | Shares | | Value ($) |
| |
| |
|
| Registered Investment Company; | | | | |
| Dreyfus Institutional Preferred Plus Money Market Fund | | |
| (cost $4,322,000) | | 4,322,000 k | | 4,322,000 |
| |
| |
|
| |
| Investment of Cash Collateral | | | | |
| for Securities Loaned—1.6% | | Shares | | Value ($) |
| |
| |
|
| Registered Investment Company; | | | | |
| Dreyfus Institutional Cash Advantage Fund | | | | |
| (cost $3,452,850) | | 3,452,850 k | | 3,452,850 |
| |
| |
|
| Total Investment (cost $266,306,955) | | 121.2% | | 266,926,359 |
| Liabilities, Less Cash and Receivables | | (21.2%) | | (46,650,657) |
| Net Assets | | 100.0% | | 220,275,702 |
| a Principal amount stated in U.S. Dollars unless otherwised noted. |
| AUD—Austrialian Dollars |
| EUR—Euros |
| b The value of this security has been determined in good faith under the direction of the Board of Trustees. |
| c Non-incoming producing—security in default. |
| d Variable rate security—interest rate subject to periodic change. |
| e Securities exempt from registration under rule 144A of the Securities Act of 1933.These securities may be resold in |
| transactions exempt from registration, normally to qualified institutional buyers. At June 30, 2005, these securities |
| amounted to $16,780,565 or 7.6% of net assets. |
| f All or a portion of these securities are on loan. At June 30, 2005, the total market value of the portfolio's securities |
| on loan is $3,350,663 and the total market value of the collateral held by the portfolio is $3,452,850. |
| g Security linked to Goldman Sachs Non Energy—Excess Return Index. |
| h Held by a broker as collateral for open financial futures position. |
| i Notional face amount shown. |
| j Purchased on a forward commitment basis. |
| k Investments in affiliated money market mutual funds. |
| Portfolio Summary (Unaudited) † | | | | |
| |
| Value (%) | | | | Value (%) |
| |
| |
|
| U.S. Government & Agencies | | 66.6 | | Structured Index | | 1.0 |
| Corporate Bonds | | 28.1 | | Futures/Options/Swaps/Foreign | | |
| Asset/Mortgage Backed | | 15.5 | | Currency Exchange Contracts | | .1 |
| Foreign/Governmental | | 6.4 | | | | |
| Short Term/Money Markets Investments | | 3.6 | | | | 121.3 |
| |
| † Based on net assets. | | | | | | |
| See notes to financial statements. | | | | | | |
18
STATEMENT OF FINANCIAL FUTURES
June 30, 2005 (Unaudited)
| | | | | Market Value | | | | Unrealized |
| | | | | Covered by | | | | Appreciation |
| | | Contracts | | Contracts ($) | | Expiration | | at 6/30/2005 ($) |
| |
| |
| |
| |
|
| Financial Futures Long | | | | | | | | |
| U.S. Treasury 5 Year Notes | | 75 | | 8,166,797 | | September 2005 | | 31,641 |
| U.S. Treasury 30 Year Bonds | | 40 | | 4,750,000 | | September 2005 | | 101,562 |
| | | | | | | | | 133,203 |
See notes to financial statements.
|
STATEMENT OF OPTIONS WRITTEN
June 30, 2005 (Unaudited)
| | | Face Amount | | |
| | | Covered by | | |
| Issuer | | Contracts | | Value ($) |
| |
| |
|
| Call Options: | | | | |
| Dow Jones CDX.NA.IG.4 | | | | |
| September 2005 @ .52 | | 10,000,000 | | 8,000 |
| U.S. Treasury Notes, 4%, 2/15/2015 | | | | |
| August 2005 @ 100 | | 4,350,000 | | 39,237 |
| U.S. Treasury Notes, 4.125%, 5/15/2015 | | | | |
| August 2005 @ 102.859375 | | 4,350,000 | | 18,618 |
| Put Options; | | | | |
| U.S. Treasury Notes, 4.125%, 5/15/2015 | | | | |
| August 2005 @ 97.9375 | | 4,350,000 | | 3,398 |
| (Premuims received $84,964) | | | | 69,253 |
See notes to financial statements.
|
STATEMENT OF ASSETS AND LIABILITIES
June 30, 2005 (Unaudited)
| | | Cost | | Value |
| |
| |
|
| Assets ($): | | | | |
| Investments in securities—See Statement | | | | |
| of Investments (including securities on loan, | | |
| valued at $3,350,663)—Note 1(c): | | | | |
| Unaffiliated issuers | | 258,532,105 | | 259,151,509 |
| Affiliated issuers | | 7,774,850 | | 7,774,850 |
| Cash denominated in foreign currencies | | 27 | | 27 |
| Dividends and interest receivable | | | | 2,245,741 |
| Receivable for investment securities sold | | | | 1,986,567 |
| Unrealized appreciation on swaps—Note 4 | | | | 64,189 |
| Receivable for futures variation margin—Note 4 | | 35,469 |
| Unrealized appreciation on forward | | | | |
| currency exchange contracts—Note 4 | | | | 13,813 |
| Receivable from broker for swap transactions—Note 4 | | 19,210 |
| Receivable for shares of Beneficial Interest subscribed | | 4,990 |
| | | | | 271,296,365 |
| |
| |
|
| Liabilities ($): | | | | |
| Due to The Dreyfus Corporation and affiliates—Note 3(b) | | 118,347 |
| Payable for investment securities purchased | | 45,091,038 |
| Liability for securities on loan—Note 1(c) | | | | 3,452,850 |
| Cash overdraft due to Custodian | | | | 1,901,026 |
| Unrealized depreciation on swaps—Note 4 | | | | 344,638 |
| Outstanding options written, at value (premiums | | |
| received $84,964)—See Statement of Options Written | | 69,253 |
| Payable for shares of Beneficial Interest redeemed | | 14,213 |
| Accrued expenses and other liabilities | | | | 29,298 |
| | | | | 51,020,663 |
| |
| |
|
| Net Assets ($) | | | | 220,275,702 |
| |
| |
|
| Composition of Net Assets ($): | | | | |
| Paid-in capital | | | | 219,736,349 |
| Accumulated undistributed investment income—net | | 441,814 |
| Accumulated net realized gain (loss) on investments | | (401,890) |
| Accumulated net unrealized appreciation (depreciation) | | |
| on investments (including $133,203 net unrealized | | |
| appreciation on financial futures) | | | | 499,429 |
| |
| |
|
| Net Assets ($) | | | | 220,275,702 |
| |
| |
|
| |
| |
| Net Asset Value Per Share | | | | |
| | | Initial Shares | | Service Shares |
| |
| |
|
| Net Assets ($) | | 168,569,307 | | 51,706,395 |
| Shares Outstanding | | 14,670,081 | | 4,513,063 |
| |
| |
|
| Net Asset Value Per Share ($) | | 11.49 | | 11.46 |
See notes to financial statements.
20
|
STATEMENT OF OPERATIONS
Six Month Ended June 30, 2005 (Unaudited)
|
| Investment Income ($): | | |
| Income: | | |
| Interest | | 4,136,524 |
| Dividends; | | |
| Affiliated issuers | | 131,485 |
| Income from securities lending | | 6,461 |
| Total Income | | 4,274,470 |
| Expenses: | | |
| Investment advisory fee—Note 3(a) | | 717,722 |
| Distribution fees—Note 3(b) | | 66,525 |
| Custodian fees—Note 3(b) | | 39,102 |
| Prospectus and shareholders' reports | | 33,249 |
| Professional fees | | 21,168 |
| Trustees' fees and expenses—Note 3(c) | | 12,590 |
| Shareholder servicing costs—Note 3(b) | | 3,190 |
| Miscellaneous | | 18,039 |
| Total Expenses | | 911,585 |
| Less—reduction in investment advisory | | |
| fee due to undertaking—Note 3 | | (165,628) |
| Net Expenses | | 745,957 |
| Investment Income—Net | | 3,528,513 |
| |
|
| Realized and Unrealized Gain (Loss) on Investments—Note 4 ($): |
| Net realized gain (loss) on investments and foreign currency transactions | | 2,784,281 |
| Net realized gain (loss) on options transactions | | 42,216 |
| Net realized gain (loss) on financial futures | | 178,125 |
| Net realized gain (loss) on swap transactions | | 16,197 |
| Net realized gain (loss) on forward currency exchange contracts | | 285,747 |
| Net Realized Gain (Loss) | | 3,306,566 |
| Net unrealized appreciation (depreciation) on investments, | | |
| foreign currency transactions, options and swap transactions | | |
| (including $131,140 net unrealized appreciation on financial futures) | | (2,029,856) |
| Net Realized and Unrealized Gain (Loss) on Investments | | 1,276,710 |
| Net Increase in Net Assets Resulting from Operations | | 4,805,223 |
See notes to financial statements.
|
STATEMENT OF CHANGES IN NET ASSETS
| | | Six Months Ended | | |
| | | June 30, 2005 | | Year Ended |
| | | (Unaudited) | | December 31, 2004 |
| |
| |
|
| Operations ($): | | | | |
| Investment income—net | | 3,528,513 | | 7,298,267 |
| Net realized gain (loss) on investments | | 3,306,566 | | (66,428) |
| Net unrealized appreciation | | | | |
| (depreciation) on investments | | (2,029,856) | | 516,522 |
| Net Increase (Decrease) in Net Assets | | | | |
| Resulting from Operations | | 4,805,223 | | 7,748,361 |
| |
| |
|
| Dividends to Shareholders from ($): | | | | |
| Investment income—net: | | | | |
| Initial shares | | (2,621,955) | | (6,897,830) |
| Service shares | | (774,179) | | (2,194,224) |
| Total Dividends | | (3,396,134) | | (9,092,054) |
| |
| |
|
| Beneficial Interest Transactions ($): | | | | |
| Net proceeds from shares sold: | | | | |
| Initial shares | | 8,845,807 | | 31,181,952 |
| Service shares | | 911,215 | | 5,024,349 |
| Dividends reinvested: | | | | |
| Initial shares | | 2,621,955 | | 6,897,830 |
| Service shares | | 774,179 | | 2,194,224 |
| Cost of shares redeemed: | | | | |
| Initial shares | | (15,406,270) | | (39,389,257) |
| Service shares | | (5,889,293) | | (11,650,522) |
| Increase (Decrease) in Net Assets from | | | | |
| Beneficial Interest Transactions | | (8,142,407) | | (5,741,424) |
| Total Increase (Decrease) in Net Assets | | (6,733,318) | | (7,085,117) |
| |
| |
|
| Net Assets ($): | | | | |
| Beginning of Period | | 227,009,020 | | 234,094,137 |
| End of Period | | 220,275,702 | | 227,009,020 |
| Undistributed investment income—net | | 441,814 | | 309,435 |
| | | Six Months Ended | | |
| | | June 30, 2005 | | Year Ended |
| | | (Unaudited) | | December 31, 2004 |
| |
| |
|
| Capital Share Transactions: | | | | |
| Initial Shares | | | | |
| Shares sold | | 776,463 | | 2,799,550 |
| Shares issued for dividends reinvested | | 230,404 | | 611,686 |
| Shares redeemed | | (1,354,113) | | (3,478,459) |
| Net Increase (Decrease) in Shares Outstanding | | (347,246) | | (67,223) |
| |
| |
|
| Service Shares | | | | |
| Shares sold | | 80,449 | | 444,035 |
| Shares issued for dividends reinvested | | 68,203 | | 195,075 |
| Shares redeemed | | (518,608) | | (1,033,241) |
| Net Increase (Decrease) in Shares Outstanding | | (369,956) | | (394,131) |
See notes to financial statements.
|
The following tables describe the performance for each share class for the fiscal periods indicated. All information (except portfolio turnover rate) reflects financial results for a single portfolio share.Total return shows how much your investment in the portfolio would have increased (or decreased) during each period, assuming you had reinvested all dividends and distributions.These figures have been derived from the portfolio's financial statements.
| Six Months Ended | | | | | | | | | | |
| June 30, 2005 | | | | Year Ended December 31, | | |
| |
| |
| |
|
| Initial Shares | | (Unaudited) | | 2004 | | 2003 a | | 2002 | | 2001 b | | 2000 |
| |
| |
| |
| |
| |
| |
|
| Per Share Data ($): | | | | | | | | | | | | |
| Net asset value, | | | | | | | | | | | | |
| beginning of period | | 11.42 | | 11.50 | | 11.65 | | 11.37 | | 11.39 | | 10.89 |
| Investment Operations: | | | | | | | | | | | | |
| Investment income—net | | .18c | | .37c | | .35c | | .54c | | .65c | | .68 |
| Net realized and unrealized | | | | | | | | | | | | |
| gain (loss) on investments | | .11 | | .01 | | .21 | | .32 | | .10 | | .50 |
| Total from Investment Operations | | .29 | | .38 | | .56 | | .86 | | .75 | | 1.18 |
| Distributions: | | | | | | | | | | | | |
| Dividends from | | | | | | | | | | | | |
| investment income—net | | (.22) | | (.46) | | (.46) | | (.58) | | (.69) | | (.68) |
| Dividends from net realized | | | | | | | | | | | | |
| gain on investments | | — | | — | | (.25) | | — | | (.08) | | — |
| Total Distributions | | (.22) | | (.46) | | (.71) | | (.58) | | (.77) | | (.68) |
| Net asset value, end of period | | 11.49 | | 11.42 | | 11.50 | | 11.65 | | 11.37 | | 11.39 |
| |
| |
| |
| |
| |
| |
|
| Total Return (%) | | 2.28d | | 3.37 | | 4.94 | | 7.76 | | 6.69 | | 11.20 |
| | | Six Months Ended | | | | | | | | | | |
| | | June 30, 2005 | | | | Year Ended December 31, | | |
| | | |
| |
| |
|
| Initial Shares (continued) | | (Unaudited) | | 2004 | | 2003 a | | 2002 | | 2001 b | | 2000 |
| |
| |
| |
| |
| |
| |
|
| Ratios/Supplemental Data (%): | | | | | | | | | | |
| Ratio of total expenses | | | | | | | | | | | | |
| to average net assets | | .77e | | .74 | | .74 | | .72 | | .75 | | .72 |
| Ratio of net expenses | | | | | | | | | | | | |
| to average net assets | | .62e | | .74 | | .74 | | .72 | | .75 | | .72 |
| Ratio of net investment income | | | | | | | | | | |
| to average net assets | | 3.25e | | 3.30 | | 2.96 | | 4.70 | | 5.57 | | 6.12 |
| Portfolio Turnover Rate | | 280.53d,f 819.75f | | 898.18f | | 877.87 | | 1,105.61 | | 917.75 |
| |
| |
| |
| |
| |
|
| Net Assets, end of period | | | | | | | | | | | | |
| ($ x 1,000) | | 168,569 | | 171,424 | | 173,534 | | 194,519 | | 191,089 | | 148,885 |
| a | | As of January 1, 2004, the portfolio has adopted the method of accounting for interim payments on swap contracts in |
| | | accordance with Financial Accounting Standards Board Statement No. 133.These interim payments are reflected |
| | | within net realized and unrealized gain (loss) on swap contracts, however, prior to January 1, 2004, these interim |
| | | payments were reflected within interest income/expense in the Statement of Operations.The effect of this change for |
| | | the period ended December 31, 2004, was to increase net investment income per share by $.01, decrease net realized |
| | | and unrealized gain (loss) on investments per share by less than $.01 and increase the ratio of net investment income |
| | | to average net assets from 3.28% to 3.30%. Per share data and ratios/supplemental data for periods prior to |
| | | January 1, 2004 have not been restated to reflect these changes in presentation. |
| b | | As required, effective January 1, 2001, the portfolio has adopted the provisions of the AICPA Audit and Accounting |
| | | Guide for Investment Companies and began accreting discount or amortizing premium on fixed income securities on a |
| | | scientific basis and including paydown gains and losses in interest income.The effect of this change for the period |
| | | ended December 31, 2001, was to decrease net investment income per share by $.04, increase net realized and |
| | | unrealized gain (loss) on investments per share by $.04 and decrease the ratio of net investment income to average net |
| | | assets from 5.91% to 5.57%. Per share data and ratios/supplemental data for periods prior to January 1, 2001 |
| | | have not been restated to reflect this change in presentation. |
| c | | Based on average shares outstanding at each month end. |
| d | | Not annualized. |
| e | | Annualized. |
| f | | The portfolio turnover rates excluding mortgage dollar roll transactions for the six months ended June 30, 2005, years |
| | | ended December 31, 2004 and December 31, 2003, were 201.01%, 761.92% and 755.08%, respectively. |
| See notes to financial statements. |
The Portfolio 25
FINANCIAL HIGHLIGHTS (continued)
|
| Six Months Ended | | | | | | | | | | |
| June 30, 2005 | | | | Year Ended December 31, | | |
| |
| |
| |
|
| Service Shares | | (Unaudited) | | 2004 a | | 2003 | | 2002 | | 2001 b | | 2000 c |
| |
| |
| |
| |
| |
| |
|
| Per Share Data ($): | | | | | | | | | | | | |
| Net asset value, | | | | | | | | | | | | |
| beginning of period | | 11.38 | | 11.48 | | 11.62 | | 11.35 | | 11.39 | | 11.39 |
| Investment Operations: | | | | | | | | | | | | |
| Investment income—net | | .17d | | .35d | | .31d | | .50d | | .58d | | — |
| Net realized and unrealized | | | | | | | | | | | | |
| gain (loss) on investments | | .11 | | (.01) | | .24 | | .32 | | .14 | | — |
| Total from Investment Operations | | .28 | | .34 | | .55 | | .82 | | .72 | | — |
| Distributions: | | | | | | | | | | | | |
| Dividends from investment | | | | | | | | | | | | |
| income—net | | (.20) | | (.44) | | (.44) | | (.55) | | (.68) | | — |
| Dividends from net realized | | | | | | | | | | | | |
| gain on investments | | — | | — | | (.25) | | — | | (.08) | | — |
| Total Distributions | | (.20) | | (.44) | | (.69) | | (.55) | | (.76) | | — |
| Net asset value, end of period | | 11.46 | | 11.38 | | 11.48 | | 11.62 | | 11.35 | | 11.39 |
| |
| |
| |
| |
| |
| |
|
| Total Return (%) | | 2.17e | | 3.05 | | 4.78 | | 7.47 | | 6.37 | | — |
| Six Months Ended | | | | | | | | | | |
| | | June 30, 2005 | | | | Year Ended December 31, | | |
| | | |
| |
| |
|
| Service Shares (continued) | | (Unaudited) | | 2004 a | | 2003 | | 2002 | | 2001 b | | 2000 c |
| |
| |
| |
| |
| |
| |
|
| Ratios/Supplemental Data (%): | | | | | | | | | | |
| Ratio of total expenses | | | | | | | | | | | | |
| to average net assets | | 1.01f | | .99 | | .99 | | .97 | | 1.01 | | — |
| Ratio of net expenses | | | | | | | | | | | | |
| to average net assets | | .86f | | .99 | | .99 | | .97 | | 1.01 | | — |
| Ratio of net investment income | | | | | | | | | | |
| to average net assets | | 3.01f | | 3.06 | | 2.66 | | 4.39 | | 5.24 | | — |
| Portfolio Turnover Rate | | 280.53e,g 819.75g | | 898.18g | | 877.87 | | 1,105.61 | | 917.75 |
| |
| |
| |
| |
| |
|
| Net Assets, end of period | | | | | | | | | | | | |
| ($ x 1,000) | | 51,706 | | 55,585 | | 60,561 | | 57,966 | | 23,431 | | 1 |
| a | | As of January 1, 2004, the portfolio has adopted the method of accounting for interim payments on swap contracts in |
| | | accordance with Financial Accounting Standards Board Statement No. 133.These interim payments are reflected |
| | | within net realized and unrealized gain (loss) on swap contracts, however, prior to January 1, 2004, these interim |
| | | payments were reflected within interest income/expense in the Statement of Operations.The effect of this change for |
| | | the period ended December 31, 2004, was to increase net investment income per share by $.01, decrease net realized |
| | | and unrealized gain (loss) on investments per share by $.01 and increase the ratio of net investment income to |
| | | average net assets from 3.03% to 3.06%. Per share data and ratios/supplemental data for periods prior to January |
| | | 1, 2004 have not been restated to reflect these changes in presentation. |
| b | | As required, effective January1, 2001, the portfolio has adopted the provisions of the AICPA Audit and Accounting |
| | | Guide for Investment Companies and began accreting discount or amortizing premium on fixed income securities on a |
| | | scientific basis and including paydown gains and losses in interest income.The effect of this change for the period |
| | | ended December 31, 2001, was to decrease net investment income per share by $.03, increase net realized and |
| | | unrealized gain (loss) on investments per share by $.03 and decrease the ratio of net investment income to average net |
| | | assets from 5.57% to 5.24%. Per share data and ratios/supplemental data for periods prior to January 1, 2001 |
| | | have not been restated to reflect these changes in presentation. |
| c | | The portfolio commenced offering Service shares on December 31, 2000. |
| d | | Based on average shares outstanding at each month end. |
| e | | Not annualized. |
| f | | Annualized. |
| g | | The portfolio turnover rates excluding mortgage dollar roll transactions for the six months ended June 30, 2005, years |
| | | ended December 31, 2004 and December 31, 2003, were 201.01%, 761.92% and 755.08%, respectively. |
| See notes to financial statements. |
NOTES TO FINANCIAL STATEMENTS (Unaudited)
NOTE 1—Significant Accounting Policies:
Dreyfus Variable Investment Fund (the "fund") is registered under the Investment Company Act of 1940, as amended (the "Act"), as an open-end management investment company, operating as a series company currently offering twelve series, including the Quality Bond Portfolio (the "portfolio"). The portfolio is only offered to separate accounts established by insurance companies to fund variable annuity contracts and variable life insurance policies.The portfolio is a diversified series.The portfolio's investment objective will be to maximize total return, consisting of capital appreciation and current income.The Dreyfus Corporation (the "Manager" or "Dreyfus") serves as the portfolio's investment adviser.The Manager is a wholly-owned subsidiary of Mellon Financial Corporation ("Mellon Financial").
Dreyfus Service Corporation (the "Distributor"), a wholly-owned subsidiary of the Manager, is the distributor of the portfolio's shares, which are sold without a sales charge.The portfolio is authorized to issue an unlimited number of $.001 par value shares of Beneficial Interest in each of the following classes of shares: Initial and Service. Each class of shares has identical rights and privileges, except with respect to the distribution plan and the expenses borne by each class and certain voting rights. Income, expenses (other than expenses attributable to a specific class), and realized and unrealized gains or losses on investments are allocated to each class of shares based on its relative net assets.
The fund accounts separately for the assets, liabilities and operations of each series. Expenses directly attributable to each series are charged to that series' operations, expenses which are applicable to all series are allocated among them on a pro rata basis.
The portfolio's financial statements are prepared in accordance with U.S. generally accepted accounting principles, which may require the use of management estimates and assumptions.Actual results could differ from those estimates.
The fund enters into contracts that contain a variety of indemnifica-tions.The portfolio's maximum exposure under these arrangements is
unknown. The portfolio does not anticipate recognizing any loss related to these arrangements.
(a) Portfolio valuation: Investments in securities (excluding short-term investments (other than U.S. Treasury Bills), financial futures, options, swap transactions and forward currency exchange contracts) are valued each business day by an independent pricing service (the "Service") approved by the Board of Trustees. Investments for which quoted bid prices are readily available and are representative of the bid side of the market in the judgment of the Service are valued at the mean between the quoted bid prices (as obtained by the Service from dealers in such securities) and asked prices (as calculated by the Service based upon its evaluation of the market for such securities). Other investments (which constitute a majority of the portfolio's securities) are valued as determined by the Service, based on methods which include consideration of: yields or prices of securities of comparable quality, coupon, maturity and type; indications as to values from dealers; and general market conditions. Securities for which there are no such valuations are valued at fair value as determined in good faith under the direction of the Board of Trustees. Restricted securities, as well as securities or other assets for which recent market quotations are not readily available, not valued by a pricing service approved by the Board of Trustees, or determined by the fund not to reflect accurately fair value (such as when an event occurs after the close of the exchange on which the security is principally traded and that is determined by the fund to have changed the value of the security), are valued at fair value as determined in good faith under the direction of the Board of Trustees. The factors that may be considered when fair valuing a security include fundamental analytical data, the nature and duration of restrictions on disposition, an evaluation of the forces that influence the market in which the securities are purchased and sold, and public trading in similar securities of the issuer or comparable issuers. Short-term investments, excluding U.S. Treasury Bills, are carried at amortized cost, which approximates value. Investments in registered investment companies are valued at their net asset value. Financial futures and options, which are traded on an
NOTES TO FINANCIAL STATEMENTS (Unaudited) (continued)
exchange, are valued at the last sales price on the securities exchange on which such securities are primarily traded or at the last sales price on the national securities market on each business day. Options traded over-the-counter are priced at the mean between the bid prices and asked prices. Swap transactions are valued daily based upon future cash flows and other factors, such as interest rates and underlying securities. Investments denominated in foreign currencies are translated to U.S. dollars at the prevailing rates of exchange. Forward currency exchange contracts are valued at the forward rate.
(b) Foreign currency transactions: The portfolio does not isolate that portion of the results of operations resulting from changes in foreign exchange rates on investments from the fluctuations arising from changes in the market prices of securities held. Such fluctuations are included with the net realized and unrealized gain or loss on investments.
Net realized foreign exchange gains or losses arise from sales and maturities of short-term securities, sales of foreign currencies, currency gains or losses realized on securities transactions and the difference between the amounts of dividends, interest and foreign withholding taxes recorded on the portfolios' books and the U.S. dollar equivalent of the amounts actually received or paid. Net unrealized foreign exchange gains and losses arise from changes in the value of assets and liabilities other than investments in securities, resulting from changes in exchange rates. Such gains and losses are included with net realized and unrealized gain or loss on investments.
(c) Securities transactions and investment income: Securities transactions are recorded on a trade date basis. Realized gain and loss from securities transactions are recorded on the identified cost basis. Dividend income is recognized on the ex-dividend date and interest income, including, where applicable, accretion of discount and amortization of premium on investments, is recognized on the accrual basis.
The portfolio has an arrangement with the custodian bank whereby the portfolio receives earnings credits from the custodian when positive cash balances are maintained, which are used to offset custody fees.
For financial reporting purposes, the portfolio includes net earnings credits, if any, as an expense offset in the Statement of Operations.
Pursuant to a securities lending agreement with Mellon Bank, N.A., an affiliate of the Manager, the portfolio may lend securities to qualified institutions.At origination, all loans are secured by collateral of at least 102% of the value of U.S. securities loaned and 105% of the value of foreign securities loaned. Collateral equivalent to at least 100% of the market value of securities on loan will be maintained at all times. Cash collateral is invested in certain money market mutual funds managed by the Manager. The portfolio will be entitled to receive all income on securities loaned, in addition to income earned as a result of the lending transaction. Although each security loaned is fully collateralized, the fund would bear the risk of delay in recovery of, or loss of rights in, the securities loaned should a borrower fail to return the securities in a timely manner.
(d) Affiliated issuers: Investments in other investment companies advised by the Manager are defined as "affiliated" in the Act.
(e) Dividends to shareholders: Dividends are recorded on the ex-dividend date. Dividends from investment income-net are declared and paid monthly. Dividends from net realized capital gain, if any, are normally declared and paid annually, but the portfolio may make distributions on a more frequent basis to comply with the distribution requirements of the Internal Revenue Code of 1986, as amended (the "Code").To the extent that net realized capital gain can be offset by capital loss carryovers, if any, it is the policy of the portfolio not to distribute such gain. Income and capital gain distributions are determined in accordance with income tax regulations, which may differ from U.S. generally accepted accounting principles.
On June 30, 2005, the Board of Trustees declared a cash dividend of .039 and .037 per share for the Initial Shares and Service Shares respectively, from undistributed investment income-net payable on July 1, 2005 (ex-dividend date) to shareholders of record as of the close of business on June 30, 2005.
NOTES TO FINANCIAL STATEMENTS (Unaudited) (continued)
(f) Federal income taxes: It is the policy of the portfolio to continue to qualify as a regulated investment company, if such qualification is in the best interests of its shareholders, by complying with the applicable provisions of the Code, and to make distributions of taxable income sufficient to relieve it from substantially all federal income and excise taxes.
The portfolio has an unused capital loss carryover of $3,149,141 available to be applied against future net securities profits, if any, realized subsequent to December 31, 2004, if not applied, the carryover expires in fiscal 2012.
The tax character of distributions paid to shareholders during the fiscal year ended December 31, 2004, was as follows: ordinary income $9,092,054. The tax character of current year distributions will be determined at the end of the current fiscal year.
NOTE 2—Bank Lines of Credit:
|
The portfolio may borrow up to $10 million for leveraging purposes under a short-term unsecured line of credit and participates with other Dreyfus-managed funds in a $100 million unsecured line of credit primarily to be utilized for temporary or emergency purposes, including the financing of redemptions. Interest is charged to the portfolio based on prevailing market rates in effect at the time of borrowings. During the period ended June 30, 2005, the portfolio did not borrow under the Facility.
NOTE 3—Investment Advisory Fee and Other Transactions With Affiliates:
(a) Pursuant to an Investment Advisory Agreement with the Manager, the investment advisory fee is computed at the annual rate of .65 of 1% of the value of the portfolio's average daily net assets and is payable monthly. The Manager has agreed from January 1, 2005 until December 31, 2005 to waive receipt of a portion of the portfolio's management fee, in the amount of .15 of 1% of the value of the portfolio's average net assets.
(b) Under the Distribution Plan (the "Plan") adopted pursuant to Rule 12b-1 under the Act, Service shares pay the Distributor for distributing
their shares, for servicing and/or maintaining Service shares shareholder accounts and for advertising and marketing for Service shares.The Plan provides for payments to be made at an annual rate of .25 of 1% of the value of the Service shares' average daily net assets.The Distributor may make payments to Participating Insurance Companies and to brokers and dealers acting as principal underwriter for their variable insurance products.The fees payable under the Plan are payable without regard to actual expenses incurred. During the period ended June 30, 2005, Service shares were charged $66,525 pursuant to the Plan.
The portfolio compensates Dreyfus Transfer, Inc., a wholly-owned subsidiary of the Manager, under a transfer agency agreement for providing personnel and facilities to perform transfer agency services for the portfolio. During the period ended June 30, 2005, the portfolio was charged $223 pursuant to the transfer agency agreement.
The portfolio compensates Mellon Bank, N.A., an affiliate of the Manager, under a custody agreement to provide custodial services for the portfolio. During the period ended June 30, 2005, the portfolio was charged $39,102 pursuant to the custody agreement.
During the period ended June 30, 2005, the fund was charged $1,998 for services performed by the Chief Compliance Officer.
The components of Due to The Dreyfus Corporation and affiliates in the Statement of Assets and Liabilities consist of: investment advisory fees $117,806, Rule 12b-1 distribution plan fees $10,756, custodian fees $15,261, chief compliance officer fees $1,998 and transfer agency per account fees $66, which are offset against an expense reimbursement currently in effect in the amount of $27,540.
(c) Each Board member also serves as a Board member of other funds within the Dreyfus complex. Annual retainer fees and attendance fees are allocated to each fund based on net assets.
(d) Pursuant to an exemptive order from the Securities and Exchange Commission, the portfolio may invest its available cash balances in affiliated money market mutual funds. Management fees of the underlying money market mutual funds have been waived by the Manager.
NOTES TO FINANCIAL STATEMENTS (Unaudited) (continued)
NOTE 4—Securities Transactions:
|
The aggregate amount of purchases and sales (including paydowns) of investment securities, excluding short-term securities, financial futures, forward currency exchange contracts, options transactions and swap transactions, during the period ended June 30, 2005, amounted to $697,024,951 and $637,432,194, respectively, of which $180,343,149 in purchases and $180,684,590 in sales were from dollar roll transactions.
A mortgage dollar roll transaction involves a sale by the portfolio of mortgage related securities that it holds with an agreement by the portfolio to repurchase similar securities at an agreed upon price and date.The securities purchased will bear the same interest rate as those sold, but generally will be collateralized by pools of mortgages with different prepayment histories than those securities sold.
The portfolio may invest in financial futures contracts in order to gain exposure to or protect against changes in the market.The portfolio is exposed to market risk as a result of changes in the value of the underlying financial instruments. Investments in financial futures require the portfolio to "mark to market" on a daily basis, which reflects the change in market value of the contracts at the close of each day's trading. Accordingly, variation margin payments are received or made to reflect daily unrealized gains or losses.When the contracts are closed, the portfolio recognizes a realized gain or loss. These investments require initial margin deposits with a broker, which consist of cash or cash equivalents. The amount of these deposits is determined by the exchange or Board of Trade on which the contract is traded and is subject to change. Contracts open at June 30, 2005, are set forth in the Statement of Financial Futures.
The portfolio may purchase and write (sell) put and call options in order to gain exposure to or to protect against changes in the market.
As a writer of call options, the portfolio receives a premium at the outset and then bears the market risk of unfavorable changes in the price of the financial instrument underlying the option. Generally, the port-
folio would incur a gain, to the extent of the premium, if the price of the underlying financial instrument decreases between the date the option is written and the date on which the option is terminated. Generally, the portfolio would realize a loss, if the price of the financial instrument increases between those dates.
As a writer of put options, the portfolio receives a premium at the outset and then bears the market risk of unfavorable changes in the price of the financial instrument underlying the option. Generally, the portfolio would incur a gain, to the extent of the premium, if the price of the underlying financial instrument increases between the date the option is written and the date on which the option is terminated. Generally, the portfolio would realize a loss, if the price of the financial instrument decreases between those dates.The following summarizes the portfolio's call/put options written for the period ended June 30, 2005.
| | | Face Amount | | | | Options Terminated |
| | | | | |
|
| | | Covered by | | Premiums | | | | Net Realized |
| Options Written: | | Contracts ($) | | Received ($) | | Cost ($) | | Gain ($) |
| |
| |
| |
| |
|
| Contracts outstanding | | | | | | | | |
| December 31, 2004 | | 25,785,000 | | 326,625 | | | | |
| Contracts written | | 32,400,000 | | 142,257 | | | | |
| Contracts terminated: | | | | | | | | |
| Contracts closed | | 30,235,000 | | 350,613 | | 569,423 | | (218,810) |
| Contracts expired | | 4,900,000 | | 33,305 | | — | | 33,305 |
| Total contracts | | | | | | | | |
| terminated | | 35,135,000 | | 383,918 | | 569,423 | | (185,505) |
| Contracts outstanding | | | | | | |
| June 30, 2005 | | 23,050,000 | | 84,964 | | | | |
The portfolio may enter into forward currency exchange contracts in order to hedge its exposure to changes in foreign currency exchange rates on its foreign portfolio holdings and to settle foreign currency transactions.When executing forward currency exchange contracts, the portfolio is obligated to buy or sell a foreign currency at a specified rate on a certain date in the future.With respect to sales of forward currency exchange contracts, the portfolio would incur a loss if the value of the contract increases between the date the forward contract is opened and the date the forward contract is closed.The portfolio realizes a gain if
NOTES TO FINANCIAL STATEMENTS (Unaudited) (continued)
the value of the contract decreases between those dates.With respect to purchases of forward currency exchange contracts, the portfolio would incur a loss if the value of the contract decreases between the date the forward contract is opened and the date the forward contract is closed. The portfolio realizes a gain if the value of the contract increases between those dates.The portfolio is also exposed to credit risk associated with counterparty nonperformance on these forward currency exchange contracts which is typically limited to the unrealized gain on each open contract.The following summarizes open forward currency exchange contracts at June 30, 2005
| | | Foreign | | | | | | Unrealized |
| Forward Currency | | Currency | | | | | | Appreciation |
| Exchange Contracts | | Amounts | | Cost ($) | | Value ($) | | (Depreciation) ($) |
| |
| |
| |
| |
|
| Sales: | | | | | | | | |
| Australian Dollar, | | | | | | | | |
| expiring 9/21/2005 | | 4,880,000 | | 3,692,696 | | 3,699,040 | | 6,344 |
| Euro, | | | | | | | | |
| expiring 9/21/2005 | | 3,490,000 | | 4,235,115 | | 4,242,584 | | 7,469 |
| Total | | | | | | | | 13,813 |
The portfolio may enter into swap agreements to exchange the interest rate on, or return generated by, one nominal instrument for the return generated by another nominal instrument.
As of January 1, 2004, the portfolio has adopted the method of accounting for interim payments on swap contracts in accordance with Financial Accounting Standards Board Statement No. 133.The portfolio accrues for the interim payments on swap contracts on a daily basis, with the net amount recorded within unrealized appreciation (depreciation) of swap contracts in the Statement of Assets and Liabilities. Once the interim payments are settled in cash, the net amount is recorded as realized gain (loss) on swaps, in addition to realized gain (loss) recorded upon the termination of swap contracts in the Statement of Operations. Prior to January 1, 2004, these interim payments were reflected within interest income in the Statement of Operations. Fluctuations in the value of swap contracts are recorded as a component of net change in unrealized appreciation (depreciation) on investments.
Credit default swaps involve commitments to pay a fixed interest rate in exchange for payment if a credit event affecting a third party (the referenced company) occurs. Credit events may include a failure to pay interest or principal, bankruptcy, or restructuring. For those credit default swaps in which the fund is receiving a fixed rate, the fund is providing credits protection on the underlying instrument.The maximum payouts for these contracts are limited to the notional amount of each swap. The following summarizes credit default swaps entered into by the portfolio at June 30, 2005:
| | | | | Unrealized |
| | | | | Appreciation |
| Notional Amount ($) Description | | (Depreciation) ($) |
| |
|
| 192,000 | | Agreement with Bear Stearns terminating | | 578 |
| June 20, 2010 to receive a fixed rate |
| of 1.2% and pay the notional amount |
| as a result of interest payment default |
| | | totaling $1,000,000 or principal payment default | | |
| of $10,000,000 on Altria, 7%, 11/4/2013 |
| 519,000 | | Agreement with Bear Stearns terminating | | (1,107) |
| June 20, 2010 to receive a fixed rate |
| of .27% and pay the notional amount |
| as a result of interest payment default |
| totaling $1,000,000 or principal payment |
| | | default of $10,000,000 on Berkshire | | |
| | | Hathaway, 4.125%, 1/15/2010 | | |
| 888,000 | | Agreement with UBS terminating | | (729) |
| June 20, 2010 to receive a fixed rate |
| of .28% and pay the notional amount |
| as a result of interest payment default |
| totaling $1,000,000 or principal payment |
| | | default of $10,000,000 on Berkshire | | |
| | | Hathaway, 4.85%, 1/15/2015 | | |
| 778,000 | | Agreement with Bear Stearns terminating | | 458 |
| June 20, 2010 to receive a fixed rate |
| of .33% and pay the notional amount |
| as a result of interest payment default |
| totaling $1,000,000 or principal payment |
| | | default of $10,000,000 on Berkshire | | |
| | | Hathaway, 4.125%, 1/15/2010 | | |
| 760,000 | | Agreement with Morgan Stanley terminating | | (10,407) |
| | | June 20,2010 to pay a fixed rate of | | |
| .685% and receive the notional amount |
| | | as a result of interest payment default totaling | | |
| | | $1,000,000 or principal payment default of | | |
| $10,000,000 on Dow Jones CDX.NA.IG.4 |
The Portfolio 37
NOTES TO FINANCIAL STATEMENTS (Unaudited) (continued)
| | | | | Unrealized |
| | | | | Appreciation |
| Notional Amount ($) | | Description | | (Depreciation) ($) |
| |
| |
|
| 760,000 | | Agreement with Citigroup terminating | | (9,732) |
| | | June 20, 2010 to pay a fixed rate | | |
| of .685% and receive the notional amount |
| as a result of interest payment default totaling | | |
| $1,000,000 or principal payment default of | | |
| $10,000,000 on Dow Jones CDX.NA.IG.4 |
| 1,100,000 | | Agreement with UBS terminating | | (2,182) |
| June 20, 2010 to receive a fixed rate |
| of .78% and pay the notional amount |
| as a result of interest payment default totaling | | |
| $1,000,000 or principal payment default |
| of $10,000,000 on MBIA 6.625%, 10/1/2028 | | |
| 519,000 | | Agreement with JP Morgan terminating | | 1,813 |
| | | June 20, 2010 to pay a fixed rate of | | |
| .30% and receive the notional amount |
| as a result of interest payment default |
| | | totaling $1,000,000 or principal | | |
| | | payment default of $10,000,000 on | | |
| | | St. Paul Cos., 6.38%, 12/15/2008 | | |
| 888,000 | | Agreement with UBS terminating | | 2,708 |
| | | June 20, 2010 to pay a fixed rate of | | |
| .31% and receive the notional amount |
| as a result of interest payment default |
| | | totaling $1,000,000 or principal | | |
| | | payment default of $10,000,000 on | | |
| | | St. Paul Cos., 8.125%, 4/15/2010 | | |
| 778,000 | | Agreement with Bear Stearns terminating | | 582 |
| | | June 20, 2010 to pay a fixed rate of | | |
| .37% and receive the notional amount |
| as a result of interest payment default |
| totaling $1,000,000 or principal payment |
| | | default of $10,000,000 on | | |
| | | St. Paul Cos., 6.38%, 12/15/2008 | | |
| 1,120,000 | | Agreement with Citigroup terminating | | (22,766) |
| | | to receive a fixed rate of .53% and | | |
| | | pay the notional amount as a result | | |
| | | of interest payment default totaling | | |
| | | $1,000,000 or principal payment | | |
| | | default of $10,000,000 on | | |
| | | Washington Mutual, 4%, 1/15/2009 | | |
| Total | | | | (40,784) |
The fund may enter into interest rate swaps which involve the exchange of commitments to pay and receive interest based on a notional princi-
pal amount.The following summarizes interest rate swaps entered into by the fund at June 30, 2005:
| | | | | Unrealized |
| | | | | Appreciation |
| Notional Amount ($) | | Description | | (Depreciation) ($) |
| |
| |
|
| 10,899,000 | | Interest Rate Swap Agreement with | | 58,050 |
| | | Merrill Lynch terminating May 15, | | |
| | | 2008 to pay 3 month LIBOR and | | |
| | | receive a fixed rate of 4.1725% | | |
| 10,899,000 | | Interest Rate Swap Agreement with | | (297,715) |
| | | Merrill Lynch terminating May 13, | | |
| | | 2015 to receive 3 month LIBOR and | | |
| | | pay a fixed rate of 4.6425% | | |
| | | | | (239,665) |
Risks may arise upon entering into these agreements from the potential inability of the counterparties to meet the terms of the agreement and are generally limited to the amount of net payments to be received, if any, at the date of default.
At June 30, 2005, accumulated net unrealized appreciation on investments was $619,404, consisting of $1,670,434 gross unrealized appreciation and $1,051,030 gross unrealized depreciation.
At June 30,2005,the cost of investments for federal income tax purposes was substantially the same as the cost for financial reporting purposes (see the Statement of Investments).
In early 2004, two purported class and derivative actions were filed against Mellon Financial, Mellon Bank, N.A., Dreyfus, Founders Asset Management LLC, and certain directors of the Dreyfus Funds and the Dreyfus Founders Funds (together, the "Funds") in the United States District Court for the Western District of Pennsylvania. In September 2004, plaintiffs served a Consolidated Amended Complaint (the "Amended Complaint") on behalf of a purported class of all persons who acquired interests in any of the Funds between January 30, 1999
NOTES TO FINANCIAL STATEMENTS (Unaudited) (continued)
and November 17, 2003, and derivatively on behalf of the Funds.The Amended Complaint in the newly styled In re Dreyfus Mutual Funds Fee Litigation also named the Distributor, Premier Mutual Fund Services, Inc. and two additional Fund directors as defendants and alleges violations of the Investment Company Act of 1940, the Investment Advisers Act of 1940, the Pennsylvania Unfair Trade Practices and Consumer Protection Law and common-law claims. Plaintiffs seek to recover allegedly improper and excessive Rule 12b-1 and advisory fees allegedly charged to the Funds for marketing and distribution services. More specifically, plaintiffs claim, among other things, that 12b-1 fees and directed brokerage were improperly used to pay brokers to recommend the Funds over other funds, and that such payments were not disclosed to investors. In addition, plaintiffs assert that economies of scale and soft-dollar benefits were not passed on to the Funds. Plaintiffs further allege that 12b-1 fees were improperly charged to certain of the Funds that were closed to new investors.The Amended Complaint seeks compensatory and punitive damages, rescission of the advisory contracts, and an accounting and restitution of any unlawful fees, as well as an award of attorneys' fees and litigation expenses. As noted, some of the claims in this litigation are asserted derivatively on behalf of the Funds that have been named as nominal defendants. With respect to such derivative claims, no relief is sought against the Funds. Dreyfus believes the allegations to be totally without merit and intends to defend the action vigorously. In November 2004, all named defendants moved to dismiss the Amended Complaint in the whole or substantial part. Briefing was completed in May 2005.
Additional lawsuits arising out of these circumstances and presenting similar allegations and requests for relief may be filed against the defendants in the future. Neither Dreyfus nor the Funds believe that any of the pending actions will have a material adverse effect on the Funds or Dreyfus' ability to perform its contract with the Funds.
INFORMATION ABOUT THE REVIEW
AND APPROVAL OF THE PORTFOLIO'S
I N V E S T M E N T A DV I S O RY A G R E E M E N T (Unaudited)
|
At separate meetings of the Board of Trustees for the fund held on June 8-9, 2005, the Board considered the re-approval, through its annual renewal date of July 31, 2006, of the Investment Advisory Agreement with the Manager for the portfolio, pursuant to which the Manager provides the portfolio with investment advisory and administrative services. The Board members who are not "interested persons" (as defined in the Act (the "Independent Trustees")) of the portfolio were assisted in their review by independent legal counsel and met with counsel in executive session separate from representatives of the Manager.
Analysis of Nature, Extent and Quality of Services Provided to the Portfolio. The Board members received a presentation from representatives of the Manager regarding services provided to the portfolio and other funds in the Dreyfus fund complex, and discussed the nature, extent and quality of the services provided to the portfolio pursuant to its Investment Advisory Agreement. The Manager's representatives reviewed the portfolio's distribution of accounts and the relationships the Manager has with various intermediaries and the different needs of each.The Board noted that the portfolio's shares were offered only to separate accounts established by insurance companies to fund variable annuity contracts and variable life insurance policies. The Manager's representatives noted the diversity of distribution among the funds in the Dreyfus complex, and the Manager's corresponding need for broad, deep, and diverse resources to be able to provide ongoing shareholder services to each distribution channel, including that of the portfolio. The Board also reviewed the number of shareholder accounts in the portfolio, as well as the portfolio's asset size.
The Board members also considered the Manager's research and portfolio management capabilities and that the Manager also provides oversight of day-to-day portfolio operations, including fund accounting and administration and assistance in meeting legal and regulatory requirements. The Board members also considered the Manager's extensive administrative, accounting and compliance infrastructure.
INFORMATION ABOUT THE REVIEW AND APPROVAL OF THE PORTFOLIO'S
INVESTMENT ADVISORY AGREEMENT (Unaudited) (continued)
|
Comparative Analysis of the Portfolio's Performance, Investment Advisory Fee and Expense Ratio. The Board members reviewed the portfolio's performance and expense ratios and placed significant emphasis on comparisons to a group of comparable funds and Lipper category averages, as applicable.The Board reviewed the portfolio's performance, investment advisory fee, and total expense ratios within these comparison groups and against the portfolio's Lipper category averages, as applicable.The groups of comparable funds were previously approved by the Board for this purpose, and were prepared using a Board-approved selection methodology that was based, in part, on selecting non-affiliated funds reported in the same Lipper category as the Fund. The Board members discussed the results of the comparisons and noted that the portfolio's long term income yield performance was below the comparison group and Lipper category averages, but that its more recent 1-year and 3-year income yield performance for its Initial shares generally ranked in the middle or in the top half of its comparison group. It was noted that the portfolio's longer term total return performance was below the averages of its comparison groups and its Lipper category, but that the portfolio's 1-year performance was above the averages of its comparison groups and Lipper category averages, and that the more recent 3-month and 4-month Initial shares total return performance showed improvement in its rankings.The Board members noted that the portfolio's portfolio management team changed in January 2005. The Board members also discussed the portfolio's expense ratio for each class of shares, noting that the current fee waiver and expense reimbursement arrangement undertaken by the Manager would cause the portfolio's expense ratio for its Initial shares to be lower than its Lipper category and closer to its comparison group average, and for its Service shares to be closer to its comparison group and Lipper category averages.They reviewed the range of management fees in the comparison groups and noted that the Manager's current fee waiver would have lowered the portfolio's investment advisory fee.
Representatives of the Manager reviewed with the Board members the fees paid to the Manager or its affiliates by mutual funds managed by the Manager or its affiliates with similar investment objectives, policies
and strategies as the portfolio (the "Similar Funds"), of which there was one, and explained the nature of the Similar Fund and any differences, from the Manager's perspective, in Management of such Similar Fund as compared to managing and providing services to the portfolio.There were no separate accounts managed by the Manager or its affiliates with similar investment objectives, policies and strategies as the portfolio.The Similar Fund was a mutual fund reported as a "corporate debt A rated" fund by Lipper. The Manager's representatives also reviewed the costs associated with distribution through intermediaries. It was noted that the Similar Fund had the same management fee as the fee borne by the portfolio, prior to giving effect to the current fee waiver. The Board members considered the relevance of the fee information provided for the Similar Fund managed by the Manager to evaluate the appropriateness and reasonableness of the portfolio's advisory fees.
Analysis of Profitability and Economies of Scale. The Manager's representatives reviewed the dollar amount of expenses allocated and profit received by the Manager and the method used to determine such expenses and profit. The Board received and considered information prepared by an independent consulting firm regarding Dreyfus' approach to allocating costs to, and determining the profitability of, individual funds and the entire Dreyfus mutual fund complex.The consulting firm also analyzed where any economies of scale might emerge as assets grow.The Board members evaluated the analysis in light of the relevant circumstances for the portfolio, including the increase in fund assets and the extent to which economies of scale would be realized as the portfolio continues to grow and whether fee levels reflect these economies of scale for the benefit of portfolio investors. The Board members also considered potential benefits to the Manager from acting as investment adviser and noted that there were no soft dollar arrangements with respect to trading the portfolio's portfolio.
It was noted that the Board members should consider the Manager's profitability with respect to the portfolio as part of their evaluation of whether the fee under the Investment Advisory Agreement bears a reasonable relationship to the mix of services provided by the Manager,
INFORMATION ABOUT THE REVIEW AND APPROVAL OF THE PORTFOLIO'S
INVESTMENT ADVISORY AGREEMENT (Unaudited) (continued)
|
including the nature, extent and quality of such services and that a discussion of economies of scale are predicated on increasing assets and that, if a fund's assets had been decreasing, the possibility that the Manager may have realized any economies of scale would be less. It also was noted that the profitability percentage for managing the portfolio was within ranges determined by appropriate court cases to be reasonable given the services rendered and given the portfolio's overall performance and generally superior service levels provided. It also was noted that the current undertaking to waive a portion of the portfolio's investment advisory fee had the potential to reduce the profitability for managing the portfolio over the period of the undertaking.
At the conclusion of these discussions, each of the Independent Trustees expressed the opinion that he or she had been furnished with sufficient information to make an informed business decision with respect to continuation of the fund's Investment Advisory Agreement with respect to the portfolio. Based on their discussions and considerations as described above, the Board made the following conclusions and determinations.
- The Board concluded that the nature, extent and quality of the ser- vices provided by the Manager are adequate and appropriate.
- The Board generally was satisfied with the portfolio's shorter-term income yield performance, the portfolio's improvement in its 1-year total return performance and the portfolio's more recent Initial shares short-term total return performance, as well as the Manager's change in the portfolio's portfolio management team in January 2005.
- The Board concluded that the fee paid by the portfolio to the Manager was reasonable in light of comparative performance and expense and advisory fee information, including the Manager's implementation of a partial fee waiver, costs of the services provided and profits to be realized and benefits derived or to be derived by the Manager from its relationship with the portfolio.
- The Board determined that, to the extent that material economies of scale had not been shared with the portfolio, the Board would seek to do so.
The Board members considered these conclusions and determinations, along with information received on a routine and regular basis throughout the year, and, without any one factor being dispositive, the Board determined that re-approval of the fund's Investment Advisory Agreement, with respect to the portfolio, was in the best interests of the portfolio and its shareholders.
| For More | | Information |
| |
|
| |
| Dreyfus Variable | | Transfer Agent & |
| Investment Fund, | | Dividend Disbursing Agent |
| Quality Bond Portfolio | | |
| | | Dreyfus Transfer, Inc. |
| 200 Park Avenue | | |
| | | 200 Park Avenue |
| New York, NY 10166 | | |
| | | New York, NY 10166 |
| |
| Investment Adviser | | Distributor |
| The Dreyfus Corporation | | |
| | | Dreyfus Service Corporation |
| 200 Park Avenue | | |
| | | 200 Park Avenue |
| New York, NY 10166 | | |
| | | New York, NY 10166 |
| Custodian | | |
| Mellon Bank, N.A. | | |
| One Mellon Bank Center | | |
| Pittsburgh, PA 15258 | | |
Telephone 1-800-554-4611 or 516-338-3300
Mail The Dreyfus Family of Funds, 144 Glenn Curtiss Boulevard, Uniondale, NY 11556-0144 Attn: Institutional Servicing
The portfolio files its complete schedule of portfolio holdings with the Securities and Exchange Commission ("SEC") for the first and third quarters of each fiscal year on Form N-Q. The portfolio's Forms N-Q are available on the SEC's website at http://www.sec.gov and may be reviewed and copied at the SEC's Public Reference Room in Washington, DC. Information on the operation of the Public Reference Room may be obtained by calling 1-800-SEC-0330.
A description of the policies and procedures that the portfolio uses to determine how to vote proxies relating to portfolio securities, and information regarding how the portfolio voted these proxies for the 12-month period ended June 30, 2005, is available at http://www.dreyfus.com and on the SEC's website at http://www.sec.gov. The description of the policies and procedures is also available without charge, upon request, by calling 1-800-645-6561.
© 2005 Dreyfus Service Corporation

| Dreyfus Variable |
| Investment Fund, |
| Small | | Company |
| Stock | | Portfolio |

The views expressed in this report reflect those of the portfolio manager only through the end of the period covered and do not necessarily represent the views of Dreyfus or any other person in the Dreyfus organization.Any such views are subject to change at any time based upon market or other conditions and Dreyfus disclaims any responsibility to update such views. These views may not be relied on as investment advice and, because investment decisions for a Dreyfus portfolio are based on numerous factors, may not be relied on as an indication of trading intent on behalf of any Dreyfus portfolio.
Not FDIC-Insured • Not Bank-Guaranteed • May Lose Value
| | | Contents |
| |
| | | T H E P O R T F O L I O |
| |
|
| 2 | | Letter from the Chairman |
| 3 | | Discussion of Performance |
| 6 | | Understanding Your Portfolio's Expenses |
| 6 | | Comparing Your Portfolio's Expenses |
| | | With Those of Other Funds |
| 7 | | Statement of Investments |
| 15 | | Statement of Assets and Liabilities |
| 16 | | Statement of Operations |
| 17 | | Statement of Changes in Net Assets |
| 19 | | Financial Highlights |
| 21 | | Notes to Financial Statements |
| 28 | | Information About the Review |
| and Approval of the Portfolio's |
| Investment Advisory Agreement |
| | | F O R M O R E I N F O R M AT I O N |
| |
|
| | | Back Cover |
| Dreyfus Variable Investment Fund, |
| Small Company Stock Portfolio |
The Portfolio

LETTER FROM THE CHAIRMAN
We are pleased to present this semiannual report for Dreyfus Variable Investment Fund, Small Company Stock Portfolio, covering the six-month period from January 1, 2005, through June 30, 2005. Inside, you'll find valuable information about how the portfolio was managed during the reporting period, including a discussion with the portfolio manager, Dwight Cowden.
On average, U.S. stock prices ended the first half of 2005 slightly lower than where they began, largely due to headwinds caused by higher energy prices, rising short-term interest rates and recent evidence of slower economic growth. While mid-cap stocks generally produced higher returns than large-cap stocks, and large-cap stocks generally outperformed small-cap stocks, these differences were relatively small. Conversely, value-oriented stocks continued to produce substantially better results than their more growth-oriented counterparts.
In some ways, market conditions at midyear remind us of those from one year ago, when stock prices languished due to economic and political concerns before rallying strongly later in the year. Currently, our economists expect the U.S. economy to continue to grow over the foreseeable future without significant new inflationary pressures, potentially setting the stage for better business conditions that could send stock prices higher.As always, we encourage you to discuss these and other matters with your financial advisor.
Thank you for your continued confidence and support.


DISCUSSION OF PERFORMANCE
Dwight Cowden, Portfolio Manager
How did Dreyfus Variable Investment Fund, Small Company Stock Portfolio perform relative to its benchmark?
For the six-month period ended June 30, 2005, the portfolio produced total returns of –2.01% for its Initial shares and –2.13% for its Service shares.1 This compares with a total return of 1.79% for the portfolio's benchmark, the S&P SmallCap 600 Index, for the same period.2
We attribute these results to rising interest rates, higher energy prices and concerns that economic growth might slow. Small-cap stocks produced slightly higher returns than their large-cap counterparts, delivering mild gains for the reporting period. However, high market volatility during the reporting period led to disappointing returns from some individual stocks, particularly in the technology and consumer discretionary areas, which caused the portfolio's returns to lag the benchmark.
What is the portfolio's investment approach?
The portfolio seeks capital appreciation.To pursue this goal, the portfolio normally invests at least 80% of its assets in the stocks of small-capitalization companies. Small-capitalization companies are generally new and often entrepreneurial companies with market capitalizations ranging from $100 million to $3 billion at the time of purchase. We may continue to hold the securities of companies as their market capitalization grows. Small-cap companies can, if successful, grow faster than larger-cap companies and typically use any profits for expansion rather than for paying dividends.
Stocks are chosen through a disciplined investment process that combines computer modeling techniques, fundamental analysis and risk management. In selecting securities, we use a computer model to identify and rank stocks within an industry or sector, based on several characteristics, including: value, or how a stock is priced relative to its perceived intrinsic worth; growth, in this case the sustainability or growth of earnings; and financial profile, which measures the financial health of the company.
DISCUSSION OF PERFORMANCE (continued)
|
We then use fundamental analysis and generally select what we believe are the most attractive of the higher-ranked securities and determine those issues that should be sold.We use a variety of sources, including internal as well as Wall Street research, and company management to stay abreast of current developments.We attempt to manage risk by diversifying across companies and industries, limiting the potential adverse impact from any one stock or industry.The portfolio is structured so that its sector weightings and risk characteristics, such as growth, size and yield, are generally similar to those of the S&P SmallCap 600 Index.
What other factors influenced the portfolio's performance?
Technology stocks accounted for over half of the portfolio's total relative underperformance, caused primarily by volatility in the semiconductor area. More than a half-dozen semiconductor holdings experienced double-digit declines during April when the companies issued disappointing earnings or earnings guidance. A few consumer discretionary stocks further contributed to the portfolio's underperformance compared to the benchmark. Women's clothing retailer Talbots and automotive parts retailer The Pep Boys lost ground due to disappointing same store sales comparisons, while pet supply retailer PETCO Animal Supplies announced weaker-than-anticipated sales results and a delay in financial statement filings.
On a more encouraging note, the portfolio's moderate emphasis on the energy sector contributed positively to returns.Although energy stocks faltered early in the reporting period due to a dip in oil prices, the sector regained its footing as oil prices surged above $60 per barrel by the end of June 2005.Top performers in the area included petroleum refiner Frontier Oil, as well as exploration and production companies, such as Energy Partners. The portfolio also delivered relatively strong returns in utilities, due to slightly overweighted exposure to this strong-performing sector and good individual stock selections. The portfolio received especially positive contributions to performance from UGI and CMS Energy.
What is the portfolio's current strategy?
Our quantitative model remains an important tool in the portfolio's stock selection process. Like most quantitative models, ours tends to work best during markets with identifiable trends as the model searches for companies with sustainable patterns of improving earnings growth and reasonable values.We have responded to recent difficulties in part by adding to our team's fundamental analytical expertise. We believe enhanced fundamental input will complement and improve upon the quantitative model's effectiveness.
In most market sectors, we have continued to maintain our generally sector-neutral investment strategy. Specifically, we have scaled back the portfolio's moderate emphasis on energy stocks. However, we recently have been adding to the portfolio's health care holdings, where we believe a number of companies in the products and service-providers areas offer favorable risk/reward characteristics.
| | | The portfolio is only available as a funding vehicle under various life insurance policies or variable |
| | | annuity contracts issued by insurance companies. Individuals may not purchase shares of the |
| | | portfolio directly. A variable annuity is an insurance contract issued by an insurance company that |
| | | enables investors to accumulate assets on a tax-deferred basis for retirement or other long-term |
| | | goals.The investment objective and policies of Dreyfus Variable Investment Fund, Small Company |
| | | Stock Portfolio made available through insurance products may be similar to other funds/portfolios |
| | | managed or advised by Dreyfus. However, the investment results of the portfolio may be higher or |
| | | lower than, and may not be comparable to, those of any other Dreyfus fund/portfolio. |
| 1 | | Total return includes reinvestment of dividends and any capital gains paid. Past performance is no |
| | | guarantee of future results. Share price and investment return fluctuate such that upon redemption, |
| | | portfolio shares may be worth more or less than their original cost.The portfolio's performance does |
| | | not reflect the deduction of additional charges and expenses imposed in connection with investing |
| | | in variable insurance contracts, which will reduce returns. |
| | | Part of the portfolio's recent performance is attributable to positive returns from its initial |
| | | public offering (IPO) investments. There can be no guarantee that IPOs will have or |
| | | continue to have a positive effect on the portfolio's performance. |
| 2 | | SOURCE: LIPPER INC. — Reflects reinvestment of dividends and, where applicable, capital |
| | | gain distributions.The Standard and Poor's SmallCap 600 Index is a widely accepted, |
| | | unmanaged index of small-cap stock market performance. |
UNDERSTANDING YOUR
PORTFOLIO'S EXPENSES (Unaudited)
|
As a mutual fund investor, you pay ongoing expenses, such as management fees and other expenses. Using the information below, you can estimate how these expenses affect your investment and compare them with the expenses of other funds.You also may pay one-time transaction expenses, including sales charges (loads) and redemption fees, which are not shown in this section and would have resulted in higher total expenses. For more information, see your portfolio's prospectus or talk to your financial adviser.
Review your portfolio's expenses
|
The table below shows the expenses you would have paid on a $1,000 investment in Dreyfus Variable Investment Fund, Small Company Stock Portfolio from January 1, 2005 to June 30, 2005. It also shows how much a $1,000 investment would be worth at the close of the period, assuming actual returns and expenses.
| Expenses and Value of a $1,000 Investment | | |
| assuming actual returns for the six months ended June 30, 2005 | | |
| | | Initial Shares | | Service Shares |
| |
| |
|
| Expenses paid per $1,000 † | | $ 5.01 | | $ 6.23 |
| Ending value (after expenses) | | $979.90 | | $978.70 |
COMPARING YOUR PORTFOLIO'S EXPENSES WITH THOSE OF OTHER FUNDS (Unaudited)
Using the SEC's method to compare expenses
The Securities and Exchange Commission (SEC) has established guidelines to help investors assess fund expenses. Per these guidelines, the table below shows your portfolio's expenses based on a $1,000 investment, assuming a hypothetical 5% annualized return. You can use this information to compare the ongoing expenses (but not transaction expenses or total cost) of investing in the portfolio with those of other funds. All mutual fund shareholder reports will provide this information to help you make this comparison. Please note that you cannot use this information to estimate your actual ending account balance and expenses paid during the period.
Expenses and Value of a $1,000 Investment assuming a hypothetical 5% annualized return for the six months ended June 30, 2005
| | | Initial Shares | | Service Shares |
| |
| |
|
| Expenses paid per $1,000 † | | $ 5.11 | | $ 6.36 |
| Ending value (after expenses) | | $1,019.74 | | $1,018.50 |
† Expenses are equal to the portfolio's annualized expense ratio of 1.02% for Initial shares and 1.27% for Service shares, multiplied by the average account value over the period, multiplied by 181/365 (to reflect the one-half year period).
STATEMENT OF INVESTMENTS
June 30, 2005 (Unaudited)
|
| Common Stocks—99.6% | | Shares | | | | Value ($) |
| |
| |
| |
|
| Consumer Cyclical—17.0% | | | | | | |
| Alaska Air Group | | 7,100 | | a | | 211,225 |
| AnnTaylor Stores | | 16,800 | | a | | 407,904 |
| CEC Entertainment | | 4,100 | | a | | 172,569 |
| CSK Auto | | 9,700 | | a | | 161,796 |
| Choice Hotels International | | 4,840 | | | | 317,988 |
| Coldwater Creek | | 9,700 | | a | | 241,627 |
| Finish Line, Cl. A | | 4,400 | | | | 83,248 |
| GameStop, Cl. A | | 5,800 | | a | | 189,718 |
| Guitar Center | | 2,700 | | a | | 157,599 |
| Hot Topic | | 4,000 | | a | | 76,480 |
| Jos. A. Bank Clothiers | | 5,300 | | a,b | | 229,490 |
| Linens ‘n Things | | 4,600 | | a | | 108,836 |
| Lone Star Steakhouse & Saloon | | 5,480 | | | | 166,647 |
| Marvel Enterprises | | 11,300 | | a | | 222,836 |
| Men's Wearhouse | | 6,500 | | a | | 223,795 |
| NBTY | | 5,230 | | a | | 135,666 |
| Oshkosh Truck | | 3,070 | | | | 240,320 |
| PETCO Animal Supplies | | 13,100 | | a | | 384,092 |
| P.F. Chang's China Bistro | | 2,300 | | a | | 135,654 |
| Panera Bread, Cl. A | | 2,700 | | a | | 167,629 |
| Polaris Industries | | 3,570 | | | | 192,780 |
| Quiksilver | | 38,300 | | a | | 612,034 |
| RARE Hospitality International | | 2,800 | | a | | 85,316 |
| SCP Pool | | 5,935 | | | | 208,259 |
| Shuffle Master | | 6,292 | | a,b | | 176,365 |
| Sonic | | 5,190 | | a | | 158,451 |
| Steak n Shake | | 10,510 | | a | | 195,696 |
| Stein Mart | | 10,400 | | | | 228,800 |
| Talbots | | 5,100 | | | | 165,597 |
| Tempur-Pedic International | | 7,700 | | a,b | | 170,786 |
| Toro | | 3,860 | | | | 149,035 |
| Tractor Supply | | 3,200 | | a | | 157,120 |
| Warnaco Group | | 10,100 | | a | | 234,825 |
| Wild Oats Markets | | 35,500 | | a,b | | 406,475 |
| Wolverine World Wide | | 12,085 | | | | 290,161 |
| Zale | | 4,520 | | a | | 143,239 |
| | | | | | | 7,610,058 |
STATEMENT OF INVESTMENTS (Unaudited) (continued)
| Common Stocks (continued) | | Shares | | Value ($) |
| |
| |
|
| Consumer Staples—3.6% | | | | |
| Corn Products International | | 12,200 | | 289,872 |
| Flowers Foods | | 3,700 | | 130,832 |
| Gymboree | | 13,110 a | | 179,083 |
| Loews-Carolina Group | | 13,100 | | 436,492 |
| Performance Food Group | | 13,476 a | | 407,110 |
| Tupperware | | 6,400 | | 149,568 |
| | | | | 1,592,957 |
| Energy—9.2% | | | | |
| AGL Resources | | 4,720 | | 182,428 |
| Cal Dive International | | 6,810 a | | 356,640 |
| Cimarex Energy | | 7,920 a | | 308,167 |
| Energen | | 10,660 | | 373,633 |
| Frontier Oil | | 13,140 | | 385,659 |
| Hydril | | 1,900 a | | 103,265 |
| New Jersey Resources | | 6,160 | | 297,220 |
| Piedmont Natural Gas | | 6,500 b | | 156,130 |
| Remington Oil & Gas | | 8,070 a | | 288,099 |
| St. Mary Land & Exploration | | 11,600 | | 336,168 |
| Southwestern Energy | | 6,240 a | | 293,155 |
| Stone Energy | | 2,500 a | | 122,250 |
| UGI | | 15,500 | | 432,450 |
| Unit | | 3,820 a | | 168,118 |
| Veritas DGC | | 6,000 a | | 166,440 |
| Vintage Petroleum | | 4,600 | | 140,162 |
| | | | | 4,109,984 |
| Health Care—13.6% | | | | |
| AMERIGROUP | | 4,220 a | | 169,644 |
| Abgenix | | 18,800 a,b | | 161,304 |
| American Healthways | | 3,000 a | | 126,810 |
| Amylin Pharmaceuticals | | 13,700 a,b | | 286,741 |
| Biosite | | 1,400 a | | 76,986 |
| CONMED | | 9,220 a | | 283,699 |
| Cooper Cos. | | 2,850 | | 173,451 |
| Diagnostic Products | | 2,480 | | 117,378 |
| Encysive Pharmaceuticals | | 20,800 a | | 224,848 |
| Haemonetics | | 2,140 a | | 86,970 |
8
| Common Stocks (continued) | | Shares | | Value ($) |
| |
| |
|
| Health Care (continued) | | | | |
| IDEXX Laboratories | | 6,320 a | | 393,926 |
| Immucor | | 3,800 a | | 110,010 |
| Invacare | | 2,600 | | 115,336 |
| Kindred Healthcare | | 6,100 a | | 241,621 |
| LCA-Vision | | 4,160 | | 201,594 |
| MGI Pharma | | 5,900 a | | 128,384 |
| Matria Healthcare | | 4,550 a | | 146,647 |
| Merit Medical Systems | | 1 a | | 15 |
| Owens & Minor | | 3,500 | | 113,225 |
| Pediatrix Medical Group | | 1,900 a | | 139,726 |
| Pharmaceutical Product Development | | 6,100 a | | 285,846 |
| Psychiatric Solutions | | 9,500 a | | 462,745 |
| ResMed | | 5,800 a | | 382,742 |
| Respironics | | 5,800 a | | 209,438 |
| Sierra Health Services | | 5,070 a | | 362,302 |
| Sybron Dental Specialties | | 7,700 a | | 289,674 |
| Symbion | | 7,040 a | | 167,904 |
| Syneron Medical | | 13,200 a | | 482,988 |
| United Surgical Partners International | | 3,000 a | | 156,240 |
| | | | | 6,098,194 |
| Interest Sensitive—14.8% | | | | |
| AmerUs Group | | 3,300 b | | 158,565 |
| Apollo Investment | | 9,141 | | 168,469 |
| Arch Capital Group | | 3,400 a | | 153,170 |
| BankUnited Financial, Cl. A | | 8,470 | | 229,029 |
| Capital Automotive | | 5,290 | | 201,919 |
| Centene | | 4,700 a | | 157,826 |
| Downey Financial | | 3,500 | | 256,200 |
| East West Bancorp | | 4,200 | | 141,078 |
| Endurance Specialty Holdings | | 3,900 | | 147,498 |
| Equity Inns | | 35,000 | | 465,500 |
| Equity One | | 10,360 | | 235,172 |
| Essex Property Trust | | 4,000 | | 332,240 |
| First Midwest Bancorp | | 5,860 | | 206,096 |
| First Niagara Financial Group | | 8,800 | | 128,304 |
| FirstFed Financial | | 1,170 a | | 69,744 |
The Portfolio 9
STATEMENT OF INVESTMENTS (Unaudited) (continued)
| Common Stocks (continued) | | Shares | | Value ($) |
| |
| |
|
| Interest Sensitive (continued) | | | | |
| Flagstar Bancorp | | 5,470 | | 103,547 |
| Fremont General | | 12,600 | | 306,558 |
| Horace Mann Educators | | 9,110 | | 171,450 |
| Hudson United Bancorp | | 3,570 | | 128,877 |
| La Quinta | | 37,650 a | | 351,274 |
| Max Re Capital | | 6,200 | | 141,980 |
| Nelnet, Cl. A | | 5,700 a | | 189,639 |
| New Century Financial | | 2,180 | | 112,161 |
| Ohio Casualty | | 7,200 | | 174,096 |
| Philadelphia Consolidated Holdings | | 2,400 a | | 203,424 |
| Phoenix Companies | | 12,800 b | | 152,320 |
| PrivateBancorp | | 6,600 | | 233,508 |
| Republic Bancorp | | 9,410 | | 140,962 |
| SVB Financial Group | | 4,500 a | | 215,550 |
| South Financial Group | | 5,100 | | 144,942 |
| Susquehanna Bancshares | | 4,500 | | 110,655 |
| UCBH Holdings | | 8,040 | | 130,570 |
| UICI | | 3,670 | | 109,256 |
| Umpqua Holdings | | 10,400 | | 244,816 |
| Wintrust Financial | | 3,730 | | 195,265 |
| | | | | 6,611,660 |
| Producer Goods & Services—20.2% | | | | |
| Actuant, Cl. A | | 5,200 a | | 249,288 |
| AptarGroup | | 4,120 | | 209,296 |
| Arkansas Best | | 2,400 | | 76,344 |
| Armor Holdings | | 2,560 a | | 101,402 |
| Brady, Cl. A | | 3,700 | | 114,700 |
| Briggs & Stratton | | 4,540 | | 157,175 |
| CLARCOR | | 9,700 | | 283,725 |
| Carpenter Technology | | 2,130 | | 110,334 |
| Cleveland-Cliffs | | 1,800 | | 103,968 |
| Commercial Metals | | 5,820 | | 138,632 |
| Curtiss-Wright | | 1,630 | | 87,939 |
| Engineered Support Systems | | 6,100 | | 218,563 |
| EnPro Industries | | 6,770 a | | 195,450 |
| Common Stocks (continued) | | Shares | | Value ($) |
| |
| |
|
| Producer Goods & Services (continued) | | | | |
| FMC | | 4,960 a | | 278,454 |
| Florida Rock Industries | | 3,700 | | 271,395 |
| GATX | | 5,000 | | 172,500 |
| Genlyte Group | | 4,800 a | | 233,952 |
| Georgia Gulf | | 3,010 | | 93,461 |
| H.B. Fuller | | 6,600 | | 224,796 |
| Headwaters | | 3,440 a,b | | 118,267 |
| Heartland Express | | 5,140 | | 99,870 |
| IDEX | | 4,100 | | 158,301 |
| Kansas City Southern | | 6,300 a | | 127,134 |
| Knight Transportation | | 4,100 | | 99,753 |
| Landstar System | | 5,360 a | | 161,443 |
| M.D.C. Holdings | | 3,170 | | 260,732 |
| Manitowoc | | 3,300 | | 135,366 |
| Massey Energy | | 10,800 | | 407,376 |
| Maverick Tube | | 7,400 a | | 220,520 |
| Meritage Homes | | 2,000 a | | 159,000 |
| Mueller Industries | | 4,900 | | 132,790 |
| NVR | | 500 a | | 405,000 |
| Olin | | 19,400 | | 353,856 |
| Overseas Shipholding Group | | 4,230 | | 252,319 |
| Pacer International | | 12,500 a | | 272,375 |
| Quanex | | 2,490 | | 131,995 |
| Reliance Steel & Aluminum | | 2,990 | | 110,839 |
| Simpson Manufacturing | | 3,000 | | 91,650 |
| Spectrum Brands | | 3,900 a | | 128,700 |
| Standard Pacific | | 2,930 | | 257,693 |
| Teledyne Technologies | | 9,810 a | | 319,610 |
| Thomas & Betts | | 4,640 a | | 131,034 |
| Timken | | 7,920 | | 182,952 |
| URS | | 3,590 a | | 134,087 |
| United Stationers | | 2,900 | | 142,390 |
| WCI Communities | | 14,000 a | | 448,420 |
| Watsco | | 6,070 | | 258,582 |
| | | | | 9,023,428 |
STATEMENT OF INVESTMENTS (Unaudited) (continued)
| Common Stocks (continued) | | Shares | | Value ($) |
| |
| |
|
| Services—7.9% | | | | |
| Allied Waste Industries | | 56,100 a | | 444,873 |
| Allscripts Healthcare Solutions | | 19,800 a,b | | 328,878 |
| CACI International, Cl. A | | 9,670 a | | 610,757 |
| Cerner | | 3,410 a,b | | 231,778 |
| Consolidated Graphics | | 3,200 a | | 130,464 |
| FactSet Research Systems | | 2,995 | | 107,341 |
| Global Payments | | 3,270 | | 221,706 |
| Healthcare Services Group | | 10,495 | | 210,740 |
| Kronos | | 3,700 a | | 149,443 |
| Labor Ready | | 15,650 a | | 364,801 |
| MICROS Systems | | 3,300 a | | 147,675 |
| Navigant Consulting | | 25,140 a | | 443,972 |
| Shaw Group | | 6,300 a | | 135,513 |
| | | | | 3,527,941 |
| Technology—12.0% | | | | |
| ANSYS | | 5,960 a | | 211,640 |
| Alamosa Holdings | | 16,100 a | | 223,790 |
| Anixter International | | 5,610 a | | 208,524 |
| Avid Technology | | 2,780 a | | 148,118 |
| Axcelis Technologies | | 22,600 a | | 155,036 |
| Benchmark Electronics | | 3,500 a | | 106,470 |
| Cognex | | 3,990 | | 104,498 |
| Coherent | | 3,000 a | | 108,030 |
| Cymer | | 3,300 a | | 86,955 |
| Cypress Semiconductor | | 7,300 a | | 91,907 |
| DSP Group | | 2,500 a | | 59,675 |
| Epicor Software | | 13,000 a | | 171,600 |
| Esterline Technologies | | 3,930 a | | 157,514 |
| FLIR Systems | | 6,600 a | | 196,944 |
| FileNET | | 3,600 a | | 90,504 |
| Hutchinson Technology | | 2,500 a | | 96,275 |
| Hyperion Solutions | | 3,600 a | | 144,864 |
| Internet Security Systems | | 3,800 a | | 77,102 |
| j2 Global Communications | | 3,990 a,b | | 137,416 |
| MIPS Technologies | | 29,800 a | | 214,560 |
| Common Stocks (continued) | | Shares | | Value ($) |
| |
| |
|
| Technology (continued) | | | | |
| Macromedia | | 4,600 a | | 175,812 |
| Mercury Computer Systems | | 4,820 a | | 131,923 |
| Micrel | | 9,400 a | | 108,288 |
| Microsemi | | 5,200 a | | 97,760 |
| NETGEAR | | 5,700 a | | 106,020 |
| Packeteer | | 15,500 a | | 218,550 |
| Power Integrations | | 2,900 a | | 62,553 |
| Progress Software | | 3,400 a | | 102,510 |
| Roper Industries | | 3,500 | | 249,795 |
| Skyworks Solutions | | 11,700 a | | 86,229 |
| Symbol Technologies | | 14,940 | | 147,458 |
| THQ | | 3,700 a | | 108,299 |
| Take-Two Interactive Software | | 5,870 a,b | | 149,391 |
| Trimble Navigation | | 5,800 a | | 226,026 |
| Varian Semiconductor | | | | |
| Equipment Associates | | 8,000 a | | 296,000 |
| Verint Systems | | 3,400 a | | 109,344 |
| Websense | | 3,900 a | | 187,395 |
| | | | | 5,354,775 |
| Utilities—1.3% | | | | |
| ALLETE | | 2,200 | | 109,780 |
| Alaska Communications Systems Group | | 21,800 b | | 216,038 |
| CMS Energy | | 10,500 a | | 158,130 |
| Cleco | | 4,130 | | 89,084 |
| | | | | 573,032 |
| Total Common Stocks | | | | |
| (cost $36,608,326) | | | | 44,502,029 |
| |
| |
|
| | | Principal | | |
| Short-Term Investments—.6% | | Amount ($) | | Value ($) |
| |
| |
|
| Repurchase Agreement; | | | | |
| Greenwich Capital Markets, Tri-Party Repurchase | | |
| Agreement, 2.9%, dated 6/30/2005, due 7/1/2005 | | |
| in the amount of $240,019 (fully collateralized by | | |
| $250,000 Federal Home Loan Bank, 2.05%, | | |
| 7/21/2006, value $247,796) | | | | |
| (cost $240,000) | | 240,000 | | 240,000 |
STATEMENT OF INVESTMENTS (Unaudited) (continued)
| Investment of Cash Collateral | | | | |
| for Securities Loaned—7.0% | | Shares | | Value ($) |
| |
| |
|
| Registered Investment Company; | | | | |
| Dreyfus Institutional Cash Advantage Plus Fund | | |
| (cost $3,139,578) | | | | 3,139,578 c | | 3,139,578 |
| |
| |
| |
|
| |
| Total Investments (cost $39,987,904) | | 107.2% | | 47,881,607 |
| Liabilities, Less Cash and Receivables | | (7.2%) | | (3,199,648) |
| Net Assets | | | | 100.0% | | 44,681,959 |
| |
| a | | Non-income producing. | | | | | | |
| b | | All or a portion of these securities are on loan. At June 30, 2005, the total market value of the portfolio's securities |
| | | on loan is $2,972,176 and the total market value of the collateral held by the portfolio is $3,139,578. |
| c | | Investment in affiliated money market mutual fund. | | | | |
| |
| |
| |
|
| |
| |
| |
| Portfolio Summary (Unaudited) † | | | | |
| | | | | Value (%) | | | | Value (%) |
| |
| |
| |
| |
|
| Producer Goods & Services | | 20.2 | | Energy | | 9.2 |
| Consumer Cyclical | | 17.0 | | Services | | 7.9 |
| Interest Sensitive | | 14.8 | | Short-Term/Money Market Investments 7.6 |
| Health Care | | 13.6 | | Other | | 4.9 |
| Technology | | 12.0 | | | | 107.2 |
| |
| † | | Based on net assets. | | | | | | |
| See notes to financial statements. | | | | | | |
STATEMENT OF ASSETS AND LIABILITIES
June 30, 2005 (Unaudited)
| | | Cost | | Value |
| |
| |
|
| Assets ($): | | | | |
| Investments in securities—See Statement | | | | |
| of Investments (including securities on loan, | | |
| valued at $2,972,176)—Note 1(b): | | | | |
| Unaffiliated issuers | | 36,848,326 | | 44,742,029 |
| Affiliated issuers | | 3,139,578 | | 3,139,578 |
| Cash | | | | 80,853 |
| Receivable for investment securities sold | | | | 2,045,224 |
| Dividends and interest receivable | | | | 39,158 |
| Prepaid expenses | | | | 1,599 |
| | | | | 50,048,441 |
| |
| |
|
| Liabilities ($): | | | | |
| Due to The Dreyfus Corporation and affiliates—Note 3(b) | | 38,240 |
| Liability for securities on loan—Note 1(b) | | | | 3,139,578 |
| Payable for investment securities purchased | | 2,140,752 |
| Payable for shares of Beneficial Interest redeemed | | 205 |
| Accrued expenses | | | | 47,707 |
| | | | | 5,366,482 |
| |
| |
|
| Net Assets ($) | | | | 44,681,959 |
| |
| |
|
| Composition of Net Assets ($): | | | | |
| Paid-in capital | | | | 34,123,973 |
| Accumulated investment (loss)—net | | | | (6,709) |
| Accumulated net realized gain (loss) on investments | | 2,670,992 |
| Accumulated net unrealized appreciation | | | | |
| (depreciation) on investments | | | | 7,893,703 |
| |
| |
|
| Net Assets ($) | | | | 44,681,959 |
| |
| |
|
| |
| |
| Net Asset Value Per Share | | | | |
| | | Initial Shares | | Service Shares |
| |
| |
|
| Net Assets ($) | | 38,603,333 | | 6,078,626 |
| Shares Outstanding | | 1,826,293 | | 290,697 |
| |
| |
|
| Net Asset Value Per Share ($) | | 21.14 | | 20.91 |
See notes to financial statements.
|
STATEMENT OF OPERATIONS
Six Months Ended June 30, 2005 (Unaudited)
|
| Investment Income ($): | | |
| Income: | | |
| Cash dividends (net of $367 foreign taxes withheld at source) | | 204,651 |
| Income from securities lending | | 11,190 |
| Interest | | 6,710 |
| Total Income | | 222,551 |
| Expenses: | | |
| Investment advisory fee—Note 3(a) | | 168,683 |
| Auditing fees | | 19,425 |
| Custodian fees—Note 3(b) | | 16,401 |
| Prospectus and shareholders' reports | | 11,860 |
| Distribution fees—Note 3(b) | | 7,751 |
| Shareholder servicing costs—Note 3(b) | | 7,677 |
| Trustees' fees and expenses—Note 3(c) | | 1,606 |
| Legal fees | | 875 |
| Loan commitment fees—Note 2 | | 213 |
| Miscellaneous | | 2,414 |
| Total Expenses | | 236,905 |
| Less—reduction in custody fees due | | |
| to earnings credits—Note 1(b) | | (48) |
| Net Expenses | | 236,857 |
| Investment (Loss)—Net | | (14,306) |
| |
|
| Realized and Unrealized Gain (Loss) on Investments—Note 4 ($): |
| Net realized gain (loss) on investments | | 2,719,400 |
| Net unrealized appreciation (depreciation) on investments | | (3,747,052) |
| Net Realized and Unrealized Gain (Loss) on Investments | | (1,027,652) |
| Net (Decrease) in Net Assets Resulting from Operations | | (1,041,958) |
See notes to financial statements.
|
STATEMENT OF CHANGES IN NET ASSETS
| | | Six Months Ended | | |
| | | June 30, 2005 | | Year Ended |
| | | (Unaudited) | | December 31, 2004 |
| |
| |
|
| Operations ($): | | | | |
| Investment (loss)—net | | (14,306) | | (13,309) |
| Net realized gain (loss) on investments | | 2,719,400 | | 5,768,704 |
| Net unrealized appreciation | | | | |
| (depreciation) on investments | | (3,747,052) | | 1,812,799 |
| Net Increase (Decrease) in Net Assets | | | | |
| Resulting from Operations | | (1,041,958) | | 7,568,194 |
| |
| |
|
| Dividends to Shareholders from ($): | | | | |
| Net realized gain on investments: | | | | |
| Initial shares | | (1,889,620) | | (2,482,168) |
| Service shares | | (300,690) | | (414,059) |
| Total Dividends | | (2,190,310) | | (2,896,227) |
| |
| |
|
| Beneficial Interest Transactions ($): | | | | |
| Net proceeds from shares sold: | | | | |
| Initial shares | | 2,151,698 | | 5,675,897 |
| Service shares | | 590,616 | | 3,986,665 |
| Dividends reinvested: | | | | |
| Initial shares | | 1,889,620 | | 2,482,168 |
| Service shares | | 300,690 | | 414,059 |
| Cost of shares redeemed: | | | | |
| Initial shares | | (4,190,107) | | (6,864,790) |
| Service shares | | (1,241,137) | | (3,712,388) |
| Increase (Decrease) in Net Assets from | | | | |
| Beneficial Interest Transactions | | (498,620) | | 1,981,611 |
| Total Increase (Decrease) in Net Assets | | (3,730,888) | | 6,653,578 |
| |
| |
|
| Net Assets ($): | | | | |
| Beginning of Period | | 48,412,847 | | 41,759,269 |
| End of Period | | 44,681,959 | | 48,412,847 |
| Undistributed investment income (loss)—net | | (6,709) | | 7,597 |
STATEMENT OF CHANGES IN NET ASSETS (continued)
|
| | | Six Months Ended | | |
| | | June 30, 2005 | | Year Ended |
| | | (Unaudited) | | December 31, 2004 |
| |
| |
|
| Capital Share Transactions: | | | | |
| Initial Shares | | | | |
| Shares sold | | 100,054 | | 265,284 |
| Shares issued for dividends reinvested | | 90,585 | | 110,368 |
| Shares redeemed | | (197,470) | | (322,098) |
| Net Increase (Decrease) in Shares Outstanding | | (6,831) | | 53,554 |
| |
| |
|
| Service Shares | | | | |
| Shares sold | | 28,788 | | 188,954 |
| Shares issued for dividends reinvested | | 14,561 | | 18,576 |
| Shares redeemed | | (59,009) | | (176,121) |
| Net Increase (Decrease) in Shares Outstanding | | (15,660) | | 31,409 |
See notes to financial statements.
|
The following tables describe the performance for each share class for the fiscal periods indicated.All information (except portfolio turnover rate) reflects financial results for a single portfolio share. Total return shows how much your investment in the portfolio would have increased (or decreased) during each period, assuming you had reinvested all dividends and distributions.These figures have been derived from the portfolio's financial statements.
| | | Six Months Ended | | | | | | | | | | |
| | | June 30, 2005 | | | | Year Ended December 31, | | |
| | | |
| |
| |
|
| Initial Shares | | (Unaudited) | | 2004 | | 2003 | | 2002 | | 2001 | | 2000 |
| |
| |
| |
| |
| |
| |
|
| Per Share Data ($): | | | | | | | | | | | | |
| Net asset value, | | | | | | | | | | | | |
| beginning of period | | 22.66 | | 20.34 | | 14.25 | | 17.79 | | 18.08 | | 16.69 |
| Investment Operations: | | | | | | | | | | | | |
| Investment income (loss)—net a | | (.00)b | | .00b | | (.01) | | .05 | | .03 | | .02 |
| Net realized and unrealized | | | | | | | | | | | | |
| gain (loss) on investments | | (.47) | | 3.76 | | 6.12 | | (3.55) | | (.31) | | 1.40 |
| Total from Investment Operations | | (.47) | | 3.76 | | 6.11 | | (3.50) | | (.28) | | 1.42 |
| Distributions: | | | | | | | | | | | | |
| Dividends from investment | | | | | | | | | | | | |
| income—net | | — | | — | | (.02) | | (.04) | | (.01) | | (.03) |
| Dividends from net realized | | | | | | | | | | | | |
| gain on investments | | (1.05) | | (1.44) | | — | | — | | — | | — |
| Total Distributions | | (1.05) | | (1.44) | | (.02) | | (.04) | | (.01) | | (.03) |
| Net asset value, end of period | | 21.14 | | 22.66 | | 20.34 | | 14.25 | | 17.79 | | 18.08 |
| |
| |
| |
| |
| |
| |
|
| Total Return (%) | | (2.01)c | | 18.52 | | 42.94 | | (19.71) | | (1.53) | | 8.53 |
| |
| |
| |
| |
| |
| |
|
| Ratios/Supplemental Data (%): | | | | | | | | | | |
| Ratio of total expenses | | | | | | | | | | | | |
| to average net assets | | .50c | | .95 | | 1.12 | | .98 | | 1.03 | | .93 |
| Ratio of net expenses | | | | | | | | | | | | |
| to average net assets | | .50c | | .95 | | 1.12 | | .98 | | 1.03 | | .93 |
| Ratio of net investment | | | | | | | | | | | | |
| income (loss) to | | | | | | | | | | | | |
| average net assets | | (.01)c | | .00d | | (.09) | | .28 | | .16 | | .09 |
| Portfolio Turnover Rate | | 72.20c | | 112.27 | | 171.34 | | 71.76 | | 60.40 | | 84.47 |
| |
| |
| |
| |
| |
| |
|
| Net Assets, end of period | | | | | | | | | | | | |
| ($ x 1,000) | | 38,603 | | 41,534 | | 36,200 | | 25,458 | | 33,341 | | 35,956 |
| |
| a | | Based on average shares outstanding at each month end. | | | | | | | | |
| b | | Amount represents less than $.01 per share. | | | | | | | | | | |
| c | | Not annualized. | | | | | | | | | | | | |
| d | | Amount represents less than .01%. | | | | | | | | | | | | |
| See notes to financial statements. | | | | | | | | | | | | |
| | FINANCIAL HIGHLIGHTS (continued)
|
| | | Six Months Ended | | | | | | | | | | |
| | | June 30, 2005 | | | | Year Ended December 31, | | |
| | | |
| |
| |
|
| Service Shares | | (Unaudited) | | 2004 | | 2003 | | 2002 | | 2001 | | 2000 a |
| |
| |
| |
| |
| |
| |
|
| Per Share Data ($): | | | | | | | | | | | | |
| Net asset value, | | | | | | | | | | | | |
| beginning of period | | 22.45 | | 20.22 | | 14.20 | | 17.73 | | 18.08 | | 18.08 |
| Investment Operations: | | | | | | | | | | | | |
| Investment income (loss)—net | | (.03)b | | (.05)b | | (.06)b | | .01b | | (.03)b | | — |
| Net realized and unrealized | | | | | | | | | | | | |
| gain (loss) on investments | | (.46) | | 3.72 | | 6.10 | | (3.54) | | (.31) | | — |
| Total from Investment Operations | | (.49) | | 3.67 | | 6.04 | | (3.53) | | (.34) | | — |
| Distributions: | | | | | | | | | | | | |
| Dividends from investment | | | | | | | | | | | | |
| income—net | | — | | — | | (.02) | | (.00)c | | (.01) | | — |
| Dividends from net realized | | | | | | | | | | | | |
| gain on investments | | (1.05) | | (1.44) | | — | | — | | — | | — |
| Total Distributions | | (1.05) | | (1.44) | | (.02) | | (.00)c | | (.01) | | — |
| Net asset value, end of period | | 20.91 | | 22.45 | | 20.22 | | 14.20 | | 17.73 | | 18.08 |
| |
| |
| |
| |
| |
| |
|
| Total Return (%) | | (2.13)d | | 18.18 | | 42.60 | | (19.89) | | (1.86) | | — |
| |
| |
| |
| |
| |
| |
|
| Ratios/Supplemental Data (%): | | | | | | | | | | |
| Ratio of total expenses | | | | | | | | | | | | |
| to average net assets | | .63d | | 1.20 | | 1.37 | | 1.22 | | 1.39 | | — |
| Ratio of net expenses | | | | | | | | | | | | |
| to average net assets | | .63d | | 1.20 | | 1.37 | | 1.22 | | 1.39 | | — |
| Ratio of net investment income | | | | | | | | | | | | |
| (loss) to average net assets | | (.14)d | | (.25) | | (.34) | | .04 | | (.18) | | — |
| Portfolio Turnover Rate | | 72.20d | | 112.27 | | 171.34 | | 71.76 | | 60.40 | | 84.47 |
| |
| |
| |
| |
| |
| |
|
| Net Assets, end of period | | | | | | | | | | | | |
| ($ x 1,000) | | 6,079 | | 6,879 | | 5,559 | | 3,117 | | 1,944 | | 1 |
| |
| a | | The portfolio commenced offering Service shares on December 31, 2000. | | | | | | |
| b | | Based on average shares outstanding at each month end. | | | | | | | | |
| c | | Amount represents less than $.01 per share. | | | | | | | | | | |
| d | | Not annualized. | | | | | | | | | | | | |
| See notes to financial statements. | | | | | | | | | | | | |
20
NOTES TO FINANCIAL STATEMENTS (Unaudited)
NOTE 1—Significant Accounting Policies:
Dreyfus Variable Investment Fund (the "fund") is registered under the Investment Company Act of 1940, as amended (the "Act"), as an open-end management investment company, operating as a series company currently offering twelve series, including the Small Company Stock Portfolio (the "portfolio"). The portfolio is only offered to separate accounts established by insurance companies to fund variable annuity contracts and variable life insurance policies.The portfolio is a diversified series.The portfolio's investment objective is to provide capital appreciation. The Dreyfus Corporation (the "Manager" or "Dreyfus") serves as the portfolio's investment adviser.The Manager is a wholly-owned subsidiary of Mellon Financial Corporation ("Mellon Financial").
Dreyfus Service Corporation (the "Distributor"), a wholly-owned subsidiary of the Manager, is the distributor of the portfolio's shares, which are sold without a sales charge.The portfolio is authorized to issue an unlimited number of $.001 par value shares of Beneficial Interest in each of the following classes of shares: Initial and Service. Each class of shares has identical rights and privileges, except with respect to the distribution plan and the expenses borne by each class and certain voting rights. Income, expenses (other than expenses attributable to a specific class), and realized and unrealized gains or losses on investments are allocated to each class of shares based on its relative net assets.
The fund accounts separately for the assets, liabilities and operations of each series. Expenses directly attributable to each series are charged to that series' operations; expenses which are applicable to all series are allocated among them on a pro rata basis.
The portfolio's financial statements are prepared in accordance with U.S. generally accepted accounting principles, which may require the use of management estimates and assumptions. Actual results may differ from those estimates.
NOTES TO FINANCIAL STATEMENTS (Unaudited) (continued)
The fund enters into contracts that contain a variety of indemnifica-tions.The portfolio's maximum exposure under these arrangements is unknown. The portfolio does not anticipate recognizing any loss related to these arrangements.
(a) Portfolio valuation: Investments in securities are valued at the last sales price on the securities exchange or national securities market on which such securities are primarily traded. Securities listed on the National Market System for which market quotations are available are valued at the official closing price or, if there is no official closing price that day, at the last sales price. Securities not listed on an exchange or the national securities market, or securities for which there were no transactions, are valued at the average of the most recent bid and asked prices, except for open short positions, where the asked price is used for valuation purposes. Bid price is used when no asked price is available. Investments in registered investment companies are valued at their net asset value.When market quotations or official closing prices are not readily available, or are determined not to reflect accurately fair value, such as when the value of a security has been significantly affected by events after the close of the exchange or market on which the security is principally traded (for example, a foreign exchange or market), but before the portfolio calculates its net asset value, the portfolio may value these investments at fair value as determined in accordance with the procedures approved by the Board of Trustees. Fair valuing of securities may be determined with the assistance of a pricing service using calculations based on indices of domestic securities and other appropriate indicators, such as prices of relevant ADR's and futures contracts. For other securities that are fair valued by the Board of Trustees, certain factors may be considered such as: fundamental analytical data, the nature and duration of restrictions on disposition, an evaluation of the forces that influence the market in which the securities are purchased and sold and public trading in similar securities of the issuer or comparable issuers. Financial futures are valued at the last sales price.
(b) Securities transactions and investment income: Securities transactions are recorded on a trade date basis. Realized gain and loss from securities transactions are recorded on the identified cost basis. Dividend income is recognized on the ex-dividend date and interest income, including, where applicable, accretion of discount and amortization of premium on investments, is recognized on the accrual basis.
The portfolio has an arrangement with the custodian bank whereby the portfolio receives earnings credits from the custodian when positive cash balances are maintained, which are used to offset custody fees. For financial reporting purposes, the portfolio includes net earnings credits as an expense offset in the Statement of Operations.
Pursuant to a securities lending agreement with Mellon Bank, N.A., an affiliate of the Manager, the portfolio may lend securities to qualified institutions.At origination, all loans are secured by collateral of at least 102% of the value of U.S. securities loaned and 105% of the value of foreign securities loaned. Collateral equivalent to at least 100% of the market value of securities on loan will be maintained at all times. Cash collateral is invested in certain money market mutual funds managed by the Manager. The portfolio will be entitled to receive all income on securities loaned, in addition to income earned as a result of the lending transaction. Although each security loaned is fully collateralized, the portfolio would bear the risk of delay in recovery of, or loss of rights in, the securities loaned should a borrower fail to return the securities in a timely manner.
The portfolio may enter into repurchase agreements with financial institutions, deemed to be creditworthy by the Manager, subject to the seller's agreement to repurchase and the portfolio's agreement to resell such securities at a mutually agreed upon price. Securities purchased subject to repurchase agreements are deposited with the portfolio's custodian and, pursuant to the terms of the repurchase agreement, must have an aggregate market value greater than or equal to the terms of the repurchase price plus accrued interest at all times. If the value of
NOTES TO FINANCIAL STATEMENTS (Unaudited) (continued)
the underlying securities falls below the value of the repurchase price plus accrued interest, the portfolio will require the seller to deposit additional collateral by the next business day. If the request for additional collateral is not met, or the seller defaults on its repurchase obligation, the portfolio maintains its right to sell the underlying securities at market value and may claim any resulting loss against the seller.
(c) Affiliated issuers: Investments in other investment companies advised by the Manager are defined as "affiliated" in the Act.
(d) Dividends to shareholders: Dividends are recorded on the ex-dividend date. Dividends from investment income-net and dividends from net realized capital gain, if any, are normally declared and paid annually, but the portfolio may make distributions on a more frequent basis to comply with the distribution requirements of the Internal Revenue Code of 1986, as amended (the "Code").To the extent that net realized capital gain can be offset by capital loss carryovers, if any, it is the policy of the portfolio not to distribute such gain. Income and capital gain distributions are determined in accordance with income tax regulations, which may differ from U.S. generally accepted accounting principles.
(e) Federal income taxes: It is the policy of the portfolio to continue to qualify as a regulated investment company, if such qualification is in the best interests of its shareholders, by complying with the applicable provisions of the Code, and to make distributions of taxable income sufficient to relieve it from substantially all federal income and excise taxes.
The tax character of distributions paid to shareholders during the fiscal year ended December 31, 2004 was as follows: long-term capital gains $2,896,227. The tax character of current year distributions will be determined at the end of the current fiscal year.
NOTE 2—Bank Line of Credit:
|
The portfolio participates with other Dreyfus-managed funds in a $350 million redemption credit facility (the "Facility") to be utilized for temporary or emergency purposes, including the financing of redemptions. In connection therewith, the portfolio has agreed to pay
commitment fees on its pro rata portion of the Facility. Interest is charged to the portfolio based on prevailing market rates in effect at the time of borrowings. During the period ended June 30, 2005, the portfolio did not borrow under the Facility.
NOTE 3—Investment Advisory Fee and Other Transactions with Affiliates:
(a) Pursuant to an Investment Advisory Agreement with the Manager,the investment advisory fee is computed at the annual rate of .75 of 1% of the value of the portfolio's average daily net assets and is payable monthly.
(b) Under the Distribution Plan (the "Plan") adopted pursuant to Rule 12b-1 under the Act, Service shares pay the Distributor for distributing their shares, for servicing and/or maintaining Service shares shareholder accounts and for advertising and marketing for Service shares.The Plan provides for payments to be made at an annual rate of .25 of 1% of the value of the Service shares' average daily net assets.The Distributor may make payments to Participating Insurance Companies and to brokers and dealers acting as principal underwriter for their variable insurance products.The fees payable under the Plan are payable without regard to actual expenses incurred. During the period ended June 30, 2005, Service shares were charged $7,751 pursuant to the Plan.
The portfolio compensates Dreyfus Transfer, Inc., a wholly-owned subsidiary of the Manager, under a transfer agency agreement for providing personnel and facilities to perform transfer agency services for the portfolio. During the period ended June 30, 2005, the portfolio was charged $194 pursuant to the transfer agency agreement.
The portfolio compensates Mellon Bank, N.A., an affiliate of the Manager, under a custody agreement for providing custodial services for the portfolio. During the period ended June 30, 2005, the portfolio was charged $16,401 pursuant to the custody agreement.
During the period ended June 30, 2005, the portfolio was charged $1,998 for services performed by the Chief Compliance Officer.
NOTES TO FINANCIAL STATEMENTS (Unaudited) (continued)
The components of Due to The Dreyfus Corporation and affiliates in the Statement of Assets and Liabilities consist of: investment advisory fees $27,489, Rule 12b-1 distribution plan fees $1,238, custodian fees $7,447, chief compliance officer fees $1,998 and transfer agency per account fees $68.
(c) Each Board member also serves as a Board member of other funds within the Dreyfus complex. Annual retainer fees and attendance fees are allocated to each fund based on net assets.
NOTE 4—Securities Transactions:
|
The aggregate amount of purchases and sales of investment securities, excluding short-term securities, during the period ended June 30, 2005, amounted to $32,686,693, and $35,393,365, respectively.
At June 30, 2005, accumulated net unrealized appreciation on investments was $7,893,703, consisting of $8,716,328 gross unrealized appreciation and $822,625 gross unrealized depreciation.
At June 30,2005,the cost of investments for federal income tax purposes was substantially the same as the cost for financial reporting purposes (see the Statement of Investments).
In early 2004, two purported class and derivative actions were filed against Mellon Financial, Mellon Bank, N.A., Dreyfus, Founders Asset Management LLC, and certain directors of the Dreyfus Funds and the Dreyfus Founders Funds (together, the "Funds") in the United States District Court for the Western District of Pennsylvania. In September 2004, plaintiffs served a Consolidated Amended Complaint (the "Amended Complaint") on behalf of a purported class of all persons who acquired interests in any of the Funds between January 30, 1999 and November 17, 2003, and derivatively on behalf of the Funds.The Amended Complaint in the newly styled In re Dreyfus Mutual Funds Fee Litigation also named the Distributor, Premier Mutual Fund Services, Inc. and two additional Fund directors as defendants and
alleges violations of the Investment Company Act of 1940, the Investment Advisers Act of 1940, the Pennsylvania Unfair Trade Practices and Consumer Protection Law and common-law claims. Plaintiffs seek to recover allegedly improper and excessive Rule 12b-1 and advisory fees allegedly charged to the Funds for marketing and distribution services. More specifically, plaintiffs claim, among other things, that 12b-1 fees and directed brokerage were improperly used to pay brokers to recommend the Funds over other funds, and that such payments were not disclosed to investors. In addition, plaintiffs assert that economies of scale and soft-dollar benefits were not passed on to the Funds. Plaintiffs further allege that 12b-1 fees were improperly charged to certain of the Funds that were closed to new investors.The Amended Complaint seeks compensatory and punitive damages, rescission of the advisory contracts, and an accounting and restitution of any unlawful fees, as well as an award of attorneys' fees and litigation expenses. As noted, some of the claims in this litigation are asserted derivatively on behalf of the Funds that have been named as nominal defendants. With respect to such derivative claims, no relief is sought against the Funds. Dreyfus believes the allegations to be totally without merit and intends to defend the action vigorously. In November 2004, all named defendants moved to dismiss the Amended Complaint in whole or substantial part. Briefing was completed in May 2005.
Additional lawsuits arising out of these circumstances and presenting similar allegations and requests for relief may be filed against the defendants in the future. Neither Dreyfus nor the Funds believe that any of the pending actions will have a material adverse effect on the Funds or Dreyfus' ability to perform its contract with the Funds.
INFORMATION ABOUT THE REVIEW
AND APPROVAL OF THE PORTFOLIO'S
I N V E S T M E N T A DV I S O RY A G R E E M E N T (Unaudited)
|
At separate meetings of the Board of Trustees for the fund held on June 8-9, 2005, the Board considered the re-approval, through its annual renewal date of July 31, 2006, of the Investment Advisory Agreement with the Manager for the portfolio, pursuant to which the Manager provides the portfolio with investment advisory and administrative ser-vices.The Board members who are not "interested persons" (as defined in the Act (the "Independent Trustees")) of the fund were assisted in their review by independent legal counsel and met with counsel in executive session separate from representatives of the Manager.
Analysis of Nature, Extent and Quality of Services Provided to the Portfolio. The Board members received a presentation from representatives of the Manager regarding services provided to the portfolio and other funds in the Dreyfus fund complex, and discussed the nature, extent and quality of the services provided to the portfolio pursuant to its Investment Advisory Agreement. The Manager's representatives reviewed the portfolio's distribution of accounts and the relationships the Manager has with various intermediaries and the different needs of each.The Board noted that the portfolio's shares were offered only to separate accounts established by insurance companies to fund variable annuity contracts and variable life insurance policies. The Manager's representatives noted the diversity of distribution among the funds in the Dreyfus complex, and the Manager's corresponding need for broad, deep, and diverse resources to be able to provide ongoing shareholder services to each distribution channel, including that of the Fund. The Board also reviewed the number of shareholder accounts in the portfolio, as well as the portfolio's asset size.
The Board members also considered the Manager's research and portfolio management capabilities and that the Manager also provides oversight of day-to-day portfolio operations, including fund accounting and administration and assistance in meeting legal and regulatory requirements. The Board members also considered the Manager's extensive administrative, accounting and compliance infrastructure.
Comparative Analysis of the Portfolio's Performance, Investment Advisory Fee and Expense Ratio. The Board members reviewed the portfolio's performance and expense ratios and placed significant emphasis on comparisons to two groups of comparable funds and its former and current Lipper category averages, as applicable.The Board reviewed the portfolio's performance, investment advisory fee, and total expense ratios within these comparison groups and against the averages of the portfolio's current and former Lipper categories, as applicable. The groups of comparable funds were previously approved by the Board for this purpose, and were prepared using a Board-approved selection methodology that was based, in part, on selecting non-affiliated funds reported in the same Lipper category as the portfolio.The Board members discussed the results of the comparisons and noted that the portfolio's performance generally was below the averages of its comparison groups and its former Lipper category averages, but, that its performance generally was above its current Lipper category averages, and its longer term performance rankings in its comparison groups generally were above its one year rankings. The Board members also discussed the portfolio's expense ratio for each class of shares, noting it is lower than the average of its Initial shares comparison group and higher than the average of the Service shares comparison group, and that it generally ranks in the middle of its comparison groups. They reviewed the range of management fees in the comparison groups and noted that the portfolio's management fee ranks in the top half (i.e., lower than that of most of the other funds) of the comparison groups. They noted the Manager's proposed undertaking to waive or reimburse certain fees and expenses to limit the portfolio's expense ratio, which would reduce the expense ratio for the portfolio's Service shares based on the portfolio's current expense ratio, and which, if in effect during the period, would have reduced the Service share expense ratio to below its comparison group average.
INFORMATION ABOUT THE REVIEW AND APPROVAL OF THE PORTFOLIO'S
INVESTMENT ADVISORY AGREEMENT (Unaudited) (continued)
|
Representatives of the Manager reviewed with the Board members the fees paid to the Manager or its affiliates by mutual funds managed by the Manager or its affiliates with similar investment objectives, policies and strategies (the "Similar Funds"), of which there was one, and by separate accounts or mutual funds for which the Manager or its affiliates serve as sub-investment adviser with similar investment objectives, policies and strategies as the portfolio (the "Separate Accounts" and, collectively with Similar Funds, the "Similar Accounts") and explained the nature of each Similar Account and the differences, from the Manager's perspective, in management of such Similar Accounts as compared to managing and providing other services to the portfolio. The Similar Fund was a mutual fund reported in the same Lipper category as the portfolio.The Manager's representatives also reviewed the costs associated with distribution through intermediaries. The Board analyzed differences in fees paid to the Manager and discussed the relationship of the advisory fees paid in light of the Manager's performance and the services provided. It was noted that the one Similar Fund had the same management fee as the fee borne by the portfolio.The Board members considered the relevance of the fee information provided for the Similar Accounts managed by the Manager to evaluate the appropriateness and reasonableness of the portfolio's advisory fees.The Board acknowledged that differences in fees paid by the Similar Accounts seemed to be consistent with the services provided.
Analysis of Profitability and Economies of Scale. The Manager's representatives reviewed the dollar amount of expenses allocated and profit received by the Manager and the method used to determine such expenses and profit.The Board received and considered information prepared by an independent consulting firm regarding Dreyfus' approach to allocating costs to, and determining the profitability of, individual funds and the entire Dreyfus mutual fund complex. The consulting firm also analyzed where any economies of scale might emerge as assets grow. The Board members evaluated the analysis in light of the relevant circumstances for the portfolio, including the slight increase in portfolio assets and the extent to which economies
of scale would be realized as the portfolio grows and whether fee levels reflect these economies of scale for the benefit of portfolio investors.The Board members also considered potential benefits to the Manager from acting as investment adviser and noted the soft dollar arrangements with respect to trading the portfolio's portfolio.
It was noted that the Board members should consider the Manager's profitability with respect to the portfolio as part of their evaluation of whether the fee under the Investment Advisory Agreement bears a reasonable relationship to the mix of services provided by the Manager, including the nature, extent and quality of such services and that a discussion of economies of scale are predicated on increasing assets and that, if a fund's assets had been decreasing, the possibility that the Manager may have realized any economies of scale would be less. It also was noted that the profitability percentage for managing the portfolio was within ranges determined by appropriate court cases to be reasonable given the services rendered and, given the portfolio's overall performance and generally superior service levels provided. It was also noted that the proposed undertaking to waive fees or reimburse expenses had the potential to reduce the profitability for managing the portfolio over the period of the undertaking.
At the conclusion of these discussions, each of the Independent Trustees expressed the opinion that he or she had been furnished with sufficient information to make an informed business decision with respect to continuation of the fund's Investment Advisory Agreement, with respect to the portfolio. Based on their discussions and considerations as described above, the Board made the following conclusions and determinations.
- The Board concluded that the nature, extent and quality of the ser- vices provided by the Manager are adequate and appropriate.
- The Board generally was satisfied with the Manager's performance as compared to its current Lipper category averages and the portfolio's longer term performance as compared to its comparison groups.
INFORMATION ABOUT THE REVIEW AND APPROVAL OF THE PORTFOLIO'S
INVESTMENT ADVISORY AGREEMENT (Unaudited) (continued)
|
- The Board concluded that the fee paid by the portfolio to the Manager was reasonable in light of comparative performance and expense and advisory fee information, including the Manager's pro- posal to waive or reimburse certain fees and expenses, which would reduce the expense ratio of the Service shares based on current expense ratios, costs of the services provided and profits to be real- ized and benefits derived or to be derived by the Manager from its relationship with the portfolio.
- The Board determined that, to the extent that material economies of scale had not been shared with the portfolio, the Board would seek to do so.
The Board members considered these conclusions and determinations, along with information received on a routine and regular basis throughout the year, and, without any one factor being dispositive, the Board determined that approval of the fund's Investment Advisory Agreement, with respect to the portfolio, was in the best interests of the portfolio and its shareholders.
| For More | | Information |
| |
|
| |
| Dreyfus Variable | | Transfer Agent & |
| Investment Fund, | | Dividend Disbursing Agent |
| Small Company Stock Portfolio |
| | | Dreyfus Transfer, Inc. |
| 200 Park Avenue | | |
| | | 200 Park Avenue |
| New York, NY 10166 | | |
| | | New York, NY 10166 |
| |
| Investment Adviser | | Distributor |
| The Dreyfus Corporation | | |
| | | Dreyfus Service Corporation |
| 200 Park Avenue | | |
| | | 200 Park Avenue |
| New York, NY 10166 | | |
| | | New York, NY 10166 |
| Custodian | | |
| Mellon Bank, N.A. | | |
| One Mellon Bank Center | | |
| Pittsburgh, PA 15258 | | |
Telephone 1-800-554-4611 or 516-338-3300
Mail The Dreyfus Family of Funds, 144 Glenn Curtiss Boulevard, Uniondale, NY 11556-0144 Attn: Institutional Servicing
The portfolio files its complete schedule of portfolio holdings with the Securities and Exchange Commission ("SEC") for the first and third quarters of each fiscal year on Form N-Q. The portfolio's Forms N-Q are available on the SEC's website at http://www.sec.gov and may be reviewed and copied at the SEC's Public Reference Room in Washington, DC. Information on the operation of the Public Reference Room may be obtained by calling 1-800-SEC-0330.
A description of the policies and procedures that the portfolio uses to determine how to vote proxies relating to portfolio securities, and information regarding how the portfolio voted these proxies for the 12-month period ended June 30, 2005, is available at http://www.dreyfus.com and on the SEC's website at http://www.sec.gov. The description of the policies and procedures is also available without charge, upon request, by calling 1-800-645-6561.
© 2005 Dreyfus Service Corporation

| Dreyfus Variable |
| Investment Fund, |
| Special Value Portfolio |
SEMIANNUAL REPORT June 30, 2005

The views expressed in this report reflect those of the portfolio manager only through the end of the period covered and do not necessarily represent the views of Dreyfus or any other person in the Dreyfus organization.Any such views are subject to change at any time based upon market or other conditions and Dreyfus disclaims any responsibility to update such views. These views may not be relied on as investment advice and, because investment decisions for a Dreyfus portfolio are based on numerous factors, may not be relied on as an indication of trading intent on behalf of any Dreyfus portfolio.
Not FDIC-Insured • Not Bank-Guaranteed • May Lose Value
| | | Contents |
| |
| | | T H E P O R T F O L I O |
| |
|
| 2 | | Letter from the Chairman |
| 3 | | Discussion of Performance |
| 6 | | Understanding Your Portfolio's Expenses |
| 6 | | Comparing Your Portfolio's Expenses |
| | | With Those of Other Funds |
| 7 | | Statement of Investments |
| 11 | | Statement of Assets and Liabilities |
| 12 | | Statement of Operations |
| 13 | | Statement of Changes in Net Assets |
| 15 | | Financial Highlights |
| 17 | | Notes to Financial Statements |
| 24 | | Information About the Review |
| and Approval of the Portfolio's |
| Investment Advisory Agreement |
| | | F O R M O R E I N F O R M AT I O N |
| |
|
| | | Back Cover |
| Dreyfus Variable Investment Fund, |
| Special Value Portfolio |
The Portfolio

LETTER FROM THE CHAIRMAN
We are pleased to present this semiannual report for Dreyfus Variable Investment Fund, Special Value Portfolio, covering the six-month period from January 1, 2005, through June 30, 2005. Inside, you'll find valuable information about how the fund was managed during the reporting period, including a discussion with the fund's portfolio managers, Mark G. DeFranco and Brian M. Gillott of Jennison Associates LLC, the portfolio's sub-investment adviser.
On average, U.S. stock prices ended the first half of 2005 slightly lower than where they began, largely due to headwinds caused by higher energy prices, rising short-term interest rates and recent evidence of slower economic growth. While midcap stocks generally produced higher returns than large-cap stocks, and large-cap stocks generally outperformed small-cap stocks, these differences were relatively small. Conversely, value-oriented stocks continued to produce substantially better results than their more growth-oriented counterparts.
In some ways, market conditions at midyear remind us of those from one year ago, when stock prices languished due to economic and political concerns before rallying strongly later in the year. Currently, our economists expect the U.S. economy to continue to grow over the foreseeable future without significant new inflationary pressures, potentially setting the stage for better business conditions that could send stock prices higher.As always, we encourage you to discuss these and other matters with your financial advisor.
Thank you for your continued confidence and support.


DISCUSSION OF PERFORMANCE
Mark G. DeFranco and Brian M. Gillott, Portfolio Managers Jennison Associates LLC, Sub-Investment Adviser
How did Dreyfus Variable Investment Fund, Special Value Portfolio perform relative to its benchmark?
For the six-month period ended June 30, 2005, the portfolio produced total returns of –2.60% for its Initial shares and –2.68% for its Service shares.1 For the same period, the total return of the Russell 1000 Value Index (the "Index"), the portfolio's benchmark, was 1.76% .2
Stocks generally struggled during the reporting period as positive influences, such as sustained economic growth and sound corporate earnings, were offset by negative ones, including higher interest rates and surging energy prices.The portfolio produced lower returns than its benchmark, primarily due to its relatively heavy exposure to the basic materials sector, which declined over the reporting period after posting strong returns in 2004.
What is the portfolio's investment approach?
The portfolio seeks to maximize total return, consisting of capital appreciation and current income.To pursue this goal, the portfolio normally invests at least 80% of its assets in stocks. The portfolio's stock investments may include common stocks, preferred stocks and convertible securities of both U.S. and foreign companies of any size, including those purchased in initial public offerings or shortly thereafter.
The portfolio managers seek to identify attractively valued companies with current or emerging earnings growth that may not be fully recognized or appreciated by the market. Generally, there are two types of companies which may exhibit the characteristics the portfolio managers are seeking.The first type is a company that is out of favor with investors but which the portfolio managers expect will experience an improved earnings cycle over the next 12 to 18 months due to corporate restructuring, new product development, an industry cycle turn, increased management focus on shareholder value or improving balance sheet and cash flow.The second type is a company currently
DISCUSSION OF PERFORMANCE (continued)
|
delivering good growth characteristics but which the portfolio managers believe is being mispriced by the market based on short-term earnings results relative to "street" expectations or market uncertainty regarding the sustainability of earnings growth.
What other factors influenced the portfolio's performance?
Although we choose the portfolio's investments according to our "bottom-up" research into the prospects of individual companies, it is worth noting that stocks were influenced by changes in economic expectations over the first half of 2005. Stocks had rallied sharply in the weeks before the reporting period began as new evidence emerged that the U.S. economy was growing without rekindling inflationary pressures. During the first quarter of 2005, however, inflation concerns began to mount as energy prices surged higher. In addition, investors began to worry that the Federal Reserve Board might increase short-term interest rates to a higher level and at a faster pace than they previously expected.As a result, stock prices generally failed to advance during the reporting period.
Despite rising energy prices, prices of many other commodities, including chemicals and industrial metals, began to moderate as inventories accumulated amid signs that demand from China and other emerging markets might slacken. As a result, the stocks of materials producers declined. Because the portfolio was more heavily invested in these companies than the benchmark, its relative performance suffered. We subsequently reduced the portfolio's exposure to the materials sector.
The portfolio also lost ground relative to its benchmark in the financials sector, where The Bank of New York was hurt by expenses related to the construction of new facilities, and insurance broker Willis Group Holdings encountered unexpectedly high recruitment costs in attracting agents from other firms. Finally, the portfolio's media stocks continued to disappoint due to persistently weak advertising revenues.
On the other hand, the portfolio received strong contributions to performance from its holdings in the energy sector, where we shifted the portfolio's focus from integrated oil producers and exploration-and-production companies to oil services providers, such as drilling rig manufacturer National-Oilwell and international oil services leader Schlumberger. In the health care sector, the fund's positions in medical
services providers fared well, led by managed care company CIGNA, which has cut costs while increasing membership; hospitals operator Community Health Systems, which we purchased at attractive levels; and prescription manager Medco Health Solutions, which has been gaining market share. Good relative performance in the technology sector was driven by information technology services provider SunGard Data Systems, which was subject to an acquisition offer, enterprise software developer BEA Systems and wireless telephone handset maker Nokia Oyj.
What is the portfolio's current strategy?
We believe that the stock market's recent weakness has created a number of value-oriented opportunities in a variety of industry groups. Accordingly, we have established new positions in a leading media research firm, an educational publisher, a semiconductor manufacturer, generic drug makers and an asset manager, among others. In our judgment, the portfolio's current holdings potentially position it well for a market environment in which selectivity is likely to be a more important driver of performance.
| | | The portfolio is only available as a funding vehicle under variable life insurance policies or variable |
| | | annuity contracts issued by insurance companies. Individuals may not purchase shares of the |
| | | portfolio directly. A variable annuity is an insurance contract issued by an insurance company that |
| | | enables investors to accumulate assets on a tax-deferred basis for retirement or other long-term |
| | | goals.The investment objective and policies of Dreyfus Variable Investment Fund, Special Value |
| | | Portfolio made available through insurance products may be similar to other funds/portfolios |
| | | managed or advised by Dreyfus. However, the investment results of the portfolio may be higher or |
| | | lower than, and may not be comparable to, those of any other Dreyfus fund/portfolio. |
| 1 | | Total return includes reinvestment of dividends and any capital gains paid. Past performance is no |
| | | guarantee of future results. Share price and investment return fluctuate such that upon redemption, |
| | | portfolio shares may be worth more or less than their original cost.The portfolio's performance does |
| | | not reflect the deduction of additional charges and expenses imposed in connection with investing |
| | | in variable insurance contracts, which will reduce returns. Return figures provided reflect the |
| | | absorption of portfolio expenses by The Dreyfus Corporation pursuant to an agreement in effect |
| | | through December 31, 2005, at which time it may be extended, terminated or modified. Had |
| | | these expenses not been absorbed, the portfolio's returns would have been lower. |
| | | Part of the portfolio's recent performance is attributable to positive returns from its initial |
| | | public offering (IPO) investments. There can be no guarantee that IPOs will have or |
| | | continue to have a positive effect on the portfolio's performance. |
| 2 | | SOURCE: LIPPER INC. — Reflects the reinvestment of dividends and, where applicable, |
| | | capital gain distributions.The Russell 1000 Value Index is an unmanaged index which measures |
| | | the performance of those Russell 1000 companies with lower price-to-book ratios and lower |
| | | forecasted growth values. |
The Portfolio 5
UNDERSTANDING YOUR
PORTFOLIO'S EXPENSES (Unaudited)
|
As a mutual fund investor, you pay ongoing expenses, such as management fees and other expenses. Using the information below, you can estimate how these expenses affect your investment and compare them with the expenses of other funds.You also may pay one-time transaction expenses, including sales charges (loads) and redemption fees, which are not shown in this section and would have resulted in higher total expenses. For more information, see your portfolio's prospectus or talk to your financial adviser.
Review your portfolio's expenses
|
The table below shows the expenses you would have paid on a $1,000 investment in Dreyfus Variable Investment Fund, Special Value Portfolio from January 1, 2005 to June 30, 2005. It also shows how much a $1,000 investment would be worth at the close of the period, assuming actual returns and expenses.
| Expenses and Value of a $1,000 Investment | | |
| assuming actual returns for the six months ended June 30, 2005 | | |
| | | Initial Shares | | Service Shares |
| |
| |
|
| Expenses paid per $1,000 † | | $ 4.55 | | $ 4.89 |
| Ending value (after expenses) | | $974.00 | | $973.20 |
COMPARING YOUR PORTFOLIO'S EXPENSES WITH THOSE OF OTHER FUNDS (Unaudited)
Using the SEC's method to compare expenses
The Securities and Exchange Commission (SEC) has established guidelines to help investors assess fund expenses. Per these guidelines, the table below shows your portfolio's expenses based on a $1,000 investment, assuming a hypothetical 5% annualized return. You can use this information to compare the ongoing expenses (but not transaction expenses or total cost) of investing in the portfolio with those of other funds. All mutual fund shareholder reports will provide this information to help you make this comparison. Please note that you cannot use this information to estimate your actual ending account balance and expenses paid during the period.
Expenses and Value of a $1,000 Investment assuming a hypothetical 5% annualized return for the six months ended June 30, 2005
| | | Initial Shares | | Service Shares |
| |
| |
|
| Expenses paid per $1,000 † | | $ 4.66 | | $ 5.01 |
| Ending value (after expenses) | | $1,020.18 | | $1,019.84 |
† Expenses are equal to the portfolio's annualized expense ratio of .93% for Initial shares and 1.00% for Service shares, multiplied by the average account value over the period, multiplied by 181/365 (to reflect the one-half year period).
STATEMENT OF INVESTMENTS
June 30, 2005 (Unaudited)
|
| Common Stocks—96.5% | | Shares | | Value ($) |
| |
| |
|
| Aerospace & Defense—1.1% | | | | |
| Empresa Brasileira de Aeronautica, ADR | | 10,500 | | 347,235 |
| Biotechnology—1.3% | | | | |
| MedImmune | | 14,700 a | | 392,784 |
| Capital Markets—9.4% | | | | |
| Bank of New York | | 27,800 | | 800,084 |
| Eaton Vance | | 7,600 | | 181,716 |
| Janus Capital Group | | 19,600 | | 294,784 |
| Lazard, Cl. A | | 21,200 a | | 492,900 |
| Nuveen Investments | | 14,000 | | 526,680 |
| Schwab (Charles) | | 51,200 | | 577,536 |
| | | | | 2,873,700 |
| Chemicals—4.1% | | | | |
| du Pont EI de Nemours | | 15,300 | | 658,053 |
| Huntsman | | 9,000 a | | 182,430 |
| Lyondell Chemical | | 5,600 | | 147,952 |
| Olin | | 9,900 | | 180,576 |
| Terra Industries | | 11,900 | | 81,039 |
| | | | | 1,250,050 |
| Commercial Banks—1.1% | | | | |
| Fifth Third Bancorp | | 8,400 | | 346,164 |
| Commercial Services & Supplies—2.6% | | | | |
| Hewitt Associates, Cl.A | | 7,200 a | | 190,872 |
| Manpower | | 14,900 | | 592,722 |
| | | | | 783,594 |
| Communications Equipment—1.7% | | | | |
| Nokia Oyj, ADR | | 31,700 | | 527,488 |
| Consumer Finance—.7% | | | | |
| Alliance Data Systems | | 5,200 a | | 210,912 |
| Diversified Consumer Services—1.8% | | | | |
| Education Management | | 10,800 a | | 364,284 |
| ITT Educational Services | | 3,500 a | | 186,970 |
| | | | | 551,254 |
| Diversified Financial Services—1.1% | | | | |
| J.P. Morgan Chase & Co. | | 9,336 | | 329,748 |
| Diversified Telecommunications—2.8% | | | | |
| Citizens Communications | | 36,500 | | 490,560 |
| IDT, Cl. B | | 27,800 a | | 365,848 |
| | | | | 856,408 |
The Portfolio 7
STATEMENT OF INVESTMENTS (Unaudited) (continued)
| Common Stocks (continued) | | Shares | | Value ($) |
| |
| |
|
| Electronic Equipment—1.9% | | | | |
| Agilent Technologies | | 12,200 a | | 280,844 |
| Symbol Technologies | | 31,800 | | 313,866 |
| | | | | 594,710 |
| Energy Equipment & Services—8.2% | | | | |
| BJ Services | | 4,800 | | 251,904 |
| Cooper Cameron | | 5,300 a | | 328,865 |
| National-Oilwell | | 7,400 a | | 351,796 |
| Rowan Cos. | | 11,200 | | 332,752 |
| Schlumberger | | 8,400 | | 637,896 |
| Todco, Cl. A | | 11,500 a | | 295,205 |
| Weatherford International | | 5,200 a | | 301,496 |
| | | | | 2,499,914 |
| Food & Staples Retailing—3.8% | | | | |
| Kroger | | 41,800 a | | 795,454 |
| Performance Food Group | | 12,000 a | | 362,520 |
| | | | | 1,157,974 |
| Healthcare Providers & Services—4.4% | | |
| CIGNA | | 3,000 | | 321,090 |
| Community Health Systems | | 9,100 a | | 343,889 |
| Medco Health Solutions | | 4,100 a | | 218,776 |
| Tenet Healthcare | | 37,800 a | | 462,672 |
| | | | | 1,346,427 |
| Household Products—.8% | | | | |
| Kimberly-Clark | | 3,700 | | 231,583 |
| Hotels Restaurants & Leisure—1.1% | | | | |
| GTECH Holdings. | | 11,700 | | 342,108 |
| Insurance—7.7% | | | | |
| American International Group | | 11,000 | | 639,100 |
| Axis Capital Holdings | | 18,400 | | 520,720 |
| UnumProvident | | 46,000 | | 842,720 |
| XL Capital, Cl. A | | 4,500 | | 334,890 |
| | | | | 2,337,430 |
| Internet—2.5% | | | | |
| IAC/InterActive | | 31,500 a | | 757,575 |
| Machinery—1.3% | | | | |
| Dover | | 4,500 | | 163,710 |
| Navistar International | | 7,500 a | | 240,000 |
| | | | | 403,710 |
8
| Common Stocks (continued) | | Shares | | Value ($) |
| |
| |
|
| Media—9.9% | | | | |
| DIRECTV Group | | 24,200 a | | 375,100 |
| Gemstar-TV Guide International | | 88,400 a | | 317,356 |
| Pearson, ADR | | 30,100 | | 357,588 |
| Radio One, Cl. D | | 32,900 a | | 420,133 |
| VNU | | 13,200 | | 368,413 |
| Viacom, Cl. B | | 22,674 | | 726,021 |
| Westwood One | | 23,100 | | 471,933 |
| | | | | 3,036,544 |
| Metals & Mining—2.4% | | | | |
| Alcoa | | 11,300 | | 295,269 |
| Harmony Gold Mining Co., ADR | | 51,000 | | 436,560 |
| | | | | 731,829 |
| Multi Utilities—1.7% | | | | |
| Aquila | | 54,200 a | | 195,662 |
| Sempra Energy | | 7,600 | | 313,956 |
| | | | | 509,618 |
| Oil & Gas—.8% | | | | |
| Spinnaker Exploration | | 7,100 a | | 251,979 |
| Paper & Forest Products—2.1% | | | | |
| MeadWestvaco | | 22,400 | | 628,096 |
| Pharmaceuticals—8.6% | | | | |
| Andrx Group | | 22,500 a | | 456,975 |
| Eli Lilly & Co. | | 8,700 | | 484,677 |
| GlaxoSmithKline, ADR | | 6,900 | | 334,719 |
| Merck & Co. | | 10,500 | | 323,400 |
| Pfizer | | 21,000 | | 579,180 |
| Watson Pharmaceuticals | | 15,400 a | | 455,224 |
| | | | | 2,634,175 |
| Road & Rail—1.7% | | | | |
| CSX | | 12,500 | | 533,250 |
| Semiconductors—1.9% | | | | |
| MEMC Electronic Materials | | 27,000 a | | 425,790 |
| Micron Technology | | 15,800 a | | 161,318 |
| | | | | 587,108 |
| Software—8.0% | | | | |
| BEA Systems | | 40,500 a | | 355,590 |
| Business Objects, ADR | | 11,600 a | | 305,080 |
The Portfolio 9
STATEMENT OF INVESTMENTS (Unaudited) (continued)
| Common Stocks (continued) | | Shares | | Value ($) |
| |
| |
|
| Software (continued) | | | | |
| Computer Associates International | | 11,100 | | 305,028 |
| Manhattan Associates | | 18,300 a | | 351,543 |
| Microsoft | | 32,800 | | 814,752 |
| TIBCO Software | | 46,100 a | | 301,494 |
| | | | | 2,433,487 |
| Total Common Stocks | | | | |
| (cost $27,591,448) | | | | 29,486,854 |
| |
| |
|
| |
| Other Investment—4.1% | | | | |
| |
| |
|
| Registered Investment Company: | | | | |
| Dreyfus Institutional Preferred Plus Money Market Fund | | |
| (cost $1,242,000) | | 1,242,000 b | | 1,242,000 |
| |
| |
|
| Total Investments (cost $28,833,448) | | 100.6% | | 30,728,854 |
| Liabilities, Less Cash and Receivables | | (.6%) | | (178,275) |
| Net Assets | | 100.0% | | 30,550,579 |
| ADR — American Depository Receipts. |
| a | | Non-income producing. |
| b | | Investment in affiliated money market fund. |
| Portfolio Summary (Unaudited) † | | | | |
| |
| | | Value (%) | | | | Value (%) |
| |
| |
| |
|
| Media | | 9.9 | | Healthcare Providers & Services | | 4.4 |
| Capital Markets | | 9.4 | | Chemicals | | 4.1 |
| Pharmaceuticals | | 8.6 | | Money Market Investments | | 4.1 |
| Energy Equipment & Services | | 8.2 | | Other | | 36.2 |
| Software | | 8.0 | | | | |
| Insurance | | 7.7 | | | | 100.6 |
| |
| † Based on net assets. | | | | | | |
| See notes to financial statements. | | | | | | |
STATEMENT OF ASSETS AND LIABILITIES
June 30, 2005 (Unaudited)
| | | Cost | | Value |
| |
| |
|
| Assets ($): | | | | |
| Investments in securities—See Statement of Investments | | |
| Unaffiliated issuers | | 27,591,448 | | 29,486,854 |
| Affiliated issuers | | 1,242,000 | | 1,242,000 |
| Receivable for investment securities sold | | 174,130 |
| Dividends and interest receivable | | | | 31,582 |
| Prepaid expenses | | | | 857 |
| | | | | 30,935,423 |
| |
| |
|
| Liabilities ($): | | | | |
| Due to The Dreyfus Corporation and affiliates—Note 3(b) | | 20,928 |
| Cash overdraft due to Custodian | | | | 146,891 |
| Payable for investment securities purchased | | 195,359 |
| Accrued expenses | | | | 21,666 |
| | | | | 384,844 |
| |
| |
|
| Net Assets ($) | | | | 30,550,579 |
| |
| |
|
| Composition of Net Assets ($): | | | | |
| Paid-in capital | | | | 26,823,037 |
| Accumulated undistributed investment income—net | | 83,709 |
| Accumulated net realized gain (loss) on investments | | 1,748,427 |
| Accumulated net unrealized appreciation | | |
| (depreciation) on investments | | | | 1,895,406 |
| |
| |
|
| Net Assets ($) | | | | 30,550,579 |
| |
| |
|
| |
| |
| Net Asset Value Per Share | | | | |
| | | Initial Shares | | Service Shares |
| |
| |
|
| Net Assets ($) | | 25,852,563 | | 4,698,016 |
| Shares Outstanding | | 1,867,122 | | 340,176 |
| |
| |
|
| Net Asset Value Per Share ($) | | 13.85 | | 13.81 |
See notes to financial statements.
|
STATEMENT OF OPERATIONS
Six Months Ended June 30, 2005 (Unaudited)
|
| Investment Income ($): | | |
| Income: | | |
| Cash dividends (net of $2,851 foreign taxes withheld at source): | | |
| Unaffiliated issuers | | 211,222 |
| Affiliated issuers | | 21,892 |
| Total Income | | 233,114 |
| Expenses: | | |
| Investment advisory fee—Note 3(a) | | 118,579 |
| Auditing fees | | 13,472 |
| Custodian fees | | 7,251 |
| Distribution fees—Note 3(b) | | 6,116 |
| Prospectus and shareholders' reports | | 3,233 |
| Trustees' fees and expenses—Note 3(c) | | 1,411 |
| Shareholder servicing costs—Note 3(b) | | 827 |
| Legal fees | | 491 |
| Miscellaneous | | 2,416 |
| Total Expenses | | 153,796 |
| Less—waiver of fees due to undertaking—Note 3(a) | | (4,645) |
| Net Expenses | | 149,151 |
| Investment Income—Net | | 83,963 |
| |
|
| Realized and Unrealized Gain (Loss) on Investments—Note 4 ($): |
| Net realized gain (loss) on investments | | 1,849,345 |
| Net unrealized appreciation (depreciation) on investments | | (2,841,609) |
| Net Realized and Unrealized Gain (Loss) on Investments | | (992,264) |
| Net (Decrease) in Net Assets Resulting from Operations | | (908,301) |
See notes to financial statements.
|
STATEMENT OF CHANGES IN NET ASSETS
| | | Six Months Ended | | |
| | | June 30, 2005 | | Year Ended |
| | | (Unaudited) | | December 31, 2004 |
| |
| |
|
| Operations ($): | | | | |
| Investment income—net | | 83,963 | | 171,248 |
| Net realized gain (loss) on investments | | 1,849,345 | | 4,777,637 |
| Net unrealized appreciation | | | | |
| (depreciation) on investments | | (2,841,609) | | (866,908) |
| Net Increase (Decrease) in Net Assets | | | | |
| Resulting from Operations | | (908,301) | | 4,081,977 |
| |
| |
|
| Dividends to Shareholders from ($): | | | | |
| Investment income—net: | | | | |
| Initial shares | | (33,620) | | (178,813) |
| Service shares | | (2,523) | | (28,674) |
| Net realized gain on investments: | | | | |
| Initial shares | | (720,459) | | (2,756,165) |
| Service shares | | (131,069) | | (507,560) |
| Total Dividends | | (887,671) | | (3,471,212) |
| |
| |
|
| Beneficial Interest Transactions ($): | | | | |
| Net proceeds from shares sold: | | | | |
| Initial shares | | 1,010,977 | | 1,068,137 |
| Service shares | | 273,487 | | 713,100 |
| Dividends reinvested: | | | | |
| Initial shares | | 754,079 | | 2,934,978 |
| Service shares | | 133,592 | | 536,234 |
| Cost of shares redeemed: | | | | |
| Initial shares | | (3,340,955) | | (7,150,023) |
| Service shares | | (748,951) | | (1,201,875) |
| Increase (Decrease) in Net Assets from | | | | |
| Beneficial Interest Transactions | | (1,917,771) | | (3,099,449) |
| Total Increase (Decrease) in Net Assets | | (3,713,743) | | (2,488,684) |
| |
| |
|
| Net Assets ($): | | | | |
| Beginning of Period | | 34,264,322 | | 36,753,006 |
| End of Period | | 30,550,579 | | 34,264,322 |
| Undistributed investment income—net | | 83,709 | | 35,889 |
STATEMENT OF CHANGES IN NET ASSETS (continued)
|
| | | Six Months Ended | | |
| | | June 30, 2005 | | Year Ended |
| | | (Unaudited) | | December 31, 2004 |
| |
| |
|
| Capital Share Transactions: | | | | |
| Initial Shares | | | | |
| Shares sold | | 71,610 | | 71,441 |
| Shares issued for dividends reinvested | | 54,683 | | 200,454 |
| Shares redeemed | | (238,118) | | (485,958) |
| Net Increase (Decrease) in Shares Outstanding | | (111,825) | | (214,063) |
| |
| |
|
| Service Shares | | | | |
| Shares sold | | 19,685 | | 48,492 |
| Shares issued for dividends reinvested | | 9,716 | | 36,724 |
| Shares redeemed | | (53,653) | | (82,737) |
| Net Increase (Decrease) in Shares Outstanding | | (24,252) | | 2,479 |
See notes to financial statements.
|
The following tables describe the performance for each share class for the fiscal periods indicated.All information (except portfolio turnover rate) reflects financial results for a single portfolio share. Total return shows how much your investment in the portfolio would have increased (or decreased) during each period, assuming you had reinvested all dividends and distributions.These figures have been derived from the portfolio's financial statements.
| | | Six Months Ended | | | | | | | | | | |
| | | June 30, 2005 | | | | Year Ended December 31, | | |
| | | |
| |
| |
|
| Initial Shares | | (Unaudited) | | 2004 | | 2003 | | 2002 | | 2001 | | 2000 |
| |
| |
| |
| |
| |
| |
|
| Per Share Data ($): | | | | | | | | | | | | |
| Net asset value, | | | | | | | | | | | | |
| beginning of period | | 14.63 | | 14.39 | | 11.04 | | 13.07 | | 14.65 | | 14.64 |
| Investment Operations: | | | | | | | | | | | | |
| Investment income—net a | | .04 | | .07 | | .03 | | .10 | | .14 | | .12 |
| Net realized and unrealized | | | | | | | | | | | | |
| gain (loss) on investments | | (.76) | | 1.82 | | 3.43 | | (2.09) | | (1.30) | | .70 |
| Total from Investment Operations | | (.72) | | 1.89 | | 3.46 | | (1.99) | | (1.16) | | .82 |
| Distributions: | | | | | | | | | | | | |
| Dividends from | | | | | | | | | | | | |
| investment income—net | | (.02) | | (.10) | | (.11) | | (.04) | | (.11) | | (.14) |
| Dividends from net realized | | | | | | | | | | | | |
| gain on investments | | (.04) | | (1.55) | | — | | — | | (.31) | | (.67) |
| Total Distributions | | (.06) | | (1.65) | | (.11) | | (.04) | | (.42) | | (.81) |
| Net asset value, end of period | | 13.85 | | 14.63 | | 14.39 | | 11.04 | | 13.07 | | 14.65 |
| |
| |
| |
| |
| |
| |
|
| Total Return (%) | | (2.60)b | | 13.08 | | 31.74 | | (15.28) | | (7.97) | | 5.70 |
| |
| |
| |
| |
| |
| |
|
| Ratios/Supplemental Data (%): | | | | | | | | | | |
| Ratio of total expenses | | | | | | | | | | | | |
| to average net assets | | .46b | | .93 | | 1.01 | | .99 | | .91 | | .87 |
| Ratio of net expenses | | | | | | | | | | | | |
| to average net assets | | .46b | | .91 | | .97 | | .92 | | .90 | | .87 |
| Ratio of net investment income | | | | | | | | | | | | |
| to average net assets | | .27b | | .50 | | .23 | | .81 | | 1.00 | | .81 |
| Portfolio Turnover Rate | | 46.24b | | 90.27 | | 108.01 | | 148.29 | | 59.85 | | 149.83 |
| |
| |
| |
| |
| |
| |
|
| Net Assets, end of period | | | | | | | | | | | | |
| ($ x 1,000) | | 25,853 | | 28,949 | | 31,557 | | 27,255 | | 39,854 | | 50,671 |
| |
| a | | Based on average shares outstanding at each month end. | | | | | | | | |
| b | | Not annualized. | | | | | | | | | | | | |
| See notes to financial statements. | | | | | | | | | | | | |
FINANCIAL HIGHLIGHTS (continued)
|
| | | Six Months Ended | | | | | | | | | | |
| | | June 30, 2005 | | | | Year Ended December 31, | | |
| | | |
| |
| |
|
| Service Shares | | (Unaudited) | | 2004 | | 2003 | | 2002 | | 2001 | | 2000 a |
| |
| |
| |
| |
| |
| |
|
| Per Share Data ($): | | | | | | | | | | | | |
| Net asset value, | | | | | | | | | | | | |
| beginning of period | | 14.59 | | 14.36 | | 11.02 | | 13.05 | | 14.65 | | 14.65 |
| Investment Operations: | | | | | | | | | | | | |
| Investment income—net | | .03b | | .06b | | .02b | | .08b | | .12b | | — |
| Net realized and unrealized | | | | | | | | | | | | |
| gain (loss) on investments | | (.76) | | 1.80 | | 3.43 | | (2.07) | | (1.31) | | — |
| Total from Investment Operations | | (.73) | | 1.86 | | 3.45 | | (1.99) | | (1.19) | | — |
| Distributions: | | | | | | | | | | | | |
| Dividends from | | | | | | | | | | | | |
| investment income—net | | (.01) | | (.08) | | (.11) | | (.04) | | (.10) | | — |
| Dividends from net realized | | | | | | | | | | | | |
| gain on investments | | (.04) | | (1.55) | | — | | — | | (.31) | | — |
| Total Distributions | | (.05) | | (1.63) | | (.11) | | (.04) | | (.41) | | — |
| Net asset value, end of period | | 13.81 | | 14.59 | | 14.36 | | 11.02 | | 13.05 | | 14.65 |
| |
| |
| |
| |
| |
| |
|
| Total Return (%) | | (2.68)c | | 12.96 | | 31.71 | | (15.32) | | (8.17) | | — |
| |
| |
| |
| |
| |
| |
|
| Ratios/Supplemental Data (%): | | | | | | | | | | |
| Ratio of total expenses | | | | | | | | | | | | |
| to average net assets | | .59c | | 1.18 | | 1.27 | | 1.26 | | 1.24 | | — |
| Ratio of net expenses | | | | | | | | | | | | |
| to average net assets | | .50c | | 1.00 | | 1.00 | | .99 | | 1.00 | | — |
| Ratio of net investment income | | | | | | | | | | | | |
| to average net assets | | .23c | | .42 | | .21 | | .69 | | .92 | | — |
| Portfolio Turnover Rate | | 46.24c | | 90.27 | | 108.01 | | 148.29 | | 59.85 | | 149.83 |
| |
| |
| |
| |
| |
| |
|
| Net Assets, end of period | | | | | | | | | | | | |
| ($ x 1,000) | | 4,698 | | 5,316 | | 5,196 | | 3,910 | | 2,585 | | 1 |
| |
| a | | The portfolio commenced offering Service shares on December 31, 2000. | | | | | | |
| b | | Based on average shares outstanding at each month end. | | | | | | | | |
| c | | Not annualized. | | | | | | | | | | | | |
| See notes to financial statements. | | | | | | | | | | | | |
NOTES TO FINANCIAL STATEMENTS (Unaudited)
NOTE 1—Significant Accounting Policies:
Dreyfus Variable Investment Fund (the "fund") is registered under the Investment Company Act of 1940, as amended (the "Act"), as an open-end management investment company, operating as a series company currently offering twelve series, including the Special Value Portfolio (the "portfolio"). The portfolio is only offered to separate accounts established by insurance companies to fund variable annuity contracts and variable life insurance policies.The portfolio is a diversified series. The portfolio's investment objective is to maximize total return, consisting of capital appreciation and current income. The Dreyfus Corporation ("Dreyfus") serves as the portfolio's investment adviser. Dreyfus is a wholly-owned subsidiary of Mellon Financial Corporation ("Mellon Financial"). Jennison Associates LLC ("Jennison") serves as the portfolio's sub-investment adviser.
Dreyfus Service Corporation (the "Distributor"), a wholly-owned subsidiary of Dreyfus, is the distributor of the portfolio's shares, which are sold without a sales charge.The portfolio is authorized to issue an unlimited number of $.001 par value shares of Beneficial Interest in each of the following classes of shares: Initial and Service. Each class of shares has identical rights and privileges, except with respect to the distribution plan and the expenses borne by each class and certain voting rights. Income, expenses (other than expenses attributable to a specific class), and realized and unrealized gains or losses on investments are allocated to each class of shares based on its relative net assets.
The fund accounts separately for the assets, liabilities and operations of each series. Expenses directly attributable to each series are charged to that series' operations; expenses which are applicable to all series are allocated among them on a pro rata basis.
The portfolio's financial statements are prepared in accordance with U.S. generally accepted accounting principles, which may require the use of management estimates and assumptions.Actual results could differ from those estimates.
NOTES TO FINANCIAL STATEMENTS (Unaudited) (continued)
The fund enters into contracts that contain a variety of indemnifica-tions.The portfolio's maximum exposure under these arrangements is unknown. The portfolio does not anticipate recognizing any loss related to these arrangements.
(a) Portfolio valuation: Investments in securities are valued at the last sales price on the securities exchange or national securities market on which such securities are primarily traded. Securities listed on the National Market System for which market quotations are available are valued at the official closing price or, if there is no official closing price that day, at the last sales price. Securities not listed on an exchange or the national securities market, or securities for which there were no transactions, are valued at the average of the most recent bid and asked prices, except for open short positions, where the asked price is used for valuation purposes. Bid price is used when no asked price is available. Investments in registered investment companies are valued at their net asset value. When market quotations or official closing prices are not readily available, or are determined not to reflect accurately fair value, such as when the value of a security has been significantly affected by events after the close of the exchange or market on which the security is principally traded (for example, a foreign exchange or market), but before the portfolio calculates its net asset value, the portfolio may value these investments at fair value as determined in accordance with the procedures approved by the Board of Trustees. Fair valuing of securities may be determined with the assistance of a pricing service using calculations based on indices of domestic securities and other appropriate indicators, such as prices of relevant ADR's and futures contracts. For other securities that are fair valued by the Board of Trustees, certain factors may be considered such as: fundamental analytical data, the nature and duration of restrictions on disposition, an evaluation of the forces that influence the market in which the securities are purchased and sold, and public trading in similar securities of the issuer or comparable issuers. Financial futures are valued at the last sales price.
(b) Foreign currency transactions: The portfolio does not isolate that portion of the results of operations resulting from changes in foreign exchange rates on investments from the fluctuations arising from changes in market prices of securities held. Such fluctuations are included with the net realized and unrealized gain or loss on investments.
Net realized foreign exchange gains or losses arise from sales and maturities of short-term securities, sales of foreign currencies, currency gains or losses realized on securities transactions and the difference between the amounts of dividends, interest and foreign withholding taxes recorded on the portfolio's books and the U.S. dollar equivalent of the amounts actually received or paid. Net unrealized foreign exchange gains or losses arise from changes in the value of assets and liabilities other than investments in securities, resulting from changes in exchange rates. Such gains and losses are included with net realized and unrealized gain or loss on investments.
(c) Securities transactions and investment income: Securities transactions are recorded on a trade date basis. Realized gain and loss from securities transactions are recorded on the identified cost basis. Dividend income is recognized on the ex-dividend date and interest income, including, where applicable, accretion of discount and amortization of premium on investments, is recognized on the accrual basis.
The portfolio has an arrangement with the custodian bank whereby the portfolio receives earnings credits from the custodian when positive cash balances are maintained, which are used to offset custody fees. For financial reporting purposes, the portfolio includes net earnings credits, if any, as an expense offset in the Statement of Operations.
(d) Affiliated issuers: Investments in other investment companies advised by Dreyfus are defined as "affiliated" in the Act.
(e) Dividends to shareholders: Dividends are recorded on the ex-dividend date. Dividends from investment income-net and dividends
NOTES TO FINANCIAL STATEMENTS (Unaudited) (continued)
from net realized capital gain, if any, are normally declared and paid annually, but the portfolio may make distributions on a more frequent basis to comply with the distribution requirements of the Internal Revenue Code of 1986, as amended (the "Code").To the extent that net realized capital gain can be offset by capital loss carryovers, if any, it is the policy of the portfolio not to distribute such gain. Income and capital gain distributions are determined in accordance with income tax regulations, which may differ from U.S. generally accepted accounting principles.
(f) Federal income taxes: It is the policy of the portfolio to continue to qualify as a regulated investment company, if such qualification is in the best interests of its shareholders, by complying with the applicable provisions of the Code, and to make distributions of taxable income sufficient to relieve it from substantially all federal income and excise taxes.
The tax character of distributions paid to shareholders during the fiscal year ended December 31, 2004, was as follows: ordinary income $1,237,803 and long-term capital gain $2,233,409.The tax character of current year distributions will be determined at the end of the current fiscal year.
NOTE 2—Bank Lines of Credit:
|
The portfolio may borrow up to $5 million for leveraging purposes under a short-term unsecured line of credit and participates with other Dreyfus managed funds in a $100 million unsecured line of credit primarily to be utilized for temporary or emergency purposes including the financing of redemptions. Interest is charged to the portfolio based on prevailing market rates in effect at the time of borrowings. During the period ended June 30, 2005, the portfolio did not borrow under either line of credit.
NOTE 3—Investment Advisory Fee and Other Transactions With Affiliates:
(a) Pursuant to an Investment Advisory Agreement with Dreyfus, the investment advisory fee is computed at the annual rate of .75 of 1% of the value of the portfolio's average daily net assets and is payable monthly.
Pursuant to a Sub-Investment Advisory Agreement between Dreyfus and Jennison, the sub-investment advisory fee is payable monthly by Dreyfus, and is based upon the value of the portfolio's average daily net assets, computed at the following annual rates: .50 of 1% of the first $300 million and .45 of 1% over $300 million.
Dreyfus has agreed, from January 1, 2005 to December 31, 2005 to waive receipt of its fees and/or assume the expenses of the portfolio so that the expenses of neither class, exclusive of taxes, brokerage commissions, interest expense and extraordinary expenses, exceed 1% of the value of the average daily net assets of their class. During the period ended June 30, 2005, Dreyfus waived receipt of fees of $4,645, pursuant to the undertaking.
(b) Under the Distribution Plan (the "Plan") adopted pursuant to Rule 12b-1 under the Act, Service shares pay the Distributor for distributing their shares, for servicing and/or maintaining Service shares shareholder accounts and for advertising and marketing for Service shares.The Plan provides for payments to be made at an annual rate of .25 of 1% of the value of the Service shares' average daily net assets.The Distributor may make payments to Participating Insurance Companies and to brokers and dealers acting as principal underwriter for their variable insurance products.The fees payable under the Plan are payable without regard to actual expenses incurred. During the period ended June 30, 2005, Service shares were charged $6,116 pursuant to the Plan.
The portfolio compensates Dreyfus Transfer, Inc., a wholly-owned subsidiary of Dreyfus, under a transfer agency agreement for providing personnel and facilities to perform transfer agency services for the portfolio. During the period ended June 30, 2005, the portfolio was charged $32 pursuant to the transfer agency agreement.
During the period ended June 30, 2005, the portfolio was charged $1,998 for services performed by the Chief Compliance Officer.
The components of Due to The Dreyfus Corporation and affiliates in the Statement of Assets and Liabilities consist of: investment advisory fees $19,079, Rule 12b-1 distribution plan fees $975, chief compliance
NOTES TO FINANCIAL STATEMENTS (Unaudited) (continued)
officer fees $1,998 and transfer agency per account fees $10, which are offset against an expense reimbursement currently in effect in the amount of $1,134.
(c) Each Board member also serves as a Board member of other funds within the Dreyfus complex. Annual retainer fees and attendance fees are allocated to each fund based on net assets.
(d) Pursuant to an exemptive order from the Securities and Exchange Commission, the portfolio may invest its available cash balances in affiliated money market mutual funds. Management fees of the underlying money market mutual funds have been waived by Dreyfus.
NOTE 4—Securities Transactions:
|
The aggregate amount of purchases and sales of investment securities, excluding short-term securities, during the period ended June 30, 2005, amounted to $14,063,497 and $15,513,670, respectively.
At June 30, 2005, accumulated net unrealized appreciation on investments was $1,895,406, consisting of $2,919,593 gross unrealized appreciation and $1,024,187 gross unrealized depreciation.
At June 30,2005,the cost of investments for federal income tax purposes was substantially the same as the cost for financial reporting purposes (see the Statement of Investments).
In early 2004, two purported class and derivative actions were filed against Mellon Financial, Mellon Bank, N.A., Dreyfus, Founders Asset Management LLC, and certain directors of the Dreyfus Funds and the Dreyfus Founders Funds (together, the "Funds") in the United States District Court for the Western District of Pennsylvania. In September 2004, plaintiffs served a Consolidated Amended Complaint (the "Amended Complaint") on behalf of a purported class of all persons who acquired interests in any of the Funds between January 30, 1999
and November 17, 2003, and derivatively on behalf of the Funds.The Amended Complaint in the newly styled In re Dreyfus Mutual Funds Fee Litigation also named the Distributor, Premier Mutual Fund Services, Inc. and two additional Fund directors as defendants and alleges violations of the Investment Company Act of 1940, the Investment Advisers Act of 1940, the Pennsylvania Unfair Trade Practices and Consumer Protection Law and common-law claims. Plaintiffs seek to recover allegedly improper and excessive Rule 12b-1 and advisory fees allegedly charged to the Funds for marketing and distribution services. More specifically, plaintiffs claim, among other things, that 12b-1 fees and directed brokerage were improperly used to pay brokers to recommend the Funds over other funds, and that such payments were not disclosed to investors. In addition, plaintiffs assert that economies of scale and soft-dollar benefits were not passed on to the Funds. Plaintiffs further allege that 12b-1 fees were improperly charged to certain of the Funds that were closed to new investors.The Amended Complaint seeks compensatory and punitive damages, rescission of the advisory contracts, and an accounting and restitution of any unlawful fees, as well as an award of attorneys' fees and litigation expenses. As noted, some of the claims in this litigation are asserted derivatively on behalf of the Funds that have been named as nominal defendants. With respect to such derivative claims, no relief is sought against the Funds. Dreyfus believes the allegations to be totally without merit and intends to defend the action vigorously. In November 2004, all named defendants moved to dismiss the Amended Complaint in the whole or substantial part. Briefing was completed in May 2005.
Additional lawsuits arising out of these circumstances and presenting similar allegations and requests for relief may be filed against the defendants in the future. Neither Dreyfus nor the Funds believe that any of the pending actions will have a material adverse effect on the Funds or Dreyfus' ability to perform its contract with the Funds.
INFORMATION ABOUT THE REVIEW
AND APPROVAL OF THE PORTFOLIO'S
INVESTMENT ADVISORY AGREEMENT (Unaudited)
|
At separate meetings of the Board of Trustees for the fund held on June 8-9, 2005, the Board considered the re-approval, through its annual renewal date of July 31, 2006, of the Investment Advisory Agreement for the portfolio, pursuant to which Dreyfus provides the portfolio with investment advisory and administrative services, and the Sub-Investment Advisory Agreement ("Sub-Advisory Agreement") between Dreyfus and Jennison Associates LLC ("Jennison"), pursuant to which Jennison provides day-to-day management of the portfolio's portfolio subject to Dreyfus's oversight. The Board members who are not "interested persons" (as defined in the Act (the "Independent Trustees")) of the fund were assisted in their review by independent legal counsel and met with counsel in executive session separate from representatives of Dreyfus and Jennison.
Analysis of Nature, Extent and Quality of Services Provided to the Portfolio. The Board members received a presentation from representatives of Dreyfus regarding services provided to the portfolio and other funds in the Dreyfus fund complex, and discussed the nature, extent and quality of the services provided to the portfolio pursuant to its Investment Advisory Agreement and the Sub-Advisory Agreement. Dreyfus's representatives reviewed the portfolio's distribution of accounts and the relationships Dreyfus has with various intermediaries and the different needs of each. The Board noted that the portfolio's shares were offered only to separate accounts established by insurance companies to fund variable annuity contracts and variable life insurance policies. Dreyfus's representatives noted the diversity of distribution among the funds in the Dreyfus complex, and Dreyfus's corresponding need for broad, deep, and diverse resources to be able to provide ongoing shareholder services to each distribution channel, including that of the portfolio. The Board also reviewed the number of shareholder accounts in the portfolio, as well as the portfolio's asset size.
The Board members also considered Jennison's research and portfolio management capabilities and that Dreyfus also provides oversight of day-to-day portfolio operations, including fund accounting and
administration and assistance in meeting legal and regulatory require-ments.The Board members also considered Dreyfus's extensive administrative, accounting and compliance infrastructure, as well as Dreyfus's supervisory activities over the Sub-Adviser.
Comparative Analysis of the Portfolio's Performance, Investment Advisory Fee and Expense Ratio. The Board members reviewed the portfolio's performance and expense ratios and placed significant emphasis on comparisons to two groups of comparable funds and current and former Lipper category averages, as applicable. The Board reviewed the portfolio's performance, investment advisory and sub-advisory fees, and total expense ratios within these comparison groups and against the portfolio's current and former Lipper category averages, as applicable. The groups of comparable funds were previously approved by the Board for this purpose, and were prepared using a Board-approved selection methodology that was based, in part, on selecting non-affiliated funds reported in the same Lipper category as the portfolio. The Board members discussed the results of the comparisons and noted that the portfolio's Initial shares 3-year and 5-year comparison group rankings were at or slightly below the middle of such group, that the portfolio's Initial shares performance for the 3-year and 5-year periods and the portfolio's Service shares performance for the 3-year period was above the average of its current Lipper category, and that the portfolio's Initial shares performance for the 3-year period was above the average of its comparison group. The Board members generally noted that the portfolio's overall performance was below the averages of its comparison groups and its former Lipper cat-egory.The Board members also discussed the portfolio's expense ratio for each class of shares, noting it is slightly higher than the average for its respective comparison group and ranks in the middle of its respective comparison group.They reviewed the range of management fees in the comparison groups and noted that the portfolio's aggregate investment advisory and sub-advisory fee is in the bottom half (i.e., higher than most of the other funds) of the comparison groups. The
INFORMATION ABOUT THE REVIEW AND APPROVAL OF THE PORTFOLIO'S
INVESTMENT ADVISORY AGREEMENT(Unaudited) (continued)
|
Board members noted Dreyfus's current undertaking to waive or reimburse certain fees and expense, which reduced the expense ratio for the portfolio's Service shares and Initial shares.
Representatives of Dreyfus noted that there are no other mutual funds managed by Dreyfus or its affiliates or the Sub-Adviser or its affiliates, with similar investment objectives, policies and strategies as the fund that were reported in the same Lipper category as the portfolio.The representatives of Dreyfus also noted that there are no separate accounts with investment objectives, policies and strategies similar to the portfolio that are managed by Dreyfus or its affiliates or the Sub-Adviser or its affiliates. Dreyfus's representatives also reviewed the costs associated with distribution through intermediaries.The Board analyzed differences in fees paid to Dreyfus and Jennison and discussed the relationship of the advisory fees paid in light of Dreyfus's and Jennison's performance and the services provided.
Analysis of Profitability and Economies of Scale. Dreyfus's representatives reviewed the dollar amount of expenses allocated and profit received by Dreyfus and the method used to determine such expenses and profit. (The Board members subsequent to the meeting were provided a profitability statement for Jennison with respect to the portfolio.) The Board members received and considered information prepared by an independent consulting firm regarding Dreyfus' approach to allocating costs to, and determining the profitability of, individual funds and the entire Dreyfus mutual fund complex.The consulting firm also analyzed where any economies of scale might emerge as assets grow.The Board members evaluated the analysis in light of the relevant circumstances for the portfolio, including the decline in assets and the extent to which economies of scale would be realized as the portfolio grows and whether fee levels reflect these economies of scale for the benefit of portfolio investors.The Board members also considered potential benefits to Dreyfus from acting as investment adviser and to Jennison and noted the soft dollar arrangements with respect to trading the portfolio's portfolio.
It was noted that the Board members should consider Dreyfus's and Jennison's profitability with respect to the portfolio as part of their evaluation of whether the fee under the Management Agreement and the Sub-Advisory Agreement bears a reasonable relationship to the mix of services provided by Dreyfus and Jennison, including the nature, extent and quality of such services and that a discussion of economies of scale are predicated on increasing assets and that, if a fund's assets had been decreasing, the possibility that Dreyfus and/or Jennison may have realized any economies of scale would be less.The profitability percentages for managing the portfolio were within ranges determined by appropriate court cases to be reasonable given the services rendered and, given the portfolio's overall performance and generally superior service levels provided. The Board also noted the current fee waiver and expense reimbursement arrangement and its effect on profitability of Dreyfus.
At the conclusion of these discussions, each of the Independent Trustees expressed the opinion that he or she had been furnished with sufficient information to make an informed business decision with respect to continuation of the fund's Investment Advisory Agreement and Sub-Investment Advisory Agreement with respect to the portfolio. Based on their discussions and considerations as described above, the Board made the following conclusions and determinations.
- The Board concluded that the nature, extent and quality of the ser- vices provided by Dreyfus and Jennison are adequate and appropriate.
- The Board generally was satisfied with the portfolio's Initial shares 3-year and 5-year performance as compared to its comparison group and current Lipper category averages, the portfolio's Service shares 3-year performance as compared to its current Lipper cate- gory average, and the portfolio's Initial shares rankings in its com- parison group for the 3-year and 5-year periods.
INFORMATION ABOUT THE REVIEW AND APPROVAL OF THE PORTFOLIO'S
INVESTMENT ADVISORY AGREEMENT (Unaudited) (continued)
|
- The Board concluded that the fee paid by the portfolio to Dreyfus (and the fee paid to Jennison by Dreyfus) was reasonable in light of comparative performance and expense and advisory fee informa- tion, including Dreyfus's current undertaking to waive or reimburse certain fees and expenses, costs of the services provided and profits to be realized and benefits derived or to be derived by Dreyfus and Jennison from their relationship with the portfolio.
- The Board determined that, to the extent that material economies of scale had not been shared with the portfolio, the Board would seek to do so.
The Board members considered these conclusions and determinations, along with information received on a routine and regular basis throughout the year, and, without any one factor being dispositive, the Board determined that approval of the fund's Investment Advisory Agreement and Sub-Advisory Agreement, with respect to the portfolio, was in the best interests of the portfolio and its shareholders.
| For More | | Information |
| |
|
| |
| |
| |
| Dreyfus Variable | | Custodian |
| |
| Investment Fund, | | |
| | | The Bank of New York |
| Special Value Portfolio | | |
| | | One Wall Street |
| 200 Park Avenue | | |
| | | New York, NY 10286 |
| New York, NY 10166 | | |
| |
| | | Transfer Agent & |
| |
| Investment Adviser | | Dividend Disbursing Agent |
| |
| The Dreyfus Corporation | | |
| | | Dreyfus Transfer, Inc. |
| 200 Park Avenue | | |
| | | 200 Park Avenue |
| New York, NY 10166 | | |
| | | New York, NY 10166 |
| |
| |
| Sub-Investment Adviser | | Distributor |
| |
| Jennison Associates LLC | | |
| | | Dreyfus Service Corporation |
| 466 Lexington Avenue | | |
| | | 200 Park Avenue |
| New York, NY 10017 | | |
| | | New York, NY 10166 |
Telephone 1-800-554-4611 or 516-338-3300
Mail The Dreyfus Family of Funds, 144 Glenn Curtiss Boulevard, Uniondale, NY 11556-0144 Attn: Institutional Servicing
The portfolio files its complete schedule of portfolio holdings with the Securities and Exchange Commission ("SEC") for the first and third quarters of each fiscal year on Form N-Q. The portfolio's Forms N-Q are available on the SEC's website at http://www.sec.gov and may be reviewed and copied at the SEC's Public Reference Room in Washington, DC. Information on the operation of the Public Reference Room may be obtained by calling 1-800-SEC-0330.
A description of the policies and procedures that the portfolio uses to determine how to vote proxies relating to portfolio securities, and information regarding how the portfolio voted these proxies for the 12-month period ended June 30, 2005, is available at http://www.dreyfus.com and on the SEC's website at http://www.sec.gov. The description of the policies and procedures is also available without charge, upon request, by calling 1-800-645-6561.
© 2005 Dreyfus Service Corporation

| Item 2. | | Code of Ethics. |
| | | Not applicable. |
| Item 3. | | Audit Committee Financial Expert. |
| | | Not applicable. |
| Item 4. | | Principal Accountant Fees and Services. |
| | | Not applicable. |
| Item 5. | | Audit Committee of Listed Registrants. |
| | | Not applicable. |
| Item 6. | | Schedule of Investments. |
| | | Not applicable. |
| Item 7. | | Disclosure of Proxy Voting Policies and Procedures for Closed-End Management |
| | | Investment Companies. |
| | | Not applicable. |
| Item 8. | | Portfolio Managers of Closed-End Management Investment Companies. |
| | | Not applicable. |
| Item 9. | | Purchases of Equity Securities by Closed-End Management Investment Companies and |
| | | Affiliated Purchasers. |
| | | Not applicable. [CLOSED-END FUNDS ONLY] |
| Item 10. | | Submission of Matters to a Vote of Security Holders. |
The Registrant has a Nominating Committee (the "Committee"), which is responsible for selecting and nominating persons for election or appointment by the Registrant's Board as Board members. The Committee has adopted a Nominating Committee Charter (the "Charter"). Pursuant to the Charter, the Committee will consider recommendations for nominees from shareholders submitted to the Secretary of the Registrant, c/o The Dreyfus Corporation Legal Department, 200 Park Avenue, 8th Floor East, New York, New York 10166. A nomination submission must include information regarding the recommended nominee as specified in the Charter. This information includes all information relating to a recommended nominee that is required to be disclosed in solicitations or proxy statements for the election of Board members, as well as information sufficient to evaluate the factors to be considered by the Committee, including character and integrity, business and professional experience, and whether the person has the ability to apply sound and independent business judgment and would act in the interests of the Registrant and its shareholders.
-2-
Nomination submissions are required to be accompanied by a written consent of the individual to stand for election if nominated by the Board and to serve if elected by the shareholders, and such additional information must be provided regarding the recommended nominee as reasonably requested by the Committee.
Item 11. Controls and Procedures.
(a) The Registrant's principal executive and principal financial officers have concluded, based on their evaluation of the Registrant's disclosure controls and procedures as of a date within 90 days of the filing date of this report, that the Registrant's disclosure controls and procedures are reasonably designed to ensure that information required to be disclosed by the Registrant on Form N-CSR is recorded, processed, summarized and reported within the required time periods and that information required to be disclosed by the Registrant in the reports that it files or submits on Form N-CSR is accumulated and communicated to the Registrant's management, including its principal executive and principal financial officers, as appropriate to allow timely decisions regarding required disclosure.
(b) There were no changes to the Registrant's internal control over financial reporting that occurred during the second fiscal quarter of the period covered by this report that have materially affected, or are reasonably likely to materially affect, the Registrant's internal control over financial reporting.
Item 12. Exhibits.
| (a)(1) | | Not applicable. |
| (a)(2) | | Certifications of principal executive and principal financial officers as required by Rule 30a-2(a) |
| under the Investment Company Act of 1940. |
| (a)(3) | | Not applicable. |
| (b) | | Certification of principal executive and principal financial officers as required by Rule 30a-2(b) |
| under the Investment Company Act of 1940. |
SIGNATURES
Pursuant to the requirements of the Securities Exchange Act of 1934 and the Investment Company Act of 1940, the Registrant has duly caused this Report to be signed on its behalf by the undersigned, thereunto duly authorized.
Dreyfus Variable Investment Fund
|
| By: | | /s/Stephen E. Canter |
| | | Stephen E. Canter |
| | | President |
| |
| Date: | | August 10, 2005 |
Pursuant to the requirements of the Securities Exchange Act of 1934 and the Investment Company Act of 1940, this Report has been signed below by the following persons on behalf of the Registrant and in the capacities and on the dates indicated.
| By: | | /s/Stephen E. Canter |
| | | Stephen E. Canter |
| | | Chief Executive Officer |
| |
| Date: | | August 10, 2005 |
| |
| By: | | /s/James Windels |
| | | James Windels |
| | | Chief Financial Officer |
| |
| Date: | | August 10, 2005 |
| |
| EXHIBIT INDEX |
| |
| | | (a)(2) Certifications of principal executive and principal financial officers as required by Rule 30a- |
| | | 2(a) under the Investment Company Act of 1940. (EX-99.CERT) |
| |
| | | (b) Certification of principal executive and principal financial officers as required by Rule 30a- |
| | | 2(b) under the Investment Company Act of 1940. (EX-99.906CERT) |