UNITED STATES
SECURITIES AND EXCHANGE COMMISSION
WASHINGTON, D.C. 20549
FORM N-CSR
CERTIFIED SHAREHOLDER REPORT OF REGISTERED
MANAGEMENT INVESTMENT COMPANIES
Investment Company Act file number: 811-01716
AB CAP FUND, INC.
(Exact name of registrant as specified in charter)
1345 Avenue of the Americas, New York, New York 10105
(Address of principal executive offices) (Zip code)
Joseph J. Mantineo
AllianceBernstein L.P.
1345 Avenue of the Americas
New York, New York 10105
(Name and address of agent for service)
Registrant’s telephone number, including area code: (800) 221-5672
Date of fiscal year end: March 31, 2017
Date of reporting period: March 31, 2017
| ITEM 1. | REPORTS TO STOCKHOLDERS. |
MAR 03.31.17
ANNUAL REPORT
AB EMERGING MARKETS
MULTI-ASSET PORTFOLIO


| | |
| |
| Investment Products Offered | | • Are Not FDIC Insured • May Lose Value • Are Not Bank Guaranteed |
Investors should consider the investment objectives, risks, charges and expenses of the Fund carefully before investing. For copies of our prospectus or summary prospectus, which contain this and other information, visit us online at www.abfunds.com or contact your AB representative. Please read the prospectus and/or summary prospectus carefully before investing.
This shareholder report must be preceded or accompanied by the Fund’s prospectus for individuals who are not current shareholders of the Fund.
You may obtain a description of the Fund’s proxy voting policies and procedures, and information regarding how the Fund voted proxies relating to portfolio securities during the most recent 12-month period ended June 30, without charge. Simply visit AB’s website at www.abfunds.com, or go to the Securities and Exchange Commission’s (the “Commission”) website at www.sec.gov, or call AB at (800) 227 4618.
The Fund files its complete schedule of portfolio holdings with the Commission for the first and third quarters of each fiscal year on Form N-Q. The Fund’s Forms N-Q are available on the Commission’s website at www.sec.gov. The Fund’s Forms N-Q may also be reviewed and copied at the Commission’s Public Reference Room in Washington, DC; information on the operation of the Public Reference Room may be obtained by calling (800) SEC 0330. AB publishes full portfolio holdings for the Fund monthly at www.abfunds.com.
AllianceBernstein Investments, Inc. (ABI) is the distributor of the AB family of mutual funds. ABI is a member of FINRA and is an affiliate of AllianceBernstein L.P., the Adviser of the funds.
The [A/B] logo is a registered service mark of AllianceBernstein and AllianceBernstein® is a registered service mark used by permission of the owner, AllianceBernstein L.P.
| | |
| FROM THE PRESIDENT | |  |
Dear Shareholder,
We are pleased to provide this report for AB Emerging Markets Multi-Asset Portfolio (the “Fund”). Please review the discussion of Fund performance, the market conditions during the reporting period and the Fund’s investment strategy.
As always, AB strives to keep clients ahead of what’s next by:
| + | | Transforming uncommon insights into uncommon knowledge with a global research scope |
| + | | Navigating markets with seasoned investment experience and sophisticated solutions |
| + | | Providing thoughtful investment insights and actionable ideas |
Whether you’re an individual investor or a multi-billion-dollar institution, we put knowledge and experience to work for you.
AB’s global research organization connects and collaborates across platforms and teams to deliver impactful insights and innovative products. Better insights lead to better opportunities—anywhere in the world.
For additional information about AB’s range of products and shareholder resources, please log on to www.abfunds.com.
Thank you for your investment in the AB Mutual Funds.
Sincerely,

Robert M. Keith
President and Chief Executive Officer, AB Mutual Funds
| | |
| abfunds.com | | AB EMERGING MARKETS MULTI-ASSET PORTFOLIO | 1 |
ANNUAL REPORT
May 15, 2017
This report provides management’s discussion of fund performance for AB Emerging Markets Multi-Asset Portfolio for the annual reporting period ended March 31, 2017.
The Fund’s investment objective is to maximize total return. Total return is the sum of capital appreciation and income.
NAV RETURNS AS OF MARCH 31, 2017 (unaudited)
| | | | | | | | |
| | | 6 Months | | | 12 Months | |
| AB EMERGING MARKETS MULTI-ASSET PORTFOLIO | | | | | | | | |
| Class A Shares | | | 3.75% | | | | 11.82% | |
| Class C Shares1 | | | 3.38% | | | | 10.88% | |
| Advisor Class Shares2 | | | 3.90% | | | | 12.07% | |
| Class R Shares2 | | | 3.67% | | | | 11.51% | |
| Class K Shares2 | | | 3.71% | | | | 11.75% | |
| Class I Shares1,2 | | | 3.88% | | | | 12.03% | |
| MSCI EM Index (net) | | | 6.80% | | | | 17.21% | |
| 1 | The returns shown are based on net asset values calculated for shareholder transactions and may differ from the returns shown in the Financial Highlights, which reflects adjustments made to the net asset values in accordance with accounting principles generally accepted in the United States of America. |
| 2 | Please note that these share classes are for investors purchasing shares through accounts established under certain fee-based programs sponsored and maintained by certain broker-dealers and financial intermediaries, institutional pension plans and/or investment advisory clients of, and certain other persons associated with, the Adviser and its affiliates or the Fund. |
INVESTMENT RESULTS
The table above shows the Fund’s performance compared to its benchmark, the Morgan Stanley Capital International Emerging Markets (“MSCI EM”) Index (net), for the six- and 12-month periods ended March 31, 2017.
During both periods, all share classes of the Fund underperformed the benchmark, before sales charges. During the 12-month period, both equity and fixed-income assets detracted, relative to the benchmark. Equity security selection in the utilities, industrial commodities and technology sectors detracted, as did sector overweights in utilities and industrial commodities. However, security selection in consumer staples and financials, along with underweights in telecommunications and consumer cyclicals, contributed. Country selection (a result of bottom-up security analysis combined with fundamental research) contributed to returns, because of an overweight to Morocco. An overweight in Russia detracted from returns.
| | |
| 2 | AB EMERGING MARKETS MULTI-ASSET PORTFOLIO | | abfunds.com |
During the six-month period, fixed-income assets detracted, while equity assets contributed, relative to the benchmark. Security selection within equity sectors contributed to returns, particularly within consumer staples, financials and capital equipment. However, sector selection within equities detracted, because of a sector overweight in industrial commodities and cash positions. Country selection in equity contributed, particularly overweights in Morocco and the US, although an overweight in Russia detracted.
The Fund utilized derivatives for hedging and investment purposes in the form of currency forwards, interest rate swaps and total return swaps, which added to returns for both periods, in absolute terms. Purchased options and variance swaps for hedging purposes added for the six-month period and detracted for the 12-month period. Treasury futures for hedging and investment purposes detracted for both periods. Credit default swaps for hedging and investment purposes detracted for the six-month period and added for the 12-month period.
MARKET REVIEW AND INVESTMENT STRATEGY
Despite several fleeting bouts of volatility, global stocks soared during the 12-month period ended March 31, 2017. US and emerging-market equities led, with high double-digit gains, followed by non-US stocks.
In fixed-income markets, global bonds increased in absolute terms (bond yields move inversely to price). Investment-grade credit securities, developed-market treasuries and emerging-market local-currency government bonds all ended the period in positive territory, but lagged the double-digit returns of global high yield. Yields in developed markets had varying performance, generally rising in the US and Canada, falling in the UK, and moving in different directions elsewhere.
Unexpected political victories surprised both equity and fixed-income markets during the period. The two biggest upsets—the UK’s decision to leave the European Union (“Brexit”) and Donald Trump’s presidential win in the US—appeared most likely to impact economic and trade policies, along with inflation. The fluctuating price of oil also influenced markets during the period, as the potential for an OPEC production cut waxed and waned.
Varying central bank measures also played a role. Throughout the period, European central banks generally adopted an easing bias, particularly on the heels of Brexit, when the Bank of England cut rates to a new historic low. At the opposite end of the spectrum, the US Federal Reserve raised official rates twice while telegraphing that further increases lay ahead.
| | |
| abfunds.com | | AB EMERGING MARKETS MULTI-ASSET PORTFOLIO | 3 |
INVESTMENT POLICIES
The Fund invests at least 80% of its net assets under normal circumstances in securities of emerging-market issuers and/or the currencies of emerging-market countries. Examples of emerging-market countries include Argentina, Brazil, Chile, Croatia, Egypt, Hong Kong, India, Indonesia, Israel, Kazakhstan, Malaysia, Mexico, the People’s Republic of China, Peru, the Philippines, Poland, Russia, South Africa, South Korea, Taiwan, Thailand, Turkey and Venezuela. The Fund may invest up to 20% of its net assets in the securities of developed-market issuers.
The Fund invests in equity securities, debt securities and currencies, and does not attempt to maintain a constant or relatively constant allocation among these asset classes. Rather, allocations among asset classes are adjusted based on the Adviser’s view of the relative attractiveness of the asset classes. These allocations are informed by the Adviser’s proprietary asset allocation tools, which are comprised of a series of volatility, correlation and expected return forecasts. The Adviser reviews potential Fund investments in each asset class holistically from a country, currency, sector and security standpoint to optimize overall portfolio construction. Under normal circumstances, the Fund will invest between 30% and 95% of its net assets in equity securities, and between 0% and 65% of its net assets in debt securities, with any remainder held in cash (including foreign currency). The Fund is not constrained based on the country, region, market capitalization, credit quality or duration of its investments and its assets may at times be concentrated in a particular country or region.
The process for selecting equity securities for the Fund is primarily bottom-up. The Adviser seeks to identify stocks that are attractive based on valuation, profitability, earnings quality, business trends, price momentum and other measures. The process for selecting debt securities for the Fund is more top-down. The Adviser believes that inefficiencies in the global debt markets arise from investor emotion, market complexity and conflicting investment agendas. The Adviser combines quantitative forecasts with fundamental credit and economic research in seeking to exploit these inefficiencies. The Adviser seeks to generate returns from the Fund’s fixed-income investments through a combination of country selection, currency allocation, sector analysis and security selection. Debt securities may include those of both corporate and governmental issuers, and may include below investment-grade debt securities (“junk bonds”). The Fund may invest in debt securities with a range of maturities from short- to long-term.
(continued on next page)
| | |
| 4 | AB EMERGING MARKETS MULTI-ASSET PORTFOLIO | | abfunds.com |
The Adviser considers both quantitative and fundamental factors in adjusting the Fund’s currency exposures. In addition to the Fund’s currency exposure that results from its investments in equity and debt securities denominated in foreign currencies (and any related hedging), the Fund may hold foreign currency (or related derivatives) independently of any such investments, and may hold a currency even if the Fund does not hold any securities denominated in that currency.
The Fund expects to utilize derivatives, such as futures contracts, forwards and swaps, and invest in exchange-traded funds (“ETFs”) to a significant extent. Derivatives and ETFs may provide more efficient and economical exposure to market segments than direct investments, and may also be a quicker and more efficient way to alter the portfolio’s exposure than buying and selling direct investments. In determining when and to what extent to enter into derivatives transactions or to invest in ETFs, the Adviser will consider factors such as the relative risks and returns expected of potential investments and the cost of such transactions. Derivatives may also be used for hedging purposes, including to hedge against interest rate, credit and currency fluctuations. The Adviser also expects to use derivatives frequently to effectively leverage the Fund by creating aggregate exposure somewhat in excess of the Fund’s net assets.
| | |
| abfunds.com | | AB EMERGING MARKETS MULTI-ASSET PORTFOLIO | 5 |
DISCLOSURES AND RISKS
Benchmark Disclosure
The MSCI EM Index (net) is unmanaged and does not reflect fees and expenses associated with the active management of a mutual fund portfolio. The MSCI EM Index (free float-adjusted, market capitalization weighted) represents the equity market performance of emerging markets. MSCI makes no express or implied warranties or representations, and shall have no liability whatsoever with respect to any MSCI data contained herein. The MSCI data may not be further redistributed or used as a basis for other indices, any securities or financial products. This report is not approved, reviewed or produced by MSCI. Net returns include the reinvestment of dividends after deduction of non-US withholding tax. An investor cannot invest directly in an index or average, and their results are not indicative of the performance for any specific investment, including the Fund.
A Word About Risk
Emerging Market Risk: Investments in emerging-market countries may involve more risk than investments in other foreign countries because the markets in emerging-market countries are less developed and less liquid, and because these investments may be subject to increased economic, political, regulatory or other uncertainties.
Market Risk: The value of the Fund’s assets will fluctuate as the stock, bond or currency markets fluctuate. The value of the Fund’s investments may decline, sometimes rapidly and unpredictably, simply because of economic changes or other events that affect large portions of the market.
Foreign (Non-US) Risk: Investments in securities of non-US issuers may involve more risk than those of US issuers. These securities may fluctuate more widely in price and may be less liquid due to adverse market, economic, political, regulatory or other factors.
Currency Risk: Fluctuations in currency exchange rates may negatively affect the value of the Fund’s investments or reduce its returns. Emerging-market currencies may be more volatile and less liquid, and subject to significantly greater risk of currency controls and convertibility restrictions, than currencies of developed countries.
Country Concentration Risk: The Fund may not always be diversified among countries or geographic regions and the effect on the Fund’s net asset value (“NAV”) of the specific risks identified above, such as political, regulatory and currency risks, may be magnified due to concentration of the Fund’s investments in a particular country or region.
| | |
| 6 | AB EMERGING MARKETS MULTI-ASSET PORTFOLIO | | abfunds.com |
DISCLOSURES AND RISKS (continued)
Allocation Risk: The allocation of Fund assets among different asset classes, such as equity securities, debt securities and currencies, may have a significant effect on the Fund’s NAV when one of these asset classes is performing better or worse than others. The diversification benefits typically associated with investing in both equity and debt securities may be limited in the emerging-markets context, as movements in emerging-market equity and emerging-market debt markets may be more correlated than movements in the equity and debt markets of developed countries.
Capitalization Risk: Investments in small- and mid-capitalization companies may be more volatile than investments in large-capitalization companies. Investments in small-capitalization companies may have additional risks because these companies have limited product lines, markets or financial resources.
Interest Rate Risk: Changes in interest rates will affect the value of investments in fixed-income securities. When interest rates rise, the value of existing investments in fixed-income securities tends to fall and this decrease in value may not be offset by higher income from new investments. The Fund may be subject to heightened interest rate risk due to rising rates as the current period of historically low rates ends. Interest rate risk is generally greater for fixed-income securities with longer maturities or durations.
Credit Risk: An issuer or guarantor of a fixed-income security, or the counterparty to a derivatives or other contract, may be unable or unwilling to make timely payments of interest or principal, or to otherwise honor its obligations. The issuer or guarantor may default, causing a loss of the full principal amount of a security. The degree of risk for a particular security may be reflected in its credit rating. There is the possibility that the credit rating of a fixed-income security may be downgraded after purchase, which may adversely affect the value of the security.
Below Investment Grade Securities: Investments in fixed-income securities with lower ratings (commonly known as “junk bonds”) tend to have a higher probability that an issuer will default or fail to meet its payment obligations. These securities may be subject to greater price volatility due to factors such as specific corporate developments, interest rate sensitivity, negative perceptions of the junk bond market generally, and less secondary market liquidity.
Derivatives Risk: Derivatives may be illiquid, difficult to price and leveraged so that small changes may produce disproportionate losses for the Fund, and may be subject to counterparty risk to a greater degree than more traditional investments.
| | |
| abfunds.com | | AB EMERGING MARKETS MULTI-ASSET PORTFOLIO | 7 |
DISCLOSURES AND RISKS (continued)
Leverage Risk: To the extent the Fund uses leveraging techniques, its NAV may be more volatile because leverage tends to exaggerate the effect of changes in interest rates and any increase or decrease in the value of the Fund’s investments.
Liquidity Risk: Liquidity risk occurs when certain investments become difficult to purchase or sell. Difficulty in selling less liquid securities may result in sales at disadvantageous prices affecting the value of your investment in the Fund. Causes of liquidity risk may include low trading volumes, large positions and heavy redemptions of Fund shares. Over recent years liquidity risk has also increased because the capacity of dealers in the secondary market for fixed-income securities to make markets in these securities has decreased, even as the overall bond market has grown significantly, due to, among other things, structural changes, additional regulatory requirements and capital and risk restraints that have led to reduced inventories. Liquidity risk may be higher in a rising interest rate environment, when the value and liquidity of fixed-income securities generally decline.
Management Risk: The Fund is subject to management risk because it is an actively managed investment fund. The Adviser will apply its investment techniques and risk analyses in making investment decisions, but there is no guarantee that its techniques will produce the intended results.
These risks are fully discussed in the Fund’s prospectus. As with all investments, you may lose money by investing in the Fund.
An Important Note About Historical Performance
The investment return and principal value of an investment in the Fund will fluctuate, so that shares, when redeemed, may be worth more or less than their original cost. Performance shown in this report represents past performance and does not guarantee future results. Current performance may be lower or higher than the performance information shown. You may obtain performance information current to the most recent month-end by visiting www.abfunds.com.
All fees and expenses related to the operation of the Fund have been deducted. NAV returns do not reflect sales charges; if sales charges were reflected, the Fund’s quoted performance would be lower. SEC returns reflect the applicable sales charges for each share class: a 4.25% maximum front-end sales charge for Class A shares and a 1% 1-year contingent deferred sales charge for Class C shares. Returns for the different share classes will vary due to different expenses associated with each class. Performance assumes reinvestment of distributions and does not account for taxes.
| | |
| 8 | AB EMERGING MARKETS MULTI-ASSET PORTFOLIO | | abfunds.com |
HISTORICAL PERFORMANCE
GROWTH OF A $10,000 INVESTMENT IN THE FUND (unaudited)
8/31/20111 TO 3/31/2017
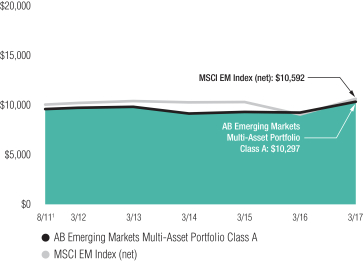
This chart illustrates the total value of an assumed $10,000 investment in AB Emerging Markets Multi-Asset Portfolio Class A shares (from 8/31/20111 to 3/31/2017) as compared to the performance of its benchmark. The chart reflects the deduction of the maximum 4.25% sales charge from the initial $10,000 investment in the Fund and assumes the reinvestment of dividends and capital gains distributions.
| 1 | Inception date: 8/31/2011. |
| | |
| abfunds.com | | AB EMERGING MARKETS MULTI-ASSET PORTFOLIO | 9 |
HISTORICAL PERFORMANCE (continued)
AVERAGE ANNUAL RETURNS AS OF MARCH 31, 2017 (unaudited)
| | | | | | | | |
| | | NAV Returns | | | SEC Returns (reflects applicable
sales charges) | |
| CLASS A SHARES | | | | | | | | |
| 1 Year | | | 11.82% | | | | 7.09% | |
| 5 Years | | | 1.20% | | | | 0.32% | |
| Since Inception1 | | | 1.30% | | | | 0.53% | |
| CLASS C SHARES | | | | | | | | |
| 1 Year | | | 10.88% | | | | 9.88% | |
| 5 Years | | | 0.46% | | | | 0.46% | |
| Since Inception1 | | | 0.57% | | | | 0.57% | |
| ADVISOR CLASS SHARES2 | | | | | | | | |
| 1 Year | | | 12.07% | | | | 12.07% | |
| 5 Years | | | 1.48% | | | | 1.48% | |
| Since Inception1 | | | 1.59% | | | | 1.59% | |
| CLASS R SHARES2 | | | | | | | | |
| 1 Year | | | 11.51% | | | | 11.51% | |
| 5 Years | | | 0.97% | | | | 0.97% | |
| Since Inception1 | | | 1.09% | | | | 1.09% | |
| CLASS K SHARES2 | | | | | | | | |
| 1 Year | | | 11.75% | | | | 11.75% | |
| 5 Years | | | 1.23% | | | | 1.23% | |
| Since Inception1 | | | 1.33% | | | | 1.33% | |
| CLASS I SHARES2 | | | | | | | | |
| 1 Year | | | 12.03% | | | | 12.03% | |
| 5 Years | | | 1.47% | | | | 1.47% | |
| Since Inception1 | | | 1.58% | | | | 1.58% | |
The Fund’s prospectus fee table shows the Fund’s total annual operating expense ratios as 2.71%, 3.49%, 2.43%, 3.16%, 2.70% and 2.33% for Class A, Class C, Advisor Class, Class R, Class K and Class I shares, respectively, gross of any fee waivers or expense reimbursements. Contractual fee waivers and/or expense reimbursements limit the Fund’s annual operating expense ratios exclusive of expenses associated with acquired fund fees and expenses other than the advisory fees of any AB mutual funds in which the Fund may invest, interest expense and extraordinary expenses to 1.24%, 1.99%, 0.99%, 1.49%, 1.24% and 0.99% for Class A, Class C, Advisor Class, Class R, Class K and Class I shares, respectively. These waivers/reimbursements may not be terminated before July 31, 2017. Absent reimbursements or waivers, performance would have been lower. The Financial Highlights section of this report sets forth expense ratio data for the current reporting period; the expense ratios shown above may differ from the expense ratios in the Financial Highlights section since they are based on different time periods.
(footnotes continued on next page)
| | |
| 10 | AB EMERGING MARKETS MULTI-ASSET PORTFOLIO | | abfunds.com |
HISTORICAL PERFORMANCE (continued)
| 1 | Inception date: 8/31/2011. |
| 2 | These share classes are offered at NAV to eligible investors and their SEC returns are the same as their NAV returns. Please note that these share classes are for investors purchasing shares through accounts established under certain fee-based programs sponsored and maintained by certain broker-dealers and financial intermediaries, institutional pension plans and/or investment advisory clients of, and certain other persons associated with, the Adviser and its affiliates or the Fund. |
| | |
| abfunds.com | | AB EMERGING MARKETS MULTI-ASSET PORTFOLIO | 11 |
HISTORICAL PERFORMANCE (continued)
SEC AVERAGE ANNUAL RETURNS
AS OF THE MOST RECENT CALENDAR QUARTER-END
MARCH 31, 2017 (unaudited)
| | | | |
| | | SEC Returns (reflects applicable
sales charges) | |
| CLASS A SHARES | | | | |
| 1 Year | | | 7.09% | |
| 5 Years | | | 0.32% | |
| Since Inception1 | | | 0.53% | |
| CLASS C SHARES | | | | |
| 1 Year | | | 9.88% | |
| 5 Years | | | 0.46% | |
| Since Inception1 | | | 0.57% | |
| ADVISOR CLASS SHARES2 | | | | |
| 1 Year | | | 12.07% | |
| 5 Years | | | 1.48% | |
| Since Inception1 | | | 1.59% | |
| CLASS R SHARES2 | | | | |
| 1 Year | | | 11.51% | |
| 5 Years | | | 0.97% | |
| Since Inception1 | | | 1.09% | |
| CLASS K SHARES2 | | | | |
| 1 Year | | | 11.75% | |
| 5 Years | | | 1.23% | |
| Since Inception1 | | | 1.33% | |
| CLASS I SHARES2 | | | | |
| 1 Year | | | 12.03% | |
| 5 Years | | | 1.47% | |
| Since Inception1 | | | 1.58% | |
| 1 | Inception date: 8/31/2011. |
| 2 | Please note that these share classes are for investors purchasing shares through accounts established under certain fee-based programs sponsored and maintained by certain broker-dealers and financial intermediaries, institutional pension plans and/or investment advisory clients of, and certain other persons associated with, the Adviser and its affiliates or the Fund. |
| | |
| 12 | AB EMERGING MARKETS MULTI-ASSET PORTFOLIO | | abfunds.com |
EXPENSE EXAMPLE
(unaudited)
As a shareholder of the Fund, you incur two types of costs: (1) transaction costs, including sales charges (loads) on purchase payments, contingent deferred sales charges on redemptions and (2) ongoing costs, including management fees; distribution (12b-1) fees; and other Fund expenses. This example is intended to help you understand your ongoing costs (in dollars) of investing in the Fund and to compare these costs with the ongoing costs of investing in other mutual funds.
The Example is based on an investment of $1,000 invested at the beginning of the period and held for the entire period as indicated below.
Actual Expenses
The table below provides information about actual account values and actual expenses. You may use the information, together with the amount you invested, to estimate the expenses that you paid over the period. Simply divide your account value by $1,000 (for example, an $8,600 account value divided by $1,000 = 8.6), then multiply the result by the number under the heading entitled “Expenses Paid During Period” to estimate the expenses you paid on your account during this period.
Hypothetical Example for Comparison Purposes
The table below also provides information about hypothetical account values and hypothetical expenses based on the Fund’s actual expense ratio and an assumed annual rate of return of 5% before expenses, which is not the Fund’s actual return. The hypothetical account values and expenses may not be used to estimate the actual ending account balance or expenses you paid for the period. You may use this information to compare the ongoing costs of investing in the Fund and other funds by comparing this 5% hypothetical example with the 5% hypothetical examples that appear in the shareholder reports of other funds.
Please note that the expenses shown in the table are meant to highlight your ongoing costs only and do not reflect any transactional costs, such as sales charges (loads), or contingent deferred sales charges on redemptions. Therefore, the hypothetical example is useful in comparing ongoing costs only, and will not help you determine the relative total costs of owning different funds. In addition, if these transactional costs were included, your costs would have been higher.
| | | | | | | | | | | | | | | | | | | | | | | | |
| | | Beginning
Account
Value
10/1/2016 | | | Ending
Account
Value
3/31/2017 | | | Expenses
Paid
During
Period* | | | Annualized
Expense
Ratio* | | | Effective
Expenses
Paid
During
Period+ | | | Effective
Annualized
Expense
Ratio+ | |
| Class A | | | | | | | | | | | | | | | | | | | | | | | | |
Actual | | $ | 1,000 | | | $ | 1,037.50 | | | $ | 7.42 | | | | 1.46 | % | | $ | 7.57 | | | | 1.49 | % |
Hypothetical** | | $ | 1,000 | | | $ | 1,017.65 | | | $ | 7.34 | | | | 1.46 | % | | $ | 7.49 | | | | 1.49 | % |
| | |
| abfunds.com | | AB EMERGING MARKETS MULTI-ASSET PORTFOLIO | 13 |
EXPENSE EXAMPLE (continued)
| | | | | | | | | | | | | | | | | | | | | | | | |
| | | Beginning
Account
Value
10/1/2016 | | | Ending
Account
Value
3/31/2017 | | | Expenses
Paid
During
Period* | | | Annualized
Expense
Ratio* | | | Effective
Expenses
Paid
During
Period+ | | | Effective
Annualized
Expense
Ratio+ | |
| Class C | | | | | | | | | | | | | | | | | | | | | | | | |
Actual | | $ | 1,000 | | | $ | 1,035.00 | | | $ | 11.21 | | | | 2.21 | % | | $ | 11.36 | | | | 2.24 | % |
Hypothetical** | | $ | 1,000 | | | $ | 1,013.91 | | | $ | 11.10 | | | | 2.21 | % | | $ | 11.25 | | | | 2.24 | % |
| Advisor Class | | | | | | | | | | | | | | | | | | | | | | | | |
Actual | | $ | 1,000 | | | $ | 1,039.00 | | | $ | 5.95 | | | | 1.17 | % | | $ | 6.10 | | | | 1.20 | % |
Hypothetical** | | $ | 1,000 | | | $ | 1,019.10 | | | $ | 5.89 | | | | 1.17 | % | | $ | 6.04 | | | | 1.20 | % |
| Class R | | | | | | | | | | | | | | | | | | | | | | | | |
Actual | | $ | 1,000 | | | $ | 1,036.70 | | | $ | 8.68 | | | | 1.71 | % | | $ | 8.78 | | | | 1.73 | % |
Hypothetical** | | $ | 1,000 | | | $ | 1,016.40 | | | $ | 8.60 | | | | 1.71 | % | | $ | 8.70 | | | | 1.73 | % |
| Class K | | | | | | | | | | | | | | | | | | | | | | | | |
Actual | | $ | 1,000 | | | $ | 1,037.10 | | | $ | 7.42 | | | | 1.46 | % | | $ | 7.57 | | | | 1.49 | % |
Hypothetical** | | $ | 1,000 | | | $ | 1,017.65 | | | $ | 7.34 | | | | 1.46 | % | | $ | 7.49 | | | | 1.49 | % |
| Class I | | | | | | | | | | | | | | | | | | | | | | | | |
Actual | | $ | 1,000 | | | $ | 1,040.00 | | | $ | 6.15 | | | | 1.21 | % | | $ | 6.31 | | | | 1.24 | % |
Hypothetical** | | $ | 1,000 | | | $ | 1,018.90 | | | $ | 6.09 | | | | 1.21 | % | | $ | 6.24 | | | | 1.24 | % |
| * | Expenses are equal to the classes’ annualized expense ratios multiplied by the average account value over the period, multiplied by 182/365 (to reflect the one-half year period). |
| ** | Assumes 5% annual return before expenses. |
| + | The Fund’s investments in affiliated/unaffiliated underlying portfolios incur no direct expenses, but bear proportionate shares of the acquired fund fees (i.e., operating, administrative and investment advisory fee) of the affiliated/unaffiliated underlying portfolios. Currently the Adviser has voluntarily agreed to waive its investment advisory fee from the Fund in an amount equal to the Fund’s share of the advisory fees of the affiliated underlying portfolios, as borne indirectly by the Fund as an acquired fund fee and expense. The Fund’s effective expenses are equal to the classes’ annualized expense ratio plus the Fund’s pro-rata share of the weighted average expense ratio of the affiliated/unaffiliated underlying portfolios in which it invests, multiplied by the average account value over the period, multiplied by 182/365 (to reflect the one-half year period). |
| | |
| 14 | AB EMERGING MARKETS MULTI-ASSET PORTFOLIO | | abfunds.com |
PORTFOLIO SUMMARY
March 31, 2017 (unaudited)
PORTFOLIO STATISTICS
Net Assets ($mil): $64.7
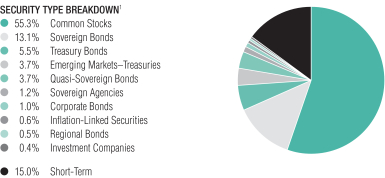
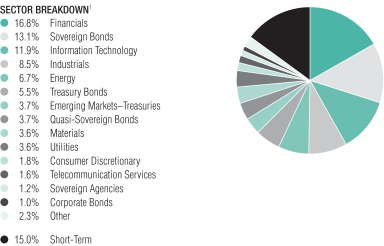
| 1 | All data are as of March 31, 2017. The Fund’s security type and sector breakdowns are expressed as a percentage of total investments and may vary over time. The Fund also enters into derivative transactions, which may be used for hedging or investment purposes (see “Portfolio of Investments” section of the report for additional details). “Other” sector weightings represent 0.6% or less in the following sectors: Consumer Staples, Funds and Investment Trusts, Health Care, Inflation-Linked Securities, Real Estate and Regional Bonds. |
| | |
| abfunds.com | | AB EMERGING MARKETS MULTI-ASSET PORTFOLIO | 15 |
PORTFOLIO SUMMARY (continued)
March 31, 2017 (unaudited)
TEN LARGEST HOLDINGS2
| | | | | | | | |
| Company | | U.S. $ Value | | | Percent of
Net Assets | |
| Brazil Notas do Tesouro Nacional | | $ | 1,650,669 | | | | 2.6 | % |
| LUKOIL PJSC (Sponsored ADR) | | | 1,321,724 | | | | 2.1 | |
| Kingboard Chemical Holdings Ltd. | | | 1,283,856 | | | | 2.0 | |
| Centrais Eletricas Brasileiras SA (Preference Shares) | | | 1,192,116 | | | | 1.8 | |
| Industrial & Commercial Bank of China Ltd. – Class H | | | 1,189,605 | | | | 1.8 | |
| Turkey Government International Bond | | | 1,178,439 | | | | 1.8 | |
| Marubeni Corp. | | | 1,168,060 | | | | 1.8 | |
| Petroleos Mexicanos | | | 1,162,771 | | | | 1.8 | |
| Argentine Republic Government International Bond | | | 1,159,462 | | | | 1.8 | |
| Samsung Electronics Co., Ltd. | | | 990,958 | | | | 1.5 | |
| | $ | 12,297,660 | | | | 19.0 | % |
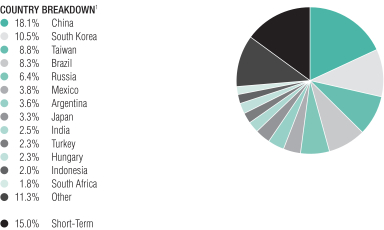
| 1 | All data are as of March 31, 2017. The Fund’s country breakdown is expressed as a percentage of total investments and may vary over time. “Other” country weightings represent 1.1% or less in the following countries: Angola, Cameroon, Chile, Colombia, Costa Rica, Dominican Republic, Ecuador, Egypt, El Salvador, Ethiopia, Gabon, Hong Kong, Jamaica, Kazakhstan, Lebanon, Mongolia, Morocco, Panama, Peru, Poland, Sri Lanka, Thailand, Trinidad and Tobago, Ukraine, United Arab Emirates, United Republic of Tanzania, Uruguay, Venezuela and Vietnam. |
| | |
| 16 | AB EMERGING MARKETS MULTI-ASSET PORTFOLIO | | abfunds.com |
PORTFOLIO OF INVESTMENTS
March 31, 2017
| | | | | | | | | | | | |
| Company | | | | |
Shares | | | U.S. $ Value | |
| |
| | | | | | | | | | | | |
COMMON STOCKS – 54.7% | | | | | | | | | | | | |
Financials – 16.6% | | | | | | | | | | | | |
Banks – 12.6% | | | | | | | | | | | | |
Agricultural Bank of China Ltd. – Class H | | | | | | | 1,121,000 | | | $ | 516,981 | |
Bangkok Bank PCL | | | | | | | 9,500 | | | | 51,422 | |
Bangkok Bank PCL (NVDR) | | | | | | | 20,400 | | | | 107,757 | |
Bank of China Ltd. – Class H | | | | | | | 1,699,000 | | | | 844,881 | |
Bank of Communications Co., Ltd. – Class H | | | | | | | 70,000 | | | | 54,489 | |
China Construction Bank Corp. – Class H | | | | | | | 740,000 | | | | 596,224 | |
Chongqing Rural Commercial Bank Co., Ltd. – Class H | | | | | | | 933,000 | | | | 630,323 | |
DGB Financial Group, Inc. | | | | | | | 34,430 | | | | 333,780 | |
Hana Financial Group, Inc. | | | | | | | 22,220 | | | | 733,216 | |
Industrial & Commercial Bank of China Ltd. – Class H | | | | | | | 1,818,000 | | | | 1,189,605 | |
Industrial Bank of Korea | | | | | | | 61,720 | | | | 672,801 | |
Itausa – Investimentos Itau SA(a) | | | | | | | 2,697 | | | | 5,255 | |
Itausa – Investimentos Itau SA (Preference Shares) | | | | | | | 200,999 | | | | 609,944 | |
KB Financial Group, Inc. | | | | | | | 18,320 | | | | 802,901 | |
OTP Bank PLC | | | | | | | 14,200 | | | | 396,740 | |
Shinhan Financial Group Co., Ltd. | | | | | | | 9,490 | | | | 395,421 | |
Woori Bank | | | | | | | 20,610 | | | | 239,427 | |
| | | | | | | | | | | | |
| | | | | | | | | | | 8,181,167 | |
| | | | | | | | | | | | |
Capital Markets – 1.1% | | | | | | | | | | | | |
China Everbright Ltd. | | | | | | | 168,000 | | | | 339,296 | |
Meritz Securities Co., Ltd. | | | | | | | 106,100 | | | | 353,533 | |
| | | | | | | | | | | | |
| | | | | | | | | | | 692,829 | |
| | | | | | | | | | | | |
Consumer Finance – 0.3% | | | | | | | | | | | | |
Samsung Card Co., Ltd. | | | | | | | 5,520 | | | | 193,608 | |
| | | | | | | | | | | | |
| | | |
Diversified Financial Services – 2.5% | | | | | | | | | | | | |
Fubon Financial Holding Co., Ltd. | | | | | | | 120,000 | | | | 195,726 | |
Power Finance Corp., Ltd. | | | | | | | 280,140 | | | | 629,877 | |
Rural Electrification Corp. Ltd. | | | | | | | 285,670 | | | | 796,603 | |
| | | | | | | | | | | | |
| | | | | | | | | | | 1,622,206 | |
| | | | | | | | | | | | |
Insurance – 0.1% | | | | | | | | | | | | |
Dongbu Insurance Co., Ltd. | | | | | | | 620 | | | | 35,490 | |
| | | | | | | | | | | | |
| | | | | | | | | | | 10,725,300 | |
| | | | | | | | | | | | |
Information Technology – 11.8% | | | | | | | | | | | | |
Electronic Equipment, Instruments & Components – 4.7% | | | | | | | | | | | | |
Hon Hai Precision Industry Co., Ltd. | | | | | | | 217,415 | | | | 652,047 | |
Kingboard Chemical Holdings Ltd. | | | | | | | 347,500 | | | | 1,283,856 | |
| | |
| abfunds.com | | AB EMERGING MARKETS MULTI-ASSET PORTFOLIO | 17 |
PORTFOLIO OF INVESTMENTS (continued)
| | | | | | | | | | | | |
| Company | | | | |
Shares | | | U.S. $ Value | |
| |
| | | | | | | | | | | | |
Largan Precision Co., Ltd. | | | | | | | 1,000 | | | $ | 157,500 | |
Tripod Technology Corp. | | | | | | | 278,000 | | | | 783,244 | |
WPG Holdings Ltd. | | | | | | | 103,000 | | | | 129,334 | |
Zhen Ding Technology Holding Ltd. | | | | | | | 20,000 | | | | 46,996 | |
| | | | | | | | | | | | |
| | | | | | | | | | | 3,052,977 | |
| | | | | | | | | | | | |
Internet Software & Services – 0.6% | | | | | | | | | | | | |
NetEase, Inc. (ADR) | | | | | | | 930 | | | | 264,120 | |
Tencent Holdings Ltd. | | | | | | | 3,900 | | | | 112,357 | |
| | | | | | | | | | | | |
| | | | | | | | | | | 376,477 | |
| | | | | | | | | | | | |
Semiconductors & Semiconductor Equipment – 2.5% | | | | | | | | | | | | |
Hua Hong Semiconductor Ltd.(b) | | | | | | | 205,000 | | | | 287,835 | |
Novatek Microelectronics Corp. | | | | | | | 200,000 | | | | 774,549 | |
Realtek Semiconductor Corp. | | | | | | | 47,000 | | | | 168,050 | |
Taiwan Semiconductor Manufacturing Co., Ltd. | | | | | | | 55,000 | | | | 344,885 | |
Vanguard International Semiconductor Corp. | | | | | | | 27,000 | | | | 51,416 | |
| | | | | | | | | | | | |
| | | | | | | | | | | 1,626,735 | |
| | | | | | | | | | | | |
Technology Hardware, Storage & Peripherals – 4.0% | | | | | | | | | | | | |
Foxconn Technology Co., Ltd. | | | | | | | 104,000 | | | | 317,088 | |
Lite-On Technology Corp. | | | | | | | 106,068 | | | | 182,825 | |
Pegatron Corp. | | | | | | | 180,000 | | | | 532,862 | |
Quanta Computer, Inc. | | | | | | | 120,000 | | | | 243,983 | |
Samsung Electronics Co., Ltd. | | | | | | | 375 | | | | 690,156 | |
Samsung Electronics Co., Ltd. (Preference Shares) | | | | | | | 210 | | | | 300,802 | |
Wistron Corp. | | | | | | | 306,170 | | | | 280,540 | |
| | | | | | | | | | | | |
| | | | | | | | | | | 2,548,256 | |
| | | | | | | | | | | | |
| | | | | | | | | | | 7,604,445 | |
| | | | | | | | | | | | |
Industrials – 8.4% | | | | | | | | | | | | |
Airlines – 0.5% | | | | | | | | | | | | |
Air Arabia PJSC | | | | | | | 1,150,190 | | | | 332,062 | |
| | | | | | | | | | | | |
| | | |
Construction & Engineering – 0.3% | | | | | | | | | | | | |
Hyundai Engineering & Construction Co., Ltd. | | | | | | | 4,070 | | | | 180,308 | |
| | | | | | | | | | | | |
| | | |
Electrical Equipment – 0.4% | | | | | | | | | | | | |
Walsin Lihwa Corp. | | | | | | | 510,000 | | | | 233,661 | |
| | | | | | | | | | | | |
| | | |
Industrial Conglomerates – 0.2% | | | | | | | | | | | | |
Far Eastern New Century Corp. | | | | | | | 148,000 | | | | 128,317 | |
| | | | | | | | | | | | |
| | |
| 18 | AB EMERGING MARKETS MULTI-ASSET PORTFOLIO | | abfunds.com |
PORTFOLIO OF INVESTMENTS (continued)
| | | | | | | | | | | | |
| Company | | | | |
Shares | | | U.S. $ Value | |
| |
| | | | | | | | | | | | |
Machinery – 1.6% | | | | | | | | | | | | |
Hyundai Heavy Industries Co., Ltd.(a)(c)(d) | | | | | | | 1,150 | | | $ | 169,096 | |
Sinotruk Hong Kong Ltd. | | | | | | | 138,500 | | | | 103,995 | |
Yangzijiang Shipbuilding Holdings Ltd. | | | | | | | 953,500 | | | | 769,804 | |
| | | | | | | | | | | | |
| | | | | | | | | | | 1,042,895 | |
| | | | | | | | | | | | |
Trading Companies & Distributors – 3.0% | | | | | | | | | | | | |
Marubeni Corp. | | | | | | | 189,100 | | | | 1,168,060 | |
Sumitomo Corp. | | | | | | | 57,200 | | | | 771,677 | |
| | | | | | | | | | | | |
| | | | | | | | | | | 1,939,737 | |
| | | | | | | | | | | | |
Transportation Infrastructure – 2.4% | | | | | | | | | | | | |
Jiangsu Expressway Co., Ltd. – Class H | | | | | | | 564,000 | | | | 810,190 | |
Zhejiang Expressway Co., Ltd. – Class H | | | | | | | 564,000 | | | | 737,730 | |
| | | | | | | | | | | | |
| | | | | | | | | | | 1,547,920 | |
| | | | | | | | | | | | |
| | | | | | | | | | | 5,404,900 | |
| | | | | | | | | | | | |
Energy – 6.6% | | | | | | | | | | | | |
Oil, Gas & Consumable Fuels – 6.6% | | | | | | | | | | | | |
China Petroleum & Chemical Corp. – Class H | | | | | | | 694,000 | | | | 564,893 | |
Cosan SA Industria e Comercio | | | | | | | 11,400 | | | | 141,508 | |
Gazprom PJSC (Sponsored ADR) | | | | | | | 98,380 | | | | 442,218 | |
LUKOIL PJSC (Sponsored ADR) | | | | | | | 24,910 | | | | 1,321,724 | |
MOL Hungarian Oil & Gas PLC | | | | | | | 9,280 | | | | 635,413 | |
Petroleo Brasileiro SA(a) | | | | | | | 35,400 | | | | 171,312 | |
Tatneft PJSC (Sponsored ADR) | | | | | | | 16,720 | | | | 615,638 | |
YPF SA (Sponsored ADR) | | | | | | | 16,740 | | | | 406,447 | |
| | | | | | | | | | | | |
| | | | | | | | | | | 4,299,153 | |
| | | | | | | | | | | | |
Materials – 3.6% | | | | | | | | | | | | |
Chemicals – 2.0% | | | | | | | | | | | | |
Formosa Chemicals & Fibre Corp. | | | | | | | 32,000 | | | | 99,553 | |
Hyosung Corp. | | | | | | | 3,440 | | | | 416,864 | |
Mitsubishi Gas Chemical Co., Inc. | | | | | | | 6,600 | | | | 137,468 | |
Sinopec Shanghai Petrochemical Co., Ltd. – Class H | | | | | | | 1,120,000 | | | | 621,600 | |
| | | | | | | | | | | | |
| | | | | | | | | | | 1,275,485 | |
| | | | | | | | | | | | |
Metals & Mining – 1.6% | | | | | | | | | | | | |
Gerdau SA (Preference Shares) | | | | | | | 52,600 | | | | 182,973 | |
Novolipetsk Steel PJSC (GDR)(b) | | | | | | | 11,360 | | | | 225,797 | |
POSCO | | | | | | | 2,280 | | | | 592,175 | |
Severstal PJSC (GDR)(b) | | | | | | | 3,220 | | | | 46,346 | |
| | | | | | | | | | | | |
| | | | | | | | | | | 1,047,291 | |
| | | | | | | | | | | | |
| | | | | | | | | | | 2,322,776 | |
| | | | | | | | | | | | |
| | |
| abfunds.com | | AB EMERGING MARKETS MULTI-ASSET PORTFOLIO | 19 |
PORTFOLIO OF INVESTMENTS (continued)
| | | | | | | | | | | | |
| Company | | | | |
Shares | | | U.S. $ Value | |
| |
| | | | | | | | | | | | |
Utilities – 3.5% | | | | | | | | | | | | |
Electric Utilities – 2.7% | | | | | | | | | | | | |
Centrais Eletricas Brasileiras SA (Preference Shares)(a) | | | | | | | 169,100 | | | $ | 1,192,116 | |
Cia Energetica de Minas Gerais (Preference Shares) | | | | | | | 157,000 | | | | 517,549 | |
Korea Electric Power Corp. | | | | | | | 1,520 | | | | 63,271 | |
| | | | | | | | | | | | |
| | | | | | | | | | | 1,772,936 | |
| | | | | | | | | | | | |
Independent Power and Renewable Electricity Producers – 0.8% | | | | | | | | | | | | |
Huadian Power International Corp., Ltd. – Class H | | | | | | | 1,024,000 | | | | 436,294 | |
Huaneng Power International, Inc. – Class H | | | | | | | 112,000 | | | | 74,831 | |
| | | | | | | | | | | | |
| | | | | | | | | | | 511,125 | |
| | | | | | | | | | | | |
| | | | | | | | | | | 2,284,061 | |
| | | | | | | | | | | | |
Consumer Discretionary – 1.8% | | | | | | | | | | | | |
Automobiles – 1.0% | | | | | | | | | | | | |
Dongfeng Motor Group Co., Ltd. – Class H | | | | | | | 354,000 | | | | 397,931 | |
Kia Motors Corp. | | | | | | | 8,030 | | | | 266,136 | |
| | | | | | | | | | | | |
| | | | | | | | | | | 664,067 | |
| | | | | | | | | | | | |
Diversified Consumer Services – 0.4% | | | | | | | | | | | | |
TAL Education Group (ADR)(a) | | | | | | | 2,180 | | | | 232,323 | |
| | | | | | | | | | | | |
| | | |
Textiles, Apparel & Luxury Goods – 0.4% | | | | | | | | | | | | |
Luthai Textile Co., Ltd. – Class B | | | | | | | 195,586 | | | | 231,821 | |
Pou Chen Corp. | | | | | | | 27,000 | | | | 37,368 | |
| | | | | | | | | | | | |
| | | | | | | | | | | 269,189 | |
| | | | | | | | | | | | |
| | | | | | | | | | | 1,165,579 | |
| | | | | | | | | | | | |
Telecommunication Services – 1.6% | | | | | | | | | | | | |
Diversified Telecommunication Services – 1.4% | | | | | | | | | | | | |
China Communications Services Corp. Ltd. – Class H | | | | | | | 244,000 | | | | 159,797 | |
China Telecom Corp., Ltd. – Class H | | | | | | | 182,000 | | | | 88,903 | |
China Unicom Hong Kong Ltd. | | | | | | | 40,000 | | | | 53,725 | |
Chunghwa Telecom Co., Ltd. | | | | | | | 34,000 | | | | 115,460 | |
Jasmine Broadband Internet Infrastructure Fund | | | | | | | 595,900 | | | | 201,162 | |
KT Corp. (Sponsored ADR)(a) | | | | | | | 16,660 | | | | 280,388 | |
| | | | | | | | | | | | |
| | | | | | | | | | | 899,435 | |
| | | | | | | | | | | | |
Wireless Telecommunication Services – 0.2% | | | | | | | | | | | | |
China Mobile Ltd. | | | | | | | 10,500 | | | | 115,474 | |
| | | | | | | | | | | | |
| | | | | | | | | | | 1,014,909 | |
| | | | | | | | | | | | |
| | |
| 20 | AB EMERGING MARKETS MULTI-ASSET PORTFOLIO | | abfunds.com |
PORTFOLIO OF INVESTMENTS (continued)
| | | | | | | | | | | | |
| Company | | | | |
Shares | | | U.S. $ Value | |
| |
| | | | | | | | | | | | |
Real Estate – 0.4% | | | | | | | | | | | | |
Real Estate Management & Development – 0.4% | | | | | | | | | | | | |
Aldar Properties PJSC | | | | | | | 221,990 | | | $ | 136,623 | |
Kaisa Group Holdings Ltd.(a) | | | | | | | 223,000 | | | | 78,910 | |
Wharf Holdings Ltd. (The) | | | | | | | 9,000 | | | | 77,346 | |
| | | | | | | | | | | | |
| | | | | | | | | | | 292,879 | |
| | | | | | | | | | | | |
Consumer Staples – 0.3% | | | | | | | | | | | | |
Food & Staples Retailing – 0.1% | | | | | | | | | | | | |
X5 Retail Group NV (GDR)(a)(b) | | | | | | | 1,540 | | | | 51,821 | |
| | | | | | | | | | | | |
| | | |
Food Products – 0.2% | | | | | | | | | | | | |
Uni-President Enterprises Corp. | | | | | | | 78,000 | | | | 146,230 | |
| | | | | | | | | | | | |
| | | | | | | | | | | 198,051 | |
| | | | | | | | | | | | |
Health Care – 0.1% | | | | | | | | | | | | |
Pharmaceuticals – 0.1% | | | | | | | | | | | | |
Richter Gedeon Nyrt | | | | | | | 2,240 | | | | 50,874 | |
| | | | | | | | | | | | |
| | | |
Total Common Stocks
(cost $32,703,676) | | | | | | | | | | | 35,362,927 | |
| | | | | | | | | | | | |
| | | |
| | | | | | Principal
Amount
(000) | | | | |
FIXED INCOME SECURITIES – 28.9% | | | | | | | | | | | | |
Sovereign Bonds – 12.9% | | | | | | | | | | | | |
Argentine Republic Government International Bond | | | | | | | | | | | | |
5.625%, 1/26/22(b) | | | U.S.$ | | | | 240 | | | | 245,760 | |
6.875%, 1/26/27(b) | | | | | | | 205 | | | | 207,870 | |
7.50%, 4/22/26(b) | | | | | | | 664 | | | | 705,832 | |
Costa Rica Government International Bond
7.00%, 4/04/44(b) | | | | | | | 200 | | | | 202,500 | |
Dominican Republic International Bond | | | | | | | | | | | | |
5.875%, 4/18/24(b) | | | | | | | 225 | | | | 235,687 | |
5.95%, 1/25/27(b) | | | | | | | 124 | | | | 126,790 | |
7.45%, 4/30/44(b) | | | | | | | 154 | | | | 170,170 | |
Ecuador Government International Bond
9.65%, 12/13/26(b) | | | | | | | 200 | | | | 206,000 | |
Egypt Government International Bond
6.125%, 1/31/22(b) | | | | | | | 200 | | | | 207,750 | |
El Salvador Government International Bond | | | | | | | | | | | | |
6.375%, 1/18/27(b) | | | | | | | 49 | | | | 43,855 | |
7.65%, 6/15/35(b) | | | | | | | 19 | | | | 17,718 | |
8.625%, 2/28/29(b) | | | | | | | 39 | | | | 40,170 | |
| | |
| abfunds.com | | AB EMERGING MARKETS MULTI-ASSET PORTFOLIO | 21 |
PORTFOLIO OF INVESTMENTS (continued)
| | | | | | | | | | | | |
| | | | | | Principal
Amount
(000) | | | U.S. $ Value | |
| |
| | | | | | | | | | | | |
Ethiopia International Bond
6.625%, 12/11/24(b) | | | U.S.$ | | | | 203 | | | $ | 194,119 | |
Gabon Government International Bond
6.375%, 12/12/24(b) | | | | | | | 200 | | | | 193,000 | |
Hungary Government International Bond
5.75%, 11/22/23 | | | | | | | 146 | | | | 165,163 | |
Indonesia Government International Bond
3.375%, 4/15/23(b) | | | | | | | 644 | | | | 643,195 | |
Jamaica Government International Bond
8.00%, 3/15/39 | | | | | | | 108 | | | | 123,795 | |
Kazakhstan Government International Bond
4.875%, 10/14/44(b) | | | | | | | 200 | | | | 196,250 | |
Lebanon Government International Bond
8.25%, 4/12/21(b) | | | | | | | 78 | | | | 86,346 | |
Series E
6.10%, 10/04/22(b) | | | | | | | 40 | | | | 41,050 | |
Mexico Government International Bond | | | | | | | | | | | | |
4.00%, 10/02/23 | | | | | | | 72 | | | | 74,250 | |
4.125%, 1/21/26 | | | | | | | 286 | | | | 294,008 | |
4.75%, 3/08/44 | | | | | | | 98 | | | | 95,428 | |
5.55%, 1/21/45 | | | | | | | 188 | | | | 203,040 | |
Panama Government International Bond
4.00%, 9/22/24 | | | | | | | 200 | | | | 208,250 | |
Perusahaan Penerbit SBSN Indonesia III
4.35%, 9/10/24(b) | | | | | | | 200 | | | | 207,000 | |
Peruvian Government International Bond
4.125%, 8/25/27 | | | | | | | 78 | | | | 83,850 | |
Republic of Angola Via Northern Lights III BV
7.00%, 8/17/19(b) | | | | | | | 156 | | | | 160,742 | |
Republic of Cameroon International Bond
9.50%, 11/19/25(b) | | | | | | | 200 | | | | 225,500 | |
Republic of Poland Government International Bond
3.25%, 4/06/26 | | | | | | | 40 | | | | 39,650 | |
4.00%, 1/22/24 | | | | | | | 61 | | | | 64,050 | |
5.00%, 3/23/22 | | | | | | | 87 | | | | 95,591 | |
Republic of South Africa Government International Bond
5.875%, 9/16/25 | | | | | | | 200 | | | | 214,750 | |
Russian Foreign Bond – Eurobond | | | | | | | | | | | | |
4.875%, 9/16/23(b) | | | | | | | 200 | | | | 214,300 | |
5.00%, 4/29/20(b) | | | | | | | 100 | | | | 106,750 | |
5.625%, 4/04/42(b) | | | | | | | 200 | | | | 219,200 | |
Tanzania Government International Bond
7.421% (LIBOR 6 Month + 6.00%), 3/09/20(b)(e) | | | | | | | 133 | | | | 140,833 | |
| | |
| 22 | AB EMERGING MARKETS MULTI-ASSET PORTFOLIO | | abfunds.com |
PORTFOLIO OF INVESTMENTS (continued)
| | | | | | | | | | | | |
| | | | | | Principal
Amount
(000) | | | U.S. $ Value | |
| |
| | | | | | | | | | | | |
Turkey Government International Bond
3.25%, 3/23/23 | | U.S.$ | | | | | 230 | | | $ | 210,450 | |
4.875%, 10/09/26-4/16/43 | | | | | | | 400 | | | | 363,500 | |
6.00%, 3/25/27 | | | | | | | 272 | | | | 282,608 | |
7.00%, 6/05/20 | | | | | | | 95 | | | | 103,550 | |
7.375%, 2/05/25 | | | | | | | 193 | | | | 218,331 | |
Ukraine Government International Bond
7.75%, 9/01/22-9/01/24(b) | | | | | | | 451 | | | | 429,060 | |
Uruguay Government International Bond
5.10%, 6/18/50 | | | | | | | 43 | | | | 41,441 | |
| | | | | | | | | | | | |
| | | |
Total Sovereign Bonds
(cost $8,239,443) | | | | | | | | | | | 8,349,152 | |
| | | | | | | | | | | | |
| | | |
Treasury Bonds – 5.4% | | | | | | | | | | | | |
Colombian TES
Series B
7.00%, 5/04/22 | | | COP | | | | 545,100 | | | | 195,693 | |
10.00%, 7/24/24 | | | | | | | 454,000 | | | | 189,541 | |
Indonesia Treasury Bond
Series FR56
8.375%, 9/15/26 | | | IDR | | | | 783,000 | | | | 63,710 | |
Series FR70
8.375%, 3/15/24 | | | | | | | 4,414,000 | | | | 353,946 | |
Mexican Bonos
Series M
6.50%, 6/10/21 | | | MXN | | | | 8,961 | | | | 471,731 | |
Peru Government Bond
6.35%, 8/12/28 | | | PEN | | | | 170 | | | | 54,278 | |
6.95%, 8/12/31 | | | | | | | 386 | | | | 127,750 | |
Peruvian Government International Bond
6.35%, 8/12/28(b) | | | | | | | 709 | | | | 226,371 | |
Republic of Poland Government Bond
Series 0725
3.25%, 7/25/25 | | | PLN | | | | 996 | | | | 250,717 | |
Republic of South Africa Government Bond
Series 2048
8.75%, 2/28/48 | | | ZAR | | | | 5,184 | | | | 348,699 | |
Series R186
10.50%, 12/21/26 | | | | | | | 4,286 | | | | 352,309 | |
Russian Federal Bond – OFZ
7.00%, 8/16/23 | | | RUB | | | | 4,752 | | | | 80,710 | |
Series 6212
7.05%, 1/19/28 | | | | | | | 33,787 | | | | 564,042 | |
Series 6215
7.00%, 8/16/23 | | | | | | | 11,139 | | | | 189,189 | |
| | |
| abfunds.com | | AB EMERGING MARKETS MULTI-ASSET PORTFOLIO | 23 |
PORTFOLIO OF INVESTMENTS (continued)
| | | | | | | | | | | | |
| | | | | | Principal
Amount
(000) | | | U.S. $ Value | |
| |
| | | | | | | | | | | | |
Sri Lanka Government Bonds
Series A
11.50%, 8/01/26 | | | LKR | | | | 6,000 | | | $ | 36,392 | |
| | | | | | | | | | | | |
| | | |
Total Treasury Bonds
(cost $3,263,959) | | | | | | | | | | | 3,505,078 | |
| | | | | | | | | | | | |
| | | |
Emerging Markets - Treasuries – 3.7% | | | | | | | | | | | | |
Argentine Bonos del Tesoro
15.50%, 10/17/26 | | | ARS | | | | 1,297 | | | | 87,699 | |
16.00%, 10/17/23 | | | | | | | 1,322 | | | | 88,784 | |
18.20%, 10/03/21 | | | | | | | 2,737 | | | | 191,122 | |
21.20%, 9/19/18 | | | | | | | 1,230 | | | | 83,537 | |
Brazil Notas do Tesouro Nacional
Series F
10.00%, 1/01/21-1/01/25 | | | BRL | | | | 4,458 | | | | 1,425,287 | |
Dominican Republic International Bond
16.00%, 7/10/20(f) | | | DOP | | | | 7,100 | | | | 174,481 | |
Sri Lanka Government Bonds
Series A
10.75%, 3/01/21 | | | LKR | | | | 6,000 | | | | 37,296 | |
Turkey Government Bond
8.00%, 3/12/25 | | | TRY | | | | 719 | | | | 169,243 | |
10.60%, 2/11/26 | | | | | | | 115 | | | | 31,489 | |
11.00%, 2/24/27 | | | | | | | 354 | | | | 100,089 | |
| | | | | | | | | | | | |
| | | |
Total Emerging Markets – Treasuries
(cost $2,200,488) | | | | | | | | | | | 2,389,027 | |
| | | | | | | | | | | | |
| | | |
Quasi-Sovereign Bonds – 3.6% | | | | | | | | | | | | |
Empresa Nacional del Petroleo
3.75%, 8/05/26(b) | | | U.S.$ | | | | 200 | | | | 193,500 | |
Eskom Holdings SOC Ltd.
7.125%, 2/11/25(b) | | | | | | | 200 | | | | 202,100 | |
Magyar Export-Import Bank Zrt
4.00%, 1/30/20(b) | | | | | | | 200 | | | | 204,250 | |
Petroleos de Venezuela SA
6.00%, 11/15/26(b) | | | | | | | 154 | | | | 52,761 | |
8.50%, 10/27/20(b) | | | | | | | 150 | | | | 111,000 | |
Petroleos Mexicanos
4.25%, 1/15/25 | | | | | | | 48 | | | | 46,224 | |
4.77% (LIBOR 3 Month + 3.65%), 3/11/22(b)(e) | | | | | | | 405 | | | | 435,608 | |
5.50%, 6/27/44 | | | | | | | 62 | | | | 54,563 | |
5.625%, 1/23/46 | | | | | | | 44 | | | | 39,340 | |
6.75%, 9/21/47 | | | | | | | 254 | | | | 257,650 | |
6.875%, 8/04/26 | | | | | | | 297 | | | | 329,386 | |
| | |
| 24 | AB EMERGING MARKETS MULTI-ASSET PORTFOLIO | | abfunds.com |
PORTFOLIO OF INVESTMENTS (continued)
| | | | | | | | | | | | |
| | | | | | Principal
Amount
(000) | | | U.S. $ Value | |
| |
| | | | | | | | | | | | |
Trade & Development Bank of Mongolia LLC
9.375%, 5/19/20(b) | | | U.S.$ | | | | 200 | | | $ | 213,250 | |
Trinidad Generation UnLtd.
5.25%, 11/04/27(b) | | | | | | | 200 | | | | 199,700 | |
| | | | | | | | | | | | |
| | | |
Total Quasi-Sovereign Bonds
(cost $2,280,999) | | | | | | | | | | | 2,339,332 | |
| | | | | | | | | | | | |
| | | |
Sovereign Agencies – 1.2% | | | | | | | | | | | | |
Banco do Brasil SA/Cayman
9.00%, 6/18/24(b)(g) | | | | | | | 200 | | | | 205,000 | |
Ecopetrol SA
5.875%, 9/18/23 | | | | | | | 200 | | | | 216,450 | |
OCP SA
5.625%, 4/25/24(b) | | | | | | | 200 | | | | 214,100 | |
Petrobras Global Finance BV
6.125%, 1/17/22 | | | | | | | 35 | | | | 36,533 | |
6.85%, 6/05/15 | | | | | | | 23 | | | | 20,556 | |
8.75%, 5/23/26 | | | | | | | 52 | | | | 59,956 | |
| | | | | | | | | | | | |
| | | |
Total Sovereign Agencies
(cost $727,361) | | | | | | | | | | | 752,595 | |
| | | | | | | | | | | | |
| | | |
Corporate Bonds – 1.0% | | | | | | | | | | | | |
Indiabulls Housing Finance Ltd.
8.567%, 10/15/19(b) | | | INR | | | | 10,000 | | | | 150,920 | |
Marfrig Holdings Europe BV
8.00%, 6/08/23(b) | | | U.S.$ | | | | 200 | | | | 207,960 | |
Minerva Luxembourg SA
6.50%, 9/20/26(b) | | | | | | | 200 | | | | 194,676 | |
Odebrecht Finance Ltd.
7.125%, 6/26/42(b) | | | | | | | 200 | | | | 71,000 | |
Tonon Luxembourg SA
7.25% (7.25% Cash or 9.25% PIK), 1/24/20(a)(f)(h)(i) | | | | | | | 285 | | | | 31,347 | |
Virgolino de Oliveira Finance SA
11.75%, 2/09/22(a)(f)(h) | | | | | | | 202 | | | | 15,150 | |
| | | | | | | | | | | | |
| | | |
Total Corporate Bonds
(cost $1,040,328) | | | | | | | | | | | 671,053 | |
| | | | | | | | | | | | |
| | | |
Inflation-Linked Securities – 0.6% | | | | | | | | | | | | |
Brazil Notas do Tesouro Nacional
Series B
6.00%, 8/15/22-8/15/50 | | | BRL | | | | 217 | | | | 225,382 | |
Mexican Udibonos
Series S
4.00%, 6/13/19 | | | MXN | | | | 2,834 | | | | 154,299 | |
| | | | | | | | | | | | |
| | | |
Total Inflation-Linked Securities
(cost $341,711) | | | | | | | | | | | 379,681 | |
| | | | | | | | | | | | |
| | |
| abfunds.com | | AB EMERGING MARKETS MULTI-ASSET PORTFOLIO | 25 |
PORTFOLIO OF INVESTMENTS (continued)
| | | | | | | | | | | | |
| Company | | | | | Principal
Amount
(000) | | | U.S. $ Value | |
| |
| | | | | | | | | | | | |
| Regional Bonds – 0.5% | | | | | | | | | | | | |
Provincia de Buenos Aires/Argentina
5.75%, 6/15/19(b) | | | U.S.$ | | | | 150 | | | $ | 154,875 | |
Provincia de Cordoba
7.125%, 6/10/21(b) | | | | | | | 150 | | | | 154,875 | |
| | | | | | | | | | | | |
| | | |
Total Regional Bonds
(cost $300,000) | | | | | | | | | | | 309,750 | |
| | | | | | | | | | | | |
| | | |
Total Fixed Income Securities
(cost $18,394,289) | | | | | | | | | | | 18,695,668 | |
| | | | | | | | | | | | |
| | | |
| | | | | | Shares | | | | |
INVESTMENT COMPANIES – 0.4% | | | | | | | | | | | | |
Funds and Investment Trusts – 0.4% | | | | | | | | | | | | |
VFMVN30 ETF Fund(a)
(cost $216,656) | | | | | | | 516,760 | | | | 256,739 | |
| | | | | | | | | | | | |
| | | | | | | | | | | | |
SHORT-TERM INVESTMENTS – 14.8% | | | | | | | | | | | | |
Investment Companies – 14.4% | | | | | | | | | | | | |
AB Fixed Income Shares, Inc. – Government Money Market Portfolio – Class AB, 0.54%(j)(k)
(cost $9,352,221) | | | | | | | 9,352,221 | | | | 9,352,221 | |
| | | | | | | | | | | | |
| | | |
| | | | | | Principal
Amount
(000) | | | | |
Time Deposits – 0.3% | | | | | | | | | | | | |
BBH, Grand Cayman
(0.574)%, 4/03/17 | | | EUR | | | | 3 | | | | 2,755 | |
0.005%, 4/03/17 | | | HKD | | | | 59 | | | | 7,624 | |
0.01%, 4/03/17 | | | SGD | | | | 4 | | | | 2,787 | |
0.043%, 4/03/17 | | | NOK | | | | 2 | | | | 200 | |
0.05%, 4/03/17 | | | CAD | | | | 1 | | | | 582 | |
0.05%, 4/03/17 | | | GBP | | | | 1 | | | | 1,614 | |
0.474%, 4/03/17 | | | AUD | | | | 2 | | | | 1,148 | |
5.465%, 4/03/17 | | | ZAR | | | | 39 | | | | 2,930 | |
Sumitomo, Tokyo
(0.27)%, 4/03/17 | | | JPY | | | | 4,575 | | | | 41,095 | |
0.41%, 4/03/17 | | | U.S.$ | | | | 141 | | | | 141,437 | |
| | | | | | | | | | | | |
| | | |
Total Time Deposits
(cost $202,454) | | | | | | | | | | | 202,172 | |
| | | | | | | | | | | | |
| | |
| 26 | AB EMERGING MARKETS MULTI-ASSET PORTFOLIO | | abfunds.com |
PORTFOLIO OF INVESTMENTS (continued)
| | | | | | | | | | | | |
| | | | | | Principal
Amount
(000) | | | U.S. $ Value | |
| |
| | | | | | | | | | | | |
Treasury Bonds – 0.1% | | | | | | | | | | | | |
Nigeria Treasury Bill
Series 364D
0.01%, 7/20/17
(cost $45,829) | | | NGN | | | | 15,193 | | | $ | 46,970 | |
| | | | | | | | | | | | |
| | | |
Total Short-Term Investments
(cost $9,600,504) | | | | | | | | | | | 9,601,363 | |
| | | | | | | | | | | | |
| | | |
Total Investments – 98.8%
(cost $60,915,125) | | | | | | | | | | | 63,916,697 | |
Other assets less liabilities – 1.2% | | | | | | | | | | | 777,555 | |
| | | | | | | | | | | | |
| | | |
Net Assets – 100.0% | | | | | | | | | | $ | 64,694,252 | |
| | | | | | | | | | | | |
FUTURES (see Note D)
| | | | | | | | | | | | | | | | | | | | |
| Type | | Number of
Contracts | | | Expiration
Month | | | Original Value | | | Value at March 31,
2017 | | | Unrealized
Appreciation/
(Depreciation) | |
Purchased Contracts | | | | | | | | | | | | | | | | | | | | |
Mini MSCI Emerging Markets Index Futures | | | 45 | | | | June 2017 | | | $ | 2,183,494 | | | $ | 2,164,860 | | | $ | (18,634 | ) |
U.S. T-Note 10 Yr (CBT) Futures | | | 20 | | | | June 2017 | | | | 2,487,141 | | | | 2,491,250 | | | | 4,109 | |
U.S. T-Note 5 Yr (CBT) Futures | | | 5 | | | | June 2017 | | | | 587,735 | | | | 588,633 | | | | 898 | |
| | | | | | | | | | | | | | | | | | | | |
| | | | | | | | | | | | | | | | | | $ | (13,627 | ) |
| | | | | | | | | | | | | | | | | | | | |
FORWARD CURRENCY EXCHANGE CONTRACTS (see Note D)
| | | | | | | | | | | | | | | | | | | | |
| Counterparty | | Contracts to Deliver (000) | | | In Exchange For (000) | | | Settlement
Date | | | Unrealized
Appreciation/
(Depreciation) | |
Bank of America, NA | | USD | | | 609 | | | RUB | | | 36,034 | | | | 6/15/17 | | | $ | 19,566 | |
Barclays Bank PLC | | HUF | | | 148,223 | | | USD | | | 506 | | | | 6/15/17 | | | | (7,400 | ) |
BNP Paribas SA | | USD | | | 616 | | | EUR | | | 568 | | | | 6/15/17 | | | | (7,738 | ) |
Brown Brothers Harriman & Co. | | EUR | | | 568 | | | USD | | | 609 | | | | 6/15/17 | | | | 1,226 | |
Brown Brothers Harriman & Co. | | HUF | | | 27,709 | | | USD | | | 97 | | | | 6/15/17 | | | | 640 | |
Brown Brothers Harriman & Co. | | USD | | | 404 | | | MXN | | | 7,793 | | | | 6/15/17 | | | | 7,166 | |
Brown Brothers Harriman & Co. | | USD | | | 314 | | | PLN | | | 1,246 | | | | 6/14/17 | | | | 62 | |
Brown Brothers Harriman & Co. | | USD | | | 310 | | | ZAR | | | 3,951 | | | | 6/15/17 | | | | (19,727 | ) |
Brown Brothers Harriman & Co. | | USD | | | 495 | | | TRY | | | 1,874 | | | | 6/15/17 | | | | 10,266 | |
Brown Brothers Harriman & Co. | | USD | | | 107 | | | TRY | | | 397 | | | | 6/15/17 | | | | (299 | ) |
| | |
| abfunds.com | | AB EMERGING MARKETS MULTI-ASSET PORTFOLIO | 27 |
PORTFOLIO OF INVESTMENTS (continued)
| | | | | | | | | | | | | | | | | | | | | | | | |
| Counterparty | | Contracts to Deliver (000) | | | In Exchange For (000) | | | Settlement
Date | | | Unrealized
Appreciation/
(Depreciation) | |
Citibank, NA | | | USD | | | | 608 | | | | ARS | | | | 9,810 | | | | 6/15/17 | | | $ | 8,587 | |
Citibank, NA | | | CLP | | | | 214,718 | | | | USD | | | | 334 | | | | 6/15/17 | | | | 9,656 | |
Citibank, NA | | | USD | | | | 248 | | | | CLP | | | | 163,993 | | | | 6/15/17 | | | | (130 | ) |
Citibank, NA | | | CLP | | | | 53,990 | | | | USD | | | | 81 | | | | 6/15/17 | | | | (142 | ) |
Citibank, NA | | | USD | | | | 403 | | | | COP | | | | 1,193,017 | | | | 6/15/17 | | | | 8,042 | |
Citibank, NA | | | COP | | | | 1,193,017 | | | | USD | | | | 406 | | | | 6/15/17 | | | | (4,479 | ) |
Citibank, NA | | | USD | | | | 58 | | | | INR | | | | 3,801 | | | | 6/15/17 | | | | 744 | |
Citibank, NA | | | USD | | | | 208 | | | | MYR | | | | 931 | | | | 4/13/17 | | | | 2,043 | |
Citibank, NA | | | USD | | | | 501 | | | | MXN | | | | 10,355 | | | | 6/15/17 | | | | 45,809 | |
Citibank, NA | | | PEN | | | | 232 | | | | USD | | | | 71 | | | | 6/15/17 | | | | (192 | ) |
Citibank, NA | | | USD | | | | 247 | | | | PEN | | | | 807 | | | | 6/15/17 | | | | (279 | ) |
Citibank, NA | | | PHP | | | | 5,466 | | | | USD | | | | 108 | | | | 6/15/17 | | | | (150 | ) |
Citibank, NA | | | KRW | | | | 111,610 | | | | USD | | | | 99 | | | | 6/15/17 | | | | (1,381 | ) |
Goldman Sachs Bank USA | | | USD | | | | 603 | | | | BRL | | | | 1,909 | | | | 4/04/17 | | | | 7,276 | |
Goldman Sachs Bank USA | | | BRL | | | | 1,909 | | | | USD | | | | 611 | | | | 4/04/17 | | | | 741 | |
Goldman Sachs Bank USA | | | USD | | | | 611 | | | | BRL | | | | 1,909 | | | | 4/04/17 | | | | (1,152 | ) |
Goldman Sachs Bank USA | | | BRL | | | | 1,909 | | | | USD | | | | 603 | | | | 4/04/17 | | | | (7,276 | ) |
Goldman Sachs Bank USA | | | USD | | | | 331 | | | | INR | | | | 21,830 | | | | 6/15/17 | | | | 3,401 | |
Goldman Sachs Bank USA | | | USD | | | | 335 | | | | MYR | | | | 1,494 | | | | 4/13/17 | | | | 2,119 | |
Goldman Sachs Bank USA | | | USD | | | | 83 | | | | MYR | | | | 367 | | | | 4/24/17 | | | | 117 | |
Goldman Sachs Bank USA | | | TWD | | | | 10,322 | | | | USD | | | | 333 | | | | 6/15/17 | | | | (8,293 | ) |
Goldman Sachs Bank USA | | | USD | | | | 619 | | | | KRW | | | | 692,638 | | | | 6/15/17 | | | | 1,463 | |
JPMorgan Chase Bank, NA | | | USD | | | | 209 | | | | INR | | | | 14,076 | | | | 6/15/17 | | | | 6,666 | |
JPMorgan Chase Bank, NA | | | USD | | | | 632 | | | | TWD | | | | 19,181 | | | | 6/15/17 | | | | 2,109 | |
JPMorgan Chase Bank, NA | | | NGN | | | | 15,193 | | | | USD | | | | 39 | | | | 8/21/17 | | | | (5,182 | ) |
Morgan Stanley Capital Services LLC | | | PEN | | | | 1,091 | | | | USD | | | | 332 | | | | 6/15/17 | | | | (1,906 | ) |
Nomura Global Financial Products, Inc. | | | USD | | | | 331 | | | | INR | | | | 22,460 | | | | 6/15/17 | | | | 13,389 | |
Nomura Global Financial Products, Inc. | | | USD | | | | 338 | | | | TWD | | | | 10,322 | | | | 6/15/17 | | | | 3,249 | |
Nomura Global Financial Products, Inc. | | | KRW | | | | 581,028 | | | | USD | | | | 510 | | | | 6/15/17 | | | | (10,206 | ) |
Standard Chartered Bank | | | PHP | | | | 25,400 | | | | USD | | | | 504 | | | | 6/15/17 | | | | (60 | ) |
| | | | | | | | | | | | | | | | | | | | | | | | |
| | | | | | | | | | | | | | | | | | | | | | $ | 78,345 | |
| | | | | | | | | | | | | | | | | | | | | | | | |
CENTRALLY CLEARED INTEREST RATE SWAPS (see Note D)
| | | | | | | | | | | | | | | | | | | | | | | | |
| | | | | | | | | | | | Rate Type | | | | |
Clearing Broker/ (Exchange) | | Notional
Amount
(000) | | | Termination
Date | | | Payments
made
by the Fund | | | Payments
received
by the
Fund | | | Unrealized
Appreciation/
(Depreciation) | |
Morgan Stanley & Co. LLC/(CME Group) | | | MXN | | | | 2,339 | | | | 12/11/18 | | | | 4 Week TIIE | | | | 6.775 | % | | $ | (711 | ) |
Morgan Stanley & Co. LLC/(CME Group) | | | | | | | 2,950 | | | | 12/12/18 | | | | 4 Week TIIE | | | | 6.840 | % | | | (726 | ) |
| | |
| 28 | AB EMERGING MARKETS MULTI-ASSET PORTFOLIO | | abfunds.com |
PORTFOLIO OF INVESTMENTS (continued)
| | | | | | | | | | | | | | | | | | | | | | | | |
| | | | | | | | | | | | Rate Type | | | | |
Clearing Broker/ (Exchange) | | Notional
Amount
(000) | | | Termination
Date | | | Payments
made
by the Fund | | | Payments
received
by the
Fund | | | Unrealized
Appreciation/
(Depreciation) | |
Morgan Stanley & Co. LLC/(CME Group) | | | MXN | | | | 1,970 | | | | 12/13/18 | | | | 4 Week TIIE | | | | 6.845% | | | $ | (477 | ) |
Morgan Stanley & Co. LLC/(CME Group) | | | | | | | 710 | | | | 12/17/18 | | | | 4 Week TIIE | | | | 7.035% | | | | (52 | ) |
Morgan Stanley & Co. LLC/(CME Group) | | | $ | | | | 271 | | | | 10/11/26 | | | | 1.61% | | | | 3 Month LIBOR | | | | 16,896 | |
Morgan Stanley & Co. LLC/(CME Group) | | | MXN | | | | 591 | | | | 12/01/26 | | | | 7.700% | | | | 4 Week TIIE | | | | (688 | ) |
Morgan Stanley & Co. LLC/(CME Group) | | | | | | | 750 | | | | 12/02/26 | | | | 7.762% | | | | 4 Week TIIE | | | | (1,046 | ) |
Morgan Stanley & Co. LLC/(CME Group) | | | | | | | 500 | | | | 12/03/26 | | | | 7.76% | | | | 4 Week TIIE | | | | (693 | ) |
Morgan Stanley & Co. LLC/(CME Group) | | | | | | | 180 | | | | 12/07/26 | | | | 7.83% | | | | 4 Week TIIE | | | | (296 | ) |
| | | | | | | | | | | | | | | | | | | | | | | | |
| | | | | | | | | | | | | | | | | | | | | | $ | 12,207 | |
| | | | | | | | | | | | | | | | | | | | | | | | |
TOTAL RETURN SWAPS (see Note D)
| | | | | | | | | | | | | | | | | | |
Counterparty &
Referenced Obligation | | # of Shares
or Units | | | Rate Paid/
Received | | Notional
Amount
(000) | | | Maturity
Date | | | Unrealized
Appreciation/
(Depreciation) | |
Receive Total Return on Reference Obligation | | | | | |
JPMorgan Chase Bank, NA | | | | | | | | | | | | | | | | | | |
JPMorgan $ Emerging Markets Bond ETF | | | 3,868 | | | LIBOR Plus 0.75% | | $ | 2,000 | | | | 4/05/17 | | | $ | 14,029 | |
JPMorgan $ Emerging Markets Bond ETF | | | 584 | | | LIBOR Plus 0.75% | | | 300 | | | | 4/05/17 | | | | 4,004 | |
JPMorgan $ Emerging Markets Bond ETF | | | 2,888 | | | LIBOR Plus 0.75% | | | 1,500 | | | | 4/05/17 | | | | 3,766 | |
JPMorgan $ Emerging Markets Bond ETF | | | 1,929 | | | LIBOR Plus 0.75% | | | 1,000 | | | | 4/05/17 | | | | 3,382 | |
JPMorgan $ Emerging Markets Bond ETF | | | 581 | | | LIBOR Plus 0.75% | | | 300 | | | | 4/05/17 | | | | 2,352 | |
| | | | | | | | | | | | | | | | | | |
| | | | | | | | | | | | | | | | $ | 27,533 | |
| | | | | | | | | | | | | | | | | | |
| (a) | Non-income producing security. |
| (b) | Security is exempt from registration under Rule 144A of the Securities Act of 1933. These securities are considered restricted, but liquid and may be resold in transactions exempt from registration, normally to qualified institutional buyers. At March 31, 2017, the aggregate market value of these securities amounted to $9,271,192 or 14.3% of net assets. |
| (d) | Fair valued by the Adviser. |
| (e) | Floating Rate Security. Stated interest/floor rate was in effect at March 31, 2017. |
| | |
| abfunds.com | | AB EMERGING MARKETS MULTI-ASSET PORTFOLIO | 29 |
PORTFOLIO OF INVESTMENTS (continued)
| (f) | Security is exempt from registration under Rule 144A of the Securities Act of 1933. These securities, which represent 0.34% of net assets as of March 31, 2017, are considered illiquid and restricted. Additional information regarding such securities follows: |
| | | | | | | | | | | | | | | | |
144A/Restricted & Illiquid
Securities | | Acquisition
Date | | | Cost | | | Market
Value | | | Percentage of
Net Assets | |
Dominican Republic International Bond
16.00%, 7/10/20 | | | 9/11/12 | | | $ | 200,841 | | | $ | 174,481 | | | | 0.27 | % |
Tonon Luxembourg SA
9.25%, 1/24/20 | | | 7/13/15 – 8/17/15 | | | | 272,560 | | | | 31,347 | | | | 0.05 | % |
Virgolino de Oliveira Finance SA
11.75%, 2/09/22 | | | 7/12/13 | | | | 172,628 | | | | 15,150 | | | | 0.02 | % |
| (g) | Securities are perpetual and, thus, do not have a predetermined maturity date. The date shown, if applicable, reflects the next call date. |
| (i) | Pay-In-Kind Payments (PIK). The issuer may pay cash interest and/or interest in additional debt securities. Rates shown are the rates in effect at March 31, 2017. |
| (j) | To obtain a copy of the fund’s shareholder report, please go to the Securities and Exchange Commission’s website at www.sec.gov. Additionally, shareholder reports for AB funds can be obtained by calling AB at (800) 227-4618. |
| (k) | Investment in affiliated money market mutual fund. The rate shown represents the 7-day yield as of period end. |
| | |
Currency Abbreviation: ARS – Argentine Peso AUD – Australian Dollar BRL – Brazilian Real CAD – Canadian Dollar CLP – Chilean Peso COP – Colombian Peso DOP – Dominican Peso EUR – Euro HKD – Hong Kong Dollar HUF – Hungarian Forint IDR – Indonesian Rupiah INR – Indian Rupee JPY – Japanese Yen KRW – South Korean Won | | LKR – Sri Lankan Rupee MXN – Mexican Peso MYR – Malaysian Ringgit NGN – Nigerian Naira NOK – Norwegian Krone PEN – Peruvian Sol PHP – Philippine Peso PLN – Polish Zloty RUB – Russian Ruble SGD – Singapore Dollar TRY – Turkish Lira TWD – New Taiwan Dollar USD – United States Dollar ZAR – South African Rand |
Glossary:
ADR – American Depositary Receipt
CBT – Chicago Board of Trade
CME – Chicago Mercantile Exchange
ETF – Exchange Traded Fund
GDR – Global Depositary Receipt
LIBOR – London Interbank Offered Rates
MSCI – Morgan Stanley Capital International
NVDR – Non Voting Depositary Receipt
PJSC – Public Joint Stock Company
TIIE – Banco de México Equilibrium Interbank Interest Rate
See notes to financial statements.
| | |
| 30 | AB EMERGING MARKETS MULTI-ASSET PORTFOLIO | | abfunds.com |
STATEMENT OF ASSETS & LIABILITIES
March 31, 2017
| | | | |
| Assets | | | | |
Investments in securities, at value | | | | |
Unaffiliated issuers (cost $51,562,904) | | $ | 54,564,476 | |
Affiliated issuers (cost $9,352,221) | | | 9,352,221 | |
Cash | | | 6,274 | |
Cash collateral due from broker | | | 132,652 | |
Foreign currencies, at value (cost $73,797) | | | 77,066 | |
Receivable for capital stock sold | | | 505,283 | |
Dividends and interest receivable | | | 460,745 | |
Unrealized appreciation on forward currency exchange contracts | | | 154,337 | |
Unrealized appreciation of total return swaps | | | 27,533 | |
Receivable from Adviser | | | 22,457 | |
Affiliated dividends receivable | | | 2,252 | |
| | | | |
Total assets | | | 65,305,296 | |
| | | | |
| Liabilities | | | | |
Payable for investment securities purchased | | | 248,477 | |
Custody fee payable | | | 80,298 | |
Unrealized depreciation on forward currency exchange contracts | | | 75,992 | |
Audit and tax fee payable | | | 69,968 | |
Capital gains tax payable | | | 31,607 | |
Payable for capital stock redeemed | | | 17,252 | |
Payable for variation margin on exchange-traded derivatives | | | 9,076 | |
Transfer Agent fee payable | | | 5,765 | |
Distribution fee payable | | | 1,503 | |
Accrued expenses and other liabilities | | | 71,106 | |
| | | | |
Total liabilities | | | 611,044 | |
| | | | |
Net Assets | | $ | 64,694,252 | |
| | | | |
| Composition of Net Assets | | | | |
Capital stock, at par | | $ | 703 | |
Additional paid-in capital | | | 66,006,793 | |
Distributions in excess of net investment income | | | (293,424 | ) |
Accumulated net realized loss on investment and foreign currency transactions | | | (4,101,908 | ) |
Net unrealized appreciation on investments and foreign currency denominated assets and liabilities | | | 3,082,088 | |
| | | | |
| | $ | 64,694,252 | |
| | | | |
Net Asset Value Per Share—27 billion shares of capital stock authorized, $.0001 par value
| | | | | | | | | | | | |
| Class | | Net Assets | | | Shares
Outstanding | | | Net Asset
Value | |
| |
| A | | $ | 4,763,557 | | | | 517,501 | | | $ | 9.20 | * |
| |
| C | | $ | 496,508 | | | | 54,053 | | | $ | 9.19 | |
| |
| Advisor | | $ | 42,000,313 | | | | 4,553,457 | | | $ | 9.22 | |
| |
| R | | $ | 183,943 | | | | 20,052 | | | $ | 9.17 | |
| |
| K | | $ | 298,284 | | | | 32,546 | | | $ | 9.16 | |
| |
| I | | $ | 16,951,647 | | | | 1,851,010 | | | $ | 9.16 | |
| |
| * | The maximum offering price per share for Class A shares was $9.61, which reflects a sales charge of 4.25%. |
See notes to financial statements.
| | |
| abfunds.com | | AB EMERGING MARKETS MULTI-ASSET PORTFOLIO | 31 |
STATEMENT OF OPERATIONS
Year Ended March 31, 2017
| | | | | | | | |
| Investment Income | | | | | | | | |
Interest (net of foreign taxes withheld of $11,277) | | $ | 1,110,734 | | | | | |
Dividends | | | | | | | | |
Unaffiliated issuers (net of foreign taxes withheld of $76,215) | | | 604,479 | | | | | |
Affiliated issuers | | | 12,260 | | | | | |
Securities lending income | | | 50 | | | $ | 1,727,523 | |
| | | | | | | | |
| Expenses | | | | | | | | |
Advisory fee (see Note B) | | | 382,701 | | | | | |
Transfer agency—Class A | | | 5,467 | | | | | |
Transfer agency—Class C | | | 563 | | | | | |
Transfer agency—Advisor Class | | | 32,985 | | | | | |
Transfer agency—Class R | | | 184 | | | | | |
Transfer agency—Class K | | | 412 | | | | | |
Transfer agency—Class I | | | 3,342 | | | | | |
Distribution fee—Class A | | | 8,290 | | | | | |
Distribution fee—Class C | | | 3,088 | | | | | |
Distribution fee—Class R | | | 445 | | | | | |
Distribution fee—Class K | | | 720 | | | | | |
Custodian | | | 183,269 | | | | | |
Audit and tax | | | 85,492 | | | | | |
Registration fees | | | 80,333 | | | | | |
Administrative | | | 64,739 | | | | | |
Legal | | | 42,297 | | | | | |
Printing | | | 37,398 | | | | | |
Directors’ fees | | | 25,465 | | | | | |
Miscellaneous | | | 80,386 | | | | | |
| | | | | | | | |
Total expenses | | | 1,037,576 | | | | | |
Less: expenses waived and reimbursed by the Adviser (see Note B and Note E) | | | (526,910 | ) | | | | |
| | | | | | | | |
Net expenses | | | | | | | 510,666 | |
| | | | | | | | |
Net investment income | | | | | | | 1,216,857 | |
| | | | | | | | |
| Realized and Unrealized Gain (Loss) on Investment and Foreign Currency Transactions | | | | | | | | |
Net realized gain (loss) on: | | | | | | | | |
Investment transactions | | | | | | | 392,680 | (a) |
Swaps | | | | | | | 160,588 | |
Futures | | | | | | | (178,616 | ) |
Foreign currency transactions | | | | | | | 162,908 | |
Net change in unrealized appreciation/depreciation on: | | | | | | | | |
Investments | | | | | | | 2,803,800 | (b) |
Swaps | | | | | | | (212,000 | ) |
Futures | | | | | | | (35,261 | ) |
Foreign currency denominated assets and liabilities | | | | | | | 25,897 | |
| | | | | | | | |
Net gain on investment and foreign currency transactions | | | | | | | 3,119,996 | |
| | | | | | | | |
Net Increase in Net Assets from Operations | | | | | | $ | 4,336,853 | |
| | | | | | | | |
| (a) | Net of foreign capital gains taxes of $3,537. |
| (b) | Net of increase in accrued foreign capital gains of $30,859. |
See notes to financial statements.
| | |
| 32 | AB EMERGING MARKETS MULTI-ASSET PORTFOLIO | | abfunds.com |
STATEMENT OF CHANGES IN NET ASSETS
| | | | | | | | |
| | | Year Ended
March 31, 2017 | | | Year Ended
March 31, 2016 | |
| Increase (Decrease) in Net Assets from Operations | | | | | | | | |
Net investment income | | $ | 1,216,857 | | | $ | 1,031,049 | |
Net realized gain (loss) on investment and foreign currency transactions | | | 537,560 | | | | (972,004 | ) |
Net change in unrealized appreciation/depreciation on investments and foreign currency denominated assets and liabilities | | | 2,582,436 | | | | (292,757 | ) |
| | | | | | | | |
Net increase (decrease) in net assets from operations | | | 4,336,853 | | | | (233,712 | ) |
| Dividends to Shareholders from | | | | | | | | |
Net investment income | | | | | | | | |
Class A | | | (118,034 | ) | | | (18,193 | ) |
Class C | | | (9,994 | ) | | | (1,631 | ) |
Advisor Class | | | (700,726 | ) | | | (338,505 | ) |
Class R | | | (3,471 | ) | | | (193 | ) |
Class K | | | (10,048 | ) | | | (4,151 | ) |
Class I | | | (609,331 | ) | | | (399,784 | ) |
Tax return of capital | | | | | | | | |
Class A | | | (25,462 | ) | | | (8,618 | ) |
Class C | | | (2,156 | ) | | | (772 | ) |
Advisor Class | | | (151,160 | ) | | | (160,317 | ) |
Class R | | | (749 | ) | | | (91 | ) |
Class K | | | (2,167 | ) | | | (1,966 | ) |
Class I | | | (131,444 | ) | | | (189,339 | ) |
| Capital Stock Transactions | | | | | | | | |
Net increase | | | 27,250,690 | | | | 3,618,681 | |
| | | | | | | | |
Total increase | | | 29,822,801 | | | | 2,261,409 | |
| Net Assets | | | | | | | | |
Beginning of period | | | 34,871,451 | | | | 32,610,042 | |
| | | | | | | | |
End of period (including distributions in excess of net investment income of $(293,424) and $(140,025), respectively) | | $ | 64,694,252 | | | $ | 34,871,451 | |
| | | | | | | | |
See notes to financial statements.
| | |
| abfunds.com | | AB EMERGING MARKETS MULTI-ASSET PORTFOLIO | 33 |
NOTES TO FINANCIAL STATEMENTS
March 31, 2017
NOTE A
Significant Accounting Policies
AB Cap Fund, Inc. (the “Company”), which is a Maryland corporation, is registered under the Investment Company Act of 1940 as an open-end management investment company. The Company operates as a series company currently comprised of 27 portfolios. Each portfolio is considered to be a separate entity for financial reporting and tax purposes. This report relates only to the AB Emerging Markets Multi-Asset Portfolio (the “Fund”), a diversified portfolio. The Fund has authorized the issuance of Class A, Class B, Class C, Advisor Class, Class R, Class K, Class I, Class 1 and Class 2 shares. Class B, Class 1, and Class 2 shares are not currently being offered. Class A shares are sold with a front-end sales charge of up to 4.25% for purchases not exceeding $1,000,000. With respect to purchases of $1,000,000 or more, Class A shares redeemed within one year of purchase may be subject to a contingent deferred sales charge of 1%. Class C shares are subject to a contingent deferred sales charge of 1% on redemptions made within the first year after purchase. Class R and Class K shares are sold without an initial or contingent deferred sales charge. Advisor Class and Class I shares are sold without an initial or contingent deferred sales charge and are not subject to ongoing distribution expenses. All nine classes of shares have identical voting, dividend, liquidation and other rights, except that the classes bear different distribution and transfer agency expenses. Each class has exclusive voting rights with respect to its distribution plan. The financial statements have been prepared in conformity with U.S. generally accepted accounting principles (“U.S. GAAP”), which require management to make certain estimates and assumptions that affect the reported amounts of assets and liabilities in the financial statements and amounts of income and expenses during the reporting period. Actual results could differ from those estimates. The Fund is an investment company under U.S. GAAP and follows the accounting and reporting guidance applicable to investment companies. The following is a summary of significant accounting policies followed by the Fund.
1. Security Valuation
Portfolio securities are valued at their current market value determined on the basis of market quotations or, if market quotations are not readily available or are deemed unreliable, at “fair value” as determined in accordance with procedures established by and under the general supervision of the Company’s Board of Directors (the “Board”).
In general, the market values of securities which are readily available and deemed reliable are determined as follows: securities listed on a national securities exchange (other than securities listed on the NASDAQ Stock Market, Inc. (“NASDAQ”)) or on a foreign securities exchange are valued at
| | |
| 34 | AB EMERGING MARKETS MULTI-ASSET PORTFOLIO | | abfunds.com |
NOTES TO FINANCIAL STATEMENTS (continued)
the last sale price at the close of the exchange or foreign securities exchange. If there has been no sale on such day, the securities are valued at last traded price from the previous day. Securities listed on more than one exchange are valued by reference to the principal exchange on which the securities are traded; securities listed only on NASDAQ are valued in accordance with the NASDAQ Official Closing Price; listed or over the counter (“OTC”) market put or call options are valued at the mid level between the current bid and ask prices. If either a current bid or current ask price is unavailable, AllianceBernstein L.P. (the “Adviser”) will have discretion to determine the best valuation (e.g. last trade price in the case of listed options); open futures contracts are valued using the closing settlement price or, in the absence of such a price, the most recent quoted bid price. If there are no quotations available for the day of valuation, the last available closing settlement price is used; U.S. Government securities and any other debt instruments having 60 days or less remaining until maturity are generally valued at market by an independent pricing vendor, if a market price is available. If a market price is not available, the securities are valued at amortized cost. This methodology is commonly used for short term securities that have an original maturity of 60 days or less, as well as short term securities that had an original term to maturity that exceeded 60 days. In instances when amortized cost is utilized, the Valuation Committee (the “Committee”) must reasonably conclude that the utilization of amortized cost is approximately the same as the fair value of the security. Such factors the Committee will consider include, but are not limited to, an impairment of the creditworthiness of the issuer or material changes in interest rates. Fixed-income securities, including mortgage-backed and asset-backed securities, may be valued on the basis of prices provided by a pricing service or at a price obtained from one or more of the major broker-dealers. In cases where broker/dealer quotes are obtained, the Adviser may establish procedures whereby changes in market yields or spreads are used to adjust, on a daily basis, a recently obtained quoted price on a security; swaps and other derivatives are valued daily, primarily using independent pricing services, independent pricing models using market inputs, as well as third party broker-dealers or counterparties. Open end mutual funds are valued at the closing net asset value per share, while exchange traded funds are valued at the closing market price per share.
Securities for which market quotations are not readily available (including restricted securities) or are deemed unreliable are valued at fair value as deemed appropriate by the Adviser. Factors considered in making this determination may include, but are not limited to, information obtained by contacting the issuer, analysts, analysis of the issuer’s financial statements or other available documents. In addition, the Fund may use fair value pricing for securities primarily traded in non-U.S. markets because most foreign
| | |
| abfunds.com | | AB EMERGING MARKETS MULTI-ASSET PORTFOLIO | 35 |
NOTES TO FINANCIAL STATEMENTS (continued)
markets close well before the Fund values its securities at 4:00 p.m., Eastern Time. The earlier close of these foreign markets gives rise to the possibility that significant events, including broad market moves, may have occurred in the interim and may materially affect the value of those securities. To account for this, the Fund may frequently value many of its foreign equity securities using fair value prices based on third party vendor modeling tools to the extent available.
2. Fair Value Measurements
In accordance with U.S. GAAP regarding fair value measurements, fair value is defined as the price that the Fund would receive to sell an asset or pay to transfer a liability in an orderly transaction between market participants at the measurement date. U.S. GAAP establishes a framework for measuring fair value, and a three-level hierarchy for fair value measurements based upon the transparency of inputs to the valuation of an asset or liability (including those valued based on their market values as described in Note A.1 above). Inputs may be observable or unobservable and refer broadly to the assumptions that market participants would use in pricing the asset or liability. Observable inputs reflect the assumptions market participants would use in pricing the asset or liability based on market data obtained from sources independent of the Fund. Unobservable inputs reflect the Fund’s own assumptions about the assumptions that market participants would use in pricing the asset or liability based on the best information available in the circumstances. Each investment is assigned a level based upon the observability of the inputs which are significant to the overall valuation. The three-tier hierarchy of inputs is summarized below.
| | • | | Level 1—quoted prices in active markets for identical investments |
| | • | | Level 2—other significant observable inputs (including quoted prices for similar investments, interest rates, prepayment speeds, credit risk, etc.) |
| | • | | Level 3—significant unobservable inputs (including the Fund’s own assumptions in determining the fair value of investments) |
The fair value of debt instruments, such as bonds, and over-the-counter derivatives is generally based on market price quotations, recently executed market transactions (where observable) or industry recognized modeling techniques and are generally classified as Level 2. Pricing vendor inputs to Level 2 valuations may include quoted prices for similar investments in active markets, interest rate curves, coupon rates, currency rates, yield curves, option adjusted spreads, default rates, credit spreads and other unique security features in order to estimate the relevant cash flows which is then discounted to calculate fair values. If these inputs are unobservable and significant to the fair value, these investments will be classified as Level 3. In addition, non-agency rated investments are classified as Level 3.
| | |
| 36 | AB EMERGING MARKETS MULTI-ASSET PORTFOLIO | | abfunds.com |
NOTES TO FINANCIAL STATEMENTS (continued)
Where readily available market prices or relevant bid prices are not available for certain equity investments, such investments may be valued based on similar publicly traded investments, movements in relevant indices since last available prices or based upon underlying company fundamentals and comparable company data (such as multiples to earnings or other multiples to equity). Where an investment is valued using an observable input, such as another publicly traded security, the investment will be classified as Level 2. If management determines that an adjustment is appropriate based on restrictions on resale, illiquidity or uncertainty, and such adjustment is a significant component of the valuation, the investment will be classified as Level 3. An investment will also be classified as Level 3 where management uses company fundamentals and other significant inputs to determine the valuation.
Other fixed income investments, including non-U.S. government and corporate debt, are generally valued using quoted market prices, if available, which are typically impacted by current interest rates, maturity dates and any perceived credit risk of the issuer. Additionally, in the absence of quoted market prices, these inputs are used by pricing vendors to derive a valuation based upon industry or proprietary models which incorporate issuer specific data with relevant yield/spread comparisons with more widely quoted bonds with similar key characteristics. Those investments for which there are observable inputs are classified as Level 2. Where the inputs are not observable, the investments are classified as Level 3.
The following table summarizes the valuation of the Fund’s investments by the above fair value hierarchy levels as of March 31, 2017:
| | | | | | | | | | | | | | | | |
Investments in
Securities | | Level 1 | | | Level 2 | | | Level 3 | | | Total | |
Assets: | | | | | | | | | | | | | | | | |
Common Stocks: | | | | | | | | | | | | | | | | |
Financials | | $ | 661,366 | | | $ | 10,063,934 | | | $ | – 0 | – | | $ | 10,725,300 | |
Information Technology | | | 264,120 | | | | 7,340,325 | | | | – 0 | – | | | 7,604,445 | |
Industrials | | | – 0 | – | | | 5,404,900 | | | | – 0 | – | | | 5,404,900 | |
Energy | | | 2,483,209 | | | | 1,815,944 | | | | – 0 | – | | | 4,299,153 | |
Materials | | | 182,973 | | | | 2,139,803 | | | | – 0 | – | | | 2,322,776 | |
Utilities | | | 1,709,665 | | | | 574,396 | | | | – 0 | – | | | 2,284,061 | |
Consumer Discretionary | | | 232,323 | | | | 933,256 | | | | – 0 | – | | | 1,165,579 | |
Telecommunication Services | | | 280,388 | | | | 734,521 | | | | – 0 | – | | | 1,014,909 | |
Real Estate | | | 78,910 | | | | 213,969 | | | | – 0 | – | | | 292,879 | |
Consumer Staples | | | 51,821 | | | | 146,230 | | | | – 0 | – | | | 198,051 | |
Health Care | | | – 0 | – | | | 50,874 | | | | – 0 | – | | | 50,874 | |
| | |
| abfunds.com | | AB EMERGING MARKETS MULTI-ASSET PORTFOLIO | 37 |
NOTES TO FINANCIAL STATEMENTS (continued)
| | | | | | | | | | | | | | | | |
Investments in
Securities | | Level 1 | | | Level 2 | | | Level 3 | | | Total | |
Fixed Income Securities: | | | | | | | | | | | | | | | | |
Sovereign Bonds | | $ | – 0 | – | | $ | 8,349,152 | | | $ | – 0 | – | | $ | 8,349,152 | |
Treasury Bonds | | | – 0 | – | | | 3,505,078 | | | | – 0 | – | | | 3,505,078 | |
Emerging Markets – Treasuries | | | – 0 | – | | | 2,389,027 | | | | – 0 | – | | | 2,389,027 | |
Quasi-Sovereign Bonds | | | – 0 | – | | | 2,339,332 | | | | – 0 | – | | | 2,339,332 | |
Sovereign Agencies | | | – 0 | – | | | 752,595 | | | | – 0 | – | | | 752,595 | |
Corporate Bonds | | | – 0 | – | | | 488,786 | | | | 182,267 | | | | 671,053 | |
Inflation-Linked Securities | | | – 0 | – | | | 379,681 | | | | – 0 | – | | | 379,681 | |
Regional Bonds | | | – 0 | – | | | 309,750 | | | | – 0 | – | | | 309,750 | |
Investment Companies | | | – 0 | – | | | 256,739 | | | | – 0 | – | | | 256,739 | |
Short-Term Investments: | | | | | | | | | | | | | | | | |
Investment Companies | | | 9,352,221 | | | | – 0 | – | | | – 0 | – | | | 9,352,221 | |
Time Deposits | | | – 0 | – | | | 202,172 | | | | – 0 | – | | | 202,172 | |
Treasury Bonds | | | – 0 | – | | | 46,970 | | | | – 0 | – | | | 46,970 | |
| | | | | | | | | | | | | | | | |
Total Investments in Securities | | | 15,296,996 | | | | 48,437,434 | + | | | 182,267 | | | | 63,916,697 | |
Other Financial Instruments*: | | | | | | | | | | | | | | | | |
Assets | | | | | | | | | | | | | | | | |
Futures | | | 5,007 | | | | – 0 | – | | | – 0 | – | | | 5,007 | † |
Forward Currency Exchange Contracts | | | – 0 | – | | | 154,337 | | | | – 0 | – | | | 154,337 | |
Centrally Cleared Interest Rate Swaps | | | – 0 | – | | | 16,896 | | | | – 0 | – | | | 16,896 | † |
Total Return Swaps | | | – 0 | – | | | 27,533 | | | | – 0 | – | | | 27,533 | |
Liabilities | | | | | | | | | | | | | | | | |
Futures | | | – 0 | – | | | (18,634 | ) | | | – 0 | – | | | (18,634 | )† |
Forward Currency Exchange Contracts | | | – 0 | – | | | (75,992 | ) | | | – 0 | – | | | (75,992 | ) |
Centrally Cleared Interest Rate Swaps | | | – 0 | – | | | (4,689 | ) | | | – 0 | – | | | (4,689 | )† |
| | | | | | | | | | | | | | | | |
Total^ | | $ | 15,302,003 | | | $ | 48,536,885 | | | $ | 182,267 | | | $ | 64,021,155 | |
| | | | | | | | | | | | | | | | |
| * | Other financial instruments are derivative instruments, such as futures, forwards and swaps which are valued at the unrealized appreciation/(depreciation) on the instrument. |
| + | A significant portion of the Fund’s foreign equity investments are categorized as Level 2 investments since they are valued using fair value prices based on third party vendor modeling tools to the extent available, see Note A.1. |
| † | Only variation margin receivable/payable at period end is reported within the statements of assets and liabilities. This amount reflects cumulative unrealized appreciation/(depreciation) of exchange-traded derivatives as reported in the portfolio of investments. |
| ^ | There were no transfers between Level 1 and Level 2 during the reporting period. |
The Fund recognizes all transfers between levels of the fair value hierarchy assuming the financial instrument was transferred at the beginning of the reporting period.
| | |
| 38 | AB EMERGING MARKETS MULTI-ASSET PORTFOLIO | | abfunds.com |
NOTES TO FINANCIAL STATEMENTS (continued)
Following is a reconciliation of investments in which significant unobservable inputs (Level 3) were used in determining fair value.
| | | | | | | | | | | | | | | | |
| | | Common
Stocks | | | Emerging
Markets -
Treasuries | | | Corporate
Bonds | | | Totals | |
Balance as of 3/31/16 | | $ | 22,423 | | | $ | 187,776 | | | $ | 39,896 | | | $ | 250,095 | |
Accrued discounts/ (premiums) | | | – 0 | – | | | – 0 | – | | | 221 | | | | 221 | |
Realized gain (loss) | | | – 0 | – | | | – 0 | – | | | – 0 | – | | | – 0 | – |
Change in unrealized appreciation/depreciation | | | – 0 | – | | | – 0 | – | | | (2,753 | ) | | | (2,753 | ) |
Purchases | | | – 0 | – | | | – 0 | – | | | 144,903 | | | | 144,903 | |
Sales | | | – 0 | – | | | – 0 | – | | | – 0 | – | | | – 0 | – |
Transfers into Level 3 | | | – 0 | – | | | – 0 | – | | | – 0 | – | | | – 0 | – |
Transfers out of Level 3 | | | (22,423 | ) | | | (187,776 | ) | | | – 0 | – | | | (210,199 | ) |
| | | | | | | | | | | | | | | | |
Balance as of 3/31/17 | | $ | – 0 | – | | $ | – 0 | – | | $ | 182,267 | | | $ | 182,267 | + |
| | | | | | | | | | | | | | | | |
Net change in unrealized appreciation/depreciation from investments held as of 3/31/17** | | $ | – 0 | – | | $ | – 0 | – | | $ | (2,753 | ) | | $ | (2,753 | ) |
| | | | | | | | | | | | | | | | |
| ** | The unrealized appreciation/(depreciation) is included in net change in unrealized appreciation/(depreciation) on investments and other financial instruments in the accompanying statement of operations. |
| + | There were de minimis transfers under 1% of net assets during the reporting period. |
The Adviser established the Committee to oversee the pricing and valuation of all securities held in the Fund. The Committee operates under pricing and valuation policies and procedures established by the Adviser and approved by the Board, including pricing policies which set forth the mechanisms and processes to be employed on a daily basis to implement these policies and procedures. In particular, the pricing policies describe how to determine market quotations for securities and other instruments. The Committee’s responsibilities include: 1) fair value and liquidity determinations (and oversight of any third parties to whom any responsibility for fair value and liquidity determinations is delegated), and 2) regular monitoring of the Adviser’s pricing and valuation policies and procedures and modification or enhancement of these policies and procedures (or recommendation of the modification of these policies and procedures) as the Committee believes appropriate.
The Committee is also responsible for monitoring the implementation of the pricing policies by the Adviser’s Pricing Group (the “Pricing Group”) and any third party which performs certain pricing functions in accordance with the pricing policies. The Pricing Group is responsible for the oversight of the third party on a day-to-day basis. The Committee and the Pricing Group perform a series of activities to provide reasonable assurance of the accuracy of prices including: 1) periodic vendor due diligence meetings,
| | |
| abfunds.com | | AB EMERGING MARKETS MULTI-ASSET PORTFOLIO | 39 |
NOTES TO FINANCIAL STATEMENTS (continued)
review of methodologies, new developments, and process at vendors, 2) daily compare of security valuation versus prior day for all securities that exceeded established thresholds, and 3) daily review of unpriced, stale, and variance reports with exceptions reviewed by senior management and the Committee.
In addition, several processes outside of the pricing process are used to monitor valuation issues including: 1) performance and performance attribution reports are monitored for anomalous impacts based upon benchmark performance, and 2) portfolio managers review all portfolios for performance and analytics (which are generated using the Adviser’s prices).
3. Currency Translation
Asset and liabilities denominated in foreign currencies and commitments under forward currency exchange contracts are translated into U.S. dollars at the mean of the quoted bid and ask prices of such currencies against the U.S. dollar. Purchases and sales of portfolio securities are translated into U.S. dollars at the rates of exchange prevailing when such securities were acquired or sold. Income and expenses are translated into U.S. dollars at rates of exchange prevailing when accrued.
Net realized gain or loss on foreign currency transactions represents foreign exchange gains and losses from sales and maturities of foreign fixed income investments, foreign currency exchange contracts, holding of foreign currencies, currency gains or losses realized between the trade and settlement dates on foreign investment transactions, and the difference between the amounts of dividends, interest and foreign withholding taxes recorded on the Fund’s books and the U.S. dollar equivalent amounts actually received or paid. Net unrealized currency gains and losses from valuing foreign currency denominated assets and liabilities at period end exchange rates are reflected as a component of net unrealized appreciation and depreciation of foreign currency denominated assets and liabilities.
4. Taxes
It is the Fund’s policy to meet the requirements of the Internal Revenue Code applicable to regulated investment companies and to distribute all of its investment company taxable income and net realized gains, if any, to shareholders. Therefore, no provisions for federal income or excise taxes are required. The Fund may be subject to taxes imposed by countries in which it invests. Such taxes are generally based on income and/or capital gains earned or repatriated. Taxes are accrued and applied to net investment income, net realized gains and net unrealized appreciation/depreciation as such income and/or gains are earned.
| | |
| 40 | AB EMERGING MARKETS MULTI-ASSET PORTFOLIO | | abfunds.com |
NOTES TO FINANCIAL STATEMENTS (continued)
In accordance with U.S. GAAP requirements regarding accounting for uncertainties in income taxes, management has analyzed the Fund’s tax positions taken or expected to be taken on federal and state income tax returns and has concluded that no provision for income tax is required in the Fund’s financial statements.
5. Investment Income and Investment Transactions
Dividend income is recorded on the ex-dividend date or as soon as the Fund is informed of the dividend. Interest income is accrued daily. Investment transactions are accounted for on the date securities are purchased or sold. Investment gains or losses are determined on the identified cost basis. The Fund amortizes premiums and accretes discounts as adjustments to interest income.
6. Class Allocations
All income earned and expenses incurred by the Fund are borne on a pro-rata basis by each settled class of shares, based on the proportionate interest in the Fund represented by the net assets of such class, except for class specific expenses which are allocated to the respective class. Expenses of the Company are charged proportionately to each portfolio or based on other appropriate methods. Realized and unrealized gains and losses are allocated among various share classes based on their respective net assets.
7. Dividends and Distributions
Dividends and distributions to shareholders, if any, are recorded on the ex-dividend date. Income dividends and capital gains distributions are determined in accordance with federal tax regulations and may differ from those determined in accordance with U.S. GAAP. To the extent these differences are permanent, such amounts are reclassified within the capital accounts based on their federal tax basis treatment; temporary differences do not require such reclassification.
NOTE B
Advisory Fee and Other Transactions with Affiliates
Under the terms of the investment advisory agreement, the Fund pays the Adviser an advisory fee at an annual rate of .85% of the first $1 billion, .80% of the next $1 billion, .75% of the next $1 billion and .70% in excess of $3 billion of the Fund’s average daily net assets. Prior to February 3, 2017, the Fund paid the Adviser at an annual rate of 1% of the first $1 billion, .95% of the next $1 billion, .90% of the next $1 billion and .85% in excess of $3 billion of the Fund’s average daily net assets. The fee is accrued daily and paid monthly. The Adviser has agreed to reimburse its fees and bear certain expenses to the extent necessary to limit total
| | |
| abfunds.com | | AB EMERGING MARKETS MULTI-ASSET PORTFOLIO | 41 |
NOTES TO FINANCIAL STATEMENTS (continued)
operating expenses on an annual basis (“the Expense Caps”) to 1.24%, 1.99%, .99%, 1.49%, 1.24%, and .99% of the daily average net assets for the Class A, Class C, Advisor Class, Class R, Class K, and Class I shares, respectively. The Expense Caps may not be terminated before July 31, 2017. For the year ended March 31, 2017, such waiver/reimbursement amounted to $456,050. Prior to February 3, 2017, the Adviser had agreed to waive its fees and bear certain expenses to the extent necessary to limit total operating expenses on an annual basis to 1.60%, 2.35%, 1.35%, 1.85%, 1.60%, and 1.35% of daily average net assets for Class A, Class C, Advisor Class, Class R, Class K and Class I shares respectively. Prior to July 31, 2015, the Adviser had agreed to waive its fees and bear certain expenses to the extent necessary to limit total operating expenses on an annual basis to 1.65% of daily average net assets for Class A shares.
Pursuant to the investment advisory agreement, the Fund may reimburse the Adviser for certain legal and accounting services provided to the Fund by the Adviser. For the year ended March 31, 2017, the Adviser voluntarily agreed to waive such fees in the amount of $64,739.
The Fund compensates AllianceBernstein Investor Services, Inc. (“ABIS”), a wholly-owned subsidiary of the Adviser, under a Transfer Agency Agreement for providing personnel and facilities to perform transfer agency services for the Fund. ABIS may make payments to intermediaries that provide omnibus account services, sub-accounting services and/or networking services. The compensation retained by ABIS amounted to $19,454 for the year ended March 31, 2017.
AllianceBernstein Investments, Inc. (the “Distributor”), is a wholly-owned subsidiary of the Adviser, serves as the distributor of the Fund’s shares. The Distributor has advised the Fund that it has retained front-end sales charges of $287 from the sale of Class A shares and received $7 and $24 in contingent deferred sales charges imposed upon redemption by shareholders of Class A and Class C shares, respectively, for the year ended March 31, 2017.
The AB Fixed-Income Shares, Inc. — Government STIF Portfolio (the “Government STIF Portfolio”), prior to June 1, 2016, was offered as a cash management option to mutual funds and other institutional accounts of the Adviser, and was not available for direct purchase by members of the public. Prior to June 1, 2016, the Government STIF Portfolio paid no advisory fees but did bear its own expenses. As of June 1, 2016, the Government STIF Portfolio, which was renamed “AB Government Money Market Portfolio” (the “Government Money Market Portfolio”), has a contractual annual advisory fee rate of .20% of the Portfolio’s average daily net assets invested in such Portfolio and bears its own expenses. In connection with the investment by the Fund in the Government Money Market Portfolio, the
| | |
| 42 | AB EMERGING MARKETS MULTI-ASSET PORTFOLIO | | abfunds.com |
NOTES TO FINANCIAL STATEMENTS (continued)
Adviser has agreed to waive its advisory fee from the Fund in an amount equal to the Fund’s pro rata share of the effective advisory fee of Government Money Market Portfolio, as borne indirectly by the Fund as an acquired fund fee and expense. For the year ended March 31, 2017 such waiver amounted to $5,983. A summary of the Fund’s transactions in shares of the Government Money Market Portfolio for the year ended March 31, 2017 is as follows:
| | | | | | | | | | | | | | | | | | |
Market Value
March 31, 2016
(000) | | | Purchases
at Cost
(000) | | | Sales
Proceeds
(000) | | | Market Value
March 31, 2017
(000) | | | Dividend
Income
(000) | |
| $ | 4,798 | | | $ | 36,390 | | | $ | 31,836 | | | $ | 9,352 | | | $ | 12 | |
Brokerage commissions paid on investment transactions for the year ended March 31, 2017 amounted to $58,971, none of which was paid to Sanford C. Bernstein & Co. LLC and Sanford C. Bernstein Limited, affiliates of the Adviser.
NOTE C
Distribution Services Agreement
The Fund has adopted a Distribution Services Agreement (the “Agreement”) pursuant to Rule 12b-1 under the Investment Company Act of 1940. Under the Agreement the Fund pays distribution and servicing fees to the Distributor at an annual rate of up to .30% of the Fund’s average daily net assets attributable to Class A shares, 1% of the Fund’s average daily net assets attributable to Class C shares, .50% of the Fund’s average daily net assets attributable to Class R shares and .25% of the Fund’s average daily net assets attributable to Class K shares. Effective July 31, 2015, payments under the Agreement in respect of Class A shares are limited to an annual rate of .25% of Class A share’s average daily net assets. There are no distribution and servicing fees on Advisor Class and Class I shares. The fees are accrued daily and paid monthly. The Agreement provides that the Distributor will use such payments in their entirety for distribution assistance and promotional activities. Since the commencement of the Fund’s operation, the Distributor has incurred expenses in excess of the distribution costs reimbursed by the Fund in the amounts of $2,922 and $207 for Class C and Class R shares, respectively. While such costs may be recovered from the Fund in future periods so long as the Agreement is in effect, the rate of the distribution and servicing fees payable under the Agreement may not be increased without a shareholder vote. In accordance with the Agreement, there is no provision for recovery of unreimbursed distribution costs, incurred by the Distributor, beyond the current fiscal period for Class A shares. The Agreement also provides that the Adviser may use its own resources to finance the distribution of the Fund’s shares.
| | |
| abfunds.com | | AB EMERGING MARKETS MULTI-ASSET PORTFOLIO | 43 |
NOTES TO FINANCIAL STATEMENTS (continued)
NOTE D
Investment Transactions
Purchases and sales of investment securities (excluding short-term investments) for the year ended March 31, 2017, were as follows:
| | | | | | | | |
| | | Purchases | | | Sales | |
Investment securities (excluding U.S. government securities) | | $ | 60,752,652 | | | $ | 42,439,209 | |
U.S. government securities | | | – 0 | – | | | 249,090 | |
The cost of investments for federal income tax purposes, gross unrealized appreciation and unrealized depreciation (excluding foreign currency, futures and swaps) are as follows:
| | | | |
Cost | | $ | 61,282,396 | |
| | | | |
Gross unrealized appreciation | | $ | 4,394,595 | |
Gross unrealized depreciation | | | (1,760,294 | ) |
| | | | |
Net unrealized appreciation | | $ | 2,634,301 | |
| | | | |
1. Derivative Financial Instruments
The Fund may use derivatives in an effort to earn income and enhance returns, to replace more traditional direct investments, to obtain exposure to otherwise inaccessible markets (collectively, “investment purposes”), or to hedge or adjust the risk profile of its portfolio.
The principal types of derivatives utilized by the Fund, as well as the methods in which they may be used are:
| | • | | Forward Currency Exchange Contracts |
The Fund may enter into forward currency exchange contracts in order to hedge its exposure to changes in foreign currency exchange rates on its foreign portfolio holdings, to hedge certain firm purchase and sales commitments denominated in foreign currencies and for non-hedging purposes as a means of making direct investments in foreign currencies, as described below under “Currency Transactions”.
A forward currency exchange contract is a commitment to purchase or sell a foreign currency at a future date at a negotiated forward rate. The gain or loss arising from the difference between the original contract and the closing of such contract would be included in net realized gain or loss on foreign currency transactions. Fluctuations in the value of open forward currency exchange contracts are recorded for financial reporting purposes as unrealized appreciation and/or depreciation by the Fund. Risks may arise from the potential inability of a counterparty to meet the terms of a contract and from unanticipated movements in the value of a foreign currency relative to the U.S. dollar.
| | |
| 44 | AB EMERGING MARKETS MULTI-ASSET PORTFOLIO | | abfunds.com |
NOTES TO FINANCIAL STATEMENTS (continued)
During the year ended March 31, 2017, the Fund held foreign-currency contracts for hedging and non-hedging purposes.
The Fund may buy or sell futures for investment purposes or for the purpose of hedging its portfolio against adverse effects of potential movements in the market. The Fund bears the market risk that arises from changes in the value of these instruments and the imperfect correlation between movements in the price of the futures and movements in the price of the assets, reference rates or indices which they are designed to track. Among other things, the Fund may purchase or sell futures for foreign currencies or options thereon for non-hedging purposes as a means of making direct investment in foreign currencies, as described below under “Currency Transactions”.
At the time the Fund enters into futures, the Fund deposits and maintains as collateral an initial margin with the broker, as required by the exchange on which the transaction is effected. Such amount is shown as cash collateral due from broker on the statement of assets and liabilities. Pursuant to the contract, the Fund agrees to receive from or pay to the broker an amount of cash equal to the daily fluctuation in the value of the contract. Such receipts or payments are known as variation margin and are recorded by the Fund as unrealized gains or losses. Risks may arise from the potential inability of a counter party to meet the terms of the contract. The credit/counterparty risk for exchange-traded futures contracts is generally less than privately negotiated futures contracts, since the clearinghouse, which is the issuer or counterparty to each exchange-traded future, has robust risk mitigation standards, including the requirement to provide initial and variation margin. When the contract is closed, the Fund records a realized gain or loss equal to the difference between the value of the contract at the time it was opened and the time it was closed.
Use of long futures subjects the Fund to risk of loss in excess of the amounts shown on the statement of assets and liabilities, up to the notional value of the futures. Use of short futures subjects the Fund to unlimited risk of loss. Under some circumstances, futures exchanges may establish daily limits on the amount that the price of a future can vary from the previous day’s settlement price, which could effectively prevent liquidation of unfavorable positions.
During the year ended March 31, 2017, the Fund held futures for hedging and non-hedging purposes.
| | |
| abfunds.com | | AB EMERGING MARKETS MULTI-ASSET PORTFOLIO | 45 |
NOTES TO FINANCIAL STATEMENTS (continued)
For hedging and investment purposes, the Fund may purchase and write (sell) put and call options on U.S. and foreign securities, including government securities, and foreign currencies that are traded on U.S. and foreign securities exchanges and over-the-counter markets. Among other things, the Fund may use options transactions for non-hedging purposes as a means of making direct investments in foreign currencies, as described below under “Currency Transactions” and may use options strategies involving the purchase and/or writing of various combinations of call and/or put options, for hedging and investment purposes.
The risk associated with purchasing an option is that the Fund pays a premium whether or not the option is exercised. Additionally, the Fund bears the risk of loss of the premium and change in market value should the counterparty not perform under the contract. If a put or call option purchased by the Fund were permitted to expire without being sold or exercised, its premium would represent a loss to the Fund. Put and call options purchased are accounted for in the same manner as portfolio securities. The cost of securities acquired through the exercise of call options is increased by premiums paid. The proceeds from securities sold through the exercise of put options are decreased by the premiums paid.
The Fund may also invest in options on swaps, also called “swaptions”. A swaption is an option that gives the buyer the right, but not the obligation, to enter into a swap on a future date in exchange for paying a market-based “premium”. A receiver swaption gives the owner the right to receive the total return of a specified asset, reference rate, or index. A payer swaption gives the owner the right to pay the total return of a specified asset, reference rate, or index. Swaptions also include options that allow an existing swap to be terminated or extended by one of the counterparties.
During the year ended March 31, 2017, the Fund held purchased options for hedging purposes.
The Fund may enter into swaps to hedge its exposure to interest rates, credit risk, or currencies. The Fund may also enter into swaps for non-hedging purposes as a means of gaining market exposures including by making direct investments in foreign currencies, as described below under “Currency Transactions”. A swap is an agreement that obligates two parties to exchange a series of cash flows at specified intervals based upon or calculated by reference to changes in specified prices or rates for a specified amount of an
| | |
| 46 | AB EMERGING MARKETS MULTI-ASSET PORTFOLIO | | abfunds.com |
NOTES TO FINANCIAL STATEMENTS (continued)
underlying asset. The payment flows are usually netted against each other, with the difference being paid by one party to the other. In addition, collateral may be pledged or received by the Fund in accordance with the terms of the respective swaps to provide value and recourse to the Fund or its counterparties in the event of default, bankruptcy or insolvency by one of the parties to the swap.
Risks may arise as a result of the failure of the counterparty to the swap contract to comply with the terms of the swap. The loss incurred by the failure of a counterparty is generally limited to the net interim payment to be received by the Fund, and/or the termination value at the end of the contract. Therefore, the Fund considers the creditworthiness of each counterparty to a swap in evaluating potential counterparty risk. This risk is mitigated by having a netting arrangement between the Fund and the counterparty and by the posting of collateral by the counterparty to the Fund to cover the Fund’s exposure to the counterparty. Additionally, risks may arise from unanticipated movements in interest rates or in the value of the underlying securities. The Fund accrues for the interim payments on swaps on a daily basis, with the net amount recorded within unrealized appreciation/depreciation of swaps on the statement of assets and liabilities, where applicable. Once the interim payments are settled in cash, the net amount is recorded as realized gain/(loss) on swaps on the statement of operations, in addition to any realized gain/(loss) recorded upon the termination of swaps. Upfront premiums paid or received are recognized as cost or proceeds on the statement of assets and liabilities and are amortized on a straight line basis over the life of the contract. Amortized upfront premiums are included in net realized gain/(loss) from swaps on the statement of operations. Fluctuations in the value of swaps are recorded as a component of net change in unrealized appreciation/depreciation of swaps on the statement of operations.
Certain standardized swaps, including certain interest rate swaps and credit default swaps, are (or soon will be) subject to mandatory central clearing. Cleared swaps are transacted through futures commission merchants (“FCMs”) that are members of central clearinghouses, with the clearinghouse serving as central counterparty, similar to transactions in futures contracts. Centralized clearing will be required for additional categories of swaps on a phased-in basis based on requirements published by the Securities and Exchange Commission and Commodity Futures Trading Commission.
At the time the Fund enters into a centrally cleared swap, the Fund deposits and maintains as collateral an initial margin with the broker, as required by the clearinghouse on which the transaction is effected.
| | |
| abfunds.com | | AB EMERGING MARKETS MULTI-ASSET PORTFOLIO | 47 |
NOTES TO FINANCIAL STATEMENTS (continued)
Such amount is shown as cash collateral due from broker on the statement of asset and liabilities. Pursuant to the contract, the Fund agrees to receive from or pay to the broker an amount of cash equal to the daily fluctuation in the value of the contract. Such receipts or payments are known as variation margin and are recorded by the Fund as unrealized gains or losses. Risks may arise from the potential inability of a counterparty to meet the terms of the contract. The credit/counterparty risk for centrally cleared swaps is generally less than non-centrally cleared swaps, since the clearinghouse, which is the issuer or counterparty to each centrally cleared swap, has robust risk mitigation standards, including the requirement to provide initial and variation margin. When the contract is closed, the Fund records a realized gain or loss equal to the difference between the value of the contract at the time it was opened and the time it was closed.
Interest Rate Swaps:
The Fund is subject to interest rate risk exposure in the normal course of pursuing its investment objectives. Because the Fund holds fixed rate bonds, the value of these bonds may decrease if interest rates rise. To help hedge against this risk and to maintain its ability to generate income at prevailing market rates, the Fund may enter into interest rate swaps. Interest rate swaps are agreements between two parties to exchange cash flows based on a notional amount. The Fund may elect to pay a fixed rate and receive a floating rate, or, receive a fixed rate and pay a floating rate on a notional amount.
In addition, the Fund may also enter into interest rate swap transactions to preserve a return or spread on a particular investment or portion of its portfolio, or protecting against an increase in the price of securities the Fund anticipates purchasing at a later date. Interest rate swaps involve the exchange by a Fund with another party of their respective commitments to pay or receive interest (e.g., an exchange of floating rate payments for fixed rate payments) computed based on a contractually-based principal (or “notional”) amount. Interest rate swaps are entered into on a net basis (i.e., the two payment streams are netted, with the Fund receiving or paying, as the case may be, only the net amount of the two payments).
During the year ended March 31, 2017, the Fund held interest rate swaps for hedging and non-hedging purposes
Credit Default Swaps:
The Fund may enter into credit default swaps, including to manage its exposure to the market or certain sectors of the market, to reduce its risk exposure to defaults by corporate and sovereign issuers held by the Fund, or to create exposure to corporate or sovereign issuers to which it is not otherwise exposed. The Fund may purchase credit
| | |
| 48 | AB EMERGING MARKETS MULTI-ASSET PORTFOLIO | | abfunds.com |
NOTES TO FINANCIAL STATEMENTS (continued)
protection (“Buy Contract”) or provide credit protection (“Sale Contract”) on the referenced obligation of the credit default swap. During the term of the swap, the Fund receives/(pays) fixed payments from/(to) the respective counterparty, calculated at the agreed upon interest rate applied to the notional amount. If the Fund is a buyer/(seller) of protection and a credit event occurs, as defined under the terms of the swap, the Fund will either (i) receive from the seller/(pay to the buyer) of protection an amount equal to the notional amount of the swap (the “Maximum Payout Amount”) and deliver/(take delivery of) the referenced obligation or (ii) receive/(pay) a net settlement amount in the form of cash or securities equal to the notional amount of the swap less the recovery value of the referenced obligation.
In certain circumstances Maximum Payout Amounts may be partially offset by recovery values of the respective referenced obligations, upfront premium received upon entering into the agreement, or net amounts received from settlement of buy protection credit default swaps entered into by the Fund for the same reference obligation with the same counterparty. As of March 31, 2017, the Fund had no Buy Contracts outstanding with respect to the same referenced obligation and same counterparty for certain Sale Contracts.
Credit default swaps may involve greater risks than if the Fund had invested in the referenced obligation directly. Credit default swaps are subject to general market risk, liquidity risk, counterparty risk and credit risk. If the Fund is a buyer of protection and no credit event occurs, it will lose its investment. If the Fund is a seller of protection and a credit event occurs, the value of the referenced obligation received by the Fund coupled with the periodic payments previously received may be less than the Maximum Payout Amount it pays to the buyer, resulting in a net loss to the Fund.
Implied credit spreads over Treasuries of comparable maturity utilized in determining the market value of credit default swaps on issuers as of period end are disclosed in the portfolio of investments. The implied spreads serve as an indicator of the current status of the payment/performance risk and typically reflect the market’s assessment of the likelihood of default by the issuer on the referenced obligation. The implied credit spread of a particular reference entity reflects the cost of buying/selling protection and may include upfront payments required to be made to enter into the agreement. Widening credit spreads typically represent a deterioration of the referenced entity’s credit soundness and greater likelihood of default or other credit event occurring as defined under the terms of the agreement. A credit spread identified as “Defaulted” indicates a credit event has occurred for the referenced entity or obligation.
| | |
| abfunds.com | | AB EMERGING MARKETS MULTI-ASSET PORTFOLIO | 49 |
NOTES TO FINANCIAL STATEMENTS (continued)
During the year ended March 31, 2017, the Fund held credit default swaps for hedging and non-hedging purposes.
Total Return Swaps:
The Fund may enter into total return swaps in order take a “long” or “short” position with respect to an underlying referenced asset. The Fund is subject to market price volatility of the underlying referenced asset. A total return swap involves commitments to pay interest in exchange for a market linked return based on a notional amount. To the extent that the total return of the security, group of securities or index underlying the transaction exceeds or falls short of the offsetting interest obligation, the Fund will receive a payment from or make a payment to the counterparty.
During the year ended March 31, 2017, the Fund held total return swaps for hedging and non-hedging purposes.
Variance Swaps:
The Fund may enter into variance swaps to hedge equity market risk or adjust exposure to the equity markets. Variance swaps are contracts in which two parties agree to exchange cash payments based on the difference between the stated level of variance and the actual variance realized on underlying asset(s) or index(es). Actual “variance” as used here is defined as the sum of the square of the returns on the reference asset(s) or index(es) (which in effect is a measure of its “volatility”) over the length of the contract term. So the parties to a variance swap can be said to exchange actual volatility for a contractually stated rate of volatility.
During the year ended March 31, 2017, the Fund held variance swaps for hedging purposes.
The Fund typically enters into International Swaps and Derivatives Association, Inc. Master Agreements (“ISDA Master Agreement”) or similar master agreements (collectively, “Master Agreements”) with its derivative contract counterparties in order to, among other things, reduce its credit risk to counterparties. ISDA Master Agreements include provisions for general obligations, representations, collateral and events of default or termination. Under an ISDA Master Agreement, the Fund typically may offset with the counterparty certain derivative financial instruments’ payables and/or receivables with collateral held and/or posted and create one single net payment (close-out netting) in the event of default or termination.
Various master agreements govern the terms of certain transactions with counterparties, including transactions such as derivative transactions, repurchase and reverse repurchase agreements. These master agreements typically attempt to reduce the counterparty risk associated with
| | |
| 50 | AB EMERGING MARKETS MULTI-ASSET PORTFOLIO | | abfunds.com |
NOTES TO FINANCIAL STATEMENTS (continued)
such transactions by specifying credit protection mechanisms and providing standardization that improves legal certainty. Cross-termination provisions under Master Agreements typically provide that a default in connection with one transaction between the Fund and a counterparty gives the non-defaulting party the right to terminate any other transactions in place with the defaulting party to create one single net payment due to/due from the defaulting party. In the event of a default by a Master Agreements counterparty, the return of collateral with market value in excess of the Fund’s net liability, held by the defaulting party, may be delayed or denied.
The Fund’s Master Agreements may contain provisions for early termination of derivative transactions in the event the net assets of the Fund decline below specific levels (“net asset contingent features”). If these levels are triggered, the Fund’s counterparty has the right to terminate such transaction and require the Fund to pay or receive a settlement amount in connection with the terminated transaction. For additional details, please refer to netting arrangements by counterparty tables below.
During the year ended March 31, 2017 the Fund had entered into the following derivatives:
| | | | | | | | | | | | | | |
| | | Asset Derivatives | | | Liability Derivatives | |
Derivative Type | | Statement of
Assets and
Liabilities
Location | | Fair Value | | | Statement of
Assets and
Liabilities
Location | | | Fair Value | |
Interest rate contracts | | Unrealized
appreciation on
total return swaps | | $ | 27,533 | | | | | | | | | |
| | | | |
Interest rate contracts | | Receivable/Payable
for variation margin on
exchange-traded
derivatives | | | 21,903 | * | |
| Receivable/Payable
for variation margin
on exchange-traded
derivatives |
| | $ | 4,689 | * |
| | | | |
Foreign exchange contracts | | Unrealized
appreciation on
forward currency
exchange contracts | | | 154,337 | | |
| Unrealized
depreciation on
forward currency
exchange contracts |
| | | 75,992 | |
| | | | |
Equity contracts | | | | | | | |
| Receivable/Payable
for variation margin
on exchange-
traded derivatives |
| | | 18,634 | * |
| | | | | | | | | | | | | | |
Total | | | | $ | 203,773 | | | | | | | $ | 99,315 | |
| | | | | | | | | | | | | | |
| * | Only variation margin receivable/payable at period end is reported within the statement of assets and liabilities. This amount reflects cumulative unrealized appreciation/depreciation on exchange-traded derivatives as reported in the portfolio of investments. |
| | |
| abfunds.com | | AB EMERGING MARKETS MULTI-ASSET PORTFOLIO | 51 |
NOTES TO FINANCIAL STATEMENTS (continued)
| | | | | | | | | | |
Derivative Type | | Location of Gain
or (Loss) on
Derivatives Within
Statement of
Operations | | Realized Gain
or (Loss) on
Derivatives | | | Change in
Unrealized
Appreciation or
(Depreciation) | |
Interest rate contracts | | Net realized gain/(loss)
on swaps; Net change in unrealized appreciation/ depreciation on swaps | | $ | 209,775 | | | $ | (136,312 | ) |
| | | |
Interest rate contracts | | Net realized gain/(loss) on futures; Net change in unrealized appreciation/ depreciation on futures | | | (73,604 | ) | | | 4,116 | |
| | | |
Interest rate contracts | | Net realized gain/(loss) on investment transactions; Net change in unrealized appreciation/depreciation on investment transactions | | | (2,954 | ) | | | – 0 | – |
| | | |
Foreign exchange contracts | | Net realized gain/(loss) on foreign currency transactions; Net change in unrealized appreciation/depreciation on foreign currency denominated assets and liabilities | | | 194,864 | | | | 25,571 | |
| | | |
Foreign exchange contracts | | Net realized gain/(loss) on investment transactions; Net change in unrealized appreciation/depreciation on investment transactions | | | 490 | | | | – 0 | – |
| | | |
Credit contracts | | Net realized gain/(loss) on swaps; Net change in unrealized appreciation/ depreciation on swaps | | | 50,914 | | | | (75,688 | ) |
| | | |
Equity contracts | | Net realized gain/(loss) on swaps; Net change in unrealized appreciation/ depreciation on swaps | | | (100,101 | ) | | | – 0 | – |
| | | |
Equity contracts | | Net realized gain/(loss) on futures; Net change in unrealized appreciation/depreciation on futures | | | (105,012 | ) | | | (39,377 | ) |
| | |
| 52 | AB EMERGING MARKETS MULTI-ASSET PORTFOLIO | | abfunds.com |
NOTES TO FINANCIAL STATEMENTS (continued)
| | | | | | | | | | |
Derivative Type | | Location of Gain
or (Loss) on
Derivatives Within
Statement of
Operations | | Realized Gain
or (Loss) on
Derivatives | | | Change in
Unrealized
Appreciation or
(Depreciation) | |
Equity contracts | | Net realized gain/(loss) on investment transactions; Net change in unrealized appreciation/depreciation on investment transactions | | $ | (32,170 | ) | | $ | – 0 | – |
| | | | | | | | | | |
Total | | | | $ | 142,202 | | | $ | (221,690 | ) |
| | | | | | | | | | |
The following table represents the average monthly volume of the Fund’s derivative transactions during the year ended March 31, 2017:
| | | | |
Centrally Cleared Interest Rate Swaps: | | | | |
Average notional amount | | $ | 717,798 | (a) |
Credit Default Swaps: | | | | |
Average notional amount on buy contracts | | $ | 535,333 | (b) |
Average notional amount on sale contracts | | $ | 1,507,917 | (c) |
Forward Currency Exchange Contracts: | | | | |
Average principal amount on buy contracts | | $ | 3,500,278 | |
Average principal amount on sale contracts | | $ | 3,954,558 | |
Futures: | | | | |
Average notional amount on buy contracts | | $ | 4,257,362 | |
Average notional amount on sale contracts | | $ | 1,383,562 | (d) |
Purchased Options: | | | | |
Average monthly cost | | $ | 32,452 | (e) |
Total Return Swaps: | | | | |
Average notional amount | | $ | 3,704,294 | |
Variance Swaps: | | | | |
Average notional amount | | $ | 212,265 | (f) |
| (a) | Positions were open for six months during the year. |
| (b) | Positions were open for five months during the year. |
| (c) | Positions were open for eleven months during the year. |
| (d) | Positions were open for two months during the year. |
| (e) | Positions were open for four months during the year. |
| (f) | Positions were open for seven months during the year. |
For financial reporting purposes, the Fund does not offset derivative assets and derivative liabilities that are subject to netting arrangements in the statement of assets and liabilities.
| | |
| abfunds.com | | AB EMERGING MARKETS MULTI-ASSET PORTFOLIO | 53 |
NOTES TO FINANCIAL STATEMENTS (continued)
All derivatives held at year end were subject to netting arrangements. The following tables present the Fund’s derivative assets and liabilities by counterparty net of amounts available for offset under Master Agreements (“MA”) and net of the related collateral received/pledged by the Fund as of March 31, 2017:
| | | | | | | | | | | | | | | | | | | | |
Counterparty | | Derivative
Assets
Subject
to a MA | | | Derivatives
Available
for Offset | | | Cash
Collateral
Received* | | | Security
Collateral
Received | | | Net
Amount of
Derivatives
Assets | |
OTC Derivatives: | | | | | | | | | | | | | | | | | | | | |
Bank of America, NA | | $ | 19,566 | | | $ | – 0 | – | | $ | – 0 | – | | $ | – 0 | – | | $ | 19,566 | |
Brown Brothers Harriman & Co. | | | 19,360 | | | | (19,360 | ) | | | – 0 | – | | | – 0 | – | | | – 0 | – |
Citibank, NA | | | 74,881 | | | | (6,753 | ) | | | – 0 | – | | | – 0 | – | | | 68,128 | |
Goldman Sachs Bank USA | | | 15,117 | | | | (15,117 | ) | | | – 0 | – | | | – 0 | – | | | – 0 | – |
JPMorgan Chase Bank, NA | | | 36,308 | | | | (5,182 | ) | | | – 0 | – | | | – 0 | – | | | 31,126 | |
Nomura Global Financial Products Inc. | | | 16,638 | | | | (10,206 | ) | | | – 0 | – | | | – 0 | – | | | 6,432 | |
| | | | | | | | | | | | | | | | | | | | |
Total | | $ | 181,870 | | | $ | (56,618 | ) | | $ | – 0 | – | | $ | – 0 | – | | $ | 125,252 | ^ |
| | | | | | | | | | | | | | | | | | | | |
| | | | | |
Counterparty | | Derivative
Liabilities
Subject
to a MA | | | Derivatives
Available
for Offset | | | Cash
Collateral
Pledged* | | | Security
Collateral
Pledged | | | Net
Amount of
Derivatives
Liabilities | |
Exchange-Traded Derivatives: | | | | | | | | | | | | | | | | | | | | |
Goldman Sachs & Co.** | | $ | 8,509 | | | $ | – 0 | – | | $ | (8,509 | ) | | $ | – 0 | – | | $ | – 0 | – |
Morgan Stanley Capital Services LLC | | | 567 | | | | – 0 | – | | | (567 | ) | | | – 0 | – | | | – 0 | – |
| | | | | | | | | | | | | | | | | | | | |
Total | | $ | 9,076 | | | $ | – 0 | – | | $ | (9,076 | ) | | $ | – 0 | – | | $ | – 0 | – |
| | | | | | | | | | | | | | | | | | | | |
OTC Derivatives: | | | | | | | | | | | | | | | | | | | | |
Barclays Bank PLC | | $ | 7,400 | | | $ | – 0 | – | | $ | – 0 | – | | $ | – 0 | – | | $ | 7,400 | |
BNP Paribas SA | | | 7,738 | | | | – 0 | – | | | – 0 | – | | | – 0 | – | | | 7,738 | |
Brown Brothers Harriman & Co. | | | 20,026 | | | | (19,360 | ) | | | – 0 | – | | | – 0 | – | | | 666 | |
Citibank, NA | | | 6,753 | | | | (6,753 | ) | | | – 0 | – | | | – 0 | – | | | – 0 | – |
Goldman Sachs Bank USA | | | 16,721 | | | | (15,117 | ) | | | – 0 | – | | | – 0 | – | | | 1,604 | |
JPMorgan Chase Bank, NA | | | 5,182 | | | | (5,182 | ) | | | – 0 | – | | | – 0 | – | | | – 0 | – |
Morgan Stanley Capital Services LLC | | | 1,906 | | | | – 0 | – | | | – 0 | – | | | – 0 | – | | | 1,906 | |
Nomura Global Financial Products Inc. | | | 10,206 | | | | (10,206 | ) | | | – 0 | – | | | – 0 | – | | | – 0 | – |
Standard Charter Bank | | | 60 | | | | – 0 | – | | | – 0 | – | | | – 0 | – | | | 60 | |
| | | | | | | | | | | | | | | | | | | | |
Total | | $ | 75,992 | | | $ | (56,618 | ) | | $ | – 0 | – | | $ | – 0 | – | | $ | 19,374 | ^ |
| | | | | | | | | | | | | | | | | | | | |
| * | The actual collateral received/pledged may be more than the amount reported due to overcollateralization. |
| ** | Cash has been posted for initial margin requirements for exchange-traded derivatives outstanding at March 31, 2017. |
| ^ | Net amount represents the net receivable/payable that would be due from/to the counterparty in the event of default or termination. The net amount from OTC financial derivative instruments can only be netted across transactions governed under the same master agreement with the same counterparty. |
| | |
| 54 | AB EMERGING MARKETS MULTI-ASSET PORTFOLIO | | abfunds.com |
NOTES TO FINANCIAL STATEMENTS (continued)
2. Currency Transactions
The Fund may invest in non-U.S. Dollar-denominated securities on a currency hedged or unhedged basis. The Fund may seek investment opportunities by taking long or short positions in currencies through the use of currency-related derivatives, including forward currency exchange contracts, futures and options on futures, swaps, and other options. The Fund may enter into transactions for investment opportunities when it anticipates that a foreign currency will appreciate or depreciate in value but securities denominated in that currency are not held by the Fund and do not present attractive investment opportunities. Such transactions may also be used when the Adviser believes that it may be more efficient than a direct investment in a foreign currency-denominated security. The Fund may also conduct currency exchange contracts on a spot basis (i.e., for cash at the spot rate prevailing in the currency exchange market for buying or selling currencies).
NOTE E
Securities Lending
The Fund may enter into securities lending transactions. Under the Fund’s securities lending program, all loans of securities will be collateralized continually by cash. The Fund will be compensated for the loan from a portion of the net return from the income earned on cash collateral after a rebate is paid to the borrower (in some cases, this rebate may be a “negative rebate” or fee paid by the borrower to the Fund in connection with the loan), and payments are made for fees of the securities lending agent and for certain other administrative expenses. It is the policy of the Fund to receive collateral consisting of cash in an amount exceeding the value of the securities loaned. A Fund will have the right to call a loan and obtain the securities loaned at any time on notice to the borrower within the normal and customary settlement time for the securities. While the securities are on loan, the borrower is obligated to pay the Fund amounts equal to any income or other distributions from the securities. The Fund will not be able to exercise voting rights with respect to any securities during the existence of a loan, but will have the right to regain ownership of loaned securities in order to exercise voting or other ownership rights. The lending agent has agreed to indemnify the Fund in the case of default of any securities borrower. Collateral received and securities loaned are marked to market daily to ensure that the securities loaned are secured by collateral. The lending agent currently invests the cash collateral received in Government Money Market Portfolio, an eligible money market vehicle, in accordance with the investment restrictions of the Fund, and as approved by the Board. Prior to June 27, 2016, such cash collateral received was invested in AB Exchange Reserves. The collateral received on securities loaned is recorded as an asset as well as a corresponding liability in the statement
| | |
| abfunds.com | | AB EMERGING MARKETS MULTI-ASSET PORTFOLIO | 55 |
NOTES TO FINANCIAL STATEMENTS (continued)
of assets and liabilities. When the Fund lends securities, its investment performance will continue to reflect changes in the value of the securities loaned. At March 31, 2017, the Fund had no securities on loan and had received no cash collateral. The Fund earned securities lending income of $50 and $276 from the borrowers and Government Money Market Portfolio, respectively, for the year ended March 31, 2017; these amounts are reflected in the statement of operations. In connection with the cash collateral investment by the Fund in the Government Money Market Portfolio, the Adviser has agreed to waive a portion of the Fund’s share of the advisory fees of Government Money Market Portfolio, as borne indirectly by the Fund as an acquired fund fee and expense. For the year ended March 31, 2017, such waiver amounted to $138. A principal risk of lending portfolio securities is that the borrower may fail to return the loaned securities upon termination of the loan and that the collateral will not be sufficient to replace the loaned securities. A summary of the Fund’s transactions in shares of AB Exchange Reserves for the period April 1, 2016 to June 14, 2016 is as follows:
| | | | | | | | | | | | | | |
Market Value
March 31, 2016
(000) | | | Purchases
at Cost
(000) | | | Sales
Proceeds
(000) | | | Market Value
June 14, 2016
(000) | |
| $ | 35 | | | $ | 61 | | | $ | 96 | | | $ | – 0 – | |
A summary of the Fund’s transactions in shares of Government Money Market Portfolio for the period June 27, 2016 to March 31, 2017 is as follows:
| | | | | | | | | | | | | | |
Market Value
June 27, 2016
(000) | | | Purchases
at Cost
(000) | | | Sales
Proceeds
(000) | | | Market Value
March 31, 2017
(000) | |
| $ | – 0 – | | | $ | 2,803 | | | $ | 2,803 | | | $ | – 0 – | |
| | |
| 56 | AB EMERGING MARKETS MULTI-ASSET PORTFOLIO | | abfunds.com |
NOTES TO FINANCIAL STATEMENTS (continued)
NOTE F
Capital Stock
Each class consists of 3,000,000,000 authorized shares. Transactions in capital shares for each class were as follows:
| | | | | | | | | | | | | | | | | | | | | | | | |
| | | | | | | | | | | | | | | | | | | | | | | | |
| | | Shares | | | | | | Amount | | | | |
| | | Year Ended
March 31, 2017 | | | Year Ended
March 31, 2016 | | | | | | Year Ended
March 31, 2017 | | | Year Ended
March 31, 2016 | | | | |
| | | | | | | | |
| Class A | | | | | | | | | | | | | | | | | | | | | | | | |
Shares sold | | | 727,876 | | | | 138,944 | | | | | | | $ | 6,543,915 | | | $ | 1,167,394 | | | | | |
| | | | | |
Shares issued in reinvestment of dividends | | | 14,899 | | | | 2,781 | | | | | | | | 128,347 | | | | 23,359 | | | | | |
| | | | | |
Shares redeemed | | | (416,415 | ) | | | (21,100 | ) | | | | | | | (3,635,011 | ) | | | (179,787 | ) | | | | |
| | | | | |
Net increase | | | 326,360 | | | | 120,625 | | | | | | | $ | 3,037,251 | | | $ | 1,010,966 | | | | | |
| | | | | |
| | | | | | | | | | | | | | | | | | | | | | | | |
| Class C | | | | | | | | | | | | | | | | | | | | | | | | |
Shares sold | | | 53,420 | | | | 2,408 | | | | | | | $ | 477,643 | | | $ | 20,250 | | | | | |
| | | | | |
Shares issued in reinvestment of dividends | | | 1,061 | | | | 258 | | | | | | | | 9,079 | | | | 2,172 | | | | | |
| | | | | |
Shares redeemed | | | (11,449 | ) | | | (2,620 | ) | | | | | | | (98,629 | ) | | | (21,453 | ) | | | | |
| | | | | |
Net increase | | | 43,032 | | | | 46 | | | | | | | $ | 388,093 | | | $ | 969 | | | | | |
| | | | | |
| | | | | | | | | | | | | | | | | | | | | | | | |
| Advisor Class | | | | | | | | | | | | | | | | | | | | | | | | |
Shares sold | | | 3,304,607 | | | | 977,399 | | | | | | | $ | 29,723,712 | | | $ | 8,297,142 | | | | | |
| | | | | |
Shares issued in reinvestment of dividends | | | 84,990 | | | | 48,040 | | | | | | | | 734,670 | | | | 407,168 | | | | | |
| | | | | |
Shares redeemed | | | (876,736 | ) | | | (741,133 | ) | | | | | | | (7,407,067 | ) | | | (6,307,457 | ) | | | | |
| | | | | |
Net increase | | | 2,512,861 | | | | 284,306 | | | | | | | $ | 23,051,315 | | | $ | 2,396,853 | | | | | |
| | | | | |
| | | | | | | | | | | | | | | | | | | | | | | | |
| Class R | | | | | | | | | | | | | | | | | | | | | | | | |
Shares sold | | | 18,632 | | | | – 0 | – | | | | | | $ | 167,380 | | | $ | – 0 | – | | | | |
| | | | | |
Shares issued in reinvestment of dividends | | | 452 | | | | – 0 | – | | | | | | | 3,864 | | | | – 0 | – | | | | |
| | | | | |
Shares redeemed | | | (32 | ) | | | – 0 | – | | | | | | | (291 | ) | | | – 0 | – | | | | |
| | | | | |
Net increase | | | 19,052 | | | | – 0 | – | | | | | | $ | 170,953 | | | $ | – 0 | – | | | | |
| | | | | |
| | | | | | | | | | | | | | | | | | | | | | | | |
| Class K | | | | | | | | | | | | | | | | | | | | | | | | |
Shares sold | | | 20,232 | | | | 23,142 | | | | | | | $ | 175,839 | | | $ | 205,610 | | | | | |
| | | | | |
Shares issued in reinvestment of dividends | | | 1,384 | | | | 702 | | | | | | | | 11,840 | | | | 5,815 | | | | | |
| | | | | |
Shares redeemed | | | (13,877 | ) | | | (185 | ) | | | | | | | (124,199 | ) | | | (1,532 | ) | | | | |
| | | | | |
Net increase | | | 7,739 | | | | 23,659 | | | | | | | $ | 63,480 | | | $ | 209,893 | | | | | |
| | | | | |
| | |
| abfunds.com | | AB EMERGING MARKETS MULTI-ASSET PORTFOLIO | 57 |
NOTES TO FINANCIAL STATEMENTS (continued)
| | | | | | | | | | | | | | | | | | | | | | | | |
| | | | | | | | | | | | | | | | | | | | | | | | |
| | | Shares | | | | | | Amount | | | | |
| | | Year Ended
March 31, 2017 | | | Year Ended
March 31, 2016 | | | | | | Year Ended
March 31, 2017 | | | Year Ended
March 31, 2016 | | | | |
| | | | | | | | |
| Class I | | | | | | | | | | | | | | | | | | | | | | | | |
Shares sold | | | 61,677 | | | | – 0 | – | | | | | | $ | 561,775 | | | $ | – 0 | – | | | | |
| | | | | |
Shares issued in reinvestment of dividends | | | 1,809 | | | | – 0 | – | | | | | | | 15,481 | | | | – 0 | – | | | | |
| | | | | |
Shares redeemed | | | (4,211 | ) | | | – 0 | – | | | | | | | (37,658 | ) | | | – 0 | – | | | | |
| | | | | |
Net increase | | | 59,275 | | | | – 0 | – | | | | | | $ | 539,598 | | | $ | – 0 | – | | | | |
| | | | | |
NOTE G
Risks Involved in Investing in the Fund
Emerging Market Risk—Investments in emerging market countries may involve more risk than investments in other foreign countries because the markets in emerging market countries are less developed and less liquid, and because these investments may be subject to increased economic, political, regulatory, or other uncertainties.
Foreign (Non-U.S.) Risk—Investments in securities of non-U.S. issuers may involve more risk than those of U.S. issuers. These securities may fluctuate more widely in price and may be less liquid due to adverse market, economic, political, regulatory or other factors.
Currency Risk—Fluctuations in currency exchange rates may negatively affect the value of the Fund’s investments or reduce its returns. Emerging market currencies may be more volatile and less liquid, and subject to significantly greater risk of currency controls and convertibility restrictions, than currencies of developed countries.
Country Concentration Risk—The Fund may not always be diversified among countries or geographic regions and the effect on the Fund’s net asset value, or NAV, of the specific risks identified above, such as political, regulatory and currency risks, may be magnified due to concentration of the Fund’s investments in a particular country or region.
Allocation Risk—The allocation of Fund assets among different asset classes, such as equity securities, debt securities and currencies, may have a significant effect on the Fund’s NAV when one of these asset classes is performing better or worse than others. The diversification benefits typically associated with investing in both equity and debt securities may be limited in the emerging markets context, as movements in emerging market equity and emerging market debt markets may be more correlated than movements in the equity and debt markets of developed countries.
| | |
| 58 | AB EMERGING MARKETS MULTI-ASSET PORTFOLIO | | abfunds.com |
NOTES TO FINANCIAL STATEMENTS (continued)
Capitalization Risk—Investments in small- and mid-capitalization companies may be more volatile than investments in large-capitalization companies. Investments in small-capitalization companies may have additional risks because these companies have limited product lines, markets or financial resources.
Interest Rate Risk and Credit Risk—Interest rate risk is the risk that changes in interest rates will affect the value of the Fund’s investments in fixed-income debt securities such as bonds or notes. Increases in interest rates may cause the value of the Fund’s investments to decline. Credit risk is the risk that the issuer or guarantor of a debt security, or the counterparty to a derivative contract, will be unable or unwilling to make timely principal and/or interest payments, or to otherwise honor its obligations. The degree of risk for a particular security may be reflected in its credit rating. Credit risk is greater for medium quality and lower-rated securities. Lower-rated debt securities and similar unrated securities (commonly known as “junk bonds”) have speculative elements or are predominantly speculative risks.
Below Investment Grade Securities—Investments in fixed-income securities with lower ratings (commonly known as “junk bonds”) tend to have a higher probability that an issuer will default or fail to meet its payment obligations. These securities may be subject to greater price volatility due to factors such as specific corporate developments, interest rate sensitivity, negative perceptions of the junk bond market generally, and less secondary market liquidity.
Derivatives Risk—The Fund may enter into derivative transactions such as forwards, options, futures and swaps. Derivatives may be illiquid, difficult to price, and leveraged so that small changes may produce disproportionate losses for the Fund, and subject to counterparty risk to a greater degree than more traditional investments. Derivatives may result in significant losses, including losses that are far greater than the value of the derivatives reflected on the statement of assets and liabilities.
Leverage Risk—When the Fund borrows money or otherwise leverages its investments, its performance may be volatile because leverage tends to exaggerate the effect of any increase or decrease in the value of the Fund’s investments. The Fund may create leverage through the use of reverse repurchase arrangements, forward currency exchange contracts, forward commitments, dollar rolls or futures contracts or by borrowing money. The use of other types of derivative instruments by the Fund, such as options and swaps, may also result in a form of leverage. Leverage may result in higher returns to the Fund than if the Fund were not leveraged, but may also adversely affect returns, particularly if the market is declining.
| | |
| abfunds.com | | AB EMERGING MARKETS MULTI-ASSET PORTFOLIO | 59 |
NOTES TO FINANCIAL STATEMENTS (continued)
Liquidity Risk—Liquidity risk occurs when certain investments become difficult to purchase or sell. Difficulty in selling less liquid securities may result in sales at disadvantageous prices affecting the value of your investment in the Fund. Causes of liquidity risk may include low trading volumes, large positions and heavy redemptions of Fund shares. Over recent years liquidity risk has also increased because the capacity of dealers in the secondary market for fixed-income securities to make markets in these securities has decreased, even as the overall bond market has grown significantly, due to, among other things, structural changes, additional regulatory requirements and capital and risk restraints that have led to reduced inventories. Liquidity risk may be higher in a rising interest rate environment, when the value and liquidity of fixed-income securities generally decline.
Indemnification Risk—In the ordinary course of business, the Fund enters into contracts that contain a variety of indemnifications. The Fund’s maximum exposure under these arrangements is unknown. However, the Fund has not had prior claims or losses pursuant to these indemnification provisions and expects the risk of loss thereunder to be remote. Therefore, the Fund has not accrued any liability in connection with these indemnification provisions.
NOTE H
Joint Credit Facility
A number of open-end mutual funds managed by the Adviser, including the Fund, participate in a $280 million revolving credit facility (the “Facility”) intended to provide short-term financing if necessary, subject to certain restrictions in connection with abnormal redemption activity. Commitment fees related to the Facility are paid by the participating funds and are included in miscellaneous expenses in the statement of operations. The Fund did not utilize the Facility during the year ended March 31, 2017.
NOTE I
Distributions to Shareholders
The tax character of distributions paid during the fiscal years ended March 31, 2017 and March 31, 2016 were as follows:
| | | | | | | | |
| | | 2017 | | | 2016 | |
Distributions paid from: | | | | | | | | |
Ordinary income | | $ | 1,451,604 | | | $ | 762,458 | |
Tax Return of Capital | | | 313,138 | | | | 361,102 | |
| | | | | | | | |
Total taxable distributions paid | | $ | 1,764,742 | | | $ | 1,123,560 | |
| | | | | | | | |
| | |
| 60 | AB EMERGING MARKETS MULTI-ASSET PORTFOLIO | | abfunds.com |
NOTES TO FINANCIAL STATEMENTS (continued)
As of March 31, 2017 the components of accumulated earnings/(deficit) on a tax basis were as follows:
| | | | |
Accumulated capital and other losses | | $ | (3,856,926 | )(a) |
Unrealized appreciation/(depreciation) | | | 2,656,563 | (b) |
| | | | |
Total accumulated earnings/(deficit) | | $ | (1,200,363 | )(c) |
| | | | |
| (a) | As of March 31, 2017, the Fund had a net capital loss carryforward of $3,856,926. During the fiscal year, the Fund utilized $324,001 of capital loss carryforwards to offset current year net realized gains. |
| (b) | The differences between book-basis and tax-basis unrealized appreciation/(depreciation) are attributable primarily to the tax deferral of losses on wash sales, the tax treatment of swaps, the recognition for tax purposes of unrealized gains/losses on certain derivative instruments, and the tax treatment of Passive Foreign Investment Companies (PFICs). |
| (c) | The differences between book-basis and tax-basis components of accumulated earnings/(deficit) is attributable to the tax treatment of defaulted securities. |
For tax purposes, net realized capital losses may be carried over to offset future capital gains, if any. Funds are permitted to carry forward capital losses for an indefinite period, and such losses will retain their character as either short-term or long-term capital losses. As of March 31, 2017, the Fund had a net short-term capital loss carryforward of $3,483,850 and net long-term capital loss carryforward of $373,076 which may be carried forward for an indefinite period.
During the current fiscal year, permanent differences primarily due to the tax treatment of swaps, reclassifications of foreign currency and foreign capital gains tax, and the tax treatment of passive foreign investment companies (PFICs) resulted in a net decrease in accumulated net investment loss, and a net increase in accumulated net realized loss on investment and foreign currency transactions. These reclassifications had no effect on net assets.
NOTE J
Other
In October 2016, the U.S. Securities and Exchange Commission adopted new rules and amended existing rules (together, “final rules”) intended to modernize the reporting and disclosure of information by registered investment companies. In part, the final rules amend Regulation S-X and require standardized, enhanced disclosure about derivatives in investment company financial statements, as well as other amendments. The compliance date for the amendments to Regulation S-X is August 1, 2017. Management is currently evaluating the impact that the adoption of the amendments to Regulation S-X will have on the financial statements and related disclosures.
| | |
| abfunds.com | | AB EMERGING MARKETS MULTI-ASSET PORTFOLIO | 61 |
NOTES TO FINANCIAL STATEMENTS (continued)
NOTE K
Recent Accounting Pronouncements
In March 2017, the Financial Accounting Standards Board issued an Accounting Standards Update, ASU 2017-08, Receivables — Nonrefundable Fees and Other Costs (Subtopic 310-20), Premium Amortization on Purchased Callable Debt Securities (the “ASU”) which amends the amortization period for certain purchased callable debt securities held at a premium, shortening such period to the earliest call date. The ASU does not require any accounting change for debt securities held at a discount; the discount continues to be amortized to maturity. The ASU is effective for fiscal years, and interim periods within those fiscal years, beginning after December 15, 2018. At this time, management is evaluating the implications of these changes on the financial statements.
NOTE L
Subsequent Events
Effective April 10, 2017, for Class C shares, the CDSC is 0% after the first year. Class C shares automatically convert to Class A shares after ten years.
Management has evaluated subsequent events for possible recognition or disclosure in the financial statements through the date the financial statements are issued. Management has determined that there are no other material events that would require disclosure in the Fund’s financial statements through this date.
| | |
| 62 | AB EMERGING MARKETS MULTI-ASSET PORTFOLIO | | abfunds.com |
FINANCIAL HIGHLIGHTS
Selected Data For A Share Of Capital Stock Outstanding Throughout Each Period
| | | | | | | | | | | | | | | | | | | | |
| | | Class A | |
| | | Year Ended March 31, | |
| | 2017 | | | 2016 | | | 2015 | | | 2014 | | | 2013 | |
| | | | |
| | | | | | | | | | | | | | | | | | | | |
Net asset value, beginning of period | | | $ 8.59 | | | | $ 8.99 | | | | $ 9.20 | | | | $ 10.05 | | | | $ 10.13 | |
| | | | |
Income From Investment Operations | | | | | | | | | | | | | | | | | | | | |
Net investment income(a)(b) | | | .24 | | | | .27 | | | | .28 | | | | .27 | | | | .15 | |
Net realized and unrealized gain (loss) on investment and foreign currency transactions | | | .74 | | | | (.37 | ) | | | (.10 | ) | | | (.96 | ) | | | (.07 | ) |
| | | | |
Net increase (decrease) in net asset value from operations | | | .98 | | | | (.10 | ) | | | .18 | | | | (.69 | ) | | | .08 | |
| | | | |
Less: Dividends and Distributions | | | | | | | | | | | | | | | | | | | | |
Dividends from net investment income | | | (.30 | ) | | | (.20 | ) | | | (.39 | ) | | | (.16 | ) | | | (.16 | ) |
Tax return of capital | | | (.07 | ) | | | (.10 | ) | | | – 0 | – | | | – 0 | – | | | – 0 | – |
| | | | |
Total dividends and distributions | | | (.37 | ) | | | (.30 | ) | | | (.39 | ) | | | (.16 | ) | | | (.16 | ) |
| | | | |
Net asset value, end of period | | | $ 9.20 | | | | $ 8.59 | | | | $ 8.99 | | | | $ 9.20 | | | | $ 10.05 | |
| | | | |
Total Return | | | | | | | | | | | | | | | | | | | | |
Total investment return based on net asset value(c) | | | 11.82 | % | | | (0.98 | )%^ | | | 1.91 | % | | | (6.82 | )% | | | 0.82 | % |
Ratios/Supplemental Data | | | | | | | | | | | | | | | | | | | | |
Net assets, end of period (000’s omitted) | | | $4,764 | | | | $1,643 | | | | $634 | | | | $605 | | | | $757 | |
Ratio to average net assets of: | | | | | | | | | | | | | | | | | | | | |
Expenses, net of waivers/reimbursements(d) | | | 1.51 | % | | | 1.62 | % | | | 1.65 | % | | | 1.65 | % | | | 1.65 | % |
Expenses, before waivers/reimbursements(d) | | | 2.92 | % | | | 3.22 | % | | | 2.96 | % | | | 2.67 | % | | | 2.88 | % |
Net investment income(b) | | | 2.68 | % | | | 3.15 | % | | | 2.96 | % | | | 2.88 | % | | | 1.48 | % |
Portfolio turnover rate | | | 118 | % | | | 108 | % | | | 114 | % | | | 183 | % | | | 91 | % |
See footnote summary on page 69.
| | |
| abfunds.com | | AB EMERGING MARKETS MULTI-ASSET PORTFOLIO | 63 |
FINANCIAL HIGHLIGHTS (continued)
Selected Data For A Share Of Capital Stock Outstanding Throughout Each Period
| | | | | | | | | | | | | | | | | | | | |
| | | Class C | |
| | | Year Ended March 31, | |
| | 2017 | | | 2016 | | | 2015 | | | 2014 | | | 2013 | |
| | | | |
| | | | | | | | | | | | | | | | | | | | |
Net asset value, beginning of period | | | $ 8.59 | | | | $ 8.97 | | | | $ 9.18 | | | | $ 9.99 | | | | $ 10.09 | |
| | | | |
Income From Investment Operations | | | | | | | | | | | | | | | | | | | | |
Net investment income(a)(b) | | | .17 | | | | .22 | | | | .18 | | | | .21 | | | | .09 | |
Net realized and unrealized gain (loss) on investment and foreign currency transactions | | | .75 | | | | (.37 | ) | | | (.08 | ) | | | (.95 | ) | | | (.09 | ) |
| | | | |
Net increase (decrease) in net asset value from operations | | | .92 | | | | (.15 | ) | | | .10 | | | | (.74 | ) | | | .00 | (e) |
| | | | |
Less: Dividends and Distributions | | | | | | | | | | | | | | | | | | | | |
Dividends from net investment income | | | (.26 | ) | | | (.16 | ) | | | (.31 | ) | | | (.07 | ) | | | (.10 | ) |
Tax return of capital | | | (.06 | ) | | | (.07 | ) | | | – 0 | – | | | – 0 | – | | | – 0 | – |
| | | | |
Total dividends and distributions | | | (.32 | ) | | | (.23 | ) | | | (.31 | ) | | | (.07 | ) | | | (.10 | ) |
| | | | |
Net asset value, end of period | | | $ 9.19 | | | | $ 8.59 | | | | $ 8.97 | | | | $ 9.18 | | | | $ 9.99 | |
| | | | |
Total Return | | | | | | | | | | | | | | | | | | | | |
Total investment return based on net asset value(c) | | | 11.00 | %^ | | | (1.58 | )%^ | | | 1.23 | % | | | (7.47 | )% | | | .00 | % |
Ratios/Supplemental Data | | | | | | | | | | | | | | | | | | | | |
Net assets, end of period (000’s omitted) | | | $497 | | | | $95 | | | | $98 | | | | $69 | | | | $114 | |
Ratio to average net assets of: | | | | | | | | | | | | | | | | | | | | |
Expenses, net of waivers/reimbursements(d) | | | 2.26 | % | | | 2.35 | % | | | 2.35 | % | | | 2.35 | % | | | 2.35 | % |
Expenses, before waivers/reimbursements(d) | | | 3.69 | % | | | 3.93 | % | | | 3.71 | % | | | 3.34 | % | | | 3.66 | % |
Net investment income(b) | | | 1.97 | % | | | 2.52 | % | | | 1.97 | % | | | 2.25 | % | | | .91 | % |
Portfolio turnover rate | | | 118 | % | | | 108 | % | | | 114 | % | | | 183 | % | | | 91 | % |
See footnote summary on page 69.
| | |
| 64 | AB EMERGING MARKETS MULTI-ASSET PORTFOLIO | | abfunds.com |
FINANCIAL HIGHLIGHTS (continued)
Selected Data For A Share Of Capital Stock Outstanding Throughout Each Period
| | | | | | | | | | | | | | | | | | | | |
| | | Advisor Class | |
| | | Year Ended March 31, | |
| | 2017 | | | 2016 | | | 2015 | | | 2014 | | | 2013 | |
| | | | |
| | | | | | | | | | | | | | | | | | | | |
Net asset value, beginning of period | | | $ 8.61 | | | | $ 9.00 | | | | $ 9.22 | | | | $ 10.07 | | | | $ 10.15 | |
| | | | |
Income From Investment Operations | | | | | | | | | | | | | | | | | | | | |
Net investment income(a)(b) | | | .27 | | | | .31 | | | | .31 | | | | .30 | | | | .18 | |
Net realized and unrealized gain (loss) on investment and foreign currency transactions | | | .74 | | | | (.38 | ) | | | (.11 | ) | | | (.96 | ) | | | (.08 | ) |
| | | | |
Net increase (decrease) in net asset value from operations | | | 1.01 | | | | (.07 | ) | | | .20 | | | | (.66 | ) | | | .10 | |
| | | | |
Less: Dividends and Distributions | | | | | | | | | | | | | | | | | | | | |
Dividends from net investment income | | | (.33 | ) | | | (.22 | ) | | | (.42 | ) | | | (.19 | ) | | | (.18 | ) |
Tax return of capital | | | (.07 | ) | | | (.10 | ) | | | – 0 | – | | | – 0 | – | | | – 0 | – |
| | | | |
Total dividends and distributions | | | (.40 | ) | | | (.32 | ) | | | (.42 | ) | | | (.19 | ) | | | (.18 | ) |
| | | | |
Net asset value, end of period | | | $ 9.22 | | | | $ 8.61 | | | | $ 9.00 | | | | $ 9.22 | | | | $ 10.07 | |
| | | | |
Total Return | | | | | | | | | | | | | | | | | | | | |
Total investment return based on net asset value(c) | | | 12.07 | % | | | (0.63 | )%^ | | | 2.17 | % | | | (6.48 | )% | | | 1.02 | % |
Ratios/Supplemental Data | | | | | | | | | | | | | | | | | | | | |
Net assets, end of period (000’s omitted) | | | $42,000 | | | | $17,572 | | | | $15,805 | | | | $16,242 | | | | $14,088 | |
Ratio to average net assets of: | | | | | | | | | | | | | | | | | | | | |
Expenses, net of waivers/reimbursements(d) | | | 1.24 | % | | | 1.35 | % | | | 1.35 | % | | | 1.35 | % | | | 1.35 | % |
Expenses, before waivers/reimbursements(d) | | | 2.64 | % | | | 2.92 | % | | | 2.65 | % | | | 2.40 | % | | | 2.63 | % |
Net investment income(b) | | | 3.07 | % | | | 3.60 | % | | | 3.27 | % | | | 3.18 | % | | | 1.80 | % |
Portfolio turnover rate | | | 118 | % | | | 108 | % | | | 114 | % | | | 183 | % | | | 91 | % |
See footnote summary on page 69.
| | |
| abfunds.com | | AB EMERGING MARKETS MULTI-ASSET PORTFOLIO | 65 |
FINANCIAL HIGHLIGHTS (continued)
Selected Data For A Share Of Capital Stock Outstanding Throughout Each Period
| | | | | | | | | | | | | | | | | | | | |
| | | Class R | |
| | | Year Ended March 31, | |
| | 2017 | | | 2016 | | | 2015 | | | 2014 | | | 2013 | |
| | | | |
| | | | | | | | | | | | | | | | | | | | |
Net asset value, beginning of period | | | $ 8.57 | | | | $ 8.96 | | | | $ 9.18 | | | | $ 10.03 | | | | $ 10.12 | |
| | | | |
Income From Investment Operations | | | | | | | | | | | | | | | | | | | | |
Net investment income(a)(b) | | | .18 | | | | .26 | | | | .26 | | | | .25 | | | | .15 | |
Net realized and unrealized gain (loss) on investment and foreign currency transactions | | | .78 | | | | (.37 | ) | | | (.11 | ) | | | (.95 | ) | | | (.09 | ) |
| | | | |
Net increase (decrease) in net asset value from operations | | | .96 | | | | (.11 | ) | | | .15 | | | | (.70 | ) | | | .06 | |
| | | | |
Less: Dividends and Distributions | | | | | | | | | | | | | | | | | | | | |
Dividends from net investment income | | | (.30 | ) | | | (.19 | ) | | | (.37 | ) | | | (.15 | ) | | | (.15 | ) |
Tax return of capital | | | (.06 | ) | | | (.09 | ) | | | – 0 | – | | | – 0 | – | | | – 0 | – |
| | | | |
Total dividends and distributions | | | (.36 | ) | | | (.28 | ) | | | (.37 | ) | | | (.15 | ) | | | (.15 | ) |
| | | | |
Net asset value, end of period | | | $ 9.17 | | | | $ 8.57 | | | | $ 8.96 | | | | $ 9.18 | | | | $ 10.03 | |
| | | | |
Total Return | | | | | | | | | | | | | | | | | | | | |
Total investment return based on net asset value(c) | | | 11.51 | % | | | (1.07 | )% | | | 1.70 | % | | | (6.99 | )% | | | 0.57 | % |
Ratios/Supplemental Data | | | | | | | | | | | | | | | | | | | | |
Net assets, end of period (000’s omitted) | | | $184 | | | | $9 | | | | $9 | | | | $9 | | | | $10 | |
Ratio to average net assets of: | | | | | | | | | | | | | | | | | | | | |
Expenses, net of waivers/reimbursements(d) | | | 1.72 | % | | | 1.85 | % | | | 1.85 | % | | | 1.85 | % | | | 1.85 | % |
Expenses, before waivers/reimbursements(d) | | | 3.24 | % | | | 3.39 | % | | | 3.11 | % | | | 2.85 | % | | | 3.20 | % |
Net investment income(b) | | | 2.08 | % | | | 3.00 | % | | | 2.79 | % | | | 2.66 | % | | | 1.53 | % |
Portfolio turnover rate | | | 118 | % | | | 108 | % | | | 114 | % | | | 183 | % | | | 91 | % |
See footnote summary on page 69.
| | |
| 66 | AB EMERGING MARKETS MULTI-ASSET PORTFOLIO | | abfunds.com |
FINANCIAL HIGHLIGHTS (continued)
Selected Data For A Share Of Capital Stock Outstanding Throughout Each Period
| | | | | | | | | | | | | | | | | | | | |
| | | Class K | |
| | | Year Ended March 31, | |
| | 2017 | | | 2016 | | | 2015 | | | 2014 | | | 2013 | |
| | | | |
| | | | | | | | | | | | | | | | | | | | |
Net asset value, beginning of period | | | $ 8.56 | | | | $ 8.95 | | | | $ 9.17 | | | | $ 10.03 | | | | $ 10.12 | |
| | | | |
Income From Investment Operations | | | | | | | | | | | | | | | | | | | | |
Net investment income(a)(b) | | | .26 | | | | .24 | | | | .28 | | | | .26 | | | | .17 | |
Net realized and unrealized gain (loss) on investment and foreign currency transactions | | | .71 | | | | (.33 | ) | | | (.10 | ) | | | (.94 | ) | | | (.09 | ) |
| | | | |
Net increase (decrease) in net asset value from operations | | | .97 | | | | (.09 | ) | | | .18 | | | | (.68 | ) | | | .08 | |
| | | | |
Less: Dividends and Distributions | | | | | | | | | | | | | | | | | | | | |
Dividends from net investment income | | | (.30 | ) | | | (.20 | ) | | | (.40 | ) | | | (.18 | ) | | | (.17 | ) |
Tax return of capital | | | (.07 | ) | | | (.10 | ) | | | – 0 | – | | | – 0 | – | | | – 0 | – |
| | | | |
Total dividends and distributions | | | (.37 | ) | | | (.30 | ) | | | (.40 | ) | | | (.18 | ) | | | (.17 | ) |
| | | | |
Net asset value, end of period | | | $ 9.16 | | | | $ 8.56 | | | | $ 8.95 | | | | $ 9.17 | | | | $ 10.03 | |
| | | | |
Total Return | | | | | | | | | | | | | | | | | | | | |
Total investment return based on net asset value(c) | | | 11.75 | % | | | (0.86 | )%^ | | | 1.91 | % | | | (6.75 | )% | | | 0.83 | % |
Ratios/Supplemental Data | | | | | | | | | | | | | | | | | | | | |
Net assets, end of period (000’s omitted) | | | $298 | | | | $212 | | | | $10 | | | | $9 | | | | $10 | |
Ratio to average net assets of: | | | | | | | | | | | | | | | | | | | | |
Expenses, net of waivers/reimbursements(d) | | | 1.53 | % | | | 1.60 | % | | | 1.60 | % | | | 1.60 | % | | | 1.60 | % |
Expenses, before waivers/reimbursements(d) | | | 2.89 | % | | | 3.34 | % | | | 2.86 | % | | | 2.68 | % | | | 2.92 | % |
Net investment income(b) | | | 2.94 | % | | | 2.87 | % | | | 2.95 | % | | | 2.76 | % | | | 1.78 | % |
Portfolio turnover rate | | | 118 | % | | | 108 | % | | | 114 | % | | | 183 | % | | | 91 | % |
See footnote summary on page 69.
| | |
| abfunds.com | | AB EMERGING MARKETS MULTI-ASSET PORTFOLIO | 67 |
FINANCIAL HIGHLIGHTS (continued)
Selected Data For A Share Of Capital Stock Outstanding Throughout Each Period
| | | | | | | | | | | | | | | | | | | | |
| | | Class I | |
| | | Year Ended March 31, | |
| | 2017 | | | 2016 | | | 2015 | | | 2014 | | | 2013 | |
| | | | |
| | | | | | | | | | | | | | | | | | | | |
Net asset value, beginning of period | | | $ 8.56 | | | | $ 8.96 | | | | $ 9.19 | | | | $ 10.04 | | | | $ 10.13 | |
| | | | |
Income From Investment Operations | | | | | | | | | | | | | | | | | | | | |
Net investment income(a)(b) | | | .28 | | | | .30 | | | | .32 | | | | .29 | | | | .20 | |
Net realized and unrealized gain (loss) on investment and foreign currency transactions | | | .72 | | | | (.37 | ) | | | (.12 | ) | | | (.94 | ) | | | (.09 | ) |
| | | | |
Net increase (decrease) in net asset value from operations | | | 1.00 | | | | (.07 | ) | | | .20 | | | | (.65 | ) | | | .11 | |
| | | | |
Less: Dividends and Distributions | | | | | | | | | | | | | | | | | | | | |
Dividends from net investment income | | | (.33 | ) | | | (.22 | ) | | | (.43 | ) | | | (.20 | ) | | | (.20 | ) |
Tax return of capital | | | (.07 | ) | | | (.11 | ) | | | – 0 | – | | | – 0 | – | | | – 0 | – |
| | | | |
Total dividends and distributions | | | (.40 | ) | | | (.33 | ) | | | (.43 | ) | | | (.20 | ) | | | (.20 | ) |
| | | | |
Net asset value, end of period | | | $ 9.16 | | | | $ 8.56 | | | | $ 8.96 | | | | $ 9.19 | | | | $ 10.04 | |
| | | | |
Total Return | | | | | | | | | | | | | | | | | | | | |
Total investment return based on net asset value(c) | | | 12.15 | %^ | | | (0.66 | )%^ | | | 2.15 | % | | | (6.44 | ) % | | | 1.05 | % |
Ratios/Supplemental Data | | | | | | | | | | | | | | | | | | | | |
Net assets, end of period (000’s omitted) | | | $16,952 | | | | $15,342 | | | | $16,054 | | | | $18,351 | | | | $20,039 | |
Ratio to average net assets of: | | | | | | | | | | | | | | | | | | | | |
Expenses, net of waivers/reimbursements(d) | | | 1.28 | % | | | 1.35 | % | | | 1.35 | % | | | 1.35 | % | | | 1.35 | % |
Expenses, before waivers/reimbursements(d) | | | 2.51 | % | | | 2.85 | % | | | 2.57 | % | | | 2.33 | % | | | 2.64 | % |
Net investment income(b) | | | 3.19 | % | | | 3.49 | % | | | 3.37 | % | | | 3.17 | % | | | 2.02 | % |
Portfolio turnover rate | | | 118 | % | | | 108 | % | | | 114 | % | | | 183 | % | | | 91 | % |
See footnote summary on page 69.
| | |
| 68 | AB EMERGING MARKETS MULTI-ASSET PORTFOLIO | | abfunds.com |
FINANCIAL HIGHLIGHTS (continued)
| (a) | Based on average shares outstanding. |
| (b) | Net of expenses waived/reimbursed by the Adviser. |
| (c) | Total investment return is calculated assuming an initial investment made at the net asset value at the beginning of the period, reinvestment of all dividends and distributions at net asset value during the period, and redemption on the last day of the period. Initial sales charge or contingent deferred sales charge is not reflected in the calculation of total investment return. Total investment return does not reflect the deduction of taxes that a shareholder would pay on fund distributions or the redemption of fund shares. Total investment return for a period of less than one year is not annualized. |
| ^ | The net asset value and total return include adjustments in accordance with accounting principles generally accepted in the United States of America for financial reporting purposes. As such, the net asset value and total return for shareholder transactions may differ from financial statements. |
| (d) | In connection with the Fund’s investments in affiliated underlying portfolios, the Fund incurs no direct expenses but bears proportionate shares of the acquired fund fees and expenses (i.e., operating, administrative and investment advisory fees) of the affiliated underlying portfolios. The Adviser has contractually agreed to waive its fees from the Fund in an amount equal to the Fund’s pro rata share of certain acquired fund fees and expenses, and for the year ended March 31, 2017, such waiver amounted to 0.02% annualized for the Fund. |
| (e) | Amount is less than $0.005. |
See notes to financial statements.
| | |
| abfunds.com | | AB EMERGING MARKETS MULTI-ASSET PORTFOLIO | 69 |
REPORT OF INDEPENDENT REGISTERED
PUBLIC ACCOUNTING FIRM
To the Board of Directors and Shareholders of the AB Emerging Markets Multi-Asset Portfolio
We have audited the accompanying statement of assets and liabilities, including the portfolio of investments, of AB Emerging Markets Multi-Asset Portfolio (one of the portfolios constituting AB Cap Fund, Inc., (the “Fund”)) as of March 31, 2017, and the related statement of operations for the year then ended, the statements of changes in net assets for each of the two years in the period then ended, and the financial highlights for each of the five years in the period then ended. These financial statements and financial highlights are the responsibility of the Fund’s management. Our responsibility is to express an opinion on these financial statements and financial highlights based on our audits.
We conducted our audits in accordance with the standards of the Public Company Accounting Oversight Board (United States). Those standards require that we plan and perform the audit to obtain reasonable assurance about whether the financial statements and financial highlights are free of material misstatement. We were not engaged to perform an audit of the Fund’s internal control over financial reporting. Our audits included consideration of internal control over financial reporting as a basis for designing audit procedures that are appropriate in the circumstances, but not for the purpose of expressing an opinion on the effectiveness of the Fund’s internal control over financial reporting. Accordingly, we express no such opinion. An audit also includes examining, on a test basis, evidence supporting the amounts and disclosures in the financial statements and financial highlights, assessing the accounting principles used and significant estimates made by management, and evaluating the overall financial statement presentation. Our procedures included confirmation of securities owned as of March 31, 2017, by correspondence with the custodian and others, or by other appropriate auditing procedures where replies from others were not received. We believe that our audits provide a reasonable basis for our opinion.
In our opinion, the financial statements and financial highlights referred to above present fairly, in all material respects, the financial position of AB Emerging Markets Multi-Asset Portfolio (one of the portfolios constituting the AB Cap Fund, Inc.) at March 31, 2017, the results of its operations for the year then ended, the changes in its net assets for each of the two years in the period then ended, and the financial highlights for each of the five years in the period then ended, in conformity with U.S. generally accepted accounting principles.

New York, New York
May 25, 2017
| | |
| 70 | AB EMERGING MARKETS MULTI-ASSET PORTFOLIO | | abfunds.com |
2017 FEDERAL TAX INFORMATION
(unaudited)
For Federal income tax purposes, the following information is furnished with respect to the earnings of the Fund for the taxable year ended March 31, 2017.
For corporate shareholders, 0.53% of dividends paid qualify for the dividends received deduction. For individual shareholders, the Fund designates 23.14% of dividends paid as qualified dividend income.
The Fund intends to make an election to pass through foreign taxes to its shareholders. For the taxable year ended March 31, 2017, $78,669 of foreign taxes may be passed through and the associated foreign source income for information reporting purposes is $674,805.
Shareholders should not use the above information to prepare their income tax returns. The information necessary to complete your income tax returns will be included with your Form 1099-DIV which will be sent to you separately in January 2018.
| | |
| abfunds.com | | AB EMERGING MARKETS MULTI-ASSET PORTFOLIO | 71 |
BOARD OF DIRECTORS
Marshall C. Turner, Jr.(1), Chairman
John H. Dobkin(1)
Michael J. Downey(1)
William H. Foulk, Jr.(1)
D. James Guzy(1)
Nancy P. Jacklin(1)
Carol C. McMullen(1)
Robert M. Keith, President and Chief Executive Officer
Garry L. Moody(1)
Earl D. Weiner(1)
OFFICERS
Philip L. Kirstein, Senior Vice President and Independent Compliance Officer
Henry S. D’Auria(2), Vice President
Paul J. DeNoon(2), Vice President
Morgan C. Harting(2), Vice President
Shamaila Khan(2), Vice President
Emilie D. Wrapp, Secretary
Joseph J. Mantineo, Treasurer and Chief Financial Officer
Phyllis J. Clarke, Controller
Vincent S. Noto, Chief Compliance Officer
| | |
Custodian and Accounting Agent Brown Brothers Harriman & Co.
50 Post Office Square
Boston, MA 02110 Principal Underwriter AllianceBernstein Investments, Inc.
1345 Avenue of the Americas
New York, NY 10105 Legal Counsel Seward & Kissel LLP
One Battery Park Plaza
New York, NY 10004 | | Independent Registered Public Accounting Firm Ernst & Young LLP
5 Times Square
New York, NY 10036 Transfer Agent AllianceBernstein Investor
Services, Inc.
P.O. Box 786003
San Antonio, TX 78278-6003
Toll-Free (800) 221-5672 |
| (1) | Member of the Audit Committee, the Governance and Nominating Committee and the Independent Directors Committee. |
| (2) | The day-to-day management of, and investment decisions for, the Portfolio are made by the Adviser’s Emerging Markets Multi-Asset Team. Messrs. D’Auria, DeNoon, Harting and Ms. Khan are the investment professionals with the most significant responsibility for the day-to-day management of the Portfolio’s portfolio. |
| | |
| 72 | AB EMERGING MARKETS MULTI-ASSET PORTFOLIO | | abfunds.com |
MANAGEMENT OF THE FUND
Directors Bios for – Emerging Markets Multi-Asset
| | | | | | | | |
NAME,
ADDRESS*, AGE,
(YEAR FIRST ELECTED**) | | PRINCIPAL
OCCUPATION(S)
DURING PAST FIVE YEARS
AND OTHER RELEVANT
QUALIFICATIONS*** | | PORTFOLIOS IN AB FUND COMPLEX OVERSEEN BY DIRECTOR | | | OTHER PUBLIC COMPANY DIRECTORSHIPS CURRENTLY
HELD BY
DIRECTOR |
| INTERESTED DIRECTOR | | | | | | |
Robert M. Keith, # 1345 Avenue of the Americas New York, NY 10105 57 (2011) | | Senior Vice President of AllianceBernstein L.P. (the “Adviser”) and the head of AllianceBernstein Investments, Inc. (“ABI”) since July 2008; Director of ABI and President of the AB Mutual Funds. Previously, he served as Executive Managing Director of ABI from December 2006 to June 2008. Prior to joining ABI in 2006, Executive Managing Director of Bernstein Global Wealth Management, and prior thereto, Senior Managing Director and Global Head of Client Service and Sales of the Adviser’s institutional investment management business since 2004. Prior thereto, he was Managing Director and Head of North American Client Service and Sales in the Adviser’s institutional investment management business, with which he had been associated since prior to 2004. | | | 96 | | | None |
| | | | | | | | |
| | |
| abfunds.com | | AB EMERGING MARKETS MULTI-ASSET PORTFOLIO | 73 |
MANAGEMENT OF THE FUND (continued)
| | | | | | | | |
NAME,
ADDRESS*, AGE,
(YEAR FIRST ELECTED**) | | PRINCIPAL
OCCUPATION(S)
DURING PAST FIVE YEARS
AND OTHER RELEVANT
QUALIFICATIONS*** | | PORTFOLIOS IN AB FUND COMPLEX OVERSEEN BY DIRECTOR | | | OTHER PUBLIC COMPANY DIRECTORSHIPS CURRENTLY
HELD BY
DIRECTOR |
| DISINTERESTED DIRECTORS | | | | | | |
Marshall C. Turner, Jr., ## Chairman of the Board 75 (2011) | | Private Investor since prior to 2012. Former CEO of Dupont Photomasks, Inc. (components of semi-conductor manufacturing). He has extensive operating leadership, and venture capital experience, including five interim or full-time CEO roles, and prior service as general partner of institutional venture capital partnerships. He also has extensive non-profit board leadership experience, and currently serves on the boards of two education and science-related non-profit organizations. He has served as a director of one AB Fund since 1992, and director or trustee of multiple AB Funds since 2005. He has been Chairman of the AB Funds since January 2014, and the Chairman of the Independent Directors Committees of such Funds since February 2014. | | | 96 | | | Xilinx, Inc. (programmable logic semi-conductors) since 2007 |
| | | | | | | | |
John H. Dobkin, ## 75 (2011) | | Independent Consultant since prior to 2012. Formerly, President of Save Venice, Inc. (preservation organization) from 2001-2002; Senior Advisor from June 1999-June 2000 and President of Historic Hudson Valley (historic preservation) from December 1989-May 1999. Previously, Director of the National Academy of Design. He has served as a director or trustee of various AB Funds since 1992, and as Chairman of the Audit Committees of a number of such AB Funds from 2001-2008. | | | 95 | | | None |
| | | | | | | | |
| | |
| 74 | AB EMERGING MARKETS MULTI-ASSET PORTFOLIO | | abfunds.com |
MANAGEMENT OF THE FUND (continued)
| | | | | | | | |
NAME,
ADDRESS*, AGE,
(YEAR FIRST ELECTED**) | | PRINCIPAL
OCCUPATION(S)
DURING PAST FIVE YEARS
AND OTHER RELEVANT
QUALIFICATIONS*** | | PORTFOLIOS IN AB FUND COMPLEX OVERSEEN BY DIRECTOR | | | OTHER PUBLIC COMPANY DIRECTORSHIPS CURRENTLY
HELD BY
DIRECTOR |
DISINTERESTED DIRECTORS
(continued) | | | | | | |
Michael J. Downey, ## 73 (2011) | | Private Investor since prior to 2012. Formerly, managing partner of Lexington Capital, LLC (investment advisory firm) from December 1997 until December 2003. He served as a Director of Prospect Acquisition Corp. (financial services) from 2007 until 2009. From 1987 until 1993, Chairman and CEO of Prudential Mutual Fund Management, director of the Prudential mutual funds, and member of the Executive Committee of Prudential Securities Inc. He has served as a director or trustee of the AB Funds since 2005 and is a director and Chairman of one other registered investment company. | | | 96 | | | The Asia Pacific Fund, Inc. (registered investment company) since prior to 2012 |
| | | | | | | | |
William H. Foulk, Jr., ## 84 (2011) | | Investment Adviser and an Independent Consultant since prior to 2012. Previously, he was Senior Manager of Barrett Associates, Inc., a registered investment adviser. He was formerly Deputy Comptroller and Chief Investment Officer of the State of New York and, prior thereto, Chief Investment Officer of the New York Bank for Savings. He has served as a director or trustee of various AB Funds since 1983, and was Chairman of the Independent Directors Committees of the AB Funds from 2003 until early February 2014. He served as Chairman of such Funds from 2003 through December 2013. He is also active in a number of mutual fund related organizations and committees. | | | 96 | | | None |
| | |
| abfunds.com | | AB EMERGING MARKETS MULTI-ASSET PORTFOLIO | 75 |
MANAGEMENT OF THE FUND (continued)
| | | | | | | | |
NAME,
ADDRESS*, AGE,
(YEAR FIRST ELECTED**) | | PRINCIPAL
OCCUPATION(S)
DURING PAST FIVE YEARS
AND OTHER RELEVANT
QUALIFICATIONS*** | | PORTFOLIOS IN AB FUND COMPLEX OVERSEEN BY DIRECTOR | | | OTHER PUBLIC COMPANY DIRECTORSHIPS CURRENTLY
HELD BY
DIRECTOR |
DISINTERESTED DIRECTORS
(continued) | | | | | | |
D. James Guzy, ## 81 (2011) | | Chairman of the Board of SRC Computers, Inc. (semi-conductors), with which he has been associated since prior to 2012. He served as Chairman of the Board of PLX Technology (semi-conductors) since prior to 2012 until November 2013. He was a director of Intel Corporation (semi-conductors) from 1969 until 2008, and served as Chairman of the Finance Committee of such company for several years until May 2008. He was a Director of Cirrus Logic Corporation (semi-conductors) from 1984 until July 2011. He has served as a director or trustee of one or more of the AB Funds since 1982. | | | 93 | | | None |
| | | | | | | | |
Nancy P. Jacklin, ## 69 (2011) | | Private Investor since prior to 2012. Professorial Lecturer at the Johns Hopkins School of Advanced International Studies (2008-2015). U.S. Executive Director of the International Monetary Fund (which is responsible for ensuring the stability of the international monetary system), (December 2002-May 2006); Partner, Clifford Chance (1992-2002); Sector Counsel, International Banking and Finance, and Associate General Counsel, Citicorp (1985-1992); Assistant General Counsel (International), Federal Reserve Board of Governors (1982-1985); and Attorney Advisor, U.S. Department of the Treasury (1973-1982). Member of the Bar of the District of Columbia and of New York; and member of the Council on Foreign Relations. She has served as a director or trustee of the AB Funds since 2006 and has been Chairman of the Governance and Nominating Committees of the Funds since August 2014. | | | 96 | | | None |
| | |
| 76 | AB EMERGING MARKETS MULTI-ASSET PORTFOLIO | | abfunds.com |
MANAGEMENT OF THE FUND (continued)
| | | | | | | | |
NAME,
ADDRESS*, AGE,
(YEAR FIRST ELECTED**) | | PRINCIPAL
OCCUPATION(S)
DURING PAST FIVE YEARS
AND OTHER RELEVANT
QUALIFICATIONS*** | | PORTFOLIOS IN AB FUND COMPLEX OVERSEEN BY DIRECTOR | | | OTHER PUBLIC COMPANY DIRECTORSHIPS CURRENTLY
HELD BY
DIRECTOR |
DISINTERESTED DIRECTORS
(continued) | | | | | | |
Carol C. McMullen, ## 61 (2016) | | Managing Director of Slalom Consulting (consulting) since 2014, private investor and member of the Partners Healthcare Investment Committee. Formerly, Director of Norfolk & Dedham Group (mutual property and casualty insurance) from 2011 until November 2016; Director of Partners Community Physicians Organization (healthcare) from 2014 until December 2016; and Managing Director of The Crossland Group (consulting) from 2012 until 2013. She has held a number of senior positions in the asset and wealth management industries, including at Eastern Bank (where her roles included President of Eastern Wealth Management), Thomson Financial (Global Head of Sales for Investment Management), and Putnam Investments (where her roles included Head of Global Investment Research). She has served on a number of private company and nonprofit boards, and as a director or trustee of the AB Funds since June 2016. | | | 96 | | | None |
| | | | | | | | |
| | |
| abfunds.com | | AB EMERGING MARKETS MULTI-ASSET PORTFOLIO | 77 |
MANAGEMENT OF THE FUND (continued)
| | | | | | | | |
NAME,
ADDRESS*, AGE,
(YEAR FIRST ELECTED**) | | PRINCIPAL
OCCUPATION(S)
DURING PAST FIVE YEARS
AND OTHER RELEVANT
QUALIFICATIONS*** | | PORTFOLIOS IN AB FUND COMPLEX OVERSEEN BY DIRECTOR | | | OTHER PUBLIC COMPANY DIRECTORSHIPS CURRENTLY
HELD BY
DIRECTOR |
DISINTERESTED DIRECTORS
(continued) | | | | | | |
Garry L. Moody, ## 65 (2011) | | Independent Consultant. Formerly, Partner, Deloitte & Touche LLP (1995-2008) where he held a number of senior positions, including Vice Chairman, and U.S. and Global Investment Management Practice Managing Partner; President, Fidelity Accounting and Custody Services Company (1993-1995), where he was responsible for accounting, pricing, custody and reporting for the Fidelity mutual funds; and Partner, Ernst & Young LLP (1975-1993), where he served as the National Director of Mutual Fund Tax Services and Managing Partner of its Chicago Office Tax department. He is a member of the Trustee Advisory Board of BoardIQ, a biweekly publication focused on issues and news affecting directors of mutual funds. He has served as a director or trustee, and as Chairman of the Audit Committees, of the AB Funds since 2008. | | | 96 | | | None |
| | | | | | | | |
Earl D. Weiner, ## 77 (2011) | | Of Counsel, and Partner prior to January 2007, of the law firm Sullivan & Cromwell LLP and is a former member of the ABA Federal Regulation of Securities Committee Task Force to draft editions of the Fund Director’s Guidebook. He also serves as a director or trustee of various non-profit organizations and has served as Chairman or Vice Chairman of a number of them. He has served as a director or trustee of the AB Funds since 2007 and served as Chairman of the Governance and Nominating Committees of the AB Funds from 2007 until August 2014. | | | 96 | | | None |
| | |
| 78 | AB EMERGING MARKETS MULTI-ASSET PORTFOLIO | | abfunds.com |
MANAGEMENT OF THE FUND (continued)
| * | The address for each of the Fund’s disinterested Directors is c/o AllianceBernstein L.P. Attention: Philip L. Kirstein, 1345 Avenue of the Americas, New York, NY 10105. |
| ** | There is no stated term of office for the Fund’s Directors. |
| *** | The information above includes each Director’s principal occupation during the last five years and other information relating to the experience, attributes, and skills relevant to each Director’s qualifications to serve as a Director, which led to the conclusion that each Director should serve as a Director for the Fund. |
| # | Mr. Keith is an “interested person” of the Fund, as defined in the 1940 Act, due to his position as a Senior Vice President of the Adviser. |
| ## | Member of the Audit Committee, the Governance and Nominating Committee and the Independent Directors Committee. |
| | |
| abfunds.com | | AB EMERGING MARKETS MULTI-ASSET PORTFOLIO | 79 |
MANAGEMENT OF THE FUND (continued)
Officer Information
Certain information concerning the Fund’s Officers is listed below:
| | | | |
Robert M. Keith
57 | | President and Chief Executive Officer | | See biography above. |
| | | | |
Philip L. Kirstein
72 | | Senior Vice President and Independent Compliance Officer | | Senior Vice President and Independent Compliance Officer of the AB Funds, with which he has been associated since October 2004. Prior thereto, he was Of Counsel to Kirkpatrick & Lockhart, LLP from October 2003 to October 2004, and General Counsel of Merrill Lynch Investment Managers, L.P., since prior to March 2003. |
| | | | |
Henry S. D’Auria
55 | | Vice President | | Senior Vice President of the Adviser**, with which he has been associated since prior to 2012. |
| | | | |
Paul J. DeNoon
55 | | Vice President | | Senior Vice President of the Adviser**, with which he has been associated since prior to 2012. |
| | | | |
Morgan C. Harting
45 | | Vice President | | Senior Vice President of the Adviser**, with which he has been associated since prior to 2012. |
| | | | |
Shamaila Khan
46 | | Vice President | | Senior Vice President of the Adviser**, with which he has been associated since prior to 2012. |
| | | | |
Emilie D. Wrapp
61 | | Secretary | | Senior Vice President, Assistant General Counsel and Assistant Secretary of ABI**, with which she has been associated since prior to 2012. |
| | | | |
Joseph J. Mantineo
58 | | Treasurer and Chief Financial Officer | | Senior Vice President of AllianceBernstein Investor Services (“ABIS”)**, with which he has been associated since prior to 2012. |
| | | | |
Phyllis J. Clarke
56 | | Controller | | Vice President of ABIS**, with which she has been associated since prior to 2012. |
| | | | |
Vincent S. Noto 52 | | Chief Compliance Officer | | Senior Vice President since 2015 and Mutual Fund Chief Compliance Officer of the Adviser** since 2014. Prior thereto, he was Vice President and Director of Mutual Fund Compliance of the Adviser** since prior to 2012. |
| * | The address for each of the Fund’s Officers is 1345 Avenue of the Americas, New York, NY 10105. |
| ** | The Adviser, ABI and ABIS are affiliates of the Fund. |
| | The Fund’s Statement of Additional Information (“SAI”) has additional information about the Fund’s Directors and Officers and is available without charge upon request. Contact your financial representative or AB at (800) 227-4618, or visit www.abgfunds.com, for a free prospectus or SAI. |
| | |
| 80 | AB EMERGING MARKETS MULTI-ASSET PORTFOLIO | | abfunds.com |
Information Regarding the Review and Approval of Amendment to the Fund’s Advisory Agreement
At a meeting of the Board of Directors of AB Cap Fund, Inc. (the “Company”) held on January 31-February 1, 2017, the Adviser recommended an amendment to the Company’s current Advisory Agreement with the Adviser (the “Amended Agreement”) to effect a fee reduction in respect of AB Emerging Markets Multi-Asset Portfolio (the “Fund”) effective February 3, 2017.
After their review of updated comparative fee and expense information, and discussion with experienced counsel who are independent of the Adviser, who advised on the relevant legal standards, and the Company’s Senior Officer (who is also the Company’s Independent Compliance Officer), the disinterested directors (the “directors”) unanimously approved the Amended Agreement.
The directors last approved the continuance of the Fund’s current Advisory Agreement at a meeting held on May 3-5, 2016 (the “May 2016 Meeting”) and a discussion regarding the basis for the Board’s approval is set forth below. In determining to approve the Amended Agreement the directors took into account their review at the May 2016 Meeting and noted that the proposed lowering of the advisory fee would benefit the Fund and its shareholders. The Directors noted that the Adviser was reducing fees for business reasons, and had assured them that there would be no diminution in the nature or quality of services to the Fund.
Board’s Approval at the May 2016 Meeting
The directors unanimously approved the continuance of the Fund’s current Advisory Agreement at the May 2016 Meeting.
Prior to approval of the continuance of the Advisory Agreement, the directors had requested from the Adviser, and received and evaluated, extensive materials. They reviewed the proposed continuance of the Advisory Agreement with the Adviser and with experienced counsel who are independent of the Adviser, who advised on the relevant legal standards. The directors also reviewed an independent evaluation prepared by the Company’s Senior Officer of the reasonableness of the advisory fee, in which the Senior Officer concluded that the contractual fee for the Fund was reasonable. The directors also discussed the proposed continuance in private sessions with counsel and the Company’s Senior Officer.
The directors considered their knowledge of the nature and quality of the services provided by the Adviser to the Fund gained from their experience as directors or trustees of most of the registered investment companies advised by the Adviser, their overall confidence in the Adviser’s integrity and competence they have gained from that experience, the Adviser’s initiative in identifying and raising potential issues with the directors and its
| | |
| abfunds.com | | AB EMERGING MARKETS MULTI-ASSET PORTFOLIO | 81 |
responsiveness, frankness and attention to concerns raised by the directors in the past, including the Adviser’s willingness to consider and implement organizational and operational changes designed to improve investment results and the services provided to the AB Funds. The directors noted that they have four regular meetings each year, at each of which they receive presentations from the Adviser on the investment results of the Fund and review extensive materials and information presented by the Adviser.
The directors also considered all other factors they believed relevant, including the specific matters discussed below. In their deliberations, the directors did not identify any particular information that was all-important or controlling, and different directors may have attributed different weights to the various factors. The directors determined that the selection of the Adviser to manage the Fund and the overall arrangements between the Fund and the Adviser, as provided in the Advisory Agreement, including the advisory fee, were fair and reasonable in light of the services performed, expenses incurred and such other matters as the directors considered relevant in the exercise of their business judgment. The material factors and conclusions that formed the basis for the directors’ determinations included the following:
Nature, Extent and Quality of Services Provided
The directors considered the scope and quality of services provided by the Adviser under the Advisory Agreement, including the quality of the investment research capabilities of the Adviser and the other resources it has dedicated to performing services for the Fund. They also noted the professional experience and qualifications of the Fund’s portfolio management team and other senior personnel of the Adviser. The directors also considered that the Advisory Agreement provides that the Fund will reimburse the Adviser for the cost to it of providing certain clerical, accounting, administrative and other services to the Fund by employees of the Adviser or its affiliates. Requests for these reimbursements are made on a quarterly basis and subject to approval by the directors. Reimbursements, to the extent requested and paid, result in a higher rate of total compensation from the Fund to the Adviser than the fee rate stated in the Advisory Agreement. The directors noted that the methodology used to determine the reimbursement amounts had been reviewed by an independent consultant retained by the Company’s Senior Officer. The quality of administrative and other services, including the Adviser’s role in coordinating the activities of the Fund’s other service providers, also was considered. The directors concluded that, overall, they were satisfied with the nature, extent and quality of services provided to the Fund under the Advisory Agreement.
Costs of Services Provided and Profitability
The directors reviewed a schedule of the revenues, expenses and related notes indicating the profitability of the Fund to the Adviser for calendar
| | |
| 82 | AB EMERGING MARKETS MULTI-ASSET PORTFOLIO | | abfunds.com |
years 2014 and 2015 that had been prepared with an expense allocation methodology arrived at in consultation with an independent consultant retained by the Company’s Senior Officer. The directors noted the assumptions and methods of allocation used by the Adviser in preparing fund-specific profitability data and understood that there are a number of potentially acceptable allocation methodologies for information of this type. The directors noted that the profitability information reflected all revenues and expenses of the Adviser’s relationship with the Fund, including those relating to its subsidiaries that provide transfer agency, distribution and brokerage services to the Fund. The directors recognized that it is difficult to make comparisons of the profitability of the Advisory Agreement with the profitability of advisory contracts for unaffiliated funds because comparative information is not generally publicly available and is affected by numerous factors. The directors focused on the profitability of the Adviser’s relationship with the Fund before taxes and distribution expenses. The directors noted that the Fund was not profitable to the Adviser in the periods reviewed.
Fall-Out Benefits
The directors considered the other benefits to the Adviser and its affiliates from their relationships with the Fund, including, but not limited to, benefits relating to soft dollar arrangements (whereby investment advisers receive brokerage and research services from brokers that execute agency transactions for their clients); 12b-1 fees and sales charges received by the Fund’s principal underwriter (which is a wholly owned subsidiary of the Adviser) in respect of certain classes of the Fund’s shares; brokerage commissions paid by the Fund to brokers affiliated with the Adviser; and transfer agency fees paid by the Fund to a wholly owned subsidiary of the Adviser. The directors recognized that the Fund’s unprofitability to the Adviser would be exacerbated without these benefits. The directors understood that the Adviser also might derive reputational and other benefits from its association with the Fund.
Investment Results
In addition to the information reviewed by the directors in connection with the May 2016 Meeting, the directors receive detailed performance information for the Fund at each regular Board meeting during the year.
At the May 2016 Meeting, the directors reviewed information prepared by Broadridge Financial Solutions, Inc. (“Broadridge”), an analytical service that is not affiliated with the Adviser, showing the performance of the Class A Shares of the Fund against a peer group and a peer universe selected by Broadridge, and information prepared by the Adviser showing performance of the Class A Shares against a broad-based securities market index, in each case for the 1- and 3-year periods ended February 29, 2016 and (in the case of comparisons with the broad-based securities market index) the period since inception. Based on their review, the directors concluded that the Fund’s investment performance was acceptable.
| | |
| abfunds.com | | AB EMERGING MARKETS MULTI-ASSET PORTFOLIO | 83 |
Advisory Fees and Other Expenses
The directors considered the advisory fee rate paid by the Fund to the Adviser and information prepared by Broadridge concerning advisory fee rates paid by other funds in the same Broadridge category as the Fund at a common asset level. The directors recognized that it is difficult to make comparisons of advisory fees because there are variations in the services that are included in the fees paid by other funds. The directors considered the Fund’s contractual effective advisory fee rate against a peer group median and took into account the impact on the advisory fee rate of the administrative expense reimbursement paid to the Adviser in the latest fiscal year.
The directors also considered the Adviser’s fee schedule for institutional clients pursuing a similar investment style. For this purpose, they reviewed the relevant advisory fee information from the Adviser’s Form ADV and the evaluation from the Company’s Senior Officer and noted the differences between the Fund’s fee schedule, on the one hand, and the institutional fee schedule and the schedule of fees charged to any offshore funds and any sub-advised funds, on the other. The directors noted that the Adviser may, in some cases, agree to fee rates with large institutional clients that are lower than those reviewed by the directors and that they had previously discussed with the Adviser its policies in respect of such arrangements.
The Adviser reviewed with the directors the significantly greater scope of the services it provides to the Fund relative to institutional, offshore fund and sub-advised fund clients. In light of the substantial differences in services rendered by the Adviser to institutional, offshore fund and sub-advised fund clients as compared to funds such as the Fund, the directors considered these fee comparisons inapt and did not place significant weight on them in their deliberations.
The directors noted that the Fund may invest in shares of exchange-traded funds (“ETFs”), subject to the restrictions and limitations of the Investment Company Act of 1940 as these may be varied as a result of exemptive orders issued by the SEC. The directors also noted that ETFs pay advisory fees pursuant to their advisory contracts, and that the Adviser had provided, and they had reviewed, information about the expense ratios of the relevant ETFs. The directors concluded, based on the Adviser’s explanation of how it may use ETFs when they are the most cost-effective way to obtain desired exposures for a fund or to temporarily “equitize” cash inflows pending purchases of underlying securities, that the advisory fee for the Fund would be paid for services that would be in addition to, rather than duplicative of, the services provided under the advisory contracts of the ETFs.
The directors also considered the total expense ratio of the Class A shares of the Fund in comparison to a peer group and a peer universe selected by
| | |
| 84 | AB EMERGING MARKETS MULTI-ASSET PORTFOLIO | | abfunds.com |
Broadridge. The Class A expense ratio of the Fund was based on the Fund’s latest fiscal year and the information included the pro forma expense ratio to reflect a reduction in the 12b-1 fee effective July 31, 2015. The directors noted the effects of any fee waivers and/or expense reimbursements as a result of an undertaking by the Adviser. The directors noted that it was likely that the expense ratios of some of the other funds in the Fund’s Broadridge category were lowered by waivers or reimbursements by those funds’ investment advisers, which in some cases might be voluntary or temporary. The directors view expense ratio information as relevant to their evaluation of the Adviser’s services because the Adviser is responsible for coordinating services provided to the Fund by others. Based on their review, the directors concluded that the Fund’s pro forma expense ratio was acceptable.
Economies of Scale
The directors noted that the advisory fee schedule for the Fund contains breakpoints that reduce the fee rates on assets above specified levels. The directors took into consideration prior presentations by an independent consultant on economies of scale in the mutual fund industry and for the AB Funds, and by the Adviser concerning certain of its views on economies of scale. The directors also had requested and received from the Adviser certain updates on economies of scale in advance of the May 2016 Meeting. The directors believe that economies of scale may be realized (if at all) by the Adviser across a variety of products and services, and not only in respect of a single fund. The directors noted that there is no established methodology for setting breakpoints that give effect to the fund-specific services provided by a fund’s adviser and to the economies of scale that an adviser may realize in its overall mutual fund business or those components of it which directly or indirectly affect a fund’s operations. The directors observed that in the mutual fund industry as a whole, as well as among funds similar to the Fund, there is no uniformity or pattern in the fees and asset levels at which breakpoints (if any) apply. The directors also noted that the advisory agreements for many funds do not have breakpoints at all. Having taken these factors into account, the directors concluded that the Fund’s shareholders would benefit from a sharing of economies of scale in the event the Fund’s net assets exceed a breakpoint in the future.
| | |
| abfunds.com | | AB EMERGING MARKETS MULTI-ASSET PORTFOLIO | 85 |
This page is not part of the Shareholder Report or the Financial Statements
AB FAMILY OF FUNDS
US EQUITY
US CORE
Core Opportunities Fund
Select US Equity Portfolio
US GROWTH
Concentrated Growth Fund
Discovery Growth Fund
Growth Fund
Large Cap Growth Fund
Small Cap Growth Portfolio
US VALUE
Discovery Value Fund
Equity Income Fund
Relative Value Fund1
Small Cap Value Portfolio
Value Fund
INTERNATIONAL/ GLOBAL EQUITY
INTERNATIONAL/ GLOBAL CORE
Global Core Equity Portfolio
International Portfolio
International Strategic Core Portfolio
Sustainable Global Thematic Fund1
Tax-Managed International Portfolio
INTERNATIONAL/ GLOBAL GROWTH
Concentrated International Growth Portfolio
International Growth Fund
INTERNATIONAL/ GLOBAL VALUE
Asia ex-Japan Equity Portfolio
International Value Fund
FIXED INCOME
MUNICIPAL
High Income Municipal Portfolio
Intermediate California Municipal Portfolio
Intermediate Diversified Municipal Portfolio
Intermediate New York Municipal Portfolio
Municipal Bond Inflation Strategy
Tax-Aware Fixed Income Portfolio
National Portfolio
Arizona Portfolio
California Portfolio
Massachusetts Portfolio
Minnesota Portfolio
New Jersey Portfolio
New York Portfolio
Ohio Portfolio
Pennsylvania Portfolio
Virginia Portfolio
TAXABLE
Bond Inflation Strategy
Global Bond Fund
High Income Fund
High Yield Portfolio
Income Fund
Intermediate Bond Portfolio
Limited Duration High Income Portfolio
Short Duration Portfolio
ALTERNATIVES
All Market Real Return Portfolio
Credit Long/Short Portfolio
Global Real Estate Investment Fund
Long/Short Multi-Manager Fund
ALTERNATIVES (continued)
Multi-Manager Alternative Strategies Fund
Select US Long/Short Portfolio
Unconstrained Bond Fund
MULTI-ASSET
All Market Income Portfolio
All Market Total Return Portfolio1
Conservative Wealth Strategy
Emerging Markets Multi-Asset Portfolio
Global Risk Allocation Fund
Tax-Managed All Market Income Portfolio1
Tax-Managed Wealth Appreciation Strategy
Wealth Appreciation Strategy
TARGET-DATE
Multi-Manager Select Retirement Allocation Fund
Multi-Manager Select 2010 Fund
Multi-Manager Select 2015 Fund
Multi-Manager Select 2020 Fund
Multi-Manager Select 2025 Fund
Multi-Manager Select 2030 Fund
Multi-Manager Select 2035 Fund
Multi-Manager Select 2040 Fund
Multi-Manager Select 2045 Fund
Multi-Manager Select 2050 Fund
Multi-Manager Select 2055 Fund
CLOSED-END FUNDS
Alliance California Municipal Income Fund
AllianceBernstein Global High Income Fund
AllianceBernstein National Municipal Income Fund
We also offer Government Exchange Reserves, which serves as the money market fund exchange vehicle for the AB mutual funds. An investment in Government Exchange Reserves is not a deposit in a bank and is not insured or guaranteed by the Federal Deposit Insurance Corporation or any other government agency. Although the Fund seeks to preserve the value of your investment at $1.00 per share, it is possible to lose money by investing in the Fund.
Investors should consider the investment objectives, risks, charges and expenses of the Fund carefully before investing. For copies of our prospectus or summary prospectus, which contain this and other information, visit us online at www.abfunds.com or contact your AB representative. Please read the prospectus and/or summary prospectus carefully before investing.
| 1 | Prior to November 1, 2016, Sustainable Global Thematic Fund was named Global Thematic Growth Fund; prior to January 9, 2017, Relative Value Fund was named Growth & Income Fund; prior to April 17, 2017, Tax-Managed All Market Income Portfolio was named Tax-Managed Balanced Wealth Strategy; prior to April 24, 2017, All Market Total Return Portfolio was named Balanced Wealth Strategy. |
| | |
| 86 | AB EMERGING MARKETS MULTI-ASSET PORTFOLIO | | abfunds.com |
NOTES
| | |
| abfunds.com | | AB EMERGING MARKETS MULTI-ASSET PORTFOLIO | 87 |
NOTES
| | |
| 88 | AB EMERGING MARKETS MULTI-ASSET PORTFOLIO | | abfunds.com |
NOTES
| | |
| abfunds.com | | AB EMERGING MARKETS MULTI-ASSET PORTFOLIO | 89 |
NOTES
| | |
| 90 | AB EMERGING MARKETS MULTI-ASSET PORTFOLIO | | abfunds.com |
NOTES
| | |
| abfunds.com | | AB EMERGING MARKETS MULTI-ASSET PORTFOLIO | 91 |
NOTES
| | |
| 92 | AB EMERGING MARKETS MULTI-ASSET PORTFOLIO | | abfunds.com |

AB EMERGING MARKETS MULTI-ASSET PORTFOLIO
1345 Avenue of the Americas
New York, NY 10105
800 221 5672
EMMA-0151-0317 
(a) The registrant has adopted a code of ethics that applies to its principal executive officer, principal financial officer and principal accounting officer. A copy of the registrant’s code of ethics is filed herewith as Exhibit 12(a)(1).
(b) During the period covered by this report, no material amendments were made to the provisions of the code of ethics adopted in 2(a) above.
(c) During the period covered by this report, no implicit or explicit waivers to the provisions of the code of ethics adopted in 2(a) above were granted.
| ITEM 3. | AUDIT COMMITTEE FINANCIAL EXPERT. |
The registrant’s Board of Directors has determined that independent directors William H. Foulk, Jr., Garry L. Moody and Marshall C. Turner, Jr. qualify as audit committee financial experts.
| ITEM 4. | PRINCIPAL ACCOUNTANT FEES AND SERVICES. |
(a) - (c) The following table sets forth the aggregate fees billed by the independent registered public accounting firm Ernst & Young LLP, for the Fund’s last two fiscal years for professional services rendered for: (i) the audit of the Fund’s annual financial statements included in the Fund’s annual report to stockholders; (ii) assurance and related services that are reasonably related to the performance of the audit of the Fund’s financial statements and are not reported under (i), which include advice and education related to accounting and auditing issues and quarterly press release review (for those Funds which issue press releases), and preferred stock maintenance testing (for those Funds that issue preferred stock); and (iii) tax compliance, tax advice and tax return preparation.
| | | | | | | | | | | | | | | | |
| | | | | | Audit-Related | |
| | | | | | Audit Fees | | | Fees | | | Tax Fees | |
AB Emerging Market Multi-Asset | | | 2016 | | | $ | 56,118 | | | $ | 1,307 | | | $ | 27,423 | |
| | | 2017 | | | $ | 57,769 | | | $ | — | | | $ | 27,688 | |
(d) Not applicable.
(e) (1) Beginning with audit and non-audit service contracts entered into on or after May 6, 2003, the Fund’s Audit Committee policies and procedures require the pre-approval of all audit and non-audit services provided to the Fund by the Fund’s independent registered public accounting firm. The Fund’s Audit Committee policies and procedures also require pre-approval of all audit and non-audit services provided to the Adviser and Service Affiliates to the extent that these services are directly related to the operations or financial reporting of the Fund.
(e) (2) All of the amounts for Audit Fees, Audit-Related Fees and Tax Fees in the table under Item 4 (a) – (c) are for services pre-approved by the Fund’s Audit Committee.
(f) Not applicable.
(g) The following table sets forth the aggregate non-audit services provided to the Fund, the Fund’s Adviser and entities that control, are controlled by or under common control with the Adviser that provide ongoing services to the Fund:
| | | | | | | | | | | | |
| | | | | | All Fees for
Non-Audit Services
Provided to the
Portfolio, the Adviser
and Service Affiliates | | | Total Amount of
Foregoing Column Pre-
approved by the
Audit Committee
(Portion Comprised of
Audit Related Fees)
(Portion Comprised of
Tax Fees) | |
AB Emerging Market Multi-Asset | | | 2016 | | | $ | 482,875 | | | $ | 28,730 | |
| | | | | | | | | | $ | (1,307 | ) |
| | | | | | | | | | $ | (27,423 | ) |
| | | 2017 | | | $ | 705,978 | | | $ | 27,688 | |
| | | | | | | | | | $ | — | |
| | | | | | | | | | $ | (27,688 | ) |
(h) The Audit Committee of the Fund has considered whether the provision of any non-audit services not pre-approved by the Audit Committee provided by the Fund’s independent registered public accounting firm to the Adviser and Service Affiliates is compatible with maintaining the auditor’s independence.
| ITEM 5. | AUDIT COMMITTEE OF LISTED REGISTRANTS. |
Not applicable to the registrant.
| ITEM 6. | SCHEDULE OF INVESTMENTS. |
Please see Schedule of Investments contained in the Report to Shareholders included under Item 1 of this Form N-CSR.
| ITEM 7. | DISCLOSURE OF PROXY VOTING POLICIES AND PROCEDURES FOR CLOSED-END MANAGEMENT INVESTMENT COMPANIES. |
Not applicable to the registrant.
| ITEM 8. | PORTFOLIO MANAGERS OF CLOSED-END MANAGEMENT INVESTMENT COMPANIES. |
Not applicable to the registrant.
| ITEM 9. | PURCHASES OF EQUITY SECURITIES BY CLOSED-END MANAGEMENT INVESTMENT COMPANY AND AFFILIATED PURCHASERS. |
Not applicable to the registrant.
| ITEM 10. | SUBMISSION OF MATTERS TO A VOTE OF SECURITY HOLDERS. |
There have been no material changes to the procedures by which shareholders may recommend nominees to the Fund’s Board of Directors since the Fund last provided disclosure in response to this item.
| ITEM 11. | CONTROLS AND PROCEDURES. |
(a) The registrant’s principal executive officer and principal financial officer have concluded that the registrant’s disclosure controls and procedures (as defined in Rule 30a-2(c) under the Investment Company Act of 1940, as amended) are effective at the reasonable assurance level based on their evaluation of these controls and procedures as of a date within 90 days of the filing date of this document.
(b) There were no changes in the registrant’s internal controls over financial reporting that occurred during the second fiscal quarter of the period that has materially affected, or is reasonably likely to materially affect, the registrant’s internal control over financial reporting.
The following exhibits are attached to this Form N-CSR:
| | |
EXHIBIT NO. | | DESCRIPTION OF EXHIBIT |
| |
| 12 (a) (1) | | Code of Ethics that is subject to the disclosure of Item 2 hereof |
| |
| 12 (b) (1) | | Certification of Principal Executive Officer Pursuant to Section 302 of the Sarbanes-Oxley Act of 2002 |
| |
| 12 (b) (2) | | Certification of Principal Financial Officer Pursuant to Section 302 of the Sarbanes-Oxley Act of 2002 |
| |
| 12 (c) | | Certification of Principal Executive Officer and Principal Financial Officer Pursuant to Section 906 of the Sarbanes-Oxley Act of 2002 |
SIGNATURES
Pursuant to the requirements of the Securities Exchange Act of 1934 and the Investment Company Act of 1940, the registrant has duly caused this report to be signed on its behalf by the undersigned, thereunto duly authorized.
| | |
| (Registrant): AB Cap Fund, Inc. |
| |
| By: | | /s/ Robert M. Keith Robert M. Keith President |
|
| Date: May 30, 2017 |
Pursuant to the requirements of the Securities Exchange Act of 1934 and the Investment Company Act of 1940, this report has been signed below by the following persons on behalf of the registrant and in the capacities and on the dates indicated.
| | |
| By: | | /s/ Robert M. Keith Robert M. Keith President |
|
| Date: May 30, 2017 |
| |
| By: | | /s/ Joseph J. Mantineo Joseph J. Mantineo Treasurer and Chief Financial Officer |
|
| Date: May 30, 2017 |