UNITED STATES
SECURITIES AND EXCHANGE COMMISSION
WASHINGTON, D.C. 20549
FORM N-CSR
CERTIFIED SHAREHOLDER REPORT OF REGISTERED
MANAGEMENT INVESTMENT COMPANIES
Investment Company Act file number: 811-01716
AB CAP FUND, INC.
(Exact name of registrant as specified in charter)
1345 Avenue of the Americas, New York, New York 10105
(Address of principal executive offices) (Zip code)
Joseph J. Mantineo
AllianceBernstein L.P.
1345 Avenue of the Americas
New York, New York 10105
(Name and address of agent for service)
Registrant’s telephone number, including area code: (800) 221-5672
Date of fiscal year end: July 31, 2017
Date of reporting period: July 31, 2017
| ITEM 1. | REPORTS TO STOCKHOLDERS. |
JUL 07.31.17

ANNUAL REPORT
AB MULTI-MANAGER SELECT RETIREMENT FUNDS
| + | | AB MULTI-MANAGER SELECT RETIREMENT ALLOCATION FUND |
| + | | AB MULTI-MANAGER SELECT 2010 FUND |
| + | | AB MULTI-MANAGER SELECT 2015 FUND |
| + | | AB MULTI-MANAGER SELECT 2020 FUND |
| + | | AB MULTI-MANAGER SELECT 2025 FUND |
| + | | AB MULTI-MANAGER SELECT 2030 FUND |
| + | | AB MULTI-MANAGER SELECT 2035 FUND |
| + | | AB MULTI-MANAGER SELECT 2040 FUND |
| + | | AB MULTI-MANAGER SELECT 2045 FUND |
| + | | AB MULTI-MANAGER SELECT 2050 FUND |
| + | | AB MULTI-MANAGER SELECT 2055 FUND |


| | |
| |
| Investment Products Offered | | • Are Not FDIC Insured • May Lose Value • Are Not Bank Guaranteed |
Investors should consider the investment objectives, risks, charges and expenses of the Fund carefully before investing. For copies of our prospectus or summary prospectus, which contain this and other information, visit us online at www.abfunds.com or contact your AB representative. Please read the prospectus and/or summary prospectus carefully before investing.
This shareholder report must be preceded or accompanied by the Fund’s prospectus for individuals who are not current shareholders of the Fund.
You may obtain a description of the Fund’s proxy voting policies and procedures, and information regarding how the Fund voted proxies relating to portfolio securities during the most recent 12-month period ended June 30, without charge. Simply visit AB’s website at www.abfunds.com, or go to the Securities and Exchange Commission’s (the “Commission”) website at www.sec.gov, or call AB at (800) 227 4618.
The Fund files its complete schedule of portfolio holdings with the Commission for the first and third quarters of each fiscal year on Form N-Q. The Fund’s Forms N-Q are available on the Commission’s website at www.sec.gov. The Fund’s Forms N-Q may also be reviewed and copied at the Commission’s Public Reference Room in Washington, DC; information on the operation of the Public Reference Room may be obtained by calling (800) SEC 0330. AB publishes full portfolio holdings for the Fund monthly at www.abfunds.com.
AllianceBernstein Investments, Inc. (ABI) is the distributor of the AB family of mutual funds. ABI is a member of FINRA and is an affiliate of AllianceBernstein L.P., the Adviser of the funds.
The [A/B] logo is a registered service mark of AllianceBernstein and AllianceBernstein® is a registered service mark used by permission of the owner, AllianceBernstein L.P.
| | |
| FROM THE PRESIDENT | |  |
Dear Shareholder,
We are pleased to provide this report for AB Multi-Manager Select Retirement Funds (collectively the “Funds”, individually a “Fund”). Please review the discussion of Fund performance, the market conditions during the reporting period and the Funds’ investment strategies.
As always, AB strives to keep clients ahead of what’s next by:
| + | | Transforming uncommon insights into uncommon knowledge with a global research scope |
| + | | Navigating markets with seasoned investment experience and sophisticated solutions |
| + | | Providing thoughtful investment insights and actionable ideas |
Whether you’re an individual investor or a multi-billion-dollar institution, we put knowledge and experience to work for you.
AB’s global research organization connects and collaborates across platforms and teams to deliver impactful insights and innovative products. Better insights lead to better opportunities—anywhere in the world.
For additional information about AB’s range of products and shareholder resources, please log on to www.abfunds.com.
Thank you for your investment in the AB Mutual Funds.
Sincerely,

Robert M. Keith
President and Chief Executive Officer, AB Mutual Funds
| | |
| abfunds.com | | AB MULTI-MANAGER SELECT RETIREMENT FUNDS | 1 |
ANNUAL REPORT
September 11, 2017
This report provides management’s discussion of the performance for AB Multi-Manager Select Retirement Funds for the annual reporting period ended July 31, 2017.
Each Fund’s investment objective is to seek the highest total return (total return includes capital appreciation and income) over time consistent with its asset mix.
NAV RETURNS AS OF JULY 31, 2017 (unaudited)
| | | | | | | | |
| | | 6 Months | | | 12 Months | |
AB MULTI-MANAGER SELECT RETIREMENT
ALLOCATION FUND | | | | | | | | |
| Class A Shares | | | 4.48% | | | | 5.08% | |
| Class C Shares | | | 4.06% | | | | 4.26% | |
| Advisor Class Shares1 | | | 4.54% | | | | 5.34% | |
| Class R Shares1 | | | 4.27% | | | | 4.88% | |
| Class K Shares1 | | | 4.47% | | | | 5.15% | |
| Class I Shares1 | | | 4.56% | | | | 5.35% | |
| Class Z Shares1 | | | 4.57% | | | | 5.41% | |
| S&P Target Date Retirement Income Index | | | 4.22% | | | | 4.53% | |
| | | | | | | | |
| | | 6 Months | | | 12 Months | |
| AB MULTI-MANAGER SELECT 2010 FUND | | | | | | | | |
| Class A Shares | | | 5.31% | | | | 6.56% | |
| Class C Shares | | | 4.98% | | | | 5.81% | |
| Advisor Class Shares1 | | | 5.44% | | | | 6.81% | |
| Class R Shares1 | | | 5.14% | | | | 6.28% | |
| Class K Shares1 | | | 5.34% | | | | 6.52% | |
| Class I Shares1 | | | 5.44% | | | | 6.88% | |
| Class Z Shares1 | | | 5.43% | | | | 6.90% | |
| S&P Target Date 2010 Index | | | 4.93% | | | | 6.04% | |
| 1 | Please note that these share classes are for investors purchasing shares through accounts established under certain fee-based programs sponsored and maintained by certain broker-dealers and financial intermediaries, institutional pension plans and/or investment advisory clients of, and certain other persons associated with, the Adviser and its affiliates or the Funds. |
| | |
| 2 | AB MULTI-MANAGER SELECT RETIREMENT FUNDS | | abfunds.com |
NAV RETURNS AS OF JULY 31, 2017 (unaudited)
| | | | | | | | |
| | | 6 Months | | | 12 Months | |
| AB MULTI-MANAGER SELECT 2015 FUND | | | | | | | | |
| Class A Shares | | | 5.76% | | | | 7.72% | |
| Class C Shares | | | 5.41% | | | | 6.92% | |
| Advisor Class Shares1 | | | 5.88% | | | | 7.98% | |
| Class R Shares1 | | | 5.59% | | | | 7.40% | |
| Class K Shares1 | | | 5.78% | | | | 7.68% | |
| Class I Shares1 | | | 5.88% | | | | 7.96% | |
| Class Z Shares1 | | | 5.98% | | | | 8.02% | |
| S&P Target Date 2015 Index | | | 5.66% | | | | 7.42% | |
| | | | | | | | |
| | | 6 Months | | | 12 Months | |
| AB MULTI-MANAGER SELECT 2020 FUND | | | | | | | | |
| Class A Shares | | | 6.49% | | | | 8.98% | |
| Class C Shares | | | 6.06% | | | | 8.17% | |
| Advisor Class Shares1 | | | 6.58% | | | | 9.23% | |
| Class R Shares1 | | | 6.33% | | | | 8.78% | |
| Class K Shares1 | | | 6.52% | | | | 9.07% | |
| Class I Shares1 | | | 6.61% | | | | 9.29% | |
| Class Z Shares1 | | | 6.62% | | | | 9.27% | |
| S&P Target Date 2020 Index | | | 6.31% | | | | 8.75% | |
| | | | | | | | |
| | | 6 Months | | | 12 Months | |
| AB MULTI-MANAGER SELECT 2025 FUND | | | | | | | | |
| Class A Shares | | | 7.50% | | | | 10.74% | |
| Class C Shares | | | 7.08% | | | | 9.87% | |
| Advisor Class Shares1 | | | 7.59% | | | | 10.95% | |
| Class R Shares1 | | | 7.28% | | | | 10.35% | |
| Class K Shares1 | | | 7.46% | | | | 10.66% | |
| Class I Shares1 | | | 7.54% | | | | 10.98% | |
| Class Z Shares1 | | | 7.55% | | | | 10.97% | |
| S&P Target Date 2025 Index | | | 7.04% | | | | 10.11% | |
| 1 | Please note that these share classes are for investors purchasing shares through accounts established under certain fee-based programs sponsored and maintained by certain broker-dealers and financial intermediaries, institutional pension plans and/or investment advisory clients of, and certain other persons associated with, the Adviser and its affiliates or the Funds. |
| | |
| abfunds.com | | AB MULTI-MANAGER SELECT RETIREMENT FUNDS | 3 |
NAV RETURNS AS OF JULY 31, 2017 (unaudited)
| | | | | | | | |
| | | 6 Months | | | 12 Months | |
| AB MULTI-MANAGER SELECT 2030 FUND | | | | | | | | |
| Class A Shares | | | 8.44% | | | | 12.65% | |
| Class C Shares | | | 8.14% | | | | 11.86% | |
| Advisor Class Shares1 | | | 8.62% | | | | 12.95% | |
| Class R Shares1 | | | 8.33% | | | | 12.29% | |
| Class K Shares1 | | | 8.42% | | | | 12.61% | |
| Class I Shares1 | | | 8.60% | | | | 12.94% | |
| Class Z Shares1 | | | 8.60% | | | | 12.99% | |
| S&P Target Date 2030 Index | | | 7.69% | | | | 11.33% | |
| | | | | | | | |
| | | 6 Months | | | 12 Months | |
| AB MULTI-MANAGER SELECT 2035 FUND | | | | | | | | |
| Class A Shares | | | 9.40% | | | | 14.39% | |
| Class C Shares | | | 9.12% | | | | 13.53% | |
| Advisor Class Shares1 | | | 9.56% | | | | 14.59% | |
| Class R Shares1 | | | 9.34% | | | | 14.07% | |
| Class K Shares1 | | | 9.41% | | | | 14.34% | |
| Class I Shares1 | | | 9.59% | | | | 14.64% | |
| Class Z Shares1 | | | 9.50% | | | | 14.62% | |
| S&P Target Date 2035 Index | | | 8.34% | | | | 12.56% | |
| | | | | | | | |
| | | 6 Months | | | 12 Months | |
| AB MULTI-MANAGER SELECT 2040 FUND | | | | | | | | |
| Class A Shares | | | 9.97% | | | | 15.22% | |
| Class C Shares | | | 9.60% | | | | 14.43% | |
| Advisor Class Shares1 | | | 10.13% | | | | 15.54% | |
| Class R Shares1 | | | 9.74% | | | | 14.92% | |
| Class K Shares1 | | | 10.00% | | | | 15.30% | |
| Class I Shares1 | | | 10.09% | | | | 15.52% | |
| Class Z Shares1 | | | 10.09% | | | | 15.59% | |
| S&P Target Date 2040 Index | | | 8.76% | | | | 13.41% | |
| 1 | Please note that these share classes are for investors purchasing shares through accounts established under certain fee-based programs sponsored and maintained by certain broker-dealers and financial intermediaries, institutional pension plans and/or investment advisory clients of, and certain other persons associated with, the Adviser and its affiliates or the Funds. |
Please keep in mind that high, double-digit returns are highly unusual and cannot be sustained. Investors should also be aware that these returns were primarily achieved during favorable market conditions.
| | |
| 4 | AB MULTI-MANAGER SELECT RETIREMENT FUNDS | | abfunds.com |
NAV RETURNS AS OF JULY 31, 2017 (unaudited)
| | | | | | | | |
| | | 6 Months | | | 12 Months | |
| AB MULTI-MANAGER SELECT 2045 FUND | | | | | | | | |
| Class A Shares | | | 10.17% | | | | 15.71% | |
| Class C Shares | | | 9.81% | | | | 14.91% | |
| Advisor Class Shares1 | | | 10.39% | | | | 16.09% | |
| Class R Shares1 | | | 10.07% | | | | 15.44% | |
| Class K Shares1 | | | 10.22% | | | | 15.88% | |
| Class I Shares1 | | | 10.41% | | | | 16.08% | |
| Class Z Shares1 | | | 10.31% | | | | 16.05% | |
| S&P Target Date 2045 Index | | | 9.07% | | | | 14.09% | |
| | | | | | | | |
| | | 6 Months | | | 12 Months | |
| AB MULTI-MANAGER SELECT 2050 FUND | | | | | | | | |
| Class A Shares | | | 10.47% | | | | 16.19% | |
| Class C Shares | | | 10.11% | | | | 15.30% | |
| Advisor Class Shares1 | | | 10.60% | | | | 16.51% | |
| Class R Shares1 | | | 10.33% | | | | 15.84% | |
| Class K Shares1 | | | 10.40% | | | | 16.15% | |
| Class I Shares1 | | | 10.66% | | | | 16.51% | |
| Class Z Shares1 | | | 10.57% | | | | 16.47% | |
| S&P Target Date 2050 Index | | | 9.34% | | | | 14.68% | |
| | | | | | | | |
| | | 6 Months | | | 12 Months | |
| AB MULTI-MANAGER SELECT 2055 FUND | | | | | | | | |
| Class A Shares | | | 10.51% | | | | 16.08% | |
| Class C Shares | | | 10.08% | | | | 15.25% | |
| Advisor Class Shares1 | | | 10.58% | | | | 16.40% | |
| Class R Shares1 | | | 10.39% | | | | 15.82% | |
| Class K Shares1 | | | 10.37% | | | | 16.06% | |
| Class I Shares1 | | | 10.64% | | | | 16.43% | |
| Class Z Shares1 | | | 10.54% | | | | 16.38% | |
| S&P Target Date 2055 Index | | | 9.49% | | | | 15.09% | |
| 1 | Please note that these share classes are for investors purchasing shares through accounts established under certain fee-based programs sponsored and maintained by certain broker-dealers and financial intermediaries, institutional pension plans and/or investment advisory clients of, and certain other persons associated with, the Adviser and its affiliates or the Funds. |
Please keep in mind that high, double-digit returns are highly unusual and cannot be sustained. Investors should also be aware that these returns were primarily achieved during favorable market conditions.
| | |
| abfunds.com | | AB MULTI-MANAGER SELECT RETIREMENT FUNDS | 5 |
INVESTMENT RESULTS
The preceding tables show the Funds’ performance compared to their benchmarks, the Standard & Poor’s (“S&P”) Target Date Index Series, for the six- and 12-month periods ended July 31, 2017.
The benchmarks are as follows: Retirement Allocation Fund, the S&P Target Date Retirement Income Index; Select 2010 Fund, the S&P Target Date 2010 Index; Select 2015 Fund, the S&P Target Date 2015 Index; Select 2020 Fund, the S&P Target Date 2020 Index; Select 2025 Fund, the S&P Target Date 2025 Index; Select 2030 Fund, the S&P Target Date 2030 Index; Select 2035 Fund, the S&P Target Date 2035 Index; Select 2040 Fund, the S&P Target Date 2040 Index; Select 2045 Fund, the S&P Target Date 2045 Index; Select 2050 Fund, the S&P Target Date 2050 Index; Select 2055 Fund, the S&P Target Date 2055 Index.
For the 12-month period, Class A shares of all vintages outperformed their respective benchmarks, although certain share classes of the Retirement Allocation Fund and 2010-2025 vintages underperformed, before sales charges.
Relative to the S&P Target Date Indices, strategic asset allocation detracted across all vintages, with lower allocation in non-US large-caps and higher allocations in real assets and equity diversifiers detracting most from returns, as global stocks soared and diversifiers relatively underperformed during the 12-month period. Underlying Portfolio selection (as defined below) positively contributed to performance for the 12-month period. Notable contributors included AQR Long-Short Equity Fund (equity diversifier), MFS Institutional International Equity Fund (non-US large-cap) and AB Relative Value Fund (US large-cap). Detractors included AQR International Defensive Style Fund (defensive), T. Rowe Price Dividend Growth Fund (defensive) and AB All Market Real Return Portfolio (real assets). Tactical asset allocation, employed through the Adviser’s dynamic asset allocation (“DAA”) process, positively contributed to performance. During the period, DAA, on average, was overweight emerging equities, non-US large-caps and US small/mid-caps, and was underweight US large-caps, short duration bonds and core bonds. The main contributors to DAA performance during the period were overweights in emerging equities and US small/mid-caps, as well as an underweight in core bonds.
For the six-month period, Class A shares of all vintages outperformed their respective benchmarks, although certain share classes of the Retirement Allocation Fund and 2015-2020 vintages underperformed, before sales charges.
Relative to the S&P Target Date Indices, strategic asset allocation contributed positively for the younger participants (2025 to 2055 vintages) but detracted for more senior participants (Retirement Allocation, 2010-2020 vintages). While lower allocations in short duration bonds and US small/mid-
| | |
| 6 | AB MULTI-MANAGER SELECT RETIREMENT FUNDS | | abfunds.com |
caps, as well as a higher allocation in defensive equities helped performance, a lower allocation in non-US large-cap and a higher allocation in real assets detracted. Underlying Portfolio selection positively contributed to performance for the six-month period. Notable contributors included AB Relative Value Fund, MFS Institutional International Equity Fund and MFS Value Fund (US large-cap). Detractors included AB High Income Fund (high income), Franklin Growth Fund (US large-cap) and AQR Risk-Balanced Commodities Strategy Fund (real assets). Tactical asset allocation positively contributed to performance. During the period, DAA, on average, was overweight non-US large-caps, emerging equities and US small/mid-caps, and was underweight US large-caps, core bonds and short duration bonds. Within the non-US large-caps overweight, DAA was, on average, overweight USD-hedged European equities to benefit from higher growth potential, but without taking on undesired currency risk. The main contributors to DAA performance during the period were an overweight in emerging equities and underweights in core bonds and short duration bonds.
The Funds did not directly utilize derivatives during either period.
MFS is a registered service mark of Massachusetts Financial Services Company; Franklin and Templeton are registered trademarks of Franklin Templeton Investments. None of Massachusetts Financial Services Company; Franklin Templeton Investments; AQR Capital Management, LLC or T. Rowe Price Associates, Inc. make any representations regarding the advisability of investing in the Funds.
MARKET REVIEW AND INVESTMENT STRATEGY
Despite a few brief pullbacks, global stocks soared during the 12-month period ended July 31, 2017. Emerging-market equities widely outperformed, delivering notable gains.
In contrast, fixed-income markets were volatile during the period. Emerging-market local-currency government bonds rebounded in the period, outperforming the negative returns of developed-market treasuries and investment-grade credit securities, but trailing the double-digit rally of global high yield. Developed-market treasury yields generally rose almost across the board over the 12-month period, with the exception of shorter maturities in the eurozone.
A number of geopolitical developments unfolded during the period amidst a steadily accelerating global economy. Fallout from the UK’s decision to leave the European Union (“Brexit”), Donald Trump’s unexpected election to the US presidency and a decisive French presidential election victory by newcomer Emmanuel Macron, all played a role. Financial markets were buoyed by Trump’s win, although at times investors fretted about White House turmoil and policy risk. UK prime minister Theresa May further rattled markets when she called for a snap parliamentary election three years ahead of schedule in an attempt to shore up her mandate ahead of Brexit
| | |
| abfunds.com | | AB MULTI-MANAGER SELECT RETIREMENT FUNDS | 7 |
negotiations. The move backfired, however, heightening political uncertainty when May’s Conservative Party was left with a minority position. On the other hand, investors were reassured a few days later when Macron’s centrist party secured a resounding majority in the French parliament.
Shifting central bank stances also impacted markets. European central banks generally maintained an easing bias, though at the end of the period they began to signal that monetary-policy normalization loomed. While the US Federal Reserve (the “Fed”) raised interest rates for the third consecutive quarter, US inflation data ended the period below expectations. At its late-July meeting, the Fed made minor changes to its statement, leading investors to believe that aggressive monetary policy action would not be forthcoming.
INVESTMENT POLICIES
In seeking to achieve their investment objective, the Funds focus their investments while seeking to minimize short-term risks on a combination of AB mutual funds as well as mutual funds and exchange-traded funds (“ETFs”) managed by unaffiliated third parties (“Underlying Portfolios”) representing a variety of asset classes and investment styles. Each Fund invests in the Underlying Portfolios in accordance with its current asset mix. In order to implement the Funds’ investment strategies, Morningstar Investment Management LLC (“Morningstar”), the Funds’ sub-adviser, during the reporting period selected Underlying Portfolios within each asset class for investment by the Funds from among AB mutual funds and funds offered by other fund complexes that have entered into a participation agreement or similar arrangement with the Fund. The Adviser has directed Morningstar to typically select Underlying Portfolios so that a target of 33%, but no more than 40%, of each Fund is invested in AB mutual funds.
Other than the AB Multi-Manager Select Retirement Allocation Fund, each Fund is managed to the specific year of planned retirement included in its name (the “retirement date”). Each Fund’s asset mix becomes more conservative, with an increasing exposure to investments in fixed-income securities and short-term bonds, each year until reaching the year approximately 15 years after the retirement date. At that time, the Fund will no longer be managed to become more conservative each year, although the Adviser may continue to vary the relative weightings of the Fund’s asset classes as described fully in the prospectus. The AB Multi-Manager Select Retirement Allocation Fund is managed according to a conservative asset allocation, and such Fund’s portfolio allocation will not necessarily become more conservative over time.
| | |
| 8 | AB MULTI-MANAGER SELECT RETIREMENT FUNDS | | abfunds.com |
(continued on next page)
The Funds allocate their investments in Underlying Portfolios that invest in the following asset classes: equities, equity diversifiers, inflation-sensitive instruments, fixed-income diversifiers and fixed-income securities (including high-yield bonds or “junk bonds”). For these purposes, inflation-sensitive instruments include funds focused on real estate securities, commodities and inflation-protected securities; fixed-income
diversifiers include funds engaged in certain alternative strategies that seek reduced volatility and low correlation with fixed-income markets such as market neutral funds; and equity diversifiers include funds engaged in certain alternative strategies that seek reduced volatility and limited correlation with equity markets such as equity long/short funds. The Funds may also invest directly in investments within each asset class. The Underlying Portfolios may enter into derivatives transactions, such as options, futures contracts, forwards and swaps, in an effort to earn income, to gain or adjust exposure to individual securities or markets, or to protect all or a portion of the Underlying Portfolios’ portfolio from a decline in value.
In making asset allocation decisions, the Adviser uses its proprietary DAA process. DAA comprises a series of analytical and forecasting tools employed by the Adviser to gauge fluctuations in the risk/return profile of various asset classes. DAA will aim to adjust the Funds’ investment exposure in changing market conditions and thereby reduce overall portfolio volatility by seeking to mitigate the effects of market fluctuations, while preserving consistent long-term return potential. For example, the Adviser may seek to reduce a Fund’s risk exposure to one or more asset classes when DAA suggests that market risks relevant to those asset classes are rising but return opportunities are declining. The Adviser expects to pursue this process for the Funds primarily by adjusting an Underlying Portfolio’s investments.
| | |
| abfunds.com | | AB MULTI-MANAGER SELECT RETIREMENT FUNDS | 9 |
DISCLOSURES AND RISKS
Benchmark Disclosure
The S&P® Target Date Index Series Indices are unmanaged and do not reflect fees and expenses associated with the active management of a mutual fund portfolio. The S&P Target Date Index Series (each, an “Index”) reflects exposure to various asset classes included in target date funds driven by a survey of such funds for each particular target date. These asset class exposures include US large-cap, US mid-cap, US small-cap, international equities, emerging markets, US and international real estate investment trusts, core fixed-income, cash equivalents, Treasury inflation-protected securities, high-yield corporate bonds and commodities, and each Index uses the performance of other indices to track each asset class for purposes of Index calculation. The original inception date for the Indices was September 25, 2008, except the S&P Target Date 2050 Index, which was May 31, 2011, and the S&P Target Date 2055 Index, which was May 31, 2012. The Index returns are calculated on a daily basis and will continue to be calculated daily. The performance of the Index does not reflect the deduction of expenses associated with a fund, such as investment management fees. An investor cannot invest directly in an index and its results are not indicative of the performance for any specific investment, including the Funds.
A Word About Risk
Market Risk: The value of the Funds’ investments will fluctuate as the stock or bond market fluctuates. The value of their investments may decline, sometimes rapidly and unpredictably, simply because of economic changes or other events that affect large portions of the market. It includes the risk that a particular style of investing may be underperforming the stock market generally.
Allocation Risk: The allocation of investments among the Underlying Portfolios’ different investment styles, such as equity or debt securities, or US or non-US securities, may have a more significant effect on the Funds’ net asset value (“NAV”) when one of these investments is performing more poorly than the other. There is no assurance that allocation decisions will result in the desired effects. Subjective decisions made by the Adviser and/or Morningstar may cause the Funds to incur losses or to miss profit opportunities on which they might otherwise have capitalized. The limited universe of Underlying Portfolios and the requirement that a specified percentage of the Funds’ assets be invested in AB mutual funds as noted above may adversely affect the Funds’ performance.
Interest Rate Risk: Changes in interest rates will affect the value of the Funds’ investments in Underlying Portfolios that invest in fixed-income securities. When interest rates rise, the value of existing investments in fixed-income securities tends to fall and this decrease in value may not be
| | |
| 10 | AB MULTI-MANAGER SELECT RETIREMENT FUNDS | | abfunds.com |
DISCLOSURES AND RISKS (continued)
offset by higher income from new investments. The Funds may be subject to a heightened risk of rising rates as the current period of historically low interest rates may be ending. Interest rate risk is generally greater for fixed-income securities with longer maturities or durations.
Credit Risk: An issuer or guarantor of a fixed-income security, or the counterparty to a derivatives or other contract, may be unable or unwilling to make timely payments of interest or principal, or to otherwise honor its obligations. The issuer or guarantor may default, causing a loss of the full principal amount of a security. The degree of risk for a particular security may be reflected in its credit rating. There is the possibility that the credit rating of a fixed-income security may be downgraded after purchase, which may adversely affect the value of the security. Investments by Underlying Portfolios in fixed-income securities with lower ratings are subject to a higher probability that an issuer will default or fail to meet its payment obligations.
High Yield Debt Security Risk: Investments in fixed-income securities with ratings below investment-grade, commonly known as “junk bonds”, tend to have a higher probability that an issuer will default or fail to meet its payment obligations. These securities may be subject to greater price volatility due to such factors as specific corporate developments, interest rate sensitivity, negative perceptions of the junk bond market generally and less secondary market liquidity.
Inflation Risk: This is the risk that the value of assets or income from the Funds’ investments in the Underlying Portfolios will be less in the future as inflation decreases the value of money. As inflation increases, the value of each Underlying Portfolio’s assets can decline as can the value of that Underlying Portfolio’s distributions.
Foreign (Non-US) Risk: Investments in non-US issuers by Underlying Portfolios may involve more risk than investments in US issuers. These securities may fluctuate more widely in price and may be less liquid due to adverse market, economic, political, regulatory or other factors.
Currency Risk: Fluctuations in currency exchange rates may negatively affect the value of the Funds’ investments or reduce their returns.
Capitalization Risk: Investments in small- and mid-capitalization companies by Underlying Portfolios tend to be more volatile than investments in large-capitalization companies. Investments in small-capitalization companies may have additional risks because these companies often have limited product lines, markets or financial resources.
| | |
| abfunds.com | | AB MULTI-MANAGER SELECT RETIREMENT FUNDS | 11 |
DISCLOSURES AND RISKS (continued)
Derivatives Risk: Derivatives may be illiquid, difficult to price, and leveraged so that small changes may produce disproportionate losses, and may be subject to counterparty risk to a greater degree than more traditional investments.
Leverage Risk: Borrowing money or other leverage may make an Underlying Portfolio’s investments more volatile because leverage tends to exaggerate the effect of any increase or decrease in the value of its investments. An Underlying Portfolio may create leverage through the use of certain portfolio management techniques such as reverse repurchase agreements or forward commitments, or by borrowing money.
Non-Diversification Risk: The Funds may have more risk because they are “non-diversified”, meaning that the Funds can invest more of their assets in a smaller number of issuers. Accordingly, changes in the value of a single security may have a more significant effect, either negative or positive, on the Funds’ NAV.
Investment in Other Investment Companies Risk: As with other investments, investments in other investment companies, including ETFs, are subject to market and selection risk. In addition, shareholders of the Funds bear both their proportionate share of expenses in the Funds (including management fees) and, indirectly, the expenses of the investment companies.
Management Risk: The Funds are subject to management risk because they are actively managed investment funds. The Adviser and Morningstar will apply their investment techniques and risk analyses in making investment decisions for the Funds, but there is no guarantee that their techniques will produce the intended results.
These risks are fully discussed in the Funds’ prospectus. As with all investments, you may lose money by investing in the Funds.
An Important Note About Historical Performance
The investment return and principal value of an investment in the Funds will fluctuate, so that shares, when redeemed, may be worth more or less than their original cost. Performance shown in this report represents past performance and does not guarantee future results. Current performance may be lower or higher than the performance information shown. You may obtain performance information current to the most recent month-end by visiting www.abfunds.com.
All fees and expenses related to the operation of the Funds have been deducted. NAV returns do not reflect sales charges; if sales charges were reflected, the Funds’ quoted performance would be lower. SEC
| | |
| 12 | AB MULTI-MANAGER SELECT RETIREMENT FUNDS | | abfunds.com |
DISCLOSURES AND RISKS (continued)
returns reflect the applicable sales charges for each share class: a 4.25% maximum front-end sales charge for Class A shares and a 1% 1-year contingent deferred sales charge for Class C shares. Returns for different share classes will vary due to different expenses associated with each class. Performance assumes reinvestment of distributions and does not account for taxes.
| | |
| abfunds.com | | AB MULTI-MANAGER SELECT RETIREMENT FUNDS | 13 |
HISTORICAL PERFORMANCE
AB MULTI-MANAGER SELECT RETIREMENT ALLOCATION FUND
GROWTH OF A $10,000 INVESTMENT IN THE FUND (unaudited)
12/15/20141 TO 7/31/2017
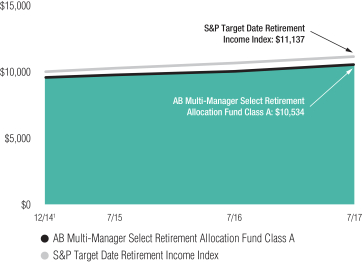
This chart illustrates the total value of an assumed $10,000 investment in AB Multi-Manager Select Retirement Allocation Fund Class A shares (from 12/15/20141 to 7/31/2017) as compared to the performance of the Fund’s benchmark. The chart reflects the deduction of the maximum 4.25% sales charge from the initial $10,000 investment in the Fund and assumes the reinvestment of dividends and capital gains distributions.
| 1 | Inception date: 12/15/2014. |
| | |
| 14 | AB MULTI-MANAGER SELECT RETIREMENT FUNDS | | abfunds.com |
HISTORICAL PERFORMANCE (continued)
AB MULTI-MANAGER SELECT RETIREMENT ALLOCATION FUND
AVERAGE ANNUAL RETURNS AS OF JULY 31, 2017 (unaudited)
| | | | | | | | |
| | | NAV Returns | | | SEC Returns
(reflects applicable
sales charges) | |
| CLASS A SHARES | | | | | | | | |
| 1 Year | | | 5.08% | | | | 0.64% | |
| Since Inception1 | | | 3.69% | | | | 2.00% | |
| CLASS C SHARES | | | | | | | | |
| 1 Year | | | 4.26% | | | | 3.26% | |
| Since Inception1 | | | 2.85% | | | | 2.85% | |
| ADVISOR CLASS SHARES2 | | | | | | | | |
| 1 Year | | | 5.34% | | | | 5.34% | |
| Since Inception1 | | | 3.90% | | | | 3.90% | |
| CLASS R SHARES2 | | | | | | | | |
| 1 Year | | | 4.88% | | | | 4.88% | |
| Since Inception1 | | | 3.37% | | | | 3.37% | |
| CLASS K SHARES2 | | | | | | | | |
| 1 Year | | | 5.15% | | | | 5.15% | |
| Since Inception1 | | | 3.67% | | | | 3.67% | |
| CLASS I SHARES2 | | | | | | | | |
| 1 Year | | | 5.35% | | | | 5.35% | |
| Since Inception1 | | | 3.92% | | | | 3.92% | |
| CLASS Z SHARES2 | | | | | | | | |
| 1 Year | | | 5.41% | | | | 5.41% | |
| Since Inception1 | | | 3.90% | | | | 3.90% | |
The Fund’s current prospectus fee table shows the Fund’s total annual operating expense ratios as 8.85%, 11.51%, 9.62%, 5.56%, 4.88%, 8.05% and 7.86% for Class A, Class C, Advisor Class, Class R, Class K, Class I and Class Z shares, respectively, gross of any fee waivers or expense reimbursements and inclusive of the Fund’s proportionate share of Underlying Portfolio fees and expenses. Contractual fee waivers and/or expense reimbursements limit the Fund’s annual operating expense ratios exclusive of acquired fund fees and expenses, interest expense, taxes, extraordinary expenses, and brokerage commissions and other transaction costs to 0.42%, 1.17%, 0.17%, 0.67%, 0.42%, 0.17% and 0.17% for Class A, Class C, Advisor Class, Class R, Class K, Class I and Class Z shares, respectively. These waivers/reimbursements may not be terminated before November 30, 2017 and may be extended by the Adviser for additional one-year terms. Any fees waived and expenses borne by the Adviser through January 5, 2016 under the expense limitation in effect prior to that date may be reimbursed by the Fund until the end of the third fiscal year after the fiscal period in which the fee was waived or the expense was borne, provided that no reimbursement payment will be made that would cause the Fund’s operating expenses to exceed the applicable expense limitations. Absent reimbursements or waivers, performance would have been lower. The Financial Highlights section of this report sets forth expense ratio data for the current reporting period; the expense ratios shown above may differ from the expense ratios in the Financial Highlights section since they are based on different time periods.
| 1 | Inception date: 12/15/2014. |
| 2 | These share classes are offered at NAV to eligible investors and their SEC returns are the same as their NAV returns. Please note that these share classes are for investors purchasing shares through accounts established under certain fee-based programs sponsored and maintained by certain broker-dealers and financial intermediaries, institutional pension plans and/or investment advisory clients of, and certain other persons associated with, the Adviser and its affiliates or the Funds. |
| | |
| abfunds.com | | AB MULTI-MANAGER SELECT RETIREMENT FUNDS | 15 |
HISTORICAL PERFORMANCE (continued)
AB MULTI-MANAGER SELECT RETIREMENT ALLOCATION FUND
SEC AVERAGE ANNUAL RETURNS
AS OF THE MOST RECENT CALENDAR QUARTER-END
JUNE 30, 2017 (unaudited)
| | | | |
| | | SEC Returns
(reflects applicable
sales charges) | |
| CLASS A SHARES | | | | |
| 1 Year | | | 0.93% | |
| Since Inception1 | | | 1.63% | |
| CLASS C SHARES | | | | |
| 1 Year | | | 3.62% | |
| Since Inception1 | | | 2.54% | |
| ADVISOR CLASS SHARES2 | | | | |
| 1 Year | | | 5.71% | |
| Since Inception1 | | | 3.59% | |
| CLASS R SHARES2 | | | | |
| 1 Year | | | 5.23% | |
| Since Inception1 | | | 3.06% | |
| CLASS K SHARES2 | | | | |
| 1 Year | | | 5.40% | |
| Since Inception1 | | | 3.33% | |
| CLASS I SHARES2 | | | | |
| 1 Year | | | 5.70% | |
| Since Inception1 | | | 3.58% | |
| CLASS Z SHARES2 | | | | |
| 1 Year | | | 5.75% | |
| Since Inception1 | | | 3.60% | |
| 1 | Inception date: 12/15/2014. |
| 2 | Please note that these share classes are for investors purchasing shares through accounts established under certain fee-based programs sponsored and maintained by certain broker-dealers and financial intermediaries, institutional pension plans and/or investment advisory clients of, and certain other persons associated with, the Adviser and its affiliates or the Funds. |
| | |
| 16 | AB MULTI-MANAGER SELECT RETIREMENT FUNDS | | abfunds.com |
HISTORICAL PERFORMANCE
AB MULTI-MANAGER SELECT 2010 FUND
GROWTH OF A $10,000 INVESTMENT IN THE FUND (unaudited)
12/15/20141 TO 7/31/2017
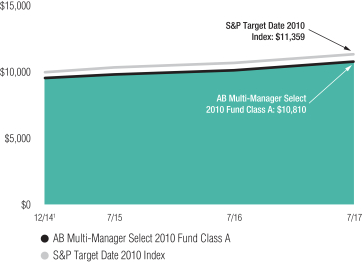
This chart illustrates the total value of an assumed $10,000 investment in AB Multi-Manager Select 2010 Fund Class A shares (from 12/15/20141 to 7/31/2017) as compared to the performance of the Fund’s benchmark. The chart reflects the deduction of the maximum 4.25% sales charge from the initial $10,000 investment in the Fund and assumes the reinvestment of dividends and capital gains distributions.
| 1 | Inception date: 12/15/2014. |
| | |
| abfunds.com | | AB MULTI-MANAGER SELECT RETIREMENT FUNDS | 17 |
HISTORICAL PERFORMANCE (continued)
AB MULTI-MANAGER SELECT 2010 FUND
AVERAGE ANNUAL RETURNS AS OF JULY 31, 2017 (unaudited)
| | | | | | | | |
| | | NAV Returns | | | SEC Returns
(reflects applicable
sales charges) | |
| CLASS A SHARES | | | | | | | | |
| 1 Year | | | 6.56% | | | | 2.07% | |
| Since Inception1 | | | 4.72% | | | | 3.01% | |
| CLASS C SHARES | | | | | | | | |
| 1 Year | | | 5.81% | | | | 4.81% | |
| Since Inception1 | | | 3.90% | | | | 3.90% | |
| ADVISOR CLASS SHARES2 | | | | | | | | |
| 1 Year | | | 6.81% | | | | 6.81% | |
| Since Inception1 | | | 4.95% | | | | 4.95% | |
| CLASS R SHARES2 | | | | | | | | |
| 1 Year | | | 6.28% | | | | 6.28% | |
| Since Inception1 | | | 4.45% | | | | 4.45% | |
| CLASS K SHARES2 | | | | | | | | |
| 1 Year | | | 6.52% | | | | 6.52% | |
| Since Inception1 | | | 4.65% | | | | 4.65% | |
| CLASS I SHARES2 | | | | | | | | |
| 1 Year | | | 6.88% | | | | 6.88% | |
| Since Inception1 | | | 4.96% | | | | 4.96% | |
| CLASS Z SHARES2 | | | | | | | | |
| 1 Year | | | 6.90% | | | | 6.90% | |
| Since Inception1 | | | 4.96% | | | | 4.96% | |
The Fund’s current prospectus fee table shows the Fund’s total annual operating expense ratios as 4.62%, 6.03%, 4.11%, 4.14%, 3.39%, 11.01% and 6.84% for Class A, Class C, Advisor Class, Class R, Class K, Class I and Class Z shares, respectively, gross of any fee waivers or expense reimbursements and inclusive of the Fund’s proportionate share of Underlying Portfolio fees and expenses. Contractual fee waivers and/or expense reimbursements limit the Fund’s annual operating expense ratios exclusive of acquired fund fees and expenses, interest expense, taxes, extraordinary expenses, and brokerage commissions and other transaction costs to 0.40%, 1.15%, 0.15%, 0.65%, 0.40%, 0.15% and 0.15% for Class A, Class C, Advisor Class, Class R, Class K, Class I and Class Z shares, respectively. These waivers/reimbursements may not be terminated before November 30, 2017 and may be extended by the Adviser for additional one-year terms. Any fees waived and expenses borne by the Adviser through January 5, 2016 under the expense limitation in effect prior to that date may be reimbursed by the Fund until the end of the third fiscal year after the fiscal period in which the fee was waived or the expense was borne, provided that no reimbursement payment will be made that would cause the Fund’s operating expenses to exceed the applicable expense limitations. Absent reimbursements or waivers, performance would have been lower. The Financial Highlights section of this report sets forth expense ratio data for the current reporting period; the expense ratios shown above may differ from the expense ratios in the Financial Highlights section since they are based on different time periods.
| 1 | Inception date: 12/15/2014. |
| 2 | These share classes are offered at NAV to eligible investors and their SEC returns are the same as their NAV returns. Please note that these share classes are for investors purchasing shares through accounts established under certain fee-based programs sponsored and maintained by certain broker-dealers and financial intermediaries, institutional pension plans and/or investment advisory clients of, and certain other persons associated with, the Adviser and its affiliates or the Funds. |
| | |
| 18 | AB MULTI-MANAGER SELECT RETIREMENT FUNDS | | abfunds.com |
HISTORICAL PERFORMANCE (continued)
AB MULTI-MANAGER SELECT 2010 FUND
SEC AVERAGE ANNUAL RETURNS
AS OF THE MOST RECENT CALENDAR QUARTER-END
JUNE 30, 2017 (unaudited)
| | | | |
| | | SEC Returns
(reflects applicable
sales charges) | |
| CLASS A SHARES | | | | |
| 1 Year | | | 2.38% | |
| Since Inception1 | | | 2.56% | |
| CLASS C SHARES | | | | |
| 1 Year | | | 5.20% | |
| Since Inception1 | | | 3.48% | |
| ADVISOR CLASS SHARES2 | | | | |
| 1 Year | | | 7.30% | |
| Since Inception1 | | | 4.56% | |
| CLASS R SHARES2 | | | | |
| 1 Year | | | 6.76% | |
| Since Inception1 | | | 4.06% | |
| CLASS K SHARES2 | | | | |
| 1 Year | | | 6.90% | |
| Since Inception1 | | | 4.23% | |
| CLASS I SHARES2 | | | | |
| 1 Year | | | 7.26% | |
| Since Inception1 | | | 4.54% | |
| CLASS Z SHARES2 | | | | |
| 1 Year | | | 7.27% | |
| Since Inception1 | | | 4.55% | |
| 1 | Inception date: 12/15/2014. |
| 2 | Please note that these share classes are for investors purchasing shares through accounts established under certain fee-based programs sponsored and maintained by certain broker-dealers and financial intermediaries, institutional pension plans and/or investment advisory clients of, and certain other persons associated with, the Adviser and its affiliates or the Funds. |
| | |
| abfunds.com | | AB MULTI-MANAGER SELECT RETIREMENT FUNDS | 19 |
HISTORICAL PERFORMANCE
AB MULTI-MANAGER SELECT 2015 FUND
GROWTH OF A $10,000 INVESTMENT IN THE FUND (unaudited)
12/15/20141 TO 7/31/2017
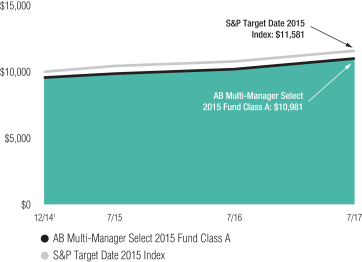
This chart illustrates the total value of an assumed $10,000 investment in AB Multi-Manager Select 2015 Fund Class A shares (from 12/15/20141 to 7/31/2017) as compared to the performance of the Fund’s benchmark. The chart reflects the deduction of the maximum 4.25% sales charge from the initial $10,000 investment in the Fund and assumes the reinvestment of dividends and capital gains distributions.
| 1 | Inception date: 12/15/2014. |
| | |
| 20 | AB MULTI-MANAGER SELECT RETIREMENT FUNDS | | abfunds.com |
HISTORICAL PERFORMANCE (continued)
AB MULTI-MANAGER SELECT 2015 FUND
AVERAGE ANNUAL RETURNS AS OF JULY 31, 2017 (unaudited)
| | | | | | | | |
| | | NAV Returns | | | SEC Returns
(reflects applicable
sales charges) | |
| CLASS A SHARES | | | | | | | | |
| 1 Year | | | 7.72% | | | | 3.18% | |
| Since Inception1 | | | 5.34% | | | | 3.63% | |
| CLASS C SHARES | | | | | | | | |
| 1 Year | | | 6.92% | | | | 5.92% | |
| Since Inception1 | | | 4.56% | | | | 4.56% | |
| ADVISOR CLASS SHARES2 | | | | | | | | |
| 1 Year | | | 7.98% | | | | 7.98% | |
| Since Inception1 | | | 5.62% | | | | 5.62% | |
| CLASS R SHARES2 | | | | | | | | |
| 1 Year | | | 7.40% | | | | 7.40% | |
| Since Inception1 | | | 5.07% | | | | 5.07% | |
| CLASS K SHARES2 | | | | | | | | |
| 1 Year | | | 7.68% | | | | 7.68% | |
| Since Inception1 | | | 5.36% | | | | 5.36% | |
| CLASS I SHARES2 | | | | | | | | |
| 1 Year | | | 7.96% | | | | 7.96% | |
| Since Inception1 | | | 5.61% | | | | 5.61% | |
| CLASS Z SHARES2 | | | | | | | | |
| 1 Year | | | 8.02% | | | | 8.02% | |
| Since Inception1 | | | 5.63% | | | | 5.63% | |
The Fund’s current prospectus fee table shows the Fund’s total annual operating expense ratios as 1.91%, 3.12%, 2.18%, 2.55%, 1.97%, 2.34% and 2.07% for Class A, Class C, Advisor Class, Class R, Class K, Class I and Class Z shares, respectively, gross of any fee waivers or expense reimbursements and inclusive of the Fund’s proportionate share of Underlying Portfolio fees and expenses. Contractual fee waivers and/or expense reimbursements limit the Fund’s annual operating expense ratios exclusive of acquired fund fees and expenses, interest expense, taxes, extraordinary expenses, and brokerage commissions and other transaction costs to 0.40%, 1.15%, 0.15%, 0.65%, 0.40%, 0.15% and 0.15% for Class A, Class C, Advisor Class, Class R, Class K, Class I and Class Z shares, respectively. These waivers/reimbursements may not be terminated before November 30, 2017 and may be extended by the Adviser for additional one-year terms. Any fees waived and expenses borne by the Adviser through January 5, 2016 under the expense limitation in effect prior to that date may be reimbursed by the Fund until the end of the third fiscal year after the fiscal period in which the fee was waived or the expense was borne, provided that no reimbursement payment will be made that would cause the Fund’s operating expenses to exceed the applicable expense limitations. Absent reimbursements or waivers, performance would have been lower. The Financial Highlights section of this report sets forth expense ratio data for the current reporting period; the expense ratios shown above may differ from the expense ratios in the Financial Highlights section since they are based on different time periods.
| 1 | Inception date: 12/15/2014. |
| 2 | These share classes are offered at NAV to eligible investors and their SEC returns are the same as their NAV returns. Please note that these share classes are for investors purchasing shares through accounts established under certain fee-based programs sponsored and maintained by certain broker-dealers and financial intermediaries, institutional pension plans and/or investment advisory clients of, and certain other persons associated with, the Adviser and its affiliates or the Funds. |
| | |
| abfunds.com | | AB MULTI-MANAGER SELECT RETIREMENT FUNDS | 21 |
HISTORICAL PERFORMANCE (continued)
AB MULTI-MANAGER SELECT 2015 FUND
SEC AVERAGE ANNUAL RETURNS
AS OF THE MOST RECENT CALENDAR QUARTER-END
JUNE 30, 2017 (unaudited)
| | | | |
| | | SEC Returns
(reflects applicable
sales charges) | |
| CLASS A SHARES | | | | |
| 1 Year | | | 3.67% | |
| Since Inception1 | | | 3.12% | |
| CLASS C SHARES | | | | |
| 1 Year | | | 6.42% | |
| Since Inception1 | | | 4.07% | |
| ADVISOR CLASS SHARES2 | | | | |
| 1 Year | | | 8.58% | |
| Since Inception1 | | | 5.17% | |
| CLASS R SHARES2 | | | | |
| 1 Year | | | 8.01% | |
| Since Inception1 | | | 4.63% | |
| CLASS K SHARES2 | | | | |
| 1 Year | | | 8.30% | |
| Since Inception1 | | | 4.93% | |
| CLASS I SHARES2 | | | | |
| 1 Year | | | 8.58% | |
| Since Inception1 | | | 5.14% | |
| CLASS Z SHARES2 | | | | |
| 1 Year | | | 8.64% | |
| Since Inception1 | | | 5.16% | |
| 1 | Inception date: 12/15/2014. |
| 2 | Please note that these share classes are for investors purchasing shares through accounts established under certain fee-based programs sponsored and maintained by certain broker-dealers and financial intermediaries, institutional pension plans and/or investment advisory clients of, and certain other persons associated with, the Adviser and its affiliates or the Funds. |
| | |
| 22 | AB MULTI-MANAGER SELECT RETIREMENT FUNDS | | abfunds.com |
HISTORICAL PERFORMANCE
AB MULTI-MANAGER SELECT 2020 FUND
GROWTH OF A $10,000 INVESTMENT IN THE FUND (unaudited)
12/15/20141 TO 7/31/2017
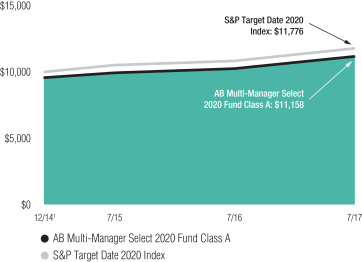
This chart illustrates the total value of an assumed $10,000 investment in AB Multi-Manager Select 2020 Fund Class A shares (from 12/15/20141 to 7/31/2017) as compared to the performance of the Fund’s benchmark. The chart reflects the deduction of the maximum 4.25% sales charge from the initial $10,000 investment in the Fund and assumes the reinvestment of dividends and capital gains distributions.
| 1 | Inception date: 12/15/2014. |
| | |
| abfunds.com | | AB MULTI-MANAGER SELECT RETIREMENT FUNDS | 23 |
HISTORICAL PERFORMANCE (continued)
AB MULTI-MANAGER SELECT 2020 FUND
AVERAGE ANNUAL RETURNS AS OF JULY 31, 2017 (unaudited)
| | | | | | | | |
| | | NAV Returns | | | SEC Returns
(reflects applicable
sales charges) | |
| CLASS A SHARES | | | | | | | | |
| 1 Year | | | 8.98% | | | | 4.39% | |
| Since Inception1 | | | 5.99% | | | | 4.26% | |
| CLASS C SHARES | | | | | | | | |
| 1 Year | | | 8.17% | | | | 7.17% | |
| Since Inception1 | | | 5.16% | | | | 5.16% | |
| ADVISOR CLASS SHARES2 | | | | | | | | |
| 1 Year | | | 9.23% | | | | 9.23% | |
| Since Inception1 | | | 6.23% | | | | 6.23% | |
| CLASS R SHARES2 | | | | | | | | |
| 1 Year | | | 8.78% | | | | 8.78% | |
| Since Inception1 | | | 5.71% | | | | 5.71% | |
| CLASS K SHARES2 | | | | | | | | |
| 1 Year | | | 9.07% | | | | 9.07% | |
| Since Inception1 | | | 6.00% | | | | 6.00% | |
| CLASS I SHARES2 | | | | | | | | |
| 1 Year | | | 9.29% | | | | 9.29% | |
| Since Inception1 | | | 6.23% | | | | 6.23% | |
| CLASS Z SHARES2 | | | | | | | | |
| 1 Year | | | 9.27% | | | | 9.27% | |
| Since Inception1 | | | 6.22% | | | | 6.22% | |
The Fund’s current prospectus fee table shows the Fund’s total annual operating expense ratios as 1.62%, 2.43%, 1.30%, 1.97%, 1.65%, 1.41% and 1.58% for Class A, Class C, Advisor Class, Class R, Class K, Class I and Class Z shares, respectively, gross of any fee waivers or expense reimbursements and inclusive of the Fund’s proportionate share of Underlying Portfolio fees and expenses. Contractual fee waivers and/or expense reimbursements limit the Fund’s annual operating expense ratios exclusive of acquired fund fees and expenses, interest expense, taxes, extraordinary expenses, and brokerage commissions and other transaction costs to 0.44%, 1.19%, 0.19%, 0.69%, 0.44%, 0.19% and 0.19% for Class A, Class C, Advisor Class, Class R, Class K, Class I and Class Z shares, respectively. These waivers/reimbursements may not be terminated before November 30, 2017 and may be extended by the Adviser for additional one-year terms. Any fees waived and expenses borne by the Adviser through January 5, 2016 under the expense limitation in effect prior to that date may be reimbursed by the Fund until the end of the third fiscal year after the fiscal period in which the fee was waived or the expense was borne, provided that no reimbursement payment will be made that would cause the Fund’s operating expenses to exceed the applicable expense limitations. Absent reimbursements or waivers, performance would have been lower. The Financial Highlights section of this report sets forth expense ratio data for the current reporting period; the expense ratios shown above may differ from the expense ratios in the Financial Highlights section since they are based on different time periods.
| 1 | Inception date: 12/15/2014. |
| 2 | These share classes are offered at NAV to eligible investors and their SEC returns are the same as their NAV returns. Please note that these share classes are for investors purchasing shares through accounts established under certain fee-based programs sponsored and maintained by certain broker-dealers and financial intermediaries, institutional pension plans and/or investment advisory clients of, and certain other persons associated with, the Adviser and its affiliates or the Funds. |
| | |
| 24 | AB MULTI-MANAGER SELECT RETIREMENT FUNDS | | abfunds.com |
HISTORICAL PERFORMANCE (continued)
AB MULTI-MANAGER SELECT 2020 FUND
SEC AVERAGE ANNUAL RETURNS
AS OF THE MOST RECENT CALENDAR QUARTER-END
JUNE 30, 2017 (unaudited)
| | | | |
| | | SEC Returns
(reflects applicable
sales charges) | |
| CLASS A SHARES | | | | |
| 1 Year | | | 5.01% | |
| Since Inception1 | | | 3.70% | |
| CLASS C SHARES | | | | |
| 1 Year | | | 7.82% | |
| Since Inception1 | | | 4.65% | |
| ADVISOR CLASS SHARES2 | | | | |
| 1 Year | | | 9.99% | |
| Since Inception1 | | | 5.73% | |
| CLASS R SHARES2 | | | | |
| 1 Year | | | 9.34% | |
| Since Inception1 | | | 5.18% | |
| CLASS K SHARES2 | | | | |
| 1 Year | | | 9.63% | |
| Since Inception1 | | | 5.48% | |
| CLASS I SHARES2 | | | | |
| 1 Year | | | 9.96% | |
| Since Inception1 | | | 5.71% | |
| CLASS Z SHARES2 | | | | |
| 1 Year | | | 9.94% | |
| Since Inception1 | | | 5.70% | |
| 1 | Inception date: 12/15/2014. |
| 2 | Please note that these share classes are for investors purchasing shares through accounts established under certain fee-based programs sponsored and maintained by certain broker-dealers and financial intermediaries, institutional pension plans and/or investment advisory clients of, and certain other persons associated with, the Adviser and its affiliates or the Funds. |
| | |
| abfunds.com | | AB MULTI-MANAGER SELECT RETIREMENT FUNDS | 25 |
HISTORICAL PERFORMANCE
AB MULTI-MANAGER SELECT 2025 FUND
GROWTH OF A $10,000 INVESTMENT IN THE FUND (unaudited)
12/15/20141 TO 7/31/2017
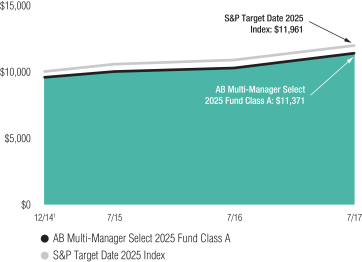
This chart illustrates the total value of an assumed $10,000 investment in AB Multi-Manager Select 2025 Fund Class A shares (from 12/15/20141 to 7/31/2017) as compared to the performance of the Fund’s benchmark. The chart reflects the deduction of the maximum 4.25% sales charge from the initial $10,000 investment in the Fund and assumes the reinvestment of dividends and capital gains distributions.
| 1 | Inception date: 12/15/2014. |
| | |
| 26 | AB MULTI-MANAGER SELECT RETIREMENT FUNDS | | abfunds.com |
HISTORICAL PERFORMANCE (continued)
AB MULTI-MANAGER SELECT 2025 FUND
AVERAGE ANNUAL RETURNS AS OF JULY 31, 2017 (unaudited)
| | | | | | | | |
| | | NAV Returns | | | SEC Returns
(reflects applicable
sales charges) | |
| CLASS A SHARES | | | | | | | | |
| 1 Year | | | 10.74% | | | | 6.07% | |
| Since Inception1 | | | 6.75% | | | | 5.02% | |
| CLASS C SHARES | | | | | | | | |
| 1 Year | | | 9.87% | | | | 8.87% | |
| Since Inception1 | | | 5.99% | | | | 5.99% | |
| ADVISOR CLASS SHARES2 | | | | | | | | |
| 1 Year | | | 10.95% | | | | 10.95% | |
| Since Inception1 | | | 7.04% | | | | 7.04% | |
| CLASS R SHARES2 | | | | | | | | |
| 1 Year | | | 10.35% | | | | 10.35% | |
| Since Inception1 | | | 6.47% | | | | 6.47% | |
| CLASS K SHARES2 | | | | | | | | |
| 1 Year | | | 10.66% | | | | 10.66% | |
| Since Inception1 | | | 6.78% | | | | 6.78% | |
| CLASS I SHARES2 | | | | | | | | |
| 1 Year | | | 10.98% | | | | 10.98% | |
| Since Inception1 | | | 7.04% | | | | 7.04% | |
| CLASS Z SHARES2 | | | | | | | | |
| 1 Year | | | 10.97% | | | | 10.97% | |
| Since Inception1 | | | 7.03% | | | | 7.03% | |
The Fund’s current prospectus fee table shows the Fund’s total annual operating expense ratios as 1.45%, 2.30%, 1.41%, 1.63%, 1.54%, 1.27% and 1.40% for Class A, Class C, Advisor Class, Class R, Class K, Class I and Class Z shares, respectively, gross of any fee waivers or expense reimbursements and inclusive of the Fund’s proportionate share of Underlying Portfolio fees and expenses. Contractual fee waivers and/or expense reimbursements limit the Fund’s annual operating expense ratios exclusive of acquired fund fees and expenses, interest expense, taxes, extraordinary expenses, and brokerage commissions and other transaction costs to 0.43%, 1.18%, 0.18%, 0.68%, 0.43%, 0.18% and 0.18% for Class A, Class C, Advisor Class, Class R, Class K, Class I and Class Z shares, respectively. These waivers/reimbursements may not be terminated before November 30, 2017 and may be extended by the Adviser for additional one-year terms. Any fees waived and expenses borne by the Adviser through January 5, 2016 under the expense limitation in effect prior to that date may be reimbursed by the Fund until the end of the third fiscal year after the fiscal period in which the fee was waived or the expense was borne, provided that no reimbursement payment will be made that would cause the Fund’s operating expenses to exceed the applicable expense limitations. Absent reimbursements or waivers, performance would have been lower. The Financial Highlights section of this report sets forth expense ratio data for the current reporting period; the expense ratios shown above may differ from the expense ratios in the Financial Highlights section since they are based on different time periods.
| 1 | Inception date: 12/15/2014. |
| 2 | These share classes are offered at NAV to eligible investors and their SEC returns are the same as their NAV returns. Please note that these share classes are for investors purchasing shares through accounts established under certain fee-based programs sponsored and maintained by certain broker-dealers and financial intermediaries, institutional pension plans and/or investment advisory clients of, and certain other persons associated with, the Adviser and its affiliates or the Funds. |
| | |
| abfunds.com | | AB MULTI-MANAGER SELECT RETIREMENT FUNDS | 27 |
HISTORICAL PERFORMANCE (continued)
AB MULTI-MANAGER SELECT 2025 FUND
SEC AVERAGE ANNUAL RETURNS
AS OF THE MOST RECENT CALENDAR QUARTER-END
JUNE 30, 2017 (unaudited)
| | | | |
| | | SEC Returns
(reflects applicable
sales charges) | |
| CLASS A SHARES | | | | |
| 1 Year | | | 6.84% | |
| Since Inception1 | | | 4.41% | |
| CLASS C SHARES | | | | |
| 1 Year | | | 9.79% | |
| Since Inception1 | | | 5.45% | |
| ADVISOR CLASS SHARES2 | | | | |
| 1 Year | | | 11.87% | |
| Since Inception1 | | | 6.50% | |
| CLASS R SHARES2 | | | | |
| 1 Year | | | 11.29% | |
| Since Inception1 | | | 5.93% | |
| CLASS K SHARES2 | | | | |
| 1 Year | | | 11.60% | |
| Since Inception1 | | | 6.25% | |
| CLASS I SHARES2 | | | | |
| 1 Year | | | 11.81% | |
| Since Inception1 | | | 6.48% | |
| CLASS Z SHARES2 | | | | |
| 1 Year | | | 11.80% | |
| Since Inception1 | | | 6.47% | |
| 1 | Inception date: 12/15/2014. |
| 2 | Please note that these share classes are for investors purchasing shares through accounts established under certain fee-based programs sponsored and maintained by certain broker-dealers and financial intermediaries, institutional pension plans and/or investment advisory clients of, and certain other persons associated with, the Adviser and its affiliates or the Funds. |
| | |
| 28 | AB MULTI-MANAGER SELECT RETIREMENT FUNDS | | abfunds.com |
HISTORICAL PERFORMANCE
AB MULTI-MANAGER SELECT 2030 FUND
GROWTH OF A $10,000 INVESTMENT IN THE FUND (unaudited)
12/15/20141 TO 7/31/2017
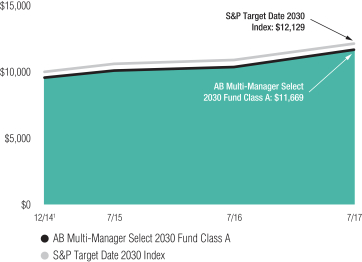
This chart illustrates the total value of an assumed $10,000 investment in AB Multi-Manager Select 2030 Fund Class A shares (from 12/15/20141 to 7/31/2017) as compared to the performance of the Fund’s benchmark. The chart reflects the deduction of the maximum 4.25% sales charge from the initial $10,000 investment in the Fund and assumes the reinvestment of dividends and capital gains distributions.
| 1 | Inception date: 12/15/2014. |
| | |
| abfunds.com | | AB MULTI-MANAGER SELECT RETIREMENT FUNDS | 29 |
HISTORICAL PERFORMANCE (continued)
AB MULTI-MANAGER SELECT 2030 FUND
AVERAGE ANNUAL RETURNS AS OF JULY 31, 2017 (unaudited)
| | | | | | | | |
| | | NAV Returns | | | SEC Returns
(reflects applicable
sales charges) | |
| CLASS A SHARES | | | | | | | | |
| 1 Year | | | 12.65% | | | | 7.82% | |
| Since Inception1 | | | 7.81% | | | | 6.06% | |
| CLASS C SHARES | | | | | | | | |
| 1 Year | | | 11.86% | | | | 10.86% | |
| Since Inception1 | | | 7.08% | | | | 7.08% | |
| ADVISOR CLASS SHARES2 | | | | | | | | |
| 1 Year | | | 12.95% | | | | 12.95% | |
| Since Inception1 | | | 8.13% | | | | 8.13% | |
| CLASS R SHARES2 | | | | | | | | |
| 1 Year | | | 12.29% | | | | 12.29% | |
| Since Inception1 | | | 7.55% | | | | 7.55% | |
| CLASS K SHARES2 | | | | | | | | |
| 1 Year | | | 12.61% | | | | 12.61% | |
| Since Inception1 | | | 7.82% | | | | 7.82% | |
| CLASS I SHARES2 | | | | | | | | |
| 1 Year | | | 12.94% | | | | 12.94% | |
| Since Inception1 | | | 8.09% | | | | 8.09% | |
| CLASS Z SHARES2 | | | | | | | | |
| 1 Year | | | 12.99% | | | | 12.99% | |
| Since Inception1 | | | 8.10% | | | | 8.10% | |
The Fund’s current prospectus fee table shows the Fund’s total annual operating expense ratios as 1.59%, 2.45%, 1.32%, 2.02%, 1.68%, 1.42% and 1.57% for Class A, Class C, Advisor Class, Class R, Class K, Class I and Class Z shares, respectively, gross of any fee waivers or expense reimbursements and inclusive of the Fund’s proportionate share of Underlying Portfolio fees and expenses. Contractual fee waivers and/or expense reimbursements limit the Fund’s annual operating expense ratios exclusive of acquired fund fees and expenses, interest expense, taxes, extraordinary expenses, and brokerage commissions and other transaction costs to 0.48%, 1.23%, 0.23%, 0.73%, 0.48%, 0.23% and 0.23% for Class A, Class C, Advisor Class, Class R, Class K, Class I and Class Z shares, respectively. These waivers/reimbursements may not be terminated before November 30, 2017 and may be extended by the Adviser for additional one-year terms. Any fees waived and expenses borne by the Adviser through January 5, 2016 under the expense limitation in effect prior to that date may be reimbursed by the Fund until the end of the third fiscal year after the fiscal period in which the fee was waived or the expense was borne, provided that no reimbursement payment will be made that would cause the Fund’s operating expenses to exceed the applicable expense limitations. Absent reimbursements or waivers, performance would have been lower. The Financial Highlights section of this report sets forth expense ratio data for the current reporting period; the expense ratios shown above may differ from the expense ratios in the Financial Highlights section since they are based on different time periods.
| 1 | Inception date: 12/15/2014. |
| 2 | These share classes are offered at NAV to eligible investors and their SEC returns are the same as their NAV returns. Please note that these share classes are for investors purchasing shares through accounts established under certain fee-based programs sponsored and maintained by certain broker-dealers and financial intermediaries, institutional pension plans and/or investment advisory clients of, and certain other persons associated with, the Adviser and its affiliates or the Funds. |
| | |
| 30 | AB MULTI-MANAGER SELECT RETIREMENT FUNDS | | abfunds.com |
HISTORICAL PERFORMANCE (continued)
AB MULTI-MANAGER SELECT 2030 FUND
SEC AVERAGE ANNUAL RETURNS
AS OF THE MOST RECENT CALENDAR QUARTER-END
JUNE 30, 2017 (unaudited)
| | | | |
| | | SEC Returns
(reflects applicable
sales charges) | |
| CLASS A SHARES | | | | |
| 1 Year | | | 8.95% | |
| Since Inception1 | | | 5.46% | |
| CLASS C SHARES | | | | |
| 1 Year | | | 11.84% | |
| Since Inception1 | | | 6.51% | |
| ADVISOR CLASS SHARES2 | | | | |
| 1 Year | | | 13.95% | |
| Since Inception1 | | | 7.56% | |
| CLASS R SHARES2 | | | | |
| 1 Year | | | 13.51% | |
| Since Inception1 | | | 7.02% | |
| CLASS K SHARES2 | | | | |
| 1 Year | | | 13.73% | |
| Since Inception1 | | | 7.26% | |
| CLASS I SHARES2 | | | | |
| 1 Year | | | 14.06% | |
| Since Inception1 | | | 7.54% | |
| CLASS Z SHARES2 | | | | |
| 1 Year | | | 14.00% | |
| Since Inception1 | | | 7.56% | |
| 1 | Inception date: 12/15/2014. |
| 2 | Please note that these share classes are for investors purchasing shares through accounts established under certain fee-based programs sponsored and maintained by certain broker-dealers and financial intermediaries, institutional pension plans and/or investment advisory clients of, and certain other persons associated with, the Adviser and its affiliates or the Funds. |
| | |
| abfunds.com | | AB MULTI-MANAGER SELECT RETIREMENT FUNDS | 31 |
HISTORICAL PERFORMANCE
AB MULTI-MANAGER SELECT 2035 FUND
GROWTH OF A $10,000 INVESTMENT IN THE FUND (unaudited)
12/15/20141 TO 7/31/2017

This chart illustrates the total value of an assumed $10,000 investment in AB Multi-Manager Select 2035 Fund Class A shares (from 12/15/20141 to 7/31/2017) as compared to the performance of the Fund’s benchmark. The chart reflects the deduction of the maximum 4.25% sales charge from the initial $10,000 investment in the Fund and assumes the reinvestment of dividends and capital gains distributions.
| 1 | Inception date: 12/15/2014. |
| | |
| 32 | AB MULTI-MANAGER SELECT RETIREMENT FUNDS | | abfunds.com |
HISTORICAL PERFORMANCE (continued)
AB MULTI-MANAGER SELECT 2035 FUND
AVERAGE ANNUAL RETURNS AS OF JULY 31, 2017 (unaudited)
| | | | | | | | |
| | | NAV Returns | | | SEC Returns
(reflects applicable
sales charges) | |
| CLASS A SHARES | | | | | | | | |
| 1 Year | | | 14.39% | | | | 9.57% | |
| Since Inception1 | | | 8.48% | | | | 6.72% | |
| CLASS C SHARES | | | | | | | | |
| 1 Year | | | 13.53% | | | | 12.53% | |
| Since Inception1 | | | 7.67% | | | | 7.67% | |
| ADVISOR CLASS SHARES2 | | | | | | | | |
| 1 Year | | | 14.59% | | | | 14.59% | |
| Since Inception1 | | | 8.73% | | | | 8.73% | |
| CLASS R SHARES2 | | | | | | | | |
| 1 Year | | | 14.07% | | | | 14.07% | |
| Since Inception1 | | | 8.20% | | | | 8.20% | |
| CLASS K SHARES2 | | | | | | | | |
| 1 Year | | | 14.34% | | | | 14.34% | |
| Since Inception1 | | | 8.49% | | | | 8.49% | |
| CLASS I SHARES2 | | | | | | | | |
| 1 Year | | | 14.64% | | | | 14.64% | |
| Since Inception1 | | | 8.75% | | | | 8.75% | |
| CLASS Z SHARES2 | | | | | | | | |
| 1 Year | | | 14.62% | | | | 14.62% | |
| Since Inception1 | | | 8.73% | | | | 8.73% | |
The Fund’s current prospectus fee table shows the Fund’s total annual operating expense ratios as 1.75%, 2.62%, 1.61%, 2.08%, 1.79%, 1.53% and 1.78% for Class A, Class C, Advisor Class, Class R, Class K, Class I and Class Z shares, respectively, gross of any fee waivers or expense reimbursements and inclusive of the Fund’s proportionate share of Underlying Portfolio fees and expenses. Contractual fee waivers and/or expense reimbursements limit the Fund’s annual operating expense ratios exclusive of acquired fund fees and expenses, interest expense, taxes, extraordinary expenses, and brokerage commissions and other transaction costs to 0.48%, 1.23%, 0.23%, 0.73%, 0.48%, 0.23% and 0.23% for Class A, Class C, Advisor Class, Class R, Class K, Class I and Class Z shares, respectively. These waivers/reimbursements may not be terminated before November 30, 2017 and may be extended by the Adviser for additional one-year terms. Any fees waived and expenses borne by the Adviser through January 5, 2016 under the expense limitation in effect prior to that date may be reimbursed by the Fund until the end of the third fiscal year after the fiscal period in which the fee was waived or the expense was borne, provided that no reimbursement payment will be made that would cause the Fund’s operating expenses to exceed the applicable expense limitations. Absent reimbursements or waivers, performance would have been lower. The Financial Highlights section of this report sets forth expense ratio data for the current reporting period; the expense ratios shown above may differ from the expense ratios in the Financial Highlights section since they are based on different time periods.
| 1 | Inception date: 12/15/2014. |
| 2 | These share classes are offered at NAV to eligible investors and their SEC returns are the same as their NAV returns. Please note that these share classes are for investors purchasing shares through accounts established under certain fee-based programs sponsored and maintained by certain broker-dealers and financial intermediaries, institutional pension plans and/or investment advisory clients of, and certain other persons associated with, the Adviser and its affiliates or the Funds. |
| | |
| abfunds.com | | AB MULTI-MANAGER SELECT RETIREMENT FUNDS | 33 |
HISTORICAL PERFORMANCE (continued)
AB MULTI-MANAGER SELECT 2035 FUND
SEC AVERAGE ANNUAL RETURNS
AS OF THE MOST RECENT CALENDAR QUARTER-END
JUNE 30, 2017 (unaudited)
| | | | |
| | | SEC Returns
(reflects applicable
sales charges) | |
| CLASS A SHARES | | | | |
| 1 Year | | | 10.69% | |
| Since Inception1 | | | 6.05% | |
| CLASS C SHARES | | | | |
| 1 Year | | | 13.83% | |
| Since Inception1 | | | 7.05% | |
| ADVISOR CLASS SHARES2 | | | | |
| 1 Year | | | 15.89% | |
| Since Inception1 | | | 8.12% | |
| CLASS R SHARES2 | | | | |
| 1 Year | | | 15.40% | |
| Since Inception1 | | | 7.58% | |
| CLASS K SHARES2 | | | | |
| 1 Year | | | 15.66% | |
| Since Inception1 | | | 7.88% | |
| CLASS I SHARES2 | | | | |
| 1 Year | | | 15.96% | |
| Since Inception1 | | | 8.15% | |
| CLASS Z SHARES2 | | | | |
| 1 Year | | | 15.94% | |
| Since Inception1 | | | 8.14% | |
| 1 | Inception date: 12/15/2014. |
| 2 | Please note that these share classes are for investors purchasing shares through accounts established under certain fee-based programs sponsored and maintained by certain broker-dealers and financial intermediaries, institutional pension plans and/or investment advisory clients of, and certain other persons associated with, the Adviser and its affiliates or the Funds. |
| | |
| 34 | AB MULTI-MANAGER SELECT RETIREMENT FUNDS | | abfunds.com |
HISTORICAL PERFORMANCE
AB MULTI-MANAGER SELECT 2040 FUND
GROWTH OF A $10,000 INVESTMENT IN THE FUND (unaudited)
12/15/20141 TO 7/31/2017
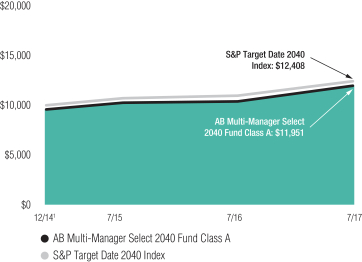
This chart illustrates the total value of an assumed $10,000 investment in AB Multi-Manager Select 2040 Fund Class A shares (from 12/15/20141 to 7/31/2017) as compared to the performance of the Fund’s benchmark. The chart reflects the deduction of the maximum 4.25% sales charge from the initial $10,000 investment in the Fund and assumes the reinvestment of dividends and capital gains distributions.
| 1 | Inception date: 12/15/2014. |
| | |
| abfunds.com | | AB MULTI-MANAGER SELECT RETIREMENT FUNDS | 35 |
HISTORICAL PERFORMANCE (continued)
AB MULTI-MANAGER SELECT 2040 FUND
AVERAGE ANNUAL RETURNS AS OF JULY 31, 2017 (unaudited)
| | | | | | | | |
| | | NAV Returns | | | SEC Returns
(reflects applicable
sales charges) | |
| CLASS A SHARES | | | | | | | | |
| 1 Year | | | 15.22% | | | | 10.34% | |
| Since Inception1 | | | 8.79% | | | | 7.02% | |
| CLASS C SHARES | | | | | | | | |
| 1 Year | | | 14.43% | | | | 13.43% | |
| Since Inception1 | | | 8.03% | | | | 8.03% | |
| ADVISOR CLASS SHARES2 | | | | | | | | |
| 1 Year | | | 15.54% | | | | 15.54% | |
| Since Inception1 | | | 9.09% | | | | 9.09% | |
| CLASS R SHARES2 | | | | | | | | |
| 1 Year | | | 14.92% | | | | 14.92% | |
| Since Inception1 | | | 8.54% | | | | 8.54% | |
| CLASS K SHARES2 | | | | | | | | |
| 1 Year | | | 15.30% | | | | 15.30% | |
| Since Inception1 | | | 8.85% | | | | 8.85% | |
| CLASS I SHARES2 | | | | | | | | |
| 1 Year | | | 15.52% | | | | 15.52% | |
| Since Inception1 | | | 9.08% | | | | 9.08% | |
| CLASS Z SHARES2 | | | | | | | | |
| 1 Year | | | 15.59% | | | | 15.59% | |
| Since Inception1 | | | 9.10% | | | | 9.10% | |
The Fund’s current prospectus fee table shows the Fund’s total annual operating expense ratios as 1.81%, 2.66%, 1.51%, 2.08%, 1.93%, 1.74% and 1.92% for Class A, Class C, Advisor Class, Class R, Class K, Class I and Class Z shares, respectively, gross of any fee waivers or expense reimbursements and inclusive of the Fund’s proportionate share of Underlying Portfolio fees and expenses. Contractual fee waivers and/or expense reimbursements limit the Fund’s annual operating expense ratios exclusive of acquired fund fees and expenses, interest expense, taxes, extraordinary expenses, and brokerage commissions and other transaction costs to 0.52%, 1.27%, 0.27%, 0.77%, 0.52%, 0.27% and 0.27% for Class A, Class C, Advisor Class, Class R, Class K, Class I and Class Z shares, respectively. These waivers/reimbursements may not be terminated before November 30, 2017 and may be extended by the Adviser for additional one-year terms. Any fees waived and expenses borne by the Adviser through January 5, 2016 under the expense limitation in effect prior to that date may be reimbursed by the Fund until the end of the third fiscal year after the fiscal period in which the fee was waived or the expense was borne, provided that no reimbursement payment will be made that would cause the Fund’s operating expenses to exceed the applicable expense limitations. Absent reimbursements or waivers, performance would have been lower. The Financial Highlights section of this report sets forth expense ratio data for the current reporting period; the expense ratios shown above may differ from the expense ratios in the Financial Highlights section since they are based on different time periods.
| 1 | Inception date: 12/15/2014. |
| 2 | These share classes are offered at NAV to eligible investors and their SEC returns are the same as their NAV returns. Please note that these share classes are for investors purchasing shares through accounts established under certain fee-based programs sponsored and maintained by certain broker-dealers and financial intermediaries, institutional pension plans and/or investment advisory clients of, and certain other persons associated with, the Adviser and its affiliates or the Funds. |
| | |
| 36 | AB MULTI-MANAGER SELECT RETIREMENT FUNDS | | abfunds.com |
HISTORICAL PERFORMANCE (continued)
AB MULTI-MANAGER SELECT 2040 FUND
SEC AVERAGE ANNUAL RETURNS
AS OF THE MOST RECENT CALENDAR QUARTER-END
JUNE 30, 2017 (unaudited)
| | | | |
| | | SEC Returns
(reflects applicable
sales charges) | |
| CLASS A SHARES | | | | |
| 1 Year | | | 11.70% | |
| Since Inception1 | | | 6.37% | |
| CLASS C SHARES | | | | |
| 1 Year | | | 15.00% | |
| Since Inception1 | | | 7.43% | |
| ADVISOR CLASS SHARES2 | | | | |
| 1 Year | | | 17.14% | |
| Since Inception1 | | | 8.45% | |
| CLASS R SHARES2 | | | | |
| 1 Year | | | 16.52% | |
| Since Inception1 | | | 7.94% | |
| CLASS K SHARES2 | | | | |
| 1 Year | | | 16.80% | |
| Since Inception1 | | | 8.22% | |
| CLASS I SHARES2 | | | | |
| 1 Year | | | 17.14% | |
| Since Inception1 | | | 8.46% | |
| CLASS Z SHARES2 | | | | |
| 1 Year | | | 17.09% | |
| Since Inception1 | | | 8.48% | |
| 1 | Inception date: 12/15/2014. |
| 2 | Please note that these share classes are for investors purchasing shares through accounts established under certain fee-based programs sponsored and maintained by certain broker-dealers and financial intermediaries, institutional pension plans and/or investment advisory clients of, and certain other persons associated with, the Adviser and its affiliates or the Funds. |
| | |
| abfunds.com | | AB MULTI-MANAGER SELECT RETIREMENT FUNDS | 37 |
HISTORICAL PERFORMANCE
AB MULTI-MANAGER SELECT 2045 FUND
GROWTH OF A $10,000 INVESTMENT IN THE FUND (unaudited)
12/15/20141 TO 7/31/2017
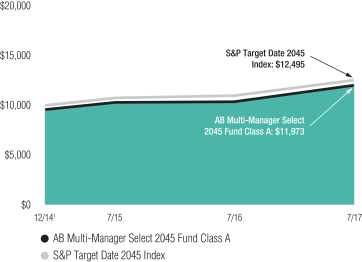
This chart illustrates the total value of an assumed $10,000 investment in AB Multi-Manager Select 2045 Fund Class A shares (from 12/15/20141 to 7/31/2017) as compared to the performance of the Fund’s benchmark. The chart reflects the deduction of the maximum 4.25% sales charge from the initial $10,000 investment in the Fund and assumes the reinvestment of dividends and capital gains distributions.
| 1 | Inception date: 12/15/2014. |
| | |
| 38 | AB MULTI-MANAGER SELECT RETIREMENT FUNDS | | abfunds.com |
HISTORICAL PERFORMANCE (continued)
AB MULTI-MANAGER SELECT 2045 FUND
AVERAGE ANNUAL RETURNS AS OF JULY 31, 2017 (unaudited)
| | | | | | | | |
| | | NAV Returns | | | SEC Returns
(reflects applicable
sales charges) | |
| CLASS A SHARES | | | | | | | | |
| 1 Year | | | 15.71% | | | | 10.82% | |
| Since Inception1 | | | 8.87% | | | | 7.10% | |
| CLASS C SHARES | | | | | | | | |
| 1 Year | | | 14.91% | | | | 13.91% | |
| Since Inception1 | | | 8.08% | | | | 8.08% | |
| ADVISOR CLASS SHARES2 | | | | | | | | |
| 1 Year | | | 16.09% | | | | 16.09% | |
| Since Inception1 | | | 9.13% | | | | 9.13% | |
| CLASS R SHARES2 | | | | | | | | |
| 1 Year | | | 15.44% | | | | 15.44% | |
| Since Inception1 | | | 8.59% | | | | 8.59% | |
| CLASS K SHARES2 | | | | | | | | |
| 1 Year | | | 15.88% | | | | 15.88% | |
| Since Inception1 | | | 8.92% | | | | 8.92% | |
| CLASS I SHARES2 | | | | | | | | |
| 1 Year | | | 16.08% | | | | 16.08% | |
| Since Inception1 | | | 9.14% | | | | 9.14% | |
| CLASS Z SHARES2 | | | | | | | | |
| 1 Year | | | 16.05% | | | | 16.05% | |
| Since Inception1 | | | 9.13% | | | | 9.13% | |
The Fund’s current prospectus fee table shows the Fund’s total annual operating expense ratios as 2.15%, 3.39%, 2.04%, 2.25%, 2.22%, 2.07% and 2.43% for Class A, Class C, Advisor Class, Class R, Class K, Class I and Class Z shares, respectively, gross of any fee waivers or expense reimbursements and inclusive of the Fund’s proportionate share of Underlying Portfolio fees and expenses. Contractual fee waivers and/or expense reimbursements limit the Fund’s annual operating expense ratios exclusive of acquired fund fees and expenses, interest expense, taxes, extraordinary expenses, and brokerage commissions and other transaction costs to 0.50%, 1.25%, 0.25%, 0.75%, 0.50%, 0.25% and 0.25% for Class A, Class C, Advisor Class, Class R, Class K, Class I and Class Z shares, respectively. These waivers/reimbursements may not be terminated before November 30, 2017 and may be extended by the Adviser for additional one-year terms. Any fees waived and expenses borne by the Adviser through January 5, 2016 under the expense limitation in effect prior to that date may be reimbursed by the Fund until the end of the third fiscal year after the fiscal period in which the fee was waived or the expense was borne, provided that no reimbursement payment will be made that would cause the Fund’s operating expenses to exceed the applicable expense limitations. Absent reimbursements or waivers, performance would have been lower. The Financial Highlights section of this report sets forth expense ratio data for the current reporting period; the expense ratios shown above may differ from the expense ratios in the Financial Highlights section since they are based on different time periods.
| 1 | Inception date: 12/15/2014. |
| 2 | These share classes are offered at NAV to eligible investors and their SEC returns are the same as their NAV returns. Please note that these share classes are for investors purchasing shares through accounts established under certain fee-based programs sponsored and maintained by certain broker-dealers and financial intermediaries, institutional pension plans and/or investment advisory clients of, and certain other persons associated with, the Adviser and its affiliates or the Funds. |
| | |
| abfunds.com | | AB MULTI-MANAGER SELECT RETIREMENT FUNDS | 39 |
HISTORICAL PERFORMANCE (continued)
AB MULTI-MANAGER SELECT 2045 FUND
SEC AVERAGE ANNUAL RETURNS
AS OF THE MOST RECENT CALENDAR QUARTER-END
JUNE 30, 2017 (unaudited)
| | | | |
| | | SEC Returns
(reflects applicable
sales charges) | |
| CLASS A SHARES | | | | |
| 1 Year | | | 12.53% | |
| Since Inception1 | | | 6.46% | |
| CLASS C SHARES | | | | |
| 1 Year | | | 15.63% | |
| Since Inception1 | | | 7.45% | |
| ADVISOR CLASS SHARES2 | | | | |
| 1 Year | | | 17.92% | |
| Since Inception1 | | | 8.55% | |
| CLASS R SHARES2 | | | | |
| 1 Year | | | 17.30% | |
| Since Inception1 | | | 8.00% | |
| CLASS K SHARES2 | | | | |
| 1 Year | | | 17.53% | |
| Since Inception1 | | | 8.30% | |
| CLASS I SHARES2 | | | | |
| 1 Year | | | 17.83% | |
| Since Inception1 | | | 8.53% | |
| CLASS Z SHARES2 | | | | |
| 1 Year | | | 17.80% | |
| Since Inception1 | | | 8.52% | |
| 1 | Inception date: 12/15/2014. |
| 2 | Please note that these share classes are for investors purchasing shares through accounts established under certain fee-based programs sponsored and maintained by certain broker-dealers and financial intermediaries, institutional pension plans and/or investment advisory clients of, and certain other persons associated with, the Adviser and its affiliates or the Funds. |
| | |
| 40 | AB MULTI-MANAGER SELECT RETIREMENT FUNDS | | abfunds.com |
HISTORICAL PERFORMANCE
AB MULTI-MANAGER SELECT 2050 FUND
GROWTH OF A $10,000 INVESTMENT IN THE FUND (unaudited)
12/15/20141 TO 7/31/2017
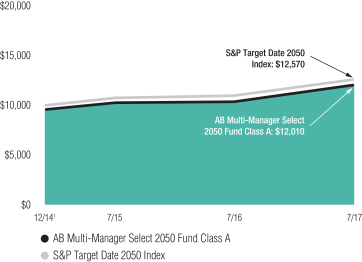
This chart illustrates the total value of an assumed $10,000 investment in AB Multi-Manager Select 2050 Fund Class A shares (from 12/15/20141 to 7/31/2017) as compared to the performance of the Fund’s benchmark. The chart reflects the deduction of the maximum 4.25% sales charge from the initial $10,000 investment in the Fund and assumes the reinvestment of dividends and capital gains distributions.
| 1 | Inception date: 12/15/2014. |
| | |
| abfunds.com | | AB MULTI-MANAGER SELECT RETIREMENT FUNDS | 41 |
HISTORICAL PERFORMANCE (continued)
AB MULTI-MANAGER SELECT 2050 FUND
AVERAGE ANNUAL RETURNS AS OF JULY 31, 2017 (unaudited)
| | | | | | | | |
| | | NAV Returns | | | SEC Returns
(reflects applicable
sales charges) | |
| CLASS A SHARES | | | | | | | | |
| 1 Year | | | 16.19% | | | | 11.20% | |
| Since Inception1 | | | 9.00% | | | | 7.23% | |
| CLASS C SHARES | | | | | | | | |
| 1 Year | | | 15.30% | | | | 14.30% | |
| Since Inception1 | | | 8.17% | | | | 8.17% | |
| ADVISOR CLASS SHARES2 | | | | | | | | |
| 1 Year | | | 16.51% | | | | 16.51% | |
| Since Inception1 | | | 9.25% | | | | 9.25% | |
| CLASS R SHARES2 | | | | | | | | |
| 1 Year | | | 15.84% | | | | 15.84% | |
| Since Inception1 | | | 8.71% | | | | 8.71% | |
| CLASS K SHARES2 | | | | | | | | |
| 1 Year | | | 16.15% | | | | 16.15% | |
| Since Inception1 | | | 8.95% | | | | 8.95% | |
| CLASS I SHARES2 | | | | | | | | |
| 1 Year | | | 16.51% | | | | 16.51% | |
| Since Inception1 | | | 9.27% | | | | 9.27% | |
| CLASS Z SHARES2 | | | | | | | | |
| 1 Year | | | 16.47% | | | | 16.47% | |
| Since Inception1 | | | 9.25% | | | | 9.25% | |
The Fund’s current prospectus fee table shows the Fund’s total annual operating expense ratios as 5.29%, 6.51%, 4.93%, 3.40%, 3.64%, 4.23% and 4.70% for Class A, Class C, Advisor Class, Class R, Class K, Class I and Class Z shares, respectively, gross of any fee waivers or expense reimbursements and inclusive of the Fund’s proportionate share of Underlying Portfolio fees and expenses. Contractual fee waivers and/or expense reimbursements limit the Fund’s annual operating expense ratios exclusive of acquired fund fees and expenses, interest expense, taxes, extraordinary expenses, and brokerage commissions and other transaction costs to 0.50%, 1.25%, 0.25%, 0.75%, 0.50%, 0.25% and 0.25% for Class A, Class C, Advisor Class, Class R, Class K, Class I and Class Z shares, respectively. These waivers/reimbursements may not be terminated before November 30, 2017 and may be extended by the Adviser for additional one-year terms. Any fees waived and expenses borne by the Adviser through January 5, 2016 under the expense limitation in effect prior to that date may be reimbursed by the Fund until the end of the third fiscal year after the fiscal period in which the fee was waived or the expense was borne, provided that no reimbursement payment will be made that would cause the Fund’s operating expenses to exceed the applicable expense limitations. Absent reimbursements or waivers, performance would have been lower. The Financial Highlights section of this report sets forth expense ratio data for the current reporting period; the expense ratios shown above may differ from the expense ratios in the Financial Highlights section since they are based on different time periods.
| 1 | Inception date: 12/15/2014. |
| 2 | These share classes are offered at NAV to eligible investors and their SEC returns are the same as their NAV returns. Please note that these share classes are for investors purchasing shares through accounts established under certain fee-based programs sponsored and maintained by certain broker-dealers and financial intermediaries, institutional pension plans and/or investment advisory clients of, and certain other persons associated with, the Adviser and its affiliates or the Funds. |
| | |
| 42 | AB MULTI-MANAGER SELECT RETIREMENT FUNDS | | abfunds.com |
HISTORICAL PERFORMANCE (continued)
AB MULTI-MANAGER SELECT 2050 FUND
SEC AVERAGE ANNUAL RETURNS
AS OF THE MOST RECENT CALENDAR QUARTER-END
JUNE 30, 2017 (unaudited)
| | | | |
| | | SEC Returns
(reflects applicable
sales charges) | |
| CLASS A SHARES | | | | |
| 1 Year | | | 12.85% | |
| Since Inception1 | | | 6.53% | |
| CLASS C SHARES | | | | |
| 1 Year | | | 16.06% | |
| Since Inception1 | | | 7.52% | |
| ADVISOR CLASS SHARES2 | | | | |
| 1 Year | | | 18.17% | |
| Since Inception1 | | | 8.62% | |
| CLASS R SHARES2 | | | | |
| 1 Year | | | 17.61% | |
| Since Inception1 | | | 8.09% | |
| CLASS K SHARES2 | | | | |
| 1 Year | | | 17.93% | |
| Since Inception1 | | | 8.34% | |
| CLASS I SHARES2 | | | | |
| 1 Year | | | 18.19% | |
| Since Inception1 | | | 8.63% | |
| CLASS Z SHARES2 | | | | |
| 1 Year | | | 18.15% | |
| Since Inception1 | | | 8.61% | |
| 1 | Inception date: 12/15/2014. |
| 2 | Please note that these share classes are for investors purchasing shares through accounts established under certain fee-based programs sponsored and maintained by certain broker-dealers and financial intermediaries, institutional pension plans and/or investment advisory clients of, and certain other persons associated with, the Adviser and its affiliates or the Funds. |
| | |
| abfunds.com | | AB MULTI-MANAGER SELECT RETIREMENT FUNDS | 43 |
HISTORICAL PERFORMANCE
AB MULTI-MANAGER SELECT 2055 FUND
GROWTH OF A $10,000 INVESTMENT IN THE FUND (unaudited)
12/15/20141 TO 7/31/2017
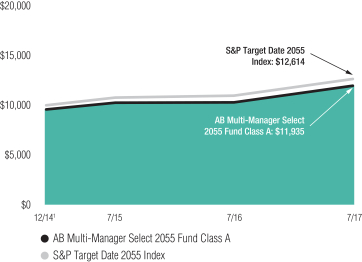
This chart illustrates the total value of an assumed $10,000 investment in AB Multi-Manager Select 2055 Fund Class A shares (from 12/15/20141 to 7/31/2017) as compared to the performance of the Fund’s benchmark. The chart reflects the deduction of the maximum 4.25% sales charge from the initial $10,000 investment in the Fund and assumes the reinvestment of dividends and capital gains distributions.
| 1 | Inception date: 12/15/2014. |
| | |
| 44 | AB MULTI-MANAGER SELECT RETIREMENT FUNDS | | abfunds.com |
HISTORICAL PERFORMANCE (continued)
AB MULTI-MANAGER SELECT 2055 FUND
AVERAGE ANNUAL RETURNS AS OF JULY 31, 2017 (unaudited)
| | | | | | | | |
| | | NAV Returns | | | SEC Returns
(reflects applicable
sales charges) | |
| CLASS A SHARES | | | | | | | | |
| 1 Year | | | 16.08% | | | | 11.16% | |
| Since Inception1 | | | 8.74% | | | | 6.97% | |
| CLASS C SHARES | | | | | | | | |
| 1 Year | | | 15.25% | | | | 14.25% | |
| Since Inception1 | | | 7.94% | | | | 7.94% | |
| ADVISOR CLASS SHARES2 | | | | | | | | |
| 1 Year | | | 16.40% | | | | 16.40% | |
| Since Inception1 | | | 9.01% | | | | 9.01% | |
| CLASS R SHARES2 | | | | | | | | |
| 1 Year | | | 15.82% | | | | 15.82% | |
| Since Inception1 | | | 8.49% | | | | 8.49% | |
| CLASS K SHARES2 | | | | | | | | |
| 1 Year | | | 16.06% | | | | 16.06% | |
| Since Inception1 | | | 8.72% | | | | 8.72% | |
| CLASS I SHARES2 | | | | | | | | |
| 1 Year | | | 16.43% | | | | 16.43% | |
| Since Inception1 | | | 9.04% | | | | 9.04% | |
| CLASS Z SHARES2 | | | | | | | | |
| 1 Year | | | 16.38% | | | | 16.38% | |
| Since Inception1 | | | 9.02% | | | | 9.02% | |
The Fund’s current prospectus fee table shows the Fund’s total annual operating expense ratios as 5.28%, 6.80%, 6.30%, 4.32%, 3.72%, 5.22% and 4.91% for Class A, Class C, Advisor Class, Class R, Class K, Class I and Class Z shares, respectively, gross of any fee waivers or expense reimbursements and inclusive of the Fund’s proportionate share of Underlying Portfolio fees and expenses. Contractual fee waivers and/or expense reimbursements limit the Fund’s annual operating expense ratios exclusive of acquired fund fees and expenses, interest expense, taxes, extraordinary expenses, and brokerage commissions and other transaction costs to 0.51%, 1.26%, 0.26%, 0.76%, 0.51%, 0.26% and 0.26% for Class A, Class C, Advisor Class, Class R, Class K, Class I and Class Z shares, respectively. These waivers/reimbursements may not be terminated before November 30, 2017 and may be extended by the Adviser for additional one-year terms. Any fees waived and expenses borne by the Adviser through January 5, 2016 under the expense limitation in effect prior to that date may be reimbursed by the Fund until the end of the third fiscal year after the fiscal period in which the fee was waived or the expense was borne, provided that no reimbursement payment will be made that would cause the Fund’s operating expenses to exceed the applicable expense limitations. Absent reimbursements or waivers, performance would have been lower. The Financial Highlights section of this report sets forth expense ratio data for the current reporting period; the expense ratios shown above may differ from the expense ratios in the Financial Highlights section since they are based on different time periods.
| 1 | Inception date: 12/15/2014. |
| 2 | These share classes are offered at NAV to eligible investors and their SEC returns are the same as their NAV returns. Please note that these share classes are for investors purchasing shares through accounts established under certain fee-based programs sponsored and maintained by certain broker-dealers and financial intermediaries, institutional pension plans and/or investment advisory clients of, and certain other persons associated with, the Adviser and its affiliates or the Funds. |
| | |
| abfunds.com | | AB MULTI-MANAGER SELECT RETIREMENT FUNDS | 45 |
HISTORICAL PERFORMANCE (continued)
AB MULTI-MANAGER SELECT 2055 FUND
SEC AVERAGE ANNUAL RETURNS
AS OF THE MOST RECENT CALENDAR QUARTER-END
JUNE 30, 2017 (unaudited)
| | | | |
| | | SEC Returns
(reflects applicable
sales charges) | |
| CLASS A SHARES | | | | |
| 1 Year | | | 12.80% | |
| Since Inception1 | | | 6.29% | |
| CLASS C SHARES | | | | |
| 1 Year | | | 15.89% | |
| Since Inception1 | | | 7.30% | |
| ADVISOR CLASS SHARES2 | | | | |
| 1 Year | | | 18.17% | |
| Since Inception1 | | | 8.39% | |
| CLASS R SHARES2 | | | | |
| 1 Year | | | 17.60% | |
| Since Inception1 | | | 7.86% | |
| CLASS K SHARES2 | | | | |
| 1 Year | | | 17.84% | |
| Since Inception1 | | | 8.10% | |
| CLASS I SHARES2 | | | | |
| 1 Year | | | 18.10% | |
| Since Inception1 | | | 8.39% | |
| CLASS Z SHARES2 | | | | |
| 1 Year | | | 18.05% | |
| Since Inception1 | | | 8.37% | |
| 1 | Inception date: 12/15/2014. |
| 2 | Please note that these share classes are for investors purchasing shares through accounts established under certain fee-based programs sponsored and maintained by certain broker-dealers and financial intermediaries, institutional pension plans and/or investment advisory clients of, and certain other persons associated with, the Adviser and its affiliates or the Funds. |
| | |
| 46 | AB MULTI-MANAGER SELECT RETIREMENT FUNDS | | abfunds.com |
EXPENSE EXAMPLE
(unaudited)
As a shareholder of a Fund, you incur two types of costs: (1) transaction costs, including sales charges (loads) on purchase payments, contingent deferred sales charges on redemptions and (2) ongoing costs, including management fees; distribution (12b-1) fees; and other Fund expenses. This example is intended to help you understand your ongoing costs (in dollars) of investing in the Fund and to compare these costs with the ongoing costs of investing in other mutual funds.
The Example is based on an investment of $1,000 invested at the beginning of the period and held for the entire period as indicated below.
Actual Expenses
The first line of each table below provides information about actual account values and actual expenses. You may use the information, together with the amount you invested, to estimate the expenses that you paid over the period. Simply divide your account value by $1,000 (for example, an $8,600 account value divided by $1,000 = 8.6), then multiply the result by the number under the heading entitled “Expenses Paid During Period” to estimate the expenses you paid on your account during this period. Each Fund will indirectly bear its pro rata share of the expenses incurred by the Underlying Portfolios in which the Fund invests. These expenses are not included in the table below.
Hypothetical Example for Comparison Purposes
The first line of each table below also provides information about hypothetical account values and hypothetical expenses based on a Fund’s actual expense ratio and an assumed annual rate of return of 5% before expenses, which is not the Fund’s actual return. The hypothetical account values and expenses may not be used to estimate the actual ending account balance or expenses you paid for the period. You may use this information to compare the ongoing costs of investing in the Fund and other funds by comparing this 5% hypothetical example with the 5% hypothetical examples that appear in the shareholder reports of other funds. Each Fund will indirectly bear its pro rata share of the expenses incurred by the Underlying Portfolios in which the Fund invests. These expenses are not included in the table below.
Please note that the expenses shown in the table are meant to highlight your ongoing costs only and do not reflect any transactional costs, such as sales charges (loads), or contingent deferred sales charges on redemptions. Therefore, the hypothetical example is useful in comparing ongoing costs only, and will not help you determine the relative total costs of owning different funds. In addition, if these transactional costs were included, your costs would have been higher.
| | |
| abfunds.com | | AB MULTI-MANAGER SELECT RETIREMENT FUNDS | 47 |
EXPENSE EXAMPLE (continued)
(unaudited)
AB Multi-Manager Select Retirement Allocation Fund
| | | | | | | | | | | | | | | | | | | | | | | | |
| | | Beginning
Account
Value
February 1,
2017 | | | Ending
Account
Value
July 31,
2017 | | | Expenses
Paid
During
Period* | | | Annualized
Expense
Ratio* | | | Total
Expenses
Paid
During
Period+ | | | Total
Annualized
Expense
Ratio+ | |
| Class A | | | | | | | | | | | | | | | | | | | | | | | | |
Actual | | $ | 1,000 | | | $ | 1,044.80 | | | $ | 2.13 | | | | 0.42 | % | | $ | 4.82 | | | | 0.95 | % |
Hypothetical** | | $ | 1,000 | | | $ | 1,022.71 | | | $ | 2.11 | | | | 0.42 | % | | $ | 4.76 | | | | 0.95 | % |
| Class C | | | | | | | | | | | | | | | | | | | | | | | | |
Actual | | $ | 1,000 | | | $ | 1,040.60 | | | $ | 5.92 | | | | 1.17 | % | | $ | 8.60 | | | | 1.70 | % |
Hypothetical** | | $ | 1,000 | | | $ | 1,018.99 | | | $ | 5.86 | | | | 1.17 | % | | $ | 8.51 | | | | 1.70 | % |
| Advisor Class | | | | | | | | | | | | | | | | | | | | | | | | |
Actual | | $ | 1,000 | | | $ | 1,045.40 | | | $ | 0.86 | | | | 0.17 | % | | $ | 3.55 | | | | 0.70 | % |
Hypothetical** | | $ | 1,000 | | | $ | 1,023.95 | | | $ | 0.85 | | | | 0.17 | % | | $ | 3.51 | | | | 0.70 | % |
| Class R | | | | | | | | | | | | | | | | | | | | | | | | |
Actual | | $ | 1,000 | | | $ | 1,042.70 | | | $ | 3.39 | | | | 0.67 | % | | $ | 6.08 | | | | 1.20 | % |
Hypothetical** | | $ | 1,000 | | | $ | 1,021.47 | | | $ | 3.36 | | | | 0.67 | % | | $ | 6.01 | | | | 1.20 | % |
| Class K | | | | | | | | | | | | | | | | | | | | | | | | |
Actual | | $ | 1,000 | | | $ | 1,044.70 | | | $ | 2.13 | | | | 0.42 | % | | $ | 4.82 | | | | 0.95 | % |
Hypothetical** | | $ | 1,000 | | | $ | 1,022.71 | | | $ | 2.11 | | | | 0.42 | % | | $ | 4.76 | | | | 0.95 | % |
| Class I | | | | | | | | | | | | | | | | | | | | | | | | |
Actual | | $ | 1,000 | | | $ | 1,045.60 | | | $ | 0.86 | | | | 0.17 | % | | $ | 3.55 | | | | 0.70 | % |
Hypothetical** | | $ | 1,000 | | | $ | 1,023.95 | | | $ | 0.85 | | | | 0.17 | % | | $ | 3.51 | | | | 0.70 | % |
| Class Z | | | | | | | | | | | | | | | | | | | | | | | | |
Actual | | $ | 1,000 | | | $ | 1,045.70 | | | $ | 0.86 | | | | 0.17 | % | | $ | 3.55 | | | | 0.70 | % |
Hypothetical** | | $ | 1,000 | | | $ | 1,023.93 | | | $ | 0.85 | | | | 0.17 | % | | $ | 3.51 | | | | 0.70 | % |
AB Multi-Manager Select 2010 Fund
| | | | | | | | | | | | | | | | | | | | | | | | |
| | | Beginning
Account
Value
February 1,
2017 | | | Ending
Account
Value
July 31,
2017 | | | Expenses
Paid
During
Period* | | | Annualized
Expense
Ratio* | | | Total
Expenses
Paid
During
Period+ | | | Total
Annualized
Expense
Ratio+ | |
| Class A | | | | | | | | | | | | | | | | | | | | | | | | |
Actual | | $ | 1,000 | | | $ | 1,053.10 | | | $ | 2.04 | | | | 0.40 | % | | $ | 4.89 | | | | 0.96 | % |
Hypothetical** | | $ | 1,000 | | | $ | 1,022.81 | | | $ | 2.01 | | | | 0.40 | % | | $ | 4.81 | | | | 0.96 | % |
| Class C | | | | | | | | | | | | | | | | | | | | | | | | |
Actual | | $ | 1,000 | | | $ | 1,049.80 | | | $ | 5.84 | | | | 1.15 | % | | $ | 8.69 | | | | 1.71 | % |
Hypothetical** | | $ | 1,000 | | | $ | 1,019.09 | | | $ | 5.76 | | | | 1.15 | % | | $ | 8.41 | | | | 1.71 | % |
| Advisor Class | | | | | | | | | | | | | | | | | | | | | | | | |
Actual | | $ | 1,000 | | | $ | 1,054.40 | | | $ | 0.76 | | | | 0.15 | % | | $ | 3.62 | | | | 0.71 | % |
Hypothetical** | | $ | 1,000 | | | $ | 1,024.05 | | | $ | 0.75 | | | | 0.15 | % | | $ | 3.41 | | | | 0.71 | % |
| Class R | | | | | | | | | | | | | | | | | | | | | | | | |
Actual | | $ | 1,000 | | | $ | 1,051.40 | | | $ | 3.31 | | | | 0.65 | % | | $ | 6.15 | | | | 1.21 | % |
Hypothetical** | | $ | 1,000 | | | $ | 1,021.57 | | | $ | 3.26 | | | | 0.65 | % | | $ | 5.91 | | | | 1.21 | % |
| Class K | | | | | | | | | | | | | | | | | | | | | | | | |
Actual | | $ | 1,000 | | | $ | 1,053.40 | | | $ | 2.04 | | | | 0.40 | % | | $ | 4.89 | | | | 0.96 | % |
Hypothetical** | | $ | 1,000 | | | $ | 1,022.81 | | | $ | 2.01 | | | | 0.40 | % | | $ | 4.66 | | | | 0.96 | % |
| | |
| 48 | AB MULTI-MANAGER SELECT RETIREMENT FUNDS | | abfunds.com |
EXPENSE EXAMPLE (continued)
(unaudited)
| | | | | | | | | | | | | | | | | | | | | | | | |
| | | Beginning
Account
Value
February 1,
2017 | | | Ending
Account
Value
July 31,
2017 | | | Expenses
Paid
During
Period* | | | Annualized
Expense
Ratio* | | | Total
Expenses
Paid
During
Period+ | | | Total
Annualized
Expense
Ratio+ | |
| Class I | | | | | | | | | | | | | | | | | | | | | | | | |
Actual | | $ | 1,000 | | | $ | 1,054.40 | | | $ | 0.76 | | | | 0.15 | % | | $ | 3.62 | | | | 0.71 | % |
Hypothetical** | | $ | 1,000 | | | $ | 1,024.05 | | | $ | 0.75 | | | | 0.15 | % | | $ | 3.56 | | | | 0.71 | % |
| Class Z | | | | | | | | | | | | | | | | | | | | | | | | |
Actual | | $ | 1,000 | | | $ | 1,054.30 | | | $ | 0.76 | | | | 0.15 | % | | $ | 3.62 | | | | 0.71 | % |
Hypothetical** | | $ | 1,000 | | | $ | 1,024.05 | | | $ | 0.75 | | | | 0.15 | % | | $ | 3.56 | | | | 0.71 | % |
AB Multi-Manager Select 2015 Fund
| | | | | | | | | | | | | | | | | | | | | | | | |
| | | Beginning
Account
Value
February 1,
2017 | | | Ending
Account
Value
July 31,
2017 | | | Expenses
Paid
During
Period* | | | Annualized
Expense
Ratio* | | | Total
Expenses
Paid
During
Period+ | | | Total
Annualized
Expense
Ratio+ | |
| Class A | | | | | | | | | | | | | | | | | | | | | | | | |
Actual | | $ | 1,000 | | | $ | 1,057.60 | | | $ | 2.04 | | | | 0.40 | % | | $ | 5.10 | | | | 1.00 | % |
Hypothetical** | | $ | 1,000 | | | $ | 1,022.81 | | | $ | 2.01 | | | | 0.40 | % | | $ | 5.02 | | | | 1.00 | % |
| Class C | | | | | | | | | | | | | | | | | | | | | | | | |
Actual | | $ | 1,000 | | | $ | 1,054.10 | | | $ | 5.86 | | | | 1.15 | % | | $ | 8.91 | | | | 1.75 | % |
Hypothetical** | | $ | 1,000 | | | $ | 1,019.09 | | | $ | 5.76 | | | | 1.15 | % | | $ | 8.76 | | | | 1.75 | % |
| Advisor Class | | | | | | | | | | | | | | | | | | | | | | | | |
Actual | | $ | 1,000 | | | $ | 1,058.80 | | | $ | 0.77 | | | | 0.15 | % | | $ | 3.83 | | | | 0.75 | % |
Hypothetical** | | $ | 1,000 | | | $ | 1,024.05 | | | $ | 0.75 | | | | 0.15 | % | | $ | 3.76 | | | | 0.75 | % |
| Class R | | | | | | | | | | | | | | | | | | | | | | | | |
Actual | | $ | 1,000 | | | $ | 1,055.90 | | | $ | 3.31 | | | | 0.65 | % | | $ | 6.37 | | | | 1.25 | % |
Hypothetical** | | $ | 1,000 | | | $ | 1,021.57 | | | $ | 3.26 | | | | 0.65 | % | | $ | 6.27 | | | | 1.25 | % |
| Class K | | | | | | | | | | | | | | | | | | | | | | | | |
Actual | | $ | 1,000 | | | $ | 1,057.80 | | | $ | 2.04 | | | | 0.40 | % | | $ | 5.10 | | | | 1.00 | % |
Hypothetical** | | $ | 1,000 | | | $ | 1,022.81 | | | $ | 2.01 | | | | 0.40 | % | | $ | 5.02 | | | | 1.00 | % |
| Class I | | | | | | | | | | | | | | | | | | | | | | | | |
Actual | | $ | 1,000 | | | $ | 1,058.80 | | | $ | 0.77 | | | | 0.15 | % | | $ | 3.83 | | | | 0.75 | % |
Hypothetical** | | $ | 1,000 | | | $ | 1,024.05 | | | $ | 0.75 | | | | 0.15 | % | | $ | 3.76 | | | | 0.75 | % |
| Class Z | | | | | | | | | | | | | | | | | | | | | | | | |
Actual | | $ | 1,000 | | | $ | 1,059.80 | | | $ | 0.77 | | | | 0.15 | % | | $ | 3.83 | | | | 0.75 | % |
Hypothetical** | | $ | 1,000 | | | $ | 1,024.05 | | | $ | 0.75 | | | | 0.15 | % | | $ | 3.76 | | | | 0.75 | % |
AB Multi-Manager Select 2020 Fund
| | | | | | | | | | | | | | | | | | | | | | | | |
| | | Beginning
Account
Value
February 1,
2017 | | | Ending
Account
Value
July 31,
2017 | | | Expenses
Paid
During
Period* | | | Annualized
Expense
Ratio* | | | Total
Expenses
Paid
During
Period+ | | | Total
Annualized
Expense
Ratio+ | |
| Class A | | | | | | | | | | | | | | | | | | | | | | | | |
Actual | | $ | 1,000 | | | $ | 1,064.90 | | | $ | 2.25 | | | | 0.44 | % | | $ | 5.43 | | | | 1.06 | % |
Hypothetical** | | $ | 1,000 | | | $ | 1,022.61 | | | $ | 2.21 | | | | 0.44 | % | | $ | 5.32 | | | | 1.06 | % |
| | |
| abfunds.com | | AB MULTI-MANAGER SELECT RETIREMENT FUNDS | 49 |
EXPENSE EXAMPLE (continued)
(unaudited)
| | | | | | | | | | | | | | | | | | | | | | | | |
| | | Beginning
Account
Value
February 1,
2017 | | | Ending
Account
Value
July 31,
2017 | | | Expenses
Paid
During
Period* | | | Annualized
Expense
Ratio* | | | Total
Expenses
Paid
During
Period+ | | | Total
Annualized
Expense
Ratio+ | |
| Class C | | | | | | | | | | | | | | | | | | | | | | | | |
Actual | | $ | 1,000 | | | $ | 1,060.60 | | | $ | 6.08 | | | | 1.19 | % | | $ | 9.25 | | | | 1.81 | % |
Hypothetical** | | $ | 1,000 | | | $ | 1,018.89 | | | $ | 5.96 | | | | 1.19 | % | | $ | 9.06 | | | | 1.81 | % |
| Advisor Class | | | | | | | | | | | | | | | | | | | | | | | | |
Actual | | $ | 1,000 | | | $ | 1,065.80 | | | $ | 0.97 | | | | 0.19 | % | | $ | 4.15 | | | | 0.81 | % |
Hypothetical** | | $ | 1,000 | | | $ | 1,023.85 | | | $ | 0.95 | | | | 0.19 | % | | $ | 4.06 | | | | 0.81 | % |
| Class R | | | | | | | | | | | | | | | | | | | | | | | | |
Actual | | $ | 1,000 | | | $ | 1,063.30 | | | $ | 3.53 | | | | 0.69 | % | | $ | 6.70 | | | | 1.31 | % |
Hypothetical** | | $ | 1,000 | | | $ | 1,021.37 | | | $ | 3.46 | | | | 0.69 | % | | $ | 6.57 | | | | 1.31 | % |
| Class K | | | | | | | | | | | | | | | | | | | | | | | | |
Actual | | $ | 1,000 | | | $ | 1,065.20 | | | $ | 2.25 | | | | 0.44 | % | | $ | 5.43 | | | | 1.06 | % |
Hypothetical** | | $ | 1,000 | | | $ | 1,022.61 | | | $ | 2.21 | | | | 0.44 | % | | $ | 5.32 | | | | 1.06 | % |
| Class I | | | | | | | | | | | | | | | | | | | | | | | | |
Actual | | $ | 1,000 | | | $ | 1,066.10 | | | $ | 0.97 | | | | 0.19 | % | | $ | 4.15 | | | | 0.81 | % |
Hypothetical** | | $ | 1,000 | | | $ | 1,023.85 | | | $ | 0.95 | | | | 0.19 | % | | $ | 4.06 | | | | 0.81 | % |
| Class Z | | | | | | | | | | | | | | | | | | | | | | | | |
Actual | | $ | 1,000 | | | $ | 1,066.20 | | | $ | 0.97 | | | | 0.19 | % | | $ | 4.15 | | | | 0.81 | % |
Hypothetical** | | $ | 1,000 | | | $ | 1,023.85 | | | $ | 0.95 | | | | 0.19 | % | | $ | 4.06 | | | | 0.81 | % |
AB Multi-Manager Select 2025 Fund
| | | | | | | | | | | | | | | | | | | | | | | | |
| | | Beginning
Account
Value
February 1,
2017 | | | Ending
Account
Value
July 31,
2017 | | | Expenses
Paid
During
Period* | | | Annualized
Expense
Ratio* | | | Total
Expenses
Paid
During
Period+ | | | Total
Annualized
Expense
Ratio+ | |
| Class A | | | | | | | | | | | | | | | | | | | | | | | | |
Actual | | $ | 1,000 | | | $ | 1,075.00 | | | $ | 2.21 | | | | 0.43 | % | | $ | 5.51 | | | | 1.07 | % |
Hypothetical** | | $ | 1,000 | | | $ | 1,022.66 | | | $ | 2.16 | | | | 0.43 | % | | $ | 5.37 | | | | 1.07 | % |
| Class C | | | | | | | | | | | | | | | | | | | | | | | | |
Actual | | $ | 1,000 | | | $ | 1,070.80 | | | $ | 6.06 | | | | 1.18 | % | | $ | 9.34 | | | | 1.82 | % |
Hypothetical** | | $ | 1,000 | | | $ | 1,018.94 | | | $ | 5.91 | | | | 1.18 | % | | $ | 9.11 | | | | 1.82 | % |
| Advisor Class | | | | | | | | | | | | | | | | | | | | | | | | |
Actual | | $ | 1,000 | | | $ | 1,075.90 | | | $ | 0.93 | | | | 0.18 | % | | $ | 4.22 | | | | 0.82 | % |
Hypothetical** | | $ | 1,000 | | | $ | 1,023.90 | | | $ | 0.90 | | | | 0.18 | % | | $ | 4.11 | | | | 0.82 | % |
| Class R | | | | | | | | | | | | | | | | | | | | | | | | |
Actual | | $ | 1,000 | | | $ | 1,072.80 | | | $ | 3.49 | | | | 0.68 | % | | $ | 6.78 | | | | 1.32 | % |
Hypothetical** | | $ | 1,000 | | | $ | 1,021.42 | | | $ | 3.41 | | | | 0.68 | % | | $ | 6.62 | | | | 1.32 | % |
| Class K | | | | | | | | | | | | | | | | | | | | | | | | |
Actual | | $ | 1,000 | | | $ | 1,074.60 | | | $ | 2.21 | | | | 0.43 | % | | $ | 5.50 | | | | 1.07 | % |
Hypothetical** | | $ | 1,000 | | | $ | 1,022.66 | | | $ | 2.16 | | | | 0.43 | % | | $ | 5.37 | | | | 1.07 | % |
| Class I | | | | | | | | | | | | | | | | | | | | | | | | |
Actual | | $ | 1,000 | | | $ | 1,075.40 | | | $ | 0.93 | | | | 0.18 | % | | $ | 4.22 | | | | 0.82 | % |
Hypothetical** | | $ | 1,000 | | | $ | 1,023.90 | | | $ | 0.90 | | | | 0.18 | % | | $ | 4.11 | | | | 0.82 | % |
| Class Z | | | | | | | | | | | | | | | | | | | | | | | | |
Actual | | $ | 1,000 | | | $ | 1,075.50 | | | $ | 0.93 | | | | 0.18 | % | | $ | 4.22 | | | | 0.82 | % |
Hypothetical** | | $ | 1,000 | | | $ | 1,023.90 | | | $ | 0.90 | | | | 0.18 | % | | $ | 4.11 | | | | 0.82 | % |
| | |
| 50 | AB MULTI-MANAGER SELECT RETIREMENT FUNDS | | abfunds.com |
EXPENSE EXAMPLE (continued)
(unaudited)
AB Multi-Manager Select 2030 Fund
| | | | | | | | | | | | | | | | | | | | | | | | |
| | | Beginning
Account
Value
February 1,
2017 | | | Ending
Account
Value
July 31,
2017 | | | Expenses
Paid
During
Period* | | | Annualized
Expense
Ratio* | | | Total
Expenses
Paid
During
Period+ | | | Total
Annualized
Expense
Ratio+ | |
| Class A | | | | | | | | | | | | | | | | | | | | | | | | |
Actual | | $ | 1,000 | | | $ | 1,084.40 | | | $ | 2.48 | | | | 0.48 | % | | $ | 5.79 | | | | 1.12 | % |
Hypothetical** | | $ | 1,000 | | | $ | 1,022.41 | | | $ | 2.41 | | | | 0.48 | % | | $ | 5.62 | | | | 1.12 | % |
| Class C | | | | | | | | | | | | | | | | | | | | | | | | |
Actual | | $ | 1,000 | | | $ | 1,081.40 | | | $ | 6.35 | | | | 1.23 | % | | $ | 9.65 | | | | 1.87 | % |
Hypothetical** | | $ | 1,000 | | | $ | 1,018.70 | | | $ | 6.16 | | | | 1.23 | % | | $ | 9.36 | | | | 1.87 | % |
| Advisor Class | | | | | | | | | | | | | | | | | | | | | | | | |
Actual | | $ | 1,000 | | | $ | 1,086.20 | | | $ | 1.19 | | | | 0.23 | % | | $ | 4.50 | | | | 0.87 | % |
Hypothetical** | | $ | 1,000 | | | $ | 1,023.65 | | | $ | 1.15 | | | | 0.23 | % | | $ | 4.37 | | | | 0.87 | % |
| Class R | | | | | | | | | | | | | | | | | | | | | | | | |
Actual | | $ | 1,000 | | | $ | 1,083.30 | | | $ | 3.77 | | | | 0.73 | % | | $ | 7.08 | | | | 1.37 | % |
Hypothetical** | | $ | 1,000 | | | $ | 1,021.17 | | | $ | 3.66 | | | | 0.73 | % | | $ | 6.87 | | | | 1.37 | % |
| Class K | | | | | | | | | | | | | | | | | | | | | | | | |
Actual | | $ | 1,000 | | | $ | 1,084.20 | | | $ | 2.48 | | | | 0.48 | % | | $ | 5.79 | | | | 1.12 | % |
Hypothetical** | | $ | 1,000 | | | $ | 1,022.41 | | | $ | 2.41 | | | | 0.48 | % | | $ | 5.62 | | | | 1.12 | % |
| Class I | | | | | | | | | | | | | | | | | | | | | | | | |
Actual | | $ | 1,000 | | | $ | 1,086.00 | | | $ | 1.19 | | | | 0.23 | % | | $ | 4.50 | | | | 0.87 | % |
Hypothetical** | | $ | 1,000 | | | $ | 1,023.65 | | | $ | 1.15 | | | | 0.23 | % | | $ | 4.37 | | | | 0.87 | % |
| Class Z | | | | | | | | | | | | | | | | | | | | | | | | |
Actual | | $ | 1,000 | | | $ | 1,086.00 | | | $ | 1.19 | | | | 0.23 | % | | $ | 4.50 | | | | 0.87 | % |
Hypothetical** | | $ | 1,000 | | | $ | 1,023.65 | | | $ | 1.15 | | | | 0.23 | % | | $ | 4.37 | | | | 0.87 | % |
AB Multi-Manager Select 2035 Fund
| | | | | | | | | | | | | | | | | | | | | | | | |
| | | Beginning
Account
Value
February 1,
2017 | | | Ending
Account
Value
July 31,
2017 | | | Expenses
Paid
During
Period* | | | Annualized
Expense
Ratio* | | | Total
Expenses
Paid
During
Period+ | | | Total
Annualized
Expense
Ratio+ | |
| Class A | | | | | | | | | | | | | | | | | | | | | | | | |
Actual | | $ | 1,000 | | | $ | 1,094.00 | | | $ | 2.49 | | | | 0.48 | % | | $ | 5.87 | | | | 1.13 | % |
Hypothetical** | | $ | 1,000 | | | $ | 1,022.41 | | | $ | 2.41 | | | | 0.48 | % | | $ | 5.67 | | | | 1.13 | % |
| Class C | | | | | | | | | | | | | | | | | | | | | | | | |
Actual | | $ | 1,000 | | | $ | 1,091.20 | | | $ | 6.38 | | | | 1.23 | % | | $ | 9.75 | | | | 1.88 | % |
Hypothetical** | | $ | 1,000 | | | $ | 1,018.70 | | | $ | 6.16 | | | | 1.23 | % | | $ | 9.41 | | | | 1.88 | % |
| Advisor Class | | | | | | | | | | | | | | | | | | | | | | | | |
Actual | | $ | 1,000 | | | $ | 1,095.60 | | | $ | 1.20 | | | | 0.23 | % | | $ | 4.57 | | | | 0.88 | % |
Hypothetical** | | $ | 1,000 | | | $ | 1,023.65 | | | $ | 1.15 | | | | 0.23 | % | | $ | 4.42 | | | | 0.88 | % |
| Class R | | | | | | | | | | | | | | | | | | | | | | | | |
Actual | | $ | 1,000 | | | $ | 1,093.40 | | | $ | 3.79 | | | | 0.73 | % | | $ | 7.16 | | | | 1.38 | % |
Hypothetical** | | $ | 1,000 | | | $ | 1,021.17 | | | $ | 3.66 | | | | 0.73 | % | | $ | 6.92 | | | | 1.38 | % |
| Class K | | | | | | | | | | | | | | | | | | | | | | | | |
Actual | | $ | 1,000 | | | $ | 1,094.10 | | | $ | 2.49 | | | | 0.48 | % | | $ | 5.87 | | | | 1.13 | % |
Hypothetical** | | $ | 1,000 | | | $ | 1,022.41 | | | $ | 2.41 | | | | 0.48 | % | | $ | 5.67 | | | | 1.13 | % |
| | |
| abfunds.com | | AB MULTI-MANAGER SELECT RETIREMENT FUNDS | 51 |
EXPENSE EXAMPLE (continued)
(unaudited)
| | | | | | | | | | | | | | | | | | | | | | | | |
| | | Beginning
Account
Value
February 1,
2017 | | | Ending
Account
Value
July 31,
2017 | | | Expenses
Paid
During
Period* | | | Annualized
Expense
Ratio* | | | Total
Expenses
Paid
During
Period+ | | | Total
Annualized
Expense
Ratio+ | |
| Class I | | | | | | | | | | | | | | | | | | | | | | | | |
Actual | | $ | 1,000 | | | $ | 1,095.90 | | | $ | 1.20 | | | | 0.23 | % | | $ | 4.57 | | | | 0.88 | % |
Hypothetical** | | $ | 1,000 | | | $ | 1,023.65 | | | $ | 1.15 | | | | 0.23 | % | | $ | 4.42 | | | | 0.88 | % |
| Class Z | | | | | | | | | | | | | | | | | | | | | | | | |
Actual | | $ | 1,000 | | | $ | 1,095.00 | | | $ | 1.19 | | | | 0.23 | % | | $ | 4.57 | | | | 0.88 | % |
Hypothetical** | | $ | 1,000 | | | $ | 1,023.65 | | | $ | 1.15 | | | | 0.23 | % | | $ | 4.42 | | | | 0.88 | % |
AB Multi-Manager Select 2040 Fund
| | | | | | | | | | | | | | | | | | | | | | | | |
| | | Beginning
Account
Value
February 1,
2017 | | | Ending
Account
Value
July 31,
2017 | | | Expenses
Paid
During
Period* | | | Annualized
Expense
Ratio* | | | Total
Expenses
Paid
During
Period+ | | | Total
Annualized
Expense
Ratio+ | |
| Class A | | | | | | | | | | | | | | | | | | | | | | | | |
Actual | | $ | 1,000 | | | $ | 1,099.70 | | | $ | 2.71 | | | | 0.52 | % | | $ | 6.20 | | | | 1.19 | % |
Hypothetical** | | $ | 1,000 | | | $ | 1,022.22 | | | $ | 2.61 | | | | 0.52 | % | | $ | 5.97 | | | | 1.19 | % |
| Class C | | | | | | | | | | | | | | | | | | | | | | | | |
Actual | | $ | 1,000 | | | $ | 1,096.00 | | | $ | 6.60 | | | | 1.27 | % | | $ | 10.08 | | | | 1.94 | % |
Hypothetical** | | $ | 1,000 | | | $ | 1,018.50 | | | $ | 6.36 | | | | 1.27 | % | | $ | 9.71 | | | | 1.94 | % |
| Advisor Class | | | | | | | | | | | | | | | | | | | | | | | | |
Actual | | $ | 1,000 | | | $ | 1,101.30 | | | $ | 1.41 | | | | 0.27 | % | | $ | 4.90 | | | | 0.94 | % |
Hypothetical** | | $ | 1,000 | | | $ | 1,023.46 | | | $ | 1.35 | | | | 0.27 | % | | $ | 4.72 | | | | 0.94 | % |
| Class R | | | | | | | | | | | | | | | | | | | | | | | | |
Actual | | $ | 1,000 | | | $ | 1,097.40 | | | $ | 4.00 | | | | 0.77 | % | | $ | 7.49 | | | | 1.44 | % |
Hypothetical** | | $ | 1,000 | | | $ | 1,020.98 | | | $ | 3.86 | | | | 0.77 | % | | $ | 7.22 | | | | 1.44 | % |
| Class K | | | | | | | | | | | | | | | | | | | | | | | | |
Actual | | $ | 1,000 | | | $ | 1,100.00 | | | $ | 2.71 | | | | 0.52 | % | | $ | 6.20 | | | | 1.19 | % |
Hypothetical** | | $ | 1,000 | | | $ | 1,022.22 | | | $ | 2.61 | | | | 0.52 | % | | $ | 5.97 | | | | 1.19 | % |
| Class I | | | | | | | | | | | | | | | | | | | | | | | | |
Actual | | $ | 1,000 | | | $ | 1,100.90 | | | $ | 1.41 | | | | 0.27 | % | | $ | 4.90 | | | | 0.94 | % |
Hypothetical** | | $ | 1,000 | | | $ | 1,023.46 | | | $ | 1.35 | | | | 0.27 | % | | $ | 4.72 | | | | 0.94 | % |
| Class Z | | | | | | | | | | | | | | | | | | | | | | | | |
Actual | | $ | 1,000 | | | $ | 1,100.90 | | | $ | 1.41 | | | | 0.27 | % | | $ | 4.90 | | | | 0.94 | % |
Hypothetical** | | $ | 1,000 | | | $ | 1,023.46 | | | $ | 1.35 | | | | 0.27 | % | | $ | 4.72 | | | | 0.94 | % |
AB Multi-Manager Select 2045 Fund
| | | | | | | | | | | | | | | | | | | | | | | | |
| | | Beginning
Account
Value
February 1,
2017 | | | Ending
Account
Value
July 31,
2017 | | | Expenses
Paid
During
Period* | | | Annualized
Expense
Ratio* | | | Total
Expenses
Paid
During
Period+ | | | Total
Annualized
Expense
Ratio+ | |
| Class A | | | | | | | | | | | | |
Actual | | $ | 1,000 | | | $ | 1,101.70 | | | $ | 2.61 | | | | 0.50 | % | | $ | 6.04 | | | | 1.16 | % |
Hypothetical** | | $ | 1,000 | | | $ | 1,022.32 | | | $ | 2.51 | | | | 0.50 | % | | $ | 5.82 | | | | 1.16 | % |
| | |
| 52 | AB MULTI-MANAGER SELECT RETIREMENT FUNDS | | abfunds.com |
EXPENSE EXAMPLE (continued)
(unaudited)
| | | | | | | | | | | | | | | | | | | | | | | | |
| | | Beginning
Account
Value
February 1,
2017 | | | Ending
Account
Value
July 31,
2017 | | | Expenses
Paid
During
Period* | | | Annualized
Expense
Ratio* | | | Total
Expenses
Paid
During
Period+ | | | Total
Annualized
Expense
Ratio+ | |
| Class C | | | | | | | | | | | | |
Actual | | $ | 1,000 | | | $ | 1,098.10 | | | $ | 6.50 | | | | 1.25 | % | | $ | 9.94 | | | | 1.91 | % |
Hypothetical** | | $ | 1,000 | | | $ | 1,018.60 | | | $ | 6.26 | | | | 1.25 | % | | $ | 9.56 | | | | 1.91 | % |
| Advisor Class | | | | | | | | | | | | |
Actual | | $ | 1,000 | | | $ | 1,103.90 | | | $ | 1.30 | | | | 0.25 | % | | $ | 4.75 | | | | 0.91 | % |
Hypothetical** | | $ | 1,000 | | | $ | 1,023.55 | | | $ | 1.25 | | | | 0.25 | % | | $ | 4.57 | | | | 0.91 | % |
| Class R | | | | | | | | | | | | |
Actual | | $ | 1,000 | | | $ | 1,100.70 | | | $ | 3.91 | | | | 0.75 | % | | $ | 7.34 | | | | 1.41 | % |
Hypothetical** | | $ | 1,000 | | | $ | 1,021.08 | | | $ | 3.76 | | | | 0.75 | % | | $ | 7.07 | | | | 1.41 | % |
| Class K | | | | | | | | | | | | |
Actual | | $ | 1,000 | | | $ | 1,102.20 | | | $ | 2.61 | | | | 0.50 | % | | $ | 6.05 | | | | 1.16 | % |
Hypothetical** | | $ | 1,000 | | | $ | 1,022.32 | | | $ | 2.51 | | | | 0.50 | % | | $ | 5.82 | | | | 1.16 | % |
| Class I | | | | | | | | | | | | |
Actual | | $ | 1,000 | | | $ | 1,104.10 | | | $ | 1.30 | | | | 0.25 | % | | $ | 4.75 | | | | 0.91 | % |
Hypothetical** | | $ | 1,000 | | | $ | 1,023.55 | | | $ | 1.25 | | | | 0.25 | % | | $ | 4.57 | | | | 0.91 | % |
| Class Z | | | | | | | | | | | | |
Actual | | $ | 1,000 | | | $ | 1,103.10 | | | $ | 1.30 | | | | 0.25 | % | | $ | 4.75 | | | | 0.91 | % |
Hypothetical** | | $ | 1,000 | | | $ | 1,023.55 | | | $ | 1.25 | | | | 0.25 | % | | $ | 4.57 | | | | 0.91 | % |
AB Multi-Manager Select 2050 Fund
| | | | | | | | | | | | | | | | | | | | | | | | |
| | | Beginning
Account
Value
February 1,
2017 | | | Ending
Account
Value
July 31,
2017 | | | Expenses
Paid
During
Period* | | | Annualized
Expense
Ratio* | | | Total
Expenses
Paid
During
Period+ | | | Total
Annualized
Expense
Ratio+ | |
| Class A | | | | | | | | | | | | |
Actual | | $ | 1,000 | | | $ | 1,104.70 | | | $ | 2.61 | | | | 0.50 | % | | $ | 6.16 | | | | 1.18 | % |
Hypothetical** | | $ | 1,000 | | | $ | 1,022.32 | | | $ | 2.51 | | | | 0.50 | % | | $ | 5.92 | | | | 1.18 | % |
| Class C | | | | | | | | | | | | |
Actual | | $ | 1,000 | | | $ | 1,101.10 | | | $ | 6.51 | | | | 1.25 | % | | $ | 10.05 | | | | 1.93 | % |
Hypothetical** | | $ | 1,000 | | | $ | 1,018.60 | | | $ | 6.26 | | | | 1.25 | % | | $ | 9.66 | | | | 1.93 | % |
| Advisor Class | | | | | | | | | | | | |
Actual | | $ | 1,000 | | | $ | 1,106.00 | | | $ | 1.31 | | | | 0.25 | % | | $ | 4.86 | | | | 0.93 | % |
Hypothetical** | | $ | 1,000 | | | $ | 1,023.55 | | | $ | 1.25 | | | | 0.25 | % | | $ | 4.67 | | | | 0.93 | % |
| Class R | | | | | | | | | | | | |
Actual | | $ | 1,000 | | | $ | 1,103.30 | | | $ | 3.91 | | | | 0.75 | % | | $ | 7.46 | | | | 1.43 | % |
Hypothetical** | | $ | 1,000 | | | $ | 1,021.08 | | | $ | 3.76 | | | | 0.75 | % | | $ | 7.17 | | | | 1.43 | % |
| Class K | | | | | | | | | | | | |
Actual | | $ | 1,000 | | | $ | 1,104.00 | | | $ | 2.61 | | | | 0.50 | % | | $ | 6.16 | | | | 1.18 | % |
Hypothetical** | | $ | 1,000 | | | $ | 1,022.32 | | | $ | 2.51 | | | | 0.50 | % | | $ | 5.92 | | | | 1.18 | % |
| Class I | | | | | | | | | | | | |
Actual | | $ | 1,000 | | | $ | 1,106.60 | | | $ | 1.31 | | | | 0.25 | % | | $ | 4.86 | | | | 0.93 | % |
Hypothetical** | | $ | 1,000 | | | $ | 1,023.55 | | | $ | 1.25 | | | | 0.25 | % | | $ | 4.67 | | | | 0.93 | % |
| Class Z | | | | | | | | | | | | |
Actual | | $ | 1,000 | | | $ | 1,105.70 | | | $ | 1.31 | | | | 0.25 | % | | $ | 4.86 | | | | 0.93 | % |
Hypothetical** | | $ | 1,000 | | | $ | 1,023.55 | | | $ | 1.25 | | | | 0.25 | % | | $ | 4.67 | | | | 0.93 | % |
| | |
| abfunds.com | | AB MULTI-MANAGER SELECT RETIREMENT FUNDS | 53 |
EXPENSE EXAMPLE (continued)
(unaudited)
AB Multi-Manager Select 2055 Fund
| | | | | | | | | | | | | | | | | | | | | | | | |
| | | Beginning
Account
Value
February 1,
2017 | | | Ending
Account
Value
July 31,
2017 | | | Expenses
Paid
During
Period* | | | Annualized
Expense
Ratio* | | | Total
Expenses
Paid
During
Period+ | | | Total
Annualized
Expense
Ratio+ | |
| Class A | | | | | | | | | | | | |
Actual | | $ | 1,000 | | | $ | 1,105.10 | | | $ | 2.66 | | | | 0.51 | % | | $ | 6.21 | | | | 1.19 | % |
Hypothetical** | | $ | 1,000 | | | $ | 1,022.27 | | | $ | 2.56 | | | | 0.51 | % | | $ | 5.97 | | | | 1.19 | % |
| Class C | | | | | | | | | | | | |
Actual | | $ | 1,000 | | | $ | 1,100.80 | | | $ | 6.56 | | | | 1.26 | % | | $ | 10.11 | | | | 1.94 | % |
Hypothetical** | | $ | 1,000 | | | $ | 1,018.55 | | | $ | 6.31 | | | | 1.26 | % | | $ | 9.71 | | | | 1.94 | % |
| Advisor Class | | | | | | | | | | | | |
Actual | | $ | 1,000 | | | $ | 1,105.80 | | | $ | 1.36 | | | | 0.26 | % | | $ | 4.91 | | | | 0.94 | % |
Hypothetical** | | $ | 1,000 | | | $ | 1,023.51 | | | $ | 1.30 | | | | 0.26 | % | | $ | 4.72 | | | | 0.94 | % |
| Class R | | | | | | | | | | | | |
Actual | | $ | 1,000 | | | $ | 1,103.90 | | | $ | 3.96 | | | | 0.76 | % | | $ | 7.51 | | | | 1.44 | % |
Hypothetical** | | $ | 1,000 | | | $ | 1,021.03 | | | $ | 3.81 | | | | 0.76 | % | | $ | 7.22 | | | | 1.44 | % |
| Class K | | | | | | | | | | | | |
Actual | | $ | 1,000 | | | $ | 1,103.70 | | | $ | 2.66 | | | | 0.51 | % | | $ | 6.21 | | | | 1.19 | % |
Hypothetical** | | $ | 1,000 | | | $ | 1,022.27 | | | $ | 2.56 | | | | 0.51 | % | | $ | 5.97 | | | | 1.19 | % |
| Class I | | | | | | | | | | | | |
Actual | | $ | 1,000 | | | $ | 1,106.40 | | | $ | 1.36 | | | | 0.26 | % | | $ | 4.91 | | | | 0.94 | % |
Hypothetical** | | $ | 1,000 | | | $ | 1,023.51 | | | $ | 1.30 | | | | 0.26 | % | | $ | 4.72 | | | | 0.94 | % |
| Class Z | | | | | | | | | | | | |
Actual | | $ | 1,000 | | | $ | 1,105.40 | | | $ | 1.36 | | | | 0.26 | % | | $ | 4.91 | | | | 0.94 | % |
Hypothetical** | | $ | 1,000 | | | $ | 1,023.51 | | | $ | 1.30 | | | | 0.26 | % | | $ | 4.72 | | | | 0.94 | % |
| * | Expenses are equal to the classes’ annualized expense ratios multiplied by the average account value over the period, multiplied by 181/365 (to reflect the one-half year period). |
| ** | Assumes 5% annual return before expenses. |
| + | In connection with the Funds’ investments in affiliated/unaffiliated underlying portfolios, the Funds incur no direct expenses, but bear proportionate shares of the fees and expenses (i.e., operating, administrative and investment advisory fees) of the affiliated/unaffiliated underlying portfolios. The Funds’ total expenses are equal to the classes’ annualized expense ratio plus the Funds’ pro rata share of the weighted average expense ratio of the affiliated/unaffiliated underlying portfolios in which they invest, multiplied by the average account value over the period, multiplied by 181/365 (to reflect the one-half year period). |
| | |
| 54 | AB MULTI-MANAGER SELECT RETIREMENT FUNDS | | abfunds.com |
PORTFOLIO SUMMARY
AB MULTI-MANAGER SELECT RETIREMENT ALLOCATION FUND
July 31, 2017 (unaudited)
PORTFOLIO STATISTICS
Net Assets ($thousand): $9,474
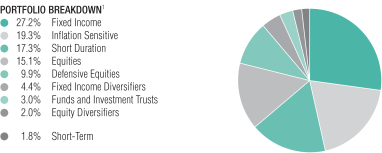
| 1 | All data are as of July 31, 2017. The Fund’s portfolio breakdown is expressed as a percentage of total investments, based on the Adviser’s internal classification. Underlying Portfolios may not invest 100% of their assets in the category to which the Underlying Portfolio is assigned. The percentages may vary over time. |
| | |
| abfunds.com | | AB MULTI-MANAGER SELECT RETIREMENT FUNDS | 55 |
PORTFOLIO SUMMARY
AB MULTI-MANAGER SELECT 2010 FUND
July 31, 2017 (unaudited)
PORTFOLIO STATISTICS
Net Assets ($thousand): $13,199
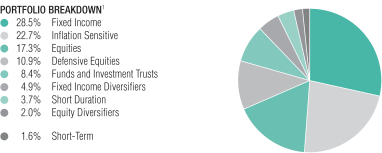
| 1 | All data are as of July 31, 2017. The Fund’s portfolio breakdown is expressed as a percentage of total investments, based on the Adviser’s internal classification. Underlying Portfolios may not invest 100% of their assets in the category to which the Underlying Portfolio is assigned. The percentages may vary over time. |
| | |
| 56 | AB MULTI-MANAGER SELECT RETIREMENT FUNDS | | abfunds.com |
PORTFOLIO SUMMARY
AB MULTI-MANAGER SELECT 2015 FUND
July 31, 2017 (unaudited)
PORTFOLIO STATISTICS
Net Assets ($thousand): $42,069
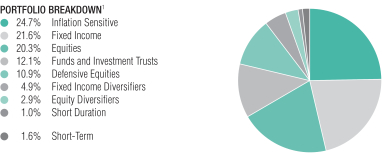
| 1 | All data are as of July 31, 2017. The Fund’s portfolio breakdown is expressed as a percentage of total investments, based on the Adviser’s internal classification. Underlying Portfolios may not invest 100% of their assets in the category to which the Underlying Portfolio is assigned. The percentages may vary over time. |
| | |
| abfunds.com | | AB MULTI-MANAGER SELECT RETIREMENT FUNDS | 57 |
PORTFOLIO SUMMARY
AB MULTI-MANAGER SELECT 2020 FUND
July 31, 2017 (unaudited)
PORTFOLIO STATISTICS
Net Assets ($thousand): $93,551
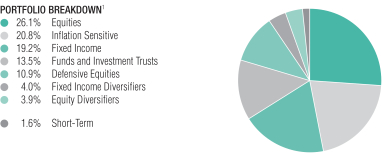
| 1 | All data are as of July 31, 2017. The Fund’s portfolio breakdown is expressed as a percentage of total investments, based on the Adviser’s internal classification. Underlying Portfolios may not invest 100% of their assets in the category to which the Underlying Portfolio is assigned. The percentages may vary over time. |
| | |
| 58 | AB MULTI-MANAGER SELECT RETIREMENT FUNDS | | abfunds.com |
PORTFOLIO SUMMARY
AB MULTI-MANAGER SELECT 2025 FUND
July 31, 2017 (unaudited)
PORTFOLIO STATISTICS
Net Assets ($thousand): $132,644
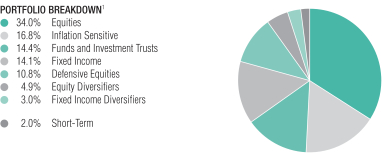
| 1 | All data are as of July 31, 2017. The Fund’s portfolio breakdown is expressed as a percentage of total investments, based on the Adviser’s internal classification. Underlying Portfolios may not invest 100% of their assets in the category to which the Underlying Portfolio is assigned. The percentages may vary over time. |
| | |
| abfunds.com | | AB MULTI-MANAGER SELECT RETIREMENT FUNDS | 59 |
PORTFOLIO SUMMARY
AB MULTI-MANAGER SELECT 2030 FUND
July 31, 2017 (unaudited)
PORTFOLIO STATISTICS
Net Assets ($thousand): $101,761
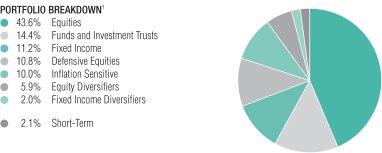
| 1 | All data are as of July 31, 2017. The Fund’s portfolio breakdown is expressed as a percentage of total investments, based on the Adviser’s internal classification. Underlying Portfolios may not invest 100% of their assets in the category to which the Underlying Portfolio is assigned. The percentages may vary over time. |
| | |
| 60 | AB MULTI-MANAGER SELECT RETIREMENT FUNDS | | abfunds.com |
PORTFOLIO SUMMARY
AB MULTI-MANAGER SELECT 2035 FUND
July 31, 2017 (unaudited)
PORTFOLIO STATISTICS
Net Assets ($thousand): $91,499
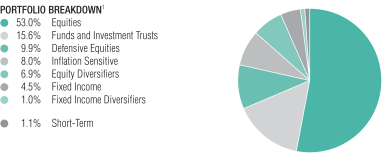
| 1 | All data are as of July 31, 2017. The Fund’s portfolio breakdown is expressed as a percentage of total investments, based on the Adviser’s internal classification. Underlying Portfolios may not invest 100% of their assets in the category to which the Underlying Portfolio is assigned. The percentages may vary over time. |
| | |
| abfunds.com | | AB MULTI-MANAGER SELECT RETIREMENT FUNDS | 61 |
PORTFOLIO SUMMARY
AB MULTI-MANAGER SELECT 2040 FUND
July 31, 2017 (unaudited)
PORTFOLIO STATISTICS
Net Assets ($thousand): $64,562
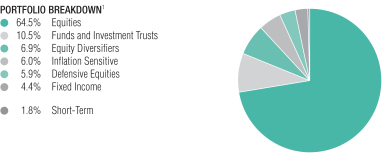
| 1 | All data are as of July 31, 2017. The Fund’s portfolio breakdown is expressed as a percentage of total investments, based on the Adviser’s internal classification. Underlying Portfolios may not invest 100% of their assets in the category to which the Underlying Portfolio is assigned. The percentages may vary over time. |
| | |
| 62 | AB MULTI-MANAGER SELECT RETIREMENT FUNDS | | abfunds.com |
PORTFOLIO SUMMARY
AB MULTI-MANAGER SELECT 2045 FUND
July 31, 2017 (unaudited)
PORTFOLIO STATISTICS
Net Assets ($thousand): $54,432
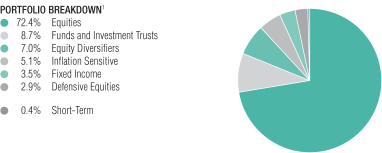
| 1 | All data are as of July 31, 2017. The Fund’s portfolio breakdown is expressed as a percentage of total investments, based on the Adviser’s internal classification. Underlying Portfolios may not invest 100% of their assets in the category to which the Underlying Portfolio is assigned. The percentages may vary over time. |
| | |
| abfunds.com | | AB MULTI-MANAGER SELECT RETIREMENT FUNDS | 63 |
PORTFOLIO SUMMARY
AB MULTI-MANAGER SELECT 2050 FUND
July 31, 2017 (unaudited)
PORTFOLIO STATISTICS
Net Assets ($thousand): $21,857
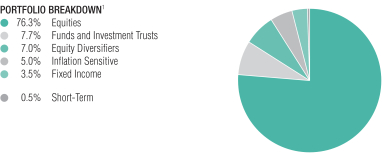
| 1 | All data are as of July 31, 2017. The Fund’s portfolio breakdown is expressed as a percentage of total investments, based on the Adviser’s internal classification. Underlying Portfolios may not invest 100% of their assets in the category to which the Underlying Portfolio is assigned. The percentages may vary over time. |
| | |
| 64 | AB MULTI-MANAGER SELECT RETIREMENT FUNDS | | abfunds.com |
PORTFOLIO SUMMARY
AB MULTI-MANAGER SELECT 2055 FUND
July 31, 2017 (unaudited)
PORTFOLIO STATISTICS
Net Assets ($thousand): $25,411

| 1 | All data are as of July 31, 2017. The Fund’s portfolio breakdown is expressed as a percentage of total investments, based on the Adviser’s internal classification. Underlying Portfolios may not invest 100% of their assets in the category to which the Underlying Portfolio is assigned. The percentages may vary over time. |
| | |
| abfunds.com | | AB MULTI-MANAGER SELECT RETIREMENT FUNDS | 65 |
PORTFOLIO OF INVESTMENTS
AB MULTI-MANAGER SELECT RETIREMENT ALLOCATION FUND
July 31, 2017
| | | | | | | | |
| Company | | Shares | | | U.S. $ Value | |
| |
| | | | | | | | |
INVESTMENT COMPANIES – 100.3% | | | | | | | | |
Funds and Investment Trusts – 100.3%(a) | | | | | | | | |
AB All Market Real Return Portfolio – Class Z | | | 28,673 | | | $ | 244,583 | |
AB Bond Inflation Strategy Portfolio – Class Z | | | 52,977 | | | | 569,503 | |
AB Concentrated Growth Fund – Class Z(b) | | | 2,891 | | | | 96,321 | |
AB Global Bond Fund, Inc. – Class Z | | | 22,649 | | | | 191,161 | |
AB Global Real Estate Investment Fund II – Class I | | | 30,245 | | | | 333,605 | |
AB High Income Fund, Inc. – Class Z | | | 26,583 | | | | 238,180 | |
AB Intermediate Bond Portfolio – Class Z | | | 67,893 | | | | 757,685 | |
AB Relative Value Fund – Class Z | | | 62,771 | | | | 381,022 | |
AB Unconstrained Bond Fund, Inc. – Class Z | | | 32,356 | | | | 281,818 | |
AQR International Defensive Style Fund – Class R6 | | | 22,352 | | | | 292,362 | |
AQR Large Cap Defensive Style Fund – Class R6 | | | 21,339 | | | | 382,614 | |
AQR Long-Short Equity Fund – Class R6 | | | 13,418 | | | | 189,059 | |
AQR Risk-Balanced Commodities Fund – Class R6 | | | 23,702 | | | | 150,511 | |
AQR Style Premia Alternative Fund – Class R6 | | | 14,192 | | | | 147,174 | |
Baird Short Term Bond Fund | | | 106,743 | | | | 1,036,472 | |
Franklin Growth Fund – Class R6 | | | 1,099 | | | | 97,841 | |
iShares Russell 2000 ETF | | | 493 | | | | 69,764 | |
Metropolitan West Total Return Bond Fund | | | 65,802 | | | | 660,649 | |
MFS Institutional International Equity Fund | | | 2,591 | | | | 63,467 | |
MFS Value Fund – Class R5 | | | 2,399 | | | | 94,179 | |
T. Rowe Price Dividend Growth Fund, Inc. | | | 6,961 | | | | 284,827 | |
T. Rowe Price Inflation Protected Bond Fund, Inc. | | | 47,963 | | | | 569,800 | |
T. Rowe Price Institutional Long Duration Credit Fund | | | 26,992 | | | | 287,469 | |
T. Rowe Price International Funds – International Discovery Fund | | | 1,497 | | | | 99,243 | |
T. Rowe Price Small-Cap Value Fund, Inc. – Class I | | | 2,038 | | | | 96,156 | |
Templeton Global Bond Fund – Class R6 | | | 11,497 | | | | 138,878 | |
Vanguard FTSE Developed Markets ETF | | | 7,790 | | | | 331,153 | |
Vanguard FTSE Emerging Markets ETF | | | 1,114 | | | | 47,913 | |
Vanguard Short-Term Bond ETF | | | 7,958 | | | | 636,799 | |
Vanguard Total Bond Market ETF | | | 7,281 | | | | 596,969 | |
WisdomTree Europe Hedged Equity Fund | | | 2,216 | | | | 137,414 | |
| | | | | | | | |
| | |
Total Investment Companies
(cost $9,100,043) | | | | | | | 9,504,591 | |
| | | | | | | | |
| | |
SHORT-TERM INVESTMENTS – 1.9% | | | | | | | | |
Investment Companies – 1.9% | | | | | | | | |
AB Fixed Income Shares, Inc. – Government Money Market Portfolio – Class AB, 0.86%(a)(c)
(cost $177,962) | | | 177,962 | | | | 177,962 | |
| | | | | | | | |
| | |
Total Investments – 102.2%
(cost $9,278,005) | | | | | | | 9,682,553 | |
Other assets less liabilities – (2.2)% | | | | | | | (208,088 | ) |
| | | | | | | | |
| | |
Net Assets – 100.0% | | | | | | $ | 9,474,465 | |
| | | | | | | | |
| | |
| 66 | AB MULTI-MANAGER SELECT RETIREMENT FUNDS | | abfunds.com |
PORTFOLIO OF INVESTMENTS (continued)
AB MULTI-MANAGER SELECT RETIREMENT ALLOCATION FUND
| (a) | To obtain a copy of the fund’s shareholder report, please go to the Securities and Exchange Commission’s website at www.sec.gov. Additionally, shareholder reports for AB funds can be obtained by calling AB at (800) 227-4618. |
| (b) | Non-income producing security. |
| (c) | Investment in affiliated money market mutual fund. The rate shown represents the 7-day yield as of period end. |
Glossary:
ETF – Exchange Traded Fund
FTSE – Financial Times Stock Exchange
See notes to financial statements.
| | |
| abfunds.com | | AB MULTI-MANAGER SELECT RETIREMENT FUNDS | 67 |
PORTFOLIO OF INVESTMENTS
AB MULTI-MANAGER SELECT 2010 FUND
July 31, 2017
| | | | | | | | |
| Company | | Shares | | | U.S. $ Value | |
| |
| | | | | | | | |
INVESTMENT COMPANIES – 100.4% | | | | | | | | |
Funds and Investment Trusts – 100.4%(a) | | | | | | | | |
AB All Market Real Return Portfolio – Class Z | | | 46,764 | | | $ | 398,899 | |
AB Bond Inflation Strategy Portfolio – Class Z | | | 98,866 | | | | 1,062,809 | |
AB Global Bond Fund, Inc. – Class Z | | | 62,740 | | | | 529,526 | |
AB Global Real Estate Investment Fund II – Class I | | | 48,048 | | | | 529,970 | |
AB High Income Fund, Inc. – Class Z | | | 33,983 | | | | 304,485 | |
AB Intermediate Bond Portfolio – Class Z | | | 71,273 | | | | 795,407 | |
AB Relative Value Fund – Class Z | | | 87,879 | | | | 533,424 | |
AB Unconstrained Bond Fund, Inc. – Class Z | | | 29,956 | | | | 260,918 | |
AQR International Defensive Style Fund – Class R6 | | | 30,952 | | | | 404,857 | |
AQR Large Cap Defensive Style Fund – Class R6 | | | 29,776 | | | | 533,876 | |
AQR Long-Short Equity Fund – Class R6 | | | 18,833 | | | | 265,355 | |
AQR Risk-Balanced Commodities Fund – Class R6 | | | 42,135 | | | | 267,560 | |
AQR Style Premia Alternative Fund – Class R6 | | | 38,971 | | | | 404,129 | |
Baird Short Term Bond Fund | | | 50,974 | | | | 494,959 | |
Franklin Growth Fund – Class R6 | | | 2,969 | | | | 264,245 | |
iShares Core S&P 500 ETF | | | 3,058 | | | | 759,791 | |
iShares Russell 2000 ETF | | | 948 | | | | 134,152 | |
Metropolitan West Total Return Bond Fund | | | 105,237 | | | | 1,056,576 | |
MFS Institutional International Equity Fund | | | 3,551 | | | | 87,006 | |
MFS Value Fund – Class R5 | | | 3,351 | | | | 131,542 | |
T. Rowe Price Dividend Growth Fund, Inc. | | | 12,969 | | | | 530,704 | |
T. Rowe Price Emerging Markets Stock Fund | | | 3,269 | | | | 132,603 | |
T. Rowe Price Inflation Protected Bond Fund, Inc. | | | 66,847 | | | | 794,143 | |
T. Rowe Price Institutional Long Duration Credit Fund | | | 24,913 | | | | 265,325 | |
T. Rowe Price International Funds – International Discovery Fund | | | 2,003 | | | | 132,816 | |
T. Rowe Price Small-Cap Value Fund, Inc. – Class I | | | 2,843 | | | | 134,156 | |
Templeton Global Bond Fund – Class R6 | | | 13,361 | | | | 161,401 | |
Vanguard FTSE Developed Markets ETF | | | 13,755 | | | | 584,725 | |
Vanguard FTSE Emerging Markets ETF | | | 1,548 | | | | 66,579 | |
Vanguard Total Bond Market ETF | | | 12,546 | | | | 1,028,647 | |
WisdomTree Europe Hedged Equity Fund | | | 3,185 | | | | 197,502 | |
| | | | | | | | |
| | |
Total Investment Companies
(cost $12,528,686) | | | | | | | 13,248,087 | |
| | | | | | | | |
| | |
SHORT-TERM INVESTMENTS – 1.6% | | | | | | | | |
Investment Companies – 1.6% | | | | | | | | |
AB Fixed Income Shares, Inc. – Government Money Market Portfolio – Class AB, 0.86%(a)(b)
(cost $217,830) | | | 217,830 | | | | 217,830 | |
| | | | | | | | |
| | |
Total Investments – 102.0%
(cost $12,746,516) | | | | | | | 13,465,917 | |
Other assets less liabilities – (2.0)% | | | | | | | (266,823 | ) |
| | | | | | | | |
| | |
Net Assets – 100.0% | | | | | | $ | 13,199,094 | |
| | | | | | | | |
| | |
| 68 | AB MULTI-MANAGER SELECT RETIREMENT FUNDS | | abfunds.com |
PORTFOLIO OF INVESTMENTS (continued)
AB MULTI-MANAGER SELECT 2010 FUND
| (a) | To obtain a copy of the fund’s shareholder report, please go to the Securities and Exchange Commission’s website at www.sec.gov. Additionally, shareholder reports for AB funds can be obtained by calling AB at (800) 227-4618. |
| (b) | Investment in affiliated money market mutual fund. The rate shown represents the 7-day yield as of period end. |
Glossary:
ETF – Exchange Traded Fund
FTSE – Financial Times Stock Exchange
See notes to financial statements.
| | |
| abfunds.com | | AB MULTI-MANAGER SELECT RETIREMENT FUNDS | 69 |
PORTFOLIO OF INVESTMENTS
AB MULTI-MANAGER SELECT 2015 FUND
July 31, 2017
| | | | | | | | |
| Company | | Shares | | | U.S. $ Value | |
| |
| | | | | | | | |
INVESTMENT COMPANIES – 100.0% | | | | | | | | |
Funds and Investment Trusts – 100.0%(a) | | | | | | | | |
AB All Market Real Return Portfolio – Class Z | | | 151,331 | | | $ | 1,290,852 | |
AB Bond Inflation Strategy Portfolio – Class Z | | | 312,152 | | | | 3,355,631 | |
AB Discovery Value Fund – Class Z | | | 19,552 | | | | 427,788 | |
AB Global Bond Fund, Inc. – Class Z | | | 198,271 | | | | 1,673,405 | |
AB Global Real Estate Investment Fund II – Class I | | | 153,541 | | | | 1,693,554 | |
AB High Income Fund, Inc. – Class Z | | | 189,191 | | | | 1,695,152 | |
AB Intermediate Bond Portfolio – Class Z | | | 188,357 | | | | 2,102,065 | |
AB Relative Value Fund – Class Z | | | 139,160 | | | | 844,698 | |
AB Unconstrained Bond Fund, Inc. – Class Z | | | 95,705 | | | | 833,592 | |
AQR International Defensive Style Fund – Class R6 | | | 97,327 | | | | 1,273,035 | |
AQR Large Cap Defensive Style Fund – Class R6 | | | 94,277 | | | | 1,690,395 | |
AQR Long-Short Equity Fund – Class R6 | | | 89,522 | | | | 1,261,364 | |
AQR Risk-Balanced Commodities Fund – Class R6 | | | 206,011 | | | | 1,308,172 | |
AQR Style Premia Alternative Fund – Class R6 | | | 122,549 | | | | 1,270,837 | |
Baird Short Term Bond Fund | | | 43,048 | | | | 417,997 | |
Franklin Growth Fund – Class R6 | | | 9,398 | | | | 836,387 | |
iShares Core S&P 500 ETF | | | 11,371 | | | | 2,825,239 | |
iShares Russell 2000 ETF | | | 2,985 | | | | 422,407 | |
Metropolitan West Total Return Bond Fund | | | 207,985 | | | | 2,088,173 | |
MFS Institutional International Equity Fund | | | 28,868 | | | | 707,273 | |
MFS Value Fund – Class R5 | | | 31,970 | | | | 1,254,821 | |
T. Rowe Price Dividend Growth Fund, Inc. | | | 41,205 | | | | 1,686,125 | |
T. Rowe Price Emerging Markets Stock Fund | | | 20,757 | | | | 842,113 | |
T. Rowe Price Inflation Protected Bond Fund, Inc. | | | 246,854 | | | | 2,932,630 | |
T. Rowe Price Institutional Long Duration Credit Fund | | | 78,638 | | | | 837,491 | |
T. Rowe Price International Funds – International Discovery Fund | | | 6,530 | | | | 432,929 | |
T. Rowe Price Small-Cap Value Fund, Inc. – Class I | | | 9,032 | | | | 426,216 | |
Templeton Global Bond Fund – Class R6 | | | 34,708 | | | | 419,275 | |
Vanguard FTSE Developed Markets ETF | | | 53,931 | | | | 2,292,607 | |
Vanguard FTSE Emerging Markets ETF | | | 4,915 | | | | 211,394 | |
Vanguard Total Bond Market ETF | | | 25,695 | | | | 2,106,733 | |
WisdomTree Europe Hedged Equity Fund | | | 10,093 | | | | 625,867 | |
| | | | | | | | |
| | |
Total Investment Companies
(cost $39,296,978) | | | | | | | 42,086,217 | |
| | | | | | | | |
| | |
SHORT-TERM INVESTMENTS – 1.7% | | | | | | | | |
Investment Companies – 1.7% | | | | | | | | |
AB Fixed Income Shares, Inc. – Government Money Market Portfolio – Class AB, 0.86%(a)(b)
(cost $693,106) | | | 693,106 | | | | 693,106 | |
| | | | | | | | |
| | |
Total Investments – 101.7%
(cost $39,990,084) | | | | | | | 42,779,323 | |
Other assets less liabilities – (1.7)% | | | | | | | (710,299 | ) |
| | | | | | | | |
| | |
Net Assets – 100.0% | | | | | | $ | 42,069,024 | |
| | | | | | | | |
| | |
| 70 | AB MULTI-MANAGER SELECT RETIREMENT FUNDS | | abfunds.com |
PORTFOLIO OF INVESTMENTS (continued)
AB MULTI-MANAGER SELECT 2015 FUND
| (a) | To obtain a copy of the fund’s shareholder report, please go to the Securities and Exchange Commission’s website at www.sec.gov. Additionally, shareholder reports for AB funds can be obtained by calling AB at (800) 227-4618. |
| (b) | Investment in affiliated money market mutual fund. The rate shown represents the 7-day yield as of period end. |
Glossary:
ETF – Exchange Traded Fund
FTSE – Financial Times Stock Exchange
See notes to financial statements.
| | |
| abfunds.com | | AB MULTI-MANAGER SELECT RETIREMENT FUNDS | 71 |
PORTFOLIO OF INVESTMENTS
AB MULTI-MANAGER SELECT 2020 FUND
July 31, 2017
| | | | | | | | |
| Company | | Shares | | | U.S. $ Value | |
| |
| | | | | | | | |
INVESTMENT COMPANIES – 99.9% | | | | | | | | |
Funds and Investment Trusts – 99.9%(a) | | | | | | | | |
AB All Market Real Return Portfolio – Class Z | | | 329,882 | | | $ | 2,813,890 | |
AB Bond Inflation Strategy Portfolio – Class Z | | | 524,514 | | | | 5,638,531 | |
AB Discovery Value Fund – Class Z | | | 42,490 | | | | 929,691 | |
AB Global Bond Fund, Inc. – Class Z | | | 331,021 | | | | 2,793,817 | |
AB Global Real Estate Investment Fund II – Class I | | | 338,937 | | | | 3,738,472 | |
AB High Income Fund, Inc. – Class Z | | | 523,560 | | | | 4,691,100 | |
AB Intermediate Bond Portfolio – Class Z | | | 421,074 | | | | 4,699,182 | |
AB Relative Value Fund – Class Z | | | 768,601 | | | | 4,665,406 | |
AB Unconstrained Bond Fund, Inc. – Class Z | | | 109,132 | | | | 950,539 | |
AQR International Defensive Style Fund – Class R6 | | | 215,570 | | | | 2,819,656 | |
AQR Large Cap Defensive Style Fund – Class R6 | | | 208,384 | | | | 3,736,326 | |
AQR Long-Short Equity Fund – Class R6 | | | 266,239 | | | | 3,751,313 | |
AQR Risk-Balanced Commodities Fund – Class R6 | | | 445,861 | | | | 2,831,219 | |
AQR Style Premia Alternative Fund – Class R6 | | | 276,392 | | | | 2,866,185 | |
Franklin Growth Fund – Class R6 | | | 21,257 | | | | 1,891,852 | |
iShares Core S&P 500 ETF | | | 27,034 | | | | 6,716,868 | |
iShares Russell 2000 ETF | | | 6,555 | | | | 927,598 | |
Metropolitan West Total Return Bond Fund | | | 373,428 | | | | 3,749,214 | |
MFS Institutional International Equity Fund | | | 101,809 | | | | 2,494,328 | |
MFS Value Fund – Class R5 | | | 71,036 | | | | 2,788,172 | |
T. Rowe Price Dividend Growth Fund, Inc. | | | 91,793 | | | | 3,756,171 | |
T. Rowe Price Emerging Markets Stock Fund | | | 46,124 | | | | 1,871,232 | |
T. Rowe Price Inflation Protected Bond Fund, Inc. | | | 395,313 | | | | 4,696,312 | |
T. Rowe Price Institutional Long Duration Credit Fund | | | 177,151 | | | | 1,886,660 | |
T. Rowe Price International Funds – International Discovery Fund | | | 28,892 | | | | 1,915,563 | |
T. Rowe Price Small-Cap Value Fund, Inc. – Class I | | | 19,632 | | | | 926,424 | |
Templeton Global Bond Fund – Class R6 | | | 152,809 | | | | 1,845,934 | |
Vanguard FTSE Developed Markets ETF | | | 141,141 | | | | 5,999,904 | |
Vanguard FTSE Emerging Markets ETF | | | 10,923 | | | | 469,798 | |
Vanguard Total Bond Market ETF | | | 39,966 | | | | 3,276,812 | |
WisdomTree Europe Hedged Equity Fund | | | 21,544 | | | | 1,335,943 | |
| | | | | | | | |
| | |
Total Investment Companies
(cost $86,851,121) | | | | | | | 93,474,112 | |
| | | | | | | | |
| | |
SHORT-TERM INVESTMENTS – 1.7% | | | | | | | | |
Investment Companies – 1.7% | | | | | | | | |
AB Fixed Income Shares, Inc. – Government Money Market Portfolio – Class AB, 0.86%(a)(b)
(cost $1,552,631) | | | 1,552,631 | | | | 1,552,631 | |
| | | | | | | | |
| | |
Total Investments – 101.6%
(cost $88,403,752) | | | | | | | 95,026,743 | |
Other assets less liabilities – (1.6)% | | | | | | | (1,475,501 | ) |
| | | | | | | | |
| | |
Net Assets – 100.0% | | | | | | $ | 93,551,242 | |
| | | | | | | | |
| | |
| 72 | AB MULTI-MANAGER SELECT RETIREMENT FUNDS | | abfunds.com |
PORTFOLIO OF INVESTMENTS (continued)
AB MULTI-MANAGER SELECT 2020 FUND
| (a) | To obtain a copy of the fund’s shareholder report, please go to the Securities and Exchange Commission’s website at www.sec.gov. Additionally, shareholder reports for AB funds can be obtained by calling AB at (800) 227-4618. |
| (b) | Investment in affiliated money market mutual fund. The rate shown represents the 7-day yield as of period end. |
Glossary:
ETF – Exchange Traded Fund
FTSE – Financial Times Stock Exchange
See notes to financial statements.
| | |
| abfunds.com | | AB MULTI-MANAGER SELECT RETIREMENT FUNDS | 73 |
PORTFOLIO OF INVESTMENTS
AB MULTI-MANAGER SELECT 2025 FUND
July 31, 2017
| | | | | | | | |
| Company | | Shares | | | U.S. $ Value | |
| |
| | | | | | | | |
INVESTMENT COMPANIES – 99.7% | | | | | | | | |
Funds and Investment Trusts – 99.7%(a) | | | | | | | | |
AB All Market Real Return Portfolio – Class Z | | | 319,685 | | | $ | 2,726,910 | |
AB Bond Inflation Strategy Portfolio – Class Z | | | 366,314 | | | | 3,937,879 | |
AB Concentrated Growth Fund – Class Z(b) | | | 118,376 | | | | 3,944,279 | |
AB Discovery Growth Fund, Inc. – Class Z(b) | | | 122,586 | | | | 1,311,669 | |
AB Discovery Value Fund – Class Z | | | 59,458 | | | | 1,300,949 | |
AB Global Bond Fund, Inc. – Class Z | | | 466,899 | | | | 3,940,630 | |
AB Global Real Estate Investment Fund II – Class I | | | 600,354 | | | | 6,621,902 | |
AB High Income Fund, Inc. – Class Z | | | 887,195 | | | | 7,949,267 | |
AB Intermediate Bond Portfolio – Class Z | | | 354,535 | | | | 3,956,616 | |
AB Relative Value Fund – Class Z | | | 1,308,184 | | | | 7,940,676 | |
AQR International Defensive Style Fund – Class R6 | | | 304,181 | | | | 3,978,689 | |
AQR Large Cap Defensive Style Fund – Class R6 | | | 293,974 | | | | 5,270,949 | |
AQR Long-Short Equity Fund – Class R6 | | | 472,350 | | | | 6,655,419 | |
AQR Risk-Balanced Commodities Fund – Class R6 | | | 864,945 | | | | 5,492,401 | |
AQR Style Premia Alternative Fund – Class R6 | | | 388,958 | | | | 4,033,491 | |
Franklin Growth Fund – Class R6 | | | 44,691 | | | | 3,977,459 | |
iShares Core S&P 500 ETF | | | 33,164 | | | | 8,239,927 | |
iShares Russell 2000 ETF | | | 9,367 | | | | 1,325,524 | |
Metropolitan West Total Return Bond Fund | | | 125,670 | | | | 1,261,729 | |
MFS Institutional International Equity Fund | | | 198,455 | | | | 4,862,160 | |
MFS Value Fund – Class R5 | | | 133,604 | | | | 5,243,953 | |
T. Rowe Price Dividend Growth Fund, Inc. | | | 128,533 | | | | 5,259,556 | |
T. Rowe Price Emerging Markets Stock Fund | | | 65,450 | | | | 2,655,302 | |
T. Rowe Price Inflation Protected Bond Fund, Inc. | | | 329,367 | | | | 3,912,880 | |
T. Rowe Price Institutional Long Duration Credit Fund | | | 243,708 | | | | 2,595,489 | |
T. Rowe Price International Funds – International Discovery Fund | | | 40,738 | | | | 2,700,958 | |
T. Rowe Price Small-Cap Value Fund, Inc. – Class I | | | 27,602 | | | | 1,302,534 | |
Templeton Global Bond Fund – Class R6 | | | 214,208 | | | | 2,587,629 | |
Vanguard FTSE Developed Markets ETF | | | 232,962 | | | | 9,903,215 | |
Vanguard FTSE Emerging Markets ETF | | | 15,500 | | | | 666,655 | |
Vanguard Total Bond Market ETF | | | 56,712 | | | | 4,649,817 | |
WisdomTree Europe Hedged Equity Fund | | | 31,420 | | | | 1,948,354 | |
| | | | | | | | |
| | |
Total Investment Companies
(cost $121,069,825) | | | | | | | 132,154,867 | |
| | | | | | | | |
| | |
| 74 | AB MULTI-MANAGER SELECT RETIREMENT FUNDS | | abfunds.com |
PORTFOLIO OF INVESTMENTS (continued)
AB MULTI-MANAGER SELECT 2025 FUND
| | | | | | | | |
| Company | | Shares | | | U.S. $ Value | |
| |
| | | | | | | | |
SHORT-TERM INVESTMENTS – 2.0% | | | | | | | | |
Investment Companies – 2.0% | | | | | | | | |
AB Fixed Income Shares, Inc. – Government Money Market Portfolio – Class AB, 0.86%(a)(c)
(cost $2,693,003) | | | 2,693,003 | | | $ | 2,693,003 | |
| | | | | | | | |
| | |
Total Investments – 101.7%
(cost $123,762,828) | | | | | | | 134,847,870 | |
Other assets less liabilities – (1.7)% | | | | | | | (2,203,958 | ) |
| | | | | | | | |
| | |
Net Assets – 100.0% | | | | | | $ | 132,643,912 | |
| | | | | | | | |
| (a) | To obtain a copy of the fund’s shareholder report, please go to the Securities and Exchange Commission’s website at www.sec.gov. Additionally, shareholder reports for AB funds can be obtained by calling AB at (800) 227-4618. |
| (b) | Non-income producing security. |
| (c) | Investment in affiliated money market mutual fund. The rate shown represents the 7-day yield as of period end. |
Glossary:
ETF – Exchange Traded Fund
FTSE – Financial Times Stock Exchange
See notes to financial statements.
| | |
| abfunds.com | | AB MULTI-MANAGER SELECT RETIREMENT FUNDS | 75 |
PORTFOLIO OF INVESTMENTS
AB MULTI-MANAGER SELECT 2030 FUND
July 31, 2017
| | | | | | | | |
| Company | | Shares | | | U.S. $ Value | |
| |
| | | | | | | | |
INVESTMENT COMPANIES – 99.6% | | | | | | | | |
Funds and Investment Trusts – 99.6%(a) | | | | | | | | |
AB All Market Real Return Portfolio – Class Z | | | 118,342 | | | $ | 1,009,460 | |
AB Concentrated Growth Fund – Class Z(b) | | | 90,140 | | | | 3,003,480 | |
AB Discovery Growth Fund, Inc. – Class Z(b) | | | 92,466 | | | | 989,388 | |
AB Discovery Value Fund – Class Z | | | 92,012 | | | | 2,013,219 | |
AB Global Bond Fund, Inc. – Class Z | | | 358,317 | | | | 3,024,197 | |
AB Global Real Estate Investment Fund II – Class I | | | 373,326 | | | | 4,117,782 | |
AB High Income Fund, Inc. – Class Z | | | 685,617 | | | | 6,143,124 | |
AB Intermediate Bond Portfolio – Class Z | | | 272,345 | | | | 3,039,364 | |
AB Relative Value Fund – Class Z | | | 1,677,039 | | | | 10,179,629 | |
AQR International Defensive Style Fund – Class R6 | | | 231,846 | | | | 3,032,551 | |
AQR Large Cap Defensive Style Fund – Class R6 | | | 283,956 | | | | 5,091,328 | |
AQR Long-Short Equity Fund – Class R6 | | | 434,240 | | | | 6,118,440 | |
AQR Risk-Balanced Commodities Fund – Class R6 | | | 666,258 | | | | 4,230,739 | |
AQR Style Premia Alternative Fund – Class R6 | | | 194,660 | | | | 2,018,627 | |
Franklin Growth Fund – Class R6 | | | 33,716 | | | | 3,000,754 | |
iShares Core S&P 500 ETF | | | 21,171 | | | | 5,260,147 | |
iShares Russell 2000 ETF | | | 7,079 | | | | 1,001,749 | |
Metropolitan West Total Return Bond Fund | | | 96,908 | | | | 972,957 | |
MFS Institutional International Equity Fund | | | 235,814 | | | | 5,777,435 | |
MFS Value Fund – Class R5 | | | 155,431 | | | | 6,100,646 | |
T. Rowe Price Dividend Growth Fund, Inc. | | | 73,866 | | | | 3,022,590 | |
T. Rowe Price Emerging Markets Stock Fund | | | 50,241 | | | | 2,038,275 | |
T. Rowe Price Inflation Protected Bond Fund, Inc. | | | 85,859 | | | | 1,020,007 | |
T. Rowe Price International Funds – International Discovery Fund | | | 30,710 | | | | 2,036,090 | |
T. Rowe Price Small-Cap Value Fund, Inc. – Class I | | | 21,021 | | | | 991,979 | |
Templeton Global Bond Fund – Class R6 | | | 163,880 | | | | 1,979,671 | |
Vanguard FTSE Developed Markets ETF | | | 201,976 | | | | 8,586,000 | |
Vanguard FTSE Emerging Markets ETF | | | 35,694 | | | | 1,535,199 | |
Vanguard Total Bond Market ETF | | | 31,094 | | | | 2,549,397 | |
WisdomTree Europe Hedged Equity Fund | | | 23,808 | | | | 1,476,334 | |
| | | | | | | | |
| | |
Total Investment Companies
(cost $92,571,553) | | | | | | | 101,360,558 | |
| | | | | | | | |
| | | | | | | | |
SHORT-TERM INVESTMENTS – 2.1% | | | | | | | | |
Investment Companies – 2.1% | | | | | | | | |
AB Fixed Income Shares, Inc. – Government Money Market Portfolio – Class AB, 0.86%(a)(c)
(cost $2,156,165) | | | 2,156,165 | | | | 2,156,165 | |
| | | | | | | | |
| | |
Total Investments – 101.7%
(cost $94,727,718) | | | | | | | 103,516,723 | |
Other assets less liabilities – (1.7)% | | | | | | | (1,755,474 | ) |
| | | | | | | | |
| | |
Net Assets – 100.0% | | | | | | $ | 101,761,249 | |
| | | | | | | | |
| | |
| 76 | AB MULTI-MANAGER SELECT RETIREMENT FUNDS | | abfunds.com |
PORTFOLIO OF INVESTMENTS (continued)
AB MULTI-MANAGER SELECT 2030 FUND
| (a) | To obtain a copy of the fund’s shareholder report, please go to the Securities and Exchange Commission’s website at www.sec.gov. Additionally, shareholder reports for AB funds can be obtained by calling AB at (800) 227-4618. |
| (b) | Non-income producing security. |
| (c) | Investment in affiliated money market mutual fund. The rate shown represents the 7-day yield as of period end. |
Glossary:
ETF – Exchange Traded Fund
FTSE – Financial Times Stock Exchange
See notes to financial statements.
| | |
| abfunds.com | | AB MULTI-MANAGER SELECT RETIREMENT FUNDS | 77 |
PORTFOLIO OF INVESTMENTS
AB MULTI-MANAGER SELECT 2035 FUND
July 31, 2017
| | | | | | | | |
| Company | | Shares | | | U.S. $ Value | |
| |
| | | | | | | | |
INVESTMENT COMPANIES – 99.5% | | | | | | | | |
Funds and Investment Trusts – 99.5%(a) | | | | | | | | |
AB All Market Real Return Portfolio – Class Z | | | 106,732 | | | $ | 910,424 | |
AB Concentrated Growth Fund – Class Z(b) | | | 135,304 | | | | 4,508,326 | |
AB Discovery Growth Fund, Inc. – Class Z(b) | | | 84,397 | | | | 903,051 | |
AB Discovery Value Fund – Class Z | | | 83,335 | | | | 1,823,364 | |
AB Global Real Estate Investment Fund II – Class I | | | 329,918 | | | | 3,638,991 | |
AB High Income Fund, Inc. – Class Z | | | 613,794 | | | | 5,499,597 | |
AB Intermediate Bond Portfolio – Class Z | | | 164,254 | | | | 1,833,071 | |
AB Relative Value Fund – Class Z | | | 1,811,064 | | | | 10,993,157 | |
AQR International Defensive Style Fund – Class R6 | | | 208,737 | | | | 2,730,275 | |
AQR Large Cap Defensive Style Fund – Class R6 | | | 254,992 | | | | 4,572,005 | |
AQR Long-Short Equity Fund – Class R6 | | | 449,855 | | | | 6,338,459 | |
AQR Risk-Balanced Commodities Fund – Class R6 | | | 444,599 | | | | 2,823,205 | |
AQR Style Premia Alternative Fund – Class R6 | | | 89,523 | | | | 928,350 | |
Franklin Growth Fund – Class R6 | | | 50,946 | | | | 4,534,222 | |
iShares Core S&P 500 ETF | | | 15,376 | | | | 3,820,321 | |
iShares Russell 2000 ETF | | | 6,494 | | | | 918,966 | |
MFS Institutional International Equity Fund | | | 286,323 | | | | 7,014,913 | |
MFS Value Fund – Class R5 | | | 138,717 | | | | 5,444,655 | |
T. Rowe Price Dividend Growth Fund, Inc. | | | 44,412 | | | | 1,817,350 | |
T. Rowe Price Emerging Markets Stock Fund | | | 45,141 | | | | 1,831,356 | |
T. Rowe Price International Funds – International Discovery Fund | | | 41,537 | | | | 2,753,910 | |
T. Rowe Price Small-Cap Value Fund, Inc. – Class I | | | 18,625 | | | | 878,939 | |
Templeton Global Bond Fund – Class R6 | | | 73,930 | | | | 893,078 | |
Vanguard FTSE Developed Markets ETF | | | 202,475 | | | | 8,607,212 | |
Vanguard FTSE Emerging Markets ETF | | | 53,451 | | | | 2,298,928 | |
Vanguard Total Bond Market ETF | | | 16,763 | | | | 1,374,398 | |
WisdomTree Europe Hedged Equity Fund | | | 21,598 | | | | 1,339,292 | |
| | | | | | | | |
| | |
Total Investment Companies
(cost $81,703,705) | | | | | | | 91,029,815 | |
| | | | | | | | |
| | | | | | | | |
SHORT-TERM INVESTMENTS – 1.1% | | | | | | | | |
Investment Companies – 1.1% | | | | | | | | |
AB Fixed Income Shares, Inc. – Government Money Market Portfolio – Class AB, 0.86%(a)(c)
(cost $1,004,222) | | | 1,004,222 | | | | 1,004,222 | |
| | | | | | | | |
| | |
Total Investments – 100.6%
(cost $82,707,927) | | | | | | | 92,034,037 | |
Other assets less liabilities – (0.6)% | | | | | | | (535,479 | ) |
| | | | | | | | |
| | |
Net Assets – 100.0% | | | | | | $ | 91,498,558 | |
| | | | | | | | |
| | |
| 78 | AB MULTI-MANAGER SELECT RETIREMENT FUNDS | | abfunds.com |
PORTFOLIO OF INVESTMENTS (continued)
AB MULTI-MANAGER SELECT 2035 FUND
| (a) | To obtain a copy of the fund’s shareholder report, please go to the Securities and Exchange Commission’s website at www.sec.gov. Additionally, shareholder reports for AB funds can be obtained by calling AB at (800) 227-4618. |
| (b) | Non-income producing security. |
| (c) | Investment in affiliated money market mutual fund. The rate shown represents the 7-day yield as of period end. |
Glossary:
ETF – Exchange Traded Fund
FTSE – Financial Times Stock Exchange
See notes to financial statements.
| | |
| abfunds.com | | AB MULTI-MANAGER SELECT RETIREMENT FUNDS | 79 |
PORTFOLIO OF INVESTMENTS
AB MULTI-MANAGER SELECT 2040 FUND
July 31, 2017
| | | | | | | | |
| Company | | Shares | | | U.S. $ Value | |
| |
| | | | | | | | |
INVESTMENT COMPANIES – 99.6% | |
Funds and Investment Trusts – 99.6%(a) | |
AB Concentrated Growth Fund – Class Z(b) | | | 155,021 | | | $ | 5,165,290 | |
AB Discovery Growth Fund, Inc. – Class Z(b) | | | 58,614 | | | | 627,168 | |
AB Discovery Value Fund – Class Z | | | 88,317 | | | | 1,932,374 | |
AB Global Real Estate Investment Fund II – Class I | | | 175,662 | | | | 1,937,554 | |
AB High Income Fund, Inc. – Class Z | | | 70,819 | | | | 634,536 | |
AB Intermediate Bond Portfolio – Class Z | | | 115,304 | | | | 1,286,796 | |
AB Relative Value Fund – Class Z | | | 1,593,389 | | | | 9,671,873 | |
AQR International Defensive Style Fund – Class R6 | | | 97,237 | | | | 1,271,859 | |
AQR Large Cap Defensive Style Fund – Class R6 | | | 72,080 | | | | 1,292,399 | |
AQR Long-Short Equity Fund – Class R6 | | | 319,900 | | | | 4,507,393 | |
AQR Risk-Balanced Commodities Fund – Class R6 | | | 311,698 | | | | 1,979,285 | |
Franklin Growth Fund – Class R6 | | | 35,951 | | | | 3,199,651 | |
iShares Core S&P 500 ETF | | | 8,315 | | | | 2,065,945 | |
iShares Russell 2000 ETF | | | 4,577 | | | | 647,691 | |
MFS Institutional International Equity Fund | | | 254,323 | | | | 6,230,908 | |
MFS Value Fund – Class R5 | | | 131,839 | | | | 5,174,670 | |
T. Rowe Price Dividend Growth Fund, Inc. | | | 31,575 | | | | 1,292,032 | |
T. Rowe Price Emerging Markets Stock Fund | | | 47,534 | | | | 1,928,446 | |
T. Rowe Price International Funds – International Discovery Fund | | | 29,337 | | | | 1,945,054 | |
T. Rowe Price Small-Cap Value Fund, Inc. – Class I | | | 13,673 | | | | 645,240 | |
Templeton Global Bond Fund – Class R6 | | | 51,011 | | | | 616,211 | |
Vanguard FTSE Developed Markets ETF | | | 158,342 | | | | 6,731,118 | |
Vanguard FTSE Emerging Markets ETF | | | 37,522 | | | | 1,613,821 | |
Vanguard Total Bond Market ETF | | | 11,767 | | | | 964,776 | |
WisdomTree Europe Hedged Equity Fund | | | 15,521 | | | | 962,457 | |
| | | | | | | | |
| | |
Total Investment Companies
(cost $57,206,720) | | | | | | | 64,324,547 | |
| | | | | | | | |
| | | | | | | | |
SHORT-TERM INVESTMENTS – 1.9% | | | | | | | | |
Investment Companies – 1.9% | | | | | | | | |
AB Fixed Income Shares, Inc. – Government Money Market Portfolio – Class AB, 0.86%(a)(c)
(cost $1,203,849) | | | 1,203,849 | | | | 1,203,849 | |
| | | | | | | | |
| | |
Total Investments – 101.5%
(cost $58,410,569) | | | | | | | 65,528,396 | |
Other assets less liabilities – (1.5)% | | | | | | | (966,080 | ) |
| | | | | | | | |
| | |
Net Assets – 100.0% | | | | | | $ | 64,562,316 | |
| | | | | | | | |
| | |
| 80 | AB MULTI-MANAGER SELECT RETIREMENT FUNDS | | abfunds.com |
PORTFOLIO OF INVESTMENTS (continued)
AB MULTI-MANAGER SELECT 2040 FUND
| (a) | To obtain a copy of the fund’s shareholder report, please go to the Securities and Exchange Commission’s website at www.sec.gov. Additionally, shareholder reports for AB funds can be obtained by calling AB at (800) 227-4618. |
| (b) | Non-income producing security. |
| (c) | Investment in affiliated money market mutual fund. The rate shown represents the 7-day yield as of period end. |
Glossary:
ETF – Exchange Traded Fund
FTSE – Financial Times Stock Exchange
See notes to financial statements.
| | |
| abfunds.com | | AB MULTI-MANAGER SELECT RETIREMENT FUNDS | 81 |
PORTFOLIO OF INVESTMENTS
AB MULTI-MANAGER SELECT 2045 FUND
July 31, 2017
| | | | | | | | |
| Company | | Shares | | | U.S. $ Value | |
| |
| | | | | | | | |
INVESTMENT COMPANIES – 99.7% | |
Funds and Investment Trusts – 99.7%(a) | |
AB Concentrated Growth Fund – Class Z(b) | | | 129,331 | | | $ | 4,309,294 | |
AB Discovery Value Fund – Class Z | | | 74,000 | | | | 1,619,116 | |
AB Global Real Estate Investment Fund II – Class I | | | 148,787 | | | | 1,641,118 | |
AB Intermediate Bond Portfolio – Class Z | | | 134,300 | | | | 1,498,790 | |
AB Relative Value Fund – Class Z | | | 1,437,929 | | | | 8,728,230 | |
AQR International Defensive Style Fund – Class R6 | | | 40,497 | | | | 529,700 | |
AQR Large Cap Defensive Style Fund – Class R6 | | | 29,669 | | | | 531,961 | |
AQR Long-Short Equity Fund – Class R6 | | | 269,795 | | | | 3,801,408 | |
AQR Risk-Balanced Commodities Fund – Class R6 | | | 181,067 | | | | 1,149,775 | |
Franklin Growth Fund – Class R6 | | | 42,566 | | | | 3,788,387 | |
iShares Core S&P 500 ETF | | | 6,993 | | | | 1,737,481 | |
iShares Russell 2000 ETF | | | 3,769 | | | | 533,351 | |
MFS Institutional International Equity Fund | | | 238,008 | | | | 5,831,201 | |
MFS Value Fund – Class R5 | | | 124,027 | | | | 4,868,043 | |
T. Rowe Price Dividend Growth Fund, Inc. | | | 13,138 | | | | 537,617 | |
T. Rowe Price Emerging Markets Stock Fund | | | 40,287 | | | | 1,634,456 | |
T. Rowe Price International Funds – International Discovery Fund | | | 24,831 | | | | 1,646,300 | |
T. Rowe Price Small-Cap Value Fund, Inc. – Class I | | | 22,770 | | | | 1,074,536 | |
Vanguard FTSE Developed Markets ETF | | | 147,107 | | | | 6,253,519 | |
Vanguard FTSE Emerging Markets ETF | | | 31,802 | | | | 1,367,804 | |
Vanguard Total Bond Market ETF | | | 4,879 | | | | 400,029 | |
WisdomTree Europe Hedged Equity Fund | | | 12,771 | | | | 791,930 | |
| | | | | | | | |
| | |
Total Investment Companies
(cost $48,189,680) | | | | | | | 54,274,046 | |
| | | | | | | | |
| | | | | | | | |
SHORT-TERM INVESTMENTS – 0.5% | | | | | | | | |
Investment Companies – 0.5% | | | | | | | | |
AB Fixed Income Shares, Inc. – Government Money Market Portfolio – Class AB, 0.86%(a)(c)
(cost $252,267) | | | 252,267 | | | | 252,267 | |
| | | | | | | | |
| | |
Total Investments – 100.2%
(cost $48,441,947) | | | | | | | 54,526,313 | |
Other assets less liabilities – (0.2)% | | | | | | | (93,966 | ) |
| | | | | | | | |
| | |
Net Assets – 100.0% | | | | | | $ | 54,432,347 | |
| | | | | | | | |
| (a) | To obtain a copy of the fund’s shareholder report, please go to the Securities and Exchange Commission’s website at www.sec.gov. Additionally, shareholder reports for AB funds can be obtained by calling AB at (800) 227-4618. |
| (b) | Non-income producing security. |
| (c) | Investment in affiliated money market mutual fund. The rate shown represents the 7-day yield as of period end. |
Glossary:
ETF – Exchange Traded Fund
FTSE – Financial Times Stock Exchange
See notes to financial statements.
| | |
| 82 | AB MULTI-MANAGER SELECT RETIREMENT FUNDS | | abfunds.com |
PORTFOLIO OF INVESTMENTS
AB MULTI-MANAGER SELECT 2050 FUND
July 31, 2017
| | | | | | | | |
| Company | | Shares | | | U.S. $ Value | |
| |
| | | | | | | | |
INVESTMENT COMPANIES – 99.7% | | | | | | | | |
Funds and Investment Trusts – 99.7%(a) | | | | | | | | |
AB Concentrated Growth Fund – Class Z(b) | | | 58,530 | | | $ | 1,950,204 | |
AB Discovery Value Fund – Class Z | | | 29,748 | | | | 650,885 | |
AB Global Real Estate Investment Fund II – Class I | | | 59,284 | | | | 653,906 | |
AB Intermediate Bond Portfolio – Class Z | | | 54,004 | | | | 602,683 | |
AB Relative Value Fund – Class Z | | | 540,270 | | | | 3,279,436 | |
AQR Long-Short Equity Fund – Class R6 | | | 108,815 | | | | 1,533,211 | |
AQR Risk-Balanced Commodities Fund – Class R6 | | | 70,439 | | | | 447,289 | |
Franklin Growth Fund – Class R6 | | | 17,018 | | | | 1,514,642 | |
iShares Core S&P 500 ETF | | | 3,682 | | | | 914,830 | |
iShares Russell 2000 ETF | | | 1,543 | | | | 218,350 | |
MFS Institutional International Equity Fund | | | 104,472 | | | | 2,559,564 | |
MFS Value Fund – Class R5 | | | 50,065 | | | | 1,965,066 | |
T. Rowe Price Emerging Markets Stock Fund | | | 27,001 | | | | 1,095,425 | |
T. Rowe Price International Funds – International Discovery Fund | | | 10,020 | | | | 664,338 | |
T. Rowe Price Small-Cap Value Fund, Inc. – Class I | | | 9,073 | | | | 428,154 | |
Vanguard FTSE Developed Markets ETF | | | 63,833 | | | | 2,713,541 | |
Vanguard FTSE Emerging Markets ETF | | | 2,557 | | | | 109,976 | |
Vanguard Total Bond Market ETF | | | 1,985 | | | | 162,750 | |
WisdomTree Europe Hedged Equity Fund | | | 5,171 | | | | 320,654 | |
| | | | | | | | |
| | |
Total Investment Companies
(cost $19,309,073) | | | | | | | 21,784,904 | |
| | | | | | | | |
| | | | | | | | |
SHORT-TERM INVESTMENTS – 0.5% | | | | | | | | |
Investment Companies – 0.5% | | | | | | | | |
AB Fixed Income Shares, Inc. – Government Money Market Portfolio – Class AB, 0.86%(a)(c)
(cost $113,303) | | | 113,303 | | | | 113,303 | |
| | | | | | | | |
| | |
Total Investments – 100.2%
(cost $19,422,376) | | | | | | | 21,898,207 | |
Other assets less liabilities – (0.2)% | | | | | | | (41,163 | ) |
| | | | | | | | |
| | |
Net Assets – 100.0% | | | | | | $ | 21,857,044 | |
| | | | | | | | |
| (a) | To obtain a copy of the fund’s shareholder report, please go to the Securities and Exchange Commission’s website at www.sec.gov. Additionally, shareholder reports for AB funds can be obtained by calling AB at (800) 227-4618. |
| (b) | Non-income producing security. |
| (c) | Investment in affiliated money market mutual fund. The rate shown represents the 7-day yield as of period end. |
Glossary:
ETF – Exchange Traded Fund
FTSE – Financial Times Stock Exchange
See notes to financial statements.
| | |
| abfunds.com | | AB MULTI-MANAGER SELECT RETIREMENT FUNDS | 83 |
PORTFOLIO OF INVESTMENTS
AB MULTI-MANAGER SELECT 2055 FUND
July 31, 2017
| | | | | | | | |
| Company | | Shares | | | U.S. $ Value | |
| |
| | | | | | | | |
INVESTMENT COMPANIES – 99.9% | | | | | | | | |
Funds and Investment Trusts – 99.9%(a) | | | | | | | | |
AB Concentrated Growth Fund – Class Z(b) | | | 68,697 | | | $ | 2,288,976 | |
AB Discovery Value Fund – Class Z | | | 34,594 | | | | 756,917 | |
AB Global Real Estate Investment Fund II – Class I | | | 68,909 | | | | 760,065 | |
AB Intermediate Bond Portfolio – Class Z | | | 62,767 | | | | 700,478 | |
AB Relative Value Fund – Class Z | | | 630,452 | | | | 3,826,842 | |
AQR Long-Short Equity Fund – Class R6 | | | 126,746 | | | | 1,785,856 | |
AQR Risk-Balanced Commodities Fund – Class R6 | | | 82,822 | | | | 525,920 | |
Franklin Growth Fund – Class R6 | | | 19,936 | | | | 1,774,330 | |
iShares Core S&P 500 ETF | | | 4,283 | | | | 1,064,154 | |
iShares Russell 2000 ETF | | | 1,730 | | | | 244,812 | |
MFS Institutional International Equity Fund | | | 121,961 | | | | 2,988,051 | |
MFS Value Fund – Class R5 | | | 58,423 | | | | 2,293,096 | |
T. Rowe Price Emerging Markets Stock Fund | | | 31,381 | | | | 1,273,141 | |
T. Rowe Price International Funds – International Discovery Fund | | | 11,630 | | | | 771,077 | |
T. Rowe Price Small-Cap Value Fund, Inc. – Class I | | | 10,624 | | | | 501,334 | |
Vanguard FTSE Developed Markets ETF | | | 74,106 | | | | 3,150,246 | |
Vanguard FTSE Emerging Markets ETF | | | 2,972 | | | | 127,826 | |
Vanguard Total Bond Market ETF | | | 2,184 | | | | 179,066 | |
WisdomTree Europe Hedged Equity Fund | | | 5,896 | | | | 365,611 | |
| | | | | | | | |
| | |
Total Investment Companies
(cost $22,703,755) | | | | | | | 25,377,798 | |
| | | | | | | | |
| | | | | | | | |
SHORT-TERM INVESTMENTS – 0.6% | | | | | | | | |
Investment Companies – 0.6% | | | | | | | | |
AB Fixed Income Shares, Inc. – Government Money Market Portfolio – Class AB, 0.86%(a)(c)
(cost $169,684) | | | 169,684 | | | | 169,684 | |
| | | | | | | | |
| | |
Total Investments – 100.5%
(cost $22,873,439) | | | | | | | 25,547,482 | |
Other assets less liabilities – (0.5)% | | | | | | | (136,790 | ) |
| | | | | | | | |
| | |
Net Assets – 100.0% | | | | | | $ | 25,410,692 | |
| | | | | | | | |
| (a) | To obtain a copy of the fund’s shareholder report, please go to the Securities and Exchange Commission’s website at www.sec.gov. Additionally, shareholder reports for AB funds can be obtained by calling AB at (800) 227-4618. |
| (b) | Non-income producing security. |
| (c) | Investment in affiliated money market mutual fund. The rate shown represents the 7-day yield as of period end. |
Glossary:
ETF – Exchange Traded Fund
FTSE – Financial Times Stock Exchange
See notes to financial statements.
| | |
| 84 | AB MULTI-MANAGER SELECT RETIREMENT FUNDS | | abfunds.com |
STATEMENT OF ASSETS & LIABILITIES
July 31, 2017
| | | | |
| | | AB Multi-Manager
Select
Retirement
Allocation Fund | |
| Assets | | | | |
Investments in Underlying Portfolios, at value | | | | |
Unaffiliated issuers (cost $6,124,972) | | $ | 6,410,713 | |
Affiliated issuers (cost $3,153,033) | | | 3,271,840 | |
Receivable due from Adviser | | | 21,324 | |
Receivable for capital stock sold | | | 10,313 | |
Affiliated dividends receivable | | | 3,279 | |
Unaffiliated dividends receivable | | | 2,447 | |
| | | | |
Total assets | | | 9,719,916 | |
| | | | |
| Liabilities | | | | |
Payable for investments purchased | | | 147,741 | |
Custody fee payable | | | 41,700 | |
Audit and tax fee payable | | | 34,535 | |
Distribution fee payable | | | 1,773 | |
Transfer Agent fee payable | | | 1,436 | |
Payable for capital stock redeemed | | | 693 | |
Accrued expenses | | | 17,573 | |
| | | | |
Total liabilities | | | 245,451 | |
| | | | |
Net Assets | | $ | 9,474,465 | |
| | | | |
| Composition of Net Assets | | | | |
Capital stock, at par | | $ | 90 | |
Additional paid-in capital | | | 8,982,596 | |
Undistributed net investment income | | | 70,635 | |
Accumulated net realized gain on investment transactions | | | 16,596 | |
Net unrealized appreciation on investments | | | 404,548 | |
| | | | |
| | $ | 9,474,465 | |
| | | | |
Net Asset Value Per Share—11 billion shares of capital stock authorized, $.0001 par value
| | | | | | | | | | | | |
| Class | | Net Assets | | | Shares
Outstanding | | | Net Asset
Value | |
| |
| A | | $ | 309,517 | | | | 28,217 | | | $ | 10.97 | * |
| |
| C | | $ | 186,047 | | | | 17,285 | | | $ | 10.76 | |
| |
| Advisor | | $ | 25,126 | | | | 2,273 | | | $ | 11.05 | |
| |
| R | | $ | 16,789 | | | | 1,601 | | | $ | 10.49 | |
| |
| K | | $ | 7,868,615 | | | | 748,914 | | | $ | 10.51 | |
| |
| I | | $ | 1,057,568 | | | | 100,344 | | | $ | 10.54 | |
| |
| Z | | $ | 10,803 | | | | 1,026 | | | $ | 10.53 | |
| |
| * | The maximum offering price per share for Class A shares was $11.46 which reflects a sales charge of 4.25%. |
See notes to financial statements.
| | |
| abfunds.com | | AB MULTI-MANAGER SELECT RETIREMENT FUNDS | 85 |
STATEMENT OF ASSETS & LIABILITIES (continued)
| | | | |
| | | AB Multi-Manager
Select 2010
Fund | |
| Assets | | | | |
Investments in Underlying Portfolios, at value | | | | |
Unaffiliated issuers (cost $8,258,511) | | $ | 8,832,649 | |
Affiliated issuers (cost $4,488,005) | | | 4,633,268 | |
Receivable due from Adviser | | | 20,073 | |
Receivable for capital stock sold | | | 5,745 | |
Affiliated dividends receivable | | | 4,392 | |
Unaffiliated dividends receivable | | | 3,340 | |
| | | | |
Total assets | | | 13,499,467 | |
| | | | |
| Liabilities | | | | |
Payable for investments purchased | | | 205,485 | |
Custody fee payable | | | 41,660 | |
Audit and tax fee payable | | | 32,211 | |
Distribution fee payable | | | 2,628 | |
Transfer Agent fee payable | | | 1,489 | |
Accrued expenses | | | 16,900 | |
| | | | |
Total liabilities | | | 300,373 | |
| | | | |
Net Assets | | $ | 13,199,094 | |
| | | | |
| Composition of Net Assets | | | | |
Capital stock, at par | | $ | 123 | |
Additional paid-in capital | | | 12,132,781 | |
Undistributed net investment income | | | 101,161 | |
Accumulated net realized gain on investment transactions | | | 245,628 | |
Net unrealized appreciation on investments | | | 719,401 | |
| | | | |
| | $ | 13,199,094 | |
| | | | |
Net Asset Value Per Share—11 billion shares of capital stock authorized, $.0001 par value
| | | | | | | | | | | | |
| Class | | Net Assets | | | Shares
Outstanding | | | Net Asset
Value | |
| |
| A | | $ | 376,075 | | | | 33,847 | | | $ | 11.11 | * |
| |
| C | | $ | 142,206 | | | | 12,979 | | | $ | 10.96 | |
| |
| Advisor | | $ | 778,055 | | | | 70,474 | | | $ | 11.04 | |
| |
| R | | $ | 388,542 | | | | 36,545 | | | $ | 10.63 | |
| |
| K | | $ | 11,448,228 | | | | 1,074,936 | | | $ | 10.65 | |
| |
| I | | $ | 54,955 | | | | 5,157.60 | | | $ | 10.66 | |
| |
| Z | | $ | 11,033 | | | | 1,033 | | | $ | 10.68 | |
| |
| * | The maximum offering price per share for Class A shares was $11.60 which reflects a sales charge of 4.25%. |
See notes to financial statements.
| | |
| 86 | AB MULTI-MANAGER SELECT RETIREMENT FUNDS | | abfunds.com |
STATEMENT OF ASSETS & LIABILITIES (continued)
| | | | |
| | | AB Multi-Manager
Select 2015
Fund | |
| Assets | | | | |
Investments in Underlying Portfolios, at value | | | | |
Unaffiliated issuers (cost $25,893,415) | | $ | 28,169,480 | |
Affiliated issuers (cost $14,096,669) | | | 14,609,843 | |
Receivable due from Adviser | | | 18,832 | |
Affiliated dividends receivable | | | 16,393 | |
Receivable for capital stock sold | | | 9,664 | |
Unaffiliated dividends receivable | | | 7,520 | |
| | | | |
Total assets | | | 42,831,732 | |
| | | | |
| Liabilities | | | | |
Payable for investments purchased | | | 662,858 | |
Custody fee payable | | | 40,313 | |
Distribution fee payable | | | 8,707 | |
Transfer Agent fee payable | | | 1,721 | |
Accrued expenses | | | 49,109 | |
| | | | |
Total liabilities | | | 762,708 | |
| | | | |
Net Assets | | $ | 42,069,024 | |
| | | | |
| Composition of Net Assets | | | | |
Capital stock, at par | | $ | 389 | |
Additional paid-in capital | | | 38,124,481 | |
Undistributed net investment income | | | 307,001 | |
Accumulated net realized gain on investment transactions | | | 847,914 | |
Net unrealized appreciation on investments | | | 2,789,239 | |
| | | | |
| | $ | 42,069,024 | |
| | | | |
Net Asset Value Per Share—11 billion shares of capital stock authorized, $.0001 par value
| | | | | | | | | | | | |
| Class | | Net Assets | | | Shares
Outstanding | | | Net Asset
Value | |
| |
| A | | $ | 2,224,314 | | | | 201,950 | | | $ | 11.01 | * |
| |
| C | | $ | 737,501 | | | | 67,553 | | | $ | 10.92 | |
| |
| Advisor | | $ | 77,554 | | | | 6,948 | | | $ | 11.16 | |
| |
| R | | $ | 398,628 | | | | 36,999 | | | $ | 10.77 | |
| |
| K | | $ | 38,085,856 | | | | 3,528,324 | | | $ | 10.79 | |
| |
| I | | $ | 533,960 | | | | 49,381 | | | $ | 10.81 | |
| |
| Z | | $ | 11,211 | | | | 1,037 | | | $ | 10.81 | |
| |
| * | The maximum offering price per share for Class A shares was $11.50 which reflects a sales charge of 4.25%. |
See notes to financial statements.
| | |
| abfunds.com | | AB MULTI-MANAGER SELECT RETIREMENT FUNDS | 87 |
STATEMENT OF ASSETS & LIABILITIES (continued)
| | | | |
| | | AB Multi-Manager
Select 2020
Fund | |
| Assets | | | | |
Investments in Underlying Portfolios, at value | | | | |
Unaffiliated issuers (cost $57,201,241) | | $ | 62,553,484 | |
Affiliated issuers (cost $31,202,511) | | | 32,473,259 | |
Receivable for investments sold | | | 86,564 | |
Affiliated dividends receivable | | | 38,941 | |
Receivable for capital stock sold | | | 36,497 | |
Unaffiliated dividends receivable | | | 14,444 | |
Receivable due from Adviser | | | 734 | |
| | | | |
Total assets | | | 95,203,923 | |
| | | | |
| Liabilities | | | | |
Due to custodian | | | 86,564 | |
Payable for investments purchased | | | 1,450,731 | |
Distribution fee payable | | | 19,382 | |
Transfer Agent fee payable | | | 3,423 | |
Payable for capital stock redeemed | | | 19 | |
Accrued expenses | | | 92,562 | |
| | | | |
Total liabilities | | | 1,652,681 | |
| | | | |
Net Assets | | $ | 93,551,242 | |
| | | | |
| Composition of Net Assets | | | | |
Capital stock, at par | | $ | 854 | |
Additional paid-in capital | | | 84,581,186 | |
Undistributed net investment income | | | 643,435 | |
Accumulated net realized gain on investment transactions | | | 1,702,776 | |
Net unrealized appreciation on investments | | | 6,622,991 | |
| | | | |
| | $ | 93,551,242 | |
| | | | |
Net Asset Value Per Share—11 billion shares of capital stock authorized, $.0001 par value
| | | | | | | | | | | | |
| Class | | Net Assets | | | Shares
Outstanding | | | Net Asset
Value | |
| |
| A | | $ | 5,239,312 | | | | 469,952 | | | $ | 11.15 | * |
| |
| C | | $ | 1,582,614 | | | | 143,596 | | | $ | 11.02 | |
| |
| Advisor | | $ | 220,371 | | | | 19,721 | | | $ | 11.17 | |
| |
| R | | $ | 2,052,313 | | | | 188,010 | | | $ | 10.92 | |
| |
| K | | $ | 82,262,973 | | | | 7,521,612 | | | $ | 10.94 | |
| |
| I | | $ | 2,182,294 | | | | 199,155 | | | $ | 10.96 | |
| |
| Z | | $ | 11,365 | | | | 1,038 | | | $ | 10.95 | |
| |
| * | The maximum offering price per share for Class A shares was $11.64 which reflects a sales charge of 4.25%. |
See notes to financial statements.
| | |
| 88 | AB MULTI-MANAGER SELECT RETIREMENT FUNDS | | abfunds.com |
STATEMENT OF ASSETS & LIABILITIES (continued)
| | | | |
| | | AB Multi-Manager
Select 2025
Fund | |
| Assets | | | | |
Investments in Underlying Portfolios, at value | | | | |
Unaffiliated issuers (cost $80,049,317) | | $ | 88,524,090 | |
Affiliated issuers (cost $43,713,511) | | | 46,323,780 | |
Receivable for capital stock sold | | | 61,772 | |
Affiliated dividends receivable | | | 55,180 | |
Unaffiliated dividends receivable | | | 10,806 | |
| | | | |
Total assets | | | 134,975,628 | |
| | | | |
| Liabilities | | | | |
Payable for investments purchased | | | 2,075,392 | |
Payable for capital stock redeemed | | | 129,852 | |
Distribution fee payable | | | 26,165 | |
Transfer Agent fee payable | | | 5,162 | |
Advisory fee payable | | | 538 | |
Accrued expenses | | | 94,607 | |
| | | | |
Total liabilities | | | 2,331,716 | |
| | | | |
Net Assets | | $ | 132,643,912 | |
| | | | |
| Composition of Net Assets | | | | |
Capital stock, at par | | $ | 1,195 | |
Additional paid-in capital | | | 118,353,817 | |
Undistributed net investment income | | | 835,186 | |
Accumulated net realized gain on investment transactions | | | 2,368,672 | |
Net unrealized appreciation on investments | | | 11,085,042 | |
| | | | |
| | $ | 132,643,912 | |
| | | | |
Net Asset Value Per Share—11 billion shares of capital stock authorized, $.0001 par value
| | | | | | | | | | | | |
| Class | | Net Assets | | | Shares
Outstanding | | | Net Asset
Value | |
| |
| A | | $ | 4,804,110 | | | | 424,500 | | | $ | 11.32 | * |
| |
| C | | $ | 629,438 | | | | 56,246 | | | $ | 11.19 | |
| |
| Advisor | | $ | 860,628 | | | | 75,883 | | | $ | 11.34 | |
| |
| R | | $ | 2,851,811 | | | | 257,985 | | | $ | 11.05 | |
| |
| K | | $ | 120,243,446 | | | | 10,840,233 | | | $ | 11.09 | |
| |
| I | | $ | 3,216,727 | | | | 289,266 | | | $ | 11.12 | |
| |
| Z | | $ | 37,752 | | | | 3,398 | | | $ | 11.11 | |
| |
| * | The maximum offering price per share for Class A shares was $11.82 which reflects a sales charge of 4.25%. |
See notes to financial statements.
| | |
| abfunds.com | | AB MULTI-MANAGER SELECT RETIREMENT FUNDS | 89 |
STATEMENT OF ASSETS & LIABILITIES (continued)
| | | | |
| | | AB Multi-Manager
Select 2030
Fund | |
| Assets | | | | |
Investments in Underlying Portfolios, at value | | | | |
Unaffiliated issuers (cost $61,159,925) | | $ | 67,840,915 | |
Affiliated issuers (cost $33,567,793) | | | 35,675,808 | |
Receivable for capital stock sold | | | 63,129 | |
Affiliated dividends receivable | | | 41,829 | |
Unaffiliated dividends receivable | | | 2,321 | |
| | | | |
Total assets | | | 103,624,002 | |
| | | | |
| Liabilities | | | | |
Payable for investments purchased | | | 1,616,993 | |
Payable for capital stock redeemed | | | 123,237 | |
Distribution fee payable | | | 19,758 | |
Advisory fee payable | | | 5,367 | |
Transfer Agent fee payable | | | 3,855 | |
Accrued expenses | | | 93,543 | |
| | | | |
Total liabilities | | | 1,862,753 | |
| | | | |
Net Assets | | $ | 101,761,249 | |
| | | | |
| Composition of Net Assets | | | | |
Capital stock, at par | | $ | 897 | |
Additional paid-in capital | | | 90,042,901 | |
Undistributed net investment income | | | 537,651 | |
Accumulated net realized gain on investment transactions | | | 2,390,795 | |
Net unrealized appreciation on investments | | | 8,789,005 | |
| | | | |
| | $ | 101,761,249 | |
| | | | |
Net Asset Value Per Share—11 billion shares of capital stock authorized, $.0001 par value
| | | | | | | | | | | | |
| Class | | Net Assets | | | Shares
Outstanding | | | Net Asset
Value | |
| |
| A | | $ | 5,955,638 | | | | 515,057 | | | $ | 11.56 | * |
| |
| C | | $ | 951,093 | | | | 83,208 | | | $ | 11.43 | |
| |
| Advisor | | $ | 924,529 | | | | 79,773 | | | $ | 11.59 | |
| |
| R | | $ | 1,300,492 | | | | 114,952 | | | $ | 11.31 | |
| |
| K | | $ | 88,324,683 | | | | 7,794,293 | | | $ | 11.33 | |
| |
| I | | $ | 4,288,198 | | | | 377,410 | | | $ | 11.36 | |
| |
| Z | | $ | 16,616 | | | | 1,463 | | | $ | 11.36 | |
| |
| * | The maximum offering price per share for Class A shares was $12.07 which reflects a sales charge of 4.25%. |
See notes to financial statements.
| | |
| 90 | AB MULTI-MANAGER SELECT RETIREMENT FUNDS | | abfunds.com |
STATEMENT OF ASSETS & LIABILITIES (continued)
| | | | |
| | | AB Multi-Manager
Select 2035
Fund | |
| Assets | | | | |
Investments in Underlying Portfolios, at value | | | | |
Unaffiliated issuers (cost $53,970,399) | | $ | 60,919,834 | |
Affiliated issuers (cost $28,737,528) | | | 31,114,203 | |
Cash | | | 241,235 | |
Receivable for capital stock sold | | | 73,006 | |
Affiliated dividends receivable | | | 27,555 | |
| | | | |
Total assets | | | 92,375,833 | |
| | | | |
| Liabilities | | | | |
Payable for investments purchased | | | 728,197 | |
Payable for capital stock redeemed | | | 27,187 | |
Distribution fee payable | | | 17,712 | |
Advisory fee payable | | | 7,000 | |
Transfer Agent fee payable | | | 3,518 | |
Accrued expenses | | | 93,661 | |
| | | | |
Total liabilities | | | 877,275 | |
| | | | |
Net Assets | | $ | 91,498,558 | |
| | | | |
| Composition of Net Assets | | | | |
Capital stock, at par | | $ | 794 | |
Additional paid-in capital | | | 79,892,159 | |
Undistributed net investment income | | | 413,386 | |
Accumulated net realized gain on investment transactions | | | 1,866,109 | |
Net unrealized appreciation on investments | | | 9,326,110 | |
| | | | |
| | $ | 91,498,558 | |
| | | | |
Net Asset Value Per Share—11 billion shares of capital stock authorized, $.0001 par value
| | | | | | | | | | | | |
| Class | | Net Assets | | | Shares
Outstanding | | | Net Asset
Value | |
| |
| A | | $ | 4,670,755 | | | | 397,175 | | | $ | 11.76 | * |
| |
| C | | $ | 603,818 | | | | 52,069 | | | $ | 11.60 | |
| |
| Advisor | | $ | 534,618 | | | | 45,290 | | | $ | 11.80 | |
| |
| R | | $ | 1,708,567 | | | | 148,965 | | | $ | 11.47 | |
| |
| K | | $ | 79,676,511 | | | | 6,922,841 | | | $ | 11.51 | |
| |
| I | | $ | 4,280,003 | | | | 370,914 | | | $ | 11.54 | |
| |
| Z | | $ | 24,286 | | | | 2,106 | | | $ | 11.53 | |
| |
| * | The maximum offering price per share for Class A shares was $12.28 which reflects a sales charge of 4.25%. |
See notes to financial statements.
| | |
| abfunds.com | | AB MULTI-MANAGER SELECT RETIREMENT FUNDS | 91 |
STATEMENT OF ASSETS & LIABILITIES (continued)
| | | | |
| | | AB Multi-Manager
Select 2040
Fund | |
| Assets | | | | |
Investments in Underlying Portfolios, at value | | | | |
Unaffiliated issuers (cost $37,933,671) | | $ | 43,068,956 | |
Affiliated issuers (cost $20,476,898) | | | 22,459,440 | |
Receivable for capital stock sold | | | 63,031 | |
Affiliated dividends receivable | | | 4,418 | |
Receivable due from Adviser | | | 3,742 | |
| | | | |
Total assets | | | 65,599,587 | |
| | | | |
| Liabilities | | | | |
Payable for investments purchased | | | 916,839 | |
Payable for capital stock redeemed | | | 13,390 | |
Distribution fee payable | | | 12,216 | |
Transfer Agent fee payable | | | 2,451 | |
Accrued expenses | | | 92,375 | |
| | | | |
Total liabilities | | | 1,037,271 | |
| | | | |
Net Assets | | $ | 64,562,316 | |
| | | | |
| Composition of Net Assets | | | | |
Capital stock, at par | | $ | 558 | |
Additional paid-in capital | | | 55,831,040 | |
Undistributed net investment income | | | 213,607 | |
Accumulated net realized gain on investment transactions | | | 1,399,284 | |
Net unrealized appreciation on investments | | | 7,117,827 | |
| | | | |
| | $ | 64,562,316 | |
| | | | |
Net Asset Value Per Share—11 billion shares of capital stock authorized, $.0001 par value
| | | | | | | | | | | | |
| Class | | Net Assets | | | Shares
Outstanding | | | Net Asset
Value | |
| |
| A | | $ | 4,050,704 | | | | 343,249 | | | $ | 11.80 | * |
| |
| C | | $ | 398,296 | | | | 34,189 | | | $ | 11.65 | |
| |
| Advisor | | $ | 459,329 | | | | 38,767 | | | $ | 11.85 | |
| |
| R | | $ | 1,508,004 | | | | 131,202 | | | $ | 11.49 | |
| |
| K | | $ | 53,901,996 | | | | 4,668,519 | | | $ | 11.55 | |
| |
| I | | $ | 3,644,188 | | | | 315,019 | | | $ | 11.57 | |
| |
| Z | | $ | 599,799 | | | | 51,842 | | | $ | 11.57 | |
| |
| * | The maximum offering price per share for Class A shares was $12.32 which reflects a sales charge of 4.25%. |
See notes to financial statements.
| | |
| 92 | AB MULTI-MANAGER SELECT RETIREMENT FUNDS | | abfunds.com |
STATEMENT OF ASSETS & LIABILITIES (continued)
| | | | |
| | | AB Multi-Manager
Select 2045
Fund | |
| Assets | | | | |
Investments in Underlying Portfolios, at value | | | | |
Unaffiliated issuers (cost $31,942,336) | | $ | 36,477,498 | |
Affiliated issuers (cost $16,499,611) | | | 18,048,815 | |
Receivable for capital stock sold | | | 75,490 | |
Receivable due from Adviser | | | 2,762 | |
Affiliated dividends receivable | | | 1,192 | |
| | | | |
Total assets | | | 54,605,757 | |
| | | | |
| Liabilities | | | | |
Payable for capital stock redeemed | | | 68,262 | |
Custody fee payable | | | 39,735 | |
Audit and tax fee payable | | | 30,430 | |
Distribution fee payable | | | 10,410 | |
Legal fee payable | | | 9,696 | |
Transfer Agent fee payable | | | 2,081 | |
Payable for investments purchased | | | 1,027 | |
Accrued expenses | | | 11,769 | |
| | | | |
Total liabilities | | | 173,410 | |
| | | | |
Net Assets | | $ | 54,432,347 | |
| | | | |
| Composition of Net Assets | | | | |
Capital stock, at par | | $ | 467 | |
Additional paid-in capital | | | 46,998,537 | |
Undistributed net investment income | | | 169,408 | |
Accumulated net realized gain on investment transactions | | | 1,179,569 | |
Net unrealized appreciation on investments | | | 6,084,366 | |
| | | | |
| | $ | 54,432,347 | |
| | | | |
Net Asset Value Per Share—11 billion shares of capital stock authorized, $.0001 par value
| | | | | | | | | | | | |
| Class | | Net Assets | | | Shares
Outstanding | | | Net Asset
Value | |
| |
| A | | $ | 3,015,218 | | | | 252,870 | | | $ | 11.92 | * |
| |
| C | | $ | 275,066 | | | | 23,175 | | | $ | 11.87 | |
| |
| Advisor | | $ | 32,410 | | | | 2,698 | | | $ | 12.01 | |
| |
| R | | $ | 2,174,116 | | | | 187,545 | | | $ | 11.59 | |
| |
| K | | $ | 44,736,298 | | | | 3,840,989 | | | $ | 11.65 | |
| |
| I | | $ | 3,829,812 | | | | 328,145 | | | $ | 11.67 | |
| |
| Z | | $ | 369,427 | | | | 31,673 | | | $ | 11.66 | |
| |
| * | The maximum offering price per share for Class A shares was $12.45 which reflects a sales charge of 4.25%. |
See notes to financial statements.
| | |
| abfunds.com | | AB MULTI-MANAGER SELECT RETIREMENT FUNDS | 93 |
STATEMENT OF ASSETS & LIABILITIES (continued)
| | | | |
| | | AB Multi-Manager
Select 2050
Fund | |
| Assets | | | | |
Investments in Underlying Portfolios, at value | | | | |
Unaffiliated issuers (cost $12,778,804) | | $ | 14,647,790 | |
Affiliated issuers (cost $6,643,572) | | | 7,250,417 | |
Receivable for capital stock sold | | | 42,680 | |
Receivable due from Adviser | | | 16,675 | |
Affiliated dividends receivable | | | 474 | |
| | | | |
Total assets | | | 21,958,036 | |
| | | | |
| Liabilities | | | | |
Custody fee payable | | | 39,183 | |
Audit and tax fee payable | | | 32,211 | |
Legal fee payable | | | 9,696 | |
Distribution fee payable | | | 3,965 | |
Transfer Agent fee payable | | | 1,576 | |
Payable for capital stock redeemed | | | 1,441 | |
Payable for investments purchased | | | 415 | |
Accrued expenses | | | 12,505 | |
| | | | |
Total liabilities | | | 100,992 | |
| | | | |
Net Assets | | $ | 21,857,044 | |
| | | | |
| Composition of Net Assets | | | | |
Capital stock, at par | | $ | 187 | |
Additional paid-in capital | | | 18,825,326 | |
Undistributed net investment income | | | 68,338 | |
Accumulated net realized gain on investment transactions | | | 487,362 | |
Net unrealized appreciation on investments | | | 2,475,831 | |
| | | | |
| | $ | 21,857,044 | |
| | | | |
Net Asset Value Per Share—11 billion shares of capital stock authorized, $.0001 par value
| | | | | | | | | | | | |
| Class | | Net Assets | | | Shares
Outstanding | | | Net Asset
Value | |
| |
| A | | $ | 1,035,343 | | | | 85,388 | | | $ | 12.13 | * |
| |
| C | | $ | 81,249 | | | | 6,784 | | | $ | 11.98 | |
| |
| Advisor | | $ | 117,487 | | | | 9,625 | | | $ | 12.21 | |
| |
| R | | $ | 570,076 | | | | 48,976 | | | $ | 11.64 | |
| |
| K | | $ | 17,652,149 | | | | 1,511,016 | | | $ | 11.68 | |
| |
| I | | $ | 2,388,412 | | | | 203,688 | | | $ | 11.73 | |
| |
| Z | | $ | 12,328 | | | | 1,052 | | | $ | 11.72 | |
| |
| * | The maximum offering price per share for Class A shares was $12.67 which reflects a sales charge of 4.25%. |
See notes to financial statements.
| | |
| 94 | AB MULTI-MANAGER SELECT RETIREMENT FUNDS | | abfunds.com |
STATEMENT OF ASSETS & LIABILITIES (continued)
| | | | |
| | | AB Multi-Manager
Select 2055
Fund | |
| Assets | | | | |
Investments in Underlying Portfolios, at value | | | | |
Unaffiliated issuers (cost $15,048,717) | | $ | 17,044,520 | |
Affiliated issuers (cost $7,824,722) | | | 8,502,962 | |
Receivable for capital stock sold | | | 47,747 | |
Receivable due from Adviser | | | 10,780 | |
Affiliated dividends receivable | | | 572 | |
| | | | |
Total assets | | | 25,606,581 | |
| | | | |
| Liabilities | | | | |
Payable for investments purchased | | | 96,496 | |
Custody fee payable | | | 39,222 | |
Audit and tax fee payable | | | 32,211 | |
Distribution fee payable | | | 4,663 | |
Transfer Agent fee payable | | | 1,758 | |
Payable for capital stock redeemed | | | 895 | |
Accrued expenses | | | 20,644 | |
| | | | |
Total liabilities | | | 195,889 | |
| | | | |
Net Assets | | $ | 25,410,692 | |
| | | | |
| Composition of Net Assets | | | | |
Capital stock, at par | | $ | 218 | |
Additional paid-in capital | | | 22,241,309 | |
Undistributed net investment income | | | 72,733 | |
Accumulated net realized gain on investment transactions | | | 422,389 | |
Net unrealized appreciation on investments | | | 2,674,043 | |
| | | | |
| | $ | 25,410,692 | |
| | | | |
Net Asset Value Per Share—11 billion shares of capital stock authorized, $.0001 par value
| | | | | | | | | | | | |
| Class | | Net Assets | | | Shares
Outstanding | | | Net Asset
Value | |
| |
| A | | $ | 1,094,328 | | | | 91,288 | | | $ | 11.99 | * |
| |
| C | | $ | 191,995 | | | | 16,272 | | | $ | 11.80 | |
| |
| Advisor | | $ | 546,910 | | | | 45,124 | | | $ | 12.12 | |
| |
| R | | $ | 323,377 | | | | 27,936 | | | $ | 11.58 | |
| |
| K | | $ | 21,440,529 | | | | 1,848,022 | | | $ | 11.60 | |
| |
| I | | $ | 1,800,641 | | | | 154,612 | | | $ | 11.65 | |
| |
| Z | | $ | 12,912 | | | | 1,109 | | | $ | 11.64 | |
| |
| * | The maximum offering price per share for Class A shares was $12.52 which reflects a sales charge of 4.25%. |
See notes to financial statements.
| | |
| abfunds.com | | AB MULTI-MANAGER SELECT RETIREMENT FUNDS | 95 |
STATEMENT OF OPERATIONS
Year Ended July 31, 2017
| | | | | | | | |
| | | AB Multi-Manager
Select
Retirement
Allocation Fund | | | | |
| Investment Income | | | | | | | | |
Dividends | | | | | | | | |
Income distributions from unaffiliated Underlying Portfolios | | $ | 130,484 | | | | | |
Income distributions from affiliated Underlying Portfolios | | | 102,438 | | | $ | 232,922 | |
| | | | | | | | |
| Expenses | | | | | | | | |
Advisory fee (see Note B) | | | 14,465 | | | | | |
Distribution fee – Class A | | | 820 | | | | | |
Distribution fee – Class C | | | 1,596 | | | | | |
Distribution fee – Class R | | | 150 | | | | | |
Distribution fee – Class K | | | 20,640 | | | | | |
Transfer agency – Class A | | | 10,326 | | | | | |
Transfer agency – Class C | | | 5,201 | | | | | |
Transfer agency – Advisor Class | | | 735 | | | | | |
Transfer agency – Class R | | | 64 | | | | | |
Transfer agency – Class K | | | 15,272 | | | | | |
Transfer agency – Class I | | | 879 | | | | | |
Transfer agency – Class Z | | | 2 | | | | | |
Registration fees | | | 93,823 | | | | | |
Custodian | | | 68,441 | | | | | |
Audit and tax | | | 38,244 | | | | | |
Legal | | | 28,377 | | | | | |
Directors’ fees | | | 27,338 | | | | | |
Printing | | | 2,317 | | | | | |
Miscellaneous | | | 9,762 | | | | | |
| | | | | | | | |
Total expenses | | | 338,452 | | | | | |
Less: expenses waived and reimbursed by the Adviser (see Note B) | | | (298,967 | ) | | | | |
| | | | | | | | |
Net expenses | | | | | | | 39,485 | |
| | | | | | | | |
Net investment income | | | | | | | 193,437 | |
| | | | | | | | |
| Realized and Unrealized Gain on Investment Transactions | | | | | | | | |
Net realized gain on: | | | | | | | | |
Affiliated Underlying Portfolios | | | | | | | 22,493 | |
Unaffiliated Underlying Portfolios | | | | | | | 86,615 | |
Net realized gain distributions from: | | | | | | | | |
Affiliated Underlying Portfolios | | | | | | | 14,671 | |
Unaffiliated Underlying Portfolios | | | | | | | 17,616 | |
Net change in unrealized appreciation/depreciation in: | | | | | | | | |
Affiliated Underlying Portfolios | | | | | | | 12,913 | |
Unaffiliated Underlying Portfolios | | | | | | | 135,896 | |
| | | | | | | | |
Net gain on investment transactions | | | | | | | 290,204 | |
| | | | | | | | |
Net Increase in Net Assets from Operations | | | | | | $ | 483,641 | |
| | | | | | | | |
See notes to financial statements.
| | |
| 96 | AB MULTI-MANAGER SELECT RETIREMENT FUNDS | | abfunds.com |
STATEMENT OF OPERATIONS (continued)
| | | | | | | | |
| | | AB Multi-Manager
Select
2010 Fund | | | | |
| Investment Income | | | | | | | | |
Dividends | | | | | | | | |
Income distributions from unaffiliated Underlying Portfolios | | $ | 184,360 | | | | | |
Income distributions from affiliated Underlying Portfolios | | | 147,554 | | | $ | 331,914 | |
| | | | | | | | |
| Expenses | | | | | | | | |
Advisory fee (see Note B) | | | 20,459 | | | | | |
Distribution fee – Class A | | | 1,044 | | | | | |
Distribution fee – Class C | | | 1,248 | | | | | |
Distribution fee – Class R | | | 2,988 | | | | | |
Distribution fee – Class K | | | 29,296 | | | | | |
Transfer agency – Class A | | | 4,637 | | | | | |
Transfer agency – Class C | | | 1,469 | | | | | |
Transfer agency – Advisor Class | | | 8,402 | | | | | |
Transfer agency – Class R | | | 1,292 | | | | | |
Transfer agency – Class K | | | 23,437 | | | | | |
Transfer agency – Class I | | | 41 | | | | | |
Transfer agency – Class Z | | | 2 | | | | | |
Registration fees | | | 93,824 | | | | | |
Custodian | | | 68,304 | | | | | |
Audit and tax | | | 35,538 | | | | | |
Legal | | | 28,402 | | | | | |
Directors’ fees | | | 27,338 | | | | | |
Printing | | | 2,261 | | | | | |
Miscellaneous | | | 8,957 | | | | | |
| | | | | | | | |
Total expenses | | | 358,939 | | | | | |
| | | | | | | | |
Less: expenses waived and reimbursed by the Adviser (see Note B) | | | (303,548 | ) | | | | |
| | | | | | | | |
Net expenses | | | | | | | 55,391 | |
| | | | | | | | |
Net investment income | | | | | | | 276,523 | |
| | | | | | | | |
| Realized and Unrealized Gain on Investment Transactions | | | | | | | | |
Net realized gain on: | | | | | | | | |
Affiliated Underlying Portfolios | | | | | | | 52,000 | |
Unaffiliated Underlying Portfolios | | | | | | | 256,548 | |
Net realized gain distributions from: | | | | | | | | |
Affiliated Underlying Portfolios | | | | | | | 19,353 | |
Unaffiliated Underlying Portfolios | | | | | | | 33,098 | |
Net change in unrealized appreciation/depreciation in: | | | | | | | | |
Affiliated Underlying Portfolios | | | | | | | (40,082 | ) |
Unaffiliated Underlying Portfolios | | | | | | | 220,625 | |
| | | | | | | | |
Net gain on investment transactions | | | | | | | 541,542 | |
| | | | | | | | |
Net Increase in Net Assets from Operations | | | | | | $ | 818,065 | |
| | | | | | | | |
See notes to financial statements.
| | |
| abfunds.com | | AB MULTI-MANAGER SELECT RETIREMENT FUNDS | 97 |
STATEMENT OF OPERATIONS (continued)
| | | | | | | | |
| | | AB Multi-Manager
Select
2015 Fund | | | | |
| Investment Income | | | | | | | | |
Dividends | | | | | | | | |
Income distributions from unaffiliated Underlying Portfolios | | $ | 575,005 | | | | | |
Income distributions from affiliated Underlying Portfolios | | | 483,031 | | | $ | 1,058,036 | |
| | | | | | | | |
| Expenses | | | | | | | | |
Advisory fee (see Note B) | | | 64,506 | | | | | |
Distribution fee – Class A | | | 6,168 | | | | | |
Distribution fee – Class C | | | 7,320 | | | | | |
Distribution fee – Class R | | | 1,919 | | | | | |
Distribution fee – Class K | | | 97,054 | | | | | |
Transfer agency – Class A | | | 3,644 | | | | | |
Transfer agency – Class C | | | 1,135 | | | | | |
Transfer agency – Advisor Class | | | 112 | | | | | |
Transfer agency – Class R | | | 881 | | | | | |
Transfer agency – Class K | | | 76,849 | | | | | |
Transfer agency – Class I | | | 584 | | | | | |
Transfer agency – Class Z | | | 2 | | | | | |
Registration fees | | | 94,174 | | | | | |
Custodian | | | 68,979 | | | | | |
Audit and tax | | | 33,758 | | | | | |
Legal | | | 28,417 | | | | | |
Directors’ fees | | | 27,337 | | | | | |
Printing | | | 4,508 | | | | | |
Miscellaneous | | | 11,654 | | | | | |
| | | | | | | | |
Total expenses | | | 529,001 | | | | | |
| | | | | | | | |
Less: expenses waived and reimbursed by the Adviser (see Note B) | | | (352,332 | ) | | | | |
| | | | | | | | |
Net expenses | | | | | | | 176,669 | |
| | | | | | | | |
Net investment income | | | | | | | 881,367 | |
| | | | | | | | |
| Realized and Unrealized Gain on Investment Transactions | | | | | | | | |
Net realized gain on: | | | | | | | | |
Affiliated Underlying Portfolios | | | | | | | 158,957 | |
Unaffiliated Underlying Portfolios | | | | | | | 896,752 | |
Net realized gain distributions from: | | | | | | | | |
Affiliated Underlying Portfolios | | | | | | | 62,205 | |
Unaffiliated Underlying Portfolios | | | | | | | 115,264 | |
Net change in unrealized appreciation/depreciation in: | | | | | | | | |
Affiliated Underlying Portfolios | | | | | | | (61,192 | ) |
Unaffiliated Underlying Portfolios | | | | | | | 1,017,889 | |
| | | | | | | | |
Net gain on investment transactions | | | | | | | 2,189,875 | |
| | | | | | | | |
Net Increase in Net Assets from Operations | | | | | | $ | 3,071,242 | |
| | | | | | | | |
See notes to financial statements.
| | |
| 98 | AB MULTI-MANAGER SELECT RETIREMENT FUNDS | | abfunds.com |
STATEMENT OF OPERATIONS (continued)
| | | | | | | | |
| | | AB Multi-Manager
Select
2020 Fund | | | | |
| Investment Income | | | | | | | | |
Dividends | | | | | | | | |
Income distributions from unaffiliated Underlying Portfolios | | $ | 1,165,548 | | | | | |
Income distributions from affiliated Underlying Portfolios | | | 1,000,702 | | | $ | 2,166,250 | |
| | | | | | | | |
| Expenses | | | | | | | | |
Advisory fee (see Note B) | | | 132,235 | | | | | |
Distribution fee – Class A | | | 14,881 | | | | | |
Distribution fee – Class C | | | 13,926 | | | | | |
Distribution fee – Class R | | | 10,156 | | | | | |
Distribution fee – Class K | | | 190,737 | | | | | |
Transfer agency – Class A | | | 6,235 | | | | | |
Transfer agency – Class C | | | 1,479 | | | | | |
Transfer agency – Advisor Class | | | 210 | | | | | |
Transfer agency – Class R | | | 4,144 | | | | | |
Transfer agency – Class K | | | 139,372 | | | | | |
Transfer agency – Class I | | | 2,733 | | | | | |
Transfer agency – Class Z | | | 2 | | | | | |
Registration fees | | | 94,400 | | | | | |
Custodian | | | 69,594 | | | | | |
Audit and tax | | | 33,764 | | | | | |
Legal | | | 28,429 | | | | | |
Directors’ fees | | | 27,338 | | | | | |
Printing | | | 9,713 | | | | | |
Miscellaneous | | | 15,837 | | | | | |
| | | | | | | | |
Total expenses | | | 795,185 | | | | | |
| | | | | | | | |
Less: expenses waived and reimbursed by the Adviser (see Note B) | | | (396,031 | ) | | | | |
| | | | | | | | |
Net expenses | | | | | | | 399,154 | |
| | | | | | | | |
Net investment income | | | | | | | 1,767,096 | |
| | | | | | | | |
| Realized and Unrealized Gain on Investment Transactions | | | | | | | | |
Net realized gain on: | | | | | | | | |
Affiliated Underlying Portfolios | | | | | | | 244,653 | |
Unaffiliated Underlying Portfolios | | | | | | | 1,820,870 | |
Net realized gain distributions from: | | | | | | | | |
Affiliated Underlying Portfolios | | | | | | | 211,371 | |
Unaffiliated Underlying Portfolios | | | | | | | 231,078 | |
Net change in unrealized appreciation/depreciation in: | | | | | | | | |
Affiliated Underlying Portfolios | | | | | | | 331,885 | |
Unaffiliated Underlying Portfolios | | | | | | | 3,121,751 | |
| | | | | | | | |
Net gain on investment transactions | | | | | | | 5,961,608 | |
| | | | | | | | |
Net Increase in Net Assets from Operations | | | | | | $ | 7,728,704 | |
| | | | | | | | |
See notes to financial statements.
| | |
| abfunds.com | | AB MULTI-MANAGER SELECT RETIREMENT FUNDS | 99 |
STATEMENT OF OPERATIONS (continued)
| | | | | | | | |
| | | AB Multi-Manager
Select
2025 Fund | | | | |
| Investment Income | | | | | | | | |
Dividends | | | | | | | | |
Income distributions from unaffiliated Underlying Portfolios | | $ | 1,672,590 | | | | | |
Income distributions from affiliated Underlying Portfolios | | | 1,363,712 | | | $ | 3,036,302 | |
| | | | | | | | |
| Expenses | | | | | | | | |
Advisory fee (see Note B) | | | 184,754 | | | | | |
Distribution fee – Class A | | | 13,717 | | | | | |
Distribution fee – Class C | | | 7,891 | | | | | |
Distribution fee – Class R | | | 14,098 | | | | | |
Distribution fee – Class K | | | 275,977 | | | | | |
Transfer agency – Class A | | | 6,854 | | | | | |
Transfer agency – Class C | | | 1,167 | | | | | |
Transfer agency – Advisor Class | | | 1,046 | | | | | |
Transfer agency – Class R | | | 4,320 | | | | | |
Transfer agency – Class K | | | 203,307 | | | | | |
Transfer agency – Class I | | | 3,129 | | | | | |
Transfer agency – Class Z | | | 6 | | | | | |
Registration fees | | | 94,955 | | | | | |
Custodian | | | 70,533 | | | | | |
Audit and tax | | | 33,766 | | | | | |
Legal | | | 28,439 | | | | | |
Directors’ fees | | | 27,337 | | | | | |
Printing | | | 11,297 | | | | | |
Miscellaneous | | | 17,420 | | | | | |
| | | | | | | | |
Total expenses | | | 1,000,013 | | | | | |
| | | | | | | | |
Less: expenses waived and reimbursed by the Adviser (see Note B) | | | (463,781 | ) | | | | |
| | | | | | | | |
Net expenses | | | | | | | 536,232 | |
| | | | | | | | |
Net investment income | | | | | | | 2,500,070 | |
| | | | | | | | |
| Realized and Unrealized Gain on Investment Transactions | | | | | | | | |
Net realized gain on: | | | | | | | | |
Affiliated Underlying Portfolios | | | | | | | 297,750 | |
Unaffiliated Underlying Portfolios | | | | | | | 2,454,475 | |
Net realized gain distributions from: | | | | | | | | |
Affiliated Underlying Portfolios | | | | | | | 389,096 | |
Unaffiliated Underlying Portfolios | | | | | | | 380,377 | |
Net change in unrealized appreciation/depreciation in: | | | | | | | | |
Affiliated Underlying Portfolios | | | | | | | 1,366,856 | |
Unaffiliated Underlying Portfolios | | | | | | | 5,208,399 | |
| | | | | | | | |
Net gain on investment transactions | | | | | | | 10,096,953 | |
| | | | | | | | |
Net Increase in Net Assets from Operations | | | | | | $ | 12,597,023 | |
| | | | | | | | |
See notes to financial statements.
| | |
| 100 | AB MULTI-MANAGER SELECT RETIREMENT FUNDS | | abfunds.com |
STATEMENT OF OPERATIONS (continued)
| | | | | | | | |
| | | AB Multi-Manager
Select
2030 Fund | | | | |
| Investment Income | | | | | | | | |
Dividends | | | | | | | | |
Income distributions from unaffiliated Underlying Portfolios | | $ | 1,192,995 | | | | | |
Income distributions from affiliated Underlying Portfolios | | | 968,543 | | | $ | 2,161,538 | |
| | | | | | | | |
| Expenses | | | | | | | | |
Advisory fee (see Note B) | | | 134,396 | | | | | |
Distribution fee – Class A | | | 15,321 | | | | | |
Distribution fee – Class C | | | 9,565 | | | | | |
Distribution fee – Class R | | | 7,717 | | | | | |
Distribution fee – Class K | | | 192,013 | | | | | |
Transfer agency – Class A | | | 7,101 | | | | | |
Transfer agency – Class C | | | 1,222 | | | | | |
Transfer agency – Advisor Class | | | 866 | | | | | |
Transfer agency – Class R | | | 2,867 | | | | | |
Transfer agency – Class K | | | 136,669 | | | | | |
Transfer agency – Class I | | | 3,657 | | | | | |
Transfer agency – Class Z | | | 3 | | | | | |
Registration fees | | | 94,274 | | | | | |
Custodian | | | 69,733 | | | | | |
Audit and tax | | | 33,764 | | | | | |
Legal | | | 28,430 | | | | | |
Directors’ fees | | | 27,338 | | | | | |
Printing | | | 12,255 | | | | | |
Miscellaneous | | | 14,178 | | | | | |
| | | | | | | | |
Total expenses | | | 791,369 | | | | | |
| | | | | | | | |
Less: expenses waived and reimbursed by the Adviser (see Note B) | | | (361,709 | ) | | | | |
| | | | | | | | |
Net expenses | | | | | | | 429,660 | |
| | | | | | | | |
Net investment income | | | | | | | 1,731,878 | |
| | | | | | | | |
| Realized and Unrealized Gain on Investment Transactions | | | | | | | | |
Net realized gain on: | | | | | | | | |
Affiliated Underlying Portfolios | | | | | | | 314,314 | |
Unaffiliated Underlying Portfolios | | | | | | | 2,335,229 | |
Net realized gain distributions from: | | | | | | | | |
Affiliated Underlying Portfolios | | | | | | | 330,474 | |
Unaffiliated Underlying Portfolios | | | | | | | 306,283 | |
Net change in unrealized appreciation/depreciation in: | | | | | | | | |
Affiliated Underlying Portfolios | | | | | | | 1,313,735 | |
Unaffiliated Underlying Portfolios | | | | | | | 4,441,235 | |
| | | | | | | | |
Net gain on investment transactions | | | | | | | 9,041,270 | |
| | | | | | | | |
Net Increase in Net Assets from Operations | | | | | | $ | 10,773,148 | |
| | | | | | | | |
See notes to financial statements.
| | |
| abfunds.com | | AB MULTI-MANAGER SELECT RETIREMENT FUNDS | 101 |
STATEMENT OF OPERATIONS (continued)
| | | | | | | | |
| | | AB Multi-Manager
Select
2035 Fund | | | | |
| Investment Income | | | | | | | | |
Dividends | | | | | | | | |
Income distributions from unaffiliated Underlying Portfolios | | $ | 1,007,360 | | | | | |
Income distributions from affiliated Underlying Portfolios | | | 751,726 | | | $ | 1,759,086 | |
| | | | | | | | |
| Expenses | | | | | | | | |
Advisory fee (see Note B) | | | 117,296 | | | | | |
Distribution fee – Class A | | | 11,926 | | | | | |
Distribution fee – Class C | | | 9,336 | | | | | |
Distribution fee – Class R | | | 7,711 | | | | | |
Distribution fee – Class K | | | 167,284 | | | | | |
Transfer agency – Class A | | | 7,446 | | | | | |
Transfer agency – Class C | | | 1,648 | | | | | |
Transfer agency – Advisor Class | | | 784 | | | | | |
Transfer agency – Class R | | | 1,758 | | | | | |
Transfer agency – Class K | | | 115,378 | | | | | |
Transfer agency – Class I | | | 3,927 | | | | | |
Transfer agency – Class Z | | | 3 | | | | | |
Registration fees | | | 94,444 | | | | | |
Custodian | | | 69,169 | | | | | |
Audit and tax | | | 33,763 | | | | | |
Legal | | | 28,425 | | | | | |
Directors’ fees | | | 27,337 | | | | | |
Printing | | | 13,262 | | | | | |
Miscellaneous | | | 13,883 | | | | | |
| | | | | | | | |
Total expenses | | | 724,780 | | | | | |
| | | | | | | | |
Less: expenses waived and reimbursed by the Adviser (see Note B) | | | (347,405 | ) | | | | |
| | | | | | | | |
Net expenses | | | | | | | 377,375 | |
| | | | | | | | |
Net investment income | | | | | | | 1,381,711 | |
| | | | | | | | |
| Realized and Unrealized Gain on Investment Transactions | | | | | | | | |
Net realized gain on: | | | | | | | | |
Affiliated Underlying Portfolios | | | | | | | 198,603 | |
Unaffiliated Underlying Portfolios | | | | | | | 1,722,034 | |
Net realized gain distributions from: | | | | | | | | |
Affiliated Underlying Portfolios | �� | | | | | | 379,968 | |
Unaffiliated Underlying Portfolios | | | | | | | 286,532 | |
Net change in unrealized appreciation/depreciation in: | | | | | | | | |
Affiliated Underlying Portfolios | | | | | | | 1,679,912 | |
Unaffiliated Underlying Portfolios | | | | | | | 5,024,858 | |
| | | | | | | | |
Net gain on investment transactions | | | | | | | 9,291,907 | |
| | | | | | | | |
Net Increase in Net Assets from Operations | | | | | | $ | 10,673,618 | |
| | | | | | | | |
See notes to financial statements.
| | |
| 102 | AB MULTI-MANAGER SELECT RETIREMENT FUNDS | | abfunds.com |
STATEMENT OF OPERATIONS (continued)
| | | | | | | | |
| | | AB Multi-Manager
Select
2040 Fund | | | | |
| Investment Income | | | | | | | | |
Dividends | | | | | | | | |
Income distributions from unaffiliated Underlying Portfolios | | $ | 786,067 | | | | | |
Income distributions from affiliated Underlying Portfolios | | | 412,817 | | | $ | 1,198,884 | |
| | | | | | | | |
| Expenses | | | | | | | | |
Advisory fee (see Note B) | | | 87,840 | | | | | |
Distribution fee – Class A | | | 10,595 | | | | | |
Distribution fee – Class C | | | 7,708 | | | | | |
Distribution fee – Class R | | | 6,653 | | | | | |
Distribution fee – Class K | | | 121,375 | | | | | |
Transfer agency – Class A | | | 6,972 | | | | | |
Transfer agency – Class C | | | 1,500 | | | | | |
Transfer agency – Advisor Class | | | 671 | | | | | |
Transfer agency – Class R | | | 2,016 | | | | | |
Transfer agency – Class K | | | 88,587 | | | | | |
Transfer agency – Class I | | | 2,815 | | | | | |
Transfer agency – Class Z | | | 110 | | | | | |
Registration fees | | | 94,376 | | | | | |
Custodian | | | 68,971 | | | | | |
Audit and tax | | | 33,757 | | | | | |
Legal | | | 28,420 | | | | | |
Directors’ fees | | | 27,337 | | | | | |
Printing | | | 10,664 | | | | | |
Miscellaneous | | | 13,473 | | | | | |
| | | | | | | | |
Total expenses | | | 613,840 | | | | | |
| | | | | | | | |
Less: expenses waived and reimbursed by the Adviser (see Note B) | | | (310,101 | ) | | | | |
| | | | | | | | |
Net expenses | | | | | | | 303,739 | |
| | | | | | | | |
Net investment income | | | | | | | 895,145 | |
| | | | | | | | |
| Realized and Unrealized Gain on Investment Transactions | | | | | | | | |
Net realized gain on: | | | | | | | | |
Affiliated Underlying Portfolios | | | | | | | 97,200 | |
Unaffiliated Underlying Portfolios | | | | | | | 1,311,260 | |
Net realized gain distributions from: | | | | | | | | |
Affiliated Underlying Portfolios | | | | | | | 388,901 | |
Unaffiliated Underlying Portfolios | | | | | | | 239,658 | |
Net change in unrealized appreciation/depreciation in: | | | | | | | | |
Affiliated Underlying Portfolios | | | | | | | 1,619,187 | |
Unaffiliated Underlying Portfolios | | | | | | | 3,677,413 | |
| | | | | | | | |
Net gain on investment transactions | | | | | | | 7,333,619 | |
| | | | | | | | |
Net Increase in Net Assets from Operations | | | | | | $ | 8,228,764 | |
| | | | | | | | |
See notes to financial statements.
| | |
| abfunds.com | | AB MULTI-MANAGER SELECT RETIREMENT FUNDS | 103 |
STATEMENT OF OPERATIONS (continued)
| | | | | | | | |
| | | AB Multi-Manager
Select
2045 Fund | | | | |
| Investment Income | | | | | | | | |
Dividends | | | | | | | | |
Income distributions from unaffiliated Underlying Portfolios | | $ | 610,095 | | | | | |
Income distributions from affiliated Underlying Portfolios | | | 311,510 | | | $ | 921,605 | |
| | | | | | | | |
| Expenses | | | | | | | | |
Advisory fee (see Note B) | | | 70,850 | | | | | |
Distribution fee – Class A | | | 8,438 | | | | | |
Distribution fee – Class C | | | 2,858 | | | | | |
Distribution fee – Class R | | | 10,088 | | | | | |
Distribution fee – Class K | | | 95,547 | | | | | |
Transfer agency – Class A | | | 9,250 | | | | | |
Transfer agency – Class C | | | 855 | | | | | |
Transfer agency – Advisor Class | | | 88 | | | | | |
Transfer agency – Class R | | | 1,884 | | | | | |
Transfer agency – Class K | | | 66,801 | | | | | |
Transfer agency – Class I | | | 3,079 | | | | | |
Transfer agency – Class Z | | | 67 | | | | | |
Registration fees | | | 94,838 | | | | | |
Custodian | | | 68,296 | | | | | |
Audit and tax | | | 33,757 | | | | | |
Legal | | | 28,417 | | | | | |
Directors’ fees | | | 27,337 | | | | | |
Printing | | | 11,686 | | | | | |
Miscellaneous | | | 12,828 | | | | | |
| | | | | | | | |
Total expenses | | | 546,964 | | | | | |
| | | | | | | | |
Less: expenses waived and reimbursed by the Adviser (see Note B) | | | (311,111 | ) | | | | |
| | | | | | | | |
Net expenses | | | | | | | 235,853 | |
| | | | | | | | |
Net investment income | | | | | | | 685,752 | |
| | | | | | | | |
| Realized and Unrealized Gain on Investment Transactions | | | | | | | | |
Net realized gain on: | | | | | | | | |
Affiliated Underlying Portfolios | | | | | | | 90,402 | |
Unaffiliated Underlying Portfolios | | | | | | | 1,021,446 | |
Net realized gain distributions from: | | | | | | | | |
Affiliated Underlying Portfolios | | | | | | | 321,098 | |
Unaffiliated Underlying Portfolios | | | | | | | 228,434 | |
Net change in unrealized appreciation/depreciation in: | | | | | | | | |
Affiliated Underlying Portfolios | | | | | | | 1,283,762 | |
Unaffiliated Underlying Portfolios | | | | | | | 3,365,447 | |
| | | | | | | | |
Net gain on investment transactions | | | | | | | 6,310,589 | |
| | | | | | | | |
Net Increase in Net Assets from Operations | | | | | | $ | 6,996,341 | |
| | | | | | | | |
See notes to financial statements.
| | |
| 104 | AB MULTI-MANAGER SELECT RETIREMENT FUNDS | | abfunds.com |
STATEMENT OF OPERATIONS (continued)
| | | | | | | | |
| | | AB Multi-Manager
Select
2050 Fund | | | | |
| Investment Income | | | | | | | | |
Dividends | | | | | | | | |
Income distributions from unaffiliated Underlying Portfolios | | $ | 249,651 | | | | | |
Income distributions from affiliated Underlying Portfolios | | | 131,231 | | | $ | 380,882 | |
| | | | | | | | |
| Expenses | | | | | | | | |
Advisory fee (see Note B) | | | 28,787 | | | | | |
Distribution fee – Class A | | | 2,478 | | | | | |
Distribution fee – Class C | | | 649 | | | | | |
Distribution fee – Class R | | | 2,350 | | | | | |
Distribution fee – Class K | | | 39,417 | | | | | |
Transfer agency – Class A | | | 12,233 | | | | | |
Transfer agency – Class C | | | 864 | | | | | |
Transfer agency – Advisor Class | | | 1,032 | | | | | |
Transfer agency – Class R | | | 948 | | | | | |
Transfer agency – Class K | | | 28,011 | | | | | |
Transfer agency – Class I | | | 1,868 | | | | | |
Transfer agency – Class Z | | | 2 | | | | | |
Registration fees | | | 93,924 | | | | | |
Custodian | | | 67,617 | | | | | |
Audit and tax | | | 35,538 | | | | | |
Legal | | | 28,407 | | | | | |
Directors’ fees | | | 27,337 | | | | | |
Printing | | | 7,981 | | | | | |
Miscellaneous | | | 10,024 | | | | | |
| | | | | | | | |
Total expenses | | | 389,467 | | | | | |
| | | | | | | | |
Less: expenses waived and reimbursed by the Adviser (see Note B) | | | (295,686 | ) | | | | |
| | | | | | | | |
Net expenses | | | | | | | 93,781 | |
| | | | | | | | |
Net investment income | | | | | | | 287,101 | |
| | | | | | | | |
| Realized and Unrealized Gain on Investment Transactions | | | | | | | | |
Net realized gain on: | | | | | | | | |
Affiliated Underlying Portfolios | | | | | | | 49,738 | |
Unaffiliated Underlying Portfolios | | | | | | | 415,116 | |
Net realized gain distributions from: | | | | | | | | |
Affiliated Underlying Portfolios | | | | | | | 136,202 | |
Unaffiliated Underlying Portfolios | | | | | | | 91,948 | |
Net change in unrealized appreciation/depreciation in: | | | | | | | | |
Affiliated Underlying Portfolios | | | | | | | 513,531 | |
Unaffiliated Underlying Portfolios | | | | | | | 1,417,352 | |
| | | | | | | | |
Net gain on investment transactions | | | | | | | 2,623,887 | |
| | | | | | | | |
Net Increase in Net Assets from Operations | | | | | | $ | 2,910,988 | |
| | | | | | | | |
See notes to financial statements.
| | |
| abfunds.com | | AB MULTI-MANAGER SELECT RETIREMENT FUNDS | 105 |
STATEMENT OF OPERATIONS (continued)
| | | | | | | | |
| | | AB Multi-Manager
Select
2055 Fund | | | | |
| Investment Income | | | | | | | | |
Dividends | | | | | | | | |
Income distributions from unaffiliated Underlying Portfolios | | $ | 254,439 | | | | | |
Income distributions from affiliated Underlying Portfolios | | | 130,664 | | | $ | 385,103 | |
| | | | | | | | |
| Expenses | | | | | | | | |
Advisory fee (see Note B) | | | 29,883 | | | | | |
Distribution fee – Class A | | | 2,051 | | | | | |
Distribution fee – Class C | | | 1,204 | | | | | |
Distribution fee – Class R | | | 778 | | | | | |
Distribution fee – Class K | | | 42,629 | | | | | |
Transfer agency – Class A | | | 7,927 | | | | | |
Transfer agency – Class C | | | 1,207 | | | | | |
Transfer agency – Advisor Class | | | 4,908 | | | | | |
Transfer agency – Class R | | | 172 | | | | | |
Transfer agency – Class K | | | 28,223 | | | | | |
Transfer agency – Class I | | | 1,193 | | | | | |
Transfer agency – Class Z | | | 2 | | | | | |
Registration fees | | | 94,079 | | | | | |
Custodian | | | 67,666 | | | | | |
Audit and tax | | | 35,538 | | | | | |
Legal | | | 28,407 | | | | | |
Directors’ fees | | | 27,338 | | | | | |
Printing | | | 9,889 | | | | | |
Miscellaneous | | | 9,685 | | | | | |
| | | | | | | | |
Total expenses | | | 392,779 | | | | | |
| | | | | | | | |
Less: expenses waived and reimbursed by the Adviser (see Note B) | | | (294,089 | ) | | | | |
| | | | | | | | |
Net expenses | | | | | | | 98,690 | |
| | | | | | | | |
Net investment income | | | | | | | 286,413 | |
| | | | | | | | |
| Realized and Unrealized Gain on Investment Transactions | | | | | | | | |
Net realized gain on: | | | | | | | | |
Affiliated Underlying Portfolios | | | | | | | 30,282 | |
Unaffiliated Underlying Portfolios | | | | | | | 386,800 | |
Net realized gain distributions from: | | | | | | | | |
Affiliated Underlying Portfolios | | | | | | | 133,999 | |
Unaffiliated Underlying Portfolios | | | | | | | 90,682 | |
Net change in unrealized appreciation/depreciation in: | | | | | | | | |
Affiliated Underlying Portfolios | | | | | | | 565,322 | |
Unaffiliated Underlying Portfolios | | | | | | | 1,537,443 | |
| | | | | | | | |
Net gain on investment transactions | | | | | | | 2,744,528 | |
| | | | | | | | |
Net Increase in Net Assets from Operations | | | | | | $ | 3,030,941 | |
| | | | | | | | |
See notes to financial statements.
| | |
| 106 | AB MULTI-MANAGER SELECT RETIREMENT FUNDS | | abfunds.com |
STATEMENT OF CHANGES IN NET ASSETS
| | | | | | | | |
| | | AB Multi-Manager Select
Retirement Allocation Fund | |
| | | Year Ended
July 31,
2017 | | | Year Ended
July 31,
2016 | |
| Increase (Decrease) in Net Assets from Operations | | | | | | | | |
Net investment income | | $ | 193,437 | | | $ | 157,559 | |
Net realized gain (loss) on Underlying Portfolios | | | 109,108 | | | | (217,074 | ) |
Net realized gain distributions from Underlying Portfolios | | | 32,287 | | | | 84,535 | |
Net change in unrealized appreciation/depreciation of investments in Underlying Portfolios | | | 148,809 | | | | 255,905 | |
Contributions from Affiliates (see Note B) | | | – 0 | – | | | 53 | |
| | | | | | | | |
Net increase in net assets from operations | | | 483,641 | | | | 280,978 | |
| Dividends and Distributions to Shareholders from | | | | | | | | |
Net investment income | | | | | | | | |
Class A | | | – 0 | – | | | (895 | ) |
Class R | | | (729 | ) | | | (249 | ) |
Class K | | | (156,811 | ) | | | (81,657 | ) |
Class I | | | (17,281 | ) | | | (17,120 | ) |
Class Z | | | (234 | ) | | | (109 | ) |
Net realized gain on investment transactions | | | | | | | | |
Class A | | | – 0 | – | | | (283 | ) |
Class C | | | – 0 | – | | | (63 | ) |
Advisor Class | | | – 0 | – | | | (6 | ) |
Class R | | | – 0 | – | | | (18 | ) |
Class K | | | – 0 | – | | | (4,771 | ) |
Class I | | | – 0 | – | | | (965 | ) |
Class Z | | | – 0 | – | | | (6 | ) |
| Capital Stock Transactions | | | | | | | | |
Net increase (decrease) | | | (438,400 | ) | | | 7,714,437 | |
| | | | | | | | |
Total increase (decrease) | | | (129,814 | ) | | | 7,889,273 | |
| Net Assets | | | | | | | | |
Beginning of period | | | 9,604,279 | | | | 1,715,006 | |
| | | | | | | | |
End of period (including undistributed net investment income of $70,635 and $60,507, respectively) | | $ | 9,474,465 | | | $ | 9,604,279 | |
| | | | | | | | |
See notes to financial statements.
| | |
| abfunds.com | | AB MULTI-MANAGER SELECT RETIREMENT FUNDS | 107 |
STATEMENT OF CHANGES IN NET ASSETS (continued)
| | | | | | | | |
| | | AB Multi-Manager Select
2010 Fund | |
| | | Year Ended
July 31,
2017 | | | Year Ended
July 31,
2016 | |
| Increase (Decrease) in Net Assets from Operations | | | | | | | | |
Net investment income | | $ | 276,523 | | | $ | 276,811 | |
Net realized gain (loss) on Underlying Portfolios | | | 308,548 | | | | (218,217 | ) |
Net realized gain distributions from Underlying Portfolios | | | 52,451 | | | | 136,673 | |
Net change in unrealized appreciation/depreciation of investments in Underlying Portfolios | | | 180,543 | | | | 537,944 | |
Contributions from Affiliates (see Note B) | | | – 0 | – | | | 112 | |
| | | | | | | | |
Net increase in net assets from operations | | | 818,065 | | | | 733,323 | |
| Dividends and Distributions to Shareholders from | | | | | | | | |
Net investment income | | | | | | | | |
Class A | | | (419 | ) | | | (5,458 | ) |
Class C | | | – 0 | – | | | (451 | ) |
Advisor Class | | | (10,370 | ) | | | (3,238 | ) |
Class R | | | (10,769 | ) | | | (5,553 | ) |
Class K | | | (230,069 | ) | | | (155,650 | ) |
Class I | | | (610 | ) | | | (10,521 | ) |
Class Z | | | (265 | ) | | | (112 | ) |
Net realized gain on investment transactions | | | | | | | | |
Class A | | | (1,101 | ) | | | (1,013 | ) |
Class C | | | (321 | ) | | | (301 | ) |
Advisor Class | | | (2,149 | ) | | | (725 | ) |
Class R | | | (1,827 | ) | | | (750 | ) |
Class K | | | (34,560 | ) | | | (19,746 | ) |
Class I | �� | | (70 | ) | | | (1,308 | ) |
Class Z | | | (33 | ) | | | (14 | ) |
| Capital Stock Transactions | | | | | | | | |
Net increase (decrease) | | | (2,647,412 | ) | | | 13,173,107 | |
| | | | | | | | |
Total increase (decrease) | | | (2,121,910 | ) | | | 13,701,590 | |
| Net Assets | | | | | | | | |
Beginning of period | | | 15,321,004 | | | | 1,619,414 | |
| | | | | | | | |
End of period (including undistributed net investment income of $101,161 and $83,958, respectively) | | $ | 13,199,094 | | | $ | 15,321,004 | |
| | | | | | | | |
See notes to financial statements.
| | |
| 108 | AB MULTI-MANAGER SELECT RETIREMENT FUNDS | | abfunds.com |
STATEMENT OF CHANGES IN NET ASSETS (continued)
| | | | | | | | |
| | | AB Multi-Manager Select
2015 Fund | |
| | | Year Ended
July 31,
2017 | | | Year Ended
July 31,
2016 | |
| Increase (Decrease) in Net Assets from Operations | | | | | | | | |
Net investment income | | $ | 881,367 | | | $ | 875,880 | |
Net realized gain (loss) on Underlying Portfolios | | | 1,055,709 | | | | (607,154 | ) |
Net realized gain distributions from Underlying Portfolios | | | 177,469 | | | | 427,076 | |
Net change in unrealized appreciation/depreciation of investments in Underlying Portfolios | | | 956,697 | | | | 1,841,266 | |
Contributions from Affiliates (see Note B) | | | – 0 | – | | | 409 | |
| | | | | | | | |
Net increase in net assets from operations | | | 3,071,242 | | | | 2,537,477 | |
| Dividends and Distributions to Shareholders from | | | | | | | | |
Net investment income | | | | | | | | |
Class A | | | (34,876 | ) | | | (44,721 | ) |
Class C | | | (9,155 | ) | | | (5,527 | ) |
Advisor Class | | | (1,595 | ) | | | (92 | ) |
Class R | | | (6,163 | ) | | | (5,374 | ) |
Class K | | | (764,529 | ) | | | (539,098 | ) |
Class I | | | (13,513 | ) | | | (17,211 | ) |
Class Z | | | (257 | ) | | | (146 | ) |
Net realized gain on investment transactions | | | | | | | | |
Class A | | | (10,425 | ) | | | (848 | ) |
Class C | | | (3,838 | ) | | | (192 | ) |
Advisor Class | | | (365 | ) | | | (16 | ) |
Class R | | | (2,037 | ) | | | (109 | ) |
Class K | | | (205,519 | ) | | | (9,787 | ) |
Class I | | | (3,065 | ) | | | (301 | ) |
Class Z | | | (57 | ) | | | (3 | ) |
| Capital Stock Transactions | | | | | | | | |
Net increase (decrease) | | | (6,878,024 | ) | | | 39,408,217 | |
| | | | | | | | |
Total increase (decrease) | | | (4,862,176 | ) | | | 41,322,269 | |
| Net Assets | | | | | | | | |
Beginning of period | | | 46,931,200 | | | | 5,608,931 | |
| | | | | | | | |
End of period (including undistributed net investment income of $307,001 and $279,277, respectively) | | $ | 42,069,024 | | | $ | 46,931,200 | |
| | | | | | | | |
See notes to financial statements.
| | |
| abfunds.com | | AB MULTI-MANAGER SELECT RETIREMENT FUNDS | 109 |
STATEMENT OF CHANGES IN NET ASSETS (continued)
| | | | | | | | |
| | | AB Multi-Manager Select
2020 Fund | |
| | | Year Ended
July 31,
2017 | | | Year Ended
July 31,
2016 | |
| Increase (Decrease) in Net Assets from Operations | | | | | | | | |
Net investment income | | $ | 1,767,096 | | | $ | 1,496,809 | |
Net realized gain (loss) on Underlying Portfolios | | | 2,065,523 | | | | (1,327,076 | ) |
Net realized gain distributions from Underlying Portfolios | | | 442,449 | | | | 893,647 | |
Net change in unrealized appreciation/depreciation of investments in Underlying Portfolios | | | 3,453,636 | | | | 3,186,030 | |
Contributions from Affiliates (see Note B) | | | – 0 | – | | | 737 | |
| | | | | | | | |
Net increase in net assets from operations | | | 7,728,704 | | | | 4,250,147 | |
| Dividends and Distributions to Shareholders from | | | | | | | | |
Net investment income | | | | | | | | |
Class A | | | (88,088 | ) | | | (96,845 | ) |
Class C | | | (14,696 | ) | | | (11,090 | ) |
Advisor Class | | | (4,135 | ) | | | (2,646 | ) |
Class R | | | (26,966 | ) | | | (33,802 | ) |
Class K | | | (1,331,949 | ) | | | (879,682 | ) |
Class I | | | (49,437 | ) | | | (43,894 | ) |
Class Z | | | (238 | ) | | | (146 | ) |
Net realized gain on investment transactions | | | | | | | | |
Class A | | | (25,316 | ) | | | (4,254 | ) |
Class C | | | (6,210 | ) | | | (642 | ) |
Advisor Class | | | (948 | ) | | | (118 | ) |
Class R | | | (9,846 | ) | | | (1,495 | ) |
Class K | | | (359,437 | ) | | | (37,691 | ) |
Class I | | | (11,434 | ) | | | (1,806 | ) |
Class Z | | | (53 | ) | | | (6 | ) |
| Capital Stock Transactions | | | | | | | | |
Net increase | | | 644,807 | | | | 74,929,382 | |
| | | | | | | | |
Total increase | | | 6,444,758 | | | | 78,065,412 | |
| Net Assets | | | | | | | | |
Beginning of period | | | 87,106,484 | | | | 9,041,072 | |
| | | | | | | | |
End of period (including undistributed net investment income of $643,435 and $460,139, respectively) | | $ | 93,551,242 | | | $ | 87,106,484 | |
| | | | | | | | |
See notes to financial statements.
| | |
| 110 | AB MULTI-MANAGER SELECT RETIREMENT FUNDS | | abfunds.com |
STATEMENT OF CHANGES IN NET ASSETS (continued)
| | | | | | | | |
| | | AB Multi-Manager Select
2025 Fund | |
| | | Year Ended
July 31,
2017 | | | Year Ended
July 31,
2016 | |
| Increase (Decrease) in Net Assets from Operations | | | | | | | | |
Net investment income | | $ | 2,500,070 | | | $ | 1,903,413 | |
Net realized gain (loss) on Underlying Portfolios | | | 2,752,225 | | | | (1,699,406 | ) |
Net realized gain distributions from Underlying Portfolios | | | 769,473 | | | | 1,352,542 | |
Net change in unrealized appreciation/depreciation of investments in Underlying Portfolios | | | 6,575,255 | | | | 4,553,207 | |
Contributions from Affiliates (see Note B) | | | – 0 | – | | | 1,004 | |
| | | | | | | | |
Net increase in net assets from operations | | | 12,597,023 | | | | 6,110,760 | |
| Dividends and Distributions to Shareholders from | | | | | | | | |
Net investment income | | | | | | | | |
Class A | | | (58,560 | ) | | | (113,937 | ) |
Class C | | | (9,756 | ) | | | (6,315 | ) |
Advisor Class | | | (15,502 | ) | | | (10,931 | ) |
Class R | | | (41,732 | ) | | | (37,348 | ) |
Class K | | | (1,894,206 | ) | | | (1,246,162 | ) |
Class I | | | (54,800 | ) | | | (45,386 | ) |
Class Z | | | (755 | ) | | | (153 | ) |
Net realized gain on investment transactions | | | | | | | | |
Class A | | | (29,013 | ) | | | (2,309 | ) |
Class C | | | (6,180 | ) | | | (175 | ) |
Advisor Class | | | (5,471 | ) | | | (231 | ) |
Class R | | | (20,866 | ) | | | (786 | ) |
Class K | | | (780,630 | ) | | | (25,044 | ) |
Class I | | | (19,261 | ) | | | (878 | ) |
Class Z | | | (255 | ) | | | (3 | ) |
| Capital Stock Transactions | | | | | | | | |
Net increase | | | 831,400 | | | | 104,712,301 | |
| | | | | | | | |
Total increase | | | 10,491,436 | | | | 109,333,403 | |
| Net Assets | | | | | | | | |
Beginning of period | | | 122,152,476 | | | | 12,819,073 | |
| | | | | | | | |
End of period (including undistributed net investment income of $835,186 and $473,311, respectively) | | $ | 132,643,912 | | | $ | 122,152,476 | |
| | | | | | | | |
See notes to financial statements.
| | |
| abfunds.com | | AB MULTI-MANAGER SELECT RETIREMENT FUNDS | 111 |
STATEMENT OF CHANGES IN NET ASSETS (continued)
| | | | | | | | |
| | | AB Multi-Manager Select
2030 Fund | |
| | | Year Ended
July 31,
2017 | | | Year Ended
July 31,
2016 | |
| Increase (Decrease) in Net Assets from Operations | | | | | | | | |
Net investment income | | $ | 1,731,878 | | | $ | 1,256,770 | |
Net realized gain (loss) on Underlying Portfolios | | | 2,649,543 | | | | (1,306,997 | ) |
Net realized gain distributions from Underlying Portfolios | | | 636,757 | | | | 1,101,209 | |
Net change in unrealized appreciation/depreciation of investments in Underlying Portfolios | | | 5,754,970 | | | | 3,055,202 | |
Contributions from Affiliates (see Note B) | | | – 0 | – | | | 708 | |
| | | | | | | | |
Net increase in net assets from operations | | | 10,773,148 | | | | 4,106,892 | |
| Dividends and Distributions to Shareholders from | | | | | | | | |
Net investment income | | | | | | | | |
Class A | | | (67,828 | ) | | | (100,804 | ) |
Class C | | | (9,903 | ) | | | (6,588 | ) |
Advisor Class | | | (13,562 | ) | | | (9,280 | ) |
Class R | | | (21,869 | ) | | | (26,331 | ) |
Class K | | | (1,194,305 | ) | | | (858,218 | ) |
Class I | | | (67,735 | ) | | | (37,057 | ) |
Class Z | | | (240 | ) | | | (152 | ) |
Net realized gain on investment transactions | | | | | | | | |
Class A | | | (41,193 | ) | | | (4,143 | ) |
Class C | | | (8,018 | ) | | | (337 | ) |
Advisor Class | | | (6,109 | ) | | | (378 | ) |
Class R | | | (15,399 | ) | | | (1,118 | ) |
Class K | | | (636,869 | ) | | | (34,425 | ) |
Class I | | | (30,156 | ) | | | (1,426 | ) |
Class Z | | | (105 | ) | | | (6 | ) |
| Capital Stock Transactions | | | | | | | | |
Net increase | | | 7,423,509 | | | | 73,094,721 | |
| | | | | | | | |
Total increase | | | 16,083,366 | | | | 76,121,350 | |
| Net Assets | | | | | | | | |
Beginning of period | | | 85,677,883 | | | | 9,556,533 | |
| | | | | | | | |
End of period (including undistributed net investment income of $537,651 and $239,251, respectively) | | $ | 101,761,249 | | | $ | 85,677,883 | |
| | | | | | | | |
See notes to financial statements.
| | |
| 112 | AB MULTI-MANAGER SELECT RETIREMENT FUNDS | | abfunds.com |
STATEMENT OF CHANGES IN NET ASSETS (continued)
| | | | | | | | |
| | | AB Multi-Manager Select
2035 Fund | |
| | | Year Ended
July 31,
2017 | | | Year Ended
July 31,
2016 | |
| Increase (Decrease) in Net Assets from Operations | | | | | | | | |
Net investment income | | $ | 1,381,711 | | | $ | 850,195 | |
Net realized gain (loss) on Underlying Portfolios | | | 1,920,637 | | | | (1,179,767 | ) |
Net realized gain distributions from Underlying Portfolios | | | 666,500 | | | | 1,023,613 | |
Net change in unrealized appreciation/depreciation of investments in Underlying Portfolios | | | 6,704,770 | | | | 2,610,836 | |
Contributions from Affiliates (see Note B) | | | – 0 | – | | | 580 | |
| | | | | | | | |
Net increase in net assets from operations | | | 10,673,618 | | | | 3,305,457 | |
| Dividends and Distributions to Shareholders from | | | | | | | | |
Net investment income | | | | | | | | |
Class A | | | (36,140 | ) | | | (87,915 | ) |
Class C | | | (8,011 | ) | | | (7,857 | ) |
Advisor Class | | | (7,300 | ) | | | (4,715 | ) |
Class R | | | (16,201 | ) | | | (18,346 | ) |
Class K | | | (836,846 | ) | | | (702,701 | ) |
Class I | | | (60,400 | ) | | | (54,125 | ) |
Class Z | | | (275 | ) | | | (159 | ) |
Net realized gain on investment transactions | | | | | | | | |
Class A | | | (27,220 | ) | | | (2,536 | ) |
Class C | | | (8,139 | ) | | | (291 | ) |
Advisor Class | | | (3,474 | ) | | | (178 | ) |
Class R | | | (11,632 | ) | | | (543 | ) |
Class K | | | (480,016 | ) | | | (19,834 | ) |
Class I | | | (28,468 | ) | | | (1,467 | ) |
Class Z | | | (125 | ) | | | (4 | ) |
| Capital Stock Transactions | | | | | | | | |
Net increase | | | 10,991,918 | | | | 60,431,624 | |
| | | | | | | | |
Total increase | | | 20,141,289 | | | | 62,836,410 | |
| Net Assets | | | | | | | | |
Beginning of period | | | 71,357,269 | | | | 8,520,859 | |
| | | | | | | | |
End of period (including undistributed net investment income of $413,386 and $0, respectively) | | $ | 91,498,558 | | | $ | 71,357,269 | |
| | | | | | | | |
See notes to financial statements.
| | |
| abfunds.com | | AB MULTI-MANAGER SELECT RETIREMENT FUNDS | 113 |
STATEMENT OF CHANGES IN NET ASSETS (continued)
| | | | | | | | |
| | | AB Multi-Manager Select
2040 Fund | |
| | | Year Ended
July 31,
2017 | | | Year Ended
July 31,
2016 | |
| Increase (Decrease) in Net Assets from Operations | | | | | | | | |
Net investment income | | $ | 895,145 | | | $ | 570,074 | |
Net realized gain (loss) on Underlying Portfolios | | | 1,408,460 | | | | (1,009,651 | ) |
Net realized gain distributions from Underlying Portfolios | | | 628,559 | | | | 915,613 | |
Net change in unrealized appreciation/depreciation of investments in Underlying Portfolios | | | 5,296,600 | | | | 1,782,987 | |
Contributions from Affiliates (see Note B) | | | – 0 | – | | | 355 | |
| | | | | | | | |
Net increase in net assets from operations | | | 8,228,764 | | | | 2,259,378 | |
| Dividends and Distributions to Shareholders from | | | | | | | | |
Net investment income | | | | | | | | |
Class A | | | (22,743 | ) | | | (80,802 | ) |
Class C | | | (6,144 | ) | | | (4,005 | ) |
Advisor Class | | | (5,361 | ) | | | (1,428 | ) |
Class R | | | (13,274 | ) | | | (14,549 | ) |
Class K | | | (584,318 | ) | | | (570,126 | ) |
Class I | | | (39,695 | ) | | | (37,557 | ) |
Class Z | | | (8,500 | ) | | | (7,672 | ) |
Net realized gain on investment transactions | | | | | | | | |
Class A | | | (21,120 | ) | | | (2,567 | ) |
Class C | | | (6,520 | ) | | | (185 | ) |
Advisor Class | | | (2,596 | ) | | | (66 | ) |
Class R | | | (9,662 | ) | | | (455 | ) |
Class K | | | (354,310 | ) | | | (17,633 | ) |
Class I | | | (19,137 | ) | | | (1,114 | ) |
Class Z | | | (3,954 | ) | | | (229 | ) |
| Capital Stock Transactions | | | | | | | | |
Net increase (decrease) | | | (1,214,511 | ) | | | 46,817,772 | |
| | | | | | | | |
Total increase | | | 5,916,919 | | | | 48,338,762 | |
| Net Assets | | | | | | | | |
Beginning of period | | | 58,645,397 | | | | 10,306,635 | |
| | | | | | | | |
End of period (including undistributed net investment income of $213,607 and $0, respectively) | | $ | 64,562,316 | | | $ | 58,645,397 | |
| | | | | | | | |
See notes to financial statements.
| | |
| 114 | AB MULTI-MANAGER SELECT RETIREMENT FUNDS | | abfunds.com |
STATEMENT OF CHANGES IN NET ASSETS (continued)
| | | | | | | | |
| | | AB Multi-Manager Select
2045 Fund | |
| | | Year Ended
July 31,
2017 | | | Year Ended
July 31,
2016 | |
| Increase (Decrease) in Net Assets from Operations | | | | | | | | |
Net investment income | | $ | 685,752 | | | $ | 412,158 | |
Net realized gain (loss) on Underlying Portfolios | | | 1,111,848 | | | | (755,895 | ) |
Net realized gain distributions from Underlying Portfolios | | | 549,532 | | | | 686,658 | |
Net change in unrealized appreciation/depreciation of investments in Underlying Portfolios | | | 4,649,209 | | | | 1,413,243 | |
Contributions from Affiliates (see Note B) | | | – 0 | – | | | 90 | |
| | | | | | | | |
Net increase in net assets from operations | | | 6,996,341 | | | | 1,756,254 | |
| Dividends and Distributions to Shareholders from | | | | | | | | |
Net investment income | | | | | | | | |
Class A | | | (15,732 | ) | | | (74,138 | ) |
Class C | | | (1,036 | ) | | | (812 | ) |
Advisor Class | | | (347 | ) | | | (292 | ) |
Class R | | | (19,126 | ) | | | (29,399 | ) |
Class K | | | (438,618 | ) | | | (407,986 | ) |
Class I | | | (40,162 | ) | | | (45,213 | ) |
Class Z | | | (5,050 | ) | | | (5,307 | ) |
Net realized gain on investment transactions | | | | | | | | |
Class A | | | (15,285 | ) | | | (2,518 | ) |
Class C | | | (1,803 | ) | | | (143 | ) |
Advisor Class | | | (167 | ) | | | (20 | ) |
Class R | | | (12,525 | ) | | | (972 | ) |
Class K | | | (225,030 | ) | | | (13,403 | ) |
Class I | | | (16,592 | ) | | | (1,429 | ) |
Class Z | | | (2,003 | ) | | | (168 | ) |
| Capital Stock Transactions | | | | | | | | |
Net increase | | | 4,297,883 | | | | 35,055,873 | |
| | | | | | | | |
Total increase | | | 10,500,748 | | | | 36,230,327 | |
| Net Assets | | | | | | | | |
Beginning of period | | | 43,931,599 | | | | 7,701,272 | |
| | | | | | | | |
End of period (including undistributed net investment income of $169,408 and $0, respectively) | | $ | 54,432,347 | | | $ | 43,931,599 | |
| | | | | | | | |
See notes to financial statements.
| | |
| abfunds.com | | AB MULTI-MANAGER SELECT RETIREMENT FUNDS | 115 |
STATEMENT OF CHANGES IN NET ASSETS (continued)
| | | | | | | | |
| | | AB Multi-Manager Select
2050 Fund | |
| | | Year Ended
July 31,
2017 | | | Year Ended
July 31,
2016 | |
| Increase (Decrease) in Net Assets from Operations | | | | | | | | |
Net investment income | | $ | 287,101 | | | $ | 155,434 | |
Net realized gain (loss) on Underlying Portfolios | | | 464,854 | | | | (327,393 | ) |
Net realized gain distributions from Underlying Portfolios | | | 228,150 | | | | 251,203 | |
Net change in unrealized appreciation/depreciation of investments in Underlying Portfolios | | | 1,930,883 | | | | 521,553 | |
| | | | | | | | |
Net increase in net assets from operations | | | 2,910,988 | | | | 600,797 | |
| Dividends and Distributions to Shareholders from | | | | | | | | |
Net investment income | | | | | | | | |
Class A | | | – 0 | – | | | (5,375 | ) |
Advisor Class | | | (462 | ) | | | – 0 | – |
Class R | | | (4,942 | ) | | | (1,213 | ) |
Class K | | | (189,810 | ) | | | (161,613 | ) |
Class I | | | (24,707 | ) | | | (30,681 | ) |
Class Z | | | (171 | ) | | | (150 | ) |
Net realized gain on investment transactions | | | | | | | | |
Class A | | | (3,875 | ) | | | (497 | ) |
Class C | | | (292 | ) | | | (14 | ) |
Advisor Class | | | (326 | ) | | | (13 | ) |
Class R | | | (2,216 | ) | | | (64 | ) |
Class K | | | (76,402 | ) | | | (7,889 | ) |
Class I | | | (8,083 | ) | | | (1,442 | ) |
Class Z | | | (54 | ) | | | (7 | ) |
| Capital Stock Transactions | | | | | | | | |
Net increase | | | 1,611,571 | | | | 14,513,283 | |
| | | | | | | | |
Total increase | | | 4,211,219 | | | | 14,905,122 | |
| Net Assets | | | | | | | | |
Beginning of period | | | 17,645,825 | | | | 2,740,703 | |
| | | | | | | | |
End of period (including undistributed net investment income of $68,338 and $0, respectively) | | $ | 21,857,044 | | | $ | 17,645,825 | |
| | | | | | | | |
See notes to financial statements.
| | |
| 116 | AB MULTI-MANAGER SELECT RETIREMENT FUNDS | | abfunds.com |
STATEMENT OF CHANGES IN NET ASSETS (continued)
| | | | | | | | |
| | | AB Multi-Manager Select
2055 Fund | |
| | | Year Ended
July 31,
2017 | | | Year Ended
July 31,
2016 | |
| Increase (Decrease) in Net Assets from Operations | | | | | | | | |
Net investment income | | $ | 286,413 | | | $ | 137,779 | |
Net realized gain (loss) on Underlying Portfolios | | | 417,082 | | | | (300,583 | ) |
Net realized gain distributions from Underlying Portfolios | | | 224,681 | | | | 221,049 | |
Net change in unrealized appreciation/depreciation of investments in Underlying Portfolios | | | 2,102,765 | | | | 531,795 | |
| | | | | | | | |
Net increase in net assets from operations | | | 3,030,941 | | | | 590,040 | |
| Dividends and Distributions to Shareholders from | | | | | | | | |
Net investment income | | | | | | | | |
Class A | | | – 0 | –(a) | | | (6,120 | ) |
Class C | | | – 0 | –(a) | | | (1,395 | ) |
Advisor Class | | | (1,691 | ) | | | (1,463 | ) |
Class R | | | (809 | ) | | | (309 | ) |
Class K | | | (195,029 | ) | | | (139,487 | ) |
Class I | | | (17,327 | ) | | | (23,596 | ) |
Class Z | | | (179 | ) | | | (178 | ) |
Net realized gain on investment transactions | | | | | | | | |
Class A | | | (3,750 | ) | | | (548 | ) |
Class C | | | (552 | ) | | | (176 | ) |
Advisor Class | | | (2,811 | ) | | | (441 | ) |
Class R | | | (446 | ) | | | (27 | ) |
Class K | | | (95,602 | ) | | | (10,174 | ) |
Class I | | | (6,897 | ) | | | (1,663 | ) |
Class Z | | | (69 | ) | | | (13 | ) |
| Capital Stock Transactions | | | | | | | | |
Net increase | | | 5,585,891 | | | | 13,998,853 | |
| | | | | | | | |
Total increase | | | 8,291,670 | | | | 14,403,303 | |
| Net Assets | | | | | | | | |
Beginning of period | | | 17,119,022 | | | | 2,715,719 | |
| | | | | | | | |
End of period (including undistributed net investment income of $72,733 and $0, respectively) | | $ | 25,410,692 | | | $ | 17,119,022 | |
| | | | | | | | |
| (a) | Amount is less than .50 cents. |
See notes to financial statements.
| | |
| abfunds.com | | AB MULTI-MANAGER SELECT RETIREMENT FUNDS | 117 |
NOTES TO FINANCIAL STATEMENTS
July 31, 2017
NOTE A
Significant Accounting Policies
AB Cap Fund, Inc. (the “Company”), which is a Maryland corporation, is registered under the Investment Company Act of 1940 as an open-end management investment company. The Company operates as a series company currently comprised of 29 portfolios. Each portfolio is considered to be a separate entity for financial reporting and tax purposes. This report relates only to the AB Multi-Manager Select Retirement Allocation Fund, AB Multi-Manager Select 2010 Fund, AB Multi-Manager Select 2015 Fund, AB Multi-Manager Select 2020 Fund, AB Multi-Manager Select 2025 Fund, AB Multi-Manager Select 2030 Fund, AB Multi-Manager Select 2035 Fund, AB Multi-Manager Select 2040 Fund, AB Multi-Manager Select 2045 Fund, AB Multi-Manager Select 2050 Fund and AB Multi-Manager Select 2055 Fund (the “Funds”), each a non-diversified portfolio. The Funds have authorized the issuance of Class A, Class B, Class C, Advisor Class, Class R, Class K, Class I, Class Z, Class T, Class 1 and Class 2 shares. Class B, Class T, Class 1 and Class 2 shares have not been issued. Class A shares are sold with a front-end sales charge of up to 4.25% for purchases not exceeding $1,000,000. With respect to purchases of $1,000,000 or more, Class A shares redeemed within one year of purchase may be subject to a contingent deferred sales charge of 1%. Class C shares are subject to a contingent deferred sales charge of 1% on redemptions made within the first year after purchase, and 0% after the first year of purchase. Effective April 10, 2017, Class C shares will automatically convert to Class A shares ten years after the end of the calendar month of purchase. Class R and Class K shares are sold without an initial or contingent deferred sales charge. Advisor Class, Class I and Class Z shares are sold without an initial or contingent deferred sales charge and are not subject to ongoing distribution expenses. All eleven classes of shares have identical voting, dividend, liquidation and other rights, except that the classes bear different distribution and transfer agency expenses. Each class has exclusive voting rights with respect to its distribution plan. The Funds invest primarily in a combination of portfolios managed by the Adviser and by certain unaffiliated third parties (the “Underlying Portfolios”). In order to implement the Funds’ investment strategies, Morningstar Investment Management LLC, the Funds’ sub-adviser, selects Underlying Portfolios for investment by the Funds from among AB Mutual Funds and funds offered by other fund complexes that have entered into a participation agreement or similar agreement with the Funds. The financial statements have been prepared in conformity with U.S. generally accepted accounting principles (“U.S. GAAP”) which require management to make certain estimates and assumptions that affect the reported amounts of assets and liabilities in the financial statements and amounts of income and expenses during the reporting period. Actual results could differ from those estimates. Each Fund is an investment
| | |
| 118 | AB MULTI-MANAGER SELECT RETIREMENT FUNDS | | abfunds.com |
NOTES TO FINANCIAL STATEMENTS (continued)
company under U.S. GAAP and follows the accounting and reporting guidance applicable to investment companies. The following is a summary of significant accounting policies followed by the Funds.
1. Security Valuation
Net asset value per share of the Funds, which may be based on the NAVs of the Underlying Portfolios, is calculated as of the close of business of the New York Stock Exchange, normally 4:00 p.m., Eastern Time. Investments in the Underlying Portfolios are valued at the closing net asset value per share, while exchange traded funds are valued at the closing market price per share.
2. Fair Value Measurements
In accordance with U.S. GAAP regarding fair value measurements, fair value is defined as the price that the Funds would receive to sell an asset or pay to transfer a liability in an orderly transaction between market participants at the measurement date. U.S. GAAP establishes a framework for measuring fair value, and a three-level hierarchy for fair value measurements based upon the transparency of inputs to the valuation of an asset or liability. Inputs may be observable or unobservable and refer broadly to the assumptions that market participants would use in pricing the asset or liability. Observable inputs reflect the assumptions market participants would use in pricing the asset or liability based on market data obtained from sources independent of the Funds. Unobservable inputs reflect the Funds’ own assumptions about the assumptions that market participants would use in pricing the asset or liability based on the best information available in the circumstances. Each investment is assigned a level based upon the observability of the inputs which are significant to the overall valuation. The three-tier hierarchy of inputs is summarized below.
| | • | | Level 1—quoted prices in active markets for identical investments |
| | • | | Level 2—other significant observable inputs (including quoted prices for similar investments, interest rates, prepayment speeds, credit risk, etc.) |
| | • | | Level 3—significant unobservable inputs (including the Funds’ own assumptions in determining the fair value of investments) |
The following table summarizes the valuation of the Funds’ investments by the above fair value hierarchy levels as of July 31, 2017:
| | | | | | | | | | | | | | | | |
Investments in Underlying
Portfolios: | | Level 1 | | | Level 2 | | | Level 3 | | | Total | |
AB Multi-Manager Select Retirement Allocation Fund | | | | | | | | | | | | | | | | |
Investment Companies | | $ | 9,504,591 | | | $ | – 0 | – | | $ | – 0 | – | | $ | 9,504,591 | |
Short-Term Investments | | | 177,962 | | | | – 0 | – | | | – 0 | – | | | 177,962 | |
| | | | | | | | | | | | | | | | |
Total(a) | | $ | 9,682,553 | | | $ | – 0 | – | | $ | – 0 | – | | $ | 9,682,553 | |
| | | | | | | | | | | | | | | | |
| | |
| abfunds.com | | AB MULTI-MANAGER SELECT RETIREMENT FUNDS | 119 |
NOTES TO FINANCIAL STATEMENTS (continued)
| | | | | | | | | | | | | | | | |
Investments in Underlying
Portfolios: | | Level 1 | | | Level 2 | | | Level 3 | | | Total | |
AB Multi-Manager Select 2010 Fund | | | | | | | | | | | | | | | | |
Investment Companies | | $ | 13,248,087 | | | $ | – 0 | – | | $ | – 0 | – | | $ | 13,248,087 | |
Short-Term Investments | | | 217,830 | | | | – 0 | – | | | – 0 | – | | | 217,830 | |
| | | | | | | | | | | | | | | | |
Total(a) | | $ | 13,465,917 | | | $ | – 0 | – | | $ | – 0 | – | | $ | 13,465,917 | |
| | | | | | | | | | | | | | | | |
AB Multi-Manager Select 2015 Fund | | | | | | | | | | | | | | | | |
Investment Companies | | $ | 42,086,217 | | | $ | – 0 | – | | $ | – 0 | – | | $ | 42,086,217 | |
Short-Term Investments | | | 693,106 | | | | – 0 | – | | | – 0 | – | | | 693,106 | |
| | | | | | | | | | | | | | | | |
Total(a) | | $ | 42,779,323 | | | $ | – 0 | – | | $ | – 0 | – | | $ | 42,779,323 | |
| | | | | | | | | | | | | | | | |
AB Multi-Manager Select 2020 Fund | | | | | | | | | | | | | | | | |
Investment Companies | | $ | 93,474,112 | | | $ | – 0 | – | | $ | – 0 | – | | $ | 93,474,112 | |
Short-Term Investments | | | 1,552,631 | | | | – 0 | – | | | – 0 | – | | | 1,552,631 | |
| | | | | | | | | | | | | | | | |
Total(a) | | $ | 95,026,743 | | | $ | – 0 | – | | $ | – 0 | – | | $ | 95,026,743 | |
| | | | | | | | | | | | | | | | |
AB Multi-Manager Select 2025 Fund | | | | | | | | | | | | | | | | |
Investment Companies | | $ | 132,154,867 | | | $ | – 0 | – | | $ | – 0 | – | | $ | 132,154,867 | |
Short-Term Investments | | | 2,693,003 | | | | – 0 | – | | | – 0 | – | | | 2,693,003 | |
| | | | | | | | | | | | | | | | |
Total(a) | | $ | 134,847,870 | | | $ | – 0 | – | | $ | – 0 | – | | $ | 134,847,870 | |
| | | | | | | | | | | | | | | | |
AB Multi-Manager Select 2030 Fund | | | | | | | | | | | | | | | | |
Investment Companies | | $ | 101,360,558 | | | $ | – 0 | – | | $ | – 0 | – | | $ | 101,360,558 | |
Short-Term Investments | | | 2,156,165 | | | | – 0 | – | | | – 0 | – | | | 2,156,165 | |
| | | | | | | | | | | | | | | | |
Total(a) | | $ | 103,516,723 | | | $ | – 0 | – | | $ | – 0 | – | | $ | 103,516,723 | |
| | | | | | | | | | | | | | | | |
AB Multi-Manager Select 2035 Fund | | | | | | | | | | | | | | | | |
Investment Companies | | $ | 91,029,815 | | | $ | – 0 | – | | $ | – 0 | – | | $ | 91,029,815 | |
Short-Term Investments | | | 1,004,222 | | | | – 0 | – | | | – 0 | – | | | 1,004,222 | |
| | | | | | | | | | | | | | | | |
Total(a) | | $ | 92,034,037 | | | $ | – 0 | – | | $ | – 0 | – | | $ | 92,034,037 | |
| | | | | | | | | | | | | | | | |
AB Multi-Manager Select 2040 Fund | | | | | | | | | | | | | | | | |
Investment Companies | | $ | 64,324,547 | | | $ | – 0 | – | | $ | – 0 | – | | $ | 64,324,547 | |
Short-Term Investments | | | 1,203,849 | | | | – 0 | – | | | – 0 | – | | | 1,203,849 | |
| | | | | | | | | | | | | | | | |
Total(a) | | $ | 65,528,396 | | | $ | – 0 | – | | $ | – 0 | – | | $ | 65,528,396 | |
| | | | | | | | | | | | | | | | |
AB Multi-Manager Select 2045 Fund | | | | | | | | | | | | | | | | |
Investment Companies | | $ | 54,274,046 | | | $ | – 0 | – | | $ | – 0 | – | | $ | 54,274,046 | |
Short-Term Investments | | | 252,267 | | | | – 0 | – | | | – 0 | – | | | 252,267 | |
| | | | | | | | | | | | | | | | |
Total(a) | | $ | 54,526,313 | | | $ | – 0 | – | | $ | – 0 | – | | $ | 54,526,313 | |
| | | | | | | | | | | | | | | | |
AB Multi-Manager Select 2050 Fund | | | | | | | | | | | | | | | | |
Investment Companies | | $ | 21,784,904 | | | $ | – 0 | – | | $ | – 0 | – | | $ | 21,784,904 | |
Short-Term Investments | | | 113,303 | | | | – 0 | – | | | – 0 | – | | | 113,303 | |
| | | | | | | | | | | | | | | | |
Total(a) | | $ | 21,898,207 | | | $ | – 0 | – | | $ | – 0 | – | | $ | 21,898,207 | |
| | | | | | | | | | | | | | | | |
| | |
| 120 | AB MULTI-MANAGER SELECT RETIREMENT FUNDS | | abfunds.com |
NOTES TO FINANCIAL STATEMENTS (continued)
| | | | | | | | | | | | | | | | |
Investments in Underlying
Portfolios: | | Level 1 | | | Level 2 | | | Level 3 | | | Total | |
AB Multi-Manager Select 2055 Fund | | | | | | | | | | | | | | | | |
Investment Companies | | $ | 25,377,798 | | | $ | – 0 | – | | $ | – 0 | – | | $ | 25,377,798 | |
Short-Term Investments | | | 169,684 | | | | – 0 | – | | | – 0 | – | | | 169,684 | |
| | | | | | | | | | | | | | | | |
Total(a) | | $ | 25,547,482 | | | $ | – 0 | – | | $ | – 0 | – | | $ | 25,547,482 | |
| | | | | | | | | | | | | | | | |
| (a) | There were no transfers between any levels during the reporting period. |
The Funds recognize all transfers between levels of the fair value hierarchy assuming the financial instruments were transferred at the beginning of the reporting period.
The Adviser established a Valuation Committee (the “Committee”) to oversee the pricing and valuation of all securities held in the Funds. The Committee operates under pricing and valuation policies and procedures established by the Adviser and approved by the Board, including pricing policies which set forth the mechanisms and processes to be employed on a daily basis to implement these policies and procedures. In particular, the pricing policies describe how to determine market quotations for securities and other instruments. The Committee’s responsibilities include: 1) fair value and liquidity determinations (and oversight of any third parties to whom any responsibility for fair value and liquidity determinations is delegated), and 2) regular monitoring of the Adviser’s pricing and valuation policies and procedures and modification or enhancement of these policies and procedures (or recommendation of the modification of these policies and procedures) as the Committee believes appropriate.
The Committee is also responsible for monitoring the implementation of the pricing policies by the Adviser’s Pricing Group (the “Pricing Group”) and any third party which performs certain pricing functions in accordance with the pricing policies. The Pricing Group is responsible for the oversight of the third party on a day-to-day basis. The Committee and the Pricing Group perform a series of activities to provide reasonable assurance of the accuracy of prices including: 1) periodic vendor due diligence meetings, review of methodologies, new developments and processes at vendors, 2) daily comparison of security valuation versus prior day for all securities that exceeded established thresholds, and 3) daily review of unpriced, stale, and variance reports with exceptions reviewed by senior management and the Committee.
In addition, several processes outside of the pricing process are used to monitor valuation issues including: 1) performance and performance attribution reports are monitored for anomalous impacts based upon benchmark performance, and 2) portfolio managers review all portfolios for performance and analytics (which are generated using the Adviser’s prices).
| | |
| abfunds.com | | AB MULTI-MANAGER SELECT RETIREMENT FUNDS | 121 |
NOTES TO FINANCIAL STATEMENTS (continued)
3. Taxes
It is each Fund’s policy to meet the requirements of the Internal Revenue Code applicable to regulated investment companies and to distribute all of its investment company taxable income and net realized gains, if any, to shareholders. Therefore, no provisions for federal income or excise taxes are required.
In accordance with U.S. GAAP requirements regarding accounting for uncertainties in income taxes, management has analyzed the Funds’ tax positions taken or expected to be taken on federal and state income tax returns for all open tax years (the current and the prior two tax years) and has concluded that no provision for income tax is required in the Funds’ financial statements.
4. Investment Income and Investment Transactions
Income and capital gain distributions from the Underlying Portfolios, if any, are recorded on the ex-dividend date. Transactions in shares of the Underlying Portfolios are accounted for on the trade date. Investment gains and losses are determined on the identified cost basis.
5. Class Allocations
All income earned and expenses incurred by the Funds are borne on a pro-rata basis by each settled class of shares, based on the proportionate interest in the Funds represented by the net assets of such class, except for class specific expenses which are allocated to the respective class. Expenses included in the accompanying statements of operations do not include any expenses of the Underlying Portfolios. Expenses of the Company are charged proportionately to each portfolio or based on other appropriate methods. Realized and unrealized gains and losses are allocated among the various share classes based on respective net assets.
6. Dividends and Distributions
Dividends and distributions to shareholders, if any, are recorded on the ex-dividend date. Income dividends and capital gains distributions are determined in accordance with federal tax regulations and may differ from those determined in accordance with U.S. GAAP. To the extent these differences are permanent, such amounts are reclassified within the capital accounts based on their federal tax basis treatment; temporary differences do not require such reclassification.
7. Offering Expenses
Offering expenses of $128,722 for each Fund had been deferred and were being amortized on a straight line basis over a one year period.
| | |
| 122 | AB MULTI-MANAGER SELECT RETIREMENT FUNDS | | abfunds.com |
NOTES TO FINANCIAL STATEMENTS (continued)
NOTE B
Advisory Fee and Other Transactions with Affiliates
Under the terms of the investment advisory agreement, each Fund pays the Adviser an advisory fee at an annual rate of .15% of the Funds’ average daily net assets. The fee is accrued daily and paid monthly. From its advisory fees received from the Funds, the Adviser pays the fees of Morningstar Investment Management LLC, the Funds’ sub-adviser. The Adviser has agreed to waive its fees and bear certain expenses to the extent necessary to limit total operating expenses on an annual basis (the “Expense Caps”) as follows:
| | | | | | | | | | | | | | | | | | | | | | | | | | | | |
| | | Effective December 1, 2016 | |
Multi-Manager
Select Fund | | Class A | | | Class C | | | Advisor
Class | | | Class R | | | Class K | | | Class I | | | Class Z | |
Retirement Allocation Fund | | | 0.42 | % | | | 1.17 | % | | | 0.17 | % | | | 0.67 | % | | | 0.42 | % | | | 0.17 | % | | | 0.17 | % |
2010 Fund | | | 0.40 | % | | | 1.15 | % | | | 0.15 | % | | | 0.65 | % | | | 0.40 | % | | | 0.15 | % | | | 0.15 | % |
2015 Fund | | | 0.40 | % | | | 1.15 | % | | | 0.15 | % | | | 0.65 | % | | | 0.40 | % | | | 0.15 | % | | | 0.15 | % |
2020 Fund | | | 0.44 | % | | | 1.19 | % | | | 0.19 | % | | | 0.69 | % | | | 0.44 | % | | | 0.19 | % | | | 0.19 | % |
2025 Fund | | | 0.43 | % | | | 1.18 | % | | | 0.18 | % | | | 0.68 | % | | | 0.43 | % | | | 0.18 | % | | | 0.18 | % |
2030 Fund | | | 0.48 | % | | | 1.23 | % | | | 0.23 | % | | | 0.73 | % | | | 0.48 | % | | | 0.23 | % | | | 0.23 | % |
2035 Fund | | | 0.48 | % | | | 1.23 | % | | | 0.23 | % | | | 0.73 | % | | | 0.48 | % | | | 0.23 | % | | | 0.23 | % |
2040 Fund | | | 0.52 | % | | | 1.27 | % | | | 0.27 | % | | | 0.77 | % | | | 0.52 | % | | | 0.27 | % | | | 0.27 | % |
2045 Fund | | | 0.50 | % | | | 1.25 | % | | | 0.25 | % | | | 0.75 | % | | | 0.50 | % | | | 0.25 | % | | | 0.25 | % |
2050 Fund | | | 0.50 | % | | | 1.25 | % | | | 0.25 | % | | | 0.75 | % | | | 0.50 | % | | | 0.25 | % | | | 0.25 | % |
2055 Fund | | | 0.51 | % | | | 1.26 | % | | | 0.26 | % | | | 0.76 | % | | | 0.51 | % | | | 0.26 | % | | | 0.26 | % |
| | | | | | | | | | | | | | | | | | | | | | | | | | | | |
| | | January 6, 2016 to December 1, 2016 | |
Multi-Manager
Select Fund | | Class A | | | Class C | | | Advisor
Class | | | Class R | | | Class K | | | Class I | | | Class Z | |
Retirement Allocation Fund | | | 0.42 | % | | | 1.17 | % | | | 0.17 | % | | | 0.67 | % | | | 0.42 | % | | | 0.17 | % | | | 0.17 | % |
2010 Fund | | | 0.41 | % | | | 1.16 | % | | | 0.16 | % | | | 0.66 | % | | | 0.41 | % | | | 0.16 | % | | | 0.16 | % |
2015 Fund | | | 0.40 | % | | | 1.15 | % | | | 0.15 | % | | | 0.65 | % | | | 0.40 | % | | | 0.15 | % | | | 0.15 | % |
2020 Fund | | | 0.45 | % | | | 1.20 | % | | | 0.20 | % | | | 0.70 | % | | | 0.45 | % | | | 0.20 | % | | | 0.20 | % |
2025 Fund | | | 0.44 | % | | | 1.19 | % | | | 0.19 | % | | | 0.69 | % | | | 0.44 | % | | | 0.19 | % | | | 0.19 | % |
2030 Fund | | | 0.48 | % | | | 1.23 | % | | | 0.23 | % | | | 0.73 | % | | | 0.48 | % | | | 0.23 | % | | | 0.23 | % |
2035 Fund | | | 0.49 | % | | | 1.24 | % | | | 0.24 | % | | | 0.74 | % | | | 0.49 | % | | | 0.24 | % | | | 0.24 | % |
2040 Fund | | | 0.52 | % | | | 1.27 | % | | | 0.27 | % | | | 0.77 | % | | | 0.52 | % | | | 0.27 | % | | | 0.27 | % |
2045 Fund | | | 0.51 | % | | | 1.26 | % | | | 0.26 | % | | | 0.76 | % | | | 0.51 | % | | | 0.26 | % | | | 0.26 | % |
2050 Fund | | | 0.52 | % | | | 1.27 | % | | | 0.27 | % | | | 0.77 | % | | | 0.52 | % | | | 0.27 | % | | | 0.27 | % |
2055 Fund | | | 0.52 | % | | | 1.27 | % | | | 0.27 | % | | | 0.77 | % | | | 0.52 | % | | | 0.27 | % | | | 0.27 | % |
| | | | | | | | | | | | | | | | | | | | | | | | | | | | |
| | | Prior to January 6, 2016 | |
Multi-Manager
Select Fund | | Class A | | | Class C | | | Advisor
Class | | | Class R | | | Class K | | | Class I | | | Class Z | |
Retirement Allocation Fund | | | 0.39 | % | | | 1.14 | % | | | 0.14 | % | | | 0.64 | % | | | 0.39 | % | | | 0.14 | % | | | 0.14 | % |
2010 Fund | | | 0.38 | % | | | 1.13 | % | | | 0.13 | % | | | 0.63 | % | | | 0.38 | % | | | 0.13 | % | | | 0.13 | % |
2015 Fund | | | 0.42 | % | | | 1.17 | % | | | 0.17 | % | | | 0.67 | % | | | 0.42 | % | | | 0.17 | % | | | 0.17 | % |
2020 Fund | | | 0.46 | % | | | 1.21 | % | | | 0.21 | % | | | 0.71 | % | | | 0.46 | % | | | 0.21 | % | | | 0.21 | % |
2025 Fund | | | 0.45 | % | | | 1.20 | % | | | 0.20 | % | | | 0.70 | % | | | 0.45 | % | | | 0.20 | % | | | 0.20 | % |
| | |
| abfunds.com | | AB MULTI-MANAGER SELECT RETIREMENT FUNDS | 123 |
NOTES TO FINANCIAL STATEMENTS (continued)
| | | | | | | | | | | | | | | | | | | | | | | | | | | | |
| | | Prior to January 6, 2016 | |
Multi-Manager
Select Fund | | Class A | | | Class C | | | Advisor
Class | | | Class R | | | Class K | | | Class I | | | Class Z | |
2030 Fund | | | 0.49 | % | | | 1.24 | % | | | 0.24 | % | | | 0.74 | % | | | 0.49 | % | | | 0.24 | % | | | 0.24 | % |
2035 Fund | | | 0.49 | % | | | 1.24 | % | | | 0.24 | % | | | 0.74 | % | | | 0.49 | % | | | 0.24 | % | | | 0.24 | % |
2040 Fund | | | 0.53 | % | | | 1.28 | % | | | 0.28 | % | | | 0.78 | % | | | 0.53 | % | | | 0.28 | % | | | 0.28 | % |
2045 Fund | | | 0.54 | % | | | 1.29 | % | | | 0.29 | % | | | 0.79 | % | | | 0.54 | % | | | 0.29 | % | | | 0.29 | % |
2050 Fund | | | 0.53 | % | | | 1.28 | % | | | 0.28 | % | | | 0.78 | % | | | 0.53 | % | | | 0.28 | % | | | 0.28 | % |
2055 Fund | | | 0.53 | % | | | 1.28 | % | | | 0.28 | % | | | 0.78 | % | | | 0.53 | % | | | 0.28 | % | | | 0.28 | % |
Any fees waived and expenses borne by the Adviser from December 15, 2014 through July 31, 2015 are subject to repayment by the Funds until July 31, 2018; such waivers that are subject to repayment amounted to:
| | | | | | | | | | |
Multi-Manager
Select Fund | | Amount | | | Fund | | Amount | |
Retirement Allocation Fund | | $ | 206,043 | | | 2035 Fund | | $ | 206,713 | |
2010 Fund | | | 206,330 | | | 2040 Fund | | | 204,490 | |
2015 Fund | | | 206,688 | | | 2045 Fund | | | 204,804 | |
2020 Fund | | | 205,253 | | | 2050 Fund | | | 205,292 | |
2025 Fund | | | 206,723 | | | 2055 Fund | | | 203,471 | |
2030 Fund | | | 207,192 | | | | | | | |
Any fees waived and expenses borne by the Adviser from August 1, 2015 through January 5, 2016 are subject to repayment by the Funds until July 31, 2019; such waivers that are subject to repayment amounted to:
| | | | | | | | | | |
Multi-Manager
Select Fund | | Amount | | | Fund | | Amount | |
Retirement Allocation Fund | | $ | 148,582 | | | 2035 Fund | | $ | 140,240 | |
2010 Fund | | | 149,220 | | | 2040 Fund | | | 135,952 | |
2015 Fund | | | 149,516 | | | 2045 Fund | | | 138,850 | |
2020 Fund | | | 143,920 | | | 2050 Fund | | | 144,451 | |
2025 Fund | | | 145,154 | | | 2055 Fund | | | 144,775 | |
2030 Fund | | | 138,748 | | | | | | | |
In any case, no repayment will be made that would cause the Funds’ total annual operating expenses to exceed the net fee percentages set forth per the Expense Caps in effect prior to January 6, 2016. The Expense Caps in effect as of December 1, 2016 may not be terminated by the Adviser before November 30, 2017. For the year ended July 31, 2017, such waivers and reimbursement amounted to:
| | | | | | | | | | |
Multi-Manager
Select Fund | | Amount | | | Multi-Manager
Select Fund | | Amount | |
Retirement Allocation Fund | | $ | 298,854 | | | 2035 Fund | | $ | 346,303 | |
2010 Fund | | | 303,409 | | | 2040 Fund | | | 309,397 | |
2015 Fund | | | 352,034 | | | 2045 Fund | | | 310,479 | |
2020 Fund | | | 395,172 | | | 2050 Fund | | | 295,402 | |
2025 Fund | | | 462,656 | | | 2055 Fund | | | 293,725 | |
2030 Fund | | | 360,678 | | | | | | | |
| | |
| 124 | AB MULTI-MANAGER SELECT RETIREMENT FUNDS | | abfunds.com |
NOTES TO FINANCIAL STATEMENTS (continued)
During the year ended July 31, 2016, the Adviser reimbursed the Funds the following amounts for trading losses incurred due to a trade entry error:
| | | | |
Multi-Manager
Select Fund | | Amount | |
Retirement Allocation Fund | | $ | 53 | |
2010 Fund | | | 112 | |
2015 Fund | | | 409 | |
2020 Fund | | | 737 | |
2025 Fund | | | 1,004 | |
2030 Fund | | | 708 | |
2035 Fund | | | 580 | |
2040 Fund | | | 355 | |
2045 Fund | | | 90 | |
2050 Fund | | | – 0 | – |
2055 Fund | | | – 0 | – |
The Funds compensate AllianceBernstein Investor Services, Inc. (“ABIS”), a wholly-owned subsidiary of the Adviser, under a Transfer Agency Agreement for providing personnel and facilities to perform transfer agency services for the Funds. ABIS may make payments to intermediaries that provide omnibus account services, sub-accounting services and/or networking services. For the year ended July 31, 2017, such compensation retained by ABIS was as follows:
| | | | | | | | | | |
Multi-Manager
Select Fund | | Amount | | | Multi-Manager
Select Fund | | Amount | |
Retirement Allocation Fund | | $ | 17,985 | | | 2035 Fund | | $ | 37,901 | |
2010 Fund | | | 17,970 | | | 2040 Fund | | | 27,963 | |
2015 Fund | | | 21,119 | | | 2045 Fund | | | 22,766 | |
2020 Fund | | | 42,528 | | | 2050 Fund | | | 17,932 | |
2025 Fund | | | 60,135 | | | 2055 Fund | | | 17,843 | |
2030 Fund | | | 42,883 | | | | | | | |
AllianceBernstein Investments, Inc. (the “Distributor”), a wholly-owned subsidiary of the Adviser, serves as the distributor of the Funds’ shares. The Distributor has advised the Funds that it has retained front-end sales charges from the sale of Class A shares and received contingent deferred sales charges imposed upon redemptions by shareholders of Class A and Class C shares for each Fund for the year ended July 31, 2017 as follows:
| | | | | | | | | | | | |
| | | Front-End Sales
Charges | | | Contingent Deferred Sales
Charges | |
Multi-Manager
Select Fund | | Class A | | | Class A | | | Class C | |
Retirement Allocation Fund | | $ | – 0 | – | | $ | – 0 | – | | $ | 98 | |
2010 Fund | | | 6 | | | | 355 | | | | – 0 | – |
2015 Fund | | | 162 | | | | 438 | | | | 650 | |
2020 Fund | | | 131 | | | | 423 | | | | 103 | |
2025 Fund | | | 398 | | | | 2,090 | | | | – 0 | – |
2030 Fund | | | 250 | | | | 796 | | | | 71 | |
2035 Fund | | | 215 | | | | 1,520 | | | | 71 | |
| | |
| abfunds.com | | AB MULTI-MANAGER SELECT RETIREMENT FUNDS | 125 |
NOTES TO FINANCIAL STATEMENTS (continued)
| | | | | | | | | | | | |
| | | Front-End Sales
Charges | | | Contingent Deferred Sales
Charges | |
Multi-Manager
Select Fund | | Class A | | | Class A | | | Class C | |
2040 Fund | | $ | 349 | | | $ | 957 | | | $ | 3 | |
2045 Fund | | | 324 | | | | 1,363 | | | | – 0 | – |
2050 Fund | | | 211 | | | | 778 | | | | – 0 | – |
2055 Fund | | | 182 | | | | 322 | | | | – 0 | – |
The Funds may invest in AB Government Money Market Portfolio (the “Government Money Market Portfolio”) which has a contractual annual advisory fee rate of .20% of the portfolio’s average daily net assets and bears its own expenses. In connection with the investment by the Funds in the Government Money Market Portfolio, the Adviser has agreed to waive its advisory fee from the Funds in an amount equal to each Fund’s pro rata share of the effective advisory fees of Government Money Market Portfolio, as borne indirectly by the Funds as an acquired fund fee and expense. For the year ended July 31, 2017, such waivers amounted to:
| | | | | | | | | | |
Multi-Manager
Select Fund | | Amount | | | Multi-Manager
Select Fund | | Amount | |
Retirement Allocation Fund | | $ | 113 | | | 2035 Fund | | $ | 1,102 | |
2010 Fund | | | 139 | | | 2040 Fund | | | 704 | |
2015 Fund | | | 298 | | | 2045 Fund | | | 632 | |
2020 Fund | | | 859 | | | 2050 Fund | | | 284 | |
2025 Fund | | | 1,125 | | | 2055 Fund | | | 364 | |
2030 Fund | | | 1,031 | | | | | | | |
A summary of the Funds’ transactions in shares of the Government Money Market Portfolio for the year ended July 31, 2017 is as follows:
| | | | | | | | | | | | | | | | | | | | |
| | | Market
Value
7/31/16
(000) | | | Purchases
at Cost
(000) | | | Sales
Proceeds
(000) | | | Market
Value
7/31/17
(000) | | | Dividend
Income
(000) | |
Retirement Allocation Fund | | $ | 101 | | | $ | 2,553 | | | $ | 2,476 | | | $ | 178 | | | $ | 1 | |
2010 Fund | | | 164 | | | | 4,013 | | | | 3,959 | | | | 218 | | | | – 0 | –* |
2015 Fund | | | 366 | | | | 7,151 | | | | 6,824 | | | | 693 | | | | 1 | |
2020 Fund | | | 693 | | | | 26,312 | | | | 25,452 | | | | 1,553 | | | | 2 | |
2025 Fund | | | 1,605 | | | | 27,557 | | | | 26,469 | | | | 2,693 | | | | 2 | |
2030 Fund | | | 718 | | | | 31,300 | | | | 29,862 | | | | 2,156 | | | | 2 | |
2035 Fund | | | 594 | | | | 26,659 | | | | 26,249 | | | | 1,004 | | | | 2 | |
2040 Fund | | | 519 | | | | 15,937 | | | | 15,252 | | | | 1,204 | | | | 1 | |
2045 Fund | | | 207 | | | | 12,219 | | | | 12,174 | | | | 252 | | | | 1 | |
2050 Fund | | | 87 | | | | 6,754 | | | | 6,728 | | | | 113 | | | | 1 | |
2055 Fund | | | 361 | | | | 7,935 | | | | 8,126 | | | | 170 | | | | 1 | |
| * | Amount is less than $500. |
| | |
| 126 | AB MULTI-MANAGER SELECT RETIREMENT FUNDS | | abfunds.com |
NOTES TO FINANCIAL STATEMENTS (continued)
A summary of the Funds’ affiliated Underlying Portfolio transactions for the year ended July 31, 2017 is as follows:
| | | | | | | | | | | | | | | | | | | | | | | | | | | | | | | | |
| AB All Market Real Return Portfolio | |
| | | | | | | | | | | | | | | | | | | | | Distributions | |
Multi-Manager
Select Fund | | Market
Value
7/31/16
(000) | | | Purchases
at Cost
(000) | | | Sales
Proceeds
(000) | | | Realized
Gain
(Loss)
(000) | | | Change in
Unrealized
Appr./(Depr.)
(000) | | | Market
Value
7/31/17
(000) | | | Income
(000) | | | Realized
Gains
(000) | |
Retirement Allocation Fund | | $ | 287 | | | $ | 48 | | | $ | 100 | | | $ | 8 | | | $ | 2 | | | $ | 245 | | | $ | 7 | | | $ | – 0 | – |
2010 Fund | | | 458 | | | | 84 | | | | 156 | | | | 12 | | | | 1 | | | | 399 | | | | 12 | | | | – 0 | – |
2015 Fund | | | 1,379 | | | | 224 | | | | 351 | | | | 23 | | | | 16 | | | | 1,291 | | | | 34 | | | | – 0 | – |
2020 Fund | | | 2,595 | | | | 520 | | | | 382 | | | | 10 | | | | 71 | | | | 2,814 | | | | 65 | | | | – 0 | – |
2025 Fund | | | 2,413 | | | | 595 | | | | 359 | | | | 9 | | | | 69 | | | | 2,727 | | | | 63 | | | | – 0 | – |
2030 Fund | | | 823 | | | | 281 | | | | 122 | | | | 4 | | | | 24 | | | | 1,010 | | | | 23 | | | | – 0 | – |
2035 Fund | | | 708 | | | | 206 | | | | 29 | | | | 1 | | | | 24 | | | | 910 | | | | 19 | | | | – 0 | – |
| | | | | | | | | | | | | | | | | | | | | | | | | | | | | | | | |
| AB Bond Inflation Strategy Portfolio | |
| | | | | | | | | | | | | | | | | | | | | Distributions | |
Multi-Manager
Select Fund | | Market
Value
7/31/16
(000) | | | Purchases
at Cost
(000) | | | Sales
Proceeds
(000) | | | Realized
Gain
(Loss)
(000) | | | Change in
Unrealized
Appr./(Depr.)
(000) | | | Market
Value
7/31/17
(000) | | | Income
(000) | | | Realized
Gains
(000) | |
Retirement Allocation Fund | | $ | 576 | | | $ | 104 | | | $ | 105 | | | $ | 4 | | | $ | (9 | ) | | $ | 570 | | | $ | 13 | | | $ | – 0 | – |
2010 Fund | | | 1,223 | | | | 212 | | | | 360 | | | | 13 | | | | (25 | ) | | | 1,063 | | | | 27 | | | | – 0 | – |
2015 Fund | | | 3,273 | | | | 881 | | | | 777 | | | | 28 | | | | (49 | ) | | | 3,356 | | | | 76 | | | | – 0 | – |
2020 Fund | | | 4,328 | | | | 2,193 | | | | 863 | | | | 31 | | | | (50 | ) | | | 5,639 | | | | 113 | | | | – 0 | – |
2025 Fund | | | 2,425 | | | | 1,792 | | | | 275 | | | | 5 | | | | (9 | ) | | | 3,938 | | | | 70 | | | | – 0 | – |
| | | | | | | | | | | | | | | | | | | | | | | | | | | | | | | | |
| AB Concentrated Growth Fund | |
| | | | | | | | | | | | | | | | | | | | | Distributions | |
Multi-Manager
Select Fund | | Market
Value
7/31/16
(000) | | | Purchases
at Cost
(000) | | | Sales
Proceeds
(000) | | | Realized
Gain
(Loss)
(000) | | | Change in
Unrealized
Appr./(Depr.)
(000) | | | Market
Value
7/31/17
(000) | | | Income
(000)* | | | Realized
Gains
(000) | |
Retirement Allocation Fund | | $ | 101 | | | $ | 1 | | | $ | 22 | | | $ | – 0 | –* | | $ | 16 | | | $ | 96 | | | $ | – 0 | – | | $ | – 0 | – |
2025 Fund | | | 2,449 | | | | 1,386 | | | | 407 | | | | 13 | | | | 502 | | | | 3,943 | | | | – 0 | – | | | 10 | |
2030 Fund | | | 1,741 | | | | 1,266 | | | | 458 | | | | 17 | | | | 438 | | | | 3,004 | | | | – 0 | – | | | 11 | |
2035 Fund | | | 2,155 | | | | 2,060 | | | | 306 | | | | 12 | | | | 587 | | | | 4,508 | | | | – 0 | – | | | 12 | |
2040 Fund | | | 3,526 | | | | 1,788 | | | | 886 | | | | 25 | | | | 712 | | | | 5,165 | | | | – 0 | – | | | 17 | |
2045 Fund | | | 2,673 | | | | 1,530 | | | | 498 | | | | 20 | | | | 584 | | | | 4,309 | | | | – 0 | – | | | 14 | |
2050 Fund | | | 1,074 | | | | 932 | | | | 317 | | | | 15 | | | | 246 | | | | 1,950 | | | | – 0 | – | | | 6 | |
2055 Fund | | | 1,019 | | | | 1,186 | | | | 187 | | | | 2 | | | | 269 | | | | 2,289 | | | | – 0 | – | | | 6 | |
| * | Amount is less than $500. |
| | | | | | | | | | | | | | | | | | | | | | | | | | | | | | | | |
| AB Discovery Growth Fund, Inc. | |
| | | | | | | | | | | | | | | | | | | | | Distributions | |
Multi-Manager
Select Fund | | Market
Value
7/31/16
(000) | | | Purchases
at Cost
(000) | | | Sales
Proceeds
(000) | | | Realized
Gain
(Loss)
(000) | | | Change in
Unrealized
Appr./(Depr.)
(000) | | | Market
Value
7/31/17
(000) | | | Income
(000) | | | Realized
Gains
(000) | |
2025 Fund | | $ | 1,247 | | | $ | 60 | | | $ | 207 | | | $ | (11 | ) | | $ | 223 | | | $ | 1,312 | | | $ | – 0 | – | | $ | – 0 | – |
2030 Fund | | | 882 | | | | 71 | | | | 114 | | | | (15 | ) | | | 165 | | | | 989 | | | | – 0 | – | | | – 0 | – |
2035 Fund | | | 700 | | | | 125 | | | | 58 | | | | 5 | | | | 131 | | | | 903 | | | | – 0 | – | | | – 0 | – |
2040 Fund | | | 577 | | | | – 0 | – | | | 50 | | | | 5 | | | | 95 | | | | 627 | | | | – 0 | – | | | – 0 | – |
| | |
| abfunds.com | | AB MULTI-MANAGER SELECT RETIREMENT FUNDS | 127 |
NOTES TO FINANCIAL STATEMENTS (continued)
| | | | | | | | | | | | | | | | | | | | | | | | | | | | | | | | |
| AB Discovery Value Fund | |
| | | | | | | | | | | | | | | | | | | | | Distributions | |
Multi-Manager
Select Fund | | Market
Value
7/31/16
(000) | | | Purchases
at Cost
(000) | | | Sales
Proceeds
(000) | | | Realized
Gain
(Loss)
(000) | | | Change in
Unrealized
Appr./(Depr.)
(000) | | | Market
Value
7/31/17
(000) | | | Income
(000) | | | Realized
Gains
(000) | |
2015 Fund | | $ | 492 | | | $ | 43 | | | $ | 157 | | | $ | 19 | | | $ | 31 | | | $ | 428 | | | $ | 2 | | | $ | 14 | |
2020 Fund | | | 891 | | | | 157 | | | | 215 | | | | 12 | | | | 85 | | | | 930 | | | | 4 | | | | 27 | |
2025 Fund | | | 1,206 | | | | 192 | | | | 232 | | | | 12 | | | | 123 | | | | 1,301 | | | | 6 | | | | 37 | |
2030 Fund | | | 1,747 | | | | 499 | | | | 426 | | | | 15 | | | | 178 | | | | 2,013 | | | | 8 | | | | 54 | |
2035 Fund | | | 1,445 | | | | 458 | | | | 242 | | | | 13 | | | | 149 | | | | 1,823 | | | | 6 | | | | 45 | |
2040 Fund | | | 1,764 | | | | 449 | | | | 466 | | | | 23 | | | | 162 | | | | 1,932 | | | | 8 | | | | 53 | |
2045 Fund | | | 1,786 | | | | 361 | | | | 688 | | | | 20 | | | | 140 | | | | 1,619 | | | | 6 | | | | 42 | |
2050 Fund | | | 716 | | | | 182 | | | | 313 | | | | 11 | | | | 55 | | | | 651 | | | | 2 | | | | 18 | |
2055 Fund | | | 677 | | | | 284 | | | | 270 | | | | 9 | | | | 57 | | | | 757 | | | | 3 | | | | 17 | |
| | | | | | | | | | | | | | | | | | | | | | | | | | | | | | | | |
| AB Global Bond Fund, Inc. | |
| | | | | | | | | | | | | | | | | | | | | Distributions | |
Multi-Manager
Select Fund | | Market
Value
7/31/16
(000) | | | Purchases
at Cost
(000) | | | Sales
Proceeds
(000) | | | Realized
Gain
(Loss)
(000) | | | Change in
Unrealized
Appr./(Depr.)
(000) | | | Market
Value
7/31/17
(000) | | | Income
(000) | | | Realized
Gains
(000) | |
Retirement Allocation Fund | | $ | 191 | | | $ | 27 | | | $ | 23 | | | $ | – 0 | –* | | $ | (4 | ) | | $ | 191 | | | $ | 6 | | | $ | – 0 | – |
2010 Fund | | | 608 | | | | 78 | | | | 144 | | | | 1 | | | | (13 | ) | | | 530 | | | | 18 | | | | – 0 | – |
2015 Fund | | | 1,872 | | | | 200 | | | | 363 | | | | 5 | | | | (41 | ) | | | 1,673 | | | | 57 | | | | – 0 | – |
2020 Fund | | | 1,718 | | | | 1,406 | | | | 289 | | | | 5 | | | | (46 | ) | | | 2,794 | | | | 82 | | | | – 0 | – |
2025 Fund | | | 2,426 | | | | 1,912 | | | | 335 | | | | 5 | | | | (67 | ) | | | 3,941 | | | | 115 | | | | – 0 | – |
2030 Fund | | | 1,683 | | | | 1,825 | | | | 438 | | | | 6 | | | | (52 | ) | | | 3,024 | | | | 84 | | | | – 0 | – |
| * | Amount is less than $500. |
| | | | | | | | | | | | | | | | | | | | | | | | | | | | | | | | |
| AB Global Real Estate Investment Fund II | |
| | | | | | | | | | | | | | | | | | | | | Distributions | |
Multi-Manager
Select Fund | | Market
Value
7/31/16
(000) | | | Purchases
at Cost
(000) | | | Sales
Proceeds
(000) | | | Realized
Gain
(Loss)
(000) | | | Change in
Unrealized
Appr./(Depr.)
(000) | | | Market
Value
7/31/17
(000) | | | Income
(000) | | | Realized
Gains
(000) | |
Retirement Allocation Fund | | $ | 392 | | | $ | 97 | | | $ | 136 | | | $ | 2 | | | $ | (21 | ) | | $ | 334 | | | $ | 16 | | | $ | – 0 | – |
2010 Fund | | | 623 | | | | 141 | | | | 206 | | | | 6 | | | | (34 | ) | | | 530 | | | | 23 | | | | – 0 | – |
2015 Fund | | | 1,920 | | | | 360 | | | | 501 | | | | 18 | | | | (103 | ) | | | 1,694 | | | | 76 | | | | – 0 | – |
2020 Fund | | | 3,539 | | | | 1,141 | | | | 827 | | | | 14 | | | | (129 | ) | | | 3,738 | | | | 152 | | | | – 0 | – |
2025 Fund | | | 6,215 | | | | 1,813 | | | | 1,186 | | | | 7 | | | | (227 | ) | | | 6,622 | | | | 266 | | | | – 0 | – |
2030 Fund | | | 3,494 | | | | 2,346 | | | | 1,617 | | | | (12 | ) | | | (93 | ) | | | 4,118 | | | | 180 | | | | – 0 | – |
2035 Fund | | | 2,887 | | | | 2,109 | | | | 1,286 | | | | (0 | )* | | | (71 | ) | | | 3,639 | | | | 156 | | | | – 0 | – |
2040 Fund | | | 1,770 | | | | 1,310 | | | | 1,083 | | | | (5 | ) | | | (54 | ) | | | 1,938 | | | | 94 | | | | – 0 | – |
2045 Fund | | | 1,323 | | | | 1,087 | | | | 734 | | | | 2 | | | | (37 | ) | | | 1,641 | | | | 75 | | | | – 0 | – |
2050 Fund | | | 538 | | | | 426 | | | | 297 | | | | (1 | ) | | | (12 | ) | | | 654 | | | | 31 | | | | – 0 | – |
2055 Fund | | | 513 | | | | 512 | | | | 254 | | | | (1 | ) | | | (10 | ) | | | 760 | | | | 31 | | | | – 0 | – |
| * | Amount is less than $500. |
| | |
| 128 | AB MULTI-MANAGER SELECT RETIREMENT FUNDS | | abfunds.com |
NOTES TO FINANCIAL STATEMENTS (continued)
| | | | | | | | | | | | | | | | | | | | | | | | | | | | | | | | |
| AB High Income Fund, Inc. | |
| | | | | | | | | | | | | | | | | | | | | Distributions | |
Multi-Manager
Select Fund | | Market
Value
7/31/16
(000) | | | Purchases
at Cost
(000) | | | Sales
Proceeds
(000) | | | Realized
Gain
(Loss)
(000) | | | Change in
Unrealized
Appr./(Depr.)
(000) | | | Market
Value
7/31/17
(000) | | | Income
(000) | | | Realized
Gains
(000) | |
Retirement Allocation Fund | | $ | 219 | | | $ | 78 | | | $ | 70 | | | $ | 3 | | | $ | 8 | | | $ | 238 | | | $ | 14 | | | $ | – 0 | – |
2010 Fund | | | 348 | | | | 82 | | | | 139 | | | | 6 | | | | 7 | | | | 304 | | | | 19 | | | | – 0 | – |
2015 Fund | | | 1,985 | | | | 189 | | | | 554 | | | | 20 | | | | 55 | | | | 1,695 | | | | 105 | | | | – 0 | – |
2020 Fund | | | 5,463 | | | | 1,049 | | | | 2,026 | | | | 73 | | | | 132 | | | | 4,691 | | | | 277 | | | | – 0 | – |
2025 Fund | | | 8,875 | | | | 1,453 | | | | 2,719 | | | | 89 | | | | 251 | | | | 7,949 | | | | 464 | | | | – 0 | – |
2030 Fund | | | 7,005 | | | | 2,185 | | | | 3,318 | | | | 204 | | | | 67 | | | | 6,143 | | | | 387 | | | | – 0 | – |
2035 Fund | | | 4,413 | | | | 1,608 | | | | 724 | | | | 45 | | | | 158 | | | | 5,500 | | | | 286 | | | | – 0 | – |
2040 Fund | | | 730 | | | | 110 | | | | 233 | | | | 8 | | | | 19 | | | | 634 | | | | 36 | | | | – 0 | – |
2045 Fund | | | 25 | | | | – 0 | – | | | 25 | | | | 1 | | | | (1 | ) | | | – 0 | – | | | – 0 | –* | | | – 0 | – |
2050 Fund | | | 10 | | | | – 0 | – | | | 10 | | | | – 0 | –* | | | – 0 | –* | | | – 0 | – | | | – 0 | –* | | | – 0 | – |
2055 Fund | | | 9 | | | | – 0 | – | | | 9 | | | | – 0 | –* | | | – 0 | –* | | | – 0 | – | | | – 0 | –* | | | – 0 | – |
| * | Amount is less than $500. |
| | | | | | | | | | | | | | | | | | | | | | | | | | | | | | | | |
| AB Intermediate Bond Portfolio | |
| | | | | | | | | | | | | | | | | | | | | Distributions | |
Multi-Manager
Select Fund | | Market
Value
7/31/16
(000) | | | Purchases
at Cost
(000) | | | Sales
Proceeds
(000) | | | Realized
Gain
(Loss)
(000) | | | Change in
Unrealized
Appr./(Depr.)
(000) | | | Market
Value
7/31/17
(000) | | | Income
(000) | | | Realized
Gains
(000) | |
Retirement Allocation Fund | | $ | 771 | | | $ | 154 | | | $ | 154 | | | $ | 2 | | | $ | (15 | ) | | $ | 758 | | | $ | 23 | | | $ | – 0 | –* |
2010 Fund | | | 919 | | | | 145 | | | | 251 | | | | 1 | | | | (19 | ) | | | 795 | | | | 24 | | | | 1 | |
2015 Fund | | | 2,346 | | | | 251 | | | | 453 | | | | 4 | | | | (46 | ) | | | 2,102 | | | | 64 | | | | 1 | |
2020 Fund | | | 4,353 | | | | 1,259 | | | | 849 | | | | 10 | | | | (74 | ) | | | 4,699 | | | | 130 | | | | 2 | |
2025 Fund | | | 3,640 | | | | 780 | | | | 406 | | | | (4 | ) | | | (53 | ) | | | 3,957 | | | | 109 | | | | 2 | |
2030 Fund | | | 2,568 | | | | 1,330 | | | | 812 | | | | (12 | ) | | | (35 | ) | | | 3,039 | | | | 76 | | | | 1 | |
2035 Fund | | | 1,423 | | | | 1,390 | | | | 960 | | | | (11 | ) | | | (9 | ) | | | 1,833 | | | | 28 | | | | 1 | |
2040 Fund | | | 1,164 | | | | 989 | | | | 849 | | | | (10 | ) | | | (7 | ) | | | 1,287 | | | | 22 | | | | – 0 | –* |
2045 Fund | | | 877 | | | | 1,520 | | | | 883 | | | | (16 | ) | | | 2 | | | | 1,500 | | | | 20 | | | | – 0 | –* |
2050 Fund | | | 352 | | | | 631 | | | | 374 | | | | (7 | ) | | | 1 | | | | 603 | | | | 8 | | | | – 0 | –* |
2055 Fund | | | 336 | | | | 718 | | | | 348 | | | | (6 | ) | | | – 0 | –* | | | 700 | | | | 8 | | | | – 0 | –* |
| * | Amount is less than $500. |
| | | | | | | | | | | | | | | | | | | | | | | | | | | | | | | | |
| AB Relative Value Fund (formerly known as AB Growth and Income Fund, Inc.) | |
| | | | | | | | | | | | | | | | | | | | | Distributions | |
Multi-Manager
Select Fund | | Market
Value
7/31/16
(000) | | | Purchases
at Cost
(000) | | | Sales
Proceeds
(000) | | | Realized
Gain
(Loss)
(000) | | | Change in
Unrealized
Appr./(Depr.)
(000) | | | Market
Value
7/31/17
(000) | | | Income
(000) | | | Realized
Gains
(000) | |
Retirement Allocation Fund | | $ | 381 | | | $ | 60 | | | $ | 92 | | | $ | 2 | | | $ | 30 | | | $ | 381 | | | $ | 11 | | | $ | 15 | |
2010 Fund | | | 605 | | | | 107 | | | | 229 | | | | 12 | | | | 38 | | | | 533 | | | | 15 | | | | 18 | |
2015 Fund | | | 1,391 | | | | 178 | | | | 821 | | | | 41 | | | | 56 | | | | 845 | | | | 37 | | | | 47 | |
2020 Fund | | | 5,160 | | | | 1,315 | | | | 2,220 | | | | 89 | | | | 321 | | | | 4,665 | | | | 145 | | | | 182 | |
2025 Fund | | | 9,690 | | | | 2,518 | | | | 4,995 | | | | 173 | | | | 555 | | | | 7,941 | | | | 269 | | | | 340 | |
2030 Fund | | | 8,473 | | | | 4,120 | | | | 3,142 | | | | 107 | | | | 622 | | | | 10,180 | | | | 209 | | | | 264 | |
2035 Fund | | | 9,870 | | | | 3,882 | | | | 3,603 | | | | 134 | | | | 711 | | | | 10,994 | | | | 255 | | | | 322 | |
2040 Fund | | | 9,798 | | | | 2,803 | | | | 3,672 | | | | 51 | | | | 692 | | | | 9,672 | | | | 252 | | | | 318 | |
2045 Fund | | | 7,805 | | | | 2,522 | | | | 2,258 | | | | 63 | | | | 596 | | | | 8,728 | | | | 210 | | | | 265 | |
2050 Fund | | | 3,137 | | | | 1,244 | | | | 1,358 | | | | 32 | | | | 224 | | | | 3,279 | | | | 89 | | | | 112 | |
2055 Fund | | | 3,058 | | | | 1,731 | | | | 1,237 | | | | 26 | | | | 249 | | | | 3,827 | | | | 88 | | | | 111 | |
| | |
| abfunds.com | | AB MULTI-MANAGER SELECT RETIREMENT FUNDS | 129 |
NOTES TO FINANCIAL STATEMENTS (continued)
| | | | | | | | | | | | | | | | | | | | | | | | | | | | | | | | |
| AB Unconstrained Bond Fund, Inc. | |
| | | | | | | | | | | | | | | | | | | | | Distributions | |
Multi-Manager
Select Fund | | Market
Value
7/31/16
(000) | | | Purchases
at Cost
(000) | | | Sales
Proceeds
(000) | | | Realized
Gain
(Loss)
(000) | | | Change in
Unrealized
Appr./(Depr.)
(000) | | | Market
Value
7/31/17
(000) | | | Income
(000) | | | Realized
Gains
(000) | |
Retirement Allocation Fund | | $ | 288 | | | $ | 42 | | | $ | 55 | | | $ | 1 | | | $ | 6 | | | $ | 282 | | | $ | 11 | | | $ | – 0 | – |
2010 Fund | | | 305 | | | | 38 | | | | 88 | | | | 1 | | | | 5 | | | | 261 | | | | 10 | | | | – 0 | – |
2015 Fund | | | 948 | | | | 79 | | | | 214 | | | | 1 | | | | 20 | | | | 834 | | | | 31 | | | | – 0 | – |
2020 Fund | | | 863 | | | | 140 | | | | 75 | | | | 1 | | | | 22 | | | | 951 | | | | 31 | | | | – 0 | – |
Brokerage commissions paid on investment transactions and brokerage commissions paid to Sanford C. Bernstein & Co. LLC and Sanford C. Bernstein Limited, affiliates of the Adviser, for the year ended July 31, 2017 were as follows:
| | | | | | | | | | | | |
Multi-Manager Select Fund | | Total Commissions | | | Sanford C. Bernstein & Co. LLC | | | Sanford C. Bernstein Limited | |
Retirement Allocation Fund | | $ | 1,729 | | | $ | – 0 | – | | $ | – 0 | – |
2010 Fund | | | 2,506 | | | | – 0 | – | | | – 0 | – |
2015 Fund | | | 7,315 | | | | – 0 | – | | | – 0 | – |
2020 Fund | | | 15,716 | | | | – 0 | – | | | – 0 | – |
2025 Fund | | | 21,294 | | | | – 0 | – | | | – 0 | – |
2030 Fund | | | 17,044 | | | | – 0 | – | | | – 0 | – |
2035 Fund | | | 13,598 | | | | – 0 | – | | | – 0 | – |
2040 Fund | | | 10,570 | | | | – 0 | – | | | – 0 | – |
2045 Fund | | | 7,945 | | | | – 0 | – | | | – 0 | – |
2050 Fund | | | 3,318 | | | | – 0 | – | | | – 0 | – |
2055 Fund | | | 3,388 | | | | – 0 | – | | | – 0 | – |
NOTE C
Distribution Services Agreement
The Funds have adopted a Distribution Services Agreement (the “Agreement”) pursuant to Rule 12b-1 under the Investment Company Act of 1940. Under the Agreement, the Funds pay distribution and servicing fees to the Distributor at an annual rate of up to .25% of each Fund’s average daily net assets attributable to Class A shares and 1% of each Fund’s average daily net assets attributable to Class C shares, .50% of each Fund’s average daily net assets attributable to Class R shares and .25% of each Fund’s average daily net assets attributable to Class K shares. There are no distribution and servicing fees on the Advisor Class, Class I and Class Z shares.
The fees are accrued daily and paid monthly. The Agreement provides that the Distributor will use such payments in their entirety for distribution assistance and promotional activities.
| | |
| 130 | AB MULTI-MANAGER SELECT RETIREMENT FUNDS | | abfunds.com |
NOTES TO FINANCIAL STATEMENTS (continued)
Since the commencement of the Funds’ operations, the Distributor has incurred expenses in excess of the distribution costs eligible to be reimbursed by each Fund for Class C, Class R and Class K as follows:
| | | | | | | | | | | | |
Multi-Manager Select Fund | | Class C | | | Class R | | | Class K | |
Retirement Allocation Fund | | $ | 541 | | | $ | 109 | | | $ | – 0 | – |
2010 Fund | | | – 0 | – | | | 2,068 | | | | –0 | – |
2015 Fund | | | 2,853 | | | | 1,514 | | | | –0 | – |
2020 Fund | | | 2,743 | | | | 9,107 | | | | –0 | – |
2025 Fund | | | 2,824 | | | | 11,486 | | | | –0 | – |
2030 Fund | | | 1,799 | | | | 8,165 | | | | –0 | – |
2035 Fund | | | 2,939 | | | | 6,430 | | | | –0 | – |
2040 Fund | | | 1,790 | | | | 4,868 | | | | –0 | – |
2045 Fund | | | 386 | | | | 8,704 | | | | –0 | – |
2050 Fund | | | – 0 | – | | | 1,506 | | | | –0 | – |
2055 Fund | | | 667 | | | | 623 | | | | –0 | – |
While such costs may be recovered from the Funds in future periods so long as the Agreement is in effect, the rate of the distribution and servicing fees payable under the Agreement may not be increased without a shareholder vote. In accordance with the Agreement, there is no provision for recovery of unreimbursed distribution costs incurred by the Distributor beyond the current fiscal year for Class A shares. The Agreement also provides that the Adviser may use its own resources to finance the distribution of the Funds’ shares.
NOTE D
Investment Transactions
Purchases and sales of investments in the Underlying Portfolios for the year ended July 31, 2017 were as follows:
| | | | | | | | |
Multi-Manager Select Fund | | Purchases | | | Sales | |
Retirement Allocation Fund | | $ | 5,728,963 | | | $ | 5,994,175 | |
2010 Fund | | | 6,724,858 | | | | 9,128,330 | |
2015 Fund | | | 16,148,050 | | | | 22,673,798 | |
2020 Fund | | | 41,797,751 | | | | 40,313,074 | |
2025 Fund | | | 51,983,782 | | | | 50,103,913 | |
2030 Fund | | | 51,347,920 | | | | 43,411,159 | |
2035 Fund | | | 41,230,700 | | | | 29,564,864 | |
2040 Fund | | | 27,260,573 | | | | 27,606,432 | |
2045 Fund | | | 23,028,753 | | | | 18,294,769 | |
2050 Fund | | | 10,573,393 | | | | 8,787,378 | |
2055 Fund | | | 13,919,399 | | | | 8,056,658 | |
| | |
| abfunds.com | | AB MULTI-MANAGER SELECT RETIREMENT FUNDS | 131 |
NOTES TO FINANCIAL STATEMENTS (continued)
The cost of investments for federal income tax purposes, gross unrealized appreciation and unrealized depreciation are as follows:
| | | | | | | | | | | | | | | | |
| | | | | | Gross Unrealized | | | Net
Unrealized
Appreciation/
(Depreciation) | |
| | | Cost | | | Appreciation | | | (Depreciation) | | |
Retirement Allocation Fund | | $ | 9,320,424 | | | $ | 422,588 | | | $ | (60,459 | ) | | $ | 362,129 | |
2010 Fund | | | 12,802,906 | | | | 738,995 | | | | (75,984 | ) | | | 663,011 | |
2015 Fund | | | 40,130,277 | | | | 2,844,758 | | | | (195,712 | ) | | | 2,649,046 | |
2020 Fund | | | 88,754,740 | | | | 6,743,025 | | | | (471,022 | ) | | | 6,272,003 | |
2025 Fund | | | 124,210,642 | | | | 11,290,717 | | | | (653,489 | ) | | | 10,637,228 | |
2030 Fund | | | 95,155,794 | | | | 8,897,309 | | | | (536,380 | ) | | | 8,360,929 | |
2035 Fund | | | 83,113,318 | | | | 9,414,965 | | | | (494,246 | ) | | | 8,920,719 | |
2040 Fund | | | 58,847,397 | | | | 7,182,612 | | | | (501,613 | ) | | | 6,680,999 | |
2045 Fund | | | 48,749,702 | | | | 6,123,028 | | | | (346,417 | ) | | | 5,776,611 | |
2050 Fund | | | 19,560,861 | | | | 2,492,898 | | | | (155,552 | ) | | | 2,337,346 | |
2055 Fund | | | 23,029,920 | | | | 2,691,701 | | | | (174,139 | ) | | | 2,517,562 | |
1. Currency Transactions
A Fund may invest in non-U.S. Dollar-denominated securities on a currency hedged or unhedged basis through its investments in an Underlying Portfolio. A Fund or an Underlying Portfolio may seek investment opportunities by taking long or short positions in currencies through the use of currency-related derivatives, including forward currency exchange contracts, futures and options on futures, swaps, and other options. A Fund or an Underlying Portfolio may enter into transactions for investment opportunities when it anticipates that a foreign currency will appreciate or depreciate in value but securities denominated in that currency are not held by the Funds or the Underlying Portfolio and do not present attractive investment opportunities. Such transactions may also be used when the Adviser or an Underlying Portfolio’s investment adviser believes that it may be more efficient than a direct investment in a foreign currency-denominated security. A Fund or an Underlying Portfolio may also conduct currency exchange contracts on a spot basis (i.e., for cash at the spot rate prevailing in the currency exchange market for buying or selling currencies).
| | |
| 132 | AB MULTI-MANAGER SELECT RETIREMENT FUNDS | | abfunds.com |
NOTES TO FINANCIAL STATEMENTS (continued)
NOTE E
Capital Stock
Each class consists of 1,000,000,000 authorized shares. Transactions in capital shares for each class were as follows:
| | | | | | | | | | | | | | | | | | | | | | | | |
| | | | | | | | | | | | | | | | | | | | | | | | |
| | | AB Multi-Manager Select Retirement Allocation Fund | | | | |
| | | Shares | | | | | | Amount | | | | |
| | | Year Ended
July 31,
2017 | | | Year Ended
July 31,
2016 | | | | | | Year Ended
July 31,
2017 | | | Year Ended
July 31,
2016 | | | | |
| | | | | | | | |
| Class A | | | | | | | | | | | | | | | | | | | | | | | | |
Shares sold | | | 3,018 | | | | 65,506 | | | | | | | $ | 32,094 | | | $ | 655,818 | | | | | |
| | | | | |
Shares issued in reinvestment of dividends and distributions | | | – 0 | – | | | 116 | | | | | | | | – 0 | – | | | 1,153 | | | | | |
| | | | | |
Shares redeemed | | | (17,180 | ) | | | (24,254 | ) | | | | | | | (177,975 | ) | | | (240,301 | ) | | | | |
| | | | | |
Net increase (decrease) | | | (14,162 | ) | | | 41,368 | | | | | | | $ | (145,881 | ) | | $ | 416,670 | | | | | |
| | | | | |
| | | | | | | | | | | | | | | | | | | | | | | | |
| Class C | | | | | | | | | | | | | | | | | | | | | | | | |
Shares sold | | | 6,701 | | | | 9,233 | | | | | | | $ | 68,616 | | | $ | 92,175 | | | | | |
| | | | | |
Shares issued in reinvestment of dividends and distributions | | | – 0 | – | | | 6 | | | | | | | | – 0 | – | | | 57 | | | | | |
| | | | | |
Shares redeemed | | | (1,629 | ) | | | (1,475 | ) | | | | | | | (16,704 | ) | | | (14,861 | ) | | | | |
| | | | | |
Net increase | | | 5,072 | | | | 7,764 | | | | | | | $ | 51,912 | | | $ | 77,371 | | | | | |
| | | | | |
| | | | | | | | | | | | | | | | | | | | | | | | |
| Advisor Class | | | | | | | | | | | | | | | | | | | | | | | | |
Shares sold | | | 259 | | | | 1,117 | | | | | | | $ | 2,770 | | | $ | 11,155 | | | | | |
| | | | | |
Shares redeemed | | | (65 | ) | | | (38 | ) | | | | | | | (689 | ) | | | (379 | ) | | | | |
| | | | | |
Net increase | | | 194 | | | | 1,079 | | | | | | | $ | 2,081 | | | $ | 10,776 | | | | | |
| | | | | |
| | | | | | | | | | | | | | | | | | | | | | | | |
| Class R | | | | | | | | | | | | | | | | | | | | | | | | |
Shares sold | | | 1,910 | | | | 11,726 | | | | | | | $ | 19,411 | | | $ | 113,189 | | | | | |
| | | | | |
Shares issued in reinvestment of dividends and distributions | | | 57 | | | | 18 | | | | | | | | 569 | | | | 173 | | | | | |
| | | | | |
Shares redeemed | | | (3,611 | ) | | | (9,513 | ) | | | | | | | (36,318 | ) | | | (91,086 | ) | | | | |
| | | | | |
Net increase (decrease) | | | (1,644 | ) | | | 2,231 | | | | | | | $ | (16,338 | ) | | $ | 22,276 | | | | | |
| | | | | |
| | | | | | | | | | | | | | | | | | | | | | | | |
| | |
| abfunds.com | | AB MULTI-MANAGER SELECT RETIREMENT FUNDS | 133 |
NOTES TO FINANCIAL STATEMENTS (continued)
| | | | | | | | | | | | | | | | | | | | | | | | |
| | | | | | | | | | | | | | | | | | | | | | | | |
| | | AB Multi-Manager Select Retirement Allocation Fund | | | | |
| | | Shares | | | | | | Amount | | | | |
| | | Year Ended
July 31,
2017 | | | Year Ended
July 31,
2016 | | | | | | Year Ended
July 31,
2017 | | | Year Ended
July 31,
2016 | | | | |
| | | | | | | | |
| Class K | | | | | | | | | | | | | | | | | | | | | | | | |
Shares sold | | | 144,712 | | | | 1,016,023 | | | | | | | $ | 1,469,367 | | | $ | 10,045,125 | | | | | |
| | | | | |
Shares issued in reinvestment of dividends and distributions | | | 15,808 | | | | 8,880 | | | | | | | | 156,811 | | | | 86,316 | | | | | |
| | | | | |
Shares redeemed | | | (226,516 | ) | | | (276,795 | ) | | | | | | | (2,314,088 | ) | | | (2,678,715 | ) | | | | |
| | | | | |
Net increase (decrease) | | | (65,996 | ) | | | 748,108 | | | | | | | $ | (687,910 | ) | | $ | 7,452,726 | | | | | |
| | | | | |
| | | | | | | | | | | | | | | | | | | | | | | | |
| Class I | | | | | | | | | | | | | | | | | | | | | | | | |
Shares sold | | | 41,259 | | | | 63,576 | | | | | | | $ | 422,484 | | | $ | 628,079 | | | | | |
| | | | | |
Shares issued in reinvestment of dividends and distributions | | | 1,714 | | | | 737 | | | | | | | | 17,035 | | | | 7,186 | | | | | |
| | | | | |
Shares redeemed | | | (7,995 | ) | | | (94,307 | ) | | | | | | | (81,885 | ) | | | (900,647 | ) | | | | |
| | | | | |
Net increase (decrease) | | | 34,978 | | | | (29,994 | ) | | | | | | $ | 357,634 | | | $ | (265,382 | ) | | | | |
| | | | | |
| | | | | | | | | | | | | | | | | | | | | | | | |
| Class Z | | | | | | | | | | | | | | | | | | | | | | | | |
Shares sold | | | 10 | | | | – 0 | – | | | | | | $ | 100 | | | $ | – 0 | – | | | | |
| | | | | |
Shares issued in reinvestment of dividends and distributions | | | – 0 | –(a) | | | – 0 | –(a) | | | | | | | 2 | | | | – 0 | –(b) | | | | |
| | | | | |
Net increase | | | 10 | | | | – 0 | – | | | | | | $ | 102 | | | $ | – 0 | – | | | | |
| | | | | |
| (a) | Amount is less than one share. |
| (b) | Amount is less than .50 cents. |
| | | | | | | | | | | | | | | | | | | | | | | | |
| | | | | | | | | | | | | | | | | | | | | | | | |
| | | AB Multi-Manager Select 2010 Fund | | | | |
| | | Shares | | | | | | Amount | | | | |
| | | Year Ended
July 31,
2017 | | | Year Ended July 31, 2016 | | | | | | Year Ended July 31, 2017 | | | Year Ended July 31, 2016 | | | | |
| | | | | | | | |
| Class A | | | | | | | | | | | | | | | | | | | | | | | | |
Shares sold | | | 11,547 | | | | 79,811 | | | | | | | $ | 123,292 | | | $ | 796,074 | | | | | |
| | | | | |
Shares issued in reinvestment of dividends and distributions | | | 132 | | | | 613 | | | | | | | | 1,376 | | | | 6,068 | | | | | |
| | | | | |
Shares converted from Class C | | | 270 | | | | – 0 | – | | | | | | | 2,929 | | | | – 0 | – | | | | |
| | | | | |
Shares redeemed | | | (38,140 | ) | | | (21,926 | ) | | | | | | | (399,782 | ) | | | (214,197 | ) | | | | |
| | | | | |
Net increase (decrease) | | | (26,191 | ) | | | 58,498 | | | | | | | $ | (272,185 | ) | | $ | 587,945 | | | | | |
| | | | | |
| | | | | | | | | | | | | | | | | | | | | | | | |
| | |
| 134 | AB MULTI-MANAGER SELECT RETIREMENT FUNDS | | abfunds.com |
NOTES TO FINANCIAL STATEMENTS (continued)
| | | | | | | | | | | | | | | | | | | | | | | | |
| | | | | | | | | | | | | | | | | | | | | | | | |
| | | AB Multi-Manager Select 2010 Fund | | | | |
| | | Shares | | | | | | Amount | | | | |
| | | Year Ended
July 31,
2017 | | | Year Ended July 31, 2016 | | | | | | Year Ended July 31, 2017 | | | Year Ended July 31, 2016 | | | | |
| | | | | | | | |
| Class C | | | | | | | | | | | | | | | | | | | | | | | | |
Shares sold | | | 3,101 | | | | 21,215 | | | | | | | $ | 32,279 | | | $ | 211,220 | | | | | |
| | | | | |
Shares issued in reinvestment of dividends and distributions | | | 31 | | | | 73 | | | | | | | | 321 | | | | 718 | | | | | |
| | | | | |
Shares converted to Class A | | | (274 | ) | | | – 0 | – | | | | | | | (2,929 | ) | | | – 0 | – | | | | |
| | | | | |
Shares redeemed | | | (102 | ) | | | (12,070 | ) | | | | | | | (1,070 | ) | | | (115,989 | ) | | | | |
| | | | | |
Net increase | | | 2,756 | | | | 9,218 | | | | | | | $ | 28,601 | | | $ | 95,949 | | | | | |
| | | | | |
| | | | | | | | | | | | | | | | | | | | | | | | |
| Advisor Class | | | | | | | | | | | | | | | | | | | | | | | | |
Shares sold | | | 1,979 | | | | 68,309 | | | | | | | $ | 21,000 | | | $ | 686,310 | | | | | |
| | | | | |
Shares issued in reinvestment of dividends and distributions | | | 1,214 | | | | 391 | | | | | | | | 12,518 | | | | 3,888 | | | | | |
| | | | | |
Shares redeemed | | | (941 | ) | | | (1,487 | ) | | | | | | | (10,000 | ) | | | (14,523 | ) | | | | |
| | | | | |
Net increase | | | 2,252 | | | | 67,213 | | | | | | | $ | 23,518 | | | $ | 675,675 | | | | | |
| | | | | |
| | | | | | | | | | | | | | | | | | | | | | | | |
| Class R | | | | | | | | | | | | | | | | | | | | | | | | |
Shares sold | | | 4,753 | | | | 71,890 | | | | | | | $ | 48,703 | | | $ | 709,616 | | | | | |
| | | | | |
Shares issued in reinvestment of dividends and distributions | | | 1,265 | | | | 638 | | | | | | | | 12,595 | | | | 6,186 | | | | | |
| | | | | |
Shares redeemed | | | (30,330 | ) | | | (12,697 | ) | | | | | | | (317,523 | ) | | | (124,248 | ) | | | | |
| | | | | |
Net increase (decrease) | | | (24,312 | ) | | | 59,831 | | | | | | | $ | (256,225 | ) | | $ | 591,554 | | | | | |
| | | | | |
| | | | | | | | | | | | | | | | | | | | | | | | |
| Class K | | | | | | | | | | | | | | | | | | | | | | | | |
Shares sold | | | 276,887 | | | | 1,667,254 | | | | | | | $ | 2,839,354 | | | $ | 16,366,468 | | | | | |
| | | | | |
Shares issued in reinvestment of dividends and distributions | | | 26,569 | | | | 18,088 | | | | | | | | 264,629 | | | | 175,273 | | | | | |
| | | | | |
Shares redeemed | | | (520,319 | ) | | | (452,946 | ) | | | | | | | (5,313,915 | ) | | | (4,426,129 | ) | | | | |
| | | | | |
Net increase (decrease) | | | (216,863 | ) | | | 1,232,396 | | | | | | | $ | (2,209,932 | ) | | $ | 12,115,612 | | | | | |
| | | | | |
| | | | | | | | | | | | | | | | | | | | | | | | |
| Class I | | | | | | | | | | | | | | | | | | | | | | | | |
Shares sold | | | 3,774 | | | | 254 | | | | | | | $ | 38,367 | | | $ | 2,504 | | | | | |
| | | | | |
Shares issued in reinvestment of dividends and distributions | | | 35 | | | | 3 | | | | | | | | 344 | | | | 31 | | | | | |
| | | | | |
Shares redeemed | | | – 0 | –(a) | | | (94,832 | ) | | | | | | | (1 | ) | | | (896,163 | ) | | | | |
| | | | | |
Net increase (decrease) | | | 3,809 | | | | (94,575 | ) | | | | | | $ | 38,710 | | | $ | (893,628 | ) | | | | |
| | | | | |
| | | | | | | | | | | | | | | | | | | | | | | | |
| | |
| abfunds.com | | AB MULTI-MANAGER SELECT RETIREMENT FUNDS | 135 |
NOTES TO FINANCIAL STATEMENTS (continued)
| | | | | | | | | | | | | | | | | | | | | | | | |
| | | | | | | | | | | | | | | | | | | | | | | | |
| | | AB Multi-Manager Select 2010 Fund | | | | |
| | | Shares | | | | | | Amount | | | | |
| | | Year Ended
July 31,
2017 | | | Year Ended July 31, 2016 | | | | | | Year Ended July 31, 2017 | | | Year Ended July 31, 2016 | | | | |
| | | | | | | | |
| Class Z | | | | | | | | | | | | | | | | | | | | | | | | |
Shares sold | | | 10 | | | | – 0 | – | | | | | | $ | 99 | | | $ | – 0 | – | | | | |
| | | | | |
Shares issued in reinvestment of dividends and distributions | | | – 0 | –(a) | | | – 0 | –(a) | | | | | | | 3 | | | | – 0 | –(b) | | | | |
| | | | | |
Shares redeemed | | | – 0 | –(a) | | | – 0 | – | | | | | | | (1 | ) | | | – 0 | – | | | | |
| | | | | |
Net increase | | | 10 | | | | – 0 | – | | | | | | $ | 101 | | | $ | – 0 | – | | | | |
| | | | | |
| (a) | Amount is less than one share. |
| (b) | Amount is less than .50 cents. |
| | | | | | | | | | | | | | | | | | | | | | | | |
| | | | | | | | | | | | | | | | | | | | | | | | |
| | | AB Multi-Manager Select 2015 Fund | | | | |
| | | Shares | | | | | | Amount | | | | |
| | | Year Ended
July 31,
2017 | | | Year Ended July 31, 2016 | | | | | | Year Ended July 31, 2017 | | | Year Ended July 31, 2016 | | | | |
| | | | | | | | |
| Class A | | | | | | | | | | | | | | | | | | | | | | | | |
Shares sold | | | 19,374 | | | | 355,853 | | | | | | | $ | 204,353 | | | $ | 3,542,540 | | | | | |
| | | | | |
Shares issued in reinvestment of dividends and distributions | | | 4,202 | | | | 4,425 | | | | | | | | 42,978 | | | | 43,805 | | | | | |
| | | | | |
Shares converted from Class C | | | 3,894 | | | | – 0 | – | | | | | | | 41,704 | | | | – 0 | – | | | | |
| | | | | |
Shares redeemed | | | (170,793 | ) | | | (31,341 | ) | | | | | | | (1,772,945 | ) | | | (317,284 | ) | | | | |
| | | | | |
Net increase (decrease) | | | (143,323 | ) | | | 328,937 | | | | | | | $ | (1,483,910 | ) | | $ | 3,269,061 | | | | | |
| | | | | |
| | | | | | | | | | | | | | | | | | | | | | | | |
| Class C | | | | | | | | | | | | | | | | | | | | | | | | |
Shares sold | | | 2,915 | | | | 46,335 | | | | | | | $ | 30,530 | | | $ | 457,797 | | | | | |
| | | | | |
Shares issued in reinvestment of dividends and distributions | | | 784 | | | | 571 | | | | | | | | 7,982 | | | | 5,643 | | | | | |
| | | | | |
Shares converted to Class A | | | (3,920 | ) | | | – 0 | – | | | | | | | (41,704 | ) | | | – 0 | – | | | | |
| | | | | |
Shares redeemed | | | (1,213 | ) | | | (14,513 | ) | | | | | | | (12,738 | ) | | | (145,081 | ) | | | | |
| | | | | |
Net increase (decrease) | | | (1,434 | ) | | | 32,393 | | | | | | | $ | (15,930 | ) | | $ | 318,359 | | | | | |
| | | | | |
| | | | | | | | | | | | | | | | | | | | | | | | |
| | |
| 136 | AB MULTI-MANAGER SELECT RETIREMENT FUNDS | | abfunds.com |
NOTES TO FINANCIAL STATEMENTS (continued)
| | | | | | | | | | | | | | | | | | | | | | | | |
| | | | | | | | | | | | | | | | | | | | | | | | |
| | | AB Multi-Manager Select 2015 Fund | | | | |
| | | Shares | | | | | | Amount | | | | |
| | | Year Ended
July 31,
2017 | | | Year Ended July 31, 2016 | | | | | | Year Ended July 31, 2017 | | | Year Ended July 31, 2016 | | | | |
| | | | | | | | |
| Advisor Class | | | | | | | | | | | | | | | | | | | | | | | | |
Shares sold | | | 240 | | | | 3,639 | | | | | | | $ | 2,573 | | | $ | 36,156 | | | | | |
| | | | | |
Shares issued in reinvestment of dividends and distributions | | | 161 | | | | 9 | | | | | | | | 1,664 | | | | 91 | | | | | |
| | | | | |
Shares redeemed | | | – 0 | – | | | (2,994 | ) | | | | | | | – 0 | – | | | (29,997 | ) | | | | |
| | | | | |
Net increase | | | 401 | | | | 654 | | | | | | | $ | 4,237 | | | $ | 6,250 | | | | | |
| | | | | |
| | | | | | | | | | | | | | | | | | | | | | | | |
| Class R | | | | | | | | | | | | | | | | | | | | | | | | |
Shares sold | | | 2,945 | | | | 34,298 | | | | | | | $ | 30,517 | | | $ | 338,405 | | | | | |
| | | | | |
Shares issued in reinvestment of dividends and distributions | | | 818 | | | | 552 | | | | | | | | 8,200 | | | | 5,356 | | | | | |
| | | | | |
Shares redeemed | | | (3,392 | ) | | | (22,797 | ) | | | | | | | (35,122 | ) | | | (221,400 | ) | | | | |
| | | | | |
Net increase | | | 371 | | | | 12,053 | | | | | | | $ | 3,595 | | | $ | 122,361 | | | | | |
| | | | | |
| | | | | | | | | | | | | | | | | | | | | | | | |
| Class K | | | | | | | | | | | | | | | | | | | | | | | | |
Shares sold | | | 639,497 | | | | 4,279,201 | | | | | | | $ | 6,618,689 | | | $ | 42,021,964 | | | | | |
| | | | | |
Shares issued in reinvestment of dividends and distributions | | | 96,811 | | | | 56,455 | | | | | | | | 970,047 | | | | 548,742 | | | | | |
| | | | | |
Shares redeemed | | | (1,254,954 | ) | | | (663,432 | ) | | | | | | | (12,946,470 | ) | | | (6,498,258 | ) | | | | |
| | | | | |
Net increase (decrease) | | | (518,646 | ) | | | 3,672,224 | | | | | | | $ | (5,357,734 | ) | | $ | 36,072,448 | | | | | |
| | | | | |
| | | | | | | | | | | | | | | | | | | | | | | | |
| Class I | | | | | | | | | | | | | | | | | | | | | | | | |
Shares sold | | | 25,491 | | | | 51,710 | | | | | | | $ | 262,853 | | | $ | 513,250 | | | | | |
| | | | | |
Shares issued in reinvestment of dividends and distributions | | | 1,620 | | | | 367 | | | | | | | | 16,250 | | | | 3,570 | | | | | |
| | | | | |
Shares redeemed | | | (30,233 | ) | | | (95,596 | ) | | | | | | | (307,519 | ) | | | (897,082 | ) | | | | |
| | | | | |
Net decrease | | | (3,122 | ) | | | (43,519 | ) | | | | | | $ | (28,416 | ) | | $ | (380,262 | ) | | | | |
| | | | | |
| | | | | | | | | | | | | | | | | | | | | | | | |
| Class Z | | | | | | | | | | | | | | | | | | | | | | | | |
Shares sold | | | 13 | | | | – 0 | – | | | | | | $ | 131 | | | $ | – 0 | – | | | | |
| | | | | |
Shares issued in reinvestment of dividends and distributions | | | – 0 | –(a) | | | – 0 | –(a) | | | | | | | 3 | | | | – 0 | –(b) | | | | |
| | | | | |
Net increase | | | 13 | | | | – 0 | – | | | | | | $ | 134 | | | $ | – 0 | – | | | | |
| | | | | |
| (a) | Amount is less than one share. |
| (b) | Amount is less than .50 cents. |
| | |
| abfunds.com | | AB MULTI-MANAGER SELECT RETIREMENT FUNDS | 137 |
NOTES TO FINANCIAL STATEMENTS (continued)
| | | | | | | | | | | | | | | | | | | | | | | | |
| | | | | | | | | | | | | | | | | | | | | | | | |
| | | AB Multi-Manager Select 2020 Fund | | | | |
| | | Shares | | | | | | Amount | | | | |
| | | Year Ended
July 31,
2017 | | | Year Ended July 31, 2016 | | | | | | Year Ended July 31, 2017 | | | Year Ended July 31, 2016 | | | | |
| | | | | | | | |
| Class A | | | | | | | | | | | | | | | | | | | | | | | | |
Shares sold | | | 45,084 | | | | 814,845 | | | | | | | $ | 474,554 | | | $ | 8,084,991 | | | | | |
| | | | | |
Shares issued in reinvestment of dividends and distributions | | | 10,199 | | | | 9,704 | | | | | | | | 104,849 | | | | 96,171 | | | | | |
| | | | | |
Shares converted from Class C | | | 9,433 | | | | – 0 | – | | | | | | | 102,063 | | | | – 0 | – | | | | |
| | | | | |
Shares redeemed | | | (392,338 | ) | | | (77,676 | ) | | | | | | | (4,092,506 | ) | | | (769,030 | ) | | | | |
| | | | | |
Net increase (decrease) | | | (327,622 | ) | | | 746,873 | | | | | | | $ | (3,411,040 | ) | | $ | 7,412,132 | | | | | |
| | | | | |
| | | | | | | | | | | | | | | | | | | | | | | | |
| Class C | | | | | | | | | | | | | | | | | | | | | | | | |
Shares sold | | | 42,959 | | | | 108,258 | | | | | | | $ | 453,426 | | | $ | 1,067,869 | | | | | |
| | | | | |
Shares issued in reinvestment of dividends and distributions | | | 2,035 | | | | 1,168 | | | | | | | | 20,776 | | | | 11,513 | | | | | |
| | | | | |
Shares converted to Class A | | | (9,530 | ) | | | – 0 | – | | | | | | | (102,063 | ) | | | – 0 | – | | | | |
| | | | | |
Shares redeemed | | | (16,030 | ) | | | (21,377 | ) | | | | | | | (166,636 | ) | | | (210,946 | ) | | | | |
| | | | | |
Net increase | | | 19,434 | | | | 88,049 | | | | | | | $ | 205,503 | | | $ | 868,436 | | | | | |
| | | | | |
| | | | | | | | | | | | | | | | | | | | | | | | |
| Advisor Class | | | | | | | | | | | | | | | | | | | | | | | | |
Shares sold | | | 3,366 | | | | 21,106 | | | | | | | $ | 35,963 | | | $ | 212,881 | | | | | |
| | | | | |
Shares issued in reinvestment of dividends and distributions | | | 494 | | | | 251 | | | | | | | | 5,082 | | | | 2,500 | | | | | |
| | | | | |
Shares redeemed | | | (1,173 | ) | | | (5,814 | ) | | | | | | | (12,355 | ) | | | (57,390 | ) | | | | |
| | | | | |
Net increase | | | 2,687 | | | | 15,543 | | | | | | | $ | 28,690 | | | $ | 157,991 | | | | | |
| | | | | |
| | | | | | | | | | | | | | | | | | | | | | | | |
| Class R | | | | | | | | | | | | | | | | | | | | | | | | |
Shares sold | | | 19,556 | | | | 299,341 | | | | | | | $ | 202,316 | | | $ | 2,946,080 | | | | | |
| | | | | |
Shares issued in reinvestment of dividends and distributions | | | 3,652 | | | | 3,620 | | | | | | | | 36,811 | | | | 35,154 | | | | | |
| | | | | |
Shares redeemed | | | (62,862 | ) | | | (104,583 | ) | | | | | | | (650,287 | ) | | | (1,031,706 | ) | | | | |
| | | | | |
Net increase (decrease) | | | (39,654 | ) | | | 198,378 | | | | | | | $ | (411,160 | ) | | $ | 1,949,528 | | | | | |
| | | | | |
| | | | | | | | | | | | | | | | | | | | | | | | |
| | |
| 138 | AB MULTI-MANAGER SELECT RETIREMENT FUNDS | | abfunds.com |
NOTES TO FINANCIAL STATEMENTS (continued)
| | | | | | | | | | | | | | | | | | | | | | | | |
| | | | | | | | | | | | | | | | | | | | | | | | |
| | | AB Multi-Manager Select 2020 Fund | | | | |
| | | Shares | | | | | | Amount | | | | |
| | | Year Ended
July 31,
2017 | | | Year Ended July 31, 2016 | | | | | | Year Ended July 31, 2017 | | | Year Ended July 31, 2016 | | | | |
| | | | | | | | |
| Class K | | | | | | | | | | | | | | | | | | | | | | | | |
Shares sold | | | 2,551,822 | | | | 7,254,831 | | | | | | | $ | 26,644,803 | | | $ | 71,560,066 | | | | | |
| | | | | |
Shares issued in reinvestment of dividends and distributions | | | 167,630 | | | | 94,171 | | | | | | | | 1,691,387 | | | | 917,226 | | | | | |
| | | | | |
Shares redeemed | | | (2,265,517 | ) | | | (959,192 | ) | | | | | | | (23,770,610 | ) | | | (9,320,861 | ) | | | | |
| | | | | |
Net increase | | | 453,935 | | | | 6,389,810 | | | | | | | $ | 4,565,580 | | | $ | 63,156,431 | | | | | |
| | | | | |
| | | | | | | | | | | | | | | | | | | | | | | | |
| Class I | | | | | | | | | | | | | | | | | | | | | | | | |
Shares sold | | | 46,558 | | | | 231,027 | | | | | | | $ | 484,587 | | | $ | 2,286,266 | | | | | |
| | | | | |
Shares issued in reinvestment of dividends and distributions | | | 6,003 | | | | 3,212 | | | | | | | | 60,570 | | | | 31,311 | | | | | |
| | | | | |
Shares redeemed | | | (84,230 | ) | | | (99,797 | ) | | | | | | | (878,024 | ) | | | (932,710 | ) | | | | |
| | | | | |
Net increase (decrease) | | | (31,669 | ) | | | 134,442 | | | | | | | $ | (332,867 | ) | | $ | 1,384,867 | | | | | |
| | | | | |
| | | | | | | | | | | | | | | | | | | | | | | | |
| Class Z | | | | | | | | | | | | | | | | | | | | | | | | |
Shares sold | | | 10 | | | | – 0 | –(a) | | | | | | $ | 100 | | | $ | – 0 | –(b) | | | | |
| | | | | |
Shares issued in reinvestment of dividends and distributions | | | – 0 | – | | | – 0 | –(a) | | | | | | | 3 | | | | – 0 | –(b) | | | | |
| | | | | |
Shares redeemed | | | – 0 | – | | | (0 | )(a) | | | | | | | (2 | ) | | | (3 | ) | | | | |
| | | | | |
Net increase | | | 10 | | | | – 0 | – | | | | | | $ | 101 | | | $ | (3 | ) | | | | |
| | | | | |
| (a) | Amount is less than one share. |
| (b) | Amount is less than .50 cents. |
| | | | | | | | | | | | | | | | | | | | | | | | |
| | | | | | | | | | | | | | | | | | | | | | | | |
| | | AB Multi-Manager Select 2025 Fund | | | | |
| | | Shares | | | | | | Amount | | | | |
| | | Year Ended
July 31,
2017 | | | Year Ended July 31, 2016 | | | | | | Year Ended July 31, 2017 | | | Year Ended July 31, 2016 | | | | |
| | | | | | | | |
| Class A | | | | | | | | | | | | | | | | | | | | | | | | |
Shares sold | | | 78,998 | | | | 870,281 | | | | | | | $ | 838,142 | | | $ | 8,708,445 | | | | | |
| | | | | |
Shares issued in reinvestment of dividends and distributions | | | 8,139 | | | | 11,493 | | | | | | | | 84,079 | | | | 114,133 | | | | | |
| | | | | |
Shares converted from Class C | | | 22,819 | | | | – 0 | – | | | | | | | 249,408 | | | | – 0 | – | | | | |
| | | | | |
Shares redeemed | | | (532,894 | ) | | | (51,172 | ) | | | | | | | (5,527,675 | ) | | | (507,797 | ) | | | | |
| | | | | |
Net increase (decrease) | | | (422,938 | ) | | | 830,602 | | | | | | | $ | (4,356,046 | ) | | $ | 8,314,781 | | | | | |
| | | | | |
| | | | | | | | | | | | | | | | | | | | | | | | |
| | |
| abfunds.com | | AB MULTI-MANAGER SELECT RETIREMENT FUNDS | 139 |
NOTES TO FINANCIAL STATEMENTS (continued)
| | | | | | | | | | | | | | | | | | | | | | | | |
| | | | | | | | | | | | | | | | | | | | | | | | |
| | | AB Multi-Manager Select 2025 Fund | | | | |
| | | Shares | | | | | | Amount | | | | |
| | | Year Ended
July 31,
2017 | | | Year Ended July 31, 2016 | | | | | | Year Ended July 31, 2017 | | | Year Ended July 31, 2016 | | | | |
| | | | | | | | |
| Class C | | | | | | | | | | | | | | | | | | | | | | | | |
Shares sold | | | 8,246 | | | | 66,660 | | | | | | | $ | 86,192 | | | $ | 653,782 | | | | | |
| | | | | |
Shares issued in reinvestment of dividends and distributions | | | 1,554 | | | | 645 | | | | | | | | 15,935 | | | | 6,381 | | | | | |
| | | | | |
Shares converted to Class A | | | (23,029 | ) | | | – 0 | – | | | | | | | (249,408 | ) | | | – 0 | – | | | | |
| | | | | |
Shares redeemed | | | (9,359 | ) | | | (1,869 | ) | | | | | | | (99,125 | ) | | | (17,620 | ) | | | | |
| | | | | |
Net increase (decrease) | | | (22,588 | ) | | | 65,436 | | | | | | | $ | (246,406 | ) | | $ | 642,543 | | | | | |
| | | | | |
| | | | | | | | | | | | | | | | | | | | | | | | |
| Advisor Class | | | | | | | | | | | | | | | | | | | | | | | | |
Shares sold | | | 7,513 | | | | 30,335 | | | | | | | $ | 80,325 | | | $ | 305,941 | | | | | |
| | | | | |
Shares issued in reinvestment of dividends and distributions | | | 1,276 | | | | 1,096 | | | | | | | | 13,176 | | | | 10,924 | | | | | |
| | | | | |
Shares redeemed | | | (240 | ) | | | (15,719 | ) | | | | | | | (2,525 | ) | | | (156,079 | ) | | | | |
| | | | | |
Net increase | | | 8,549 | | | | 15,712 | | | | | | | $ | 90,976 | | | $ | 160,786 | | | | | |
| | | | | |
| | | | | | | | | | | | | | | | | | | | | | | | |
| Class R | | | | | | | | | | | | | | | | | | | | | | | | |
Shares sold | | | 30,783 | | | | 275,349 | | | | | | | $ | 318,266 | | | $ | 2,705,202 | | | | | |
| | | | | |
Shares issued in reinvestment of dividends and distributions | | | 6,198 | | | | 3,900 | | | | | | | | 62,598 | | | | 37,990 | | | | | |
| | | | | |
Shares redeemed | | | (52,736 | ) | | | (53,034 | ) | | | | | | | (552,728 | ) | | | (518,896 | ) | | | | |
| | | | | |
Net increase (decrease) | | | (15,755 | ) | | | 226,215 | | | | | | | $ | (171,864 | ) | | $ | 2,224,296 | | | | | |
| | | | | |
| | | | | | | | | | | | | | | | | | | | | | | | |
| Class K | | | | | | | | | | | | | | | | | | | | | | | | |
Shares sold | | | 2,401,295 | | | | 9,818,685 | | | | | | | $ | 25,106,311 | | | $ | 96,545,747 | | | | | |
| | | | | |
Shares issued in reinvestment of dividends and distributions | | | 264,312 | | | | 130,231 | | | | | | | | 2,674,836 | | | | 1,271,054 | | | | | |
| | | | | |
Shares redeemed | | | (2,191,060 | ) | | | (616,287 | ) | | | | | | | (22,844,881 | ) | | | (5,875,570 | ) | | | | |
| | | | | |
Net increase | | | 474,547 | | | | 9,332,629 | | | | | | | $ | 4,936,266 | | | $ | 91,941,231 | | | | | |
| | | | | |
| | | | | | | | | | | | | | | | | | | | | | | | |
| Class I | | | | | | | | | | | | | | | | | | | | | | | | |
Shares sold | | | 120,028 | | | | 255,923 | | | | | | | $ | 1,255,986 | | | $ | 2,535,492 | | | | | |
| | | | | |
Shares issued in reinvestment of dividends and distributions | | | 7,279 | | | | 3,219 | | | | | | | | 73,738 | | | | 31,478 | | | | | |
| | | | | |
Shares redeemed | | | (72,876 | ) | | | (121,009 | ) | | | | | | | (775,480 | ) | | | (1,138,306 | ) | | | | |
| | | | | |
Net increase | | | 54,431 | | | | 138,133 | | | | | | | $ | 554,244 | | | $ | 1,428,664 | | | | | |
| | | | | |
| | | | | | | | | | | | | | | | | | | | | | | | |
| | |
| 140 | AB MULTI-MANAGER SELECT RETIREMENT FUNDS | | abfunds.com |
NOTES TO FINANCIAL STATEMENTS (continued)
| | | | | | | | | | | | | | | | | | | | | | | | |
| | | | | | | | | | | | | | | | | | | | | | | | |
| | | AB Multi-Manager Select 2025 Fund | | | | |
| | | Shares | | | | | | Amount | | | | |
| | | Year Ended
July 31,
2017 | | | Year Ended July 31, 2016 | | | | | | Year Ended July 31, 2017 | | | Year Ended July 31, 2016 | | | | |
| | | | | | | | |
| Class Z | | | | | | | | | | | | | | | | | | | | | | | | |
Shares sold | | | 2,325 | | | | – 0 | – | | | | | | $ | 23,812 | | | $ | – 0 | – | | | | |
| | | | | |
Shares issued in reinvestment of dividends and distributions | | | 69 | | | | – 0 | –(a) | | | | | | | 699 | | | | – 0 | –(b) | | | | |
| | | | | |
Shares redeemed | | | (27 | ) | | | – 0 | – | | | | | | | (281 | ) | | | – 0 | – | | | | |
| | | | | |
Net increase | | | 2,367 | | | | – 0 | – | | | | | | $ | 24,230 | | | $ | – 0 | – | | | | |
| | | | | |
| (a) | Amount is less than one share. |
| (b) | Amount is less than .50 cents. |
| | | | | | | | | | | | | | | | | | | | | | | | |
| | | | | | | | | | | | | | | | | | | | | | | | |
| | | AB Multi-Manager Select 2030 Fund | | | | |
| | | Shares | | | | | | Amount | | | | |
| | | Year Ended July 31, 2017 | | | Year Ended July 31, 2016 | | | | | | Year Ended July 31, 2017 | | | Year Ended July 31, 2016 | | | | |
| | | | | | | | |
| Class A | | | | | | | | | | | | | | | | | | | | | | | | |
Shares sold | | | 76,367 | | | | 901,061 | | | | | | | $ | 823,423 | | | $ | 9,018,677 | | | | | |
| | | | | |
Shares issued in reinvestment of dividends and distributions | | | 10,346 | | | | 10,447 | | | | | | | | 108,009 | | | | 104,466 | | | | | |
| | | | | |
Shares converted from Class C | | | 21,985 | | | | – 0 | – | | | | | | | 244,695 | | | | – 0 | – | | | | |
| | | | | |
Shares redeemed | | | (408,189 | ) | | | (127,478 | ) | | | | | | | (4,264,323 | ) | | | (1,287,007 | ) | | | | |
| | | | | |
Net increase (decrease) | | | (299,491 | ) | | | 784,030 | | | | | | | $ | (3,088,196 | ) | | $ | 7,836,136 | | | | | |
| | | | | |
| | | | | | | | | | | | | | | | | | | | | | | | |
| Class C | | | | | | | | | | | | | | | | | | | | | | | | |
Shares sold | | | 25,606 | | | | 103,422 | | | | | | | $ | 275,799 | | | $ | 1,036,013 | | | | | |
| | | | | |
Shares issued in reinvestment of dividends and distributions | | | 1,730 | | | | 683 | | | | | | | | 17,921 | | | | 6,806 | | | | | |
| | | | | |
Shares converted to Class A | | | (22,205 | ) | | | – 0 | – | | | | | | | (244,695 | ) | | | – 0 | – | | | | |
| | | | | |
Shares redeemed | | | (9,311 | ) | | | (18,619 | ) | | | | | | | (95,516 | ) | | | (186,033 | ) | | | | |
| | | | | |
Net increase (decrease) | | | (4,180 | ) | | | 85,486 | | | | | | | $ | (46,491 | ) | | $ | 856,786 | | | | | |
| | | | | |
| | | | | | | | | | | | | | | | | | | | | | | | |
| | |
| abfunds.com | | AB MULTI-MANAGER SELECT RETIREMENT FUNDS | 141 |
NOTES TO FINANCIAL STATEMENTS (continued)
| | | | | | | | | | | | | | | | | | | | | | | | |
| | | | | | | | | | | | | | | | | | | | | | | | |
| | | AB Multi-Manager Select 2030 Fund | | | | |
| | | Shares | | | | | | Amount | | | | |
| | | Year Ended July 31, 2017 | | | Year Ended July 31, 2016 | | | | | | Year Ended July 31, 2017 | | | Year Ended July 31, 2016 | | | | |
| | | | | | | | |
| Advisor Class | | | | | | | | | | | | | | | | | | | | | | | | |
Shares sold | | | 18,422 | | | | 66,553 | | | | | | | $ | 209,002 | | | $ | 675,745 | | | | | |
| | | | | |
Shares issued in reinvestment of dividends and distributions | | | 1,882 | | | | 948 | | | | | | | | 19,670 | | | | 9,509 | | | | | |
| | | | | |
Shares redeemed | | | (7,027 | ) | | | (5,851 | ) | | | | | | | (75,345 | ) | | | (58,513 | ) | | | | |
| | | | | |
Net increase | | | 13,277 | | | | 61,650 | | | | | | | $ | 153,327 | | | $ | 626,741 | | | | | |
| | | | | |
| | | | | | | | | | | | | | | | | | | | | | | | |
| Class R | | | | | | | | | | | | | | | | | | | | | | | | |
Shares sold | | | 17,955 | | | | 194,121 | | | | | | | $ | 189,829 | | | $ | 1,907,112 | | | | | |
| | | | | |
Shares issued in reinvestment of dividends and distributions | | | 3,643 | | | | 2,783 | | | | | | | | 37,267 | | | | 27,304 | | | | | |
| | | | | |
Shares redeemed | | | (88,038 | ) | | | (52,724 | ) | | | | | | | (926,840 | ) | | | (519,385 | ) | | | | |
| | | | | |
Net increase (decrease) | | | (66,440 | ) | | | 144,180 | | | | | | | $ | (699,744 | ) | | $ | 1,415,031 | | | | | |
| | | | | |
| | | | | | | | | | | | | | | | | | | | | | | | |
| Class K | | | | | | | | | | | | | | | | | | | | | | | | |
Shares sold | | | 2,591,107 | | | | 6,752,994 | | | | | | | $ | 27,455,252 | | | $ | 66,891,318 | | | | | |
| | | | | |
Shares issued in reinvestment of dividends and distributions | | | 179,000 | | | | 90,885 | | | | | | | | 1,831,174 | | | | 892,491 | | | | | |
| | | | | |
Shares redeemed | | | (1,853,202 | ) | | | (728,707 | ) | | | | | | | (19,445,912 | ) | | | (7,110,030 | ) | | | | |
| | | | | |
Net increase | | | 916,905 | | | | 6,115,172 | | | | | | | $ | 9,840,514 | | | $ | 60,673,779 | | | | | |
| | | | | |
| | | | | | | | | | | | | | | | | | | | | | | | |
| Class I | | | | | | | | | | | | | | | | | | | | | | | | |
Shares sold | | | 254,944 | | | | 277,051 | | | | | | | $ | 2,695,053 | | | $ | 2,750,187 | | | | | |
| | | | | |
Shares issued in reinvestment of dividends and distributions | | | 9,528 | | | | 2,393 | | | | | | | | 97,564 | | | | 23,547 | | | | | |
| | | | | |
Shares redeemed | | | (146,203 | ) | | | (117,419 | ) | | | | | | | (1,532,949 | ) | | | (1,087,672 | ) | | | | |
| | | | | |
Net increase | | | 118,269 | | | | 162,025 | | | | | | | $ | 1,259,668 | | | $ | 1,686,062 | | | | | |
| | | | | |
| | | | | | | | | | | | | | | | | | | | | | | | |
| Class Z | | | | | | | | | | | | | | | | | | | | | | | | |
Shares sold | | | 408 | | | | 18 | | | | | | | $ | 4,417 | | | $ | 186 | | | | | |
| | | | | |
Shares issued in reinvestment of dividends and distributions | | | 3 | | | | – 0 | –(a) | | | | | | | 32 | | | | – 0 | –(b) | | | | |
| | | | | |
Shares redeemed | | | (1 | ) | | | – 0 | – | | | | | | | (18 | ) | | | – 0 | – | | | | |
| | | | | |
Net increase | | | 410 | | | | 18 | | | | | | | $ | 4,431 | | | $ | 186 | | | | | |
| | | | | |
| (a) | Amount is less than one share. |
| (b) | Amount is less than .50 cents. |
| | |
| 142 | AB MULTI-MANAGER SELECT RETIREMENT FUNDS | | abfunds.com |
NOTES TO FINANCIAL STATEMENTS (continued)
| | | | | | | | | | | | | | | | | | | | | | | | |
| | | | | | | | | | | | | | | | | | | | | | | | |
| | | AB Multi-Manager Select 2035 Fund | | | | |
| | | Shares | | | | | | Amount | | | | |
| | | Year Ended July 31, 2017 | | | Year Ended July 31, 2016 | | | | | | Year Ended July 31, 2017 | | | Year Ended July 31, 2016 | | | | |
| | | | | | | | |
| Class A | | | | | | | | | | | | | | | | | | | | | | | | |
Shares sold | | | 73,403 | | | | 691,818 | | | | | | | $ | 798,189 | | | $ | 6,935,960 | | | | | |
| | | | | |
Shares issued in reinvestment of dividends and distributions | | | 6,017 | | | | 9,003 | | | | | | | | 63,122 | | | | 90,114 | | | | | |
| | | | | |
Shares converted from Class C | | | 56,995 | | | | – 0 | – | | | | | | | 642,900 | | | | – 0 | – | | | | |
| | | | | |
Shares redeemed | | | (432,477 | ) | | | (35,164 | ) | | | | | | | (4,517,850 | ) | | | (349,872 | ) | | | | |
| | | | | |
Net increase (decrease) | | | (296,062 | ) | | | 665,657 | | | | | | | $ | (3,013,639 | ) | | $ | 6,676,202 | | | | | |
| | | | | |
| | | | | | | | | | | | | | | | | | | | | | | | |
| Class C | | | | | | | | | | | | | | | | | | | | | | | | |
Shares sold | | | 17,189 | | | | 86,588 | | | | | | | $ | 187,265 | | | $ | 856,821 | | | | | |
| | | | | |
Shares issued in reinvestment of dividends and distributions | | | 1,501 | | | | 766 | | | | | | | | 15,597 | | | | 7,634 | | | | | |
| | | | | |
Shares converted to Class A | | | (57,711 | ) | | | – 0 | – | | | | | | | (642,900 | ) | | | – 0 | – | | | | |
| | | | | |
Shares redeemed | | | (1,365 | ) | | | (1,117 | ) | | | | | | | (14,910 | ) | | | (10,432 | ) | | | | |
| | | | | |
Net increase (decrease) | | | (40,386 | ) | | | 86,237 | | | | | | | $ | (454,948 | ) | | $ | 854,023 | | | | | |
| | | | | |
| | | | | | | | | | | | | | | | | | | | | | | | |
| Advisor Class | | | | | | | | | | | | | | | | | | | | | | | | |
Shares sold | | | 2,418 | | | | 29,251 | | | | | | | $ | 27,278 | | | $ | 298,071 | | | | | |
| | | | | |
Shares issued in reinvestment of dividends and distributions | | | 1,024 | | | | 474 | | | | | | | | 10,774 | | | | 4,774 | | | | | |
| | | | | |
Shares redeemed | | | (778 | ) | | | (3,492 | ) | | | | | | | (8,035 | ) | | | (34,626 | ) | | | | |
| | | | | |
Net increase | | | 2,664 | | | | 26,233 | | | | | | | $ | 30,017 | | | $ | 268,219 | | | | | |
| | | | | |
| | | | | | | | | | | | | | | | | | | | | | | | |
| Class R | | | | | | | | | | | | | | | | | | | | | | | | |
Shares sold | | | 32,754 | | | | 141,923 | | | | | | | $ | 349,362 | | | $ | 1,397,508 | | | | | |
| | | | | |
Shares issued in reinvestment of dividends and distributions | | | 2,715 | | | | 1,910 | | | | | | | | 27,833 | | | | 18,737 | | | | | |
| | | | | |
Shares redeemed | | | (22,736 | ) | | | (28,726 | ) | | | | | | | (245,295 | ) | | | (271,574 | ) | | | | |
| | | | | |
Net increase | | | 12,733 | | | | 115,107 | | | | | | | $ | 131,900 | | | $ | 1,144,671 | | | | | |
| | | | | |
| | | | | | | | | | | | | | | | | | | | | | | | |
| | |
| abfunds.com | | AB MULTI-MANAGER SELECT RETIREMENT FUNDS | 143 |
NOTES TO FINANCIAL STATEMENTS (continued)
| | | | | | | | | | | | | | | | | | | | | | | | |
| | | | | | | | | | | | | | | | | | | | | | | | |
| | | AB Multi-Manager Select 2035 Fund | | | | |
| | | Shares | | | | | | Amount | | | | |
| | | Year Ended July 31, 2017 | | | Year Ended July 31, 2016 | | | | | | Year Ended July 31, 2017 | | | Year Ended July 31, 2016 | | | | |
| | | | | | | | |
| Class K | | | | | | | | | | | | | | | | | | | | | | | | |
Shares sold | | | 2,349,873 | | | | 5,249,299 | | | | | | | $ | 25,115,267 | | | $ | 51,823,337 | | | | | |
| | | | | |
Shares issued in reinvestment of dividends and distributions | | | 128,224 | | | | 73,412 | | | | | | | | 1,316,862 | | | | 722,378 | | | | | |
| | | | | |
Shares redeemed | | | (1,213,404 | ) | | | (324,187 | ) | | | | | | | (12,911,015 | ) | | | (3,135,930 | ) | | | | |
| | | | | |
Net increase | | | 1,264,693 | | | | 4,998,524 | | | | | | | $ | 13,521,114 | | | $ | 49,409,785 | | | | | |
| | | | | |
| | | | | | | | | | | | | | | | | | | | | | | | |
| Class I | | | | | | | | | | | | | | | | | | | | | | | | |
Shares sold | | | 147,279 | | | | 329,925 | | | | | | | $ | 1,571,935 | | | $ | 3,280,643 | | | | | |
| | | | | |
Shares issued in reinvestment of dividends and distributions | | | 8,618 | | | | 4,069 | | | | | | | | 88,582 | | | | 40,079 | | | | | |
| | | | | |
Shares redeemed | | | (83,851 | ) | | | (132,568 | ) | | | | | | | (893,859 | ) | | | (1,242,569 | ) | | | | |
| | | | | |
Net increase | | | 72,046 | | | | 201,426 | | | | | | | $ | 766,658 | | | $ | 2,078,153 | | | | | |
| | | | | |
| | | | | | | | | | | | | | | | | | | | | | | | |
| Class Z | | | | | | | | | | | | | | | | | | | | | | | | |
Shares sold | | | 1,005 | | | | 58 | | | | | | | $ | 10,768 | | | $ | 571 | | | | | |
| | | | | |
Shares issued in reinvestment of dividends and distributions | | | 12 | | | | – 0 | –(a) | | | | | | | 123 | | | | – 0 | –(b) | | | | |
| | | | | |
Shares redeemed | | | (7 | ) | | | – 0 | – | | | | | | | (75 | ) | | | – 0 | – | | | | |
| | | | | |
Net increase | | | 1,010 | | | | 58 | | | | | | | $ | 10,816 | | | $ | 571 | | | | | |
| | | | | |
| (a) | Amount is less than one share. |
| (b) | Amount is less than .50 cents. |
| | | | | | | | | | | | | | | | | | | | | | | | |
| | | | | | | | | | | | | | | | | | | | | | | | |
| | | AB Multi-Manager Select 2040 Fund | | | | |
| | | Shares | | | | | | Amount | | | | |
| | | Year Ended July 31, 2017 | | | Year Ended July 31, 2016 | | | | | | Year Ended July 31, 2017 | | | Year Ended July 31, 2016 | | | | |
| | | | | | | | |
| Class A | | | | | | | | | | | | | | | | | | | | | | | | |
Shares sold | | | 82,193 | | | | 702,605 | | | | | | | $ | 885,731 | | | $ | 6,980,044 | | | | | |
| | | | | |
Shares issued in reinvestment of dividends and distributions | | | 4,177 | | | | 8,340 | | | | | | | | 43,774 | | | | 83,147 | | | | | |
| | | | | |
Shares converted from Class C | | | 54,157 | | | | – 0 | – | | | | | | | 611,973 | | | | – 0 | – | | | | |
| | | | | |
Shares redeemed | | | (452,420 | ) | | | (63,150 | ) | | | | | | | (4,694,831 | ) | | | (628,137 | ) | | | | |
| | | | | |
Net increase (decrease) | | | (311,893 | ) | | | 647,795 | | | | | | | $ | (3,153,353 | ) | | $ | 6,435,054 | | | | | |
| | | | | |
| | | | | | | | | | | | | | | | | | | | | | | | |
| | |
| 144 | AB MULTI-MANAGER SELECT RETIREMENT FUNDS | | abfunds.com |
NOTES TO FINANCIAL STATEMENTS (continued)
| | | | | | | | | | | | | | | | | | | | | | | | |
| | | | | | | | | | | | | | | | | | | | | | | | |
| | | AB Multi-Manager Select 2040 Fund | | | | |
| | | Shares | | | | | | Amount | | | | |
| | | Year Ended July 31, 2017 | | | Year Ended July 31, 2016 | | | | | | Year Ended July 31, 2017 | | | Year Ended July 31, 2016 | | | | |
| | | | | | | | |
| Class C | | | | | | | | | | | | | | | | | | | | | | | | |
Shares sold | | | 7,178 | | | | 81,281 | | | | | | | $ | 77,510 | | | $ | 794,310 | | | | | |
| | | | | |
Shares issued in reinvestment of dividends and distributions | | | 1,219 | | | | 411 | | | | | | | | 12,664 | | | | 4,085 | | | | | |
| | | | | |
Shares converted to Class A | | | (54,787 | ) | | | – 0 | – | | | | | | | (611,973 | ) | | | – 0 | – | | | | |
| | | | | |
Shares redeemed | | | (1,151 | ) | | | (2,484 | ) | | | | | | | (12,108 | ) | | | (23,859 | ) | | | | |
| | | | | |
Net increase (decrease) | | | (47,541 | ) | | | 79,208 | | | | | | | $ | (533,907 | ) | | $ | 774,536 | | | | | |
| | | | | |
| | | | | | | | | | | | | | | | | | | | | | | | |
| Advisor Class | | | | | | | | | | | | | | | | | | | | | | | | |
Shares sold | | | 14,047 | | | | 30,576 | | | | | | | $ | 152,018 | | | $ | 300,505 | | | | | |
| | | | | |
Shares issued in reinvestment of dividends and distributions | | | 652 | | | | 138 | | | | | | | | 6,843 | | | | 1,388 | | | | | |
| | | | | |
Shares redeemed | | | (1,438 | ) | | | (6,595 | ) | | | | | | | (15,227 | ) | | | (65,189 | ) | | | | |
| | | | | |
Net increase | | | 13,261 | | | | 24,119 | | | | | | | $ | 143,634 | | | $ | 236,704 | | | | | |
| | | | | |
| | | | | | | | | | | | | | | | | | | | | | | | |
| Class R | | | | | | | | | | | | | | | | | | | | | | | | |
Shares sold | | | 20,635 | | | | 138,290 | | | | | | | $ | 220,454 | | | $ | 1,367,416 | | | | | |
| | | | | |
Shares issued in reinvestment of dividends and distributions | | | 2,244 | | | | 1,520 | | | | | | | | 22,935 | | | | 14,849 | | | | | |
| | | | | |
Shares redeemed | | | (11,954 | ) | | | (23,023 | ) | | | | | | | (127,178 | ) | | | (221,797 | ) | | | | |
| | | | | |
Net increase | | | 10,925 | | | | 116,787 | | | | | | | $ | 116,211 | | | $ | 1,160,468 | | | | | |
| | | | | |
| | | | | | | | | | | | | | | | | | | | | | | | |
| Class K | | | | | | | | | | | | | | | | | | | | | | | | |
Shares sold | | | 1,318,382 | | | | 4,127,540 | | | | | | | $ | 14,069,295 | | | $ | 40,721,976 | | | | | |
| | | | | |
Shares issued in reinvestment of dividends and distributions | | | 91,573 | | | | 59,959 | | | | | | | | 938,628 | | | | 587,602 | | | | | |
| | | | | |
Shares redeemed | | | (1,323,891 | ) | | | (446,247 | ) | | | | | | | (13,948,811 | ) | | | (4,281,542 | ) | | | | |
| | | | | |
Net increase | | | 86,064 | | | | 3,741,252 | | | | | | | $ | 1,059,112 | | | $ | 37,028,036 | | | | | |
| | | | | |
| | | | | | | | | | | | | | | | | | | | | | | | |
| Class I | | | | | | | | | | | | | | | | | | | | | | | | |
Shares sold | | | 120,587 | | | | 242,065 | | | | | | | $ | 1,294,331 | | | $ | 2,401,476 | | | | | |
| | | | | |
Shares issued in reinvestment of dividends and distributions | | | 5,708 | | | | 2,379 | | | | | | | | 58,567 | | | | 23,337 | | | | | |
| | | | | |
Shares redeemed | | | (20,115 | ) | | | (133,775 | ) | | | | | | | (211,660 | ) | | | (1,240,075 | ) | | | | |
| | | | | |
Net increase | | | 106,180 | | | | 110,669 | | | | | | | $ | 1,141,238 | | | $ | 1,184,738 | | | | | |
| | | | | |
| | | | | | | | | | | | | | | | | | | | | | | | |
| | |
| abfunds.com | | AB MULTI-MANAGER SELECT RETIREMENT FUNDS | 145 |
NOTES TO FINANCIAL STATEMENTS (continued)
| | | | | | | | | | | | | | | | | | | | | | | | |
| | | | | | | | | | | | | | | | | | | | | | | | |
| | | AB Multi-Manager Select 2040 Fund | | | | |
| | | Shares | | | | | | Amount | | | | |
| | | Year Ended July 31, 2017 | | | Year Ended July 31, 2016 | | | | | | Year Ended July 31, 2017 | | | Year Ended July 31, 2016 | | | | |
| | | | | | | | |
| Class Z | | | | | | | | | | | | | | | | | | | | | | | | |
Shares sold | | | 10 | | | | – 0 | – | | | | | | $ | 100 | | | $ | – 0 | – | | | | |
| | | | | |
Shares issued in reinvestment of dividends and distributions | | | 1,214 | | | | 788 | | | | | | | | 12,454 | | | | 7,739 | | | | | |
| | | | | |
Shares redeemed | | | – 0 | – | | | (1,045 | ) | | | | | | | – 0 | – | | | (9,503 | ) | | | | |
| | | | | |
Net increase (decrease) | | | 1,224 | | | | (257 | ) | | | | | | $ | 12,554 | | | $ | (1,764 | ) | | | | |
| | | | | |
| | | | | | | | | | | | | | | | | | | | | | | | |
| | | | | | | | | | | | | | | | | | | | | | | | |
| | | AB Multi-Manager Select 2045 Fund | | | | |
| | | Shares | | | | | | Amount | | | | |
| | | Year Ended July 31, 2017 | | | Year Ended July 31, 2016 | | | | | | Year Ended July 31, 2017 | | | Year Ended July 31, 2016 | | | | |
| | | | | | | | |
| Class A | | | | | | | | | | | | | | | | | | | | | | | | |
Shares sold | | | 62,001 | | | | 577,565 | | | | | | | $ | 675,477 | | | $ | 5,790,474 | | | | | |
| | | | | |
Shares issued in reinvestment of dividends and distributions | | | 2,879 | | | | 7,642 | | | | | | | | 30,402 | | | | 76,499 | | | | | |
| | | | | |
Shares converted from Class C | | | 636 | | | | – 0 | – | | | | | | | 7,256 | | | | – 0 | – | | | | |
| | | | | |
Shares redeemed | | | (302,467 | ) | | | (105,901 | ) | | | | | | | (3,155,362 | ) | | | (1,056,114 | ) | | | | |
| | | | | |
Net increase (decrease) | | | (236,951 | ) | | | 479,306 | | | | | | | $ | (2,442,227 | ) | | $ | 4,810,859 | | | | | |
| | | | | |
| | | | | | | | | | | | | | | | | | | | | | | | |
| Class C | | | | | | | | | | | | | | | | | | | | | | | | |
Shares sold | | | 2,525 | | | | 35,669 | | | | | | | $ | 27,461 | | | $ | 360,464 | | | | | |
| | | | | |
Shares issued in reinvestment of dividends and distributions | | | 269 | | | | 92 | | | | | | | | 2,839 | | | | 921 | | | | | |
| | | | | |
Shares converted to Class A | | | (639 | ) | | | – 0 | – | | | | | | | (7,256 | ) | | | – 0 | – | | | | |
| | | | | |
Shares redeemed | | | (6,683 | ) | | | (16,092 | ) | | | | | | | (73,537 | ) | | | (161,008 | ) | | | | |
| | | | | |
Net increase (decrease) | | | (4,528 | ) | | | 19,669 | | | | | | | $ | (50,493 | ) | | $ | 200,377 | | | | | |
| | | | | |
| | | | | | | | | | | | | | | | | | | | | | | | |
| | |
| 146 | AB MULTI-MANAGER SELECT RETIREMENT FUNDS | | abfunds.com |
NOTES TO FINANCIAL STATEMENTS (continued)
| | | | | | | | | | | | | | | | | | | | | | | | |
| | | | | | | | | | | | | | | | | | | | | | | | |
| | | AB Multi-Manager Select 2045 Fund | | | | |
| | | Shares | | | | | | Amount | | | | |
| | | Year Ended July 31, 2017 | | | Year Ended July 31, 2016 | | | | | | Year Ended July 31, 2017 | | | Year Ended July 31, 2016 | | | | |
| | | | | | | | |
| Advisor Class | | | | | | | | | | | | | | | | | | | | | | | | |
Shares sold | | | 118 | | | | 8,322 | | | | | | | $ | 1,339 | | | $ | 82,766 | | | | | |
| | | | | |
Shares issued in reinvestment of dividends and distributions | | | 29 | | | | 23 | | | | | | | | 310 | | | | 233 | | | | | |
| | | | | |
Shares redeemed | | | (2,520 | ) | | | (4,300 | ) | | | | | | | (26,292 | ) | | | (43,516 | ) | | | | |
| | | | | |
Net increase (decrease) | | | (2,373 | ) | | | 4,045 | | | | | | | $ | (24,643 | ) | | $ | 39,483 | | | | | |
| | | | | |
| | | | | | | | | | | | | | | | | | | | | | | | |
| Class R | | | | | | | | | | | | | | | | | | | | | | | | |
Shares sold | | | 37,859 | | | | 211,582 | | | | | | | $ | 402,526 | | | $ | 2,083,764 | | | | | |
| | | | | |
Shares issued in reinvestment of dividends and distributions | | | 3,079 | | | | 3,083 | | | | | | | | 31,651 | | | | 30,209 | | | | | |
| | | | | |
Shares redeemed | | | (33,420 | ) | | | (40,746 | ) | | | | | | | (359,142 | ) | | | (388,025 | ) | | | | |
| | | | | |
Net increase | | | 7,518 | | | | 173,919 | | | | | | | $ | 75,035 | | | $ | 1,725,948 | | | | | |
| | | | | |
| | | | | | | | | | | | | | | | | | | | | | | | |
| Class K | | | | | | | | | | | | | | | | | | | | | | | | |
Shares sold | | | 1,155,595 | | | | 3,098,292 | | | | | | | $ | 12,416,436 | | | $ | 30,549,782 | | | | | |
| | | | | |
Shares issued in reinvestment of dividends and distributions | | | 64,307 | | | | 42,851 | | | | | | | | 663,648 | | | | 421,226 | | | | | |
| | | | | |
Shares redeemed | | | (698,967 | ) | | | (408,868 | ) | | | | | | | (7,450,461 | ) | | | (4,024,745 | ) | | | | |
| | | | | |
Net increase | | | 520,935 | | | | 2,732,275 | | | | | | | $ | 5,629,623 | | | $ | 26,946,263 | | | | | |
| | | | | |
| | | | | | | | | | | | | | | | | | | | | | | | |
| Class I | | | | | | | | | | | | | | | | | | | | | | | | |
Shares sold | | | 125,071 | | | | 238,505 | | | | | | | $ | 1,346,651 | | | $ | 2,373,132 | | | | | |
| | | | | |
Shares issued in reinvestment of dividends and distributions | | | 5,476 | | | | 3,122 | | | | | | | | 56,509 | | | | 30,717 | | | | | |
| | | | | |
Shares redeemed | | | (28,155 | ) | | | (113,457 | ) | | | | | | | (301,762 | ) | | | (1,044,587 | ) | | | | |
| | | | | |
Net increase | | | 102,392 | | | | 128,170 | | | | | | | $ | 1,101,398 | | | $ | 1,359,262 | | | | | |
| | | | | |
| | | | | | | | | | | | | | | | | | | | | | | | |
| Class Z | | | | | | | | | | | | | | | | | | | | | | | | |
Shares sold | | | 199 | | | | 516 | | | | | | | $ | 2,152 | | | $ | 5,004 | | | | | |
| | | | | |
Shares issued in reinvestment of dividends and distributions | | | 683 | | | | 539 | | | | | | | | 7,052 | | | | 5,306 | | | | | |
| | | | | |
Shares redeemed | | | (1 | ) | | | (3,759 | ) | | | | | | | (14 | ) | | | (36,629 | ) | | | | |
| | | | | |
Net increase (decrease) | | | 881 | | | | (2,704 | ) | | | | | | $ | 9,190 | | | $ | (26,319 | ) | | | | |
| | | | | |
| | |
| abfunds.com | | AB MULTI-MANAGER SELECT RETIREMENT FUNDS | 147 |
NOTES TO FINANCIAL STATEMENTS (continued)
| | | | | | | | | | | | | | | | | | | | | | | | |
| | | | | | | | | | | | | | | | | | | | | | | | |
| | | AB Multi-Manager Select 2050 Fund | | | | |
| | | Shares | | | | | | Amount | | | | |
| | | Year Ended July 31, 2017 | | | Year Ended July 31, 2016 | | | | | | Year Ended July 31, 2017 | | | Year Ended July 31, 2016 | | | | |
| | | | | | | | |
| Class A | | | | | | | | | | | | | | | | | | | | | | | | |
Shares sold | | | 33,577 | | | | 123,315 | | | | | | | $ | 370,952 | | | $ | 1,220,670 | | | | | |
| | | | | |
Shares issued in reinvestment of dividends and distributions | | | 362 | | | | 575 | | | | | | | | 3,875 | | | | 5,790 | | | | | |
| | | | | |
Shares converted from Class C | | | 462 | | | | – 0 | – | | | | | | | 5,355 | | | | – 0 | – | | | | |
| | | | | |
Shares redeemed | | | (64,003 | ) | | | (15,153 | ) | | | | | | | (679,621 | ) | | | (151,292 | ) | | | | |
| | | | | |
Net increase (decrease) | | | (29,602 | ) | | | 108,737 | | | | | | | $ | (299,439 | ) | | $ | 1,075,168 | | | | | |
| | | | | |
| | | | | | | | | | | | | | | | | | | | | | | | |
| Class C | | | | | | | | | | | | | | | | | | | | | | | | |
Shares sold | | | 2,476 | | | | 4,026 | | | | | | | $ | 27,259 | | | $ | 40,280 | | | | | |
| | | | | |
Shares issued in reinvestment of dividends and distributions | | | 23 | | | | 1 | | | | | | | | 239 | | | | 7 | | | | | |
| | | | | |
Shares converted to Class A | | | (468 | ) | | | – 0 | – | | | | | | | (5,355 | ) | | | – 0 | – | | | | |
| | | | | |
Shares redeemed | | | (12 | ) | | | (284 | ) | | | | | | | (139 | ) | | | (2,878 | ) | | | | |
| | | | | |
Net increase | | | 2,019 | | | | 3,743 | | | | | | | $ | 22,004 | | | $ | 37,409 | | | | | |
| | | | | |
| | | | | | | | | | | | | | | | | | | | | | | | |
| Advisor Class | | | | | | | | | | | | | | | | | | | | | | | | |
Shares sold | | | 3,765 | | | | 5,795 | | | | | | | $ | 42,601 | | | $ | 59,565 | | | | | |
| | | | | |
Shares issued in reinvestment of dividends and distributions | | | 61 | | | | 1 | | | | | | | | 661 | | | | 6 | | | | | |
| | | | | |
Shares redeemed | | | (407 | ) | | | (617 | ) | | | | | | | (4,392 | ) | | | (6,229 | ) | | | | |
| | | | | |
Net increase | | | 3,419 | | | | 5,179 | | | | | | | $ | 38,870 | | | $ | 53,342 | | | | | |
| | | | | |
| | | | | | | | | | | | | | | | | | | | | | | | |
| Class R | | | | | | | | | | | | | | | | | | | | | | | | |
Shares sold | | | 15,009 | | | | 38,763 | | | | | | | $ | 162,515 | | | $ | 379,846 | | | | | |
| | | | | |
Shares issued in reinvestment of dividends and distributions | | | 695 | | | | 116 | | | | | | | | 7,157 | | | | 1,135 | | | | | |
| | | | | |
Shares redeemed | | | (6,490 | ) | | | (1,300 | ) | | | | | | | (70,150 | ) | | | (11,984 | ) | | | | |
| | | | | |
Net increase | | | 9,214 | | | | 37,579 | | | | | | | $ | 99,522 | | | $ | 368,997 | | | | | |
| | | | | |
| | | | | | | | | | | | | | | | | | | | | | | | |
| Class K | | | | | | | | | | | | | | | | | | | | | | | | |
Shares sold | | | 632,437 | | | | 1,401,759 | | | | | | | $ | 6,772,015 | | | $ | 13,851,607 | | | | | |
| | | | | |
Shares issued in reinvestment of dividends and distributions | | | 25,796 | | | | 17,263 | | | | | | | | 266,212 | | | | 169,351 | | | | | |
| | | | | |
Shares redeemed | | | (563,038 | ) | | | (159,788 | ) | | | | | | | (5,996,027 | ) | | | (1,528,982 | ) | | | | |
| | | | | |
Net increase | | | 95,195 | | | | 1,259,234 | | | | | | | $ | 1,042,200 | | | $ | 12,491,976 | | | | | |
| | | | | |
| | | | | | | | | | | | | | | | | | | | | | | | |
| | |
| 148 | AB MULTI-MANAGER SELECT RETIREMENT FUNDS | | abfunds.com |
NOTES TO FINANCIAL STATEMENTS (continued)
| | | | | | | | | | | | | | | | | | | | | | | | |
| | | | | | | | | | | | | | | | | | | | | | | | |
| | | AB Multi-Manager Select 2050 Fund | | | | |
| | | Shares | | | | | | Amount | | | | |
| | | Year Ended July 31, 2017 | | | Year Ended July 31, 2016 | | | | | | Year Ended July 31, 2017 | | | Year Ended July 31, 2016 | | | | |
| | | | | | | | |
| Class I | | | | | | | | | | | | | | | | | | | | | | | | |
Shares sold | | | 81,678 | | | | 151,508 | | | | | | | $ | 887,144 | | | $ | 1,501,799 | | | | | |
| | | | | |
Shares issued in reinvestment of dividends and distributions | | | 3,149 | | | | 1,763 | | | | | | | | 32,562 | | | | 17,332 | | | | | |
| | | | | |
Shares redeemed | | | (19,511 | ) | | | (112,534 | ) | | | | | | | (211,394 | ) | | | (1,032,740 | ) | | | | |
| | | | | |
Net increase | | | 65,316 | | | | 40,737 | | | | | | | $ | 708,312 | | | $ | 486,391 | | | | | |
| | | | | |
| | | | | | | | | | | | | | | | | | | | | | | | |
| Class Z | | | | | | | | | | | | | | | | | | | | | | | | |
Shares sold | | | 10 | | | | – 0 | – | | | | | | $ | 100 | | | $ | – 0 | – | | | | |
| | | | | |
Shares issued in reinvestment of dividends and distributions | | | – 0 | – | | | – 0 | –(a) | | | | | | | 2 | | | | – 0 | –(b) | | | | |
| | | | | |
Net increase | | | 10 | | | | – 0 | – | | | | | | $ | 102 | | | $ | – 0 | – | | | | |
| | | | | |
| (a) | Amount is less than one share. |
| (b) | Amount is less than .50 cents. |
| | | | | | | | | | | | | | | | | | | | | | | | |
| | | | | | | | | | | | | | | | | | | | | | | | |
| | | AB Multi-Manager Select 2055 Fund | | | | |
| | | Shares | | | | | | Amount | | | | |
| | | Year Ended
July 31,
2017 | | | Year Ended
July 31,
2016 | | | | | | Year Ended
July 31,
2017 | | | Year Ended
July 31,
2016 | | | | |
| | | | | | | | |
| Class A | | | | | | | | | | | | | | | | | | | | | | | | |
Shares sold | | | 50,854 | | | | 93,945 | | | | | | | $ | 569,577 | | | $ | 940,618 | | | | | |
| | | | | |
Shares issued in reinvestment of dividends and distributions | | | 354 | | | | 657 | | | | | | | | 3,750 | | | | 6,544 | | | | | |
| | | | | |
Shares redeemed | | | (49,461 | ) | | | (7,432 | ) | | | | | | | (517,543 | ) | | | (72,223 | ) | | | | |
| | | | | |
Net increase | | | 1,747 | | | | 87,170 | | | | | | | $ | 55,784 | | | $ | 874,939 | | | | | |
| | | | | |
| | | | | | | | | | | | | | | | | | | | | | | | |
| Class C | | | | | | | | | | | | | | | | | | | | | | | | |
Shares sold | | | 9,371 | | | | 19,992 | | | | | | | $ | 101,831 | | | $ | 197,057 | | | | | |
| | | | | |
Shares issued in reinvestment of dividends and distributions | | | 53 | | | | 151 | | | | | | | | 552 | | | | 1,481 | | | | | |
| | | | | |
Shares redeemed | | | (37 | ) | | | (14,299 | ) | | | | | | | (405 | ) | | | (139,623 | ) | | | | |
| | | | | |
Net increase | | | 9,387 | | | | 5,844 | | | | | | | $ | 101,978 | | | $ | 58,915 | | | | | |
| | | | | |
| | | | | | | | | | | | | | | | | | | | | | | | |
| | |
| abfunds.com | | AB MULTI-MANAGER SELECT RETIREMENT FUNDS | 149 |
NOTES TO FINANCIAL STATEMENTS (continued)
| | | | | | | | | | | | | | | | | | | | | | | | |
| | | | | | | | | | | | | | | | | | | | | | | | |
| | | AB Multi-Manager Select 2055 Fund | | | | |
| | | Shares | | | | | | Amount | | | | |
| | | Year Ended
July 31,
2017 | | | Year Ended
July 31,
2016 | | | | | | Year Ended
July 31,
2017 | | | Year Ended
July 31,
2016 | | | | |
| | | | | | | | |
| Advisor Class | | | | | | | | | | | | | | | | | | | | | | | | |
Shares sold | | | 2,195 | | | | 12,410 | | | | | | | $ | 23,841 | | | $ | 119,584 | | | | | |
| | | | | |
Shares issued in reinvestment of dividends and distributions | | | 420 | | | | 184 | | | | | | | | 4,503 | | | | 1,859 | | | | | |
| | | | | |
Shares redeemed | | | (1,803 | ) | | | (1,290 | ) | | | | | | | (19,457 | ) | | | (12,223 | ) | | | | |
| | | | | |
Net increase | | | 812 | | | | 11,304 | | | | | | | $ | 8,887 | | | $ | 109,220 | | | | | |
| | | | | |
| | | | | | | | | | | | | | | | | | | | | | | | |
| Class R | | | | | | | | | | | | | | | | | | | | | | | | |
Shares sold | | | 24,488 | | | | 5,714 | | | | | | | $ | 262,956 | | | $ | 55,193 | | | | | |
| | | | | |
Shares issued in reinvestment of dividends and distributions | | | 105 | | | | 21 | | | | | | | | 1,072 | | | | 207 | | | | | |
| | | | | |
Shares redeemed | | | (3,155 | ) | | | (725 | ) | | | | | | | (33,041 | ) | | | (7,242 | ) | | | | |
| | | | | |
Net increase | | | 21,438 | | | | 5,010 | | | | | | | $ | 230,987 | | | $ | 48,158 | | | | | |
| | | | | |
| | | | | | | | | | | | | | | | | | | | | | | | |
| Class K | | | | | | | | | | | | | | | | | | | | | | | | |
Shares sold | | | 798,664 | | | | 1,423,512 | | | | | | | $ | 8,556,644 | | | $ | 13,968,140 | | | | | |
| | | | | |
Shares issued in reinvestment of dividends and distributions | | | 28,354 | | | | 15,318 | | | | | | | | 290,631 | | | | 149,508 | | | | | |
| | | | | |
Shares redeemed | | | (422,285 | ) | | | (121,858 | ) | | | | | | | (4,394,753 | ) | | | (1,179,091 | ) | | | | |
| | | | | |
Net increase | | | 404,733 | | | | 1,316,972 | | | | | | | $ | 4,452,522 | | | $ | 12,938,557 | | | | | |
| | | | | |
| | | | | | | | | | | | | | | | | | | | | | | | |
| Class I | | | | | | | | | | | | | | | | | | | | | | | | |
Shares sold | | | 94,682 | | | | 97,435 | | | | | | | $ | 1,019,512 | | | $ | 960,694 | | | | | |
| | | | | |
Shares issued in reinvestment of dividends and distributions | | | 2,333 | | | | 1,066 | | | | | | | | 23,982 | | | | 10,428 | | | | | |
| | | | | |
Shares redeemed | | | (28,329 | ) | | | (110,215 | ) | | | | | | | (305,967 | ) | | | (1,004,448 | ) | | | | |
| | | | | |
Net increase (decrease) | | | 68,686 | | | | (11,714 | ) | | | | | | $ | 737,527 | | | $ | (33,326 | ) | | | | |
| | | | | |
| | | | | | | | | | | | | | | | | | | | | | | | |
| Class Z | | | | | | | | | | | | | | | | | | | | | | | | |
Shares sold | | | 91 | | | | 252 | | | | | | | $ | 970 | | | $ | 2,496 | | | | | |
| | | | | |
Shares issued in reinvestment of dividends and distributions | | | 2 | | | | 3 | | | | | | | | 16 | | | | 33 | | | | | |
| | | | | |
Shares redeemed | | | (265 | ) | | | (14 | ) | | | | | | | (2,780 | ) | | | (139 | ) | | | | |
| | | | | |
Net increase (decrease) | | | (172 | ) | | | 241 | | | | | | | $ | (1,794 | ) | | $ | 2,390 | | | | | |
| | | | | |
| | |
| 150 | AB MULTI-MANAGER SELECT RETIREMENT FUNDS | | abfunds.com |
NOTES TO FINANCIAL STATEMENTS (continued)
At July 31, 2017, certain shareholders of the Retirement Allocation Fund, 2010 Fund, 2015 Fund, 2020 Fund, 2025 Fund, 2030 Fund, 2035 Fund, 2040 Fund, 2045 Fund, 2050 Fund and 2055 Fund owned 94%, 76%, 80%, 84%, 77%, 75%, 77%, 74%, 70%, 73% and 74%, respectively, in aggregate of the Funds’ outstanding shares. Significant transactions by such shareholders, if any, may impact the Funds’ performance.
NOTE F
Risks Involved in Investing in the Funds
Allocation Risk—The allocation of investments among the Underlying Portfolios’ different investment styles, such as equity or debt securities, or U.S. or non-U.S. securities, may have a more significant effect on a Fund’s net asset value (“NAV”) when one of these investments is performing more poorly than the other. There is no assurance that allocation decisions will result in the desired effects. Subjective decisions made by the Adviser and/or Morningstar may cause the Funds to incur losses or to miss profit opportunities on which it might otherwise have capitalized. The limited universe of Underlying Portfolios and the requirement that a specified percentage of Fund assets be invested in AB Mutual Funds as noted above may adversely affect Fund performance.
Interest Rate Risk and Credit Risk—Interest rate risk is the risk that changes in interest rates will affect the value of the Funds’ investments in Underlying Portfolios that invest in fixed-income debt securities such as bonds or notes. Increases in interest rates may cause the value of the Funds’ investments to decline. Credit risk is the risk that the issuer or guarantor of a debt security, or the counterparty to a derivative contract, will be unable or unwilling to make timely principal and/or interest payments, or to otherwise honor its obligations. The degree of risk for a particular security may be reflected in its credit rating. Credit risk is greater for medium quality and lower-rated securities. Lower-rated debt securities and similar unrated securities (commonly known as “junk bonds”) have speculative elements or are predominantly speculative risks.
High Yield Debt Security Risk—Investments in fixed-income securities with ratings below investment grade, commonly known as “junk bonds”, tend to have a higher probability that an issuer will default or fail to meet its payment obligations. These securities may be subject to greater price volatility due to such factors as specific corporate developments, interest rate sensitivity, negative perceptions of the junk bond market generally and less secondary market liquidity.
Inflation Risk—This is the risk that the value of assets or income from the Funds’ investments in the Underlying Portfolios will be less in the future as inflation decreases the value of money. As inflation increases, the value of each Underlying Portfolio’s assets can decline as can the value of that Underlying Portfolio’s distributions.
| | |
| abfunds.com | | AB MULTI-MANAGER SELECT RETIREMENT FUNDS | 151 |
NOTES TO FINANCIAL STATEMENTS (continued)
Foreign (Non-U.S.) Risk—Investments in non-U.S. issuers by Underlying Portfolios may involve more risk than investments in U.S. issuers. These securities may fluctuate more widely in price and may be less liquid due to adverse market, economic, political, regulatory or other factors.
Currency Risk—Fluctuations in currency exchange rates may negatively affect the value of the Funds’ investments or reduce its returns.
Capitalization Risk—Investments in small- and mid-capitalization companies by Underlying Portfolios tend to be more volatile than investments in large-capitalization companies. Investments in small-capitalization companies may have additional risks because these companies often have limited product lines, markets, or financial resources.
Derivatives Risk—The Underlying Portfolios may enter into derivative transactions such as forwards, options, futures and swaps. Derivatives may be illiquid, difficult to price, and leveraged so that small changes may produce disproportionate losses for the Underlying Portfolios, and subject to counterparty risk to a greater degree than more traditional investments. Derivatives may result in significant losses, including losses that are far greater than the value of the derivatives reflected on the statement of assets and liabilities.
Leverage Risk—When an Underlying Portfolio borrows money or otherwise leverages its investments, its performance may be volatile because leverage tends to exaggerate the effect of any increase or decrease in the value of the Underlying Portfolio’s investments. An Underlying Portfolio may create leverage through the use of reverse repurchase arrangements, forward currency exchange contracts, forward commitments, dollar rolls or futures or by borrowing money. The use of other types of derivative instruments by the Underlying Portfolios, such as options and swaps, may also result in a form of leverage. Leverage may result in higher returns to an Underlying Portfolio than if the Underlying Portfolio were not leveraged, but may also adversely affect returns, particularly if the market is declining.
Non-Diversification Risk—The Funds may have more risk because it is “non-diversified”, meaning that it can invest more of its assets in a smaller number of issuers. Accordingly, changes in the value of a single security may have a more significant effect, either negative or positive, on the Funds’ NAV.
Investment in Other Investment Companies Risk—As with other investments, investments in other investment companies, including ETFs, are subject to market and selection risk. In addition, shareholders of a Fund bear both their proportionate share of expenses in the Funds (including management fees) and, indirectly, the expenses of the investment companies.
| | |
| 152 | AB MULTI-MANAGER SELECT RETIREMENT FUNDS | | abfunds.com |
NOTES TO FINANCIAL STATEMENTS (continued)
Indemnification Risk—In the ordinary course of business, the Funds enter into contracts that contain a variety of indemnifications. The Funds’ maximum exposure under these arrangements is unknown. However, the Funds have not had prior claims or losses pursuant to these indemnification provisions and expect the risk of loss thereunder to be remote. Therefore, the Funds have not accrued any liability in connection with these indemnification provisions.
NOTE G
Distributions to Shareholders
The tax character of distributions paid during the fiscal years ended July 31, 2017 and July 31, 2016 were as follows:
| | | | | | | | |
AB Multi-Manager Select Retirement Allocation
Fund | | 2017 | | | 2016 | |
Distributions paid from: | | | | | | | | |
Ordinary income | | $ | 175,055 | | | $ | 101,342 | |
Long-term capital gains | | | – 0 | – | | | 4,800 | |
| | | | | | | | |
Total distributions paid | | $ | 175,055 | | | $ | 106,142 | |
| | | | | | | | |
| | | | | | | | |
| AB Multi-Manager Select 2010 Fund | | 2017 | | | 2016 | |
Distributions paid from: | | | | | | | | |
Ordinary income | | $ | 292,563 | | | $ | 199,078 | |
Long-term capital gains | | | – 0 | – | | | 5,762 | |
| | | | | | | | |
Total distributions paid | | $ | 292,563 | | | $ | 204,840 | |
| | | | | | | | |
| | | | | | | | |
| AB Multi-Manager Select 2015 Fund | | 2017 | | | 2016 | |
Distributions paid from: | | | | | | | | |
Ordinary income | | $ | 960,632 | | | $ | 617,121 | |
Long-term capital gains | | | 94,762 | | | | 6,304 | |
| | | | | | | | |
Total distributions paid | | $ | 1,055,394 | | | $ | 623,425 | |
| | | | | | | | |
| | | | | | | | |
| AB Multi-Manager Select 2020 Fund | | 2017 | | | 2016 | |
Distributions paid from: | | | | | | | | |
Ordinary income | | $ | 1,721,344 | | | $ | 1,102,419 | |
Long-term capital gains | | | 207,409 | | | | 11,698 | |
| | | | | | | | |
Total distributions paid | | $ | 1,928,753 | | | $ | 1,114,117 | |
| | | | | | | | |
| | | | | | | | |
| AB Multi-Manager Select 2025 Fund | | 2017 | | | 2016 | |
Distributions paid from: | | | | | | | | |
Ordinary income | | $ | 2,300,639 | | | $ | 1,474,437 | |
Long-term capital gains | | | 636,348 | | | | 15,221 | |
| | | | | | | | |
Total distributions paid | | $ | 2,936,987 | | | $ | 1,489,658 | |
| | | | | | | | |
| | | | | | | | |
| | |
| abfunds.com | | AB MULTI-MANAGER SELECT RETIREMENT FUNDS | 153 |
NOTES TO FINANCIAL STATEMENTS (continued)
| | | | | | | | |
| AB Multi-Manager Select 2030 Fund | | 2017 | | | 2016 | |
Distributions paid from: | | | | | | | | |
Ordinary income | | $ | 1,618,093 | | | $ | 1,061,915 | |
Long-term capital gains | | | 495,198 | | | | 18,348 | |
| | | | | | | | |
Total distributions paid | | $ | 2,113,291 | | | $ | 1,080,263 | |
| | | | | | | | |
| | | | | | | | |
| AB Multi-Manager Select 2035 Fund | | 2017 | | | 2016 | |
Distributions paid from: | | | | | | | | |
Ordinary income | | $ | 1,075,640 | | | $ | 848,665 | |
Long-term capital gains | | | 448,607 | | | | 52,006 | |
| | | | | | | | |
Total distributions paid | | $ | 1,524,247 | | | $ | 900,671 | |
| | | | | | | | |
| | | | | | | | |
| AB Multi-Manager Select 2040 Fund | | 2017 | | | 2016 | |
Distributions paid from: | | | | | | | | |
Ordinary income | | $ | 762,319 | | | $ | 578,457 | |
Long-term capital gains | | | 335,015 | | | | 159,931 | |
| | | | | | | | |
Total distributions paid | | $ | 1,097,334 | | | $ | 738,388 | |
| | | | | | | | |
| | | | | | | | |
| AB Multi-Manager Select 2045 Fund | | 2017 | | | 2016 | |
Distributions paid from: | | | | | | | | |
Ordinary income | | $ | 582,419 | | | $ | 424,764 | |
Long-term capital gains | | | 211,057 | | | | 157,036 | |
| | | | | | | | |
Total distributions paid | | $ | 793,476 | | | $ | 581,800 | |
| | | | | | | | |
| | | | | | | | |
| AB Multi-Manager Select 2050 Fund | | 2017 | | | 2016 | |
Distributions paid from: | | | | | | | | |
Ordinary income | | $ | 245,220 | | | $ | 161,697 | |
Long-term capital gains | | | 66,120 | | | | 47,261 | |
| | | | | | | | |
Total distributions paid | | $ | 311,340 | | | $ | 208,958 | |
| | | | | | | | |
| | | | | | | | |
| AB Multi-Manager Select 2055 Fund | | 2017 | | | 2016 | |
Distributions paid from: | | | | | | | | |
Ordinary income | | $ | 237,061 | | | $ | 143,408 | |
Long-term capital gains | | | 88,101 | | | | 42,182 | |
| | | | | | | | |
Total distributions paid | | $ | 325,162 | | | $ | 185,590 | |
| | | | | | | | |
As of July 31, 2017, the components of accumulated earnings/(deficit) on a tax basis were as follows:
| | | | | | | | | | | | | | | | |
Multi-Manager Select Fund | | Undistributed Ordinary Income | | | Undistributed Capital Gains(a) | | | Unrealized Appreciation/
(Depreciation)(b) | | | Total Accumulated Earnings/ (Deficit) | |
Retirement Allocation Fund | | $ | 70,635 | | | $ | 59,013 | | | $ | 362,129 | | | $ | 491,777 | |
2010 Fund | | | 188,914 | | | | 214,263 | | | | 663,011 | | | | 1,066,188 | |
2015 Fund | | | 438,400 | | | | 856,706 | | | | 2,649,046 | | | | 3,944,152 | |
2020 Fund | | | 868,811 | | | | 1,828,388 | | | | 6,272,003 | | | | 8,969,202 | |
| | |
| 154 | AB MULTI-MANAGER SELECT RETIREMENT FUNDS | | abfunds.com |
NOTES TO FINANCIAL STATEMENTS (continued)
| | | | | | | | | | | | | | | | |
Multi-Manager Select Fund | | Undistributed Ordinary Income | | | Undistributed Capital Gains(a) | | | Unrealized Appreciation/
(Depreciation)(b) | | | Total Accumulated Earnings/ (Deficit) | |
2025 Fund | | $ | 1,191,256 | | | $ | 2,460,416 | | | $ | 10,637,228 | | | $ | 14,288,900 | |
2030 Fund | | | 1,188,855 | | | | 2,167,667 | | | | 8,360,929 | | | | 11,717,451 | |
2035 Fund | | | 898,317 | | | | 1,786,569 | | | | 8,920,719 | | | | 11,605,605 | |
2040 Fund | | | 610,956 | | | | 1,438,763 | | | | 6,680,999 | | | | 8,730,718 | |
2045 Fund | | | 453,554 | | | | 1,203,178 | | | | 5,776,611 | | | | 7,433,343 | |
2050 Fund | | | 151,401 | | | | 542,784 | | | | 2,337,346 | | | | 3,031,531 | |
2055 Fund | | | 173,537 | | | | 478,066 | | | | 2,517,562 | | | | 3,169,165 | |
| (a) | During the fiscal year ended July 31, 2017, AB Multi-Manager Select Retirement Allocation Fund utilized $79,044 of capital loss carryforwards to offset current year net realized gains. |
| (b) | The differences between book-basis and tax-basis unrealized appreciation/(depreciation) are attributable primarily to the tax deferral of losses on wash sales and return of capital distributions received from underlying securities. |
For tax purposes, net realized capital losses may be carried over to offset future capital gains, if any. Funds are permitted to carry forward capital losses for an indefinite period, and such losses will retain their character as either short-term or long-term capital losses. As of July 31, 2017, none of the Funds had any capital loss carryforwards.
During the current fiscal year, certain Funds had adjustments due to permanent differences. Permanent differences have no effect on net assets. The effect of such permanent differences on each Fund—primarily due to return of capital distributions received from underlying securities and the redesignation of dividends—is reflected as an adjustment to the components of capital as of July 31, 2017 as shown below:
| | | | | | | | | | | | |
Multi-Manager Select Fund | | Increase
(Decrease) to Additional Paid-in Capital | | | Increase (Decrease) to Undistributed Net Investment Income (Loss) | | | Increase (Decrease) to Accumulated Net
Realized Gain (Loss)
on Investments | |
Retirement Allocation Fund | | $ | – 0 | – | | $ | (8,254 | ) | | $ | 8,254 | |
2010 Fund | | | (584 | ) | | | (6,818 | ) | | | 7,402 | |
2015 Fund | | | (1,837 | ) | | | (23,555 | ) | | | 25,392 | |
2020 Fund | | | (4,820 | ) | | | (68,291 | ) | | | 73,111 | |
2025 Fund | | | (5,292 | ) | | | (62,884 | ) | | | 68,176 | |
2030 Fund | | | (3,194 | ) | | | (58,036 | ) | | | 61,230 | |
2035 Fund | | | (3,284 | ) | | | (3,152 | ) | | | 6,436 | |
2040 Fund | | | (3,309 | ) | | | (1,503 | ) | | | 4,812 | |
2045 Fund | | | (3,052 | ) | | | 3,727 | | | | (675 | ) |
2050 Fund | | | (1,050 | ) | | | 1,329 | | | | (279 | ) |
2055 Fund | | | (1,079 | ) | | | 1,355 | | | | (276 | ) |
NOTE H
Joint Credit Facility
A number of open-end mutual funds managed by the Adviser, including the Funds, participate in a $280 million revolving credit facility (the “Facility”)
| | |
| abfunds.com | | AB MULTI-MANAGER SELECT RETIREMENT FUNDS | 155 |
NOTES TO FINANCIAL STATEMENTS (continued)
intended to provide short-term financing, if necessary, subject to certain restrictions in connection with abnormal redemption activity. Commitment fees related to the Facility are paid by the participating funds and are included in miscellaneous expenses in the statement of operations. The Funds did not utilize the Facility during the year ended July 31, 2017.
NOTE I
Other
In October 2016, the U.S. Securities and Exchange Commission adopted new rules and amended existing rules (together, “final rules”) intended to modernize the reporting and disclosure of information by registered investment companies. In part, the final rules amend Regulation S-X and require standardized, enhanced disclosure about derivatives in investment company financial statements, as well as other amendments. The compliance date for the amendments to Regulation S-X is August 1, 2017 (for reporting period end dates of August 31, 2017 or after). Management has evaluated the impact of the amendments and expects the effect of the adoption of the final rules on financial statements will be limited to additional disclosures.
NOTE J
Subsequent Events
Management has evaluated subsequent events for possible recognition or disclosure in the financial statements through the date the financial statements are issued. Management has determined that there are no material events that would require disclosure in the Funds’ financial statements through this date.
| | |
| 156 | AB MULTI-MANAGER SELECT RETIREMENT FUNDS | | abfunds.com |
FINANCIAL HIGHLIGHTS
Selected Data For A Share Of Capital Stock Outstanding Throughout Each Period
| | | | | | | | | | | | |
| | | AB Multi-Manager Select
Retirement Allocation Fund | |
| | | Class A | |
| | | Year Ended July 31, | | | December 15,
2014(a) to
July 31, 2015 | |
| | | 2017 | | | 2016 | | |
| | | | |
| | | | | | | | | | | | |
Net asset value, beginning of period | | | $ 10.44 | | | | $ 10.18 | | | | $ 10.00 | |
| | | | |
Income From Investment Operations | | | | | | | | | | | | |
Net investment income(b)(c) | | | .20 | | | | .23 | | | | .11 | |
Net realized and unrealized gain on
investment transactions | | | .33 | | | | .06 | | | | .07 | |
Contributions from Affiliates | | | – 0 | – | | | .00 | (d) | | | – 0 | – |
| | | | |
Net increase in net asset value from operations | | | .53 | | | | .29 | | | | .18 | |
| | | | |
Less: Dividends and Distributions | | | | | | | | | | | | |
Dividends from net investment income | | | – 0 | – | | | (.02 | ) | | | – 0 | – |
Distributions from net realized gain on investment transactions | | | – 0 | – | | | (.01 | ) | | | – 0 | – |
| | | | |
Total dividends and distributions | | | – 0 | – | | | (.03 | ) | | | – 0 | – |
| | | | |
Net asset value, end of period | | | $ 10.97 | | | | $ 10.44 | | | | $ 10.18 | |
| | | | |
Total Return | | | | | | | | | | | | |
Total investment return based on net asset value(e) | | | 5.08 | % | | | 2.82 | % | | | 1.80 | % |
Ratios/Supplemental Data | | | | | | | | | | | | |
Net assets, end of period (000’s omitted) | | | $309 | | | | $442 | | | | $10 | |
Ratio to average net assets of: | | | | | | | | | | | | |
Expenses, net of waivers/reimbursements(f) | | | .42 | % | | | .41 | % | | | .39 | %^ |
Expenses, before waivers/reimbursements(f) | | | 6.32 | % | | | 8.37 | % | | | 45.18 | %^ |
Net investment income(c)(f) | | | 1.89 | % | | | 2.28 | % | | | 1.79 | %^ |
Portfolio turnover rate | | | 60 | % | | | 102 | % | | | 12 | % |
See footnote summary on page 233.
| | |
| abfunds.com | | AB MULTI-MANAGER SELECT RETIREMENT FUNDS | 157 |
FINANCIAL HIGHLIGHTS (continued)
Selected Data For A Share Of Capital Stock Outstanding Throughout Each Period
| | | | | | | | | | | | |
| | | AB Multi-Manager Select
Retirement Allocation Fund | |
| | | Class C | |
| | | Year Ended July 31, | | | December 15,
2014(a) to
July 31, 2015 | |
| | | 2017 | | | 2016 | | |
| | | | |
| | | | | | | | | | | | |
Net asset value, beginning of period | | | $ 10.32 | | | | $ 10.13 | | | | $ 10.00 | |
| | | | |
Income From Investment Operations | | | | | | | | | | | | |
Net investment income(b)(c) | | | .14 | | | | .12 | | | | .06 | |
Net realized and unrealized gain on
investment transactions | | | .30 | | | | .08 | | | | .07 | |
Contributions from Affiliates | | | – 0 | – | | | .00 | (d) | | | – 0 | – |
| | | | |
Net increase in net asset value from operations | | | .44 | | | | .20 | | | | .13 | |
| | | | |
Less: Dividends and Distributions | | | | | | | | | | | | |
Dividends from net investment income | | | – 0 | – | | | – 0 | – | | | – 0 | – |
Distributions from net realized gain on investment transactions | | | – 0 | – | | | (.01 | ) | | | – 0 | – |
| | | | |
Total dividends and distributions | | | – 0 | – | | | (.01 | ) | | | – 0 | – |
| | | | |
Net asset value, end of period | | | $ 10.76 | | | | $ 10.32 | | | | $ 10.13 | |
| | | | |
Total Return | | | | | | | | | | | | |
Total investment return based on net asset value(e) | | | 4.26 | % | | | 1.94 | % | | | 1.30 | % |
Ratios/Supplemental Data | | | | | | | | | | | | |
Net assets, end of period (000’s omitted) | | | $186 | | | | $126 | | | | $45 | |
Ratio to average net assets of: | | | | | | | | | | | | |
Expenses, net of waivers/reimbursements(f) | | | 1.17 | % | | | 1.16 | % | | | 1.14 | %^ |
Expenses, before waivers/reimbursements(f) | | | 7.21 | % | | | 11.03 | % | | | 43.43 | %^ |
Net investment income(c)(f) | | | 1.34 | % | | | 1.19 | % | | | .96 | %^ |
Portfolio turnover rate | | | 60 | % | | | 102 | % | | | 12 | % |
See footnote summary on page 233.
| | |
| 158 | AB MULTI-MANAGER SELECT RETIREMENT FUNDS | | abfunds.com |
FINANCIAL HIGHLIGHTS (continued)
Selected Data For A Share Of Capital Stock Outstanding Throughout Each Period
| | | | | | | | | | | | |
| | | AB Multi-Manager Select
Retirement Allocation Fund | |
| | | Advisor Class | |
| | | Year Ended July 31, | | | December 15,
2014(a) to
July 31, 2015 | |
| | | 2017 | | | 2016 | | |
| | | | |
| | | | | | | | | | | | |
Net asset value, beginning of period | | | $ 10.49 | | | | $ 10.20 | | | | $ 10.00 | |
| | | | |
Income From Investment Operations | | | | | | | | | | | | |
Net investment income(b)(c) | | | .24 | | | | .20 | | | | .13 | |
Net realized and unrealized gain on
investment transactions | | | .32 | | | | .10 | | | | .07 | |
Contributions from Affiliates | | | – 0 | – | | | .00 | (d) | | | – 0 | – |
| | | | |
Net increase in net asset value from operations | | | .56 | | | | .30 | | | | .20 | |
| | | | |
Less: Dividends and Distributions | | | | | | | | | | | | |
Dividends from net investment income | | | – 0 | – | | | – 0 | – | | | – 0 | – |
Distributions from net realized gain on investment transactions | | | – 0 | – | | | (.01 | ) | | | – 0 | – |
| | | | |
Total dividends and distributions | | | – 0 | – | | | (.01 | ) | | | – 0 | – |
| | | | |
Net asset value, end of period | | | $ 11.05 | | | | $ 10.49 | | | | $ 10.20 | |
| | | | |
Total Return | | | | | | | | | | | | |
Total investment return based on net asset value(e) | | | 5.34 | % | | | 2.91 | % | | | 2.00 | % |
Ratios/Supplemental Data | | | | | | | | | | | | |
Net assets, end of period (000’s omitted) | | | $25 | | | | $22 | | | | $10 | |
Ratio to average net assets of: | | | | | | | | | | | | |
Expenses, net of waivers/reimbursements(f) | | | .17 | % | | | .16 | % | | | .14 | %^ |
Expenses, before waivers/reimbursements(f) | | | 6.16 | % | | | 9.14 | % | | | 44.95 | %^ |
Net investment income(c)(f) | | | 2.22 | % | | | 1.98 | % | | | 2.05 | %^ |
Portfolio turnover rate | | | 60 | % | | | 102 | % | | | 12 | % |
See footnote summary on page 233.
| | |
| abfunds.com | | AB MULTI-MANAGER SELECT RETIREMENT FUNDS | 159 |
FINANCIAL HIGHLIGHTS (continued)
Selected Data For A Share Of Capital Stock Outstanding Throughout Each Period
| | | | | | | | | | | | |
| | | AB Multi-Manager Select
Retirement Allocation Fund | |
| | | Class R | |
| | | Year Ended July 31, | | | December 15,
2014(a) to
July 31, 2015 | |
| | | 2017 | | | 2016 | | |
| | | | |
| | | | | | | | | | | | |
Net asset value, beginning of period | | | $ 10.16 | | | | $ 10.02 | | | | $ 10.00 | |
| | | | |
Income From Investment Operations | | | | | | | | | | | | |
Net investment income(b)(c) | | | .22 | | | | .14 | | | | .10 | |
Net realized and unrealized gain on
investment transactions | | | .27 | | | | .09 | | | | .06 | |
Contributions from Affiliates | | | – 0 | – | | | .00 | (d) | | | – 0 | – |
| | | | |
Net increase in net asset value from operations | | | .49 | | | | .23 | | | | .16 | |
| | | | |
Less: Dividends and Distributions | | | | | | | | | | | | |
Dividends from net investment income | | | (.16 | ) | | | (.08 | ) | | | (.14 | ) |
Distributions from net realized gain on investment transactions | | | – 0 | – | | | (.01 | ) | | | – 0 | – |
| | | | |
Total dividends and distributions | | | (.16 | ) | | | (.09 | ) | | | (.14 | ) |
| | | | |
Net asset value, end of period | | | $ 10.49 | | | | $ 10.16 | | | | $ 10.02 | |
| | | | |
Total Return | | | | | | | | | | | | |
Total investment return based on net asset value(e) | | | 4.88 | % | | | 2.36 | % | | | 1.62 | % |
Ratios/Supplemental Data | | | | | | | | | | | | |
Net assets, end of period (000’s omitted) | | | $17 | | | | $33 | | | | $10 | |
Ratio to average net assets of: | | | | | | | | | | | | |
Expenses, net of waivers/reimbursements(f) | | | .67 | % | | | .66 | % | | | .64 | %^ |
Expenses, before waivers/reimbursements(f) | | | 3.59 | % | | | 5.08 | % | | | 30.60 | %^ |
Net investment income(c)(f) | | | 2.20 | % | | | 1.42 | % | | | 1.56 | %^ |
Portfolio turnover rate | | | 60 | % | | | 102 | % | | | 12 | % |
See footnote summary on page 233.
| | |
| 160 | AB MULTI-MANAGER SELECT RETIREMENT FUNDS | | abfunds.com |
FINANCIAL HIGHLIGHTS (continued)
Selected Data For A Share Of Capital Stock Outstanding Throughout Each Period
| | | | | | | | | | | | |
| | | AB Multi-Manager Select
Retirement Allocation Fund | |
| | | Class K | |
| | | Year Ended July 31, | | | December 15,
2014(a) to
July 31, 2015 | |
| | | 2017 | | | 2016 | | |
| | | | |
| | | | | | | | | | | | |
Net asset value, beginning of period | | | $ 10.19 | | | | $ 10.04 | | | | $ 10.00 | |
| | | | |
Income From Investment Operations | | | | | | | | | | | | |
Net investment income(b)(c) | | | .20 | | | | .22 | | | | .09 | |
Net realized and unrealized gain on
investment transactions | | | .31 | | | | .04 | | | | .09 | |
Contributions from Affiliates | | | – 0 | – | | | .00 | (d) | | | – 0 | – |
| | | | |
Net increase in net asset value from operations | | | .51 | | | | .26 | | | | .18 | |
| | | | |
Less: Dividends and Distributions | | | | | | | | | | | | |
Dividends from net investment income | | | (.19 | ) | | | (.10 | ) | | | (.14 | ) |
Distributions from net realized gain on investment transactions | | | – 0 | – | | | (.01 | ) | | | – 0 | – |
| | | | |
Total dividends and distributions | | | (.19 | ) | | | (.11 | ) | | | (.14 | ) |
| | | | |
Net asset value, end of period | | | $ 10.51 | | | | $ 10.19 | | | | $ 10.04 | |
| | | | |
Total Return | | | | | | | | | | | | |
Total investment return based on net asset value(e) | | | 5.15 | % | | | 2.65 | % | | | 1.84 | % |
Ratios/Supplemental Data | | | | | | | | | | | | |
Net assets, end of period (000’s omitted) | | | $7,869 | | | | $8,303 | | | | $671 | |
Ratio to average net assets of: | | | | | | | | | | | | |
Expenses, net of waivers/reimbursements(f) | | | .42 | % | | | .41 | % | | | .39 | %^ |
Expenses, before waivers/reimbursements(f) | | | 3.37 | % | | | 4.40 | % | | | 21.09 | %^ |
Net investment income(c)(f) | | | 2.00 | % | | | 2.26 | % | | | 1.45 | %^ |
Portfolio turnover rate | | | 60 | % | | | 102 | % | | | 12 | % |
See footnote summary on page 233.
| | |
| abfunds.com | | AB MULTI-MANAGER SELECT RETIREMENT FUNDS | 161 |
FINANCIAL HIGHLIGHTS (continued)
Selected Data For A Share Of Capital Stock Outstanding Throughout Each Period
| | | | | | | | | | | | |
| | | AB Multi-Manager Select
Retirement Allocation Fund | |
| | | Class I | |
| | | Year Ended July 31, | | | December 15,
2014(a) to July 31, 2015 | |
| | | 2017 | | | 2016 | | |
| | | | |
| | | | | | | | | | | | |
Net asset value, beginning of period | | | $ 10.23 | | | | $ 10.05 | | | | $ 10.00 | |
| | | | |
Income From Investment Operations | | | | | | | | | | | | |
Net investment income(b)(c) | | | .22 | | | | .27 | | | | .13 | |
Net realized and unrealized gain on
investment transactions | | | .31 | | | | .02 | | | | .06 | |
Contributions from Affiliates | | | – 0 | – | | | .00 | (d) | | | – 0 | – |
| | | | |
Net increase in net asset value from operations | | | .53 | | | | .29 | | | | .19 | |
| | | | |
Less: Dividends and Distributions | | | | | | | | | | | | |
Dividends from net investment income | | | (.22 | ) | | | (.10 | ) | | | (.14 | ) |
Distributions from net realized gain on investment transactions | | | – 0 | – | | | (.01 | ) | | | – 0 | – |
| | | | |
Total dividends and distributions | | | (.22 | ) | | | (.11 | ) | | | (.14 | ) |
| | | | |
Net asset value, end of period | | | $ 10.54 | | | | $ 10.23 | | | | $ 10.05 | |
| | | | |
Total Return | | | | | | | | | | | | |
Total investment return based on net asset value(e) | | | 5.35 | % | | | 2.98 | % | | | 1.95 | % |
Ratios/Supplemental Data | | | | | | | | | | | | |
Net assets, end of period (000’s omitted) | | | $1,057 | | | | $668 | | | | $959 | |
Ratio to average net assets of: | | | | | | | | | | | | |
Expenses, net of waivers/reimbursements(f) | | | .17 | % | | | .15 | % | | | .14 | %^ |
Expenses, before waivers/reimbursements(f) | | | 3.06 | % | | | 7.57 | % | | | 30.07 | %^ |
Net investment income(c)(f) | | | 2.20 | % | | | 2.71 | % | | | 2.06 | %^ |
Portfolio turnover rate | | | 60 | % | | | 102 | % | | | 12 | % |
See footnote summary on page 233.
| | |
| 162 | AB MULTI-MANAGER SELECT RETIREMENT FUNDS | | abfunds.com |
FINANCIAL HIGHLIGHTS (continued)
Selected Data For A Share Of Capital Stock Outstanding Throughout Each Period
| | | | | | | | | | | | |
| | | AB Multi-Manager Select
Retirement Allocation Fund | |
| | | Class Z | |
| | | Year Ended July 31, | | | December 15,
2014(a) to
July 31, 2015 | |
| | | 2017 | | | 2016 | | |
| | | | |
| | | | | | | | | | | | |
Net asset value, beginning of period | | | $ 10.22 | | | | $ 10.05 | | | | $ 10.00 | |
| | | | |
Income From Investment Operations | | | | | | | | | | | | |
Net investment income(b)(c) | | | .23 | | | | .22 | | | | .13 | |
Net realized and unrealized gain on
investment transactions | | | .31 | | | | .06 | | | | .06 | |
Contributions from Affiliates | | | – 0 | – | | | .00 | (d) | | | – 0 | – |
| | | | |
Net increase in net asset value from operations | | | .54 | | | | .28 | | | | .19 | |
| | | | |
Less: Dividends and Distributions | | | | | | | | | | | | |
Dividends from net investment income | | | (.23 | ) | | | (.10 | ) | | | (.14 | ) |
Distributions from net realized gain on investment transactions | | | – 0 | – | | | (.01 | ) | | | – 0 | – |
| | | | |
Total dividends and distributions | | | (.23 | ) | | | (.11 | ) | | | (.14 | ) |
| | | | |
Net asset value, end of period | | | $ 10.53 | | | | $ 10.22 | | | | $ 10.05 | |
| | | | |
Total Return | | | | | | | | | | | | |
Total investment return based on net asset value(e) | | | 5.41 | % | | | 2.88 | % | | | 1.95 | % |
Ratios/Supplemental Data | | | | | | | | | | | | |
Net assets, end of period (000’s omitted) | | | $11 | | | | $10 | | | | $10 | |
Ratio to average net assets of: | | | | | | | | | | | | |
Expenses, net of waivers/reimbursements(f) | | | .17 | % | | | .16 | % | | | .14 | %^ |
Expenses, before waivers/reimbursements(f) | | | 2.95 | % | | | 7.38 | % | | | 30.15 | %^ |
Net investment income(c)(f) | | | 2.27 | % | | | 2.27 | % | | | 2.07 | %^ |
Portfolio turnover rate | | | 60 | % | | | 102 | % | | | 12 | % |
See footnote summary on page 233.
| | |
| abfunds.com | | AB MULTI-MANAGER SELECT RETIREMENT FUNDS | 163 |
FINANCIAL HIGHLIGHTS (continued)
Selected Data For A Share Of Capital Stock Outstanding Throughout Each Period
| | | | | | | | | | | | |
| | | AB Multi-Manager Select 2010 Fund | |
| | | Class A | |
| | | Year Ended July 31, | | | December 15,
2014(a) to
July 31, 2015 | |
| | | 2017 | | | 2016 | | |
| | | | |
| | | | | | | | | | | | |
Net asset value, beginning of period | | | $ 10.47 | | | | $ 10.23 | | | | $ 10.00 | |
| | | | |
Income From Investment Operations | | | | | | | | | | | | |
Net investment income(b)(c) | | | .21 | | | | .24 | | | | .16 | |
Net realized and unrealized gain on
investment transactions | | | .47 | | | | .09 | | | | .10 | |
Contributions from Affiliates | | | – 0 | – | | | .00 | (d) | | | – 0 | – |
| | | | |
Net increase in net asset value from operations | | | .68 | | | | .33 | | | | .26 | |
| | | | |
Less: Dividends and Distributions | | | | | | | | | | | | |
Dividends from net investment income | | | (.01 | ) | | | (.08 | ) | | | (.03 | ) |
Distributions from net realized gain on investment transactions | | | (.03 | ) | | | (.01 | ) | | | – 0 | – |
| | | | |
Total dividends and distributions | | | (.04 | ) | | | (.09 | ) | | | (.03 | ) |
| | | | |
Net asset value, end of period | | | $ 11.11 | | | | $ 10.47 | | | | $ 10.23 | |
| | | | |
Total Return | | | | | | | | | | | | |
Total investment return based on net asset value(e) | | | 6.56 | % | | | 3.24 | % | | | 2.58 | % |
Ratios/Supplemental Data | | | | | | | | | | | | |
Net assets, end of period (000’s omitted) | | | $376 | | | | $629 | | | | $16 | |
Ratio to average net assets of: | | | | | | | | | | | | |
Expenses, net of waivers/reimbursements(f) | | | .40 | % | | | .40 | % | | | .38 | %^ |
Expenses, before waivers/reimbursements(f) | | | 3.42 | % | | | 4.07 | % | | | 46.32 | %^ |
Net investment income(c)(f) | | | 1.95 | % | | | 2.47 | % | | | 2.53 | %^ |
Portfolio turnover rate | | | 49 | % | | | 116 | % | | | 15 | % |
See footnote summary on page 233.
| | |
| 164 | AB MULTI-MANAGER SELECT RETIREMENT FUNDS | | abfunds.com |
FINANCIAL HIGHLIGHTS (continued)
Selected Data For A Share Of Capital Stock Outstanding Throughout Each Period
| | | | | | | | | | | | |
| | | AB Multi-Manager Select 2010 Fund | |
| | | Class C | |
| | | Year Ended July 31, | | | December 15,
2014(a) to
July 31, 2015 | |
| | | 2017 | | | 2016 | | |
| | | | |
| | | | | | | | | | | | |
Net asset value, beginning of period | | | $ 10.39 | | | | $ 10.18 | | | | $ 10.00 | |
| | | | |
Income From Investment Operations | | | | | | | | | | | | |
Net investment income(b)(c) | | | .12 | | | | .21 | | | | .12 | |
Net realized and unrealized gain on
investment transactions | | | .48 | | | | .03 | | | | .08 | |
Contributions from Affiliates | | | – 0 | – | | | .00 | (d) | | | – 0 | – |
| | | | |
Net increase in net asset value from operations | | | .60 | | | | .24 | | | | .20 | |
| | | | |
Less: Dividends and Distributions | | | | | | | | | | | | |
Dividends from net investment income | | | – 0 | – | | | (.02 | ) | | | (.02 | ) |
Distributions from net realized gain on investment transactions | | | (.03 | ) | | | (.01 | ) | | | – 0 | – |
| | | | |
Total dividends and distributions | | | (.03 | ) | | | (.03 | ) | | | (.02 | ) |
| | | | |
Net asset value, end of period | | | $ 10.96 | | | | $ 10.39 | | | | $ 10.18 | |
| | | | |
Total Return | | | | | | | | | | | | |
Total investment return based on net asset value(e) | | | 5.81 | % | | | 2.41 | % | | | 2.04 | % |
Ratios/Supplemental Data | | | | | | | | | | | | |
Net assets, end of period (000’s omitted) | | | $142 | | | | $106 | | | | $10 | |
Ratio to average net assets of: | | | | | | | | | | | | |
Expenses, net of waivers/reimbursements(f) | | | 1.15 | % | | | 1.15 | % | | | 1.13 | %^ |
Expenses, before waivers/reimbursements(f) | | | 4.32 | % | | | 5.48 | % | | | 47.09 | %^ |
Net investment income(c)(f) | | | 1.15 | % | | | 2.10 | % | | | 1.84 | %^ |
Portfolio turnover rate | | | 49 | % | | | 116 | % | | | 15 | % |
See footnote summary on page 233.
| | |
| abfunds.com | | AB MULTI-MANAGER SELECT RETIREMENT FUNDS | 165 |
FINANCIAL HIGHLIGHTS (continued)
Selected Data For A Share Of Capital Stock Outstanding Throughout Each Period
| | | | | | | | | | | | |
| | | AB Multi-Manager Select 2010 Fund | |
| | | Advisor Class | |
| | | Year Ended July 31, | | | December 15,
2014(a) to
July 31, 2015 | |
| | | 2017 | | | 2016 | | |
| | | | |
| | | | | | | | | | | | |
Net asset value, beginning of period | | | $ 10.52 | | | | $ 10.24 | | | | $ 10.00 | |
| | | | |
Income From Investment Operations | | | | | | | | | | | | |
Net investment income(b)(c) | | | .24 | | | | .25 | | | | .18 | |
Net realized and unrealized gain on
investment transactions | | | .46 | | | | .10 | | | | .09 | |
Contributions from Affiliates | | | – 0 | – | | | .00 | (d) | | | – 0 | – |
| | | | |
Net increase in net asset value from operations | | | .70 | | | | .35 | | | | .27 | |
| | | | |
Less: Dividends and Distributions | | | | | | | | | | | | |
Dividends from net investment income | | | (.15 | ) | | | (.06 | ) | | | (.03 | ) |
Distributions from net realized gain on investment transactions | | | (.03 | ) | | | (.01 | ) | | | – 0 | – |
| | | | |
Total dividends and distributions | | | (.18 | ) | | | (.07 | ) | | | (.03 | ) |
| | | | |
Net asset value, end of period | | | $ 11.04 | | | | $ 10.52 | | | | $ 10.24 | |
| | | | |
Total Return | | | | | | | | | | | | |
Total investment return based on net asset value(e) | | | 6.81 | % | | | 3.50 | % | | | 2.70 | % |
Ratios/Supplemental Data | | | | | | | | | | | | |
Net assets, end of period (000’s omitted) | | | $778 | | | | $717 | | | | $10 | |
Ratio to average net assets of: | | | | | | | | | | | | |
Expenses, net of waivers/reimbursements(f) | | | .15 | % | | | .15 | % | | | .13 | %^ |
Expenses, before waivers/reimbursements(f) | | | 3.26 | % | | | 3.56 | % | | | 46.11 | %^ |
Net investment income(c)(f) | | | 2.28 | % | | | 2.54 | % | | | 2.81 | %^ |
Portfolio turnover rate | | | 49 | % | | | 116 | % | | | 15 | % |
See footnote summary on page 233.
| | |
| 166 | AB MULTI-MANAGER SELECT RETIREMENT FUNDS | | abfunds.com |
FINANCIAL HIGHLIGHTS (continued)
Selected Data For A Share Of Capital Stock Outstanding Throughout Each Period
| | | | | | | | | | | | |
| | | AB Multi-Manager Select 2010 Fund | |
| | | Class R | |
| | | Year Ended July 31, | | | December 15,
2014(a) to
July 31, 2015 | |
| | | 2017 | | | 2016 | | |
| | | | |
| | | | | | | | | | | | |
Net asset value, beginning of period | | | $ 10.22 | | | | $ 10.04 | | | | $ 10.00 | |
| | | | |
Income From Investment Operations | | | | | | | | | | | | |
Net investment income(b)(c) | | | .18 | | | | .21 | | | | .15 | |
Net realized and unrealized gain on
investment transactions | | | .45 | | | | .08 | | | | .09 | |
Contributions from Affiliates | | | – 0 | – | | | .00 | (d) | | | – 0 | – |
| | | | |
Net increase in net asset value from operations | | | .63 | | | | .29 | | | | .24 | |
| | | | |
Less: Dividends and Distributions | | | | | | | | | | | | |
Dividends from net investment income | | | (.19 | ) | | | (.10 | ) | | | (.20 | ) |
Distributions from net realized gain on investment transactions | | | (.03 | ) | | | (.01 | ) | | | – 0 | – |
| | | | |
Total dividends and distributions | | | (.22 | ) | | | (.11 | ) | | | (.20 | ) |
| | | | |
Net asset value, end of period | | | $ 10.63 | | | | $ 10.22 | | | | $ 10.04 | |
| | | | |
Total Return | | | | | | | | | | | | |
Total investment return based on net asset value(e) | | | 6.28 | % | | | 2.99 | % | | | 2.43 | % |
Ratios/Supplemental Data | | | | | | | | | | | | |
Net assets, end of period (000’s omitted) | | | $389 | | | | $622 | | | | $10 | |
Ratio to average net assets of: | | | | | | | | | | | | |
Expenses, net of waivers/reimbursements(f) | | | .65 | % | | | .65 | % | | | .63 | %^ |
Expenses, before waivers/reimbursements(f) | | | 2.82 | % | | | 3.59 | % | | | 30.49 | %^ |
Net investment income(c)(f) | | | 1.80 | % | | | 2.12 | % | | | 2.31 | %^ |
Portfolio turnover rate | | | 49 | % | | | 116 | % | | | 15 | % |
See footnote summary on page 233.
| | |
| abfunds.com | | AB MULTI-MANAGER SELECT RETIREMENT FUNDS | 167 |
FINANCIAL HIGHLIGHTS (continued)
Selected Data For A Share Of Capital Stock Outstanding Throughout Each Period
| | | | | | | | | | | | |
| | | AB Multi-Manager Select 2010 Fund | |
| | | Class K | |
| | | Year Ended July 31, | | | December 15,
2014(a) to
July 31, 2015 | |
| | | 2017 | | | 2016 | | |
| | | | |
| | | | | | | | | | | | |
Net asset value, beginning of period | | | $ 10.24 | | | | $ 10.05 | | | | $ 10.00 | |
| | | | |
Income From Investment Operations | | | | | | | | | | | | |
Net investment income(b)(c) | | | .21 | | | | .23 | | | | .10 | |
Net realized and unrealized gain on
investment transactions | | | .44 | | | | .08 | | | | .15 | |
Contributions from Affiliates | | | – 0 | – | | | .00 | (d) | | | – 0 | – |
| | | | |
Net increase in net asset value from operations | | | .65 | | | | .31 | | | | .25 | |
| | | | |
Less: Dividends and Distributions | | | | | | | | | | | | |
Dividends from net investment income | | | (.21 | ) | | | (.11 | ) | | | (.20 | ) |
Distributions from net realized gain on investment transactions | | | (.03 | ) | | | (.01 | ) | | | – 0 | – |
| | | | |
Total dividends and distributions | | | (.24 | ) | | | (.12 | ) | | | (.20 | ) |
| | | | |
Net asset value, end of period | | | $ 10.65 | | | | $ 10.24 | | | | $ 10.05 | |
| | | | |
Total Return | | | | | | | | | | | | |
Total investment return based on net asset value(e) | | | 6.52 | % | | | 3.16 | % | | | 2.54 | % |
Ratios/Supplemental Data | | | | | | | | | | | | |
Net assets, end of period (000’s omitted) | | | $11,448 | | | | $13,222 | | | | $597 | |
Ratio to average net assets of: | | | | | | | | | | | | |
Expenses, net of waivers/reimbursements(f) | | | .40 | % | | | .40 | % | | | .38 | %^ |
Expenses, before waivers/reimbursements(f) | | | 2.54 | % | | | 2.84 | % | | | 23.54 | %^ |
Net investment income(c)(f) | | | 2.04 | % | | | 2.39 | % | | | 1.72 | %^ |
Portfolio turnover rate | | | 49 | % | | | 116 | % | | | 15 | % |
See footnote summary on page 233.
| | |
| 168 | AB MULTI-MANAGER SELECT RETIREMENT FUNDS | | abfunds.com |
FINANCIAL HIGHLIGHTS (continued)
Selected Data For A Share Of Capital Stock Outstanding Throughout Each Period
| | | | | | | | | | | | |
| | | AB Multi-Manager Select 2010 Fund | |
| | | Class I | |
| | | Year Ended July 31, | | | December 15,
2014(a) to
July 31, 2015 | |
| | | 2017 | | | 2016 | | |
| | | | |
| | | | | | | | | | | | |
Net asset value, beginning of period | | | $ 10.28 | | | | $ 10.07 | | | | $ 10.00 | |
| | | | |
Income From Investment Operations | | | | | | | | | | | | |
Net investment income(b)(c) | | | .20 | | | | .31 | | | | .18 | |
Net realized and unrealized gain on
investment transactions | | | .49 | | | | .02 | | | | .09 | |
| | | | |
Net increase in net asset value from operations | | | .69 | | | | .33 | | | | .27 | |
| | | | |
Less: Dividends and Distributions | | | | | | | | | | | | |
Dividends from net investment income | | | (.28 | ) | | | (.11 | ) | | | (.20 | ) |
Distributions from net realized gain on investment transactions | | | (.03 | ) | | | (.01 | ) | | | – 0 | – |
| | | | |
Total dividends and distributions | | | (.31 | ) | | | (.12 | ) | | | (.20 | ) |
| | | | |
Net asset value, end of period | | | $ 10.66 | | | | $ 10.28 | | | | $ 10.07 | |
| | | | |
Total Return | | | | | | | | | | | | |
Total investment return based on net asset value(e) | | | 6.88 | % | | | 3.38 | % | | | 2.76 | % |
Ratios/Supplemental Data | | | | | | | | | | | | |
Net assets, end of period (000’s omitted) | | | $55 | | | | $14 | | | | $966 | |
Ratio to average net assets of: | | | | | | | | | | | | |
Expenses, net of waivers/reimbursements(f) | | | .15 | % | | | .13 | % | | | .13 | %^ |
Expenses, before waivers/reimbursements(f) | | | 2.34 | % | | | 10.46 | % | | | 29.96 | %^ |
Net investment income(c)(f) | | | 1.98 | % | | | 3.17 | % | | | 2.82 | %^ |
Portfolio turnover rate | | | 49 | % | | | 116 | % | | | 15 | % |
See footnote summary on page 233.
| | |
| abfunds.com | | AB MULTI-MANAGER SELECT RETIREMENT FUNDS | 169 |
FINANCIAL HIGHLIGHTS (continued)
Selected Data For A Share Of Capital Stock Outstanding Throughout Each Period
| | | | | | | | | | | | |
| | | AB Multi-Manager Select 2010 Fund | |
| | | Class Z | |
| | | Year Ended July 31, | | | December 15,
2014(a) to
July 31, 2015 | |
| | | 2017 | | | 2016 | | |
| | | | |
| | | | | | | | | | | | |
Net asset value, beginning of period | | | $ 10.28 | | | | $ 10.07 | | | | $ 10.00 | |
| | | | |
Income From Investment Operations | | | | | | | | | | | | |
Net investment income(b)(c) | | | .24 | | | | .23 | | | | .18 | |
Net realized and unrealized gain on
investment transactions | | | .45 | | | | .10 | | | | .09 | |
| | | | |
Net increase in net asset value from operations | | | .69 | | | | .33 | | | | .27 | |
| | | | |
Less: Dividends and Distributions | | | | | | | | | | | | |
Dividends from net investment income | | | (.26 | ) | | | (.11 | ) | | | (.20 | ) |
Distributions from net realized gain on investment transactions | | | (.03 | ) | | | (.01 | ) | | | – 0 | – |
| | | | |
Total dividends and distributions | | | (.29 | ) | | | (.12 | ) | | | (.20 | ) |
| | | | |
Net asset value, end of period | | | $ 10.68 | | | | $ 10.28 | | | | $ 10.07 | |
| | | | |
Total Return | | | | | | | | | | | | |
Total investment return based on net asset value(e) | | | 6.90 | % | | | 3.38 | % | | | 2.76 | % |
Ratios/Supplemental Data | | | | | | | | | | | | |
Net assets, end of period (000’s omitted) | | | $11 | | | | $11 | | | | $10 | |
Ratio to average net assets of: | | | | | | | | | | | | |
Expenses, net of waivers/reimbursements(f) | | | .15 | % | | | .15 | % | | | .13 | %^ |
Expenses, before waivers/reimbursements(f) | | | 2.15 | % | | | 6.29 | % | | | 30.01 | %^ |
Net investment income(c)(f) | | | 2.30 | % | | | 2.39 | % | | | 2.82 | %^ |
Portfolio turnover rate | | | 49 | % | | | 116 | % | | | 15 | % |
See footnote summary on page 233.
| | |
| 170 | AB MULTI-MANAGER SELECT RETIREMENT FUNDS | | abfunds.com |
FINANCIAL HIGHLIGHTS (continued)
Selected Data For A Share Of Capital Stock Outstanding Throughout Each Period
| | | | | | | | | | | | |
| | | AB Multi-Manager Select 2015 Fund | |
| | | Class A | |
| | | Year Ended July 31, | | | December 15,
2014(a) to
July 31, 2015 | |
| | | 2017 | | | 2016 | | |
| | | | |
| | | | | | | | | | | | |
Net asset value, beginning of period | | | $ 10.46 | | | | $ 10.26 | | | | $ 10.00 | |
| | | | |
Income From Investment Operations | | | | | | | | | | | | |
Net investment income(b)(c) | | | .20 | | | | .24 | | | | .10 | |
Net realized and unrealized gain on
investment transactions | | | .59 | | | | .09 | | | | .20 | † |
Contributions from Affiliates | | | – 0 | – | | | .00 | (d) | | | .00 | (d) |
| | | | |
Net increase in net asset value from operations | | | .79 | | | | .33 | | | | .30 | |
| | | | |
Less: Dividends and Distributions | | | | | | | | | | | | |
Dividends from net investment income | | | (.18 | ) | | | (.13 | ) | | | (.04 | ) |
Distributions from net realized gain on investment transactions | | | (.06 | ) | | | (.00 | )(d) | | | – 0 | – |
| | | | |
Total dividends and distributions | | | (.24 | ) | | | (.13 | ) | | | (.04 | ) |
| | | | |
Net asset value, end of period | | | $ 11.01 | | | | $ 10.46 | | | | $ 10.26 | |
| | | | |
Total Return | | | | | | | | | | | | |
Total investment return based on net asset value(e) | | | 7.72 | % | | | 3.33 | % | | | 2.99 | % |
Ratios/Supplemental Data | | | | | | | | | | | | |
Net assets, end of period (000’s omitted) | | | $2,224 | | | | $3,613 | | | | $168 | |
Ratio to average net assets of: | | | | | | | | | | | | |
Expenses, net of waivers/reimbursements(f) | | | .40 | % | | | .40 | % | | | .42 | %^ |
Expenses, before waivers/reimbursements(f) | | | 1.16 | % | | | 1.31 | % | | | 26.98 | %^ |
Net investment income(c)(f) | | | 1.90 | % | | | 2.47 | % | | | 1.50 | %^ |
Portfolio turnover rate | | | 38 | % | | | 83 | % | | | 18 | % |
See footnote summary on page 233.
| | |
| abfunds.com | | AB MULTI-MANAGER SELECT RETIREMENT FUNDS | 171 |
FINANCIAL HIGHLIGHTS (continued)
Selected Data For A Share Of Capital Stock Outstanding Throughout Each Period
| | | | | | | | | | | | |
| | | AB Multi-Manager Select 2015 Fund | |
| | | Class C | |
| | | Year Ended July 31, | | | December 15,
2014(a) to
July 31, 2015 | |
| | | 2017 | | | 2016 | | |
| | | | |
| | | | | | | | | | | | |
Net asset value, beginning of period | | | $ 10.40 | | | | $ 10.21 | | | | $ 10.00 | |
| | | | |
Income From Investment Operations | | | | | | | | | | | | |
Net investment income(b)(c) | | | .14 | | | | .15 | | | | .06 | |
Net realized and unrealized gain on
investment transactions | | | .57 | | | | .11 | | | | .19 | † |
Contributions from Affiliates | | | – 0 | – | | | .00 | (d) | | | .00 | (d) |
| | | | |
Net increase in net asset value from operations | | | .71 | | | | .26 | | | | .25 | |
| | | | |
Less: Dividends and Distributions | | | | | | | | | | | | |
Dividends from net investment income | | | (.13 | ) | | | (.07 | ) | | | (.04 | ) |
Distributions from net realized gain on investment transactions | | | (.06 | ) | | | (.00 | )(d) | | | – 0 | – |
| | | | |
Total dividends and distributions | | | (.19 | ) | | | (.07 | ) | | | (.04 | ) |
| | | | |
Net asset value, end of period | | | $ 10.92 | | | | $ 10.40 | | | | $ 10.21 | |
| | | | |
Total Return | | | | | | | | | | | | |
Total investment return based on net asset value(e) | | | 6.92 | % | | | 2.63 | % | | | 2.45 | % |
Ratios/Supplemental Data | | | | | | | | | | | | |
Net assets, end of period (000’s omitted) | | | $737 | | | | $717 | | | | $374 | |
Ratio to average net assets of: | | | | | | | | | | | | |
Expenses, net of waivers/reimbursements(f) | | | 1.15 | % | | | 1.16 | % | | | 1.17 | %^ |
Expenses, before waivers/reimbursements(f) | | | 1.93 | % | | | 2.52 | % | | | 19.67 | %^ |
Net investment income(c)(f) | | | 1.31 | % | | | 1.55 | % | | | .90 | %^ |
Portfolio turnover rate | | | 38 | % | | | 83 | % | | | 18 | % |
See footnote summary on page 233.
| | |
| 172 | AB MULTI-MANAGER SELECT RETIREMENT FUNDS | | abfunds.com |
FINANCIAL HIGHLIGHTS (continued)
Selected Data For A Share Of Capital Stock Outstanding Throughout Each Period
| | | | | | | | | | | | |
| | | AB Multi-Manager Select 2015 Fund | |
| | | Advisor Class | |
| | | Year Ended July 31, | | | December 15,
2014(a) to
July 31, 2015 | |
| | | 2017 | | | 2016 | | |
| | | | |
| | | | | | | | | | | | |
Net asset value, beginning of period | | | $ 10.63 | | | | $ 10.27 | | | | $ 10.00 | |
| | | | |
Income From Investment Operations | | | | | | | | | | | | |
Net investment income(b)(c) | | | .25 | | | | .27 | | | | .12 | |
Net realized and unrealized gain on
investment transactions | | | .58 | | | | .11 | | | | .19 | † |
Contributions from Affiliates | | | – 0 | – | | | .00 | (d) | | | .00 | (d) |
| | | | |
Net increase in net asset value from operations | | | .83 | | | | .38 | | | | .31 | |
| | | | |
Less: Dividends and Distributions | | | | | | | | | | | | |
Dividends from net investment income | | | (.24 | ) | | | (.02 | ) | | | (.04 | ) |
Distributions from net realized gain on investment transactions | | | (.06 | ) | | | (.00 | )(d) | | | – 0 | – |
| | | | |
Total dividends and distributions | | | (.30 | ) | | | (.02 | ) | | | (.04 | ) |
| | | | |
Net asset value, end of period | | | $ 11.16 | | | | $ 10.63 | | | | $ 10.27 | |
| | | | |
Total Return | | | | | | | | | | | | |
Total investment return based on net asset value(e) | | | 7.98 | % | | | 3.68 | % | | | 3.11 | % |
Ratios/Supplemental Data | | | | | | | | | | | | |
Net assets, end of period (000’s omitted) | | | $78 | | | | $70 | | | | $61 | |
Ratio to average net assets of: | | | | | | | | | | | | |
Expenses, net of waivers/reimbursements(f) | | | .15 | % | | | .16 | % | | | .17 | %^ |
Expenses, before waivers/reimbursements(f) | | | .94 | % | | | 1.58 | % | | | 26.67 | %^ |
Net investment income(c)(f) | | | 2.30 | % | | | 2.68 | % | | | 1.82 | %^ |
Portfolio turnover rate | | | 38 | % | | | 83 | % | | | 18 | % |
See footnote summary on page 233.
| | |
| abfunds.com | | AB MULTI-MANAGER SELECT RETIREMENT FUNDS | 173 |
FINANCIAL HIGHLIGHTS (continued)
Selected Data For A Share Of Capital Stock Outstanding Throughout Each Period
| | | | | | | | | | | | |
| | | AB Multi-Manager Select 2015 Fund | |
| | | Class R | |
| | | Year Ended July 31, | | | December 15,
2014(a) to
July 31, 2015 | |
| | | 2017 | | | 2016 | | |
| | | | |
| | | | | | | | | | | | |
Net asset value, beginning of period | | | $ 10.25 | | | | $ 10.07 | | | | $ 10.00 | |
| | | | |
Income From Investment Operations | | | | | | | | | | | | |
Net investment income(b)(c) | | | .19 | | | | .21 | | | | .11 | |
Net realized and unrealized gain on
investment transactions | | | .55 | | | | .10 | | | | .17 | † |
Contributions from Affiliates | | | – 0 | – | | | .00 | (d) | | | .00 | (d) |
| | | | |
Net increase in net asset value from operations | | | .74 | | | | .31 | | | | .28 | |
| | | | |
Less: Dividends and Distributions | | | | | | | | | | | | |
Dividends from net investment income | | | (.16 | ) | | | (.13 | ) | | | (.21 | ) |
Distributions from net realized gain on investment transactions | | | (.06 | ) | | | (.00 | )(d) | | | – 0 | – |
| | | | |
Total dividends and distributions | | | (.22 | ) | | | (.13 | ) | | | (.21 | ) |
| | | | |
Net asset value, end of period | | | $ 10.77 | | | | $ 10.25 | | | | $ 10.07 | |
| | | | |
Total Return | | | | | | | | | | | | |
Total investment return based on net asset value(e) | | | 7.40 | % | | | 3.10 | % | | | 2.84 | % |
Ratios/Supplemental Data | | | | | | | | | | | | |
Net assets, end of period (000’s omitted) | | | $399 | | | | $375 | | | | $247 | |
Ratio to average net assets of: | | | | | | | | | | | | |
Expenses, net of waivers/reimbursements(f) | | | .65 | % | | | .66 | % | | | .67 | %^ |
Expenses, before waivers/reimbursements(f) | | | 1.51 | % | | | 1.95 | % | | | 15.95 | %^ |
Net investment income(c)(f) | | | 1.81 | % | | | 2.15 | % | | | 1.74 | %^ |
Portfolio turnover rate | | | 38 | % | | | 83 | % | | | 18 | % |
See footnote summary on page 233.
| | |
| 174 | AB MULTI-MANAGER SELECT RETIREMENT FUNDS | | abfunds.com |
FINANCIAL HIGHLIGHTS (continued)
Selected Data For A Share Of Capital Stock Outstanding Throughout Each Period
| | | | | | | | | | | | |
| | | AB Multi-Manager Select 2015 Fund | |
| | | Class K | |
| | | Year Ended July 31, | | | December 15,
2014(a) to
July 31, 2015 | |
| | | 2017 | | | 2016 | | |
| | | | |
| | | | | | | | | | | | |
Net asset value, beginning of period | | | $ 10.28 | | | | $ 10.09 | | | | $ 10.00 | |
| | | | |
Income From Investment Operations | | | | | | | | | | | | |
Net investment income(b)(c) | | | .21 | | | | .24 | | | | .08 | |
Net realized and unrealized gain on
investment transactions | | | .56 | | | | .09 | | | | .22 | † |
Contributions from Affiliates | | | – 0 | – | | | .00 | (d) | | | .00 | (d) |
| | | | |
Net increase in net asset value from operations | | | .77 | | | | .33 | | | | .30 | |
| | | | |
Less: Dividends and Distributions | | | | | | | | | | | | |
Dividends from net investment income | | | (.20 | ) | | | (.14 | ) | | | (.21 | ) |
Distributions from net realized gain on investment transactions | | | (.06 | ) | | | (.00 | )(d) | | | – 0 | – |
| | | | |
Total dividends and distributions | | | (.26 | ) | | | (.14 | ) | | | (.21 | ) |
| | | | |
Net asset value, end of period | | | $ 10.79 | | | | $ 10.28 | | | | $ 10.09 | |
| | | | |
Total Return | | | | | | | | | | | | |
Total investment return based on net asset value(e) | | | 7.68 | % | | | 3.35 | % | | | 3.06 | % |
Ratios/Supplemental Data | | | | | | | | | | | | |
Net assets, end of period (000’s omitted) | | | $38,086 | | | | $41,604 | | | | $3,780 | |
Ratio to average net assets of: | | | | | | | | | | | | |
Expenses, net of waivers/reimbursements(f) | | | .40 | % | | | .41 | % | | | .42 | %^ |
Expenses, before waivers/reimbursements(f) | | | 1.22 | % | | | 1.37 | % | | | 10.55 | %^ |
Net investment income(c)(f) | | | 2.07 | % | | | 2.48 | % | | | 1.30 | %^ |
Portfolio turnover rate | | | 38 | % | | | 83 | % | | | 18 | % |
See footnote summary on page 233.
| | |
| abfunds.com | | AB MULTI-MANAGER SELECT RETIREMENT FUNDS | 175 |
FINANCIAL HIGHLIGHTS (continued)
Selected Data For A Share Of Capital Stock Outstanding Throughout Each Period
| | | | | | | | | | | | |
| | | AB Multi-Manager Select 2015 Fund | |
| | | Class I | |
| | | Year Ended July 31, | | | December 15,
2014(a) to
July 31, 2015 | |
| | | 2017 | | | 2016 | | |
| | | | | | | | | | | | |
Net asset value, beginning of period | | | $ 10.31 | | | | $ 10.10 | | | | $ 10.00 | |
| | | | |
Income From Investment Operations | | | | | | | | | | | | |
Net investment income(b)(c) | | | .25 | | | | .30 | | | | .18 | |
Net realized and unrealized gain on
investment transactions | | | .55 | | | | .06 | | | | .14 | † |
Contributions from Affiliates | | | – 0 | – | | | .00 | (d) | | | .00 | (d) |
| | | | |
Net increase in net asset value from operations | | | .80 | | | | .36 | | | | .32 | |
| | | | |
Less: Dividends and Distributions | | | | | | | | | | | | |
Dividends from net investment income | | | (.24 | ) | | | (.15 | ) | | | (.22 | ) |
Distributions from net realized gain on investment transactions | | | (.06 | ) | | | (.00 | )(d) | | | – 0 | – |
| | | | |
Total dividends and distributions | | | (.30 | ) | | | (.15 | ) | | | (.22 | ) |
| | | | |
Net asset value, end of period | | | $ 10.81 | | | | $ 10.31 | | | | $ 10.10 | |
| | | | |
Total Return | | | | | | | | | | | | |
Total investment return based on net asset value(e) | | | 7.96 | % | | | 3.60 | % | | | 3.17 | % |
Ratios/Supplemental Data | | | | | | | | | | | | |
Net assets, end of period (000’s omitted) | | | $534 | | | | $541 | | | | $969 | |
Ratio to average net assets of: | | | | | | | | | | | | |
Expenses, net of waivers/reimbursements(f) | | | .15 | % | | | .16 | % | | | .17 | %^ |
Expenses, before waivers/reimbursements(f) | | | .89 | % | | | 1.74 | % | | | 25.68 | %^ |
Net investment income(c)(f) | | | 2.43 | % | | | 3.06 | % | | | 2.91 | %^ |
Portfolio turnover rate | | | 38 | % | | | 83 | % | | | 18 | % |
See footnote summary on page 233.
| | |
| 176 | AB MULTI-MANAGER SELECT RETIREMENT FUNDS | | abfunds.com |
FINANCIAL HIGHLIGHTS (continued)
Selected Data For A Share Of Capital Stock Outstanding Throughout Each Period
| | | | | | | | | | | | |
| | | AB Multi-Manager Select 2015 Fund | |
| | | Class Z | |
| | | Year Ended July 31, | | | December 15,
2014(a) to
July 31, 2015 | |
| | | 2017 | | | 2016 | | |
| | | | |
| | | | | | | | | | | | |
Net asset value, beginning of period | | | $ 10.31 | | | | $ 10.10 | | | | $ 10.00 | |
| | | | |
Income From Investment Operations | | | | | | | | | | | | |
Net investment income(b)(c) | | | .24 | | | | .24 | | | | .18 | |
Net realized and unrealized gain on
investment transactions | | | .56 | | | | .11 | | | | .14 | † |
Contributions from Affiliates | | | – 0 | – | | | .00 | (d) | | | .00 | (d) |
| | | | |
Net increase in net asset value from operations | | | .80 | | | | .35 | | | | .32 | |
| | | | |
Less: Dividends and Distributions | | | | | | | | | | | | |
Dividends from net investment income | | | (.24 | ) | | | (.14 | ) | | | (.22 | ) |
Distributions from net realized gain on investment transactions | | | (.06 | ) | | | (.00 | )(d) | | | – 0 | – |
| | | | |
Total dividends and distributions | | | (.30 | ) | | | (.14 | ) | | | (.22 | ) |
| | | | |
Net asset value, end of period | | | $ 10.81 | | | | $ 10.31 | | | | $ 10.10 | |
| | | | |
Total Return | | | | | | | | | | | | |
Total investment return based on net asset value(e) | | | 8.02 | % | | | 3.60 | % | | | 3.17 | % |
Ratios/Supplemental Data | | | | | | | | | | | | |
Net assets, end of period (000’s omitted) | | | $11 | | | | $11 | | | | $10 | |
Ratio to average net assets of: | | | | | | | | | | | | |
Expenses, net of waivers/reimbursements(f) | | | .15 | % | | | .16 | % | | | .17 | %^ |
Expenses, before waivers/reimbursements(f) | | | .80 | % | | | 1.47 | % | | | 25.70 | %^ |
Net investment income(c)(f) | | | 2.33 | % | | | 2.49 | % | | | 2.91 | %^ |
Portfolio turnover rate | | | 38 | % | | | 83 | % | | | 18 | % |
See footnote summary on page 233.
| | |
| abfunds.com | | AB MULTI-MANAGER SELECT RETIREMENT FUNDS | 177 |
FINANCIAL HIGHLIGHTS (continued)
Selected Data For A Share Of Capital Stock Outstanding Throughout Each Period
| | | | | | | | | | | | |
| | | AB Multi-Manager Select 2020 Fund | |
| | | Class A | |
| | | Year Ended July 31, | | | December 15,
2014(a) to
July 31, 2015 | |
| | | 2017 | | | 2016 | | |
| | | | |
| | | | | | | | | | | | |
Net asset value, beginning of period | | | $ 10.46 | | | | $ 10.28 | | | | $ 10.00 | |
| | | | |
Income From Investment Operations | | | | | | | | | | | | |
Net investment income(b)(c) | | | .21 | | | | .23 | | | | .12 | |
Net realized and unrealized gain on
investment transactions | | | .71 | | | | .09 | | | | .24 | † |
Contributions from Affiliates | | | – 0 | – | | | .00 | (d) | | | .00 | (d) |
| | | | |
Net increase in net asset value from operations | | | .92 | | | | .32 | | | | .36 | |
| | | | |
Less: Dividends and Distributions | | | | | | | | | | | | |
Dividends from net investment income | | | (.18 | ) | | | (.13 | ) | | | (.08 | ) |
Distributions from net realized gain on investment transactions | | | (.05 | ) | | | (.01 | ) | | | – 0 | – |
| | | | |
Total dividends and distributions | | | (.23 | ) | | | (.14 | ) | | | (.08 | ) |
| | | | |
Net asset value, end of period | | | $ 11.15 | | | | $ 10.46 | | | | $ 10.28 | |
| | | | |
Total Return | | | | | | | | | | | | |
Total investment return based on net asset value(e) | | | 8.98 | % | | | 3.19 | % | | | 3.58 | % |
Ratios/Supplemental Data | | | | | | | | | | | | |
Net assets, end of period (000’s omitted) | | | $5,239 | | | | $8,339 | | | | $521 | |
Ratio to average net assets of: | | | | | | | | | | | | |
Expenses, net of waivers/reimbursements(f) | | | .44 | % | | | .45 | % | | | .46 | %^ |
Expenses, before waivers/reimbursements(f) | | | .82 | % | | | 1.00 | % | | | 9.77 | %^ |
Net investment income(c)(f) | | | 1.94 | % | | | 2.37 | % | | | 2.00 | %^ |
Portfolio turnover rate | | | 46 | % | | | 81 | % | | | 100 | % |
See footnote summary on page 233.
| | |
| 178 | AB MULTI-MANAGER SELECT RETIREMENT FUNDS | | abfunds.com |
FINANCIAL HIGHLIGHTS (continued)
Selected Data For A Share Of Capital Stock Outstanding Throughout Each Period
| | | | | | | | | | | | |
| | | AB Multi-Manager Select 2020 Fund | |
| | | Class C | |
| | | Year Ended July 31, | | | December 15,
2014(a) to
July 31, 2015 | |
| | | 2017 | | | 2016 | | |
| | | | |
| | | | | | | | | | | | |
Net asset value, beginning of period | | | $ 10.36 | | | | $ 10.23 | | | | $ 10.00 | |
| | | | |
Income From Investment Operations | | | | | | | | | | | | |
Net investment income(b)(c) | | | .13 | | | | .15 | | | | .06 | |
Net realized and unrealized gain on
investment transactions | | | .70 | | | | .09 | | | | .24 | † |
Contributions from Affiliates | | | – 0 | – | | | .00 | (d) | | | .00 | (d) |
| | | | |
Net increase in net asset value from operations | | | .83 | | | | .24 | | | | .30 | |
| | | | |
Less: Dividends and Distributions | | | | | | | | | | | | |
Dividends from net investment income | | | (.12 | ) | | | (.10 | ) | | | (.07 | ) |
Distributions from net realized gain on investment transactions | | | (.05 | ) | | | (.01 | ) | | | – 0 | – |
| | | | |
Total dividends and distributions | | | (.17 | ) | | | (.11 | ) | | | (.07 | ) |
| | | | |
Net asset value, end of period | | | $ 11.02 | | | | $ 10.36 | | | | $ 10.23 | |
| | | | |
Total Return | | | | | | | | | | | | |
Total investment return based on net asset value(e) | | | 8.17 | % | | | 2.38 | % | | | 3.04 | % |
Ratios/Supplemental Data | | | | | | | | | | | | |
Net assets, end of period (000’s omitted) | | | $1,584 | | | | $1,286 | | | | $370 | |
Ratio to average net assets of: | | | | | | | | | | | | |
Expenses, net of waivers/reimbursements(f) | | | 1.19 | % | | | 1.20 | % | | | 1.21 | %^ |
Expenses, before waivers/reimbursements(f) | | | 1.57 | % | | | 1.82 | % | | | 12.82 | %^ |
Net investment income(c)(f) | | | 1.23 | % | | | 1.57 | % | | | .95 | %^ |
Portfolio turnover rate | | | 46 | % | | | 81 | % | | | 100 | % |
See footnote summary on page 233.
| | |
| abfunds.com | | AB MULTI-MANAGER SELECT RETIREMENT FUNDS | 179 |
FINANCIAL HIGHLIGHTS (continued)
Selected Data For A Share Of Capital Stock Outstanding Throughout Each Period
| | | | | | | | | | | | |
| | | AB Multi-Manager Select 2020 Fund | |
| | | Advisor Class | |
| | | Year Ended July 31, | | | December 15,
2014(a) to
July 31, 2015 | |
| | | 2017 | | | 2016 | | |
| | | | |
| | | | | | | | | | | | |
Net asset value, beginning of period | | | $ 10.50 | | | | $ 10.30 | | | | $ 10.00 | |
| | | | |
Income From Investment Operations | | | | | | | | | | | | |
Net investment income(b)(c) | | | .25 | | | | .29 | | | | .18 | |
Net realized and unrealized gain on
investment transactions | | | .70 | | | | .05 | | | | .20 | † |
Contributions from Affiliates | | | – 0 | – | | | .00 | (d) | | | .00 | (d) |
| | | | |
Net increase in net asset value from operations | | | .95 | | | | .34 | | | | .38 | |
| | | | |
Less: Dividends and Distributions | | | | | | | | | | | | |
Dividends from net investment income | | | (.23 | ) | | | (.13 | ) | | | (.08 | ) |
Distributions from net realized gain on investment transactions | | | (.05 | ) | | | (.01 | ) | | | – 0 | – |
| | | | |
Total dividends and distributions | | | (.28 | ) | | | (.14 | ) | | | (.08 | ) |
| | | | |
Net asset value, end of period | | | $ 11.17 | | | | $ 10.50 | | | | $ 10.30 | |
| | | | |
Total Return | | | | | | | | | | | | |
Total investment return based on net asset value(e) | | | 9.23 | % | | | 3.36 | % | | | 3.80 | % |
Ratios/Supplemental Data | | | | | | | | | | | | |
Net assets, end of period (000’s omitted) | | | $220 | | | | $179 | | | | $15 | |
Ratio to average net assets of: | | | | | | | | | | | | |
Expenses, net of waivers/reimbursements(f) | | | .19 | % | | | .20 | % | | | .21 | %^ |
Expenses, before waivers/reimbursements(f) | | | .57 | % | | | .69 | % | | | 25.25 | %^ |
Net investment income(c)(f) | | | 2.32 | % | | | 2.96 | % | | | 2.74 | %^ |
Portfolio turnover rate | | | 46 | % | | | 81 | % | | | 100 | % |
See footnote summary on page 233.
| | |
| 180 | AB MULTI-MANAGER SELECT RETIREMENT FUNDS | | abfunds.com |
FINANCIAL HIGHLIGHTS (continued)
Selected Data For A Share Of Capital Stock Outstanding Throughout Each Period
| | | | | | | | | | | | |
| | | AB Multi-Manager Select 2020 Fund | |
| | | Class R | |
| | | Year Ended July 31, | | | December 15,
2014(a) to
July 31, 2015 | |
| | | 2017 | | | 2016 | | |
| | | | |
| | | | | | | | | | | | |
Net asset value, beginning of period | | | $ 10.23 | | | | $ 10.09 | | | | $ 10.00 | |
| | | | |
Income From Investment Operations | | | | | | | | | | | | |
Net investment income(b)(c) | | | .19 | | | | .22 | | | | .12 | |
Net realized and unrealized gain on
investment transactions | | | .69 | | | | .06 | | | | .22 | † |
Contributions from Affiliates | | | – 0 | – | | | .00 | (d) | | | .00 | (d) |
| | | | |
Net increase in net asset value from operations | | | .88 | | | | .28 | | | | .34 | |
| | | | |
Less: Dividends and Distributions | | | | | | | | | | | | |
Dividends from net investment income | | | (.14 | ) | | | (.13 | ) | | | (.25 | ) |
Distributions from net realized gain on investment transactions | | | (.05 | ) | | | (.01 | ) | | | – 0 | – |
| | | | |
Total dividends and distributions | | | (.19 | ) | | | (.14 | ) | | | (.25 | ) |
| | | | |
Net asset value, end of period | | | $ 10.92 | | | | $ 10.23 | | | | $ 10.09 | |
| | | | |
Total Return | | | | | | | | | | | | |
Total investment return based on net asset value(e) | | | 8.78 | % | | | 2.84 | % | | | 3.43 | % |
Ratios/Supplemental Data | | | | | | | | | | | | |
Net assets, end of period (000’s omitted) | | | $2,052 | | | | $2,328 | | | | $296 | |
Ratio to average net assets of: | | | | | | | | | | | | |
Expenses, net of waivers/reimbursements(f) | | | .69 | % | | | .70 | % | | | .71 | %^ |
Expenses, before waivers/reimbursements(f) | | | 1.17 | % | | | 1.36 | % | | | 8.32 | %^ |
Net investment income(c)(f) | | | 1.79 | % | | | 2.25 | % | | | 1.93 | %^ |
Portfolio turnover rate | | | 46 | % | | | 81 | % | | | 100 | % |
See footnote summary on page 233.
| | |
| abfunds.com | | AB MULTI-MANAGER SELECT RETIREMENT FUNDS | 181 |
FINANCIAL HIGHLIGHTS (continued)
Selected Data For A Share Of Capital Stock Outstanding Throughout Each Period
| | | | | | | | | | | | |
| | | AB Multi-Manager Select 2020 Fund | |
| | | Class K | |
| | | Year Ended July 31, | | | December 15,
2014(a) to
July 31, 2015 | |
| | | 2017 | | | 2016 | | |
| | | | |
| | | | | | | | | | | | |
Net asset value, beginning of period | | | $ 10.27 | | | | $ 10.11 | | | | $ 10.00 | |
| | | | |
Income From Investment Operations | | | | | | | | | | | | |
Net investment income(b)(c) | | | .21 | | | | .23 | | | | .10 | |
Net realized and unrealized gain on
investment transactions | | | .70 | | | | .07 | | | | .26 | † |
Contributions from Affiliates | | | – 0 | – | | | .00 | (d) | | | .00 | (d) |
| | | | |
Net increase in net asset value from operations | | | .91 | | | | .30 | | | | .36 | |
| | | | |
Less: Dividends and Distributions | | | | | | | | | | | | |
Dividends from net investment income | | | (.19 | ) | | | (.13 | ) | | | (.25 | ) |
Distributions from net realized gain on investment transactions | | | (.05 | ) | | | (.01 | ) | | | – 0 | – |
| | | | |
Total dividends and distributions | | | (.24 | ) | | | (.14 | ) | | | (.25 | ) |
| | | | |
Net asset value, end of period | | | $ 10.94 | | | | $ 10.27 | | | | $ 10.11 | |
| | | | |
Total Return | | | | | | | | | | | | |
Total investment return based on net asset value(e) | | | 9.07 | % | | | 3.08 | % | | | 3.65 | % |
Ratios/Supplemental Data | | | | | | | | | | | | |
Net assets, end of period (000’s omitted) | | | $82,263 | | | | $72,587 | | | | $6,854 | |
Ratio to average net assets of: | | | | | | | | | | | | |
Expenses, net of waivers/reimbursements(f) | | | .44 | % | | | .45 | % | | | .46 | %^ |
Expenses, before waivers/reimbursements(f) | | | .90 | % | | | 1.04 | % | | | 5.40 | %^ |
Net investment income(c)(f) | | | 2.02 | % | | | 2.40 | % | | | 1.68 | %^ |
Portfolio turnover rate | | | 46 | % | | | 81 | % | | | 100 | % |
See footnote summary on page 233.
| | |
| 182 | AB MULTI-MANAGER SELECT RETIREMENT FUNDS | | abfunds.com |
FINANCIAL HIGHLIGHTS (continued)
Selected Data For A Share Of Capital Stock Outstanding Throughout Each Period
| | | | | | | | | | | | |
| | | AB Multi-Manager Select 2020 Fund | |
| | | Class I | |
| | | Year Ended July 31, | | | December 15,
2014(a) to
July 31, 2015 | |
| | | 2017 | | | 2016 | | |
| | | | |
| | | | | | | | | | | | |
Net asset value, beginning of period | | | $ 10.30 | | | | $ 10.12 | | | | $ 10.00 | |
| | | | |
Income From Investment Operations | | | | | | | | | | | | |
Net investment income(b)(c) | | | .24 | | | | .28 | | | | .19 | |
Net realized and unrealized gain on
investment transactions | | | .69 | | | | .05 | | | | .18 | † |
Contributions from Affiliates | | | – 0 | – | | | .00 | (d) | | | .00 | (d) |
| | | | |
Net increase in net asset value from operations | | | .93 | | | | .33 | | | | .37 | |
| | | | |
Less: Dividends and Distributions | | | | | | | | | | | | |
Dividends from net investment income | | | (.22 | ) | | | (.14 | ) | | | (.25 | ) |
Distributions from net realized gain on investment transactions | | | (.05 | ) | | | (.01 | ) | | | – 0 | – |
| | | | |
Total dividends and distributions | | | (.27 | ) | | | (.15 | ) | | | (.25 | ) |
| | | | |
Net asset value, end of period | | | $ 10.96 | | | | $ 10.30 | | | | $ 10.12 | |
| | | | |
Total Return | | | | | | | | | | | | |
Total investment return based on net asset value(e) | | | 9.29 | % | | | 3.34 | % | | | 3.76 | % |
Ratios/Supplemental Data | | | | | | | | | | | | |
Net assets, end of period (000’s omitted) | | | $2,182 | | | | $2,376 | | | | $975 | |
Ratio to average net assets of: | | | | | | | | | | | | |
Expenses, net of waivers/reimbursements(f) | | | .19 | % | | | .20 | % | | | .21 | %^ |
Expenses, before waivers/reimbursements(f) | | | .59 | % | | | .80 | % | | | 24.45 | %^ |
Net investment income(c)(f) | | | 2.33 | % | | | 2.89 | % | | | 2.98 | %^ |
Portfolio turnover rate | | | 46 | % | | | 81 | % | | | 100 | % |
See footnote summary on page 233.
| | |
| abfunds.com | | AB MULTI-MANAGER SELECT RETIREMENT FUNDS | 183 |
FINANCIAL HIGHLIGHTS (continued)
Selected Data For A Share Of Capital Stock Outstanding Throughout Each Period
| | | | | | | | | | | | |
| | | AB Multi-Manager Select 2020 Fund | |
| | | Class Z | |
| | | Year Ended July 31, | | | December 15,
2014(a) to
July 31, 2015 | |
| | | 2017 | | | 2016 | | |
| | | | |
| | | | | | | | | | | | |
Net asset value, beginning of period | | | $ 10.30 | | | | $ 10.12 | | | | $ 10.00 | |
| | | | |
Income From Investment Operations | | | | | | | | | | | | |
Net investment income(b)(c) | | | .24 | | | | .24 | | | | .19 | |
Net realized and unrealized gain on
investment transactions | | | .69 | | | | .09 | | | | .18 | † |
Contributions from Affiliates | | | – 0 | – | | | .00 | (d) | | | .00 | (d) |
| | | | |
Net increase in net asset value from operations | | | .93 | | | | .33 | | | | .37 | |
| | | | |
Less: Dividends and Distributions | | | | | | | | | | | | |
Dividends from net investment income | | | (.23 | ) | | | (.14 | ) | | | (.25 | ) |
Distributions from net realized gain on investment transactions | | | (.05 | ) | | | (.01 | ) | | | – 0 | – |
| | | | |
Total dividends and distributions | | | (.28 | ) | | | (.15 | ) | | | (.25 | ) |
| | | | |
Net asset value, end of period | | | $ 10.95 | | | | $ 10.30 | | | | $ 10.12 | |
| | | | |
Total Return | | | | | | | | | | | | |
Total investment return based on net asset value(e) | | | 9.27 | % | | | 3.32 | % | | | 3.76 | % |
Ratios/Supplemental Data | | | | | | | | | | | | |
Net assets, end of period (000’s omitted) | | | $11 | | | | $11 | | | | $10 | |
Ratio to average net assets of: | | | | | | | | | | | | |
Expenses, net of waivers/reimbursements(f) | | | .19 | % | | | .20 | % | | | .21 | %^ |
Expenses, before waivers/reimbursements(f) | | | .49 | % | | | .97 | % | | | 24.49 | %^ |
Net investment income(c)(f) | | | 2.32 | % | | | 2.42 | % | | | 2.99 | %^ |
Portfolio turnover rate | | | 46 | % | | | 81 | % | | | 100 | % |
See footnote summary on page 233.
| | |
| 184 | AB MULTI-MANAGER SELECT RETIREMENT FUNDS | | abfunds.com |
FINANCIAL HIGHLIGHTS (continued)
Selected Data For A Share Of Capital Stock Outstanding Throughout Each Period
| | | | | | | | | | | | |
| | | AB Multi-Manager Select 2025 Fund | |
| | | Class A | |
| | | Year Ended July 31, | | | December 15,
2014(a) to July 31, 2015 | |
| | | 2017 | | | 2016 | | |
| | | | |
| | | | | | | | | | | | |
Net asset value, beginning of period | | | $ 10.45 | | | | $ 10.33 | | | | $ 10.00 | |
| | | | |
Income From Investment Operations | | | | | | | | | | | | |
Net investment income(b)(c) | | | .19 | | | | .24 | | | | .11 | |
Net realized and unrealized gain on
investment transactions | | | .91 | | | | .03 | | | | .33 | † |
Contributions from Affiliates | | | – 0 | – | | | .00 | (d) | | | .00 | (d) |
| | | | |
Net increase in net asset value from operations | | | 1.10 | | | | .27 | | | | .44 | |
| | | | |
Less: Dividends and Distributions | | | | | | | | | | | | |
Dividends from net investment income | | | (.15 | ) | | | (.15 | ) | | | (.11 | ) |
Distributions from net realized gain on investment transactions | | | (.08 | ) | | | (.00 | )(d) | | | – 0 | – |
| | | | |
Total dividends and distributions | | | (.23 | ) | | | (.15 | ) | | | (.11 | ) |
| | | | |
Net asset value, end of period | | | $ 11.32 | | | | $ 10.45 | | | | $ 10.33 | |
| | | | |
Total Return | | | | | | | | | | | | |
Total investment return based on net asset value(e) | | | 10.74 | % | | | 2.65 | % | | | 4.43 | % |
Ratios/Supplemental Data | | | | | | | | | | | | |
Net assets, end of period (000’s omitted) | | | $4,804 | | | | $8,857 | | | | $174 | |
Ratio to average net assets of: | | | | | | | | | | | | |
Expenses, net of waivers/reimbursements(f) | | | .43 | % | | | .44 | % | | | .45 | %^ |
Expenses, before waivers/reimbursements(f) | | | .75 | % | | | .83 | % | | | 13.53 | %^ |
Net investment income(c)(f) | | | 1.77 | % | | | 2.39 | % | | | 1.73 | %^ |
Portfolio turnover rate | | | 41 | % | | | 75 | % | | | 22 | % |
See footnote summary on page 233.
| | |
| abfunds.com | | AB MULTI-MANAGER SELECT RETIREMENT FUNDS | 185 |
FINANCIAL HIGHLIGHTS (continued)
Selected Data For A Share Of Capital Stock Outstanding Throughout Each Period
| | | | | | | | | | | | |
| | | AB Multi-Manager Select 2025 Fund | |
| | | Class C | |
| | | Year Ended July 31, | | | December 15,
2014(a) to
July 31, 2015 | |
| | | 2017 | | | 2016 | | |
| | | | |
| | | | | | | | | | | | |
Net asset value, beginning of period | | | $ 10.38 | | | | $ 10.29 | | | | $ 10.00 | |
| | | | |
Income From Investment Operations | | | | | | | | | | | | |
Net investment income(b)(c) | | | .15 | | | | .14 | | | | .05 | |
Net realized and unrealized gain on
investment transactions | | | .86 | | | | .06 | | | | .35 | † |
Contributions from Affiliates | | | – 0 | – | | | .00 | (d) | | | .00 | (d) |
| | | | |
Net increase in net asset value from operations | | | 1.01 | | | | .20 | | | | .40 | |
| | | | |
Less: Dividends and Distributions | | | | | | | | | | | | |
Dividends from net investment income | | | (.12 | ) | | | (.11 | ) | | | (.11 | ) |
Distributions from net realized gain on investment transactions | | | (.08 | ) | | | (.00 | )(d) | | | – 0 | – |
| | | | |
Total dividends and distributions | | | (.20 | ) | | | (.11 | ) | | | (.11 | ) |
| | | | |
Net asset value, end of period | | | $ 11.19 | | | | $ 10.38 | | | | $ 10.29 | |
| | | | |
Total Return | | | | | | | | | | | | |
Total investment return based on net asset value(e) | | | 9.87 | % | | | 1.97 | % | | | 3.99 | % |
Ratios/Supplemental Data | | | | | | | | | | | | |
Net assets, end of period (000’s omitted) | | | $629 | | | | $818 | | | | $138 | |
Ratio to average net assets of: | | | | | | | | | | | | |
Expenses, net of waivers/reimbursements(f) | | | 1.18 | % | | | 1.19 | % | | | 1.20 | %^ |
Expenses, before waivers/reimbursements(f) | | | 1.53 | % | | | 1.68 | % | | | 15.69 | %^ |
Net investment income(c)(f) | | | 1.40 | % | | | 1.38 | % | | | .72 | %^ |
Portfolio turnover rate | | | 41 | % | | | 75 | % | | | 22 | % |
See footnote summary on page 233.
| | |
| 186 | AB MULTI-MANAGER SELECT RETIREMENT FUNDS | | abfunds.com |
FINANCIAL HIGHLIGHTS (continued)
Selected Data For A Share Of Capital Stock Outstanding Throughout Each Period
| | | | | | | | | | | | |
| | | AB Multi-Manager Select 2025 Fund | |
| | | Advisor Class | |
| | | Year Ended July 31, | | | December 15,
2014(a) to
July 31, 2015 | |
| | | 2017 | | | 2016 | | |
| | | | |
| | | | | | | | | | | | |
Net asset value, beginning of period | | | $ 10.51 | | | | $ 10.35 | | | | $ 10.00 | |
| | | | |
Income From Investment Operations | | | | | | | | | | | | |
Net investment income(b)(c) | | | .25 | | | | .25 | | | | .11 | |
Net realized and unrealized gain on
investment transactions | | | .87 | | | | .05 | | | | .35 | † |
Contributions from Affiliates | | | – 0 | – | | | .00 | (d) | | | .00 | (d) |
| | | | |
Net increase in net asset value from operations | | | 1.12 | | | | .30 | | | | .46 | |
| | | | |
Less: Dividends and Distributions | | | | | | | | | | | | |
Dividends from net investment income | | | (.21 | ) | | | (.14 | ) | | | (.11 | ) |
Distributions from net realized gain on investment transactions | | | (.08 | ) | | | (.00 | )(d) | | | – 0 | – |
| | | | |
Total dividends and distributions | | | (.29 | ) | | | (.14 | ) | | | (.11 | ) |
| | | | |
Net asset value, end of period | | | $ 11.34 | | | | $ 10.51 | | | | $ 10.35 | |
| | | | |
Total Return | | | | | | | | | | | | |
Total investment return based on net asset value(e) | | | 10.95 | % | | | 2.97 | % | | | 4.65 | % |
Ratios/Supplemental Data | | | | | | | | | | | | |
Net assets, end of period (000’s omitted) | | | $861 | | | | $708 | | | | $534 | |
Ratio to average net assets of: | | | | | | | | | | | | |
Expenses, net of waivers/reimbursements(f) | | | .18 | % | | | .19 | % | | | .20 | %^ |
Expenses, before waivers/reimbursements(f) | | | .52 | % | | | .79 | % | | | 13.26 | %^ |
Net investment income(c)(f) | | | 2.32 | % | | | 2.51 | % | | | 1.71 | %^ |
Portfolio turnover rate | | | 41 | % | | | 75 | % | | | 22 | % |
See footnote summary on page 233.
| | |
| abfunds.com | | AB MULTI-MANAGER SELECT RETIREMENT FUNDS | 187 |
FINANCIAL HIGHLIGHTS (continued)
Selected Data For A Share Of Capital Stock Outstanding Throughout Each Period
| | | | | | | | | | | | |
| | | AB Multi-Manager Select 2025 Fund | |
| | | Class R | |
| | | Year Ended July 31, | | | December 15,
2014(a) to
July 31, 2015 | |
| | | 2017 | | | 2016 | | |
| | | | |
| | | | | | | | | | | | |
Net asset value, beginning of period | | | $ 10.24 | | | | $ 10.14 | | | | $ 10.00 | |
| | | | |
Income From Investment Operations | | | | | | | | | | | | |
Net investment income(b)(c) | | | .19 | | | | .20 | | | | .12 | |
Net realized and unrealized gain on
investment transactions | | | .85 | | | | .04 | | | | .31 | † |
Contributions from Affiliates | | | – 0 | – | | | .00 | (d) | | | .00 | (d) |
| | | | |
Net increase in net asset value from operations | | | 1.04 | | | | .24 | | | | .43 | |
| | | | |
Less: Dividends and Distributions | | | | | | | | | | | | |
Dividends from net investment income | | | (.15 | ) | | | (.14 | ) | | | (.29 | ) |
Distributions from net realized gain on investment transactions | | | (.08 | ) | | | (.00 | )(d) | | | – 0 | – |
| | | | |
Total dividends and distributions | | | (.23 | ) | | | (.14 | ) | | | (.29 | ) |
| | | | |
Net asset value, end of period | | | $ 11.05 | | | | $ 10.24 | | | | $ 10.14 | |
| | | | |
Total Return | | | | | | | | | | | | |
Total investment return based on net asset value(e) | | | 10.35 | % | | | 2.44 | % | | | 4.28 | % |
Ratios/Supplemental Data | | | | | | | | | | | | |
Net assets, end of period (000’s omitted) | | | $2,852 | | | | $2,802 | | | | $482 | |
Ratio to average net assets of: | | | | | | | | | | | | |
Expenses, net of waivers/reimbursements(f) | | | .68 | % | | | .69 | % | | | .70 | %^ |
Expenses, before waivers/reimbursements(f) | | | 1.03 | % | | | 1.01 | % | | | 7.14 | %^ |
Net investment income(c)(f) | | | 1.84 | % | | | 2.10 | % | | | 1.98 | %^ |
Portfolio turnover rate | | | 41 | % | | | 75 | % | | | 22 | % |
See footnote summary on page 233.
| | |
| 188 | AB MULTI-MANAGER SELECT RETIREMENT FUNDS | | abfunds.com |
FINANCIAL HIGHLIGHTS (continued)
Selected Data For A Share Of Capital Stock Outstanding Throughout Each Period
| | | | | | | | | | | | |
| | | AB Multi-Manager Select 2025 Fund | |
| | | Class K | |
| | | Year Ended July 31, | | | December 15,
2014(a) to
July 31, 2015 | |
| | | 2017 | | | 2016 | | |
| | | | |
| | | | | | | | | | | | |
Net asset value, beginning of period | | | $ 10.28 | | | | $ 10.16 | | | | $ 10.00 | |
| | | | |
Income From Investment Operations | | | | | | | | | | | | |
Net investment income(b)(c) | | | .21 | | | | .22 | | | | .09 | |
Net realized and unrealized gain on
investment transactions | | | .86 | | | | .05 | | | | .36 | † |
Contributions from Affiliates | | | – 0 | – | | | .00 | (d) | | | .00 | (d) |
| | | | |
Net increase in net asset value from operations | | | 1.07 | | | | .27 | | | | .45 | |
| | | | |
Less: Dividends and Distributions | | | | | | | | | | | | |
Dividends from net investment income | | | (.18 | ) | | | (.15 | ) | | | (.29 | ) |
Distributions from net realized gain on investment transactions | | | (.08 | ) | | | (.00 | )(d) | | | – 0 | – |
| | | | |
Total dividends and distributions | | | (.26 | ) | | | (.15 | ) | | | (.29 | ) |
| | | | |
Net asset value, end of period | | | $ 11.09 | | | | $ 10.28 | | | | $ 10.16 | |
| | | | |
Total Return | | | | | | | | | | | | |
Total investment return based on net asset value(e) | | | 10.66 | % | | | 2.71 | % | | | 4.50 | % |
Ratios/Supplemental Data | | | | | | | | | | | | |
Net assets, end of period (000’s omitted) | | | $120,243 | | | | $106,535 | | | | $10,497 | |
Ratio to average net assets of: | | | | | | | | | | | | |
Expenses, net of waivers/reimbursements(f) | | | .43 | % | | | .44 | % | | | .45 | %^ |
Expenses, before waivers/reimbursements(f) | | | .81 | % | | | .92 | % | | | 5.97 | %^ |
Net investment income(c)(f) | | | 2.04 | % | | | 2.26 | % | | | 1.46 | %^ |
Portfolio turnover rate | | | 41 | % | | | 75 | % | | | 22 | % |
See footnote summary on page 233.
| | |
| abfunds.com | | AB MULTI-MANAGER SELECT RETIREMENT FUNDS | 189 |
FINANCIAL HIGHLIGHTS (continued)
Selected Data For A Share Of Capital Stock Outstanding Throughout Each Period
| | | | | | | | | | | | |
| | | AB Multi-Manager Select 2025 Fund | |
| | | Class I | |
| | | Year Ended July 31, | | | December 15,
2014(a) to
July 31, 2015 | |
| | | 2017 | | | 2016 | | |
| | | | |
| | | | | | | | | | | | |
Net asset value, beginning of period | | | $ 10.31 | | | | $ 10.17 | | | | $ 10.00 | |
| | | | |
Income From Investment Operations | | | | | | | | | | | | |
Net investment income(b)(c) | | | .24 | | | | .27 | | | | .19 | |
Net realized and unrealized gain on
investment transactions | | | .86 | | | | .02 | | | | .27 | † |
Contributions from Affiliates | | | – 0 | – | | | .00 | (d) | | | .00 | (d) |
| | | | |
Net increase in net asset value from operations | | | 1.10 | | | | .29 | | | | .46 | |
| | | | |
Less: Dividends and Distributions | | | | | | | | | | | | |
Dividends from net investment income | | | (.21 | ) | | | (.15 | ) | | | (.29 | ) |
Distributions from net realized gain on investment transactions | | | (.08 | ) | | | (.00 | )(d) | | | – 0 | – |
| | | | |
Total dividends and distributions | | | (.29 | ) | | | (.15 | ) | | | (.29 | ) |
| | | | |
Net asset value, end of period | | | $ 11.12 | | | | $ 10.31 | | | | $ 10.17 | |
| | | | |
Total Return | | | | | | | | | | | | |
Total investment return based on net asset value(e) | | | 10.98 | % | | | 2.96 | % | | | 4.62 | % |
Ratios/Supplemental Data | | | | | | | | | | | | |
Net assets, end of period (000’s omitted) | | | $3,217 | | | | $2,421 | | | | $984 | |
Ratio to average net assets of: | | | | | | | | | | | | |
Expenses, net of waivers/reimbursements(f) | | | .18 | % | | | .19 | % | | | .20 | %^ |
Expenses, before waivers/reimbursements(f) | | | .49 | % | | | .65 | % | | | 22.66 | %^ |
Net investment income(c)(f) | | | 2.25 | % | | | 2.77 | % | | | 3.04 | %^ |
Portfolio turnover rate | | | 41 | % | | | 75 | % | | | 22 | % |
See footnote summary on page 233.
| | |
| 190 | AB MULTI-MANAGER SELECT RETIREMENT FUNDS | | abfunds.com |
FINANCIAL HIGHLIGHTS (continued)
Selected Data For A Share Of Capital Stock Outstanding Throughout Each Period
| | | | | | | | | | | | |
| | | AB Multi-Manager Select 2025 Fund | |
| | | Class Z | |
| | | Year Ended July 31, | | | December 15,
2014(a) to
July 31, 2015 | |
| | | 2017 | | | 2016 | | |
| | | | |
| | | | | | | | | | | | |
Net asset value, beginning of period | | | $ 10.31 | | | | $ 10.17 | | | | $ 10.00 | |
| | | | |
Income From Investment Operations | | | | | | | | | | | | |
Net investment income(b)(c) | | | .27 | | | | .23 | | | | .19 | |
Net realized and unrealized gain on
investment transactions | | | .83 | | | | .06 | | | | .27 | † |
Contributions from Affiliates | | | – 0 | – | | | .00 | (d) | | | .00 | (d) |
| | | | |
Net increase in net asset value from operations | | | 1.10 | | | | .29 | | | | .46 | |
| | | | |
Less: Dividends and Distributions | | | | | | | | | | | | |
Dividends from net investment income | | | (.22 | ) | | | (.15 | ) | | | (.29 | ) |
Distributions from net realized gain on investment transactions | | | (.08 | ) | | | (.00 | )(d) | | | – 0 | – |
| | | | |
Total dividends and distributions | | | (.30 | ) | | | (.15 | ) | | | (.29 | ) |
| | | | |
Net asset value, end of period | | | $ 11.11 | | | | $ 10.31 | | | | $ 10.17 | |
| | | | |
Total Return | | | | | | | | | | | | |
Total investment return based on net asset value(e) | | | 10.97 | % | | | 2.95 | % | | | 4.62 | % |
Ratios/Supplemental Data | | | | | | | | | | | | |
Net assets, end of period (000’s omitted) | | | $38 | | | | $11 | | | | $10 | |
Ratio to average net assets of: | | | | | | | | | | | | |
Expenses, net of waivers/reimbursements(f) | | | .18 | % | | | .19 | % | | | .20 | %^ |
Expenses, before waivers/reimbursements(f) | | | .41 | % | | | .78 | % | | | 22.69 | %^ |
Net investment income(c)(f) | | | 2.53 | % | | | 2.32 | % | | | 3.04 | %^ |
Portfolio turnover rate | | | 41 | % | | | 75 | % | | | 22 | % |
See footnote summary on page 233.
| | |
| abfunds.com | | AB MULTI-MANAGER SELECT RETIREMENT FUNDS | 191 |
FINANCIAL HIGHLIGHTS (continued)
Selected Data For A Share Of Capital Stock Outstanding Throughout Each Period
| | | | | | | | | | | | |
| | | AB Multi-Manager Select 2030 Fund | |
| | | Class A | |
| | | Year Ended July 31, | | | December 15,
2014(a) to
July 31, 2015 | |
| | | 2017 | | | 2016 | | |
| | | | |
| | | | | | | | | | | | |
Net asset value, beginning of period | | | $ 10.50 | | | | $ 10.39 | | | | $ 10.00 | |
| | | | |
Income From Investment Operations | | | | | | | | | | | | |
Net investment income(b)(c) | | | .19 | | | | .21 | | | | .08 | |
Net realized and unrealized gain on
investment transactions | | | 1.11 | | | | .04 | | | | .47 | |
Contributions from Affiliates | | | – 0 | – | | | .00 | (d) | | | .00 | (d) |
| | | | |
Net increase in net asset value from operations | | | 1.30 | | | | .25 | | | | .55 | |
| | | | |
Less: Dividends and Distributions | | | | | | | | | | | | |
Dividends from net investment income | | | (.15 | ) | | | (.13 | ) | | | (.16 | ) |
Distributions from net realized gain on investment transactions | | | (.09 | ) | | | (.01 | ) | | | – 0 | – |
| | | | |
Total dividends and distributions | | | (.24 | ) | | | (.14 | ) | | | (.16 | ) |
| | | | |
Net asset value, end of period | | | $ 11.56 | | | | $ 10.50 | | | | $ 10.39 | |
| | | | |
Total Return | | | | | | | | | | | | |
Total investment return based on net asset value(e) | | | 12.65 | % | | | 2.52 | % | | | 5.49 | % |
Ratios/Supplemental Data | | | | | | | | | | | | |
Net assets, end of period (000’s omitted) | | | $5,956 | | | | $8,554 | | | | $317 | |
Ratio to average net assets of: | | | | | | | | | | | | |
Expenses, net of waivers/reimbursements(f) | | | .48 | % | | | .48 | % | | | .49 | %^ |
Expenses, before waivers/reimbursements(f) | | | .83 | % | | | .97 | % | | | 18.85 | %^ |
Net investment income(c)(f) | | | 1.75 | % | | | 2.14 | % | | | 1.18 | %^ |
Portfolio turnover rate | | | 48 | % | | | 72 | % | | | 35 | % |
See footnote summary on page 233.
| | |
| 192 | AB MULTI-MANAGER SELECT RETIREMENT FUNDS | | abfunds.com |
FINANCIAL HIGHLIGHTS (continued)
Selected Data For A Share Of Capital Stock Outstanding Throughout Each Period
| | | | | | | | | | | | |
| | | AB Multi-Manager Select 2030 Fund | |
| | | Class C | |
| | | Year Ended July 31, | | | December 15,
2014(a) to
July 31, 2015 | |
| | | 2017 | | | 2016 | | |
| | | | |
| | | | | | | | | | | | |
Net asset value, beginning of period | | | $ 10.42 | | | | $ 10.35 | | | | $ 10.00 | |
| | | | |
Income From Investment Operations | | | | | | | | | | | | |
Net investment income(b)(c) | | | .13 | | | | .12 | | | | .12 | |
Net realized and unrealized gain on
investment transactions | | | 1.08 | | | | .07 | | | | .38 | |
Contributions from Affiliates | | | – 0 | – | | | .00 | (d) | | | .00 | (d) |
| | | | |
Net increase in net asset value from operations | | | 1.21 | | | | .19 | | | | .50 | |
| | | | |
Less: Dividends and Distributions | | | | | | | | | | | | |
Dividends from net investment income | | | (.11 | ) | | | (.11 | ) | | | (.15 | ) |
Distributions from net realized gain on investment transactions | | | (.09 | ) | | | (.01 | ) | | | – 0 | – |
| | | | |
Total dividends and distributions | | | (.20 | ) | | | (.12 | ) | | | (.15 | ) |
| | | | |
Net asset value, end of period | | | $ 11.43 | | | | $ 10.42 | | | | $ 10.35 | |
| | | | |
Total Return | | | | | | | | | | | | |
Total investment return based on net asset value(e) | | | 11.86 | % | | | 1.86 | % | | | 5.04 | % |
Ratios/Supplemental Data | | | | | | | | | | | | |
Net assets, end of period (000’s omitted) | | | $951 | | | | $911 | | | | $20 | |
Ratio to average net assets of: | | | | | | | | | | | | |
Expenses, net of waivers/reimbursements(f) | | | 1.23 | % | | | 1.23 | % | | | 1.24 | %^ |
Expenses, before waivers/reimbursements(f) | | | 1.59 | % | | | 1.83 | % | | | 25.83 | %^ |
Net investment income(c)(f) | | | 1.20 | % | | | 1.17 | % | | | 1.88 | %^ |
Portfolio turnover rate | | | 48 | % | | | 72 | % | | | 35 | % |
See footnote summary on page 233.
| | |
| abfunds.com | | AB MULTI-MANAGER SELECT RETIREMENT FUNDS | 193 |
FINANCIAL HIGHLIGHTS (continued)
Selected Data For A Share Of Capital Stock Outstanding Throughout Each Period
| | | | | | | | | | | | |
| | | AB Multi-Manager Select 2030 Fund | |
| | | Advisor Class | |
| | | Year Ended July 31, | | | December 15,
2014(a) to
July 31, 2015 | |
| | | 2017 | | | 2016 | | |
| | | | |
| | | | | | | | | | | | |
Net asset value, beginning of period | | | $ 10.55 | | | | $ 10.41 | | | | $ 10.00 | |
| | | | |
Income From Investment Operations | | | | | | | | | | | | |
Net investment income(b)(c) | | | .24 | | | | .25 | | | | .12 | |
Net realized and unrealized gain on
investment transactions | | | 1.09 | | | | .04 | | | | .45 | |
Contributions from Affiliates | | | – 0 | – | | | .00 | (d) | | | .00 | (d) |
| | | | |
Net increase in net asset value from operations | | | 1.33 | | | | .29 | | | | .57 | |
| | | | |
Less: Dividends and Distributions | | | | | | | | | | | | |
Dividends from net investment income | | | (.20 | ) | | | (.14 | ) | | | (.16 | ) |
Distributions from net realized gain on investment transactions | | | (.09 | ) | | | (.01 | ) | | | – 0 | – |
| | | | |
Total dividends and distributions | | | (.29 | ) | | | (.15 | ) | | | (.16 | ) |
| | | | |
Net asset value, end of period | | | $ 11.59 | | | | $ 10.55 | | | | $ 10.41 | |
| | | | |
Total Return | | | | | | | | | | | | |
Total investment return based on net asset value(e) | | | 12.95 | % | | | 2.82 | % | | | 5.71 | % |
Ratios/Supplemental Data | | | | | | | | | | | | |
Net assets, end of period (000’s omitted) | | | $924 | | | | $702 | | | | $50 | |
Ratio to average net assets of: | | | | | | | | | | | | |
Expenses, net of waivers/reimbursements(f) | | | .23 | % | | | .23 | % | | | .24 | %^ |
Expenses, before waivers/reimbursements(f) | | | .58 | % | | | .70 | % | | | 18.70 | %^ |
Net investment income(c)(f) | | | 2.25 | % | | | 2.54 | % | | | 1.82 | %^ |
Portfolio turnover rate | | | 48 | % | | | 72 | % | | | 35 | % |
See footnote summary on page 233.
| | |
| 194 | AB MULTI-MANAGER SELECT RETIREMENT FUNDS | | abfunds.com |
FINANCIAL HIGHLIGHTS (continued)
Selected Data For A Share Of Capital Stock Outstanding Throughout Each Period
| | | | | | | | | | | | |
| | | AB Multi-Manager Select 2030 Fund | |
| | | Class R | |
| | | Year Ended July 31, | | | December 15,
2014(a) to
July 31,
2015 | |
| | | 2017 | | | 2016 | | |
| | | | |
| | | | | | | | | | | | |
Net asset value, beginning of period | | | $ 10.29 | | | | $ 10.20 | | | | $ 10.00 | |
| | | | |
Income From Investment Operations | | | | | | | | | | | | |
Net investment income(b)(c) | | | .20 | | | | .18 | | | | .10 | |
Net realized and unrealized gain on
investment transactions | | | 1.04 | | | | .05 | | | | .43 | |
Contributions from Affiliates | | | – 0 | – | | | .00 | (d) | | | .00 | (d) |
| | | | |
Net increase in net asset value from operations | | | 1.24 | | | | .23 | | | | .53 | |
| | | | |
Less: Dividends and Distributions | | | | | | | | | | | | |
Dividends from net investment income | | | (.13 | ) | | | (.13 | ) | | | (.33 | ) |
Distributions from net realized gain on investment transactions | | | (.09 | ) | | | (.01 | ) | | | – 0 | – |
| | | | |
Total dividends and distributions | | | (.22 | ) | | | (.14 | ) | | | (.33 | ) |
| | | | |
Net asset value, end of period | | | $ 11.31 | | | | $ 10.29 | | | | $ 10.20 | |
| | | | |
Total Return | | | | | | | | | | | | |
Total investment return based on net asset value(e) | | | 12.29 | % | | | 2.32 | % | | | 5.35 | % |
Ratios/Supplemental Data | | | | | | | | | | | | |
Net assets, end of period (000’s omitted) | | | $1,300 | | | | $1,866 | | | | $380 | |
Ratio to average net assets of: | | | | | | | | | | | | |
Expenses, net of waivers/reimbursements(f) | | | .73 | % | | | .73 | % | | | .74 | %^ |
Expenses, before waivers/reimbursements(f) | | | 1.15 | % | | | 1.40 | % | | | 8.24 | %^ |
Net investment income(c)(f) | | | 1.89 | % | | | 1.89 | % | | | 1.70 | %^ |
Portfolio turnover rate | | | 48 | % | | | 72 | % | | | 35 | % |
See footnote summary on page 233.
| | |
| abfunds.com | | AB MULTI-MANAGER SELECT RETIREMENT FUNDS | 195 |
FINANCIAL HIGHLIGHTS (continued)
Selected Data For A Share Of Capital Stock Outstanding Throughout Each Period
| | | | | | | | | | | | |
| | | AB Multi-Manager Select 2030 Fund | |
| | | Class K | |
| | | Year Ended July 31, | | | December 15,
2014(a) to
July 31,
2015 | |
| | | 2017 | | | 2016 | | |
| | | | |
| | | | | | | | | | | | |
Net asset value, beginning of period | | | $ 10.32 | | | | $ 10.21 | | | | $ 10.00 | |
| | | | |
Income From Investment Operations | | | | | | | | | | | | |
Net investment income(b)(c) | | | .21 | | | | .20 | | | | .08 | |
Net realized and unrealized gain on
investment transactions | | | 1.06 | | | | .06 | | | | .46 | |
Contributions from Affiliates | | | – 0 | – | | | .00 | (d) | | | .00 | (d) |
| | | | |
Net increase in net asset value from operations | | | 1.27 | | | | .26 | | | | .54 | |
| | | | |
Less: Dividends and Distributions | | | | | | | | | | | | |
Dividends from net investment income | | | (.17 | ) | | | (.14 | ) | | | (.33 | ) |
Distributions from net realized gain on investment transactions | | | (.09 | ) | | | (.01 | ) | | | – 0 | – |
| | | | |
Total dividends and distributions | | | (.26 | ) | | | (.15 | ) | | | (.33 | ) |
| | | | |
Net asset value, end of period | | | $ 11.33 | | | | $ 10.32 | | | | $ 10.21 | |
| | | | |
Total Return | | | | | | | | | | | | |
Total investment return based on net asset value(e) | | | 12.61 | % | | | 2.60 | % | | | 5.47 | % |
Ratios/Supplemental Data | | | | | | | | | | | | |
Net assets, end of period (000’s omitted) | | | $88,325 | | | | $70,952 | | | | $7,785 | |
Ratio to average net assets of: | | | | | | | | | | | | |
Expenses, net of waivers/reimbursements(f) | | | .48 | % | | | .48 | % | | | .49 | %^ |
Expenses, before waivers/reimbursements(f) | | | .89 | % | | | 1.06 | % | | | 7.09 | %^ |
Net investment income(c)(f) | | | 1.94 | % | | | 2.08 | % | | | 1.28 | %^ |
Portfolio turnover rate | | | 48 | % | | | 72 | % | | | 35 | % |
See footnote summary on page 233.
| | |
| 196 | AB MULTI-MANAGER SELECT RETIREMENT FUNDS | | abfunds.com |
FINANCIAL HIGHLIGHTS (continued)
Selected Data For A Share Of Capital Stock Outstanding Throughout Each Period
| | | | | | | | | | | | |
| | | AB Multi-Manager Select 2030 Fund | |
| | | Class I | |
| | | Year Ended July 31, | | | December 15,
2014(a) to
July 31,
2015 | |
| | | 2017 | | | 2016 | | |
| | | | |
| | | | | | | | | | | | |
Net asset value, beginning of period | | | $ 10.35 | | | | $ 10.23 | | | | $ 10.00 | |
| | | | |
Income From Investment Operations | | | | | | | | | | | | |
Net investment income(b)(c) | | | .24 | | | | .24 | | | | .18 | |
Net realized and unrealized gain on
investment transactions | | | 1.07 | | | | .03 | | | | .38 | |
Contributions from Affiliates | | | – 0 | – | | | .00 | (d) | | | .00 | (d) |
| | | | |
Net increase in net asset value from operations | | | 1.31 | | | | .27 | | | | .56 | |
| | | | |
Less: Dividends and Distributions | | | | | | | | | | | | |
Dividends from net investment income | | | (.21 | ) | | | (.14 | ) | | | (.33 | ) |
Distributions from net realized gain on investment transactions | | | (.09 | ) | | | (.01 | ) | | | – 0 | – |
| | | | |
Total dividends and distributions | | | (.30 | ) | | | (.15 | ) | | | (.33 | ) |
| | | | |
Net asset value, end of period | | | $ 11.36 | | | | $ 10.35 | | | | $ 10.23 | |
| | | | |
Total Return | | | | | | | | | | | | |
Total investment return based on net asset value(e) | | | 12.94 | % | | | 2.75 | % | | | 5.69 | % |
Ratios/Supplemental Data | | | | | | | | | | | | |
Net assets, end of period (000’s omitted) | | | $4,288 | | | | $2,682 | | | | $994 | |
Ratio to average net assets of: | | | | | | | | | | | | |
Expenses, net of waivers/reimbursements(f) | | | .23 | % | | | .23 | % | | | .24 | %^ |
Expenses, before waivers/reimbursements(f) | | | .57 | % | | | .80 | % | | | 22.26 | %^ |
Net investment income(c)(f) | | | 2.26 | % | | | 2.42 | % | | | 2.90 | %^ |
Portfolio turnover rate | | | 48 | % | | | 72 | % | | | 35 | % |
See footnote summary on page 233.
| | |
| abfunds.com | | AB MULTI-MANAGER SELECT RETIREMENT FUNDS | 197 |
FINANCIAL HIGHLIGHTS (continued)
Selected Data For A Share Of Capital Stock Outstanding Throughout Each Period
| | | | | | | | | | | | |
| | | AB Multi-Manager Select 2030 Fund | |
| | | Class Z | |
| | | Year Ended July 31, | | | December 15,
2014(a) to
July 31,
2015 | |
| | | 2017 | | | 2016 | | |
| | | | |
| | | | | | | | | | | | |
Net asset value, beginning of period | | | $ 10.35 | | | | $ 10.23 | | | | $ 10.00 | |
| | | | |
Income From Investment Operations | | | | | | | | | | | | |
Net investment income(b)(c) | | | .23 | | | | .21 | | | | .18 | |
Net realized and unrealized gain on
investment transactions | | | 1.08 | | | | .06 | | | | .38 | |
Contributions from Affiliates | | | – 0 | – | | | .00 | (d) | | | .00 | (d) |
| | | | |
Net increase in net asset value from operations | | | 1.31 | | | | .27 | | | | .56 | |
| | | | |
Less: Dividends and Distributions | | | | | | | | | | | | |
Dividends from net investment income | | | (.21 | ) | | | (.14 | ) | | | (.33 | ) |
Distributions from net realized gain on investment transactions | | | (.09 | ) | | | (.01 | ) | | | – 0 | – |
| | | | |
Total dividends and distributions | | | (.30 | ) | | | (.15 | ) | | | (.33 | ) |
| | | | |
Net asset value, end of period | | | $ 11.36 | | | | $ 10.35 | | | | $ 10.23 | |
| | | | |
Total Return | | | | | | | | | | | | |
Total investment return based on net asset value(e) | | | 12.99 | % | | | 2.74 | % | | | 5.69 | % |
Ratios/Supplemental Data | | | | | | | | | | | | |
Net assets, end of period (000’s omitted) | | | $17 | | | | $11 | | | | $11 | |
Ratio to average net assets of: | | | | | | | | | | | | |
Expenses, net of waivers/reimbursements(f) | | | .23 | % | | | .23 | % | | | .24 | %^ |
Expenses, before waivers/reimbursements(f) | | | .48 | % | | | .95 | % | | | 22.28 | %^ |
Net investment income(c)(f) | | | 2.19 | % | | | 2.11 | % | | | 2.88 | %^ |
Portfolio turnover rate | | | 48 | % | | | 72 | % | | | 35 | % |
See footnote summary on page 233.
| | |
| 198 | AB MULTI-MANAGER SELECT RETIREMENT FUNDS | | abfunds.com |
FINANCIAL HIGHLIGHTS (continued)
Selected Data For A Share Of Capital Stock Outstanding Throughout Each Period
| | | | | | | | | | | | |
| | | AB Multi-Manager Select 2035 Fund | |
| | | Class A | |
| | | Year Ended July 31, | | | December 15,
2014(a) to
July 31,
2015 | |
| | | 2017 | | | 2016 | | |
| | | | |
| | | | | | | | | | | | |
Net asset value, beginning of period | | | $ 10.47 | | | | $ 10.44 | | | | $ 10.00 | |
| | | | |
Income From Investment Operations | | | | | | | | | | | | |
Net investment income(b)(c) | | | .17 | | | | .18 | | | | .07 | |
Net realized and unrealized gain on
investment transactions | | | 1.31 | | | | .00 | (d) | | | .56 | |
Contributions from Affiliates | | | – 0 | – | | | .00 | (d) | | | .00 | (d) |
| | | | |
Net increase in net asset value from operations | | | 1.48 | | | | .18 | | | | .63 | |
| | | | |
Less: Dividends and Distributions | | | | | | | | | | | | |
Dividends from net investment income | | | (.11 | ) | | | (.15 | ) | | | (.19 | ) |
Distributions from net realized gain on investment transactions | | | (.08 | ) | | | (.00 | )(d) | | | – 0 | – |
| | | | |
Total dividends and distributions | | | (.19 | ) | | | (.15 | ) | | | (.19 | ) |
| | | | |
Net asset value, end of period | | | $ 11.76 | | | | $ 10.47 | | | | $ 10.44 | |
| | | | |
Total Return | | | | | | | | | | | | |
Total investment return based on net asset value(e) | | | 14.39 | % | | | 1.79 | % | | | 6.34 | % |
Ratios/Supplemental Data | | | | | | | | | | | | |
Net assets, end of period (000’s omitted) | | | $4,670 | | | | $7,259 | | | | $288 | |
Ratio to average net assets of: | | | | | | | | | | | | |
Expenses, net of waivers/reimbursements(f) | | | .48 | % | | | .49 | % | | | .49 | %^ |
Expenses, before waivers/reimbursements(f) | | | .91 | % | | | 1.13 | % | | | 14.64 | %^ |
Net investment income(c)(f) | | | 1.56 | % | | | 1.79 | % | | | 1.09 | %^ |
Portfolio turnover rate | | | 38 | % | | | 74 | % | | | 17 | % |
See footnote summary on page 233.
| | |
| abfunds.com | | AB MULTI-MANAGER SELECT RETIREMENT FUNDS | 199 |
FINANCIAL HIGHLIGHTS (continued)
Selected Data For A Share Of Capital Stock Outstanding Throughout Each Period
| | | | | | | | | | | | |
| | | AB Multi-Manager Select 2035 Fund | |
| | | Class C | |
| | | Year Ended July 31, | | | December 15,
2014(a) to
July 31,
2015 | |
| | | 2017 | | | 2016 | | |
| | | | |
| | | | | | | | | | | | |
Net asset value, beginning of period | | | $ 10.38 | | | | $ 10.40 | | | | $ 10.00 | |
| | | | |
Income From Investment Operations | | | | | | | | | | | | |
Net investment income(b)(c) | | | .13 | | | | .08 | | | | .05 | |
Net realized and unrealized gain on
investment transactions | | | 1.25 | | | | .02 | | | | .54 | |
Contributions from Affiliates | | | – 0 | – | | | .00 | (d) | | | .00 | (d) |
| | | | |
Net increase in net asset value from operations | | | 1.38 | | | | .10 | | | | .59 | |
| | | | |
Less: Dividends and Distributions | | | | | | | | | | | | |
Dividends from net investment income | | | (.08 | ) | | | (.12 | ) | | | (.19 | ) |
Distributions from net realized gain on investment transactions | | | (.08 | ) | | | (.00 | )(d) | | | – 0 | – |
| | | | |
Total dividends and distributions | | | (.16 | ) | | | (.12 | ) | | | (.19 | ) |
| | | | |
Net asset value, end of period | | | $ 11.60 | | | | $ 10.38 | | | | $ 10.40 | |
| | | | |
Total Return | | | | | | | | | | | | |
Total investment return based on net asset value(e) | | | 13.53 | % | | | .98 | % | | | 5.90 | % |
Ratios/Supplemental Data | | | | | | | | | | | | |
Net assets, end of period (000’s omitted) | | | $604 | | | | $959 | | | | $65 | |
Ratio to average net assets of: | | | | | | | | | | | | |
Expenses, net of waivers/reimbursements(f) | | | 1.23 | % | | | 1.24 | % | | | 1.24 | %^ |
Expenses, before waivers/reimbursements(f) | | | 1.68 | % | | | 2.00 | % | | | 19.46 | %^ |
Net investment income(c)(f) | | | 1.22 | % | | | .84 | % | | | .76 | %^ |
Portfolio turnover rate | | | 38 | % | | | 74 | % | | | 17 | % |
See footnote summary on page 233.
| | |
| 200 | AB MULTI-MANAGER SELECT RETIREMENT FUNDS | | abfunds.com |
FINANCIAL HIGHLIGHTS (continued)
Selected Data For A Share Of Capital Stock Outstanding Throughout Each Period
| | | | | | | | | | | | |
| | | AB Multi-Manager Select 2035 Fund | |
| | | Advisor Class | |
| | | Year Ended July 31, | | | December 15,
2014(a) to
July 31,
2015 | |
| | | 2017 | | | 2016 | | |
| | | | |
| | | | | | | | | | | | |
Net asset value, beginning of period | | | $ 10.55 | | | | $ 10.45 | | | | $ 10.00 | |
| | | | |
Income From Investment Operations | | | | | | | | | | | | |
Net investment income(b)(c) | | | .23 | | | | .20 | | | | .07 | |
Net realized and unrealized gain on
investment transactions | | | 1.28 | | | | .02 | | | | .57 | |
Contributions from Affiliates | | | – 0 | – | | | .00 | (d) | | | .00 | (d) |
| | | | |
Net increase in net asset value from operations | | | 1.51 | | | | .22 | | | | .64 | |
| | | | |
Less: Dividends and Distributions | | | | | | | | | | | | |
Dividends from net investment income | | | (.18 | ) | | | (.12 | ) | | | (.19 | ) |
Distributions from net realized gain on investment transactions | | | (.08 | ) | | | (.00 | )(d) | | | – 0 | – |
| | | | |
Total dividends and distributions | | | (.26 | ) | | | (.12 | ) | | | (.19 | ) |
| | | | |
Net asset value, end of period | | | $ 11.80 | | | | $ 10.55 | | | | $ 10.45 | |
| | | | |
Total Return | | | | | | | | | | | | |
Total investment return based on net asset value(e) | | | 14.59 | % | | | 2.12 | % | | | 6.46 | % |
Ratios/Supplemental Data | | | | | | | | | | | | |
Net assets, end of period (000’s omitted) | | | $535 | | | | $450 | | | | $171 | |
Ratio to average net assets of: | | | | | | | | | | | | |
Expenses, net of waivers/reimbursements(f) | | | .23 | % | | | .24 | % | | | .24 | %^ |
Expenses, before waivers/reimbursements(f) | | | .67 | % | | | .99 | % | | | 21.13 | %^ |
Net investment income(c)(f) | | | 2.07 | % | | | 2.03 | % | | | 1.16 | %^ |
Portfolio turnover rate | | | 38 | % | | | 74 | % | | | 17 | % |
See footnote summary on page 233.
| | |
| abfunds.com | | AB MULTI-MANAGER SELECT RETIREMENT FUNDS | 201 |
FINANCIAL HIGHLIGHTS (continued)
Selected Data For A Share Of Capital Stock Outstanding Throughout Each Period
| | | | | | | | | | | | |
| | | AB Multi-Manager Select 2035 Fund | |
| | | Class R | |
| | | Year Ended July 31, | | | December 15,
2014(a) to
July 31,
2015 | |
| | | 2017 | | | 2016 | | |
| | | | |
| | | | | | | | | | | | |
Net asset value, beginning of period | | | $ 10.25 | | | | $ 10.25 | | | | $ 10.00 | |
| | | | |
Income From Investment Operations | | | | | | | | | | | | |
Net investment income(b)(c) | | | .17 | | | | .15 | | | | .10 | |
Net realized and unrealized gain on
investment transactions | | | 1.25 | | | | .00 | (d) | | | .51 | |
Contributions from Affiliates | | | – 0 | – | | | .00 | (d) | | | .00 | (d) |
| | | | |
Net increase in net asset value from operations | | | 1.42 | | | | .15 | | | | .61 | |
| | | | |
Less: Dividends and Distributions | | | | | | | | | | | | |
Dividends from net investment income | | | (.12 | ) | | | (.15 | ) | | | (.36 | ) |
Distributions from net realized gain on investment transactions | | | (.08 | ) | | | (.00 | )(d) | | | – 0 | – |
| | | | |
Total dividends and distributions | | | (.20 | ) | | | (.15 | ) | | | (.36 | ) |
| | | | |
Net asset value, end of period | | | $ 11.47 | | | | $ 10.25 | | | | $ 10.25 | |
| | | | |
Total Return | | | | | | | | | | | | |
Total investment return based on net asset value(e) | | | 14.07 | % | | | 1.49 | % | | | 6.22 | % |
Ratios/Supplemental Data | | | | | | | | | | | | |
Net assets, end of period (000’s omitted) | | | $1,709 | | | | $1,396 | | | | $216 | |
Ratio to average net assets of: | | | | | | | | | | | | |
Expenses, net of waivers/reimbursements(f) | | | .73 | % | | | .74 | % | | | .74 | %^�� |
Expenses, before waivers/reimbursements(f) | | | 1.12 | % | | | 1.46 | % | | | 9.15 | %^ |
Net investment income(c)(f) | | | 1.60 | % | | | 1.57 | % | | | 1.62 | %^ |
Portfolio turnover rate | | | 38 | % | | | 74 | % | | | 17 | % |
See footnote summary on page 233.
| | |
| 202 | AB MULTI-MANAGER SELECT RETIREMENT FUNDS | | abfunds.com |
FINANCIAL HIGHLIGHTS (continued)
Selected Data For A Share Of Capital Stock Outstanding Throughout Each Period
| | | | | | | | | | | | |
| | | AB Multi-Manager Select 2035 Fund | |
| | | Class K | |
| | | Year Ended July 31, | | | December 15,
2014(a) to
July 31,
2015 | |
| | | 2017 | | | 2016 | | |
| | | | |
| | | | | | | | | | | | |
Net asset value, beginning of period | | | $ 10.29 | | | | $ 10.26 | | | | $ 10.00 | |
| | | | |
Income From Investment Operations | | | | | | | | | | | | |
Net investment income(b)(c) | | | .19 | | | | .17 | | | | .07 | |
Net realized and unrealized gain on
investment transactions | | | 1.26 | | | | .01 | | | | .56 | |
Contributions from Affiliates | | | – 0 | – | | | .00 | (d) | | | .00 | (d) |
| | | | |
Net increase in net asset value from operations | | | 1.45 | | | | .18 | | | | .63 | |
| | | | |
Less: Dividends and Distributions | | | | | | | | | | | | |
Dividends from net investment income | | | (.15 | ) | | | (.15 | ) | | | (.37 | ) |
Distributions from net realized gain on investment transactions | | | (.08 | ) | | | (.00 | )(d) | | | – 0 | – |
| | | | |
Total dividends and distributions | | | (.23 | ) | | | (.15 | ) | | | (.37 | ) |
| | | | |
Net asset value, end of period | | | $ 11.51 | | | | $ 10.29 | | | | $ 10.26 | |
| | | | |
Total Return | | | | | | | | | | | | |
Total investment return based on net asset value(e) | | | 14.34 | % | | | 1.85 | % | | | 6.34 | % |
Ratios/Supplemental Data | | | | | | | | | | | | |
Net assets, end of period (000’s omitted) | | | $79,677 | | | | $58,198 | | | | $6,768 | |
Ratio to average net assets of: | | | | | | | | | | | | |
Expenses, net of waivers/reimbursements(f) | | | .48 | % | | | .49 | % | | | .49 | %^ |
Expenses, before waivers/reimbursements(f) | | | .93 | % | | | 1.17 | % | | | 6.39 | %^ |
Net investment income(c)(f) | | | 1.77 | % | | | 1.72 | % | | | 1.16 | %^ |
Portfolio turnover rate | | | 38 | % | | | 74 | % | | | 17 | % |
See footnote summary on page 233.
| | |
| abfunds.com | | AB MULTI-MANAGER SELECT RETIREMENT FUNDS | 203 |
FINANCIAL HIGHLIGHTS (continued)
Selected Data For A Share Of Capital Stock Outstanding Throughout Each Period
| | | | | | | | | | | | |
| | | AB Multi-Manager Select 2035 Fund | |
| | | Class I | |
| | | Year Ended July 31, | | | December 15,
2014(a) to
July 31, 2015 | |
| | | 2017 | | | 2016 | | |
| | | | |
| | | | | | | | | | | | |
Net asset value, beginning of period | | | $ 10.32 | | | | $ 10.28 | | | | $ 10.00 | |
| | | | |
Income From Investment Operations | | | | | | | | | | | | |
Net investment income(b)(c) | | | .23 | | | | .20 | | | | .17 | |
Net realized and unrealized gain on
investment transactions | | | 1.25 | | | | .00 | (d) | | | .48 | |
Contributions from Affiliates | | | – 0 | – | | | .00 | (d) | | | .00 | (d) |
| | | | |
Net increase in net asset value from operations | | | 1.48 | | | | .20 | | | | .65 | |
| | | | |
Less: Dividends and Distributions | | | | | | | | | | | | |
Dividends from net investment income | | | (.18 | ) | | | (.16 | ) | | | (.37 | ) |
Distributions from net realized gain on investment transactions | | | (.08 | ) | | | (.00 | )(d) | | | – 0 | – |
| | | | |
Total dividends and distributions | | | (.26 | ) | | | (.16 | ) | | | (.37 | ) |
| | | | |
Net asset value, end of period | | | $ 11.54 | | | | $ 10.32 | | | | $ 10.28 | |
| | | | |
Total Return | | | | | | | | | | | | |
Total investment return based on net asset value(e) | | | 14.64 | % | | | 2.01 | % | | | 6.56 | % |
Ratios/Supplemental Data | | | | | | | | | | | | |
Net assets, end of period (000’s omitted) | | | $4,280 | | | | $3,084 | | | | $1,001 | |
Ratio to average net assets of: | | | | | | | | | | | | |
Expenses, net of waivers/reimbursements(f) | | | .23 | % | | | .24 | % | | | .24 | %^ |
Expenses, before waivers/reimbursements(f) | | | .62 | % | | | .91 | % | | | 22.51 | %^ |
Net investment income(c)(f) | | | 2.14 | % | | | 2.10 | % | | | 2.65 | %^ |
Portfolio turnover rate | | | 38 | % | | | 74 | % | | | 17 | % |
See footnote summary on page 233.
| | |
| 204 | AB MULTI-MANAGER SELECT RETIREMENT FUNDS | | abfunds.com |
FINANCIAL HIGHLIGHTS (continued)
Selected Data For A Share Of Capital Stock Outstanding Throughout Each Period
| | | | | | | | | | | | |
| | | AB Multi-Manager Select 2035 Fund | |
| | | Class Z | |
| | | Year Ended July 31, | | | December 15,
2014(a) to July 31, 2015 | |
| | | 2017 | | | 2016 | | |
| | | | |
| | | | | | | | | | | | |
Net asset value, beginning of period | | | $ 10.32 | | | | $ 10.28 | | | | $ 10.00 | |
| | | | |
Income From Investment Operations | | | | | | | | | | | | |
Net investment income(b)(c) | | | .22 | | | | .17 | | | | .17 | |
Net realized and unrealized gain on
investment transactions | | | 1.26 | | | | .03 | | | | .48 | |
Contributions from Affiliates | | | – 0 | – | | | .00 | (d) | | | .00 | (d) |
| | | | |
Net increase in net asset value from operations | | | 1.48 | | | | .20 | | | | .65 | |
| | | | |
Less: Dividends and Distributions | | | | | | | | | | | | |
Dividends from net investment income | | | (.19 | ) | | | (.16 | ) | | | (.37 | ) |
Distributions from net realized gain on investment transactions | | | (.08 | ) | | | (.00 | )(d) | | | – 0 | – |
| | | | |
Total dividends and distributions | | | (.27 | ) | | | (.16 | ) | | | (.37 | ) |
| | | | |
Net asset value, end of period | | | $ 11.53 | | | | $ 10.32 | | | | $ 10.28 | |
| | | | |
Total Return | | | | | | | | | | | | |
Total investment return based on net asset value(e) | | | 14.62 | % | | | 2.00 | % | | | 6.56 | % |
Ratios/Supplemental Data | | | | | | | | | | | | |
Net assets, end of period (000’s omitted) | | | $24 | | | | $11 | | | | $12 | |
Ratio to average net assets of: | | | | | | | | | | | | |
Expenses, net of waivers/reimbursements(f) | | | .23 | % | | | .24 | % | | | .24 | %^ |
Expenses, before waivers/reimbursements(f) | | | .52 | % | | | 1.16 | % | | | 22.53 | %^ |
Net investment income(c)(f) | | | 2.06 | % | | | 1.77 | % | | | 2.64 | %^ |
Portfolio turnover rate | | | 38 | % | | | 74 | % | | | 17 | % |
See footnote summary on page 233.
| | |
| abfunds.com | | AB MULTI-MANAGER SELECT RETIREMENT FUNDS | 205 |
FINANCIAL HIGHLIGHTS (continued)
Selected Data For A Share Of Capital Stock Outstanding Throughout Each Period
| | | | | | | | | | | | |
| | | AB Multi-Manager Select 2040 Fund | |
| | | Class A | |
| | | Year Ended July 31, | | | December 15,
2014(a) to
July 31, 2015 | |
| | | 2017 | | | 2016 | | |
| | | | |
| | | | | | | | | | | | |
Net asset value, beginning of period | | | $ 10.40 | | | | $ 10.42 | | | | $ 10.00 | |
| | | | |
Income From Investment Operations | | | | | | | | | | | | |
Net investment income(b)(c) | | | .13 | | | | .14 | | | | .11 | |
Net realized and unrealized gain (loss) on
investment transactions | | | 1.43 | | | | (.01 | )† | | | .58 | |
Contributions from Affiliates | | | – 0 | – | | | .00 | (d) | | | .00 | (d) |
| | | | |
Net increase in net asset value from operations | | | 1.56 | | | | .13 | | | | .69 | |
| | | | |
Less: Dividends and Distributions | | | | | | | | | | | | |
Dividends from net investment income | | | (.08 | ) | | | (.15 | ) | | | (.27 | ) |
Distributions from net realized gain on investment transactions | | | (.08 | ) | | | (.00 | )(d) | | | – 0 | – |
| | | | |
Total dividends and distributions | | | (.16 | ) | | | (.15 | ) | | | (.27 | ) |
| | | | |
Net asset value, end of period | | | $ 11.80 | | | | $ 10.40 | | | | $ 10.42 | |
| | | | |
Total Return | | | | | | | | | | | | |
Total investment return based on net asset value(e) | | | 15.22 | % | | | 1.28 | % | | | 6.92 | % |
Ratios/Supplemental Data | | | | | | | | | | | | |
Net assets, end of period (000’s omitted) | | | $4,051 | | | | $6,816 | | | | $77 | |
Ratio to average net assets of: | | | | | | | | | | | | |
Expenses, net of waivers/reimbursements(f) | | | .52 | % | | | .52 | % | | | .53 | %^ |
Expenses, before waivers/reimbursements(f) | | | 1.03 | % | | | 1.18 | % | | | 23.89 | %^ |
Net investment income(c)(f) | | | 1.17 | % | | | 1.45 | % | | | 1.69 | %^ |
Portfolio turnover rate | | | 46 | % | | | 69 | % | | | 16 | % |
See footnote summary on page 233.
| | |
| 206 | AB MULTI-MANAGER SELECT RETIREMENT FUNDS | | abfunds.com |
FINANCIAL HIGHLIGHTS (continued)
Selected Data For A Share Of Capital Stock Outstanding Throughout Each Period
| | | | | | | | | | | | |
| | | AB Multi-Manager Select 2040 Fund | |
| | | Class C | |
| | | Year Ended July 31, | | | December 15,
2014(a) to
July 31, 2015 | |
| | | 2017 | | | 2016 | | |
| | | | |
| | | | | | | | | | | | |
Net asset value, beginning of period | | | $ 10.33 | | | | $ 10.39 | | | | $ 10.00 | |
| | | | |
Income From Investment Operations | | | | | | | | | | | | |
Net investment income(b)(c) | | | .10 | | | | .03 | | | | .09 | |
Net realized and unrealized gain on
investment transactions | | | 1.37 | | | | .01 | | | | .56 | |
Contributions from Affiliates | | | – 0 | – | | | .00 | (d) | | | .00 | (d) |
| | | | |
Net increase in net asset value from operations | | | 1.47 | | | | .04 | | | | .65 | |
| | | | |
Less: Dividends and Distributions | | | | | | | | | | | | |
Dividends from net investment income | | | (.07 | ) | | | (.10 | ) | | | (.26 | ) |
Distributions from net realized gain on investment transactions | | | (.08 | ) | | | (.00 | )(d) | | | – 0 | – |
| | | | |
Total dividends and distributions | | | (.15 | ) | | | (.10 | ) | | | (.26 | ) |
| | | | |
Net asset value, end of period | | | $ 11.65 | | | | $ 10.33 | | | | $ 10.39 | |
| | | | |
Total Return | | | | | | | | | | | | |
Total investment return based on net asset value(e) | | | 14.43 | % | | | .44 | % | | | 6.57 | % |
Ratios/Supplemental Data | | | | | | | | | | | | |
Net assets, end of period (000’s omitted) | | | $398 | | | | $844 | | | | $26 | |
Ratio to average net assets of: | | | | | | | | | | | | |
Expenses, net of waivers/reimbursements(f) | | | 1.27 | % | | | 1.27 | % | | | 1.28 | %^ |
Expenses, before waivers/reimbursements(f) | | | 1.81 | % | | | 2.03 | % | | | 30.19 | %^ |
Net investment income(c)(f) | | | .95 | % | | | .35 | % | | | 1.35 | %^ |
Portfolio turnover rate | | | 46 | % | | | 69 | % | | | 16 | % |
See footnote summary on page 233.
| | |
| abfunds.com | | AB MULTI-MANAGER SELECT RETIREMENT FUNDS | 207 |
FINANCIAL HIGHLIGHTS (continued)
Selected Data For A Share Of Capital Stock Outstanding Throughout Each Period
| | | | | | | | | | | | |
| | | AB Multi-Manager Select 2040 Fund | |
| | | Advisor Class | |
| | | Year Ended July 31, | | | December 15,
2014(a) to
July 31, 2015 | |
| | | 2017 | | | 2016 | | |
| | | | |
| | | | | | | | | | | | |
| | | | | | | | | | | | |
Net asset value, beginning of period | | | $ 10.49 | | | | $ 10.45 | | | | $ 10.00 | |
| | | | |
Income From Investment Operations | | | | | | | | | | | | |
Net investment income(b)(c) | | | .20 | | | | .16 | | | | .15 | |
Net realized and unrealized gain (loss) on
investment transactions | | | 1.40 | | | | (.02 | )† | | | .57 | |
Contributions from Affiliates | | | – 0 | – | | | .00 | (d) | | | .00 | (d) |
| | | | |
Net increase in net asset value from operations | | | 1.60 | | | | .14 | | | | .72 | |
| | | | |
Less: Dividends and Distributions | | | | | | | | | | | | |
Dividends from net investment income | | | (.16 | ) | | | (.10 | ) | | | (.27 | ) |
Distributions from net realized gain on investment transactions | | | (.08 | ) | | | (.00 | )(d) | | | – 0 | – |
| | | | |
Total dividends and distributions | | | (.24 | ) | | | (.10 | ) | | | (.27 | ) |
| | | | |
Net asset value, end of period | | | $ 11.85 | | | | $ 10.49 | | | | $ 10.45 | |
| | | | |
Total Return | | | | | | | | | | | | |
Total investment return based on net asset value(e) | | | 15.54 | % | | | 1.40 | % | | | 7.24 | % |
Ratios/Supplemental Data | | | | | | | | | | | | |
Net assets, end of period (000’s omitted) | | | $459 | | | | $268 | | | | $15 | |
Ratio to average net assets of: | | | | | | | | | | | | |
Expenses, net of waivers/reimbursements(f) | | | .27 | % | | | .27 | % | | | .28 | %^ |
Expenses, before waivers/reimbursements(f) | | | .81 | % | | | .89 | % | | | 29.08 | %^ |
Net investment income(c)(f) | | | 1.80 | % | | | 1.58 | % | | | 2.33 | %^ |
Portfolio turnover rate | | | 46 | % | | | 69 | % | | | 16 | % |
See footnote summary on page 233.
| | |
| 208 | AB MULTI-MANAGER SELECT RETIREMENT FUNDS | | abfunds.com |
FINANCIAL HIGHLIGHTS (continued)
Selected Data For A Share Of Capital Stock Outstanding Throughout Each Period
| | | | | | | | | | | | |
| | | AB Multi-Manager Select 2040 Fund | |
| | | Class R | |
| | | Year Ended July 31, | | | December 15,
2014(a) to
July 31, 2015 | |
| | | 2017 | | | 2016 | | |
| | | | |
| | | | | | | | | | | | |
| | | | | | | | | | | | |
Net asset value, beginning of period | | | $ 10.18 | | | | $ 10.24 | | | | $ 10.00 | |
| | | | |
Income From Investment Operations | | | | | | | | | | | | |
Net investment income(b)(c) | | | .14 | | | | .13 | | | | .11 | |
Net realized and unrealized gain (loss) on
investment transactions | | | 1.36 | | | | (.04 | )† | | | .57 | |
Contributions from Affiliates | | | – 0 | – | | | .00 | (d) | | | .00 | (d) |
| | | | |
Net increase in net asset value from operations | | | 1.50 | | | | .09 | | | | .68 | |
| | | | |
Less: Dividends and Distributions | | | | | | | | | | | | |
Dividends from net investment income | | | (.11 | ) | | | (.15 | ) | | | (.44 | ) |
Distributions from net realized gain on investment transactions | | | (.08 | ) | | | (.00 | )(d) | | | – 0 | – |
| | | | |
Total dividends and distributions | | | (.19 | ) | | | (.15 | ) | | | (.44 | ) |
| | | | |
Net asset value, end of period | | | $ 11.49 | | | | $ 10.18 | | | | $ 10.24 | |
| | | | |
Total Return | | | | | | | | | | | | |
Total investment return based on net asset value(e) | | | 14.92 | % | | | .92 | % | | | 6.91 | % |
Ratios/Supplemental Data | | | | | | | | | | | | |
Net assets, end of period (000’s omitted) | | | $1,508 | | | | $1,224 | | | | $36 | |
Ratio to average net assets of: | | | | | | | | | | | | |
Expenses, net of waivers/reimbursements(f) | | | .77 | % | | | .77 | % | | | .78 | %^ |
Expenses, before waivers/reimbursements(f) | | | 1.28 | % | | | 1.45 | % | | | 14.63 | %^ |
Net investment income(c)(f) | | | 1.29 | % | | | 1.33 | % | | | 1.71 | %^ |
Portfolio turnover rate | | | 46 | % | | | 69 | % | | | 16 | % |
See footnote summary on page 233.
| | |
| abfunds.com | | AB MULTI-MANAGER SELECT RETIREMENT FUNDS | 209 |
FINANCIAL HIGHLIGHTS (continued)
Selected Data For A Share Of Capital Stock Outstanding Throughout Each Period
| | | | | | | | | | | | |
| | | AB Multi-Manager Select 2040 Fund | |
| | | Class K | |
| | | Year Ended July 31, | | | December 15,
2014(a) to
July 31, 2015 | |
| | | 2017 | | | 2016 | | |
| | | | |
| | | | | | | | | | | | |
Net asset value, beginning of period | | | $ 10.22 | | | | $ 10.25 | | | | $ 10.00 | |
| | | | |
Income From Investment Operations | | | | | | | | | | | | |
Net investment income(b)(c) | | | .17 | | | | .13 | | | | .06 | |
Net realized and unrealized gain (loss) on
investment transactions | | | 1.37 | | | | (.01 | )† | | | .63 | |
Contributions from Affiliates | | | – 0 | – | | | .00 | (d) | | | .00 | (d) |
| | | | |
Net increase in net asset value from operations | | | 1.54 | | | | .12 | | | | .69 | |
| | | | |
Less: Dividends and Distributions | | | | | | | | | | | | |
Dividends from net investment income | | | (.13 | ) | | | (.15 | ) | | | (.44 | ) |
Distributions from net realized gain on investment transactions | | | (.08 | ) | | | (.00 | )(d) | | | – 0 | – |
| | | | |
Total dividends and distributions | | | (.21 | ) | | | (.15 | ) | | | (.44 | ) |
| | | | |
Net asset value, end of period | | | $ 11.55 | | | | $ 10.22 | | | | $ 10.25 | |
| | | | |
Total Return | | | | | | | | | | | | |
Total investment return based on net asset value(e) | | | 15.30 | % | | | 1.23 | % | | | 7.03 | % |
Ratios/Supplemental Data | | | | | | | | | | | | |
Net assets, end of period (000’s omitted) | | | $53,902 | | | | $46,834 | | | | $8,623 | |
Ratio to average net assets of: | | | | | | | | | | | | |
Expenses, net of waivers/reimbursements(f) | | | .52 | % | | | .52 | % | | | .53 | %^ |
Expenses, before waivers/reimbursements(f) | | | 1.06 | % | | | 1.30 | % | | | 5.69 | %^ |
Net investment income(c)(f) | | | 1.56 | % | | | 1.38 | % | | | 1.03 | %^ |
Portfolio turnover rate | | | 46 | % | | | 69 | % | | | 16 | % |
See footnote summary on page 233.
| | |
| 210 | AB MULTI-MANAGER SELECT RETIREMENT FUNDS | | abfunds.com |
FINANCIAL HIGHLIGHTS (continued)
Selected Data For A Share Of Capital Stock Outstanding Throughout Each Period
| | | | | | | | | | | | |
| | | AB Multi-Manager Select 2040 Fund | |
| | | Class I | |
| | | Year Ended July 31, | | | December 15,
2014(a) to
July 31, 2015 | |
| | | 2017 | | | 2016 | | |
| | | | |
| | | | | | | | | | | | |
Net asset value, beginning of period | | | $ 10.25 | | | | $ 10.27 | | | | $ 10.00 | |
| | | | |
Income From Investment Operations | | | | | | | | | | | | |
Net investment income(b)(c) | | | .19 | | | | .19 | | | | .15 | |
Net realized and unrealized gain (loss) on
investment transactions | | | 1.37 | | | | (.05 | )† | | | .56 | |
Contributions from Affiliates | | | – 0 | – | | | .00 | (d) | | | .00 | (d) |
| | | | |
Net increase in net asset value from operations | | | 1.56 | | | | .14 | | | | .71 | |
| | | | |
Less: Dividends and Distributions | | | | | | | | | | | | |
Dividends from net investment income | | | (.16 | ) | | | (.16 | ) | | | (.44 | ) |
Distributions from net realized gain on investment transactions | | | (.08 | ) | | | (.00 | )(d) | | | – 0 | – |
| | | | |
Total dividends and distributions | | | (.24 | ) | | | (.16 | ) | | | (.44 | ) |
| | | | |
Net asset value, end of period | | | $ 11.57 | | | | $ 10.25 | | | | $ 10.27 | |
| | | | |
Total Return | | | | | | | | | | | | |
Total investment return based on net asset value(e) | | | 15.52 | % | | | 1.40 | % | | | 7.25 | % |
Ratios/Supplemental Data | | | | | | | | | | | | |
Net assets, end of period (000’s omitted) | | | $3,644 | | | | $2,140 | | | | $1,008 | |
Ratio to average net assets of: | | | | | | | | | | | | |
Expenses, net of waivers/reimbursements(f) | | | .27 | % | | | .27 | % | | | .28 | %^ |
Expenses, before waivers/reimbursements(f) | | | .73 | % | | | 1.11 | % | | | 18.71 | %^ |
Net investment income(c)(f) | | | 1.75 | % | | | 2.00 | % | | | 2.44 | %^ |
Portfolio turnover rate | | | 46 | % | | | 69 | % | | | 16 | % |
See footnote summary on page 233.
| | |
| abfunds.com | | AB MULTI-MANAGER SELECT RETIREMENT FUNDS | 211 |
FINANCIAL HIGHLIGHTS (continued)
Selected Data For A Share Of Capital Stock Outstanding Throughout Each Period
| | | | | | | | | | | | |
| | | AB Multi-Manager Select 2040 Fund | |
| | | Class Z | |
| | | Year Ended July 31, | | | December 15,
2014(a) to
July 31, 2015 | |
| | | 2017 | | | 2016 | | |
| | | | |
| | | | | | | | | | | | |
Net asset value, beginning of period | | | $ 10.25 | | | | $ 10.27 | | | | $ 10.00 | |
| | | | |
Income From Investment Operations | | | | | | | | | | | | |
Net investment income(b)(c) | | | .19 | | | | .14 | | | | .04 | |
Net realized and unrealized gain on
investment transactions | | | 1.38 | | | | .00 | (d) | | | .67 | |
Contributions from Affiliates | | | – 0 | – | | | .00 | (d) | | | .00 | (d) |
| | | | |
Net increase in net asset value from operations | | | 1.57 | | | | .14 | | | | .71 | |
| | | | |
Less: Dividends and Distributions | | | | | | | | | | | | |
Dividends from net investment income | | | (.17 | ) | | | (.16 | ) | | | (.44 | ) |
Distributions from net realized gain on investment transactions | | | (.08 | ) | | | (.00 | )(d) | | | – 0 | – |
| | | | |
Total dividends and distributions | | | (.25 | ) | | | (.16 | ) | | | (.44 | ) |
| | | | |
Net asset value, end of period | | | $ 11.57 | | | | $ 10.25 | | | | $ 10.27 | |
| | | | |
Total Return | | | | | | | | | | | | |
Total investment return based on net asset value(e) | | | 15.59 | % | | | 1.38 | % | | | 7.25 | % |
Ratios/Supplemental Data | | | | | | | | | | | | |
Net assets, end of period (000’s omitted) | | | $600 | | | | $519 | | | | $522 | |
Ratio to average net assets of: | | | | | | | | | | | | |
Expenses, net of waivers/reimbursements(f) | | | .27 | % | | | .27 | % | | | .28 | %^ |
Expenses, before waivers/reimbursements(f) | | | .64 | % | | | 1.29 | % | | | 16.54 | %^ |
Net investment income(c)(f) | | | 1.79 | % | | | 1.46 | % | | | .68 | %^ |
Portfolio turnover rate | | | 46 | % | | | 69 | % | | | 16 | % |
See footnote summary on page 233.
| | |
| 212 | AB MULTI-MANAGER SELECT RETIREMENT FUNDS | | abfunds.com |
FINANCIAL HIGHLIGHTS (continued)
Selected Data For A Share Of Capital Stock Outstanding Throughout Each Period
| | | | | | | | | | | | |
| | | AB Multi-Manager Select 2045 Fund | |
| | | Class A | |
| | | Year Ended July 31, | | | December 15,
2014(a) to
July 31, 2015 | |
| | | 2017 | | | 2016 | | |
| | | | |
| | | | | | | | | | | | |
Net asset value, beginning of period | | | $ 10.43 | | | | $ 10.51 | | | | $ 10.00 | |
| | | | |
Income From Investment Operations | | | | | | | | | | | | |
Net investment income(b)(c) | | | .13 | | | | .15 | | | | .12 | |
Net realized and unrealized gain (loss) on
investment transactions | | | 1.49 | | | | (.08 | )† | | | .60 | |
Contributions from Affiliates | | | – 0 | – | | | .00 | (d) | | | .00 | (d) |
| | | | |
Net increase in net asset value from operations | | | 1.62 | | | | .07 | | | | .72 | |
| | | | |
Less: Dividends and Distributions | | | | | | | | | | | | |
Dividends from net investment income | | | (.07 | ) | | | (.14 | ) | | | (.21 | ) |
Distributions from net realized gain on investment transactions | | | (.06 | ) | | | (.01 | ) | | | – 0 | – |
| | | | |
Total dividends and distributions | | | (.13 | ) | | | (.15 | ) | | | (.21 | ) |
| | | | |
Net asset value, end of period | | | $ 11.92 | | | | $ 10.43 | | | | $ 10.51 | |
| | | | |
Total Return | | | | | | | | | | | | |
Total investment return based on net asset value(e) | | | 15.71 | % | | | .76 | % | | | 7.21 | % |
Ratios/Supplemental Data | | | | | | | | | | | | |
Net assets, end of period (000’s omitted) | | | $3,016 | | | | $5,107 | | | | $111 | |
Ratio to average net assets of: | | | | | | | | | | | | |
Expenses, net of waivers/reimbursements(f) | | | .50 | % | | | .52 | % | | | .54 | %^ |
Expenses, before waivers/reimbursements(f) | | | 1.26 | % | | | 1.50 | % | | | 28.43 | %^ |
Net investment income(c)(f) | | | 1.19 | % | | | 1.48 | % | | | 1.96 | %^ |
Portfolio turnover rate | | | 39 | % | | | 67 | % | | | 14 | % |
See footnote summary on page 233.
| | |
| abfunds.com | | AB MULTI-MANAGER SELECT RETIREMENT FUNDS | 213 |
FINANCIAL HIGHLIGHTS (continued)
Selected Data For A Share Of Capital Stock Outstanding Throughout Each Period
| | | | | | | | | | | | |
| | | AB Multi-Manager Select 2045 Fund | |
| | | Class C | |
| | | Year Ended July 31, | | | December 15,
2014(a) to
July 31, 2015 | |
| | | 2017 | | | 2016 | | |
| | | | |
| | | | | | | | | | | | |
Net asset value, beginning of period | | | $ 10.43 | | | | $ 10.47 | | | | $ 10.00 | |
| | | | |
Income From Investment Operations | | | | | | | | | | | | |
Net investment income(b)(c) | | | .09 | | | | .04 | | | | .01 | |
Net realized and unrealized gain (loss) on
investment transactions | | | 1.45 | | | | (.05 | )† | | | .66 | |
Contributions from Affiliates | | | – 0 | – | | | .00 | (d) | | | .00 | (d) |
| | | | |
Net increase (decrease) in net asset value from operations | | | 1.54 | | | | (.01 | ) | | | .67 | |
| | | | |
Less: Dividends and Distributions | | | | | | | | | | | | |
Dividends from net investment income | | | (.04 | ) | | | (.02 | ) | | | (.20 | ) |
Distributions from net realized gain on investment transactions | | | (.06 | ) | | | (.01 | ) | | | – 0 | – |
| | | | |
Total dividends and distributions | | | (.10 | ) | | | (.03 | ) | | | (.20 | ) |
| | | | |
Net asset value, end of period | | | $ 11.87 | | | | $ 10.43 | | | | $ 10.47 | |
| | | | |
Total Return | | | | | | | | | | | | |
Total investment return based on net asset value(e) | | | 14.91 | % | | | (.05 | )% | | | 6.76 | % |
Ratios/Supplemental Data | | | | | | | | | | | | |
Net assets, end of period (000’s omitted) | | | $275 | | | | $289 | | | | $84 | |
Ratio to average net assets of: | | | | | | | | | | | | |
Expenses, net of waivers/reimbursements(f) | | | 1.25 | % | | | 1.27 | % | | | 1.29 | %^ |
Expenses, before waivers/reimbursements(f) | | | 2.04 | % | | | 2.74 | % | | | 27.00 | %^ |
Net investment income(c)(f) | | | .81 | % | | | .45 | % | | | .14 | %^ |
Portfolio turnover rate | | | 39 | % | | | 67 | % | | | 14 | % |
See footnote summary on page 233.
| | |
| 214 | AB MULTI-MANAGER SELECT RETIREMENT FUNDS | | abfunds.com |
FINANCIAL HIGHLIGHTS (continued)
Selected Data For A Share Of Capital Stock Outstanding Throughout Each Period
| | | | | | | | | | | | |
| | | AB Multi-Manager Select 2045 Fund | |
| | | Advisor Class | |
| | | Year Ended July 31, | | | December 15,
2014(a) to
July 31, 2015 | |
| | | 2017 | | | 2016 | | |
| | | | |
| | | | | | | | | | | | |
Net asset value, beginning of period | | | $ 10.54 | | | | $ 10.53 | | | | $ 10.00 | |
| | | | |
Income From Investment Operations | | | | | | | | | | | | |
Net investment income(b)(c) | | | .18 | | | | .18 | | | | .15 | |
Net realized and unrealized gain (loss) on investment transactions | | | 1.49 | | | | (.09 | )† | | | .59 | |
Contributions from Affiliates | | | – 0 | – | | | .00 | (d) | | | .00 | (d) |
| | | | |
Net increase in net asset value from operations | | | 1.67 | | | | .09 | | | | .74 | |
| | | | |
Less: Dividends and Distributions | | | | | | | | | | | | |
Dividends from net investment income | | | (.14 | ) | | | (.07 | ) | | | (.21 | ) |
Distributions from net realized gain on investment transactions | | | (.06 | ) | | | (.01 | ) | | | – 0 | – |
| | | | |
Total dividends and distributions | | | (.20 | ) | | | (.08 | ) | | | (.21 | ) |
| | | | |
Net asset value, end of period | | | $ 12.01 | | | | $ 10.54 | | | | $ 10.53 | |
| | | | |
Total Return | | | | | | | | | | | | |
Total investment return based on net asset value(e) | | | 16.09 | % | | | .86 | % | | | 7.43 | % |
Ratios/Supplemental Data | | | | | | | | | | | | |
Net assets, end of period (000’s omitted) | | | $32 | | | | $53 | | | | $11 | |
Ratio to average net assets of: | | | | | | | | | | | | |
Expenses, net of waivers/reimbursements(f) | | | .25 | % | | | .27 | % | | | .29 | %^ |
Expenses, before waivers/reimbursements(f) | | | 1.02 | % | | | 1.39 | % | | | 29.40 | %^ |
Net investment income(c)(f) | | | 1.63 | % | | | 1.81 | % | | | 2.35 | %^ |
Portfolio turnover rate | | | 39 | % | | | 67 | % | | | 14 | % |
See footnote summary on page 233.
| | |
| abfunds.com | | AB MULTI-MANAGER SELECT RETIREMENT FUNDS | 215 |
FINANCIAL HIGHLIGHTS (continued)
Selected Data For A Share Of Capital Stock Outstanding Throughout Each Period
| | | | | | | | | | | | |
| | | AB Multi-Manager Select 2045 Fund | |
| | | Class R | |
| | | Year Ended July 31, | | | December 15,
2014(a) to
July 31, 2015 | |
| | | 2017 | | | 2016 | | |
| | | | |
| | | | | | | | | | | | |
Net asset value, beginning of period | | | $ 10.20 | | | | $ 10.32 | | | | $ 10.00 | |
| | | | |
Income From Investment Operations | | | | | | | | | | | | |
Net investment income(b)(c) | | | .14 | | | | .13 | | | | .10 | |
Net realized and unrealized gain (loss) on investment transactions | | | 1.41 | | | | (.09 | )† | | | .60 | |
Contributions from Affiliates | | | – 0 | – | | | .00 | (d) | | | .00 | (d) |
| | | | |
Net increase in net asset value from operations | | | 1.55 | | | | .04 | | | | .70 | |
| | | | |
Less: Dividends and Distributions | | | | | | | | | | | | |
Dividends from net investment income | | | (.10 | ) | | | (.15 | ) | | | (.38 | ) |
Distributions from net realized gain on investment transactions | | | (.06 | ) | | | (.01 | ) | | | – 0 | – |
| | | | |
Total dividends and distributions | | | (.16 | ) | | | (.16 | ) | | | (.38 | ) |
| | | | |
Net asset value, end of period | | | $ 11.59 | | | | $ 10.20 | | | | $ 10.32 | |
| | | | |
Total Return | | | | | | | | | | | | |
Total investment return based on net asset value(e) | | | 15.44 | % | | | .41 | % | | | 7.10 | % |
Ratios/Supplemental Data | | | | | | | | | | | | |
Net assets, end of period (000’s omitted) | | | $2,174 | | | | $1,836 | | | | $63 | |
Ratio to average net assets of: | | | | | | | | | | | | |
Expenses, net of waivers/reimbursements(f) | | | .75 | % | | | .77 | % | | | .79 | %^ |
Expenses, before waivers/reimbursements(f) | | | 1.33 | % | | | 1.60 | % | | | 15.63 | %^ |
Net investment income(c)(f) | | | 1.28 | % | | | 1.33 | % | | | 1.53 | %^ |
Portfolio turnover rate | | | 39 | % | | | 67 | % | | | 14 | % |
See footnote summary on page 233.
| | |
| 216 | AB MULTI-MANAGER SELECT RETIREMENT FUNDS | | abfunds.com |
FINANCIAL HIGHLIGHTS (continued)
Selected Data For A Share Of Capital Stock Outstanding Throughout Each Period
| | | | | | | | | | | | |
| | | AB Multi-Manager Select 2045 Fund | |
| | | Class K | |
| | | Year Ended July 31, | | | December 15,
2014(a) to
July 31, 2015 | |
| | | 2017 | | | 2016 | | |
| | | | |
| | | | | | | | | | | | |
Net asset value, beginning of period | | | $ 10.24 | | | | $ 10.34 | | | | $ 10.00 | |
| | | | |
Income From Investment Operations | | | | | | | | | | | | |
Net investment income(b)(c) | | | .16 | | | | .13 | | | | .06 | |
Net realized and unrealized gain (loss) on investment transactions | | | 1.44 | | | | (.07 | )† | | | .66 | |
Contributions from Affiliates | | | – 0 | – | | | .00 | (d) | | | .00 | (d) |
| | | | |
Net increase in net asset value from operations | | | 1.60 | | | | .06 | | | | .72 | |
| | | | |
Less: Dividends and Distributions | | | | | | | | | | | | |
Dividends from net investment income | | | (.13 | ) | | | (.15 | ) | | | (.38 | ) |
Distributions from net realized gain on investment transactions | | | (.06 | ) | | | (.01 | ) | | | – 0 | – |
| | | | |
Total dividends and distributions | | | (.19 | ) | | | (.16 | ) | | | (.38 | ) |
| | | | |
Net asset value, end of period | | | $ 11.65 | | | | $ 10.24 | | | | $ 10.34 | |
| | | | |
Total Return | | | | | | | | | | | | |
Total investment return based on net asset value(e) | | | 15.88 | % | | | .62 | % | | | 7.32 | % |
Ratios/Supplemental Data | | | | | | | | | | | | |
Net assets, end of period (000’s omitted) | | | $44,736 | | | | $34,012 | | | | $6,077 | |
Ratio to average net assets of: | | | | | | | | | | | | |
Expenses, net of waivers/reimbursements(f) | | | .50 | % | | | .52 | % | | | .54 | %^ |
Expenses, before waivers/reimbursements(f) | | | 1.16 | % | | | 1.57 | % | | | 7.63 | %^ |
Net investment income(c)(f) | | | 1.47 | % | | | 1.32 | % | | | .93 | %^ |
Portfolio turnover rate | | | 39 | % | | | 67 | % | | | 14 | % |
See footnote summary on page 233.
| | |
| abfunds.com | | AB MULTI-MANAGER SELECT RETIREMENT FUNDS | 217 |
FINANCIAL HIGHLIGHTS (continued)
Selected Data For A Share Of Capital Stock Outstanding Throughout Each Period
| | | | | | | | | | | | |
| | | AB Multi-Manager Select 2045 Fund | |
| | | Class I | |
| | | Year Ended July 31, | | | December 15,
2014(a) to
July 31, 2015 | |
| | | 2017 | | | 2016 | | |
| | | | |
| | | | | | | | | | | | |
Net asset value, beginning of period | | | $ 10.27 | | | | $ 10.34 | | | | $ 10.00 | |
| | | | |
Income From Investment Operations | | | | | | | | | | | | |
Net investment income(b)(c) | | | .18 | | | | .17 | | | | .15 | |
Net realized and unrealized gain (loss) on investment transactions | | | 1.44 | | | | (.08 | )† | | | .57 | |
Contributions from Affiliates | | | – 0 | – | | | .00 | (d) | | | .00 | (d) |
| | | | |
Net increase in net asset value from operations | | | 1.62 | | | | .09 | | | | .72 | |
| | | | |
Less: Dividends and Distributions | | | | | | | | | | | | |
Dividends from net investment income | | | (.16 | ) | | | (.15 | ) | | | (.38 | ) |
Distributions from net realized gain on investment transactions | | | (.06 | ) | | | (.01 | ) | | | – 0 | – |
| | | | |
Total dividends and distributions | | | (.22 | ) | | | (.16 | ) | | | (.38 | ) |
| | | | |
Net asset value, end of period | | | $ 11.67 | | | | $ 10.27 | | | | $ 10.34 | |
| | | | |
Total Return | | | | | | | | | | | | |
Total investment return based on net asset value(e) | | | 16.08 | % | | | .97 | % | | | 7.34 | % |
Ratios/Supplemental Data | | | | | | | | | | | | |
Net assets, end of period (000’s omitted) | | | $3,830 | | | | $2,319 | | | | $1,009 | |
Ratio to average net assets of: | | | | | | | | | | | | |
Expenses, net of waivers/reimbursements(f) | | | .25 | % | | | .27 | % | | | .29 | %^ |
Expenses, before waivers/reimbursements(f) | | | .84 | % | | | 1.41 | % | | | 23.10 | %^ |
Net investment income(c)(f) | | | 1.66 | % | | | 1.79 | % | | | 2.36 | %^ |
Portfolio turnover rate | | | 39 | % | | | 67 | % | | | 14 | % |
See footnote summary on page 233.
| | |
| 218 | AB MULTI-MANAGER SELECT RETIREMENT FUNDS | | abfunds.com |
FINANCIAL HIGHLIGHTS (continued)
Selected Data For A Share Of Capital Stock Outstanding Throughout Each Period
| | | | | | | | | | | | |
| | | AB Multi-Manager Select 2045 Fund | |
| | | Class Z | |
| | | Year Ended July 31, | | | December 15,
2014(a) to
July 31, 2015 | |
| | | 2017 | | | 2016 | | |
| | | | |
| | | | | | | | | | | | |
Net asset value, beginning of period | | | $ 10.27 | | | | $ 10.34 | | | | $ 10.00 | |
| | | | |
Income From Investment Operations | | | | | | | | | | | | |
Net investment income(b)(c) | | | .19 | | | | .14 | | | | .06 | |
Net realized and unrealized gain (loss) on investment transactions | | | 1.43 | | | | (.05 | )† | | | .66 | |
Contributions from Affiliates | | | – 0 | – | | | .00 | (d) | | | .00 | (d) |
| | | | |
Net increase in net asset value from operations | | | 1.62 | | | | .09 | | | | .72 | |
| | | | |
Less: Dividends and Distributions | | | | | | | | | | | | |
Dividends from net investment income | | | (.17 | ) | | | (.15 | ) | | | (.38 | ) |
Distributions from net realized gain on investment transactions | | | (.06 | ) | | | (.01 | ) | | | – 0 | – |
| | | | |
Total dividends and distributions | | | (.23 | ) | | | (.16 | ) | | | (.38 | ) |
| | | | |
Net asset value, end of period | | | $ 11.66 | | | | $ 10.27 | | | | $ 10.34 | |
| | | | |
Total Return | | | | | | | | | | | | |
Total investment return based on net asset value(e) | | | 16.05 | % | | | .96 | % | | | 7.34 | % |
Ratios/Supplemental Data | | | | | | | | | | | | |
Net assets, end of period (000’s omitted) | | | $369 | | | | $316 | | | | $346 | |
Ratio to average net assets of: | | | | | | | | | | | | |
Expenses, net of waivers/reimbursements(f) | | | .25 | % | | | .27 | % | | | .29 | %^ |
Expenses, before waivers/reimbursements(f) | | | .76 | % | | | 1.78 | % | | | 16.19 | %^ |
Net investment income(c)(f) | | | 1.74 | % | | | 1.41 | % | | | .96 | %^ |
Portfolio turnover rate | | | 39 | % | | | 67 | % | | | 14 | % |
See footnote summary on page 233.
| | |
| abfunds.com | | AB MULTI-MANAGER SELECT RETIREMENT FUNDS | 219 |
FINANCIAL HIGHLIGHTS (continued)
Selected Data For A Share Of Capital Stock Outstanding Throughout Each Period
| | | | | | | | | | | | |
| | | AB Multi-Manager Select 2050 Fund | |
| | | Class A | |
| | | Year Ended July 31, | | | December 15,
2014(a) to
July 31, 2015 | |
| | | 2017 | | | 2016 | | |
| | | | |
| | | | | | | | | | | | |
Net asset value, beginning of period | | | $ 10.49 | | | | $ 10.49 | | | | $ 10.00 | |
| | | | |
Income From Investment Operations | | | | | | | | | | | | |
Net investment income(b)(c) | | | .14 | | | | .11 | | | | .09 | |
Net realized and unrealized gain (loss) on investment transactions | | | 1.55 | | | | (.03 | )† | | | .61 | |
| | | | |
Net increase in net asset value from operations | | | 1.69 | | | | .08 | | | | .70 | |
| | | | |
Less: Dividends and Distributions | | | | | | | | | | | | |
Dividends from net investment income | | | – 0 | – | | | (.07 | ) | | | (.21 | ) |
Distributions from net realized gain on investment transactions | | | (.05 | ) | | | (.01 | ) | | | – 0 | – |
| | | | |
Total dividends and distributions | | | (.05 | ) | | | (.08 | ) | | | (.21 | ) |
| | | | |
Net asset value, end of period | | | $ 12.13 | | | | $ 10.49 | | | | $ 10.49 | |
| | | | |
Total Return | | | | | | | | | | | | |
Total investment return based on net asset value(e) | | | 16.19 | % | | | .80 | % | | | 7.06 | % |
Ratios/Supplemental Data | | | | | | | | | | | | |
Net assets, end of period (000’s omitted) | | | $1,035 | | | | $1,206 | | | | $66 | |
Ratio to average net assets of: | | | | | | | | | | | | |
Expenses, net of waivers/reimbursements(f) | | | .51 | % | | | .52 | % | | | .53 | %^ |
Expenses, before waivers/reimbursements(f) | | | 3.04 | % | | | 4.64 | % | | | 36.42 | %^ |
Net investment income(c)(f) | | | 1.26 | % | | | 1.13 | % | | | 1.37 | %^ |
Portfolio turnover rate | | | 46 | % | | | 69 | % | | | 16 | % |
See footnote summary on page 233.
| | |
| 220 | AB MULTI-MANAGER SELECT RETIREMENT FUNDS | | abfunds.com |
FINANCIAL HIGHLIGHTS (continued)
Selected Data For A Share Of Capital Stock Outstanding Throughout Each Period
| | | | | | | | | | | | |
| | | AB Multi-Manager Select 2050 Fund | |
| | | Class C | |
| | | Year Ended July 31, | | | December 15,
2014(a) to
July 31, 2015 | |
| | | 2017 | | | 2016 | | |
| | | | |
| | | | | | | | | | | | |
Net asset value, beginning of period | | | $ 10.44 | | | | $ 10.44 | | | | $ 10.00 | |
| | | | |
Income From Investment Operations | | | | | | | | | | | | |
Net investment income(b)(c) | | | .07 | | | | .03 | | | | .09 | |
Net realized and unrealized gain (loss) on investment transactions | | | 1.52 | | | | (.02 | )† | | | .56 | |
| | | | |
Net increase in net asset value from operations | | | 1.59 | | | | .01 | | | | .65 | |
| | | | |
Less: Dividends and Distributions | | | | | | | | | | | | |
Dividends from net investment income | | | – 0 | – | | | – 0 | – | | | (.21 | ) |
Distributions from net realized gain on investment transactions | | | (.05 | ) | | | (.01 | ) | | | – 0 | – |
| | | | |
Total dividends and distributions | | | (.05 | ) | | | (.01 | ) | | | (.21 | ) |
| | | | |
Net asset value, end of period | | | $ 11.98 | | | | $ 10.44 | | | | $ 10.44 | |
| | | | |
Total Return | | | | | | | | | | | | |
Total investment return based on net asset value(e) | | | 15.30 | % | | | .07 | % | | | 6.51 | % |
Ratios/Supplemental Data | | | | | | | | | | | | |
Net assets, end of period (000’s omitted) | | | $81 | | | | $50 | | | | $11 | |
Ratio to average net assets of: | | | | | | | | | | | | |
Expenses, net of waivers/reimbursements(f) | | | 1.25 | % | | | 1.27 | % | | | 1.28 | %^ |
Expenses, before waivers/reimbursements(f) | | | 3.89 | % | | | 5.86 | % | | | 41.11 | %^ |
Net investment income(c)(f) | | | .66 | % | | | .27 | % | | | 1.39 | %^ |
Portfolio turnover rate | | | 46 | % | | | 69 | % | | | 16 | % |
See footnote summary on page 233.
| | |
| abfunds.com | | AB MULTI-MANAGER SELECT RETIREMENT FUNDS | 221 |
FINANCIAL HIGHLIGHTS (continued)
Selected Data For A Share Of Capital Stock Outstanding Throughout Each Period
| | | | | | | | | | | | |
| | | AB Multi-Manager Select 2050 Fund | |
| | | Advisor Class | |
| | | Year Ended July 31, | | | December 15,
2014(a) to
July 31, 2015 | |
| | | 2017 | | | 2016 | | |
| | | | |
| | | | | | | | | | | | |
Net asset value, beginning of period | | | $ 10.60 | | | | $ 10.50 | | | | $ 10.00 | |
| | | | |
Income From Investment Operations | | | | | | | | | | | | |
Net investment income(b)(c) | | | .18 | | | | .14 | | | | .15 | |
Net realized and unrealized gain (loss) on investment transactions | | | 1.55 | | | | (.03 | )† | | | .56 | |
| | | | |
Net increase in net asset value from operations | | | 1.73 | | | | .11 | | | | .71 | |
| | | | |
Less: Dividends and Distributions | | | | | | | | | | | | |
Dividends from net investment income | | | (.07 | ) | | | – 0 | – | | | (.21 | ) |
Distributions from net realized gain on investment transactions | | | (.05 | ) | | | (.01 | ) | | | – 0 | – |
| | | | |
Total dividends and distributions | | | (.12 | ) | | | (.01 | ) | | | (.21 | ) |
| | | | |
Net asset value, end of period | | | $ 12.21 | | | | $ 10.60 | | | | $ 10.50 | |
| | | | |
Total Return | | | | | | | | | | | | |
Total investment return based on net asset value(e) | | | 16.51 | % | | | 1.02 | % | | | 7.18 | % |
Ratios/Supplemental Data | | | | | | | | | | | | |
Net assets, end of period (000’s omitted) | | | $118 | | | | $66 | | | | $11 | |
Ratio to average net assets of: | | | | | | | | | | | | |
Expenses, net of waivers/reimbursements(f) | | | .25 | % | | | .27 | % | | | .28 | %^ |
Expenses, before waivers/reimbursements(f) | | | 2.80 | % | | | 4.28 | % | | | 40.13 | %^ |
Net investment income(c)(f) | | | 1.58 | % | | | 1.44 | % | | | 2.38 | %^ |
Portfolio turnover rate | | | 46 | % | | | 69 | % | | | 16 | % |
See footnote summary on page 233.
| | |
| 222 | AB MULTI-MANAGER SELECT RETIREMENT FUNDS | | abfunds.com |
FINANCIAL HIGHLIGHTS (continued)
Selected Data For A Share Of Capital Stock Outstanding Throughout Each Period
| | | | | | | | | | | | |
| | | AB Multi-Manager Select 2050 Fund | |
| | | Class R | |
| | | Year Ended July 31, | | | December 15,
2014(a) to
July 31, 2015 | |
| | | 2017 | | | 2016 | | |
| | | | |
| | | | | | | | | | | | |
Net asset value, beginning of period | | | $ 10.21 | | | | $ 10.29 | | | | $ 10.00 | |
| | | | |
Income From Investment Operations | | | | | | | | | | | | |
Net investment income(b)(c) | | | .13 | | | | .06 | | | | .13 | |
Net realized and unrealized gain on investment transactions | | | 1.47 | | | | .00 | (d) | | | .55 | |
| | | | |
Net increase in net asset value from operations | | | 1.60 | | | | .06 | | | | .68 | |
| | | | |
Less: Dividends and Distributions | | | | | | | | | | | | |
Dividends from net investment income | | | (.12 | ) | | | (.13 | ) | | | (.39 | ) |
Distributions from net realized gain on investment transactions | | | (.05 | ) | | | (.01 | ) | | | – 0 | – |
| | | | |
Total dividends and distributions | | | (.17 | ) | | | (.14 | ) | | | (.39 | ) |
| | | | |
Net asset value, end of period | | | $ 11.64 | | | | $ 10.21 | | | | $ 10.29 | |
| | | | |
Total Return | | | | | | | | | | | | |
Total investment return based on net asset value(e) | | | 15.84 | % | | | .60 | % | | | 6.85 | % |
Ratios/Supplemental Data | | | | | | | | | | | | |
Net assets, end of period (000’s omitted) | | | $570 | | | | $406 | | | | $22 | |
Ratio to average net assets of: | | | | | | | | | | | | |
Expenses, net of waivers/reimbursements(f) | | | .75 | % | | | .77 | % | | | .78 | %^ |
Expenses, before waivers/reimbursements(f) | | | 2.26 | % | | | 2.75 | % | | | 25.29 | %^ |
Net investment income(c)(f) | | | 1.22 | % | | | .57 | % | | | 2.03 | %^ |
Portfolio turnover rate | | | 46 | % | | | 69 | % | | | 16 | % |
See footnote summary on page 233.
| | |
| abfunds.com | | AB MULTI-MANAGER SELECT RETIREMENT FUNDS | 223 |
FINANCIAL HIGHLIGHTS (continued)
Selected Data For A Share Of Capital Stock Outstanding Throughout Each Period
| | | | | | | | | | | | |
| | | AB Multi-Manager Select 2050 Fund | |
| | | Class K | |
| | | Year Ended July 31, | | | December 15,
2014(a) to
July 31, 2015 | |
| | | 2017 | | | 2016 | | |
| | | | |
| | | | | | | | | | | | |
Net asset value, beginning of period | | | $ 10.23 | | | | $ 10.30 | | | | $ 10.00 | |
| | | | |
Income From Investment Operations | | | | | | | | | | | | |
Net investment income(b)(c) | | | .16 | | | | .12 | | | | .07 | |
Net realized and unrealized gain (loss) on investment transactions | | | 1.47 | | | | (.04 | )† | | | .62 | |
| | | | |
Net increase in net asset value from operations | | | 1.63 | | | | .08 | | | | .69 | |
| | | | |
Less: Dividends and Distributions | | | | | | | | | | | | |
Dividends from net investment income | | | (.13 | ) | | | (.14 | ) | | | (.39 | ) |
Distributions from net realized gain on investment transactions | | | (.05 | ) | | | (.01 | ) | | | – 0 | – |
| | | | |
Total dividends and distributions | | | (.18 | ) | | | (.15 | ) | | | (.39 | ) |
| | | | |
Net asset value, end of period | | | $ 11.68 | | | | $ 10.23 | | | | $ 10.30 | |
| | | | |
Total Return | | | | | | | | | | | | |
Total investment return based on net asset value(e) | | | 16.15 | % | | | .80 | % | | | 6.97 | % |
Ratios/Supplemental Data | | | | | | | | | | | | |
Net assets, end of period (000’s omitted) | | | $17,652 | | | | $14,486 | | | | $1,613 | |
Ratio to average net assets of: | | | | | | | | | | | | |
Expenses, net of waivers/reimbursements(f) | | | .50 | % | | | .52 | % | | | .53 | %^ |
Expenses, before waivers/reimbursements(f) | | | 1.99 | % | | | 2.99 | % | | | 16.29 | %^ |
Net investment income(c)(f) | | | 1.50 | % | | | 1.28 | % | | | 1.09 | %^ |
Portfolio turnover rate | | | 46 | % | | | 69 | % | | | 16 | % |
See footnote summary on page 233.
| | |
| 224 | AB MULTI-MANAGER SELECT RETIREMENT FUNDS | | abfunds.com |
FINANCIAL HIGHLIGHTS (continued)
Selected Data For A Share Of Capital Stock Outstanding Throughout Each Period
| | | | | | | | | | | | |
| | | AB Multi-Manager Select 2050 Fund | |
| | | Class I | |
| | | Year Ended July 31, | | | December 15,
2014(a) to
July 31, 2015 | |
| | | 2017 | | | 2016 | | |
| | | | |
| | | | | | | | | | | | |
Net asset value, beginning of period | | | $ 10.27 | | | | $ 10.32 | | | | $ 10.00 | |
| | | | |
Income From Investment Operations | | | | | | | | | | | | |
Net investment income(b)(c) | | | .18 | | | | .17 | | | | .15 | |
Net realized and unrealized gain (loss) on investment transactions | | | 1.49 | | | | (.07 | )† | | | .56 | |
| | | | |
Net increase in net asset value from operations | | | 1.67 | | | | .10 | | | | .71 | |
| | | | |
Less: Dividends and Distributions | | | | | | | | | | | | |
Dividends from net investment income | | | (.16 | ) | | | (.14 | ) | | | (.39 | ) |
Distributions from net realized gain on investment transactions | | | (.05 | ) | | | (.01 | ) | | | – 0 | – |
| | | | |
Total dividends and distributions | | | (.21 | ) | | | (.15 | ) | | | (.39 | ) |
| | | | |
Net asset value, end of period | | | $ 11.73 | | | | $ 10.27 | | | | $ 10.32 | |
| | | | |
Total Return | | | | | | | | | | | | |
Total investment return based on net asset value(e) | | | 16.51 | % | | | 1.05 | % | | | 7.19 | % |
Ratios/Supplemental Data | | | | | | | | | | | | |
Net assets, end of period (000’s omitted) | | | $2,389 | | | | $1,421 | | | | $1,007 | |
Ratio to average net assets of: | | | | | | | | | | | | |
Expenses, net of waivers/reimbursements(f) | | | .25 | % | | | .27 | % | | | .28 | %^ |
Expenses, before waivers/reimbursements(f) | | | 1.66 | % | | | 3.58 | % | | | 27.24 | %^ |
Net investment income(c)(f) | | | 1.64 | % | | | 1.76 | % | | | 2.39 | %^ |
Portfolio turnover rate | | | 46 | % | | | 69 | % | | | 16 | % |
See footnote summary on page 233.
| | |
| abfunds.com | | AB MULTI-MANAGER SELECT RETIREMENT FUNDS | 225 |
FINANCIAL HIGHLIGHTS (continued)
Selected Data For A Share Of Capital Stock Outstanding Throughout Each Period
| | | | | | | | | | | | |
| | | AB Multi-Manager Select 2050 Fund | |
| | | Class Z | |
| | | Year Ended July 31, | | | December 15,
2014(a) to
July 31, 2015 | |
| | | 2017 | | | 2016 | | |
| | | | |
| | | | | | | | | | | | |
Net asset value, beginning of period | | | $ 10.27 | | | | $ 10.32 | | | | $ 10.00 | |
| | | | |
Income From Investment Operations | | | | | | | | | | | | |
Net investment income(b)(c) | | | .19 | | | | .13 | | | | .15 | |
Net realized and unrealized gain (loss) on investment transactions | | | 1.47 | | | | (.03 | )† | | | .56 | |
| | | | |
Net increase in net asset value from operations | | | 1.66 | | | | .10 | | | | .71 | |
| | | | |
Less: Dividends and Distributions | | | | | | | | | | | | |
Dividends from net investment income | | | (.16 | ) | | | (.14 | ) | | | (.39 | ) |
Distributions from net realized gain on investment transactions | | | (.05 | ) | | | (.01 | ) | | | – 0 | – |
| | | | |
Total dividends and distributions | | | (.21 | ) | | | (.15 | ) | | | (.39 | ) |
| | | | |
Net asset value, end of period | | | $ 11.72 | | | | $ 10.27 | | | | $ 10.32 | |
| | | | |
Total Return | | | | | | | | | | | | |
Total investment return based on net asset value(e) | | | 16.47 | % | | | 1.04 | % | | | 7.19 | % |
Ratios/Supplemental Data | | | | | | | | | | | | |
Net assets, end of period (000’s omitted) | | | $12 | | | | $11 | | | | $11 | |
Ratio to average net assets of: | | | | | | | | | | | | |
Expenses, net of waivers/reimbursements(f) | | | .25 | % | | | .27 | % | | | .28 | %^ |
Expenses, before waivers/reimbursements(f) | | | 1.58 | % | | | 4.05 | % | | | 27.28 | %^ |
Net investment income(c)(f) | | | 1.74 | % | | | 1.36 | % | | | 2.38 | %^ |
Portfolio turnover rate | | | 46 | % | | | 69 | % | | | 16 | % |
See footnote summary on page 233.
| | |
| 226 | AB MULTI-MANAGER SELECT RETIREMENT FUNDS | | abfunds.com |
FINANCIAL HIGHLIGHTS (continued)
Selected Data For A Share Of Capital Stock Outstanding Throughout Each Period
| | | | | | | | | | | | |
| | | AB Multi-Manager Select 2055 Fund | |
| | | Class A | |
| | | Year Ended July 31, | | | December 15,
2014(a) to
July 31, 2015 | |
| | | 2017 | | | 2016 | | |
| | | | |
| | | | | | | | | | | | |
Net asset value, beginning of period | | | $ 10.39 | | | | $ 10.48 | | | | $ 10.00 | |
| | | | |
Income From Investment Operations | | | | | | | | | | | | |
Net investment income(b)(c) | | | .14 | | | | .12 | | | | .11 | |
Net realized and unrealized gain (loss) on investment transactions | | | 1.52 | | | | (.09 | )† | | | .58 | |
Contributions from Affiliates | | | – 0 | – | | | – 0 | – | | | .00 | (d) |
| | | | |
Net increase in net asset value from operations | | | 1.66 | | | | .03 | | | | .69 | |
| | | | |
Less: Dividends and Distributions | | | | | | | | | | | | |
Dividends from net investment income | | | – 0 | – | | | (.11 | ) | | | (.21 | ) |
Distributions from net realized gain on investment transactions | | | (.06 | ) | | | (.01 | ) | | | – 0 | – |
| | | | |
Total dividends and distributions | | | (.06 | ) | | | (.12 | ) | | | (.21 | ) |
| | | | |
Net asset value, end of period | | | $ 11.99 | | | | $ 10.39 | | | | $ 10.48 | |
| | | | |
Total Return | | | | | | | | | | | | |
Total investment return based on net asset value(e) | | | 16.08 | % | | | .35 | % | | | 6.96 | % |
Ratios/Supplemental Data | | | | | | | | | | | | |
Net assets, end of period (000’s omitted) | | | $1,094 | | | | $931 | | | | $25 | |
Ratio to average net assets of: | | | | | | | | | | | | |
Expenses, net of waivers/reimbursements(f) | | | .51 | % | | | .52 | % | | | .53 | %^ |
Expenses, before waivers/reimbursements(f) | | | 2.73 | % | | | 4.64 | % | | | 22.61 | %^ |
Net investment income(c)(f) | | | 1.24 | % | | | 1.19 | % | | | 1.73 | %^ |
Portfolio turnover rate | | | 40 | % | | | 71 | % | | | 16 | % |
See footnote summary on page 233.
| | |
| abfunds.com | | AB MULTI-MANAGER SELECT RETIREMENT FUNDS | 227 |
FINANCIAL HIGHLIGHTS (continued)
Selected Data For A Share Of Capital Stock Outstanding Throughout Each Period
| | | | | | | | | | | | |
| | | AB Multi-Manager Select 2055 Fund | |
| | | Class C | |
| | | Year Ended July 31, | | | December 15,
2014(a) to
July 31, 2015 | |
| | | 2017 | | | 2016 | | |
| | | | |
| | | | | | | | | | | | |
Net asset value, beginning of period | | | $ 10.30 | | | | $ 10.44 | | | | $ 10.00 | |
| | | | |
Income From Investment Operations | | | | | | | | | | | | |
Net investment income(b)(c) | | | .05 | | | | .08 | | | | .09 | |
Net realized and unrealized gain (loss) on investment transactions | | | 1.51 | | | | (.13 | )† | | | .56 | |
Contributions from Affiliates | | | – 0 | – | | | – 0 | – | | | .00 | (d) |
| | | | |
Net increase (decrease) in net asset value from operations | | | 1.56 | | | | (.05 | ) | | | .65 | |
| | | | |
Less: Dividends and Distributions | | | | | | | | | | | | |
Dividends from net investment income | | | – 0 | – | | | (.08 | ) | | | (.21 | ) |
Distributions from net realized gain on investment transactions | | | (.06 | ) | | | (.01 | ) | | | – 0 | – |
| | | | |
Total dividends and distributions | | | (.06 | ) | | | (.09 | ) | | | (.21 | ) |
| | | | |
Net asset value, end of period | | | $ 11.80 | | | | $ 10.30 | | | | $ 10.44 | |
| | | | |
Total Return | | | | | | | | | | | | |
Total investment return based on net asset value(e) | | | 15.25 | % | | | (.45 | )% | | | 6.51 | % |
Ratios/Supplemental Data | | | | | | | | | | | | |
Net assets, end of period (000’s omitted) | | | $192 | | | | $71 | | | | $11 | |
Ratio to average net assets of: | | | | | | | | | | | | |
Expenses, net of waivers/reimbursements(f) | | | 1.26 | % | | | 1.27 | % | | | 1.28 | %^ |
Expenses, before waivers/reimbursements(f) | | | 3.52 | % | | | 6.16 | % | | | 24.47 | %^ |
Net investment income(c)(f) | | | .48 | % | | | .81 | % | | | 1.39 | %^ |
Portfolio turnover rate | | | 40 | % | | | 71 | % | | | 16 | % |
See footnote summary on page 233.
| | |
| 228 | AB MULTI-MANAGER SELECT RETIREMENT FUNDS | | abfunds.com |
FINANCIAL HIGHLIGHTS (continued)
Selected Data For A Share Of Capital Stock Outstanding Throughout Each Period
| | | | | | | | | | | | |
| | | AB Multi-Manager Select 2055 Fund | |
| | | Advisor Class | |
| | | Year Ended July 31, | | | December 15,
2014(a) to
July 31, 2015 | |
| | | 2017 | | | 2016 | | |
| | | | |
| | | | | | | | | | | | |
Net asset value, beginning of period | | | $ 10.51 | | | | $ 10.50 | | | | $ 10.00 | |
| | | | |
Income From Investment Operations | | | | | | | | | | | | |
Net investment income(b)(c) | | | .19 | | | | .14 | | | | .04 | |
Net realized and unrealized gain (loss) on investment transactions | | | 1.52 | | | | (.09 | )† | | | .67 | |
Contributions from Affiliates | | | – 0 | – | | | – 0 | – | | | .00 | (d) |
| | | | |
Net increase in net asset value from operations | | | 1.71 | | | | .05 | | | | .71 | |
| | | | |
Less: Dividends and Distributions | | | | | | | | | | | | |
Dividends from net investment income | | | (.04 | ) | | | (.03 | ) | | | (.21 | ) |
Distributions from net realized gain on investment transactions | | | (.06 | ) | | | (.01 | ) | | | – 0 | – |
| | | | |
Total dividends and distributions | | | (.10 | ) | | | (.04 | ) | | | (.21 | ) |
| | | | |
Net asset value, end of period | | | $ 12.12 | | | | $ 10.51 | | | | $ 10.50 | |
| | | | |
Total Return | | | | | | | | | | | | |
Total investment return based on net asset value(e) | | | 16.40 | % | | | .52 | % | | | 7.18 | % |
Ratios/Supplemental Data | | | | | | | | | | | | |
Net assets, end of period (000’s omitted) | | | $547 | | | | $466 | | | | $347 | |
Ratio to average net assets of: | | | | | | | | | | | | |
Expenses, net of waivers/reimbursements(f) | | | .26 | % | | | .27 | % | | | .28 | %^ |
Expenses, before waivers/reimbursements(f) | | | 2.51 | % | | | 5.66 | % | | | 22.48 | %^ |
Net investment income(c)(f) | | | 1.72 | % | | | 1.37 | % | | | .69 | %^ |
Portfolio turnover rate | | | 40 | % | | | 71 | % | | | 16 | % |
See footnote summary on page 233.
| | |
| abfunds.com | | AB MULTI-MANAGER SELECT RETIREMENT FUNDS | 229 |
FINANCIAL HIGHLIGHTS (continued)
Selected Data For A Share Of Capital Stock Outstanding Throughout Each Period
| | | | | | | | | | | | |
| | | AB Multi-Manager Select 2055 Fund | |
| | | Class R | |
| | | Year Ended July 31, | | | December 15,
2014(a) to
July 31, 2015 | |
| | | 2017 | | | 2016 | | |
| | | | |
| | | | | | | | | | | | |
Net asset value, beginning of period | | | $ 10.17 | | | | $ 10.29 | | | | $ 10.00 | |
| | | | |
Income From Investment Operations | | | | | | | | | | | | |
Net investment income(b)(c) | | | .07 | | | | .07 | | | | .12 | |
Net realized and unrealized gain (loss) on investment transactions | | | 1.52 | | | | (.07 | )† | | | .56 | |
Contributions from Affiliates | | | – 0 | – | | | – 0 | – | | | .00 | (d) |
| | | | |
Net increase in net asset value from operations | | | 1.59 | | | | .00 | | | | .68 | |
| | | | |
Less: Dividends and Distributions | | | | | | | | | | | | |
Dividends from net investment income | | | (.12 | ) | | | (.11 | ) | | | (.39 | ) |
Distributions from net realized gain on investment transactions | | | (.06 | ) | | | (.01 | ) | | | – 0 | – |
| | | | |
Total dividends and distributions | | | (.18 | ) | | | (.12 | ) | | | (.39 | ) |
| | | | |
Net asset value, end of period | | | $ 11.58 | | | | $ 10.17 | | | | $ 10.29 | |
| | | | |
Total Return | | | | | | | | | | | | |
Total investment return based on net asset value(e) | | | 15.82 | % | | | .09 | % | | | 6.85 | % |
Ratios/Supplemental Data | | | | | | | | | | | | |
Net assets, end of period (000’s omitted) | | | $323 | | | | $66 | | | | $15 | |
Ratio to average net assets of: | | | | | | | | | | | | |
Expenses, net of waivers/reimbursements(f) | | | .76 | % | | | .77 | % | | | .78 | %^ |
Expenses, before waivers/reimbursements(f) | | | 2.12 | % | | | 3.68 | % | | | 22.02 | %^ |
Net investment income(c)(f) | | | .68 | % | | | .69 | % | | | 1.86 | %^ |
Portfolio turnover rate | | | 40 | % | | | 71 | % | | | 16 | % |
See footnote summary on page 233.
| | |
| 230 | AB MULTI-MANAGER SELECT RETIREMENT FUNDS | | abfunds.com |
FINANCIAL HIGHLIGHTS (continued)
Selected Data For A Share Of Capital Stock Outstanding Throughout Each Period
| | | | | | | | | | | | |
| | | AB Multi-Manager Select 2055 Fund | |
| | | Class K | |
| | | Year Ended July 31, | | | December 15,
2014(a) to
July 31, 2015 | |
| | | 2017 | | | 2016 | | |
| | | | |
| | | | | | | | | | | | |
Net asset value, beginning of period | | | $ 10.18 | | | | $ 10.29 | | | | $ 10.00 | |
| | | | |
Income From Investment Operations | | | | | | | | | | | | |
Net investment income(b)(c) | | | .15 | | | | .12 | | | | .07 | |
Net realized and unrealized gain (loss) on investment transactions | | | 1.46 | | | | (.08 | )† | | | .61 | |
Contributions from Affiliates | | | – 0 | – | | | – 0 | – | | | .00 | (d) |
| | | | |
Net increase in net asset value from operations | | | 1.61 | | | | .04 | | | | .68 | |
| | | | |
Less: Dividends and Distributions | | | | | | | | | | | | |
Dividends from net investment income | | | (.13 | ) | | | (.14 | ) | | | (.39 | ) |
Distributions from net realized gain on investment transactions | | | (.06 | ) | | | (.01 | ) | | | – 0 | – |
| | | | |
Total dividends and distributions | | | (.19 | ) | | | (.15 | ) | | | (.39 | ) |
| | | | |
Net asset value, end of period | | | $ 11.60 | | | | $ 10.18 | | | | $ 10.29 | |
| | | | |
Total Return | | | | | | | | | | | | |
Total investment return based on net asset value(e) | | | 16.06 | % | | | .42 | % | | | 6.86 | % |
Ratios/Supplemental Data | | | | | | | | | | | | |
Net assets, end of period (000’s omitted) | | | $21,441 | | | | $14,694 | | | | $1,300 | |
Ratio to average net assets of: | | | | | | | | | | | | |
Expenses, net of waivers/reimbursements(f) | | | .51 | % | | | .52 | % | | | .53 | %^ |
Expenses, before waivers/reimbursements(f) | | | 1.93 | % | | | 3.08 | % | | | 16.63 | %^ |
Net investment income(c)(f) | | | 1.44 | % | | | 1.20 | % | | | 1.14 | %^ |
Portfolio turnover rate | | | 40 | % | | | 71 | % | | | 16 | % |
See footnote summary on page 233.
| | |
| abfunds.com | | AB MULTI-MANAGER SELECT RETIREMENT FUNDS | 231 |
FINANCIAL HIGHLIGHTS (continued)
Selected Data For A Share Of Capital Stock Outstanding Throughout Each Period
| | | | | | | | | | | | |
| | | AB Multi-Manager Select 2055 Fund | |
| | | Class I | |
| | | Year Ended July 31, | | | December 15,
2014(a) to
July 31, 2015 | |
| | | 2017 | | | 2016 | | |
| | | | |
| | | | | | | | | | | | |
Net asset value, beginning of period | | | $ 10.22 | | | | $ 10.32 | | | | $ 10.00 | |
| | | | |
Income From Investment Operations | | | | | | | | | | | | |
Net investment income(b)(c) | | | .18 | | | | .17 | | | | .15 | |
Net realized and unrealized gain (loss) on investment transactions | | | 1.47 | | | | (.12 | )† | | | .56 | |
Contributions from Affiliates | | | – 0 | – | | | – 0 | – | | | .00 | (d) |
| | | | |
Net increase in net asset value from operations | | | 1.65 | | | | .05 | | | | .71 | |
| | | | |
Less: Dividends and Distributions | | | | | | | | | | | | |
Dividends from net investment income | | | (.16 | ) | | | (.14 | ) | | | (.39 | ) |
Distributions from net realized gain on investment transactions | | | (.06 | ) | | | (.01 | ) | | | – 0 | – |
| | | | |
Total dividends and distributions | | | (.22 | ) | | | (.15 | ) | | | (.39 | ) |
| | | | |
Net asset value, end of period | | | $ 11.65 | | | | $ 10.22 | | | | $ 10.32 | |
| | | | |
Total Return | | | | | | | | | | | | |
Total investment return based on net asset value(e) | | | 16.43 | % | | | .57 | % | | | 7.19 | % |
Ratios/Supplemental Data | | | | | | | | | | | | |
Net assets, end of period (000’s omitted) | | | $1,801 | | | | $878 | | | | $1,007 | |
Ratio to average net assets of: | | | | | | | | | | | | |
Expenses, net of waivers/reimbursements(f) | | | .26 | % | | | .27 | % | | | .28 | %^ |
Expenses, before waivers/reimbursements(f) | | | 1.61 | % | | | 4.58 | % | | | 21.99 | %^ |
Net investment income(c)(f) | | | 1.63 | % | | | 1.80 | % | | | 2.39 | %^ |
Portfolio turnover rate | | | 40 | % | | | 71 | % | | | 16 | % |
See footnote summary on page 233.
| | |
| 232 | AB MULTI-MANAGER SELECT RETIREMENT FUNDS | | abfunds.com |
FINANCIAL HIGHLIGHTS (continued)
Selected Data For A Share Of Capital Stock Outstanding Throughout Each Period
| | | | | | | | | | | | |
| | | AB Multi-Manager Select 2055 Fund | |
| | | Class Z | |
| | | Year Ended July 31, | | | December 15,
2014(a) to
July 31, 2015 | |
| | | 2017 | | | 2016 | | |
| | | | |
| | | | | | | | | | | | |
Net asset value, beginning of period | | | $ 10.22 | | | | $ 10.32 | | | | $ 10.00 | |
| | | | |
Income From Investment Operations | | | | | | | | | | | | |
Net investment income(b)(c) | | | .18 | | | | .13 | | | | .15 | |
Net realized and unrealized gain (loss) on investment transactions | | | 1.46 | | | | (.08 | )† | | | .56 | |
Contributions from Affiliates | | | – 0 | – | | | – 0 | – | | | .00 | (d) |
| | | | |
Net increase in net asset value from operations | | | 1.64 | | | | .05 | | | | .71 | |
| | | | |
Less: Dividends and Distributions | | | | | | | | | | | | |
Dividends from net investment income | | | (.16 | ) | | | (.14 | ) | | | (.39 | ) |
Distributions from net realized gain on investment transactions | | | (.06 | ) | | | (.01 | ) | | | – 0 | – |
| | | | |
Total dividends and distributions | | | (.22 | ) | | | (.15 | ) | | | (.39 | ) |
| | | | |
Net asset value, end of period | | | $ 11.64 | | | | $ 10.22 | | | | $ 10.32 | |
| | | | |
Total Return | | | | | | | | | | | | |
Total investment return based on net asset value(e) | | | 16.38 | % | | | .56 | % | | | 7.19 | % |
Ratios/Supplemental Data | | | | | | | | | | | | |
Net assets, end of period (000’s omitted) | | | $13 | | | | $13 | | | | $11 | |
Ratio to average net assets of: | | | | | | | | | | | | |
Expenses, net of waivers/reimbursements(f) | | | .26 | % | | | .27 | % | | | .28 | %^ |
Expenses, before waivers/reimbursements(f) | | | 1.55 | % | | | 4.27 | % | | | 21.98 | %^ |
Net investment income(c)(f) | | | 1.69 | % | | | 1.36 | % | | | 2.38 | %^ |
Portfolio turnover rate | | | 40 | % | | | 71 | % | | | 16 | % |
| (a) | Commencement of operations. |
| (b) | Based on average shares outstanding. |
| (c) | Net of fees and expenses waived/reimbursed by the Adviser. |
| (d) | Amount is less than $.005. |
| (e) | Total investment return is calculated assuming an initial investment made at the net asset value at the beginning of the period, reinvestment of all dividends and distributions at net asset value during the period, and redemption on the last day of the period. Initial sales charges or contingent deferred sales charges are not reflected in the calculation of total investment return. Total return does not reflect the deduction of taxes that a shareholder would pay on fund distributions or the redemption of fund shares. Total investment return calculated for a period of less than one year is not annualized. |
| (f) | The expense and net investment loss ratios do not include income earned or expenses incurred by the Fund through its Underlying Portfolios. |
| † | Due to timing of sales and repurchase of capital shares, the net realized and unrealized gain (loss) per share is not in accord with the Funds’ change in net realized and unrealized gain (loss) on investment transactions for the period. |
See notes to financial statements.
| | |
| abfunds.com | | AB MULTI-MANAGER SELECT RETIREMENT FUNDS | 233 |
REPORT OF INDEPENDENT REGISTERED
PUBLIC ACCOUNTING FIRM
To the Board of Directors and Shareholders of AB Multi-Manager Select Retirement Allocation Fund, AB Multi-Manager Select 2010 Fund, AB Multi-Manager Select 2015 Fund, AB Multi-Manager Select 2020 Fund, AB Multi-Manager Select 2025 Fund, AB Multi-Manager Select 2030 Fund, AB Multi-Manager Select 2035 Fund, AB Multi-Manager Select 2040 Fund, AB Multi-Manager Select 2045 Fund, AB Multi-Manager Select 2050 Fund and AB Multi-Manager Select 2055 Fund
We have audited the accompanying statements of assets and liabilities, including the portfolios of investments, of AB Multi-Manager Select Retirement Allocation Fund, AB Multi-Manager Select 2010 Fund, AB Multi-Manager Select 2015 Fund, AB Multi-Manager Select 2020 Fund, AB Multi-Manager Select 2025 Fund, AB Multi-Manager Select 2030 Fund, AB Multi-Manager Select 2035 Fund, AB Multi-Manager Select 2040 Fund, AB Multi-Manager Select 2045 Fund, AB Multi-Manager Select 2050 Fund and AB Multi-Manager Select 2055 Fund (collectively, the “Funds”), eleven of the portfolios constituting AB Cap Fund, Inc., as of July 31, 2017, and the related statements of operations for the year then ended, statements of changes in net assets for each of the two years in the period then ended and the financial highlights for each of the two years in the period then ended and the period December 15, 2014 (commencement of operations) to July 31, 2015. These financial statements and financial highlights are the responsibility of the Funds’ management. Our responsibility is to express an opinion on these financial statements and financial highlights based on our audits.
We conducted our audits in accordance with the standards of the Public Company Accounting Oversight Board (United States). Those standards require that we plan and perform the audit to obtain reasonable assurance about whether the financial statements and financial highlights are free of material misstatement. We were not engaged to perform an audit of the Funds’ internal control over financial reporting. Our audit included consideration of internal control over financial reporting as a basis for designing audit procedures that are appropriate in the circumstances, but not for the purpose of expressing an opinion on the effectiveness of the Funds’ internal control over financial reporting. Accordingly, we express no such opinion. An audit also includes examining, on a test basis, evidence supporting the amounts and disclosures in the financial statements and financial highlights, assessing the accounting principles used and significant estimates made by management, and evaluating the overall financial statement presentation. Our procedures included confirmation of securities owned as of July 31, 2017 by correspondence with the custodian and others or by other appropriate auditing procedures where replies from others were not received. We believe that our audits provide a reasonable basis for our opinion.
| | |
| 234 | AB MULTI-MANAGER SELECT RETIREMENT FUNDS | | abfunds.com |
REPORT OF INDEPENDENT REGISTERED
PUBLIC ACCOUNTING FIRM (continued)
In our opinion, the financial statements and financial highlights referred to above present fairly, in all material respects, the financial position of AB Multi-Manager Select Retirement Allocation Fund, AB Multi-Manager Select 2010 Fund, AB Multi-Manager Select 2015 Fund, AB Multi-Manager Select 2020 Fund, AB Multi-Manager Select 2025 Fund, AB Multi-Manager Select 2030 Fund, AB Multi-Manager Select 2035 Fund, AB Multi-Manager Select 2040 Fund, AB Multi-Manager Select 2045 Fund, AB Multi-Manager Select 2050 Fund and AB Multi-Manager Select 2055 Fund, eleven of the portfolios constituting AB Cap Fund, Inc., at July 31, 2017, the results of their operations for the year then ended, the changes in their net assets for each of the two years in the period then ended and the financial highlights for each of the two years in the period then ended and the period December 15, 2014 (commencement of operations) to July 31, 2015, in conformity with U.S. generally accepted accounting principles.

New York, New York
September 25, 2017
| | |
| abfunds.com | | AB MULTI-MANAGER SELECT RETIREMENT FUNDS | 235 |
2017 FEDERAL TAX INFORMATION
(unaudited)
For Federal income tax purposes, the following information is furnished with respect to the distributions paid by the Funds during the taxable year ended July 31, 2017. For such year, each of the AB Multi-Manager Select Retirement Funds designates the maximum amount allowable as qualified dividend income eligible to be taxed at the same rate as long-term capital gain.
Shareholders should not use the above information to prepare their income tax returns. The information necessary to complete your income tax returns will be included with your Form 1099-DIV which will be sent to you separately in January 2018.
| | |
| 236 | AB MULTI-MANAGER SELECT RETIREMENT FUNDS | | abfunds.com |
BOARD OF DIRECTORS
Marshall C. Turner, Jr.(1), Chairman
John H. Dobkin(1)
Michael J. Downey(1)
William H. Foulk, Jr.(1)
D. James Guzy(1)
Nancy P. Jacklin(1)
Robert M. Keith, President and Chief Executive Officer
Carol C. McMullen(1)
Garry L. Moody(1)
Earl D. Weiner(1)
OFFICERS
Philip L. Kirstein, Senior Vice President and Independent Compliance Officer
Daniel J. Loewy(2), Vice President
Christopher H. Nikolich(2), Vice President
Vadim Zlotnikov(2) , Vice President
Joseph J. Mantineo, Treasurer and Chief Financial Officer
Emilie D. Wrapp, Secretary
Phyllis J. Clarke, Controller
Vincent S. Noto, Chief Compliance Officer
| | |
Custodian and Accounting Agent State Street Bank and Trust Company
State Street Corporation CCB/5
1 Iron Street
Boston, MA 02210 Principal Underwriter AllianceBernstein Investments, Inc.
1345 Avenue of the Americas
New York, NY 10105 Transfer Agent AllianceBernstein Investor Services, Inc.
P.O. Box 786003
San Antonio, TX 78278-6003
Toll-Free (800) 221-5672 | | Independent Registered Public Accounting Firm Ernst & Young LLP
5 Times Square
New York, NY 10036 Legal Counsel Seward & Kissel LLP
One Battery Park Plaza
New York, NY 10004 |
| 1 | Member of the Audit Committee, the Governance and Nominating Committee and the Independent Directors Committee. |
| 2 | Messrs. Loewy, Nikolich, and Zlotnikov are the investment professionals at the Adviser with the most significant responsibility for the Adviser’s role in the day-to-day management of the Funds’ portfolios, which role includes monitoring the Funds’ sub-adviser and allocating Fund assets among asset classes. |
| | |
| abfunds.com | | AB MULTI-MANAGER SELECT RETIREMENT FUNDS | 237 |
MANAGEMENT OF THE FUND
| | | | | | | | |
NAME, ADDRESS, AGE AND (YEAR FIRST ELECTED) | | PRINCIPAL
OCCUPATION(S),
DURING PAST FIVE YEARS
AND OTHER INFORMATION | | PORTFOLIOS IN AB FUND COMPLEX OVERSEEN BY DIRECTOR | | | OTHER PUBLIC COMPANY DIRECTORSHIPS CURRENTLY HELD BY DIRECTOR
|
| INTERESTED DIRECTOR | | | | | | |
Robert M. Keith, # 57 (2010) | | Senior Vice President of AllianceBernstein L.P. (the “Adviser”) and the head of AllianceBernstein Investments, Inc. (“ABI”) since July 2008; Director of ABI and President of the AB Mutual Funds. Previously, he served as Executive Managing Director of ABI from December 2006 to June 2008. Prior to joining ABI in 2006, Executive Managing Director of Bernstein Global Wealth Management, and prior thereto, Senior Managing Director and Global Head of Client Service and Sales of the Adviser’s institutional investment management business since 2004. Prior thereto, he was Managing Director and Head of North American Client Service and Sales in the Adviser’s institutional investment management business with which he has been associated since prior to 2004. | | | 98 | | | None |
| | |
| 238 | AB MULTI-MANAGER SELECT RETIREMENT FUNDS | | abfunds.com |
MANAGEMENT OF THE FUND (continued)
| | | | | | | | |
NAME, ADDRESS, AGE AND (YEAR FIRST ELECTED) | | PRINCIPAL
OCCUPATION(S),
DURING PAST FIVE YEARS
AND OTHER INFORMATION | | PORTFOLIOS IN AB FUND COMPLEX OVERSEEN BY DIRECTOR | | | OTHER PUBLIC COMPANY DIRECTORSHIPS CURRENTLY HELD BY DIRECTOR
|
| INDEPENDENT TRUSTEES | | | | | | |
Marshall C. Turner, Jr., ## Chairman of the Board 75 (2005) | | Private Investor since prior to 2012. Former Chairman and CEO of Dupont Photomasks, Inc. (components of semi-conductor manufacturing). He has extensive operating leadership, and venture capital investing experience, including five interim or full-time CEO roles, and prior service as general partner of institutional venture capital partnerships. He also has extensive non-profit board leadership experience, and currently serves on the boards of two education and science-related non-profit organizations. He has served as a director of one AB Fund since 1992, and director or trustee of multiple AB Funds since 2005. He has been Chairman of the AB Funds since January 2014, and the Chairman of the Independent Directors Committees of such AB Funds since February 2014. | | | 98 | | | Xilinx, Inc. (programmable logic semi-conductors) since 2007 |
| | | | | | | | |
John H. Dobkin, ## 75 (1992) | | Independent Consultant since prior to 2012. Formerly, President of Save Venice, Inc. (preservation organization) from 2001-2002; Senior Advisor from June 1999–June 2000 and President of Historic Hudson Valley (historic preservation) from December 1989–May 1999. Previously, Director of the National Academy of Design. He has served as a director or trustee of various AB Funds since 1992 and as Chairman of the Audit Committees of a number of such AB Funds from 2001-2008. | | | 97 | | | None |
| | |
| abfunds.com | | AB MULTI-MANAGER SELECT RETIREMENT FUNDS | 239 |
MANAGEMENT OF THE FUND (continued)
| | | | | | | | |
NAME, ADDRESS, AGE AND (YEAR FIRST ELECTED) | | PRINCIPAL
OCCUPATION(S),
DURING PAST FIVE YEARS
AND OTHER INFORMATION | | PORTFOLIOS IN AB FUND COMPLEX OVERSEEN BY DIRECTOR | | | OTHER PUBLIC COMPANY DIRECTORSHIPS CURRENTLY HELD BY DIRECTOR
|
INDEPENDENT TRUSTEES
(continued) | | | | | | |
Michael J. Downey, ## 73 (2005) | | Private Investor since prior to 2012. Formerly, managing partner of Lexington Capital, LLC (investment advisory firm) from December 1997 until December 2003. He served as a Director of Prospect Acquisition Corp. (financial services) from 2007 until 2009. From 1987 until 1993, Chairman and CEO of Prudential Mutual Fund Management, director of the Prudential mutual funds, and member of the Executive Committee of Prudential Securities, Inc. He has served as a director or trustee of the AB Funds since 2005 and is a director and Chairman of one other registered investment company. | | | 98 | | | The Asia Pacific Fund, Inc. (registered investment company) since prior to 2012 |
| | | | | | | | |
William H. Foulk, Jr., ## 85 (1992) | | Investment Adviser and an Independent Consultant since prior to 2012. Previously, he was Senior Manager of Barrett Associates, Inc., a registered investment adviser. He was formerly Deputy Comptroller and Chief Investment Officer of the State of New York and, prior thereto, Chief Investment Officer of the New York Bank for Savings. He has served as a director or trustee of various AB Funds since 1983, and was Chairman of the Independent Directors Committees of the AB Funds from 2003 until early February 2014. He served as Chairman of such AB Funds from 2003 through December 2013. He is also active in a number of mutual fund related organizations and committees. | | | 98 | | | None |
| | |
| 240 | AB MULTI-MANAGER SELECT RETIREMENT FUNDS | | abfunds.com |
MANAGEMENT OF THE FUND (continued)
| | | | | | | | |
NAME, ADDRESS, AGE AND (YEAR FIRST ELECTED) | | PRINCIPAL
OCCUPATION(S),
DURING PAST FIVE YEARS
AND OTHER INFORMATION | | PORTFOLIOS IN AB FUND COMPLEX OVERSEEN BY DIRECTOR | | | OTHER PUBLIC COMPANY DIRECTORSHIPS CURRENTLY HELD BY DIRECTOR
|
INDEPENDENT TRUSTEES
(continued) | | | | | | |
D. James Guzy, ## 81 (2005) | | Chairman of the Board of SRC Computers, Inc. (semi-conductors), with which he has been associated since prior to 2012. He served as Chairman of the Board of PLX Technology (semi-conductors) since prior to 2012 until November 2013. He was a director of Intel Corporation (semi-conductors) from 1969 until 2008, and served as Chairman of the Finance Committee of such company for several years until May 2008. He has served as a director or trustee of one or more of the AB Funds since 1982. | | | 95 | | | None |
| | | | | | | | |
Nancy P. Jacklin, ## 69 (2006) | | Private Investor since prior to 2012. Professorial Lecturer at the Johns Hopkins School of Advanced International Studies (2008-2015). U.S. Executive Director of the International Monetary Fund (which is responsible for ensuring the stability of the international monetary system), (December 2002-May 2006); Partner, Clifford Chance (1992-2002); Sector Counsel, International Banking and Finance, and Associate General Counsel, Citicorp (1985-1992); Assistant General Counsel (International), Federal Reserve Board of Governors (1982-1985); and Attorney Advisor, U.S. Department of the Treasury (1973-1982). Member of the Bar of the District of Columbia and of New York; and member of the Council on Foreign Relations. She has served as a director or trustee of the AB Funds since 2006 and has been Chairman of the Governance and Nominating Committees of the AB Funds since August 2014. | | | 98 | | | None |
| | |
| abfunds.com | | AB MULTI-MANAGER SELECT RETIREMENT FUNDS | 241 |
MANAGEMENT OF THE FUND (continued)
| | | | | | | | |
NAME, ADDRESS, AGE AND (YEAR FIRST ELECTED) | | PRINCIPAL
OCCUPATION(S),
DURING PAST FIVE YEARS
AND OTHER INFORMATION | | PORTFOLIOS IN AB FUND COMPLEX OVERSEEN BY DIRECTOR | | | OTHER PUBLIC COMPANY DIRECTORSHIPS CURRENTLY HELD BY DIRECTOR
|
INDEPENDENT TRUSTEES
(continued) | | | | | | |
Carol C. McMullen, ## 62 (2016) | | Managing Director of Slalom Consulting (consulting) since 2014, private investor and member of the Partners Healthcare Investment Committee. Formerly, Director of Norfolk & Dedham Group (mutual property and casualty insurance) from 2011 until November 2016; Director of Partners Community Physicians Organization (healthcare) from 2014 until December 2016; and Managing Director of The Crossland Group (consulting) from 2012 until 2013. She has held a number of senior positions in the asset and wealth management industries, including at Eastern Bank (where her roles included President of Eastern Wealth Management), Thomson Financial (Global Head of Sales for Investment Management), and Putnam Investments (where her roles included Head of Global Investment Research). She has served on a number of private company and nonprofit boards, and as a director or trustee of the AB Funds since June 2016. | | | 98 | | | None |
| | |
| 242 | AB MULTI-MANAGER SELECT RETIREMENT FUNDS | | abfunds.com |
MANAGEMENT OF THE FUND (continued)
| | | | | | | | |
NAME, ADDRESS, AGE AND (YEAR FIRST ELECTED) | | PRINCIPAL
OCCUPATION(S),
DURING PAST FIVE YEARS
AND OTHER INFORMATION | | PORTFOLIOS IN AB FUND COMPLEX OVERSEEN BY DIRECTOR | | | OTHER PUBLIC COMPANY DIRECTORSHIPS CURRENTLY HELD BY DIRECTOR
|
INDEPENDENT TRUSTEES
(continued) | | | | | | |
Garry L. Moody, ## 65 (2008) | | Independent Consultant. Formerly, Partner, Deloitte & Touche LLP (1995-2008) where he held a number of senior positions, including Vice Chairman, and U.S. and Global Investment Management Practice Managing Partner; President, Fidelity Accounting and Custody Services Company (1993-1995), where he was responsible for accounting, pricing, custody and reporting for the Fidelity mutual funds; and Partner, Ernst & Young LLP (1975-1993), where he served as the National Director of Mutual Fund Tax Services and Managing Partner of its Chicago Office Tax department. He is a member of the Trustee Advisory Board of BoardIQ, a biweekly publication focused on issues and news affecting directors of mutual funds. He has served as a director or trustee, and as Chairman of the Audit Committees, of the AB Funds since 2008. | | | 98 | | | None |
| | | | | | | | |
Earl D. Weiner, ## 78 (2007) | | Of Counsel, and Partner prior to January 2007, of the law firm Sullivan & Cromwell LLP and is a former member of the ABA Federal Regulation of Securities Committee Task Force to draft editions of the Fund Director’s Guidebook. He also serves as a director or trustee of various non-profit organizations and has served as Chairman or Vice Chairman of a number of them. He has served as a director or trustee of the AB Funds since 2007 and served as Chairman of the Governance and Nominating Committees of the AB Funds from 2007 until August 2014. | | | 98 | | | None |
| | |
| abfunds.com | | AB MULTI-MANAGER SELECT RETIREMENT FUNDS | 243 |
MANAGEMENT OF THE FUND (continued)
| * | The address for each of the Fund’s disinterested Directors is c/o AllianceBernstein L.P., Attention: Philip L. Kirstein, 1345 Avenue of the Americas, New York, NY 10105. |
| ** | There is no stated term of office for the Fund’s Directors. |
| *** | The information above includes each Director’s principal occupation during the last five years and other information relating to the experience, attributes and skills relevant to each Director’s qualifications to serve as a Director, which led to the conclusion that each Director should serve as a Director for the Fund. |
| # | Mr. Keith is an “interested person” of the Fund, as defined in the 1940 Act, due to his position as a Senior Vice President of the Adviser. |
| ## | Member pf the Audit Committee, the Governance and Nominating Committee and the Independent Directors Committee. |
| | |
| 244 | AB MULTI-MANAGER SELECT RETIREMENT FUNDS | | abfunds.com |
MANAGEMENT OF THE FUND (continued)
Officer Information
| | | | |
NAME, ADDRESS*
AND AGE | | POSITION(S)
HELD WITH TRUST | | PRINCIPAL OCCUPATION
DURING PAST 5 YEARS |
Robert M. Keith 57 | | President and Chief Executive Officer | | See biography above. |
| | | | |
Philip L. Kirstein 72 | | Senior Vice President and Independent Compliance Officer | | Senior Vice President and Independent Compliance Officer of the AB Funds, with which he has been associated since October 2004. Prior thereto, he was Of Counsel to Kirkpatrick & Lockhart, LLP from October 2003 to October 2004, and General Counsel of Merrill Lynch Investment Managers, L.P., since prior to March 2003. |
| | | | |
Daniel J. Loewy 42 | | Vice President | | Senior Vice President of the Adviser**, with which he has been associated since prior to 2012. |
| | | | |
Christopher H. Nikolich 47 | | Vice President | | Senior Vice President of the Adviser**, with which he has been associated since prior to 2012. |
| | | | |
Vadim Zlotnikov 55 | | Vice President | | Senior Vice President of the Adviser**, with which he has been associated since prior to 2012. |
| | | | |
Emilie D. Wrapp 61 | | Secretary | | Senior Vice President, Assistant General Counsel and Assistant Secretary of ABI**, with which she has been associated since prior to 2012. |
| | | | |
Joseph J. Mantineo 58 | | Treasurer and Chief Financial Officer | | Senior Vice President of AllianceBernstein Investor Services (“ABIS”)**, with which he has been associated since prior to 2012. |
| | | | |
Phyllis J. Clarke 56 | | Controller | | Vice President of ABIS**, with which she has been associated since prior to 2012. |
| | | | |
Vincent S. Noto 52 | | Chief Compliance Officer | | Senior Vice President since 2015 and Mutual Fund Chief Compliance Officer since 2014. Prior thereto, he was Vice President and Director of Mutual Fund Compliance of the Adviser** since prior to 2012. |
| * | The address for each of the Fund’s Officers is 1345 Avenue of the Americas, New York, NY 10105. |
| ** | The Adviser, ABI and ABIS are affiliates of the Fund. |
| | The Fund’s Statement of Additional Information (“SAI”) has additional information about the Fund’s Directors and Officers and is available without charge upon request. Contact your financial representative or AB at 1-(800) 227-4618, or visit www.abfunds.com, for a free prospectus or SAI. |
| | |
| abfunds.com | | AB MULTI-MANAGER SELECT RETIREMENT FUNDS | 245 |
Information Regarding the Review and Approval of the Advisory Agreement and Sub-Advisory Agreement in Respect of Each Fund
The disinterested directors (the “directors”) of AB Cap Fund, Inc. (the “Company”) unanimously approved (i) the continuance of the Company’s Advisory Agreement with the Adviser in respect of each of the portfolios listed below (each, a “Fund” and collectively, the “Funds”) and (ii) the proposed amendment to the Sub-Advisory Agreement (the “Amended Sub-Advisory Agreement” and, together with the Advisory Agreement, the “Advisory Contracts”) between the Adviser and Morningstar Investment Management LLC (formerly Morningstar Associates, LLC) (the “Sub-Adviser”) in respect of each Fund at a meeting held on August 2-3, 2016 (the “Meeting”).
| | • | | AB Multi-Manager Select Retirement Allocation Fund |
| | • | | AB Multi-Manager Select 2010 Fund |
| | • | | AB Multi-Manager Select 2015 Fund |
| | • | | AB Multi-Manager Select 2020 Fund |
| | • | | AB Multi-Manager Select 2025 Fund |
| | • | | AB Multi-Manager Select 2030 Fund |
| | • | | AB Multi-Manager Select 2035 Fund |
| | • | | AB Multi-Manager Select 2040 Fund |
| | • | | AB Multi-Manager Select 2045 Fund |
| | • | | AB Multi-Manager Select 2050 Fund |
| | • | | AB Multi-Manager Select 2055 Fund |
Prior to approval of the Advisory Contracts, the directors had requested from the Adviser and the Sub-Adviser, and received and evaluated, extensive materials. They reviewed the proposed approval of the Advisory Contracts with the Adviser and with experienced counsel who are independent of the Adviser, who advised on the relevant legal standards. The directors also reviewed an independent evaluation prepared by the Company’s Senior Officer (who is also the Company’s Independent Compliance Officer) of the reasonableness of the advisory fee in respect of each Fund, in which the Senior Officer concluded that the contractual fee for each Fund was reasonable. The directors also discussed the proposed approvals in private sessions with counsel and the Company’s Senior Officer.
The directors considered their knowledge of the nature and quality of the services provided by the Adviser to the Funds gained from their experience as directors or trustees of most of the registered investment companies advised by the Adviser, their overall confidence in the Adviser’s integrity and competence they have gained from that experience, the Adviser’s initiative in identifying and raising potential issues with the directors and its responsiveness, frankness and attention to concerns raised by the directors in the past, including the Adviser’s willingness to consider and implement organizational and operational changes designed to improve investment results and the
| | |
| 246 | AB MULTI-MANAGER SELECT RETIREMENT FUNDS | | abfunds.com |
services provided to the AB Funds. The directors noted that they have four regular meetings each year, at each of which they receive presentations from the Adviser on the investment results of the Funds and review extensive materials and information presented by the Adviser. The directors also receive an annual presentation from the Sub-Adviser addressing the Sub-Adviser’s services to the Funds.
The directors also considered all other factors they believed relevant, including the specific matters discussed below. In their deliberations, the directors did not identify any particular information that was all-important or controlling, and different directors may have attributed different weights to the various factors. The directors determined that the selection of the Adviser to manage each Fund, and the overall arrangements (i) between each Fund and the Adviser, as provided in the Advisory Agreement, including the advisory fee and (ii) between the Adviser and the Sub-Adviser, as provided in the Amended Sub-Advisory Agreement, including the sub-advisory fee payable by the Adviser to the Sub-Adviser, were fair and reasonable in light of the services performed, expenses incurred and such other matters as the directors considered relevant in the exercise of their business judgment. The material factors and conclusions that formed the basis for the directors’ determinations included the following:
Nature, Extent and Quality of Services Provided
The directors considered the scope and quality of services provided by the Adviser under the Advisory Agreement, including the quality of the investment research capabilities of the Adviser and the other resources it has dedicated to performing services for the Funds. The directors considered both the investment advisory services and the other non-advisory services outlined with specificity in the Advisory Agreement that are provided to the Funds by the Adviser. They also noted the professional experience and qualifications of the Adviser’s personnel who oversee the Sub-Adviser, other members of the investment team and other senior personnel of the Adviser. The directors noted that the Advisory Agreement, unlike the advisory agreements for most of the other AB Funds, does not provide for reimbursement to the Adviser of the Adviser’s costs of providing administrative and accounting services for the Funds. These services are covered by the advisory fee.
The directors noted that the Funds invest in a mix of mutual funds advised by the Adviser (“AB Mutual Funds”) and mutual funds and exchange-traded funds managed by third parties unaffiliated with the Adviser (“External Funds” and together with the AB Mutual Funds, “Underlying Funds”). The Sub-Adviser selects Underlying Funds within each asset class for investment by the Funds from among AB Mutual Funds and funds offered by other fund complexes that have entered into a participation agreement or similar arrangement with the Funds. The directors noted that the Amended Sub-Advisory Agreement gives broader latitude
| | |
| abfunds.com | | AB MULTI-MANAGER SELECT RETIREMENT FUNDS | 247 |
to the Sub-Adviser to identify funds for investment that are not in the current families of approved External Funds, subject to the Adviser’s ability to enter into the necessary arrangements with the new funds, and does not alter the original 33% target with 40% cap for AB Mutual Funds.
The quality of administrative and other services, including the Adviser’s role in coordinating the activities of each Fund’s other service providers, also was considered. The directors concluded that, overall, they were satisfied with the nature, extent and quality of services provided to each of the Funds under the Advisory Agreement.
Costs of Services Provided and Profitability
The directors reviewed a schedule of the revenues, expenses and related notes indicating the profitability of each Fund to the Adviser for the period ended December 31, 2014 and for calendar year 2015 that had been prepared with an expense allocation methodology arrived at in consultation with an independent consultant retained by the Company’s Senior Officer. The directors noted the assumptions and methods of allocation used by the Adviser in preparing fund-specific profitability data and understood that there are a number of potentially acceptable allocation methodologies for information of this type. The directors noted that the profitability information reflected all revenues and expenses of the Adviser’s relationship with the Funds, including those relating to its subsidiaries that provide transfer agency, distribution and brokerage services to the Funds. The directors recognized that it is difficult to make comparisons of the profitability of the Advisory Agreement with the profitability of advisory contracts for unaffiliated funds because comparative information is not generally publicly available and is affected by numerous factors. The directors focused on the profitability of the Adviser’s relationship with the Funds before taxes and distribution expenses. The directors noted that the Funds were not profitable to the Adviser in the periods reviewed.
Fall-Out Benefits
The directors considered the other benefits to the Adviser and its affiliates from their relationships with the Funds, including, but not limited to, benefits relating to soft dollar arrangements (whereby investment advisers receive brokerage and research services from brokers that execute agency transactions for their clients); 12b-1 fees and sales charges received by the Funds’ principal underwriter (which is a wholly owned subsidiary of the Adviser) in respect of certain classes of the Funds’ shares; brokerage commissions paid by the Funds to brokers affiliated with the Adviser; and transfer agency fees paid by the Funds to a wholly owned subsidiary of the Adviser. The directors recognized that each Fund’s unprofitability to the Adviser would be exacerbated without these benefits. The directors understood that the Adviser also might derive reputational and other benefits from its association with the Funds.
| | |
| 248 | AB MULTI-MANAGER SELECT RETIREMENT FUNDS | | abfunds.com |
Investment Results
In addition to the information reviewed by the directors in connection with the Meeting, the directors receive detailed performance information for each Fund at each regular Board meeting during the year. At the Meeting, the directors reviewed information prepared by Broadridge Financial Solutions, Inc. (“Broadridge”), an analytical service that is not affiliated with the Adviser, showing the performance of the Class A Shares of each Fund against a peer group and a peer universe selected by Broadridge, and information prepared by the Adviser showing performance of the Class A Shares against a broad-based securities market index, in each case for the 1-year period ended May 31, 2016, and (in the case of comparisons with the broad-based securities market index) the period since inception. Based on their review, the directors concluded that each Fund’s investment performance was acceptable.
Advisory Fee and Other Expenses
The directors considered the advisory fee rate paid by each Fund to the Adviser and information prepared by Broadridge concerning advisory fee rates paid by other funds in the same Broadridge category as such Fund at a common asset level. The directors recognized that it is difficult to make comparisons of advisory fees because there are variations in the services that are included in the fees paid by other funds. The directors considered each Fund’s contractual advisory fee rate against a peer group median.
The directors also considered the Adviser’s fee schedule for institutional clients pursuing a similar investment style. For this purpose, they reviewed the relevant advisory fee information from the Adviser’s Form ADV and the evaluation from the Company’s Senior Officer and noted the differences between each Fund’s fee schedule, on the one hand, and the institutional fee schedule and the schedule of fees charged to any offshore funds and any sub-advised funds, on the other. The directors noted that the Adviser may, in some cases, agree to fee rates with large institutional clients that are lower than those reviewed by the directors and that they had previously discussed with the Adviser its policies in respect of such arrangements.
The Adviser reviewed with the directors the significantly greater scope of the services it provides to the Funds relative to institutional, offshore fund and sub-advised fund clients. In light of the substantial differences in services rendered by the Adviser to institutional, offshore fund and sub-advised fund clients as compared to funds such as the Funds, as well as the difference in fee structure, the directors considered these fee comparisons inapt and did not place significant weight on them in their deliberations.
The directors noted that each Fund invests in Underlying Funds pursuant to a Fund of Funds Order from the SEC. The directors concluded that the advisory fee for each Fund is based on services provided that are in addition to, rather than duplicative of, the services provided under the advisory contracts of the Underlying Funds in which the Funds may invest.
| | |
| abfunds.com | | AB MULTI-MANAGER SELECT RETIREMENT FUNDS | 249 |
The directors considered the total expense ratio of the Class A shares of each Fund in comparison to a peer group and a peer universe selected by Broadridge. The Class A expense ratio of each Fund was based on the Fund’s latest fiscal year and the information (except in the case of AB Multi-Manager Select 2035 Fund) included the pro forma expense ratio to reflect the expense cap level effective January 6, 2016. The directors noted the effects of any fee waivers and/or expense reimbursements as a result of an undertaking by the Adviser. The directors noted that it was likely that the expense ratios of some of the other funds in each Fund’s Broadridge category were lowered by waivers or reimbursements by those funds’ investment advisers, which in some cases might be voluntary or temporary. The directors view expense ratio information as relevant to their evaluation of the Adviser’s services because the Adviser is responsible for coordinating services provided to the Funds by others.
AB Multi-Manager Select Retirement Allocation Fund
AB Multi-Manager Select 2010 Fund
AB Multi-Manager Select 2015 Fund
AB Multi-Manager Select 2020 Fund
AB Multi-Manager Select 2030 Fund
AB Multi-Manager Select 2050 Fund
Based on their review, the directors concluded that each Fund’s pro forma expense ratio was acceptable.
AB Multi-Manager Select 2040 Fund
AB Multi-Manager Select 2045 Fund
AB Multi-Manager Select 2055 Fund
After reviewing and discussing the Adviser’s explanations of the reasons each Fund’s pro forma expense ratio was above its peer group median, the directors concluded that each Fund’s pro forma expense ratio was acceptable.
AB Multi-Manager Select 2025 Fund
AB Multi-Manager Select 2035 Fund
After reviewing and discussing the Adviser’s explanations of the reasons each Fund’s expense ratio (pro forma expense ratio in the case of AB Multi-Manager Select 2025 Fund) was above the medians, the directors concluded that such expense ratios were acceptable.
Approval of Amended Sub-Advisory Agreement
Nature, Extent and Quality of Services Provided and Performance
In determining to approve the Amended Sub-Advisory Agreement, the directors relied to a significant extent on the due diligence review performed by the Adviser to develop a recommendation to the directors for
| | |
| 250 | AB MULTI-MANAGER SELECT RETIREMENT FUNDS | | abfunds.com |
the Sub-Adviser to continue to serve as sub-adviser for each of the Funds. The directors also reviewed extensive materials concerning the Sub-Adviser. The directors’ review of the Sub-Adviser and the nature and quality of the services provided by it covered, among other things: (i) the Sub-Adviser’s operations and principal business activities, services provided by the Sub-Adviser and senior and professional personnel who perform services for the Funds, (ii) investment advisory services provided by the Sub-Adviser to the Funds, and (iii) the Sub-Adviser’s compliance structure and program.
Cost of Services Provided and Profitability
The directors considered the amount and competitiveness of the sub-advisory fee payable to the Sub-Adviser, noting that such fee had been negotiated by the Adviser (which is not affiliated with the Sub-Adviser) and was payable by the Adviser out of the advisory fee paid to the Adviser by the Funds. They also considered profitability information that the Adviser obtained from the Sub-Adviser.
Economies of Scale
The directors noted that the advisory fee schedule for the Funds does not contain breakpoints and that they had discussed their strong preference for breakpoints in advisory contracts with the Adviser. The directors noted that the sub-advisory fee schedule for the Funds contains breakpoints that reduce fee rates on assets above specified levels. The sub-advisory fee schedule also provides for an annual minimum fee. Because the Sub-Adviser’s fee schedule includes breakpoints which the Adviser’s fee schedule does not, the Adviser would retain a larger fee on a percentage basis as the Funds grow. The directors took into consideration prior presentations by an independent consultant on economies of scale in the mutual fund industry and for the AB Funds, and by the Adviser concerning certain of its views on economies of scale. The directors also had requested and received from the Adviser certain updates on economies of scale in advance of the Meeting. The directors believe that economies of scale may be realized (if at all) by the Adviser and the Sub-Adviser across a variety of products and services, and not only in respect of a single fund. The directors noted that there is no established methodology for setting breakpoints that give effect to the fund-specific services provided by a fund’s adviser or sub-adviser and to the economies of scale that an adviser or sub-adviser may realize in its overall mutual fund or asset management business or those components of it which directly or indirectly affect a fund’s operations. The directors observed that in the mutual fund industry as a whole, as well as among funds similar to the Funds, there is no uniformity or pattern in the fees and asset levels at which breakpoints (if any) apply. The directors also noted that the advisory agreements for many funds do not have breakpoints at all. The directors informed the Adviser that they would monitor each Fund’s assets (which were well below the level at which they would anticipate adding an initial breakpoint) and its profitability (currently unprofitable) to the Adviser and anticipated revisiting the question of breakpoints in the advisory fee schedule in the future if circumstances warranted doing so.
| | |
| abfunds.com | | AB MULTI-MANAGER SELECT RETIREMENT FUNDS | 251 |
This page is not part of the Shareholder Report or the Financial Statements.
AB FAMILY OF FUNDS
US EQUITY
US CORE
Core Opportunities Fund
Select US Equity Portfolio
US GROWTH
Concentrated Growth Fund
Discovery Growth Fund
Growth Fund
Large Cap Growth Fund
Small Cap Growth Portfolio
US VALUE
Discovery Value Fund
Equity Income Fund
Relative Value Fund1
Small Cap Value Portfolio
Value Fund
INTERNATIONAL/ GLOBAL EQUITY
INTERNATIONAL/ GLOBAL CORE
Global Core Equity Portfolio
International Portfolio
International Strategic Core Portfolio
Sustainable Global Thematic Fund1
Tax-Managed International Portfolio
Tax-Managed Wealth Appreciation Strategy
Wealth Appreciation Strategy
INTERNATIONAL/ GLOBAL GROWTH
Concentrated International Growth Portfolio
International Growth Fund
INTERNATIONAL/ GLOBAL EQUITY (continued)
INTERNATIONAL/ GLOBAL VALUE
Asia ex-Japan Equity Portfolio
International Value Fund
FIXED INCOME
MUNICIPAL
High Income Municipal Portfolio
Intermediate California Municipal Portfolio
Intermediate Diversified Municipal Portfolio
Intermediate New York Municipal Portfolio
Municipal Bond Inflation Strategy
Tax-Aware Fixed Income Portfolio
National Portfolio
Arizona Portfolio
California Portfolio
Massachusetts Portfolio
Minnesota Portfolio
New Jersey Portfolio
New York Portfolio
Ohio Portfolio
Pennsylvania Portfolio
Virginia Portfolio
TAXABLE
Bond Inflation Strategy
Global Bond Fund
High Income Fund
High Yield Portfolio
Income Fund
Intermediate Bond Portfolio
Limited Duration High Income Portfolio
Short Duration Portfolio
ALTERNATIVES
All Market Real Return Portfolio
Credit Long/Short Portfolio
Global Real Estate Investment Fund
Select US Long/Short Portfolio
Unconstrained Bond Fund
MULTI-ASSET
All Market Income Portfolio
All Market Total Return Portfolio1
Conservative Wealth Strategy
Emerging Markets Multi-Asset Portfolio
Global Risk Allocation Fund
Tax-Managed All Market Income Portfolio1
TARGET-DATE
Multi-Manager Select Retirement Allocation Fund
Multi-Manager Select 2010 Fund
Multi-Manager Select 2015 Fund
Multi-Manager Select 2020 Fund
Multi-Manager Select 2025 Fund
Multi-Manager Select 2030 Fund
Multi-Manager Select 2035 Fund
Multi-Manager Select 2040 Fund
Multi-Manager Select 2045 Fund
Multi-Manager Select 2050 Fund
Multi-Manager Select 2055 Fund
CLOSED-END FUNDS
Alliance California Municipal Income Fund
AllianceBernstein Global High Income Fund
AllianceBernstein National Municipal Income Fund
We also offer Government Exchange Reserves, which serves as the money market fund exchange vehicle for the AB mutual funds. An investment in Government Exchange Reserves is not a deposit in a bank and is not insured or guaranteed by the Federal Deposit Insurance Corporation or any other government agency. Although the Fund seeks to preserve the value of your investment at $1.00 per share, it is possible to lose money by investing in the Fund.
Investors should consider the investment objectives, risks, charges and expenses of the Fund carefully before investing. For copies of our prospectus or summary prospectus, which contain this and other information, visit us online at www.abfunds.com or contact your AB representative. Please read the prospectus and/or summary prospectus carefully before investing.
| 1 | Prior to November 1, 2016, Sustainable Global Thematic Fund was named Global Thematic Growth Fund; prior to January 9, 2017, Relative Value Fund was named Growth & Income Fund; prior to April 17, 2017, Tax-Managed All Market Income Portfolio was named Tax-Managed Balanced Wealth Strategy; prior to April 24, 2017, All Market Total Return Portfolio was named Balanced Wealth Strategy. |
| | |
| 252 | AB MULTI-MANAGER SELECT RETIREMENT FUNDS | | abfunds.com |
NOTES
| | |
| abfunds.com | | AB MULTI-MANAGER SELECT RETIREMENT FUNDS | 253 |
NOTES
| | |
| 254 | AB MULTI-MANAGER SELECT RETIREMENT FUNDS | | abfunds.com |
NOTES
| | |
| abfunds.com | | AB MULTI-MANAGER SELECT RETIREMENT FUNDS | 255 |
NOTES
| | |
| 256 | AB MULTI-MANAGER SELECT RETIREMENT FUNDS | | abfunds.com |
AB MULTI-MANAGER SELECT RETIREMENT FUNDS
1345 Avenue of the Americas
New York, NY 10105
800 221 5672
MMSR-0151-0717 
JUL 07.31.17
ANNUAL REPORT
AB SMALL CAP GROWTH PORTFOLIO


| | |
| |
| Investment Products Offered | | • Are Not FDIC Insured • May Lose Value • Are Not Bank Guaranteed |
Investors should consider the investment objectives, risks, charges and expenses of the Fund carefully before investing. For copies of our prospectus or summary prospectus, which contain this and other information, visit us online at www.abfunds.com or contact your AB representative. Please read the prospectus and/or summary prospectus carefully before investing.
This shareholder report must be preceded or accompanied by the Fund’s prospectus for individuals who are not current shareholders of the Fund.
You may obtain a description of the Fund’s proxy voting policies and procedures, and information regarding how the Fund voted proxies relating to portfolio securities during the most recent 12-month period ended June 30, without charge. Simply visit AB’s website at www.abfunds.com, or go to the Securities and Exchange Commission’s (the “Commission”) website at www.sec.gov, or call AB at (800) 227 4618.
The Fund files its complete schedule of portfolio holdings with the Commission for the first and third quarters of each fiscal year on Form N-Q. The Fund’s Forms N-Q are available on the Commission’s website at www.sec.gov. The Fund’s Forms N-Q may also be reviewed and copied at the Commission’s Public Reference Room in Washington, DC; information on the operation of the Public Reference Room may be obtained by calling (800) SEC 0330. AB publishes full portfolio holdings for the Fund monthly at www.abfunds.com.
AllianceBernstein Investments, Inc. (ABI) is the distributor of the AB family of mutual funds. ABI is a member of FINRA and is an affiliate of AllianceBernstein L.P., the Adviser of the funds.
The [A/B] logo is a registered service mark of AllianceBernstein and AllianceBernstein® is a registered service mark used by permission of the owner, AllianceBernstein L.P.
| | |
| FROM THE PRESIDENT | |  |
Dear Shareholder,
We are pleased to provide this report for AB Small Cap Growth Portfolio (the “Fund”). Please review the discussion of Fund performance, the market conditions during the reporting period and the Fund’s investment strategy.
As always, AB strives to keep clients ahead of what’s next by:
| + | | Transforming uncommon insights into uncommon knowledge with a global research scope |
| + | | Navigating markets with seasoned investment experience and sophisticated solutions |
| + | | Providing thoughtful investment insights and actionable ideas |
Whether you’re an individual investor or a multi-billion-dollar institution, we put knowledge and experience to work for you.
AB’s global research organization connects and collaborates across platforms and teams to deliver impactful insights and innovative products. Better insights lead to better opportunities—anywhere in the world.
For additional information about AB’s range of products and shareholder resources, please log on to www.abfunds.com.
Thank you for your investment in the AB Mutual Funds.
Sincerely,

Robert M. Keith
President and Chief Executive Officer, AB Mutual Funds
| | |
| abfunds.com | | AB SMALL CAP GROWTH PORTFOLIO | 1 |
ANNUAL REPORT
September 15, 2017
This report provides management’s discussion of fund performance for AB Small Cap Growth Portfolio for the annual reporting period ended July 31, 2017.
The Fund’s investment objective is long-term growth of capital.
NAV RETURNS AS OF JULY 31, 2017 (unaudited)
| | | | | | | | |
| | | 6 Months | | | 12 Months | |
| AB SMALL CAP GROWTH PORTFOLIO1 | | | | | | | | |
| Class A Shares | | | 12.83% | | | | 21.99% | |
| Class B Shares2 | | | 12.38% | | | | 21.24% | |
| Class C Shares | | | 12.40% | | | | 21.11% | |
| Advisor Class Shares3 | | | 12.95% | | | | 22.28% | |
| Class R Shares3 | | | 12.58% | | | | 21.58% | |
| Class K Shares3 | | | 12.77% | | | | 21.94% | |
| Class I Shares3 | | | 12.96% | | | | 22.31% | |
| Class Z Shares3 | | | 13.01% | | | | 22.45% | |
| Russell 2000 Growth Index | | | 9.14% | | | | 17.76% | |
| 1 | Includes the impact of proceeds received and credited to the Fund resulting from class action settlements, which enhanced the performance of all share classes of the Fund for the six- and 12-month periods ended July 31, 2017, by 0.01% and 0.03%, respectively. Also includes the impact of a non-recurring refund for overbilling of prior years’ custody out of pocket fees, which enhanced performance for the six- and 12-month periods ended July 31, 2017, by 0.00% and 0.01%, respectively. The returns shown are based on net asset values calculated for shareholder transactions and may differ from the returns shown in the Financial Highlights, which reflect adjustments made to the net asset values in accordance with accounting principles generally accepted in the United States of America. |
| 2 | Effective January 31, 2009, Class B shares are no longer available for purchase to new investors. Please see Note A for more information. |
| 3 | Please note that these share classes are for investors purchasing shares through accounts established under certain fee-based programs sponsored and maintained by certain broker-dealers and financial intermediaries, institutional pension plans and/or investment advisory clients of, and certain other persons associated with, the Adviser and its affiliates or the Fund. |
Please keep in mind that high, double-digit returns are highly unusual and cannot be sustained. Investors should also be aware that these returns were primarily achieved during favorable market conditions.
INVESTMENT RESULTS
The table above shows the Fund’s performance compared to its benchmark, the Russell 2000 Growth Index, for the six- and 12-month periods ended July 31, 2017.
All share classes of the Fund outperformed the benchmark for both periods, before sales charges. Stock selection contributed to performance as the market focused on companies that delivered stronger-than-expected earnings growth.
| | |
| 2 | AB SMALL CAP GROWTH PORTFOLIO | | abfunds.com |
During the 12-month period, stock selection, relative to the benchmark contributed in the financials sector and in the health care sector, helped by biopharmaceutical holdings. Positioning in the energy sector detracted amid falling US crude oil prices. For the six-month period, stock selection in the technology and health care sectors contributed. Positioning in the energy sector detracted, as did stock selection in the consumer/commercial services sector.
The Fund did not utilize derivatives during either period.
MARKET REVIEW AND INVESTMENT STRATEGY
Despite a few brief pullbacks, US equities recorded strong gains during the 12-month period ended July 31, 2017. Markets were boosted by solid corporate earnings and continued expectations for steady-to-improving economic growth. Consumer confidence remained high, supported by a 16-year-low US unemployment rate. While US large-caps performed in line with their global peers, small-cap US stocks trailed as hopes faded for a broad tax cut that would benefit smaller companies.
Reflecting a bottom-up investment process, the Fund’s Senior Investment Management Team (the “Team”) continued to find opportunities across most sectors, with a greater emphasis on companies that are less dependent on the short-term macro outlook. The Fund’s positioning in technology continued to emphasize secular software ideas over more cyclically oriented subsectors given attractive relative valuation. In health care, the Team maintained an overweight to medical devices that exhibited healthy unit volume trends with relatively less headline risk with respect to pricing regulation. Concerns over policy changes regarding the Affordable Care Act have led to an underweight to health care services, pending better visibility into the final proposal. Financials remained an underweight overall, given a consistent lack of exposure to real estate investment trusts. The Team continued to closely monitor global GDP trends and opportunistically narrowed the underweight to industrials.
INVESTMENT POLICIES
The Fund invests primarily in a diversified portfolio of equity securities with relatively smaller capitalizations as compared to the overall US market. Under normal circumstances, the Fund invests at least 80% of its net assets in equity securities of smaller companies. For these purposes, “smaller companies” are those that, at the time of investment, fall within the lowest 20% of the total US equity market capitalization (excluding, for purposes of this calculation, companies with market capitalizations of less than $10 million). Because the Fund’s definition of smaller companies is dynamic, the limits on market capitalization will change with the markets.
| | |
| abfunds.com | | AB SMALL CAP GROWTH PORTFOLIO | 3 |
(continued on next page)
The Fund may invest in any company and industry and in any type of equity security with potential for capital appreciation. It invests in well-known and established companies and in new and less-seasoned companies. The Fund’s investment policies emphasize investments in companies that are demonstrating improving financial results and a favorable earnings outlook. The Fund may invest in foreign securities. The Fund may periodically invest in the securities of companies that are expected to appreciate due to a development particularly or uniquely applicable to that company regardless of general business conditions or movements of the market as a whole.
The Fund invests primarily in equity securities but may also invest in other types of securities, such as preferred stocks. The Fund may, at times, invest in shares of exchange-traded funds (“ETFs”) in lieu of making direct investments in securities. ETFs may provide more efficient and economical exposure to the types of companies and geographic locations in which the Fund seeks to invest than direct investments. The Fund may also invest up to 20% of its total assets in rights or warrants.
The Fund may enter into derivatives transactions, such as options, futures contracts, forwards and swaps. The Fund may use options strategies involving the purchase and/or writing of various combinations of call and/or put options, including on individual securities and stock indices, futures contracts (including futures contracts on individual securities and stock indices) or shares of ETFs. These transactions may be used, for example, in an effort to earn extra income, to adjust exposure to individual securities or markets, or to protect all or a portion of the Fund’s portfolio from a decline in value, sometimes within certain ranges.
| | |
| 4 | AB SMALL CAP GROWTH PORTFOLIO | | abfunds.com |
DISCLOSURES AND RISKS
Benchmark Disclosure
The Russell 2000® Growth Index is unmanaged and does not reflect fees and expenses associated with the active management of a mutual fund portfolio. The Russell 2000 Growth Index represents the performance of 2,000 small-cap growth companies within the US. An investor cannot invest directly in an index, and its results are not indicative of the performance for any specific investment, including the Fund.
A Word About Risk
Market Risk: The value of the Fund’s assets will fluctuate as the stock or bond market fluctuates. The value of its investments may decline, sometimes rapidly and unpredictably, simply because of economic changes or other events that affect large portions of the market. It includes the risk that a particular style of investing, such as growth, may underperform the market generally.
Capitalization Risk: Investments in small- and mid-capitalization companies may be more volatile than investments in large-capitalization companies. Investments in small-capitalization companies may have additional risks because these companies have limited product lines, markets or financial resources.
Foreign (Non-US) Risk: Investments in securities of non-US issuers may involve more risk than those of US issuers. These securities may fluctuate more widely in price and may be less liquid due to adverse market, economic, political, regulatory or other factors.
Derivatives Risk: Derivatives may be illiquid, difficult to price, and leveraged so that small changes may produce disproportionate losses for the Fund, and may be subject to counterparty risk to a greater degree than more traditional investments.
Management Risk: The Fund is subject to management risk because it is an actively managed investment fund. The Adviser will apply its investment techniques and risk analyses in making investment decisions for the Fund, but there is no guarantee that its techniques will produce the intended results.
These risks are fully discussed in the Fund’s prospectus. As with all investments, you may lose money by investing in the Fund.
An Important Note About Historical Performance
The investment return and principal value of an investment in the Fund will fluctuate, so that shares, when redeemed, may be worth more or less than their original cost. Performance shown in this report represents past performance and does not guarantee future
| | |
| abfunds.com | | AB SMALL CAP GROWTH PORTFOLIO | 5 |
DISCLOSURES AND RISKS (continued)
results. Current performance may be lower or higher than the performance information shown. You may obtain performance information current to the most recent month-end by visiting www.abfunds.com.
All fees and expenses related to the operation of the Fund have been deducted. Net asset value (“NAV”) returns do not reflect sales charges; if sales charges were reflected, the Fund’s quoted performance would be lower. SEC returns reflect the applicable sales charges for each share class: a 4.25% maximum front-end sales charge for Class A shares; the applicable contingent deferred sales charge for Class B shares (4% year 1, 3% year 2, 2% year 3, 1% year 4) and a 1% 1-year contingent deferred sales charge for Class C shares. Returns for the different share classes will vary due to different expenses associated with each class. Performance assumes reinvestment of distributions and does not account for taxes.
| | |
| 6 | AB SMALL CAP GROWTH PORTFOLIO | | abfunds.com |
HISTORICAL PERFORMANCE
GROWTH OF A $10,000 INVESTMENT IN THE FUND (unaudited)
7/31/2007 TO 7/31/2017
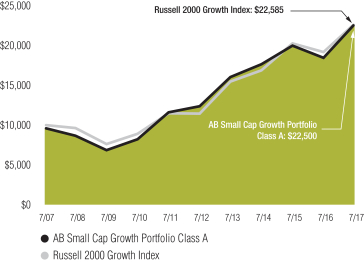
This chart illustrates the total value of an assumed $10,000 investment in AB Small Cap Growth Portfolio Class A shares (from 7/31/2007 to 7/31/2017) as compared to the performance of the Fund’s benchmark. The chart reflects the deduction of the maximum 4.25% sales charge from the initial $10,000 investment in the Fund and assumes the reinvestment of dividends and capital gains distributions.
| | |
| abfunds.com | | AB SMALL CAP GROWTH PORTFOLIO | 7 |
HISTORICAL PERFORMANCE (continued)
AVERAGE ANNUAL RETURNS AS OF JULY 31, 2017 (unaudited)
| | | | | | | | |
| | | NAV Returns | | | SEC Returns (reflects applicable sales charges) | |
| CLASS A SHARES | | | | | | | | |
| 1 Year | | | 21.99% | | | | 16.81% | |
| 5 Years | | | 12.71% | | | | 11.73% | |
| 10 Years | | | 8.92% | | | | 8.45% | |
| CLASS B SHARES | | | | | | | | |
| 1 Year | | | 21.24% | | | | 17.24% | |
| 5 Years | | | 11.80% | | | | 11.80% | |
| 10 Years1 | | | 8.19% | | | | 8.19% | |
| CLASS C SHARES | | | | | | | | |
| 1 Year | | | 21.11% | | | | 20.11% | |
| 5 Years | | | 11.86% | | | | 11.86% | |
| 10 Years | | | 8.09% | | | | 8.09% | |
| ADVISOR CLASS SHARES2 | | | | | | | | |
| 1 Year | | | 22.28% | | | | 22.28% | |
| 5 Years | | | 13.00% | | | | 13.00% | |
| 10 Years | | | 9.21% | | | | 9.21% | |
| CLASS R SHARES2 | | | | | | | | |
| 1 Year | | | 21.58% | | | | 21.58% | |
| 5 Years | | | 12.37% | | | | 12.37% | |
| 10 Years | | | 8.69% | | | | 8.69% | |
| CLASS K SHARES2 | | | | | | | | |
| 1 Year | | | 21.94% | | | | 21.94% | |
| 5 Years | | | 12.74% | | | | 12.74% | |
| 10 Years | | | 9.03% | | | | 9.03% | |
| CLASS I SHARES2 | | | | | | | | |
| 1 Year | | | 22.31% | | | | 22.31% | |
| 5 Years | | | 13.09% | | | | 13.09% | |
| 10 Years | | | 9.38% | | | | 9.38% | |
| CLASS Z SHARES2 | | | | | | | | |
| 1 Year | | | 22.45% | | | | 22.45% | |
| Since Inception3 | | | 5.97% | | | | 5.97% | |
The Fund’s current prospectus fee table shows the Fund’s total annual operating expense ratios as 1.28%, 2.08%, 2.03%, 1.02%, 1.56%, 1.23%, 0.92% and 0.85% for Class A, Class B, Class C, Advisor Class, Class R, Class K, Class I and Class Z shares, respectively. The Financial Highlights section of this report sets forth expense ratio data for the current reporting period; the expense ratios shown above may differ from the expense ratios in the Financial Highlights section since they are based on different time periods.
(footnotes continued on next page)
| | |
| 8 | AB SMALL CAP GROWTH PORTFOLIO | | abfunds.com |
HISTORICAL PERFORMANCE (continued)
| 1 | Assumes conversion of Class B shares into Class A shares after eight years. |
| 2 | These share classes are offered at NAV to eligible investors and their SEC returns are the same as their NAV returns. Please note that these share classes are for investors purchasing shares through accounts established under certain fee-based programs sponsored and maintained by certain broker-dealers and financial intermediaries, institutional pension plans and/or investment advisory clients of, and certain other persons associated with, the Adviser and its affiliates or the Fund. |
| 3 | Inception date: 6/30/2015. |
| | |
| abfunds.com | | AB SMALL CAP GROWTH PORTFOLIO | 9 |
HISTORICAL PERFORMANCE (continued)
SEC AVERAGE ANNUAL RETURNS
AS OF THE MOST RECENT CALENDAR QUARTER-END
JUNE 30, 2017 (unaudited)
| | | | |
| | | SEC Returns (reflects applicable
sales charges) | |
| CLASS A SHARES | | | | |
| 1 Year | | | 22.79% | |
| 5 Years | | | 11.48% | |
| 10 Years | | | 8.07% | |
| CLASS B SHARES | | | | |
| 1 Year | | | 23.45% | |
| 5 Years | | | 11.55% | |
| 10 Years1 | | | 7.81% | |
| CLASS C SHARES | | | | |
| 1 Year | | | 26.33% | |
| 5 Years | | | 11.61% | |
| 10 Years | | | 7.71% | |
| ADVISOR CLASS SHARES2 | | | | |
| 1 Year | | | 28.55% | |
| 5 Years | | | 12.73% | |
| 10 Years | | | 8.82% | |
| CLASS R SHARES2 | | | | |
| 1 Year | | | 27.84% | |
| 5 Years | | | 12.12% | |
| 10 Years | | | 8.31% | |
| CLASS K SHARES2 | | | | |
| 1 Year | | | 28.24% | |
| 5 Years | | | 12.49% | |
| 10 Years | | | 8.65% | |
| CLASS I SHARES2 | | | | |
| 1 Year | | | 28.63% | |
| 5 Years | | | 12.83% | |
| 10 Years | | | 9.00% | |
| CLASS Z SHARES2 | | | | |
| 1 Year | | | 28.77% | |
| Since Inception3 | | | 5.69% | |
| 1 | Assumes conversion of Class B shares into Class A shares after eight years. |
| 2 | Please note that these share classes are for investors purchasing shares through accounts established under certain fee-based programs sponsored and maintained by certain broker-dealers and financial intermediaries, institutional pension plans and/or investment advisory clients of, and certain other persons associated with, the Adviser and its affiliates or the Fund. |
| 3 | Inception date: 6/30/2015. |
| | |
| 10 | AB SMALL CAP GROWTH PORTFOLIO | | abfunds.com |
EXPENSE EXAMPLE
(unaudited)
As a shareholder of the Fund, you incur two types of costs: (1) transaction costs, including sales charges (loads) on purchase payments, contingent deferred sales charges on redemptions and (2) ongoing costs, including management fees; distribution (12b-1) fees; and other Fund expenses. This example is intended to help you understand your ongoing costs (in dollars) of investing in the Fund and to compare these costs with the ongoing costs of investing in other mutual funds.
The Example is based on an investment of $1,000 invested at the beginning of the period and held for the entire period as indicated below.
Actual Expenses
The table below provides information about actual account values and actual expenses. You may use the information, together with the amount you invested, to estimate the expenses that you paid over the period. Simply divide your account value by $1,000 (for example, an $8,600 account value divided by $1,000 = 8.6), then multiply the result by the number under the heading entitled “Expenses Paid During Period” to estimate the expenses you paid on your account during this period.
Hypothetical Example for Comparison Purposes
The table below also provides information about hypothetical account values and hypothetical expenses based on the Fund’s actual expense ratio and an assumed annual rate of return of 5% before expenses, which is not the Fund’s actual return. The hypothetical account values and expenses may not be used to estimate the actual ending account balance or expenses you paid for the period. You may use this information to compare the ongoing costs of investing in the Fund and other funds by comparing this 5% hypothetical example with the 5% hypothetical examples that appear in the shareholder reports of other funds.
Please note that the expenses shown in the table are meant to highlight your ongoing costs only and do not reflect any transactional costs, such as sales charges (loads), or contingent deferred sales charges on redemptions. Therefore, the hypothetical example is useful in comparing ongoing costs only, and will not help you determine the relative total costs of owning different funds. In addition, if these transactional costs were included, your costs would have been higher.
| | | | | | | | | | | | | | | | | | | | | | | | |
| | | Beginning
Account
Value
February 1,
2017 | | | Ending
Account
Value
July 31,
2017 | | | Expenses
Paid
During
Period* | | | Annualized
Expense
Ratio* | | | Total
Expenses
Paid
During
Period+ | | | Total
Annualized
Expense
Ratio+ | |
| Class A | | | | | | | | | | | | | | | | | | | | | | | | |
Actual | | $ | 1,000 | | | $ | 1,128.30 | | | $ | 5.96 | | | | 1.13 | % | | $ | 6.02 | | | | 1.14 | % |
Hypothetical** | | $ | 1,000 | | | $ | 1,019.19 | | | $ | 5.66 | | | | 1.13 | % | | $ | 5.71 | | | | 1.14 | % |
| | |
| abfunds.com | | AB SMALL CAP GROWTH PORTFOLIO | 11 |
EXPENSE EXAMPLE (continued)
| | | | | | | | | | | | | | | | | | | | | | | | |
| | | Beginning
Account
Value
February 1,
2017 | | | Ending
Account
Value
July 31,
2017 | | | Expenses
Paid
During
Period* | | | Annualized
Expense
Ratio* | | | Total
Expenses
Paid
During
Period+ | | | Total
Annualized
Expense
Ratio+ | |
| Class B | | | | | | | | | | | | | | | | | | | | | | | | |
Actual | | $ | 1,000 | | | $ | 1,123.80 | | | $ | 10.01 | | | | 1.90 | % | | $ | 10.06 | | | | 1.91 | % |
Hypothetical** | | $ | 1,000 | | | $ | 1,015.37 | | | $ | 9.49 | | | | 1.90 | % | | $ | 9.54 | | | | 1.91 | % |
| Class C | | | | | | | | | | | | | | | | | | | | | | | | |
Actual | | $ | 1,000 | | | $ | 1,124.00 | | | $ | 9.95 | | | | 1.89 | % | | $ | 10.01 | | | | 1.90 | % |
Hypothetical** | | $ | 1,000 | | | $ | 1,015.42 | | | $ | 9.44 | | | | 1.89 | % | | $ | 9.49 | | | | 1.90 | % |
| Advisor Class | | | | | | | | | | | | | | | | | | | | | | | | |
Actual | | $ | 1,000 | | | $ | 1,129.50 | | | $ | 4.65 | | | | 0.88 | % | | $ | 4.70 | | | | 0.89 | % |
Hypothetical** | | $ | 1,000 | | | $ | 1,020.43 | | | $ | 4.41 | | | | 0.88 | % | | $ | 4.46 | | | | 0.89 | % |
| Class R | | | | | | | | | | | | | | | | | | | | | | | | |
Actual | | $ | 1,000 | | | $ | 1,125.80 | | | $ | 8.06 | | | | 1.53 | % | | $ | 8.12 | | | | 1.54 | % |
Hypothetical** | | $ | 1,000 | | | $ | 1,017.21 | | | $ | 7.65 | | | | 1.53 | % | | $ | 7.70 | | | | 1.54 | % |
| Class K | | | | | | | | | | | | | | | | | | | | | | | | |
Actual | | $ | 1,000 | | | $ | 1,127.70 | | | $ | 6.44 | | | | 1.22 | % | | $ | 6.49 | | | | 1.23 | % |
Hypothetical** | | $ | 1,000 | | | $ | 1,018.74 | | | $ | 6.11 | | | | 1.22 | % | | $ | 6.16 | | | | 1.23 | % |
| Class I | | | | | | | | | | | | | | | | | | | | | | | | |
Actual | | $ | 1,000 | | | $ | 1,129.60 | | | $ | 4.75 | | | | 0.90 | % | | $ | 4.81 | | | | 0.91 | % |
Hypothetical** | | $ | 1,000 | | | $ | 1,020.33 | | | $ | 4.51 | | | | 0.90 | % | | $ | 4.56 | | | | 0.91 | % |
| Class Z | | | | | | | | | | | | | | | | | | | | | | | | |
Actual | | $ | 1,000 | | | $ | 1,130.10 | | | $ | 4.33 | | | | 0.82 | % | | $ | 4.38 | | | | 0.83 | % |
Hypothetical** | | $ | 1,000 | | | $ | 1,020.73 | | | $ | 4.11 | | | | 0.82 | % | | $ | 4.16 | | | | 0.83 | % |
| * | Expenses are equal to the classes’ annualized expense ratios multiplied by the average account value over the period, multiplied by 181/365 (to reflect the one-half year period). |
| ** | Assumes 5% annual return before expenses. |
| + | In connection with the Fund’s investments in affiliated/unaffiliated underlying portfolios, the Fund incurs no direct expenses, but bears proportionate shares of the fees and expenses (i.e., operating, administrative and investment advisory fees) of the affiliated/unaffiliated underlying portfolios. The Adviser has contractually agreed to waive its fees from the Fund in an amount equal to the Fund’s pro rata share of certain acquired fund fees and expenses of the affiliated underlying portfolios. The Fund’s total expenses are equal to the classes’ annualized expense ratio plus the Fund’s pro rata share of the weighted average expense ratio of the affiliated/unaffiliated underlying portfolios in which it invests, multiplied by the average account value over the period, multiplied by 181/365 (to reflect the one-half year period). |
| | |
| 12 | AB SMALL CAP GROWTH PORTFOLIO | | abfunds.com |
PORTFOLIO SUMMARY
July 31, 2017 (unaudited)
PORTFOLIO STATISTICS
Net Assets ($mil): $1,294.9
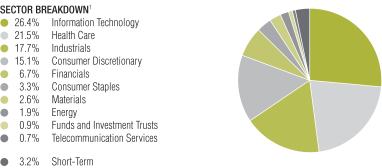
TEN LARGEST HOLDINGS2
| | | | | | | | |
| Company | | U.S. $ Value | | | Percent of Net Assets | |
| Planet Fitness, Inc. | | $ | 21,269,311 | | | | 1.6 | % |
| Grand Canyon Education, Inc. | | | 20,936,551 | | | | 1.6 | |
| GrubHub, Inc. | | | 19,819,755 | | | | 1.5 | |
| Lithia Motors, Inc. – Class A | | | 19,112,917 | | | | 1.5 | |
| Five Below, Inc. | | | 18,398,960 | | | | 1.4 | |
| Freshpet, Inc. | | | 18,027,118 | | | | 1.4 | |
| LogMeIn, Inc. | | | 17,903,023 | | | | 1.4 | |
| 2U, Inc. | | | 17,665,794 | | | | 1.4 | |
| Ollie’s Bargain Outlet Holdings, Inc. | | | 17,436,800 | | | | 1.4 | |
| Vail Resorts, Inc. | | | 17,061,022 | | | | 1.3 | |
| | $ | 187,631,251 | | | | 14.5 | % |
| 1 | All data are as of July 31, 2017. The Fund’s sector breakdown is expressed as a percentage of total investments (excluding security lending collateral) and may vary over time. |
Please note: The sector classifications presented herein are based on the Global Industry Classification Standard (GICS) which was developed by Morgan Stanley Capital International and Standard & Poor’s. The components are divided into sector, industry group, and industry sub-indices as classified by the GICS for each of the market capitalization indices in the broad market. These sector classifications are broadly defined. The “Portfolio of Investments” section of the report reflects more specific industry information and is consistent with the investment restrictions discussed in the Fund’s prospectus.
| | |
| abfunds.com | | AB SMALL CAP GROWTH PORTFOLIO | 13 |
PORTFOLIO OF INVESTMENTS
July 31, 2017
| | | | | | | | |
| Company | | Shares | | | U.S. $ Value | |
| | | | | | | | |
| | | | | | | | |
COMMON STOCKS – 96.0% | | | | | | | | |
Information Technology – 26.4% | | | | | | | | |
Communications Equipment – 1.7% | | | | | | | | |
Arista Networks, Inc.(a) | | | 55,460 | | | $ | 8,279,623 | |
Lumentum Holdings, Inc.(a) | | | 212,770 | | | | 13,319,402 | |
| | | | | | | | |
| | | | | | | 21,599,025 | |
| | | | | | | | |
Electronic Equipment, Instruments & Components – 0.7% | | | | | | | | |
Coherent, Inc.(a) | | | 31,910 | | | | 8,456,150 | |
| | | | | | | | |
| | |
Internet Software & Services – 9.5% | | | | | | | | |
2U, Inc.(a) | | | 341,368 | | | | 17,665,794 | |
Cimpress NV(a)(b) | | | 169,018 | | | | 14,914,148 | |
CoStar Group, Inc.(a) | | | 54,568 | | | | 15,036,212 | |
GrubHub, Inc.(a)(b) | | | 429,650 | | | | 19,819,755 | |
LogMeIn, Inc. | | | 153,740 | | | | 17,903,023 | |
Q2 Holdings, Inc.(a) | | | 367,921 | | | | 14,312,127 | |
Trade Desk, Inc. (The) – Class A(a) | | | 294,038 | | | | 15,675,166 | |
Wix.com Ltd.(a) | | | 128,636 | | | | 7,936,841 | |
| | | | | | | | |
| | | | | | | 123,263,066 | |
| | | | | | | | |
Semiconductors & Semiconductor Equipment – 3.7% | | | | | | | | |
Advanced Energy Industries, Inc.(a) | | | 213,210 | | | | 15,468,386 | |
Microsemi Corp.(a) | | | 104,500 | | | | 5,442,360 | |
Monolithic Power Systems, Inc. | | | 139,238 | | | | 14,246,832 | |
Silicon Laboratories, Inc.(a) | | | 177,662 | | | | 13,342,416 | |
| | | | | | | | |
| | | | | | | 48,499,994 | |
| | | | | | | | |
Software – 10.8% | | | | | | | | |
Aspen Technology, Inc.(a) | | | 265,680 | | | | 15,109,222 | |
Blackbaud, Inc. | | | 130,630 | | | | 12,062,374 | |
Blackline, Inc.(a) | | | 353,190 | | | | 13,693,176 | |
Ellie Mae, Inc.(a) | | | 123,860 | | | | 10,803,069 | |
Guidewire Software, Inc.(a) | | | 156,315 | | | | 11,279,691 | |
HubSpot, Inc.(a) | | | 180,546 | | | | 13,062,503 | |
Paylocity Holding Corp.(a) | | | 241,458 | | | | 10,979,095 | |
Proofpoint, Inc.(a) | | | 190,532 | | | | 16,240,948 | |
RingCentral, Inc. – Class A(a) | | | 380,765 | | | | 13,250,622 | |
Take-Two Interactive Software, Inc.(a) | | | 175,583 | | | | 13,955,337 | |
Ultimate Software Group, Inc. (The)(a)(b) | | | 43,459 | | | | 9,809,131 | |
| | | | | | | | |
| | | | | | | 140,245,168 | |
| | | | | | | | |
| | | | | | | 342,063,403 | |
| | | | | | | | |
Health Care – 21.5% | | | | | | | | |
Biotechnology – 9.0% | | | | | | | | |
Adamas Pharmaceuticals, Inc.(a)(b) | | | 299,643 | | | | 5,198,806 | |
Aimmune Therapeutics, Inc.(a)(b) | | | 257,696 | | | | 5,545,618 | |
Audentes Therapeutics, Inc.(a) | | | 255,495 | | | | 5,132,894 | |
Avexis, Inc.(a) | | | 100,880 | | | | 9,346,532 | |
| | |
| 14 | AB SMALL CAP GROWTH PORTFOLIO | | abfunds.com |
PORTFOLIO OF INVESTMENTS (continued)
| | | | | | | | |
| Company | | Shares | | | U.S. $ Value | |
| | | | | | | | |
| | | | | | | | |
BeiGene Ltd. (ADR)(a) | | | 42,300 | | | $ | 2,981,727 | |
Biohaven Pharmaceutical Holding Co., Ltd.(a) | | | 92,295 | | | | 2,377,519 | |
Blueprint Medicines Corp.(a) | | | 172,179 | | | | 9,010,127 | |
Clovis Oncology, Inc.(a) | | | 155,360 | | | | 13,176,082 | |
DBV Technologies SA (Sponsored ADR)(a) | | | 155,864 | | | | 6,942,183 | |
Loxo Oncology, Inc.(a) | | | 151,519 | | | | 10,956,339 | |
Neurocrine Biosciences, Inc.(a) | | | 111,460 | | | | 5,353,424 | |
Otonomy, Inc.(a) | | | 251,003 | | | | 4,718,856 | |
Prothena Corp. PLC(a)(b) | | | 143,530 | | | | 8,864,413 | |
Radius Health, Inc.(a)(b) | | | 109,400 | | | | 4,816,882 | |
Sage Therapeutics, Inc.(a) | | | 110,033 | | | | 8,775,132 | |
TESARO, Inc.(a) | | | 48,565 | | | | 6,199,808 | |
Ultragenyx Pharmaceutical, Inc.(a) | | | 109,106 | | | | 7,235,910 | |
| | | | | | | | |
| | | | | | | 116,632,252 | |
| | | | | | | | |
Health Care Equipment & Supplies – 6.1% | | | | | |
Align Technology, Inc.(a) | | | 67,352 | | | | 11,263,275 | |
DexCom, Inc.(a) | | | 143,014 | | | | 9,526,163 | |
Glaukos Corp.(a)(b) | | | 262,736 | | | | 10,556,732 | |
iRhythm Technologies, Inc.(a)(b) | | | 381,884 | | | | 15,794,722 | |
Nevro Corp.(a) | | | 183,305 | | | | 15,775,228 | |
Penumbra, Inc.(a) | | | 190,187 | | | | 15,528,769 | |
| | | | | | | | |
| | | | | | | 78,444,889 | |
| | | | | | | | |
Health Care Providers & Services – 1.0% | | | | | | | | |
Teladoc, Inc.(a)(b) | | | 414,616 | | | | 13,599,405 | |
| | | | | | | | |
| | |
Health Care Technology – 1.3% | | | | | | | | |
Vocera Communications, Inc.(a) | | | 613,253 | | | | 16,723,409 | |
| | | | | | | | |
| | |
Life Sciences Tools & Services – 1.3% | | | | | | | | |
ICON PLC(a) | | | 155,712 | | | | 16,341,974 | |
| | | | | | | | |
| | |
Pharmaceuticals – 2.8% | | | | | | | | |
Aerie Pharmaceuticals, Inc.(a) | | | 131,335 | | | | 7,131,491 | |
Akorn, Inc.(a) | | | 132,348 | | | | 4,449,540 | |
GW Pharmaceuticals PLC (ADR)(a)(b) | | | 47,780 | | | | 5,340,848 | |
Intersect ENT, Inc.(a) | | | 422,540 | | | | 11,577,596 | |
Medicines Co. (The)(a)(b) | | | 214,467 | | | | 8,246,256 | |
| | | | | | | | |
| | | | | | | 36,745,731 | |
| | | | | | | | |
| | | | | | | 278,487,660 | |
| | | | | | | | |
Industrials – 17.8% | |
Aerospace & Defense – 1.9% | |
Hexcel Corp. | | | 240,885 | | | | 12,326,086 | |
Mercury Systems, Inc.(a) | | | 288,444 | | | | 12,665,576 | |
| | | | | | | | |
| | | | | | | 24,991,662 | |
| | | | | | | | |
Commercial Services & Supplies – 1.8% | | | | | | | | |
Advanced Disposal Services, Inc.(a) | | | 382,781 | | | | 9,255,645 | |
| | |
| abfunds.com | | AB SMALL CAP GROWTH PORTFOLIO | 15 |
PORTFOLIO OF INVESTMENTS (continued)
| | | | | | | | |
| Company | | Shares | | | U.S. $ Value | |
| | | | | | | | |
| | | | | | | | |
Tetra Tech, Inc. | | | 284,120 | | | $ | 13,481,494 | |
| | | | | | | | |
| | | | | | | 22,737,139 | |
| | | | | | | | |
Construction & Engineering – 1.1% | | | | | | | | |
Dycom Industries, Inc.(a) | | | 150,834 | | | | 13,665,560 | |
| | | | | | | | |
| | |
Industrial Conglomerates – 0.8% | | | | | | | | |
Carlisle Cos., Inc. | | | 111,690 | | | | 10,899,827 | |
| | | | | | | | |
| | |
Machinery – 8.8% | | | | | | | | |
Astec Industries, Inc. | | | 252,490 | | | | 12,692,672 | |
Gardner Denver Holdings, Inc.(a) | | | 529,195 | | | | 12,150,317 | |
IDEX Corp. | | | 117,716 | | | | 13,718,623 | |
John Bean Technologies Corp. | | | 147,050 | | | | 13,587,420 | |
Kennametal, Inc. | | | 304,764 | | | | 11,245,791 | |
Lincoln Electric Holdings, Inc. | | | 153,873 | | | | 13,426,958 | |
Middleby Corp. (The)(a) | | | 71,497 | | | | 9,343,228 | |
Nordson Corp. | | | 113,380 | | | | 14,399,260 | |
RBC Bearings, Inc.(a) | | | 134,658 | | | | 13,915,558 | |
| | | | | | | | |
| | | | | | | 114,479,827 | |
| | | | | | | | |
Road & Rail – 0.9% | | | | | | | | |
Genesee & Wyoming, Inc. – Class A(a) | | | 182,063 | | | | 11,863,225 | |
| | | | | | | | |
| | |
Trading Companies & Distributors – 2.5% | | | | | | | | |
H&E Equipment Services, Inc. | | | 644,590 | | | | 14,548,396 | |
MSC Industrial Direct Co., Inc. – Class A | | | 32,370 | | | | 2,305,068 | |
SiteOne Landscape Supply, Inc.(a) | | | 283,654 | | | | 14,891,835 | |
| | | | | | | | |
| | | | | | | 31,745,299 | |
| | | | | | | | |
| | | | | | | 230,382,539 | |
| | | | | | | | |
Consumer Discretionary – 15.1% | | | | | | | | |
Distributors – 1.0% | | | | | | | | |
Pool Corp. | | | 123,278 | | | | 13,328,817 | |
| | | | | | | | |
| | |
Diversified Consumer Services – 2.9% | | | | | | | | |
Bright Horizons Family Solutions, Inc.(a) | | | 205,335 | | | | 16,223,518 | |
Grand Canyon Education, Inc.(a) | | | 284,580 | | | | 20,936,551 | |
| | | | | | | | |
| | | | | | | 37,160,069 | |
| | | | | | | | |
Hotels, Restaurants & Leisure – 5.1% | | | | | | | | |
Dave & Buster’s Entertainment, Inc.(a) | | | 232,064 | | | | 14,413,495 | |
Hilton Grand Vacations, Inc.(a) | | | 356,063 | | | | 13,088,876 | |
Planet Fitness, Inc. | | | 938,628 | | | | 21,269,311 | |
Vail Resorts, Inc. | | | 80,950 | | | | 17,061,022 | |
| | | | | | | | |
| | | | | | | 65,832,704 | |
| | | | | | | | |
Media – 0.4% | | | | | | | | |
IMAX Corp.(a) | | | 268,896 | | | | 5,754,374 | |
| | | | | | | | |
| | |
Multiline Retail – 1.4% | | | | | | | | |
Ollie’s Bargain Outlet Holdings, Inc.(a) | | | 390,085 | | | | 17,436,800 | |
| | | | | | | | |
| | |
| 16 | AB SMALL CAP GROWTH PORTFOLIO | | abfunds.com |
PORTFOLIO OF INVESTMENTS (continued)
| | | | | | | | |
| Company | | Shares | | | U.S. $ Value | |
| | | | | | | | |
| | | | | | | | |
Specialty Retail – 4.3% | | | | | | | | |
Five Below, Inc.(a) | | | 380,852 | | | $ | 18,398,960 | |
Floor & Decor Holdings, Inc. – Class A(a) | | | 371,963 | | | | 12,877,359 | |
Lithia Motors, Inc. – Class A | | | 185,113 | | | | 19,112,917 | |
Select Comfort Corp.(a) | | | 21,407 | | | | 723,771 | |
Tile Shop Holdings, Inc. | | | 307,818 | | | | 4,494,143 | |
| | | | | | | | |
| | | | | | | 55,607,150 | |
| | | | | | | | |
| | | | | | | 195,119,914 | |
| | | | | | | | |
Financials – 6.7% | | | | | | | | |
Banks – 4.2% | | | | | | | | |
Signature Bank/New York NY(a) | | | 77,874 | | | | 10,791,779 | |
Sterling Bancorp/DE | | | 583,196 | | | | 13,471,828 | |
SVB Financial Group(a) | | | 77,252 | | | | 13,784,847 | |
Western Alliance Bancorp(a) | | | 313,993 | | | | 15,818,967 | |
| | | | | | | | |
| | | | | | | 53,867,421 | |
| | | | | | | | |
Capital Markets – 2.5% | | | | | | | | |
Hamilton Lane, Inc. – Class A | | | 278,924 | | | | 6,264,633 | |
Houlihan Lokey, Inc. | | | 388,027 | | | | 14,426,844 | |
Stifel Financial Corp.(a) | | | 237,777 | | | | 12,090,960 | |
| | | | | | | | |
| | | | | | | 32,782,437 | |
| | | | | | | | |
| | | | | | | 86,649,858 | |
| | | | | | | | |
Consumer Staples – 3.3% | | | | | | | | |
Food & Staples Retailing – 0.9% | | | | | | | | |
Chefs’ Warehouse, Inc. (The)(a) | | | 819,827 | | | | 11,887,492 | |
| | | | | | | | |
| | |
Food Products – 1.4% | | | | | | | | |
Freshpet, Inc.(a)(b) | | | 1,057,309 | | | | 18,027,118 | |
| | | | | | | | |
| | |
Personal Products – 1.0% | | | | | | | | |
elf Beauty, Inc.(a)(b) | | | 516,976 | | | | 13,115,681 | |
| | | | | | | | |
| | | | | | | 43,030,291 | |
| | | | | | | | |
Materials – 2.6% | | | | | | | | |
Chemicals – 1.3% | | | | | | | | |
PolyOne Corp. | | | 465,225 | | | | 17,017,930 | |
| | | | | | | | |
| | |
Construction Materials – 1.3% | | | | | | | | |
Summit Materials, Inc. – Class A(a) | | | 579,858 | | | | 16,491,162 | |
| | | | | | | | |
| | | | | | | 33,509,092 | |
| | | | | | | | |
Energy – 1.9% | | | | | | | | |
Energy Equipment & Services – 1.0% | | | | | | | | |
Forum Energy Technologies, Inc.(a) | | | 372,051 | | | | 4,929,676 | |
Oil States International, Inc.(a) | | | 354,848 | | | | 8,817,973 | |
| | | | | | | | |
| | | | | | | 13,747,649 | |
| | | | | | | | |
Oil, Gas & Consumable Fuels – 0.9% | | | | | | | | |
Matador Resources Co.(a)(b) | | | 471,135 | | | | 11,429,735 | |
| | | | | | | | |
| | | | | | | 25,177,384 | |
| | | | | | | | |
| | |
| abfunds.com | | AB SMALL CAP GROWTH PORTFOLIO | 17 |
PORTFOLIO OF INVESTMENTS (continued)
| | | | | | | | |
| Company | | Shares | | | U.S. $ Value | |
| | | | | | | | |
| | | | | | | | |
Telecommunication Services – 0.7% | | | | | | | | |
Diversified Telecommunication Services – 0.7% | | | | | | | | |
Vonage Holdings Corp.(a) | | | 1,451,140 | | | $ | 9,592,035 | |
| | | | | | | | |
| | |
Total Common Stocks
(cost $905,324,312) | | | | | | | 1,244,012,176 | |
| | | | | | | | |
| | | | | | | | |
INVESTMENT COMPANIES – 0.9% | | | | | | | | |
Funds and Investment Trusts – 0.9% | | | | | | | | |
iShares Russell 2000 Growth ETF(b)(c)
(cost $10,834,269) | | | 70,700 | | | | 12,023,242 | |
| | | | | | | | |
| | | | | | | | |
PREFERRED STOCKS – 0.1% | | | | | | | | |
Consumer Discretionary – 0.1% | | | | | | | | |
Household Durables – 0.1% | | | | | | | | |
Honest Co. (The) – Series D
0.00%(a)(d)(e)
(cost $1,356,132) | | | 29,639 | | | | 1,197,860 | |
| | | | | | | | |
| | | | | | | | |
SHORT-TERM INVESTMENTS – 3.2% | | | | | | | | |
Investment Companies – 3.2% | | | | | | | | |
AB Fixed Income Shares, Inc. – Government Money Market Portfolio – Class AB, 0.86%(c)(f)
(cost $41,063,780) | | | 41,063,780 | | | | 41,063,780 | |
| | | | | | | | |
| | |
Total Investments Before Security Lending Collateral for Securities Loaned – 100.2%
(cost $958,578,493) | | | | | | | 1,298,297,058 | |
| | | | | | | | |
| | | | | | | | |
INVESTMENTS OF CASH COLLATERAL FOR SECURITIES LOANED – 6.6% | | | | | | | | |
Investment Companies – 6.6% | | | | | | | | |
AB Fixed Income Shares, Inc. – Government Money Market Portfolio – Class AB, 0.86%(c)(f)
(cost $84,994,169) | | | 84,994,169 | | | | 84,994,169 | |
| | | | | | | | |
| | |
Total Investments – 106.8%
(cost $1,043,572,662) | | | | | | | 1,383,291,227 | |
Other assets less liabilities – (6.8)% | | | | | | | (88,401,451 | ) |
| | | | | | | | |
| | |
Net Assets – 100.0% | | | | | | $ | 1,294,889,776 | |
| | | | | | | | |
| | |
| 18 | AB SMALL CAP GROWTH PORTFOLIO | | abfunds.com |
PORTFOLIO OF INVESTMENTS (continued)
| (a) | Non-income producing security. |
| (b) | Represents entire or partial securities out on loan. See Note E for securities lending information. |
| (c) | To obtain a copy of the fund’s shareholder report, please go to the Securities and Exchange Commission’s website at www.sec.gov. Additionally, shareholder reports for AB funds can be obtained by calling AB at (800) 227-4618. |
| (d) | Fair valued by the Adviser. |
| (f) | Investment in affiliated money market mutual fund. The rate shown represents the 7-day yield as of period end. |
Glossary:
ADR – American Depositary Receipt
ETF – Exchange Traded Fund
See notes to financial statements.
| | |
| abfunds.com | | AB SMALL CAP GROWTH PORTFOLIO | 19 |
STATEMENT OF ASSETS & LIABILITIES
July 31, 2017
| | | | |
| Assets | | | | |
Investments in securities, at value | | | | |
Unaffiliated issuers (cost $917,514,713)(a) | | $ | 1,257,233,278 | |
Affiliated issuers (cost $126,057,949—including investment of cash collateral for securities loaned of $84,994,169) | | | 126,057,949 | |
Receivable for investment securities sold | | | 11,429,657 | |
Receivable for capital stock sold | | | 2,023,740 | |
Unaffiliated interest and dividends receivable | | | 113,303 | |
Affiliated dividends receivable | | | 16,052 | |
| | | | |
Total assets | | | 1,396,873,979 | |
| | | | |
| Liabilities | |
Payable for collateral received on securities loaned | | | 84,994,169 | |
Payable for investment securities purchased | | | 13,342,326 | |
Payable for capital stock redeemed | | | 2,273,587 | |
Advisory fee payable | | | 752,928 | |
Distribution fee payable | | | 136,821 | |
Transfer Agent fee payable | | | 54,481 | |
Administrative fee payable | | | 22,743 | |
Accrued expenses | | | 407,148 | |
| | | | |
Total liabilities | | | 101,984,203 | |
| | | | |
Net Assets | | $ | 1,294,889,776 | |
| | | | |
| Composition of Net Assets | |
Capital stock, at par | | $ | 2,551 | |
Additional paid-in capital | | | 908,792,946 | |
Accumulated net investment loss | | | (756,626 | ) |
Accumulated net realized gain on investment transactions | | | 47,132,340 | |
Net unrealized appreciation on investments | | | 339,718,565 | |
| | | | |
| | $ | 1,294,889,776 | |
| | | | |
Net Asset Value Per Share—27 billion shares of capital stock authorized, $.0001 par value
| | | | | | | | | | | | |
| Class | | Net Assets | | | Outstanding | | | Value | |
| |
| A | | $ | 465,187,798 | | | | 9,444,695 | | | $ | 49.25 | * |
| |
| B | | $ | 1,289,930 | | | | 38,306 | | | $ | 33.67 | |
| |
| C | | $ | 27,342,713 | | | | 802,318 | | | $ | 34.08 | |
| |
| Advisor | | $ | 309,330,459 | | | | 5,825,620 | | | $ | 53.10 | |
| |
| R | | $ | 33,842,348 | | | | 704,247 | | | $ | 48.05 | |
| |
| K | | $ | 40,370,163 | | | | 802,045 | | | $ | 50.33 | |
| |
| I | | $ | 319,436,486 | | | | 6,039,634 | | | $ | 52.89 | |
| |
| Z | | $ | 98,089,879 | | | | 1,850,721 | | | $ | 53.00 | |
| |
| (a) | Includes securities on loan with a value of $82,320,023 (see Note E). |
| * | The maximum offering price per share for Class A shares was $51.44 which reflects a sales charge of 4.25%. |
See notes to financial statements.
| | |
| 20 | AB SMALL CAP GROWTH PORTFOLIO | | abfunds.com |
STATEMENT OF OPERATIONS
Year Ended July 31, 2017
| | | | | | | | |
| Investment Income | | | | | | | | |
Dividends | | | | | | | | |
Unaffiliated issuers | | $ | 3,543,139 | | | | | |
Affiliated issuers | | | 482,267 | | | | | |
Securities lending income | | | 198,920 | | | | | |
Other income(a) | | | 101,468 | | | $ | 4,325,794 | |
| | | | | | | | |
| Expenses | | | | | | | | |
Advisory fee (see Note B) | | | 8,509,709 | | | | | |
Distribution fee—Class A | | | 902,529 | | | | | |
Distribution fee—Class B | | | 14,498 | | | | | |
Distribution fee—Class C | | | 352,269 | | | | | |
Distribution fee—Class R | | | 181,625 | | | | | |
Distribution fee—Class K | | | 125,618 | | | | | |
Transfer agency—Class A | | | 439,143 | | | | | |
Transfer agency—Class B | | | 2,435 | | | | | |
Transfer agency—Class C | | | 47,758 | | | | | |
Transfer agency—Advisor Class | | | 341,251 | | | | | |
Transfer agency—Class R | | | 77,802 | | | | | |
Transfer agency—Class K | | | 77,032 | | | | | |
Transfer agency—Class I | | | 342,680 | | | | | |
Transfer agency—Class Z | | | 15,555 | | | | | |
Custodian | | | 213,518 | | | | | |
Printing | | | 144,417 | | | | | |
Registration fees | | | 121,921 | | | | | |
Administrative | | | 66,424 | | | | | |
Audit and tax | | | 54,119 | | | | | |
Legal | | | 41,955 | | | | | |
Directors’ fees | | | 27,586 | | | | | |
Miscellaneous | | | 53,269 | | | | | |
| | | | | | | | |
Total expenses | | | 12,153,113 | | | | | |
Less: expenses waived and reimbursed by the Adviser (see Notes B & E) | | | (171,846 | ) | | | | |
| | | | | | | | |
Net expenses | | | | | | | 11,981,267 | |
| | | | | | | | |
Net investment loss | | | | | | | (7,655,473 | ) |
| | | | | | | | |
| Realized and Unrealized Gain on Investment Transactions | | | | | | | | |
Net realized gain on investment transactions | | | | | | | 123,855,523 | |
Net change in unrealized appreciation/depreciation of investments | | | | | | | 110,587,154 | |
| | | | | | | | |
Net gain on investment transactions | | | | | | | 234,442,677 | |
| | | | | | | | |
Net Increase in Net Assets from Operations | | | | | | $ | 226,787,204 | |
| | | | | | | | |
| (a) | Other income represents a refund for overbilling of prior years’ custody out-of-pocket fees. |
See notes to financial statements.
| | |
| abfunds.com | | AB SMALL CAP GROWTH PORTFOLIO | 21 |
STATEMENT OF CHANGES IN NET ASSETS
| | | | | | | | |
| | | Year Ended
July 31,
2017 | | | Year Ended
July 31,
2016 | |
| Increase (Decrease) in Net Assets from Operations | | | | | | | | |
Net investment loss | | $ | (7,655,473 | ) | | $ | (7,735,444 | ) |
Net realized gain (loss) on investment transactions | | | 123,855,523 | | | | (18,768,011 | ) |
Net change in unrealized appreciation/depreciation of investments | | | 110,587,154 | | | | (115,356,996 | ) |
| | | | | | | | |
Net increase (decrease) in net assets from operations | | | 226,787,204 | | | | (141,860,451 | ) |
| Distributions to Shareholders from | | | | | | | | |
Net realized gain on investment transactions | | | | | | | | |
Class A | | | (7,225,274 | ) | | | (27,260,771 | ) |
Class B | | | (46,330 | ) | | | (246,573 | ) |
Class C | | | (1,188,647 | ) | | | (5,772,907 | ) |
Advisor Class | | | (5,602,479 | ) | | | (32,001,903 | ) |
Class R | | | (848,050 | ) | | | (4,027,564 | ) |
Class K | | | (1,155,471 | ) | | | (6,196,464 | ) |
Class I | | | (6,202,047 | ) | | | (31,221,483 | ) |
Class Z | | | (1,347,008 | ) | | | (980,882 | ) |
| Capital Stock Transactions | | | | | | | | |
Net decrease | | | (17,208,382 | ) | | | (176,744,912 | ) |
| Capital Contributions | | | | | | | | |
Proceeds from regulatory settlement (see Note F) | | | – 0 | – | | | 67,021 | |
| | | | | | | | |
Total increase (decrease) | | | 185,963,516 | | | | (426,246,889 | ) |
| Net Assets | | | | | | | | |
Beginning of period | | | 1,108,926,260 | | | | 1,535,173,149 | |
| | | | | | | | |
End of period (including accumulated net investment loss of ($756,626) and ($4,119,133), respectively) | | $ | 1,294,889,776 | | | $ | 1,108,926,260 | |
| | | | | | | | |
See notes to financial statements.
| | |
| 22 | AB SMALL CAP GROWTH PORTFOLIO | | abfunds.com |
NOTES TO FINANCIAL STATEMENTS
July 31, 2017
NOTE A
Significant Accounting Policies
AB Cap Fund, Inc. (the “Company”), which is a Maryland corporation, is registered under the Investment Company Act of 1940 as an open-end management investment company. The Company operates as a series company currently comprised of 29 portfolios. Each portfolio is considered to be a separate entity for financial reporting and tax purposes. This report relates only to the AB Small Cap Growth Portfolio (the “Fund”), a diversified portfolio. The Fund has authorized the issuance of Class A, Class B, Class C, Advisor Class, Class R, Class K, Class I, Class Z and Class T shares. Class T shares have not been issued. Effective June 30, 2015 the Fund commenced offering of Class Z shares. Class A shares are sold with a front-end sales charge of up to 4.25% for purchases not exceeding $1,000,000. With respect to purchases of $1,000,000 or more, Class A shares redeemed within one year of purchase may be subject to a contingent deferred sales charge of 1%. Class B shares are currently sold with a contingent deferred sales charge which declines from 4% to zero depending on the period of time the shares are held. Effective January 31, 2009, sales of Class B shares of the Fund to new investors were suspended. Class B shares will only be issued (i) upon the exchange of Class B shares from another AB Mutual Fund, (ii) for purposes of dividend reinvestment, (iii) through the Fund’s Automatic Investment Program (the “Program”) for accounts that established the Program prior to January 31, 2009, and (iv) for purchases of additional shares by Class B shareholders as of January 31, 2009. The ability to establish a new Program for accounts containing Class B shares was suspended as of January 31, 2009. Class B shares will automatically convert to Class A shares eight years after the end of the calendar month of purchase. Class C shares are subject to a contingent deferred sales charge of 1% on redemptions made within the first year after purchase, and 0% after the first year of purchase. Effective April 10, 2017, Class C shares will automatically convert to Class A shares ten years after the end of the calendar month of purchase. Class R and Class K shares are sold without an initial or contingent deferred sales charge. Advisor Class, Class I and Class Z shares are sold without an initial or contingent deferred sales charge and are not subject to ongoing distribution expenses. All nine classes of shares have identical voting, dividend, liquidation and other rights, except that the classes bear different distribution and transfer agency expenses. Each class has exclusive voting rights with respect to its distribution plan. Effective February 1, 2013, the Fund was closed to new investors, subject to certain exceptions. Effective June 1, 2016, with the exception of Class B shares, the Fund reopened to new investors. The financial statements have been prepared in conformity with U.S. generally accepted accounting principles (“U.S. GAAP”) which require management to make certain estimates and assumptions that affect the reported amounts of assets and liabilities in the
| | |
| abfunds.com | | AB SMALL CAP GROWTH PORTFOLIO | 23 |
NOTES TO FINANCIAL STATEMENTS (continued)
financial statements and amounts of income and expenses during the reporting period. Actual results could differ from those estimates. The Fund is an investment company under U.S. GAAP and follows the accounting and reporting guidance applicable to investment companies. The following is a summary of significant accounting policies followed by the Fund.
1. Security Valuation
Portfolio securities are valued at their current market value determined on the basis of market quotations or, if market quotations are not readily available or are deemed unreliable, at “fair value” as determined in accordance with procedures established by and under the general supervision of the Company’s Board of Directors (the “Board”).
In general, the market values of securities which are readily available and deemed reliable are determined as follows: securities listed on a national securities exchange (other than securities listed on the NASDAQ Stock Market, Inc. (“NASDAQ”)) or on a foreign securities exchange are valued at the last sale price at the close of the exchange or foreign securities exchange. If there has been no sale on such day, the securities are valued at the last traded price from the previous day. Securities listed on more than one exchange are valued by reference to the principal exchange on which the securities are traded; securities listed only on NASDAQ are valued in accordance with the NASDAQ Official Closing Price; listed or over the counter (“OTC”) market put or call options are valued at the mid level between the current bid and ask prices. If either a current bid or current ask price is unavailable, AllianceBernstein L.P. (the “Adviser”) will have discretion to determine the best valuation (e.g. last trade price in the case of listed options); open futures are valued using the closing settlement price or, in the absence of such a price, the most recent quoted bid price. If there are no quotations available for the day of valuation, the last available closing settlement price is used; U.S. Government securities and any other debt instruments having 60 days or less remaining until maturity are generally valued at market by an independent pricing vendor, if a market price is available. If a market price is not available, the securities are valued at amortized cost. This methodology is commonly used for short term securities that have an original maturity of 60 days or less, as well as short term securities that had an original term to maturity that exceeded 60 days. In instances when amortized cost is utilized, the Valuation Committee (the “Committee”) must reasonably conclude that the utilization of amortized cost is approximately the same as the fair value of the security. Such factors the Committee will consider include, but are not limited to, an impairment of the creditworthiness of the issuer or material changes in interest rates. Fixed-income securities, including mortgage-backed and asset-backed securities, may be valued on the basis of prices provided by a pricing service or at a price obtained from one or more of the major broker-dealers. In cases where broker-dealer quotes are obtained, the Adviser
| | |
| 24 | AB SMALL CAP GROWTH PORTFOLIO | | abfunds.com |
NOTES TO FINANCIAL STATEMENTS (continued)
may establish procedures whereby changes in market yields or spreads are used to adjust, on a daily basis, a recently obtained quoted price on a security. Swaps and other derivatives are valued daily, primarily using independent pricing services, independent pricing models using market inputs, as well as third party broker-dealers or counterparties. Open end mutual funds are valued at the closing net asset value per share, while exchange traded funds are valued at the closing market price per share.
Securities for which market quotations are not readily available (including restricted securities) or are deemed unreliable are valued at fair value as deemed appropriate by the Adviser. Factors considered in making this determination may include, but are not limited to, information obtained by contacting the issuer, analysts, analysis of the issuer’s financial statements or other available documents. In addition, the Fund may use fair value pricing for securities primarily traded in non-U.S. markets because most foreign markets close well before the Fund values its securities at 4:00 p.m., Eastern Time. The earlier close of these foreign markets gives rise to the possibility that significant events, including broad market moves, may have occurred in the interim and may materially affect the value of those securities. To account for this, the Fund may frequently value many of its foreign equity securities using fair value prices based on third party vendor modeling tools to the extent available.
2. Fair Value Measurements
In accordance with U.S. GAAP regarding fair value measurements, fair value is defined as the price that the Fund would receive to sell an asset or pay to transfer a liability in an orderly transaction between market participants at the measurement date. U.S. GAAP establishes a framework for measuring fair value, and a three-level hierarchy for fair value measurements based upon the transparency of inputs to the valuation of an asset or liability (including those valued based on their market values as described in Note A.1 above). Inputs may be observable or unobservable and refer broadly to the assumptions that market participants would use in pricing the asset or liability. Observable inputs reflect the assumptions market participants would use in pricing the asset or liability based on market data obtained from sources independent of the Fund. Unobservable inputs reflect the Fund’s own assumptions about the assumptions that market participants would use in pricing the asset or liability based on the best information available in the circumstances. Each investment is assigned a level based upon the observability of the inputs which are significant to the overall valuation. The three-tier hierarchy of inputs is summarized below.
| | • | | Level 1—quoted prices in active markets for identical investments |
| | • | | Level 2—other significant observable inputs (including quoted prices for similar investments, interest rates, prepayment speeds, credit risk, etc.) |
| | |
| abfunds.com | | AB SMALL CAP GROWTH PORTFOLIO | 25 |
NOTES TO FINANCIAL STATEMENTS (continued)
| | • | | Level 3—significant unobservable inputs (including the Fund’s own assumptions in determining the fair value of investments) |
Where readily available market prices or relevant bid prices are not available for certain equity investments, such investments may be valued based on similar publicly traded investments, movements in relevant indices since last available prices or based upon underlying company fundamentals and comparable company data (such as multiples to earnings or other multiples to equity). Where an investment is valued using an observable input, such as another publicly traded security, the investment will be classified as Level 2. If management determines that an adjustment is appropriate based on restrictions on resale, illiquidity or uncertainty, and such adjustment is a significant component of the valuation, the investment will be classified as Level 3. An investment will also be classified as Level 3 where management uses company fundamentals and other significant inputs to determine the valuation.
The following tables summarize the valuation of the Fund’s investments by the above fair value hierarchy levels as of July 31, 2017:
| | | | | | | | | | | | | | | | |
Investments in
Securities: | | Level 1 | | | Level 2 | | | Level 3 | | | Total | |
Assets: | |
Common Stocks(a) | | $ | 1,244,012,176 | | | $ | – 0 | – | | $ | – 0 | – | | $ | 1,244,012,176 | |
Investment Companies | | | 12,023,242 | | | | – 0 | – | | | – 0 | – | | | 12,023,242 | |
Preferred Stocks | | | – 0 | – | | | – 0 | – | | | 1,197,860 | | | | 1,197,860 | |
Short-Term Investments | | | 41,063,780 | | | | – 0 | – | | | – 0 | – | | | 41,063,780 | |
Investments of Cash Collateral for Securities Loaned in Affiliated Money Market Fund | | | 84,994,169 | | | | – 0 | – | | | – 0 | – | | | 84,994,169 | |
| | | | | | | | | | | | | | | | |
Total Investments in Securities | | | 1,382,093,367 | | | | – 0 | – | | | 1,197,860 | | | | 1,383,291,227 | |
Other Financial Instruments(b) | | | – 0 | – | | | – 0 | – | | | – 0 | – | | | – 0 | – |
| | | | | | | | | | | | | | | | |
Total(c) | | $ | 1,382,093,367 | | | $ | – 0 | – | | $ | 1,197,860 | | | $ | 1,383,291,227 | |
| | | | | | | | | | | | | | | | |
| (a) | See Portfolio of Investments for sector classifications. |
| (b) | Other financial instruments are derivative instruments, such as futures, forwards and swaps, which are valued at the unrealized appreciation/(depreciation) on the instrument. |
| (c) | There were no transfers between any levels during the reporting period. |
The Fund recognizes all transfers between levels of the fair value hierarchy assuming the financial instruments were transferred at the beginning of the reporting period.
| | |
| 26 | AB SMALL CAP GROWTH PORTFOLIO | | abfunds.com |
NOTES TO FINANCIAL STATEMENTS (continued)
The following is a reconciliation of investments in which significant unobservable inputs (Level 3) were used in determining fair value.
| | | | | | | | | | | | |
| | | Common Stocks | | | Preferred Stocks | | | Total | |
Balance as of 7/31/16 | | $ | 1,211,049 | | | $ | – 0 | – | | $ | 1,211,049 | |
Accrued discounts/(premiums) | | | – 0 | – | | | – 0 | – | | | – 0 | – |
Realized gain (loss) | | | – 0 | – | | | – 0 | – | | | – 0 | – |
Change in unrealized appreciation/depreciation | | | – 0 | – | | | (13,189 | ) | | | (13,189 | ) |
Purchases | | | – 0 | – | | | – 0 | – | | | – 0 | – |
Sales | | | – 0 | – | | | – 0 | – | | | – 0 | – |
Reclassification | | | (1,211,049 | ) | | | 1,211,049 | | | | – 0 | – |
Transfers in to Level 3 | | | – 0 | – | | | – 0 | – | | | – 0 | – |
Transfers out of Level 3 | | | – 0 | – | | | – 0 | – | | | – 0 | – |
| | | | | | | | | | | | |
Balance as of 7/31/17 | | $ | – 0 | – | | $ | 1,197,860 | | | $ | 1,197,860 | |
| | | | | | | | | | | | |
Net change in unrealized appreciation/depreciation from investments held as of 7/31/17(a) | | $ | – 0 | – | | $ | (13,189 | ) | | $ | (13,189 | ) |
| | | | | | | | | | | | |
| (a) | The unrealized appreciation/(depreciation) is included in net change in unrealized appreciation/(depreciation) on investments and other financial instruments in the accompanying statement of operations. |
The Adviser established the Committee to oversee the pricing and valuation of all securities held in the Fund. The Committee operates under pricing and valuation policies and procedures established by the Adviser and approved by the Board, including pricing policies which set forth the mechanisms and processes to be employed on a daily basis to implement these policies and procedures. In particular, the pricing policies describe how to determine market quotations for securities and other instruments. The Committee’s responsibilities include: 1) fair value and liquidity determinations (and oversight of any third parties to whom any responsibility for fair value and liquidity determinations is delegated), and 2) regular monitoring of the Adviser’s pricing and valuation policies and procedures and modification or enhancement of these policies and procedures (or recommendation of the modification of these policies and procedures) as the Committee believes appropriate.
The Committee is also responsible for monitoring the implementation of the pricing policies by the Adviser’s Pricing Group (the “Pricing Group”) and any third party which performs certain pricing functions in accordance with the pricing policies. The Pricing Group is responsible for the oversight of the third party on a day-to-day basis. The Committee and the Pricing Group perform a series of activities to provide reasonable assurance of the accuracy of prices including: 1) periodic vendor due diligence meetings, review of methodologies, new developments and processes at vendors, 2) daily comparison of security valuation versus prior day for all securities that
| | |
| abfunds.com | | AB SMALL CAP GROWTH PORTFOLIO | 27 |
NOTES TO FINANCIAL STATEMENTS (continued)
exceeded established thresholds, and 3) daily review of unpriced, stale, and variance reports with exceptions reviewed by senior management and the Committee.
In addition, several processes outside of the pricing process are used to monitor valuation issues including: 1) performance and performance attribution reports are monitored for anomalous impacts based upon benchmark performance, and 2) portfolio managers review all portfolios for performance and analytics (which are generated using the Adviser’s prices).
3. Currency Translation
Assets and liabilities denominated in foreign currencies and commitments under forward currency exchange contracts are translated into U.S. dollars at the mean of the quoted bid and ask prices of such currencies against the U.S. dollar. Purchases and sales of portfolio securities are translated into U.S. dollars at the rates of exchange prevailing when such securities were acquired or sold. Income and expenses are translated into U.S. dollars at rates of exchange prevailing when accrued.
Net realized gain or loss on foreign currency transactions represents foreign exchange gains and losses from sales and maturities of foreign fixed income investments, foreign currency exchange contracts, holding of foreign currencies, currency gains or losses realized between the trade and settlement dates on foreign investment transactions, and the difference between the amounts of dividends, interest and foreign withholding taxes recorded on the Fund’s books and the U.S. dollar equivalent amounts actually received or paid. Net unrealized currency gains and losses from valuing foreign currency denominated assets and liabilities at period end exchange rates are reflected as a component of net unrealized appreciation or depreciation of foreign currency denominated assets and liabilities.
4. Taxes
It is the Fund’s policy to meet the requirements of the Internal Revenue Code applicable to regulated investment companies and to distribute all of its investment company taxable income and net realized gains, if any, to shareholders. Therefore, no provisions for federal income or excise taxes are required. The Fund may be subject to taxes imposed by countries in which it invests. Such taxes are generally based on income and/or capital gains earned or repatriated. Taxes are accrued and applied to net investment income, net realized gains and net unrealized appreciation/depreciation as such income and/or gains are earned.
In accordance with U.S. GAAP requirements regarding accounting for uncertainties in income taxes, management has analyzed the Fund’s tax positions taken or expected to be taken on federal and state income tax
| | |
| 28 | AB SMALL CAP GROWTH PORTFOLIO | | abfunds.com |
NOTES TO FINANCIAL STATEMENTS (continued)
returns for all open tax years (the current and the prior three tax years) and has concluded that no provision for income tax is required in the Fund’s financial statements.
5. Investment Income and Investment Transactions
Dividend income is recorded on the ex-dividend date or as soon as the Fund is informed of the dividend. Interest income is accrued daily. Investment transactions are accounted for on the date the securities are purchased or sold. Investment gains or losses are determined on the identified cost basis. The Fund amortizes premiums and accretes discounts as adjustments to interest income.
6. Class Allocations
All income earned and expenses incurred by the Fund are borne on a pro-rata basis by each outstanding class of shares, based on the proportionate interest in the Fund represented by the net assets of such class, except for class specific expenses which are allocated to the respective class. Expenses of the Company are charged proportionately to each portfolio or based on other appropriate methods. Realized and unrealized gains and losses are allocated among the various share classes based on respective net assets.
7. Dividends and Distributions
Dividends and distributions to shareholders, if any, are recorded on the ex-dividend date. Income dividends and capital gains distributions are determined in accordance with federal tax regulations and may differ from those determined in accordance with U.S. GAAP. To the extent these differences are permanent, such amounts are reclassified within the capital accounts based on their federal tax basis treatment; temporary differences do not require such reclassification.
NOTE B
Advisory Fee and Other Transactions with Affiliates
Under the terms of the investment advisory agreement, the Fund pays the Adviser an advisory fee at an annual rate of .75% of the first $2.5 billion, .65% of the excess over $2.5 billion up to $5 billion and .60% of the excess over $5 billion as a percentage of the Fund’s average daily net assets. The fee is accrued daily and paid monthly.
Pursuant to the investment advisory agreement, the Fund may reimburse the Adviser for certain legal and accounting services provided to the Fund by the Adviser. For the year ended July 31, 2017, the reimbursement for such services amounted to $66,424.
The Fund compensates AllianceBernstein Investor Services, Inc. (“ABIS”), a wholly-owned subsidiary of the Adviser, under a Transfer Agency
| | |
| abfunds.com | | AB SMALL CAP GROWTH PORTFOLIO | 29 |
NOTES TO FINANCIAL STATEMENTS (continued)
Agreement for providing personnel and facilities to perform transfer agency services for the Fund. ABIS may make payments to intermediaries that provide omnibus account services, sub-accounting services and/or networking services. Such compensation retained by ABIS amounted to $436,919 for the year ended July 31, 2017.
AllianceBernstein Investments, Inc. (the “Distributor”), a wholly-owned subsidiary of the Adviser, serves as the distributor of the Fund’s shares. The Distributor has advised the Fund that it has retained front-end sales charges of $3,401 from the sale of Class A shares and received $4,909, $1,398 and $1,364 in contingent deferred sales charges imposed upon redemptions by shareholders of Class A, Class B and Class C shares, respectively, for the year ended July 31, 2017.
The Fund may invest in AB Government Money Market Portfolio (the “Government Money Market Portfolio”) which has a contractual annual advisory fee rate of ..20% of the portfolio’s average daily net assets and bears its own expenses. In connection with the investment by the Fund in the Government Money Market Portfolio, the Adviser has agreed to waive its advisory fee from the Fund in an amount equal to the Fund’s pro rata share of the effective advisory fees of Government Money Market Portfolio, as borne indirectly by the Fund as an acquired fund fee and expense. For the year ended July 31, 2017, such waiver amounted to $38,777. A summary of the Fund’s transactions in shares of the Government Money Market Portfolio for the year ended July 31, 2017 is as follows:
| | | | | | | | | | | | | | | | | | |
Market Value 7/31/16 (000) | | | Purchases
at Cost
(000) | | | Sales
Proceeds
(000) | | | Market Value
7/31/17
(000) | | | Dividend
Income
(000) | |
| $ | 29,052 | | | $ | 352,188 | | | $ | 340,176 | | | $ | 41,064 | | | $ | 87 | |
Brokerage commissions paid on investment transactions for the year ended July 31, 2017 amounted to $860,663, of which $51 and $0, respectively, was paid to Sanford C. Bernstein & Co. LLC and Sanford C. Bernstein Limited, affiliates of the Adviser.
NOTE C
Distribution Services Agreement
The Fund has adopted a Distribution Services Agreement (the “Agreement”) pursuant to Rule 12b-1 under the Investment Company Act of 1940. Under the Agreement, the Fund pays distribution and servicing fees to the Distributor at an annual rate of up to .30% of the Fund’s average daily net assets attributable to Class A shares, 1% of the Fund’s average daily net assets attributable to both Class B and Class C shares, .50% of the Fund’s average daily net assets attributable to Class R shares and .25% of the Fund’s average daily net assets attributable to Class K shares.
| | |
| 30 | AB SMALL CAP GROWTH PORTFOLIO | | abfunds.com |
NOTES TO FINANCIAL STATEMENTS (continued)
There are no distribution and servicing fees on the Advisor Class, Class I and Class Z shares. Effective October 31, 2014, payments under the Agreement in respect of Class A shares are limited to an annual rate of .25% of Class A shares’ average daily net assets. The fees are accrued daily and paid monthly. The Agreement provides that the Distributor will use such payments in their entirety for distribution assistance and promotional activities. Since the commencement of the Fund’s operations, the Distributor has incurred expenses in excess of the distribution costs reimbursed by the Fund in the amounts of $20,222,077, $2,735,483, $623,888 and $672,749 for Class B, Class C, Class R and Class K shares, respectively. While such costs may be recovered from the Fund in future periods so long as the Agreement is in effect, the rate of the distribution and servicing fees payable under the Agreement may not be increased without a shareholder vote. In accordance with the Agreement, there is no provision for recovery of unreimbursed distribution costs incurred by the Distributor beyond the current fiscal year for Class A shares. The Agreement also provides that the Adviser may use its own resources to finance the distribution of the Fund’s shares.
NOTE D
Investment Transactions
Purchases and sales of investment securities (excluding short-term investments) for the year ended July 31, 2017 were as follows:
| | | | | | | | |
| | | Purchases | | | Sales | |
Investment securities (excluding U.S. government securities) | | $ | 740,151,208 | | | $ | 797,298,190 | |
U.S. government securities | | | – 0 | – | | | – 0 | – |
The cost of investments for federal income tax purposes, gross unrealized appreciation and unrealized depreciation are as follows:
| | | | |
Cost | | $ | 1,065,521,219 | |
| | | | |
Gross unrealized appreciation | | $ | 354,998,923 | |
Gross unrealized depreciation | | | (37,228,915 | ) |
| | | | |
Net unrealized appreciation | | $ | 317,770,008 | |
| | | | |
1. Derivative Financial Instruments
The Fund may use derivatives in an effort to earn income and enhance returns, to replace more traditional direct investments, to obtain exposure to otherwise inaccessible markets (collectively, “investment purposes”), or to hedge or adjust the risk profile of its portfolio.
The Fund did not engage in derivatives transactions for the year ended July 31, 2017.
| | |
| abfunds.com | | AB SMALL CAP GROWTH PORTFOLIO | 31 |
NOTES TO FINANCIAL STATEMENTS (continued)
2. Currency Transactions
The Fund may invest in non-U.S. Dollar-denominated securities on a currency hedged or unhedged basis. The Fund may seek investment opportunities by taking long or short positions in currencies through the use of currency-related derivatives, including forward currency exchange contracts, futures and options on futures, swaps, and other options. The Fund may enter into transactions for investment opportunities when it anticipates that a foreign currency will appreciate or depreciate in value but securities denominated in that currency are not held by the Fund and do not present attractive investment opportunities. Such transactions may also be used when the Adviser believes that it may be more efficient than a direct investment in a foreign currency-denominated security. The Fund may also conduct currency exchange contracts on a spot basis (i.e., for cash at the spot rate prevailing in the currency exchange market for buying or selling currencies).
NOTE E
Securities Lending
The Fund may enter into securities lending transactions. Under the Fund’s securities lending program, all loans of securities will be collateralized continually by cash. The Fund will be compensated for the loan from a portion of the net return from the income earned on cash collateral after a rebate is paid to the borrower (in some cases, this rebate may be a “negative rebate” or fee paid by the borrower to the Fund in connection with the loan), and payments are made for fees of the securities lending agent and for certain other administrative expenses. It is the policy of the Fund to receive collateral consisting of cash in an amount exceeding the value of the securities loaned. The Fund will have the right to call a loan and obtain the securities loaned at any time on notice to the borrower within the normal and customary settlement time for the securities. While the securities are on loan, the borrower is obligated to pay the Fund amounts equal to any income or other distributions from the securities. The Fund will not be able to exercise voting rights with respect to any securities during the existence of a loan, but will have the right to regain ownership of loaned securities in order to exercise voting or other ownership rights. The lending agent has agreed to indemnify the Fund in the case of default of any securities borrower. Collateral received and securities loaned are marked to market daily to ensure that the securities loaned are secured by collateral. The lending agent currently invests the cash collateral received in Government Money Market Portfolio, an eligible money market vehicle, in accordance with the investment restrictions of the Fund, and as approved by the Board. The collateral received on securities loaned is recorded as an asset as well as a corresponding liability in the statement of assets and liabilities. When the Fund lends securities, its investment performance will continue to reflect changes in the value of the securities loaned. At July 31, 2017,
| | |
| 32 | AB SMALL CAP GROWTH PORTFOLIO | | abfunds.com |
NOTES TO FINANCIAL STATEMENTS (continued)
the Fund had securities on loan with a value of $82,320,023 and had received cash collateral which has been invested into Government Money Market Portfolio of $84,994,169. The cash collateral will be adjusted on the next business day to maintain the required collateral amount. The Fund earned securities lending income of $198,920 and $394,769 from the borrowers and Government Money Market Portfolio, respectively, for the year ended July 31, 2017; these amounts are reflected in the statement of operations. In connection with the cash collateral investment by the Fund in the Government Money Market Portfolio, the Adviser has agreed to waive a portion of the Fund’s share of the advisory fees of Government Money Market Portfolio, as borne indirectly by the Fund as an acquired fund fee and expense. For the year ended July 31, 2017, such waiver amounted to $133,069. A principal risk of lending portfolio securities is that the borrower may fail to return the loaned securities upon termination of the loan and that the collateral will not be sufficient to replace the loaned securities. A summary of the Fund’s transactions in shares of Government Money Market Portfolio for the year ended July 31, 2017 is as follows:
| | | | | | | | | | | | |
Market Value 7/31/16 (000) | | Purchases
at Cost
(000) | | | Sales
Proceeds
(000) | | | Market Value
7/31/17
(000) | |
| $ 197,326 | | $ | 758,259 | | | $ | 870,591 | | | $ | 84,994 | |
NOTE F
Capital Stock
Each class consists of 3,000,000,000 authorized shares. Transactions in capital shares for each class were as follows:
| | | | | | | | | | | | | | | | | | | | | | | | |
| | | | | | | | | | | | | | | | | | | | | | | | |
| | | Shares | | | | | | Amount | | | | |
| | | Year Ended
July 31,
2017 | | | Year Ended
July 31,
2016 | | | | | | Year Ended
July 31,
2017 | | | Year Ended
July 31,
2016 | | | | |
| | | | | | | | |
| Class A | | | | | | | | | | | | | | | | | | | | | | | | |
Shares sold | | | 4,107,221 | | | | 835,749 | | | | | | | $ | 183,226,064 | | | $ | 33,196,108 | | | | | |
| | | | | |
Shares issued in reinvestment of distributions | | | 160,291 | | | | 616,073 | | | | | | | | 6,781,894 | | | | 25,123,448 | | | | | |
| | | | | |
Shares converted from Class B | | | 12,637 | | | | 13,801 | | | | | | | | 550,996 | | | | 549,063 | | | | | |
| | | | | |
Shares converted from Class C | | | 215,002 | | | | – 0 | – | | | | | | | 10,165,505 | | | | – 0 | – | | | | |
| | | | | |
Shares redeemed | | | (2,153,278 | ) | | | (2,107,032 | ) | | | | | | | (94,876,155 | ) | | | (83,450,827 | ) | | | | |
| | | | | |
Net increase (decrease) | | | 2,341,873 | | | | (641,409 | ) | | | | | | $ | 105,848,304 | | | $ | (24,582,208 | ) | | | | |
| | | | | |
| | |
| abfunds.com | | AB SMALL CAP GROWTH PORTFOLIO | 33 |
NOTES TO FINANCIAL STATEMENTS (continued)
| | | | | | | | | | | | | | | | | | | | | | | | |
| | | | | | | | | | | | | | | | | | | | | | | | |
| | | Shares | | | | | | Amount | | | | |
| | | Year Ended
July 31,
2017 | | | Year Ended
July 31,
2016 | | | | | | Year Ended
July 31,
2017 | | | Year Ended
July 31,
2016 | | | | |
| | | | | | | | | | | | | | | | | | | | | | | | |
| Class B | | | | | | | | | | | | | | | | | | | | | | | | |
Shares sold | | | 4,068 | | | | 3,020 | | | | | | | $ | 124,690 | | | $ | 85,046 | | | | | |
| | | | | |
Shares issued in reinvestment of distributions | | | 1,538 | | | | 8,432 | | | | | | | | 44,722 | | | | 240,559 | | | | | |
| | | | | |
Shares converted to Class A | | | (18,311 | ) | | | (19,532 | ) | | | | | | | (550,996 | ) | | | (549,063 | ) | | | | |
| | | | | |
Shares redeemed | | | (7,171 | ) | | | (8,465 | ) | | | | | | | (223,357 | ) | | | (243,211 | ) | | | | |
| | | | | |
Net decrease | | | (19,876 | ) | | | (16,545 | ) | | | | | | $ | (604,941 | ) | | $ | (466,669 | ) | | | | |
| | | | | |
| | | | | | | | | | | | | | | | | | | | | | | | |
| Class C | | | | | | | | | | | | | | | | | | | | | | | | |
Shares sold | | | 48,554 | | | | 94,031 | | | | | | | $ | 1,492,782 | | | $ | 2,664,151 | | | | | |
| | | | | |
Shares issued in reinvestment of distributions | | | 37,284 | | | | 172,897 | | | | | | | | 1,096,513 | | | | 4,988,076 | | | | | |
| | | | | |
Shares converted to Class A | | | (310,163 | ) | | | – 0 | – | | | | | | | (10,165,505 | ) | | | – 0 | – | | | | |
| | | | | |
Shares redeemed | | | (319,762 | ) | | | (574,889 | ) | | | | | | | (9,805,148 | ) | | | (15,968,924 | ) | | | | |
| | | | | |
Net decrease | | | (544,087 | ) | | | (307,961 | ) | | | | | | $ | (17,381,358 | ) | | $ | (8,316,697 | ) | | | | |
| | | | | |
| | | | | | | | | | | | | | | | | | | | | | | | |
| Advisor Class | | | | | | | | | | | | | | | | | | | | | | | | |
Shares sold | | | 2,123,318 | | | | 1,630,203 | | | | | | | $ | 103,304,850 | | | $ | 69,367,720 | | | | | |
| | | | | |
Shares issued in reinvestment of distributions | | | 86,364 | | | | 474,756 | | | | | | | | 3,933,861 | | | | 20,761,076 | | | | | |
| | | | | |
Shares redeemed | | | (2,471,406 | ) | | | (5,463,636 | ) | | | | | | | (116,312,691 | ) | | | (226,299,391 | ) | | | | |
| | | | | |
Net decrease | | | (261,724 | ) | | | (3,358,677 | ) | | | | | | $ | (9,073,980 | ) | | $ | (136,170,595 | ) | | | | |
| | | | | |
| | | | | | | | | | | | | | | | | | | | | | | | |
| Class R | | | | | | | | | | | | | | | | | | | | | | | | |
Shares sold | | | 153,209 | | | | 222,524 | | | | | | | $ | 6,719,829 | | | $ | 8,907,944 | | | | | |
| | | | | |
Shares issued in reinvestment of distributions | | | 20,494 | | | | 100,664 | | | | | | | | 848,048 | | | | 4,027,556 | | | | | |
| | | | | |
Shares redeemed | | | (465,643 | ) | | | (453,269 | ) | | | | | | | (20,033,609 | ) | | | (17,568,618 | ) | | | | |
| | | | | |
Net decrease | | | (291,940 | ) | | | (130,081 | ) | | | | | | $ | (12,465,732 | ) | | $ | (4,633,118 | ) | | | | |
| | | | | |
| | | | | | | | | | | | | | | | | | | | | | | | |
| Class K | | | | | | | | | | | | | | | | | | | | | | | | |
Shares sold | | | 187,456 | | | | 317,247 | | | | | | | $ | 8,517,165 | | | $ | 12,872,586 | | | | | |
| | | | | |
Shares issued in reinvestment of distributions | | | 26,709 | | | | 148,773 | | | | | | | | 1,155,456 | | | | 6,196,406 | | | | | |
| | | | | |
Shares redeemed | | | (1,066,152 | ) | | | (572,702 | ) | | | | | | | (47,456,747 | ) | | | (23,262,447 | ) | | | | |
| | | | | |
Net decrease | | | (851,987 | ) | | | (106,682 | ) | | | | | | $ | (37,784,126 | ) | | $ | (4,193,455 | ) | | | | |
| | | | | |
| | |
| 34 | AB SMALL CAP GROWTH PORTFOLIO | | abfunds.com |
NOTES TO FINANCIAL STATEMENTS (continued)
| | | | | | | | | | | | | | | | | | | | | | | | |
| | | | | | | | | | | | | | | | | | | | | | | | |
| | | Shares | | | | | | Amount | | | | |
| | | Year Ended
July 31,
2017 | | | Year Ended
July 31,
2016 | | | | | | Year Ended
July 31,
2017 | | | Year Ended
July 31,
2016 | | | | |
| | | | | | | | | | | | | | | | | | | | | | | | |
| Class I | | | | | | | | | | | | | | | | | | | | | | | | |
Shares sold | | | 1,352,005 | | | | 1,645,074 | | | | | | | $ | 65,074,309 | | | $ | 70,472,871 | | | | | |
| | | | | |
Shares issued in reinvestment of distributions | | | 136,695 | | | | 717,004 | | | | | | | | 6,201,852 | | | | 31,196,864 | | | | | |
| | | | | |
Shares redeemed | | | (2,286,283 | ) | | | (4,458,142 | ) | | | | | | | (108,537,412 | ) | | | (180,194,086 | ) | | | | |
| | | | | |
Net decrease | | | (797,583 | ) | | | (2,096,064 | ) | | | | | | $ | (37,261,251 | ) | | $ | (78,524,351 | ) | | | | |
| | | | | |
| | | | | | | | | | | | | | | | | | | | | | | | |
| Class Z | | | | | | | | | | | | | | | | | | | | | | | | |
Shares sold | | | 740,593 | | | | 2,263,578 | | | | | | | $ | 36,519,461 | | | $ | 86,290,355 | | | | | |
| | | | | |
Shares issued in reinvestment of distributions | | | 29,640 | | | | 22,517 | | | | | | | | 1,346,821 | | | | 980,170 | | | | | |
| | | | | |
Shares redeemed | | | (1,026,088 | ) | | | (179,711 | ) | | | | | | | (46,351,580 | ) | | | (7,128,344 | ) | | | | |
| | | | | |
Net increase (decrease) | | | (255,855 | ) | | | 2,106,384 | | | | | | | $ | (8,485,298 | ) | | $ | 80,142,181 | | | | | |
| | | | | |
For the year ended July 31, 2016, the Fund recorded proceeds of $67,021 in connection with a residual distribution from the Alliance Fair Fund relating to regulatory settlements in 2004. This amount is presented in the Fund’s statement of changes in net assets.
NOTE G
Risks Involved in Investing in the Fund
Capitalization Risk—Investments in small- and mid-capitalization companies may be more volatile than investments in large-capitalization companies. Investments in small-capitalization companies may have additional risks because these companies have limited product lines, markets or financial resources.
Foreign (Non-U.S.) Risk—Investments in securities of non-U.S. issuers may involve more risk than those of U.S. issuers. These securities may fluctuate more widely in price and may be less liquid due to adverse market, economic, political, regulatory or other factors.
Derivatives Risk—The Fund may enter into derivative transactions such as forwards, options, futures and swaps. Derivatives may be illiquid, difficult to price, and leveraged so that small changes may produce disproportionate losses for the Fund, and subject to counterparty risk to a greater degree than more traditional investments. Derivatives may result in significant losses, including losses that are far greater than the value of the derivatives reflected on the statement of assets and liabilities.
| | |
| abfunds.com | | AB SMALL CAP GROWTH PORTFOLIO | 35 |
NOTES TO FINANCIAL STATEMENTS (continued)
Indemnification Risk—In the ordinary course of business, the Fund enters into contracts that contain a variety of indemnifications. The Fund’s maximum exposure under these arrangements is unknown. However, the Fund has not had prior claims or losses pursuant to these indemnification provisions and expects the risk of loss thereunder to be remote. Therefore, the Fund has not accrued any liability in connection with these indemnification provisions.
NOTE H
Joint Credit Facility
A number of open-end mutual funds managed by the Adviser, including the Fund, participate in a $280 million revolving credit facility (the “Facility”) intended to provide short-term financing, if necessary, subject to certain restrictions in connection with abnormal redemption activity. Commitment fees related to the Facility are paid by the participating funds and are included in miscellaneous expenses in the statement of operations. The Fund did not utilize the Facility during the year ended July 31, 2017.
NOTE I
Distributions to Shareholders
The tax character of distributions paid during the fiscal years ended July 31, 2017 and July 31, 2016 were as follows:
| | | | | | | | |
| | | 2017 | | | 2016 | |
Distributions paid from: | | | | | | | | |
Long-term capital gains | | $ | 23,615,306 | | | $ | 107,708,547 | |
| | | | | | | | |
Total taxable distributions | | $ | 23,615,306 | | | $ | 107,708,547 | |
| | | | | | | | |
As of July 31, 2017, the components of accumulated earnings/(deficit) on a tax basis were as follows:
| | | | |
Undistributed ordinary income | | $ | 12,919,230 | |
Undistributed capital gains | | | 55,405,042 | |
Unrealized appreciation/(depreciation) | | | 317,770,008 | (a) |
| | | | |
Total accumulated earnings/(deficit) | | $ | 386,094,280 | |
| | | | |
| (a) | The differences between book-basis and tax-basis unrealized appreciation/(depreciation) are attributable primarily to the tax deferral of losses on wash sales and the tax treatment of passive foreign investment companies (PFICs). |
For tax purposes, net realized capital losses may be carried over to offset future capital gains, if any. Funds are permitted to carry forward capital losses for an indefinite period, and such losses will retain their character as either short-term or long-term capital losses. As of July 31, 2017, the Fund did not have any capital loss carryforwards.
| | |
| 36 | AB SMALL CAP GROWTH PORTFOLIO | | abfunds.com |
NOTES TO FINANCIAL STATEMENTS (continued)
During the current fiscal year, permanent differences primarily due to the tax treatment of passive foreign investment companies (PFICs) and the disallowance of net operating loss resulted in a net decrease in accumulated net investment loss, a net decrease in accumulated net realized gain on investment transactions, and a net decrease in additional paid-in capital. These reclassifications had no effect on net assets.
NOTE J
Other
In October 2016, the U.S. Securities and Exchange Commission adopted new rules and amended existing rules (together, “final rules”) intended to modernize the reporting and disclosure of information by registered investment companies. In part, the final rules amend Regulation S-X and require standardized, enhanced disclosure about derivatives in investment company financial statements, as well as other amendments. The compliance date for the amendments to Regulation S-X is August 1, 2017 (for the reporting period end dates August 31, 2017 or after). Management has evaluated the impact of the amendments and expects the effects of the adoption of the final rules on financial statements will be limited to additional disclosures.
NOTE K
Subsequent Events
Management has evaluated subsequent events for possible recognition or disclosure in the financial statements through the date the financial statements are issued. Management has determined that there are no material events that would require disclosure in the Fund’s financial statements through this date.
| | |
| abfunds.com | | AB SMALL CAP GROWTH PORTFOLIO | 37 |
FINANCIAL HIGHLIGHTS
Selected Data For A Share Of Capital Stock Outstanding Throughout Each Period
| | | | | | | | | | | | | | | | | | | | |
| | | Class A | |
| | | Year Ended July 31, | |
| | | 2017 | | | 2016 | | | 2015 | | | 2014 | | | 2013 | |
| | | | |
| | | | | | | | | | | | | | | | | | | | |
Net asset value, beginning of period | | | $ 41.28 | | | | $ 48.82 | | | | $ 48.62 | | | | $ 47.08 | | | | $ 37.62 | |
| | | | |
Income From Investment Operations | | | | | | | | | | | | | | | | | | | | |
Net investment loss(a) | | | (.38 | )(b)† | | | (.32 | )(b) | | | (.33 | ) | | | (.47 | ) | | | (.36 | ) |
Net realized and unrealized gain (loss) on investment transactions | | | 9.32 | | | | (3.52 | ) | | | 6.07 | | | | 5.28 | | | | 11.10 | |
Capital contributions | | | – 0 | – | | | .00 | (c) | | | – 0 | – | | | – 0 | – | | | – 0 | – |
| | | | |
Net increase (decrease) in net asset value from operations | | | 8.94 | | | | (3.84 | ) | | | 5.74 | | | | 4.81 | | | | 10.74 | |
| | | | |
Less: Distributions | | | | | | | | | | | | | | | | | | | | |
Distributions from net realized gain on investment transactions | | | (.97 | ) | | | (3.70 | ) | | | (5.54 | ) | | | (3.27 | ) | | | (1.28 | ) |
| | | | |
Net asset value, end of period | | | $ 49.25 | | | | $ 41.28 | | | | $ 48.82 | | | | $ 48.62 | | | | $ 47.08 | |
| | | | |
Total Return | | | | | | | | | | | | | | | | | | | | |
Total investment return based on net asset value(d) | | | 22.05 | %†*‡ | | | (7.77 | )%*‡ | | | 13.24 | % | | | 10.21 | %* | | | 29.47 | %* |
Ratios/Supplemental Data | | | | | | | | | | | | | | | | | | | | |
Net assets, end of period (000’s omitted) | | | $465,188 | | | | $293,237 | | | | $378,062 | | | | $475,832 | | | | $452,253 | |
Ratio to average net assets of: | | | | | | | | | | | | | | | | | | | | |
Expenses, net of waivers/reimbursements(e) | | | 1.17 | % | | | 1.27 | % | | | 1.20 | % | | | 1.27 | % | | | 1.34 | % |
Expenses, before waivers/reimbursements(e) | | | 1.19 | % | | | 1.28 | % | | | 1.20 | % | | | 1.27 | % | | | 1.34 | % |
Net investment loss | | | (.85 | )%(b)† | | | (.80 | )%(b) | | | (.70 | )% | | | (.93 | )% | | | (.89 | )% |
Portfolio turnover rate | | | 66 | % | | | 70 | % | | | 61 | % | | | 80 | % | | | 76 | % |
See footnote summary on page 46.
| | |
| 38 | AB SMALL CAP GROWTH PORTFOLIO | | abfunds.com |
FINANCIAL HIGHLIGHTS (continued)
Selected Data For A Share Of Capital Stock Outstanding Throughout Each Period
| | | | | | | | | | | | | | | | | | | | |
| | | Class B | |
| | | Year Ended July 31, | |
| | | 2017 | | | 2016 | | | 2015 | | | 2014 | | | 2013 | |
| | | | |
| | | | | | | | | | | | | | | | | | | | |
Net asset value, beginning of period | | | $ 28.74 | | | | $ 35.48 | | | | $ 37.14 | | | | $ 36.93 | | | | $ 30.01 | |
| | | | |
Income From Investment Operations | | | | | | | | | | | | | | | | | | | | |
Net investment loss(a) | | | (.47 | )(b)† | | | (.46 | )(b) | | | (.53 | ) | | | (.67 | ) | | | (.52 | ) |
Net realized and unrealized gain (loss) on investment transactions | | | 6.37 | | | | (2.58 | ) | | | 4.41 | | | | 4.15 | | | | 8.72 | |
Capital contributions | | | – 0 | – | | | .00 | (c) | | | – 0 | – | | | – 0 | – | | | – 0 | – |
| | | | |
Net increase (decrease) in net asset value from operations | | | 5.90 | | | | (3.04 | ) | | | 3.88 | | | | 3.48 | | | | 8.20 | |
| | | | |
Less: Distributions | | | | | | | | | | | | | | | | | | | | |
Distributions from net realized gain on investment transactions | | | (.97 | ) | | | (3.70 | ) | | | (5.54 | ) | | | (3.27 | ) | | | (1.28 | ) |
| | | | |
Net asset value, end of period | | | $ 33.67 | | | | $ 28.74 | | | | $ 35.48 | | | | $ 37.14 | | | | $ 36.93 | |
| | | | |
Total Return | | | | | | | | | | | | | | | | | | | | |
Total investment return based on net asset value(d) | | | 21.07 | %†*‡ | | | (8.48 | )%*‡ | | | 12.22 | % | | | 9.37 | %* | | | 28.45 | %* |
Ratios/Supplemental Data | | | | | | | | | | | | | | | | | | | | |
Net assets, end of period (000’s omitted) | | | $1,290 | | | | $1,672 | | | | $2,652 | | | | $3,774 | | | | $5,329 | |
Ratio to average net assets of: | | | | | | | | | | | | | | | | | | | | |
Expenses, net of waivers/reimbursements(e) | | | 1.97 | % | | | 2.08 | % | | | 1.99 | % | | | 2.04 | % | | | 2.12 | % |
Expenses, before waivers/reimbursements(e) | | | 1.98 | % | | | 2.08 | % | | | 1.99 | % | | | 2.04 | % | | | 2.12 | % |
Net investment loss | | | (1.53 | )%(b)† | | | (1.60 | )%(b) | | | (1.49 | )% | | | (1.72 | )% | | | (1.63 | )% |
Portfolio turnover rate | | | 66 | % | | | 70 | % | | | 61 | % | | | 80 | % | | | 76 | % |
See footnote summary on page 46.
| | |
| abfunds.com | | AB SMALL CAP GROWTH PORTFOLIO | 39 |
FINANCIAL HIGHLIGHTS (continued)
Selected Data For A Share Of Capital Stock Outstanding Throughout Each Period
| | | | | | | | | | | | | | | | | | | | |
| | | Class C | |
| | | Year Ended July 31, | |
| | | 2017 | | | 2016 | | | 2015 | | | 2014 | | | 2013 | |
| | | | |
| | | | | | | | | | | | | | | | | | | | |
Net asset value, beginning of period | | | $ 29.06 | | | | $ 35.82 | | | | $ 37.41 | | | | $ 37.17 | | | | $ 30.18 | |
| | | | |
Income From Investment Operations | | | | | | | | | | | | | | | | | | | | |
Net investment loss(a) | | | (.45 | )(b)† | | | (.45 | )(b) | | | (.52 | ) | | | (.65 | ) | | | (.53 | ) |
Net realized and unrealized gain (loss) on investment transactions | | | 6.44 | | | | (2.61 | ) | | | 4.47 | | | | 4.16 | | | | 8.80 | |
Capital contributions | | | – 0 | – | | | .00 | (c) | | | – 0 | – | | | – 0 | – | | | – 0 | – |
| | | | |
Net increase (decrease) in net asset value from operations | | | 5.99 | | | | (3.06 | ) | | | 3.95 | | | | 3.51 | | | | 8.27 | |
| | | | |
Less: Distributions | | | | | | | | | | | | | | | | | | | | |
Distributions from net realized gain on investment transactions | | | (.97 | ) | | | (3.70 | ) | | | (5.54 | ) | | | (3.27 | ) | | | (1.28 | ) |
| | | | |
Net asset value, end of period | | | $ 34.08 | | | | $ 29.06 | | | | $ 35.82 | | | | $ 37.41 | | | | $ 37.17 | |
| | | | |
Total Return | | | | | | | | | | | | | | | | | | | | |
Total investment return based on net asset value(d) | | | 21.15 | %†*‡ | | | (8.46 | )%*‡ | | | 12.33 | % | | | 9.39 | %* | | | 28.52 | %* |
Ratios/Supplemental Data | | | | | | | | | | | | | | | | | | | | |
Net assets, end of period (000’s omitted) | | | $27,343 | | | | $39,132 | | | | $59,262 | | | | $67,619 | | | | $60,274 | |
Ratio to average net assets of: | | | | | | | | | | | | | | | | | | | | |
Expenses, net of waivers/reimbursements(e) | | | 1.93 | % | | | 2.02 | % | | | 1.95 | % | | | 2.00 | % | | | 2.08 | % |
Expenses, before waivers/reimbursements(e) | | | 1.95 | % | | | 2.03 | % | | | 1.95 | % | | | 2.00 | % | | | 2.08 | % |
Net investment loss | | | (1.46 | )%(b)† | | | (1.54 | )%(b) | | | (1.45 | )% | | | (1.66 | )% | | | (1.64 | )% |
Portfolio turnover rate | | | 66 | % | | | 70 | % | | | 61 | % | | | 80 | % | | | 76 | % |
See footnote summary on page 46.
| | |
| 40 | AB SMALL CAP GROWTH PORTFOLIO | | abfunds.com |
FINANCIAL HIGHLIGHTS (continued)
Selected Data For A Share Of Capital Stock Outstanding Throughout Each Period
| | | | | | | | | | | | | | | | | | | | |
| | | Advisor Class | |
| | | Year Ended July 31, | |
| | | 2017 | | | 2016 | | | 2015 | | | 2014 | | | 2013 | |
| | | | |
| | | | | | | | | | | | | | | | | | | | |
Net asset value, beginning of period | | | $ 44.33 | | | | $ 52.00 | | | | $ 51.31 | | | | $ 49.39 | | | | $ 39.30 | |
| | | | |
Income From Investment Operations | | | | | | | | | | | | | | | | | | | | |
Net investment loss(a) | | | (.25 | )(b)† | | | (.23 | )(b) | | | (.22 | ) | | | (.35 | ) | | | (.27 | ) |
Net realized and unrealized gain (loss) on investment transactions | | | 9.99 | | | | (3.74 | ) | | | 6.45 | | | | 5.54 | | | | 11.64 | |
Capital contributions | | | – 0 | – | | | .00 | (c) | | | – 0 | – | | | – 0 | – | | | – 0 | – |
| | | | |
Net increase (decrease) in net asset value from operations | | | 9.74 | | | | (3.97 | ) | | | 6.23 | | | | 5.19 | | | | 11.37 | |
| | | | |
Less: Distributions | | | | | | | | | | | | | | | | | | | | |
Distributions from net realized gain on investment transactions | | | (.97 | ) | | | (3.70 | ) | | | (5.54 | ) | | | (3.27 | ) | | | (1.28 | ) |
| | | | |
Net asset value, end of period | | | $ 53.10 | | | | $ 44.33 | | | | $ 52.00 | | | | $ 51.31 | | | | $ 49.39 | |
| | | | |
Total Return | | | | | | | | | | | | | | | | | | | | |
Total investment return based on net asset value(d) | | | 22.34 | %†*‡ | | | (7.53 | )%*‡ | | | 13.51 | % | | | 10.51 | %* | | | 29.82 | %* |
Ratios/Supplemental Data | | | | | | | | | | | | | | | | | | | | |
Net assets, end of period (000’s omitted) | | | $309,330 | | | | $269,857 | | | | $491,170 | | | | $426,149 | | | | $320,624 | |
Ratio to average net assets of: | | | | | | | | | | | | | | | | | | | | |
Expenses, net of waivers/reimbursements(e) | | | .93 | % | | | 1.01 | % | | | .94 | % | | | 1.00 | % | | | 1.07 | % |
Expenses, before waivers/reimbursements(e) | | | .94 | % | | | 1.02 | % | | | .94 | % | | | 1.00 | % | | | 1.07 | % |
Net investment loss | | | (.52 | )%(b)† | | | (.54 | )%(b) | | | (.44 | )% | | | (.65 | )% | | | (.64 | )% |
Portfolio turnover rate | | | 66 | % | | | 70 | % | | | 61 | % | | | 80 | % | | | 76 | % |
See footnote summary on page 46.
| | |
| abfunds.com | | AB SMALL CAP GROWTH PORTFOLIO | 41 |
FINANCIAL HIGHLIGHTS (continued)
Selected Data For A Share Of Capital Stock Outstanding Throughout Each Period
| | | | | | | | | | | | | | | | | | | | |
| | | Class R | |
| | | Year Ended July 31, | |
| | | 2017 | | | 2016 | | | 2015 | | | 2014 | | | 2013 | |
| | | | |
| | | | | | | | | | | | | | | | | | | | |
Net asset value, beginning of period | | | $ 40.44 | | | | $ 48.03 | | | | $ 48.09 | | | | $ 46.71 | | | | $ 37.42 | |
| | | | |
Income From Investment Operations | | | | | | | | | | | | | | | | | | | | |
Net investment loss(a) | | | (.47 | )(b)† | | | (.43 | )(b) | | | (.49 | ) | | | (.59 | ) | | | (.45 | ) |
Net realized and unrealized gain (loss) on investment transactions | | | 9.05 | | | | (3.46 | ) | | | 5.97 | | | | 5.24 | | | | 11.02 | |
Capital contributions | | | – 0 | – | | | .00 | (c) | | | – 0 | – | | | – 0 | – | | | – 0 | – |
| | | | |
Net increase (decrease) in net asset value from operations | | | 8.58 | | | | (3.89 | ) | | | 5.48 | | | | 4.65 | | | | 10.57 | |
| | | | |
Less: Distributions | | | | | | | | | | | | | | | | | | | | |
Distributions from net realized gain on investment transactions | | | (.97 | ) | | | (3.70 | ) | | | (5.54 | ) | | | (3.27 | ) | | | (1.28 | ) |
| | | | |
Net asset value, end of period | | | $ 48.05 | | | | $ 40.44 | | | | $ 48.03 | | | | $ 48.09 | | | | $ 46.71 | |
| | | | |
Total Return | | | | | | | | | | | | | | | | | | | | |
Total investment return based on net asset value(d) | | | 21.61 | %†*‡ | | | (8.01 | )%*‡ | | | 12.81 | % | | | 9.94 | %* | | | 29.17 | %* |
Ratios/Supplemental Data | | | | | | | | | | | | | | | | | | | | |
Net assets, end of period (000’s omitted) | | | $33,842 | | | | $40,284 | | | | $54,094 | | | | $53,267 | | | | $50,283 | |
Ratio to average net assets of: | | | | | | | | | | | | | | | | | | | | |
Expenses, net of waivers/reimbursements(e) | | | 1.51 | % | | | 1.56 | % | | | 1.54 | % | | | 1.52 | % | | | 1.55 | % |
Expenses, before waivers/reimbursements(e) | | | 1.53 | % | | | 1.56 | % | | | 1.54 | % | | | 1.52 | % | | | 1.55 | % |
Net investment loss | | | (1.08 | )%(b)† | | | (1.08 | )%(b) | | | (1.04 | )% | | | (1.18 | )% | | | (1.12 | )% |
Portfolio turnover rate | | | 66 | % | | | 70 | % | | | 61 | % | | | 80 | % | | | 76 | % |
See footnote summary on page 46.
| | |
| 42 | AB SMALL CAP GROWTH PORTFOLIO | | abfunds.com |
FINANCIAL HIGHLIGHTS (continued)
Selected Data For A Share Of Capital Stock Outstanding Throughout Each Period
| | | | | | | | | | | | | | | | | | | | |
| | | Class K | |
| | | Year Ended July 31, | |
| | | 2017 | | | 2016 | | | 2015 | | | 2014 | | | 2013 | |
| | | | |
| | | | | | | | | | | | | | | | | | | | |
Net asset value, beginning of period | | | $ 42.18 | | | | $ 49.77 | | | | $ 49.48 | | | | $ 47.83 | | | | $ 38.16 | |
| | | | |
Income From Investment Operations | | | | | | | | | | | | | | | | | | | | |
Net investment loss(a) | | | (.30 | )(b)† | | | (.31 | )(b) | | | (.35 | ) | | | (.44 | ) | | | (.33 | ) |
Net realized and unrealized gain (loss) on investment transactions | | | 9.42 | | | | (3.58 | ) | | | 6.18 | | | | 5.36 | | | | 11.28 | |
Capital contributions | | | – 0 | – | | | .00 | (c) | | | – 0 | – | | | – 0 | – | | | – 0 | – |
| | | | |
Net increase (decrease) in net asset value from operations | | | 9.12 | | | | (3.89 | ) | | | 5.83 | | | | 4.92 | | | | 10.95 | |
| | | | |
Less: Distributions | | | | | | | | | | | | | | | | | | | | |
Distributions from net realized gain on investment transactions | | | (.97 | ) | | | (3.70 | ) | | | (5.54 | ) | | | (3.27 | ) | | | (1.28 | ) |
| | | | |
Net asset value, end of period | | | $ 50.33 | | | | $ 42.18 | | | | $ 49.77 | | | | $ 49.48 | | | | $ 47.83 | |
| | | | |
Total Return | | | | | | | | | | | | | | | | | | | | |
Total investment return based on net asset value(d) | | | 22.00 | %†*‡ | | | (7.71 | )%*‡ | | | 13.16 | % | | | 10.30 | %* | | | 29.60 | %* |
Ratios/Supplemental Data | | | | | | | | | | | | | | | | | | | | |
Net assets, end of period (000’s omitted) | | | $40,370 | | | | $69,770 | | | | $87,627 | | | | $82,244 | | | | $75,804 | |
Ratio to average net assets of: | | | | | | | | | | | | | | | | | | | | |
Expenses, net of waivers/reimbursements(e) | | | 1.20 | % | | | 1.23 | % | | | 1.22 | % | | | 1.19 | % | | | 1.21 | % |
Expenses, before waivers/reimbursements(e) | | | 1.22 | % | | | 1.23 | % | | | 1.22 | % | | | 1.19 | % | | | 1.21 | % |
Net investment loss | | | (.67 | )%(b)† | | | (.76 | )%(b) | | | (.73 | )% | | | (.85 | )% | | | (.78 | )% |
Portfolio turnover rate | | | 66 | % | | | 70 | % | | | 61 | % | | | 80 | % | | | 76 | % |
See footnote summary on page 46.
| | |
| abfunds.com | | AB SMALL CAP GROWTH PORTFOLIO | 43 |
FINANCIAL HIGHLIGHTS (continued)
Selected Data For A Share Of Capital Stock Outstanding Throughout Each Period
| | | | | | | | | | | | | | | | | | | | |
| | | Class I | |
| | | Year Ended July 31, | |
| | | 2017 | | | 2016 | | | 2015 | | | 2014 | | | 2013 | |
| | | | |
| | | | | | | | | | | | | | | | | | | | |
Net asset value, beginning of period | | | $ 44.15 | | | | $ 51.75 | | | | $ 51.07 | | | | $ 49.13 | | | | $ 39.05 | |
| | | | |
Income From Investment Operations | | | | | | | | | | | | | | | | | | | | |
Net investment loss(a) | | | (.24 | )(b)† | | | (.19 | )(b) | | | (.20 | ) | | | (.30 | ) | | | (.21 | ) |
Net realized and unrealized gain (loss) on investment transactions | | | 9.95 | | | | (3.71 | ) | | | 6.42 | | | | 5.51 | | | | 11.57 | |
Capital contributions | | | – 0 | – | | | .00 | (c) | | | – 0 | – | | | – 0 | – | | | – 0 | – |
| | | | |
Net increase (decrease) in net asset value from operations | | | 9.71 | | | | (3.90 | ) | | | 6.22 | | | | 5.21 | | | | 11.36 | |
| | | | |
Less: Distributions | | | | | | | | | | | | | | | | | | | | |
Distributions from net realized gain on investment transactions | | | (.97 | ) | | | (3.70 | ) | | | (5.54 | ) | | | (3.27 | ) | | | (1.28 | ) |
| | | | |
Net asset value, end of period | | | $ 52.89 | | | | $ 44.15 | | | | $ 51.75 | | | | $ 51.07 | | | | $ 49.13 | |
| | | | |
Total Return | | | | | | | | | | | | | | | | | | | | |
Total investment return based on net asset value(d) | | | 22.36 | %†*‡ | | | (7.42 | )%*‡ | | | 13.57 | % | | | 10.61 | %* | | | 29.98 | %* |
Ratios/Supplemental Data | | | | | | | | | | | | | | | | | | | | |
Net assets, end of period (000’s omitted) | | | $319,437 | | | | $301,866 | | | | $462,296 | | | | $436,828 | | | | $474,383 | |
Ratio to average net assets of: | | | | | | | | | | | | | | | | | | | | |
Expenses, net of waivers/reimbursements(e) | | | .91 | % | | | .92 | % | | | .91 | % | | | .91 | % | | | .92 | % |
Expenses, before waivers/reimbursements(e) | | | .93 | % | | | .92 | % | | | .91 | % | | | .91 | % | | | .92 | % |
Net investment loss | | | (.51 | )%(b)† | | | (.45 | )%(b) | | | (.41 | )% | | | (.57 | )% | | | (.51 | )% |
Portfolio turnover rate | | | 66 | % | | | 70 | % | | | 61 | % | | | 80 | % | | | 76 | % |
See footnote summary on page 46.
| | |
| 44 | AB SMALL CAP GROWTH PORTFOLIO | | abfunds.com |
FINANCIAL HIGHLIGHTS (continued)
Selected Data For A Share Of Capital Stock Outstanding Throughout Each Period
| | | | | | | | | | | | |
| | | Class Z | |
| | | Year Ended July 31, | | | June 30,
2015(f) to
July 31,
2015 | |
| | | 2017 | | | 2016 | | |
| | | | |
| | | | | | | | | | | | |
Net asset value, beginning of period | | | $ 44.20 | | | | $ 51.75 | | | | $ 52.05 | |
| | | | |
Income From Investment Operations | | | | | | | | | | | | |
Net investment income (loss)(a) | | | (.23 | )(b)† | | | (.16 | )(b) | | | (.05 | ) |
Net realized and unrealized gain (loss) on investment transactions | | | 10.00 | | | | (3.69 | ) | | | (.25 | )** |
Capital contributions | | | – 0 | – | | | .00 | (c) | | | – 0 | – |
| | | | |
Net increase (decrease) in net asset value from operations | | | 9.77 | | | | (3.85 | ) | | | (.30 | ) |
| | | | |
Less: Distributions | | | | | | | | | | | | |
Distributions from net realized gain on investment transactions | | | (.97 | ) | | | (3.70 | ) | | | – 0 | – |
| | | | |
Net asset value, end of period | | | $ 53.00 | | | | $ 44.20 | | | | $ 51.75 | |
| | | | |
Total Return | | | | | | | | | | | | |
Total investment return based on net asset value(d) | | | 22.47 | %†*‡ | | | (7.32 | )%‡* | | | (.58 | )% |
Ratios/Supplemental Data | | | | | | | | | | | | |
Net assets, end of period (000’s omitted) | | | $98,090 | | | | $93,108 | | | | $10 | |
Ratio to average net assets of: | | | | | | | | | | | | |
Expenses, net of waivers/reimbursements(e) | | | .82 | % | | | .85 | % | | | .71 | %^ |
Expenses, before waivers/reimbursements(e) | | | .83 | % | | | .85 | % | | | .71 | %^ |
Net investment income (loss) | | | (.49 | )%(b)† | | | (.40 | )%(b) | | | (1.06 | )%^ |
Portfolio turnover rate | | | 66 | % | | | 70 | % | | | 61 | % |
See footnote summary on page 46.
| | |
| abfunds.com | | AB SMALL CAP GROWTH PORTFOLIO | 45 |
FINANCIAL HIGHLIGHTS (continued)
Selected Data For A Share Of Capital Stock Outstanding Throughout Each Period
| (a) | Based on average shares outstanding. |
| (b) | Net of fees and expenses waived/reimbursed by the Adviser. |
| (c) | Amount is less than $.005. |
| (d) | Total investment return is calculated assuming an initial investment made at the net asset value at the beginning of the period, reinvestment of all dividends and distributions at net asset value during the period, and redemption on the last day of the period. Initial sales charges or contingent deferred sales charges are not reflected in the calculation of total investment return. Total return does not reflect the deduction of taxes that a shareholder would pay on fund distributions or the redemption of fund shares. Total investment return calculated for a period of less than one year is not annualized. |
| (e) | In connection with the Fund’s investments in affiliated underlying portfolios, the Fund incurs no direct expenses, but bears proportionate shares of the fees and expenses (i.e., operating, administrative and investment advisory fees) of the affiliated underlying portfolios. The Adviser has contractually agreed to waive its fees from the Fund in an amount equal to the Fund’s pro rata share of certain acquired fund fees and expenses, and for the year ended July 31, 2017, such waiver amounted to 0.02% for the Fund. |
| (f) | Commencement of distributions. |
| † | For the year ended July 31, 2017 the amount includes a refund for overbilling of prior years’ custody out of pocket fees as follows: |
| | | | |
Net Investment Income Per Share | | Net Investment
Income Ratio | | Total
Return |
| $.004 | | .01% | | .01% |
| * | Includes the impact of proceeds received and credited to the Fund resulting from class action settlements, which enhanced the Fund’s performance for the years ended July 31, 2017, July 31, 2016, July 31, 2014, and July 31, 2013 by 0.03%, 0.02%, 0.01% and 0.08%, respectively. |
| | Includes the impact of proceeds received and credited to the Fund in connection with a residual distribution relating to regulatory settlements, which enhanced the Fund’s performance for the year ended July 31, 2016 by 0.01%. |
| ‡ | The net asset value and total return include adjustments in accordance with accounting principles generally accepted in the United States of America for financial reporting purposes. As such, the net asset value and total return for shareholder transactions may differ from financial statements. |
| ** | Due to timing of sales and repurchase of capital shares, the net realized and unrealized gain (loss) per share is not in accord with the Fund’s change in net realized and unrealized gain (loss) on investment transactions for the period. |
See notes to financial statements.
| | |
| 46 | AB SMALL CAP GROWTH PORTFOLIO | | abfunds.com |
REPORT OF INDEPENDENT REGISTERED
PUBLIC ACCOUNTING FIRM
To the Board of Directors and Shareholders of
AB Small Cap Growth Portfolio
We have audited the accompanying statement of assets and liabilities, including the portfolio of investments, of AB Small Cap Growth Portfolio (the “Fund”) (one of the portfolios constituting AB Cap Fund, Inc.) as of July 31, 2017, and the related statement of operations for the year then ended, the statements of changes in net assets for each of the two years in the period then ended and the financial highlights for each of the periods indicated therein. These financial statements and financial highlights are the responsibility of the Fund’s management. Our responsibility is to express an opinion on these financial statements and financial highlights based on our audits.
We conducted our audits in accordance with the standards of the Public Company Accounting Oversight Board (United States). Those standards require that we plan and perform the audit to obtain reasonable assurance about whether the financial statements and financial highlights are free of material misstatement. We were not engaged to perform an audit of the Fund’s internal control over financial reporting. Our audits included consideration of internal control over financial reporting as a basis for designing audit procedures that are appropriate in the circumstances, but not for the purpose of expressing an opinion on the effectiveness of the Fund’s internal control over financial reporting. Accordingly, we express no such opinion. An audit also includes examining, on a test basis, evidence supporting the amounts and disclosures in the financial statements and financial highlights, assessing the accounting principles used and significant estimates made by management, and evaluating the overall financial statement presentation. Our procedures included confirmation of securities owned as of July 31, 2017, by correspondence with the custodian and others, or by other appropriate auditing procedures where replies from others were not received. We believe that our audits provide a reasonable basis for our opinion.
In our opinion, the financial statements and financial highlights referred to above present fairly, in all material respects, the financial position of AB Small Cap Growth Portfolio (one of the portfolios constituting AB Cap Fund, Inc.) at July 31, 2017, the results of its operations for the year then ended, the changes in its net assets for each of the two years in the period then ended, and the financial highlights for each of the periods indicated therein, in conformity with U.S. generally accepted accounting principles.

New York, New York
September 25, 2017
| | |
| abfunds.com | | AB SMALL CAP GROWTH PORTFOLIO | 47 |
BOARD OF DIRECTORS
Marshall C. Turner, Jr.(1), Chairman
John H. Dobkin(1)
Michael J. Downey(1)
William H. Foulk, Jr.(1)
D. James Guzy(1)
Nancy P. Jacklin(1)
Robert M. Keith, President and Chief Executive Officer
Carol C. McMullen(1)
Garry L. Moody(1)
Earl D. Weiner(1)
OFFICERS
Philip L. Kirstein, Senior Vice President and Independent Compliance Officer
Bruce K. Aronow(2) , Senior Vice President
N. Kumar Kirpalani(2), Vice President
Samantha S. Lau(2), Vice President
Wen-Tse Tseng(2), Vice President
Emilie D. Wrapp, Secretary
Joseph J. Mantineo, Treasurer and Chief Financial Officer
Phyllis J. Clarke, Controller
Vincent S. Noto, Chief Compliance Officer
| | |
| Custodian and Accounting Agent | | Transfer Agent |
State Street Bank and Trust Company State Street Corporation CCB/5 1 Iron Street Boston, MA 02210 Principal Underwriter AllianceBernstein Investments, Inc. 1345 Avenue of the Americas New York, NY 10105 Legal Counsel Seward & Kissel LLP One Battery Park Plaza New York, NY 10004 | | AllianceBernstein Investor
Services, Inc. P.O. Box 786003 San Antonio, TX 78278-6003 Toll-Free (800) 221-5672 Independent Registered Public Accounting Firm Ernst & Young LLP 5 Times Square New York, NY 10036 |
| 1 | Member of the Audit Committee, the Governance and Nominating Committee and the Independent Directors Committee. |
| 2 | The day-to-day management of, and investment decisions for, the Fund’s portfolio are made by the Adviser’s Small Cap Growth Investment Team. Mr. Bruce K. Aronow, Mr. N. Kumar Kirpalani, Ms. Samantha S. Lau and Mr. Wen-Tse Tseng are the investment professionals with the most significant responsibility for the day-to-day management of the Fund’s Portfolio. |
| | |
| 48 | AB SMALL CAP GROWTH PORTFOLIO | | abfunds.com |
MANAGEMENT OF THE FUND
Board of Directors Information
The business and affairs of the Fund are managed under the direction of the Board of Directors. Certain information concerning the Fund’s Directors is set forth below.
| | | | | | | | |
NAME,
ADDRESS* AND AGE,
(YEAR FIRST ELECTED**) | | PRINCIPAL
OCCUPATION(S) DURING PAST FIVE YEARS
AND OTHER
INFORMATION*** | | PORTFOLIOS
IN FUND
COMPLEX
OVERSEEN BY
DIRECTOR | | | OTHER
PUBLIC COMPANY
DIRECTORSHIPS
CURRENTLY
HELD BY
DIRECTOR |
| INTERESTED DIRECTOR | | | | | | |
Robert M. Keith, # 1345 Avenue of the Americas New York, NY 10105 57 (2010) | | Senior Vice President of AllianceBernstein L.P. (the “Adviser”) and the head of AllianceBernstein Investments, Inc. (“ABI”) since July 2008; Director of ABI and President of the AB Mutual Funds. Previously, he served as Executive Managing Director of ABI from December 2006 to June 2008. Prior to joining ABI in 2006, Executive Managing Director of Bernstein Global Wealth Management, and prior thereto, Senior Managing Director and Global Head of Client Service and Sales of the Adviser’s institutional investment management business since 2004. Prior thereto, he was Managing Director and Head of North American Client Service and Sales in the Adviser’s institutional investment management business, with which he had been associated since prior to 2004. | | | 98 | | | None |
| | | | | | | | |
| | |
| abfunds.com | | AB SMALL CAP GROWTH PORTFOLIO | 49 |
MANAGEMENT OF THE FUND (continued)
| | | | | | | | |
NAME,
ADDRESS* AND AGE,
(YEAR FIRST ELECTED**) | | PRINCIPAL
OCCUPATION(S) DURING PAST FIVE YEARS
AND OTHER
INFORMATION*** | | PORTFOLIOS
IN FUND
COMPLEX
OVERSEEN BY
DIRECTOR | | | OTHER
PUBLIC COMPANY
DIRECTORSHIPS
CURRENTLY
HELD BY
DIRECTOR |
| DISINTERESTED DIRECTORS | | | | | | |
Marshall C. Turner, Jr., ## Chairman of the Board 75 (2005) | | Private Investor since prior to 2012. Former Chairman and CEO of Dupont Photomasks, Inc. (components of semi-conductor manufacturing), He has extensive operating, leadership and venture capital investing experience, including five interim or full time CEO roles, and prior service as general partner of institutional venture capital partnerships. He also has extensive non-profit board leadership experience and currently serves on the boards of two education and science-related non-profit organizations. He has served as a director of one AB Fund since 1992, and director or trustee of multiple AB Funds since 2005. He has been Chairman of the AB Funds since January 2014, and the Chairman of the Independent Directors Committees of such AB Funds since February 2014. | | | 98 | | | Xilinx, Inc. (programmable logic semi-conductors) since 2007 |
| | | | | | | | |
John H. Dobkin, ## 75 (1994) | | Independent Consultant since prior to 2012. Formerly, President of Save Venice, Inc. (preservation organization) from 2001–2002; Senior Advisor from June 1999-June 2000 and President of Historic Hudson Valley (historic preservation) from December 1989-May 1999. Previously, Director of the National Academy of Design. He has served as a director or trustee of various AB Funds since 1992, and as Chairman of the Audit Committees of a number of such AB Funds from 2001-2008. | | | 97 | | | None |
| | | | | | | | |
| | |
| 50 | AB SMALL CAP GROWTH PORTFOLIO | | abfunds.com |
MANAGEMENT OF THE FUND (continued)
| | | | | | | | |
NAME,
ADDRESS* AND AGE,
(YEAR FIRST ELECTED**) | | PRINCIPAL
OCCUPATION(S) DURING PAST FIVE YEARS
AND OTHER
INFORMATION*** | | PORTFOLIOS
IN FUND
COMPLEX
OVERSEEN BY
DIRECTOR | | | OTHER
PUBLIC COMPANY
DIRECTORSHIPS
CURRENTLY
HELD BY
DIRECTOR |
DISINTERESTED DIRECTORS
(continued) | | | | | | |
Michael J. Downey, ## 73 (2005) | | Private Investor since prior to 2012. Formerly, managing partner of Lexington Capital, LLC (investment advisory firm) from December 1997 until December 2003. He served as a director of Prospect Acquisition Corp. (financial services) from 2007 until 2009. From 1987 until 1993, Chairman and CEO of Prudential Mutual Fund Management, director of the Prudential mutual funds, and member of the Executive Committee of Prudential Securities Inc. He has served as a director or trustee of the AB Funds since 2005 and is a director and Chairman of one other registered investment company. | | | 98 | | | The Asia Pacific Fund, Inc. (registered investment company) since prior to 2012 |
| | | | | | | | |
William H. Foulk, Jr., ## 85 (1992) | | Investment Adviser and an Independent Consultant since prior to 2012. Previously, he was Senior Manager of Barrett Associates, Inc., a registered investment adviser. He was formerly Deputy Comptroller and Chief Investment Officer of the State of New York and, prior thereto, Chief Investment Officer of the New York Bank for Savings. He has served as a director or trustee of various AB Funds since 1983, and was Chairman of the Independent Directors Committees of the AB Funds from 2003 to early February 2014. He served as Chairman of such AB Funds from 2003 through December 2013. He is also active in a number of mutual fund related organizations and committees. | | | 98 | | | None |
| | |
| abfunds.com | | AB SMALL CAP GROWTH PORTFOLIO | 51 |
MANAGEMENT OF THE FUND (continued)
| | | | | | | | |
NAME,
ADDRESS* AND AGE,
(YEAR FIRST ELECTED**) | | PRINCIPAL
OCCUPATION(S) DURING PAST FIVE YEARS
AND OTHER
INFORMATION*** | | PORTFOLIOS
IN FUND
COMPLEX
OVERSEEN BY
DIRECTOR | | | OTHER
PUBLIC COMPANY
DIRECTORSHIPS
CURRENTLY
HELD BY
DIRECTOR |
DISINTERESTED DIRECTORS
(continued) | | | | | | |
D. James Guzy, ## 81 (2005) | | Chairman of the Board of SRC Computers, Inc. (semi-conductors), with which he has been associated since prior to 2012. He served as Chairman of the Board of PLX Technology (semi-conductors) since prior to 2012 until November 2013. He was a director of Intel Corporation (semi-conductors) from 1969 until 2008, and served as Chairman of the Finance Committee of such company for several years until May 2008. He has served as a director or trustee of one or more of the AB Funds since 1982. | | | 95 | | | None |
| | | | | | | | |
Nancy P. Jacklin, ## 69 (2006) | | Private Investor since prior to 2012. Professorial Lecturer at the Johns Hopkins School of Advanced International Studies (2008-2015). U.S. Executive Director of the International Monetary Fund (which is responsible for ensuring the stability of the international monetary system), (December 2002-May 2006); Partner, Clifford Chance (1992-2002); Sector Counsel, International Banking and Finance, and Associate General Counsel, Citicorp (1985-1992); Assistant General Counsel (International), Federal Reserve Board of Governors (1982-1985); and Attorney Advisor, U.S. Department of the Treasury (1973-1982). Member of the Bar of the District of Columbia and of New York; and member of the Council on Foreign Relations. She has served as a director or trustee of the AB Funds since 2006 and has been Chairman of the Governance and Nominating Committees of the AB Funds since August 2014. | | | 98 | | | None |
| | |
| 52 | AB SMALL CAP GROWTH PORTFOLIO | | abfunds.com |
MANAGEMENT OF THE FUND (continued)
| | | | | | | | |
NAME,
ADDRESS* AND AGE,
(YEAR FIRST ELECTED**) | | PRINCIPAL
OCCUPATION(S) DURING PAST FIVE YEARS
AND OTHER
INFORMATION*** | | PORTFOLIOS
IN FUND
COMPLEX
OVERSEEN BY
DIRECTOR | | | OTHER
PUBLIC COMPANY
DIRECTORSHIPS
CURRENTLY
HELD BY
DIRECTOR |
DISINTERESTED DIRECTORS
(continued) | | | | | | |
Carol C. McMullen, ## 62 (2016) | | Managing Director of Slalom Consulting (consulting) since 2014, private investor and member of the Partners Healthcare Investment Committee. Formerly, Director of Norfolk & Dedham Group (mutual property and casualty insurance) from 2011 until November 2016; Director of Partners Community Physicians Organization (healthcare) from 2014 until December 2016; and Managing Director of The Crossland Group (consulting) from 2012 until 2013. She has held a number of senior positions in the asset and wealth management industries, including at Eastern Bank (where her roles included President of Eastern Wealth Management), Thomson Financial (Global Head of Sales for Investment Management), and Putnam Investments (where her roles included Head of Global Investment Research). She has served on a number of private company and nonprofit boards, and as a director or trustee of the AB Funds since June 2016. | | | 98 | | | None |
| | | | | | | | |
| | |
| abfunds.com | | AB SMALL CAP GROWTH PORTFOLIO | 53 |
MANAGEMENT OF THE FUND (continued)
| | | | | | | | |
NAME,
ADDRESS* AND AGE,
(YEAR FIRST ELECTED**) | | PRINCIPAL
OCCUPATION(S) DURING PAST FIVE YEARS
AND OTHER
INFORMATION*** | | PORTFOLIOS
IN FUND
COMPLEX
OVERSEEN BY
DIRECTOR | | | OTHER
PUBLIC COMPANY
DIRECTORSHIPS
CURRENTLY
HELD BY
DIRECTOR |
DISINTERESTED DIRECTORS
(continued) | | | | | | |
Garry L. Moody, ##
65
(2008) | | Independent Consultant. Formerly, Partner, Deloitte & Touche LLP (1995-2008) where he held a number of senior positions, including Vice Chairman, and U.S. and Global Investment Management Practice Managing Partner; President, Fidelity Accounting and Custody Services Company (1993-1995) where he was responsible for accounting, pricing, custody and reporting for the Fidelity mutual funds; and Partner, Ernst & Young LLP (1975-1993), where he served as the National Director of Mutual Fund Tax Services and Managing Partner of its Chicago Office Tax department. He is a member of the Trustee Advisory Board of BoardIQ, a biweekly publication focused on issues and news affecting directors of mutual funds. He has served as a director or trustee, and as Chairman of the Audit Committees, of the AB Funds since 2008. | | | 98 | | | None |
| | | | | | | | |
| | |
| 54 | AB SMALL CAP GROWTH PORTFOLIO | | abfunds.com |
MANAGEMENT OF THE FUND (continued)
| | | | | | | | |
NAME,
ADDRESS* AND AGE,
(YEAR FIRST ELECTED**) | | PRINCIPAL
OCCUPATION(S) DURING PAST FIVE YEARS
AND OTHER
INFORMATION*** | | PORTFOLIOS
IN FUND
COMPLEX
OVERSEEN BY
DIRECTOR | | | OTHER
PUBLIC COMPANY
DIRECTORSHIPS
CURRENTLY
HELD BY
DIRECTOR |
DISINTERESTED DIRECTORS
(continued) | | | | | | |
Earl D. Weiner, ##
78
(2007) | | Of Counsel, and Partner prior to January 2007, of the law firm Sullivan & Cromwell LLP and is a former member of the ABA Federal Regulation of Securities Committee Task Force to draft editions of the Fund Director’s Guidebook. He also serves as a director or trustee of various non-profit organizations and has served as Chairman or Vice Chairman of a number of them. He has served as a director or trustee of the AB Funds since 2007 and served as Chairman of the Governance and Nominating Committees of the AB Funds from 2007 until August 2014. | | | 98 | | | None |
| * | The address for each of the Fund’s disinterested Directors is c/o AllianceBernstein L.P., Attention: Philip L. Kirstein, 1345 Avenue of the Americas, New York, NY 10105. |
| ** | There is no stated term of office for the Fund’s Directors. |
| *** | The information above includes each Director’s principal occupation during the last five years and other information relating to the experience, attributes, and skills relevant to each Director’s qualifications to serve as a Director, which led to the conclusion that each Director should serve as a Director for the Fund. |
| # | Mr. Keith is an “interested person” of the Fund, as defined in the 1940 Act, due to his position as a Senior Vice President of the Adviser. |
| ## | Member of the Audit Committee, the Governance and Nominating Committee and Independent Directors Committee. |
| | |
| abfunds.com | | AB SMALL CAP GROWTH PORTFOLIO | 55 |
MANAGEMENT OF THE FUND (continued)
Officers Information
Certain information concerning the Fund’s Officers is listed below.
| | | | |
NAME, ADDRESS*
AND AGE | | POSITION(S)
HELD WITH FUND | | PRINCIPAL OCCUPATION
DURING PAST FIVE YEARS |
Robert M. Keith
57 | | President and Chief Executive Officer | | See biography above. |
| | | | |
Philip L. Kirstein
72 | | Senior Vice President and Independent Compliance Officer | | Senior Vice President and Independent Compliance Officer of the AB Funds, with which he has been associated since October 2004. Prior thereto, he was Of Counsel to Kirkpatrick & Lockhart, LLP from October 2003 to October 2004, and General Counsel of Merrill Lynch Investment Managers, L.P. since prior to March 2003. |
| | | | |
Bruce K. Aronow
51 | | Senior Vice President | | Senior Vice President of the Adviser,** with which he has been associated since prior to 2012. |
| | | | |
N. Kumar Kirpalani
63 | | Vice President | | Senior Vice President of the Adviser,** with which he has been associated since prior to 2012. |
| | | | |
Samantha S. Lau
44 | | Vice President | | Senior Vice President of the Adviser,** with which she has been associated since prior to 2012. |
| | | | |
Wen-Tse Tseng
51 | | Vice President | | Senior Vice President of the Adviser,** with which he has been associated since prior to 2012. |
| | | | |
Emilie D. Wrapp
61 | | Secretary | | Senior Vice President, Assistant General Counsel and Assistant Secretary of ABI,** with which she has been associated since prior to 2012. |
| | | | |
Joseph J. Mantineo
58 | | Treasurer and Chief Financial Officer | | Senior Vice President of AllianceBernstein Investor Services, Inc. (“ABIS”),** with which he has been associated since prior to 2012. |
| | | | |
Phyllis J. Clarke
56 | | Controller | | Vice President of ABIS,** with which she has been associated since prior to 2012. |
| | | | |
Vincent S. Noto 52 | | Chief Compliance Officer | | Senior Vice President since 2015, Mutual Fund Chief Compliance Officer of the Adviser** since 2014. Prior thereto, he was Vice President and Director of Mutual Fund Compliance of the Adviser** since prior to 2012. |
| * | The address for each of the Fund’s Officers is 1345 Avenue of the Americas, New York, NY 10105. |
| ** | The Adviser, ABI and ABIS are affiliates of the Fund. |
| | The Fund’s Statement of Additional Information (“SAI”) has additional information about the Fund’s Directors and Officers and is available without charge upon request. Contact your financial representative or AllianceBernstein at (800) 227-4618, or visit www.abfunds.com, for a free prospectus or SAI. |
| | |
| 56 | AB SMALL CAP GROWTH PORTFOLIO | | abfunds.com |
Information Regarding the Review and Approval of the Fund’s Advisory Agreement
The disinterested directors (the “directors”) of AB Cap Fund, Inc. (the “Company”) unanimously approved the continuance of the Company’s Advisory Agreement with the Adviser in respect of AB Small Cap Growth Portfolio (the “Fund”) at a meeting held on May 2-4, 2017 (the “Meeting”).
Prior to approval of the continuance of the Advisory Agreement, the directors had requested from the Adviser, and received and evaluated, extensive materials. They reviewed the proposed continuance of the Advisory Agreement with the Adviser and with experienced counsel who are independent of the Adviser, who advised on the relevant legal standards. The directors also reviewed an independent evaluation prepared by the Company’s Senior Officer (who is also the Company’s Independent Compliance Officer), who acted as their independent fee consultant, of the reasonableness of the advisory fee, in which the Senior Officer concluded that the contractual fee for the Fund was reasonable. The directors also discussed the proposed continuance in private sessions with counsel and the Company’s Senior Officer.
The directors considered their knowledge of the nature and quality of the services provided by the Adviser to the Fund gained from their experience as directors or trustees of most of the registered investment companies advised by the Adviser, their overall confidence in the Adviser’s integrity and competence they have gained from that experience, the Adviser’s initiative in identifying and raising potential issues with the directors and its responsiveness, frankness and attention to concerns raised by the directors in the past, including the Adviser’s willingness to consider and implement organizational and operational changes designed to improve investment results and the services provided to the AB Funds. The directors noted that they have four regular meetings each year, at each of which they review extensive materials and information from the Adviser, including information on the investment performance of the Fund.
The directors also considered all factors they believed relevant, including the specific matters discussed below. During the course of their deliberations, the directors evaluated, among other things, the reasonableness of the advisory fee. The directors did not identify any particular information that was all-important or controlling, and different directors may have attributed different weights to the various factors. The directors determined that the selection of the Adviser to manage the Fund and the overall arrangements between the Fund and the Adviser, as provided in the Advisory Agreement, including the advisory fee, were fair and reasonable in light of the services performed, expenses incurred and such other matters as the directors considered relevant in the exercise of their business judgment.
| | |
| abfunds.com | | AB SMALL CAP GROWTH PORTFOLIO | 57 |
The material factors and conclusions that formed the basis for the directors’ determinations included the following:
Nature, Extent and Quality of Services Provided
The directors considered the scope and quality of services provided by the Adviser under the Advisory Agreement, including the quality of the investment research capabilities of the Adviser and the other resources it has dedicated to performing services for the Fund. They also noted the professional experience and qualifications of the Fund’s portfolio management team and other senior personnel of the Adviser. The directors also considered that the Advisory Agreement provides that the Fund will reimburse the Adviser for the cost to it of providing certain clerical, accounting, administrative and other services to the Fund by employees of the Adviser or its affiliates. Requests for these reimbursements are made on a quarterly basis and subject to approval by the directors. Reimbursements, to the extent requested and paid, result in a higher rate of total compensation from the Fund to the Adviser than the fee rate stated in the Advisory Agreement. The directors noted that the methodology used to determine the reimbursement amounts had been reviewed by an independent consultant retained by the Company’s Senior Officer. The quality of administrative and other services, including the Adviser’s role in coordinating the activities of the Fund’s other service providers, also was considered. The directors concluded that, overall, they were satisfied with the nature, extent and quality of services provided to the Fund under the Advisory Agreement.
Costs of Services Provided and Profitability
The directors reviewed a schedule of the revenues and expenses and related notes indicating the profitability of the Fund to the Adviser for calendar years 2015 and 2016 that had been prepared with an expense allocation methodology arrived at in consultation with an independent consultant retained by the Company’s Senior Officer. The directors noted the assumptions and methods of allocation used by the Adviser in preparing fund-specific profitability data and understood that there are a number of potentially acceptable allocation methodologies for information of this type. The directors noted that the profitability information reflected all revenues and expenses of the Adviser’s relationship with the Fund, including those relating to its subsidiaries that provide transfer agency, distribution and brokerage services to the Fund. The directors recognized that it is difficult to make comparisons of the profitability of the Advisory Agreement with the profitability of advisory contracts for unaffiliated funds because comparative information is not generally publicly available and is affected by numerous factors. The directors focused on the profitability of the Adviser’s relationship with the Fund before taxes and distribution expenses. The directors concluded that the Adviser’s level of profitability from its relationship with the Fund was not unreasonable.
| | |
| 58 | AB SMALL CAP GROWTH PORTFOLIO | | abfunds.com |
Fall-Out Benefits
The directors considered the other benefits to the Adviser and its affiliates from their relationships with the Fund, including, but not limited to, benefits relating to soft dollar arrangements (whereby investment advisers receive brokerage and research services from brokers that execute agency transactions for their clients); 12b-1 fees and sales charges received by the Fund’s principal underwriter (which is a wholly owned subsidiary of the Adviser) in respect of certain classes of the Fund’s shares; brokerage commissions paid by the Fund to brokers affiliated with the Adviser; and transfer agency fees paid by the Fund to a wholly owned subsidiary of the Adviser. The directors recognized that the Adviser’s profitability would be somewhat lower without these benefits. The directors understood that the Adviser also might derive reputational and other benefits from its association with the Fund.
Investment Results
In addition to the information reviewed by the directors in connection with the Meeting, the directors receive detailed performance information for the Fund at each regular Board meeting during the year.
At the Meeting, the directors reviewed information prepared by an analytical service that is not affiliated with the Adviser (the “15(c) service provider”), showing the performance of the Class A Shares of the Fund against a peer group and a peer universe, and information prepared by the Adviser showing performance of the Class A Shares against a broad-based securities market index, in each case for the 1-, 3-, 5- and 10-year periods ended February 28, 2017. Based on their review, and their discussion with the Adviser of the reasons for the Fund’s underperformance in certain periods, the directors concluded that the Fund’s investment performance was acceptable.
Advisory Fees and Other Expenses
The directors considered the advisory fee rate paid by the Fund to the Adviser and information prepared by the 15(c) service provider concerning advisory fee rates paid by other funds in the same category as the Fund at a common asset level. The directors recognized that it is difficult to make comparisons of advisory fees because there are variations in the services that are included in the fees paid by other funds. The directors compared the Fund’s contractual effective advisory fee rate with a peer group median and took into account the impact on the advisory fee rate of the administrative expense reimbursement paid to the Adviser in the latest fiscal year.
The directors also considered the Adviser’s fee schedule for institutional clients pursuing a similar investment style. For this purpose, they reviewed the relevant advisory fee information from the Adviser’s Form ADV and the evaluation from the Company’s Senior Officer and noted the differences
| | |
| abfunds.com | | AB SMALL CAP GROWTH PORTFOLIO | 59 |
between the Fund’s fee schedule, on the one hand, and the institutional fee schedule and the schedule of fees charged to any offshore funds and any sub-advised funds, on the other. The directors noted that the Adviser may, in some cases, agree to fee rates with large institutional clients that are lower than those reviewed by the directors and that they had previously discussed with the Adviser its policies in respect of such arrangements. The directors also compared the advisory fee rate for the Fund with that for another AB Fund with a similar investment style.
The Adviser reviewed with the directors the significantly greater scope of the services it provides to the Fund relative to institutional, offshore fund and sub-advised fund clients. In light of the substantial differences in services rendered by the Adviser to institutional, offshore fund and sub-advised fund clients as compared to funds such as the Fund, the directors considered these fee comparisons inapt and did not place significant weight on them in their deliberations.
The directors noted that the Fund may invest in shares of exchange-traded funds (“ETFs”), subject to the restrictions and limitations of the Investment Company Act of 1940 as these may be varied as a result of exemptive orders issued by the SEC. The directors also noted that ETFs pay advisory fees pursuant to their advisory contracts, and that the Adviser had provided, and they had reviewed, information about the expense ratios of the relevant ETFs. The directors concluded, based on the Adviser’s explanation of how it may use ETFs when they are the most cost-effective way to obtain desired exposures for a fund or to temporarily “equitize” cash inflows pending purchases of underlying securities, that the advisory fee for the Fund would be paid for services that would be in addition to, rather than duplicative of, the services provided under the advisory contracts of the ETFs.
The directors also considered the total expense ratio of the Class A shares of the Fund in comparison to a peer group and a peer universe selected by the 15(c) service provider. The Class A expense ratio of the Fund was based on the Fund’s latest fiscal year. The directors noted that it was likely that the expense ratios of some of the other funds in the Fund’s category were lowered by waivers or reimbursements by those funds’ investment advisers, which in some cases might be voluntary or temporary. The directors view expense ratio information as relevant to their evaluation of the Adviser’s services because the Adviser is responsible for coordinating services provided to the Fund by others. Based on their review, the directors concluded that the Fund’s expense ratio was acceptable.
Economies of Scale
The directors noted that the advisory fee schedule for the Fund contains breakpoints that reduce the fee rates on assets above specified levels. The directors took into consideration prior presentations by an independent
| | |
| 60 | AB SMALL CAP GROWTH PORTFOLIO | | abfunds.com |
consultant on economies of scale in the mutual fund industry and for the AB Funds, and by the Adviser concerning certain of its views on economies of scale. The directors also had requested and received from the Adviser certain updates on economies of scale in advance of the Meeting. The directors believe that economies of scale may be realized (if at all) by the Adviser across a variety of products and services, and not only in respect of a single fund. The directors noted that there is no established methodology for setting breakpoints that give effect to the fund-specific services provided by a fund’s adviser and to the economies of scale that an adviser may realize in its overall mutual fund business or those components of it which directly or indirectly affect a fund’s operations. The directors observed that in the mutual fund industry as a whole, as well as among funds similar to the Fund, there is no uniformity or pattern in the fees and asset levels at which breakpoints (if any) apply. The directors also noted that the advisory agreements for many funds do not have breakpoints at all. Having taken these factors into account, the directors concluded that the Fund’s shareholders would benefit from a sharing of economies of scale in the event the Fund’s net assets exceed a breakpoint in the future.
| | |
| abfunds.com | | AB SMALL CAP GROWTH PORTFOLIO | 61 |
This page is not part of the Shareholder Report or the Financial Statements.
AB FAMILY OF FUNDS
US EQUITY
US CORE
Core Opportunities Fund
Select US Equity Portfolio
US GROWTH
Concentrated Growth Fund
Discovery Growth Fund
Growth Fund
Large Cap Growth Fund
Small Cap Growth Portfolio
US VALUE
Discovery Value Fund
Equity Income Fund
Relative Value Fund1
Small Cap Value Portfolio
Value Fund
INTERNATIONAL/ GLOBAL EQUITY
INTERNATIONAL/ GLOBAL CORE
Global Core Equity Portfolio
International Portfolio
International Strategic Core Portfolio
Sustainable Global Thematic Fund1
Tax-Managed International Portfolio
Tax-Managed Wealth Appreciation Strategy
Wealth Appreciation Strategy
INTERNATIONAL/ GLOBAL GROWTH
Concentrated International Growth Portfolio
International Growth Fund
INTERNATIONAL/ GLOBAL EQUITY (continued)
INTERNATIONAL/ GLOBAL VALUE
Asia ex-Japan Equity Portfolio
International Value Fund
FIXED INCOME
MUNICIPAL
High Income Municipal Portfolio
Intermediate California Municipal Portfolio
Intermediate Diversified Municipal Portfolio
Intermediate New York Municipal Portfolio
Municipal Bond Inflation Strategy
Tax-Aware Fixed Income Portfolio
National Portfolio
Arizona Portfolio
California Portfolio
Massachusetts Portfolio
Minnesota Portfolio
New Jersey Portfolio
New York Portfolio
Ohio Portfolio
Pennsylvania Portfolio
Virginia Portfolio
TAXABLE
Bond Inflation Strategy
Global Bond Fund
High Income Fund
High Yield Portfolio
Income Fund
Intermediate Bond Portfolio
Limited Duration High Income Portfolio
Short Duration Portfolio
ALTERNATIVES
All Market Real Return Portfolio
Credit Long/Short Portfolio
Global Real Estate Investment Fund
Select US Long/Short Portfolio
Unconstrained Bond Fund
MULTI-ASSET
All Market Income Portfolio
All Market Total Return Portfolio1
Conservative Wealth Strategy
Emerging Markets Multi-Asset Portfolio
Global Risk Allocation Fund
Tax-Managed All Market Income Portfolio1
TARGET-DATE
Multi-Manager Select Retirement Allocation Fund
Multi-Manager Select 2010 Fund
Multi-Manager Select 2015 Fund
Multi-Manager Select 2020 Fund
Multi-Manager Select 2025 Fund
Multi-Manager Select 2030 Fund
Multi-Manager Select 2035 Fund
Multi-Manager Select 2040 Fund
Multi-Manager Select 2045 Fund
Multi-Manager Select 2050 Fund
Multi-Manager Select 2055 Fund
CLOSED-END FUNDS
Alliance California Municipal Income Fund
AllianceBernstein Global High Income Fund
AllianceBernstein National Municipal Income Fund
We also offer Government Exchange Reserves, which serves as the money market fund exchange vehicle for the AB mutual funds. An investment in Government Exchange Reserves is not a deposit in a bank and is not insured or guaranteed by the Federal Deposit Insurance Corporation or any other government agency. Although the Fund seeks to preserve the value of your investment at $1.00 per share, it is possible to lose money by investing in the Fund.
Investors should consider the investment objectives, risks, charges and expenses of the Fund carefully before investing. For copies of our prospectus or summary prospectus, which contain this and other information, visit us online at www.abfunds.com or contact your AB representative. Please read the prospectus and/or summary prospectus carefully before investing.
| 1 | Prior to November 1, 2016, Sustainable Global Thematic Fund was named Global Thematic Growth Fund; prior to January 9, 2017, Relative Value Fund was named Growth & Income Fund; prior to April 17, 2017, Tax-Managed All Market Income Portfolio was named Tax-Managed Balanced Wealth Strategy; prior to April 24, 2017, All Market Total Return Portfolio was named Balanced Wealth Strategy. |
| | |
| 62 | AB SMALL CAP GROWTH PORTFOLIO | | abfunds.com |
NOTES
| | |
| abfunds.com | | AB SMALL CAP GROWTH PORTFOLIO | 63 |
NOTES
| | |
| 64 | AB SMALL CAP GROWTH PORTFOLIO | | abfunds.com |
NOTES
| | |
| abfunds.com | | AB SMALL CAP GROWTH PORTFOLIO | 65 |
NOTES
| | |
| 66 | AB SMALL CAP GROWTH PORTFOLIO | | abfunds.com |
NOTES
| | |
| abfunds.com | | AB SMALL CAP GROWTH PORTFOLIO | 67 |
NOTES
| | |
| 68 | AB SMALL CAP GROWTH PORTFOLIO | | abfunds.com |

AB SMALL CAP GROWTH PORTFOLIO
1345 Avenue of the Americas
New York, NY 10105
800 221 5672
SCG-0151-0717 
ITEM 2. CODE OF ETHICS.
(a) The registrant has adopted a code of ethics that applies to its principal executive officer, principal financial officer and principal accounting officer. A copy of the registrant’s code of ethics is filed herewith as Exhibit 12(a)(1).
(b) During the period covered by this report, no material amendments were made to the provisions of the code of ethics adopted in 2(a) above.
(c) During the period covered by this report, no implicit or explicit waivers to the provisions of the code of ethics adopted in 2(a) above were granted.
ITEM 3. AUDIT COMMITTEE FINANCIAL EXPERT.
The registrant’s Board of Directors has determined that independent directors William H. Foulk, Jr., Garry L. Moody and Marshall C. Turner, Jr. qualify as audit committee financial experts.
ITEM 4. PRINCIPAL ACCOUNTANT FEES AND SERVICES.
(a) - (c) The following table sets forth the aggregate fees billed by the independent registered public accounting firm Ernst & Young LLP, for the Fund’s last two fiscal years for professional services rendered for: (i) the audit of the Fund’s annual financial statements included in the Fund’s annual report to stockholders; (ii) assurance and related services that are reasonably related to the performance of the audit of the Fund’s financial statements and are not reported under (i), which include advice and education related to accounting and auditing issues and quarterly press release review (for those Funds which issue press releases), and preferred stock maintenance testing (for those Funds that issue preferred stock); and (iii) tax compliance, tax advice and tax return preparation.
| | | | | | | | | | | | | | | | |
| | | | | | Audit Fees | | | Audit-Related
Fees | | | Tax Fees | |
AB Small Cap Growth | | | 2016 | | | $ | 32,375 | | | $ | — | | | $ | 19,963 | |
| | | 2017 | | | $ | 32,375 | | | $ | 83 | | | $ | 20,461 | |
AB Multi-Manager Select 2010 | | | 2016 | | | $ | 19,911 | | | $ | — | | | $ | 14,736 | |
| | | 2017 | | | $ | 19,911 | | | $ | — | | | $ | 15,127 | |
AB Multi-Manager Select 2015 | | | 2016 | | | $ | 18,130 | | | $ | — | | | $ | 14,758 | |
| | | 2017 | | | $ | 18,130 | | | $ | — | | | $ | 15,127 | |
AB Multi-Manager Select 2020 | | | 2016 | | | $ | 18,130 | | | $ | — | | | $ | 14,758 | |
| | | 2017 | | | $ | 18,130 | | | $ | 7 | | | $ | 15,127 | |
AB Multi-Manager Select 2025 | | | 2016 | | | $ | 18,130 | | | $ | — | | | $ | 14,763 | |
| | | 2017 | | | $ | 18,130 | | | $ | 9 | | | $ | 15,127 | |
AB Multi-Manager Select 2030 | | | 2016 | | | $ | 18,130 | | | $ | — | | | $ | 14,758 | |
| | | 2017 | | | $ | 18,130 | | | $ | 7 | | | $ | 15,127 | |
AB Multi-Manager Select 2035 | | | 2016 | | | $ | 18,130 | | | $ | — | | | $ | 14,758 | |
| | | 2017 | | | $ | 18,130 | | | $ | 6 | | | $ | 15,127 | |
AB Multi-Manager Select 2040 | | | 2016 | | | $ | 18,130 | | | $ | — | | | $ | 14,643 | |
| | | 2017 | | | $ | 18,130 | | | $ | — | | | $ | 15,127 | |
AB Multi-Manager Select 2045 | | | 2016 | | | $ | 18,130 | | | $ | — | | | $ | 14,643 | |
| | | 2017 | | | $ | 18,130 | | | $ | — | | | $ | 15,127 | |
AB Multi-Manager Select 2050 | | | 2016 | | | $ | 19,911 | | | $ | — | | | $ | 14,643 | |
| | | 2017 | | | $ | 19,911 | | | $ | — | | | $ | 15,127 | |
AB Multi-Manager Select 2055 | | | 2016 | | | $ | 19,911 | | | $ | — | | | $ | 14,643 | |
| | | 2017 | | | $ | 19,911 | | | $ | — | | | $ | 15,127 | |
AB Multi-Manager Select Ret Allocation | | | 2016 | | | $ | 22,235 | | | $ | — | | | $ | 14,736 | |
| | | 2017 | | | $ | 22,235 | | | $ | — | | | $ | 15,009 | |
(d) Not applicable.
(e) (1) Beginning with audit and non-audit service contracts entered into on or after May 6, 2003, the Fund’s Audit Committee policies and procedures require the pre-approval of all audit and non-audit services provided to the Fund by the Fund’s independent registered public accounting firm. The Fund’s Audit Committee policies and procedures also require pre-approval of all audit and non-audit services provided to the Adviser and Service Affiliates to the extent that these services are directly related to the operations or financial reporting of the Fund.
(e) (2) All of the amounts for Audit Fees, Audit-Related Fees and Tax Fees in the table under Item 4 (a) - (c) are for services pre-approved by the Fund’s Audit Committee.
(f) Not applicable.
(g) The following table sets forth the aggregate non-audit services provided to the Fund, the Fund’s Adviser and entities that control, are controlled by or under common control with the Adviser that provide ongoing services to the Fund:
| | | | | | | | | | | | |
| | | | | | All Fees for
Non-Audit Services
Provided to the
Portfolio, the Adviser
and Service
Affiliates | | | Total Amount of
Foregoing Column
Pre-approved by
the Audit Committee
(Portion Comprised of
Audit Related Fees)
(Portion Comprised of
Tax Fees) | |
AB Small Cap Growth | | | 2016 | | | $ | 327,508 | | | $ | 19,963 | |
| | | | | | | | | | $ | — | |
| | | | | | | | | | $ | (19,963 | ) |
| | | 2017 | | | $ | 549,449 | | | $ | 20,544 | |
| | | | | | | | | | $ | (83 | ) |
| | | | | | | | | | $ | (20,461 | ) |
AB Multi-Manager Select 2010 | | | 2016 | | | $ | 322,303 | | | $ | 14,758 | |
| | | | | | | | | | $ | — | |
| | | | | | | | | | $ | (14,758 | ) |
| | | 2017 | | | $ | 544,032 | | | $ | 15,127 | |
| | | | | | | | | | $ | — | |
| | | | | | | | | | $ | (15,127 | ) |
AB Multi-Manager Select 2015 | | | 2016 | | | $ | 322,308 | | | $ | 14,763 | |
| | | | | | | | | | $ | — | |
| | | | | | | | | | $ | (14,763 | ) |
| | | 2017 | | | $ | 544,032 | | | $ | 15,127 | |
| | | | | | | | | | $ | — | |
| | | | | | | | | | $ | (15,127 | ) |
AB Multi-Manager Select 2020 | | | 2016 | | | $ | 322,303 | | | $ | 14,758 | |
| | | | | | | | | | $ | — | |
| | | | | | | | | | $ | (14,758 | ) |
| | | 2017 | | | $ | 544,039 | | | $ | 15,134 | |
| | | | | | | | | | $ | (7 | ) |
| | | | | | | | | | $ | (15,127 | ) |
AB Multi-Manager Select 2025 | | | 2016 | | | $ | 322,188 | | | $ | 14,643 | |
| | | | | | | | | | $ | — | |
| | | | | | | | | | $ | (14,643 | ) |
| | | 2017 | | | $ | 544,041 | | | $ | 15,136 | |
| | | | | | | | | | $ | (9 | ) |
| | | | | | | | | | $ | (15,127 | ) |
AB Multi-Manager Select 2030 | | | 2016 | | | $ | 322,188 | | | $ | 14,643 | |
| | | | | | | | | | $ | — | |
| | | | | | | | | | $ | (14,643 | ) |
| | | 2017 | | | $ | 544,039 | | | $ | 15,134 | |
| | | | | | | | | | $ | (7 | ) |
| | | | | | | | | | $ | (15,127 | ) |
AB Multi-Manager Select 2035 | | | 2016 | | | $ | 322,303 | | | $ | 14,758 | |
| | | | | | | | | | $ | — | |
| | | | | | | | | | $ | (14,758 | ) |
| | | 2017 | | | $ | 544,038 | | | $ | 15,133 | |
| | | | | | | | | | $ | (6 | ) |
| | | | | | | | | | $ | (15,127 | ) |
AB Multi-Manager Select 2040 | | | 2016 | | | $ | 322,188 | | | $ | 14,643 | |
| | | | | | | | | | $ | — | |
| | | | | | | | | | $ | (14,643 | ) |
| | | 2017 | | | $ | 544,032 | | | $ | 15,127 | |
| | | | | | | | | | $ | — | |
| | | | | | | | | | $ | (15,127 | ) |
AB Multi-Manager Select 2045 | | | 2016 | | | $ | 322,188 | | | $ | 14,643 | |
| | | | | | | | | | $ | — | |
| | | | | | | | | | $ | (14,643 | ) |
| | | 2017 | | | $ | 544,032 | | | $ | 15,127 | |
| | | | | | | | | | $ | — | |
| | | | | | | | | | $ | (15,127 | ) |
AB Multi-Manager Select 2050 | | | 2016 | | | $ | 322,188 | | | $ | 14,643 | |
| | | | | | | | | | $ | — | |
| | | | | | | | | | $ | (14,643 | ) |
| | | 2017 | | | $ | 544,032 | | | $ | 15,127 | |
| | | | | | | | | | $ | — | |
| | | | | | | | | | $ | (15,127 | ) |
AB Multi-Manager Select 2055 | | | 2016 | | | $ | 322,188 | | | $ | 14,643 | |
| | | | | | | | | | $ | — | |
| | | | | | | | | | $ | (14,643 | ) |
| | | 2017 | | | $ | 544,032 | | | $ | 15,127 | |
| | | | | | | | | | $ | — | |
| | | | | | | | | | $ | (15,127 | ) |
AB Multi-Manager Select Ret Allocation | | | 2016 | | | $ | 322,281 | | | $ | 14,736 | |
| | | | | | | | | | $ | — | |
| | | | | | | | | | $ | (14,736 | ) |
| | | 2017 | | | $ | 543,914 | | | $ | 15,009 | |
| | | | | | | | | | $ | — | |
| | | | | | | | | | $ | (15,009 | ) |
(h) The Audit Committee of the Fund has considered whether the provision of any non-audit services not pre-approved by the Audit Committee provided by the Fund’s independent registered public accounting firm to the Adviser and Service Affiliates is compatible with maintaining the auditor’s independence.
ITEM 5. AUDIT COMMITTEE OF LISTED REGISTRANTS.
Not applicable to the registrant.
ITEM 6. SCHEDULE OF INVESTMENTS.
Please see Schedule of Investments contained in the Report to Shareholders included under Item 1 of this Form N-CSR.
ITEM 7. DISCLOSURE OF PROXY VOTING POLICIES AND PROCEDURES FOR CLOSED-END MANAGEMENT INVESTMENT COMPANIES.
Not applicable to the registrant.
ITEM 8. PORTFOLIO MANAGERS OF CLOSED-END MANAGEMENT INVESTMENT COMPANIES.
Not applicable to the registrant.
ITEM 9. PURCHASES OF EQUITY SECURITIES BY CLOSED-END MANAGEMENT INVESTMENT COMPANY AND AFFILIATED PURCHASERS.
Not applicable to the registrant.
ITEM 10. SUBMISSION OF MATTERS TO A VOTE OF SECURITY HOLDERS.
There have been no material changes to the procedures by which shareholders may recommend nominees to the Fund’s Board of Directors since the Fund last provided disclosure in response to this item.
ITEM 11. CONTROLS AND PROCEDURES.
(a) The registrant’s principal executive officer and principal financial officer have concluded that the registrant’s disclosure controls and procedures (as defined in Rule 30a-2(c) under the Investment Company Act of 1940, as amended) are effective at the reasonable assurance level based on their evaluation of these controls and procedures as of a date within 90 days of the filing date of this document.
(b) There were no changes in the registrant’s internal controls over financial reporting that occurred during the second fiscal quarter of the period that has materially affected, or is reasonably likely to materially affect, the registrant’s internal control over financial reporting.
ITEM 12. EXHIBITS.
The following exhibits are attached to this Form N-CSR:
| | |
Exhibit No. | | DESCRIPTION OF EXHIBIT |
| |
| 12(a)(1) | | Code of Ethics that is subject to the disclosure of Item 2 hereof |
| |
| 12(b)(1) | | Certification of Principal Executive Officer Pursuant to Section 302 of the Sarbanes-Oxley Act of 2002 |
| |
| 12(b)(2) | | Certification of Principal Financial Officer Pursuant to Section 302 of the Sarbanes-Oxley Act of 2002 |
| |
| 12(c) | | Certification of Principal Executive Officer and Principal Financial Officer Pursuant to Section 906 of the Sarbanes-Oxley Act of 2002 |
SIGNATURES
Pursuant to the requirements of the Securities Exchange Act of 1934 and the Investment Company Act of 1940, the registrant has duly caused this report to be signed on its behalf by the undersigned, thereunto duly authorized.
| | |
| (Registrant): AB Cap Fund, Inc. |
| |
| By: | | /s/ Robert M. Keith |
| | Robert M. Keith President |
| |
| Date: | | September 29, 2017 |
Pursuant to the requirements of the Securities Exchange Act of 1934 and the Investment Company Act of 1940, this report has been signed below by the following persons on behalf of the registrant and in the capacities and on the dates indicated.
| | |
| |
| By: | | /s/ Robert M. Keith |
| | Robert M. Keith President |
| |
| Date: | | September 29, 2017 |
| | |
| |
| By: | | /s/ Joseph J. Mantineo |
| | Joseph J. Mantineo Treasurer and Chief Financial Officer |
| |
| Date: | | September 29, 2017 |