UNITED STATES
SECURITIES AND EXCHANGE COMMISSION
WASHINGTON, D.C. 20549
FORM N-CSR
CERTIFIED SHAREHOLDER REPORT OF REGISTERED
MANAGEMENT INVESTMENT COMPANIES
Investment Company Act file number: 811-01716
AB CAP FUND, INC.
(Exact name of registrant as specified in charter)
1345 Avenue of the Americas, New York, New York 10105
(Address of principal executive offices) (Zip code)
Joseph J. Mantineo
AllianceBernstein L.P.
1345 Avenue of the Americas
New York, New York 10105
(Name and address of agent for service)
Registrant’s telephone number, including area code: (800) 221-5672
Date of fiscal year end: October 31, 2017
Date of reporting period: October 31, 2017
ITEM 1. REPORTS TO STOCKHOLDERS.
OCT 10.31.17
ANNUAL REPORT
AB ALL MARKET ALTERNATIVE RETURN PORTFOLIO


| | |
| |
| Investment Products Offered | | • Are Not FDIC Insured • May Lose Value • Are Not Bank Guaranteed |
Investors should consider the investment objectives, risks, charges and expenses of the Fund carefully before investing. For copies of our prospectus or summary prospectus, which contain this and other information, visit us online at www.abfunds.com or contact your AB representative. Please read the prospectus and/or summary prospectus carefully before investing.
This shareholder report must be preceded or accompanied by the Fund’s prospectus for individuals who are not current shareholders of the Fund.
You may obtain a description of the Fund’s proxy voting policies and procedures, and information regarding how the Fund voted proxies relating to portfolio securities during the most recent 12-month period ended June 30, without charge. Simply visit AB’s website at www.abfunds.com, or go to the Securities and Exchange Commission’s (the “Commission”) website at www.sec.gov, or call AB at (800) 227 4618.
The Fund files its complete schedule of portfolio holdings with the Commission for the first and third quarters of each fiscal year on Form N-Q. The Fund’s Forms N-Q are available on the Commission’s website at www.sec.gov. The Fund’s Forms N-Q may also be reviewed and copied at the Commission’s Public Reference Room in Washington, DC; information on the operation of the Public Reference Room may be obtained by calling (800) SEC 0330. AB publishes full portfolio holdings for the Fund monthly at www.abfunds.com.
AllianceBernstein Investments, Inc. (ABI) is the distributor of the AB family of mutual funds. ABI is a member of FINRA and is an affiliate of AllianceBernstein L.P., the Adviser of the funds.
The [A/B] logo is a registered service mark of AllianceBernstein and AllianceBernstein® is a registered service mark used by permission of the owner, AllianceBernstein L.P.
| | |
| FROM THE PRESIDENT | |  |
Dear Shareholder,
We are pleased to provide this report for AB All Market Alternative Return Portfolio (the “Fund”). Please review the discussion of Fund performance, the market conditions during the reporting period and the Fund’s investment strategy.
As always, AB strives to keep clients ahead of what’s next by:
| + | | Transforming uncommon insights into uncommon knowledge with a global research scope |
| + | | Navigating markets with seasoned investment experience and sophisticated solutions |
| + | | Providing thoughtful investment insights and actionable ideas |
Whether you’re an individual investor or a multi-billion-dollar institution, we put knowledge and experience to work for you.
AB’s global research organization connects and collaborates across platforms and teams to deliver impactful insights and innovative products. Better insights lead to better opportunities—anywhere in the world.
For additional information about AB’s range of products and shareholder resources, please log on to www.abfunds.com.
Thank you for your investment in the AB Mutual Funds.
Sincerely,

Robert M. Keith
President and Chief Executive Officer, AB Mutual Funds
| | |
| abfunds.com | | AB ALL MARKET ALTERNATIVE RETURN PORTFOLIO | 1 |
ANNUAL REPORT
December 15, 2017
This report provides management’s discussion of fund performance for AB All Market Alternative Return Portfolio for the annual reporting period ended October 31, 2017.
The Fund’s investment objective is long-term capital appreciation.
NAV RETURNS AS OF OCTOBER 31, 2017 (unaudited)
| | | | | | | | |
| | | 6 Months | | | 12 Months | |
| AB ALL MARKET ALTERNATIVE RETURN PORTFOLIO | | | | | | | | |
| Class A Shares | | | -2.01% | | | | -3.22% | |
| Class C Shares1 | | | -2.27% | | | | -3.83% | |
| Advisor Class Shares2 | | | -1.89% | | | | -3.04% | |
| Bloomberg Barclays 3-Month T-Bill Index | | | 0.50% | | | | 0.73% | |
| Lipper Alternative Multi-Strategy Funds Average | | | 1.80% | | | | 4.66% | |
| 1 | The returns shown are based on net asset values calculated for shareholder transactions and may differ from the returns shown in the Financial Highlights, which reflect adjustments made to the net asset values in accordance with accounting principles generally accepted in the United States of America. |
| 2 | Please note that this share class is for investors purchasing shares through accounts established under certain fee-based programs sponsored and maintained by certain broker-dealers and financial intermediaries, certain institutional pension plans and/or investment advisory clients of, and certain other persons associated with, the Adviser and its affiliates or the Fund. |
INVESTMENT RESULTS
The table above shows the Fund’s performance compared to its benchmark, the Bloomberg Barclays 3-Month Treasury Bill (“T-Bill”) Index, and to the Lipper Alternative Multi-Strategy Funds Average (the “Lipper Average”), for the six- and 12-month periods ended October 31, 2017. Funds in the Lipper Average have generally similar investment objectives to the Fund, although some of the funds have different investment policies and sales and management fees and fund expenses.
All share classes of the Fund underperformed both the benchmark and the Lipper Average for both periods, before sales charges. Within the Fund’s long/short equity strategy for the 12-month period, single stock and country allocation contributed, relative to the benchmark. The long/short strategies in fixed income, commodities and developed-market currencies detracted. Equity volatility selling (i.e., derivative instruments, the return on which explicitly depends on the falling volatility of the price of the underlying equities) and emerging-market currency contributed. Long positions in emerging-market currency, most notably the Argentine peso, added to performance.
| | |
| 2 | AB ALL MARKET ALTERNATIVE RETURN PORTFOLIO | | abfunds.com |
Within the Fund’s equity strategy for the six-month period, single stock and country allocation contributed. Emerging and developed currency as well as commodity strategies detracted. Equity volatility selling and fixed income contributed to returns. Long positions in emerging-market currencies, most notably the Argentine peso, added to performance.
The Fund utilized derivatives for hedging and investment purposes for the 12-month period, including equity index futures, currency forwards and variance swaps, which contributed to absolute performance over the period, while interest rate swaps, bond futures and commodity futures detracted. For the six-month period, equity index futures, interest rate swaps and variance swaps were used, which contributed to performance, while currency forwards and commodity futures detracted.
MARKET REVIEW AND INVESTMENT STRATEGY
The beginning of the 12-month period ended October 31, 2017, was dominated by the US presidential election. Markets rallied after the election of Donald Trump in response to anticipated expansionary fiscal policies and pro-business regulatory policies. Following that, markets focused on recovering economic data, improving global growth and continued supportive global monetary policy. Markets were also driven at times by concern around changes in the European Central Bank’s quantitative easing policy and continued policy tightening by the US Federal Reserve (the “Fed”). Uncertainty surrounding trade and tax policy, as well as lingering geopolitical risks caused periods of rising volatility, which were brief and not extreme. Market inflation expectations for the US rose at the end of 2016 as investors priced in the impact of potential stimulus and fiscal policy by the newly elected president, which could boost demand and drive up inflation. This hurt defensive assets and yield plays such as bonds, gold, and real estate, as Treasury yields rose on the market’s increased expectations on interest rate hikes by the Fed in 2017 and beyond.
Over the course of both periods, the Fund’s Senior Investment Management Team (the “Team”) maintained exposure to a broad set of long/short factors across asset classes, including equities, fixed income, currencies and commodities. Within the Fund’s allocation to these factors, the Team increased exposure to equity strategies and fixed-income strategies. The Team modestly decreased exposure to commodity and currency strategies. Exposure to volatility selling strategies were maintained at near constant levels.
The market rally continued throughout 2017 as risk assets experienced robust growth in an extremely low-volatility environment characterized by accommodative monetary policies and strong corporate balance sheets. Commodity prices recovered during this period, and interest rates rose as well. Despite several geopolitical issues throughout the year such as the French election and escalating tensions between the US and North Korea, market downturns were short-lived. Near the end of the reporting period,
| | |
| abfunds.com | | AB ALL MARKET ALTERNATIVE RETURN PORTFOLIO | 3 |
several macroeconomic events surfaced including the aftermath of several hurricanes, the release of the White House’s tax-reform plan and the Fed’s guidance on interest-rate trajectory.
INVESTMENT POLICIES
The Fund seeks to achieve its investment objective primarily by allocating its assets among non-traditional or “alternative” investment strategies (the “Strategies”). The Fund utilizes the Adviser’s fundamental and quantitative research to identify and implement Strategies that in the aggregate are expected to deliver moderate absolute returns with low correlation to traditional asset classes such as equity and fixed-income securities. The Adviser seeks to identify tactical investment opportunities within and across these Strategies and to actively adjust the Fund’s exposure to each Strategy, and to different approaches within each Strategy in order to improve returns and control risks.
The Fund may utilize all or some of the following Strategies:
| | + | | The Fund takes long positions in certain securities or instruments in the expectation that they will increase in value and taking short positions in other securities or instruments in the expectation that they will decrease in value. The Fund may take long positions through the direct purchase of securities and/or through derivative instruments, and may likewise take short positions through short sales and/or derivatives. In a short sale transaction, the Fund sells a security that it does not own (but has borrowed) at its current market price in anticipation that the price of the security will decline. To complete, or close out, the short sale transaction, the Fund buys the same security in the market at a later date and returns it to the lender. | |
Under this Strategy, the Adviser may consider different factors, such as valuation and price momentum, in determining the securities and instruments in which to take long and short positions. The Fund may invest in one or more countries, and may focus on a specified sector, industry or market capitalization at any given time. This Strategy may include equity volatility strategies, in which the Fund would take long and short positions in equity volatility derivatives (i.e., derivative instruments the return on which explicitly depends on some measure of the volatility of the price of the underlying asset) where the Adviser deems such positions attractive.
| | + | | The Fund may take a similar approach in seeking to identify and benefit from price discrepancies between and among various currencies, interest rates, credit instruments and commodities. This Strategy attempts to exploit these discrepancies through long and | |
| | |
| 4 | AB ALL MARKET ALTERNATIVE RETURN PORTFOLIO | | abfunds.com |
(continued on next page)
| | short positions in related assets. In connection with this Strategy, the Fund may also invest in volatility derivatives related to currencies, interest rates, credit instruments and commodities. | |
| | + | | The Fund may also seek to identify and exploit opportunities across global asset classes and indexes. Unlike the approach described in the previous paragraph, this Strategy focuses on opportunities across asset classes rather than opportunities within asset classes. This Strategy is driven primarily by considerations relating to asset classes and countries, including considerations of a macroeconomic or technical nature, rather than “bottom-up” individual security analysis. As part of this Strategy, the Fund may invest in all major markets—equity, fixed-income (including both interest rate and credit instruments), real estate investment trusts (“REITs”), currencies and commodities, though not always at the same time—and may take both long and short positions in these markets. | |
In pursuing its objective, the Fund expects to invest in a wide range of securities and financial instruments, including equity and fixed-income securities and related derivatives transactions, such as options, futures contracts, forwards and swaps. The Fund’s fixed-income investments may be of any quality or maturity and include corporate obligations, obligations of US and foreign governments, and mortgage-backed or other types of asset-backed securities. The Fund may also invest in REITS, currencies and currency derivatives, and commodity derivatives. Some of the Strategies will frequently be implemented through sector-based and index-based derivatives or exchange-traded funds, rather than through specific securities or derivatives related to specific securities.
Derivatives, such as options, futures contracts, forwards and swaps, may provide more efficient and economical exposure to market segments than direct investments. The Fund’s market exposures may at times be achieved almost entirely through the use of derivatives. Derivatives transactions may also be a quicker and more efficient way to alter the Fund’s exposure than buying and selling direct investments. In determining when and to what extent to enter into derivatives transactions, the Adviser will consider factors such as the risks and returns of these investments relative to direct investments and the costs of such transactions. The Fund’s use of derivatives is expected to create aggregate notional exposure substantially in excess of the Fund’s net assets, effectively leveraging the Fund. Because derivatives transactions frequently require cash outlays that are only a small portion of the amount of exposure obtained through the derivative, a significant portion of the Fund’s assets may be held in
(continued on next page)
| | |
| abfunds.com | | AB ALL MARKET ALTERNATIVE RETURN PORTFOLIO | 5 |
cash or invested in cash equivalents, such as short-term US government and agency securities, repurchase agreements and money market funds.
While the Fund may seek to gain exposure to physical commodities traded in the commodities markets through investments in a variety of derivative instruments, the Adviser expects that the Fund will seek to gain such exposure to commodities and commodities-related instruments and derivatives primarily through investments in AllianceBernstein All Market Alternative Return Fund (Cayman) Ltd., a wholly-owned subsidiary of the Fund organized under the laws of the Cayman Islands (the “Subsidiary”). The Subsidiary is advised by the Adviser and has the same investment objective and substantially similar investment policies and restrictions as the Fund except that the Subsidiary, unlike the Fund, may invest, without limitation, in commodities and commodities-related instruments. The Fund will be subject to the risks associated with the commodities, derivatives and other instruments in which the Subsidiary invests, to the extent of its investment in the Subsidiary. The Fund limits its investment in the Subsidiary to no more than 25% of its total assets. Investment in the Subsidiary is expected to provide the Fund with commodity exposure within the limitations of federal tax requirements that apply to the Fund.
Currency exchange rate fluctuations can have a dramatic impact on returns. The Fund’s foreign currency exposures will come both from investments in equity and debt securities priced or denominated in foreign currencies and from direct holdings of foreign currencies and foreign currency-related derivatives. The Adviser may seek to hedge all or a portion of the currency exposure resulting from Fund investments or decide not to hedge this exposure. The Adviser may seek investment opportunities by taking long or short positions in currencies through the use of currency-related derivatives.
| | |
| 6 | AB ALL MARKET ALTERNATIVE RETURN PORTFOLIO | | abfunds.com |
DISCLOSURES AND RISKS
Benchmark Disclosure
The Bloomberg Barclays 3-Month T-Bill Index is unmanaged and does not reflect fees and expenses associated with the active management of a mutual fund portfolio. The Bloomberg Barclays 3-Month T-Bill Index represents the performance of Treasury securities maturing in 90 days. An investor cannot invest directly in an index, and its results are not indicative of the performance for any specific investment, including the Fund.
A Word About Risk
Market Risk: The value of the Fund’s assets will fluctuate as the stock, bond, currency and commodity markets fluctuate. The value of the Fund’s investments may decline, sometimes rapidly and unpredictably, simply because of economic changes or other events that affect large portions of the market.
Allocation Risk: The allocation of the Fund’s assets among different Strategies and asset classes, such as equity securities, debt securities and currencies, may have a significant effect on the Fund’s net asset value (“NAV”) when one of these asset classes is performing better or worse than others.
Derivatives Risk: Derivatives may be illiquid, difficult to price, and leveraged so that small changes may produce disproportionate losses for the Fund, and may be subject to counterparty risk to a greater degree than more traditional investments.
Leverage Risk: Because the Fund intends to use leveraging techniques to a significant extent, its NAV may be more volatile because leverage tends to exaggerate the effect of changes in interest rates and any increase or decrease in the value of the Fund’s investments.
Short Sale Risk: Short sales involve the risk that the Fund will incur a loss by subsequently buying a security at a higher price than the price at which it sold the security. The amount of such loss is theoretically unlimited, as it will be based on the increase in value of the security sold short. In contrast, the risk of loss from a long position is limited to the Fund’s investment in the security, because the price of the security cannot fall below zero. The Fund may not always be able to close out a short position on favorable terms.
Interest Rate Risk: Changes in interest rates will affect the value of investments in fixed-income securities. When interest rates rise, the value of existing investments in fixed-income securities tends to fall and this decrease in value may not be offset by higher income from new investments. The Fund may be subject to heightened risk due to rising rates as the current period of historically low interest rates may be ending. Interest rate risk is generally greater for fixed-income securities with longer maturities or durations.
| | |
| abfunds.com | | AB ALL MARKET ALTERNATIVE RETURN PORTFOLIO | 7 |
DISCLOSURES AND RISKS (continued)
Credit Risk: An issuer or guarantor of a fixed-income security, or the counterparty to a derivatives or other contract, may be unable or unwilling to make timely payments of interest or principal, or to otherwise honor its obligations. The issuer, guarantor or counterparty may default, causing a loss of the full principal amount of a security or the amount to which the Fund is entitled in a derivatives transaction. The degree of risk for a particular security may be reflected in its credit rating. There is the possibility that the credit rating of a fixed-income security may be downgraded after purchase, which may adversely affect the value of the security.
Foreign (Non-US) Risk: Investments in securities of non-US issuers may involve more risk than those of US issuers. These securities may fluctuate more widely in price and may be less liquid due to adverse market, economic, political, regulatory or other factors.
Emerging Market Risk: Investments in emerging-market countries may have more risk because the markets are less developed and less liquid, and because these investments may be subject to increased economic, political, regulatory and other uncertainties.
Currency Risk: Fluctuations in currency exchange rates may negatively affect the value of the Fund’s investments or reduce its returns.
Commodity Risk: Investing in commodities and commodity-linked derivative instruments may subject the Fund to greater volatility than investments in traditional securities. The value of commodity-linked derivative instruments may be affected by overall market movements, commodity index volatility, changes in interest rates, or factors affecting a particular industry or commodity, such as drought, floods, weather, livestock disease, embargoes, tariffs and international economic, political and regulatory developments.
Subsidiary Risk: By investing in the Subsidiary, the Fund is indirectly exposed to the risks associated with the Subsidiary. The derivatives and other investments held by the Subsidiary are generally similar to those that are permitted to be held by the Fund and are subject to the same risks that apply to similar investments if held directly by the Fund. The Subsidiary is not registered under the Investment Company Act of 1940, as amended (the “1940 Act”), and, unless otherwise noted in the prospectus, is not subject to all of the investor protections of the 1940 Act. However, the Fund wholly owns and controls the Subsidiary, and the Fund and the Subsidiary are managed by the Adviser, making it unlikely the Subsidiary will take actions contrary to the interests of the Fund or its shareholders. In addition, changes in federal tax laws applicable to the Fund or interpretations thereof could limit the Fund’s ability to gain exposure to commodities investments through investments in the Subsidiary.
| | |
| 8 | AB ALL MARKET ALTERNATIVE RETURN PORTFOLIO | | abfunds.com |
DISCLOSURES AND RISKS (continued)
Real Estate Risk: The Fund’s investments in real estate securities have many of the same risks as direct ownership of real estate, including the risk that the value of real estate could decline due to a variety of factors that affect the real estate market generally. Investments in REITs may have additional risks. REITs are dependent on the capability of their managers, may have limited diversification, and could be significantly affected by changes in taxes.
Non-Diversification Risk: The Fund may have more risk because it is “non-diversified”, meaning that it can invest more of its assets in a smaller number of issuers. Accordingly, changes in the value of a single security may have a more significant effect, either negative or positive, on the Fund’s NAV.
Active Trading Risk: The Fund expects to engage in active and frequent trading of its portfolio securities and its portfolio turnover rate is expected to greatly exceed 100%. A higher rate of portfolio turnover increases transaction costs, which may negatively affect the Fund’s return. In addition, a high rate of portfolio turnover may result in substantial short-term gains, which may have adverse tax consequences for Fund shareholders.
Management Risk: The Fund is subject to management risk because it is an actively managed investment fund. The Adviser will apply its investment techniques and risk analyses in making investment decisions, but there is no guarantee that its techniques will produce the intended results.
These risks are fully discussed in the Fund’s prospectus. As with all investments, you may lose money by investing in the Fund.
An Important Note About Historical Performance
The investment return and principal value of an investment in the Fund will fluctuate, so that shares, when redeemed, may be worth more or less than their original cost. Performance shown in this report represents past performance and does not guarantee future results. Current performance may be lower or higher than the performance information shown. You may obtain performance information current to the most recent month-end by visiting www.abfunds.com.
All fees and expenses related to the operation of the Fund have been deducted. NAV returns do not reflect sales charges; if sales charges were reflected, the Fund’s quoted performance would be lower. SEC returns reflect the applicable sales charges for each share class: a 4.25% maximum front-end sales charge for Class A shares and a 1% 1-year contingent deferred sales charge for Class C shares. Returns for the different share classes will vary due to different expenses associated with each class. Performance assumes reinvestment of distributions and does not account for taxes.
| | |
| abfunds.com | | AB ALL MARKET ALTERNATIVE RETURN PORTFOLIO | 9 |
HISTORICAL PERFORMANCE
GROWTH OF A $10,000 INVESTMENT IN THE FUND (unaudited)
3/9/20151 TO 10/31/2017
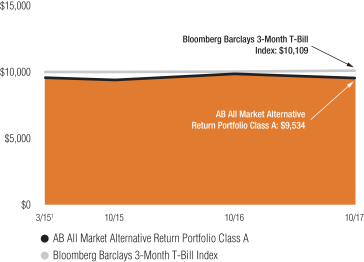
This chart illustrates the total value of an assumed $10,000 investment in AB All Market Alternative Return Portfolio Class A shares (from 3/9/20151 to 10/31/2017) as compared to the performance of its benchmark. The chart reflects the deduction of the maximum 4.25% sales charge from the initial $10,000 investment in the Fund and assumes the reinvestment of dividends and capital gains distributions.
| 1 | Inception date: 3/9/2015. |
| | |
| 10 | AB ALL MARKET ALTERNATIVE RETURN PORTFOLIO | | abfunds.com |
HISTORICAL PERFORMANCE (continued)
AVERAGE ANNUAL RETURNS AS OF OCTOBER 31, 2017 (unaudited)
| | | | | | | | |
| | | NAV Returns | | | SEC Returns
(reflects applicable
sales charges) | |
| CLASS A SHARES | | | | | | | | |
| 1 Year | | | -3.22% | | | | -7.37% | |
| Since Inception1 | | | -0.18% | | | | -1.79% | |
| CLASS C SHARES | | | | | | | | |
| 1 Year | | | -3.83% | | | | -4.64% | |
| Since Inception1 | | | -0.89% | | | | -0.89% | |
| ADVISOR CLASS SHARES2 | | | | | | | | |
| 1 Year | | | -3.04% | | | | -3.04% | |
| Since Inception1 | | | 0.04% | | | | 0.04% | |
The Fund’s prospectus fee table shows the Fund’s total annual operating expense ratios as 3.79%, 4.62% and 3.54% for Class A, Class C and Advisor Class shares, respectively, gross of any fee waivers or expense reimbursements. Contractual fee waivers and/or expense reimbursements limit the Fund’s annual operating expense ratios exclusive of expenses associated with securities sold short, acquired fund fees and expenses other than advisory fees of any AB mutual funds in which Fund may invest, interest expense, taxes, extraordinary expenses, and brokerage commissions and other transaction costs to 1.24%, 1.99% and 0.99% for Class A, Class C and Advisor Class shares, respectively. These waivers/reimbursements may not be terminated before February 28, 2018 and may be extended by the Adviser for additional one-year terms. Any fees waived and expenses borne by the Adviser may be reimbursed by the Fund until the end of the third fiscal year after the fiscal period in which the fee was waived or the expense was borne, provided that no reimbursement payment will be made that would cause the Fund’s total annual operating expenses to exceed the expense limitations. Absent reimbursements or waivers, performance would have been lower. The Financial Highlights section of this report sets forth expense ratio data for the current reporting period; the expense ratios shown above may differ from the expense ratios in the Financial Highlights sections since they are based on different time periods.
| 1 | Inception date: 3/9/2015. |
| 2 | This share class is offered at NAV to eligible investors and the SEC returns are the same as the NAV returns. Please note that this share class is for investors purchasing shares through accounts established under certain fee-based programs sponsored and maintained by certain broker-dealers and financial intermediaries, certain institutional pension plans and/or investment advisory clients of, and certain other persons associated with, the Adviser and its affiliates or the Fund. |
| | |
| abfunds.com | | AB ALL MARKET ALTERNATIVE RETURN PORTFOLIO | 11 |
HISTORICAL PERFORMANCE (continued)
SEC AVERAGE ANNUAL RETURNS
AS OF THE MOST RECENT CALENDAR QUARTER-END
SEPTEMBER 30, 2017 (unaudited)
| | | | |
| | | SEC Returns
(reflects applicable
sales charges) | |
| CLASS A SHARES | | | | |
| 1 Year | | | -5.95% | |
| Since Inception1 | | | -1.99% | |
| CLASS C SHARES | | | | |
| 1 Year | | | -3.27% | |
| Since Inception1 | | | -1.07% | |
| ADVISOR CLASS SHARES2 | | | | |
| 1 Year | | | -1.57% | |
| Since Inception1 | | | -0.10% | |
| 1 | Inception date: 3/9/2015. |
| 2 | Please note that this share class is for investors purchasing shares through accounts established under certain fee-based programs sponsored and maintained by certain broker-dealers and financial intermediaries, certain institutional pension plans and/or investment advisory clients of, and certain other persons associated with, the Adviser and its affiliates or the Fund. |
| | |
| 12 | AB ALL MARKET ALTERNATIVE RETURN PORTFOLIO | | abfunds.com |
EXPENSE EXAMPLE
(unaudited)
As a shareholder of a mutual fund, you may incur two types of costs: (1) transaction costs, including sales charges (loads) on purchase payments, contingent deferred sales charges on redemptions and (2) ongoing costs, including management fees; distribution (12b-1) fees; and other fund expenses. This example is intended to help you understand your ongoing costs (in dollars) of investing in the Fund and to compare these costs with the ongoing costs of investing in other mutual funds.
The Example is based on an investment of $1,000 invested at the beginning of the period and held for the entire period as indicated below.
Actual Expenses
The table below provides information about actual account values and actual expenses. You may use the information in this line, together with the amount you invested, to estimate the expenses that you paid over the period. Simply divide your account value by $1,000 (for example, an $8,600 account value divided by $1,000 = 8.6), then multiply the result by the number in the first line under the heading entitled “Expenses Paid During Period” to estimate the expenses you paid on your account during this period.
Hypothetical Example for Comparison Purposes
The table below provides information about hypothetical account values and hypothetical expenses based on the Fund’s actual expense ratio and an assumed annual rate of return of 5% before expenses, which is not the Fund’s actual return. The hypothetical account values and expenses may not be used to estimate the actual ending account balance or expenses you paid for the period. You may use this information to compare the ongoing costs of investing in the Fund and other funds by comparing this 5% hypothetical example with the 5% hypothetical examples that appear in the shareholder reports of other funds.
Please note that the expenses shown in the table are meant to highlight your ongoing costs only and do not reflect any transactional costs, such as sales charges (loads), or contingent deferred sales charges on redemptions. Therefore, the hypothetical example is useful in comparing ongoing costs only, and will not help you determine the relative total costs of owning different funds. In addition, if these transactional costs were included, your costs would have been higher.
| | | | | | | | | | | | | | | | | | | | | | | | |
| | | Beginning
Account
Value
May 1, 2017 | | | Ending
Account
Value
October 31, 2017 | | | Expenses
Paid
During
Period* | | | Annualized
Expense
Ratio* | | | Total
Expenses
Paid
During
Period+ | | | Total
Annualized
Expense
Ratio+ | |
| Class A | | | | | | | | | | | | | | | | | | | | | | | | |
Actual | | $ | 1,000 | | | $ | 979.90 | | | $ | 5.24 | | | | 1.05 | % | | $ | 5.59 | | | | 1.12 | % |
Hypothetical** | | $ | 1,000 | | | $ | 1,019.91 | | | $ | 5.35 | | | | 1.05 | % | | $ | 5.70 | | | | 1.12 | % |
| | |
| abfunds.com | | AB ALL MARKET ALTERNATIVE RETURN PORTFOLIO | 13 |
EXPENSE EXAMPLE (continued)
| | | | | | | | | | | | | | | | | | | | | | | | |
| | | Beginning
Account
Value
May 1, 2017 | | | Ending
Account
Value
October 31, 2017 | | | Expenses
Paid
During
Period* | | | Annualized
Expense
Ratio* | | | Total
Expenses
Paid
During
Period+ | | | Total
Annualized
Expense
Ratio+ | |
| Class C | | | | | | | | | | | | | | | | | | | | | | | | |
Actual | | $ | 1,000 | | | $ | 977.30 | | | $ | 8.72 | | | | 1.75 | % | | $ | 9.07 | | | | 1.82 | % |
Hypothetical** | | $ | 1,000 | | | $ | 1,016.38 | | | $ | 8.89 | | | | 1.75 | % | | $ | 9.25 | | | | 1.82 | % |
| Advisor Class | | | | | | | | | | | | | | | | | | | | | | | | |
Actual | | $ | 1,000 | | | $ | 981.10 | | | $ | 4.64 | | | | 0.93 | % | | $ | 4.94 | | | | 0.99 | % |
Hypothetical** | | $ | 1,000 | | | $ | 1,020.52 | | | $ | 4.74 | | | | 0.93 | % | | $ | 5.04 | | | | 0.99 | % |
| * | Expenses are equal to the classes’ annualized expense ratios, multiplied by the average account value over the period, multiplied by 184/365 (to reflect the one-half year period), respectively. |
| ** | Assumes 5% annual return before expenses. |
| + | In connection with the Fund’s investments in affiliated/unaffiliated underlying portfolios, the Fund incurs no direct expenses, but bears proportionate shares of the fees and expenses (i.e., operating, administrative and investment advisory fees) of the affiliated/unaffiliated underlying portfolios. The Adviser has contractually agreed to waive its fees from the Fund in an amount equal to the Fund’s pro rata share of certain acquired fund fees and expenses of the affiliated underlying portfolios. The Fund’s total expenses are equal to the classes’ annualized expense ratio plus the Fund’s pro rata share of the weighted average expense ratio of the affiliated/unaffiliated underlying portfolios in which it invests, multiplied by the average account value over the period, multiplied by 184/365 (to reflect the one-half year period). |
| | |
| 14 | AB ALL MARKET ALTERNATIVE RETURN PORTFOLIO | | abfunds.com |
PORTFOLIO SUMMARY
October 31, 2017 (unaudited)
PORTFOLIO STATISTICS
Net Assets ($mil): $229.3
TEN LARGEST HOLDINGS2
| | | | | | | | | | | | |
| Company | | | U.S. $ Value | | | Percent of
Net Assets | |
| Apple, Inc. | | | $ | 2,077,501 | | | | 0.9 | % |
| JPMorgan Chase & Co. | | | | 1,399,183 | | | | 0.6 | |
| UnitedHealth Group, Inc. | | | | 1,260,269 | | | | 0.6 | |
| Microsoft Corp. | | | | 1,244,539 | | | | 0.5 | |
| Procter & Gamble Co. (The) | | | | 1,235,180 | | | | 0.5 | |
| Alphabet, Inc. – Class C | | | | 1,204,899 | | | | 0.5 | |
| HSBC Holdings PLC | | | | 1,181,042 | | | | 0.5 | |
| Mastercard, Inc. – Class A | | | | 1,127,677 | | | | 0.5 | |
| Boeing Co. (The) | | | | 1,063,135 | | | | 0.5 | |
| Facebook, Inc. – Class A | | | | 1,037,145 | | | | 0.5 | |
| | | | | | $ | 12,830,570 | | | | 5.6 | % |
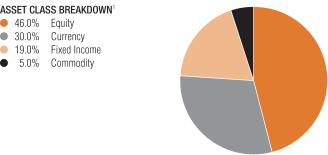
| 1 | All data are as of October 31, 2017. The Fund’s asset class breakdown includes derivatives exposure and is expressed as approximate percentages of the Fund’s total net assets, based on the Adviser’s internal classification. |
Please note: The sector classifications presented herein are based on the Global Industry Classification Standard (GICS) which was developed by Morgan Stanley Capital International and Standard & Poor’s. The components are divided into sector, industry group, and industry sub-indices as classified by the GICS for each of the market capitalization indices in the broad market. These sector classifications are broadly defined. The “Portfolio of Investments” section of the report reflects more specific industry information and is consistent with the investment restrictions discussed in the Fund’s prospectus.
| | |
| abfunds.com | | AB ALL MARKET ALTERNATIVE RETURN PORTFOLIO | 15 |
CONSOLIDATED PORTFOLIO OF INVESTMENTS
October 31, 2017
| | | | | | | | | | | | |
| Company | | | | | Shares | | | U.S. $ Value | |
| | | | | |
| | | | | | | | | | | | |
COMMON STOCKS – 48.3% | | | | | | | | | | | | |
Information Technology – 8.8% | | | | | | | | | | | | |
Communications Equipment – 0.8% | | | | | | | | | | | | |
Cisco Systems, Inc. | | | | | | | 12,408 | | | $ | 423,733 | |
F5 Networks, Inc.(a) | | | | | | | 5,730 | | | | 694,877 | |
Telefonaktiebolaget LM Ericsson – Class B | | | | | | | 123,677 | | | | 778,309 | |
| | | | | | | | | | | | |
| | | | | | | | | | | 1,896,919 | |
| | | | | | | | | | | | |
Electronic Equipment, Instruments & Components – 0.3% | | | | | | | | | | | | |
Avnet, Inc. | | | | | | | 17,060 | | | | 678,988 | |
| | | | | | | | | | | | |
| | | |
Internet Software & Services – 1.7% | | | | | | | | | | | | |
Alphabet, Inc. – Class A(a) | | | | | | | 383 | | | | 395,654 | |
Alphabet, Inc. – Class C(a) | | | | | | | 796 | | | | 809,245 | |
eBay, Inc.(a) | | | | | | | 20,590 | | | | 775,008 | |
Facebook, Inc. – Class A(a) | | | | | | | 5,760 | | | | 1,037,145 | |
Mixi, Inc. | | | | | | | 13,600 | | | | 663,026 | |
Updater, Inc.(a) | | | | | | | 235,340 | | | | 209,837 | |
| | | | | | | | | | | | |
| | | | | | | | | | | 3,889,915 | |
| | | | | | | | | | | | |
IT Services – 1.2% | | | | | | | | | | | | |
DXC Technology Co. | | | | | | | 8,414 | | | | 770,049 | |
Mastercard, Inc. – Class A | | | | | | | 7,580 | | | | 1,127,677 | |
Visa, Inc. – Class A | | | | | | | 770 | | | | 84,685 | |
Western Union Co. (The) – Class W | | | | | | | 36,250 | | | | 719,925 | |
| | | | | | | | | | | | |
| | | | | | | | | | | 2,702,336 | |
| | | | | | | | | | | | |
Semiconductors & Semiconductor Equipment – 1.7% | | | | | | | | | | | | |
Applied Materials, Inc. | | | | | | | 16,085 | | | | 907,677 | |
Intel Corp. | | | | | | | 967 | | | | 43,989 | |
KLA-Tencor Corp. | | | | | | | 7,290 | | | | 793,808 | |
Lam Research Corp. | | | | | | | 4,090 | | | | 853,051 | |
Shindengen Electric Manufacturing Co., Ltd. | | | | | | | 5,300 | | | | 361,789 | |
STMicroelectronics NV | | | | | | | 35,770 | | | | 842,073 | |
| | | | | | | | | | | | |
| | | | | | | | | | | 3,802,387 | |
| | | | | | | | | | | | |
Software – 1.9% | | | | | | | | | | | | |
Adobe Systems, Inc.(a) | | | | | | | 4,161 | | | | 728,841 | |
Electronic Arts, Inc.(a) | | | | | | | 6,240 | | | | 746,304 | |
Intuit, Inc. | | | | | | | 1,140 | | | | 172,163 | |
Microsoft Corp. | | | | | | | 14,962 | | | | 1,244,539 | |
Nexon Co., Ltd.(a) | | | | | | | 25,100 | | | | 675,168 | |
Oracle Corp. | | | | | | | 5,587 | | | | 284,378 | |
salesforce.com, Inc.(a) | | | | | | | 5,586 | | | | 571,671 | |
| | | | | | | | | | | | |
| | | | | | | | | | | 4,423,064 | |
| | | | | | | | | | | | |
Technology Hardware, Storage & Peripherals – 1.2% | | | | | | | | | | | | |
Apple, Inc. | | | | | | | 12,290 | | | | 2,077,501 | |
| | |
| 16 | AB ALL MARKET ALTERNATIVE RETURN PORTFOLIO | | abfunds.com |
CONSOLIDATED PORTFOLIO OF INVESTMENTS (continued)
| | | | | | | | | | | | |
| Company | | | | | Shares | | | U.S. $ Value | |
| | | | | |
| | | | | | | | | | | | |
NEC Corp. | | | | | | | 25,200 | | | $ | 691,479 | |
| | | | | | | | | | | | |
| | | | | | | | | | | 2,768,980 | |
| | | | | | | | | | | | |
| | | | | | | | | | | 20,162,589 | |
| | | | | | | | | | | | |
Financials – 7.6% | | | | | | | | | | | | |
Banks – 3.1% | | | | | | | | | | | | |
Bank of America Corp. | | | | | | | 17,300 | | | | 473,847 | |
Citigroup, Inc. | | | | | | | 5,000 | | | | 367,500 | |
Commerzbank AG(a) | | | | | | | 51,870 | | | | 718,819 | |
HSBC Holdings PLC | | | | | | | 120,945 | | | | 1,181,042 | |
JPMorgan Chase & Co. | | | | | | | 13,907 | | | | 1,399,183 | |
Nordea Bank AB | | | | | | | 18,120 | | | | 218,975 | |
PNC Financial Services Group, Inc. (The) | | | | | | | 5,758 | | | | 787,637 | |
Raiffeisen Bank International AG(a) | | | | | | | 12,580 | | | | 437,484 | |
Standard Chartered PLC(a) | | | | | | | 60,960 | | | | 607,154 | |
Swedbank AB – Class A | | | | | | | 26,100 | | | | 647,743 | |
Wells Fargo & Co. | | | | | | | 4,570 | | | | 256,560 | |
| | | | | | | | | | | | |
| | | | | | | | | | | 7,095,944 | |
| | | | | | | | | | | | |
Capital Markets – 1.0% | | | | | | | | | | | | |
3i Group PLC | | | | | | | 35,540 | | | | 453,567 | |
Ameriprise Financial, Inc. | | | | | | | 4,758 | | | | 744,817 | |
Cboe Global Markets, Inc. | | | | | | | 6,470 | | | | 731,498 | |
Deutsche Bank AG (REG) | | | | | | | 16,310 | | | | 267,308 | |
| | | | | | | | | | | | |
| | | | | | | | | | | 2,197,190 | |
| | | | | | | | | | | | |
Diversified Financial Services – 1.2% | | | | | | | | | | | | |
AMP Ltd. | | | | | | | 119,520 | | | | 455,491 | |
Berkshire Hathaway, Inc. – Class B(a) | | | | | | | 840 | | | | 157,030 | |
Industrivarden AB – Class C | | | | | | | 25,980 | | | | 667,596 | |
Investor AB – Class B | | | | | | | 14,350 | | | | 710,994 | |
Kinnevik AB | | | | | | | 20,200 | | | | 662,598 | |
| | | | | | | | | | | | |
| | | | | | | | | | | 2,653,709 | |
| | | | | | | | | | | | |
Insurance – 2.2% | | | | | | | | | | | | |
Aegon NV | | | | | | | 122,740 | | | | 724,639 | |
Aflac, Inc. | | | | | | | 8,735 | | | | 732,779 | |
Ageas | | | | | | | 15,250 | | | | 739,550 | |
American Financial Group, Inc./OH | | | | | | | 6,320 | | | | 666,697 | |
American International Group, Inc. | | | | | | | 12,519 | | | | 808,853 | |
Prudential Financial, Inc. | | | | | | | 6,775 | | | | 748,366 | |
Unum Group | | | | | | | 13,370 | | | | 695,775 | |
| | | | | | | | | | | | |
| | | | | | | | | | | 5,116,659 | |
| | | | | | | | | | | | |
Thrifts & Mortgage Finance – 0.1% | | | | | | | | | | | | |
OneSavings Bank PLC | | | | | | | 53,630 | | | | 288,651 | |
| | | | | | | | | | | | |
| | | | | | | | | | | 17,352,153 | |
| | | | | | | | | | | | |
Industrials – 6.5% | | | | | | | | | | | | |
Aerospace & Defense – 0.5% | | | | | | | | | | | | |
Boeing Co. (The) | | | | | | | 4,121 | | | | 1,063,135 | |
Safran SA | | | | | | | 1,371 | | | | 144,397 | |
| | | | | | | | | | | | |
| | | | | | | | | | | 1,207,532 | |
| | | | | | | | | | | | |
| | |
| abfunds.com | | AB ALL MARKET ALTERNATIVE RETURN PORTFOLIO | 17 |
CONSOLIDATED PORTFOLIO OF INVESTMENTS (continued)
| | | | | | | | | | | | |
| Company | | | | | Shares | | | U.S. $ Value | |
| | | | | |
| | | | | | | | | | | | |
Airlines – 0.8% | | | | | | | | | | | | |
Air Canada(a) | | | | | | | 17,570 | | | $ | 348,104 | |
Air France-KLM(a) | | | | | | | 9,070 | | | | 142,015 | |
Deutsche Lufthansa AG (REG) | | | | | | | 23,670 | | | | 760,466 | |
Qantas Airways Ltd. | | | | | | | 140,840 | | | | 664,713 | |
| | | | | | | | | | | | |
| | | | | | | | | | | 1,915,298 | |
| | | | | | | | | | | | |
Building Products – 0.3% | | | | | | | | | | | | |
Allegion PLC | | | | | | | 8,320 | | | | 693,805 | |
| | | | | | | | | | | | |
| | | |
Commercial Services & Supplies – 0.3% | | | | | | | | | | | | |
Toppan Printing Co., Ltd. | | | | | | | 57,000 | | | | 579,902 | |
| | | | | | | | | | | | |
| | | |
Construction & Engineering – 1.1% | | | | | | | | | | | | |
ACS Actividades de Construccion y Servicios SA | | | | | | | 16,430 | | | | 647,655 | |
Hazama Ando Corp. | | | | | | | 46,100 | | | | 375,865 | |
Kajima Corp. | | | | | | | 68,000 | | | | 705,261 | |
Maire Tecnimont SpA | | | | | | | 11,350 | | | | 63,641 | |
Sumitomo Mitsui Construction Co., Ltd. | | | | | | | 53,000 | | | | 326,511 | |
Taisei Corp. | | | | | | | 8,200 | | | | 454,337 | |
| | | | | | | | | | | | |
| | | | | | | | | | | 2,573,270 | |
| | | | | | | | | | | | |
Electrical Equipment – 0.2% | | | | | | | | | | | | |
OSRAM Licht AG | | | | | | | 5,650 | | | | 432,619 | |
| | | | | | | | | | | | |
| | | |
Industrial Conglomerates – 0.7% | | | | | | | | | | | | |
3M Co. | | | | | | | 2,471 | | | | 568,799 | |
CITIC Ltd. | | | | | | | 170,000 | | | | 249,039 | |
General Electric Co. | | | | | | | 6,510 | | | | 131,242 | |
Honeywell International, Inc. | | | | | | | 4,795 | | | | 691,247 | |
| | | | | | | | | | | | |
| | | | | | | | | | | 1,640,327 | |
| | | | | | | | | | | | |
Machinery – 1.3% | | | | | | | | | | | | |
AGCO Corp. | | | | | | | 5,640 | | | | 386,735 | |
Caterpillar, Inc. | | | | | | | 7,280 | | | | 988,624 | |
Illinois Tool Works, Inc. | | | | | | | 5,098 | | | | 797,939 | |
MINEBEA MITSUMI, Inc. | | | | | | | 41,500 | | | | 760,824 | |
| | | | | | | | | | | | |
| | | | | | | | | | | 2,934,122 | |
| | | | | | | | | | | | |
Marine – 0.1% | | | | | | | | | | | | |
Mitsui OSK Lines Ltd. | | | | | | | 8,100 | | | | 248,033 | |
| | | | | | | | | | | | |
| | | |
Professional Services – 0.3% | | | | | | | | | | | | |
Robert Half International, Inc. | | | | | | | 12,760 | | | | 660,585 | |
| | | | | | | | | | | | |
| | | |
Road & Rail – 0.9% | | | | | | | | | | | | |
Central Japan Railway Co. | | | | | | | 4,100 | | | | 744,751 | |
Nippon Express Co., Ltd. | | | | | | | 10,300 | | | | 653,561 | |
Union Pacific Corp. | | | | | | | 5,886 | | | | 681,540 | |
| | | | | | | | | | | | |
| | | | | | | | | | | 2,079,852 | |
| | | | | | | | | | | | |
| | | | | | | | | | | 14,965,345 | |
| | | | | | | | | | | | |
| | |
| 18 | AB ALL MARKET ALTERNATIVE RETURN PORTFOLIO | | abfunds.com |
CONSOLIDATED PORTFOLIO OF INVESTMENTS (continued)
| | | | | | | | | | | | |
| Company | | | | | Shares | | | U.S. $ Value | |
| | | | | |
| | | | | | | | | | | | |
Health Care – 6.5% | | | | | | | | | | | | |
Biotechnology – 2.2% | | | | | | | | | | | | |
AbbVie, Inc. | | | | | | | 9,070 | | | $ | 818,568 | |
Alexion Pharmaceuticals, Inc.(a) | | | | | | | 1,940 | | | | 232,140 | |
Amgen, Inc. | | | | | | | 5,719 | | | | 1,002,083 | |
Celgene Corp.(a) | | | | | | | 6,853 | | | | 691,947 | |
Gilead Sciences, Inc. | | | | | | | 11,539 | | | | 864,964 | |
United Therapeutics Corp.(a) | | | | | | | 5,160 | | | | 611,924 | |
Vertex Pharmaceuticals, Inc.(a) | | | | | | | 4,830 | | | | 706,291 | |
| | | | | | | | | | | | |
| | | | | | | | | | | 4,927,917 | |
| | | | | | | | | | | | |
Health Care Equipment & Supplies – 1.1% | | | | | | | | | | | | |
Baxter International, Inc. | | | | | | | 1,136 | | | | 73,238 | |
Cochlear Ltd. | | | | | | | 5,474 | | | | 737,371 | |
Hoya Corp. | | | | | | | 5,300 | | | | 287,953 | |
Straumann Holding AG | | | | | | | 1,040 | | | | 726,128 | |
Varian Medical Systems, Inc.(a) | | | | | | | 6,470 | | | | 674,109 | |
| | | | | | | | | | | | |
| | | | | | | | | | | 2,498,799 | |
| | | | | | | | | | | | |
Health Care Providers & Services – 1.8% | | | | | | | | | | | | |
Centene Corp.(a) | | | | | | | 7,170 | | | | 671,614 | |
Humana, Inc. | | | | | | | 3,200 | | | | 817,120 | |
McKesson Corp. | | | | | | | 5,090 | | | | 701,809 | |
UnitedHealth Group, Inc. | | | | | | | 5,995 | | | | 1,260,269 | |
WellCare Health Plans, Inc.(a) | | | | | | | 3,496 | | | | 691,299 | |
| | | | | | | | | | | | |
| | | | | | | | | | | 4,142,111 | |
| | | | | | | | | | | | |
Life Sciences Tools & Services – 0.0% | | | | | | | | | | | | |
Mettler-Toledo International, Inc.(a) | | | | | | | 101 | | | | 68,946 | |
| | | | | | | | | | | | |
| | | |
Pharmaceuticals – 1.4% | | | | | | | | | | | | |
Johnson & Johnson | | | | | | | 4,275 | | | | 595,978 | |
Merck & Co., Inc. | | | | | | | 18,265 | | | | 1,006,219 | |
Novartis AG (REG) | | | | | | | 1,027 | | | | 84,706 | |
Novo Nordisk A/S – Class B | | | | | | | 19,400 | | | | 965,903 | |
Orion Oyj – Class B | | | | | | | 1,753 | | | | 71,846 | |
Pfizer, Inc. | | | | | | | 10,810 | | | | 378,999 | |
Roche Holding AG | | | | | | | 390 | | | | 90,141 | |
| | | | | | | | | | | | |
| | | | | | | | | | | 3,193,792 | |
| | | | | | | | | | | | |
| | | | | | | | | | | 14,831,565 | |
| | | | | | | | | | | | |
Consumer Discretionary – 6.4% | | | | | | | | | | | | |
Automobiles – 0.4% | | | | | | | | | | | | |
Fiat Chrysler Automobiles NV(a) | | | | | | | 42,260 | | | | 730,729 | |
General Motors Co. | | | | | | | 5,740 | | | | 246,705 | |
Mazda Motor Corp. | | | | | | | 4,900 | | | | 70,735 | |
| | | | | | | | | | | | |
| | | | | | | | | | | 1,048,169 | |
| | | | | | | | | | | | |
Diversified Consumer Services – 0.3% | | | | | | | | | | | | |
Benesse Holdings, Inc. | | | | | | | 19,000 | | | | 644,103 | |
| | | | | | | | | | | | |
| | |
| abfunds.com | | AB ALL MARKET ALTERNATIVE RETURN PORTFOLIO | 19 |
CONSOLIDATED PORTFOLIO OF INVESTMENTS (continued)
| | | | | | | | | | | | |
| Company | | | | | Shares | | | U.S. $ Value | |
| | | | | |
| | | | | | | | | | | | |
Hotels, Restaurants & Leisure – 1.0% | | | | | | | | | | | | |
Aristocrat Leisure Ltd. | | | | | | | 21,733 | | | $ | 392,895 | |
Flight Centre Travel Group Ltd. | | | | | | | 19,120 | | | | 685,478 | |
InterContinental Hotels Group PLC | | | | | | | 3,048 | | | | 168,863 | |
Thomas Cook Group PLC | | | | | | | 216,890 | | | | 345,085 | |
Wynn Macau Ltd. | | | | | | | 271,200 | | | | 696,254 | |
| | | | | | | | | | | | |
| | | | | | | | | | | 2,288,575 | |
| | | | | | | | | | | | |
Household Durables – 0.6% | | | | | | | | | | | | |
Electrolux AB – Class B | | | | | | | 20,250 | | | | 715,768 | |
Sharp Corp./Japan(a) | | | | | | | 20,500 | | | | 652,147 | |
| | | | | | | | | | | | |
| | | | | | | | | | | 1,367,915 | |
| | | | | | | | | | | | |
Internet & Direct Marketing Retail – 0.8% | | | | | | | | | | | | |
Amazon.com, Inc.(a) | | | | | | | 711 | | | | 785,854 | |
Expedia, Inc. | | | | | | | 4,830 | | | | 602,108 | |
Netflix, Inc.(a) | | | | | | | 2,130 | | | | 418,396 | |
| | | | | | | | | | | | |
| | | | | | | | | | | 1,806,358 | |
| | | | | | | | | | | | |
Leisure Products – 0.4% | | | | | | | | | | | | |
Sankyo Co., Ltd. | | | | | | | 18,200 | | | | 587,452 | |
Sega Sammy Holdings, Inc. | | | | | | | 31,400 | | | | 442,028 | |
| | | | | | | | | | | | |
| | | | | | | | | | | 1,029,480 | |
| | | | | | | | | | | | |
Media – 1.3% | | | | | | | | | | | | |
CBS Corp. – Class B | | | | | | | 10,761 | | | | 603,907 | |
Comcast Corp. – Class A | | | | | | | 2,840 | | | | 102,325 | |
DHX Media Ltd. | | | | | | | 84,340 | | | | 280,458 | |
Discovery Communications, Inc. – Class A(a) | | | | | | | 9,197 | | | | 173,639 | |
Discovery Communications, Inc. – Class C(a) | | | | | | | 24,772 | | | | 441,189 | |
ITV PLC | | | | | | | 272,700 | | | | 596,098 | |
News Corp. – Class A | | | | | | | 45,909 | | | | 627,117 | |
Time Warner, Inc. | | | | | | | 1,550 | | | | 152,350 | |
Walt Disney Co. (The) | | | | | | | 440 | | | | 43,036 | |
| | | | | | | | | | | | |
| | | | | | | | | | | 3,020,119 | |
| | | | | | | | | | | | |
Multiline Retail – 0.6% | | | | | | | | | | | | |
Dollarama, Inc. | | | | | | | 6,110 | | | | 680,147 | |
Next PLC | | | | | | | 9,310 | | | | 608,563 | |
| | | | | | | | | | | | |
| | | | | | | | | | | 1,288,710 | |
| | | | | | | | | | | | |
Specialty Retail – 0.3% | | | | | | | | | | | | |
Best Buy Co., Inc. | | | | | | | 11,408 | | | | 638,620 | |
Home Depot, Inc. (The) | | | | | | | 514 | | | | 85,211 | |
| | | | | | | | | | | | |
| | | | | | | | | | | 723,831 | |
| | | | | | | | | | | | |
Textiles, Apparel & Luxury Goods – 0.7% | | | | | | | | | | | | |
Coats Group PLC | | | | | | | 327,080 | | | | 371,639 | |
HUGO BOSS AG | | | | | | | 7,757 | | | | 693,781 | |
Ralph Lauren Corp. | | | | | | | 4,970 | | | | 444,467 | |
| | | | | | | | | | | | |
| | | | | | | | | | | 1,509,887 | |
| | | | | | | | | | | | |
| | | | | | | | | | | 14,727,147 | |
| | | | | | | | | | | | |
| | |
| 20 | AB ALL MARKET ALTERNATIVE RETURN PORTFOLIO | | abfunds.com |
CONSOLIDATED PORTFOLIO OF INVESTMENTS (continued)
| | | | | | | | | | | | |
| Company | | | | | Shares | | | U.S. $ Value | |
| | | | | |
| | | | | | | | | | | | |
Consumer Staples – 4.2% | | | | | | | | | | | | |
Beverages – 0.1% | | | | | | | | | | | | |
Coca-Cola Co. (The) | | | | | | | 2,050 | | | $ | 94,259 | |
| | | | | | | | | | | | |
| | | |
Food & Staples Retailing – 0.5% | | | | | | | | | | | | |
Distribuidora Internacional de Alimentacion SA | | | | | | | 89,402 | | | | 437,264 | |
J Sainsbury PLC | | | | | | | 212,898 | | | | 685,579 | |
Wal-Mart Stores, Inc. | | | | | | | 1,332 | | | | 116,297 | |
| | | | | | | | | | | | |
| | | | | | | | | | | 1,239,140 | |
| | | | | | | | | | | | |
Food Products – 1.6% | | | | | | | | | | | | |
a2 Milk Co., Ltd./New Zealand(a) | | | | | | | 65,890 | | | | 391,190 | |
a2 Milk Co., Ltd./Australia(a) | | | | | | | 32,260 | | | | 188,592 | |
Archer-Daniels-Midland Co. | | | | | | | 16,600 | | | | 678,442 | |
Bunge Ltd. | | | | | | | 10,280 | | | | 707,058 | |
Campbell Soup Co. | | | | | | | 14,115 | | | | 668,627 | |
Conagra Brands, Inc. | | | | | | | 17,110 | | | | 584,478 | |
Nestle SA (REG) | | | | | | | 3,340 | | | | 281,023 | |
Tyson Foods, Inc. – Class A | | | | | | | 2,434 | | | | 177,463 | |
| | | | | | | | | | | | |
| | | | | | | | | | | 3,676,873 | |
| | | | | | | | | | | | |
| | | |
Household Products – 0.5% | | | | | | | | | | | | |
Procter & Gamble Co. (The) | | | | | | | 14,306 | | | | 1,235,180 | |
| | | | | | | | | | | | |
| | | |
Personal Products – 0.6% | | | | | | | | | | | | |
Best World International Ltd. | | | | | | | 257,900 | | | | 281,357 | |
Estee Lauder Cos., Inc. (The) – Class A | | | | | | | 6,620 | | | | 740,182 | |
Nu Skin Enterprises, Inc. – Class A | | | | | | | 4,410 | | | | 280,520 | |
| | | | | | | | | | | | |
| | | | | | | | | | | 1,302,059 | |
| | | | | | | | | | | | |
Tobacco – 0.9% | | | | | | | | | | | | |
Altria Group, Inc. | | | | | | | 15,750 | | | | 1,011,465 | |
Philip Morris International, Inc. | | | | | | | 9,900 | | | | 1,035,936 | |
| | | | | | | | | | | | |
| | | | | | | | | | | 2,047,401 | |
| | | | | | | | | | | | |
| | | | | | | | | | | 9,594,912 | |
| | | | | | | | | | | | |
Materials – 3.4% | | | | | | | | | | | | |
Chemicals – 1.3% | | | | | | | | | | | | |
Covestro AG(b) | | | | | | | 8,576 | | | | 824,407 | |
Methanex Corp. | | | | | | | 13,830 | | | | 673,973 | |
Mitsubishi Gas Chemical Co., Inc. | | | | | | | 29,800 | | | | 728,987 | |
Orica Ltd. | | | | | | | 39,660 | | | | 635,240 | |
Tosoh Corp. | | | | | | | 8,600 | | | | 185,594 | |
| | | | | | | | | | | | |
| | | | | | | | | | | 3,048,201 | |
| | | | | | | | | | | | |
| | | |
Construction Materials – 0.2% | | | | | | | | | | | | |
Forterra PLC(b) | | | | | | | 88,430 | | | | 352,345 | |
| | | | | | | | | | | | |
| | | |
Containers & Packaging – 0.1% | | | | | | | | | | | | |
CCL Industries, Inc. – Class B | | | | | | | 7,280 | | | | 350,880 | |
| | | | | | | | | | | | |
| | |
| abfunds.com | | AB ALL MARKET ALTERNATIVE RETURN PORTFOLIO | 21 |
CONSOLIDATED PORTFOLIO OF INVESTMENTS (continued)
| | | | | | | | | | | | |
| Company | | | | | Shares | | | U.S. $ Value | |
| | | | | |
| | | | | | | | | | | | |
Metals & Mining – 1.8% | | | | | | | | | | | | |
Anglo American PLC | | | | | | | 38,350 | | | $ | 723,396 | |
Barrick Gold Corp. (Toronto) | | | | | | | 8,540 | | | | 123,390 | |
BlueScope Steel Ltd. | | | | | | | 14,437 | | | | 142,133 | |
Ferrexpo PLC | | | | | | | 68,090 | | | | 229,883 | |
IAMGOLD Corp.(a) | | | | | | | 30,040 | | | | 164,858 | |
KAZ Minerals PLC(a) | | | | | | | 24,600 | | | | 265,618 | |
Kinross Gold Corp.(a) | | | | | | | 151,820 | | | | 600,172 | |
Lundin Mining Corp. | | | | | | | 43,750 | | | | 333,695 | |
Newmont Mining Corp. | | | | | | | 8,170 | | | | 295,427 | |
Norsk Hydro ASA | | | | | | | 35,200 | | | | 272,390 | |
Taseko Mines Ltd.(a) | | | | | | | 143,550 | | | | 314,895 | |
Teck Resources Ltd. – Class B | | | | | | | 31,450 | | | | 642,603 | |
| | | | | | | | | | | | |
| | | | | | | | | | | 4,108,460 | |
| | | | | | | | | | | | |
| | | | | | | | | | | 7,859,886 | |
| | | | | | | | | | | | |
Energy – 2.1% | | | | | | | | | | | | |
Energy Equipment & Services – 0.5% | | | | | | | | | | | | |
TechnipFMC PLC(a) | | | | | | | 24,450 | | | | 669,686 | |
Trican Well Service Ltd.(a) | | | | | | | 99,400 | | | | 373,684 | |
| | | | | | | | | | | | |
| | | | | | | | | | | 1,043,370 | |
| | | | | | | | | | | | |
Oil, Gas & Consumable Fuels – 1.6% | | | | | | | | | | | | |
Chevron Corp. | | | | | | | 1,355 | | | | 157,031 | |
China Aviation Oil Singapore Corp., Ltd. | | | | | | | 216,500 | | | | 281,266 | |
Enerplus Corp. | | | | | | | 5,880 | | | | 53,919 | |
Exxon Mobil Corp. | | | | | | | 6,480 | | | | 540,108 | |
HollyFrontier Corp. | | | | | | | 17,040 | | | | 629,628 | |
Marathon Petroleum Corp. | | | | | | | 13,390 | | | | 799,918 | |
Royal Dutch Shell PLC – Class A | | | | | | | 5,570 | | | | 175,342 | |
Valero Energy Corp. | | | | | | | 10,428 | | | | 822,665 | |
Whitehaven Coal Ltd.(a) | | | | | | | 95,570 | | | | 273,160 | |
| | | | | | | | | | | | |
| | | | | | | | | | | 3,733,037 | |
| | | | | | | | | | | | |
| | | | | | | | | | | 4,776,407 | |
| | | | | | | | | | | | |
Utilities – 1.4% | | | | | | | | | | | | |
Electric Utilities – 0.5% | | | | | | | | | | | | |
Power Assets Holdings Ltd. | | | | | | | 69,000 | | | | 598,169 | |
Tokyo Electric Power Co. Holdings, Inc.(a) | | | | | | | 154,400 | | | | 633,753 | |
| | | | | | | | | | | | |
| | | | | | | | | | | 1,231,922 | |
| | | | | | | | | | | | |
Independent Power and Renewable Electricity Producers – 0.1% | | | | | | | | | | | | |
Drax Group PLC | | | | | | | 32,940 | | | | 121,527 | |
| | | | | | | | | | | | |
| | | |
Multi-Utilities – 0.8% | | | | | | | | | | | | |
CenterPoint Energy, Inc. | | | | | | | 23,287 | | | | 688,829 | |
Centrica PLC | | | | | | | 198,953 | | | | 448,673 | |
RWE AG(a) | | | | | | | 30,080 | | | | 756,327 | |
| | | | | | | | | | | | |
| | | | | | | | | | | 1,893,829 | |
| | | | | | | | | | | | |
| | | | | | | | | | | 3,247,278 | |
| | | | | | | | | | | | |
| | |
| 22 | AB ALL MARKET ALTERNATIVE RETURN PORTFOLIO | | abfunds.com |
CONSOLIDATED PORTFOLIO OF INVESTMENTS (continued)
| | | | | | | | | | | | |
| Company | | | | | Shares | | | U.S. $ Value | |
| | | | | |
| | | | | | | | | | | | |
Real Estate – 1.3% | | | | | | | | | | | | |
Equity Real Estate Investment
Trusts (REITs) – 0.8% | | | | | | | | | | | | |
Colony NorthStar, Inc. – Class A | | | | | | | 57,160 | | | $ | 701,925 | |
Equinix, Inc. | | | | | | | 1,620 | | | | 750,870 | |
Iron Mountain, Inc. | | | | | | | 10,760 | | | | 430,400 | |
| | | | | | | | | | | | |
| | | | | | | | | | | 1,883,195 | |
| | | | | | | | | | | | |
Real Estate Management & Development – 0.5% | | | | | | | | | | | | |
Kerry Properties Ltd. | | | | | | | 154,000 | | | | 693,046 | |
Yanlord Land Group Ltd. | | | | | | | 232,900 | | | | 306,043 | |
| | | | | | | | | | | | |
| | | | | | | | | | | 999,089 | |
| | | | | | | | | | | | |
| | | | | | | | | | | 2,882,284 | |
| | | | | | | | | | | | |
Telecommunication Services – 0.1% | | | | | | | | | | | | |
Diversified Telecommunication Services – 0.1% | | | | | | | | | | | | |
AT&T, Inc. | | | | | | | 5,404 | | | | 181,845 | |
Verizon Communications, Inc. | | | | | | | 2,101 | | | | 100,575 | |
| | | | | | | | | | | | |
| | | | | | | | | | | 282,420 | |
| | | | | | | | | | | | |
Total Common Stocks
(cost $105,650,621) | | | | | | | | | | | 110,681,986 | |
| | | | | | | | | | | | |
| | | |
| | | | | | Notional
Amount
(000) | | | | |
OPTIONS PURCHASED – PUTS – 0.0% | | | | | | | | | | | | |
Swaptions – 0.0% | | | | | | | | | | | | |
IRS Swaption
Expiration: Jan 2018;
Contracts: 12,000,000;
Exercise Rate: 2.43%;
Counterparty: Citibank, NA(a) | | | USD | | | | 12,000,000 | | | | 11,837 | |
IRS Swaption
Expiration: Jan 2018;
Contracts: 10,900,000;
Exercise Rate: 2.45%;
Counterparty: Citibank, NA(a) | | | USD | | | | 10,900,000 | | | | 10,094 | |
| | | | | | | | | | | | |
| | | |
Total Options Purchased – Puts
(premiums paid $45,211) | | | | | | | | | | | 21,931 | |
| | | | | | | | | | | | |
| | | |
| | | | | | Principal
Amount
(000) | | | | |
SHORT-TERM INVESTMENTS – 43.2% | | | | | | | | | | | | |
Governments – Treasuries – 19.3% | | | | | | | | | | | | |
Japan – 19.3% | | | | | | | | | | | | |
Japan Treasury Discount Bill
Series 707
Zero Coupon, 12/11/17
(cost $46,450,435) | | | JPY | | | | 5,038,000 | | | | 44,317,552 | |
| | | | | | | | | | | | |
| | |
| abfunds.com | | AB ALL MARKET ALTERNATIVE RETURN PORTFOLIO | 23 |
CONSOLIDATED PORTFOLIO OF INVESTMENTS (continued)
| | | | | | | | | | | | |
| Company | | | | | Shares | | | U.S. $ Value | |
| | | | | |
| | | | | | | | | | | | |
Investment Companies – 17.3% | | | | | | | | | | | | |
AB Fixed Income Shares, Inc. – Government Money Market Portfolio – Class AB, 0.85%(c)(d)(e)
(cost $39,743,114) | | | | | | | 39,743,114 | | | $ | 39,743,114 | |
| | | | | | | | | | | | |
| | | |
| | | | | | Principal
Amount
(000) | | | | |
U.S. Treasury Bills – 6.6% | | | | | | | | | | | | |
U.S. Treasury Bill | | | | | | | | | | | | |
Zero Coupon, 11/16/17-1/25/18 | | | $ | | | | 2,000 | | | | 1,996,983 | |
Zero Coupon, 11/24/17-12/28/17(f) | | | | | | | 13,000 | | | | 12,987,156 | |
| | | | | | | | | | | | |
| | | |
Total U.S. Treasury Bills
(cost $14,984,139) | | | | | | | | | | | 14,984,139 | |
| | | | | | | | | | | | |
| | | |
Total Short-Term Investments
(cost $101,177,688) | | | | | | | | | | | 99,044,805 | |
| | | | | | | | | | | | |
| | | |
Total Investments – 91.5%
(cost $206,873,520) | | | | | | | | | | | 209,748,722 | |
Other assets less liabilities – 8.5% | | | | | | | | | | | 19,570,155 | |
| | | | | | | | | | | | |
| | | |
Net Assets – 100.0% | | | | | | | | | | $ | 229,318,877 | |
| | | | | | | | | | | | |
FUTURES (see Note D)
| | | | | | | | | | | | | | | | | | | | | | | | |
| Description | | Number of
Contracts | | | Expiration
Month | | | Notional (000) | | | Original
Value | | | Value at
October 31,
2017 | | | Unrealized
Appreciation/
(Depreciation) | |
Purchased Contracts | | | | | | | | | | | | | | | | | | | | | |
10 Yr Canadian Bond Futures | | | 595 | | | | December 2017 | | | CAD | 59,500 | | | $ | 63,327,847 | | | $ | 63,383,342 | | | $ | 55,495 | |
Amsterdam Index Futures | | | 17 | | | | November 2017 | | | EUR | 3 | | | | 2,158,704 | | | | 2,184,803 | | | | 26,099 | |
CAC 40 10 Euro Futures | | | 99 | | | | November 2017 | | | EUR | 1 | | | | 6,187,595 | | | | 6,344,335 | | | | 156,740 | |
DAX Index Futures | | | 15 | | | | December 2017 | | | EUR | – 0 | –** | | | 5,539,737 | | | | 5,775,615 | | | | 235,878 | |
FTSE 100 Index Futures | | | 161 | | | | December 2017 | | | GBP | 2 | | | | 15,792,247 | | | | 15,967,916 | | | | 175,669 | |
FTSE/MIB Index Futures | | | 11 | | | | December 2017 | | | EUR | – 0 | –** | | | 1,423,536 | | | | 1,459,056 | | | | 35,520 | |
IBEX 35 Index Futures | | | 16 | | | | November 2017 | | | EUR | – 0 | –** | | | 1,895,493 | | | | 1,965,409 | | | | 69,916 | |
LME Copper Futures | | | 14 | | | | December 2017 | | | USD | – 0 | –** | | | 2,254,933 | | | | 2,390,938 | | | | 136,005 | |
LME Lead Futures | | | 62 | | | | November 2017 | | | USD | 2 | | | | 3,855,872 | | | | 3,734,725 | | | | (121,147 | ) |
LME Nickel Futures | | | 28 | | | | November 2017 | | | USD | – 0 | –** | | | 1,833,626 | | | | 2,059,932 | | | | 226,306 | |
LME Primary Aluminum Futures | | | 83 | | | | November 2017 | | | USD | 2 | | | | 4,426,742 | | | | 4,453,469 | | | | 26,727 | |
LME Tin Futures | | | 43 | | | | November 2017 | | | USD | – 0 | –** | | | 4,417,289 | | | | 4,187,125 | | | | (230,164 | ) |
| | |
| 24 | AB ALL MARKET ALTERNATIVE RETURN PORTFOLIO | | abfunds.com |
CONSOLIDATED PORTFOLIO OF INVESTMENTS (continued)
| | | | | | | | | | | | | | | | | | | | | | | | |
| Description | | Number of
Contracts | | | Expiration
Month | | | Notional (000) | | | Original
Value | | | Value at
October 31,
2017 | | | Unrealized
Appreciation/
(Depreciation) | |
LME Zinc Futures | | | 42 | | | | November 2017 | | | USD | 1 | | | $ | 2,951,829 | | | $ | 3,474,450 | | | $ | 522,621 | |
MSCI Singapore IX ETS Futures | | | 982 | | | | November 2017 | | | SGD | 98 | | | | 26,837,143 | | | | 27,300,191 | | | | 463,048 | |
TOPIX Index Futures | | | 158 | | | | December 2017 | | | JPY | 1,580 | | | | 22,242,309 | | | | 24,497,955 | | | | 2,255,646 | |
U.S. T-Note 10 Yr (CBT) Futures | | | 275 | | | | December 2017 | | | USD | 27,500 | | | | 34,474,440 | | | | 34,357,813 | | | | (116,627 | ) |
| | | | | |
Sold Contracts | | | | | | | | | | | | | | | | | | | | | |
10 Yr Australian Bond Futures | | | 222 | | | | December 2017 | | | AUD | 22,200 | | | | 21,680,629 | | | | 21,893,120 | | | | (212,491 | ) |
10 Yr Japan Bond (OSE) Futures | | | 77 | | | | December 2017 | | | JPY | 7,700,000 | | | | 101,992,195 | | | | 101,896,926 | | | | 95,269 | |
Euro-Bund Futures | | | 292 | | | | December 2017 | | | EUR | 29,200 | | | | 55,375,644 | | | | 55,357,143 | | | | 18,501 | |
Hang Seng Index Futures | | | 35 | | | | November 2017 | | | HKD | 2 | | | | 6,309,659 | | | | 6,325,788 | | | | (16,129 | ) |
LME Copper Futures | | | 14 | | | | December 2017 | | | USD | – 0 | –** | | | 2,285,201 | | | | 2,390,938 | | | | (105,737 | ) |
LME Lead Futures | | | 62 | | | | November 2017 | | | USD | 2 | | | | 3,650,706 | | | | 3,734,725 | | | | (84,019 | ) |
LME Nickel Futures | | | 28 | | | | November 2017 | | | USD | – 0 | –** | | | 1,756,155 | | | | 2,059,932 | | | | (303,777 | ) |
LME Primary Aluminum Futures | | | 83 | | | | November 2017 | | | USD | 2 | | | | 3,964,035 | | | | 4,453,469 | | | | (489,434 | ) |
LME Tin Futures | | | 43 | | | | November 2017 | | | USD | – 0 | –** | | | 4,434,759 | | | | 4,187,125 | | | | 247,634 | |
LME Zinc Futures | | | 42 | | | | November 2017 | | | USD | 1 | | | | 3,388,783 | | | | 3,474,450 | | | | (85,667 | ) |
Long Gilt Futures | | | 19 | | | | December 2017 | | | GBP | 1,900 | | | | 3,195,973 | | | | 3,137,449 | | | | 58,524 | |
Mini MSCI EAFE Futures | | | 417 | | | | December 2017 | | | USD | 21 | | | | 41,156,801 | | | | 41,854,290 | | | | (697,489 | ) |
OMXS 30 Index Futures | | | 334 | | | | November 2017 | | | SEK | 33 | | | | 6,508,205 | | | | 6,661,727 | | | | (153,522 | ) |
| | |
| abfunds.com | | AB ALL MARKET ALTERNATIVE RETURN PORTFOLIO | 25 |
CONSOLIDATED PORTFOLIO OF INVESTMENTS (continued)
| | | | | | | | | | | | | | | | | | | | | | | | |
| Description | | Number of
Contracts | | | Expiration
Month | | | Notional (000) | | | Original
Value | | | Value at
October 31,
2017 | | | Unrealized
Appreciation/
(Depreciation) | |
S&P 500 E-Mini Futures | | | 584 | | | | December 2017 | | | USD | 29 | | | $ | 72,423,333 | | | $ | 75,122,840 | | | $ | (2,699,507 | ) |
S&P/TSX 60 Index Futures | | | 272 | | | | December 2017 | | | CAD | 54 | | | | 37,310,177 | | | | 39,873,374 | | | | (2,563,197 | ) |
SPI 200 Futures | | | 223 | | | | December 2017 | | | AUD | 6 | | | | 24,315,969 | | | | 25,123,068 | | | | (807,099 | ) |
| | | | | | | | | | | | | | | | | | | | | | | | |
| | | | | | | | | | | | | | | | | | | | | | $ | (3,880,408 | ) |
| | | | | | | | | | | | | | | | | | | | | | | | |
FORWARD CURRENCY EXCHANGE CONTRACTS (see Note D)
| | | | | | | | | | | | | | | | | | | | | | | | |
| Counterparty | | Contracts to Deliver (000) | | | In Exchange For (000) | | | Settlement Date | | | Unrealized Appreciation/
(Depreciation) | |
Bank of America, NA | | | BRL | | | | 36,174 | | | �� | USD | | | | 11,376 | | | | 11/03/17 | | | $ | 318,163 | |
Bank of America, NA | | | USD | | | | 11,039 | | | | BRL | | | | 36,174 | | | | 11/03/17 | | | | 18,897 | |
Bank of America, NA | | | IDR | | | | 291,758,244 | | | | USD | | | | 21,540 | | | | 11/16/17 | | | | 44,879 | |
Bank of America, NA | | | USD | | | | 11,520 | | | | RUB | | | | 667,717 | | | | 11/22/17 | | | | (121,121 | ) |
Bank of America, NA | | | BRL | | | | 31,769 | | | | USD | | | | 10,172 | | | | 12/04/17 | | | | 499,489 | |
Bank of America, NA | | | USD | | | | 32,588 | | | | PHP | | | | 1,664,915 | | | | 12/13/17 | | | | (487,236 | ) |
Bank of America, NA | | | AUD | | | | 723 | | | | USD | | | | 571 | | | | 12/18/17 | | | | 17,465 | |
Bank of America, NA | | | CHF | | | | 27,497 | | | | USD | | | | 29,053 | | | | 12/18/17 | | | | 1,404,606 | |
Bank of America, NA | | | CLP | | | | 834,248 | | | | USD | | | | 1,347 | | | | 12/18/17 | | | | 37,292 | |
Bank of America, NA | | | COP | | | | 1,030,817 | | | | USD | | | | 350 | | | | 12/18/17 | | | | 12,499 | |
Bank of America, NA | | | CZK | | | | 558,219 | | | | USD | | | | 25,838 | | | | 12/18/17 | | | | 425,342 | |
Bank of America, NA | | | GBP | | | | 20,355 | | | | USD | | | | 26,973 | | | | 12/18/17 | | | | (99,230 | ) |
Bank of America, NA | | | HUF | | | | 2,234,868 | | | | USD | | | | 8,773 | | | | 12/18/17 | | | | 394,913 | |
Bank of America, NA | | | PHP | | | | 93,560 | | | | USD | | | | 1,804 | | | | 12/18/17 | | | | 1,062 | |
Bank of America, NA | | | PLN | | | | 161,186 | | | | USD | | | | 43,909 | | | | 12/18/17 | | | | (382,091 | ) |
Bank of America, NA | | | SEK | | | | 137,797 | | | | USD | | | | 17,480 | | | | 12/18/17 | | | | 974,154 | |
Bank of America, NA | | | USD | | | | 1,569 | | | | GBP | | | | 1,189 | | | | 12/18/17 | | | | 12,889 | |
Bank of America, NA | | | USD | | | | 966 | | | | GBP | | | | 711 | | | | 12/18/17 | | | | (20,506 | ) |
Bank of America, NA | | | USD | | | | 23,856 | | | | JPY | | | | 2,675,552 | | | | 12/18/17 | | | | (273,256 | ) |
Bank of America, NA | | | USD | | | | 28,866 | | | | MXN | | | | 524,346 | | | | 12/18/17 | | | | (1,729,285 | ) |
Bank of America, NA | | | USD | | | | 19,555 | | | | NOK | | | | 150,719 | | | | 12/18/17 | | | | (1,081,353 | ) |
Bank of America, NA | | | USD | | | | 15,391 | | | | TRY | | | | 56,126 | | | | 12/18/17 | | | | (797,795 | ) |
Bank of America, NA | | | USD | | | | 2,257 | | | | ZAR | | | | 31,138 | | | | 12/18/17 | | | | (71,592 | ) |
Bank of America, NA | | | JPY | | | | 5,040,564 | | | | USD | | | | 46,835 | | | | 12/22/17 | | | | 2,396,069 | |
Barclays Bank PLC | | | USD | | | | 23,757 | | | | IDR | | | | 313,598,065 | | | | 11/16/17 | | | | (653,355 | ) |
Barclays Bank PLC | | | TWD | | | | 1,035,837 | | | | USD | | | | 34,710 | | | | 11/22/17 | | | | 297,099 | |
Barclays Bank PLC | | | INR | | | | 68,090 | | | | USD | | | | 1,036 | | | | 11/29/17 | | | | (13,541 | ) |
Barclays Bank PLC | | | USD | | | | 22,179 | | | | INR | | | | 1,429,046 | | | | 11/29/17 | | | | (151,785 | ) |
Barclays Bank PLC | | | AUD | | | | 52,867 | | | | USD | | | | 41,240 | | | | 12/18/17 | | | | 795,752 | |
Barclays Bank PLC | | | CAD | | | | 6,693 | | | | USD | | | | 5,403 | | | | 12/18/17 | | | | 212,573 | |
Barclays Bank PLC | | | HKD | | | | 16,556 | | | | USD | | | | 2,125 | | | | 12/18/17 | | | | 914 | |
Barclays Bank PLC | | | NZD | | | | 45,671 | | | | USD | | | | 32,541 | | | | 12/18/17 | | | | 1,313,897 | |
Barclays Bank PLC | | | USD | | | | 11,835 | | | | EUR | | | | 10,071 | | | | 12/18/17 | | | | (72,856 | ) |
Barclays Bank PLC | | | ZAR | | | | 260,664 | | | | USD | | | | 19,873 | | | | 12/18/17 | | | | 1,582,034 | |
BNP Paribas SA | | | CAD | | | | 4,545 | | | | USD | | | | 3,747 | | | | 12/18/17 | | | | 222,448 | |
BNP Paribas SA | | | GBP | | | | 811 | | | | USD | | | | 1,063 | | | | 12/18/17 | | | | (15,386 | ) |
BNP Paribas SA | | | HUF | | | | 332,485 | | | | USD | | | | 1,252 | | | | 12/18/17 | | | | 5,447 | |
BNP Paribas SA | | | JPY | | | | 106,829 | | | | USD | | | | 987 | | | | 12/18/17 | | | | 45,235 | |
BNP Paribas SA | | | USD | | | | 36,102 | | | | AUD | | | | 44,722 | | | | 12/18/17 | | | | (1,889,356 | ) |
| | |
| 26 | AB ALL MARKET ALTERNATIVE RETURN PORTFOLIO | | abfunds.com |
CONSOLIDATED PORTFOLIO OF INVESTMENTS (continued)
| | | | | | | | | | | | | | | | | | | | | | | | |
| Counterparty | | Contracts to Deliver (000) | | | In Exchange For (000) | | | Settlement Date | | | Unrealized Appreciation/
(Depreciation) | |
BNP Paribas SA | | | USD | | | | 22,098 | | | | NZD | | | | 30,361 | | | | 12/18/17 | | | $ | (1,339,595 | ) |
Credit Suisse International | | | USD | | | | 9,545 | | | | BRL | | | | 30,560 | | | | 12/04/17 | | | | (240,892 | ) |
Credit Suisse International | | | PEN | | | | 141,480 | | | | USD | | | | 43,462 | | | | 12/07/17 | | | | 3,671 | |
Credit Suisse International | | | NOK | | | | 148,445 | | | | USD | | | | 18,625 | | | | 12/18/17 | | | | 429,376 | |
Credit Suisse International | | | USD | | | | 3,583 | | | | NZD | | | | 4,935 | | | | 12/18/17 | | | | (208,235 | ) |
Credit Suisse International | | | USD | | | | 19,809 | | | | SEK | | | | 160,239 | | | | 12/18/17 | | | | (614,881 | ) |
Credit Suisse International | | | USD | | | | 6,624 | | | | TRY | | | | 25,087 | | | | 1/11/18 | | | | (146,680 | ) |
Deutsche Bank AG | | | BRL | | | | 36,174 | | | | USD | | | | 11,039 | | | | 11/03/17 | | | | (18,897 | ) |
Deutsche Bank AG | | | USD | | | | 10,965 | | | | BRL | | | | 36,174 | | | | 11/03/17 | | | | 92,849 | |
Deutsche Bank AG | | | BRL | | | | 36,174 | | | | USD | | | | 10,922 | | | | 12/04/17 | | | | (90,612 | ) |
Deutsche Bank AG | | | CLP | | | | 4,042,607 | | | | USD | | | | 6,499 | | | | 12/07/17 | | | | 149,777 | |
Deutsche Bank AG | | | COP | | | | 32,896,678 | | | | USD | | | | 11,139 | | | | 12/07/17 | | | | 360,257 | |
Deutsche Bank AG | | | JPY | | | | 70,956 | | | | USD | | | | 644 | | | | 12/18/17 | | | | 18,663 | |
Deutsche Bank AG | | | USD | | | | 18,181 | | | | CHF | | | | 17,703 | | | | 12/18/17 | | | | (381,032 | ) |
Goldman Sachs Bank USA | | | USD | | | | 10,543 | | | | RUB | | | | 610,746 | | | | 11/22/17 | | | | (116,366 | ) |
Goldman Sachs Bank USA | | | AUD | | | | 4,001 | | | | USD | | | | 3,184 | | | | 12/18/17 | | | | 123,038 | |
Goldman Sachs Bank USA | | | CAD | | | | 1,045 | | | | USD | | | | 839 | | | | 12/18/17 | | | | 28,208 | |
Goldman Sachs Bank USA | | | HKD | | | | 11,568 | | | | USD | | | | 1,482 | | | | 12/18/17 | | | | (1,539 | ) |
Goldman Sachs Bank USA | | | USD | | | | 6,716 | | | | CAD | | | | 8,355 | | | | 12/18/17 | | | | (237,158 | ) |
Goldman Sachs Bank USA | | | USD | | | | 16,922 | | | | CZK | | | | 371,487 | | | | 12/18/17 | | | | (11,033 | ) |
Goldman Sachs Bank USA | | | USD | | | | 3,699 | | | | GBP | | | | 2,798 | | | | 12/18/17 | | | | 22,677 | |
Goldman Sachs Bank USA | | | USD | | | | 1,485 | | | | HKD | | | | 11,568 | | | | 12/18/17 | | | | (854 | ) |
Goldman Sachs Bank USA | | | USD | | | | 8,778 | | | | JPY | | | | 951,506 | | | | 12/18/17 | | | | (391,393 | ) |
Goldman Sachs Bank USA | | | USD | | | | 1,826 | | | | PHP | | | | 93,559 | | | | 12/18/17 | | | | (23,379 | ) |
Goldman Sachs Bank USA | | | USD | | | | 34,453 | | | | PLN | | | | 122,198 | | | | 12/18/17 | | | | (875,766 | ) |
Goldman Sachs Bank USA | | | USD | | | | 9,578 | | | | TRY | | | | 33,501 | | | | 12/18/17 | | | | (867,238 | ) |
Nomura Global Financial Products, Inc. | | | SEK | | | | 206,186 | | | | USD | | | | 25,926 | | | | 12/18/17 | | | | 1,228,123 | |
Nomura Global Financial Products, Inc. | | | USD | | | | 901 | | | | NZD | | | | 1,223 | | | | 12/18/17 | | | | (65,152 | ) |
Standard Chartered Bank | | | IDR | | | | 291,758,244 | | | | USD | | | | 21,526 | | | | 11/16/17 | | | | 30,576 | |
Standard Chartered Bank | | | USD | | | | 16,335 | | | | CNY | | | | 108,484 | | | | 11/16/17 | | | | 11,496 | |
Standard Chartered Bank | | | USD | | | | 15,617 | | | | CNY | | | | 103,087 | | | | 11/16/17 | | | | (83,678 | ) |
Standard Chartered Bank | | | USD | | | | 13,100 | | | | TWD | | | | 397,526 | | | | 11/22/17 | | | | 106,568 | |
Standard Chartered Bank | | | PHP | | | | 1,958,476 | | | | USD | | | | 37,890 | | | | 12/13/17 | | | | 130,038 | |
State Street Bank & Trust Co. | | | AUD | | | | 1,259 | | | | USD | | | | 980 | | | | 12/18/17 | | | | 17,255 | |
State Street Bank & Trust Co. | | | CAD | | | | 1,768 | | | | USD | | | | 1,418 | | | | 12/18/17 | | | | 46,932 | |
| | |
| abfunds.com | | AB ALL MARKET ALTERNATIVE RETURN PORTFOLIO | 27 |
CONSOLIDATED PORTFOLIO OF INVESTMENTS (continued)
| | | | | | | | | | | | | | | | | | | | | | | | |
| Counterparty | | Contracts to Deliver (000) | | | In Exchange For (000) | | | Settlement Date | | | Unrealized Appreciation/
(Depreciation) | |
State Street Bank & Trust Co. | | | EUR | | | | 2,215 | | | | USD | | | | 2,658 | | | | 12/18/17 | | | $ | 71,109 | |
State Street Bank & Trust Co. | | | GBP | | | | 276 | | | | USD | | | | 365 | | | | 12/18/17 | | | | (1,787 | ) |
State Street Bank & Trust Co. | | | HKD | | | | 826 | | | | USD | | | | 106 | | | | 12/18/17 | | | | 41 | |
State Street Bank & Trust Co. | | | HUF | | | | 72,541 | | | | USD | | | | 287 | | | | 12/18/17 | | | | 14,818 | |
State Street Bank & Trust Co. | | | JPY | | | | 91,442 | | | | USD | | | | 823 | | | | 12/18/17 | | | | 17,389 | |
State Street Bank & Trust Co. | | | NOK | | | | 3,085 | | | | USD | | | | 396 | | | | 12/18/17 | | | | 17,467 | |
State Street Bank & Trust Co. | | | NZD | | | | 1,097 | | | | USD | | | | 787 | | | | 12/18/17 | | | | 36,659 | |
State Street Bank & Trust Co. | | | SEK | | | | 7,904 | | | | USD | | | | 995 | | | | 12/18/17 | | | | 48,294 | |
State Street Bank & Trust Co. | | | SGD | | | | 584 | | | | USD | | | | 431 | | | | 12/18/17 | | | | 2,160 | |
State Street Bank & Trust Co. | | | THB | | | | 1,027,418 | | | | USD | | | | 31,064 | | | | 12/18/17 | | | | 132,273 | |
State Street Bank & Trust Co. | | | USD | | | | 579 | | | | AUD | | | | 718 | | | | 12/18/17 | | | | (29,747 | ) |
State Street Bank & Trust Co. | | | USD | | | | 227 | | | | CAD | | | | 290 | | | | 12/18/17 | | | | (1,680 | ) |
State Street Bank & Trust Co. | | | USD | | | | 188 | | | | CHF | | | | 178 | | | | 12/18/17 | | | | (8,526 | ) |
State Street Bank & Trust Co. | | | USD | | | | 8,796 | | | | EUR | | | | 7,314 | | | | 12/18/17 | | | | (253,660 | ) |
State Street Bank & Trust Co. | | | USD | | | | 358 | | | | GBP | | | | 276 | | | | 12/18/17 | | | | 8,950 | |
State Street Bank & Trust Co. | | | USD | | | | 106 | | | | HKD | | | | 826 | | | | 12/18/17 | | | | (64 | ) |
State Street Bank & Trust Co. | | | USD | | | | 1,095 | | | | JPY | | | | 122,070 | | | | 12/18/17 | | | | (19,286 | ) |
State Street Bank & Trust Co. | | | USD | | | | 503 | | | | NOK | | | | 3,953 | | | | 12/18/17 | | | | (18,668 | ) |
State Street Bank & Trust Co. | | | USD | | | | 848 | | | | NZD | | | | 1,176 | | | | 12/18/17 | | | | (44,345 | ) |
State Street Bank & Trust Co. | | | USD | | | | 1,336 | | | | SEK | | | | 10,573 | | | | 12/18/17 | | | | (69,980 | ) |
State Street Bank & Trust Co. | | | USD | | | | 24 | | | | SGD | | | | 33 | | | | 12/18/17 | | | | (32 | ) |
State Street Bank & Trust Co. | | | USD | | | | 54,784 | | | | THB | | | | 1,824,494 | | | | 12/18/17 | | | | 144,986 | |
State Street Bank & Trust Co. | | | USD | | | | 16,211 | | | | KRW | | | | 18,355,252 | | | | 1/18/18 | | | | 212,414 | |
| | | | | | | | | | | | | | | | | | | | | | | | |
| | | | | | | | | | | | | | | | | | | | | | $ | 517,283 | |
| | | | | | | | | | | | | | | | | | | | | | | | |
| | |
| 28 | AB ALL MARKET ALTERNATIVE RETURN PORTFOLIO | | abfunds.com |
CONSOLIDATED PORTFOLIO OF INVESTMENTS (continued)
CENTRALLY CLEARED INTEREST RATE SWAPS (see Note D)
| | | | | | | | | | | | | | | | | | | | | | |
| | | | | | | | | Rate Type | | | | | | |
Notional
Amount
(000) | | | Termination
Date | | | Payments
made
by the Fund | | | Payments
received
by the
Fund | | | Payment
Frequency
Paid/Received | | Unrealized
Appreciation/
(Depreciation) | |
NOK | | | 232,720 | | | | 5/02/27 | | | | 6 Month NIBOR | | | | 1.901% | | | Semi-
Annual/
Annual | | $ | 142,676 | |
NOK | | | 40,760 | | | | 7/21/27 | | | | 6 Month NIBOR | | | | 1.985% | | | Semi-
Annual/
Annual | | | 48,700 | |
SEK | | | 197,380 | | | | 9/12/27 | | | | 3 Month STIBOR | | | | 1.080% | | | Quarterly/
Annual | | | (93,542 | ) |
NZD | | | 71,220 | | | | 9/12/27 | | | | 3 Month BKBM | | | | 2.993% | | | Quarterly/
Semi-
Annual | | | (552,991 | ) |
CHF | | | 12,790 | | | | 10/09/27 | | | | 0.298% | | | | 6 Month LIBOR | | | Annual/
Semi-
Annual | | | (74,327 | ) |
| | | | | | | | | | | | | | | | | | | | | | |
| | | | | | | | | | | | | | | | | | | | $ | (529,484 | ) |
| | | | | | | | | | | | | | | | | | | | | | |
TOTAL RETURN SWAPS (see Note D)
| | | | | | | | | | | | | | | | | | | | | | | | |
Counterparty &
Referenced Obligation | | # of Shares
or Units | | | Rate Paid/
Received | | | Payment
Frequency | | | Notional
Amount
(000) | | | Maturity
Date | | | Unrealized
Appreciation/
(Depreciation) | |
Receive Total Return on Reference Obligation | |
Barclays Bank PLC | |
Barclays Commodity Hedging Insights 2 Index | | | 54,695 | | | | 0.02% | | | | Quarterly | | | USD | 11,200 | | | | 10/15/18 | | | $ | (306,538 | ) |
Barclays Commodity Strategy 1673 | | | 8,599 | | | | 0.30% | | | | Quarterly | | | USD | 4,600 | | | | 10/15/18 | | | | 147,558 | |
Credit Suisse International | | | | | | | | | | | | | | | | | | | | | | | | |
Credit Suisse Custom 139 Excess Return Index | | | 32,516 | | | | 0.41% | | | | Quarterly | | | USD | 8,800 | | | | 10/15/18 | | | | (131,748 | ) |
Goldman Sachs International | | | | | | | | | | | | | | | | | | | | | | | | |
Goldman Sachs Commodity Trend 10% Volatility Target Excess Return Strategy | | | 30,935 | | | | 0.00% | | | | Quarterly | | | USD | 3,100 | | | | 10/15/18 | | | | 97,443 | |
JPMorgan Chase Bank, NA | | | | | | | | | | | | | | | | | | | | | | | | |
JPMorgan Cross Sectional Momentum R | | | 22,592 | | | | 0.48% | | | | Quarterly | | | USD | 4,900 | | | | 10/15/18 | | | | 98,615 | |
JPMorgan Index | | | 6,445 | | | | 0.60% | | | | Quarterly | | | USD | 11,099 | | | | 10/15/18 | | | | (167,799 | ) |
JPMorgan RCI-24 Index | | | 15,775 | | | | 0.50% | | | | Quarterly | | | USD | 4,300 | | | | 10/15/18 | | | | 95,817 | |
| | |
| abfunds.com | | AB ALL MARKET ALTERNATIVE RETURN PORTFOLIO | 29 |
CONSOLIDATED PORTFOLIO OF INVESTMENTS (continued)
| | | | | | | | | | | | | | | | | | | | | | | | |
Counterparty &
Referenced Obligation | | # of Shares
or Units | | | Rate Paid/
Received | | | Payment
Frequency | | | Notional
Amount
(000) | | | Maturity
Date | | | Unrealized
Appreciation/
(Depreciation) | |
Morgan Stanley Capital Services LLC | | | | | | | | | | | | | | | | | | | | | | | | |
MS Bespoke Equity Factors Gross Index | | | 245,794 | | | | 0.30% | | | | Annual | | | USD | 42,250 | | | | 7/16/18 | | | $ | 202,367 | |
MS Bespoke Equity Factors Gross Index | | | 242,985 | | | | 0.30% | | | | Annual | | | USD | 42,200 | | | | 8/15/18 | | | | (225,945 | ) |
| | | | | | | | | | | | | | | | | | | | | | | | |
| | | | | | | | | | | | | | | | | | | | | | $ | (190,230 | ) |
| | | | | | | | | | | | | | | | | | | | | | | | |
VARIANCE SWAPS (see Note D)
| | | | | | | | | | | | | | | | | | | | | | | | |
Swap Counterparty &
Referenced Obligation | | Volatility
Strike
Rate | | | Payment
Frequency | | | Notional
Amount
(000) | | | Market
Value | | | Upfront
Premiums
(Paid)
Received | | | Unrealized
Appreciation/
(Depreciation) | |
Buy Contracts | | | | | | | | | | | | | | | | | | | | | | | | |
Citibank, NA | | | | | | | | | | | | | | | | | | | | | | | | |
S&P/ASX 200 Index, 1/18/18* | | | 11.40 | % | | | Maturity | | | AUD | 6 | | | $ | 1,590 | | | $ | — | | | $ | 1,590 | |
Goldman Sachs International | | | | | | | | | | | | | | | | | | | | | | | | |
FTSE 100 Index, 1/19/18* | | | 11.96 | | | | Maturity | | | GBP | 14 | | | | (6,887 | ) | | | — | | | | (6,887 | ) |
UBS AG iShares MSCI | | | | | | | | | | | | | | | | | | | | | | | | |
Emerging Markets ETF, 1/19/18* | | | 18.00 | | | | Maturity | | | USD | 12 | | | | (15,250 | ) | | | — | | | | (15,250 | ) |
Nasdaq 100 Stock Index, 1/19/18* | | | 16.70 | | | | Maturity | | | USD | 23 | | | | 2,693 | | | | — | | | | 2,693 | |
Nikkei 225 Index, 1/12/18* | | | 18.90 | | | | Maturity | | | JPY | 1,575 | | | | (19,531 | ) | | | — | | | | (19,531 | ) |
Russell 2000 Index, 1/19/18* | | | 17.20 | | | | Maturity | | | USD | 4 | | | | 117 | | | | — | | | | 117 | |
S&P 500 Index, 1/19/18* | | | 12.90 | | | | Maturity | | | USD | 19 | | | | 5,693 | | | | — | | | | 5,693 | |
| | | | | |
Sale Contracts | | | | | | | | | | | | | | | | | | | | | |
Citibank, NA | | | | | | | | | | | | | | | | | | | | | | | | |
Nikkei 225 Index, 11/10/17* | | | 16.00 | | | | Maturity | | | JPY | 797 | | | | 33,433 | | | | — | | | | 33,433 | |
Nikkei 225 Index, 11/10/17* | | | 14.10 | | | | Maturity | | | JPY | 926 | | | | 12,260 | | | | — | | | | 12,260 | |
S&P/ASX 200 Index, 11/16/17* | | | 10.85 | | | | Maturity | | | AUD | 8 | | | | 14,322 | | | | — | | | | 14,322 | |
Goldman Sachs International | | | | | | | | | | | | | | | | | | | | | | | | |
Euro STOXX 50 Index, 11/17/17* | | | 12.50 | | | | Maturity | | | EUR | 3 | | | | 10,292 | | | | — | | | | 10,292 | |
iShares MSCI Emerging Markets ETF, 11/17/17* | | | 14.90 | | | | Maturity | | | USD | 3 | | | | (919 | ) | | | — | | | | (919 | ) |
Nasdaq 100 Stock Index, 11/17/17* | | | 14.70 | | | | Maturity | | | USD | 12 | | | | (20,681 | ) | | | — | | | | (20,681 | ) |
S&P 500 Index, 11/17/17* | | | 10.15 | | | | Maturity | | | USD | 12 | | | | 13,352 | | | | — | | | | 13,352 | |
| | |
| 30 | AB ALL MARKET ALTERNATIVE RETURN PORTFOLIO | | abfunds.com |
CONSOLIDATED PORTFOLIO OF INVESTMENTS (continued)
| | | | | | | | | | | | | | | | | | | | | | | | |
Swap Counterparty &
Referenced Obligation | | Volatility
Strike
Rate | | | Payment
Frequency | | | Notional
Amount
(000) | | | Market
Value | | | Upfront
Premiums
(Paid)
Received | | | Unrealized
Appreciation/
(Depreciation) | |
HSBC Bank USA | | | | | | | | | | | | | | | | | | | | | | | | |
Nikkei 225 Index, 11/10/17* | | | 16.00 | % | | | Maturity | | | JPY | 1,370 | | | $ | 51,220 | | | $ | — | | | $ | 51,220 | |
JPMorgan Chase Bank, NA | | | | | | | | | | | | | | | | | | | | | | | | |
S&P 500 Index, 11/17/17* | | | 10.35 | | | | Maturity | | | USD | 9 | | | | 19,338 | | | | — | | | | 19,338 | |
S&P 500 Index, 11/17/17* | | | 10.25 | | | | Maturity | | | USD | 8 | | | | 18,213 | | | | — | | | | 18,213 | |
| | | | | | | | | | | | | | | | | | | | | | | | |
| | | | | | | | | | | | | | $ | 119,255 | | | $ | – 0 | – | | $ | 119,255 | |
| | | | | | | | | | | | | | | | | | | | | | | | |
| ** | Notional amount less than $500. |
| (a) | Non-income producing security. |
| (b) | Security is exempt from registration under Rule 144A of the Securities Act of 1933. These securities are considered restricted, but liquid and may be resold in transactions exempt from registration, normally to qualified institutional buyers. At October 31, 2017, the aggregate market value of these securities amounted to $1,176,752 or 0.5% of net assets. |
| (c) | Affiliated investments. |
| (d) | To obtain a copy of the fund’s shareholder report, please go to the Securities and Exchange Commission’s website at www.sec.gov, or call AB at (800) 227-4618. |
| (e) | The rate shown represents the 7-day yield as of period end. |
| (f) | Position, or a portion thereof, has been segregated to collateralize OTC derivatives outstanding. |
Currency Abbreviations:
AUD – Australian Dollar
BRL – Brazilian Real
CAD – Canadian Dollar
CHF – Swiss Franc
CLP – Chilean Peso
CNY – Chinese Yuan Renminbi
COP – Colombian Peso
CZK – Czech Koruna
EUR – Euro
GBP – Great British Pound
HKD – Hong Kong Dollar
HUF – Hungarian Forint
IDR – Indonesian Rupiah
INR – Indian Rupee
JPY – Japanese Yen
KRW – South Korean Won
MXN – Mexican Peso
NOK – Norwegian Krone
NZD – New Zealand Dollar
PEN – Peruvian Sol
PHP – Philippine Peso
PLN – Polish Zloty
RUB – Russian Ruble
SEK – Swedish Krona
SGD – Singapore Dollar
THB – Thailand Baht
TRY – Turkish Lira
TWD – New Taiwan Dollar
USD – United States Dollar
ZAR – South African Rand
Glossary:
ASX – Australian Stock Exchange
BKBM – Bank Bill Benchmark (New Zealand)
CAC – Cotation Assistée en Continu (Continuous Assisted Quotation)
CBT – Chicago Board of Trade
DAX – Deutscher Aktien Index (German Stock Index)
EAFE – Europe, Australia, and Far East
ETF – Exchange Traded Fund
ETS – Emission Trading Scheme
FTSE – Financial Times Stock Exchange
IBEX – International Business Exchange
IRS – Interest Rate Swaption
LIBOR – London Interbank Offered Rates
LME – London Metal Exchange
MIB – Milano Italia Borsa
MSCI – Morgan Stanley Capital International
NASDAQ – National Association of Securities Dealers Automated Quotations
NIBOR – Norwegian Interbank Offered Rate
OMXS – Stockholm Stock Exchange
OSE – Osaka Securities Exchange
REG – Registered Shares
REIT – Real Estate Investment Trust
SPI – Share Price Index
STIBOR – Stockholm Interbank Offered Rate
TOPIX – Tokyo Price Index
TSX – Toronto Stock Exchange
| | |
| abfunds.com | | AB ALL MARKET ALTERNATIVE RETURN PORTFOLIO | 31 |
CONSOLIDATED PORTFOLIO OF INVESTMENTS (continued)
The following table represents the 50 largest equity basket holdings underlying the total return swap with MS (Morgan Stanley) Bespoke Equity Factors Gross as of October 31, 2017.
| | | | | | | | | | | | |
| Security Description | | Shares | | | Market
Value as
of 10/31/17 | | | Percent of
Basket’s
Net Assets | |
MS Bespoke Equity Factors Gross | | | | | | | | | | | | |
RioCan Real Estate Investment Trust | | | 46,472 | | | $ | 878,007 | | | | 0.3 | % |
Pinnacle West Capital Corp. | | | 9,829 | | | | 862,120 | | | | 0.3 | % |
Continental Resources Inc./OK | | | 21,161 | | | | 861,444 | | | | 0.3 | % |
Coty Inc. | | | 55,253 | | | | 844,712 | | | | 0.3 | % |
Southern Co/The | | | 15,360 | | | | 792,826 | | | | 0.3 | % |
AGNC Investment Corp. | | | 39,645 | | | | 790,967 | | | | 0.3 | % |
Weatherford International PLC | | | 224,925 | | | | 780,488 | | | | 0.3 | % |
Macquarie Infrastructure Corp. | | | 11,131 | | | | 758,179 | | | | 0.3 | % |
Avnet Inc. | | | 19,083 | | | | 756,151 | | | | 0.3 | % |
Patterson Cos Inc. | | | 20,411 | | | | 755,221 | | | | 0.3 | % |
Athene Holding Ltd. | | | 14,479 | | | | 754,799 | | | | 0.3 | % |
Sirius XM Holdings Inc. | | | 135,144 | | | | 733,672 | | | | 0.3 | % |
H&R Real Estate Investment Trust | | | 44,572 | | | | 732,743 | | | | 0.3 | % |
Shire PLC | | | 148 | | | | 729,194 | | | | 0.3 | % |
FirstEnergy Corp. | | | 22,070 | | | | 719,222 | | | | 0.3 | % |
Rolls-Royce Holdings PLC | | | 549 | | | | 709,842 | | | | 0.3 | % |
AltaGas Ltd. | | | 31,020 | | | | 703,335 | | | | 0.3 | % |
Charles Schwab Corp./The | | | 15,493 | | | | 693,448 | | | | 0.3 | % |
FLIR Systems Inc. | | | 14,415 | | | | 672,744 | | | | 0.3 | % |
Lennox International Inc. | | | 3,494 | | | | 667,843 | | | | 0.3 | % |
Crown Holdings Inc. | | | 11,059 | | | | 665,392 | | | | 0.3 | % |
Palo Alto Networks Inc. | | | 4,512 | | | | 664,209 | | | | 0.3 | % |
Dell Technologies Inc. Class V | | | 8,023 | | | | 664,040 | | | | 0.3 | % |
CI Financial Corp. | | | 29,858 | | | | 661,590 | | | | 0.3 | % |
Valero Energy Corp. | | | 8,295 | | | | 648,829 | | | | 0.3 | % |
PulteGroup Inc. | | | 21,416 | | | | 645,703 | | | | 0.3 | % |
Jack Henry & Associates Inc. | | | 5,845 | | | | 641,984 | | | | 0.3 | % |
Deutsche Lufthansa AG | | | 19,981 | | | | 641,731 | | | | 0.3 | % |
Oracle Corp. | | | 12,452 | | | | 633,788 | | | | 0.2 | % |
Tesla Inc. | | | 1,902 | | | | 630,576 | | | | 0.2 | % |
AGCO Corp. | | | 9,181 | | | | 628,210 | | | | 0.2 | % |
British American Tobacco PLC | | | 97 | | | | 626,689 | | | | 0.2 | % |
Liberty Property Trust | | | 14,615 | | | | 626,689 | | | | 0.2 | % |
Pearson PLC | | | 671 | | | | 626,689 | | | | 0.2 | % |
Atmos Energy Corp. | | | 7,154 | | | | 620,689 | | | | 0.2 | % |
Ingredion Inc. | | | 4,948 | | | | 620,182 | | | | 0.2 | % |
First Capital Realty Inc. | | | 38,953 | | | | 618,239 | | | | 0.2 | % |
Saipem SpA | | | 146,869 | | | | 617,309 | | | | 0.2 | % |
Pioneer Natural Resources Co. | | | 4,119 | | | | 616,548 | | | | 0.2 | % |
OGE Energy Corp. | | | 16,715 | | | | 615,788 | | | | 0.2 | % |
Cobham PLC | | | 3,329 | | | | 614,520 | | | | 0.2 | % |
VeriSign Inc. | | | 5,631 | | | | 605,394 | | | | 0.2 | % |
West Fraser Timber Co Ltd. | | | 9,887 | | | | 601,845 | | | | 0.2 | % |
AO Smith Corp. | | | 10,021 | | | | 593,225 | | | | 0.2 | % |
ConocoPhillips | | | 11,571 | | | | 591,873 | | | | 0.2 | % |
Linamar Corp. | | | 9,717 | | | | 589,000 | | | | 0.2 | % |
Ford Motor Co. | | | 47,969 | | | | 588,577 | | | | 0.2 | % |
AP Moller—Maersk A/S | | | 316 | | | | 585,704 | | | | 0.2 | % |
Coca-Cola Co/The | | | 12,570 | | | | 573,282 | | | | 0.2 | % |
Iron Mountain Inc. | | | 14,377 | | | | 566,268 | | | | 0.2 | % |
Other | | | 9,048,649 | | | | 222,116,833 | | | | 86.8 | % |
| | | | | | | | | | | | |
Total | | | | | | $ | 255,938,353 | | | | 100.0 | % |
| | | | | | | | | | | | |
See notes to financial statements.
| | |
| 32 | AB ALL MARKET ALTERNATIVE RETURN PORTFOLIO | | abfunds.com |
CONSOLIDATED STATEMENT OF ASSETS & LIABILITIES
October 31, 2017
| | | | |
| Assets | | | | |
Investments in securities, at value | | | | |
Unaffiliated issuers (cost $167,130,406) | | $ | 170,005,608 | |
Affiliated issuers (cost $39,743,114) | | | 39,743,114 | |
Cash | | | 184,284 | |
Cash collateral due from broker | | | 19,607,265 | |
Foreign currencies, at value (cost $1,009,435) | | | 1,002,368 | |
Unrealized appreciation on forward currency exchange contracts | | | 14,539,182 | |
Unrealized appreciation on total return swaps | | | 641,800 | |
Receivable for variation margin on exchange traded swaps | | | 238,208 | |
Unrealized appreciation on variance swaps | | | 182,523 | |
Unaffiliated dividends and interest receivable | | | 118,045 | |
Affiliated dividends receivable | | | 23,514 | |
Receivable for terminated total return swaps | | | 9,047 | |
| | | | |
Total assets | | | 246,294,958 | |
| | | | |
| Liabilities | | | | |
Unrealized depreciation on forward currency exchange contracts | | | 14,021,899 | |
Cash collateral due to broker | | | 862,000 | |
Unrealized depreciation on total return swaps | | | 832,030 | |
Payable for variation margin on futures | | | 811,561 | |
Advisory fee payable | | | 66,289 | |
Unrealized depreciation on variance swaps | | | 63,268 | |
Administrative fee payable | | | 20,330 | |
Transfer Agent fee payable | | | 3,952 | |
Directors’ fees payable | | | 2,486 | |
Distribution fee payable | | | 10 | |
Accrued expenses | | | 292,256 | |
| | | | |
Total liabilities | | | 16,976,081 | |
| | | | |
Net Assets | | $ | 229,318,877 | |
| | | | |
| Composition of Net Assets | | | | |
Capital stock, at par | | $ | 2,758 | |
Additional paid-in capital | | | 233,077,987 | |
Distributions in excess of net investment income | | | (905,260 | ) |
Accumulated net realized loss on investment and foreign currency transactions | | | (1,785,384 | ) |
Net unrealized depreciation on investments and foreign currency denominated assets and liabilities | | | (1,071,224 | ) |
| | | | |
| | $ | 229,318,877 | |
| | | | |
Net Asset Value Per Share—11 billion shares of capital stock authorized, $.0001 par value
| | | | | | | | | | | | |
| Class | | Net Assets | | | Shares
Outstanding | | | Net Asset
Value | |
| |
| A | | $ | 9,918 | | | | 1,197 | | | $ | 8.29 | * |
| |
| C | | $ | 9,721 | | | | 1,189 | | | $ | 8.18 | |
| |
| Advisor | | $ | 229,299,238 | | | | 27,576,883 | | | $ | 8.31 | |
| |
| * | The maximum offering price per share for Class A shares was $8.66 which reflects a sales charge of 4.25%. |
See notes to consolidated financial statements.
| | |
| abfunds.com | | AB ALL MARKET ALTERNATIVE RETURN PORTFOLIO | 33 |
CONSOLIDATED STATEMENT OF OPERATIONS
Year Ended October 31, 2017
| | | | | | | | |
| Investment Income | | | | | | | | |
Dividends | | | | | | | | |
Unaffiliated issuers (net of foreign taxes withheld of $39,393) | | $ | 1,141,639 | | | | | |
Affiliated issuers | | | 259,133 | | | | | |
Interest (net of foreign taxes withheld of $8,624) | | | 48,605 | | | $ | 1,449,377 | |
| | | | | | | | |
| Expenses | | | | | | | | |
Advisory fee (see Note B) | | | 929,709 | | | | | |
Distribution fee—Class A | | | 25 | | | | | |
Distribution fee—Class C | | | 98 | | | | | |
Transfer agency—Class A | | | 6 | | | | | |
Transfer agency—Class C | | | 12 | | | | | |
Transfer agency—Advisor Class | | | 31,924 | | | | | |
Custodian | | | 146,131 | | | | | |
Audit and tax | | | 107,305 | | | | | |
Administrative | | | 93,466 | | | | | |
Legal | | | 37,587 | | | | | |
Registration fees | | | 28,877 | | | | | |
Directors’ fees | | | 28,137 | | | | | |
Printing | | | 24,410 | | | | | |
Miscellaneous | | | 26,677 | | | | | |
| | | | | | | | |
Total expenses | | | 1,454,364 | | | | | |
Less: expenses waived and reimbursed by the Adviser (see Note B) | | | (300,203 | ) | | | | |
| | | | | | | | |
Net expenses | | | | | | | 1,154,161 | |
| | | | | | | | |
Net investment income | | | | | | | 295,216 | |
| | | | | | | | |
| Realized and Unrealized Gain (Loss) on Investment and Foreign Currency Transactions | | | | | | | | |
Net realized gain (loss) on: | | | | | | | | |
Investment transactions | | | | | | | 3,724,494 | |
Forward currency exchange contracts | | | | | | | (5,294,614 | ) |
Futures | | | | | | | (3,971,892 | ) |
Swaps | | | | | | | (659,368 | ) |
Foreign currency transactions | | | | | | | 1,746,912 | |
Net change in unrealized appreciation/depreciation of: | | | | | | | | |
Investments | | | | | | | 2,708,110 | |
Forward currency exchange contracts | | | | | | | 207,247 | |
Futures | | | | | | | (4,334,048 | ) |
Swaps | | | | | | | (310,452 | ) |
Foreign currency denominated assets and liabilities | | | | | | | 21,945 | |
| | | | | | | | |
Net loss on investment and foreign currency transactions | | | | | | | (6,161,666 | ) |
| | | | | | | | |
Contributions from Affiliates (see Note B) | | | | | | | 78 | |
| | | | | | | | |
Net Decrease in Net Assets from Operations | | | | | | $ | (5,866,372 | ) |
| | | | | | | | |
See notes to consolidated financial statements.
| | |
| 34 | AB ALL MARKET ALTERNATIVE RETURN PORTFOLIO | | abfunds.com |
CONSOLIDATED STATEMENT OF CHANGES IN NET ASSETS
| | | | | | | | |
| | | Year Ended
October 31,
2017 | | | Year Ended
October 31,
2016 | |
| Increase (Decrease) in Net Assets from Operations | | | | | | | | |
Net investment income (loss) | | $ | 295,216 | | | $ | (42,076 | ) |
Net realized loss on investment and foreign currency transactions | | | (4,454,468 | ) | | | (930,897 | ) |
Net change in unrealized appreciation/depreciation of investments and foreign currency denominated assets and liabilities | | | (1,707,198 | ) | | | 1,379,946 | |
Contributions from Affiliates (see Note B) | | | 78 | | | | 478,462 | |
| | | | | | | | |
Net increase (decrease) in net assets from operations | | | (5,866,372 | ) | | | 885,435 | |
| Distributions to Shareholders from | | | | | | | | |
Net investment income | | | | | | | | |
Class A | | | (1,628 | ) | | | – 0 | – |
Class C | | | (1,550 | ) | | | – 0 | – |
Advisor Class | | | (2,971,914 | ) | | | – 0 | – |
Net realized gain on investment transactions | | | | | | | | |
Class A | | | – 0 | – | | | (23 | ) |
Class C | | | – 0 | – | | | (23 | ) |
Advisor Class | | | – 0 | – | | | (40,455 | ) |
| Capital Stock Transactions | | | | | | | | |
Net increase (decrease) | | | 219,638,609 | | | | – 0 | – |
| | | | | | | | |
Total increase | | | 210,797,145 | | | | 844,934 | |
| Net Assets | | | | | | | | |
Beginning of period | | | 18,521,732 | | | | 17,676,798 | |
| | | | | | | | |
End of period (including distributions in excess of net investment income of ($905,260) and undistributed net investment income of $2,727,665, respectively) | | $ | 229,318,877 | | | $ | 18,521,732 | |
| | | | | | | | |
See notes to consolidated financial statements.
| | |
| abfunds.com | | AB ALL MARKET ALTERNATIVE RETURN PORTFOLIO | 35 |
NOTES TO CONSOLIDATED FINANCIAL STATEMENTS
October 31, 2017
NOTE A
Significant Accounting Policies
AB Cap Fund, Inc. (the “Company”), which is a Maryland corporation, is registered under the Investment Company Act of 1940 as an open-end management investment company. The Company operates as a series company currently comprised of 29 portfolios. Each portfolio is considered to be a separate entity for financial reporting and tax purposes. This report relates only to the AB All Market Alternative Return Portfolio (the “Fund”), a non-diversified portfolio. As part of the Fund’s investment strategy, the Fund seeks to gain exposure to commodities and commodities-related instruments and derivatives primarily through investments in AB All Market Alternative Return (Cayman) Ltd., a wholly-owned subsidiary of the Fund organized under the laws of the Cayman Islands (the “Subsidiary”). The Fund is the sole shareholder of the Subsidiary and it is intended that the Strategy will remain the sole shareholder and will continue to control the Subsidiary. Under the Articles of Association of the Subsidiary, shares issued by the Subsidiary confer upon a shareholder the right to receive notice of, to attend and to vote at general meetings of the Subsidiary and shall confer upon the shareholder rights in a winding-up or repayment of capital and the right to participate in the profits or assets of the Subsidiary. As of October 31, 2017, net assets of the Fund were $229,318,877, of which $37,323,718, or 16%, represented the Fund’s ownership of all issued shares and voting rights of the Subsidiary. This report presents the consolidated financial statements of AB All Market Alternative Return Portfolio and the Subsidiary. All intercompany transactions and balances have been eliminated in consolidation. The Fund has authorized the issuance of Class A, Class B, Class C, Advisor Class, Class R, Class K, Class I, Class Z, Class T, Class 1 and Class 2 shares. No classes are being publicly offered. Class B, Class R, Class K, Class I, Class Z, Class T, Class 1 or Class 2 shares have not been issued. As of October 31, 2017, AllianceBernstein L.P. (the “Adviser”), was the sole shareholder of Class A, Class C and Advisor Class shares. Class A shares are sold with a front-end sales charge of up to 4.25% for purchases not exceeding $1,000,000. With respect to purchases of $1,000,000 or more, Class A shares redeemed within one year of purchase may be subject to a contingent deferred sales charge of 1%. Class C shares are subject to a contingent deferred sales charge of 1% on redemptions made within the first year after purchase and 0% after the first year of purchase. Effective April 10, 2017, Class C shares will automatically convert to Class A shares ten years after the end of the calendar month of purchase. Advisor Class shares are sold without any initial or contingent deferred sales charge and are not subject to ongoing distribution expenses. All eleven classes of shares have identical voting, dividend, liquidation and other rights, except that the classes bear different distribution and transfer
| | |
| 36 | AB ALL MARKET ALTERNATIVE RETURN PORTFOLIO | | abfunds.com |
NOTES TO CONSOLIDATED FINANCIAL STATEMENTS (continued)
agency expenses. Each class has exclusive voting rights with respect to its distribution plan. The consolidated financial statements have been prepared in conformity with U.S. generally accepted accounting principles (“U.S. GAAP”) which require management to make certain estimates and assumptions that affect the reported amounts of assets and liabilities in the consolidated financial statements and amounts of income and expenses during the reporting period. Actual results could differ from those estimates. The Fund is an investment company under U.S. GAAP and follows the accounting and reporting guidance applicable to investment companies. The following is a summary of significant accounting policies followed by the Fund.
1. Security Valuation
Portfolio securities are valued at their current market value determined on the basis of market quotations or, if market quotations are not readily available or are deemed unreliable, at “fair value” as determined in accordance with procedures established by and under the general supervision of the Company’s Board of Directors (the “Board”).
In general, the market values of securities which are readily available and deemed reliable are determined as follows: securities listed on a national securities exchange (other than securities listed on the NASDAQ Stock Market, Inc. (“NASDAQ”)) or on a foreign securities exchange are valued at the last sale price at the close of the exchange or foreign securities exchange. If there has been no sale on such day, the securities are valued at the last traded price from the previous day. Securities listed on more than one exchange are valued by reference to the principal exchange on which the securities are traded; securities listed only on NASDAQ are valued in accordance with the NASDAQ Official Closing Price; listed or over the counter (“OTC”) market put or call options are valued at the mid level between the current bid and ask prices. If either a current bid or current ask price is unavailable, the Adviser will have discretion to determine the best valuation (e.g., last trade price in the case of listed options); open futures are valued using the closing settlement price or, in the absence of such a price, the most recent quoted bid price. If there are no quotations available for the day of valuation, the last available closing settlement price is used; U.S. Government securities and any other debt instruments having 60 days or less remaining until maturity are generally valued at market by an independent pricing vendor, if a market price is available. If a market price is not available, the securities are valued at amortized cost. This methodology is commonly used for short term securities that have an original maturity of 60 days or less, as well as short term securities that had an original term to maturity that exceeded 60 days. In instances when amortized cost is utilized, the Valuation Committee (the “Committee”) must reasonably conclude that the utilization of amortized cost is approximately the same as the fair value of the security. Such factors the Committee will
| | |
| abfunds.com | | AB ALL MARKET ALTERNATIVE RETURN PORTFOLIO | 37 |
NOTES TO CONSOLIDATED FINANCIAL STATEMENTS (continued)
consider include, but are not limited to, an impairment of the creditworthiness of the issuer or material changes in interest rates. Fixed-income securities, including mortgage-backed and asset-backed securities, may be valued on the basis of prices provided by a pricing service or at a price obtained from one or more of the major broker-dealers. In cases where broker-dealer quotes are obtained, the Adviser may establish procedures whereby changes in market yields or spreads are used to adjust, on a daily basis, a recently obtained quoted price on a security. Swaps and other derivatives are valued daily, primarily using independent pricing services, independent pricing models using market inputs, as well as third party broker-dealers or counterparties. Open end mutual funds are valued at the closing net asset value per share, while exchange traded funds are valued at the closing market price per share.
Securities for which market quotations are not readily available (including restricted securities) or are deemed unreliable are valued at fair value as deemed appropriate by the Adviser. Factors considered in making this determination may include, but are not limited to, information obtained by contacting the issuer, analysts, analysis of the issuer’s financial statements or other available documents. In addition, the Fund may use fair value pricing for securities primarily traded in non-U.S. markets because most foreign markets close well before the Fund values its securities at 4:00 p.m., Eastern Time. The earlier close of these foreign markets gives rise to the possibility that significant events, including broad market moves, may have occurred in the interim and may materially affect the value of those securities. To account for this, the Fund generally values many of its foreign equity securities using fair value prices based on third party vendor modeling tools to the extent available.
2. Fair Value Measurements
In accordance with U.S. GAAP regarding fair value measurements, fair value is defined as the price that the Fund would receive to sell an asset or pay to transfer a liability in an orderly transaction between market participants at the measurement date. U.S. GAAP establishes a framework for measuring fair value, and a three-level hierarchy for fair value measurements based upon the transparency of inputs to the valuation of an asset or liability (including those valued based on their market values as described in Note A.1 above). Inputs may be observable or unobservable and refer broadly to the assumptions that market participants would use in pricing the asset or liability. Observable inputs reflect the assumptions market participants would use in pricing the asset or liability based on market data obtained from sources independent of the Fund. Unobservable inputs reflect the Fund’s own assumptions about the assumptions that market participants would use in pricing the asset or liability based on the best information available in the circumstances. Each
| | |
| 38 | AB ALL MARKET ALTERNATIVE RETURN PORTFOLIO | | abfunds.com |
NOTES TO CONSOLIDATED FINANCIAL STATEMENTS (continued)
investment is assigned a level based upon the observability of the inputs which are significant to the overall valuation. The three-tier hierarchy of inputs is summarized below.
| | • | | Level 1—quoted prices in active markets for identical investments |
| | • | | Level 2—other significant observable inputs (including quoted prices for similar investments, interest rates, prepayment speeds, credit risk, etc.) |
| | • | | Level 3—significant unobservable inputs (including the Fund’s own assumptions in determining the fair value of investments) |
Where readily available market prices or relevant bid prices are not available for certain equity investments, such investments may be valued based on similar publicly traded investments, movements in relevant indices since last available prices or based upon underlying company fundamentals and comparable company data (such as multiples to earnings or other multiples to equity). Where an investment is valued using an observable input, such as another publicly traded security, the investment will be classified as Level 2. If management determines that an adjustment is appropriate based on restrictions on resale, illiquidity or uncertainty, and such adjustment is a significant component of the valuation, the investment will be classified as Level 3. An investment will also be classified as Level 3 where management uses company fundamentals and other significant inputs to determine the valuation.
The following table summarizes the valuation of the Fund’s investments by the above fair value hierarchy levels as of October 31, 2017:
| | | | | | | | | | | | | | | | |
Investments in
Securities: | | Level 1 | | | Level 2 | | | Level 3 | | | Total | |
Assets: | | | | | | | | | | | | | | | | |
Common Stocks: | | | | | | | | | | | | | | | | |
Information Technology | | $ | 16,150,745 | | | $ | 4,011,844 | | | $ | – 0 | – | | $ | 20,162,589 | |
Financials | | | 8,570,542 | | | | 8,781,611 | | | | – 0 | – | | | 17,352,153 | |
Industrials | | | 7,011,755 | | | | 7,953,590 | | | | – 0 | – | | | 14,965,345 | |
Health Care | | | 11,867,517 | | | | 2,964,048 | | | | – 0 | – | | | 14,831,565 | |
Consumer Discretionary | | | 6,697,168 | | | | 8,029,979 | | | | – 0 | – | | | 14,727,147 | |
Consumer Staples | | | 7,329,907 | | | | 2,265,005 | | | | – 0 | – | | | 9,594,912 | |
Materials | | | 4,082,121 | | | | 3,777,765 | | | | – 0 | – | | | 7,859,886 | |
Energy | | | 4,046,639 | | | | 729,768 | | | | – 0 | – | | | 4,776,407 | |
Utilities | | | 688,829 | | | | 2,558,449 | | | | – 0 | – | | | 3,247,278 | |
Real Estate | | | 1,883,195 | | | | 999,089 | | | | – 0 | – | | | 2,882,284 | |
Telecommunication Services | | | 282,420 | | | | – 0 | – | | | – 0 | – | | | 282,420 | |
Options Purchased – Puts | | | – 0 | – | | | 21,931 | | | | – 0 | – | | | 21,931 | |
Short-Term Investments: | | | | | | | | | | | | | | | | |
Governments – Treasuries | | | – 0 | – | | | 44,317,552 | | | | – 0 | – | | | 44,317,552 | |
Investment Companies | | | 39,743,114 | | | | – 0 | – | | | – 0 | – | | | 39,743,114 | |
U.S. Treasury Bills | | | – 0 | – | | | 14,984,139 | | | | – 0 | – | | | 14,984,139 | |
| | | | | | | | | | | | | | | | |
Total Investments in Securities | | | 108,353,952 | | | | 101,394,770 | | | | – 0 | – | | | 209,748,722 | |
| | |
| abfunds.com | | AB ALL MARKET ALTERNATIVE RETURN PORTFOLIO | 39 |
NOTES TO CONSOLIDATED FINANCIAL STATEMENTS (continued)
| | | | | | | | | | | | | | | | |
Investments in
Securities: | | Level 1 | | | Level 2 | | | Level 3 | | | Total | |
Other Financial Instruments(a): | | | | | | | | | | | | | | | | |
Assets: | | | | | | | | | | | | | | | | |
Futures | | $ | 1,387,082 | | | $ | 3,418,516 | | | $ | – 0 | – | | $ | 4,805,598 | (b) |
Forward Currency Exchange Contracts | | | – 0 | – | | | 14,539,182 | | | | – 0 | – | | | 14,539,182 | |
Centrally Cleared Interest Rate Swaps | | | – 0 | – | | | 191,376 | | | | – 0 | – | | | 191,376 | (b) |
Total Return Swaps | | | – 0 | – | | | 641,800 | | | | – 0 | – | | | 641,800 | |
Variance Swaps | | | – 0 | – | | | 182,523 | | | | – 0 | – | | | 182,523 | |
Liabilities: | | | | | | | | | | | | | | | | |
Futures | | | (7,709,256 | ) | | | (976,750 | ) | | | – 0 | – | | | (8,686,006 | )(b) |
Forward Currency Exchange Contracts | | | – 0 | – | | | (14,021,899 | ) | | | – 0 | – | | | (14,021,899 | ) |
Centrally Cleared Interest Rate Swaps | | | – 0 | – | | | (720,860 | ) | | | – 0 | – | | | (720,860 | )(b) |
Total Return Swaps | | | – 0 | – | | | (832,030 | ) | | | – 0 | – | | | (832,030 | ) |
Variance Swaps | | | – 0 | – | | | (63,268 | ) | | | – 0 | – | | | (63,268 | ) |
| | | | | | | | | | | | | | | | |
Total(c) | | $ | 102,031,778 | | | $ | 103,753,360 | | | $ | – 0 | – | | $ | 205,785,138 | |
| | | | | | | | | | | | | | | | |
| (a) | Other financial instruments are derivative instruments, such as futures, forwards and swaps, which are valued at the unrealized appreciation/(depreciation) on the instrument. Other financial instruments may also include swaps with upfront premiums, options written and swaptions which are valued at market value. |
| (b) | Only variation margin receivable/(payable) at period end is reported within the statement of assets and liabilities. This amount reflects cumulative unrealized appreciation/(depreciation) of exchange-traded derivatives as reported in the portfolio of investments. Exchanged-traded swaps with upfront premiums are presented here as market value. |
| (c) | There were no transfers between any levels during the reporting period. |
The Fund recognizes all transfers between levels of the fair value hierarchy assuming the financial instruments were transferred at the beginning of the reporting period.
The Adviser established the Committee to oversee the pricing and valuation of all securities held in the Fund. The Committee operates under pricing and valuation policies and procedures established by the Adviser and approved by the Board, including pricing policies which set forth the mechanisms and processes to be employed on a daily basis to implement these policies and procedures. In particular, the pricing policies describe how to determine market quotations for securities and other instruments. The Committee’s responsibilities include: 1) fair value and liquidity determinations (and oversight of any third parties to whom any responsibility for fair value and liquidity determinations is delegated), and 2) regular monitoring of the Adviser’s pricing and valuation policies and procedures and modification or enhancement of these policies and procedures (or recommendation of the modification of these policies and procedures) as the Committee believes appropriate.
The Committee is also responsible for monitoring the implementation of the pricing policies by the Adviser’s Pricing Group (the “Pricing Group”) and any third party which performs certain pricing functions in accordance with the pricing policies. The Pricing Group is responsible for the oversight of the third party on a day-to-day basis. The Committee and the Pricing Group perform a series of activities to provide reasonable assurance of the
| | |
| 40 | AB ALL MARKET ALTERNATIVE RETURN PORTFOLIO | | abfunds.com |
NOTES TO CONSOLIDATED FINANCIAL STATEMENTS (continued)
accuracy of prices including: 1) periodic vendor due diligence meetings, review of methodologies, new developments and processes at vendors, 2) daily comparison of security valuation versus prior day for all securities that exceeded established thresholds, and 3) daily review of unpriced, stale, and variance reports with exceptions reviewed by senior management and the Committee.
In addition, several processes outside of the pricing process are used to monitor valuation issues including: 1) performance and performance attribution reports are monitored for anomalous impacts based upon benchmark performance, and 2) portfolio managers review all portfolios for performance and analytics (which are generated using the Adviser’s prices).
3. Currency Translation
Assets and liabilities denominated in foreign currencies and commitments under forward currency exchange contracts are translated into U.S. dollars at the mean of the quoted bid and ask prices of such currencies against the U.S. dollar. Purchases and sales of portfolio securities are translated into U.S. dollars at the rates of exchange prevailing when such securities were acquired or sold. Income and expenses are translated into U.S. dollars at rates of exchange prevailing when accrued.
Net realized gain or loss on foreign currency transactions represents foreign exchange gains and losses from sales and maturities of foreign fixed income investments, holding of foreign currencies, currency gains or losses realized between the trade and settlement dates on foreign investment transactions, and the difference between the amounts of dividends, interest and foreign withholding taxes recorded on the Fund’s books and the U.S. dollar equivalent amounts actually received or paid. Net unrealized currency gains and losses from valuing foreign currency denominated assets and liabilities at period end exchange rates are reflected as a component of net unrealized appreciation or depreciation of foreign currency denominated assets and liabilities.
4. Taxes
It is the Fund’s policy to meet the requirements of the Internal Revenue Code applicable to regulated investment companies and to distribute all of its investment company taxable income and net realized gains, if any, to shareholders. Therefore, no provisions for federal income or excise taxes are required. The Fund may be subject to taxes imposed by countries in which it invests. Such taxes are generally based on income and/or capital gains earned or repatriated. Taxes are accrued and applied to net investment income, net realized gains and net unrealized appreciation/depreciation as such income and/or gains are earned.
| | |
| abfunds.com | | AB ALL MARKET ALTERNATIVE RETURN PORTFOLIO | 41 |
NOTES TO CONSOLIDATED FINANCIAL STATEMENTS (continued)
In accordance with U.S. GAAP requirements regarding accounting for uncertainties in income taxes, management has analyzed the Fund’s tax positions taken or expected to be taken on federal and state income tax returns for all open tax years (the current tax year and the prior tax years) and has concluded that no provision for income tax is required in the Fund’s consolidated financial statements.
5. Investment Income and Investment Transactions
Dividend income is recorded on the ex-dividend date or as soon as the Fund is informed of the dividend. Interest income is accrued daily. Investment transactions are accounted for on the date the securities are purchased or sold. Investment gains or losses are determined on the identified cost basis. The Fund amortizes premiums and accretes discounts as adjustments to interest income.
6. Class Allocations
All income earned and expenses incurred by the Fund are borne on a pro-rata basis by each outstanding class of shares, based on the proportionate interest in the Fund represented by the net assets of such class, except for class specific expenses which are allocated to the respective class. Expenses of the Company are charged proportionately to each portfolio or based on other appropriate methods. Realized and unrealized gains and losses are allocated among the various share classes based on respective net assets.
7. Dividends and Distributions
Dividends and distributions to shareholders, if any, are recorded on the ex-dividend date. Income dividends and capital gains distributions are determined in accordance with federal tax regulations and may differ from those determined in accordance with U.S. GAAP. To the extent these differences are permanent, such amounts are reclassified within the capital accounts based on their federal tax basis treatment; temporary differences do not require such reclassification.
NOTE B
Advisory Fee and Other Transactions with Affiliates
Under the terms of the investment advisory agreement, the Fund pays the Adviser an advisory fee at an annual rate of .75% of the Fund’s average daily net assets. Effective February 3, 2017, the advisory fee was reduced from 1.00% to .75% of the Fund’s average daily net assets. The fee is accrued daily and paid monthly. The Adviser has agreed to waive its fees and bear certain expenses to the extent necessary to limit total operating expenses (excluding expenses associated with securities sold short, acquired fund fees and expenses other than the advisory fees of any AB Mutual Funds in which the Fund may invest, interest expense, taxes,
| | |
| 42 | AB ALL MARKET ALTERNATIVE RETURN PORTFOLIO | | abfunds.com |
NOTES TO CONSOLIDATED FINANCIAL STATEMENTS (continued)
extraordinary expenses, and brokerage commissions and other transaction costs) on an annual basis (the “Expense Caps”) to 1.24%, 1.99%, and .99% of daily average net assets for Class A, Class C, and Advisor Class shares, respectively. Effective February 3, 2017, the Expense Caps were reduced from 1.55% to 1.24%, 2.30% to 1.99%, and 1.30% to .99% of daily average net assets for Class A, Class C, and Advisor Class shares, respectively. Any fees waived and expenses borne by the Adviser are subject to repayment by the Fund until the end of the third fiscal year after the fiscal period in which the fee was waived or the expense was borne; such waivers that are subject to repayment amounted to $213,895 for the fiscal period ended October 31, 2015 and $372,690 for the year ended October 31, 2016. In any case, no reimbursement payment will be made that would cause the Fund’s total annual operating expenses to exceed the net fee percentages set forth above. For the year ended October 31, 2017, such reimbursements/waivers amounted to $169,836. The Expense Caps may not be terminated by the Adviser before February 28, 2018.
Pursuant to the investment advisory agreement, the Fund may reimburse the Adviser for certain legal and accounting services provided to the Fund by the Adviser. For the year ended October 31, 2017, the reimbursement for such services amounted to $93,466. For the year ended October 31, 2017, the Adviser voluntarily agreed to waive such fees in the amount of $58,095.
During the year ended October 31, 2017 and the year October 31, 2016, the Adviser reimbursed the Fund $78 and $478,462, respectively, for trading losses incurred due to a trade entry error.
The Fund compensates AllianceBernstein Investor Services, Inc. (“ABIS”), a wholly-owned subsidiary of the Adviser, under a Transfer Agency Agreement for providing personnel and facilities to perform transfer agency services for the Fund. ABIS may make payments to intermediaries that provide omnibus account services, sub-accounting services and/or networking services. Such compensation retained by ABIS amounted to $17,946 for the year ended October 31, 2017.
AllianceBernstein Investments, Inc. (the “Distributor”), a wholly-owned subsidiary of the Adviser, serves as the distributor of the Fund’s shares. The Distributor has advised the Fund that it has retained front-end sales charges of $0 from the sale of Class A shares and received $0 and $0 in contingent deferred sales charges imposed upon redemptions by shareholders of Class A and Class C shares, respectively, for the year ended October 31, 2017.
The Fund may invest in AB Government Money Market Portfolio (the “Government Money Market Portfolio”) which has a contractual annual
| | |
| abfunds.com | | AB ALL MARKET ALTERNATIVE RETURN PORTFOLIO | 43 |
NOTES TO CONSOLIDATED FINANCIAL STATEMENTS (continued)
advisory fee rate of .20% of the portfolio’s average daily net assets and bears its own expenses. In connection with the investment by the Fund in the Government Money Market Portfolio, the Adviser has contractually agreed to waive its advisory fee from the Fund in an amount equal to the Fund’s pro rata share of the effective advisory fees of Government Money Market Portfolio, as borne indirectly by the Fund as an acquired fund fee and expense. For the year ended October 31, 2017, such waiver amounted to $72,272.
A summary of the Fund’s transactions in AB mutual funds for the year ended October 31, 2017 is as follows:
| | | | | | | | | | | | | | | | | | | | |
Fund | | Market Value
10/31/16
(000) | | | Purchases
at Cost
(000) | | | Sales
Proceeds
(000) | | | Market Value
10/31/17
(000) | | | Dividend
Income
(000) | |
Government
Money
Market
Portfolio | | $ | 6,171 | | | $ | 387,121 | | | $ | 353,549 | | | $ | 39,743 | | | $ | 259 | |
Brokerage commissions paid on investment transactions for the year ended October 31, 2017 amounted to $339,621, of which $0 and $0, respectively, was paid to Sanford C. Bernstein & Co. LLC and Sanford C. Bernstein Limited, affiliates of the Adviser.
NOTE C
Distribution Services Agreement
The Fund has adopted a Distribution Services Agreement (the “Agreement”) pursuant to Rule 12b-1 under the Investment Company Act of 1940. Under the Agreement, the Fund pays distribution and servicing fees to the Distributor at an annual rate of up to .25% of the Fund’s average daily net assets attributable to Class A shares and 1% of the Fund’s average daily net assets attributable to Class C shares. There are no distribution and servicing fees on the Advisor Class shares. The fees are accrued daily and paid monthly. The Agreement provides that the Distributor will use such payments in their entirety for distribution assistance and promotional activities. Since the commencement of the Fund’s operations, the Distributor has incurred expenses in excess of the distribution costs reimbursed by the Fund in the amount of $0 for Class C shares. While such costs may be recovered from the Fund in future periods so long as the Agreement is in effect, the rate of the distribution and servicing fees payable under the Agreement may not be increased without a shareholder vote. In accordance with the Agreement, there is no provision for recovery of unreimbursed distribution costs incurred by the Distributor beyond the current fiscal year for Class A shares. The Agreement also provides that the Adviser may use its own resources to finance the distribution of the Fund’s shares.
| | |
| 44 | AB ALL MARKET ALTERNATIVE RETURN PORTFOLIO | | abfunds.com |
NOTES TO CONSOLIDATED FINANCIAL STATEMENTS (continued)
NOTE D
Investment Transactions
Purchases and sales of investment securities (excluding short-term investments) for the year ended October 31, 2017 were as follows:
| | | | | | | | |
| | | Purchases | | | Sales | |
Investment securities (excluding
U.S. government securities) | | $ | 211,825,389 | | | $ | 117,826,371 | |
U.S. government securities | | | – 0 | – | | | – 0 | – |
The cost of investments for federal income tax purposes, gross unrealized appreciation and unrealized depreciation are as follows:
| | | | |
Cost | | $ | 212,943,853 | |
| | | | |
Gross unrealized appreciation | | $ | 30,156,187 | |
Gross unrealized depreciation | | | (32,751,307 | ) |
| | | | |
Net unrealized depreciation | | $ | (2,595,120 | ) |
| | | | |
1. Derivative Financial Instruments
The Fund may use derivatives in an effort to earn income and enhance returns, to replace more traditional direct investments, to obtain exposure to otherwise inaccessible markets (collectively, “investment purposes”), or to hedge or adjust the risk profile of its portfolio.
The principal types of derivatives utilized by the Fund, as well as the methods in which they may be used are:
| | • | | Forward Currency Exchange Contracts |
The Fund may enter into forward currency exchange contracts in order to hedge its exposure to changes in foreign currency exchange rates on its foreign portfolio holdings, to hedge certain firm purchase and sale commitments denominated in foreign currencies and for non-hedging purposes as a means of making direct investments in foreign currencies, as described below under “Currency Transactions”.
A forward currency exchange contract is a commitment to purchase or sell a foreign currency at a future date at a negotiated forward rate. The gain or loss arising from the difference between the original contract and the closing of such contract would be included in net realized gain or loss on forward currency exchange contracts. Fluctuations in the value of open forward currency exchange contracts are recorded for financial reporting purposes as unrealized appreciation and/or depreciation by the Fund. Risks may arise from the potential inability of a counterparty to meet the terms of a contract and from unanticipated movements in the value of a foreign currency relative to the U.S. dollar.
| | |
| abfunds.com | | AB ALL MARKET ALTERNATIVE RETURN PORTFOLIO | 45 |
NOTES TO CONSOLIDATED FINANCIAL STATEMENTS (continued)
During the year ended October 31, 2017, the Fund held forward currency exchange contracts for hedging and non-hedging purposes.
The Fund may buy or sell futures for investment purposes or for the purpose of hedging its portfolio against adverse effects of potential movements in the market. The Fund bears the market risk that arises from changes in the value of these instruments and the imperfect correlation between movements in the price of the futures and movements in the price of the assets, reference rates or indices which they are designed to track. Among other things, the Fund may purchase or sell futures for foreign currencies or options thereon for non-hedging purposes as a means of making direct investment in foreign currencies, as described below under “Currency Transactions”.
At the time the Fund enters into futures, the Fund deposits and maintains as collateral an initial margin with the broker, as required by the exchange on which the transaction is effected. Such amount is shown as cash collateral due from broker on the consolidated statement of assets and liabilities. Pursuant to the contract, the Fund agrees to receive from or pay to the broker an amount of cash equal to the daily fluctuation in the value of the contract. Such receipts or payments are known as variation margin and are recorded by the Fund as unrealized gains or losses. Risks may arise from the potential inability of a counterparty to meet the terms of the contract. The credit/counterparty risk for exchange-traded futures is generally less than privately negotiated futures, since the clearinghouse, which is the issuer or counterparty to each exchange-traded future, has robust risk mitigation standards, including the requirement to provide initial and variation margin. When the contract is closed, the Fund records a realized gain or loss equal to the difference between the value of the contract at the time it was opened and the time it was closed.
Use of long futures subjects the Fund to risk of loss in excess of the amounts shown on the consolidated statement of assets and liabilities, up to the notional value of the futures. Use of short futures subjects the Fund to unlimited risk of loss. Under some circumstances, futures exchanges may establish daily limits on the amount that the price of futures can vary from the previous day’s settlement price, which could effectively prevent liquidation of unfavorable positions.
During the year ended October 31, 2017, the Fund held futures for hedging and non-hedging purposes.
| | |
| 46 | AB ALL MARKET ALTERNATIVE RETURN PORTFOLIO | | abfunds.com |
NOTES TO CONSOLIDATED FINANCIAL STATEMENTS (continued)
For hedging and investment purposes, the Fund may purchase and write (sell) put and call options on U.S. and foreign securities, including government securities, and foreign currencies that are traded on U.S. and foreign securities exchanges and over-the-counter markets. Among other things, the Fund may use options transactions for non-hedging purposes as a means of making direct investments in foreign currencies, as described below under “Currency Transactions” and may use options strategies involving the purchase and/or writing of various combinations of call and/or put options, for hedging and investment purposes.
The risk associated with purchasing an option is that the Fund pays a premium whether or not the option is exercised. Additionally, the Fund bears the risk of loss of the premium and change in market value should the counterparty not perform under the contract. If a put or call option purchased by the Fund were permitted to expire without being sold or exercised, its premium would represent a loss to the Fund. Put and call options purchased are accounted for in the same manner as portfolio securities. The cost of securities acquired through the exercise of call options is increased by premiums paid. The proceeds from securities sold through the exercise of put options are decreased by the premiums paid.
When the Fund writes an option, the premium received by the Fund is recorded as a liability and is subsequently adjusted to the current market value of the option written. Premiums received from written options which expire unexercised are recorded by the Fund on the expiration date as realized gains from options written. The difference between the premium received and the amount paid on effecting a closing purchase transaction, including brokerage commissions, is also treated as a realized gain, or if the premium received is less than the amount paid for the closing purchase transaction, as a realized loss. If a call option is exercised, the premium received is added to the proceeds from the sale of the underlying security or currency in determining whether the Fund has realized a gain or loss. If a put option is exercised, the premium received reduces the cost basis of the security or currency purchased by the Fund. In writing an option, the Fund bears the market risk of an unfavorable change in the price of the security or currency underlying the written option. Exercise of an option written by the Fund could result in the Fund selling or buying a security or currency at a price different from the current market value.
The Fund may also invest in options on swap agreements, also called “swaptions”. A swaption is an option that gives the buyer the right, but not the obligation, to enter into a swap on a future date in exchange for paying a market-based “premium”. A receiver swaption
| | |
| abfunds.com | | AB ALL MARKET ALTERNATIVE RETURN PORTFOLIO | 47 |
NOTES TO CONSOLIDATED FINANCIAL STATEMENTS (continued)
gives the owner the right to receive the total return of a specified asset, reference rate, or index. A payer swaption gives the owner the right to pay the total return on a specified asset, reference rate, or index. Swaptions also include options that allow an existing swap to be terminated or extended by one of the counterparties.
During the year ended October 31, 2017, the Fund held purchased swaptions for hedging and non-hedging purposes.
The Fund may enter into swaps to hedge its exposure to interest rates, credit risk, equity markets or currencies. The Fund may also enter into swaps for non-hedging purposes as a means of gaining market exposures, making direct investments in foreign currencies, as described below under “Currency Transactions” or in order to take a “long” or “short” position with respect to an underlying referenced asset described below under “Total Return Swaps”. A swap is an agreement that obligates two parties to exchange a series of cash flows at specified intervals based upon or calculated by reference to changes in specified prices or rates for a specified amount of an underlying asset. The payment flows are usually netted against each other, with the difference being paid by one party to the other. In addition, collateral may be pledged or received by the Fund in accordance with the terms of the respective swaps to provide value and recourse to the Fund or its counterparties in the event of default, bankruptcy or insolvency by one of the parties to the swap.
Risks may arise as a result of the failure of the counterparty to the swap to comply with the terms of the swap. The loss incurred by the failure of a counterparty is generally limited to the net interim payment to be received by the Fund, and/or the termination value at the end of the contract. Therefore, the Fund considers the creditworthiness of each counterparty to a swap in evaluating potential counterparty risk. This risk is mitigated by having a netting arrangement between the Fund and the counterparty and by the posting of collateral by the counterparty to the Fund to cover the Fund’s exposure to the counterparty. Additionally, risks may arise from unanticipated movements in interest rates or in the value of the underlying securities. The Fund accrues for the interim payments on swaps on a daily basis, with the net amount recorded within unrealized appreciation/depreciation of swaps on the consolidated statement of assets and liabilities, where applicable. Once the interim payments are settled in cash, the net amount is recorded as realized gain/(loss) on swaps on the consolidated statement of operations, in addition to any realized gain/(loss) recorded upon the termination of swaps. Upfront premiums paid or received are recognized as cost or proceeds on the consolidated statement of assets and liabilities and are amortized on a straight line basis over the
| | |
| 48 | AB ALL MARKET ALTERNATIVE RETURN PORTFOLIO | | abfunds.com |
NOTES TO CONSOLIDATED FINANCIAL STATEMENTS (continued)
life of the contract. Amortized upfront premiums are included in net realized gain/(loss) from swaps on the consolidated statement of operations. Fluctuations in the value of swaps are recorded as a component of net change in unrealized appreciation/depreciation of swaps on the consolidated statement of operations.
Certain standardized swaps, including certain interest rate swaps and credit default swaps, are (or soon will be) subject to mandatory central clearing. Cleared swaps are transacted through futures commission merchants (“FCMs”) that are members of central clearinghouses, with the clearinghouse serving as central counterparty, similar to transactions in futures contracts. Centralized clearing will be required for additional categories of swaps on a phased-in basis based on requirements published by the Securities and Exchange Commission and Commodity Futures Trading Commission.
At the time the Fund enters into a centrally cleared swap, the Fund deposits and maintains as collateral an initial margin with the broker, as required by the clearinghouse on which the transaction is effected. Such amount is shown as cash collateral due from broker on the consolidated statement of assets and liabilities. Pursuant to the contract, the Fund agrees to receive from or pay to the broker an amount of cash equal to the daily fluctuation in the value of the contract. Such receipts or payments are known as variation margin and are recorded by the Fund as unrealized gains or losses. Risks may arise from the potential inability of a counterparty to meet the terms of the contract. The credit/counterparty risk for centrally cleared swaps is generally less than non-centrally cleared swaps, since the clearinghouse, which is the issuer or counterparty to each centrally cleared swap, has robust risk mitigation standards, including the requirement to provide initial and variation margin. When the contract is closed, the Fund records a realized gain or loss equal to the difference between the value of the contract at the time it was opened and the time it was closed.
Interest Rate Swaps:
The Fund is subject to interest rate risk exposure in the normal course of pursuing its investment objectives. Because the Fund holds fixed rate bonds, the value of these bonds may decrease if interest rates rise. To help hedge against this risk and to maintain its ability to generate income at prevailing market rates, the Fund may enter into interest rate swaps. Interest rate swaps are agreements between two parties to exchange cash flows based on a notional amount. The Fund may elect to pay a fixed rate and receive a floating rate, or, receive a fixed rate and pay a floating rate on a notional amount.
In addition, the Fund may also enter into interest rate swap transactions to preserve a return or spread on a particular investment
| | |
| abfunds.com | | AB ALL MARKET ALTERNATIVE RETURN PORTFOLIO | 49 |
NOTES TO CONSOLIDATED FINANCIAL STATEMENTS (continued)
or portion of its portfolio, or protecting against an increase in the price of securities the Fund anticipates purchasing at a later date. Interest rate swaps involve the exchange by a Fund with another party of their respective commitments to pay or receive interest (e.g., an exchange of floating rate payments for fixed rate payments) computed based on a contractually-based principal (or “notional”) amount. Interest rate swaps are entered into on a net basis (i.e., the two payment streams are netted out, with the Fund receiving or paying, as the case may be, only the net amount of the two payments).
During the year ended October 31, 2017, the Fund held interest rate swaps for hedging and non-hedging purposes.
Total Return Swaps:
The Fund may enter into total return swaps in order to take a “long” or “short” position with respect to an underlying referenced asset. The Fund is subject to market price volatility of the underlying referenced asset. A total return swap involves commitments to pay interest in exchange for a market linked return based on a notional amount. To the extent that the total return of the security, group of securities or index underlying the transaction exceeds or falls short of the offsetting interest obligation, the Fund will receive a payment from or make a payment to the counterparty.
During the year ended October 31, 2017, the Fund held total return swaps for hedging and non-hedging purposes.
Variance Swaps:
The Fund may enter into variance swaps to hedge equity market risk or adjust exposure to the equity markets. Variance swaps are contracts in which two parties agree to exchange cash payments based on the difference between the stated level of variance and the actual variance realized on underlying asset(s) or index(es). Actual “variance” as used here is defined as the sum of the square of the returns on the reference asset(s) or index(es) (which in effect is a measure of its “volatility”) over the length of the contract term. So the parties to a variance swap can be said to exchange actual volatility for a contractually stated rate of volatility.
During the year ended October 31, 2017, the Fund held variance swaps for hedging and non-hedging purposes.
The Fund typically enters into International Swaps and Derivatives Association, Inc. Master Agreements (“ISDA Master Agreement”) with its OTC derivative contract counterparties in order to, among other things, reduce its credit risk to OTC counterparties. ISDA Master Agreements include provisions for general obligations, representations, collateral and events of default or termination. Under an ISDA Master Agreement, the
| | |
| 50 | AB ALL MARKET ALTERNATIVE RETURN PORTFOLIO | | abfunds.com |
NOTES TO CONSOLIDATED FINANCIAL STATEMENTS (continued)
Fund typically may offset with the OTC counterparty certain derivative financial instruments’ payables and/or receivables with collateral held and/or posted and create one single net payment (close-out netting) in the event of default or termination. In the event of a default by an OTC counterparty, the return of collateral with market value in excess of the Fund’s net liability, held by the defaulting party, may be delayed or denied.
The Fund’s ISDA Master Agreements may contain provisions for early termination of OTC derivative transactions in the event the net assets of the Fund decline below specific levels (“net asset contingent features”). If these levels are triggered, the Fund’s OTC counterparty has the right to terminate such transaction and require the Fund to pay or receive a settlement amount in connection with the terminated transaction. For additional details, please refer to netting arrangements by the OTC counterparty tables below.
During the year ended October 31, 2017, the Fund had entered into the following derivatives:
| | | | | | | | | | | | |
| | | Asset Derivatives | | | Liability Derivatives | |
Derivative Type | | Consolidated
Statement of
Assets and
Liabilities
Location | | Fair Value | | | Consolidated
Statement of
Assets and
Liabilities
Location | | Fair Value | |
Interest rate contracts | | Receivable/Payable for variation margin on futures | | $ | 227,789 | * | | Receivable/Payable for variation margin on futures | | $ | 329,118 | * |
| | | | |
Equity contracts | | Receivable/Payable for variation margin on futures | | | 3,418,516 | * | | Receivable/Payable for variation margin on futures | | | 6,936,943 | * |
| | | | |
Commodity contracts | | Receivable/Payable for variation margin on futures | | | 1,159,293 | * | | Receivable/Payable for variation margin on futures | | | 1,419,945 | * |
| | | | |
Interest rate contracts | | Receivable/Payable for variation margin on exchange traded swaps | | | 191,376 | * | | Receivable/Payable for variation margin on exchange traded swaps | | | 720,860 | * |
| | | | |
Foreign exchange contracts | | Unrealized appreciation on forward currency exchange contracts | | | 14,539,182 | | | Unrealized depreciation on forward currency exchange contracts | | | 14,021,899 | |
| | |
| abfunds.com | | AB ALL MARKET ALTERNATIVE RETURN PORTFOLIO | 51 |
NOTES TO CONSOLIDATED FINANCIAL STATEMENTS (continued)
| | | | | | | | | | | | |
| | | Asset Derivatives | | | Liability Derivatives | |
Derivative Type | | Consolidated
Statement of
Assets and
Liabilities
Location | | Fair Value | | | Consolidated
Statement of
Assets and
Liabilities
Location | | Fair Value | |
Interest rate contracts | | Investments in securities, at value | | $ | 21,931 | | | | | | | |
| | | | |
Commodity contracts | |
Unrealized appreciation on total return swaps | |
|
439,433 |
| |
Unrealized depreciation on total return swaps | |
$ |
606,085 |
|
| | | | |
Equity contracts | | Unrealized appreciation on total return swaps | | | 202,367 | | | Unrealized depreciation on total return swaps | | | 225,945 | |
| | | | |
Equity contracts | | Unrealized appreciation on variance swaps | | | 182,523 | | | Unrealized depreciation on variance swaps | | | 63,268 | |
| | | | | | | | | | | | |
Total | | | | $ | 20,382,410 | | | | | $ | 24,324,063 | |
| | | | | | | | | | | | |
| * | Only variation margin receivable/payable at period end is reported within the consolidated statement of assets and liabilities. This amount reflects cumulative appreciation/(depreciation) of exchange-traded derivatives as reported in the consolidated portfolio of investments. |
| | | | | | | | | | |
Derivative Type | | Location of
Gain or (Loss)
on Derivatives
Within Consolidated
Statement of
Operations | | Realized Gain
or (Loss) on
Derivatives | | | Change in
Unrealized
Appreciation or
(Depreciation) | |
Interest rate contracts | | Net realized gain (loss) on futures; Net change in unrealized appreciation/depreciation of futures | | $ | 2,811,069 | | | $ | (370,997) | |
| | | |
Equity contracts | | Net realized gain (loss) on futures; Net change in unrealized appreciation/depreciation of futures | | | (3,141,960) | | | | (3,765,500) | |
| | | |
Commodity contracts | | Net realized gain (loss) on futures; Net change in unrealized appreciation/depreciation of futures | | | (3,641,001) | | | | (197,551) | |
| | | |
Foreign exchange contracts | |
Net realized gain (loss) on forward currency exchange contracts; Net change in unrealized appreciation/depreciation of forward currency exchange contracts | |
|
(5,294,614) |
| |
|
207,247 |
|
| | |
| 52 | AB ALL MARKET ALTERNATIVE RETURN PORTFOLIO | | abfunds.com |
NOTES TO CONSOLIDATED FINANCIAL STATEMENTS (continued)
| | | | | | | | | | |
Derivative Type | | Location of
Gain or (Loss)
on Derivatives
Within Consolidated
Statement of
Operations | | Realized Gain
or (Loss) on
Derivatives | | | Change in
Unrealized
Appreciation or
(Depreciation) | |
Interest rate contracts | | Net realized gain (loss) on investment transactions; Net change in unrealized appreciation/depreciation of investments | | $ | – 0 | – | | $ | (23,280) | |
| | | |
Interest rate contracts | | Net realized gain (loss) on swaps; Net change in unrealized appreciation/depreciation of swaps | | | (1,367,237) | | | | (242,860) | |
| | | |
Commodity contracts | | Net realized gain (loss) on swaps; Net change in unrealized appreciation/depreciation of swaps | | | (11,584) | | | | (166,652) | |
| | | |
Equity contracts | | Net realized gain (loss) on swaps; Net change in unrealized appreciation/depreciation of swaps | | | 719,453 | | | | 99,060 | |
| | | | | | | | | | |
Total | | | | $ | (9,925,874 | ) | | $ | (4,460,533 | ) |
| | | | | | | | | | |
The following table represents the average monthly volume of the Fund’s derivative transactions during the year ended October 31, 2017:
| | | | |
Futures: | | | | |
Average original value of buy contracts | | $ | 179,367,915 | |
Average original value of sale contracts | | $ | 254,229,339 | |
Forward Currency Exchange Contracts: | | | | |
Average principal amount of buy contracts | | $ | 247,687,261 | |
Average principal amount of sale contracts | | $ | 276,205,340 | |
Purchased Options: | | | | |
Average monthly cost | | $ | 45,211 | (a) |
Centrally Cleared Interest Rate Swaps: | | | | |
Average notional amount | | $ | 118,328,060 | |
Total Return Swaps: | | | | |
Average notional amount | | $ | 39,831,492 | (b) |
Variance Swaps: | | | | |
Average notional amount | | $ | 113,837 | (c) |
| (a) | Positions were open for less than one month during the year. |
| (b) | Positions were open for eleven months during the year. |
| (c) | Positions were open for two months during the year. |
| | |
| abfunds.com | | AB ALL MARKET ALTERNATIVE RETURN PORTFOLIO | 53 |
NOTES TO CONSOLIDATED FINANCIAL STATEMENTS (continued)
For financial reporting purposes, the Fund does not offset derivative assets and derivative liabilities that are subject to netting arrangements in the consolidated statement of assets and liabilities.
All OTC derivatives held at period end were subject to netting arrangements. The following table presents the Fund’s derivative assets and liabilities by OTC counterparty net of amounts available for offset under ISDA Master Agreements and net of the related collateral received/pledged by the Fund as of October 31, 2017. Exchange-traded derivatives are not subject to netting arrangements and as such are excluded from the table.
| | | | | | | | | | | | | | | | | | | | |
All Market Alternative Return Portfolio | |
Counterparty | | Derivative
Assets
Subject to
a MA | | | Derivative
Available
for Offset | | | Cash
Collateral
Received* | | | Security
Collateral
Received* | | | Net
Amount of
Derivatives
Assets | |
OTC Derivatives: | |
Bank of America, NA | | $ | 6,557,719 | | | $ | (5,063,465 | ) | | $ | – 0 | – | | $ | (324,377 | ) | | $ | 1,169,877 | |
Barclays Bank PLC | | | 4,202,269 | | | | (891,537 | ) | | | – 0 | – | | | – 0 | – | | | 3,310,732 | |
BNP Paribas SA | | | 273,130 | | | | (273,130 | ) | | | – 0 | – | | | – 0 | – | | | – 0 | – |
Citibank, NA | | | 83,536 | | | | – 0 | – | | | – 0 | – | | | – 0 | – | | | 83,536 | |
Credit Suisse International | | | 433,047 | | | | (433,047 | ) | | | – 0 | – | | | – 0 | – | | | – 0 | – |
Deutsche Bank AG | | | 621,546 | | | | (490,541 | ) | | | (131,005 | ) | | | – 0 | – | | | – 0 | – |
Goldman Sachs Bank USA/Goldman Sachs International | | | 197,567 | | | | (197,567 | ) | | | – 0 | – | | | – 0 | – | | | – 0 | – |
HSBC Bank USA | | | 51,220 | | | | – 0 | – | | | – 0 | – | | | – 0 | – | | | 51,220 | |
JPMorgan Chase Bank, NA | | | 37,551 | | | | – 0 | – | | | – 0 | – | | | – 0 | – | | | 37,551 | |
Morgan Stanley Capital Services LLC | | | 202,367 | | | | (202,367 | ) | | | – 0 | – | | | – 0 | – | | | – 0 | – |
Nomura Global Financial Products, Inc. | | | 1,228,123 | | | | (65,152 | ) | | | – 0 | – | | | – 0 | – | | | 1,162,971 | |
Standard Chartered Bank | | | 278,678 | | | | (83,678 | ) | | | (195,000 | ) | | | – 0 | – | | | – 0 | – |
State Street Bank & Trust Co. | | | 770,747 | | | | (447,775 | ) | | | – 0 | – | | | – 0 | – | | | 322,972 | |
UBS AG | | | 8,503 | | | | (8,503 | ) | | | – 0 | – | | | – 0 | – | | | – 0 | – |
| | | | | | | | | | | | | | | | | | | | |
Total | | $ | 14,946,003 | | | $ | (8,156,762 | ) | | $ | (326,005 | ) | | $ | (324,377 | ) | | $ | 6,138,859 | ^ |
| | | | | | | | | | | | | | | | | | | | |
| | |
| 54 | AB ALL MARKET ALTERNATIVE RETURN PORTFOLIO | | abfunds.com |
NOTES TO CONSOLIDATED FINANCIAL STATEMENTS (continued)
| | | | | | | | | | | | | | | | | | | | |
| | | | | |
Counterparty | | Derivative
Liabilities
Subject to
a MA | | | Derivative
Available
for Offset | | | Cash
Collateral
Pledged* | | | Security
Collateral
Pledged* | | | Net
Amount of
Derivatives
Liabilities | |
OTC Derivatives: | |
Bank of America, NA | | $ | 5,063,465 | | | $ | (5,063,465 | ) | | $ | – 0 | – | | $ | – 0 | – | | $ | – 0 | – |
Barclays Bank PLC | | | 891,537 | | | | (891,537 | ) | | | – 0 | – | | | – 0 | – | | | – 0 | – |
BNP Paribas SA | | | 3,244,337 | | | | (273,130 | ) | | | – 0 | – | | | (2,752,108 | ) | | | 219,099 | |
Credit Suisse International | | | 1,210,688 | | | | (433,047 | ) | | | – 0 | – | | | (331,750 | ) | | | 445,891 | |
Deutsche Bank AG | | | 490,541 | | | | (490,541 | ) | | | – 0 | – | | | – 0 | – | | | – 0 | – |
Goldman Sachs Bank USA/Goldman Sachs International | | | 2,553,213 | | | | (197,567 | ) | | | – 0 | – | | | – 0 | – | | | 2,355,646 | |
Morgan Stanley Capital Services LLC | | | 225,945 | | | | (202,367 | ) | | | – 0 | – | | | (23,578 | ) | | | – 0 | – |
Nomura Global Financial Products, Inc. | | | 65,152 | | | | (65,152 | ) | | | – 0 | – | | | – 0 | – | | | – 0 | – |
Standard Chartered Bank | | | 83,678 | | | | (83,678 | ) | | | – 0 | – | | | – 0 | – | | | – 0 | – |
State Street Bank & Trust Co. | | | 447,775 | | | | (447,775 | ) | | | – 0 | – | | | – 0 | – | | | – 0 | – |
UBS AG | | | 34,781 | | | | (8,503 | ) | | | – 0 | – | | | – 0 | – | | | 26,278 | |
| | | | | | | | | | | | | | | | | | | | |
Total | | $ | 14,311,112 | | | $ | (8,156,762 | ) | | $ | – 0 | – | | $ | (3,107,436 | ) | | $ | 3,046,914 | ^ |
| | | | | | | | | | | | | | | | | | | | |
AllianceBernstein All Market Alternative Return (Cayman) Ltd.
| | | | | | | | | | | | | | | | | | | | |
Counterparty | | Derivative
Assets
Subject to
a MA | | | Derivative
Available
for Offset | | | Cash
Collateral
Received* | | | Security
Collateral
Received* | | | Net
Amount of
Derivatives
Assets | |
OTC Derivatives: | |
Barclays Bank PLC | | $ | 147,558 | | | $ | (147,558 | ) | | $ | – 0 | – | | $ | – 0 | – | | $ | – 0 | – |
Goldman Sachs International | | | 97,443 | | | | – 0 | – | | | – 0 | – | | | – 0 | – | | | 97,443 | |
JPMorgan Chase Bank, NA | | | 194,432 | | | | (167,799 | ) | | | – 0 | – | | | – 0 | – | | | 26,633 | |
| | | | | | | | | | | | | | | | | | | | |
Total | | $ | 439,433 | | | $ | (315,357 | ) | | $ | – 0 | – | | $ | – 0 | – | | $ | 124,076 | ^ |
| | | | | | | | | | | | | | | | | | | | |
| | |
| abfunds.com | | AB ALL MARKET ALTERNATIVE RETURN PORTFOLIO | 55 |
NOTES TO CONSOLIDATED FINANCIAL STATEMENTS (continued)
| | | | | | | | | | | | | | | | | | | | |
| | | | | |
Counterparty | | Derivative
Liabilities
Subject to
a MA | | | Derivative
Available
for Offset | | | Cash
Collateral
Pledged* | | | Security
Collateral
Pledged* | | | Net
Amount of
Derivatives
Liabilities | |
OTC Derivatives: | |
Barclays Bank PLC | | $ | 306,538 | | | $ | (147,558 | ) | | $ | (158,980 | ) | | $ | – 0 | – | | $ | – 0 | – |
Credit Suisse International | | | 131,748 | | | | – 0 | – | | | (131,748 | ) | | | – 0 | – | | | – 0 | – |
JPMorgan Chase Bank, NA | | | 167,799 | | | | (167,799 | ) | | | – 0 | – | | | – 0 | – | | | – 0 | – |
| | | | | | | | | | | | | | | | | | | | |
Total | | $ | 606,085 | | | $ | (315,357 | ) | | $ | (290,728 | ) | | $ | – 0 | – | | $ | – 0 | –^ |
| | | | | | | | | | | | | | | | | | | | |
| * | The actual collateral received/pledged may be more than the amount reported due to over-collateralization. |
| ^ | Net amount represents the net receivable/payable that would be due from/to the counterparty in the event of default or termination. The net amount from OTC financial derivative instruments can only be netted across transactions governed under the same master agreement with the same counterparty. |
2. Currency Transactions
The Fund may invest in non-U.S. Dollar-denominated securities on a currency hedged or unhedged basis. The Fund may seek investment opportunities by taking long or short positions in currencies through the use of currency-related derivatives, including forward currency exchange contracts, futures and options on futures, swaps, and other options. The Fund may enter into transactions for investment opportunities when it anticipates that a foreign currency will appreciate or depreciate in value but securities denominated in that currency are not held by the Fund and do not present attractive investment opportunities. Such transactions may also be used when the Adviser believes that it may be more efficient than a direct investment in a foreign currency-denominated security. The Fund may also conduct currency exchange contracts on a spot basis (i.e., for cash at the spot rate prevailing in the currency exchange market for buying or selling currencies).
NOTE E
Capital Stock
Each class consists of 1,000,000,000 authorized shares. Transactions in capital shares for each class were as follows:
| | | | | | | | | | | | | | | | | | | | | | | | |
| | | | | | | | | | | | | | | | | | | | | | | | |
| | | Shares | | | | | | Amount | | | | |
| | | Year Ended
October 31,
2017 | | | Year Ended
October 31,
2016 | | | | | | Year Ended
October 31,
2017 | | | Year Ended
October 31,
2016 | | | | |
| | | | | | | | |
| Class A | | | | | |
Shares issued in reinvestment of distributions | | | 197 | | | | – 0 | – | | | | | | $ | 1,628 | | | $ | – 0 | – | | | | |
| | | | | |
Net increase | | | 197 | | | | – 0 | – | | | | | | $ | 1,628 | | | $ | – 0 | – | | | | |
| | | | | |
| | | | | | | | | | | | | | | | | | | | | | | | |
| | |
| 56 | AB ALL MARKET ALTERNATIVE RETURN PORTFOLIO | | abfunds.com |
NOTES TO CONSOLIDATED FINANCIAL STATEMENTS (continued)
| | | | | | | | | | | | | | | | | | | | | | | | |
| | | Shares | | | | | | Amount | | | | |
| | | Year Ended
October 31,
2017 | | | Year Ended
October 31,
2016 | | | | | | Year Ended
October 31,
2017 | | | Year Ended
October 31,
2016 | | | | |
| | | | | | | | |
Class C | | | | | |
Shares issued in reinvestment of distributions | | | 189 | | | | – 0 | – | | | | | | $ | 1,550 | | | $ | – 0 | – | | | | |
| | | | | |
Net increase | | | 189 | | | | – 0 | – | | | | | | $ | 1,550 | | | $ | – 0 | – | | | | |
| | | | | |
| | | | | | | | | | | | | | | | | | | | | | | | |
Advisor Class | | | | | |
Shares sold | | | 25,419,522 | | | | – 0 | – | | | | | | $ | 216,663,517 | | | $ | – 0 | – | | | | |
| | | | | |
Shares issued in reinvestment of distributions | | | 359,361 | | | | – 0 | – | | | | | | | 2,971,914 | | | | – 0 | – | | | | |
| | | | | |
Net increase | | | 25,778,883 | | | | – 0 | – | | | | | | $ | 219,635,431 | | | $ | – 0 | – | | | | |
| | | | | |
At October 31, 2017, the Adviser owns approximately 82% of the Fund’s outstanding shares. Significant transactions by such shareholder, if any, may impact the Fund’s performance.
NOTE F
Risks Involved in Investing in the Fund
Allocation Risk—The allocation of the Fund’s assets among different strategies and asset classes, such as equity securities, debt securities and currencies, may have a significant effect on the Fund’s net asset value, or NAV, when one of these asset classes is performing better or worse than others.
Derivatives Risk—The Fund may enter into derivative transactions such as forwards, options, futures and swaps. Derivatives may be illiquid, difficult to price, and leveraged so that small changes may produce disproportionate losses for the Fund, and subject to counterparty risk to a greater degree than more traditional investments. Derivatives may result in significant losses, including losses that are far greater than the value of the derivatives reflected on the consolidated statement of assets and liabilities.
Leverage Risk—When the Fund borrows money or otherwise leverages its investments, its performance may be volatile because leverage tends to exaggerate the effect of any increase or decrease in the value of the Fund’s investments. The Fund may create leverage through the use of reverse repurchase arrangements, forward currency exchange contracts, forward commitments, dollar rolls or futures or by borrowing money. The use of other types of derivative instruments by the Fund, such as options and swaps, may also result in a form of leverage. Leverage may result in higher returns to the Fund than if the Fund were not leveraged, but may also adversely affect returns, particularly if the market is declining.
| | |
| abfunds.com | | AB ALL MARKET ALTERNATIVE RETURN PORTFOLIO | 57 |
NOTES TO CONSOLIDATED FINANCIAL STATEMENTS (continued)
Short Sale Risk—Short sales involve the risk that the Fund will incur a loss by subsequently buying a security at a higher price than the price at which it sold the security. The amount of such loss is theoretically unlimited, as it will be based on the increase in value of the security sold short. In contrast, the risk of loss from a long position is limited to the Fund’s investment in the security, because the price of the security cannot fall below zero. The Fund may not always be able to close out a short position on favorable terms.
Interest Rate Risk and Credit Risk—Interest rate risk is the risk that changes in interest rates will affect the value of the Fund’s investments in fixed-income debt securities such as bonds or notes. Increases in interest rates may cause the value of the Fund’s investments to decline. Credit risk is the risk that the issuer or guarantor of a debt security, or the counterparty to a derivative contract, will be unable or unwilling to make timely principal and/or interest payments, or to otherwise honor its obligations. The degree of risk for a particular security may be reflected in its credit rating. Credit risk is greater for medium quality and lower-rated securities. Lower-rated debt securities and similar unrated securities (commonly known as “junk bonds”) have speculative elements or are predominantly speculative risks.
Foreign (Non-U.S.) Risk—Investments in securities of non-U.S. issuers may involve more risk than those of U.S. issuers. These securities may fluctuate more widely in price and may be less liquid due to adverse market, economic, political, regulatory or other factors.
Emerging Market Risk—Investments in emerging market countries may have more risk because the markets are less developed and less liquid, and because these investments may be subject to increased economic, political, regulatory, or other uncertainties.
Currency Risk—Fluctuations in currency exchange rates may negatively affect the value of the Fund’s investments or reduce its returns.
Commodity Risk—Investing in commodities and commodity-linked derivative instruments may subject the Fund to greater volatility than investments in traditional securities. The value of commodity-linked derivative instruments may be affected by overall market movements, commodity index volatility, changes in interest rates, or factors affecting a particular industry or commodity, such as drought, floods, weather, livestock disease, embargoes, tariffs and international economic, political and regulatory developments.
Subsidiary Risk—By investing in the Subsidiary, the Fund is indirectly exposed to the risks associated with the Subsidiary. The derivatives and other investments held by the Subsidiary are generally similar to those that are permitted to be held by the Fund and are subject to the same risks that
| | |
| 58 | AB ALL MARKET ALTERNATIVE RETURN PORTFOLIO | | abfunds.com |
NOTES TO CONSOLIDATED FINANCIAL STATEMENTS (continued)
apply to similar investments if held directly by the Fund. The Subsidiary is not registered under the Investment Company Act of 1940, as amended (the “1940 Act”), and, unless otherwise noted in the Fund’s prospectus, is not subject to all of the investor protections of the 1940 Act. However, the Fund wholly owns and controls the Subsidiary, and the Fund and the Subsidiary are managed by the Adviser, making it unlikely the Subsidiary will take actions contrary to the interests of the Fund or its shareholders. In addition, changes in federal tax laws applicable to the Fund or interpretations thereof could limit the Fund’s ability to gain exposure to commodities investments through investments in the Subsidiary.
Real Estate Risk—The Fund’s investments in the real estate market have many of the same risks as direct ownership of real estate, including the risk that the value of real estate could decline due to a variety of factors that affect the real estate market generally. Investments in REITs, may have additional risks. REITs are dependent on the capability of their managers, may have limited diversification, and could be significantly affected by changes in taxes.
Non-Diversification Risk—The Fund may have more risk because it is “non-diversified”, meaning that it can invest more of its assets in a smaller number of issuers. Accordingly, changes in the value of a single security may have a more significant effect, either negative or positive, on the Fund’s NAV.
Active Trading Risk—The Fund expects to engage in active and frequent trading of its portfolio securities and its portfolio turnover rate is expected to greatly exceed 100%. A higher rate of portfolio turnover increases transaction costs, which may negatively affect the Fund’s return. In addition, a high rate of portfolio turnover may result in substantial short-term gains, which may have adverse tax consequences for Fund shareholders.
Indemnification Risk—In the ordinary course of business, the Fund enters into contracts that contain a variety of indemnifications. The Fund’s maximum exposure under these arrangements is unknown. However, the Fund has not had prior claims or losses pursuant to these indemnification provisions and expects the risk of loss thereunder to be remote. Therefore, the Fund has not accrued any liability in connection with these indemnification provisions.
NOTE G
Distributions to Shareholders
The tax character of distributions paid during the fiscal years ended October 31, 2017 and October 31, 2016 were as follows:
| | | | | | | | |
| | | 2017 | | | 2016 | |
Distributions paid from: | | | | | | | | |
Ordinary income | | $ | 2,975,092 | | | $ | 40,501 | |
| | | | | | | | |
Total distributions paid | | $ | 2,975,092 | | | $ | 40,501 | |
| | | | | | | | |
| | |
| abfunds.com | | AB ALL MARKET ALTERNATIVE RETURN PORTFOLIO | 59 |
NOTES TO CONSOLIDATED FINANCIAL STATEMENTS (continued)
As of October 31, 2017, the components of accumulated earnings/(deficit) on a tax basis were as follows:
| | | | |
Accumulated capital and other losses | | $ | (4,612,900 | )(a) |
Unrealized appreciation/(depreciation) | | | (2,577,962 | )(b) |
| | | | |
Total accumulated earnings/(deficit) | | $ | (7,190,862 | ) |
| | | | |
| (a) | As of October 31, 2017, the Fund had a net capital loss carryforward of $4,612,900. |
| (b) | The differences between book-basis and tax-basis unrealized appreciation/(depreciation) are attributable primarily to the tax deferral of losses on wash sales, the tax treatment of swaps, the tax treatment of passive foreign investment companies (PFICs), and the recognition for tax purposes of unrealized gains/losses on certain derivative instruments. |
For tax purposes, net realized capital losses may be carried over to offset future capital gains, if any. Funds are permitted to carry forward capital losses incurred for an indefinite period, and such losses will retain their character as either short-term or long-term capital losses. As of October 31, 2017, the Fund had a net long-term capital loss carryforward of $4,612,900 which may be carried forward for an indefinite period.
During the current fiscal year, permanent differences primarily due to the tax treatment of swaps, the tax treatment of passive foreign investment companies (PFICs), foreign currency reclassifications, the disallowance of a net operating loss, and book/tax differences associated with the treatment of earnings from the Subsidiary resulted in a net decrease in undistributed net investment income, a net decrease in accumulated net realized loss on investment and foreign currency transactions, and a net decrease in additional paid-in capital. These reclassifications had no effect on net assets.
NOTE H
Recent Accounting Pronouncements
In March 2017, the Financial Accounting Standards Board issued an Accounting Standards Update, ASU 2017-08, Receivables—Nonrefundable Fees and Other Costs (Subtopic 310-20), Premium Amortization on Purchased Callable Debt Securities (the “ASU”) which amends the amortization period for certain purchased callable debt securities held at a premium, shortening such period to the earliest call date. The ASU does not require any accounting change for debt securities held at a discount; the discount continues to be amortized to maturity. The ASU is effective for fiscal years, and interim periods within those fiscal years, beginning after December 15, 2018. At this time, management is evaluating the implications of these changes on the consolidated financial statements.
NOTE I
Subsequent Events
Management has evaluated subsequent events for possible recognition or disclosure in the consolidated financial statements through the date the consolidated financial statements are issued. Management has determined that there are no material events that would require disclosure in the Fund’s consolidated financial statements through this date.
| | |
| 60 | AB ALL MARKET ALTERNATIVE RETURN PORTFOLIO | | abfunds.com |
CONSOLIDATED FINANCIAL HIGHLIGHTS
Selected Data For A Share Of Capital Stock Outstanding Throughout Each Period
| | | | | | | | | | | | |
| | | Class A | |
| | | Year Ended October 31, | | | March 9,
2015(a) to
October 31,
2015 | |
| | | 2017 | | | 2016 | | |
| | | | |
| | | | | | | | | | | | |
Net asset value, beginning of period | | | $ 10.25 | | | | $ 9.81 | | | | $ 10.00 | |
| | | | |
Income From Investment Operations | | | | | | | | | | | | |
Net investment income (loss)(b)(c) | | | .00 | (d) | | | (.05 | ) | | | (.10 | ) |
Net realized and unrealized gain (loss) on investment and foreign currency transactions | | | (.33 | ) | | | .24 | | | | (.09 | ) |
Contributions from Affiliates | | | .00 | (d) | | | .27 | | | | – 0 | – |
| | | | |
Net increase (decrease) in net asset value from operations | | | (.33 | ) | | | .46 | | | | (.19 | ) |
| | | | |
Less: Dividends and Distributions | | | | | | | | | | | | |
Dividends from net investment income | | | (1.63 | ) | | | – 0 | – | | | – 0 | – |
Distributions from net realized gain on investment transactions | | | – 0 | – | | | (.02 | ) | | | – 0 | – |
| | | | |
Total dividends and distributions | | | (1.63 | ) | | | (.02 | ) | | | – 0 | – |
| | | | |
Net asset value, end of period | | | $ 8.29 | | | | $ 10.25 | | | | $ 9.81 | |
| | | | |
Total Return | | | | | | | | | | | | |
Total investment return based on net asset value(e)(f) | | | (3.22 | )% | | | 4.73 | %* | | | (1.90 | )% |
Ratios/Supplemental Data | | | | | | | | | | | | |
Net assets, end of period (000’s omitted) | | | $10 | | | | $10 | | | | $10 | |
Ratio to average net assets of: | | | | | | | | | | | | |
Expenses, net of waivers/reimbursements(g)(h) | | | 1.18 | % | | | 1.53 | % | | | 1.55 | %^ |
Expenses, before waivers/reimbursements(g)(h) | | | 2.27 | % | | | 4.01 | % | | | 3.84 | %^ |
Net investment income (loss)(b) | | | .03 | % | | | (.49 | )% | | | (1.47 | )%^ |
Portfolio turnover rate | | | 224 | % | | | 429 | % | | | 2078 | % |
See footnote summary on page 64.
| | |
| abfunds.com | | AB ALL MARKET ALTERNATIVE RETURN PORTFOLIO | 61 |
CONSOLIDATED FINANCIAL HIGHLIGHTS (continued)
Selected Data For A Share Of Capital Stock Outstanding Throughout Each Period
| | | | | | | | | | | | |
| | | Class C | |
| | | Year Ended October 31, | | | March 9,
2015(a) to
October 31,
2015 | |
| | | 2017 | | | 2016 | | |
| | | | |
| | | | | | | | | | | | |
Net asset value, beginning of period | | | $ 10.12 | | | | $ 9.76 | | | | $ 10.00 | |
| | | | |
Income From Investment Operations | | | | | | | | | | | | |
Net investment loss(b)(c) | | | (.06 | ) | | | (.12 | ) | | | (.14 | ) |
Net realized and unrealized gain (loss) on investment and foreign currency transactions | | | (.33 | ) | | | .24 | | | | (.10 | ) |
Contributions from Affiliates | | | .00 | (d) | | | .26 | | | | – 0 | – |
| | | | |
Net increase (decrease) in net asset value from operations | | | (.39 | ) | | | .38 | | | | (.24 | ) |
| | | | |
Less: Dividends and Distributions | | | | | | | | | | | | |
Dividends from net investment income | | | (1.55 | ) | | | – 0 | – | | | – 0 | – |
Distributions from net realized gain on investment transactions | | | – 0 | – | | | (.02 | ) | | | – 0 | – |
| | | | |
Total dividends and distributions | | | (1.55 | ) | | | (.02 | ) | | | – 0 | – |
| | | | |
Net asset value, end of period | | | $ 8.18 | | | | $ 10.12 | | | | $ 9.76 | |
| | | | |
Total Return | | | | | | | | | | | | |
Total investment return based on net asset value(e)(f) | | | (3.95 | )% | | | 3.94 | %* | | | (2.40 | )% |
Ratios/Supplemental Data | | | | | | | | | | | | |
Net assets, end of period (000’s omitted) | | | $10 | | | | $10 | | | | $10 | |
Ratio to average net assets of: | | | | | | | | | | | | |
Expenses, net of waivers/reimbursements(g)(h) | | | 1.93 | % | | | 2.28 | % | | | 2.30 | %^ |
Expenses, before waivers/reimbursements(g)(h) | | | 3.10 | % | | | 4.84 | % | | | 4.64 | %^ |
Net investment loss(b) | | | (.72 | )% | | | (1.24 | )% | | | (2.20 | )%^ |
Portfolio turnover rate | | | 224 | % | | | 429 | % | | | 2078 | % |
See footnote summary on page 64.
| | |
| 62 | AB ALL MARKET ALTERNATIVE RETURN PORTFOLIO | | abfunds.com |
CONSOLIDATED FINANCIAL HIGHLIGHTS (continued)
Selected Data For A Share Of Capital Stock Outstanding Throughout Each Period
| | | | | | | | | | | | |
| | | Advisor Class | |
| | | Year Ended October 31, | | | March 9, 2015(a) to October 31,
2015 | |
| | | 2017 | | | 2016 | | |
| | | | |
| | | | | | | | | | | | |
Net asset value, beginning of period | | | $ 10.29 | | | | $ 9.82 | | | | $ 10.00 | |
| | | | |
Income From Investment Operations | | | | | | | | | | | | |
Net investment income (loss)(b)(c) | | | .02 | | | | (.02 | ) | | | (.08 | ) |
Net realized and unrealized gain (loss) on investment and foreign currency transactions | | | (.35 | ) | | | .24 | | | | (.10 | ) |
Contributions from Affiliates | | | .00 | (d) | | | .27 | | | | – 0 | – |
| | | | |
Net increase (decrease) in net asset value from operations | | | (.33 | ) | | | .49 | | | | (.18 | ) |
| | | | |
Less: Dividends and Distributions | | | | | | | | | | | | |
Dividends from net investment income | | | (1.65 | ) | | | – 0 | – | | | – 0 | – |
Distributions from net realized gain on investment transactions | | | – 0 | – | | | (.02 | ) | | | – 0 | – |
| | | | |
Total dividends and distributions | | | (1.65 | ) | | | (.02 | ) | | | – 0 | – |
| | | | |
Net asset value, end of period | | | $ 8.31 | | | | $ 10.29 | | | | $ 9.82 | |
| | | | |
Total Return | | | | | | | | | | | | |
Total investment return based on net asset value(e)(f) | | | (3.04 | )% | | | 5.03 | %* | | | (1.80 | )% |
Ratios/Supplemental Data | | | | | | | | | | | | |
Net assets, end of period (000’s omitted) | | | $229,299 | | | | $18,502 | | | | $17,657 | |
Ratio to average net assets of: | | | | | | | | | | | | |
Expenses, net of waivers/reimbursements(g)(h) | | | .94 | % | | | 1.27 | % | | | 1.30 | %^ |
Expenses, before waivers/reimbursements(g)(h) | | | 1.19 | % | | | 3.76 | % | | | 3.57 | %^ |
Net investment income (loss)(b) | | | .24 | % | | | (.24 | )% | | | (1.21 | )%^ |
Portfolio turnover rate | | | 224 | % | | | 429 | % | | | 2078 | % |
See footnote summary on page 64.
| | |
| abfunds.com | | AB ALL MARKET ALTERNATIVE RETURN PORTFOLIO | 63 |
CONSOLIDATED FINANCIAL HIGHLIGHTS (continued)
Selected Data For A Share Of Capital Stock Outstanding Throughout Each Period
| (a) | Commencement of operations. |
| (b) | Net of fees and expenses waived/reimbursed by the Adviser. |
| (c) | Based on average shares outstanding. |
| (d) | Amount is less than $.005. |
| (e) | Total investment return is calculated assuming an initial investment made at the net asset value at the beginning of the period, reinvestment of all dividends and distributions at net asset value during the period, and redemption on the last day of the period. Initial sales charges or contingent deferred sales charges are not reflected in the calculation of total investment return. Total return does not reflect the deduction of taxes that a shareholder would pay on fund distributions or the redemption of fund shares. Total investment return calculated for a period of less than one year is not annualized. |
| (f) | The net asset value and total return include adjustments in accordance with accounting principles generally accepted in the United States of America for financial reporting purposes. As such, the net asset value and total return for shareholder transactions may differ from financial statements. |
| (g) | In connection with the Fund’s investments in affiliated underlying portfolios, the Fund incurs no direct expenses, but bear proportionate shares of the fees and expenses (i.e., operating, administrative and investment advisory fees) of the affiliated underlying portfolios. The Adviser has contractually agreed to waive its fees from the Fund in an amount equal to the Fund’s pro rata share of certain acquired fund fees and expenses, and for the year ended October 31, 2017 and year ended October 31, 2016 (annualized), such waiver amounted to 0.06% and 0.03%, respectively. |
| (h) | The expense ratios presented below exclude interest expense: |
| | | | | | | | | | | | |
| | | Year Ended October 31, | | | March 9,
2015(a) to
October 31,
2015 | |
| | | 2017 | | | 2016 | | |
Class A | | | | | | | | | | | | |
Net of waivers | | | N/A | | | | 1.52 | % | | | N/A | |
Before waivers | | | N/A | | | | 4.00 | % | | | N/A | |
Class C | | | | | | | | | | | | |
Net of waivers | | | N/A | | | | 2.27 | % | | | N/A | |
Before waivers | | | N/A | | | | 4.83 | % | | | N/A | |
Advisor Class | | | | | | | | | | | | |
Net of waivers | | | N/A | | | | 1.27 | % | | | N/A | |
Before waivers | | | N/A | | | | 3.75 | % | | | N/A | |
| * | Includes the impact of a voluntary reimbursement from the Adviser for trading losses incurred due to a trade entry error; absent of such payment, the Fund’s performance would have been reduced by 2.71% for the year ended October 31, 2016. |
See notes to financial statements.
| | |
| 64 | AB ALL MARKET ALTERNATIVE RETURN PORTFOLIO | | abfunds.com |
REPORT OF INDEPENDENT REGISTERED
PUBLIC ACCOUNTING FIRM
To the Board of Directors and Shareholders of AB All Market Alternative Return Portfolio
We have audited the accompanying consolidated statement of assets and liabilities, including the consolidated portfolio of investments, of AB All Market Alternative Return Portfolio (the “Fund”), one of the portfolios constituting AB Cap Fund, Inc., as of October 31, 2017, and the related consolidated statement of operations for the year then ended, the consolidated statements of changes in net assets for each of the two years in the period then ended and the consolidated financial highlights for each of the two years in the period then ended and for the period March 9, 2015 (commencement of operations) to October 31, 2015. These financial statements and financial highlights are the responsibility of the Fund’s management. Our responsibility is to express an opinion on these financial statements and financial highlights based on our audits.
We conducted our audits in accordance with the standards of the Public Company Accounting Oversight Board (United States). Those standards require that we plan and perform the audit to obtain reasonable assurance about whether the financial statements and financial highlights are free of material misstatement. We were not engaged to perform an audit of the Fund’s internal control over financial reporting. Our audits included consideration of internal control over financial reporting as a basis for designing audit procedures that are appropriate in the circumstances, but not for the purpose of expressing an opinion on the effectiveness of the Fund’s internal control over financial reporting. Accordingly, we express no such opinion. An audit also includes examining, on a test basis, evidence supporting the amounts and disclosures in the financial statements and financial highlights, assessing the accounting principles used and significant estimates made by management, and evaluating the overall financial statement presentation. Our procedures included confirmation of securities owned as of October 31, 2017, by correspondence with the custodian and others, or by other appropriate auditing procedures where replies from others were not received. We believe that our audits provide a reasonable basis for our opinion.
In our opinion, the financial statements and financial highlights referred to above present fairly, in all material respects, the consolidated financial position of AB All Market Alternative Return Portfolio, one of the portfolios constituting the AB Cap Fund, Inc., at October 31, 2017, the consolidated results of its operations for the year then ended, the consolidated changes in its net assets for each of the two years in the period then ended and the consolidated financial highlights for each of the two years in the period then ended and for the period March 9, 2015 (commencement of operations) to October 31, 2015, in conformity with U.S. generally accepted accounting principles.

New York, New York
December 29, 2017
| | |
| abfunds.com | | AB ALL MARKET ALTERNATIVE RETURN PORTFOLIO | 65 |
2017 FEDERAL TAX INFORMATION
(unaudited)
For Federal income tax purposes, the following information is furnished with respect to the distributions paid by the Fund during the taxable year ended October 31, 2017. For individual shareholders, the Fund designates 5.22% of dividends paid as qualified dividend income. For foreign shareholders, 1.82% of ordinary income dividends paid may be considered to be qualifying to be taxed as interest-related dividends.
Shareholders should not use the above information to prepare their income tax returns. The information necessary to complete your income tax returns will be included with your Form 1099-DIV which will be sent to you separately in January 2018.
| | |
| 66 | AB ALL MARKET ALTERNATIVE RETURN PORTFOLIO | | abfunds.com |
BOARD OF DIRECTORS
| | |
Marshall C. Turner, Jr.(1) , Chairman John H. Dobkin(1)(2) Michael J. Downey(1) William H. Foulk, Jr.(1) D. James Guzy(1)(2) | | Nancy P. Jacklin(1) Robert M. Keith, President and Chief Executive Officer Carol C. McMullen(1) Garry L. Moody(1) Earl D. Weiner(1) |
OFFICERS
| | |
Philip L. Kirstein(3) , Senior Vice President and Independent Compliance Officer Brian T. Brugman(4) , Vice President Daniel J. Loewy(4) , Vice President Vadim Zlotnikov(4) , Vice President | | Joseph J. Mantineo, Treasurer and Chief Financial Officer Emilie D. Wrapp, Secretary Phyllis J. Clarke, Controller Vincent S. Noto, Chief Compliance Officer |
| | |
Custodian and Accounting Agent State Street Bank and Trust Company State Street Corporation CCB/5 1 Iron Street Boston, MA 02210 Principal Underwriter AllianceBernstein Investments, Inc. 1345 Avenue of the Americas New York, NY 10105 Transfer Agent AllianceBernstein Investor Services, Inc. P.O. Box 786003 San Antonio, TX 78278-6003 Toll-Free (800) 221-5672 | | Independent Registered Public Accounting Firm Ernst & Young LLP 5 Times Square New York, NY 10036 Legal Counsel Seward & Kissel LLP One Battery Park Plaza New York, NY 10004 |
| 1 | Member of the Audit Committee, the Governance and Nominating Committee and the Independent Directors Committee. |
| 2 | Messrs. Dobkin and Guzy are expected to retire on or about December 31, 2017. |
| 3 | Mr. Kirstein is expected to retire on or about December 31, 2017. |
| 4 | The day-to-day management of, and investment decisions for, the Fund are made by its senior investment management team. Messrs. Brugman, Loewy, and Zlotnikov are the investment professionals with the most significant responsibility for the day-to-day management of the Fund’s portfolio. |
| | |
| abfunds.com | | AB ALL MARKET ALTERNATIVE RETURN PORTFOLIO | 67 |
MANAGEMENT OF THE FUND
| | | | | | | | |
NAME,
ADDRESS*, AGE AND
(YEAR FIRST ELECTED**) | | PRINCIPAL OCCUPATION(S) DURING PAST FIVE (5) YEARS AND OTHER INFORMATION*** | | PORTFOLIOS IN AB FUND COMPLEX OVERSEEN BY
DIRECTOR | | | OTHER
PUBLIC COMPANY DIRECTORSHIPS CURRENTLY HELD
BY DIRECTOR |
| INTERESTED DIRECTOR | | | | | | | | |
Robert M. Keith+ 1345 Avenue of the Americas, New York, NY 10105 57 (2015) | | Senior Vice President of AllianceBernstein L.P. (the “Adviser”)++ and the head of AllianceBernstein Investments, Inc. (“ABI”)++ since July 2008; Director of ABI and President of the AB Mutual Funds. Previously, he served as Executive Managing Director of ABI from December 2006 to June 2008. Prior to joining ABI in 2006, Executive Managing Director of Bernstein Global Wealth Management, and prior thereto, Senior Managing Director and Global Head of Client Service and Sales of the Adviser’s institutional investment management business since 2004. Prior thereto, he was Managing Director and Head of North American Client Service and Sales in the Adviser’s institutional investment management business, with which he had been associated since prior to 2004. | | | 96 | | | None |
| | |
| 68 | AB ALL MARKET ALTERNATIVE RETURN PORTFOLIO | | abfunds.com |
MANAGEMENT OF THE FUND (continued)
| | | | | | | | |
NAME,
ADDRESS*, AGE AND
(YEAR FIRST ELECTED**) | | PRINCIPAL OCCUPATION(S) DURING PAST FIVE (5) YEARS AND OTHER INFORMATION*** | | PORTFOLIOS IN AB FUND COMPLEX OVERSEEN BY
DIRECTOR | | | OTHER
PUBLIC COMPANY DIRECTORSHIPS CURRENTLY HELD
BY DIRECTOR |
| INDEPENDENT DIRECTORS | | | | | | |
Marshall C. Turner, Jr.# Chairman of the Board 76 (2015) | | Private Investor since prior to 2012. Former Chairman and CEO of Dupont Photomasks, Inc. (components of semi-conductor manufacturing). He has extensive operating leadership, and venture capital investing experience, including five interim or full-time CEO roles, and prior service as a general partner of institutional venture capital partnerships. He also has extensive nonprofit board leadership experience, and currently serves on the boards of two education and science-related nonprofit organizations. He has served as a director of one AB Fund since 1992, and director or trustee of multiple AB Funds since 2005. He has been Chairman of the AB Funds since January 2014, and the Chairman of the Independent Directors Committees of such AB Funds since February 2014. | | | 96 | | | Xilinx, Inc. (programmable logic semi-conductors) since 2007 |
| | | | | | | | |
John H. Dobkin#,^ 75 (2015) | | Independent Consultant since prior to 2012. Formerly, President of Save Venice, Inc. (preservation organization) from 2001-2002; Senior Advisor from June 1999 - June 2000 and President of Historic Hudson Valley (historic preservation) from December 1989 - May 1999. Previously, Director of the National Academy of Design. He has served as a director or trustee of various AB Funds since 1992 and as Chairman of the Audit Committees of a number of such AB Funds from 2001-2008. | | | 95 | | | None |
| | |
| abfunds.com | | AB ALL MARKET ALTERNATIVE RETURN PORTFOLIO | 69 |
MANAGEMENT OF THE FUND (continued)
| | | | | | | | |
NAME,
ADDRESS*, AGE AND
(YEAR FIRST ELECTED**) | | PRINCIPAL OCCUPATION(S) DURING PAST FIVE (5) YEARS AND OTHER INFORMATION*** | | PORTFOLIOS IN AB FUND COMPLEX OVERSEEN BY
DIRECTOR | | | OTHER
PUBLIC COMPANY DIRECTORSHIPS CURRENTLY HELD
BY DIRECTOR |
INDEPENDENT DIRECTORS
(continued) | | | | | | |
Michael J. Downey# 73 (2015) | | Private Investor since prior to 2012. Formerly, managing partner of Lexington Capital, LLC (investment advisory firm) from December 1997 until December 2003. He served as a Director of Prospect Acquisition Corp. (financial services) from 2007 until 2009. From 1987 until 1993, Chairman and CEO of Prudential Mutual Fund Management, director of the Prudential mutual funds, and member of the Executive Committee of Prudential Securities Inc. He has served as a director or trustee of the AB Funds since 2005 and is a director and Chairman of one other registered investment company. | | | 96 | | | The Asia Pacific Fund, Inc. (registered investment company) since prior to 2012 |
| | | | | | | | |
William H. Foulk, Jr.# 85 (2015) | | Investment Adviser and an Independent Consultant since prior to 2012. Previously, he was Senior Manager of Barrett Associates, Inc., a registered investment adviser. He was formerly Deputy Comptroller and Chief Investment Officer of the State of New York and, prior thereto, Chief Investment Officer of the New York Bank for Savings. He has served as a director or trustee of various AB Funds since 1983, and was Chairman of the Independent Directors Committees of the AB Funds from 2003 until early February 2014. He served as Chairman of such AB Funds from 2003 through December 2013. He is also active in a number of mutual fund related organizations and committees. | | | 96 | | | None |
| | |
| 70 | AB ALL MARKET ALTERNATIVE RETURN PORTFOLIO | | abfunds.com |
MANAGEMENT OF THE FUND (continued)
| | | | | | | | |
NAME,
ADDRESS*, AGE AND
(YEAR FIRST ELECTED**) | | PRINCIPAL OCCUPATION(S) DURING PAST FIVE (5) YEARS AND OTHER INFORMATION*** | | PORTFOLIOS IN AB FUND COMPLEX OVERSEEN BY
DIRECTOR | | | OTHER
PUBLIC COMPANY DIRECTORSHIPS CURRENTLY HELD
BY DIRECTOR |
INDEPENDENT DIRECTORS
(continued) | | | | | | |
D. James Guzy#,^
81
(2015) | | Chairman of the Board of SRC Computers, Inc. (semi-conductors), with which he has been associated since prior to 2012. He served as Chairman of the Board of PLX Technology (semi-conductors) since prior to 2011 until November 2013. He was a director of Intel Corporation (semi-conductors) from 1969 until 2008, and served as Chairman of the Finance Committee of such company for several years until May 2008. He has served as a director or trustee of one or more of the AB Funds since 1982. | | | 93 | | | None |
| | | | | | | | |
Nancy P. Jacklin#
69
(2015) | | Private Investor since prior to 2012. Professorial Lecturer at the Johns Hopkins School of Advanced International Studies (2008-2015). U.S. Executive Director of the International Monetary Fund (which is responsible for ensuring the stability of the international monetary system), (December 2002-May 2006); Partner, Clifford Chance (1992-2002); Sector Counsel, International Banking and Finance, and Associate General Counsel, Citicorp (1985-1992); Assistant General Counsel (International), Federal Reserve Board of Governors (1982-1985); and Attorney Advisor, U.S. Department of the Treasury (1973-1982). Member of the Bar of the District of Columbia and of New York; and member of the Council on Foreign Relations. She has served as a director or trustee of the AB Funds since 2006 and has been Chairman of the Governance and Nominating Committees of the AB Funds since August 2014. | | | 96 | | | None |
| | |
| abfunds.com | | AB ALL MARKET ALTERNATIVE RETURN PORTFOLIO | 71 |
MANAGEMENT OF THE FUND (continued)
| | | | | | | | |
NAME,
ADDRESS*, AGE AND
(YEAR FIRST ELECTED**) | | PRINCIPAL OCCUPATION(S) DURING PAST FIVE (5) YEARS AND OTHER INFORMATION*** | | PORTFOLIOS IN AB FUND COMPLEX OVERSEEN BY
DIRECTOR | | | OTHER
PUBLIC COMPANY DIRECTORSHIPS CURRENTLY HELD
BY DIRECTOR |
INDEPENDENT DIRECTORS
(continued) | | | | | | |
Carol C. McMullen# 62 (2016) | | Managing Director of Slalom Consulting (consulting) since 2014, private investor and member of the Partners Healthcare Investment Committee. Formerly, Director of Norfolk & Dedham Group (mutual property and casualty insurance) from 2011 until November 2016; Director of Partners Community Physicians Organization (healthcare) from 2014 until December 2016; and Managing Director of The Crossland Group (consulting) from 2012 until 2013. She has held a number of senior positions in the asset and wealth management industries, including at Eastern Bank (where her roles included President of Eastern Wealth Management), Thomson Financial (Global Head of Sales for Investment Management), and Putnam Investments (where her roles included Head of Global Investment Research). She has served on a number of private company and nonprofit boards, and as a director or trustee of the AB Funds since June 2016. | | | 96 | | | None |
| | | | | | | | |
| | |
| 72 | AB ALL MARKET ALTERNATIVE RETURN PORTFOLIO | | abfunds.com |
MANAGEMENT OF THE FUND (continued)
| | | | | | | | |
NAME,
ADDRESS*, AGE AND
(YEAR FIRST ELECTED**) | | PRINCIPAL OCCUPATION(S) DURING PAST FIVE (5) YEARS AND OTHER INFORMATION*** | | PORTFOLIOS IN AB FUND COMPLEX OVERSEEN BY
DIRECTOR | | | OTHER
PUBLIC COMPANY DIRECTORSHIPS CURRENTLY HELD
BY DIRECTOR |
INDEPENDENT DIRECTORS
(continued) | | | | | | |
Garry L. Moody# 65 (2015) | | Independent Consultant. Formerly, Partner, Deloitte & Touche LLP (1995-2008) where he held a number of senior positions, including Vice Chairman, and U.S. and Global Investment Management Practice Managing Partner; President, Fidelity Accounting and Custody Services Company (1993-1995), where he was responsible for accounting, pricing, custody and reporting for the Fidelity mutual funds; and Partner, Ernst & Young LLP (1975-1993), where he served as the National Director of Mutual Fund Tax Services and Managing Partner of its Chicago Office Tax department. He is a member of the Trustee Advisory Board of Board IQ, a biweekly publication focused on issues and news affecting directors of mutual funds. He has served as a director or trustee, and as Chairman of the Audit Committees, of the AB Funds since 2008. | | | 96 | | | None |
| | | | | | | | |
Earl D. Weiner# 78 (2015) | | Of Counsel, and Partner prior to January 2007, of the law firm Sullivan & Cromwell LLP, and is a former member of the ABA Federal Regulation of Securities Committee Task Force to draft editions of the Fund Director’s Guidebook. He also serves as a director or trustee of various non-profit organizations and has served as Chairman or Vice Chairman of a number of them. He has served as a director or trustee of the AB Funds since 2007 and served as Chairman of the Governance and Nominating Committees of the AB Funds from 2007 until August 2014. | | | 96 | | | None |
| | |
| abfunds.com | | AB ALL MARKET ALTERNATIVE RETURN PORTFOLIO | 73 |
MANAGEMENT OF THE FUND (continued)
| * | The address for each of the Fund’s Directors is c/o AllianceBernstein L.P., Attention: Office of the Senior Officer, 1345 Avenue of the Americas, New York, NY 10105. |
| ** | There is no stated term of office for the Fund’s Directors. |
| *** | The information above includes each Director’s principal occupation during the last five years and other information relating to the experience, attributes, and skills relevant to each Director’s qualifications to serve as a Director, which led to the conclusion that each Director should serve as a Director for the Fund. |
| # | Member of the Audit Committee, the Governance and Nominating Committee and the Independent Directors Committee. |
| ^ | Messrs. Dobkin and Guzy are expected to retire on or about December 31, 2017. |
| + | Mr. Keith is an “interested person”, as defined in Section 2(a)(19) of the 1940 Act, of the Fund due to his position as a Senior Vice President of the Adviser. |
| ++ | The Adviser and ABI are affiliates of the Fund. |
| | |
| 74 | AB ALL MARKET ALTERNATIVE RETURN PORTFOLIO | | abfunds.com |
MANAGEMENT OF THE FUND (continued)
Officer Information
Certain Information concerning the Fund’s Officers is listed below.
| | | | |
NAME, ADDRESS*
AND AGE | | POSITION(S)
HELD WITH FUND | | PRINCIPAL OCCUPATION
DURING PAST FIVE (5) YEARS |
Robert M. Keith
57 | | President and Chief Executive Officer | | See biography above. |
| | | | |
Philip L. Kirstein#
72 | | Senior Vice President and Independent Compliance Officer | | Senior Vice President and Independent Compliance Officer of the AB Funds, with which he has been associated since October 2004. Prior thereto, he was Of Counsel to Kirkpatrick & Lockhart, LLP from October 2003 to October 2004, and General Counsel of Merrill Lynch Investment Managers, L.P., since prior to March 2003. |
| | | | |
Brian T. Brugman
37 | | Vice President | | Senior Vice President of the Adviser**, with which he has been associated since prior to 2012. |
| | | | |
Daniel J. Loewy
43 | | Vice President | | Senior Vice President of the Adviser**, with which he has been associated since prior to 2012. |
| | | | |
Vadim Zlotnikov
55 | | Vice President | | Senior Vice President of the Adviser**, with which he has been associated since prior to 2012. |
| | | | |
Emilie D. Wrapp
62 | | Secretary | | Senior Vice President, Assistant General Counsel and Assistant Secretary of ABI**, with which she has been associated since prior to 2012. |
| | | | |
Joseph J. Mantineo
58 | | Treasurer and Chief Financial Officer | | Senior Vice President of AllianceBernstein Investor Services (“ABIS”)**, with which he has been associated since prior to 2012. |
| | | | |
Phyllis J. Clarke
56 | | Controller | | Vice President of ABIS**, with which she has been associated since prior to 2012. |
| | | | |
Vincent S. Noto
53 | | Chief Compliance Officer | | Senior Vice President since 2015 and Mutual Fund Chief Compliance Officer of the Adviser** since 2014. Prior thereto, he was Vice President and Director of Mutual Fund Compliance of the Adviser** since prior to 2012. |
| * | The address for each of the Fund’s Officers is 1345 Avenue of the Americas, New York, NY 10105. |
| ** | The Adviser, ABI and ABIS are affiliates of the Fund. |
| # | Mr. Kirstein is expected to retire on or about December 31, 2017. |
The Fund’s Statement of Additional Information (“SAI”) has additional information about the Fund’s Directors and Officers and is available without charge upon request. Contact your financial representative or AB at 1-800-227-4618, or visit www.abfunds.com, for a free prospectus or SAI.
| | |
| abfunds.com | | AB ALL MARKET ALTERNATIVE RETURN PORTFOLIO | 75 |
Information Regarding the Review and Approval of Amendment to the Fund’s Advisory Agreement
At a meeting of the Board of Directors of AB Cap Fund, Inc. (the “Company”) held on January 31-February 1, 2017, the Adviser recommended an amendment to the Company’s current Advisory Agreement with the Adviser (the “Amended Agreement”) to effect a fee reduction in respect of AB All Market Alternative Return Portfolio (the “Fund”) effective February 3, 2017.
After their review of updated comparative fee and expense information, and discussion with experienced counsel who are independent of the Adviser, who advised on the relevant legal standards, and the Company’s Senior Officer (who is also the Company’s Independent Compliance Officer), the disinterested directors (the “directors”) unanimously approved the Amended Agreement.
The directors last approved the continuance of the Fund’s current Advisory Agreement at a meeting held on August 2-3, 2016 (the “August 2016 Meeting”) and a discussion regarding the basis for the Board’s approval is set forth below. In determining to approve the Amended Agreement the directors took into account their review at the August 2016 Meeting and noted that the proposed lowering of the advisory fee would benefit the Fund and its shareholders. The directors noted that the Adviser was reducing fees for business reasons, and had assured them that there would be no diminution in the nature or quality of services to the Fund.
Board’s Approval at the August 2016 Meeting
The directors unanimously approved the continuance of the Fund’s current Advisory Agreement at the August 2016 Meeting.
Prior to approval of the continuance of the Advisory Agreement, the directors had requested from the Adviser, and received and evaluated, extensive materials. They reviewed the proposed continuance of the Advisory Agreement with the Adviser and with experienced counsel who are independent of the Adviser, who advised on the relevant legal standards. The directors also reviewed an independent evaluation prepared by the Company’s Senior Officer of the reasonableness of the advisory fee, in which the Senior Officer concluded that the contractual fee for the Fund was reasonable. The directors also discussed the proposed continuance in private sessions with counsel and the Company’s Senior Officer.
The directors considered their knowledge of the nature and quality of the services provided by the Adviser to the Fund gained from their experience as directors or trustees of most of the registered investment companies advised by the Adviser, their overall confidence in the Adviser’s integrity and competence they have gained from that experience, the Adviser’s initiative in identifying and raising potential issues with the directors and its
| | |
| 76 | AB ALL MARKET ALTERNATIVE RETURN PORTFOLIO | | abfunds.com |
responsiveness, frankness and attention to concerns raised by the directors in the past, including the Adviser’s willingness to consider and implement organizational and operational changes designed to improve investment results and the services provided to the AB Funds. The directors noted that they have four regular meetings each year, at each of which they receive presentations from the Adviser on the investment results of the Fund and review extensive materials and information presented by the Adviser.
The directors also considered all other factors they believed relevant, including the specific matters discussed below. In their deliberations, the directors did not identify any particular information that was all-important or controlling, and different directors may have attributed different weights to the various factors. The directors determined that the selection of the Adviser to manage the Fund and the overall arrangements between the Fund and the Adviser, as provided in the Advisory Agreement, including the advisory fee, were fair and reasonable in light of the services performed, expenses incurred and such other matters as the directors considered relevant in the exercise of their business judgment. The material factors and conclusions that formed the basis for the directors’ determinations included the following:
Nature, Extent and Quality of Services Provided
The directors considered the scope and quality of services provided by the Adviser under the Advisory Agreement, including the quality of the investment research capabilities of the Adviser and the other resources it has dedicated to performing services for the Fund. They also noted the professional experience and qualifications of the Fund’s portfolio management team and other senior personnel of the Adviser. The directors also considered that the Advisory Agreement provides that the Fund will reimburse the Adviser for the cost to it of providing certain clerical, accounting, administrative and other services to the Fund by employees of the Adviser or its affiliates. Requests for these reimbursements are made on a quarterly basis and subject to approval by the directors. Reimbursements, to the extent requested and paid, result in a higher rate of total compensation from the Fund to the Adviser than the fee rate stated in the Advisory Agreement. The directors noted that the methodology used to determine the reimbursement amounts had been reviewed by an independent consultant retained by the Company’s Senior Officer. The quality of administrative and other services, including the Adviser’s role in coordinating the activities of the Fund’s other service providers, also was considered. The directors concluded that, overall, they were satisfied with the nature, extent and quality of services provided to the Fund under the Advisory Agreement.
| | |
| abfunds.com | | AB ALL MARKET ALTERNATIVE RETURN PORTFOLIO | 77 |
Costs of Services Provided and Profitability
The directors reviewed a schedule of the revenues, expenses and related notes indicating the profitability of the Fund to the Adviser for the period ended December 31, 2015 that had been prepared with an expense allocation methodology arrived at in consultation with an independent consultant retained by the Company’s Senior Officer. The directors noted the assumptions and methods of allocation used by the Adviser in preparing fund-specific profitability data and understood that there are a number of potentially acceptable allocation methodologies for information of this type. The directors noted that the profitability information reflected all revenues and expenses of the Adviser’s relationship with the Fund, including those relating to its subsidiaries that provide transfer agency, distribution and brokerage services to the Fund. The directors recognized that it is difficult to make comparisons of the profitability of the Advisory Agreement with the profitability of advisory contracts for unaffiliated funds because comparative information is not generally publicly available and is affected by numerous factors. The directors focused on the profitability of the Adviser’s relationship with the Fund before taxes and distribution expenses. The directors noted that the Fund was not profitable to the Adviser in the period reviewed.
Fall-Out Benefits
The directors considered the other benefits to the Adviser and its affiliates from their relationships with the Fund, including, but not limited to, benefits relating to soft dollar arrangements (whereby investment advisers receive brokerage and research services from brokers that execute agency transactions for their clients); 12b-1 fees and sales charges received by the Fund’s principal underwriter (which is a wholly owned subsidiary of the Adviser) in respect of certain classes of the Fund’s shares; brokerage commissions paid by the Fund to brokers affiliated with the Adviser; and transfer agency fees paid by the Fund to a wholly owned subsidiary of the Adviser. The directors recognized that the Fund’s unprofitability to the Adviser would be exacerbated without these benefits. The directors understood that the Adviser also might derive reputational and other benefits from its association with the Fund.
Investment Results
In addition to the information reviewed by the directors in connection with the August 2016 Meeting, the directors receive detailed performance information for the Fund at each regular Board meeting during the year.
At the August 2016 Meeting, the directors reviewed information prepared by Broadridge Financial Solutions, Inc. (“Broadridge”), an analytical service that is not affiliated with the Adviser, showing the performance of the Class A Shares of the Fund against a peer group and a peer universe selected by Broadridge, and information prepared by the Adviser showing performance of the Class A Shares against a broad-based securities
| | |
| 78 | AB ALL MARKET ALTERNATIVE RETURN PORTFOLIO | | abfunds.com |
market index, in each case for the 1-year period ended May 31, 2016 and (in the case of comparisons with the broad-based securities market index) the period since inception. Based on their review, the directors concluded that the Fund’s investment performance was acceptable.
Advisory Fees and Other Expenses
The directors considered the advisory fee rate paid by the Fund to the Adviser and information prepared by Broadridge concerning advisory fee rates paid by other funds in the same Broadridge category as the Fund at a common asset level. The directors recognized that it is difficult to make comparisons of advisory fees because there are variations in the services that are included in the fees paid by other funds. The directors considered the Fund’s contractual advisory fee rate against a peer group median.
The Adviser informed the directors that there were no institutional products managed by it that have a substantially similar investment style.
The directors noted that the Fund invests in shares of exchange-traded funds (“ETFs”), subject to the restrictions and limitations of the Investment Company Act of 1940 as these may be varied as a result of exemptive orders issued by the SEC. The directors also noted that ETFs pay advisory fees pursuant to their advisory contracts, and that the Adviser had provided, and they had reviewed, information about the expense ratios of the relevant ETFs. The directors concluded, based on the Adviser’s explanation of how it uses ETFs when they are the most cost-effective way to obtain desired exposures or to “equitize” cash inflows pending purchases of underlying securities, that the advisory fee for the Fund is based on services that are in addition to, rather than duplicative of, the services provided under the advisory contracts of the ETFs in which the Fund may invest.
The directors also considered the total expense ratio of the Class A shares of the Fund in comparison to a peer group and a peer universe selected by Broadridge. The Class A expense ratio of the Fund was based on the Fund’s latest fiscal year. The directors noted the effects of any fee waivers and/or expense reimbursements as a result of an undertaking by the Adviser. The directors noted that it was likely that the expense ratios of some of the other funds in the Fund’s Broadridge category were lowered by waivers or reimbursements by those funds’ investment advisers, which in some cases might be voluntary or temporary. The directors view expense ratio information as relevant to their evaluation of the Adviser’s services because the Adviser is responsible for coordinating services provided to the Fund by others. Based on their review, the directors concluded that the Fund’s expense ratio was acceptable.
| | |
| abfunds.com | | AB ALL MARKET ALTERNATIVE RETURN PORTFOLIO | 79 |
Economies of Scale
The directors noted that the advisory fee schedule for the Fund does not contain breakpoints and that they had discussed their strong preference for breakpoints in advisory contracts with the Adviser. The directors took into consideration prior presentations by an independent consultant on economies of scale in the mutual fund industry and for the AB Funds, and by the Adviser concerning certain of its views on economies of scale. The directors also had requested and received from the Adviser certain updates on economies of scale in advance of the August 2016 Meeting. The directors believe that economies of scale may be realized (if at all) by the Adviser across a variety of products and services, and not only in respect of a single fund. The directors noted that there is no established methodology for setting breakpoints that give effect to the fund-specific services provided by a fund’s adviser and to the economies of scale that an adviser may realize in its overall mutual fund business or those components of it which directly or indirectly affect a fund’s operations. The directors observed that in the mutual fund industry as a whole, as well as among funds similar to the Fund, there is no uniformity or pattern in the fees and asset levels at which breakpoints (if any) apply. The directors also noted that the advisory agreements for many funds do not have breakpoints at all. The directors informed the Adviser that they would monitor the Fund’s assets (which were well below the level at which they would anticipate adding an initial breakpoint) and its profitability (currently unprofitable) to the Adviser and anticipated revisiting the question of breakpoints in the future if circumstances warranted doing so.
| | |
| 80 | AB ALL MARKET ALTERNATIVE RETURN PORTFOLIO | | abfunds.com |
This page is not part of the Shareholder Report or the Financial Statements.
AB FAMILY OF FUNDS
US EQUITY
US CORE
Core Opportunities Fund
FlexFee™ US Thematic Portfolio
Select US Equity Portfolio
US GROWTH
Concentrated Growth Fund
Discovery Growth Fund
FlexFee™ Large Cap Growth Portfolio
Growth Fund
Large Cap Growth Fund
Small Cap Growth Portfolio
US VALUE
Discovery Value Fund
Equity Income Fund
Relative Value Fund1
Small Cap Value Portfolio
Value Fund
INTERNATIONAL/ GLOBAL EQUITY
INTERNATIONAL/ GLOBAL CORE
Global Core Equity Portfolio
International Portfolio
International Strategic Core Portfolio
Sustainable Global Thematic Fund1
Tax-Managed International Portfolio
Tax-Managed Wealth Appreciation Strategy
Wealth Appreciation Strategy
INTERNATIONAL/ GLOBAL GROWTH
Concentrated International Growth Portfolio
International Growth Fund
INTERNATIONAL/ GLOBAL EQUITY (continued)
INTERNATIONAL/ GLOBAL VALUE
Asia ex-Japan Equity Portfolio
International Value Fund
FIXED INCOME
MUNICIPAL
High Income Municipal Portfolio
Intermediate California Municipal Portfolio
Intermediate Diversified Municipal Portfolio
Intermediate New York Municipal Portfolio
Municipal Bond Inflation Strategy
Tax-Aware Fixed Income Portfolio
National Portfolio
Arizona Portfolio
California Portfolio
Massachusetts Portfolio
Minnesota Portfolio
New Jersey Portfolio
New York Portfolio
Ohio Portfolio
Pennsylvania Portfolio
Virginia Portfolio
TAXABLE
Bond Inflation Strategy
FlexFee™ International Bond Portfolio
Global Bond Fund
High Income Fund
High Yield Portfolio
Income Fund
Intermediate Bond Portfolio
Limited Duration High Income Portfolio
Short Duration Portfolio
ALTERNATIVES
All Market Real Return Portfolio
Credit Long/Short Portfolio
Global Real Estate Investment Fund
Select US Long/Short Portfolio
Unconstrained Bond Fund
MULTI-ASSET
All Market Income Portfolio
All Market Total Return Portfolio1
Conservative Wealth Strategy
Emerging Markets Multi-Asset Portfolio
Global Risk Allocation Fund
Tax-Managed All Market Income Portfolio1
TARGET-DATE
Multi-Manager Select Retirement Allocation Fund
Multi-Manager Select 2010 Fund
Multi-Manager Select 2015 Fund
Multi-Manager Select 2020 Fund
Multi-Manager Select 2025 Fund
Multi-Manager Select 2030 Fund
Multi-Manager Select 2035 Fund
Multi-Manager Select 2040 Fund
Multi-Manager Select 2045 Fund
Multi-Manager Select 2050 Fund
Multi-Manager Select 2055 Fund
CLOSED-END FUNDS
Alliance California Municipal Income Fund
AllianceBernstein Global High Income Fund
AllianceBernstein National Municipal Income Fund
We also offer Government Money Market Portfolio1, which serves as the money market fund exchange vehicle for the AB mutual funds. An investment in Government Money Market Portfolio is not a deposit in a bank and is not insured or guaranteed by the Federal Deposit Insurance Corporation or any other government agency. Although the Fund seeks to preserve the value of your investment at $1.00 per share, it is possible to lose money by investing in the Fund.
Investors should consider the investment objectives, risks, charges and expenses of the Fund carefully before investing. For copies of our prospectus or summary prospectus, which contain this and other information, visit us online at www.abfunds.com or contact your AB representative. Please read the prospectus and/or summary prospectus carefully before investing.
| 1 | Prior to January 9, 2017, Relative Value Fund was named Growth & Income Fund; prior to April 17, 2017, Tax-Managed All Market Income Portfolio was named Tax-Managed Balanced Wealth Strategy; prior to April 24, 2017, All Market Total Return Portfolio was named Balanced Wealth Strategy; prior to November 10, 2017, Government Money Market Portfolio was named Government Exchange Reserves. |
| | |
| abfunds.com | | AB ALL MARKET ALTERNATIVE RETURN PORTFOLIO | 81 |
NOTES
| | |
| 82 | AB ALL MARKET ALTERNATIVE RETURN PORTFOLIO | | abfunds.com |
NOTES
| | |
| abfunds.com | | AB ALL MARKET ALTERNATIVE RETURN PORTFOLIO | 83 |
NOTES
| | |
| 84 | AB ALL MARKET ALTERNATIVE RETURN PORTFOLIO | | abfunds.com |

AB ALL MARKET ALTERNATIVE RETURN PORTFOLIO
1345 Avenue of the Americas
New York, NY 10105
800 221 5672
AMAR-0151-1017 
ITEM 2. CODE OF ETHICS.
(a) The registrant has adopted a code of ethics that applies to its principal executive officer, principal financial officer and principal accounting officer. A copy of the registrant’s code of ethics is filed herewith as Exhibit 12(a)(1).
(b) During the period covered by this report, no material amendments were made to the provisions of the code of ethics adopted in 2(a) above.
(c) During the period covered by this report, no implicit or explicit waivers to the provisions of the code of ethics adopted in 2(a) above were granted.
ITEM 3. AUDIT COMMITTEE FINANCIAL EXPERT.
The registrant’s Board of Directors has determined that independent directors William H. Foulk, Jr., Garry L. Moody and Marshall C. Turner, Jr. qualify as audit committee financial experts.
ITEM 4. PRINCIPAL ACCOUNTANT FEES AND SERVICES.
(a) - (c) The following table sets forth the aggregate fees billed by the independent registered public accounting firm Ernst & Young LLP, for the Fund’s last two fiscal years for professional services rendered for: (i) the audit of the Fund’s annual financial statements included in the Fund’s annual report to stockholders; (ii) assurance and related services that are reasonably related to the performance of the audit of the Fund’s financial statements and are not reported under (i), which include advice and education related to accounting and auditing issues and quarterly press release review (for those Funds which issue press releases), and preferred stock maintenance testing (for those Funds that issue preferred stock); and (iii) tax compliance, tax advice and tax return preparation.
| | | | | | | | | | | | | | | | |
| | | | | | Audit Fees | | | Audit-Related
Fees | | | Tax Fees | |
AB All Market Alternative Return | | | 2016 | | | $ | 68,776 | | | $ | — | | | $ | 20,883 | |
| | | 2017 | | | $ | 68,776 | | | $ | — | | | $ | 35,829 | |
(d) Not applicable.
(e) (1) Beginning with audit and non-audit service contracts entered into on or after May 6, 2003, the Fund’s Audit Committee policies and procedures require the pre-approval of all audit and non-audit services provided to the Fund by the Fund’s independent registered public accounting firm. The Fund’s Audit Committee policies and procedures also require pre-approval of all audit and non-audit services provided to the Adviser and Service Affiliates to the extent that these services are directly related to the operations or financial reporting of the Fund.
(e) (2) All of the amounts for Audit Fees, Audit-Related Fees and Tax Fees in the table under Item 4 (a) – (c) are for services pre-approved by the Fund’s Audit Committee.
(f) Not applicable.
(g) The following table sets forth the aggregate non-audit services provided to the Fund, the Fund’s Adviser and entities that control, are controlled by or under common control with the Adviser that provide ongoing services to the Fund:
| | | | | | | | | | | | |
| | | | | | All Fees for
Non-Audit Services
Provided to the
Portfolio, the Adviser
and Service Affiliates | | | Total Amount of
Foregoing Column Pre-
approved by the Audit
Committee
(Portion Comprised of
Audit Related Fees)
(Portion Comprised of
Tax Fees) | |
AB All Market Alternative Return | | | 2016 | | | $ | 456,703 | | | $ | 20,883 | |
| | | | | | | | | | $ | — | |
| | | | | | | | | | $ | (20,883 | ) |
| | | 2017 | | | $ | 758,944 | | | $ | 35,829 | |
| | | | | | | | | | $ | — | |
| | | | | | | | | | $ | (35,829 | ) |
(h) The Audit Committee of the Fund has considered whether the provision of any non-audit services not pre-approved by the Audit Committee provided by the Fund’s independent registered public accounting firm to the Adviser and Service Affiliates is compatible with maintaining the auditor’s independence.
ITEM 5. AUDIT COMMITTEE OF LISTED REGISTRANTS.
Not applicable to the registrant.
ITEM 6. SCHEDULE OF INVESTMENTS.
Please see Schedule of Investments contained in the Report to Shareholders included under Item 1 of this Form N-CSR.
ITEM 7. DISCLOSURE OF PROXY VOTING POLICIES AND PROCEDURES FOR CLOSED-END MANAGEMENT INVESTMENT COMPANIES.
Not applicable to the registrant.
ITEM 8. PORTFOLIO MANAGERS OF CLOSED-END MANAGEMENT INVESTMENT COMPANIES.
Not applicable to the registrant.
ITEM 9. PURCHASES OF EQUITY SECURITIES BY CLOSED-END MANAGEMENT INVESTMENT COMPANY AND AFFILIATED PURCHASERS.
Not applicable to the registrant.
ITEM 10. SUBMISSION OF MATTERS TO A VOTE OF SECURITY HOLDERS.
There have been no material changes to the procedures by which shareholders may recommend nominees to the Fund’s Board of Directors since the Fund last provided disclosure in response to this item.
ITEM 11. CONTROLS AND PROCEDURES.
(a) The registrant’s principal executive officer and principal financial officer have concluded that the registrant’s disclosure controls and procedures (as defined in Rule 30a-2(c) under the Investment Company Act of 1940, as amended) are effective at the reasonable assurance level based on their evaluation of these controls and procedures as of a date within 90 days of the filing date of this document.
(b) There were no changes in the registrant’s internal controls over financial reporting that occurred during the second fiscal quarter of the period that has materially affected, or is reasonably likely to materially affect, the registrant’s internal control over financial reporting.
ITEM 12. EXHIBITS.
The following exhibits are attached to this Form N-CSR:
| | |
EXHIBIT NO. | | DESCRIPTION OF EXHIBIT |
| |
| 12 (a) (1) | | Code of Ethics that is subject to the disclosure of Item 2 hereof |
| |
| 12 (b) (1) | | Certification of Principal Executive Officer Pursuant to Section 302 of the Sarbanes-Oxley Act of 2002 |
| |
| 12 (b) (2) | | Certification of Principal Financial Officer Pursuant to Section 302 of the Sarbanes-Oxley Act of 2002 |
| |
| 12 (c) | | Certification of Principal Executive Officer and Principal Financial Officer Pursuant to Section 906 of the Sarbanes-Oxley Act of 2002 |
SIGNATURES
Pursuant to the requirements of the Securities Exchange Act of 1934 and the Investment Company Act of 1940, the registrant has duly caused this report to be signed on its behalf by the undersigned, thereunto duly authorized.
(Registrant): AB Cap Fund, Inc.
| | |
| By: | | /s/ Robert M. Keith |
| | Robert M. Keith |
| | President |
Date: December 29, 2017
Pursuant to the requirements of the Securities Exchange Act of 1934 and the Investment Company Act of 1940, this report has been signed below by the following persons on behalf of the registrant and in the capacities and on the dates indicated.
| | |
| By: | | /s/ Robert M. Keith |
| | Robert M. Keith |
| | President |
Date: December 29, 2017
| | |
| By: | | /s/ Joseph J. Mantineo |
| | Joseph J. Mantineo |
| | Treasurer and Chief Financial Officer |
Date: December 29, 2017