UNITED STATES
SECURITIES AND EXCHANGE COMMISSION
WASHINGTON, D.C. 20549
FORM N-CSR
CERTIFIED SHAREHOLDER REPORT OF REGISTERED
MANAGEMENT INVESTMENT COMPANIES
Investment Company Act file number: 811-01716
AB CAP FUND, INC.
(Exact name of registrant as specified in charter)
1345 Avenue of the Americas, New York, New York 10105
(Address of principal executive offices) (Zip code)
Joseph J. Mantineo
AllianceBernstein L.P.
1345 Avenue of the Americas
New York, New York 10105
(Name and address of agent for service)
Registrant’s telephone number, including area code: (800) 221-5672
Date of fiscal year end: June 30, 2017
Date of reporting period: June 30, 2017
ITEM 1. REPORTS TO STOCKHOLDERS.
JUN 06.30.17
ANNUAL REPORT
AB CONCENTRATED GROWTH FUND


| | |
| |
| Investment Products Offered | | • Are Not FDIC Insured • May Lose Value • Are Not Bank Guaranteed |
Investors should consider the investment objectives, risks, charges and expenses of the Fund carefully before investing. For copies of our prospectus or summary prospectus, which contain this and other information, visit us online at www.abfunds.com or contact your AB representative. Please read the prospectus and/or summary prospectus carefully before investing.
This shareholder report must be preceded or accompanied by the Fund’s prospectus for individuals who are not current shareholders of the Fund.
You may obtain a description of the Fund’s proxy voting policies and procedures, and information regarding how the Fund voted proxies relating to portfolio securities during the most recent 12-month period ended June 30, without charge. Simply visit AB’s website at www.abfunds.com, or go to the Securities and Exchange Commission’s (the “Commission”) website at www.sec.gov, or call AB at (800) 227-4618.
The Fund files its complete schedule of portfolio holdings with the Commission for the first and third quarters of each fiscal year on Form N-Q. The Fund’s Forms N-Q are available on the Commission’s website at www.sec.gov. The Fund’s Forms N-Q may also be reviewed and copied at the Commission’s Public Reference Room in Washington, DC; information on the operation of the Public Reference Room may be obtained by calling (800) SEC-0330. AB publishes full portfolio holdings for the Fund monthly at www.abfunds.com.
AllianceBernstein Investments, Inc. (ABI) is the distributor of the AB family of mutual funds. ABI is a member of FINRA and is an affiliate of AllianceBernstein L.P., the Adviser of the funds.
The [A/B] logo is a registered service mark of AllianceBernstein and AllianceBernstein® is a registered service mark used by permission of the owner, AllianceBernstein L.P.
| | |
| FROM THE PRESIDENT | |  |
Dear Shareholder,
We are pleased to provide this report for AB Concentrated Growth Fund (the “Fund”). Please review the discussion of Fund performance, the market conditions during the reporting period and the Fund’s investment strategy.
As always, AB strives to keep clients ahead of what’s next by:
| + | | Transforming uncommon insights into uncommon knowledge with a global research scope |
| + | | Navigating markets with seasoned investment experience and sophisticated solutions |
| + | | Providing thoughtful investment insights and actionable ideas |
Whether you’re an individual investor or a multi-billion-dollar institution, we put knowledge and experience to work for you.
AB’s global research organization connects and collaborates across platforms and teams to deliver impactful insights and innovative products. Better insights lead to better opportunities—anywhere in the world.
For additional information about AB’s range of products and shareholder resources, please log on to www.abfunds.com.
Thank you for your investment in the AB Mutual Funds.
Sincerely,

Robert M. Keith
President and Chief Executive Officer, AB Mutual Funds
| | |
| abfunds.com | | AB CONCENTRATED GROWTH FUND | 1 |
ANNUAL REPORT
August 14, 2017
This report provides management’s discussion of fund performance for AB Concentrated Growth Fund for the annual reporting period ended June 30, 2017. Effective as of the close of business on February 28, 2014, the W.P. Stewart Growth Fund, Inc. (the “Predecessor Fund”) was converted into the Fund and the Predecessor Fund’s shares were converted into Advisor Class shares of the Fund. The inception date for Class A, C, R, K, I and Z shares is February 28, 2014. The inception date of the Predecessor Fund is February 28, 1994.
The Fund’s investment objective is long-term growth of capital.
NAV RETURNS AS OF JUNE 30, 2017 (unaudited)
| | | | | | | | |
| | | 6 Months | | | 12 Months | |
| AB CONCENTRATED GROWTH FUND | | | | | | | | |
| Class A Shares | | | 14.64% | | | | 25.93% | |
| Class C Shares | | | 14.25% | | | | 25.03% | |
| Advisor Class Shares1 | | | 14.79% | | | | 26.26% | |
| Class R Shares1 | | | 14.50% | | | | 25.63% | |
| Class K Shares1 | | | 14.64% | | | | 25.97% | |
| Class I Shares1 | | | 14.77% | | | | 26.26% | |
| Class Z Shares1 | | | 14.78% | | | | 26.29% | |
| S&P 500 Index | | | 9.34% | | | | 17.90% | |
| Lipper Multi-Cap Growth Funds Average | | | 14.26% | | | | 20.07% | |
| 1 | Please note that these share classes are for investors purchasing shares through accounts established under certain fee-based programs sponsored and maintained by certain broker-dealers and financial intermediaries, institutional pension plans and/or investment advisory clients of, and certain other persons associated with, the Adviser and its affiliates or the Fund. |
Please keep in mind that high, double-digit returns are highly unusual and cannot be sustained. Investors should also be aware that these returns were primarily achieved during favorable market conditions.
INVESTMENT RESULTS
The table above shows the Fund’s performance compared to its benchmark, the Standard & Poor’s (“S&P”) 500 Index, for the six- and 12-month periods ended June 30, 2017. Also included are returns for the Fund’s peer group, as represented by the Lipper Multi-Cap Growth Funds Average (the “Lipper Average”). Funds in the Lipper Average have generally similar investment mandates to the Fund, although some may have different investment policies and sales and management fees and fund expenses.
| | |
| 2 | AB CONCENTRATED GROWTH FUND | | abfunds.com |
All share classes of the Fund outperformed the benchmark and the Lipper Average for the 12-month period, before sales charges. Sector selection and stock selection were both positive, relative to the benchmark. An overweight to the technology sector added to returns, while an underweight to financials took back some of these gains. Security selection in the health care sector contributed, but detracted within industrials. Top absolute contributors included Charles Schwab, Priceline and Apple. Top absolute detractors included VF Corporation, ULTA and Hershey.
For the six-month period, all share classes outperformed the benchmark, and all share classes except Class C shares outperformed the Lipper Average, before sales charges. An underweight to the energy sector and overweight to technology contributed relative to the benchmark. An underweight in the industrials sector took back some of these gains. Security selection in the consumer discretionary sector contributed, but detracted within industrials. Top absolute contributors to performance included Abbott Laboratories, Priceline and Delphi Automotive. Top absolute detractors included Ansys, Automatic Data Processing and VF Corporation.
The Fund did not utilize derivatives during the six- or 12-month periods.
MARKET REVIEW AND INVESTMENT STRATEGY
US equity markets had strong positive performance during the 12-month period. Markets showed continued economic growth, sturdy employment numbers and inflation rates that led the US Federal Reserve to raise interest rates. Technology and health care were strong performers during the period, while the energy and telecommunications sectors lagged. In this environment, the Fund’s Senior Investment Management Team remained focused on sustainably growing the underlying earnings power of the Fund and believes the Fund is well positioned for the current environment.
INVESTMENT POLICIES
The Adviser seeks to achieve the Fund’s investment objective of long-term growth of capital by investing primarily in common stocks of listed US companies. The Adviser employs an appraisal method that attempts to measure each prospective company’s quality and growth rate by numerous factors. Such factors include: a company’s record and projections of profit and earnings growth, accuracy and availability of information with respect to the company, success and experience of management, accessibility of management to the Fund’s Adviser, product lines and competitive position both in the United States and abroad, lack of cyclicality, large market capitalization and liquidity of the company’s securities. The Adviser compares these results to the general stock markets to determine the relative attractiveness of each company at a given time. The Adviser weighs economic, political and
(continued on next page)
| | |
| abfunds.com | | AB CONCENTRATED GROWTH FUND | 3 |
market factors in making investment decisions; this appraisal technique attempts to measure each investment candidate not only against other stocks of the same industry group, but also against a broad spectrum of investments. While the Fund primarily invests in companies that have market capitalizations of $5 billion or more, it may invest in companies that have market capitalizations of $3 billion to $5 billion.
The Fund invests in a relatively small number of individual stocks. The Fund is considered to be “non-diversified”, which means that the securities laws do not limit the percentage of its assets that it may invest in any one company (subject to certain limitations under the Internal Revenue Code of 1986, as amended).
| | |
| 4 | AB CONCENTRATED GROWTH FUND | | abfunds.com |
DISCLOSURES AND RISKS
Benchmark Disclosure
The S&P® 500 Index is unmanaged and does not reflect fees and expenses associated with the active management of a mutual fund portfolio. The S&P 500 Index includes 500 US stocks and is a common representation of the performance of the overall US stock market. An investor cannot invest directly in an index or average, and its results are not indicative of the performance for any specific investment, including the Fund.
A Word About Risk
Market Risk: The value of the Fund’s assets will fluctuate as the equity markets fluctuate. The value of the Fund’s investments may decline, sometimes rapidly and unpredictably, simply because of economic changes or other events that affect large portions of the market.
Focused Portfolio Risk: Investments in a limited number of companies may have more risk because changes in the value of a single security may have a more significant effect, either negative or positive, on the Fund’s net asset value (“NAV”).
Capitalization Risk: Investments in mid-capitalization companies may be more volatile and less liquid than investments in large-capitalization companies.
Non-Diversification Risk: The Fund may have more risk because it is “non-diversified”, meaning that it can invest more of its assets in a smaller number of issuers. Accordingly, changes in the value of a single security may have a more significant effect, either negative or positive, on the Fund’s NAV.
Management Risk: The Fund is subject to management risk because it is an actively managed investment fund. The Adviser will apply its investment techniques and risk analyses in making investment decisions for the Fund, but there is no guarantee that its techniques will produce the intended results.
These risks are fully discussed in the Fund’s prospectus. As with all investments, you may lose money by investing in the Fund.
An Important Note About Historical Performance
The investment return and principal value of an investment in the Fund will fluctuate, so that shares, when redeemed, may be worth more or less than their original cost. Performance shown in this report represents past performance and does not guarantee future results. Current performance may be lower or higher than the performance information shown. You may obtain performance information current to the most recent month-end by visiting www.abfunds.com.
| | |
| abfunds.com | | AB CONCENTRATED GROWTH FUND | 5 |
DISCLOSURES AND RISKS (continued)
All fees and expenses related to the operation of the Fund have been deducted. NAV returns do not reflect sales charges; if sales charges were reflected, the Fund’s quoted performance would be lower. SEC returns reflect the applicable sales charges for each share class: a 4.25% maximum front-end sales charge for Class A shares and a 1% 1-year contingent deferred sales charge for Class C shares. Returns for the different share classes will vary due to different expenses associated with each class. Performance assumes reinvestment of distributions and does not account for taxes.
Please note: References to specific securities are presented to illustrate the Fund’s investment philosophy and are not to be considered advice or recommendations. This information reflects prevailing market conditions and the Adviser’s judgments as of the date indicated, which are subject to change. In preparing this report, the Adviser has relied upon and assumed without independent verification, the accuracy and completeness of all information available from third-party sources. It should not be assumed that any investments made in the future will be profitable or will equal the performance of the selected investments referenced herein.
| | |
| 6 | AB CONCENTRATED GROWTH FUND | | abfunds.com |
HISTORICAL PERFORMANCE
GROWTH OF A $10,000 INVESTMENT IN THE FUND (unaudited)
6/30/2007 TO 6/30/2017
This chart illustrates the total value of an assumed $10,000 investment in AB Concentrated Growth Fund Advisor Class shares (from 6/30/2007 to 6/30/2017) as compared to the performance of the Fund’s benchmark. The chart assumes the reinvestment of dividends and capital gains distributions.
| | |
| abfunds.com | | AB CONCENTRATED GROWTH FUND | 7 |
HISTORICAL PERFORMANCE (continued)
AVERAGE ANNUAL RETURNS AS OF JUNE 30, 2017 (unaudited)
| | | | | | | | |
| | | NAV Returns | | | SEC Returns (reflects applicable
sales charges) | |
| CLASS A SHARES | | | | | | | | |
| 1 Year | | | 25.93% | | | | 20.57% | |
| Since Inception1 | | | 10.54% | | | | 9.12% | |
| CLASS C SHARES | | | | | | | | |
| 1 Year | | | 25.03% | | | | 24.03% | |
| Since Inception1 | | | 9.73% | | | | 9.73% | |
| ADVISOR CLASS SHARES2 | | | | | | | | |
| 1 Year | | | 26.26% | | | | 26.26% | |
| 5 Years | | | 15.07% | | | | 15.07% | |
| 10 Years | | | 8.47% | | | | 8.47% | |
| CLASS R SHARES2 | | | | | | | | |
| 1 Year | | | 25.63% | | | | 25.63% | |
| Since Inception1 | | | 10.26% | | | | 10.26% | |
| CLASS K SHARES2 | | | | | | | | |
| 1 Year | | | 25.97% | | | | 25.97% | |
| Since Inception1 | | | 10.55% | | | | 10.55% | |
| CLASS I SHARES2 | | | | | | | | |
| 1 Year | | | 26.26% | | | | 26.26% | |
| Since Inception1 | | | 10.84% | | | | 10.84% | |
| CLASS Z SHARES2 | | | | | | | | |
| 1 Year | | | 26.29% | | | | 26.29% | |
| Since Inception1 | | | 10.82% | | | | 10.82% | |
The Fund’s prospectus fee table shows the Fund’s total annual operating expense ratios as 1.27%, 2.01%, 1.01%, 1.50%, 1.24%, 0.98% and 0.96% for Class A, Class C, Advisor Class, Class R, Class K, Class I and Class Z shares, respectively, gross of any fee waivers or expense reimbursements. Contractual fee waivers and/or expense reimbursements limit the Fund’s annual operating expense ratios exclusive of expenses associated with acquired fund fees and expenses other than the advisory fees of any AB mutual funds in which the Fund may invest, interest expense, taxes, extraordinary expenses, and brokerage commissions and other transaction costs to 1.24%, 1.99%, 0.99%, 1.49%, 1.24%, 0.99% and 0.99% for Class A, Class C, Advisor Class, Class R, Class K, Class I and Class Z shares, respectively. These waivers/reimbursements may not be terminated before November 1, 2017. Absent reimbursements or waivers, performance would have been lower, with the exception of Class K, Class I and Class Z shares, as these share classes are currently operating below their respective contractual expense caps. The Financial Highlights section of this report sets forth expense ratio data for the current reporting period; the expense ratios shown above may differ from the expense ratios in the Financial Highlights section since they are based on different time periods.
| 1 | Inception date: 2/28/2014. |
| 2 | These share classes are offered at NAV to eligible investors and their SEC returns are the same as their NAV returns. Please note that these share classes are for investors purchasing shares through accounts established under certain fee-based programs sponsored and maintained by certain broker-dealers and financial intermediaries, institutional pension plans and/or investment advisory clients of, and certain other persons associated with, the Adviser and its affiliates or the Fund. |
| | |
| 8 | AB CONCENTRATED GROWTH FUND | | abfunds.com |
HISTORICAL PERFORMANCE (continued)
SEC AVERAGE ANNUAL RETURNS
AS OF THE MOST RECENT CALENDAR QUARTER-END
JUNE 30, 2017 (unaudited)
| | | | |
| | | SEC Returns (reflects applicable
sales charges) | |
| CLASS A SHARES | | | | |
| 1 Year | | | 20.57% | |
| Since Inception1 | | | 9.12% | |
| CLASS C SHARES | | | | |
| 1 Year | | | 24.03% | |
| Since Inception1 | | | 9.73% | |
| ADVISOR CLASS SHARES2 | | | | |
| 1 Year | | | 26.26% | |
| 5 Years | | | 15.07% | |
| 10 Years | | | 8.47% | |
| CLASS R SHARES2 | | | | |
| 1 Year | | | 25.63% | |
| Since Inception1 | | | 10.26% | |
| CLASS K SHARES2 | | | | |
| 1 Year | | | 25.97% | |
| Since Inception1 | | | 10.55% | |
| CLASS I SHARES2 | | | | |
| 1 Year | | | 26.26% | |
| Since Inception1 | | | 10.84% | |
| CLASS Z SHARES2 | | | | |
| 1 Year | | | 26.29% | |
| Since Inception1 | | | 10.82% | |
| 1 | Inception date: 2/28/2014. |
| 2 | Please note that these share classes are for investors purchasing shares through accounts established under certain fee-based programs sponsored and maintained by certain broker-dealers and financial intermediaries, institutional pension plans and/or investment advisory clients of, and certain other persons associated with, the Adviser and its affiliates or the Fund. |
| | |
| abfunds.com | | AB CONCENTRATED GROWTH FUND | 9 |
EXPENSE EXAMPLE
(unaudited)
As a shareholder of the Fund, you incur two types of costs: (1) transaction costs, including sales charges (loads) on purchase payments, contingent deferred sales charges on redemptions and (2) ongoing costs, including management fees; distribution (12b-1) fees; and other Fund expenses. This example is intended to help you understand your ongoing costs (in dollars) of investing in the Fund and to compare these costs with the ongoing costs of investing in other mutual funds.
This Example is based on an investment of $1,000 invested at the beginning of the period and held for the entire period as indicated below.
Actual Expenses
The table below provides information about actual account values and actual expenses. You may use the information, together with the amount you invested, to estimate the expenses that you paid over the period. Simply divide your account value by $1,000 (for example, an $8,600 account value divided by $1,000 = 8.6), then multiply the result by the number under the heading entitled “Expenses Paid During Period” to estimate the expenses you paid on your account during this period.
Hypothetical Example for Comparison Purposes
The table below also provides information about hypothetical account values and hypothetical expenses based on the Fund’s actual expense ratio and an assumed annual rate of return of 5% before expenses, which is not the Fund’s actual return. The hypothetical account values and expenses may not be used to estimate the actual ending account balance or expenses you paid for the period. You may use this information to compare the ongoing costs of investing in the Fund and other funds by comparing this 5% hypothetical example with the 5% hypothetical examples that appear in the shareholder reports of other funds.
Please note that the expenses shown in the table are meant to highlight your ongoing costs only and do not reflect any transactional costs, such as sales charges (loads), or contingent deferred sales charges on redemptions. Therefore, the hypothetical example is useful in comparing ongoing costs only, and will not help you determine the relative total costs of owning different funds. In addition, if these transactional costs were included, your costs would have been higher.
| | | | | | | | | | | | | | | | | | | | | | | | |
| | | Beginning
Account
Value
January 1,
2017 | | | Ending
Account
Value
June 30,
2017 | | | Expenses
Paid
During
Period* | | | Annualized
Expense
Ratio* | | | Total
Expenses
Paid
During
Period+ | | | Total
Annualized
Expense
Ratio+ | |
| Class A | | | | | | | | | | | | | | | | | | | | | | | | |
Actual | | $ | 1,000 | | | $ | 1,146.40 | | | $ | 6.44 | | | | 1.21 | % | | $ | 6.49 | | | | 1.22 | % |
Hypothetical** | | $ | 1,000 | | | $ | 1,018.79 | | | $ | 6.06 | | | | 1.21 | % | | $ | 6.11 | | | | 1.22 | % |
| | |
| 10 | AB CONCENTRATED GROWTH FUND | | abfunds.com |
EXPENSE EXAMPLE (continued)
| | | | | | | | | | | | | | | | | | | | | | | | |
| | | Beginning
Account
Value
January 1,
2017 | | | Ending
Account
Value
June 30,
2017 | | | Expenses
Paid
During
Period* | | | Annualized
Expense
Ratio* | | | Total
Expenses
Paid
During
Period+ | | | Total
Annualized
Expense
Ratio+ | |
| Class C | | | | | | | | | | | | | | | | | | | | | | | | |
Actual | | $ | 1,000 | | | $ | 1,142.50 | | | $ | 10.47 | | | | 1.97 | % | | $ | 10.52 | | | | 1.98 | % |
Hypothetical** | | $ | 1,000 | | | $ | 1,015.03 | | | $ | 9.84 | | | | 1.97 | % | | $ | 9.89 | | | | 1.98 | % |
| Advisor Class | | | | | | | | | | | | | | | | | | | | | | | | |
Actual | | $ | 1,000 | | | $ | 1,147.90 | | | $ | 5.11 | | | | 0.96 | % | | $ | 5.11 | | | | 0.96 | % |
Hypothetical** | | $ | 1,000 | | | $ | 1,020.03 | | | $ | 4.81 | | | | 0.96 | % | | $ | 4.81 | | | | 0.96 | % |
| Class R | | | | | | | | | | | | | | | | | | | | | | | | |
Actual | | $ | 1,000 | | | $ | 1,145.00 | | | $ | 7.82 | | | | 1.47 | % | | $ | 7.87 | | | | 1.48 | % |
Hypothetical** | | $ | 1,000 | | | $ | 1,017.50 | | | $ | 7.35 | | | | 1.47 | % | | $ | 7.40 | | | | 1.48 | % |
| Class K | | | | | | | | | | | | | | | | | | | | | | | | |
Actual | | $ | 1,000 | | | $ | 1,146.40 | | | $ | 6.44 | | | | 1.21 | % | | $ | 6.49 | | | | 1.22 | % |
Hypothetical** | | $ | 1,000 | | | $ | 1,018.79 | | | $ | 6.06 | | | | 1.21 | % | | $ | 6.11 | | | | 1.22 | % |
| Class I | | | | | | | | | | | | | | | | | | | | | | | | |
Actual | | $ | 1,000 | | | $ | 1,147.70 | | | $ | 5.06 | | | | 0.95 | % | | $ | 5.11 | | | | 0.96 | % |
Hypothetical** | | $ | 1,000 | | | $ | 1,020.08 | | | $ | 4.76 | | | | 0.95 | % | | $ | 4.81 | | | | 0.96 | % |
| Class Z | | | | | | | | | | | | | | | | | | | | | | | | |
Actual | | $ | 1,000 | | | $ | 1,147.80 | | | $ | 4.95 | | | | 0.93 | % | | $ | 5.01 | | | | 0.94 | % |
Hypothetical** | | $ | 1,000 | | | $ | 1,020.18 | | | $ | 4.66 | | | | 0.93 | % | | $ | 4.71 | | | | 0.94 | % |
| * | Expenses are equal to the classes’ annualized expense ratios multiplied by the average account value over the period, multiplied by 181/365 (to reflect the one-half year period). |
| ** | Assumes 5% annual return before expenses. |
| + | In connection with the Fund’s investments in affiliated/unaffiliated underlying portfolios, the Fund incurs no direct expenses, but bears proportionate shares of the fees and expenses (i.e., operating, administrative and investment advisory fees) of the affiliated/unaffiliated underlying portfolios. The Adviser has contractually agreed to waive its fees from the Fund in an amount equal to the Fund’s pro rata share of certain acquired fund fees and expenses of the affiliated underlying portfolios. The Fund’s total expenses are equal to the classes’ annualized expense ratio plus the Fund’s pro rata share of the weighted average expense ratio of the affiliated/unaffiliated underlying portfolios in which it invests, multiplied by the average account value over the period, multiplied by 181/365 (to reflect the one-half year period). |
| | |
| abfunds.com | | AB CONCENTRATED GROWTH FUND | 11 |
PORTFOLIO SUMMARY
June 30, 2017 (unaudited)
PORTFOLIO STATISTICS
Net Assets ($mil): $407.9
TEN LARGEST HOLDINGS2
| | | | | | | | |
| Company | | U.S. $ Value | | | Percent of
Net Assets | |
| Abbott Laboratories | | $ | 33,065,835 | | | | 8.1 | % |
| Alphabet, Inc. – Class C | | | 29,520,094 | | | | 7.2 | |
| Mastercard, Inc. – Class A | | | 25,780,070 | | | | 6.3 | |
| Celgene Corp. | | | 24,229,846 | | | | 5.9 | |
| Zoetis, Inc. | | | 23,479,520 | | | | 5.8 | |
| Quintiles IMS Holdings, Inc. | | | 23,405,324 | | | | 5.7 | |
| Priceline Group, Inc. (The) | | | 23,115,886 | | | | 5.7 | |
| Gartner, Inc. | | | 20,385,449 | | | | 5.0 | |
| Charles Schwab Corp. (The) | | | 19,928,929 | | | | 4.9 | |
| Verisk Analytics, Inc. – Class A | | | 19,893,771 | | | | 4.9 | |
| | $ | 242,804,724 | | | | 59.5 | % |
| 1 | All data are as of June 30, 2017. The Fund’s sector breakdown is expressed as a percentage of total investments and may vary over time. |
Please note: The sector classifications presented herein are based on the Global Industry Classification Standard (GICS) which was developed by Morgan Stanley Capital International and Standard & Poor’s. The components are divided into sector, industry group, and industry sub-indices as classified by the GICS for each of the market capitalization indices in the broad market. These sector classifications are broadly defined. The “Portfolio of Investments” section of the report reflects more specific industry information and is consistent with the investment restrictions discussed in the Fund’s prospectus.
| | |
| 12 | AB CONCENTRATED GROWTH FUND | | abfunds.com |
PORTFOLIO OF INVESTMENTS
June 30, 2017
| | | | | | | | |
| Company | | Shares | | | U.S. $ Value | |
| |
| | | | | | | | |
COMMON STOCKS – 96.4% | | | | | | | | |
Information Technology – 31.2% | | | | | | | | |
Electronic Equipment, Instruments & Components – 4.8% | | | | | | | | |
Amphenol Corp. – Class A | | | 262,733 | | | $ | 19,394,950 | |
| | | | | | | | |
| | |
Internet Software & Services – 7.2% | | | | | | | | |
Alphabet, Inc. – Class C(a) | | | 32,485 | | | | 29,520,094 | |
| | | | | | | | |
| | |
IT Services – 14.8% | | | | | | | | |
Automatic Data Processing, Inc. | | | 139,650 | | | | 14,308,539 | |
Gartner, Inc.(a) | | | 165,051 | | | | 20,385,449 | |
Mastercard, Inc. – Class A | | | 212,269 | | | | 25,780,070 | |
| | | | | | | | |
| | | | | | | 60,474,058 | |
| | | | | | | | |
Technology Hardware, Storage & Peripherals – 4.4% | | | | | | | | |
Apple, Inc. | | | 125,737 | | | | 18,108,643 | |
| | | | | | | | |
| | | | | | | 127,497,745 | |
| | | | | | | | |
Health Care – 25.5% | | | | | | | | |
Biotechnology – 5.9% | | | | | | | | |
Celgene Corp.(a) | | | 186,570 | | | | 24,229,846 | |
| | | | | | | | |
| | |
Health Care Equipment & Supplies – 8.1% | | | | | | | | |
Abbott Laboratories | | | 680,227 | | | | 33,065,835 | |
| | | | | | | | |
| | |
Life Sciences Tools & Services – 5.7% | | | | | | | | |
Quintiles IMS Holdings, Inc.(a) | | | 261,512 | | | | 23,405,324 | |
| | | | | | | | |
| | |
Pharmaceuticals – 5.8% | | | | | | | | |
Zoetis, Inc. | | | 376,395 | | | | 23,479,520 | |
| | | | | | | | |
| | | | | | | 104,180,525 | |
| | | | | | | | |
Consumer Discretionary – 21.8% | | | | | | | | |
Auto Components – 4.7% | | | | | | | | |
Delphi Automotive PLC | | | 215,860 | | | | 18,920,129 | |
| | | | | | | | |
| | |
Hotels, Restaurants & Leisure – 8.0% | | | | | | | | |
Chipotle Mexican Grill, Inc. – Class A(a) | | | 35,570 | | | | 14,800,677 | |
Starbucks Corp. | | | 308,180 | | | | 17,969,976 | |
| | | | | | | | |
| | | | | | | 32,770,653 | |
| | | | | | | | |
Internet & Direct Marketing Retail – 5.7% | | | | | | | | |
Priceline Group, Inc. (The)(a) | | | 12,358 | | | | 23,115,886 | |
| | | | | | | | |
| | |
Specialty Retail – 3.4% | | | | | | | | |
Ulta Salon Cosmetics & Fragrance, Inc.(a) | | | 48,569 | | | | 13,955,816 | |
| | | | | | | | |
| | | | | | | 88,762,484 | |
| | | | | | | | |
Financials – 4.9% | | | | | | | | |
Capital Markets – 4.9% | | | | | | | | |
Charles Schwab Corp. (The) | | | 463,895 | | | | 19,928,929 | |
| | | | | | | | |
| | |
| abfunds.com | | AB CONCENTRATED GROWTH FUND | 13 |
PORTFOLIO OF INVESTMENTS (continued)
| | | | | | | | |
| Company | | Shares | | | U.S. $ Value | |
| |
| | | | | | | | |
Industrials – 4.9% | | | | | | | | |
Professional Services – 4.9% | | | | | | | | |
Verisk Analytics, Inc. – Class A(a) | | | 235,792 | | | $ | 19,893,771 | |
| | | | | | | | |
| | |
Materials – 4.2% | | | | | | | | |
Chemicals – 4.2% | | | | | | | | |
Ecolab, Inc. | | | 128,216 | | | | 17,020,674 | |
| | | | | | | | |
| | |
Consumer Staples – 3.9% | | | | | | | | |
Food Products – 3.9% | | | | | | | | |
Hershey Co. (The) | | | 148,180 | | | | 15,910,087 | |
| | | | | | | | |
| | |
Total Common Stocks
(cost $321,714,871) | | | | | | | 393,194,215 | |
| | | | | | | | |
| | | | | | | | |
SHORT-TERM INVESTMENTS – 3.3% | | | | | | | | |
Investment Companies – 3.3% | | | | | | | | |
AB Fixed Income Shares, Inc. – Government Money Market Portfolio – Class AB, 0.79%(b)(c)
(cost $13,393,642) | | | 13,393,642 | | | | 13,393,642 | |
| | | | | | | | |
| | |
Total Investments – 99.7%
(cost $335,108,513) | | | | | | | 406,587,857 | |
Other assets less liabilities – 0.3% | | | | | | | 1,301,486 | |
| | | | | | | | |
| | |
Net Assets – 100.0% | | | | | | $ | 407,889,343 | |
| | | | | | | | |
| (a) | Non-income producing security. |
| (b) | Investment in affiliated money market mutual fund. The rate shown represents the 7-day yield as of period end. |
| (c) | To obtain a copy of the fund’s shareholder report, please go to the Securities and Exchange Commission’s website at www.sec.gov, or call AB at
(800) 227-4618. |
See notes to financial statements.
| | |
| 14 | AB CONCENTRATED GROWTH FUND | | abfunds.com |
STATEMENT OF ASSETS & LIABILITIES
June 30, 2017
| | | | |
| Assets | | | | |
Investments in securities, at value | | | | |
Unaffiliated issuers (cost $321,714,871) | | $ | 393,194,215 | |
Affiliated issuers (cost $13,393,642) | | | 13,393,642 | |
Receivable for capital stock sold | | | 1,338,156 | |
Receivable for investment securities sold | | | 1,015,997 | |
Unaffiliated dividends and interest receivable | | | 208,599 | |
Affiliated dividends receivable | | | 8,762 | |
| | | | |
Total assets | | | 409,159,371 | |
| | | | |
| Liabilities | | | | |
Due to Adviser | | | 46,446 | |
Payable for capital stock redeemed | | | 795,493 | |
Advisory fee payable | | | 265,961 | |
Distribution fee payable | | | 21,387 | |
Administrative fee payable | | | 12,889 | |
Transfer Agent fee payable | | | 6,193 | |
Accrued expenses and other liabilities | | | 121,659 | |
| | | | |
Total liabilities | | | 1,270,028 | |
| | | | |
Net Assets | | $ | 407,889,343 | |
| | | | |
Composition of Net Assets | | | | |
Capital stock, at par | | $ | 1,242 | |
Additional paid-in capital | | | 333,244,620 | |
Distributions in excess of net investment income | | | (288,780 | ) |
Accumulated net realized gain on investment transactions | | | 3,452,917 | |
Net unrealized appreciation on investments | | | 71,479,344 | |
| | | | |
| | $ | 407,889,343 | |
| | | | |
Net Asset Value Per Share—33 billion shares of capital stock authorized, $.0001 par value
| | | | | | | | | | | | |
| Class | | Net Assets | | | Shares
Outstanding | | | Net Asset
Value | |
| |
| A | | $ | 26,579,726 | | | | 814,042 | | | $ | 32.65 | * |
| |
| C | | $ | 18,726,507 | | | | 588,219 | | | $ | 31.84 | |
| |
| Advisor | | $ | 298,098,794 | | | | 9,057,352 | | | $ | 32.91 | |
| |
| R | | $ | 13,031 | | | | 402.54 | | | $ | 32.37 | |
| |
| K | | $ | 397,718 | | | | 12,179 | | | $ | 32.66 | |
| |
| I | | $ | 13,396 | | | | 406.55 | | | $ | 32.95 | |
| |
| Z | | $ | 64,060,171 | | | | 1,945,200 | | | $ | 32.93 | |
| |
| * | The maximum offering price per share for Class A shares was $34.10 which reflects a sales charge of 4.25%. |
See notes to financial statements.
| | |
| abfunds.com | | AB CONCENTRATED GROWTH FUND | 15 |
STATEMENT OF OPERATIONS
Year Ended June 30, 2017
| | | | | | | | |
| Investment Income | | | | | | | | |
Dividends | | | | | | | | |
Unaffiliated issuers | | $ | 3,292,885 | | | | | |
Affiliated issuers | | | 61,781 | | | | | |
Other income | | | 11 | | | $ | 3,354,677 | |
| | | | | | | | |
| Expenses | | | | | | | | |
Advisory fee (see Note B) | | | 2,866,411 | | | | | |
Distribution fee—Class A | | | 68,153 | | | | | |
Distribution fee—Class C | | | 191,826 | | | | | |
Distribution fee—Class R | | | 70 | | | | | |
Distribution fee—Class K | | | 668 | | | | | |
Transfer agency—Class A | | | 13,954 | | | | | |
Transfer agency—Class C | | | 9,765 | | | | | |
Transfer agency—Advisor Class | | | 126,978 | | | | | |
Transfer agency—Class R | | | 8 | | | | | |
Transfer agency—Class K | | | 134 | | | | | |
Transfer agency—Class I | | | 5 | | | | | |
Transfer agency—Class Z | | | 10,717 | | | | | |
Custodian | | | 116,539 | | | | | |
Registration fees | | | 86,167 | | | | | |
Legal | | | 66,703 | | | | | |
Administrative | | | 49,738 | | | | | |
Audit and tax | | | 35,510 | | | | | |
Printing | | | 34,282 | | | | | |
Directors’ fees | | | 27,099 | | | | | |
Miscellaneous | | | 22,996 | | | | | |
| | | | | | | | |
Total expenses | | | 3,727,723 | | | | | |
Less: expenses waived and reimbursed by the Adviser (see Notes B & E) | | | (29,232 | ) | | | | |
| | | | | | | | |
Net expenses | | | | | | | 3,698,491 | |
| | | | | | | | |
Net investment loss | | | | | | | (343,814 | ) |
| | | | | | | | |
| Realized and Unrealized Gain on Investment Transactions | | | | | | | | |
Net realized gain on investment transactions | | | | | | | 10,307,507 | |
Net change in unrealized appreciation/depreciation of investments | | | | | | | 72,629,715 | |
| | | | | | | | |
Net gain on investment transactions | | | | | | | 82,937,222 | |
| | | | | | | | |
Net Increase in Net Assets from Operations | | | | | | $ | 82,593,408 | |
| | | | | | | | |
See notes to financial statements.
| | |
| 16 | AB CONCENTRATED GROWTH FUND | | abfunds.com |
STATEMENT OF CHANGES IN NET ASSETS
| | | | | | | | |
| | | Year Ended
June 30,
2017 | | | Year Ended
June 30,
2016 | |
| Increase (Decrease) in Net Assets from Operations | | | | | | | | |
Net investment loss | | $ | (343,814 | ) | | $ | (64,946 | ) |
Net realized gain (loss) on investment transactions | | | 10,307,507 | | | | (1,084,373 | ) |
Net change in unrealized appreciation/depreciation of investments | | | 72,629,715 | | | | (19,156,207 | ) |
Net increase (decrease) in net assets from operations | | | 82,593,408 | | | | (20,305,526 | ) |
| Distributions to Shareholders from | | | | | | | | |
Net realized gain on investment transactions | | | | | | | | |
Class A | | | (111,879 | ) | | | (628,838 | ) |
Class C | | | (84,273 | ) | | | (574,644 | ) |
Advisor Class | | | (1,099,048 | ) | | | (7,302,389 | ) |
Class R | | | (51 | ) | | | (1,002 | ) |
Class K | | | (1,085 | ) | | | (2,424 | ) |
Class I | | | (120 | ) | | | (734 | ) |
Class Z | | | (227,806 | ) | | | (1,294,334 | ) |
| Capital Stock Transactions | | | | | | | | |
Net increase | | | 4,057,528 | | | | 101,027,695 | |
| | | | | | | | |
Total increase | | | 85,126,674 | | | | 70,917,804 | |
| Net Assets | | | | | | | | |
Beginning of period | | | 322,762,669 | | | | 251,844,865 | |
| | | | | | | | |
End of period (including distributions in excess of net investment income of ($288,780) and ($1,556), respectively) | | $ | 407,889,343 | | | $ | 322,762,669 | |
| | | | | | | | |
See notes to financial statements.
| | |
| abfunds.com | | AB CONCENTRATED GROWTH FUND | 17 |
NOTES TO FINANCIAL STATEMENTS
June 30, 2017
Significant Accounting Policies
AB Cap Fund, Inc. (the “Company”), which is a Maryland corporation, is registered under the Investment Company Act of 1940 as an open-end management investment company. The Company operates as a series company currently comprised of 31 portfolios. Each portfolio is considered to be a separate entity for financial reporting and tax purposes. This report relates only to the AB Concentrated Growth Fund (the “Fund”), a non-diversified portfolio. The Fund has authorized the issuance of Class A, Class B, Class C, Advisor Class, Class R, Class K, Class I, Class Z, Class T, Class 1 and Class 2 shares. Class B, Class T, Class 1 and Class 2 shares have not been issued. Class A shares are sold with a front-end sales charge of up to 4.25% for purchases not exceeding $1,000,000. Class C shares are subject to a contingent deferred sales charge of 1% on redemptions made within the first year after purchase, and 0% after the first year of purchase. Effective April 10, 2017, Class C shares will automatically convert to Class A shares ten years after the end of the calendar month of purchase. Class R and Class K shares are sold without an initial or contingent deferred sales charge. Advisor Class, Class I and Class Z shares are sold without an initial or contingent deferred sales charge and are not subject to ongoing distribution expenses. All eleven classes of shares have identical voting, dividend, liquidation and other rights, except that the classes bear different distribution and transfer agency expenses. Each class has exclusive voting rights with respect to its distribution plan. The financial statements have been prepared in conformity with U.S. generally accepted accounting principles (“U.S. GAAP”) which require management to make certain estimates and assumptions that affect the reported amounts of assets and liabilities in the financial statements and amounts of income and expenses during the reporting period. Actual results could differ from those estimates. The Fund is an investment company under U.S. GAAP and follows the accounting and reporting guidance applicable to investment companies. The following is a summary of significant accounting policies followed by the Fund.
1. Security Valuation
Portfolio securities are valued at their current market value determined on the basis of market quotations or, if market quotations are not readily available or are deemed unreliable, at “fair value” as determined in accordance with procedures established by and under the general supervision of the Company’s Board of Directors (the “Board”).
In general, the market values of securities which are readily available and deemed reliable are determined as follows: securities listed on a national securities exchange (other than securities listed on the NASDAQ Stock Market, Inc. (“NASDAQ”)) or on a foreign securities exchange are valued at
| | |
| 18 | AB CONCENTRATED GROWTH FUND | | abfunds.com |
NOTES TO FINANCIAL STATEMENTS (continued)
the last sale price at the close of the exchange or foreign securities exchange. If there has been no sale on such day, the securities are valued at the last traded price from the previous day. Securities listed on more than one exchange are valued by reference to the principal exchange on which the securities are traded; securities listed only on NASDAQ are valued in accordance with the NASDAQ Official Closing Price; listed or over the counter (“OTC”) market put or call options are valued at the mid level between the current bid and ask prices. If either a current bid or current ask price is unavailable, the Adviser will have discretion to determine the best valuation (e.g. last trade price in the case of listed options); open futures are valued using the closing settlement price or, in the absence of such a price, the most recent quoted bid price. If there are no quotations available for the day of valuation, the last available closing settlement price is used; U.S. Government securities and any other debt instruments having 60 days or less remaining until maturity are generally valued at market by an independent pricing vendor, if a market price is available. If a market price is not available, the securities are valued at amortized cost. This methodology is commonly used for short term securities that have an original maturity of 60 days or less, as well as short term securities that had an original term to maturity that exceeded 60 days. In instances when amortized cost is utilized, the Valuation Committee (the “Committee”) must reasonably conclude that the utilization of amortized cost is approximately the same as the fair value of the security. Such factors the Committee will consider include, but are not limited to, an impairment of the creditworthiness of the issuer or material changes in interest rates. Fixed-income securities, including mortgage-backed and asset-backed securities, may be valued on the basis of prices provided by a pricing service or at a price obtained from one or more of the major broker-dealers. In cases where broker-dealer quotes are obtained, the Adviser may establish procedures whereby changes in market yields or spreads are used to adjust, on a daily basis, a recently obtained quoted price on a security. Swaps and other derivatives are valued daily, primarily using independent pricing services, independent pricing models using market inputs, as well as third party broker-dealers or counterparties. Open end mutual funds are valued at the closing net asset value per share, while exchange traded funds are valued at the closing market price per share.
Securities for which market quotations are not readily available (including restricted securities) or are deemed unreliable are valued at fair value as deemed appropriate by the Adviser. Factors considered in making this determination may include, but are not limited to, information obtained by contacting the issuer, analysts, analysis of the issuer’s financial statements or other available documents. In addition, the Fund may use fair value pricing for securities primarily traded in non-U.S. markets because most foreign markets close well before the Fund values its securities at 4:00 p.m.,
| | |
| abfunds.com | | AB CONCENTRATED GROWTH FUND | 19 |
NOTES TO FINANCIAL STATEMENTS (continued)
Eastern Time. The earlier close of these foreign markets gives rise to the possibility that significant events, including broad market moves, may have occurred in the interim and may materially affect the value of those securities. To account for this, the Fund may frequently value many of its foreign equity securities using fair value prices based on third party vendor modeling tools to the extent available.
2. Fair Value Measurements
In accordance with U.S. GAAP regarding fair value measurements, fair value is defined as the price that the Fund would receive to sell an asset or pay to transfer a liability in an orderly transaction between market participants at the measurement date. U.S. GAAP establishes a framework for measuring fair value, and a three-level hierarchy for fair value measurements based upon the transparency of inputs to the valuation of an asset or liability (including those valued based on their market values as described in Note A.1 above). Inputs may be observable or unobservable and refer broadly to the assumptions that market participants would use in pricing the asset or liability. Observable inputs reflect the assumptions market participants would use in pricing the asset or liability based on market data obtained from sources independent of the Fund. Unobservable inputs reflect the Fund’s own assumptions about the assumptions that market participants would use in pricing the asset or liability based on the best information available in the circumstances. Each investment is assigned a level based upon the observability of the inputs which are significant to the overall valuation. The three-tier hierarchy of inputs is summarized below.
| | • | | Level 1—quoted prices in active markets for identical investments |
| | • | | Level 2—other significant observable inputs (including quoted prices for similar investments, interest rates, prepayment speeds, credit risk, etc.) |
| | • | | Level 3—significant unobservable inputs (including the Fund’s own assumptions in determining the fair value of investments) |
Where readily available market prices or relevant bid prices are not available for certain equity investments, such investments may be valued based on similar publicly traded investments, movements in relevant indices since last available prices or based upon underlying company fundamentals and comparable company data (such as multiples to earnings or other multiples to equity). Where an investment is valued using an observable input, such as another publicly traded security, the investment will be classified as Level 2. If management determines that an adjustment is appropriate based on restrictions on resale, illiquidity or uncertainty, and such adjustment is a significant component of the valuation, the investment will be classified as Level 3. An investment will also be classified as Level 3 where management uses company fundamentals and other significant inputs to determine the valuation.
| | |
| 20 | AB CONCENTRATED GROWTH FUND | | abfunds.com |
NOTES TO FINANCIAL STATEMENTS (continued)
The following table summarizes the valuation of the Fund’s investments by the above fair value hierarchy levels as of June 30, 2017:
| | | | | | | | | | | | | | | | |
Investments in
Securities: | | Level 1 | | | Level 2 | | | Level 3 | | | Total | |
Assets: | | | | | | | | | | | | | | | | |
Common Stocks(a) | | $ | 393,194,215 | | | $ | – 0 | – | | $ | – 0 | – | | $ | 393,194,215 | |
Short-Term Investments | | | 13,393,642 | | | | – 0 | – | | | – 0 | – | | | 13,393,642 | |
| | | | | | | | | | | | | | | | |
Total Investments in Securities | | | 406,587,857 | | | | – 0 | – | | | – 0 | – | | | 406,587,857 | |
Other Financial Instruments(b) | | | – 0 | – | | | – 0 | – | | | – 0 | – | | | – 0 | – |
| | | | | | | | | | | | | | | | |
Total(c) | | $ | 406,587,857 | | | $ | – 0 | – | | $ | – 0 | – | | $ | 406,587,857 | |
| | | | | | | | | | | | | | | | |
| (a) | See Portfolio of Investments for sector classifications. |
| (b) | Other financial instruments are derivative instruments, such as futures, forwards and swaps, which are valued at the unrealized appreciation/(depreciation) on the instrument. |
| (c) | There were no transfers between any levels during the reporting period. |
The Fund recognizes all transfers between levels of the fair value hierarchy assuming the financial instruments were transferred at the beginning of the reporting period.
The Adviser established the Committee to oversee the pricing and valuation of all securities held in the Fund. The Committee operates under pricing and valuation policies and procedures established by the Adviser and approved by the Board, including pricing policies which set forth the mechanisms and processes to be employed on a daily basis to implement these policies and procedures. In particular, the pricing policies describe how to determine market quotations for securities and other instruments. The Committee’s responsibilities include: 1) fair value and liquidity determinations (and oversight of any third parties to whom any responsibility for fair value and liquidity determinations is delegated), and 2) regular monitoring of the Adviser’s pricing and valuation policies and procedures and modification or enhancement of these policies and procedures (or recommendation of the modification of these policies and procedures) as the Committee believes appropriate.
The Committee is also responsible for monitoring the implementation of the pricing policies by the Adviser’s Pricing Group (the “Pricing Group”) and any third party which performs certain pricing functions in accordance with the pricing policies. The Pricing Group is responsible for the oversight of the third party on a day-to-day basis. The Committee and the Pricing Group perform a series of activities to provide reasonable assurance of the accuracy of prices including: 1) periodic vendor due diligence meetings, review of methodologies, new developments and processes at vendors, 2) daily comparison of security valuation versus prior day for all securities that exceeded established thresholds, and 3) daily review of unpriced, stale, and variance reports with exceptions reviewed by senior management and the Committee.
| | |
| abfunds.com | | AB CONCENTRATED GROWTH FUND | 21 |
NOTES TO FINANCIAL STATEMENTS (continued)
In addition, several processes outside of the pricing process are used to monitor valuation issues including: 1) performance and performance attribution reports are monitored for anomalous impacts based upon benchmark performance, and 2) portfolio managers review all portfolios for performance and analytics (which are generated using the Adviser’s prices).
3. Currency Translation
Assets and liabilities denominated in foreign currencies and commitments under forward currency exchange contracts are translated into U.S. dollars at the mean of the quoted bid and ask prices of such currencies against the U.S. dollar. Purchases and sales of portfolio securities are translated into U.S. dollars at the rates of exchange prevailing when such securities were acquired or sold. Income and expenses are translated into U.S. dollars at rates of exchange prevailing when accrued.
Net realized gain or loss on foreign currency transactions represents foreign exchange gains and losses from sales and maturities of foreign fixed income investments, foreign currency exchange contracts, holding of foreign currencies, currency gains or losses realized between the trade and settlement dates on foreign investment transactions, and the difference between the amounts of dividends, interest and foreign withholding taxes recorded on the Fund’s books and the U.S. dollar equivalent amounts actually received or paid. Net unrealized currency gains and losses from valuing foreign currency denominated assets and liabilities at period end exchange rates are reflected as a component of net unrealized appreciation or depreciation of foreign currency denominated assets and liabilities.
4. Taxes
It is the Fund’s policy to meet the requirements of the Internal Revenue Code applicable to regulated investment companies and to distribute all of its investment company taxable income and net realized gains, if any, to shareholders. Therefore, no provisions for federal income or excise taxes are required. The Fund may be subject to taxes imposed by countries in which it invests. Such taxes are generally based on income and/or capital gains earned or repatriated. Taxes are accrued and applied to net investment income, net realized gains and net unrealized appreciation/depreciation as such income and/or gains are earned.
In accordance with U.S. GAAP requirements regarding accounting for uncertainties in income taxes, management has analyzed the Fund’s tax positions taken or expected to be taken on federal and state income tax returns for all open tax years (the current tax year and the prior two tax years) and has concluded that no provision for income tax is required in the Fund’s financial statements.
| | |
| 22 | AB CONCENTRATED GROWTH FUND | | abfunds.com |
NOTES TO FINANCIAL STATEMENTS (continued)
5. Investment Income and Investment Transactions
Dividend income is recorded on the ex-dividend date or as soon as the Fund is informed of the dividend. Interest income is accrued daily and includes amortization of premiums and accretions of discounts as adjustments to interest income. Investment transactions are accounted for on the date the securities are purchased or sold. Investment gains or losses are determined on the identified cost basis. The Fund amortizes premiums and accretes discounts as adjustments to interest income.
6. Class Allocations
All income earned and expenses incurred by the Fund are borne on a pro-rata basis by each outstanding class of shares, based on the proportionate interest in the Fund represented by the net assets of such class, except for class specific expenses which are allocated to the respective class. Expenses of the Company are charged proportionately to each portfolio or based on other appropriate methods. Realized and unrealized gains and losses are allocated among the various share classes based on respective net assets.
7. Dividends and Distributions
Dividends and distributions to shareholders, if any, are recorded on the ex-dividend date. Income dividends and capital gains distributions are determined in accordance with federal tax regulations and may differ from those determined in accordance with U.S. GAAP. To the extent these differences are permanent, such amounts are reclassified within the capital accounts based on their federal tax basis treatment; temporary differences do not require such reclassification.
NOTE B
Advisory Fee and Other Transactions with Affiliates
Under the terms of the investment advisory agreement, the Fund pays the Adviser an advisory fee at an annual rate of .80% of the Fund’s average daily net assets. Effective November 1, 2016 the advisory fee was reduced from 1.00% to .80% of the Fund’s average daily net assets. The fee is accrued daily and paid monthly. The Adviser has agreed to waive its fees and bear certain expenses to the extent necessary to limit total operating expenses (excluding expenses associated with acquired fund fees and expenses other than the advisory fees of any AB Mutual Funds in which the Fund may invest, interest expense, taxes, extraordinary expenses, and brokerage commissions and other transaction costs) on an annual basis (the “Expense Caps”) to 1.24%, 1.99%, .99%, 1.49%, 1.24%, .99% and .99% of daily average net assets for Class A, Class C, Advisor Class, Class R, Class K, Class I and Class Z shares, respectively. For the year ended June 30, 2017, there was no such waiver/reimbursement. The Expense Caps may not be terminated by the Adviser prior to November 1, 2017.
| | |
| abfunds.com | | AB CONCENTRATED GROWTH FUND | 23 |
NOTES TO FINANCIAL STATEMENTS (continued)
Pursuant to the investment advisory agreement, the Fund may reimburse the Adviser for certain legal and accounting services provided to the Fund by the Adviser. For the year ended June 30, 2017, such fee amounted to $49,738.
The Fund compensates AllianceBernstein Investor Services, Inc. (“ABIS”), a wholly-owned subsidiary of the Adviser, under a Transfer Agency Agreement for providing personnel and facilities to perform transfer agency services for the Fund. ABIS may make payments to intermediaries that provide omnibus account services, sub-accounting services and/or networking services. Such compensation retained by ABIS amounted to $71,324 for the year ended June 30, 2017.
AllianceBernstein Investments, Inc. (the “Distributor”), a wholly-owned subsidiary of the Adviser, serves as the distributor of the Fund’s shares. The Distributor has advised the Fund that it has retained front-end sales charges of $2,760 from the sale of Class A shares and received $13 and $7,380 in contingent deferred sales charges imposed upon redemptions by shareholders of Class A and Class C shares, respectively, for the year ended June 30, 2017.
The Fund may invest in AB Government Money Market Portfolio (the “Government Money Market Portfolio”) which has a contractual annual advisory fee rate of .20% of the portfolio’s average daily net assets and bears its own expenses. In connection with the investment by the Fund in the Government Money Market Portfolio, the Adviser has agreed to waive its advisory fee from the Fund in an amount equal to the Fund’s pro rata share of the effective advisory fee of Government Money Market Portfolio, as borne indirectly by the Fund as an acquired fund fee and expense. For the year ended June 30, 2017, such waiver amounted to $26,639. A summary of the Fund’s transactions in shares of the Government Money Market Portfolio for the year ended June 30, 2017 is as follows:
| | | | | | | | | | | | | | | | | | |
Market Value
6/30/16
(000) | | | Purchases
at Cost
(000) | | | Sales
Proceeds
(000) | | | Market Value
6/30/17
(000) | | | Dividend
Income
(000) | |
| $ | 3,772 | | | $ | 107,190 | | | $ | 97,568 | | | $ | 13,394 | | | $ | 56 | |
Brokerage commissions paid on investment transactions for the year ended June 30, 2017 amounted to $53,818, of which $0 and $0, respectively, was paid to Sanford C. Bernstein & Co. LLC and Sanford C. Bernstein Limited, affiliates of the Adviser.
NOTE C
Distribution Services Agreement
The Fund has adopted a Distribution Services Agreement (“the Agreement”) pursuant to Rule 12b-1 under the Investment Company Act of 1940 for
| | |
| 24 | AB CONCENTRATED GROWTH FUND | | abfunds.com |
NOTES TO FINANCIAL STATEMENTS (continued)
Class A, Class C, Class R and Class K. Under the Agreement, the Fund pays distribution and servicing fees to the Distributor at an annual rate of up to .25% of the Fund’s average daily net assets attributable to Class A shares, 1% of the Fund’s average daily net assets attributable to Class C shares. .50% of the Fund’s average daily net assets attributable to Class R shares, and .25% of the Fund’s average daily net assets attributable to Class K shares. There are no distribution and servicing fees on the Advisor Class, Class I and Class Z shares. The fees are accrued daily and paid monthly. Since the commencement of the Fund’s operations, the Distributor has incurred expenses in excess of the distribution costs reimbursed by the Fund in the amounts of $146,276, $0 and $0 for Class C, Class R and Class K shares, respectively. The Agreement provides that the Distributor will use such payments in their entirety for distribution assistance and promotional activities. While such costs may be recovered from the Fund in future periods so long as the Agreement is in effect, the rate of the distribution and servicing fees payable under the Agreement may not be increased without a shareholder vote. In accordance with the Agreement, there is no provision for recovery of unreimbursed distribution costs incurred by the Distributor beyond the current fiscal year for Class A shares. The Agreement also provides that the Adviser may use its own resources to finance the distribution of the Fund’s shares.
NOTE D
Investment Transactions
Purchases and sales of investment securities (excluding short-term investments) for the year ended June 30, 2017 were as follows:
| | | | | | | | |
| | | Purchases | | | Sales | |
Investment securities (excluding
U.S. government securities) | | $ | 100,326,063 | | | $ | 109,078,021 | |
U.S. government securities | | | – 0 | – | | | – 0 | – |
The cost of investments for federal income tax purposes, gross unrealized appreciation and unrealized depreciation are as follows:
| | | | |
Cost | | $ | 335,851,840 | |
| | | | |
Gross unrealized appreciation | | $ | 74,293,263 | |
Gross unrealized depreciation | | | (3,557,246 | ) |
| | | | |
Net unrealized appreciation | | $ | 70,736,017 | |
| | | | |
1. Derivative Financial Instruments
The Fund may use derivatives in an effort to earn income and enhance returns, to replace more traditional direct investments, to obtain exposure to otherwise inaccessible markets (collectively, “investment purposes”), or to hedge or adjust the risk profile of its portfolio.
| | |
| abfunds.com | | AB CONCENTRATED GROWTH FUND | 25 |
NOTES TO FINANCIAL STATEMENTS (continued)
The Fund did not engage in derivatives transactions for the year ended June 30, 2017.
2. Currency Transactions
The Fund may invest in non-U.S. Dollar-denominated securities on a currency hedged or unhedged basis. The Fund may seek investment opportunities by taking long or short positions in currencies through the use of currency-related derivatives, including forward currency exchange contracts, futures and options on futures, swaps, and other options. The Fund may enter into transactions for investment opportunities when it anticipates that a foreign currency will appreciate or depreciate in value but securities denominated in that currency are not held by the Fund and do not present attractive investment opportunities. Such transactions may also be used when the Adviser believes that it may be more efficient than a direct investment in a foreign currency-denominated security. The Fund may also conduct currency exchange contracts on a spot basis (i.e., for cash at the spot rate prevailing in the currency exchange market for buying or selling currencies).
NOTE E
Securities Lending
The Fund may enter into securities lending transactions. Under the Fund’s securities lending program, all loans of securities will be collateralized continually by cash. The Fund will be compensated for the loan from a portion of the net return from the income earned on cash collateral after a rebate is paid to the borrower (in some cases, this rebate may be a “negative rebate” or fee paid by the borrower to the Fund in connection with the loan), and payments are made for fees of the securities lending agent and for certain other administrative expenses. It is the policy of the Fund to receive collateral consisting of cash in an amount exceeding the value of the securities loaned. The Fund will have the right to call a loan and obtain the securities loaned at any time on notice to the borrower within the normal and customary settlement time for the securities. While the securities are on loan, the borrower is obligated to pay the Fund amounts equal to any income or other distributions from the securities. The Fund will not be able to exercise voting rights with respect to any securities during the existence of a loan, but will have the right to regain ownership of loaned securities in order to exercise voting or other ownership rights. The lending agent has agreed to indemnify the Fund in the case of default of any securities borrower. Collateral received and securities loaned are marked to market daily to ensure that the securities loaned are secured by collateral. The lending agent currently invests the cash collateral received in Government Money Market Portfolio, an eligible money market vehicle, in accordance with the investment restrictions of the Fund, and as approved by the Board. The collateral received on securities loaned is recorded as an asset as well as a corresponding liability in the financial statement of assets and
| | |
| 26 | AB CONCENTRATED GROWTH FUND | | abfunds.com |
NOTES TO FINANCIAL STATEMENTS (continued)
liabilities. When the Fund lends securities, its investment performance will continue to reflect changes in the value of the securities loaned. At June 30, 2017, the Fund had no securities on loan. The cash collateral will be adjusted on the next business day to maintain the required collateral amount. The Fund earned securities lending income of $0 and $6,275 from the borrower and Government Money Market Portfolio respectively, for the year ended June 30, 2017; these amounts are reflected in the statement of operations. In connection with the cash collateral investment by the Fund in the Government Money Market Portfolio, the Adviser has agreed to waive a portion of the Fund’s share of the advisory fees of Government Money Market Portfolio, as borne indirectly by the Fund as an acquired fund fee and expense. For the year ended June 30, 2017, such waiver amounted to $2,593. A principal risk of lending portfolio securities is that the borrower may fail to return the loaned securities upon termination of the loan and that the collateral will not be sufficient to replace the loaned securities. A summary of the Fund’s transactions in shares of Government Money Market Portfolio for the year ended June 30, 2017 is as follows:
| | | | | | | | | | | | | | |
Market Value 6/30/16 (000) | | | Purchases
at Cost
(000) | | | Sales
Proceeds
(000) | | | Market Value
6/30/17
(000) | |
| $ | – 0 – | | | $ | 23,347 | | | $ | 23,347 | | | $ | – 0 – | |
NOTE F
Capital Stock
Each class consists of 3,000,000,000 authorized shares. Transactions in capital shares for each class were as follows:
| | | | | | | | | | | | | | | | | | | | | | | | |
| | | | | | | | | | | | | | | | | | | | | | | | |
| | | Shares | | | | | | Amount | | | | |
| | | Year Ended
June 30, 2017 | | | Year Ended
June 30, 2016 | | | | | | Year Ended
June 30, 2017 | | | Year Ended
June 30, 2016 | | | | |
| | | | | | | | |
| Class A | | | | | | | | | | | | | | | | | | | | | | | | |
Shares sold | | | 315,687 | | | | 1,023,118 | | | | | | | $ | 9,393,391 | | | $ | 27,881,994 | | | | | |
| | | | | |
Shares issued in reinvestment of distributions | | | 3,690 | | | | 18,527 | | | | | | | | 106,022 | | | | 513,394 | | | | | |
| | | | | |
Shares converted from Class C | | | 13,626 | | | | – 0 | – | | | | | | | 431,013 | | | | – 0 | – | | | | |
| | | | | |
Shares redeemed | | | (687,981 | ) | | | (354,535 | ) | | | | | | | (19,825,929 | ) | | | (9,281,867 | ) | | | | |
| | | | | |
Net increase (decrease) | | | (354,978 | ) | | | 687,110 | | | | | | | $ | (9,895,503 | ) | | $ | 19,113,521 | | | | | |
| | | | | |
| | | | | | | | | | | | | | | | | | | | | | | | |
| | |
| abfunds.com | | AB CONCENTRATED GROWTH FUND | 27 |
NOTES TO FINANCIAL STATEMENTS (continued)
| | | | | | | | | | | | | | | | | | | | | | | | |
| | | | | | | | | | | | | | | | | | | | | | | | |
| | | Shares | | | | | | Amount | | | | |
| | | Year Ended
June 30, 2017 | | | Year Ended
June 30, 2016 | | | | | | Year Ended
June 30, 2017 | | | Year Ended
June 30, 2016 | | | | |
| | | | | | | | |
| Class C | | | | | | | | | | | | | | | | | | | | | | | | |
Shares sold | | | 86,388 | | | | 535,050 | | | | | | | $ | 2,489,152 | | | $ | 14,558,072 | | | | | |
| | | | | |
Shares issued in reinvestment of distributions | | | 2,677 | | | | 18,795 | | | | | | | | 75,286 | | | | 513,848 | | | | | |
| | | | | |
Shares converted to Class A | | | (13,962 | ) | | | – 0 | – | | | | | | | (431,013 | ) | | | – 0 | – | | | | |
| | | | | |
Shares redeemed | | | (253,755 | ) | | | (162,974 | ) | | | | | | | (7,241,752 | ) | | | (4,238,657 | ) | | | | |
| | | | | |
Net increase (decrease) | | | (178,652 | ) | | | 390,871 | | | | | | | $ | (5,108,327 | ) | | $ | 10,833,263 | | | | | |
| | | | | |
| | | | | | | | | | | | | | | | | | | | | | | | |
| Advisor Class | | | | | | | | | | | | | | | | | | | | | | | | |
Shares sold | | | 3,186,102 | | | | 5,982,902 | | | | | | | $ | 94,440,304 | | | $ | 162,726,403 | | | | | |
| | | | | |
Shares issued in reinvestment of distributions | | | 32,213 | | | | 237,527 | | | | | | | | 931,605 | | | | 6,610,381 | | | | | |
| | | | | |
Shares redeemed | | | (2,862,330 | ) | | | (4,243,284 | ) | | | | | | | (83,617,725 | ) | | | (112,617,016 | ) | | | | |
| | | | | |
Net increase | | | 355,985 | | | | 1,977,145 | | | | | | | $ | 11,754,184 | | | $ | 56,719,768 | | | | | |
| | | | | |
| | | | | | | | | | | | | | | | | | | | | | | | |
| Class R | | | | | | | | | | | | | | | | | | | | | | | | |
Shares sold | | | – 0 | – | | | 864 | | | | | | | $ | – 0 | – | | $ | 24,660 | | | | | |
| | | | | |
Shares issued in reinvestment of distributions | | | – 0 | – | | | 25 | | | | | | | | – 0 | – | | | 684 | | | | | |
| | | | | |
Shares redeemed | | | (889 | ) | | | – 0 | – | | | | | | | (24,475 | ) | | | – 0 | – | | | | |
| | | | | |
Net increase (decrease) | | | (889 | ) | | | 889 | | | | | | | $ | (24,475 | ) | | $ | 25,344 | | | | | |
| | | | | |
| | | | | | | | | | | | | | | | | | | | | | | | |
| Class K | | | | | | | | | | | | | | | | | | | | | | | | |
Shares sold | | | 10,913 | | | | 3,768 | | | | | | | $ | 316,134 | | | $ | 100,456 | | | | | |
| | | | | |
Shares issued in reinvestment of distributions | | | 35 | | | | 76 | | | | | | | | 1,034 | | | | 2,106 | | | | | |
| | | | | |
Shares redeemed | | | (2,580 | ) | | | (436 | ) | | | | | | | (76,030 | ) | | | (11,663 | ) | | | | |
| | | | | |
Net increase | | | 8,368 | | | | 3,408 | | | | | | | $ | 241,138 | | | $ | 90,899 | | | | | |
| | | | | |
| | | | | | | | | | | | | | | | | | | | | | | | |
| Class I | | | | | | | | | | | | | | | | | | | | | | | | |
Shares sold | | | – 0 | – | | | 521 | | | | | | | $ | – 0 | – | | $ | 14,959 | | | | | |
| | | | | |
Shares issued in reinvestment of distributions | | | 3 | | | | 15 | | | | | | | | 68 | | | | 413 | | | | | |
| | | | | |
Shares redeemed | | | (539 | ) | | | – 0 | – | | | | | | | (16,637 | ) | | | – 0 | – | | | | |
| | | | | |
Net increase (decrease) | | | (536 | ) | | | 536 | | | | | | | $ | (16,569 | ) | | $ | 15,372 | | | | | |
| | | | | |
| | | | | | | | | | | | | | | | | | | | | | | | |
| Class Z | | | | | | | | | | | | | | | | | | | | | | | | |
Shares sold | | | 351,298 | | | | 645,565 | | | | | | | $ | 10,492,837 | | | $ | 17,935,419 | | | | | |
| | | | | |
Shares issued in reinvestment of distributions | | | 7,872 | | | | 46,502 | | | | | | | | 227,806 | | | | 1,294,147 | | | | | |
| | | | | |
Shares redeemed | | | (123,436 | ) | | | (183,880 | ) | | | | | | | (3,613,563 | ) | | | (5,000,038 | ) | | | | |
| | | | | |
Net increase | | | 235,734 | | | | 508,187 | | | | | | | $ | 7,107,080 | | | $ | 14,229,528 | | | | | |
| | | | | |
| | | | | | | | | | | | | | | | | | | | | | | | |
| | |
| 28 | AB CONCENTRATED GROWTH FUND | | abfunds.com |
NOTES TO FINANCIAL STATEMENTS (continued)
At June 30, 2017, a shareholder of the Fund owned 40% of the Fund’s outstanding shares. Significant transactions by such shareholder, if any, may impact the Fund’s performance.
NOTE G
Risks Involved in Investing in the Fund
Focused Portfolio Risk—Investments in a limited number of companies may have more risk because changes in the value of a single security may have a more significant effect, either negative or positive, on the Fund’s net asset value, or NAV.
Capitalization Risk—Investments in mid-capitalization companies may be more volatile and less liquid than investments in large-capitalization companies.
Non-Diversification Risk—The Fund may have more risk because it is “non-diversified”, meaning that it can invest more of its assets in a smaller number of issuers and that adverse changes in the value of one security could have a more significant effect on the Fund’s NAV.
Indemnification Risk—In the ordinary course of business, the Fund enters into contracts that contain a variety of indemnifications. The Fund’s maximum exposure under these arrangements is unknown. However, the Fund has not had prior claims or losses pursuant to these indemnification provisions and expects the risk of loss thereunder to be remote. Therefore, the Fund has not accrued any liability in connection with these indemnification provisions.
NOTE H
Joint Credit Facility
A number of open-end mutual funds managed by the Adviser, including the Fund, participate in a $280 million revolving credit facility (the “Facility”) intended to provide short-term financing, if necessary, subject to certain restrictions in connection with abnormal redemption activity. Commitment fees related to the Facility are paid by the participating funds and are included in miscellaneous expenses in the statement of operations. The Fund did not utilize the Facility during the year ended June 30, 2017.
NOTE I
Distributions to Shareholders
The tax character of distributions paid during the fiscal years ended June 30, 2017 and June 30, 2016 were as follows:
| | | | | | | | |
| | | 2017 | | | 2016 | |
Distributions paid from: | | | | | | | | |
Long-term capital gains | | $ | 1,524,262 | | | $ | 9,804,365 | |
| | | | | | | | |
Total taxable distributions paid | | $ | 1,524,262 | | | $ | 9,804,365 | |
| | | | | | | | |
| | |
| abfunds.com | | AB CONCENTRATED GROWTH FUND | 29 |
NOTES TO FINANCIAL STATEMENTS (continued)
As of June 30, 2017, the components of accumulated earnings/(deficit) on a tax basis were as follows:
| | | | |
Undistributed capital gains | | $ | 4,196,244 | |
Accumulated capital and other losses | | | (288,780 | )(a) |
Unrealized appreciation/(depreciation) | | | 70,736,017 | (b) |
| | | | |
Total accumulated earnings/(deficit) | | $ | 74,643,481 | |
| | | | |
| (a) | At June 30, 2017, the Fund had a qualified late-year ordinary loss deferral of $288,780. These losses are deemed to arise on July 1, 2017. |
| (b) | The difference between book-basis and tax-basis unrealized appreciation/(depreciation) is attributable primarily to the tax deferral of losses on wash sales. |
For tax purposes, net realized capital losses may be carried over to offset future capital gains, if any. Funds are permitted to carry forward capital losses for an indefinite period, and such losses will retain their character as either short-term or long-term capital losses. As of June 30, 2017, the Fund did not have any capital loss carryforwards.
During the current fiscal period, permanent differences primarily due to contributions from Affiliates and disallowance of a net operating loss resulted in a net decrease in distributions in excess of net investment income, a net increase in accumulated net realized gain on investment, and a net decrease in additional paid-in capital. These reclassifications had no effect on net assets.
NOTE J
Other
In October 2016, the U.S. Securities and Exchange Commission adopted new rules and amended existing rules (together, “final rules”) intended to modernize the reporting and disclosure of information by registered investment companies. In part, the final rules amend Regulation S-X and require standardized, enhanced disclosure about derivatives in investment company financial statements, as well as other amendments. The compliance date for the amendments to Regulation S-X is August 1, 2017 (for reporting end dates of August 31, 2017 or after). Management has evaluated the impact of the amendments and expects the effect of the adoption of the final rules on financial statements will be limited to additional disclosures.
NOTE K
Subsequent Events
Management has evaluated subsequent events for possible recognition or disclosure in the financial statements through the date the financial statements are issued. Management has determined that there are no material events that would require disclosure in the Fund’s financial statements through this date.
| | |
| 30 | AB CONCENTRATED GROWTH FUND | | abfunds.com |
FINANCIAL HIGHLIGHTS
Selected Data For A Share Of Capital Stock Outstanding Throughout Each Period
| | | | | | | | | | | | | | | | |
| | | Class A | |
| | | Year Ended June 30, | | | February 28,
2014(a) to
June 30, 2014 | |
| | | 2017 | | | 2016 | | | 2015 | | |
| | | | |
| | | | | | | | | | | | | | | | |
Net asset value, beginning of period | | | $ 26.04 | | | | $ 28.61 | | | | $ 26.26 | | | | $ 24.85 | |
| | | | |
Income From Investment Operations | | | | | | | | | | | | | | | | |
Net investment income (loss)(b)(c) | | | (.08 | ) | | | (.05 | ) | | | (.10 | ) | | | (.01 | ) |
Net realized and unrealized gain (loss) on investment transactions | | | 6.82 | | | | (1.73 | ) | | | 3.24 | | | | 1.42 | |
| | | | |
Net increase (decrease) in net asset value from operations | | | 6.74 | | | | (1.78 | ) | | | 3.14 | | | | 1.41 | |
| | | | |
Less: Distributions | | | | | | | | | | | | | | | | |
Distributions from net realized gain on investment transactions | | | (.13 | ) | | | (.79 | ) | | | (.79 | ) | | | – 0 | – |
| | | | |
Net asset value, end of period | | | $ 32.65 | | | | $ 26.04 | | | | $ 28.61 | | | | $ 26.26 | |
| | | | |
Total Return | | | | | | | | | | | | | | | | |
Total investment return based on net asset value(d) | | | 25.93 | % | | | (6.38 | )% | | | 12.12 | % | | | 5.67 | % |
Ratios/Supplemental Data | | | | | | | | | | | | | | | | |
Net assets, end of period (000’s omitted) | | | $26,579 | | | | $30,438 | | | | $13,785 | | | | $56 | |
Ratio to average net assets of: | | | | | | | | | | | | | | | | |
Expenses, net of waivers/reimbursements(e) | | | 1.22 | % | | | 1.24 | % | | | 1.24 | % | | | 1.24 | %^ |
Expenses, before waivers/reimbursements(e) | | | 1.22 | % | | | 1.27 | % | | | 1.39 | % | | | 2.58 | %^ |
Net investment income (loss)(c) | | | (.27 | )% | | | (.19 | )% | | | (.37 | )% | | | (.20 | )%^ |
Portfolio turnover rate | | | 29 | % | | | 44 | % | | | 23 | % | | | 17 | % |
See footnote summary on page 37.
| | |
| abfunds.com | | AB CONCENTRATED GROWTH FUND | 31 |
FINANCIAL HIGHLIGHTS (continued)
Selected Data For A Share Of Capital Stock Outstanding Throughout Each Period
| | | | | | | | | | | | | | | | |
| | | Class C | |
| | | Year Ended June 30, | | | February 28,
2014(a) to
June 30, 2014 | |
| | | 2017 | | | 2016 | | | 2015 | | |
| | | | |
| | | | | | | | | | | | | | | | |
Net asset value, beginning of period | | | $ 25.58 | | | | $ 28.33 | | | | $ 26.20 | | | | $ 24.85 | |
| | | | |
Income From Investment Operations | | | | | | | | | | | | | | | | |
Net investment income (loss)(b)(c) | | | (.29 | ) | | | (.25 | ) | | | (.32 | ) | | | (.05 | ) |
Net realized and unrealized gain (loss) on investment transactions | | | 6.68 | | | | (1.71 | ) | | | 3.24 | | | | 1.40 | |
| | | | |
Net increase (decrease) in net asset value from operations | | | 6.39 | | | | (1.96 | ) | | | 2.92 | | | | 1.35 | |
| | | | |
Less: Distributions | | | | | | | | | | | | | | | | |
Distributions from net realized gain on investment transactions | | | (.13 | ) | | | (.79 | ) | | | (.79 | ) | | | – 0 | – |
| | | | |
Net asset value, end of period | | | $ 31.84 | | | | $ 25.58 | | | | $ 28.33 | | | | $ 26.20 | |
| | | | |
Total Return | | | | | | | | | | | | | | | | |
Total investment return based on net asset value(d) | | | 25.03 | % | | | (7.10 | )% | | | 11.29 | % | | | 5.43 | % |
Ratios/Supplemental Data | | | | | | | | | | | | | | | | |
Net assets, end of period (000’s omitted) | | | $18,727 | | | | $19,617 | | | | $10,652 | | | | $47 | |
Ratio to average net assets of: | | | | | | | | | | | | | | | | |
Expenses, net of waivers/reimbursements(e) | | | 1.97 | % | | | 1.99 | % | | | 1.99 | % | | | 1.99 | %^ |
Expenses, before waivers/reimbursements(e) | | | 1.97 | % | | | 2.01 | % | | | 2.14 | % | | | 3.54 | %^ |
Net investment income (loss)(c) | | | (1.02 | )% | | | (.94 | )% | | | (1.15 | )% | | | (.93 | )%^ |
Portfolio turnover rate | | | 29 | % | | | 44 | % | | | 23 | % | | | 17 | % |
See footnote summary on page 37.
| | |
| 32 | AB CONCENTRATED GROWTH FUND | | abfunds.com |
FINANCIAL HIGHLIGHTS (continued)
Selected Data For A Share Of Capital Stock Outstanding Throughout Each Period
| | | | | | | | | | | | | | | | | | | | | | | | |
| | | Advisor Class | |
| | | Year Ended June 30, | | | January 1,
2014 to
June 30, 2014(f) | | | Year Ended
December 31, | |
| | | 2017 | | | 2016 | | | 2015 | | | | 2013 | | | 2012 | |
| | | | |
| | | | | | | | | | | | | | | | | | | | | | | | |
Net asset value, beginning of period | | | $ 26.18 | | | | $ 28.69 | | | | $ 26.28 | | | | $ 25.80 | | | | $ 18.91 | | | | $ 16.32 | |
| | | | |
Income From Investment Operations | | | | | | | | | | | | | | | | | | | | | | | | |
Net investment income (loss)(b)(c) | | | (.01 | ) | | | .01 | | | | (.04 | ) | | | (.01 | ) | | | (.03 | ) | | | (.06 | ) |
Net realized and unrealized gain (loss) on investment transactions | | | 6.87 | | | | (1.73 | ) | | | 3.24 | | | | 1.04 | | | | 6.92 | | | | 2.65 | |
Net increase (decrease) in net asset value from operations | | | 6.86 | | | | (1.72 | ) | | | 3.20 | | | | 1.03 | | | | 6.89 | | | | 2.59 | |
| | | | |
Less: Distributions | | | | | | | | | | | | | | | | | | | | | | | | |
Distributions from net realized gain on investment transactions | | | (.13 | ) | | | (.79 | ) | | | (.79 | ) | | | (.55 | ) | | | – 0 | – | | | – 0 | – |
Redemption fee | | | – 0 | – | | | – 0 | – | | | – 0 | – | | | – 0 | – | | | .00 | (g) | | | .00 | (g) |
| | | | |
Net asset value, end of period | | | $ 32.91 | | | | $ 26.18 | | | | $ 28.69 | | | | $ 26.28 | | | | $ 25.80 | | | | $ 18.91 | |
| | | | |
Total Return | | | | | | | | | | | | | | | | | | | | | | | | |
Total investment return based on net asset value(d) | | | 26.26 | % | | | (6.16 | )% | | | 12.34 | % | | | 4.11 | % | | | 36.44 | % | | | 15.87 | % |
Ratios/Supplemental Data | | | | | | | | | | | | | | | | | | | | | | | | |
Net assets, end of period (000’s omitted) | | | $298,099 | | | | $227,787 | | | | $192,909 | | | | $36,630 | | | | $25,170 | | | | $18,433 | |
Ratio to average net assets of: | | | | | | | | | | | | | | | | | | | | | | | | |
Expenses, net of waivers/reimbursements(e) | | | .96 | % | | | .99 | % | | | .99 | % | | | 1.06 | %^ | | | 1.23 | % | | | 1.23 | % |
Expenses, before waivers/reimbursements(e) | | | .97 | % | | | 1.01 | % | | | 1.12 | % | | | 2.26 | %^ | | | 1.90 | % | | | 1.93 | % |
Net investment income (loss)(c) | | | (.03 | )% | | | .05 | % | | | (.13 | )% | | | (.06 | )%^ | | | (.14 | )% | | | (.30 | )% |
Portfolio turnover rate | | | 29 | % | | | 44 | % | | | 23 | % | | | 17 | % | | | 42 | % | | | 34 | % |
See footnote summary on page 37.
| | |
| abfunds.com | | AB CONCENTRATED GROWTH FUND | 33 |
FINANCIAL HIGHLIGHTS (continued)
Selected Data For A Share Of Capital Stock Outstanding Throughout Each Period
| | | | | | | | | | | | | | | | |
| | | Class R | |
| | | Year Ended June 30, | | | February 28,
2014(a) to June 30, 2014 | |
| | | 2017 | | | 2016 | | | 2015 | | |
| | | | |
| | | | | | | | | | | | | | | | |
Net asset value, beginning of period | | | $ 25.88 | | | | $ 28.51 | | | | $ 26.24 | | | | $ 24.85 | |
| | | | |
Income From Investment Operations | | | | | | | | | | | | | | | | |
Net investment income (loss)(b)(c) | | | (.15 | ) | | | (.12 | ) | | | (.17 | ) | | | (.03 | ) |
Net realized and unrealized gain (loss) on investment transactions | | | 6.77 | | | | (1.72 | ) | | | 3.23 | | | | 1.42 | |
| | | | |
Net increase (decrease) in net asset value from operations | | | 6.62 | | | | (1.84 | ) | | | 3.06 | | | | 1.39 | |
| | | | |
Less: Distributions | | | | | | | | | | | | | | | | |
Distributions from net realized gain on investment transactions | | | (.13 | ) | | | (.79 | ) | | | (.79 | ) | | | – 0 | – |
| | | | |
Net asset value, end of period | | | $ 32.37 | | | | $ 25.88 | | | | $ 28.51 | | | | $ 26.24 | |
| | | | |
Total Return | | | | | | | | | | | | | | | | |
Total investment return based on net asset value(d) | | | 25.63 | % | | | (6.62 | )% | | | 11.82 | % | | | 5.59 | % |
Ratios/Supplemental Data | | | | | | | | | | | | | | | | |
Net assets, end of period (000’s omitted) | | | $13 | | | | $33 | | | | $11 | | | | $10 | |
Ratio to average net assets of: | | | | | | | | | | | | | | | | |
Expenses, net of waivers/reimbursements(e) | | | 1.46 | % | | | 1.49 | % | | | 1.49 | % | | | 1.49 | %^ |
Expenses, before waivers/reimbursements(e) | | | 1.47 | % | | | 1.50 | % | | | 1.60 | % | | | 2.79 | %^ |
Net investment income (loss)(c) | | | (.53 | )% | | | (.45 | )% | | | (.62 | )% | | | (.41 | )%^ |
Portfolio turnover rate | | | 29 | % | | | 44 | % | | | 23 | % | | | 17 | % |
See footnote summary on page 37.
| | |
| 34 | AB CONCENTRATED GROWTH FUND | | abfunds.com |
FINANCIAL HIGHLIGHTS (continued)
Selected Data For A Share Of Capital Stock Outstanding Throughout Each Period
| | | | | | | | | | | | | | | | |
| | | Class K | |
| | | Year Ended June 30, | | | February 28,
2014(a) to
June 30, 2014 | |
| | | 2017 | | | 2016 | | | 2015 | | |
| | | | |
| | | | | | | | | | | | | | | | |
Net asset value, beginning of period | | | $ 26.04 | | | | $ 28.61 | | | | $ 26.26 | | | | $ 24.85 | |
| | | | |
Income From Investment Operations | | | | | | | | | | | | | | | | |
Net investment income (loss)(b)(c) | | | (.09 | ) | | | (.05 | ) | | | (.10 | ) | | | (.01 | ) |
Net realized and unrealized gain (loss) on investment transactions | | | 6.84 | | | | (1.73 | ) | | | 3.24 | | | | 1.42 | |
| | | | |
Net increase (decrease) in net asset value from operations | | | 6.75 | | | | (1.78 | ) | | | 3.14 | | | | 1.41 | |
| | | | |
Less: Distributions | | | | | | | | | | | | | | | | |
Distributions from net realized gain on investment transactions | | | (.13 | ) | | | (.79 | ) | | | (.79 | ) | | | – 0 | – |
| | | | |
Net asset value, end of period | | | $ 32.66 | | | | $ 26.04 | | | | $ 28.61 | | | | $ 26.26 | |
| | | | |
Total Return | | | | | | | | | | | | | | | | |
Total investment return based on net asset value(d) | | | 25.97 | % | | | (6.38 | )% | | | 12.12 | % | | | 5.67 | % |
Ratios/Supplemental Data | | | | | | | | | | | | | | | | |
Net assets, end of period (000’s omitted) | | | $398 | | | | $99 | | | | $12 | | | | $10 | |
Ratio to average net assets of: | | | | | | | | | | | | | | | | |
Expenses, net of waivers/reimbursements(e) | | | 1.21 | % | | | 1.24 | % | | | 1.24 | % | | | 1.24 | %^ |
Expenses, before waivers/reimbursements(e) | | | 1.22 | % | | | 1.24 | % | | | 1.35 | % | | | 2.58 | %^ |
Net investment income (loss)(c) | | | (.31 | )% | | | (.18 | )% | | | (.38 | )% | | | (.15 | )%^ |
Portfolio turnover rate | | | 29 | % | | | 44 | % | | | 23 | % | | | 17 | % |
See footnote summary on page 37.
| | |
| abfunds.com | | AB CONCENTRATED GROWTH FUND | 35 |
FINANCIAL HIGHLIGHTS (continued)
Selected Data For A Share Of Capital Stock Outstanding Throughout Each Period
| | | | | | | | | | | | | | | | |
| | | Class I | |
| | | Year Ended June 30, | | | February 28,
2014(a) to
June 30, 2014 | |
| | | 2017 | | | 2016 | | | 2015 | | |
| | | | |
| | | | | | | | | | | | | | | | |
Net asset value, beginning of period | | | $ 26.21 | | | | $ 28.71 | | | | $ 26.28 | | | | $ 24.85 | |
| | | | |
Income From Investment Operations | | | | | | | | | | | | | | | | |
Net investment income (loss)(b)(c) | | | .00 | (g) | | | .02 | | | | (.02 | ) | | | (.02 | ) |
Net realized and unrealized gain (loss) on investment transactions | | | 6.87 | | | | (1.73 | ) | | | 3.24 | | | | 1.45 | |
| | | | |
Net increase (decrease) in net asset value from operations | | | 6.87 | | | | (1.71 | ) | | | 3.22 | | | | 1.43 | |
| | | | |
Less: Distributions | | | | | | | | | | | | | | | | |
Distributions from net realized gain on investment transactions | | | (.13 | ) | | | (.79 | ) | | | (.79 | ) | | | – 0 | – |
| | | | |
Net asset value, end of period | | | $ 32.95 | | | | $ 26.21 | | | | $ 28.71 | | | | $ 26.28 | |
| | | | |
Total Return | | | | | | | | | | | | | | | | |
Total investment return based on net asset value(d) | | | 26.26 | % | | | (6.12 | )% | | | 12.42 | % | | | 5.75 | % |
Ratios/Supplemental Data | | | | | | | | | | | | | | | | |
Net assets, end of period (000’s omitted) | | | $13 | | | | $25 | | | | $12 | | | | $26,344 | |
Ratio to average net assets of: | | | | | | | | | | | | | | | | |
Expenses, net of waivers/reimbursements(e) | | | .95 | % | | | .98 | % | | | .99 | % | | | .99 | %^ |
Expenses, before waivers/reimbursements(e) | | | .96 | % | | | .98 | % | | | 1.09 | % | | | 1.95 | %^ |
Net investment income (loss)(c) | | | .01 | % | | | .07 | % | | | (.07 | )% | | | (.27 | )%^ |
Portfolio turnover rate | | | 29 | % | | | 44 | % | | | 23 | % | | | 17 | % |
See footnote summary on page 37.
| | |
| 36 | AB CONCENTRATED GROWTH FUND | | abfunds.com |
FINANCIAL HIGHLIGHTS (continued)
Selected Data For A Share Of Capital Stock Outstanding Throughout Each Period
| | | | | | | | | | | | | | | | |
| | | Class Z | |
| | | Year Ended June 30, | | | February 28,
2014(a) to
June 30, 2014 | |
| | | 2017 | | | 2016 | | | 2015 | | |
| | | | |
| | | | | | | | | | | | | | | | |
Net asset value, beginning of period | | | $ 26.19 | | | | $ 28.69 | | | | $ 26.28 | | | | $ 24.85 | |
| | | | |
Income From Investment Operations | | | | | | | | | | | | | | | | |
Net investment income (loss)(b)(c) | | | .00 | (g) | | | .02 | | | | (.04 | ) | | | .01 | |
Net realized and unrealized gain (loss) on investment transactions | | | 6.87 | | | | (1.73 | ) | | | 3.24 | | | | 1.42 | |
| | | | |
Net increase (decrease) in net asset value from operations | | | 6.87 | | | | (1.71 | ) | | | 3.20 | | | | 1.43 | |
| | | | |
Less: Distributions | | | | | | | | | | | | | | | | |
Distributions from net realized gain on investment transactions | | | (.13 | ) | | | (.79 | ) | | | (.79 | ) | | | – 0 | – |
| | | | |
Net asset value, end of period | | | $ 32.93 | | | | $ 26.19 | | | | $ 28.69 | | | | $ 26.28 | |
| | | | |
Total Return | | | | | | | | | | | | | | | | |
Total investment return based on net asset value(d) | | | 26.29 | % | | | (6.12 | )% | | | 12.34 | % | | | 5.75 | % |
Ratios/Supplemental Data | | | | | | | | | | | | | | | | |
Net assets, end of period (000’s omitted) | | | $64,060 | | | | $44,764 | | | | $34,464 | | | | $11 | |
Ratio to average net assets of: | | | | | | | | | | | | | | | | |
Expenses, net of waivers(e) | | | .93 | % | | | .96 | % | | | .99 | % | | | .99 | %^ |
Expenses, before waivers(e) | | | .94 | % | | | .96 | % | | | 1.08 | % | | | 2.25 | %^ |
Net investment income (loss)(c) | | | 0 | % | | | .07 | % | | | (.15 | )% | | | .09 | %^ |
Portfolio turnover rate | | | 29 | % | | | 44 | % | | | 23 | % | | | 17 | % |
| (a) | Commencement of operations. |
| (b) | Based on average shares outstanding. |
| (c) | Net of fees and expenses waived/reimbursed by the Adviser. |
| (d) | Total investment return is calculated assuming an initial investment made at the net asset value at the beginning of the period, reinvestment of all dividends and distributions at net asset value during the period, and redemption on the last day of the period. Initial sales charges or contingent deferred sales charges are not reflected in the calculation of total investment return. Total return does not reflect the deduction of taxes that a shareholder would pay on fund distributions or the redemption of fund shares. Total investment return calculated for a period of less than one year is not annualized. |
| (e) | In connection with the Fund’s investments in affiliated underlying portfolios, the Fund incurs no direct expenses, but bears proportionate shares of the acquired fund fees and expenses (i.e., operating, administrative and investment advisory fees) of the affiliated underlying portfolios. The Adviser has voluntarily agreed to waive its fees from the Fund in an amount equal to the Fund’s pro rata share of certain acquired fund fees and expenses, and for the year ended June 30, 2017, such waiver amounted to 0.01% annualized for the Fund. |
| (f) | The Predecessor Fund changed its fiscal year end from December 31 to June 30. |
| (g) | Amount is less than $.005. |
See notes to financial statements.
| | |
| abfunds.com | | AB CONCENTRATED GROWTH FUND | 37 |
REPORT OF INDEPENDENT REGISTERED
PUBLIC ACCOUNTING FIRM
To the Board of Directors and the
Shareholders of AB Concentrated Growth Fund
We have audited the accompanying statement of assets and liabilities, including the portfolio of investments, of AB Concentrated Growth Fund (the “Fund”), one of the funds constituting the AB Cap Fund, Inc., as of June 30, 2017, and the related statement of operations for the year then ended, the statements of changes in net assets for each of the two years in the period then ended and the financial highlights for each of the three years in the period then ended and the period January 1, 2014 to June 30, 2014. These financial statements and financial highlights are the responsibility of the Fund’s management. Our responsibility is to express an opinion on these financial statements and financial highlights based on our audits. The financial highlights for each of the periods presented prior to January 1, 2014 were audited by other auditors whose report dated February 28, 2014 expressed an unqualified opinion on those statements and financial highlights.
We conducted our audits in accordance with the standards of the Public Company Accounting Oversight Board (United States). Those standards require that we plan and perform the audit to obtain reasonable assurance about whether the financial statements and financial highlights are free of material misstatement. We were not engaged to perform an audit of the Fund’s internal control over financial reporting. Our audits included consideration of internal control over financial reporting as a basis for designing audit procedures that are appropriate in the circumstances, but not for the purpose of expressing an opinion on the effectiveness of the Fund’s internal control over financial reporting. Accordingly, we express no such opinion. An audit also includes examining, on a test basis, evidence supporting the amounts and disclosures in the financial statements and financial highlights, assessing the accounting principles used and significant estimates made by management, and evaluating the overall financial statement presentation. Our procedures included confirmation of securities owned as of June 30, 2017 by correspondence with the custodian and others or by other appropriate auditing procedures where replies from others were not received. We believe that our audits provide a reasonable basis for our opinion.
In our opinion, the financial statements and financial highlights referred to above present fairly, in all material respects, the financial position of AB Concentrated Growth Fund, one of the funds constituting the AB Cap Fund, Inc., at June 30, 2017, and the results of its operations for the year then ended, the changes in its net assets for each of the two years in the period then ended, and the financial highlights for each of the three years in the period then ended and the period January 1, 2014 to June 30, 2014, in conformity with U.S. generally accepted accounting principles.

New York, New York
August 25, 2017
| | |
| 38 | AB CONCENTRATED GROWTH FUND | | abfunds.com |
BOARD OF DIRECTORS
| | |
Marshall C. Turner, Jr.(1), Chairman John H. Dobkin(1) Michael J. Downey(1) William H. Foulk, Jr.(1) D. James Guzy(1) Nancy P. Jacklin(1) | | Robert M. Keith, President and Chief Executive Officer Carol C. McMullen(1) Garry L. Moody(1) Earl D. Weiner(1) |
OFFICERS
| | |
Philip L. Kirstein, Senior Vice President and Independent Compliance Officer James Tierney(2), Vice President Emilie D. Wrapp, Secretary | | Joseph J. Mantineo, Treasurer and Chief Financial Officer Phyllis J. Clarke, Controller Vincent S. Noto, Chief Compliance Officer |
| | |
Custodian and Accounting Agent State Street Bank and Trust Company State Street Corporation CCB/5 1 Iron Street Boston, MA 02210 Principal Underwriter AllianceBernstein Investments, Inc. 1345 Avenue of the Americas New York, NY 10105 Transfer Agent AllianceBernstein Investor Services, Inc. P.O. Box 786003 San Antonio, TX 78278-6003 Toll-Free (800) 221-5672 | | Independent Registered Public Accounting Firm Ernst & Young LLP 5 Times Square New York, NY 10036 Legal Counsel Seward & Kissel LLP One Battery Park Plaza New York, NY 10004 |
| 1 | Member of the Audit Committee, the Governance and Nominating Committee and the Independent Directors Committee. |
| 2 | The day-to-day management of, and investment decisions for, the Fund’s Portfolio are made by Mr. James Tierney. |
| | |
| abfunds.com | | AB CONCENTRATED GROWTH FUND | 39 |
MANAGEMENT OF THE FUND
| | | | | | | | |
NAME,
ADDRESS*, AGE,
(YEAR FIRST ELECTED**) | | PRINCIPAL
OCCUPATION(S)
DURING PAST FIVE YEARS
AND OTHER INFORMATION*** | | PORTFOLIOS
IN FUND
COMPLEX
OVERSEEN BY
DIRECTOR | | | OTHER PUBLIC COMPANY
DIRECTORSHIPS CURRENTLY HELD BY
DIRECTOR |
| INTERESTED DIRECTOR | | | | | | |
Robert M. Keith, # 1345 Avenue of the Americas New York, NY 10105 57 (2014) | | Senior Vice President of AllianceBernstein L.P. (the “Adviser”) and the head of AllianceBernstein Investments, Inc. (“ABI”) since July 2008; Director of ABI and President of the AB Mutual Funds. Previously, he served as Executive Managing Director of ABI from December 2006 to June 2008. Prior to joining ABI in 2006, Executive Managing Director of Bernstein Global Wealth Management, and prior thereto, Senior Managing Director and Global Head of Client Service and Sales of the Adviser’s institutional investment management business since 2004. Prior thereto, he was Managing Director and Head of North American Client Service and Sales in the Adviser’s institutional investment management business, with which he had been associated since prior to 2004. | | | 97 | | | None |
| | | | | | | | |
| DISINTERESTED DIRECTORS | | | | | | |
Marshall C. Turner, Jr., ## Chairman of the Board 75 (2014) | | Private Investor since prior to 2011. Former Chairman and CEO of Dupont Photomasks, Inc. (components of semi-conductor manufacturing). He has extensive operating leadership and venture capital investing experience, including five interim or full-time CEO roles, and prior service as general partner of institutional venture capital partnerships. He also has extensive non-profit board leadership experience, and currently serves on the boards of two education and science-related non-profit organizations. He has served as a director of one AB Fund since 1992, and director or trustee of multiple AB Funds since 2005. He has been Chairman of the AB Funds since January 2014, and the Chairman of the Independent Directors Committees of such AB Funds since February 2014. | | | 97 | | | Xilinx, Inc. (programmable logic semi-conductors) since 2007 |
| | |
| 40 | AB CONCENTRATED GROWTH FUND | | abfunds.com |
MANAGEMENT OF THE FUND (continued)
| | | | | | | | |
NAME,
ADDRESS*, AGE,
(YEAR FIRST ELECTED**) | | PRINCIPAL
OCCUPATION(S)
DURING PAST FIVE YEARS
AND OTHER INFORMATION*** | | PORTFOLIOS
IN FUND
COMPLEX
OVERSEEN BY
DIRECTOR | | | OTHER PUBLIC COMPANY
DIRECTORSHIPS CURRENTLY HELD BY
DIRECTOR |
DISINTERESTED DIRECTORS (continued) | | | | | | |
John H. Dobkin, ## 75 (2014) | | Independent Consultant since prior to 2012. Formerly, President of Save Venice, Inc. (preservation organization) from 2001–2002; Senior Advisor from June 1999-June 2000 and President of Historic Hudson Valley (historic preservation) from December 1989-May 1999. Previously, Director of the National Academy of Design. He has served as a director or trustee of various AB Funds since 1992, and as Chairman of the Audit Committees of a number of such AB Funds from 2001-2008. | | | 96 | | | None |
| | | | | | | | |
Michael J. Downey, ## 73 (2014) | | Private Investor since prior to 2012. Formerly, managing partner of Lexington Capital, LLC (investment advisory firm) from December 1997 until December 2003. He served as a Director of Prospect Acquisition Corp. (financial services) from 2007 until 2009. From 1987 until 1993, Chairman and CEO of Prudential Mutual Fund Management, director of the Prudential mutual funds, and member of the Executive Committee of Prudential Securities Inc. He has served as a director or trustee of the AB Funds since 2005 and is a director and Chairman of one other registered investment company. | | | 97 | | | The Asia Pacific Fund, Inc. (registered investment company) since prior to 2012 |
| | | | | | | | |
| | |
| abfunds.com | | AB CONCENTRATED GROWTH FUND | 41 |
MANAGEMENT OF THE FUND (continued)
| | | | | | | | |
NAME,
ADDRESS*, AGE,
(YEAR FIRST ELECTED**) | | PRINCIPAL
OCCUPATION(S)
DURING PAST FIVE YEARS
AND OTHER INFORMATION*** | | PORTFOLIOS
IN FUND
COMPLEX
OVERSEEN BY
DIRECTOR | | | OTHER PUBLIC COMPANY
DIRECTORSHIPS CURRENTLY HELD BY
DIRECTOR |
DISINTERESTED DIRECTORS (continued) | | | | | | |
William H. Foulk, Jr., ## 84 (2014) | | Investment Adviser and an Independent Consultant since prior to 2012. Previously, he was Senior Manager of Barrett Associates, Inc., a registered investment adviser. He was formerly Deputy Comptroller and Chief Investment Officer of the State of New York and, prior thereto, Chief Investment Officer of the New York Bank for Savings. He has served as a director or trustee of various AB Funds since 1983, and was Chairman of the Independent Directors Committees of the AB Funds from 2003 until early February 2014. He served as Chairman of such AB Funds from 2003 through December 2013. He is also active in a number of mutual fund related organizations and committees. | | | 97 | | | None |
| | | | | | | | |
D. James Guzy, ## 81 (2014) | | Chairman of the Board of SRC Computers, Inc. (semi-conductors), with which he has been associated since prior to 2012. He served as Chairman of the Board of PLX Technology (semi-conductors) since prior to 2011 until November 2013. He was a director of Intel Corporation (semi-conductors) from 1969 until 2008, and served as Chairman of the Finance Committee of such company for several years until May 2008. He has served as a director or trustee of one or more of the AB Funds since 1982. | | | 94 | | | None |
| | | | | | | | |
| | |
| 42 | AB CONCENTRATED GROWTH FUND | | abfunds.com |
MANAGEMENT OF THE FUND (continued)
| | | | | | | | |
NAME,
ADDRESS*, AGE,
(YEAR FIRST ELECTED**) | | PRINCIPAL
OCCUPATION(S)
DURING PAST FIVE YEARS
AND OTHER INFORMATION*** | | PORTFOLIOS
IN FUND
COMPLEX
OVERSEEN BY
DIRECTOR | | | OTHER PUBLIC COMPANY
DIRECTORSHIPS CURRENTLY HELD BY
DIRECTOR |
DISINTERESTED DIRECTORS (continued) | | | | | | |
Nancy P. Jacklin, ## 69 (2014) | | Private Investor since prior to 2012. Professorial Lecturer at the Johns Hopkins School of Advanced International Studies (2008-2015). U.S. Executive Director of the International Monetary Fund (which is responsible for ensuring the stability of the international monetary system), (December 2002-May 2006); Partner, Clifford Chance (1992-2002); Sector Counsel, International Banking and Finance, and Associate General Counsel, Citicorp (1985-1992); Assistant General Counsel (International), Federal Reserve Board of Governors (1982-1985); and Attorney Advisor, U.S. Department of the Treasury (1973-1982). Member of the Bar of the District of Columbia and of New York; and member of the Council on Foreign Relations. She has served as a director or trustee of the AB Funds since 2006 and has been Chairman of the Governance and Nominating Committees of the AB Funds since August 2014. | | | 97 | | | None |
| | | | | | | | |
| | |
| abfunds.com | | AB CONCENTRATED GROWTH FUND | 43 |
MANAGEMENT OF THE FUND (continued)
| | | | | | | | |
NAME,
ADDRESS*, AGE,
(YEAR FIRST ELECTED**) | | PRINCIPAL
OCCUPATION(S)
DURING PAST FIVE YEARS
AND OTHER INFORMATION*** | | PORTFOLIOS
IN FUND
COMPLEX
OVERSEEN BY
DIRECTOR | | | OTHER PUBLIC COMPANY
DIRECTORSHIPS CURRENTLY HELD BY
DIRECTOR |
DISINTERESTED DIRECTORS (continued) | | | | | | |
Carol C. McMullen, ## 62 (2016) | | Managing Director of Slalom Consulting (consulting) since 2014, private investor and member of the Partners Healthcare Investment Committee. Formerly, Director of Norfolk & Dedham Group (mutual property and casualty insurance) from 2011 until November 2016; Director of Partners Community Physicians Organization (healthcare) from 2014 until December 2016; and Managing Director of The Crossland Group (consulting) from 2012 until 2013. She has held a number of senior positions in the asset and wealth management industries, including at Eastern Bank (where her roles included President of Eastern Wealth Management), Thomson Financial (Global Head of Sales for Investment Management), and Putnam Investments (where her roles included Head of Global Investment Research). She has served on a number of private company and nonprofit boards, and as a director or trustee of the AB Funds since June 2016. | | | 97 | | | None |
| | | | | | | | |
| | |
| 44 | AB CONCENTRATED GROWTH FUND | | abfunds.com |
MANAGEMENT OF THE FUND (continued)
| | | | | | | | |
NAME,
ADDRESS*, AGE,
(YEAR FIRST ELECTED**) | | PRINCIPAL
OCCUPATION(S)
DURING PAST FIVE YEARS
AND OTHER INFORMATION*** | | PORTFOLIOS
IN FUND
COMPLEX
OVERSEEN BY
DIRECTOR | | | OTHER PUBLIC COMPANY
DIRECTORSHIPS CURRENTLY HELD BY
DIRECTOR |
DISINTERESTED DIRECTORS (continued) | | | | | | |
Garry L. Moody, ## 65 (2014) | | Independent Consultant. Formerly, Partner, Deloitte & Touche LLP (1995-2008) where he held a number of senior positions, including Vice Chairman, and U.S. and Global Investment Management Practice Managing Partner; President, Fidelity Accounting and Custody Services Company (1993-1995), where he was responsible for the accounting, pricing, custody and reporting for the Fidelity mutual funds; and Partner, Ernst & Young LLP (1975-1993), where he served as the National Director of Mutual Fund Tax Services and Managing Partner of its Chicago Office Tax department. He is a member of the Trustee Advisory Board of BoardIQ, a biweekly publication focused on issues and news affecting directors of mutual funds. He has served as a director or trustee, and as Chairman of the Audit Committees of the AB Funds since 2008. | | | 97 | | | None |
| | | | | | | | |
| | |
| abfunds.com | | AB CONCENTRATED GROWTH FUND | 45 |
MANAGEMENT OF THE FUND (continued)
| | | | | | | | |
NAME,
ADDRESS*, AGE,
(YEAR FIRST ELECTED**) | | PRINCIPAL
OCCUPATION(S)
DURING PAST FIVE YEARS
AND OTHER INFORMATION*** | | PORTFOLIOS
IN FUND
COMPLEX
OVERSEEN BY
DIRECTOR | | | OTHER PUBLIC COMPANY
DIRECTORSHIPS CURRENTLY HELD BY
DIRECTOR |
DISINTERESTED DIRECTORS (continued) | | | | | | |
Earl D. Weiner, ## 78 (2014) | | Of Counsel, and Partner prior to January 2007, of the law firm Sullivan & Cromwell LLP and is a former member of the ABA Federal Regulation of Securities Committee Task Force to draft editions of the Fund Director’s Guidebook. He also serves as a director or trustee of various non-profit organizations and has served as Chairman or Vice Chairman of a number of them. He has served as a director or trustee of the AB Funds since 2007 and served as Chairman of the Governance and Nominating Committees of the AB Funds from 2007 until August 2014. | | | 97 | | | None |
| * | The address for each of the Fund’s disinterested Directors is c/o AllianceBernstein L.P., Attention: Philip L. Kirstein, 1345 Avenue of the Americas, New York, NY 10105. |
| ** | There is no stated term of office for the Fund’s Directors. |
| *** | The information above includes each Director’s principal occupation during the last five years and other information relating to the experience, attributes and skills relevant to each Director’s qualifications to serve as a Director, which led to the conclusion that each Director should serve as a Director for the Fund. |
| # | Mr. Keith is an “interested person” of the Fund, as defined in the 1940 Act, due to his position as a Senior Vice President of the Adviser. |
| ## | Member of the Audit Committee, the Governance and Nominating Committee and the Independent Directors Committee. |
| | |
| 46 | AB CONCENTRATED GROWTH FUND | | abfunds.com |
MANAGEMENT OF THE FUND (continued)
Officer Information
Certain information concerning the Fund’s Officers is listed below.
| | | | |
NAME, ADDRESS*
AND AGE | | POSITION(S)
HELD WITH FUND | | PRINCIPAL OCCUPATION
DURING PAST 5 YEARS |
Robert M. Keith 57 | | President and Chief Executive Officer | | See biography above. |
| | | | |
Philip L. Kirstein 72 | | Senior Vice President and Independent Compliance Officer | | Senior Vice President and Independent Compliance Officer of the AB Funds, with which he has been associated since October 2004. Prior thereto, he was Of Counsel to Kirkpatrick & Lockhart, LLP from October 2003 to October 2004, and General Counsel of Merrill Lynch Investment Managers, L.P. since prior to March 2003. |
| | | | |
James Tierney, 50 | | Vice President | | Senior Vice President of the Adviser and Chief Investment Officer of Concentrated US Growth since December 2013. Prior thereto, he was Chief Investment Officer of W.P. Stewart and Co. Ltd. (“WPS”) (2010-2013) and Portfolio Manager/Analyst and Senior Vice President of WPS since prior to 2012. |
| | | | |
Emilie D. Wrapp, 61 | | Secretary | | Senior Vice President, Assistant General Counsel and Assistant Secretary of ABI,** with which she has been associated since prior to 2012. |
| | | | |
Joseph J. Mantineo, 58 | | Treasurer and Chief Financial Officer | | Senior Vice President of ABIS,** with which he has been associated since prior to 2012. |
| | | | |
Vincent S. Noto 52 | | Chief Compliance Officer | | Senior Vice President since 2015 and Mutual Fund Chief Compliance Officer of the Adviser** since 2014. Prior thereto, he was Vice President and Director of Mutual Fund Compliance of the Adviser** since prior to 2012. |
| | | | |
Phyllis J. Clarke, 56 | | Controller | | Vice President of ABIS,** with which she has been associated since prior to 2012. |
| * | The address for each of the Fund’s Officers is 1345 Avenue of the Americas, New York, NY 10105. |
| ** | The Adviser, ABI and ABIS are affiliates of the Fund. |
| | The Fund’s Statement of Additional Information (“SAI”) has additional information about the Fund’s Directors and Officers and is available without charge upon request. Contact your financial representative or AB at 1-800-227-4618, or visit www.abfunds.com, for a free prospectus or SAI. |
| | |
| abfunds.com | | AB CONCENTRATED GROWTH FUND | 47 |
Information Regarding the Review and Approval of the Fund’s Advisory Agreement
The disinterested directors (the “directors”) of AB Cap Fund, Inc. (the “Company”) unanimously approved the continuance of the Company’s Advisory Agreement with the Adviser in respect of AB Concentrated Growth Fund (the “Fund”) at a meeting held on May 2-4, 2017 (the “Meeting”).
Prior to approval of the continuance of the Advisory Agreement, the directors had requested from the Adviser, and received and evaluated, extensive materials. They reviewed the proposed continuance of the Advisory Agreement with the Adviser and with experienced counsel who are independent of the Adviser, who advised on the relevant legal standards. The directors also reviewed an independent evaluation prepared by the Company’s Senior Officer (who is also the Company’s Independent Compliance Officer), who acted as their independent fee consultant, of the reasonableness of the advisory fee, in which the Senior Officer concluded that the contractual fee for the Fund was reasonable. The directors also discussed the proposed continuance in private sessions with counsel and the Company’s Senior Officer.
The directors considered their knowledge of the nature and quality of the services provided by the Adviser to the Fund gained from their experience as directors or trustees of most of the registered investment companies advised by the Adviser, their overall confidence in the Adviser’s integrity and competence they have gained from that experience, the Adviser’s initiative in identifying and raising potential issues with the directors and its responsiveness, frankness and attention to concerns raised by the directors in the past, including the Adviser’s willingness to consider and implement organizational and operational changes designed to improve investment results and the services provided to the AB Funds. The directors noted that they have four regular meetings each year, at each of which they review extensive materials and information from the Adviser, including information on the investment performance of the Fund.
The directors also considered all factors they believed relevant, including the specific matters discussed below. During the course of their deliberations, the directors evaluated, among other things, the reasonableness of the advisory fee. The directors did not identify any particular information that was all-important or controlling, and different directors may have attributed different weights to the various factors. The directors determined that the selection of the Adviser to manage the Fund and the overall arrangements between the Fund and the Adviser, as provided in the Advisory Agreement, including the advisory fee, were fair and reasonable in light of the services performed, expenses incurred and such other matters as the directors considered relevant in the exercise of
| | |
| 48 | AB CONCENTRATED GROWTH FUND | | abfunds.com |
their business judgment. The material factors and conclusions that formed the basis for the directors’ determinations included the following:
Nature, Extent and Quality of Services Provided
The directors considered the scope and quality of services provided by the Adviser under the Advisory Agreement, including the quality of the investment research capabilities of the Adviser and the other resources it has dedicated to performing services for the Fund. They also noted the professional experience and qualifications of the Fund’s portfolio management team and other senior personnel of the Adviser. The directors also considered that the Advisory Agreement provides that the Fund will reimburse the Adviser for the cost to it of providing certain clerical, accounting, administrative and other services to the Fund by employees of the Adviser or its affiliates. Requests for these reimbursements are made on a quarterly basis and subject to approval by the directors. Reimbursements, to the extent requested and paid, result in a higher rate of total compensation from the Fund to the Adviser than the fee rate stated in the Advisory Agreement. The directors noted that the methodology used to determine the reimbursement amounts had been reviewed by an independent consultant retained by the Company’s Senior Officer. The quality of administrative and other services, including the Adviser’s role in coordinating the activities of the Fund’s other service providers, also was considered. The directors concluded that, overall, they were satisfied with the nature, extent and quality of services provided to the Fund under the Advisory Agreement.
Costs of Services Provided and Profitability
The directors reviewed a schedule of the revenues and expenses and related notes indicating the profitability of the Fund to the Adviser for calendar years 2015 and 2016 that had been prepared with an expense allocation methodology arrived at in consultation with an independent consultant retained by the Company’s Senior Officer. The directors noted the assumptions and methods of allocation used by the Adviser in preparing fund-specific profitability data and understood that there are a number of potentially acceptable allocation methodologies for information of this type. The directors noted that the profitability information reflected all revenues and expenses of the Adviser’s relationship with the Fund, including those relating to its subsidiaries that provide transfer agency, distribution and brokerage services to the Fund. The directors recognized that it is difficult to make comparisons of the profitability of the Advisory Agreement with the profitability of advisory contracts for unaffiliated funds because comparative information is not generally publicly available and is affected by numerous factors. The directors focused on the profitability of the Adviser’s relationship with the Fund before taxes and distribution expenses. The directors concluded that the Adviser’s level of profitability from its relationship with the Fund was not unreasonable.
| | |
| abfunds.com | | AB CONCENTRATED GROWTH FUND | 49 |
Fall-Out Benefits
The directors considered the other benefits to the Adviser and its affiliates from their relationships with the Fund, including, but not limited to, benefits relating to soft dollar arrangements (whereby investment advisers receive brokerage and research services from brokers that execute agency transactions for their clients); 12b-1 fees and sales charges received by the Fund’s principal underwriter (which is a wholly owned subsidiary of the Adviser) in respect of certain classes of the Fund’s shares; brokerage commissions paid by the Fund to brokers affiliated with the Adviser; and transfer agency fees paid by the Fund to a wholly owned subsidiary of the Adviser. The directors recognized that the Adviser’s profitability would be somewhat lower without these benefits. The directors understood that the Adviser also might derive reputational and other benefits from its association with the Fund.
Investment Results
In addition to the information reviewed by the directors in connection with the Meeting, the directors receive detailed performance information for the Fund at each regular Board meeting during the year.
At the Meeting, the directors reviewed information prepared by an analytical service that is not affiliated with the Adviser (the “15(c) service provider”), showing the performance of the Class A Shares of the Fund against a peer group and a peer universe, and information prepared by the Adviser showing performance of the Class A Shares against a broad-based securities market index, in each case for the 1- and 3-year periods ended February 28, 2017 and (in the case of comparisons with the broad-based securities market index) for the period from inception. Based on their review, the directors concluded that the Fund’s investment performance was acceptable.
Advisory Fees and Other Expenses
The directors considered the advisory fee rate paid by the Fund to the Adviser and information prepared by the 15(c) service provider concerning advisory fee rates paid by other funds in the same category as the Fund at a common asset level. The directors recognized that it is difficult to make comparisons of advisory fees because there are variations in the services that are included in the fees paid by other funds. The directors compared the Fund’s contractual advisory fee rate with a peer group median and took into account the impact on the advisory fee rate of the administrative expense reimbursement paid to the Adviser in the latest fiscal year.
The directors also considered the Adviser’s fee schedule for institutional clients pursuing a similar investment style. For this purpose, they reviewed the relevant advisory fee information from the Adviser’s Form ADV and the evaluation from the Company’s Senior Officer and noted the differences between the Fund’s fee schedule, on the one hand, and the institutional
| | |
| 50 | AB CONCENTRATED GROWTH FUND | | abfunds.com |
fee schedule and the schedule of fees charged to any offshore funds and any sub-advised funds, on the other. The directors noted that the Adviser may, in some cases, agree to fee rates with large institutional clients that are lower than those reviewed by the directors and that they had previously discussed with the Adviser its policies in respect of such arrangements.
The Adviser reviewed with the directors the significantly greater scope of the services it provides to the Fund relative to institutional, offshore fund and sub-advised fund clients. In light of the substantial differences in services rendered by the Adviser to institutional, offshore fund and sub-advised fund clients as compared to funds such as the Fund, the directors considered these fee comparisons inapt and did not place significant weight on them in their deliberations.
The directors noted that the Fund may invest in shares of exchange-traded funds (“ETFs”), subject to the restrictions and limitations of the Investment Company Act of 1940 as these may be varied as a result of exemptive orders issued by the SEC. The directors also noted that ETFs pay advisory fees pursuant to their advisory contracts. The directors concluded, based on the Adviser’s explanation of how it may use ETFs when they are the most cost-effective way to obtain desired exposures for a fund or to temporarily “equitize” cash inflows pending purchases of underlying securities, that the advisory fee for the Fund would be paid for services that would be in addition to, rather than duplicative of, the services provided under the advisory contracts of the ETFs.
The directors also considered the total expense ratio of the Class A shares of the Fund in comparison to a peer group and a peer universe selected by the 15(c) service provider. The Class A expense ratio of the Fund was based on the Fund’s latest fiscal year and the directors considered the effects of any fee waivers and/or expense reimbursements as a result of the Adviser’s expense cap. The directors noted that it was likely that the expense ratios of some of the other funds in the Fund’s category were lowered by waivers or reimbursements by those funds’ investment advisers, which in some cases might be voluntary or temporary. The directors view expense ratio information as relevant to their evaluation of the Adviser’s services because the Adviser is responsible for coordinating services provided to the Fund by others. The directors noted that the Fund’s expense ratio was above the medians. After reviewing and discussing the Adviser’s explanations of the reasons for this, the directors concluded that the Fund’s expense ratio was acceptable.
Economies of Scale
The directors noted that the advisory fee schedule for the Fund does not contain breakpoints and that they had discussed their strong preference for breakpoints in advisory contracts with the Adviser. The directors took into consideration prior presentations by an independent consultant on
| | |
| abfunds.com | | AB CONCENTRATED GROWTH FUND | 51 |
economies of scale in the mutual fund industry and for the AB Funds, and by the Adviser concerning certain of its views on economies of scale. The directors also had requested and received from the Adviser certain updates on economies of scale in advance of the Meeting. The directors believe that economies of scale may be realized (if at all) by the Adviser across a variety of products and services, and not only in respect of a single fund. The directors noted that there is no established methodology for setting breakpoints that give effect to the fund-specific services provided by a fund’s adviser and to the economies of scale that an adviser may realize in its overall mutual fund business or those components of it which directly or indirectly affect a fund’s operations. The directors observed that in the mutual fund industry as a whole, as well as among funds similar to the Fund, there is no uniformity or pattern in the fees and asset levels at which breakpoints (if any) apply. The directors also noted that the advisory agreements for many funds do not have breakpoints at all. The directors informed the Adviser that they would monitor the Fund’s assets (which were well below the level at which they would anticipate adding an initial breakpoint) and its profitability to the Adviser and anticipated revisiting the question of breakpoints in the future if circumstances warranted doing so.
| | |
| 52 | AB CONCENTRATED GROWTH FUND | | abfunds.com |
This page is not part of the Shareholder Report or the Financial Statements.
AB FAMILY OF FUNDS
US EQUITY
US CORE
Core Opportunities Fund
Select US Equity Portfolio
US GROWTH
Concentrated Growth Fund
Discovery Growth Fund
Growth Fund
Large Cap Growth Fund
Small Cap Growth Portfolio
US VALUE
Discovery Value Fund
Equity Income Fund
Relative Value Fund1
Small Cap Value Portfolio
Value Fund
INTERNATIONAL/ GLOBAL EQUITY
INTERNATIONAL/ GLOBAL CORE
Global Core Equity Portfolio
International Portfolio
International Strategic Core Portfolio
Sustainable Global Thematic Fund1
Tax-Managed International Portfolio
Tax-Managed Wealth Appreciation Strategy
Wealth Appreciation Strategy
INTERNATIONAL/ GLOBAL GROWTH
Concentrated International Growth Portfolio
International Growth Fund
INTERNATIONAL/ GLOBAL EQUITY (continued)
INTERNATIONAL/ GLOBAL VALUE
Asia ex-Japan Equity Portfolio
International Value Fund
FIXED INCOME
MUNICIPAL
High Income Municipal Portfolio
Intermediate California Municipal Portfolio
Intermediate Diversified Municipal Portfolio
Intermediate New York Municipal Portfolio
Municipal Bond Inflation Strategy
Tax-Aware Fixed Income Portfolio
National Portfolio
Arizona Portfolio
California Portfolio
Massachusetts Portfolio
Minnesota Portfolio
New Jersey Portfolio
New York Portfolio
Ohio Portfolio
Pennsylvania Portfolio
Virginia Portfolio
TAXABLE
Bond Inflation Strategy
Global Bond Fund
High Income Fund
High Yield Portfolio
Income Fund
Intermediate Bond Portfolio
Limited Duration High Income Portfolio
Short Duration Portfolio
ALTERNATIVES
All Market Real Return Portfolio
Credit Long/Short Portfolio
Global Real Estate Investment Fund
Select US Long/Short Portfolio
Unconstrained Bond Fund
MULTI-ASSET
All Market Income Portfolio
All Market Total Return Portfolio1
Conservative Wealth Strategy
Emerging Markets Multi-Asset Portfolio
Global Risk Allocation Fund
Tax-Managed All Market Income Portfolio1
TARGET-DATE
Multi-Manager Select Retirement Allocation Fund
Multi-Manager Select 2010 Fund
Multi-Manager Select 2015 Fund
Multi-Manager Select 2020 Fund
Multi-Manager Select 2025 Fund
Multi-Manager Select 2030 Fund
Multi-Manager Select 2035 Fund
Multi-Manager Select 2040 Fund
Multi-Manager Select 2045 Fund
Multi-Manager Select 2050 Fund
Multi-Manager Select 2055 Fund
CLOSED-END FUNDS
Alliance California Municipal Income Fund
AllianceBernstein Global High Income Fund
AllianceBernstein National Municipal Income Fund
We also offer Government Exchange Reserves, which serves as the money market fund exchange vehicle for the AB mutual funds. An investment in Government Exchange Reserves is not a deposit in a bank and is not insured or guaranteed by the Federal Deposit Insurance Corporation or any other government agency. Although the Fund seeks to preserve the value of your investment at $1.00 per share, it is possible to lose money by investing in the Fund.
Investors should consider the investment objectives, risks, charges and expenses of the Fund carefully before investing. For copies of our prospectus or summary prospectus, which contain this and other information, visit us online at www.abfunds.com or contact your AB representative. Please read the prospectus and/or summary prospectus carefully before investing.
| 1 | Prior to November 1, 2016, Sustainable Global Thematic Fund was named Global Thematic Growth Fund; prior to January 9, 2017, Relative Value Fund was named Growth & Income Fund; prior to April 17, 2017, Tax-Managed All Market Income Portfolio was named Tax-Managed Balanced Wealth Strategy; prior to April 24, 2017, All Market Total Return Portfolio was named Balanced Wealth Strategy. |
| | |
| abfunds.com | | AB CONCENTRATED GROWTH FUND | 53 |
NOTES
| | |
| 54 | AB CONCENTRATED GROWTH FUND | | abfunds.com |
NOTES
| | |
| abfunds.com | | AB CONCENTRATED GROWTH FUND | 55 |
NOTES
| | |
| 56 | AB CONCENTRATED GROWTH FUND | | abfunds.com |
NOTES
| | |
| abfunds.com | | AB CONCENTRATED GROWTH FUND | 57 |
NOTES
| | |
| 58 | AB CONCENTRATED GROWTH FUND | | abfunds.com |
NOTES
| | |
| abfunds.com | | AB CONCENTRATED GROWTH FUND | 59 |
NOTES
| | |
| 60 | AB CONCENTRATED GROWTH FUND | | abfunds.com |

AB CONCENTRATED GROWTH FUND
1345 Avenue of the Americas
New York, NY 10105
800 221 5672
CG-0151-0617 
JUN 06.30.17
ANNUAL REPORT
AB CONCENTRATED
INTERNATIONAL GROWTH
PORTFOLIO


| | |
| |
| Investment Products Offered | | ��� Are Not FDIC Insured • May Lose Value • Are Not Bank Guaranteed |
Investors should consider the investment objectives, risks, charges and expenses of the Fund carefully before investing. For copies of our prospectus or summary prospectus, which contain this and other information, visit us online at www.abfunds.com or contact your AB representative. Please read the prospectus and/or summary prospectus carefully before investing.
This shareholder report must be preceded or accompanied by the Fund’s prospectus for individuals who are not current shareholders of the Fund.
You may obtain a description of the Fund’s proxy voting policies and procedures, and information regarding how the Fund voted proxies relating to portfolio securities during the most recent 12-month period ended June 30, without charge. Simply visit AB’s website at www.abfunds.com, or go to the Securities and Exchange Commission’s (the “Commission”) website at www.sec.gov, or call AB at (800) 227 4618.
The Fund files its complete schedule of portfolio holdings with the Commission for the first and third quarters of each fiscal year on Form N-Q. The Fund’s Forms N-Q are available on the Commission’s website at www.sec.gov. The Fund’s Forms N-Q may also be reviewed and copied at the Commission’s Public Reference Room in Washington, DC; information on the operation of the Public Reference Room may be obtained by calling (800) SEC 0330. AB publishes full portfolio holdings for the Fund monthly at www.abfunds.com.
AllianceBernstein Investments, Inc. (ABI) is the distributor of the AB family of mutual funds. ABI is a member of FINRA and is an affiliate of AllianceBernstein L.P., the Adviser of the funds.
The [A/B] logo is a registered service mark of AllianceBernstein and AllianceBernstein® is a registered service mark used by permission of the owner, AllianceBernstein L.P.
| | |
| FROM THE PRESIDENT | |  |
Dear Shareholder,
We are pleased to provide this report for AB Concentrated International Growth Portfolio (the “Fund”). Please review the discussion of Fund performance, the market conditions during the reporting period and the Fund’s investment strategy.
As always, AB strives to keep clients ahead of what’s next by:
| + | | Transforming uncommon insights into uncommon knowledge with a global research scope |
| + | | Navigating markets with seasoned investment experience and sophisticated solutions |
| + | | Providing thoughtful investment insights and actionable ideas |
Whether you’re an individual investor or a multi-billion-dollar institution, we put knowledge and experience to work for you.
AB’s global research organization connects and collaborates across platforms and teams to deliver impactful insights and innovative products. Better insights lead to better opportunities—anywhere in the world.
For additional information about AB’s range of products and shareholder resources, please log on to www.abfunds.com.
Thank you for your investment in the AB Mutual Funds.
Sincerely,

Robert M. Keith
President and Chief Executive Officer, AB Mutual Funds
| | |
| abfunds.com | | AB CONCENTRATED INTERNATIONAL GROWTH PORTFOLIO | 1 |
ANNUAL REPORT
August 11, 2017
This report provides management’s discussion of fund performance for AB Concentrated International Growth Portfolio for the annual reporting period ended June 30, 2017.
The Fund’s investment objective is to seek long-term growth of capital.
NAV RETURNS AS OF JUNE 30, 2017 (unaudited)
| | | | | | | | |
| | | 6 Months | | | 12 Months | |
| AB CONCENTRATED INTERNATIONAL GROWTH PORTFOLIO | | | | | | | | |
| Class A Shares | | | 21.95% | | | | 24.83% | |
| Class C Shares | | | 21.52% | | | | 23.84% | |
| Advisor Class Shares1 | | | 22.07% | | | | 25.12% | |
| MSCI EAFE Index (net) | | | 13.81% | | | | 20.27% | |
| 1 | Please note that this share class is for investors purchasing shares through accounts established under certain fee-based programs sponsored and maintained by certain broker-dealers and financial intermediaries, institutional pension plans and/or investment advisory clients of, and certain other persons associated with, the Adviser and its affiliates or the Fund. |
Please keep in mind that high, double-digit returns are highly unusual and cannot be sustained. Investors should also be aware that these returns were primarily achieved during favorable market conditions.
INVESTMENT RESULTS
The table above shows the Fund’s performance compared to its benchmark, the Morgan Stanley Capital International Europe, Australasia, Far East (“MSCI EAFE”) Index (net), for the six- and 12-month periods ended June 30, 2017.
All share classes of the Fund outperformed the benchmark for both periods, before sales charges. For both periods, sector selection, security selection and currency selection contributed, relative to the benchmark. During the 12-month period, an overweight in the technology sector and underweight to the energy sector contributed to returns, while an underweight in financials detracted. Security selection in the consumer staples sector was positive, but detracted within telecommunications. Top absolute contributors to performance included Alibaba Group, ARM Holdings and Tencent. Top absolute detractors included BT Group, Park24 and Novo Nordisk.
For the six-month period, an overweight to the technology sector contributed, while an underweight to financials detracted. Security selection within the consumer discretionary sector added to returns, yet detracted
| | |
| 2 | AB CONCENTRATED INTERNATIONAL GROWTH PORTFOLIO | | abfunds.com |
within telecommunications. Top absolute contributors to performance included Alibaba Group, Tencent and HDFC Bank. Top absolute detractors included BT Group, IHH Healthcare and Recruit Holdings.
The Fund utilized derivatives in the form of forwards for hedging purposes, which added for the six-month period and detracted for the 12-month period, in absolute terms.
MARKET REVIEW AND INVESTMENT STRATEGY
During the 12-month period, international markets showed positive performance. The best performing sectors included technology and consumer staples. The technology sector showed solid earnings momentum, and investor interest remained high as US “FAANG” stocks (the five most popular and best performing technology stocks in the market, namely Facebook, Apple, Amazon, Netflix and Alphabet’s Google) showed strong returns. The consumer staples sector was driven by continued discipline—mainly in European names—to target operating efficiencies, which in some cases were pushed by shareholders. The worst performing sectors included materials and energy. In this environment, the Fund’s Senior Investment Management Team remained focused on sustainably growing the underlying earnings power of the Fund.
INVESTMENT POLICIES
The Adviser seeks to achieve the Fund’s investment objective by investing, under normal circumstances, primarily in common stocks of non-US companies, and in companies in at least three countries other than the United States.
The Fund will invest in companies that are determined by the Adviser to offer favorable long-term growth potential and that are trading at attractive valuations. The Adviser will employ an appraisal method which attempts to measure each prospective company’s quality and growth rate by numerous factors. Such factors will include: a company’s record and projections of profit and earnings growth, accuracy and availability of information with respect to the company, success and experience of management, accessibility of management to the Adviser, product lines and competitive position both in the United States and abroad, lack of cyclicality, large market capitalization and liquidity of the company’s securities. The Adviser will compare these results to the characteristics of the general stock markets to determine the relative attractiveness of each company at a given time. The Adviser will weigh economic, political and market factors in making investment decisions; this appraisal technique attempts to measure each investment candidate not only against other stocks of the same industry and region, but also against a broad spectrum of investments.
(continued on next page)
| | |
| abfunds.com | | AB CONCENTRATED INTERNATIONAL GROWTH PORTFOLIO | 3 |
The Fund will invest in a relatively small number of individual stocks, generally 25 to 35 companies. In addition, the Fund is a non-diversified Fund as that term is defined in the Investment Company Act of 1940, which means that it may invest more of its assets in a smaller number of companies than a diversified fund. The Fund will primarily invest in mid- and large-capitalization companies, which are currently defined for the Fund as companies that have market capitalizations of $2.0 billion or more. The Fund’s holdings of non-US companies may include some companies located in emerging markets, and at times emerging-market companies may make up a significant portion of the Fund.
Fluctuations in currency exchange rates can have a dramatic impact on the returns of equity securities. While the Adviser may hedge the foreign currency exposure resulting from the Fund’s security positions through the use of currency-related derivatives, it is not required to do so.
| | |
| 4 | AB CONCENTRATED INTERNATIONAL GROWTH PORTFOLIO | | abfunds.com |
DISCLOSURES AND RISKS
Benchmark Disclosure
The MSCI EAFE Index is unmanaged and does not reflect fees and expenses associated with the active management of a mutual fund portfolio. The MSCI EAFE Index (net, free float-adjusted, market-capitalization weighted) represents the equity market performance of developed markets, excluding the US and Canada. MSCI makes no express or implied warranties or representations, and shall have no liability whatsoever with respect to any MSCI data contained herein. The MSCI data may not be further redistributed or used as a basis for other indices, any securities or financial products. This report is not approved, reviewed or produced by MSCI. Net returns include the reinvestment of dividends after deduction of non-US withholding tax. An investor cannot invest directly in an index, and its results are not indicative of the performance for any specific investment, including the Fund.
A Word About Risk
Market Risk: The value of the Fund’s assets will fluctuate as the stock or bond market fluctuates. The value of its investments may decline, sometimes rapidly and unpredictably, simply because of economic changes or other events that affect large portions of the market. It includes the risk that a particular style of investing, such as the Fund’s growth approach, may underperform the market generally.
Foreign (Non-US) Risk: Investments in securities of non-US issuers may involve more risk than those of US issuers. These securities may fluctuate more widely in price and may be less liquid due to adverse market, economic, political, regulatory or other factors.
Emerging Market Risk: Investments in emerging-market countries may have more risk because the markets are less developed and less liquid, and because these investments may be subject to increased economic, political, regulatory or other uncertainties.
Currency Risk: Fluctuations in currency exchange rates may negatively affect the value of the Fund’s investments or reduce its returns.
Focused Portfolio/Non-Diversification Risk: The Fund may have more risk because it is “non-diversified”, meaning that it can invest more of its assets in a smaller number of issuers. Accordingly, changes in the value of a single security may have a more significant effect, either negative or positive, on the Fund’s net asset value (“NAV”).
Sector Risk: The Fund may have more risk because of concentrated investments in a particular market sector, such as the technology or financial services sector. Market or economic factors affecting that sector could have a major effect on the value of the Fund’s investments.
| | |
| abfunds.com | | AB CONCENTRATED INTERNATIONAL GROWTH PORTFOLIO | 5 |
DISCLOSURES AND RISKS (continued)
Capitalization Risk: Investments in mid-capitalization companies may be more volatile than investments in large-capitalization companies. Investments in mid-capitalization companies may have additional risks because these companies have limited product lines, markets or financial resources.
Management Risk: The Fund is subject to management risk because it is an actively managed investment fund. The Adviser will apply its investment techniques and risk analyses in making investment decisions for the Fund, but there is no guarantee that its techniques will produce the intended results.
These risks are fully discussed in the Fund’s prospectus. As with all investments, you may lose money by investing in the Fund.
An Important Note About Historical Performance
The investment return and principal value of an investment in the Fund will fluctuate, so that shares, when redeemed, may be worth more or less than their original cost. Performance shown in this report represents past performance and does not guarantee future results. Current performance may be lower or higher than the performance information shown. You may obtain performance information current to the most recent month-end by visiting www.abfunds.com.
All fees and expenses related to the operation of the Fund have been deducted. NAV returns do not reflect sales charges; if sales charges were reflected, the Fund’s quoted performance would be lower. SEC returns reflect the applicable sales charges for each share class: a 4.25% maximum front-end sales charge for Class A shares and a 1% 1-year contingent deferred sales charge for Class C shares. Returns for the different share classes will vary due to different expenses associated with each class. Performance assumes reinvestment of distributions and does not account for taxes.
Please note: References to specific securities are presented to illustrate the Fund’s investment philosophy and are not to be considered advice or recommendations. This information reflects prevailing market conditions and the Adviser’s judgments as of the date indicated, which are subject to change. In preparing this report, the Adviser has relied upon and assumed without independent verification, the accuracy and completeness of all information available from third-party sources. It should not be assumed that any investments made in the future will be profitable or will equal the performance of the selected investments referenced herein.
| | |
| 6 | AB CONCENTRATED INTERNATIONAL GROWTH PORTFOLIO | | abfunds.com |
HISTORICAL PERFORMANCE
GROWTH OF A $10,000 INVESTMENT IN THE FUND (unaudited)
4/15/20151 TO 6/30/2017
This chart illustrates the total value of an assumed $10,000 investment in AB Concentrated International Growth Portfolio Class A shares (from 4/15/20151 to 6/30/2017) as compared to the performance of the Fund’s benchmark. The chart reflects the deduction of the maximum 4.25% sales charge from the initial $10,000 investment in the Fund and assumes the reinvestment of dividends and capital gains distributions.
| 1 | Inception date: 4/15/2015. |
| | |
| abfunds.com | | AB CONCENTRATED INTERNATIONAL GROWTH PORTFOLIO | 7 |
HISTORICAL PERFORMANCE (continued)
AVERAGE ANNUAL RETURNS AS OF JUNE 30, 2017 (unaudited)
| | | | | | | | |
| | | NAV Returns | | | SEC Returns (reflects applicable
sales charges) | |
| CLASS A SHARES | | | | | | | | |
| 1 Year | | | 24.83% | | | | 19.47% | |
| Since Inception1 | | | 2.51% | | | | 0.53% | |
| CLASS C SHARES | | | | | | | | |
| 1 Year | | | 23.84% | | | | 22.84% | |
| Since Inception1 | | | 1.76% | | | | 1.76% | |
| ADVISOR CLASS SHARES2 | | | | | | | | |
| 1 Year | | | 25.12% | | | | 25.12% | |
| Since Inception1 | | | 2.76% | | | | 2.76% | |
The Fund’s prospectus fee table shows the Fund’s total annual operating expense ratios as 20.02%, 20.81% and 19.76% for Class A, Class C and Advisor Class shares, respectively, gross of any fee waivers or expense reimbursements. Contractual fee waivers and/or expense reimbursements limit the Fund’s annual operating expense ratios exclusive of acquired fund fees and expenses other than the advisory fees of any AB mutual funds in which the Fund may invest, interest expense, taxes, extraordinary expenses, and brokerage commissions and other transaction costs to 1.30%, 2.05% and 1.05% for Class A, Class C and Advisor Class shares, respectively. These waivers/reimbursements may not be terminated before February 12, 2018. Any fees waived and expenses borne by the Adviser may be reimbursed by the Fund until the end of the third fiscal year after the fiscal period in which the fee was waived or the expense was borne, provided that no reimbursement payment will be made that would cause the Fund’s total annual operating expenses to exceed the expense limitations. Absent reimbursements or waivers, performance would have been lower. The Financial Highlights section of this report sets forth expense ratio data for the current reporting period; the expense ratios shown above may differ from the expense ratios in the Financial Highlights section since they are based on different time periods.
| 1 | Inception date: 4/15/2015. |
| 2 | This share class is offered at NAV to eligible investors and the SEC returns are the same as the NAV returns. Please note that this share class is for investors purchasing shares through accounts established under certain fee-based programs sponsored and maintained by certain broker-dealers and financial intermediaries, institutional pension plans and/or investment advisory clients of, and certain other persons associated with, the Adviser and its affiliates or the Fund. |
| | |
| 8 | AB CONCENTRATED INTERNATIONAL GROWTH PORTFOLIO | | abfunds.com |
HISTORICAL PERFORMANCE (continued)
SEC AVERAGE ANNUAL RETURNS
AS OF THE MOST RECENT CALENDAR QUARTER-END
JUNE 30, 2017 (unaudited)
| | | | |
| | | SEC Returns (reflects applicable
sales charges) | |
| CLASS A SHARES | | | | |
| 1 Year | | | 19.47% | |
| Since Inception1 | | | 0.53% | |
| CLASS C SHARES | | | | |
| 1 Year | | | 22.84% | |
| Since Inception1 | | | 1.76% | |
| ADVISOR CLASS SHARES2 | | | | |
| 1 Year | | | 25.12% | |
| Since Inception1 | | | 2.76% | |
| 1 | Inception date: 4/15/2015. |
| 2 | Please note that this share class is for investors purchasing shares through accounts established under certain fee-based programs sponsored and maintained by certain broker-dealers and financial intermediaries, institutional pension plans and/or investment advisory clients of, and certain other persons associated with, the Adviser and its affiliates or the Fund. |
| | |
| abfunds.com | | AB CONCENTRATED INTERNATIONAL GROWTH PORTFOLIO | 9 |
EXPENSE EXAMPLE
(unaudited)
As a shareholder of the Fund, you incur two types of costs: (1) transaction costs, including sales charges (loads) on purchase payments, contingent deferred sales charges on redemptions and (2) ongoing costs, including management fees; distribution (12b-1) fees; and other Fund expenses. This example is intended to help you understand your ongoing costs (in dollars) of investing in the Fund and to compare these costs with the ongoing costs of investing in other mutual funds.
This Example is based on an investment of $1,000 invested at the beginning of the period and held for the entire period as indicated below.
Actual Expenses
The table below provides information about actual account values and actual expenses. You may use the information, together with the amount you invested, to estimate the expenses that you paid over the period. Simply divide your account value by $1,000 (for example, an $8,600 account value divided by $1,000 = 8.6), then multiply the result by the number under the heading entitled “Expenses Paid During Period” to estimate the expenses you paid on your account during this period.
Hypothetical Example for Comparison Purposes
The table below also provides information about hypothetical account values and hypothetical expenses based on the Fund’s actual expense ratio and an assumed annual rate of return of 5% before expenses, which is not the Fund’s actual return. The hypothetical account values and expenses may not be used to estimate the actual ending account balance or expenses you paid for the period. You may use this information to compare the ongoing costs of investing in the Fund and other funds by comparing this 5% hypothetical example with the 5% hypothetical examples that appear in the shareholder reports of other funds.
Please note that the expenses shown in the table are meant to highlight your ongoing costs only and do not reflect any transactional costs, such as sales charges (loads), or contingent deferred sales charges on redemptions. Therefore, the hypothetical example is useful in comparing ongoing costs only, and will not help you determine the relative total costs of owning different funds. In addition, if these transactional costs were included, your costs would have been higher.
| | | | | | | | | | | | | | | | | | | | | | | | |
| | | Beginning
Account
Value
January 1,
2017 | | | Ending
Account
Value
June 30,
2017 | | | Expenses
Paid
During
Period* | | | Annualized
Expense
Ratio* | | | Total
Expenses
Paid
During
Period+ | | | Total
Annualized
Expense
Ratio+ | |
| Class A | | | | | | | | | | | | | | | | | | | | | | | | |
Actual | | $ | 1,000 | | | $ | 1,219.50 | | | $ | 7.10 | | | | 1.29 | % | | $ | 7.15 | | | | 1.30 | % |
Hypothetical** | | $ | 1,000 | | | $ | 1,018.30 | | | $ | 6.46 | | | | 1.29 | % | | $ | 6.51 | | | | 1.30 | % |
| | |
| 10 | AB CONCENTRATED INTERNATIONAL GROWTH PORTFOLIO | | abfunds.com |
EXPENSE EXAMPLE (continued)
| | | | | | | | | | | | | | | | | | | | | | | | |
| | | Beginning
Account
Value
January 1,
2017 | | | Ending
Account
Value
June 30,
2017 | | | Expenses
Paid
During
Period* | | | Annualized
Expense
Ratio* | | | Total
Expenses
Paid
During
Period+ | | | Total
Annualized
Expense
Ratio+ | |
| Class C | | | | | | | | | | | | |
Actual | | $ | 1,000 | | | $ | 1,215.20 | | | $ | 11.20 | | | | 2.04 | % | | $ | 11.26 | | | | 2.05 | % |
Hypothetical** | | $ | 1,000 | | | $ | 1,014.92 | | | $ | 10.19 | | | | 2.04 | % | | $ | 10.24 | | | | 2.05 | % |
| Advisor Class | | | | | | | | | | | | |
Actual | | $ | 1,000 | | | $ | 1,220.70 | | | $ | 5.73 | | | | 1.04 | % | | $ | 5.78 | | | | 1.05 | % |
Hypothetical** | | $ | 1,000 | | | $ | 1,019.96 | | | $ | 5.21 | | | | 1.04 | % | | $ | 5.26 | | | | 1.05 | % |
| * | Expenses are equal to the classes’ annualized expense ratios multiplied by the average account value over the period, multiplied by 181/365 (to reflect the one-half year period). |
| ** | Assumes 5% annual return before expenses. |
| + | In connection with the Fund’s investments in affiliated/unaffiliated underlying portfolios, the Fund incurs no direct expenses, but bears proportionate shares of the fees and expenses (i.e., operating, administrative and investment advisory fees) of the affiliated/unaffiliated underlying portfolios. The Adviser has voluntarily agreed to waive its fees from the Fund in an amount equal to the Fund’s pro rata share of certain acquired fund fees and expenses of the affiliated underlying portfolios. The Fund’s total expenses are equal to the classes’ annualized expense ratio plus the Fund’s pro rata share of the weighted average expense ratio of the affiliated/unaffiliated underlying portfolios in which it invests, multiplied by the average account value over the period, multiplied by 181/365 (to reflect the one-half year period). |
| | |
| abfunds.com | | AB CONCENTRATED INTERNATIONAL GROWTH PORTFOLIO | 11 |
PORTFOLIO SUMMARY
June 30, 2017 (unaudited)
PORTFOLIO STATISTICS
Net Assets ($mil): $32.6
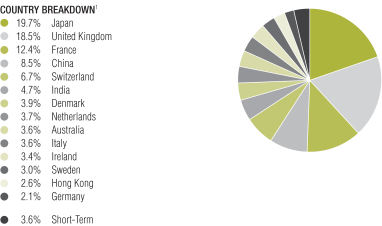
| 1 | All data are as of June 30, 2017. The Fund’s sector and country breakdowns are expressed as a percentage of total investments and may vary over time. The Fund also enters into derivative transactions, which may be used for hedging or investment purposes (see “Portfolio of Investments” section of the report for additional details). |
Please note: The sector classifications presented herein are based on the Global Industry Classification Standard (GICS) which was developed by Morgan Stanley Capital International and Standard & Poor’s. The components are divided into sector, industry group, and industry sub-indices as classified by the GICS for each of the market capitalization indices in the broad market. These sector classifications are broadly defined. The “Portfolio of Investments” section of the report reflects more specific industry information and is consistent with the investment restrictions discussed in the Fund’s prospectus.
| | |
| 12 | AB CONCENTRATED INTERNATIONAL GROWTH PORTFOLIO | | abfunds.com |
PORTFOLIO SUMMARY (continued)
June 30, 2017 (unaudited)
TEN LARGEST HOLDINGS1
| | | | | | | | |
| Company | | U.S. $ Value | | | Percent of
Net Assets | |
| HDFC Bank Ltd. (ADR) | | $ | 1,540,587 | | | | 4.7 | % |
| Genmab A/S | | | 1,255,224 | | | | 3.8 | |
| Prudential PLC | | | 1,248,707 | | | | 3.8 | |
| ASML Holding NV | | | 1,202,503 | | | | 3.7 | |
| Kose Corp. | | | 1,195,411 | | | | 3.7 | |
| Tencent Holdings Ltd. | | | 1,191,048 | | | | 3.6 | |
| Treasury Wine Estates Ltd. | | | 1,180,478 | | | | 3.6 | |
| Azimut Holding SpA | | | 1,169,772 | | | | 3.6 | |
| Capgemini SE | | | 1,167,524 | | | | 3.6 | |
| B&M European Value Retail SA | | | 1,166,146 | | | | 3.6 | |
| | $ | 12,317,400 | | | | 37.7 | % |
| | |
| abfunds.com | | AB CONCENTRATED INTERNATIONAL GROWTH PORTFOLIO | 13 |
PORTFOLIO OF INVESTMENTS
June 30, 2017
| | | | | | | | |
| Company | | Shares | | | U.S. $ Value | |
| |
| | | | | | | | |
COMMON STOCKS – 96.2% | | | | | | | | |
Information Technology – 25.4% | | | | | | | | |
Electronic Equipment, Instruments & Components – 9.1% | | | | | | | | |
Ingenico Group SA | | | 12,037 | | | $ | 1,091,603 | |
Keyence Corp. | | | 1,900 | | | | 836,433 | |
Murata Manufacturing Co., Ltd. | | | 6,760 | | | | 1,032,022 | |
| | | | | | | | |
| | | | | | | 2,960,058 | |
| | | | | | | | |
Internet Software & Services – 6.9% | | | | | | | | |
Alibaba Group Holding Ltd. (Sponsored ADR)(a) | | | 7,680 | | | | 1,082,112 | |
Tencent Holdings Ltd. | | | 33,200 | | | | 1,191,048 | |
| | | | | | | | |
| | | | | | | 2,273,160 | |
| | | | | | | | |
IT Services – 5.7% | | | | | | | | |
Capgemini SE | | | 11,302 | | | | 1,167,524 | |
Worldpay Group PLC(b) | | | 167,817 | | | | 688,119 | |
| | | | | | | | |
| | | | | | | 1,855,643 | |
| | | | | | | | |
Semiconductors & Semiconductor Equipment – 3.7% | | | | | | | | |
ASML Holding NV | | | 9,225 | | | | 1,202,503 | |
| | | | | | | | |
| | | | | | | 8,291,364 | |
| | | | | | | | |
Industrials – 17.8% | | | | | | | | |
Building Products – 3.0% | | | | | | | | |
Assa Abloy AB – Class B | | | 44,892 | | | | 989,485 | |
| | | | | | | | |
| | |
Commercial Services & Supplies – 2.1% | | | | | | | | |
Park24 Co., Ltd. | | | 26,100 | | | | 664,150 | |
| | | | | | | | |
| | |
Electrical Equipment – 3.5% | | | | | | | | |
Nidec Corp. | | | 11,200 | | | | 1,150,687 | |
| | | | | | | | |
| | |
Machinery – 1.8% | | | | | | | | |
Hoshizaki Corp. | | | 6,300 | | | | 571,604 | |
| | | | | | | | |
| | |
Professional Services – 7.4% | | | | | | | | |
Adecco Group AG (REG) | | | 10,400 | | | | 792,294 | |
Recruit Holdings Co., Ltd. | | | 56,100 | | | | 965,474 | |
RELX NV | | | 32,140 | | | | 662,624 | |
| | | | | | | | |
| | | | | | | 2,420,392 | |
| | | | | | | | |
| | | | | | | 5,796,318 | |
| | | | | | | | |
Consumer Discretionary – 15.6% | | | | | | | | |
Auto Components – 2.1% | | | | | | | | |
Continental AG | | | 3,119 | | | | 674,732 | |
| | | | | | | | |
| | |
Hotels, Restaurants & Leisure – 3.5% | | | | | | | | |
InterContinental Hotels Group PLC | | | 20,297 | | | | 1,127,166 | |
| | | | | | | | |
| | |
Internet & Direct Marketing Retail – 1.5% | | | | | | | | |
Ctrip.com International Ltd. (ADR)(a) | | | 9,280 | | | | 499,821 | |
| | | | | | | | |
| | |
| 14 | AB CONCENTRATED INTERNATIONAL GROWTH PORTFOLIO | | abfunds.com |
PORTFOLIO OF INVESTMENTS (continued)
| | | | | | | | |
| Company | | Shares | | | U.S. $ Value | |
| |
| | | | | | | | |
Multiline Retail – 3.6% | | | | | | | | |
B&M European Value Retail SA | | | 264,139 | | | $ | 1,166,146 | |
| | | | | | | | |
| | |
Textiles, Apparel & Luxury Goods – 4.9% | | | | | | | | |
LVMH Moet Hennessy Louis Vuitton SE | | | 3,053 | | | | 763,419 | |
Samsonite International SA | | | 203,700 | | | | 851,017 | |
| | | | | | | | |
| | | | | | | 1,614,436 | |
| | | | | | | | |
| | | | | | | 5,082,301 | |
| | | | | | | | |
Consumer Staples – 12.9% | | | | | | | | |
Beverages – 3.6% | | | | | | | | |
Treasury Wine Estates Ltd. | | | 116,741 | | | | 1,180,478 | |
| | | | | | | | |
| | |
Food Products – 2.1% | | | | | | | | |
Nestle SA (REG) | | | 7,910 | | | | 689,891 | |
| | | | | | | | |
| | |
Household Products – 3.5% | | | | | | | | |
Reckitt Benckiser Group PLC | | | 11,223 | | | | 1,137,710 | |
| | | | | | | | |
| | |
Personal Products – 3.7% | | | | | | | | |
Kose Corp. | | | 10,900 | | | | 1,195,411 | |
| | | | | | | | |
| | | | | | | 4,203,490 | |
| | | | | | | | |
Financials – 12.1% | | | | | | | | |
Banks – 4.7% | | | | | | | | |
HDFC Bank Ltd. (ADR) | | | 17,714 | | | | 1,540,587 | |
| | | | | | | | |
| | |
Capital Markets – 3.6% | | | | | | | | |
Azimut Holding SpA | | | 58,146 | | | | 1,169,772 | |
| | | | | | | | |
| | |
Insurance – 3.8% | | | | | | | | |
Prudential PLC | | | 54,401 | | | | 1,248,707 | |
| | | | | | | | |
| | | | | | | 3,959,066 | |
| | | | | | | | |
Health Care – 9.1% | | | | | | | | |
Biotechnology – 3.9% | | | | | | | | |
Genmab A/S(a) | | | 5,887 | | | | 1,255,224 | |
| | | | | | | | |
| | |
Life Sciences Tools & Services – 3.1% | | | | | | | | |
Eurofins Scientific SE | | | 1,816 | | | | 1,024,596 | |
| | | | | | | | |
| | |
Pharmaceuticals – 2.1% | | | | | | | | |
Roche Holding AG | | | 2,740 | | | | 700,110 | |
| | | | | | | | |
| | | | | | | 2,979,930 | |
| | | | | | | | |
Materials – 3.3% | | | | | | | | |
Construction Materials – 3.3% | | | | | | | | |
CRH PLC (London) | | | 30,755 | | | | 1,094,831 | |
| | | | | | | | |
| | |
Total Common Stocks
(cost $27,899,896) | | | | | | | 31,407,300 | |
| | | | | | | | |
| | | | | | | | |
| | |
| abfunds.com | | AB CONCENTRATED INTERNATIONAL GROWTH PORTFOLIO | 15 |
PORTFOLIO OF INVESTMENTS (continued)
| | | | | | | | |
| Company | | Shares | | | U.S. $ Value | |
| |
| | | | | | | | |
SHORT-TERM INVESTMENTS – 3.7% | | | | | | | | |
Investment Companies – 3.7% | | | | | | | | |
AB Fixed Income Shares, Inc. – Government Money Market Portfolio – Class AB, 0.79%(c)(d)
(cost $1,185,385) | | | 1,185,385 | | | $ | 1,185,385 | |
| | | | | | | | |
| | |
Total Investments – 99.9%
(cost $29,085,281) | | | | | | | 32,592,685 | |
Other assets less liabilities – 0.1% | | | | | | | 47,939 | |
| | | | | | | | |
| | |
Net Assets – 100.0% | | | | | | $ | 32,640,624 | |
| | | | | | | | |
FORWARD CURRENCY EXCHANGE CONTRACTS (see Note D)
| | | | | | | | | | | | | | | | | | | | |
| Counterparty | | Contracts to
Deliver (000) | | | In Exchange
For
(000) | | | Settlement
Date | | | Unrealized
Appreciation/
(Depreciation) | |
Bank of America, NA | | CNY | | | 9,360 | | | USD | | | 1,369 | | | | 9/15/17 | | | $ | (5,062 | ) |
Bank of America, NA | | INR | | | 45,129 | | | USD | | | 691 | | | | 9/15/17 | | | | (1,856 | ) |
Barclays Bank PLC | | USD | | | 1,259 | | | AUD | | | 1,668 | | | | 9/15/17 | | | | 21,991 | |
Citibank, NA | | USD | | | 609 | | | EUR | | | 542 | | | | 9/15/17 | | | | 12,427 | |
Royal Bank of Scotland PLC | | HKD | | | 8,172 | | | USD | | | 1,051 | | | | 9/15/17 | | | | 2,260 | |
Royal Bank of Scotland PLC | | USD | | | 1,279 | | | JPY | | | 139,464 | | | | 9/15/17 | | | | (35,528 | ) |
State Street Bank & Trust Co. | | AUD | | | 179 | | | USD | | | 135 | | | | 9/15/17 | | | | (2,845 | ) |
State Street Bank & Trust Co. | | GBP | | | 781 | | | USD | | | 1,000 | | | | 9/15/17 | | | | (19,100 | ) |
State Street Bank & Trust Co. | | JPY | | | 46,600 | | | USD | | | 425 | | | | 9/15/17 | | | | 8,978 | |
State Street Bank & Trust Co. | | USD | | | 1,624 | | | EUR | | | 1,438 | | | | 9/15/17 | | | | 25,044 | |
UBS AG | | USD | | | 777 | | | GBP | | | 609 | | | | 9/15/17 | | | | 17,691 | |
| | | | | | | | | | | | | | | | | | | | |
| | | $ | 24,000 | |
| | | | | | | | | | | | | | | | | | | | |
| (a) | Non-income producing security. |
| (b) | Security is exempt from registration under Rule 144A of the Securities Act of 1933. This security is considered restricted, but liquid and may be resold in transactions exempt from registration, normally to qualified institutional buyers. At June 30, 2017, the market value of this security amounted to $688,119 or 2.1% of net assets. |
| (c) | Investment in affiliated money market mutual fund. The rate shown represents the 7-day yield as of period end. |
| (d) | To obtain a copy of the fund’s shareholder report, please go to the Securities and Exchange Commission’s website at www.sec.gov, or call AB at (800) 227-4618. |
Currency Abbreviations:
AUD – Australian Dollar
CNY – Chinese Yuan Renminbi
EUR – Euro
GBP – Great British Pound
HKD – Hong Kong Dollar
INR – Indian Rupee
JPY – Japanese Yen
USD – United States Dollar
Glossary:
ADR – American Depositary Receipt
REG – Registered Shares
See notes to financial statements.
| | |
| 16 | AB CONCENTRATED INTERNATIONAL GROWTH PORTFOLIO | | abfunds.com |
STATEMENT OF ASSETS & LIABILITIES
June 30, 2017
| | | | |
| Assets | | | | |
Investments in securities, at value | | | | |
Unaffiliated issuers (cost $27,899,896) | | $ | 31,407,300 | |
Affiliated issuers (cost $1,185,385) | | | 1,185,385 | |
Foreign currencies, at value (cost $41,185) | | | 41,759 | |
Unrealized appreciation on forward currency exchange contracts | | | 88,391 | |
Unaffiliated dividends and interest receivable | | | 47,586 | |
Receivable due from Adviser | | | 32,475 | |
Receivable for capital stock sold | | | 3,063 | |
Affiliated dividends receivable | | | 517 | |
| | | | |
Total assets | | | 32,806,476 | |
| | | | |
| Liabilities | | | | |
Unrealized depreciation on forward currency exchange contracts | | | 64,391 | |
Payable for capital stock redeemed | | | 32,351 | |
Custody fee payable | | | 29,899 | |
Legal fee payable | | | 14,733 | |
Audit and tax fee payable | | | 9,564 | |
Transfer Agent fee payable | | | 3,005 | |
Distribution fee payable | | | 30 | |
Accrued expenses | | | 11,879 | |
| | | | |
Total liabilities | | | 165,852 | |
| | | | |
Net Assets | | $ | 32,640,624 | |
| | | | |
| Composition of Net Assets | | | | |
Capital stock, at par | | $ | 311 | |
Additional paid-in capital | | | 28,391,434 | |
Undistributed net investment income | | | 252,956 | |
Accumulated net realized gain on investment and foreign currency transactions | | | 463,220 | |
Net unrealized appreciation on investments and foreign currency denominated assets and liabilities | | | 3,532,703 | |
| | | | |
| | $ | 32,640,624 | |
| | | | |
Net Asset Value Per Share—11 billion shares of capital stock authorized, $.0001 par value
| | | | | | | | | | | | |
| Class | | Net Assets | | | Shares
Outstanding | | | Net Asset
Value | |
| |
| A | | $ | 10,504 | | | | 1,000 | | | $ | 10.50 | * |
| |
| C | | $ | 28,428 | | | | 2,736 | | | $ | 10.39 | |
| |
| Advisor | | $ | 32,601,692 | | | | 3,101,438 | | | $ | 10.51 | |
| |
| * | The maximum offering price per share for Class A shares was $10.97 which reflects a sales charge of 4.25%. |
See notes to financial statements.
| | |
| abfunds.com | | AB CONCENTRATED INTERNATIONAL GROWTH PORTFOLIO | 17 |
STATEMENT OF OPERATIONS
Year Ended June 30, 2017
| | | | | | | | |
| Investment Income | | | | | | | | |
Dividends | | | | | | | | |
Unaffiliated issuers (net of foreign taxes withheld of $40,102) | | $ | 371,581 | | | | | |
Affiliated issuers | | | 2,569 | | | $ | 374,150 | |
| | | | | | | | |
| Expenses | | | | | | | | |
Advisory fee (see Note B) | | | 103,340 | | | | | |
Distribution fee—Class A | | | 23 | | | | | |
Distribution fee—Class C | | | 102 | | | | | |
Transfer agency—Class A | | | 2 | | | | | |
Transfer agency—Class C | | | 16 | | | | | |
Transfer agency—Advisor Class | | | 8,263 | | | | | |
Custodian | | | 72,504 | | | | | |
Administrative | | | 64,995 | | | | | |
Registration fees | | | 60,508 | | | | | |
Audit and tax | | | 46,745 | | | | | |
Legal | | | 45,319 | | | | | |
Directors’ fees | | | 27,098 | | | | | |
Printing | | | 20,072 | | | | | |
Miscellaneous | | | 8,582 | | | | | |
| | | | | | | | |
Total expenses | | | 457,569 | | | | | |
Less: expenses waived and reimbursed by the Adviser (see Note B) | | | (330,766 | ) | | | | |
| | | | | | | | |
Net expenses | | | | | | | 126,803 | |
| | | | | | | | |
Net investment income | | | | | | | 247,347 | |
| | | | | | | | |
| Realized and Unrealized Gain on Investment and Foreign Currency Transactions | | | | | | | | |
Net realized gain on: | | | | | | | | |
Investment transactions | | | | | | | 547,653 | |
Foreign currency transactions | | | | | | | 8,696 | |
Net change in unrealized appreciation/depreciation of: | | | | | | | | |
Investments | | | | | | | 3,735,614 | |
Foreign currency denominated assets and liabilities | | | | | | | 25,508 | |
| | | | | | | | |
Net gain on investment and foreign currency transactions | | | | | | | 4,317,471 | |
| | | | | | | | |
Net Increase in Net Assets from Operations | | | | | | $ | 4,564,818 | |
| | | | | | | | |
See notes to financial statements.
| | |
| 18 | AB CONCENTRATED INTERNATIONAL GROWTH PORTFOLIO | | abfunds.com |
STATEMENT OF CHANGES IN NET ASSETS
| | | | | | | | |
| | | Year Ended
June 30,
2017 | | | Year Ended
June 30,
2016 | |
| Increase (Decrease) in Net Assets from Operations | | | | | | | | |
Net investment income | | $ | 247,347 | | | $ | 10,332 | |
Net realized gain (loss) on investment transactions and foreign currency | | | 556,349 | | | | (83,814 | ) |
Net change in unrealized appreciation/depreciation of investments and foreign currency denominated assets and liabilities | | | 3,761,122 | | | | (182,609 | ) |
| | | | | | | | |
Net increase (decrease) in net assets from operations | | | 4,564,818 | | | | (256,091 | ) |
| Dividends and Distributions to Shareholders from | | | | | | | | |
Net investment income | | | | | | | | |
Class A | | | (49 | ) | | | – 0 | – |
Advisor Class | | | (13,959 | ) | | | (3,307 | ) |
Net realized gain on investment transactions | | | | | | | | |
Class A | | | – 0 | – | | | (2 | ) |
Class C | | | – 0 | – | | | (2 | ) |
Advisor Class | | | – 0 | – | | | (356 | ) |
| Capital Stock Transactions | | | | | | | | |
Net increase | | | 26,395,223 | | | | – 0 | – |
| | | | | | | | |
Total increase (decrease) | | | 30,946,033 | | | | (259,758 | ) |
| Net Assets | | | | | | | | |
Beginning of period | | | 1,694,591 | | | | 1,954,349 | |
| | | | | | | | |
End of period (including undistributed net investment income of $252,956 and $10,921, respectively) | | $ | 32,640,624 | | | $ | 1,694,591 | |
| | | | | | | | |
See notes to financial statements.
| | |
| abfunds.com | | AB CONCENTRATED INTERNATIONAL GROWTH PORTFOLIO | 19 |
NOTES TO FINANCIAL STATEMENTS
June 30, 2017
NOTE A
Significant Accounting Policies
AB Cap Fund, Inc. (the “Company”), which is a Maryland corporation, is registered under the Investment Company Act of 1940 as an open-end management investment company. The Company operates as a series company currently comprised of 31 portfolios. Each portfolio is considered to be a separate entity for financial reporting and tax purposes. This report relates only to the AB Concentrated International Growth Portfolio (the “Fund”), a non-diversified portfolio. The Fund has authorized the issuance of Class A, Class B, Class C, Advisor Class, Class R, Class K, Class I, Class Z, Class T, Class 1 and Class 2 shares. Class B, Class R, Class K, Class I, Class Z, Class T, Class 1 and Class 2 shares have not been issued. Class A shares are sold with a front-end sales charge of up to 4.25% for purchases not exceeding $1,000,000. With respect to purchases of $1,000,000 or more, Class A shares redeemed within one year of purchase may be subject to a contingent deferred sales charge of 1%. Class C shares are subject to a contingent deferred sales charge of 1% on redemptions made within the first year after purchase, and 0% after the first year of purchase. Effective April 10, 2017, Class C shares will automatically convert to Class A shares ten years after the end of the calendar month of purchase. Advisor Class shares are sold without any initial or contingent deferred sales charge and are not subject to ongoing distribution expenses. All eleven classes of shares have identical voting, dividend, liquidation and other rights, except that the classes bear different distribution and transfer agency expenses. Each class has exclusive voting rights with respect to its distribution plan. The financial statements have been prepared in conformity with U.S. generally accepted accounting principles (“U.S. GAAP”) which require management to make certain estimates and assumptions that affect the reported amounts of assets and liabilities in the financial statements and amounts of income and expenses during the reporting period. Actual results could differ from those estimates. The Fund is an investment company under U.S. GAAP and follows the accounting and reporting guidance applicable to investment companies. The following is a summary of significant accounting policies followed by the Fund.
1. Security Valuation
Portfolio securities are valued at their current market value determined on the basis of market quotations or, if market quotations are not readily available or are deemed unreliable, at “fair value” as determined in accordance with procedures established by and under the general supervision of the Company’s Board of Directors (the “Board”).
In general, the market values of securities which are readily available and deemed reliable are determined as follows: securities listed on a national
| | |
| 20 | AB CONCENTRATED INTERNATIONAL GROWTH PORTFOLIO | | abfunds.com |
NOTES TO FINANCIAL STATEMENTS (continued)
securities exchange (other than securities listed on the NASDAQ Stock Market, Inc. (“NASDAQ”)) or on a foreign securities exchange are valued at the last sale price at the close of the exchange or foreign securities exchange. If there has been no sale on such day, the securities are valued at the last traded price from the previous day. Securities listed on more than one exchange are valued by reference to the principal exchange on which the securities are traded; securities listed only on NASDAQ are valued in accordance with the NASDAQ Official Closing Price; listed or over the counter (“OTC”) market put or call options are valued at the mid level between the current bid and ask prices. If either a current bid or current ask price is unavailable, the Adviser will have discretion to determine the best valuation (e.g. last trade price in the case of listed options); open futures are valued using the closing settlement price or, in the absence of such a price, the most recent quoted bid price. If there are no quotations available for the day of valuation, the last available closing settlement price is used; U.S. Government securities and any other debt instruments having 60 days or less remaining until maturity are generally valued at market by an independent pricing vendor, if a market price is available. If a market price is not available, the securities are valued at amortized cost. This methodology is commonly used for short term securities that have an original maturity of 60 days or less, as well as short term securities that had an original term to maturity that exceeded 60 days. In instances when amortized cost is utilized, the Valuation Committee (the “Committee”) must reasonably conclude that the utilization of amortized cost is approximately the same as the fair value of the security. Such factors the Committee will consider include, but are not limited to, an impairment of the creditworthiness of the issuer or material changes in interest rates. Fixed-income securities, including mortgage-backed and asset-backed securities, may be valued on the basis of prices provided by a pricing service or at a price obtained from one or more of the major broker-dealers. In cases where broker-dealer quotes are obtained, the Adviser may establish procedures whereby changes in market yields or spreads are used to adjust, on a daily basis, a recently obtained quoted price on a security. Swaps and other derivatives are valued daily, primarily using independent pricing services, independent pricing models using market inputs, as well as third party broker-dealers or counterparties. Open end mutual funds are valued at the closing net asset value per share, while exchange traded funds are valued at the closing market price per share.
Securities for which market quotations are not readily available (including restricted securities) or are deemed unreliable are valued at fair value as deemed appropriate by the Adviser. Factors considered in making this determination may include, but are not limited to, information obtained by contacting the issuer, analysts, analysis of the issuer’s financial statements or other available documents. In addition, the Fund may use fair
| | |
| abfunds.com | | AB CONCENTRATED INTERNATIONAL GROWTH PORTFOLIO | 21 |
NOTES TO FINANCIAL STATEMENTS (continued)
value pricing for securities primarily traded in non-U.S. markets because most foreign markets close well before the Fund values its securities at 4:00 p.m., Eastern Time. The earlier close of these foreign markets gives rise to the possibility that significant events, including broad market moves, may have occurred in the interim and may materially affect the value of those securities. To account for this, the Fund may frequently value many of its foreign equity securities using fair value prices based on third party vendor modeling tools to the extent available.
2. Fair Value Measurements
In accordance with U.S. GAAP regarding fair value measurements, fair value is defined as the price that the Fund would receive to sell an asset or pay to transfer a liability in an orderly transaction between market participants at the measurement date. U.S. GAAP establishes a framework for measuring fair value, and a three-level hierarchy for fair value measurements based upon the transparency of inputs to the valuation of an asset or liability (including those valued based on their market values as described in Note A.1 above). Inputs may be observable or unobservable and refer broadly to the assumptions that market participants would use in pricing the asset or liability. Observable inputs reflect the assumptions market participants would use in pricing the asset or liability based on market data obtained from sources independent of the Fund. Unobservable inputs reflect the Fund’s own assumptions about the assumptions that market participants would use in pricing the asset or liability based on the best information available in the circumstances. Each investment is assigned a level based upon the observability of the inputs which are significant to the overall valuation. The three-tier hierarchy of inputs is summarized below.
| | • | | Level 1—quoted prices in active markets for identical investments |
| | • | | Level 2—other significant observable inputs (including quoted prices for similar investments, interest rates, prepayment speeds, credit risk, etc.) |
| | • | | Level 3—significant unobservable inputs (including the Fund’s own assumptions in determining the fair value of investments) |
Where readily available market prices or relevant bid prices are not available for certain equity investments, such investments may be valued based on similar publicly traded investments, movements in relevant indices since last available prices or based upon underlying company fundamentals and comparable company data (such as multiples to earnings or other multiples to equity). Where an investment is valued using an observable input, such as another publicly traded security, the investment will be classified as Level 2. If management determines that an adjustment is appropriate based on restrictions on resale, illiquidity or uncertainty, and such adjustment is a significant component of the valuation, the investment will be
| | |
| 22 | AB CONCENTRATED INTERNATIONAL GROWTH PORTFOLIO | | abfunds.com |
NOTES TO FINANCIAL STATEMENTS (continued)
classified as Level 3. An investment will also be classified as Level 3 where management uses company fundamentals and other significant inputs to determine the valuation.
The following table summarizes the valuation of the Fund’s investments by the above fair value hierarchy levels as of June 30, 2017:
| | | | | | | | | | | | | | | | |
Investments in
Securities: | | Level 1 | | | Level 2 | | | Level 3 | | | Total | |
Assets: | | | | | | | | | | | | | | | | |
Common Stocks: | | | | | | | | | | | | | | | | |
Information Technology | | $ | 1,082,112 | | | $ | 7,209,252 | | | $ | – 0 | – | | $ | 8,291,364 | |
Industrials | | | – 0 | – | | | 5,796,318 | | | | – 0 | – | | | 5,796,318 | |
Consumer Discretionary | | | 499,821 | | | | 4,582,480 | | | | – 0 | – | | | 5,082,301 | |
Consumer Staples | | | – 0 | – | | | 4,203,490 | | | | – 0 | – | | | 4,203,490 | |
Financials | | | 1,540,587 | | | | 2,418,479 | | | | – 0 | – | | | 3,959,066 | |
Health Care | | | – 0 | – | | | 2,979,930 | | | | – 0 | – | | | 2,979,930 | |
Materials | | | – 0 | – | | | 1,094,831 | | | | – 0 | – | | | 1,094,831 | |
Short-Term Investments | | | 1,185,385 | | | | – 0 | – | | | – 0 | – | | | 1,185,385 | |
| | | | | | | | | | | | | | | | |
Total Investments in Securities | | | 4,307,905 | | | | 28,284,780 | (a) | | | – 0 | – | | | 32,592,685 | |
Other Financial Instruments(b): | | | | | | | | | | | | | | | | |
Assets: | | | | | | | | | | | | | | | | |
Forward Currency Exchange Contracts | | | – 0 | – | | | 88,391 | | | | – 0 | – | | | 88,391 | |
Liabilities: | | | | | | | | | | | | | | | | |
Forward Currency Exchange Contracts | | | – 0 | – | | | (64,391 | ) | | | – 0 | – | | | (64,391 | ) |
| | | | | | | | | | | | | | | | |
Total(c) | | $ | 4,307,905 | | | $ | 28,308,780 | | | $ | – 0 | – | | $ | 32,616,685 | |
| | | | | | | | | | | | | | | | |
| (a) | A significant portion of the Fund’s foreign equity investments are categorized as Level 2 investments since they are valued using fair value prices based on third party vendor modeling tools to the extent available, see Note 1.A. |
| (b) | Other financial instruments are derivative instruments, such as futures, forwards and swaps, which are valued at the unrealized appreciation/(depreciation) on the instrument. |
| (c) | There were no transfers between any levels during the reporting period. |
The Fund recognizes all transfers between levels of the fair value hierarchy assuming the financial instruments were transferred at the beginning of the reporting period.
The Adviser established the Committee to oversee the pricing and valuation of all securities held in the Fund. The Committee operates under pricing and valuation policies and procedures established by the Adviser and approved by the Board, including pricing policies which set forth the mechanisms and processes to be employed on a daily basis to implement these policies and procedures. In particular, the pricing policies describe how to determine market quotations for securities and other instruments. The Committee’s responsibilities include: 1) fair value and liquidity determinations (and oversight of any third parties to whom any responsibility for fair value and liquidity determinations is delegated), and 2) regular monitoring of
| | |
| abfunds.com | | AB CONCENTRATED INTERNATIONAL GROWTH PORTFOLIO | 23 |
NOTES TO FINANCIAL STATEMENTS (continued)
the Adviser’s pricing and valuation policies and procedures and modification or enhancement of these policies and procedures (or recommendation of the modification of these policies and procedures) as the Committee believes appropriate.
The Committee is also responsible for monitoring the implementation of the pricing policies by the Adviser’s Pricing Group (the “Pricing Group”) and any third party which performs certain pricing functions in accordance with the pricing policies. The Pricing Group is responsible for the oversight of the third party on a day-to-day basis. The Committee and the Pricing Group perform a series of activities to provide reasonable assurance of the accuracy of prices including: 1) periodic vendor due diligence meetings, review of methodologies, new developments and processes at vendors, 2) daily comparison of security valuation versus prior day for all securities that exceeded established thresholds, and 3) daily review of unpriced, stale, and variance reports with exceptions reviewed by senior management and the Committee.
In addition, several processes outside of the pricing process are used to monitor valuation issues including: 1) performance and performance attribution reports are monitored for anomalous impacts based upon benchmark performance, and 2) portfolio managers review all portfolios for performance and analytics (which are generated using the Adviser’s prices).
3. Currency Translation
Assets and liabilities denominated in foreign currencies and commitments under forward currency exchange contracts are translated into U.S. dollars at the mean of the quoted bid and ask prices of such currencies against the U.S. dollar. Purchases and sales of portfolio securities are translated into U.S. dollars at the rates of exchange prevailing when such securities were acquired or sold. Income and expenses are translated into U.S. dollars at rates of exchange prevailing when accrued.
Net realized gain or loss on foreign currency transactions represents foreign exchange gains and losses from sales and maturities of foreign fixed income investments, foreign currency exchange contracts, holding of foreign currencies, currency gains or losses realized between the trade and settlement dates on foreign investment transactions, and the difference between the amounts of dividends, interest and foreign withholding taxes recorded on the Fund’s books and the U.S. dollar equivalent amounts actually received or paid. Net unrealized currency gains and losses from valuing foreign currency denominated assets and liabilities at period end exchange rates are reflected as a component of net unrealized appreciation or depreciation of foreign currency denominated assets and liabilities.
| | |
| 24 | AB CONCENTRATED INTERNATIONAL GROWTH PORTFOLIO | | abfunds.com |
NOTES TO FINANCIAL STATEMENTS (continued)
4. Taxes
It is the Fund’s policy to meet the requirements of the Internal Revenue Code applicable to regulated investment companies and to distribute all of its investment company taxable income and net realized gains, if any, to shareholders. Therefore, no provisions for federal income or excise taxes are required. The Fund may be subject to taxes imposed by countries in which it invests. Such taxes are generally based on income and/or capital gains earned or repatriated. Taxes are accrued and applied to net investment income, net realized gains and net unrealized appreciation/depreciation as such income and/or gains are earned.
In accordance with U.S. GAAP requirements regarding accounting for uncertainties in income taxes, management has analyzed the Fund’s tax positions taken or expected to be taken on federal and state income tax returns for all open tax years (the current tax year and the prior two tax years) and has concluded that no provision for income tax is required in the Fund’s financial statements.
5. Investment Income and Investment Transactions
Dividend income is recorded on the ex-dividend date or as soon as the Fund is informed of the dividend. Interest income is accrued daily. Investment transactions are accounted for on the date the securities are purchased or sold. Investment gains or losses are determined on the identified cost basis. The Fund amortizes premiums and accretes discounts as adjustments to interest income.
6. Class Allocations
All income earned and expenses incurred by the Fund are borne on a pro-rata basis by each outstanding class of shares, based on the proportionate interest in the Fund represented by the net assets of such class, except for class specific expenses which are allocated to the respective class. Expenses of the Company are charged proportionately to each portfolio or based on other appropriate methods. Realized and unrealized gains and losses are allocated among the various share classes based on respective net assets.
7. Dividends and Distributions
Dividends and distributions to shareholders, if any, are recorded on the ex-dividend date. Income dividends and capital gains distributions are determined in accordance with federal tax regulations and may differ from those determined in accordance with U.S. GAAP. To the extent these differences are permanent, such amounts are reclassified within the capital accounts based on their federal tax basis treatment; temporary differences do not require such reclassification.
| | |
| abfunds.com | | AB CONCENTRATED INTERNATIONAL GROWTH PORTFOLIO | 25 |
NOTES TO FINANCIAL STATEMENTS (continued)
NOTE B
Advisory Fee and Other Transactions with Affiliates
Under the terms of the investment advisory agreement, the Fund pays the Adviser an advisory fee at an annual rate of .85% of the Fund’s average daily net assets. The fee is accrued daily and paid monthly. The Adviser has agreed to waive its fees and bear certain expenses to the extent necessary to limit total operating expenses (excluding acquired fund fees and expenses other than the advisory fees of any AB Mutual Funds in which the Fund may invest, interest expense, taxes, extraordinary expenses, and brokerage commissions and other transaction costs) on an annual basis (the “Expense Caps”) to 1.30%, 2.05% and 1.05% of the daily average net assets for Class A, Class C and Advisor Class shares, respectively. Any fees waived and expenses borne by the Adviser through April 14, 2016 are subject to repayment by the Fund until the end of the third fiscal year after the fiscal period in which the fee was waived or the expense was borne; such waivers that are subject to repayment amounted to $56,163 for the fiscal period ended June 30, 2015 and $228,495 for the year ended June 30, 2016, respectively. In any case, no reimbursement payment will be made that would cause the Fund’s total annual fund operating expenses to exceed the net fee percentages set forth above. For the year ended June 30, 2017, the reimbursements/waivers amounted to $264,793. The Expense Caps may not be terminated by the Adviser before February 12, 2018.
Pursuant to the investment advisory agreement, the Fund may reimburse the Adviser for certain legal and accounting services provided to the Fund by the Adviser. For the year ended June 30, 2017, the Adviser voluntarily agreed to waive such fees amounting to $64,995.
The Fund compensates AllianceBernstein Investor Services, Inc. (“ABIS”), a wholly-owned subsidiary of the Adviser, under a Transfer Agency Agreement for providing personnel and facilities to perform transfer agency services for the Fund. ABIS may make payments to intermediaries that provide omnibus account services, sub-accounting services and/or networking services. Such compensation retained by ABIS amounted to $1,500 for the year ended June 30, 2017.
AllianceBernstein Investments, Inc. (the “Distributor”), a wholly-owned subsidiary of the Adviser, serves as the distributor of the Fund’s shares. The Distributor has advised the Fund that it has retained front-end sales charges of $0 from the sale of Class A shares and received $0 and $0 in contingent deferred sales charges imposed upon redemptions by shareholders of Class A and Class C shares, respectively, for the year ended June 30, 2017.
| | |
| 26 | AB CONCENTRATED INTERNATIONAL GROWTH PORTFOLIO | | abfunds.com |
NOTES TO FINANCIAL STATEMENTS (continued)
The Fund may invest in AB Government Money Market Portfolio (the “Government Money Market Portfolio”) which has a contractual annual advisory fee rate of ..20% of the portfolio’s average daily net assets and bears its own expenses. In connection with the investment by the Fund in the Government Money Market Portfolio, the Adviser has agreed to waive its advisory fee from the Fund in an amount equal to the Fund’s pro rata share of the effective advisory fee of Government Money Market Portfolio, as borne indirectly by the Fund as an acquired fund fee and expense. For the year ended June 30, 2017, such waiver amounted to $978. A summary of the Fund’s transactions in shares of the Government Money Market Portfolio for the year ended June 30, 2017 is as follows:
| | | | | | | | | | | | | | | | | | |
Market Value 6/30/16 (000) | | | Purchases
at Cost
(000) | | | Sales
Proceeds
(000) | | | Market Value
6/30/17
(000) | | | Dividend
Income
(000) | |
| $ | 42 | | | $ | 34,711 | | | $ | 33,568 | | | $ | 1,185 | | | $ | 3 | |
Brokerage commissions paid on investment transactions for the year ended June 30, 2017 amounted to $23,195, of which $0 and $0, respectively, was paid to Sanford C. Bernstein & Co. LLC and Sanford C. Bernstein Limited, affiliates of the Adviser.
NOTE C
Distribution Services Agreement
The Fund has adopted a Distribution Services Agreement (the “Agreement”) pursuant to Rule 12b-1 under the Investment Company Act of 1940. Under the Agreement, the Fund pays distribution and servicing fees to the Distributor at an annual rate of up to .25% of the Fund’s average daily net assets attributable to Class A shares and 1% of the Fund’s average daily net assets attributable to Class C shares. There are no distribution and servicing fees on the Advisor Class shares. The fees are accrued daily and paid monthly. The Agreement provides that the Distributor will use such payments in their entirety for distribution assistance and promotional activities. Since the commencement of the Fund’s operations, the Distributor has incurred expenses in excess of the distribution costs reimbursed by the Fund in the amount of $0 for Class C shares. While such costs may be recovered from the Fund in future periods so long as the Agreement is in effect, the rate of the distribution and servicing fees payable under the Agreement may not be increased without a shareholder vote. In accordance with the Agreement, there is no provision for recovery of unreimbursed distribution costs incurred by the Distributor beyond the current fiscal year for Class A shares. The Agreement also provides that the Adviser may use its own resources to finance the distribution of the Fund’s shares.
| | |
| abfunds.com | | AB CONCENTRATED INTERNATIONAL GROWTH PORTFOLIO | 27 |
NOTES TO FINANCIAL STATEMENTS (continued)
NOTE D
Investment Transactions
Purchases and sales of investment securities (excluding short-term investments) for the year ended June 30, 2017 were as follows:
| | | | | | | | |
| | | Purchases | | | Sales | |
Investment securities (excluding | | | | | | | | |
U.S. government securities) | | $ | 33,734,494 | | | $ | 8,277,298 | |
U.S. government securities | | | – 0 | – | | | – 0 | – |
The cost of investments for federal income tax purposes, gross unrealized appreciation and unrealized depreciation (excluding foreign currency transactions) are as follows:
| | | | |
Cost | | $ | 29,087,772 | |
| | | | |
Gross unrealized appreciation | | $ | 3,602,937 | |
Gross unrealized depreciation | | | (98,024 | ) |
| | | | |
Net unrealized appreciation | | $ | 3,504,913 | |
| | | | |
1. Derivative Financial Instruments
The Fund may use derivatives in an effort to earn income and enhance returns, to replace more traditional direct investments, to obtain exposure to otherwise inaccessible markets (collectively, “investment purposes”), or to hedge or adjust the risk profile of its portfolio.
The principal type of derivatives utilized by the Fund, as well as the methods in which they may be used are:
| | • | | Forward Currency Exchange Contracts |
The Fund may enter into forward currency exchange contracts in order to hedge its exposure to changes in foreign currency exchange rates on its foreign portfolio holdings, to hedge certain firm purchase and sale commitments denominated in foreign currencies and for non-hedging purposes as a means of making direct investments in foreign currencies, as described below under “Currency Transactions”.
A forward currency exchange contract is a commitment to purchase or sell a foreign currency at a future date at a negotiated forward rate. The gain or loss arising from the difference between the original contract and the closing of such contract would be included in net realized gain or loss on foreign currency transactions. Fluctuations in the value of open forward currency exchange contracts are recorded for financial reporting purposes as unrealized appreciation and/or depreciation by the Fund. Risks may arise from the potential inability of a counterparty to meet the terms of a contract and from unanticipated movements in the value of a foreign currency relative to the U.S. dollar.
| | |
| 28 | AB CONCENTRATED INTERNATIONAL GROWTH PORTFOLIO | | abfunds.com |
NOTES TO FINANCIAL STATEMENTS (continued)
During the year ended June 30, 2017, the Fund held forward currency exchange contracts for hedging purposes.
The Fund typically enters into International Swaps and Derivatives Association, Inc. Master Agreements (“ISDA Master Agreement”) or similar master agreements (collectively, “Master Agreements”) with its derivative contract counterparties in order to, among other things, reduce its credit risk to counterparties. ISDA Master Agreements include provisions for general obligations, representations, collateral and events of default or termination. Under an ISDA Master Agreement, the Fund typically may offset with the counterparty certain derivative financial instruments’ payables and/or receivables with collateral held and/or posted and create one single net payment (close-out netting) in the event of default or termination.
Various Master Agreements govern the terms of certain transactions with counterparties, including transactions such as derivative transactions, repurchase and reverse repurchase agreements. These Master Agreements typically attempt to reduce the counterparty risk associated with such transactions by specifying credit protection mechanisms and providing standardization that improves legal certainty. Cross-termination provisions under Master Agreements typically provide that a default in connection with one transaction between the Fund and a counterparty gives the non-defaulting party the right to terminate any other transactions in place with the defaulting party to create one single net payment due to/due from the defaulting party. In the event of a default by a Master Agreements counterparty, the return of collateral with market value in excess of the Fund’s net liability, held by the defaulting party, may be delayed or denied.
The Fund’s Master Agreements may contain provisions for early termination of OTC derivative transactions in the event the net assets of the Fund decline below specific levels (“net asset contingent features”). If these levels are triggered, the Fund’s counterparty has the right to terminate such transaction and require the Fund to pay or receive a settlement amount in connection with the terminated transaction. For additional details, please refer to netting arrangements by counterparty tables below.
| | |
| abfunds.com | | AB CONCENTRATED INTERNATIONAL GROWTH PORTFOLIO | 29 |
NOTES TO FINANCIAL STATEMENTS (continued)
During the year ended June 30, 2017, the Fund had entered into the following derivatives:
| | | | | | | | | | | | |
| | | Asset Derivatives | | | Liability Derivatives | |
Derivative Type | | Statement of
Assets and
Liabilities
Location | | Fair Value | | | Statement of
Assets and
Liabilities
Location | | Fair Value | |
Foreign exchange contracts | | Unrealized appreciation on forward currency exchange contracts | | $ | 88,391 | | | Unrealized depreciation on forward currency exchange contracts | | $ | 64,391 | |
| | | | | | | | | | | | |
Total | | | | $ | 88,391 | | | | | $ | 64,391 | |
| | | | | | | | | | | | |
| | | | | | | | | | |
Derivative Type | | Location of Gain or
(Loss) on Derivatives Within
Statement of Operations | | Realized Gain
or (Loss) on
Derivatives | | | Change in
Unrealized
Appreciation or
(Depreciation) | |
Foreign exchange contracts | |
Net realized gain (loss) on foreign currency transactions; Net change in unrealized appreciation/depreciation of foreign currency denominated assets and liabilities | |
$ |
19,116 |
| |
$ |
24,000 |
|
| | | | | | | | | | |
Total | | | | $ | 19,116 | | | $ | 24,000 | |
| | | | | | | | | | |
The following table represents the average monthly volume of the Fund’s derivative transactions during the year ended June 30, 2017:
| | | | |
Forward Currency Exchange Contracts: | | | | |
Average principal amount of buy contracts | | $ | 3,007,253 | (a) |
Average principal amount of sale contracts | | $ | 2,762,341 | (a) |
| (a) | Positions were open for nine months during the year. |
For financial reporting purposes, the Fund does not offset derivative assets and derivative liabilities that are subject to netting arrangements in the statement of assets and liabilities.
| | |
| 30 | AB CONCENTRATED INTERNATIONAL GROWTH PORTFOLIO | | abfunds.com |
NOTES TO FINANCIAL STATEMENTS (continued)
All derivatives held at period end were subject to netting arrangements. The following table presents the Fund’s derivative assets and liabilities by counterparty net of amounts available for offset under Master Agreements (“MA”) and net of the related collateral received/pledged by the Fund as of June 30, 2017:
| | | | | | | | | | | | | | | | | | | | |
Counterparty | | Derivative
Assets
Subject to
a MA | | | Derivative
Available
for Offset | | | Cash
Collateral
Received | | | Security
Collateral
Received | | | Net Amount
of Derivatives
Assets | |
OTC Derivatives: | |
Barclays Bank PLC | | $ | 21,991 | | | $ | – 0 | – | | $ | – 0 | – | | $ | – 0 | – | | $ | 21,991 | |
Citibank, NA | | | 12,427 | | | | – 0 | – | | | – 0 | – | | | – 0 | – | | | 12,427 | |
Royal Bank of Scotland PLC | | | 2,260 | | | | (2,260 | ) | | | – 0 | – | | | – 0 | – | | | – 0 | – |
State Street Bank & Trust Co. | | | 34,022 | | | | (21,945 | ) | | | – 0 | – | | | – 0 | – | | | 12,077 | |
UBS AG | | | 17,691 | | | | – 0 | – | | | – 0 | – | | | – 0 | – | | | 17,691 | |
| | | | | | | | | | | | | | | | | | | | |
Total | | $ | 88,391 | | | $ | (24,205 | ) | | $ | – 0 | – | | $ | – 0 | – | | $ | 64,186 | ^ |
| | | | | | | | | | | | | | | | | | | | |
| | | | | |
Counterparty | | Derivative
Liabilities
Subject to
a MA | | | Derivative
Available
for Offset | | | Cash
Collateral
Pledged | | | Security
Collateral
Pledged | | | Net Amount
of Derivatives
Liabilities | |
OTC Derivatives: | |
Bank of America, NA | | $ | 6,918 | | | $ | – 0 | – | | $ | – 0 | – | | $ | – 0 | – | | $ | 6,918 | |
Royal Bank of Scotland PLC | | | 35,528 | | | | (2,260 | ) | | | – 0 | – | | | – 0 | – | | | 33,268 | |
State Street Bank & Trust Co. | | | 21,945 | | | | (21,945 | ) | | | – 0 | – | | | – 0 | – | | | – 0 | – |
| | | | | | | | | | | | | | | | | | | | |
Total | | $ | 64,391 | | | $ | (24,205 | ) | | $ | – 0 | – | | $ | – 0 | – | | $ | 40,186 | ^ |
| | | | | | | | | | | | | | | | | | | | |
| ^ | Net amount represents the net receivable/payable that would be due from/to the counterparty in the event of default or termination. The net amount from OTC financial derivative instruments can only be netted across transactions governed under the same master agreement with the same counterparty. |
2. Currency Transactions
The Fund may invest in non-U.S. Dollar-denominated securities on a currency hedged or unhedged basis. The Fund may seek investment opportunities by taking long or short positions in currencies through the use of currency-related derivatives, including forward currency exchange contracts, futures and options on futures, swaps, and other options. The Fund may enter into transactions for investment opportunities when it anticipates that a foreign currency will appreciate or depreciate in value but securities
| | |
| abfunds.com | | AB CONCENTRATED INTERNATIONAL GROWTH PORTFOLIO | 31 |
NOTES TO FINANCIAL STATEMENTS (continued)
denominated in that currency are not held by the Fund and do not present attractive investment opportunities. Such transactions may also be used when the Adviser believes that it may be more efficient than a direct investment in a foreign currency-denominated security. The Fund may also conduct currency exchange contracts on a spot basis (i.e., for cash at the spot rate prevailing in the currency exchange market for buying or selling currencies).
NOTE E
Capital Stock
Each class consists of 1,000,000,000 authorized shares. Transactions in capital shares for each class were as follows:
| | | | | | | | | | | | | | | | | | | | | | | | |
| | | | | | | | | | | | | | | | | | | | | | | | |
| | | Shares | | | | | | Amount | | | | |
| | | Year Ended
June 30,
2017 | | | Year Ended
June 30,
2016 | | | | | | Year Ended
June 30,
2017 | | | Year Ended
June 30,
2016 | | | | |
| | | | | | | | |
| Class A | | | | | |
Shares sold | | | – 0 | –(a) | | | – 0 | – | | | | | | $ | 4 | | | $ | – 0 | – | | | | |
| | | | | |
Net increase | | | – 0 | – | | | – 0 | – | | | | | | $ | 4 | | | $ | – 0 | – | | | | |
| | | | | |
| | | | | | | | | | | | | | | | | | | | | | | | |
| Class C | | | | | |
Shares sold | | | 1,736 | | | | – 0 | – | | | | | | $ | 18,211 | | | $ | – 0 | – | | | | |
| | | | | |
Net increase | | | 1,736 | | | | – 0 | – | | | | | | $ | 18,211 | | | $ | – 0 | – | | | | |
| | | | | |
| | | | | | | | | | | | | | | | | | | | | | | | |
| Advisor Class | | | | | |
Shares sold | | | 3,352,888 | | | | – 0 | – | | | | | | $ | 30,997,232 | | | $ | – 0 | – | | | | |
| | | | | |
Shares redeemed | | | (449,450 | ) | | | – 0 | – | | | | | | | (4,620,224 | ) | | | – 0 | – | | | | |
| | | | | |
Net increase | | | 2,903,438 | | | | – 0 | – | | | | | | $ | 26,377,008 | | | $ | – 0 | – | | | | |
| | | | | |
| (a) | Share amount is less than one full share. |
At June 30, 2017, a shareholder of the Fund owned 96% of the Fund’s outstanding shares. Significant transactions by such shareholder, if any, may impact the Fund’s performance.
NOTE F
Risks Involved in Investing in the Fund
Foreign (Non-U.S.) Risk—Investments in securities of non-U.S. issuers may involve more risk than those of U.S. issuers. These securities may fluctuate more widely in price and may be less liquid due to adverse market, economic, political, regulatory or other factors.
Emerging Market Risk—Investments in emerging market countries may have more risk because the markets are less developed and less liquid as well as being subject to increased economic, political, regulatory or other uncertainties.
| | |
| 32 | AB CONCENTRATED INTERNATIONAL GROWTH PORTFOLIO | | abfunds.com |
NOTES TO FINANCIAL STATEMENTS (continued)
Currency Risk—Fluctuations in currency exchange rates may negatively affect the value of the Fund’s investments or reduce its returns.
Focused Portfolio Risk—The Fund may have more risk because it is “non-diversified,” meaning that it can invest more of the Fund’s assets in a smaller number of issuers. Accordingly, changes in the value of a single security may have a more significant effect, either negative or positive, on the Fund’s net asset value, or NAV.
Sector Risk—The Fund may have more risk because of concentrated investments in a particular market sector, such as the technology or financial services sector. Market or economic factors affecting that sector could have a major effect on the value of the Fund’s investments.
Capitalization Risk—Investments in mid-capitalization companies may be more volatile than investments in large-capitalization companies. Investments in mid-capitalization companies may have additional risks because these companies have limited product lines, markets or financial resources.
Indemnification Risk—In the ordinary course of business, the Fund enters into contracts that contain a variety of indemnifications. The Fund’s maximum exposure under these arrangements is unknown. However, the Fund has not had prior claims or losses pursuant to these indemnification provisions and expects the risk of loss thereunder to be remote. Therefore, the Fund has not accrued any liability in connection with these indemnification provisions.
NOTE G
Joint Credit Facility
A number of open-end mutual funds managed by the Adviser, including the Fund, participate in a $280 million revolving credit facility (the “Facility”) intended to provide short-term financing, if necessary, subject to certain restrictions in connection with abnormal redemption activity. Commitment fees related to the Facility are paid by the participating funds and are included in miscellaneous expenses in the statement of operations. The Fund did not utilize the Facility during the year ended June 30, 2017.
NOTE H
Distributions to Shareholders
The tax character of distributions paid during the fiscal years ended June 30, 2017 and June 30, 2016 were as follows:
| | | | | | | | |
| | | 2017 | | | 2016 | |
Distributions paid from: | | | | | | | | |
Ordinary income | | $ | 14,008 | | | $ | 3,667 | |
| | | | | | | | |
Total taxable distributions paid | | $ | 14,008 | | | $ | 3,667 | |
| | | | | | | | |
| | |
| abfunds.com | | AB CONCENTRATED INTERNATIONAL GROWTH PORTFOLIO | 33 |
NOTES TO FINANCIAL STATEMENTS (continued)
As of June 30, 2017, the components of accumulated earnings/(deficit) on a tax basis were as follows:
| | | | |
Undistributed ordinary income | | $ | 740,407 | |
Accumulated capital and other losses | | | – 0 | –(a) |
Unrealized appreciation/(depreciation) | | | 3,508,472 | (b) |
| | | | |
Total accumulated earnings/(deficit) | | $ | 4,248,879 | |
| | | | |
| (a) | During the fiscal year, the Fund utilized $84,433 of capital loss carry forwards to offset current year net realized gains. |
| (b) | The difference between book-basis and tax-basis unrealized appreciation/(depreciation) is attributable primarily to the tax deferral of losses on wash sales, and the recognition for tax purposes of unrealized gains/losses on certain derivative instruments. |
For tax purposes, net realized capital losses may be carried over to offset future capital gains, if any. Funds are permitted to carry forward capital losses for an indefinite period, and such losses will retain their character as either short-term or long-term capital losses. As of June 30, 2017, the Fund did not have any capital loss carryforwards.
During the current fiscal year, permanent differences primarily due to foreign currency reclassifications resulted in a net increase in undistributed net investment income, and a net decrease in accumulated net realized gain on investment and foreign currency transactions. These reclassifications had no effect on net assets.
NOTE I
Other
In October 2016, the U.S. Securities and Exchange Commission adopted new rules and amended existing rules (together, “final rules”) intended to modernize the reporting and disclosure of information by registered investment companies. In part, the final rules amend Regulation S-X and require standardized, enhanced disclosure about derivatives in investment company financial statements, as well as other amendments. The compliance date for the amendments to Regulation S-X is August 1, 2017 (for reporting period end dates of August 31, 2017 or after). Management has evaluated the impact of the amendments and expects the effect of the adoption of the final rules on financial statements will be limited to additional disclosures.
NOTE J
Subsequent Events
Management has evaluated subsequent events for possible recognition or disclosure in the financial statements through the date the financial statements are issued. Management has determined that there are no material events that would require disclosure in the Fund’s financial statements through this date.
| | |
| 34 | AB CONCENTRATED INTERNATIONAL GROWTH PORTFOLIO | | abfunds.com |
FINANCIAL HIGHLIGHTS
Selected Data For A Share Of Capital Stock Outstanding Throughout Each Period
| | | | | | | | | | | | |
| | | Class A | |
| | | Year Ended June 30, | | | April 15,
2015(a) to
June 30, 2015 | |
| | | 2017 | | | 2016 | | |
| | | | |
| | | | | | | | | | | | |
Net asset value, beginning of period | | | $ 8.46 | | | | $ 9.77 | | | | $ 10.00 | |
| | | | |
Income From Investment Operations | | | | | | | | | | | | |
Net investment income(b)(c) | | | .05 | | | | .03 | | | | .03 | |
Net realized and unrealized gain (loss) on investment transactions and foreign currency | | | 2.04 | | | | (1.34 | ) | | | (.26 | ) |
| | | | |
Net increase (decrease) in net asset value from operations | | | 2.09 | | | | (1.31 | ) | | | (.23 | ) |
| | | | |
Less: Dividends and Distributions | | | | | | | | | | | | |
Dividends from net investment income | | | (.05 | ) | | | (.00 | )(d) | | | – 0 | – |
Distributions from net realized gain on investment transactions | | | – 0 | – | | | (.00 | )(d) | | | – 0 | – |
| | | | |
Total dividends and distributions | | | (.05 | ) | | | – 0 | – | | | – 0 | – |
| | | | |
Net asset value, end of period | | | $ 10.50 | | | | $ 8.46 | | | | $ 9.77 | |
| | | | |
Total Return | | | | | | | | | | | | |
Total investment return based on net asset value(e) | | | 24.83 | % | | | (13.39 | )% | | | (2.30 | )% |
Ratios/Supplemental Data | | | | | | | | | | | | |
Net assets, end of period (000’s omitted) | | | $11 | | | | $9 | | | | $10 | |
Ratio to average net assets of: | | | | | | | | | | | | |
Expenses, net of waivers/reimbursements(f) | | | 1.29 | % | | | 1.30 | % | | | 1.30 | %^ |
Expenses, before waivers/reimbursements(f) | | | 8.96 | % | | | 17.79 | % | | | 18.01 | %^ |
Net investment income(c) | | | .54 | % | | | .34 | % | | | 1.58 | %^ |
Portfolio turnover rate | | | 66 | % | | | 42 | % | | | 2 | % |
See footnote summary on page 37.
| | |
| abfunds.com | | AB CONCENTRATED INTERNATIONAL GROWTH PORTFOLIO | 35 |
FINANCIAL HIGHLIGHTS (continued)
Selected Data For A Share Of Capital Stock Outstanding Throughout Each Period
| | | | | | | | | | | | |
| | | Class C | |
| | | Year Ended June 30, | | | April 15,
2015(a) to June 30, 2015 | |
| | | 2017 | | | 2016 | | |
| | | | |
| | | | | | | | | | | | |
Net asset value, beginning of period | | | $ 8.39 | | | | $ 9.75 | | | | $ 10.00 | |
| | | | |
Income From Investment Operations | | | | | | | | | | | | |
Net investment income (loss)(b)(c) | | | (.02 | ) | | | (.04 | ) | | | .02 | |
Net realized and unrealized gain (loss) on investment transactions and foreign currency | | | 2.02 | | | | (1.32 | ) | | | (.27 | ) |
| | | | |
Net increase (decrease) in net asset value from operations | | | 2.00 | | | | (1.36 | ) | | | (.25 | ) |
| | | | |
Less: Distributions | | | | | | | | | | | | |
Distributions from net realized gain on investment transactions | | | – 0 | – | | | (.00 | )(d) | | | – 0 | – |
| | | | |
Net asset value, end of period | | | $ 10.39 | | | | $ 8.39 | | | | $ 9.75 | |
| | | | |
Total Return | | | | | | | | | | | | |
Total investment return based on net asset value(e) | | | 23.84 | % | | | (13.93 | )% | | | (2.50 | )% |
Ratios/Supplemental Data | | | | | | | | | | | | |
Net assets, end of period (000’s omitted) | | | $28 | | | | $8 | | | | $9 | |
Ratio to average net assets of: | | | | | | | | | | | | |
Expenses, net of waivers/reimbursements(f) | | | 2.04 | % | | | 2.05 | % | | | 2.05 | %^ |
Expenses, before waivers/reimbursements(f) | | | 9.39 | % | | | 18.58 | % | | | 18.73 | %^ |
Net investment income (loss)(c) | | | (.20 | )% | | | (.43 | )% | | | .81 | %^ |
Portfolio turnover rate | | | 66 | % | | | 42 | % | | | 2 | % |
See footnote summary on page 37.
| | |
| 36 | AB CONCENTRATED INTERNATIONAL GROWTH PORTFOLIO | | abfunds.com |
FINANCIAL HIGHLIGHTS (continued)
Selected Data For A Share Of Capital Stock Outstanding Throughout Each Period
| | | | | | | | | | | | |
| | | Advisor Class | |
| | | Year Ended June 30, | | | April 15,
2015(a) to
June 30, 2015 | |
| | | 2017 | | | 2016 | | |
| | | | |
| | | | | | | | | | | | |
Net asset value, beginning of period | | | $ 8.47 | | | | $ 9.77 | | | | $ 10.00 | |
| | | | |
Income From Investment Operations | | | | | | | | | | | | |
Net investment income(b)(c) | | | .20 | | | | .05 | | | | .04 | |
Net realized and unrealized gain (loss) on investment transactions and foreign currency | | | 1.91 | | | | (1.33 | ) | | | (.27 | ) |
| | | | |
Net increase (decrease) in net asset value from operations | | | 2.11 | | | | (1.28 | ) | | | (.23 | ) |
| | | | |
Less: Dividends and Distributions | | | | | | | | | | | | |
Dividends from net investment income | | | (.07 | ) | | | (.02 | ) | | | – 0 | – |
Distributions from net realized gain on investment transactions | | | – 0 | – | | | (.00 | )(d) | | | – 0 | – |
| | | | |
Total dividends and distributions | | | (.07 | ) | | | (.02 | ) | | | – 0 | – |
| | | | |
Net asset value, end of period | | | $ 10.51 | | | | $ 8.47 | | | | $ 9.77 | |
| | | | |
Total Return | | | | | | | | | | | | |
Total investment return based on net asset value(e) | | | 25.12 | % | | | (13.13 | )% | | | (2.30 | )% |
Ratios/Supplemental Data | | | | | | | | | | | | |
Net assets, end of period (000’s omitted) | | | $32,602 | | | | $1,678 | | | | $1,935 | |
Ratio to average net assets of: | | | | | | | | | | | | |
Expenses, net of waivers/reimbursements(f) | | | 1.04 | % | | | 1.05 | % | | | 1.05 | %^ |
Expenses, before waivers/reimbursements(f) | | | 3.75 | % | | | 17.53 | % | | | 17.75 | %^ |
Net investment income(c) | | | 2.04 | % | | | .58 | % | | | 1.81 | %^ |
Portfolio turnover rate | | | 66 | % | | | 42 | % | | | 2 | % |
| (a) | Commencement of operations. |
| (b) | Based on average shares outstanding. |
| (c) | Net of expenses waived and reimbursed by the Adviser. |
| (d) | Amount is less than $.005. |
| (e) | Total investment return is calculated assuming an initial investment made at the net asset value at the beginning of the period, reinvestment of all dividends and distributions at net asset value during the period, and redemption on the last day of the period. Initial sales charges or contingent deferred sales charges are not reflected in the calculation of total investment return. Total return does not reflect the deduction of taxes that a shareholder would pay on fund distributions or the redemption of fund shares. Total investment return calculated for a period of less than one year is not annualized. |
| (f) | In connection with the Fund’s investments in affiliated underlying portfolios, the Fund incurs no direct expenses, but bears proportionate shares of the acquired fund fees and expenses (i.e., operating, administrative and investment advisory fees) of the affiliated underlying portfolios. The Adviser has voluntarily agreed to waive its fees from the Fund in an amount equal to the Fund’s pro rata share of certain acquired fund fees and expenses, and for the year ended June 30, 2017, such waiver amounted to 0.01% annualized for the Fund. |
See notes to financial statements.
| | |
| abfunds.com | | AB CONCENTRATED INTERNATIONAL GROWTH PORTFOLIO | 37 |
REPORT OF INDEPENDENT REGISTERED
PUBLIC ACCOUNTING FIRM
To the Board of Directors and the Shareholders of
AB Concentrated International Growth Fund
We have audited the accompanying statement of assets and liabilities, including the portfolio of investments, of AB Concentrated International Growth Fund (the “Fund”), one of the funds constituting the AB Cap Fund, Inc., as of June 30, 2017, and the related statement of operations for the year then ended, the statements of changes in net assets for each of the two years in the period then ended, and the financial highlights for each of the two years in the period then ended and the period April 15, 2015 (commencement of operations) to June 30, 2015. These financial statements and financial highlights are the responsibility of the Fund’s management. Our responsibility is to express an opinion on these financial statements and financial highlights based on our audits.
We conducted our audits in accordance with the standards of the Public Company Accounting Oversight Board (United States). Those standards require that we plan and perform the audit to obtain reasonable assurance about whether the financial statements and financial highlights are free of material misstatement. We were not engaged to perform an audit of the Fund’s internal control over financial reporting. Our audits included consideration of internal control over financial reporting as a basis for designing audit procedures that are appropriate in the circumstances, but not for the purpose of expressing an opinion on the effectiveness of the Fund’s internal control over financial reporting. Accordingly, we express no such opinion. An audit also includes examining, on a test basis, evidence supporting the amounts and disclosures in the financial statements and financial highlights, assessing the accounting principles used and significant estimates made by management, and evaluating the overall financial statement presentation. Our procedures included confirmation of securities owned as of June 30, 2017 by correspondence with the custodian and others or by other appropriate auditing procedures where replies from others were not received. We believe that our audits provide a reasonable basis for our opinion.
In our opinion, the financial statements and financial highlights referred to above present fairly, in all material respects, the financial position of AB Concentrated International Growth Fund, one of the funds constituting the AB Cap Fund, Inc., at June 30, 2017, the results of its operations for the year then ended, the changes in its net assets for each of the two years in the period then ended, and the financial highlights for each of the two years in the period then ended and the period April 15, 2015 (commencement of operations) to June 30, 2015, in conformity with U.S. generally accepted accounting principles.

New York, New York
August 25, 2017
| | |
| 38 | AB CONCENTRATED INTERNATIONAL GROWTH PORTFOLIO | | abfunds.com |
2017 FEDERAL TAX INFORMATION
(unaudited)
For Federal income tax purposes, the following information is furnished with respect to the earnings of the Fund for the taxable period ended June 30, 2017. For such taxable period, the Fund designates 64.30% as the maximum amount that may be considered qualified dividend income for individual shareholders.
Shareholders should not use the above information to prepare their income tax returns. The information necessary to complete your income tax returns will be included with your Form 1099-DIV which will be sent to you separately in January 2018.
| | |
| abfunds.com | | AB CONCENTRATED INTERNATIONAL GROWTH PORTFOLIO | 39 |
BOARD OF DIRECTORS
| | |
Marshall C. Turner, Jr.(1) , Chairman John H. Dobkin(1) Michael J. Downey(1) William H. Foulk, Jr.(1) D. James Guzy(1) | | Nancy P. Jacklin(1) Robert M. Keith, President and Chief Executive Officer Carol C. McMullen(1) Garry L. Moody(1) Earl D. Weiner(1) |
OFFICERS
| | |
Philip L. Kirstein, Senior Vice President and Independent Compliance Officer Dev Chakrabarti(2), Vice President Mark Phelps(2), Vice President | | Emilie D. Wrapp, Secretary Joseph J. Mantineo, Treasurer and Chief Financial Officer Phyllis J. Clarke, Controller Vincent S. Noto, Chief Compliance Officer |
| | |
Custodian and Accounting Agent State Street Bank and Trust Company State Street Corporation CCB/5 1 Iron Street Boston, MA 02210 Principal Underwriter AllianceBernstein Investments, Inc. 1345 Avenue of the Americas New York, NY 10105 Transfer Agent AllianceBernstein Investor Services, Inc. P.O. Box 786003 San Antonio, TX 78278-6003 Toll-Free (800) 221-5672 | | Independent Registered Public Accounting Firm Ernst & Young LLP 5 Times Square New York, NY 10036 Legal Counsel Seward & Kissel LLP One Battery Park Plaza New York, NY 10004 |
| 1 | Member of the Audit Committee, the Governance and Nominating Committee and the Independent Directors Committee. |
| 2 | The day-to-day management of, and investment decisions for, the Fund’s Portfolio are made by the Investment Policy Team. Messrs. Phelps and Chakrabarti are the persons with the most significant responsibility for day-to-day management of the Fund’s Portfolio |
| | |
| 40 | AB CONCENTRATED INTERNATIONAL GROWTH PORTFOLIO | | abfunds.com |
MANAGEMENT OF THE FUND
| | | | | | | | |
NAME,
ADDRESS*, AGE,
(YEAR FIRST ELECTED**) | | PRINCIPAL
OCCUPATION(S)
DURING PAST FIVE YEARS
AND OTHER
INFORMATION*** | | PORTFOLIOS
IN FUND
COMPLEX
OVERSEEN BY
DIRECTOR | | | OTHER PUBLIC COMPANY
DIRECTORSHIPS
CURRENTLY HELD BY
DIRECTOR |
| INTERESTED DIRECTOR | | | | | | | | |
Robert M. Keith, #
1345 Avenue of the Americas
New York, NY 10105
57
(2015) | | Senior Vice President of AllianceBernstein L.P. (the “Adviser”) and the head of AllianceBernstein Investments, Inc. (“ABI”) since July 2008; Director of ABI and President of the AB Mutual Funds. Previously, he served as Executive Managing Director of ABI from December 2006 to June 2008. Prior to joining ABI in 2006, Executive Managing Director of Bernstein Global Wealth Management, and prior thereto, Senior Managing Director and Global Head of Client Service and Sales of the Adviser’s institutional investment management business since 2004. Prior thereto, he was Managing Director and Head of North American Client Service and Sales in the Adviser’s institutional investment management business, with which he had been associated since prior to 2004. | | | 97 | | | None |
| | | | | | | | |
| | |
| abfunds.com | | AB CONCENTRATED INTERNATIONAL GROWTH PORTFOLIO | 41 |
MANAGEMENT OF THE FUND (continued)
| | | | | | | | |
NAME,
ADDRESS*, AGE,
(YEAR FIRST ELECTED**) | | PRINCIPAL
OCCUPATION(S)
DURING PAST FIVE YEARS
AND OTHER
INFORMATION*** | | PORTFOLIOS
IN FUND
COMPLEX
OVERSEEN BY
DIRECTOR | | | OTHER PUBLIC COMPANY
DIRECTORSHIPS
CURRENTLY HELD BY
DIRECTOR |
| DISINTERESTED DIRECTORS | | | | | | |
Marshall C. Turner, Jr., ## Chairman of the Board 75 (2015) | | Private Investor since prior to 2012. Former Chairman and CEO of Dupont Photomasks, Inc. (components of semi-conductor manufacturing). He has extensive operating leadership and venture capital investing experience, including five interim or full-time CEO roles, and prior service as general partner of institutional venture capital partnerships. He also has extensive non-profit board leadership experience, and currently serves on the boards of two education and science-related non-profit organizations. He has served as a director of one AB Fund since 1992, and director or trustee of multiple AB Funds since 2005. He has been Chairman of the AB Funds since January 2014, and the Chairman of the Independent Directors Committees of such Funds since February 2014. | | | 97 | | | Xilinx, Inc. (programmable logic semi-conductors) since 2007 |
| | | | | | | | |
John H. Dobkin, ## 75 (2015) | | Independent Consultant since prior to 2012. Formerly, President of Save Venice, Inc. (preservation organization) from 2001-2002; Senior Advisor from June 1999-June 2000 and President of Historic Hudson Valley (historic preservation) from December 1989-May 1999. Previously, Director of the National Academy of Design. He has served as a director or trustee of various AB Funds since 1992, and as Chairman of the Audit Committees of a number of such Funds from 2001-2008. | | | 96 | | | None |
| | | | | | | | |
| | |
| 42 | AB CONCENTRATED INTERNATIONAL GROWTH PORTFOLIO | | abfunds.com |
MANAGEMENT OF THE FUND (continued)
| | | | | | | | |
NAME,
ADDRESS*, AGE,
(YEAR FIRST ELECTED**) | | PRINCIPAL
OCCUPATION(S)
DURING PAST FIVE YEARS
AND OTHER
INFORMATION*** | | PORTFOLIOS
IN FUND
COMPLEX
OVERSEEN BY
DIRECTOR | | | OTHER PUBLIC COMPANY
DIRECTORSHIPS
CURRENTLY HELD BY
DIRECTOR |
DISINTERESTED DIRECTORS (continued) | | | | | | |
Michael J. Downey, ## 73 (2015) | | Private Investor since prior to 2012. Formerly, managing partner of Lexington Capital, LLC (investment advisory firm) from December 1997 until December 2003. He served as a Director of Prospect Acquisition Corp. (financial services) from 2007 until 2009. From 1987 until 1993, Chairman and CEO of Prudential Mutual Fund Management, director of the Prudential mutual funds, and member of the Executive Committee of Prudential Securities Inc. He has served as a director or trustee of the AB Funds since 2005 and is a director and Chairman of one other registered investment company. | | | 97 | | | The Asia Pacific Fund, Inc. (registered investment company) since prior to 2012 |
| | | | | | | | |
William H. Foulk, Jr., ## 84 (2015) | | Investment Adviser and an Independent Consultant since prior to 2012. Previously, he was Senior Manager of Barrett Associates, Inc., a registered investment adviser. He was formerly Deputy Comptroller and Chief Investment Officer of the State of New York and, prior thereto, Chief Investment Officer of the New York Bank for Savings. He has served as a director or trustee of various AB Funds since 1983, and was Chairman of the Independent Directors Committees of the AB Funds from 2003 until early February 2014. He served as Chairman of such AB Funds from 2003 through December 2013. He is also active in a number of mutual fund related organizations and committees. | | | 97 | | | None |
| | |
| abfunds.com | | AB CONCENTRATED INTERNATIONAL GROWTH PORTFOLIO | 43 |
MANAGEMENT OF THE FUND (continued)
| | | | | | | | |
NAME,
ADDRESS*, AGE,
(YEAR FIRST ELECTED**) | | PRINCIPAL
OCCUPATION(S)
DURING PAST FIVE YEARS
AND OTHER
INFORMATION*** | | PORTFOLIOS
IN FUND
COMPLEX
OVERSEEN BY
DIRECTOR | | | OTHER PUBLIC COMPANY
DIRECTORSHIPS
CURRENTLY HELD BY
DIRECTOR |
DISINTERESTED DIRECTORS (continued) | | | | | | |
D. James Guzy, ## 81 (2015) | | Chairman of the Board of SRC Computers, Inc. (semi-conductors), with which he has been associated since prior to 2012. He served as Chairman of the Board of PLX Technology (semi-conductors) since prior to 2010 until November 2013. He was a Director of Intel Corporation (semi-conductors) from 1969 until 2008, and served as Chairman of the Finance Committee of such company for several years until May 2008. He has served as a director or trustee of one or more of the AB Funds since 1982. | | | 94 | | | None |
| | | | | | | | |
Nancy P. Jacklin, ## 69 (2015) | | Private Investor since prior to 2012. Professorial Lecturer at the Johns Hopkins School of Advanced International Studies (2008-2015). U.S. Executive Director of the International Monetary Fund (which is responsible for ensuring the stability of the international monetary system), (December 2002-May 2006); Partner, Clifford Chance (1992-2002); Sector Counsel, International Banking and Finance, and Associate General Counsel, Citicorp (1985-1992); Assistant General Counsel (International), Federal Reserve Board of Governors (1982-1985); and Attorney Advisor, U.S. Department of the Treasury (1973-1982). Member of the Bar of the District of Columbia and of New York; and member of the Council on Foreign Relations. She has served as a director or trustee of the AB Funds since 2006 and has been Chairman of the Governance and Nominating Committees of the AB Funds since August 2014. | | | 97 | | | None |
| | |
| 44 | AB CONCENTRATED INTERNATIONAL GROWTH PORTFOLIO | | abfunds.com |
MANAGEMENT OF THE FUND (continued)
| | | | | | | | |
NAME,
ADDRESS*, AGE,
(YEAR FIRST ELECTED**) | | PRINCIPAL
OCCUPATION(S)
DURING PAST FIVE YEARS
AND OTHER
INFORMATION*** | | PORTFOLIOS
IN FUND
COMPLEX
OVERSEEN BY
DIRECTOR | | | OTHER PUBLIC COMPANY
DIRECTORSHIPS
CURRENTLY HELD BY
DIRECTOR |
DISINTERESTED DIRECTORS (continued) | | | | | | |
Carol C. McMullen, ## 62 (2016) | | Managing Director of Slalom Consulting (consulting) since 2014, private investor and member of the Partners Healthcare Investment Committee. Formerly, Director of Norfolk & Dedham Group (mutual property and casualty insurance) from 2011 until November 2016; Director of Partners Community Physicians Organization (healthcare) from 2014 until December 2016; and Managing Director of The Crossland Group (consulting) from 2012 until 2013. She has held a number of senior positions in the asset and wealth management industries, including at Eastern Bank (where her roles included President of Eastern Wealth Management), Thomson Financial (Global Head of Sales for Investment Management), and Putnam Investments (where her roles included Head of Global Investment Research). She has served on a number of private company and nonprofit boards, and as a director or trustee of the AB Funds since June 2016. | | | 97 | | | None |
| | |
| abfunds.com | | AB CONCENTRATED INTERNATIONAL GROWTH PORTFOLIO | 45 |
MANAGEMENT OF THE FUND (continued)
| | | | | | | | |
NAME,
ADDRESS*, AGE,
(YEAR FIRST ELECTED**) | | PRINCIPAL
OCCUPATION(S)
DURING PAST FIVE YEARS
AND OTHER
INFORMATION*** | | PORTFOLIOS
IN FUND
COMPLEX
OVERSEEN BY
DIRECTOR | | | OTHER PUBLIC COMPANY
DIRECTORSHIPS
CURRENTLY HELD BY
DIRECTOR |
DISINTERESTED DIRECTORS (continued) | | | | | | |
Garry L. Moody, ## 65 (2015) | | Independent Consultant. Formerly, Partner, Deloitte & Touche LLP (1995-2008) where he held a number of senior positions, including Vice Chairman, and U.S. and Global Investment Management Practice Managing Partner; President, Fidelity Accounting and Custody Services Company (1993-1995), where he was responsible for the accounting, pricing, custody and reporting for the Fidelity mutual funds; and Partner, Ernst & Young LLP (1975-1993), where he served as the National Director of Mutual Fund Tax Services and Managing Partner of its Chicago Office Tax department. He is a member of the Trustee Advisory Board of BoardIQ, a biweekly publication focused on issues and news affecting directors of mutual funds. He has served as a director or trustee, and as Chairman of the Audit Committees of the AB Funds since 2008. | | | 97 | | | None |
| | | | | | | | |
| | |
| 46 | AB CONCENTRATED INTERNATIONAL GROWTH PORTFOLIO | | abfunds.com |
MANAGEMENT OF THE FUND (continued)
| | | | | | | | |
NAME,
ADDRESS*, AGE,
(YEAR FIRST ELECTED**) | | PRINCIPAL
OCCUPATION(S)
DURING PAST FIVE YEARS
AND OTHER
INFORMATION*** | | PORTFOLIOS
IN FUND
COMPLEX
OVERSEEN BY
DIRECTOR | | | OTHER PUBLIC COMPANY
DIRECTORSHIPS
CURRENTLY HELD BY
DIRECTOR |
DISINTERESTED DIRECTORS (continued) | | | | | | |
Earl D. Weiner, ## 77 (2015) | | Of Counsel, and Partner prior to January 2007, of the law firm Sullivan & Cromwell LLP and is a former member of the ABA Federal Regulation of Securities Committee Task Force to draft editions of the Fund Director’s Guidebook. He also serves as a director or trustee of various non-profit organizations and has served as Chairman or Vice Chairman of a number of them. He has served as a director or trustee of the AB Funds since 2007 and served as Chairman of the Governance and Nominating Committees of the AB Funds from 2007 until August 2014. | | | 97 | | | None |
| * | The address for each of the Fund’s disinterested Directors is c/o AllianceBernstein L.P., Attention: Philip L. Kirstein, 1345 Avenue of the Americas, New York, NY 10105. |
| ** | There is no stated term of office for the Fund’s Directors. |
| *** | The information above includes each Director’s principal occupation during the last five years and other information relating to the experience, attributes and skills relevant to each Director’s qualifications to serve as a Director, which led to the conclusion that each Director should serve as a Director for the Fund. |
| # | Mr. Keith is an “interested person” of the Fund, as defined in the 1940 Act, due to his position as a Senior Vice President of the Adviser. |
| ## | Member of the Audit Committee, the Governance and Nominating Committee and the Independent Directors Committee. |
| | |
| abfunds.com | | AB CONCENTRATED INTERNATIONAL GROWTH PORTFOLIO | 47 |
MANAGEMENT OF THE FUND (continued)
Officer Information
Certain information concerning the Fund’s Officers is listed below.
| | | | |
NAME, ADDRESS*
AND AGE | | POSITION(S)
HELD WITH FUND | | PRINCIPAL OCCUPATION
DURING PAST 5 YEARS |
Robert M. Keith 57 | | President and Chief Executive Officer | | See biography above. |
| | | | |
Philip L. Kirstein 72 | | Senior Vice President and Independent Compliance Officer | | Senior Vice President and Independent Compliance Officer of the AB Funds, with which he has been associated since October 2004. Prior thereto, he was Of Counsel to Kirkpatrick & Lockhart, LLP from October 2003 to October 2004, and General Counsel of Merrill Lynch Investment Managers, L.P. since prior to March 2003. |
| | | | |
Mark Phelps 57 | | Vice President | | Senior Vice President of the Adviser**, and Chief Investment Officer of Concentrated Global Growth, with which he as been associated since December 2013. Prior thereto, he was President and managing director of Global Investments at W.P. Stewart & Co. (“WPS”) from September 2008 to June 2013. He also served as W.P. Stewart’s chief executive officer since prior to 2012. |
| | | | |
Debasashi (Dev) Chakrabarti 40 | | Vice President | | Senior Vice President of the Adviser and Portfolio Manager and Senior Research Analyst for Concentrated Global Growth. Prior to joining the Adviser in December 2013, he was a portfolio manager/analyst on the global equity research and portfolio-management team at WPS Advisors since prior to 2012. |
| | | | |
Emilie D. Wrapp, 61 | | Secretary | | Senior Vice President, Assistant General Counsel and Assistant Secretary of ABI,** with which she has been associated since prior to 2012. |
| | | | |
Joseph J. Mantineo, 58 | | Treasurer and Chief Financial Officer | | Senior Vice President of ABIS,** with which he has been associated since prior to 2012. |
| | | | |
Vincent S. Noto 52 | | Chief Compliance Officer | | Senior Vice President since 2015 and Mutual Fund Chief Compliance Officer of the Adviser** since 2014. Prior thereto, he was Vice President and Director of Mutual Fund Compliance of the Adviser** since prior to 2012. |
| | | | |
Phyllis J. Clarke, 56 | | Controller | | Vice President of ABIS,** with which she has been associated since prior to 2012. |
| * | The address for each of the Fund’s Officers is 1345 Avenue of the Americas, New York, NY 10105. |
| ** | The Fund’s Advisor, ABI and ABIS are affiliates of the fund. |
| | |
| 48 | AB CONCENTRATED INTERNATIONAL GROWTH PORTFOLIO | | abfunds.com |
MANAGEMENT OF THE FUND (continued)
The Fund’s Statement of Additional Information (“SAI”) has additional information about the Fund’s Directors and Officers and is available without charge upon request. Contact your financial representative at AB at 1-800-227-4618, or visit www.abfunds.com for a free prospectus or SAI.
| | |
| abfunds.com | | AB CONCENTRATED INTERNATIONAL GROWTH PORTFOLIO | 49 |
Information Regarding the Review and Approval of the Fund’s Advisory Agreement
The disinterested directors (the “directors”) of AB Cap Fund, Inc. (the “Company”) unanimously approved the continuance of the Company’s Advisory Agreement with the Adviser in respect of AB Concentrated International Growth Portfolio (the “Fund”) at a meeting held on May 2-4, 2017 (the “Meeting”).
Prior to approval of the continuance of the Advisory Agreement, the directors had requested from the Adviser, and received and evaluated, extensive materials. They reviewed the proposed continuance of the Advisory Agreement with the Adviser and with experienced counsel who are independent of the Adviser, who advised on the relevant legal standards. The directors also reviewed an independent evaluation prepared by the Company’s Senior Officer (who is also the Company’s Independent Compliance Officer), who acted as their independent fee consultant, of the reasonableness of the advisory fee, in which the Senior Officer concluded that the contractual fee for the Fund was reasonable. The directors also discussed the proposed continuance in private sessions with counsel and the Company’s Senior Officer.
The directors considered their knowledge of the nature and quality of the services provided by the Adviser to the Fund gained from their experience as directors or trustees of most of the registered investment companies advised by the Adviser, their overall confidence in the Adviser’s integrity and competence they have gained from that experience, the Adviser’s initiative in identifying and raising potential issues with the directors and its responsiveness, frankness and attention to concerns raised by the directors in the past, including the Adviser’s willingness to consider and implement organizational and operational changes designed to improve investment results and the services provided to the AB Funds. The directors noted that they have four regular meetings each year, at each of which they review extensive materials and information from the Adviser, including information on the investment performance of the Fund.
The directors also considered all factors they believed relevant, including the specific matters discussed below. During the course of their deliberations, the directors evaluated, among other things, the reasonableness of the advisory fee. The directors did not identify any particular information that was all-important or controlling, and different directors may have attributed different weights to the various factors. The directors determined that the selection of the Adviser to manage the Fund and the overall arrangements between the Fund and the Adviser, as provided in the Advisory Agreement, including the advisory fee, were fair and reasonable in light of the services performed, expenses incurred and such other matters as the directors considered relevant in the exercise of
| | |
| 50 | AB CONCENTRATED INTERNATIONAL GROWTH PORTFOLIO | | abfunds.com |
their business judgment. The material factors and conclusions that formed the basis for the directors’ determinations included the following:
Nature, Extent and Quality of Services Provided
The directors considered the scope and quality of services provided by the Adviser under the Advisory Agreement, including the quality of the investment research capabilities of the Adviser and the other resources it has dedicated to performing services for the Fund. They also noted the professional experience and qualifications of the Fund’s portfolio management team and other senior personnel of the Adviser. The directors also considered that the Advisory Agreement provides that the Fund will reimburse the Adviser for the cost to it of providing certain clerical, accounting, administrative and other services to the Fund by employees of the Adviser or its affiliates. Requests for these reimbursements are made on a quarterly basis and subject to approval by the directors. To date, the Adviser has not requested any reimbursements from the Fund. The directors noted that the methodology used to determine the reimbursement amounts had been reviewed by an independent consultant retained by the Company’s Senior Officer. The quality of administrative and other services, including the Adviser’s role in coordinating the activities of the Fund’s other service providers, also was considered. The directors concluded that, overall, they were satisfied with the nature, extent and quality of services provided to the Fund under the Advisory Agreement.
Costs of Services Provided and Profitability
The directors reviewed a schedule of the revenues and expenses and related notes indicating the profitability of the Fund to the Adviser for calendar years 2015 and 2016 that had been prepared with an expense allocation methodology arrived at in consultation with an independent consultant retained by the Company’s Senior Officer. The directors noted the assumptions and methods of allocation used by the Adviser in preparing fund-specific profitability data and understood that there are a number of potentially acceptable allocation methodologies for information of this type. The directors noted that the profitability information reflected all revenues and expenses of the Adviser’s relationship with the Fund, including those relating to its subsidiaries that provide transfer agency, distribution and brokerage services to the Fund. The directors recognized that it is difficult to make comparisons of the profitability of the Advisory Agreement with the profitability of advisory contracts for unaffiliated funds because comparative information is not generally publicly available and is affected by numerous factors. The directors focused on the profitability of the Adviser’s relationship with the Fund before taxes and distribution expenses. The directors noted that the Fund was not profitable to the Adviser in the period reviewed.
| | |
| abfunds.com | | AB CONCENTRATED INTERNATIONAL GROWTH PORTFOLIO | 51 |
Fall-Out Benefits
The directors considered the other benefits to the Adviser and its affiliates from their relationships with the Fund, including, but not limited to, benefits relating to soft dollar arrangements (whereby investment advisers receive brokerage and research services from brokers that execute agency transactions for their clients); 12b-1 fees and sales charges received by the Fund’s principal underwriter (which is a wholly owned subsidiary of the Adviser) in respect of certain classes of the Fund’s shares; brokerage commissions paid by the Fund to brokers affiliated with the Adviser; and transfer agency fees paid by the Fund to a wholly owned subsidiary of the Adviser. The directors recognized that the Fund’s unprofitability to the Adviser would be exacerbated without these benefits. The directors understood that the Adviser also might derive reputational and other benefits from its association with the Fund.
Investment Results
In addition to the information reviewed by the directors in connection with the Meeting, the directors receive detailed performance information for the Fund at each regular Board meeting during the year.
At the Meeting, the directors reviewed information prepared by an analytical service that is not affiliated with the Adviser (the “15(c) service provider”), showing the performance of the Class A Shares of the Fund against a peer group and a peer universe, and information prepared by the Adviser showing performance of the Class A Shares against a broad-based securities market index, in each case for the 1-year period ended February 28, 2017 and (in the case of comparisons with the broad-based securities market index) for the period from inception. Based on their review, and their discussion with the Adviser of the reasons for the Fund’s underperformance in certain periods, the directors concluded that the Fund’s investment performance was acceptable.
Advisory Fees and Other Expenses
The directors considered the advisory fee rate paid by the Fund to the Adviser and information prepared by the 15(c) service provider concerning advisory fee rates paid by other funds in the same category as the Fund at a common asset level. The directors recognized that it is difficult to make comparisons of advisory fees because there are variations in the services that are included in the fees paid by other funds. The directors compared the Fund’s contractual advisory fee rate with a peer group median.
The directors also considered the Adviser’s fee schedule for institutional clients pursuing a similar investment style. For this purpose, they reviewed the relevant advisory fee information from the Adviser’s Form ADV and the evaluation from the Company’s Senior Officer and noted the differences between the Fund’s fee schedule, on the one hand, and the institutional fee schedule and the schedule of fees charged to any offshore funds and
| | |
| 52 | AB CONCENTRATED INTERNATIONAL GROWTH PORTFOLIO | | abfunds.com |
any sub-advised funds, on the other. The directors noted that the Adviser may, in some cases, agree to fee rates with large institutional clients that are lower than those reviewed by the directors and that they had previously discussed with the Adviser its policies in respect of such arrangements.
The Adviser reviewed with the directors the significantly greater scope of the services it provides to the Fund relative to institutional, offshore fund and sub-advised fund clients. In light of the substantial differences in services rendered by the Adviser to institutional, offshore fund and sub-advised fund clients as compared to funds such as the Fund, the directors considered these fee comparisons inapt and did not place significant weight on them in their deliberations.
The directors noted that the Fund may invest in shares of exchange-traded funds (“ETFs”), subject to the restrictions and limitations of the Investment Company Act of 1940 as these may be varied as a result of exemptive orders issued by the SEC. The directors also noted that ETFs pay advisory fees pursuant to their advisory contracts. The directors concluded, based on the Adviser’s explanation of how it may use ETFs when they are the most cost-effective way to obtain desired exposures for a fund or to temporarily “equitize” cash inflows pending purchases of underlying securities, that the advisory fee for the Fund would be paid for services that would be in addition to, rather than duplicative of, the services provided under the advisory contracts of the ETFs.
The directors also considered the total expense ratio of the Class A shares of the Fund in comparison to a peer group and a peer universe selected by the 15(c) service provider. The Class A expense ratio of the Fund was based on the Fund’s latest fiscal year and the directors considered the effects of any fee waivers and/or expense reimbursements as a result of the Adviser’s expense cap. The directors noted that it was likely that the expense ratios of some of the other funds in the Fund’s category were lowered by waivers or reimbursements by those funds’ investment advisers, which in some cases might be voluntary or temporary. The directors view expense ratio information as relevant to their evaluation of the Adviser’s services because the Adviser is responsible for coordinating services provided to the Fund by others. Based on their review, the directors concluded that the Fund’s expense ratio was acceptable.
Economies of Scale
The directors noted that the advisory fee schedule for the Fund does not contain breakpoints and that they had discussed their strong preference for breakpoints in advisory contracts with the Adviser. The directors took into consideration prior presentations by an independent consultant on economies of scale in the mutual fund industry and for the AB Funds, and by the Adviser concerning certain of its views on economies of scale. The directors also had requested and received from the Adviser certain
| | |
| abfunds.com | | AB CONCENTRATED INTERNATIONAL GROWTH PORTFOLIO | 53 |
updates on economies of scale in advance of the Meeting. The directors believe that economies of scale may be realized (if at all) by the Adviser across a variety of products and services, and not only in respect of a single fund. The directors noted that there is no established methodology for setting breakpoints that give effect to the fund-specific services provided by a fund’s adviser and to the economies of scale that an adviser may realize in its overall mutual fund business or those components of it which directly or indirectly affect a fund’s operations. The directors observed that in the mutual fund industry as a whole, as well as among funds similar to the Fund, there is no uniformity or pattern in the fees and asset levels at which breakpoints (if any) apply. The directors also noted that the advisory agreements for many funds do not have breakpoints at all. The directors informed the Adviser that they would monitor the Fund’s assets (which were well below the level at which they would anticipate adding an initial breakpoint) and its profitability (currently unprofitable) to the Adviser and anticipated revisiting the question of breakpoints in the future if circumstances warranted doing so.
| | |
| 54 | AB CONCENTRATED INTERNATIONAL GROWTH PORTFOLIO | | abfunds.com |
This page is not part of the Shareholder Report or the Financial Statements.
AB FAMILY OF FUNDS
US EQUITY
US CORE
Core Opportunities Fund
Select US Equity Portfolio
US GROWTH
Concentrated Growth Fund
Discovery Growth Fund
Growth Fund
Large Cap Growth Fund
Small Cap Growth Portfolio
US VALUE
Discovery Value Fund
Equity Income Fund
Relative Value Fund1
Small Cap Value Portfolio
Value Fund
INTERNATIONAL/ GLOBAL EQUITY
INTERNATIONAL/ GLOBAL CORE
Global Core Equity Portfolio
International Portfolio
International Strategic Core Portfolio
Sustainable Global Thematic Fund1
Tax-Managed International Portfolio
Tax-Managed Wealth Appreciation Strategy
Wealth Appreciation Strategy
INTERNATIONAL/ GLOBAL GROWTH
Concentrated International Growth Portfolio
International Growth Fund
INTERNATIONAL/ GLOBAL EQUITY (continued)
INTERNATIONAL/ GLOBAL VALUE
Asia ex-Japan Equity Portfolio
International Value Fund
FIXED INCOME
MUNICIPAL
High Income Municipal Portfolio
Intermediate California Municipal Portfolio
Intermediate Diversified Municipal Portfolio
Intermediate New York Municipal Portfolio
Municipal Bond Inflation Strategy
Tax-Aware Fixed Income Portfolio
National Portfolio
Arizona Portfolio
California Portfolio
Massachusetts Portfolio
Minnesota Portfolio
New Jersey Portfolio
New York Portfolio
Ohio Portfolio
Pennsylvania Portfolio
Virginia Portfolio
TAXABLE
Bond Inflation Strategy
Global Bond Fund
High Income Fund
High Yield Portfolio
Income Fund
Intermediate Bond Portfolio
Limited Duration High Income Portfolio
Short Duration Portfolio
ALTERNATIVES
All Market Real Return Portfolio
Credit Long/Short Portfolio
Global Real Estate Investment Fund
Select US Long/Short Portfolio
Unconstrained Bond Fund
MULTI-ASSET
All Market Income Portfolio
All Market Total Return Portfolio1
Conservative Wealth Strategy
Emerging Markets Multi-Asset Portfolio
Global Risk Allocation Fund
Tax-Managed All Market Income Portfolio1
TARGET-DATE
Multi-Manager Select Retirement Allocation Fund
Multi-Manager Select 2010 Fund
Multi-Manager Select 2015 Fund
Multi-Manager Select 2020 Fund
Multi-Manager Select 2025 Fund
Multi-Manager Select 2030 Fund
Multi-Manager Select 2035 Fund
Multi-Manager Select 2040 Fund
Multi-Manager Select 2045 Fund
Multi-Manager Select 2050 Fund
Multi-Manager Select 2055 Fund
CLOSED-END FUNDS
Alliance California Municipal Income Fund
AllianceBernstein Global High Income Fund
AllianceBernstein National Municipal Income Fund
We also offer Government Exchange Reserves, which serves as the money market fund exchange vehicle for the AB mutual funds. An investment in Government Exchange Reserves is not a deposit in a bank and is not insured or guaranteed by the Federal Deposit Insurance Corporation or any other government agency. Although the Fund seeks to preserve the value of your investment at $1.00 per share, it is possible to lose money by investing in the Fund.
Investors should consider the investment objectives, risks, charges and expenses of the Fund carefully before investing. For copies of our prospectus or summary prospectus, which contain this and other information, visit us online at www.abfunds.com or contact your AB representative. Please read the prospectus and/or summary prospectus carefully before investing.
| 1 | Prior to November 1, 2016, Sustainable Global Thematic Fund was named Global Thematic Growth Fund; prior to January 9, 2017, Relative Value Fund was named Growth & Income Fund; prior to April 17, 2017, Tax-Managed All Market Income Portfolio was named Tax-Managed Balanced Wealth Strategy; prior to April 24, 2017, All Market Total Return Portfolio was named Balanced Wealth Strategy. |
| | |
| abfunds.com | | AB CONCENTRATED INTERNATIONAL GROWTH PORTFOLIO | 55 |
NOTES
| | |
| 56 | AB CONCENTRATED INTERNATIONAL GROWTH PORTFOLIO | | abfunds.com |
NOTES
| | |
| abfunds.com | | AB CONCENTRATED INTERNATIONAL GROWTH PORTFOLIO | 57 |
NOTES
| | |
| 58 | AB CONCENTRATED INTERNATIONAL GROWTH PORTFOLIO | | abfunds.com |
NOTES
| | |
| abfunds.com | | AB CONCENTRATED INTERNATIONAL GROWTH PORTFOLIO | 59 |
NOTES
| | |
| 60 | AB CONCENTRATED INTERNATIONAL GROWTH PORTFOLIO | | abfunds.com |

AB CONCENTRATED INTERNATIONAL GROWTH PORTFOLIO
1345 Avenue of the Americas
New York, NY 10105
800 221 5672
CIG-0151-0617 
JUN 06.30.17
ANNUAL REPORT
AB EMERGING MARKETS CORE PORTFOLIO


| | |
| |
| Investment Products Offered | | • Are Not FDIC Insured • May Lose Value • Are Not Bank Guaranteed |
Investors should consider the investment objectives, risks, charges and expenses of the Fund carefully before investing. For copies of our prospectus or summary prospectus, which contain this and other information, visit us online at www.abfunds.com or contact your AB representative. Please read the prospectus and/or summary prospectus carefully before investing.
This shareholder report must be preceded or accompanied by the Fund’s prospectus for individuals who are not current shareholders of the Fund.
You may obtain a description of the Fund’s proxy voting policies and procedures, and information regarding how the Fund voted proxies relating to portfolio securities during the most recent 12-month period ended June 30, without charge. Simply visit AB’s website at www.abfunds.com, or go to the Securities and Exchange Commission’s (the “Commission”) website at www.sec.gov, or call AB at (800) 227 4618.
The Fund files its complete schedule of portfolio holdings with the Commission for the first and third quarters of each fiscal year on Form N-Q. The Fund’s Forms N-Q are available on the Commission’s website at www.sec.gov. The Fund’s Forms N-Q may also be reviewed and copied at the Commission’s Public Reference Room in Washington, DC; information on the operation of the Public Reference Room may be obtained by calling (800) SEC 0330. AB publishes full portfolio holdings for the Fund monthly at www.abfunds.com.
AllianceBernstein Investments, Inc. (ABI) is the distributor of the AB family of mutual funds. ABI is a member of FINRA and is an affiliate of AllianceBernstein L.P., the Adviser of the funds.
The [A/B] logo is a registered service mark of AllianceBernstein and AllianceBernstein® is a registered service mark used by permission of the owner, AllianceBernstein L.P.
| | |
| FROM THE PRESIDENT | |  |
Dear Shareholder,
We are pleased to provide this report for AB Emerging Markets Core Portfolio (the “Fund”). Please review the discussion of Fund performance, the market conditions during the reporting period and the Fund’s investment strategy.
As always, AB strives to keep clients ahead of what’s next by:
| + | | Transforming uncommon insights into uncommon knowledge with a global research scope |
| + | | Navigating markets with seasoned investment experience and sophisticated solutions |
| + | | Providing thoughtful investment insights and actionable ideas |
Whether you’re an individual investor or a multi-billion-dollar institution, we put knowledge and experience to work for you.
AB’s global research organization connects and collaborates across platforms and teams to deliver impactful insights and innovative products. Better insights lead to better opportunities—anywhere in the world.
For additional information about AB’s range of products and shareholder resources, please log on to www.abfunds.com.
Thank you for your investment in the AB Mutual Funds.
Sincerely,

Robert M. Keith
President and Chief Executive Officer, AB Mutual Funds
| | |
| abfunds.com | | AB EMERGING MARKETS CORE PORTFOLIO | 1 |
ANNUAL REPORT
August 17, 2017
This report provides management’s discussion of fund performance for AB Emerging Markets Core Portfolio for the annual reporting period ended June 30, 2017.
The Fund’s investment objective is to seek long-term growth of capital.
NAV RETURNS AS OF JUNE 30, 2017 (unaudited)
| | | | | | | | |
| | | 6 Months | | | 12 Months | |
| AB EMERGING MARKETS CORE PORTFOLIO | | | | | | | | |
| Class A Shares | | | 19.45% | | | | 18.06% | |
| Class C Shares | | | 19.07% | | | | 17.24% | |
| Advisor Class Shares1 | | | 19.64% | | | | 18.43% | |
| MSCI EM Index | | | 18.43% | | | | 23.75% | |
| 1 | Please note that this share class is for investors purchasing shares through accounts established under certain fee-based programs sponsored and maintained by certain broker-dealers and financial intermediaries, institutional pension plans and/or investment advisory clients of, and certain other persons associated with, the Adviser and its affiliates or the Fund. |
Please keep in mind that high, double-digit returns are highly unusual and cannot be sustained. Investors should also be aware that these returns were primarily achieved during favorable market conditions.
INVESTMENT RESULTS
The table above shows the Fund’s performance compared to its benchmark, the Morgan Stanley Capital International Emerging Markets (“MSCI EM”) Index, for the six- and 12-month periods ended June 30, 2017.
All share classes of the Fund outperformed the benchmark for the six-month period, and underperformed for the 12-month period, before sales charges. For the 12-month period, sector selection was negative, particularly an underweight in the technology sector and an overweight in the consumer staples sector, versus the benchmark. Security selection in consumer discretionary and financials contributed to performance. An underweight to China detracted, while an underweight to South Africa contributed.
During the six-month period, strong security selection drove returns, while sector and currency selection were negative. Security selection in the consumer discretionary and financials sectors contributed to performance while security selection in real estate and utilities detracted. An underweight in the technology sector detracted while an underweight in consumer staples contributed. Country selection was positive, with an underweight to South Africa contributing, while an underweight to China detracted.
| | |
| 2 | AB EMERGING MARKETS CORE PORTFOLIO | | abfunds.com |
The Fund utilized derivatives in the form of stock index futures for hedging purposes, which added to absolute returns for both periods.
MARKET REVIEW AND INVESTMENT STRATEGY
Aside from a few fleeting downturns, global stocks surged during the 12-month period ended June 30, 2017. Emerging-market equities led the rally, recording material gains. Against the backdrop of a gradually improving global economy, geopolitical developments dominated headlines. The aftermath of the UK’s decision to leave the European Union (“Brexit”), Donald Trump’s surprising victory in the US presidential election and a resounding win by newly-elected French president Emmanuel Macron all impacted markets. Financial markets rallied on Trump’s win, though at times both policy risk and upheaval in the White House rattled investors. UK prime minister Theresa May further surprised markets when she called for a snap parliamentary election three years ahead of schedule in an effort to firm up the country’s mandate going into Brexit negotiations. The election increased political uncertainty when May’s Conservative Party failed to secure a majority position.
In emerging markets, Turkey held a constitutional referendum in April. The reforms, which were approved by a narrow majority of voters, granted the president sweeping powers, raising questions about checks and balances in that country. In Brazil, secret recordings emerged in which President Michel Temer appeared to be discussing a bribe. The allegations clouded Brazil’s ambitious reform prospects as President Temer attempts to fend off calls for his removal. On the other hand, Brazil’s economy appeared to be on course to recover from its recession. Index provider MSCI unveiled plans to gradually add mainland Chinese shares (A-shares) to the Emerging Markets Index beginning in 2018, after considering the inclusion for four years. The 222 large-cap stocks will initially represent less than 1% of the Emerging Markets Index benchmark.
The Fund’s Senior Investment Management Team (the “Team”) sees a diverse set of opportunities with companies benefiting from a range of trends, such as technological innovation, premiumization of consumption and changing behaviors of emerging-market consumers. The Team also looks for a range of well-operated businesses within emerging-market economies.
INVESTMENT POLICIES
At least 80% of the Fund’s net assets will under normal circumstances be invested in securities of emerging-market companies and related derivatives. Examples of emerging-market countries include Argentina, Brazil, Chile, Croatia, Egypt, Hong Kong, India, Indonesia, Kazakhstan, Malaysia, Mexico, the People’s Republic of China, Peru, the
(continued on next page)
| | |
| abfunds.com | | AB EMERGING MARKETS CORE PORTFOLIO | 3 |
Philippines, Poland, Russia, South Africa, Taiwan, Thailand, Turkey and Venezuela.
The Fund intends to invest primarily in equity securities, which will be selected by the Adviser using an investment philosophy that focuses on a combination of the stocks’ quality, stability and price. These factors will be evaluated based on the Adviser’s estimates of the companies’ future earnings power. The Adviser will employ a “bottom up” approach, primarily taking into account its research findings on specific companies and industries rather than broad economic forecasts. In allocating the Fund’s assets, the Adviser will consider such factors as the Fund’s current country exposure, the liquidity and volatility of the stock markets represented, the key economic characteristics of the countries, and transaction costs. The Fund has the flexibility to invest across the capitalization spectrum and may make significant investments in the securities of mid-capitalization and small-capitalization companies. The Fund is “non-diversified”, meaning that it can invest more of its assets in a smaller number of issuers.
Fluctuations in currency exchange rates can have a dramatic impact on the returns of equity securities. While the Adviser may hedge the foreign currency exposure resulting from the Fund’s security positions through the use of currency-related derivatives, it is not required to do so. The Fund may also take long and short positions in currencies (or related derivatives) independent of any such security positions, including taking a position in a currency when it does not hold any securities traded in that currency.
| | |
| 4 | AB EMERGING MARKETS CORE PORTFOLIO | | abfunds.com |
DISCLOSURES AND RISKS
Benchmark Disclosure
The MSCI EM Index is unmanaged and does not reflect fees and expenses associated with the active management of a mutual fund portfolio. MSCI EM Index (net, free float-adjusted, market-capitalization weighted) represents the equity market performance of emerging markets. MSCI makes no express or implied warranties or representations, and shall have no liability whatsoever with respect to any MSCI data contained herein. The MSCI data may not be further redistributed or used as a basis for other indices, any securities or financial products. This report is not approved, reviewed or produced by MSCI. An investor cannot invest directly in an index, and its results are not indicative of the performance for any specific investment, including the Fund.
A Word About Risk
Emerging Market Risk: Investments in emerging-market countries may have more risk because the markets are less developed and less liquid, and because these investments may be subject to increased economic, political, regulatory or other uncertainties.
Market Risk: The value of the Fund’s assets will fluctuate as the stock market fluctuates. The value of its investments may decline, sometimes rapidly and unpredictably, simply because of economic changes or other events that affect large portions of the market. It includes the risk that a particular style of investing may underperform the market generally.
Foreign (Non-US) Risk: Investments in securities of non-US issuers may involve more risk than those of US issuers. These securities may fluctuate more widely in price and may be less liquid due to adverse market, economic, political, regulatory or other factors.
Currency Risk: Fluctuations in currency exchange rates may negatively affect the value of the Fund’s investments or reduce its returns.
Capitalization Risk: Investments in small- and mid-capitalization companies may be more volatile than investments in large-capitalization companies. Investments in small-capitalization companies may have additional risks because these companies have limited product lines, markets or financial resources.
Derivatives Risk: Derivatives may be illiquid, difficult to price, and leveraged so that small changes may produce disproportionate losses for the Fund, and may be subject to counterparty risk to a greater degree than more traditional investments.
Non-Diversification Risk: The Fund may have more risk because it is “non-diversified”, meaning that it can invest more of its assets in a smaller
| | |
| abfunds.com | | AB EMERGING MARKETS CORE PORTFOLIO | 5 |
DISCLOSURES AND RISKS (continued)
number of issuers. Accordingly, changes in the value of a single security may have a more significant effect, either negative or positive, on the Fund’s net asset value (“NAV”).
Sector Risk: The Fund may have more risk because of concentrated investments in a particular market sector, such as the technology or financial services sector. Market or economic factors affecting that sector could have a major effect on the value of the Fund’s investments.
Management Risk: The Fund is subject to management risk because it is an actively managed investment fund. The Adviser will apply its investment techniques and risk analyses in making investment decisions for the Fund, but there is no guarantee that its techniques will produce the intended results.
These risks are fully discussed in the Fund’s prospectus. As with all investments, you may lose money by investing in the Fund.
An Important Note About Historical Performance
The investment return and principal value of an investment in the Fund will fluctuate, so that shares, when redeemed, may be worth more or less than their original cost. Performance shown in this report represents past performance and does not guarantee future results. Current performance may be lower or higher than the performance information shown. You may obtain performance information current to the most recent month-end by visiting www.abfunds.com. The Fund has been in operation only for a short period of time, and therefore has a very limited historical performance period. This limited performance period is unlikely to be representative of the performance the Fund will achieve over a longer period.
All fees and expenses related to the operation of the Fund have been deducted. NAV returns do not reflect sales charges; if sales charges were reflected, the Fund’s quoted performance would be lower. SEC returns reflect the applicable sales charges for each share class: a 4.25% maximum front-end sales charge for Class A shares and a 1% 1-year contingent deferred sales charge for Class C shares. Returns for the different share classes will vary due to different expenses associated with each class. Performance assumes reinvestment of distributions and does not account for taxes.
| | |
| 6 | AB EMERGING MARKETS CORE PORTFOLIO | | abfunds.com |
HISTORICAL PERFORMANCE
GROWTH OF A $10,000 INVESTMENT IN THE FUND (unaudited)
9/9/20151 TO 6/30/2017
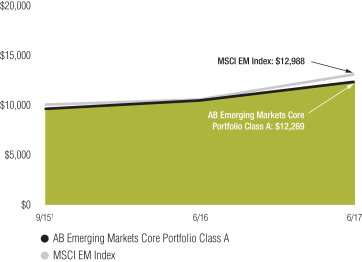
This chart illustrates the total value of an assumed $10,000 investment in AB Emerging Markets Core Portfolio Class A shares (from 9/9/20151 to 6/30/2017) as compared to the performance of the Fund’s benchmark. The chart reflects the deduction of the maximum 4.25% sales charge from the initial $10,000 investment in the Fund and assumes the reinvestment of dividends and capital gains distributions.
| 1 | Inception date: 9/9/2015. |
| | |
| abfunds.com | | AB EMERGING MARKETS CORE PORTFOLIO | 7 |
HISTORICAL PERFORMANCE (continued)
AVERAGE ANNUAL RETURNS AS OF JUNE 30, 2017 (unaudited)
| | | | | | | | |
| | | NAV Returns | | | SEC Returns (reflects applicable
sales charges) | |
| CLASS A SHARES | | | | | | | | |
| 1 Year | | | 18.06% | | | | 13.03% | |
| Since Inception1 | | | 14.67% | | | | 11.97% | |
| CLASS C SHARES | | | | | | | | |
| 1 Year | | | 17.24% | | | | 16.24% | |
| Since Inception1 | | | 13.85% | | | | 13.85% | |
| ADVISOR CLASS SHARES2 | | | | | | | | |
| 1 Year | | | 18.43% | | | | 18.43% | |
| Since Inception1 | | | 14.98% | | | | 14.98% | |
The Fund’s prospectus fee table shows the Fund’s total annual operating expense ratios as 8.26%, 9.01% and 8.01% for Class A, Class C and Advisor Class shares, respectively, gross of any fee waivers or expense reimbursements. Contractual fee waivers and/or expense reimbursements limit the Fund’s annual operating expense ratios exclusive of acquired fund fees and expenses other than the advisory fees of any AB mutual funds in which the Fund may invest, interest expense, taxes, extraordinary expenses, and brokerage commissions and other transaction costs to 1.70%, 2.45% and 1.45% for Class A, Class C and Advisor Class shares, respectively. These waivers/reimbursements may not be terminated before October 31, 2017. Any fees waived and expenses borne by the Adviser may be reimbursed by the Fund until the end of the third fiscal year after the fiscal period in which the fee was waived or the expense was borne, provided that no reimbursement payment will be made that would cause the Fund’s total annual fund operating expenses to exceed these expense limitations amounts. Absent reimbursements or waivers, performance would have been lower. The Financial Highlights section of this report sets forth expense ratio data for the current reporting period; the expense ratios shown above may differ from the expense ratios in the Financial Highlights section since they are based on different time periods.
| 1 | Inception date: 9/9/2015. |
| 2 | This share class is offered at NAV to eligible investors and the SEC returns are the same as the NAV returns. Please note that this share class is for investors purchasing shares through accounts established under certain fee-based programs sponsored and maintained by certain broker-dealers and financial intermediaries, institutional pension plans and/or investment advisory clients of, and certain other persons associated with, the Adviser and its affiliates or the Fund. |
| | |
| 8 | AB EMERGING MARKETS CORE PORTFOLIO | | abfunds.com |
HISTORICAL PERFORMANCE (continued)
SEC AVERAGE ANNUAL RETURNS
AS OF THE MOST RECENT CALENDAR QUARTER-END
JUNE 30, 2017 (unaudited)
| | | | |
| | | SEC Returns (reflects applicable
sales charges) | |
| CLASS A SHARES | | | | |
| 1 Year | | | 13.03% | |
| Since Inception1 | | | 11.97% | |
| CLASS C SHARES | | | | |
| 1 Year | | | 16.24% | |
| Since Inception1 | | | 13.85% | |
| ADVISOR CLASS SHARES2 | | | | |
| 1 Year | | | 18.43% | |
| Since Inception1 | | | 14.98% | |
| 1 | Inception date: 9/9/2015. |
| 2 | Please note that this share class is for investors purchasing shares through accounts established under certain fee-based programs sponsored and maintained by certain broker-dealers and financial intermediaries, institutional pension plans and/or investment advisory clients of, and certain other persons associated with, the Adviser and its affiliates or the Fund. |
| | |
| abfunds.com | | AB EMERGING MARKETS CORE PORTFOLIO | 9 |
EXPENSE EXAMPLE
(unaudited)
As a shareholder of the Fund, you incur two types of costs: (1) transaction costs, including sales charges (loads) on purchase payments, contingent deferred sales charges on redemptions and (2) ongoing costs, including management fees; distribution (12b-1) fees; and other Fund expenses. This example is intended to help you understand your ongoing costs (in dollars) of investing in the Fund and to compare these costs with the ongoing costs of investing in other mutual funds.
The Example is based on an investment of $1,000 invested at the beginning of the period and held for the entire period as indicated below.
Actual Expenses
The table below provides information about actual account values and actual expenses. You may use the information, together with the amount you invested, to estimate the expenses that you paid over the period. Simply divide your account value by $1,000 (for example, an $8,600 account value divided by $1,000 = 8.6), then multiply the result by the number under the heading entitled “Expenses Paid During Period” to estimate the expenses you paid on your account during this period.
Hypothetical Example for Comparison Purposes
The table below also provides information about hypothetical account values and hypothetical expenses based on the Fund’s actual expense ratio and an assumed annual rate of return of 5% before expenses, which is not the Fund’s actual return. The hypothetical account values and expenses may not be used to estimate the actual ending account balance or expenses you paid for the period. You may use this information to compare the ongoing costs of investing in the Fund and other funds by comparing this 5% hypothetical example with the 5% hypothetical examples that appear in the shareholder reports of other funds.
Please note that the expenses shown in the table are meant to highlight your ongoing costs only and do not reflect any transactional costs, such as sales charges (loads), or contingent deferred sales charges on redemptions. Therefore, the hypothetical example is useful in comparing ongoing costs only, and will not help you determine the relative total costs of owning different funds. In addition, if these transactional costs were included, your costs would have been higher.
| | | | | | | | | | | | | | | | | | | | | | | | |
| | | Beginning
Account
Value
1/1/2017 | | | Ending
Account
Value
6/30/2017 | | | Expenses
Paid
During
Period* | | | Annualized
Expense
Ratio* | | | Effective
Expenses
Paid
During
Period+ | | | Effective
Annualized
Expense
Ratio+ | |
| Class A | | | | | | | | | | | | | | | | | | | | | | | | |
Actual | | $ | 1,000 | | | $ | 1,194.50 | | | $ | 8.43 | | | | 1.55 | % | | $ | 8.43 | | | | 1.55 | % |
Hypothetical** | | $ | 1,000 | | | $ | 1,017.11 | | | $ | 7.75 | | | | 1.55 | % | | $ | 7.75 | | | | 1.55 | % |
| | |
| 10 | AB EMERGING MARKETS CORE PORTFOLIO | | abfunds.com |
EXPENSE EXAMPLE (continued)
| | | | | | | | | | | | | | | | | | | | | | | | |
| | | Beginning
Account
Value
1/1/2017 | | | Ending
Account
Value
6/30/2017 | | | Expenses
Paid
During
Period* | | | Annualized
Expense
Ratio* | | | Effective
Expenses
Paid
During
Period+ | | | Effective
Annualized
Expense
Ratio+ | |
| Class C | | | | | | | | | | | | | | | | | | | | | | | | |
Actual | | $ | 1,000 | | | $ | 1,190.70 | | | $ | 12.49 | | | | 2.30 | % | | $ | 12.49 | | | | 2.30 | % |
Hypothetical** | | $ | 1,000 | | | $ | 1,013.39 | | | $ | 11.48 | | | | 2.30 | % | | $ | 11.48 | | | | 2.30 | % |
| Advisor Class | | | | | | | | | | | | | | | | | | | | | | | | |
Actual | | $ | 1,000 | | | $ | 1,196.40 | | | $ | 7.08 | | | | 1.30 | % | | $ | 7.13 | | | | 1.31 | % |
Hypothetical** | | $ | 1,000 | | | $ | 1,018.35 | | | $ | 6.51 | | | | 1.30 | % | | $ | 6.56 | | | | 1.31 | % |
| * | Expenses are equal to the classes’ annualized expense ratios multiplied by the average account value over the period, multiplied by 181/365 (to reflect the one-half year period). |
| ** | Assumes 5% annual return before expenses. |
| + | In connection with the Fund’s investments in affiliated/unaffiliated underlying portfolios, the Fund incurs no direct expenses, but bears proportionate shares of the acquired fund fees and expenses (i.e., operating, administrative and investment advisory fees) of the affiliated/unaffiliated underlying portfolios. Currently the Adviser has contractually agreed to waive its fees from the Fund in an amount equal to the Fund’s pro rata share of certain acquired fund fees and expenses of the affiliated underlying portfolios. The Fund’s effective expenses are equal to the classes’ annualized expense ratio plus the Fund’s pro rata share of the weighted average expense ratio of the affiliated/unaffiliated underlying portfolios in which it invests, multiplied by the average account value over the period, multiplied by 181/365 (to reflect the one-half year period). |
| | |
| abfunds.com | | AB EMERGING MARKETS CORE PORTFOLIO | 11 |
PORTFOLIO SUMMARY
June 30, 2017 (unaudited)
PORTFOLIO STATISTICS
Net Assets ($mil): $5.4
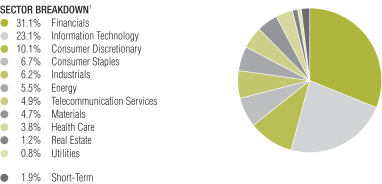
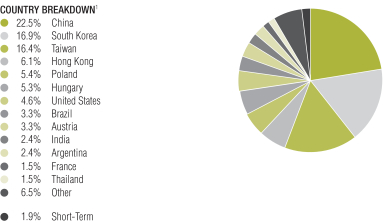
| 1 | All data are as of June 30, 2017. The Fund’s sector and country breakdowns are expressed as a percentage of total investments and may vary over time. “Other” country weightings represent 1.4% or less in the following countries: Chile, Czech Republic, Peru, Russia, Switzerland, Turkey and United Arab Emirates. |
Please note: The sector classifications presented herein are based on the Global Industry Classification Standard (GICS) which was developed by Morgan Stanley Capital International and Standard & Poor’s. The components are divided into sector, industry group, and industry sub-indices as classified by the GICS for each of the market capitalization indices in the broad market. These sector classifications are broadly defined. The “Portfolio of Investments” section of the report reflects more specific industry information and is consistent with the investment restrictions discussed in the Fund’s prospectus.
| | |
| 12 | AB EMERGING MARKETS CORE PORTFOLIO | | abfunds.com |
PORTFOLIO SUMMARY (continued)
June 30, 2017 (unaudited)
TEN LARGEST HOLDINGS1
| | | | | | | | |
| Company | | U.S. $ Value | | | Percent of
Net Assets | |
| Samsung Electronics Co., Ltd. | | $ | 291,595 | | | | 5.4 | % |
| KB Financial Group, Inc. | | | 179,240 | | | | 3.3 | |
| Erste Group Bank AG | | | 178,883 | | | | 3.3 | |
| OTP Bank PLC | | | 176,719 | | | | 3.2 | |
| Powszechny Zaklad Ubezpieczen SA | | | 164,112 | | | | 3.0 | |
| Hon Hai Precision Industry Co., Ltd. | | | 156,835 | | | | 2.9 | |
| Philip Morris International, Inc. | | | 136,242 | | | | 2.5 | |
| Jardine Strategic Holdings Ltd. | | | 129,231 | | | | 2.4 | |
| Taiwan Semiconductor Manufacturing Co., Ltd. | | | 122,980 | | | | 2.3 | |
| Tencent Holdings Ltd. | | | 121,975 | | | | 2.2 | |
| | $ | 1,657,812 | | | | 30.5 | % |
| | |
| abfunds.com | | AB EMERGING MARKETS CORE PORTFOLIO | 13 |
PORTFOLIO OF INVESTMENTS
June 30, 2017
| | | | | | | | | | | | |
| Company | | | | | Shares | | | U.S. $ Value | |
| |
| | | | | | | | | | | | |
COMMON STOCKS – 98.4% | | | | | | | | | | | | |
Financials – 31.2% | | | | | | | | | | | | |
Banks – 24.8% | | | | | | | | | | | | |
Agricultural Bank of China Ltd. – Class H(a) | | | | | | | 117,000 | | | $ | 55,296 | |
Akbank TAS | | | | | | | 15,000 | | | | 41,781 | |
Banco de Chile | | | | | | | 62,820 | | | | 8,233 | |
Banco Macro SA (ADR) | | | | | | | 760 | | | | 70,064 | |
Bank of China Ltd. – Class H(a) | | | | | | | 112,000 | | | | 54,921 | |
Bank Pekao SA | | | | | | | 1,910 | | | | 64,310 | |
China Construction Bank Corp. – Class H | | | | | | | 79,000 | | | | 61,434 | |
Credicorp Ltd. | | | | | | | 350 | | | | 62,787 | |
Erste Group Bank AG(a) | | | | | | | 4,670 | | | | 178,883 | |
Hana Financial Group, Inc. | | | | | | | 2,170 | | | | 85,699 | |
Industrial & Commercial Bank of China Ltd. – Class H(a) | | | | | | | 126,000 | | | | 85,035 | |
Itausa – Investimentos Itau SA | | | | | | | 55 | | | | 143 | |
Itausa – Investimentos Itau SA (Preference Shares) | | | | | | | 39,599 | | | | 107,816 | |
KB Financial Group, Inc. | | | | | | | 3,550 | | | | 179,240 | |
Komercni banka as | | | | | | | 1,010 | | | | 40,455 | |
OTP Bank PLC | | | | | | | 5,280 | | | | 176,719 | |
Shinhan Financial Group Co., Ltd. | | | | | | | 1,670 | | | | 72,053 | |
| | | | | | | | | | | | |
| | | | | | | | | | | 1,344,869 | |
| | | | | | | | | | | | |
Consumer Finance – 1.5% | | | | | | | | | | | | |
Samsung Card Co., Ltd. | | | | | | | 2,310 | | | | 78,927 | |
| | | | | | | | | | | | |
| | | |
Diversified Financial Services – 1.6% | | | | | | | | | | | | |
Fubon Financial Holding Co., Ltd.(a) | | | | | | | 54,000 | | | | 85,931 | |
| | | | | | | | | | | | |
| | | |
Insurance – 3.3% | | | | | | | | | | | | |
Dongbu Insurance Co., Ltd. | | | | | | | 300 | | | | 17,828 | |
Powszechny Zaklad Ubezpieczen SA | | | | | | | 13,640 | | | | 164,112 | |
| | | | | | | | | | | | |
| | | | | | | | | | | 181,940 | |
| | | | | | | | | | | | |
| | | | | | | | | | | 1,691,667 | |
| | | | | | | | | | | | |
Information Technology – 23.1% | | | | | | | | | | | | |
Electronic Equipment, Instruments & Components – 5.4% | | | | | | | | | | | | |
Hon Hai Precision Industry Co., Ltd. | | | | | | | 40,800 | | | | 156,835 | |
Kingboard Chemical Holdings Ltd. | | | | | | | 18,000 | | | | 71,654 | |
LG Innotek Co., Ltd. | | | | | | | 220 | | | | 31,738 | |
Tripod Technology Corp. | | | | | | | 11,000 | | | | 35,038 | |
| | | | | | | | | | | | |
| | | | | | | | | | | 295,265 | |
| | | | | | | | | | | | |
Internet Software & Services – 5.7% | | | | | | | | | | | | |
Alibaba Group Holding Ltd. (Sponsored ADR)(a) | | | | | | | 580 | | | | 81,722 | |
NetEase, Inc. (ADR) | | | | | | | 350 | | | | 105,220 | |
Tencent Holdings Ltd. | | | | | | | 3,400 | | | | 121,975 | |
| | | | | | | | | | | | |
| | | | | | | | | | | 308,917 | |
| | | | | | | | | | | | |
| | |
| 14 | AB EMERGING MARKETS CORE PORTFOLIO | | abfunds.com |
PORTFOLIO OF INVESTMENTS (continued)
| | | | | | | | | | | | |
| Company | | | | | Shares | | | U.S. $ Value | |
| |
| | | | | | | | | | | | |
Semiconductors & Semiconductor Equipment – 3.7% | | | | | | | | | | | | |
Realtek Semiconductor Corp. | | | | | | | 21,000 | | | $ | 75,533 | |
Taiwan Semiconductor Manufacturing Co., Ltd. | | | | | | | 18,000 | | | | 122,980 | |
| | | | | | | | | | | | |
| | | | | | | | | | | 198,513 | |
| | | | | | | | | | | | |
Technology Hardware, Storage & Peripherals – 8.3% | | | | | | | | | | | | |
Catcher Technology Co., Ltd. | | | | | | | 4,000 | | | | 47,674 | |
Pegatron Corp. | | | | | | | 18,000 | | | | 56,308 | |
Quanta Computer, Inc. | | | | | | | 24,000 | | | | 56,772 | |
Samsung Electronics Co., Ltd. | | | | | | | 140 | | | | 291,595 | |
| | | | | | | | | | | | |
| | | | | | | | | | | 452,349 | |
| | | | | | | | | | | | |
| | | | | | | | | | | 1,255,044 | |
| | | | | | | | | | | | |
Consumer Discretionary – 10.1% | | | | | | | | | | | | |
Diversified Consumer Services – 2.7% | | | | | | | | | | | | |
New Oriental Education & Technology Group, Inc. (Sponsored ADR)(a) | | | | | | | 280 | | | | 19,737 | |
TAL Education Group (ADR) | | | | | | | 570 | | | | 69,717 | |
Tarena International, Inc. (ADR) | | | | | | | 3,300 | | | | 59,103 | |
| | | | | | | | | | | | |
| | | | | | | | | | | 148,557 | |
| | | | | | | | | | | | |
Hotels, Restaurants & Leisure – 1.5% | | | | | | | | | | | | |
China Lodging Group Ltd. (Sponsored ADR)(a) | | | | | | | 360 | | | | 29,045 | |
Gourmet Master Co., Ltd. | | | | | | | 4,675 | | | | 50,392 | |
| | | | | | | | | | | | |
| | | | | | | | | | | 79,437 | |
| | | | | | | | | | | | |
Media – 0.8% | | | | | | | | | | | | |
Sun TV Network Ltd. | | | | | | | 3,330 | | | | 42,079 | |
| | | | | | | | | | | | |
| | | |
Textiles, Apparel & Luxury Goods – 5.1% | | | | | | | | | | | | |
ANTA Sports Products Ltd. | | | | | | | 9,000 | | | | 29,733 | |
Li Ning Co., Ltd.(a) | | | | | | | 34,500 | | | | 26,138 | |
LVMH Moet Hennessy Louis Vuitton SE | | | | | | | 340 | | | | 85,019 | |
Pou Chen Corp. | | | | | | | 13,000 | | | | 17,977 | |
Yue Yuen Industrial Holdings Ltd. | | | | | | | 28,500 | | | | 118,203 | |
| | | | | | | | | | | | |
| | | | | | | | | | | 277,070 | |
| | | | | | | | | | | | |
| | | | | | | | | | | 547,143 | |
| | | | | | | | | | | | |
Consumer Staples – 6.7% | | | | | | | | | | | | |
Food & Staples Retailing – 0.5% | | | | | | | | | | | | |
BGF retail Co., Ltd. | | | | | | | 310 | | | | 27,388 | |
| | | | | | | | | | | | |
| | | |
Food Products – 1.6% | | | | | | | | | | | | |
WH Group Ltd.(b) | | | | | | | 84,500 | | | | 85,326 | |
| | | | | | | | | | | | |
| | | |
Household Products – 2.1% | | | | | | | | | | | | |
Colgate-Palmolive Co. | | | | | | | 1,560 | | | | 115,643 | |
| | | | | | | | | | | | |
| | | |
Tobacco – 2.5% | | | | | | | | | | | | |
Philip Morris International, Inc. | | | | | | | 1,160 | | | | 136,242 | |
| | | | | | | | | | | | |
| | | | | | | | | | | 364,599 | |
| | | | | | | | | | | | |
| | |
| abfunds.com | | AB EMERGING MARKETS CORE PORTFOLIO | 15 |
PORTFOLIO OF INVESTMENTS (continued)
| | | | | | | | | | | | |
| Company | | | | | Shares | | | U.S. $ Value | |
| |
| | | | | | | | | | | | |
Industrials – 6.3% | | | | | | | | | | | | |
Airlines – 1.4% | | | | | | | | | | | | |
Wizz Air Holdings PLC(a)(b) | | | | | | | 2,390 | | | $ | 75,367 | |
| | | | | | | | | | | | |
| | | |
Industrial Conglomerates – 3.4% | | | | | | | | | | | | |
Far Eastern New Century Corp. | | | | | | | 69,000 | | | | 56,095 | |
Jardine Strategic Holdings Ltd. | | | | | | | 3,100 | | | | 129,231 | |
| | | | | | | | | | | | |
| | | | | | | | | | | 185,326 | |
| | | | | | | | | | | | |
Transportation Infrastructure – 1.5% | | | | | | | | | | | | |
Jiangsu Expressway Co., Ltd. – Class H | | | | | | | 56,000 | | | | 79,005 | |
| | | | | | | | | | | | |
| | | | | | | | | | | 339,698 | |
| | | | | | | | | | | | |
Energy – 5.5% | | | | | | | | | | | | |
Oil, Gas & Consumable Fuels – 5.5% | | | | | | | | | | | | |
China Petroleum & Chemical Corp. – Class H | | | | | | | 114,000 | | | | 89,262 | |
LUKOIL PJSC (Sponsored ADR) | | | | | | | 1,290 | | | | 62,939 | |
Petronet LNG Ltd. | | | | | | | 13,570 | | | | 90,169 | |
YPF SA (Sponsored ADR) | | | | | | | 2,680 | | | | 58,692 | |
| | | | | | | | | | | | |
| | | | | | | | | | | 301,062 | |
| | | | | | | | | | | | |
Telecommunication Services – 4.9% | | | | | | | | | | | | |
Diversified Telecommunication Services – 3.9% | | | | | | | | | | | | |
China Telecom Corp., Ltd. – Class H | | | | | | | 104,000 | | | | 49,386 | |
China Unicom Hong Kong Ltd.(a) | | | | | | | 18,000 | | | | 26,719 | |
Chunghwa Telecom Co., Ltd. | | | | | | | 9,000 | | | | 31,927 | |
KT Corp. (Sponsored ADR) | | | | | | | 6,250 | | | | 104,000 | |
| | | | | | | | | | | | |
| | | | | | | | | | | 212,032 | |
| | | | | | | | | | | | |
Wireless Telecommunication Services – 1.0% | | | | | | | | | | | | |
China Mobile Ltd. | | | | | | | 5,000 | | | | 53,009 | |
| | | | | | | | | | | | |
| | | | | | | | | | | 265,041 | |
| | | | | | | | | | | | |
Materials – 4.8% | | | | | | | | | | | | |
Chemicals – 3.1% | | | | | | | | | | | | |
Formosa Chemicals & Fibre Corp. | | | | | | | 20,000 | | | | 62,744 | |
PTT Global Chemical PCL (NVDR) | | | | | | | 39,600 | | | | 79,804 | |
Sinopec Shanghai Petrochemical Co., Ltd. – Class H | | | | | | | 42,000 | | | | 22,476 | |
| | | | | | | | | | | | |
| | | | | | | | | | | 165,024 | |
| | | | | | | | | | | | |
Metals & Mining – 1.7% | | | | | | | | | | | | |
KGHM Polska Miedz SA | | | | | | | 2,140 | | | | 63,832 | |
POSCO | | | | | | | 120 | | | | 30,059 | |
| | | | | | | | | | | | |
| | | | | | | | | | | 93,891 | |
| | | | | | | | | | | | |
| | | | | | | | | | | 258,915 | |
| | | | | | | | | | | | |
Health Care – 3.8% | | | | | | | | | | | | |
Health Care Equipment & Supplies – 0.6% | | | | | | | | | | | | |
St Shine Optical Co., Ltd. | | | | | | | 1,700 | | | | 35,567 | |
| | | | | | | | | | | | |
| | | |
Health Care Providers & Services – 1.1% | | | | | | | | | | | | |
Qualicorp SA | | | | | | | 3,000 | | | | 25,989 | |
Sinopharm Group Co., Ltd. – Class H(a) | | | | | | | 7,200 | | | | 32,529 | |
| | | | | | | | | | | | |
| | | | | | | | | | | 58,518 | |
| | | | | | | | | | | | |
| | |
| 16 | AB EMERGING MARKETS CORE PORTFOLIO | | abfunds.com |
PORTFOLIO OF INVESTMENTS (continued)
| | | | | | | | | | | | |
| Company | | | | | Shares | | | U.S. $ Value | |
| |
| | | | | | | | | | | | |
Pharmaceuticals – 2.1% | | | | | | | | | | | | |
Richter Gedeon Nyrt | | | | | | | 4,350 | | | $ | 113,724 | |
| | | | | | | | | | | | |
| | | | | | | | | | | 207,809 | |
| | | | | | | | | | | | |
Real Estate – 1.2% | | | | | | | | | | | | |
Real Estate Management & Development – 1.2% | | | | | | | | | | | | |
Aldar Properties PJSC | | | | | | | 102,530 | | | | 63,984 | |
| | | | | | | | | | | | |
| | | |
Utilities – 0.8% | | | | | | | | | | | | |
Electric Utilities – 0.3% | | | | | | | | | | | | |
Transmissora Alianca de Energia Eletrica SA | | | | | | | 2,600 | | | | 17,297 | |
| | | | | | | | | | | | |
| | | |
Water Utilities – 0.5% | | | | | | | | | | | | |
Cia de Saneamento Basico do Estado de Sao Paulo | | | | | | | 3,000 | | | | 28,670 | |
| | | | | | | | | | | | |
| | | | | | | | | | | 45,967 | |
| | | | | | | | | | | | |
| | | |
Total Common Stocks
(cost $4,389,790) | | | | | | | | | | | 5,340,929 | |
| | | | | | | | | | | | |
| | | | | | | | | | | | |
SHORT-TERM INVESTMENTS – 1.9% | | | | | | | | | | | | |
Investment Companies – 1.9% | | | | | | | | | | | | |
AB Fixed Income Shares, Inc. – Government Money Market Portfolio – Class AB, 0.79%(c)(d)
(cost $100,468) | | | | | | | 100,468 | | | | 100,468 | |
| | | | | | | | | | | | |
| | | |
| | | | | | Principal
Amount
(000) | | | | |
Time Deposits – 0.0% | | | | | | | | | | | | |
BBH, Grand Cayman
(0.567)%, 7/03/17 | | | EUR | | | | 1 | | | | 701 | |
0.005%, 7/03/17 | | | HKD | | | | 2 | | | | 284 | |
0.01%, 7/03/17 | | | SGD | | | | – 0 | –* | | | 322 | |
0.05%, 7/03/17 | | | GBP | | | | – 0 | –* | | | 386 | |
5.75%, 7/03/17 | | | ZAR | | | | 7 | | | | 544 | |
| | | | | | | | | | | | |
| | | |
Total Time Deposits
(cost $2,213) | | | | | | | | | | | 2,237 | |
| | | | | | | | | | | | |
| | | |
Total Short-Term Investments
(cost $102,681) | | | | | | | | | | | 102,705 | |
| | | | | | | | | | | | |
| | | |
Total Investments – 100.3%
(cost $4,492,471) | | | | | | | | | | | 5,443,634 | |
Other assets less liabilities – (0.3)% | | | | | | | | | | | (18,516 | ) |
| | | | | | | | | | | | |
| | | |
Net Assets – 100.0% | | | | | | | | | | $ | 5,425,118 | |
| | | | | | | | | | | | |
| | |
| abfunds.com | | AB EMERGING MARKETS CORE PORTFOLIO | 17 |
PORTFOLIO OF INVESTMENTS (continued)
| * | Principal amount less than 500. |
| (a) | Non-income producing security. |
| (b) | Security is exempt from registration under Rule 144A of the Securities Act of 1933. These securities are considered restricted, but liquid and may be resold in transactions exempt from registration, normally to qualified institutional buyers. At June 30, 2017, the aggregate market value of these securities amounted to $160,693 or 3.0% of net assets. |
| (c) | Investment in affiliated money market mutual fund. The rate shown represents the 7-day yield as of period end. |
| (d) | To obtain a copy of the fund’s shareholder report, please go to the Securities and Exchange Commission’s website at www.sec.gov, or call AB at (800) 227-4618. |
Currency Abbreviations:
EUR – Euro
GBP – Great British Pound
HKD – Hong Kong Dollar
SGD – Singapore Dollar
ZAR – South African Rand
Glossary:
ADR – American Depositary Receipt
NVDR – Non Voting Depositary Receipt
PJSC – Public Joint Stock Company
See notes to financial statements.
| | |
| 18 | AB EMERGING MARKETS CORE PORTFOLIO | | abfunds.com |
STATEMENT OF ASSETS & LIABILITIES
June 30, 2017
| | | | |
| Assets | | | | |
Investments in securities, at value | | | | |
Unaffiliated issuers (cost $4,392,003) | | $ | 5,343,166 | |
Affiliated issuers (cost $100,468) | | | 100,468 | |
Foreign currencies, at value (cost $2,315) | | | 2,359 | |
Receivable for investment securities sold | | | 83,531 | |
Receivable from Adviser | | | 29,074 | |
Dividends receivable | | | 19,325 | |
Receivable for variation margin on exchange-traded derivatives | | | 2,493 | |
Affiliated dividends receivable | | | 89 | |
| | | | |
Total assets | | | 5,580,505 | |
| | | | |
| Liabilities | | | | |
Payable for investment securities purchased | | | 83,783 | |
Legal fee payable | | | 14,722 | |
Custody fee payable | | | 13,014 | |
Audit and tax fee payable | | | 9,239 | |
Accrued foreign capital gains tax payable | | | 4,705 | |
Transfer Agent fee payable | | | 529 | |
Distribution fee payable | | | 13 | |
Due to Custodian | | | 4 | |
Accrued expenses and other liabilities | | | 29,378 | |
| | | | |
Total liabilities | | | 155,387 | |
| | | | |
Net Assets | | $ | 5,425,118 | |
| | | | |
| Composition of Net Assets | | | | |
Capital stock, at par | | $ | 43 | |
Additional paid-in capital | | | 4,101,067 | |
Undistributed net investment income | | | 34,791 | |
Accumulated net realized gain on investment and foreign currency transactions | | | 345,689 | |
Net unrealized appreciation on investments and foreign currency denominated assets and liabilities | | | 943,528 | |
| | | | |
| | $ | 5,425,118 | |
| | | | |
Net Asset Value Per Share—30 billion shares of capital stock authorized, $.0001 par value
| | | | | | | | | | | | |
| Class | | Net Assets | | | Shares
Outstanding | | | Net Asset
Value | |
| |
| A | | $ | 12,803 | | | | 1,017.416 | | | $ | 12.58 | * |
| |
| C | | $ | 12,632 | | | | 1,007 | | | $ | 12.54 | |
| |
| Advisor | | $ | 5,399,683 | | | | 428,598 | | | $ | 12.60 | |
| |
| * | The maximum offering price per share for Class A shares was $13.14 which reflects a sales charge of 4.25%. |
See notes to financial statements.
| | |
| abfunds.com | | AB EMERGING MARKETS CORE PORTFOLIO | 19 |
STATEMENT OF OPERATIONS
Year Ended June 30, 2017
| | | | | | | | |
| Investment Income | | | | | | | | |
Dividends | | | | | | | | |
Unaffiliated issuers (net of foreign taxes withheld of $18,720) | | $ | 149,258 | | | | | |
Affiliated issuers | | | 748 | | | | | |
Interest | | | 43 | | | $ | 150,049 | |
| | | | | | | | |
| Expenses | | | | | | | | |
Advisory fee (see Note B) | | | 65,414 | | | | | |
Transfer agency—Class A | | | 16 | | | | | |
Transfer agency—Class C | | | 19 | | | | | |
Transfer agency—Advisor Class | | | 7,528 | | | | | |
Distribution fee—Class A | | | 29 | | | | | |
Distribution fee—Class C | | | 114 | | | | | |
Custodian | | | 77,050 | | | | | |
Audit and tax | | | 71,094 | | | | | |
Administrative | | | 60,550 | | | | | |
Legal | | | 29,943 | | | | | |
Directors’ fees | | | 27,099 | | | | | |
Printing | | | 8,133 | | | | | |
Amortization of offering expenses | | | 6,394 | | | | | |
Miscellaneous | | | 24,894 | | | | | |
| | | | | | | | |
Total expenses | | | 378,277 | | | | | |
Less: expenses waived and reimbursed by the Adviser (see Note B) | | | (300,836 | ) | | | | |
| | | | | | | | |
Net expenses | | | | | | | 77,441 | |
| | | | | | | | |
Net investment income | | | | | | | 72,608 | |
| | | | | | | | |
| Realized and Unrealized Gain (Loss) on Investment and Foreign Currency Transactions | | | | | | | | |
Net realized gain (loss) on: | | | | | | | | |
Investment transactions | | | | | | | 498,064 | (a) |
Futures | | | | | | | 11,580 | |
Foreign currency transactions | | | | | | | 3,220 | |
Net change in unrealized appreciation/depreciation on: | | | | | | | | |
Investments | | | | | | | 405,616 | (b) |
Foreign currency denominated assets and liabilities | | | | | | | (206 | ) |
| | | | | | | | |
Net gain on investment and foreign currency transactions | | | | | | | 918,274 | |
| | | | | | | | |
Net Increase in Net Assets from Operations | | | | | | $ | 990,882 | |
| | | | | | | | |
| (a) | Net of foreign capital gains taxes of $3,788. |
| (b) | Net of increase in accrued foreign capital gains taxes of $7,743. |
See notes to financial statements.
| | |
| 20 | AB EMERGING MARKETS CORE PORTFOLIO | | abfunds.com |
STATEMENT OF CHANGES IN NET ASSETS
| | | | | | | | |
| | | Year Ended
June 30, 2017 | | | September 9, 2015(a)
to
June 30, 2016 | |
| Increase (Decrease) in Net Assets from Operations | | | | | | | | |
Net investment income | | $ | 72,608 | | | $ | 45,855 | |
Net realized gain (loss) on investment and foreign currency transactions | | | 512,864 | | | | (149,737 | ) |
Net change in unrealized appreciation/depreciation on investments and foreign currency denominated assets and liabilities | | | 405,410 | | | | 538,118 | |
| | | | | | | | |
Net increase in net assets from operations | | | 990,882 | | | | 434,236 | |
| Dividends to Shareholders from | | | | | | | | |
Net investment income | | | | | | | | |
Class A | | | (134 | ) | | | (46 | ) |
Class C | | | (54 | ) | | | (22 | ) |
Advisor Class | | | (79,812 | ) | | | (26,942 | ) |
| Capital Stock Transactions | | | | | | | | |
Net increase (decrease) | | | (920,000 | ) | | | 5,027,010 | |
| | | | | | | | |
Total increase (decrease) | | | (9,118 | ) | | | 5,434,236 | |
| Net Assets | | | | | | | | |
Beginning of period | | | 5,434,236 | | | | – 0 | – |
| | | | | | | | |
End of period (including undistributed net investment income of $34,791 and $39,197, respectively) | | $ | 5,425,118 | | | $ | 5,434,236 | |
| | | | | | | | |
| (a) | Commencement of operations. |
See notes to financial statements.
| | |
| abfunds.com | | AB EMERGING MARKETS CORE PORTFOLIO | 21 |
NOTES TO FINANCIAL STATEMENTS
June 30, 2017
NOTE A
Significant Accounting Policies
AB Cap Fund, Inc. (the “Company”), which is a Maryland corporation, is registered under the Investment Company Act of 1940 as an open-end management investment company. The Company operates as a series company currently comprised of 31 portfolios. Each portfolio is considered to be a separate entity for financial reporting and tax purposes. This report relates only to the AB Emerging Markets Core Portfolio (the “Fund”), a non-diversified portfolio. AB Emerging Markets Core Portfolio commenced operations on September 9, 2015. The Fund has authorized issuance of Class A, Class C, Advisor Class, Class R, Class K, Class I, Class Z, Class T, Class 1 and Class 2 shares. No classes are being publicly offered. Class R, Class K, Class I, Class Z, Class T, Class 1 or Class 2 shares have not been issued. As of June 30, 2017, AllianceBernstein L.P. (the “Adviser”) was the sole shareholder of Class A, Class C and Advisor Class shares. Class A shares are sold with a front-end sales charge of up to 4.25% for purchases not exceeding $1,000,000. With respect to purchases of $1,000,000 or more, Class A shares redeemed within one year of purchase may be subject to a contingent deferred sales charge of 1%. Class C shares are subject to a contingent deferred sales charge of 1% on redemptions made within the first year after purchase, and 0% after the first year of purchase. Effective April 10, 2017, Class C shares will automatically convert to Class A shares ten years after the end of the calendar month of purchase. Advisor Class shares are sold without an initial or contingent deferred sales charge and are not subject to ongoing distribution expenses. All ten classes of shares have identical voting, dividend, liquidation and other rights, except that the classes bear different distribution and transfer agency expenses. Each class has exclusive voting rights with respect to its distribution plan. The financial statements have been prepared in conformity with U.S. generally accepted accounting principles (“U.S. GAAP”), which require management to make certain estimates and assumptions that affect the reported amounts of assets and liabilities in the financial statements and amounts of income and expenses during the reporting period. Actual results could differ from those estimates. The Fund is an investment company under U.S. GAAP and follows the accounting and reporting guidance applicable to investment companies. The following is a summary of significant accounting policies followed by the Fund.
1. Security Valuation
Portfolio securities are valued at their current market value determined on the basis of market quotations or, if market quotations are not readily available or are deemed unreliable, at “fair value” as determined in accordance with procedures established by and under the general supervision of the Fund’s Board of Directors (the “Board”).
| | |
| 22 | AB EMERGING MARKETS CORE PORTFOLIO | | abfunds.com |
NOTES TO FINANCIAL STATEMENTS (continued)
In general, the market values of securities which are readily available and deemed reliable are determined as follows: securities listed on a national securities exchange (other than securities listed on the NASDAQ Stock Market, Inc. (“NASDAQ”)) or on a foreign securities exchange are valued at the last sale price at the close of the exchange or foreign securities exchange. If there has been no sale on such day, the securities are valued at the last traded price from the previous day. Securities listed on more than one exchange are valued by reference to the principal exchange on which the securities are traded; securities listed only on NASDAQ are valued in accordance with the NASDAQ Official Closing Price; listed or over the counter (“OTC”) market put or call options are valued at the mid level between the current bid and ask prices. If either a current bid or current ask price is unavailable, the Adviser will have discretion to determine the best valuation (e.g. last trade price in the case of listed options); open futures are valued using the closing settlement price or, in the absence of such a price, the most recent quoted bid price. If there are no quotations available for the day of valuation, the last available closing settlement price is used; U.S. Government securities and any other debt instruments having 60 days or less remaining until maturity are generally valued at market by an independent pricing vendor, if a market price is available. If a market price is not available, the securities are valued at amortized cost. This methodology is commonly used for short- term securities that have an original maturity of 60 days or less, as well as short-term securities that had an original term to maturity that exceeded 60 days. In instances when amortized cost is utilized, the Valuation Committee (the “Committee”) must reasonably conclude that the utilization of amortized cost is approximately the same as the fair value of the security. Such factors the Committee will consider include, but are not limited to, an impairment of the creditworthiness of the issuer or material changes in interest rates. Fixed-income securities, including mortgage-backed and asset-backed securities, may be valued on the basis of prices provided by a pricing service or at a price obtained from one or more of the major broker-dealers. In cases where broker-dealer quotes are obtained, the Adviser may establish procedures whereby changes in market yields or spreads are used to adjust, on a daily basis, a recently obtained quoted price on a security. Swaps and other derivatives are valued daily, primarily using independent pricing services, independent pricing models using market inputs, as well as third party broker-dealers or counterparties. Open end mutual funds are valued at the closing net asset value per share, while exchange traded funds are valued at the closing market price per share.
Securities for which market quotations are not readily available (including restricted securities) or are deemed unreliable are valued at fair value as deemed appropriate by the Adviser. Factors considered in making this determination may include, but are not limited to, information obtained by
| | |
| abfunds.com | | AB EMERGING MARKETS CORE PORTFOLIO | 23 |
NOTES TO FINANCIAL STATEMENTS (continued)
contacting the issuer, analysts, analysis of the issuer’s financial statements or other available documents. In addition, the Fund may use fair value pricing for securities primarily traded in non-U.S. markets because most foreign markets close well before the Fund values its securities at 4:00 p.m., Eastern Time. The earlier close of these foreign markets gives rise to the possibility that significant events, including broad market moves, may have occurred in the interim and may materially affect the value of those securities. To account for this, the Fund may frequently value many of its foreign equity securities using fair value prices based on third party vendor modeling tools to the extent available.
2. Fair Value Measurements
In accordance with U.S. GAAP regarding fair value measurements, fair value is defined as the price that the Fund would receive to sell an asset or pay to transfer a liability in an orderly transaction between market participants at the measurement date. U.S. GAAP establishes a framework for measuring fair value, and a three-level hierarchy for fair value measurements based upon the transparency of inputs to the valuation of an asset or liability (including those valued based on their market values as described in Note A.1 above). Inputs may be observable or unobservable and refer broadly to the assumptions that market participants would use in pricing the asset or liability. Observable inputs reflect the assumptions market participants would use in pricing the asset or liability based on market data obtained from sources independent of the Fund. Unobservable inputs reflect the Fund’s own assumptions about the assumptions that market participants would use in pricing the asset or liability based on the best information available in the circumstances. Each investment is assigned a level based upon the observability of the inputs which are significant to the overall valuation. The three-tier hierarchy of inputs is summarized below.
| | • | | Level 1—quoted prices in active markets for identical investments |
| | • | | Level 2—other significant observable inputs (including quoted prices for similar investments, interest rates, prepayment speeds, credit risk, etc.) |
| | • | | Level 3—significant unobservable inputs (including the Fund’s own assumptions in determining the fair value of investments) |
Where readily available market prices or relevant bid prices are not available for certain equity investments, such investments may be valued based on similar publicly traded investments, movements in relevant indices since last available prices or based upon underlying company fundamentals and comparable company data (such as multiples to earnings or other multiples to equity). Where an investment is valued using an observable input such as another publicly traded security, the investment will be classified
| | |
| 24 | AB EMERGING MARKETS CORE PORTFOLIO | | abfunds.com |
NOTES TO FINANCIAL STATEMENTS (continued)
as Level 2. If management determines that an adjustment is appropriate based on restrictions on resale, illiquidity or uncertainty, and such adjustment is a significant component of the valuation, the investment will be classified as Level 3. An investment will also be classified as Level 3 where management uses company fundamentals and other significant inputs to determine the valuation.
The following table summarizes the valuation of the Fund’s investments by the above fair value hierarchy levels as of June 30, 2017:
| | | | | | | | | | | | | | | | |
Investments in
Securities | | Level 1 | | | Level 2 | | | Level 3 | | | Total | |
Assets: | | | | | | | | | | | | | | | | |
Common Stocks: | | | | | | | | | | | | | | | | |
Financials | | $ | 289,498 | | | $ | 1,402,169 | | | $ | – 0 | – | | $ | 1,691,667 | |
Information Technology | | | 186,942 | | | | 1,068,102 | | | | – 0 | – | | | 1,255,044 | |
Consumer Discretionary | | | 177,602 | | | | 369,541 | | | | – 0 | – | | | 547,143 | |
Consumer Staples | | | 251,885 | | | | 112,714 | | | | – 0 | – | | | 364,599 | |
Industrials | | | – 0 | – | | | 339,698 | | | | – 0 | – | | | 339,698 | |
Energy | | | 121,631 | | | | 179,431 | | | | – 0 | – | | | 301,062 | |
Telecommunication Services | | | 104,000 | | | | 161,041 | | | | – 0 | – | | | 265,041 | |
Materials | | | – 0 | – | | | 258,915 | | | | – 0 | – | | | 258,915 | |
Health Care | | | 25,989 | | | | 181,820 | | | | – 0 | – | | | 207,809 | |
Real Estate | | | – 0 | – | | | 63,984 | | | | – 0 | – | | | 63,984 | |
Utilities | | | 45,967 | | | | – 0 | – | | | – 0 | – | | | 45,967 | |
Short-Term Investments: | | | | | | | | | | | | | | | | |
Investment Companies | | | 100,468 | | | | – 0 | – | | | – 0 | – | | | 100,468 | |
Time Deposits | | | – 0 | – | | | 2,237 | | | | – 0 | – | | | 2,237 | |
| | | | | | | | | | | | | | | | |
Total Investments in Securities | | | 1,303,982 | | | | 4,139,652 | † | | | – 0 | – | | | 5,443,634 | |
Other Financial Instruments*: | | | – 0 | – | | | – 0 | – | | | – 0 | – | | | – 0 | – |
| | | | | | | | | | | | | | | | |
Total^ | | $ | 1,303,982 | | | $ | 4,139,652 | | | $ | – 0 | – | | $ | 5,443,634 | |
| | | | | | | | | | | | | | | | |
| † | A significant portion of the Fund’s foreign equity investments are categorized as Level 2 investments since they are valued using fair value prices based on third party vendor modeling tools to the extent available, see note A.1. |
| * | Other financial instruments are derivative instruments, such as futures, forwards and swaps, which are valued at the unrealized appreciation/depreciation on the instrument. |
| ^ | There were de minimis transfers from Level 2 to Level 1 during the reporting period. There were no transfers from Level 1 to Level 2 during the reporting period. |
The Fund recognizes all transfers between levels of the fair value hierarchy assuming the financial instrument was transferred at the beginning of the reporting period.
The Adviser established the Committee to oversee the pricing and valuation of all securities held in the Fund. The Committee operates under pricing and valuation policies and procedures established by the Adviser and approved by the Board, including pricing policies which set forth the mechanisms and processes to be employed on a daily basis to implement these policies and procedures. In particular, the pricing policies describe how to determine market quotations for securities and other instruments.
| | |
| abfunds.com | | AB EMERGING MARKETS CORE PORTFOLIO | 25 |
NOTES TO FINANCIAL STATEMENTS (continued)
The Committee’s responsibilities include: 1) fair value and liquidity determinations (and oversight of any third parties to whom any responsibility for fair value and liquidity determinations is delegated), and 2) regular monitoring of the Adviser’s pricing and valuation policies and procedures and modification or enhancement of these policies and procedures (or recommendation of the modification of these policies and procedures) as the Committee believes appropriate.
The Committee is also responsible for monitoring the implementation of the pricing policies by the Adviser’s Pricing Group (the “Pricing Group”) and any third party which performs certain pricing functions in accordance with the pricing policies. The Pricing Group is responsible for the oversight of the third party on a day-to-day basis. The Committee and the Pricing Group perform a series of activities to provide reasonable assurance of the accuracy of prices including: 1) periodic vendor due diligence meetings, review of methodologies, new developments and process at vendors, 2) daily comparison of security valuation versus prior day for all securities that exceeded established thresholds, and 3) daily review of unpriced, stale, and variance reports with exceptions reviewed by senior management and the Committee.
In addition, several processes outside of the pricing process are used to monitor valuation issues including: 1) performance and performance attribution reports are monitored for anomalous impacts based upon benchmark performance, and 2) portfolio managers review all portfolios for performance and analytics (which are generated using the Adviser’s prices).
3. Currency Translation
Assets and liabilities denominated in foreign currencies and commitments under forward currency exchange contracts are translated into U.S. dollars at the mean of the quoted bid and ask prices of such currencies against the U.S. dollar. Purchases and sales of Fund securities are translated into U.S. dollars at the rates of exchange prevailing when such securities were acquired or sold. Income and expenses are translated into U.S. dollars at rates of exchange prevailing when accrued.
Net realized gain or loss on foreign currency transactions represents foreign exchange gains and losses from sales and maturities of foreign fixed income investments, foreign currency exchange contracts, holding of foreign currencies, currency gains or losses realized between the trade and settlement dates on foreign investment transactions, and the difference between the amounts of dividends, interest and foreign withholding taxes recorded on the Fund’s books and the U.S. dollar equivalent amounts actually received or paid. Net unrealized currency gains and losses from valuing foreign currency denominated assets and liabilities at period end exchange rates are reflected as a component of net unrealized appreciation and depreciation of foreign currency denominated assets and liabilities.
| | |
| 26 | AB EMERGING MARKETS CORE PORTFOLIO | | abfunds.com |
NOTES TO FINANCIAL STATEMENTS (continued)
4. Taxes
It is the Fund’s policy to meet the requirements of the Internal Revenue Code applicable to regulated investment companies and to distribute all of its investment company taxable income and net realized gains, if any, to shareholders. Therefore, no provisions for federal income or excise taxes are required. The Fund may be subject to taxes imposed by countries in which it invests. Such taxes are generally based on income and/or capital gains earned or repatriated. Taxes are accrued and applied to net investment income, net realized gains and net unrealized appreciation/depreciation as such income and/or gains are earned.
In accordance with U.S. GAAP requirements regarding accounting for uncertainties in income taxes, management has analyzed the Fund’s tax positions taken or expected to be taken on federal and state income tax returns for all open tax years (all years since inception of the Fund) and has concluded that no provision for income tax is required in the Fund’s financial statements.
5. Investment Income and Investment Transactions
Dividend income is recorded on the ex-dividend date or as soon as the Fund is informed of the dividend. Interest income is accrued daily. Investment transactions are accounted for on the date securities are purchased or sold. Investment gains and losses are determined on the identified cost basis. The Fund amortizes premiums and accretes discounts as adjustments to interest income.
6. Class Allocations
All income earned and expenses incurred by the Fund are borne on a pro-rata basis by each settled class of shares, based on the proportionate interest in the Fund represented by the net assets of such class, except for class specific expenses which are allocated to the respective class. Expenses of the Company are charged proportionately to each portfolio or based on other appropriate methods. Realized and unrealized gains and losses are allocated among the various share classes based on their respective net assets.
7. Dividends and Distributions
Dividends and distributions to shareholders, if any, are recorded on the ex-dividend date. Income dividends and capital gains distributions are determined in accordance with federal tax regulations and may differ from those determined in accordance with U.S. GAAP. To the extent these differences are permanent, such amounts are reclassified within the capital accounts based on their federal tax basis treatment; temporary differences do not require such reclassification.
| | |
| abfunds.com | | AB EMERGING MARKETS CORE PORTFOLIO | 27 |
NOTES TO FINANCIAL STATEMENTS (continued)
8. Offering Expenses
Offering expenses of $32,958 have been deferred and amortized on a straight line basis over a one year period from September 9, 2015 (commencement of operations).
NOTE B
Advisory Fee and Other Transactions with Affiliates
Under the terms of the investment advisory agreement, the Fund pays the Adviser and advisory fee at an annual rate of .95% of the first $2.5 billion of the Fund’s average daily net assets, .90% of the next $2.5 billion up to $5 billion, and .85% of the excess of $5 billion. Prior to May 5, 2017, the Fund paid the Adviser an advisory fee at an annual rate of 1.175% of the first $1 billion of the Fund’s average daily net assets, 1.05% of the next $1 billion up to $2 billion, 1.00% of the excess of $2 billion up to $3 billion, .90% of the excess of $3 billion up to $6 billion, and .85% of the excess of $6 billion. The fee is accrued daily and paid monthly. The Adviser has agreed to waive its fees and bear certain expenses to the extent necessary to limit total operating expenses (excluding expenses associated with securities sold short, acquired fund fees and expenses other than advisory fees of any AllianceBernstein Mutual Funds in which the Fund may invest, except advisory fees borne by the Fund in connection with the investment of securities lending collateral, interest expense, taxes, extraordinary expenses, and brokerage commissions and other transaction costs) on an annual basis (the “Expense Caps”) to 1.35%, 2.10% and 1.10% of the daily average net assets for Class A, Class C and Advisor Class shares, respectively. Effective May 5, 2017, the Expense Cap for Class A was reduced from 1.70% to 1.35% of the daily average net assets, for Class C was reduced from 2.45% to 2.10% of the daily average net assets, for Advisor Class was reduced from 1.45% to 1.10% of the daily average net assets. Any fees waived and expenses borne by the Adviser are subject to repayment by the Fund until the end of the third fiscal year after the fiscal period in which the fee was waived or the expense was borne; such waivers that are subject to repayment amount to $210,275 for the fiscal period ended June 30, 2016. In any case, no repayment will be made that would cause the Fund’s total annual operating expenses to exceed the net fee percentages set forth above. For the year ended June 30, 2017 the reimbursements/waivers amounted to $237,518. The Expense Caps may not be terminated by the Adviser prior to one year from the date the Fund’s shares are first offered to the public. Also, for the period July 1, 2016 through May 4, 2017, the Adviser voluntarily waived its management fee for the Fund in an additional amount of .05% of average daily net assets. For the period July 1, 2016 through May 4, 2017, such waiver amounted to $2,408.
| | |
| 28 | AB EMERGING MARKETS CORE PORTFOLIO | | abfunds.com |
NOTES TO FINANCIAL STATEMENTS (continued)
Pursuant to the investment advisory agreement, the Fund may reimburse the Adviser for certain legal and accounting services provided to the Fund by the Adviser. For the year ended June 30, 2017, the Adviser voluntarily agreed to waive such fees that amounted to $60,550.
The Fund compensates AllianceBernstein Investor Services, Inc. (“ABIS”), a wholly-owned subsidiary of the Adviser, under a Transfer Agency Agreement for providing personnel and facilities to perform transfer agency services for the Fund. ABIS may make payments to intermediaries that provide omnibus account services, sub-accounting services and/or networking services. Such compensation retained by ABIS amounted to $5,759 for the year ended June 30, 2017.
AllianceBernstein Investments, Inc. (the “Distributor”), a wholly-owned subsidiary of the Adviser, serves as the distributor of the Fund’s shares. The Distributor has advised the Fund that it has retained no front-end sales charges from the sale of Class A shares nor received any contingent deferred sales charges imposed upon redemptions by shareholders of Class A and Class C shares, respectively, for the year ended June 30, 2017.
The Fund may invest in AB Government Money Market Portfolio (the “Government Money Market Portfolio”) which has a contractual annual advisory fee rate of .20% of the portfolio’s average daily net assets and bears its own expenses. In connection with the investment by the Fund in the Government Money Market Portfolio, the Adviser has agreed to waive its advisory fee from the Fund in an amount equal to the Fund’s pro rata share of the effective advisory fees of Government Money Market Portfolio, as borne indirectly by the Fund as an acquired fund fee and expense. For the year ended June 30, 2017, such waiver amounted to $360. A summary of the Fund’s transactions in shares of Government Money Market Portfolio for the year ended June 30, 2017 is as follows:
| | | | | | | | | | | | | | | | |
Market Value
June 30, 2016
(000) | | Purchases
at Cost
(000) | | | Sales
Proceeds
(000) | | | Market Value
June 30, 2017
(000) | | | Dividend
Income
(000) | |
| $ 11 | | $ | 3,063 | | | $ | 2,974 | | | $ | 100 | | | $ | 1 | |
Brokerage commissions paid on investment transactions for the year ended June 30, 2017, amounted to $11,188, of which $0 and $0, respectively, was paid to Sanford C. Bernstein & Co. LLC or Sanford C. Bernstein Limited, affiliates of the Adviser.
| | |
| abfunds.com | | AB EMERGING MARKETS CORE PORTFOLIO | 29 |
NOTES TO FINANCIAL STATEMENTS (continued)
NOTE C
Distribution Services Agreement
The Fund has adopted a Distribution Services Agreement (the “Agreement”) pursuant to Rule 12b-1 under the Investment Company Act of 1940. Under the Agreement, the Fund pays distribution and servicing fees to the Distributor at an annual rate of up to .25% of the Fund’s average daily net assets attributable to Class A shares and 1% of the Fund’s average daily net assets attributable to Class C shares. There are no distribution and servicing fees on Advisor Class shares. The fees are accrued daily and paid monthly. The Agreement provides that the Distributor will use such payments in their entirety for distribution assistance and promotional activities. Since the commencement of the Fund’s operations, the Distributor has incurred no expenses in excess of the distribution costs reimbursed by the Fund for Class C shares. While such costs may be recovered from the Fund in future periods so long as the Agreement is in effect, the rate of the distribution and servicing fees payable under the Agreement may not be increased without a shareholder vote. In accordance with the Agreement, there is no provision for recovery of unreimbursed distribution costs incurred by the Distributor beyond the current fiscal year for Class A shares. The Agreement also provides that the Adviser may use its own resources to finance the distribution of the Fund’s shares.
NOTE D
Investment Transactions
Purchases and sales of investment securities (excluding short-term investments) for the year ended June 30, 2017 were as follows:
| | | | | | | | |
| | | Purchases | | | Sales | |
Investment securities (excluding
U.S. government securities) | | $ | 5,306,821 | | | $ | 6,357,850 | |
U.S. government securities | | | – 0 | – | | | – 0 | – |
The cost of investments for federal income tax purposes, gross unrealized appreciation and unrealized depreciation are as follows:
| | | | |
Cost | | $ | 4,497,174 | |
| | | | |
Gross unrealized appreciation | | $ | 986,404 | |
Gross unrealized depreciation | | | (39,944 | ) |
| | | | |
Net unrealized appreciation | | $ | 946,460 | |
| | | | |
1. Derivative Financial Instruments
The Fund may use derivatives in an effort to earn income and enhance returns, to replace more traditional direct investments, to obtain exposure to otherwise inaccessible markets (collectively, “investment purposes”), or to hedge or adjust the risk profile of its fund.
| | |
| 30 | AB EMERGING MARKETS CORE PORTFOLIO | | abfunds.com |
NOTES TO FINANCIAL STATEMENTS (continued)
The principal types of derivatives utilized by the Fund, as well as the methods in which they may be used are:
The Fund may buy or sell futures for investment purposes or for the purpose of hedging its fund against adverse effects of potential movements in the market. The Fund bears the market risk that arises from changes in the value of these instruments and the imperfect correlation between movements in the price of the futures and movements in the price of the assets, reference rates or indices which they are designed to track. Among other things, the Fund may purchase or sell futures for foreign currencies or options thereon for non-hedging purposes as a means of making direct investment in foreign currencies, as described below under “Currency Transactions”.
At the time the Fund enters into a future, the Fund deposits and maintains as collateral an initial margin with the broker, as required by the exchange on which the transaction is effected. Such amount is shown as cash collateral due from broker on the statement of assets and liabilities. Pursuant to the contract, the Fund agrees to receive from or pay to the broker an amount of cash equal to the daily fluctuation in the value of the contract. Such receipts or payments are known as variation margin and are recorded by the Fund as unrealized gains or losses. Risks may arise from the potential inability of a counterparty to meet the terms of the contract. The credit/counterparty risk for exchange-traded futures is generally less than privately negotiated futures, since the clearinghouse, which is the issuer or counterparty to each exchange-traded future, has robust risk mitigation standards, including the requirement to provide initial and variation margin. When the contract is closed, the Fund records a realized gain or loss equal to the difference between the value of the contract at the time it was opened and the time it was closed.
Use of long futures subjects the Fund to risk of loss in excess of the amounts shown on the statement of assets and liabilities, up to the notional value of the future. Use of short futures subjects the Fund to unlimited risk of loss. Under some circumstances, futures exchanges may establish daily limits on the amount that the price of a future can vary from the previous day’s settlement price, which could effectively prevent liquidation of unfavorable positions.
During the year ended June 30, 2017, the Fund held futures for hedging purposes.
The Fund typically enters into International Swaps and Derivatives Association, Inc. Master Agreements (“ISDA Master Agreement”) or similar master agreements (collectively, “Master Agreements”) with its derivative contract
| | |
| abfunds.com | | AB EMERGING MARKETS CORE PORTFOLIO | 31 |
NOTES TO FINANCIAL STATEMENTS (continued)
counterparties in order to, among other things, reduce its credit risk to counterparties. ISDA Master Agreements include provisions for general obligations, representations, collateral and events of default or termination. Under an ISDA Master Agreement, the Fund typically may offset with the counterparty certain derivative financial instrument’s payables and/or receivables with collateral held and/or posted and create one single net payment (close-out netting) in the event of default or termination.
Various Master Agreements govern the terms of certain transactions with counterparties, including transactions such as derivative transactions, repurchase and reverse repurchase agreements. These Master Agreements typically attempt to reduce the counterparty risk associated with such transactions by specifying credit protection mechanisms and providing standardization that improves legal certainty. Cross-termination provisions under Master Agreements typically provide that a default in connection with one transaction between the Fund and a counterparty gives the non-defaulting party the right to terminate any other transactions in place with the defaulting party to create one single net payment due to/due from the defaulting party. In the event of a default by a Master Agreements counterparty, the return of collateral with market value in excess of the Fund’s net liability, held by the defaulting party, may be delayed or denied.
The Fund’s Master Agreements may contain provisions for early termination of OTC derivative transactions in the event the net assets of the Fund decline below specific levels (“net asset contingent features”). If these levels are triggered, the Fund’s counterparty has the right to terminate such transaction and require the Fund to pay or receive a settlement amount in connection with the terminated transaction.
During the year ended June 30, 2017, the Fund had entered into the following derivatives:
| | | | | | | | | | |
Derivative Type | | Location of Gain
or (Loss) on
Derivatives Within
Statement of
Operations | | Realized Gain
or (Loss) on
Derivatives | | | Change in
Unrealized
Appreciation or
(Depreciation) | |
Equity contracts | | Net realized gain/(loss) on futures; Net change in unrealized appreciation/
depreciation on futures | | $ | 11,580 | | | $ | – 0 | – |
| | | | | | | | | | |
Total | | | | $ | 11,580 | | | $ | – 0 | – |
| | | | | | | | | | |
| | |
| 32 | AB EMERGING MARKETS CORE PORTFOLIO | | abfunds.com |
NOTES TO FINANCIAL STATEMENTS (continued)
The following table represents the average monthly volume of the Fund’s derivative transactions during the year ended June 30, 2017:
| | | | |
Futures: | | | | |
Average original value of buy contracts | | $ | 58,807 | (a) |
| (a) | Positions were open for seven months during the reporting period. |
2. Currency Transactions
The Fund may invest in non-U.S. Dollar-denominated securities on a currency hedged or unhedged basis. The Fund may seek investment opportunities by taking long or short positions in currencies through the use of currency-related derivatives, including forward currency exchange contracts, futures and options on futures, swaps, and other options. The Fund may enter into transactions for investment opportunities when it anticipates that a foreign currency will appreciate or depreciate in value but securities denominated in that currency are not held by the Fund and do not present attractive investment opportunities. Such transactions may also be used when the Adviser believes that it may be more efficient than a direct investment in a foreign currency-denominated security. The Fund may also conduct currency exchange contracts on a spot basis (i.e., for cash at the spot rate prevailing in the currency exchange market for buying or selling currencies).
NOTE E
Capital Stock
Each class consists of 3,000,000,000 authorized shares. Transactions in capital shares for each class were as follows:
| | | | | | | | | | | | | | | | | | | | | | | | |
| | | | | | | | | | | | | | | | | | | | | | | | |
| | | Shares | | | | | | Amount | | | | |
| | | Year Ended
June 30, 2017 | | | September 9, 2015*
to June 30,
2016 | | | | | | Year Ended
June 30, 2017 | | | September 9, 2015*
to June 30,
2016 | | | | |
| | | | | | | | |
| Class A | | | | | | | | | | | | | | | | | | | | | | | | |
Shares sold | | | – 0 | – | | | 1,000 | | | | | | | $ | – 0 | – | | $ | 10,000 | | | | | |
| | | | | |
Shares issued in reinvestment of dividends | | | 13 | | | | 5 | | | | | | | | 134 | | | | 46 | | | | | |
| | | | | |
Net increase | | | 13 | | | | 1,005 | | | | | | | $ | 134 | | | $ | 10,046 | | | | | |
| | | | | |
| | | | | | | | | | | | | | | | | | | | | | | | |
Class C | | | | | | | | | | | | | | | | | | | | | | | | |
Shares sold | | | – 0 | – | | | 1,000 | | | | | | | $ | – 0 | – | | $ | 10,000 | | | | | |
| | | | | |
Shares issued in reinvestment of dividends | | | 5 | | | | 2 | | | | | | | | 54 | | | | 22 | | | | | |
| | | | | |
Net increase | | | 5 | | | | 1,002 | | | | | | | $ | 54 | | | $ | 10,022 | | | | | |
| | | | | |
| | |
| abfunds.com | | AB EMERGING MARKETS CORE PORTFOLIO | 33 |
NOTES TO FINANCIAL STATEMENTS (continued)
| | | | | | | | | | | | | | | | | | | | | | | | |
| | | | | | | | | | | | | | | | | | | | | | | | |
| | | Shares | | | | | | Amount | | | | |
| | | Year Ended
June 30, 2017 | | | September 9, 2015*
to June 30, 2016 | | | | | | Year Ended
June 30, 2017 | | | September 9, 2015*
to June 30, 2016 | | | | |
| | | | | | | | |
Advisor Class | | | | | | | | | | | | | | | | | | | | | | | | |
Shares sold | | | – 0 | – | | | 498,000 | | | | | | | $ | – 0 | – | | $ | 4,980,000 | | | | | |
| | | | | |
Shares issued in reinvestment of dividends | | | 7,638 | | | | 2,705 | | | | | | | | 79,812 | | | | 26,942 | | | | | |
| | | | | |
Shares redeemed | | | (79,745 | ) | | | – 0 | – | | | | | | | (1,000,000 | ) | | | – 0 | – | | | | |
| | | | | |
Net increase (decrease) | | | (72,107 | ) | | | 500,705 | | | | | | | $ | (920,188 | ) | | $ | 5,006,942 | | | | | |
| | | | | |
| * | Commencement of operations. |
NOTE F
Risks Involved in Investing in the Fund
Emerging Market Risk—Investments in emerging market countries may have more risk because the markets are less developed and less liquid, and because these investments may be subject to increased economic, political, and regulatory or other uncertainties.
Foreign (Non-U.S.) Risk—Investments in securities of non-U.S. issuers may involve more risk than those of U.S. issuers. These securities may fluctuate more widely in price and may be less liquid due to adverse market, economic, political, regulatory or other factors.
Currency Risk—Fluctuations in currency exchange rates may negatively affect the value of the Fund’s investments or reduce its returns.
Capitalization Risk—Investments in small- and mid-capitalization companies may be more volatile than investments in large-capitalization companies. Investments in small-capitalization companies may have additional risks because these companies have limited product lines, markets or financial resources.
Derivatives Risk—The Fund may enter into derivative transactions such as forwards, options, futures and swaps. Derivatives may be illiquid, difficult to price, and leveraged so that small changes may produce disproportionate losses for the Fund, and subject to counterparty risk to a greater degree than more traditional investments. Derivatives may result in significant losses, including losses that are far greater than the value of the derivatives reflected in the statement of assets and liabilities.
Non-diversification Risk—The Fund may have more risk because it is “non-diversified”, meaning that it can invest more of its assets in a smaller
| | |
| 34 | AB EMERGING MARKETS CORE PORTFOLIO | | abfunds.com |
NOTES TO FINANCIAL STATEMENTS (continued)
number of issuers. Accordingly, changes in the value of a single security may have a more significant effect, either negative or positive, on the Fund’s net asset value, or NAV.
Sector Risk—The Fund may have more risk because of concentrated investments in a particular market sector, such as the technology or financial services sector. Market or economic factors affecting that sector could have a major effect on the value of the Fund’s investments.
Indemnification Risk—In the ordinary course of business, the Fund enters into contracts that contain a variety of indemnifications. The Fund’s maximum exposure under these arrangements is unknown. However, the Fund has not had prior claims or losses pursuant to these indemnification provisions and expects the risk of loss thereunder to be remote. Therefore, the Fund has not accrued any liability in connection with these indemnification provisions.
NOTE G
Joint Credit Facility
A number of open-end mutual funds managed by the Adviser, including the Fund, participate in a $280 million revolving credit facility (the “Facility”) intended to provide short-term financing if necessary, subject to certain restrictions in connection with abnormal redemption activity. Commitment fees related to the Facility are paid by the participating funds and are included in miscellaneous expenses in the statement of operations. The Fund did not utilize the Facility during the year ended June 30, 2017.
NOTE H
Distributions to Shareholders
The tax character of distributions paid during the fiscal year ended June 30, 2017 and the fiscal period ended June 30, 2016 were as follows:
| | | | | | | | |
| | | 2017 | | | 2016 | |
Distributions paid from: | | | | | | | | |
Ordinary income | | $ | 80,000 | | | $ | 27,010 | |
| | | | | | | | |
Total taxable distributions paid | | $ | 80,000 | | | $ | 27,010 | |
| | | | | | | | |
As of June 30, 2017, the components of accumulated earnings/(deficit) on a tax basis were as follows:
| | | | |
Undistributed ordinary income | | $ | 70,109 | |
Undistributed capital gains | | | 317,319 | (a) |
Unrealized appreciation/(depreciation) | | | 941,285 | (b) |
| | | | |
Total accumulated earnings/(deficit) | | $ | 1,328,713 | (c) |
| | | | |
| (a) | During the fiscal year, the Fund utilized $163,882 of capital loss carryforwards to offset current year net realized gains. |
| (b) | The difference between book-basis and tax-basis unrealized appreciation/(depreciation) is attributable primarily to the tax deferral of losses on wash sales. |
| (c) | The difference between book-basis and tax-basis components of accumulated earnings/(deficit) is attributable primarily to the tax treatment of accrued Argentinian capital gains tax. |
| | |
| abfunds.com | | AB EMERGING MARKETS CORE PORTFOLIO | 35 |
NOTES TO FINANCIAL STATEMENTS (continued)
For tax purposes, net realized capital losses may be carried over to offset future capital gains, if any. Funds are permitted to carry forward capital losses for an indefinite period, and such losses will retain their character as either short-term or long-term capital losses. As of June 30, 2017, the Fund did not have any capital loss carryforwards.
During the current fiscal year, permanent differences primarily due to the tax treatment of offering costs, foreign currency reclassifications, and reclassifications of foreign capital gains tax resulted in a net increase in undistributed net investment income, a net decrease in accumulated net realized gain on investments and foreign currency transactions, and a net decrease in additional paid-in capital. These reclassifications had no effect on net assets.
NOTE I
Other
In October 2016, the U.S. Securities and Exchange Commission adopted new rules and amended existing rules (together, “final rules”) intended to modernize the reporting and disclosure of information by registered investment companies. In part, the final rules amend Regulation S-X and require standardized, enhanced disclosure about derivatives in investment company financial statements, as well as other amendments. The compliance date for the amendments to Regulation S-X is August 1, 2017 (for reporting period end dates of August 31, 2017 or after). Management has evaluated the impact of the amendments and expects the effect of the adoption of the final rules on financial statements will be limited to additional disclosures.
NOTE J
Subsequent Events
Management has evaluated subsequent events for possible recognition or disclosure in the financial statements through the date the financial statements are issued. Management has determined that there are no material events that would require disclosure in the Portfolio’s financial statements through this date.
| | |
| 36 | AB EMERGING MARKETS CORE PORTFOLIO | | abfunds.com |
FINANCIAL HIGHLIGHTS
Selected Data For A Share Of Capital Stock Outstanding Throughout Each Period
| | | | | | | | |
| | | Class A | |
| | | Year Ended
June 30,
2017 | | | September 9,
2015(a) to
June 30,
2016 | |
| | | | |
Net asset value, beginning of period | | | $ 10.80 | | | | $ 10.00 | |
| | | | |
Income From Investment Operations | | | | | | | | |
Net investment income(b)(c) | | | .12 | | | | .07 | |
Net realized and unrealized gain on investment and foreign currency transactions | | | 1.79 | | | | .78 | |
| | | | |
Net increase in net asset value from operations | | | 1.91 | | | | .85 | |
| | | | |
Less: Dividends | | | | | | | | |
Dividends from net investment income | | | (.13 | ) | | | (.05 | ) |
| | | | |
Net asset value, end of period | | | $ 12.58 | | | | $ 10.80 | |
| | | | |
Total Return | | | | | | | | |
Total investment return based on net asset value(d) | | | 17.96 | % | | | 8.50 | % |
Ratios/Supplemental Data | | | | | | | | |
Net assets, end of period (000’s omitted) | | | $13 | | | | $11 | |
Ratio to average net assets of: | | | | | | | | |
Expenses, net of waivers/reimbursements | | | 1.60 | % | | | 1.65 | %(e) |
Expenses, before waivers/reimbursements | | | 6.88 | % | | | 8.26 | %(e) |
Net investment income(c) | | | 1.04 | % | | | .87 | %(e) |
Portfolio turnover rate | | | 94 | % | | | 62 | % |
See footnote summary on page 39.
| | |
| abfunds.com | | AB EMERGING MARKETS CORE PORTFOLIO | 37 |
FINANCIAL HIGHLIGHTS (continued)
Selected Data For A Share Of Capital Stock Outstanding Throughout Each Period
| | | | | | | | |
| | | Class C | |
| | | Year Ended
June 30,
2017 | | | September 9,
2015(a) to
June 30,
2016 | |
| | | | |
Net asset value, beginning of period | | | $ 10.76 | | | | $ 10.00 | |
| | | | |
Income From Investment Operations | | | | | | | | |
Net investment income(b)(c) | | | .03 | | | | .01 | |
Net realized and unrealized gain on investment and foreign currency transactions | | | 1.80 | | | | .77 | |
| | | | |
Net increase in net asset value from operations | | | 1.83 | | | | .78 | |
| | | | |
Less: Dividends | | | | | | | | |
Dividends from net investment income | | | (.05 | ) | | | (.02 | ) |
| | | | |
Net asset value, end of period | | | $ 12.54 | | | | $ 10.76 | |
| | | | |
Total Return | | | | | | | | |
Total investment return based on net asset value(d) | | | 17.14 | % | | | 7.84 | % |
Ratios/Supplemental Data | | | | | | | | |
Net assets, end of period (000’s omitted) | | | $13 | | | | $11 | |
Ratio to average net assets of: | | | | | | | | |
Expenses, net of waivers/reimbursements | | | 2.35 | % | | | 2.40 | %(e) |
Expenses, before waivers/reimbursements | | | 7.67 | % | | | 9.01 | %(e) |
Net investment income(c) | | | .29 | % | | | .11 | %(e) |
Portfolio turnover rate | | | 94 | % | | | 62 | % |
See footnote summary on page 39.
| | |
| 38 | AB EMERGING MARKETS CORE PORTFOLIO | | abfunds.com |
FINANCIAL HIGHLIGHTS (continued)
Selected Data For A Share Of Capital Stock Outstanding Throughout Each Period
| | | | | | | | |
| | | Advisor Class | |
| | | Year Ended
June 30,
2017 | | | September 9,
2015(a) to
June 30,
2016 | |
| | | | |
Net asset value, beginning of period | | | $ 10.81 | | | | $ 10.00 | |
| | | | |
Income From Investment Operations | | | | | | | | |
Net investment income(b)(c) | | | .14 | | | | .09 | |
Net realized and unrealized gain on investment and foreign currency transactions | | | 1.81 | | | | .77 | |
| | | | |
Net increase in net asset value from operations | | | 1.95 | | | | .86 | |
| | | | |
Less: Dividends | | | | | | | | |
Dividends from net investment income | | | (.16 | ) | | | (.05 | ) |
| | | | |
Net asset value, end of period | | | $ 12.60 | | | | $ 10.81 | |
| | | | |
Total Return | | | | | | | | |
Total investment return based on net asset value(d) | | | 18.34 | % | | | 8.69 | % |
Ratios/Supplemental Data | | | | | | | | |
Net assets, end of period (000’s omitted) | | | $5,399 | | | | $5,413 | |
Ratio to average net assets of: | | | | | | | | |
Expenses, net of waivers/reimbursements | | | 1.35 | % | | | 1.40 | %(e) |
Expenses, before waivers/reimbursements | | | 6.58 | % | | | 8.01 | %(e) |
Net investment income(c) | | | 1.27 | % | | | 1.12 | %(e) |
Portfolio turnover rate | | | 94 | % | | | 62 | % |
| (a) | Commencement of operations. |
| (b) | Based on average shares outstanding. |
| (c) | Net of expenses waived/reimbursed by the Adviser. |
| (d) | Total investment return is calculated assuming an initial investment made at the net asset value at the beginning of the period, reinvestment of all dividends and distributions at net asset value during the period, and redemption on the last day of the period. Initial sales charge or contingent deferred sales charge is not reflected in the calculation of total investment return. Total investment return does not reflect the deduction of taxes that a shareholder would pay on fund distributions or the redemption of fund shares. Total investment return for a period of less than one year is not annualized. |
See notes to financial statements.
| | |
| abfunds.com | | AB EMERGING MARKETS CORE PORTFOLIO | 39 |
REPORT OF INDEPENDENT REGISTERED
PUBLIC ACCOUNTING FIRM
To the Board of Directors and Shareholders of AB Emerging Markets Core Portfolio
We have audited the accompanying statement of assets and liabilities, including the portfolio of investments, of AB Emerging Markets Core Portfolio (the “Fund”), one of the funds constituting the AB Cap Fund, Inc., as of June 30, 2017, and the related statement of operations for the year then ended, and the statements of changes in net assets and the financial highlights for the year then ended and the period September 9, 2015 (commencement of operations) to June 30, 2016. These financial statements and financial highlights are the responsibility of the Fund’s management. Our responsibility is to express an opinion on these financial statements and financial highlights based on our audits.
We conducted our audits in accordance with the standards of the Public Company Accounting Oversight Board (United States). Those standards require that we plan and perform the audit to obtain reasonable assurance about whether the financial statements and financial highlights are free of material misstatement. We were not engaged to perform an audit of the Fund’s internal control over financial reporting. Our audits included consideration of internal control over financial reporting as a basis for designing audit procedures that are appropriate in the circumstances, but not for the purpose of expressing an opinion on the effectiveness of the Fund’s internal control over financial reporting. Accordingly, we express no such opinion. An audit also includes examining, on a test basis, evidence supporting the amounts and disclosures in the financial statements and financial highlights, assessing the accounting principles used and significant estimates made by management, and evaluating the overall financial statement presentation. Our procedures included confirmation of securities owned as of June 30, 2017 by correspondence with the custodian and others or by other appropriate auditing procedures where replies from others were not received. We believe that our audits provide a reasonable basis for our opinion.
In our opinion, the financial statements and financial highlights referred to above present fairly, in all material respects, the financial position of AB Emerging Markets Core Portfolio, one of the funds constituting the AB Cap Fund, Inc., at June 30, 2017, and the results of its operations for the year then ended, and the changes in its net assets and the financial highlights for the year then ended and the period September 9, 2015 (commencement of operations) to June 30, 2016, in conformity with U.S. generally accepted accounting principles.

New York, New York
August 25, 2017
| | |
| 40 | AB EMERGING MARKETS CORE PORTFOLIO | | abfunds.com |
2017 FEDERAL TAX INFORMATION
(unaudited)
For Federal income tax purposes, the following information is furnished with respect to the earnings of the Fund for the taxable period ended June 30, 2017.
For corporate shareholders, 6.20% of dividends paid qualify for the dividends received deduction.
For individual shareholders, the Fund designates 70.92% of dividends paid as qualified dividend income.
The Fund intends to make an election to pass through foreign taxes to its shareholders. For the taxable period ended June 30, 2017, $20,263 of foreign taxes may be passed through and the associated foreign source income for information reporting purposes is $163,509.
Shareholders should not use the above information to prepare their income tax returns. The information necessary to complete your income tax returns will be included with your Form 1099-DIV which will be sent to you separately in January 2018.
| | |
| abfunds.com | | AB EMERGING MARKETS CORE PORTFOLIO | 41 |
BOARD OF DIRECTORS
| | |
Marshall C. Turner, Jr.(1) , Chairman John H. Dobkin(1) Michael J. Downey(1) William H. Foulk, Jr.(1) D. James Guzy(1) Nancy P. Jacklin(1) | | Robert M. Keith, President and Chief Executive Officer Carol C. McMullen(1) Garry L. Moody(1) Earl D. Weiner(1) |
OFFICERS
| | |
Philip L. Kirstein, Senior Vice President and Independent Compliance Officer Kent W. Hargis(2), Vice President Stuart Rae(2), Vice President Sammy Suzuki(2), Vice President Emilie D. Wrapp, Secretary | | Phyllis J. Clarke, Controller Vincent S. Noto, Chief Compliance Officer Joseph J. Mantineo, Treasurer and Chief Financial Officer |
| | |
Custodian and Accounting Agent Brown Brothers Harriman & Co. 50 Post Office Square Boston, MA 02110 | | Independent Registered Public Accounting Firm Ernst & Young LLP 5 Times Square New York, NY 10036 |
| |
Principal Underwriter AllianceBernstein Investments, Inc. 1345 Avenue of the Americas New York, NY 10105 | | Legal Counsel Seward & Kissel LLP One Battery Park Plaza New York, NY 10004 |
| |
Transfer Agent AllianceBernstein Investor Services,
Inc. P.O. Box 786003 San Antonio, TX 78278-6003 Toll-Free (800) 221-5672 | | |
| 1 | Member of the Audit Committee, the Governance and Nominating Committee and the Independent Directors Committee. |
| 2 | The day-to-day management of, and investment decisions for, the Fund’s portfolio are made by the Adviser’s portfolio manages. Messrs. Hargis, Rae and Suzuki are the investment professionals with the most significant responsibility for the day-to-day management of the Fund’s portfolio. |
| | |
| 42 | AB EMERGING MARKETS CORE PORTFOLIO | | abfunds.com |
MANAGEMENT OF THE FUND
| | | | | | | | |
NAME, ADDRESS*, AGE, (YEAR FIRST ELECTED**) | | PRINCIPAL OCCUPATION(S) DURING PAST FIVE YEARS AND OTHER INFORMATION*** | | PORTFOLIOS
IN FUND
COMPLEX
OVERSEEN BY
DIRECTOR | | | OTHER PUBLIC
COMPANY
DIRECTORSHIPS
CURRENTLY HELD
BY DIRECTOR |
| INTERESTED DIRECTOR | | | | | | |
Robert M. Keith, # 1345 Avenue of the Americas New York, NY 10105 57
(2015) | | Senior Vice President of AllianceBernstein L.P. (the “Adviser”) and the head of AllianceBernstein Investments, Inc. (“ABI”) since July 2008; Director of ABI and President of the AB Mutual Funds. Previously, he served as Executive Managing Director of ABI from December 2006 to June 2008. Prior to joining ABI in 2006, Executive Managing Director of Bernstein Global Wealth Management, and prior thereto, Senior Managing Director and Global Head of Client Service and Sales of the Adviser’s institutional investment management business since 2004. Prior thereto, he was Managing Director and Head of North American Client Service and Sales in the Adviser’s institutional investment management business, with which he had been associated since prior to 2004. | | | 97 | | | None |
| | | | | | | | |
| | |
| abfunds.com | | AB EMERGING MARKETS CORE PORTFOLIO | 43 |
MANAGEMENT OF THE FUND (continued)
| | | | | | | | |
NAME, ADDRESS*, AGE, (YEAR FIRST ELECTED**) | | PRINCIPAL OCCUPATION(S) DURING PAST FIVE YEARS AND OTHER INFORMATION*** | | PORTFOLIOS
IN FUND
COMPLEX
OVERSEEN BY
DIRECTOR | | | OTHER PUBLIC
COMPANY
DIRECTORSHIPS
CURRENTLY HELD
BY DIRECTOR |
| DISINTERESTED DIRECTORS | | | | | | |
Marshall C. Turner, Jr., ## Chairman of the Board 75 (2015) | | Private Investor since prior to 2012. Former Chairman and CEO of Dupont Photomasks, Inc. (components of semi- conductor manufacturing). He has extensive operating leadership and venture capital investing experience, including five interim or full-time CEO roles, and prior service as general partner of institutional venture capital partnerships. He also has extensive non-profit board leadership experience, and currently serves on the boards of two education and science-related non- profit organizations. He has served as a director of one AB Fund since 1992, and director or trustee of multiple AB Funds since 2005. He has been Chairman of the AB Funds since January 2014, and the Chairman of the Independent Directors Committees of such AB Funds since February 2014. | | | 97 | | | Xilinx, Inc. (programmable logic semi- conductors) since 2007 |
| | | | | | | | |
John H. Dobkin, ## 75 (2015) | | Independent Consultant since prior to 2012. Formerly, President of Save Venice, Inc. (preservation organization) from 2001-2002; Senior Advisor from June 1999-June 2000 and President of Historic Hudson Valley (historic preservation) from December 1989-May 1999. Previously, Director of the National Academy of Design. He has served as a director or trustee of various AB Funds since 1992, and as Chairman of the Audit Committees of a number of such AB Funds from 2001-2008. | | | 96 | | | None |
| | |
| 44 | AB EMERGING MARKETS CORE PORTFOLIO | | abfunds.com |
MANAGEMENT OF THE FUND (continued)
| | | | | | | | |
NAME, ADDRESS*, AGE, (YEAR FIRST ELECTED**) | | PRINCIPAL OCCUPATION(S) DURING PAST FIVE YEARS AND OTHER INFORMATION*** | | PORTFOLIOS
IN FUND
COMPLEX
OVERSEEN BY
DIRECTOR | | | OTHER PUBLIC
COMPANY
DIRECTORSHIPS
CURRENTLY HELD
BY DIRECTOR |
DISINTERESTED DIRECTORS
(continued) | | | | | | |
Michael J. Downey, ## 73 (2015) | | Private Investor since prior to 2012. Formerly, managing partner of Lexington Capital, LLC (investment advisory firm) from December 1997 until December 2003. He also served as a Director of Prospect Acquisition Corp. (financial services) from 2007 until 2009. From 1987 until 1993, Chairman and CEO of Prudential Mutual Fund Management, director of the Prudential mutual funds, and member of the Executive Committee of Prudential Securities Inc. He has served as a director or trustee of the AB Funds since 2005 and is a director and Chairman of one other registered investment company. | | | 97 | | | The Asia Pacific Fund, Inc. (registered investment company) since prior to 2012 |
| | | | | | | | |
William H. Foulk, Jr., ## 84 (2015) | | Investment Adviser and an Independent Consultant since prior to 2012. Previously, he was Senior Manager of Barrett Associates, Inc., a registered investment adviser. He was formerly Deputy Comptroller and Chief Investment Officer of the State of New York and, prior thereto, Chief Investment Officer of the New York Bank for Savings. He has served as a director or trustee of various AB Funds since 1983, and was Chairman of the Independent Directors Committees of the AB Funds from 2003 until early February 2014. He served as Chairman of such AB Funds from 2003 through December 2013. He is also active in a number of mutual fund related organizations and committees. | | | 97 | | | None |
| | |
| abfunds.com | | AB EMERGING MARKETS CORE PORTFOLIO | 45 |
MANAGEMENT OF THE FUND (continued)
| | | | | | | | |
NAME, ADDRESS*, AGE, (YEAR FIRST ELECTED**) | | PRINCIPAL OCCUPATION(S) DURING PAST FIVE YEARS AND OTHER INFORMATION*** | | PORTFOLIOS
IN FUND
COMPLEX
OVERSEEN BY
DIRECTOR | | | OTHER PUBLIC
COMPANY
DIRECTORSHIPS
CURRENTLY HELD
BY DIRECTOR |
DISINTERESTED DIRECTORS
(continued) | | | | | | |
D. James Guzy, ## 81 (2015) | | Chairman of the Board of SRC Computers, Inc. (semi-conductors), with which he has been associated since prior to 2012. He served as Chairman of the Board of PLX Technology (semi-conductors) since prior to 2012 until November 2013. He was a director of Intel Corporation (semi-conductors) from 1969 until 2008, and served as Chairman of the Finance Committee of such company for several years until May 2008. He has served as a director or trustee of one or more of the AB Funds since 1982. | | | 94 | | | None |
| | | | | | | | |
Nancy P. Jacklin, ## 69 (2015) | | Private Investor since prior to 2012. Professorial Lecturer at the Johns Hopkins School of Advanced International Studies (2008-2015). U.S. Executive Director of the International Monetary Fund (which is responsible for ensuring the stability of the international monetary system), (December 2002-May 2006); Partner, Clifford Chance (1992-2002); Sector Counsel, International Banking and Finance, and Associate General Counsel, Citicorp (1985-1992); Assistant General Counsel (International), Federal Reserve Board of Governors (1982-1985); and Attorney Advisor, U.S. Department of the Treasury (1973-1982). Member of the Bar of the District of Columbia and of New York; and member of the Council on Foreign Relations. She has served as a director or trustee of the AB Funds since 2006 and has been Chairman of the Governance and Nominating Committees of the AB Funds since August 2014. | | | 97 | | | None |
| | |
| 46 | AB EMERGING MARKETS CORE PORTFOLIO | | abfunds.com |
MANAGEMENT OF THE FUND (continued)
| | | | | | | | |
NAME, ADDRESS*, AGE, (YEAR FIRST ELECTED**) | | PRINCIPAL OCCUPATION(S) DURING PAST FIVE YEARS AND OTHER INFORMATION*** | | PORTFOLIOS
IN FUND
COMPLEX
OVERSEEN BY
DIRECTOR | | | OTHER PUBLIC
COMPANY
DIRECTORSHIPS
CURRENTLY HELD
BY DIRECTOR |
DISINTERESTED DIRECTORS
(continued) | | | | | | |
Carol C. McMullen, ## 62 (2016) | | Managing Director of Slalom Consulting (consulting) since 2014, private investor and member of the Partners Healthcare Investment Committee. Formerly, Director of Norfolk & Dedham Group (mutual property and casualty insurance) from 2011 until November 2016; Director of Partners Community Physicians Organization (healthcare) from 2014 until December 2016; and Managing Director of The Crossland Group (consulting) from 2012 until 2013. She has held a number of senior positions in the asset and wealth management industries, including at Eastern Bank (where her roles included President of Eastern Wealth Management), Thomson Financial (Global Head of Sales for Investment Management), and Putnam Investments (where her roles included Head of Global Investment Research). She has served on a number of private company and nonprofit boards, and as a director or trustee of the AB Funds since June 2016. | | | 97 | | | None |
| | | | | | | | |
| | |
| abfunds.com | | AB EMERGING MARKETS CORE PORTFOLIO | 47 |
MANAGEMENT OF THE FUND (continued)
| | | | | | | | |
NAME, ADDRESS*, AGE, (YEAR FIRST ELECTED**) | | PRINCIPAL OCCUPATION(S) DURING PAST FIVE YEARS AND OTHER INFORMATION*** | | PORTFOLIOS
IN FUND
COMPLEX
OVERSEEN BY
DIRECTOR | | | OTHER PUBLIC
COMPANY
DIRECTORSHIPS
CURRENTLY HELD
BY DIRECTOR |
DISINTERESTED DIRECTORS
(continued) | | | | | | |
Garry L. Moody, ## 65 (2015) | | Independent Consultant. Formerly, Partner, Deloitte & Touche LLP (1995-2008) where he held a number of senior positions, including Vice Chairman, and U.S. and Global Investment Management Practice Managing Partner; President, Fidelity Accounting and Custody Services Company (1993-1995), where he was responsible for the accounting, pricing, custody and reporting for the Fidelity mutual funds; and Partner, Ernst & Young LLP (1975-1993), where he served as the National Director of Mutual Fund Tax Services and Managing Partner of its Chicago Office Tax department. He is a member of the Trustee Advisory Board of BoardIQ, a biweekly publication focused on issues and news affecting directors of mutual funds. He has served as a director or trustee and as Chairman of the Audit Committees of the AB Funds since 2008. | | | 97 | | | None |
| | | | | | | | |
Earl D. Weiner, ## 78 (2015) | | Of Counsel, and Partner prior to January 2007, of the law firm Sullivan & Cromwell LLP and is a former member of the ABA Federal Regulation of Securities Committee Task Force to draft editions of the Fund Director’s Guidebook. He also serves as a director or trustee of various non-profit organizations and has served as Chairman or Vice Chairman of a number of them. He has served as a director or trustee of the AB Funds since 2007 and served as Chairman of the Governance and Nominating Committees of the AB Funds from 2007 until August 2014. | | | 97 | | | None |
| | |
| 48 | AB EMERGING MARKETS CORE PORTFOLIO | | abfunds.com |
MANAGEMENT OF THE FUND (continued)
| * | | The address for each of the Fund’s disinterested Directors is c/o AllianceBernstein L.P., Attention: Philip L. Kirstein, 1345 Avenue of the Americas, New York, NY 10105. |
| ** | | There is no stated term of office for the Fund’s Directors. |
| *** | | The information above includes each Director’s principal occupation during the last five years and other information relating to the experience, attributes and skills relevant to each Director’s qualifications to serve as a Director, which led to the conclusion that each Director should serve as a Director for the Fund. |
| # | | Mr. Keith is an “interested person” of the Fund, as defined in the 1940 Act, due to his position as a Senior Vice President of the Adviser. |
| ## | | Member of the Audit Committee, the Governance and Nominating Committee and the Independent Directors Committee. |
| | |
| abfunds.com | | AB EMERGING MARKETS CORE PORTFOLIO | 49 |
MANAGEMENT OF THE FUND (continued)
| | | | |
Officer Information | | |
Robert M. Keith 57 | | President and Chief Executive Officer | | See biography above. |
| | | | |
Philip L. Kirstein 72 | | Senior Vice President and Independent Compliance Officer | | Senior Vice President and Independent Compliance Officer of the AllianceBernstein Funds, with which he has been associated since October 2004. Prior thereto, he was Of Counsel to Kirkpatrick & Lockhart, LLP from October 2003 to October 2004, and General Counsel of Merrill Lynch Investment Managers, L.P., since prior to March 2003. |
| | | | |
Kent W. Hargis 48 | | Vice President | | Senior Vice President of the Adviser**, with which he has been associated since prior to 2012. |
| | | | |
Stuart Rae 51 | | Vice President | | Senior Vice President of the Adviser**, with which he has been associated since prior to 2012. |
| | | | |
Sammy Suzuki 46 | | Vice President | | Senior Vice President of the Adviser**, with which he has been associated since prior to 2012. |
| | | | |
Emilie D. Wrapp 61 | | Secretary | | Senior Vice President, Assistant General Counsel and Assistant Secretary of ABI**, with which she has been associated since prior to 2012. |
| | | | |
Joseph J. Mantineo 58 | | Treasurer and Chief Financial Officer | | Senior Vice President of AllianceBernstein Investor Services (“ABIS”)**, with which he has been associated since prior to 2012. |
| | | | |
Phyllis J. Clarke 56 | | Controller | | Vice President of ABIS**, with which she has been associated since prior to 2012. |
| | | | |
Vincent S. Noto 52 | | Chief Compliance Officer | | Senior Vice President since 2015 and Mutual Fund Chief Compliance Officer since 2014. Prior thereto, he was Vice President and Director of Mutual Fund Compliance of the Adviser** since prior to 2012. |
| * | | The address for each of the Fund’s Officers is 1345 Avenue of the Americas, New York, NY 10105. |
| ** | | The Adviser, ABI and ABIS are affiliates of the Fund. |
| | | The Fund’s Statement of Additional Information (“SAI”) has additional information about the Fund’s Directors and Officers and is available without charge upon request. Contact your financial representative or AB at 1-(800) 227-4618, or visit www.abfunds.com, for a free prospectus or SAI. |
| | |
| 50 | AB EMERGING MARKETS CORE PORTFOLIO | | abfunds.com |
Information Regarding the Review and Approval of the Fund’s Advisory Agreement
The disinterested directors (the “directors”) of AB Cap Fund, Inc. (the “Company”) unanimously approved the continuance of the Company’s Advisory Agreement with the Adviser, as proposed to be amended to effect a fee reduction (as so amended, the “Advisory Agreement”) in respect of AB Emerging Markets Core Portfolio (the “Fund”) at a meeting held on May 2-4, 2017 (the “Meeting”).
Prior to approval of the continuance of the Advisory Agreement, the directors had requested from the Adviser, and received and evaluated, extensive materials. They reviewed the proposed continuance of the Advisory Agreement with the Adviser and with experienced counsel who are independent of the Adviser, who advised on the relevant legal standards. The directors also reviewed an independent evaluation prepared by the Company’s Senior Officer (who is also the Company’s Independent Compliance Officer), who acted as their independent fee consultant, of the reasonableness of the proposed advisory fee, in which the Senior Officer concluded that the proposed contractual fee for the Fund was reasonable. The directors also discussed the proposed continuance in private sessions with counsel and the Company’s Senior Officer.
The directors considered their knowledge of the nature and quality of the services provided by the Adviser to the Fund gained from their experience as directors or trustees of most of the registered investment companies advised by the Adviser, their overall confidence in the Adviser’s integrity and competence they have gained from that experience, the Adviser’s initiative in identifying and raising potential issues with the directors and its responsiveness, frankness and attention to concerns raised by the directors in the past, including the Adviser’s willingness to consider and implement organizational and operational changes designed to improve investment results and the services provided to the AB Funds. The directors noted that they have four regular meetings each year, at each of which they review extensive materials and information from the Adviser, including information on the investment performance of the Fund.
The directors also considered all factors they believed relevant, including the specific matters discussed below. During the course of their deliberations, the directors evaluated, among other things, the reasonableness of the proposed advisory fee. The directors did not identify any particular information that was all-important or controlling, and different directors may have attributed different weights to the various factors. The directors determined that the selection of the Adviser to manage the Fund and the overall arrangements between the Fund and the Adviser, as provided in the Advisory Agreement, including the proposed advisory fee, were fair and reasonable in light of the services performed, expenses incurred and such other matters as the directors considered relevant in the exercise of
| | |
| abfunds.com | | AB EMERGING MARKETS CORE PORTFOLIO | 51 |
their business judgment. The directors noted that the proposed lowering of the advisory fee would benefit the Fund and its shareholders. The directors noted that the Adviser was reducing the fees for business reasons, and had assured them that there would be no diminution in the nature or quality of services to the Fund. The material factors and conclusions that formed the basis for the directors’ determinations included the following:
Nature, Extent and Quality of Services Provided
The directors considered the scope and quality of services provided by the Adviser under the Advisory Agreement, including the quality of the investment research capabilities of the Adviser and the other resources it has dedicated to performing services for the Fund. They also noted the professional experience and qualifications of the Fund’s portfolio management team and other senior personnel of the Adviser. The directors also considered that the Advisory Agreement provides that the Fund will reimburse the Adviser for the cost to it of providing certain clerical, accounting, administrative and other services to the Fund by employees of the Adviser or its affiliates. Requests for these reimbursements are made on a quarterly basis and subject to approval by the directors. To date, the Adviser has not requested any reimbursements from the Fund. The directors noted that the methodology used to determine the reimbursement amounts had been reviewed by an independent consultant retained by the Company’s Senior Officer. The quality of administrative and other services, including the Adviser’s role in coordinating the activities of the Fund’s other service providers, also was considered. The directors concluded that, overall, they were satisfied with the nature, extent and quality of services provided to the Fund under the Advisory Agreement.
Costs of Services Provided and Profitability
The directors reviewed a schedule of the revenues and expenses and related notes indicating the profitability of the Fund to the Adviser for the period ended December 31, 2015 and calendar year 2016 that had been prepared with an expense allocation methodology arrived at in consultation with an independent consultant retained by the Company’s Senior Officer. The directors noted the assumptions and methods of allocation used by the Adviser in preparing fund-specific profitability data and understood that there are a number of potentially acceptable allocation methodologies for information of this type. The directors noted that the profitability information reflected all revenues and expenses of the Adviser’s relationship with the Fund, including those relating to its subsidiaries that provide transfer agency, distribution and brokerage services to the Fund, and that the proposed reduction in the advisory fee rate would likely impact the Adviser’s profitability analysis in future years. The directors recognized that it is difficult to make comparisons of the profitability of the Advisory Agreement with the profitability of advisory contracts for unaffiliated funds because comparative information is not generally publicly available and is affected by numerous factors. The directors focused on the profitability of
| | |
| 52 | AB EMERGING MARKETS CORE PORTFOLIO | | abfunds.com |
the Adviser’s relationship with the Fund before taxes and distribution expenses. The directors noted that the Fund was not profitable to the Adviser in the periods reviewed.
Fall-Out Benefits
The directors considered the other benefits to the Adviser and its affiliates from their relationships with the Fund, including, but not limited to, benefits relating to soft dollar arrangements (whereby investment advisers receive brokerage and research services from brokers that execute agency transactions for their clients); 12b-1 fees and sales charges received by the Fund’s principal underwriter (which is a wholly owned subsidiary of the Adviser) in respect of certain classes of the Fund’s shares; brokerage commissions paid by the Fund to brokers affiliated with the Adviser; and transfer agency fees paid by the Fund to a wholly owned subsidiary of the Adviser. The directors recognized that the Fund’s unprofitability to the Adviser would be exacerbated without these benefits. The directors understood that the Adviser also might derive reputational and other benefits from its association with the Fund.
Investment Results
In addition to the information reviewed by the directors in connection with the Meeting, the directors receive detailed performance information for the Fund at each regular Board meeting during the year.
At the Meeting, the directors reviewed information prepared by an analytical service that is not affiliated with the Adviser (the “15(c) service provider”), showing the performance of the Class A Shares of the Fund against a peer group and a peer universe, and information prepared by the Adviser showing performance of the Class A Shares against a broad-based securities market index, in each case for the 1-year period ended February 28, 2017 and (in the case of comparisons with the broad-based securities market index) for the period from inception. Based on their review, and their discussion with the Adviser of the reasons for the Fund’s underperformance in certain periods, the directors concluded that the Fund’s investment performance was acceptable.
Advisory Fees and Other Expenses
The directors considered the proposed advisory fee rate payable by the Fund to the Adviser and information prepared by the 15(c) service provider concerning advisory fee rates paid by other funds in the same category as the Fund at a common asset level. The directors recognized that it is difficult to make comparisons of advisory fees because there are variations in the services that are included in the fees paid by other funds. The directors compared the Fund’s pro forma contractual effective advisory fee rate (reflecting the proposed reduction in the advisory fee rate effective May 5, 2017) with a peer group median.
| | |
| abfunds.com | | AB EMERGING MARKETS CORE PORTFOLIO | 53 |
The directors also considered the Adviser’s fee schedule for institutional clients pursuing a similar investment style. For this purpose, they reviewed the relevant advisory fee information from the Adviser’s Form ADV and the evaluation from the Company’s Senior Officer and noted the differences between the Fund’s fee schedule, on the one hand, and the institutional fee schedule and the schedule of fees charged to any offshore funds and any sub-advised funds, on the other. The directors noted that the Adviser may, in some cases, agree to fee rates with large institutional clients that are lower than those reviewed by the directors and that they had previously discussed with the Adviser its policies in respect of such arrangements.
The Adviser reviewed with the directors the significantly greater scope of the services it provides to the Fund relative to institutional, offshore fund and sub-advised fund clients. In light of the substantial differences in services rendered by the Adviser to institutional, offshore fund and sub-advised fund clients as compared to funds such as the Fund, the directors considered these fee comparisons inapt and did not place significant weight on them in their deliberations.
The directors noted that the Fund may invest in shares of exchange-traded funds (“ETFs”), subject to the restrictions and limitations of the Investment Company Act of 1940 as these may be varied as a result of exemptive orders issued by the SEC. The directors also noted that ETFs pay advisory fees pursuant to their advisory contracts. The directors concluded, based on the Adviser’s explanation of how it may use ETFs when they are the most cost-effective way to obtain desired exposures for a fund or to temporarily “equitize” cash inflows pending purchases of underlying securities, that the proposed advisory fee for the Fund would be paid for services that would be in addition to, rather than duplicative of, the services provided under the advisory contracts of the ETFs.
The directors also considered the total expense ratio of the Class A shares of the Fund in comparison to a peer group and a peer universe selected by the 15(c) service provider. The Class A expense ratio of the Fund was based on the Fund’s latest fiscal year and the information included the pro forma expense ratio to reflect a reduction in the Fund’s expense ratio effective May 5, 2017. The directors considered the effects of any fee waivers and/or expense reimbursements as a result of the Adviser’s expense cap, which will be set at a lower level when the proposed advisory fee reduction takes effect on May 5, 2017. The directors noted that it was likely that the expense ratios of some of the other funds in the Fund’s category were lowered by waivers or reimbursements by those funds’ investment advisers, which in some cases might be voluntary or temporary. The directors view expense ratio information as relevant to their evaluation of the Adviser’s services because the Adviser is responsible for coordinating services provided to the Fund by others. Based on their review, the directors concluded that the Fund’s pro forma expense ratio was acceptable.
| | |
| 54 | AB EMERGING MARKETS CORE PORTFOLIO | | abfunds.com |
Economies of Scale
The directors noted that the proposed advisory fee schedule for the Fund contains breakpoints that reduce the fee rates on assets above specified levels. The directors took into consideration prior presentations by an independent consultant on economies of scale in the mutual fund industry and for the AB Funds, and by the Adviser concerning certain of its views on economies of scale. The directors also had requested and received from the Adviser certain updates on economies of scale in advance of the Meeting. The directors believe that economies of scale may be realized (if at all) by the Adviser across a variety of products and services, and not only in respect of a single fund. The directors noted that there is no established methodology for setting breakpoints that give effect to the fund-specific services provided by a fund’s adviser and to the economies of scale that an adviser may realize in its overall mutual fund business or those components of it which directly or indirectly affect a fund’s operations. The directors observed that in the mutual fund industry as a whole, as well as among funds similar to the Fund, there is no uniformity or pattern in the fees and asset levels at which breakpoints (if any) apply. The directors also noted that the advisory agreements for many funds do not have breakpoints at all. Having taken these factors into account, the directors concluded that the Fund’s shareholders would benefit from a sharing of economies of scale in the event the Fund’s net assets exceed a breakpoint in the future.
| | |
| abfunds.com | | AB EMERGING MARKETS CORE PORTFOLIO | 55 |
This page is not part of the Shareholder Report or the Financial Statements.
AB FAMILY OF FUNDS
US EQUITY
US CORE
Core Opportunities Fund
Select US Equity Portfolio
US GROWTH
Concentrated Growth Fund
Discovery Growth Fund
Growth Fund
Large Cap Growth Fund
Small Cap Growth Portfolio
US VALUE
Discovery Value Fund
Equity Income Fund
Relative Value Fund1
Small Cap Value Portfolio
Value Fund
INTERNATIONAL/ GLOBAL EQUITY
INTERNATIONAL/ GLOBAL CORE
Global Core Equity Portfolio
International Portfolio
International Strategic Core Portfolio
Sustainable Global Thematic Fund1
Tax-Managed International Portfolio
Tax-Managed Wealth Appreciation Strategy
Wealth Appreciation Strategy
INTERNATIONAL/ GLOBAL GROWTH
Concentrated International Growth Portfolio
International Growth Fund
INTERNATIONAL/ GLOBAL EQUITY (continued)
INTERNATIONAL/ GLOBAL VALUE
Asia ex-Japan Equity Portfolio
International Value Fund
FIXED INCOME
MUNICIPAL
High Income Municipal Portfolio
Intermediate California Municipal Portfolio
Intermediate Diversified Municipal Portfolio
Intermediate New York Municipal Portfolio
Municipal Bond Inflation Strategy
Tax-Aware Fixed Income Portfolio
National Portfolio
Arizona Portfolio
California Portfolio
Massachusetts Portfolio
Minnesota Portfolio
New Jersey Portfolio
New York Portfolio
Ohio Portfolio
Pennsylvania Portfolio
Virginia Portfolio
TAXABLE
Bond Inflation Strategy
Global Bond Fund
High Income Fund
High Yield Portfolio
Income Fund
Intermediate Bond Portfolio
Limited Duration High Income Portfolio
Short Duration Portfolio
ALTERNATIVES
All Market Real Return Portfolio
Credit Long/Short Portfolio
Global Real Estate Investment Fund
Select US Long/Short Portfolio
Unconstrained Bond Fund
MULTI-ASSET
All Market Income Portfolio
All Market Total Return Portfolio1
Conservative Wealth Strategy
Emerging Markets Multi-Asset Portfolio
Global Risk Allocation Fund
Tax-Managed All Market Income Portfolio1
TARGET-DATE
Multi-Manager Select Retirement Allocation Fund
Multi-Manager Select 2010 Fund
Multi-Manager Select 2015 Fund
Multi-Manager Select 2020 Fund
Multi-Manager Select 2025 Fund
Multi-Manager Select 2030 Fund
Multi-Manager Select 2035 Fund
Multi-Manager Select 2040 Fund
Multi-Manager Select 2045 Fund
Multi-Manager Select 2050 Fund
Multi-Manager Select 2055 Fund
CLOSED-END FUNDS
Alliance California Municipal Income Fund
AllianceBernstein Global High Income Fund
AllianceBernstein National Municipal Income Fund
We also offer Government Exchange Reserves, which serves as the money market fund exchange vehicle for the AB mutual funds. An investment in Government Exchange Reserves is not a deposit in a bank and is not insured or guaranteed by the Federal Deposit Insurance Corporation or any other government agency. Although the Fund seeks to preserve the value of your investment at $1.00 per share, it is possible to lose money by investing in the Fund.
Investors should consider the investment objectives, risks, charges and expenses of the Fund carefully before investing. For copies of our prospectus or summary prospectus, which contain this and other information, visit us online at www.abfunds.com or contact your AB representative. Please read the prospectus and/or summary prospectus carefully before investing.
| 1 | Prior to November 1, 2016, Sustainable Global Thematic Fund was named Global Thematic Growth Fund; prior to January 9, 2017, Relative Value Fund was named Growth & Income Fund; prior to April 17, 2017, Tax-Managed All Market Income Portfolio was named Tax-Managed Balanced Wealth Strategy; prior to April 24, 2017, All Market Total Return Portfolio was named Balanced Wealth Strategy. |
| | |
| 56 | AB EMERGING MARKETS CORE PORTFOLIO | | abfunds.com |
NOTES
| | |
| abfunds.com | | AB EMERGING MARKETS CORE PORTFOLIO | 57 |
NOTES
| | |
| 58 | AB EMERGING MARKETS CORE PORTFOLIO | | abfunds.com |
NOTES
| | |
| abfunds.com | | AB EMERGING MARKETS CORE PORTFOLIO | 59 |
NOTES
| | |
| 60 | AB EMERGING MARKETS CORE PORTFOLIO | | abfunds.com |

AB EMERGING MARKETS CORE PORTFOLIO
1345 Avenue of the Americas
New York, NY 10105
800 221 5672
EMCP-0151-0617 
JUN 06.30.17
ANNUAL REPORT
AB FLEXFEETM EMERGING MARKETS GROWTH PORTFOLIO


| | |
| |
| Investment Products Offered | | • Are Not FDIC Insured • May Lose Value • Are Not Bank Guaranteed |
Investors should consider the investment objectives, risks, charges and expenses of the Fund carefully before investing. For copies of our prospectus or summary prospectus, which contain this and other information, visit us online at www.abfunds.com or contact your AB representative. Please read the prospectus and/or summary prospectus carefully before investing.
This shareholder report must be preceded or accompanied by the Fund’s prospectus for individuals who are not current shareholders of the Fund.
You may obtain a description of the Fund’s proxy voting policies and procedures, and information regarding how the Fund voted proxies relating to portfolio securities during the most recent 12-month period ended June 30, without charge. Simply visit AB’s website at www.abfunds.com, or go to the Securities and Exchange Commission’s (the “Commission”) website at www.sec.gov, or call AB at (800) 227 4618.
The Fund files its complete schedule of portfolio holdings with the Commission for the first and third quarters of each fiscal year on Form N-Q. The Fund’s Forms N-Q are available on the Commission’s website at www.sec.gov. The Fund’s Forms N-Q may also be reviewed and copied at the Commission’s Public Reference Room in Washington, DC; information on the operation of the Public Reference Room may be obtained by calling (800) SEC 0330. AB publishes full portfolio holdings for the Fund monthly at www.abfunds.com.
AllianceBernstein Investments, Inc. (ABI) is the distributor of the AB family of mutual funds. ABI is a member of FINRA and is an affiliate of AllianceBernstein L.P., the Adviser of the funds.
The [A/B] logo is a registered service mark of AllianceBernstein and AllianceBernstein® is a registered service mark used by permission of the owner, AllianceBernstein L.P.
| | |
| FROM THE PRESIDENT | |  |
Dear Shareholder,
We are pleased to provide this report for AB FlexFee Emerging Markets Growth Portfolio (the “Fund”). Please review the discussion of Fund performance, the market conditions during the reporting period and the Fund’s investment strategy.
As always, AB strives to keep clients ahead of what’s next by:
| + | | Transforming uncommon insights into uncommon knowledge with a global research scope |
| + | | Navigating markets with seasoned investment experience and sophisticated solutions |
| + | | Providing thoughtful investment insights and actionable ideas |
Whether you’re an individual investor or a multi-billion-dollar institution, we put knowledge and experience to work for you.
AB’s global research organization connects and collaborates across platforms and teams to deliver impactful insights and innovative products. Better insights lead to better opportunities—anywhere in the world.
For additional information about AB’s range of products and shareholder resources, please log on to www.abfunds.com.
Thank you for your investment in the AB Mutual Funds.
Sincerely,

Robert M. Keith
President and Chief Executive Officer, AB Mutual Funds
| | |
| abfunds.com | | AB FLEXFEE EMERGING MARKETS GROWTH PORTFOLIO | 1 |
ANNUAL REPORT
August 17, 2017
This report provides management’s discussion of fund performance for AB FlexFee Emerging Markets Growth Portfolio for the annual reporting period ended June 30, 2017.
On December 29, 2016, the Fund’s name was changed from the AB Emerging Markets Growth Portfolio to the AB Performance Fee Series – Emerging Markets Growth Portfolio. On May 9, 2017, the Fund’s name was changed to the AB FlexFee Emerging Markets Growth Portfolio.
The Fund’s investment objective is to seek long-term growth of capital.
NAV RETURNS AS OF JUNE 30, 2017 (unaudited)
| | | | | | | | |
| | | 6 Months | | | 12 Months | |
| FLEXFEE EMERGING MARKETS GROWTH PORTFOLIO | | | | | | | | |
| Advisor Class Shares1 | | | 21.36% | | | | 24.06% | |
| MSCI EM Index | | | 18.43% | | | | 23.75% | |
| 1 | Please note that this share class is for investors purchasing shares through accounts established under certain fee-based programs sponsored and maintained by certain broker-dealers and financial intermediaries, institutional pension plans and/or investment advisory clients of, and certain other persons associated with, the Adviser and its affiliates or the Fund. |
Please keep in mind that high, double-digit returns are highly unusual and cannot be sustained. Investors should also be aware that these returns were primarily achieved during favorable market conditions.
INVESTMENT RESULTS
The table above shows the Fund’s performance compared to its benchmark, the Morgan Stanley Capital International Emerging Markets (“MSCI EM”) Index, for the six- and 12-month periods ended June 30, 2017.
Advisor Class shares of the Fund outperformed the benchmark for both periods. For the 12-month period, positioning and security selection in the technology sector was the main driver of returns, versus the benchmark. An overweight to the consumer staples sector and security selection in the energy sector detracted. An overweight to Russia detracted, while an underweight to South Africa contributed.
For the six-month period, positioning and security selection in the technology sector was the main driver of returns. An overweight to the health care sector and security selection in the energy sector detracted. An overweight to Russia detracted, while an underweight to South Africa contributed.
The Fund did not utilize derivatives during either period.
| | |
| 2 | AB FLEXFEE EMERGING MARKETS GROWTH PORTFOLIO | | abfunds.com |
MARKET REVIEW AND INVESTMENT STRATEGY
Aside from a few fleeting downturns, global stocks surged during the 12-month period ended June 30, 2017. Emerging-market equities led the rally, recording material gains. Against the backdrop of a gradually improving global economy, geopolitical developments dominated headlines. The aftermath of the UK’s decision to leave the European Union (“Brexit”), Donald Trump’s surprise victory in the US presidential election and a resounding win by Emmanuel Macron in the French presidential election all impacted markets. Financial markets rallied on Trump’s win, though at times both policy risk and upheaval in the White House rattled investors. UK prime minister Theresa May further surprised markets when she called for a snap parliamentary election three years ahead of schedule in an effort to firm up the country’s mandate going into Brexit negotiations. The election increased political uncertainty when May’s Conservative Party failed to secure a majority position. In contrast, investors were reassured a few days later when Macron’s centrist party secured a resounding majority in the French parliament.
In emerging markets, Turkey held a constitutional referendum in April. The reforms, which were approved by a narrow majority, grant the president sweeping powers, raising questions about checks and balances. In Brazil, secret recordings emerged in which President Michel Temer appeared to be discussing a bribe. The allegations clouded Brazil’s ambitious reform prospects as President Temer tries to fend off calls for his removal. On the other hand, Brazil’s economy seemed on course to recover from its recession. Index provider MSCI unveiled plans to gradually add mainland Chinese shares to its EM index beginning next year, after considering the inclusion for four years. The 222 Chinese large-cap stocks will initially represent less than 1% of the Fund’s benchmark.
INVESTMENT POLICIES
At least 80% of the Fund’s net assets will, under normal circumstances, be invested in securities of emerging-market companies and related derivatives. Examples of emerging-market countries include Argentina, Brazil, Chile, Croatia, Egypt, Hong Kong, India, Indonesia, Kazakhstan, Malaysia, Mexico, the People’s Republic of China, Peru, the Philippines, Poland, Russia, South Africa, Taiwan, Thailand, Turkey and Venezuela. Emerging-market countries may include countries referred to as “frontier” markets, such as Egypt, Nigeria and Vietnam.
In managing the Fund, the Adviser will employ a “bottom up” investment process that focuses on a company’s prospective earnings growth, valuation and business quality. The Adviser will typically look for companies that have strong, experienced management teams and the potential to support greater than expected earnings growth rates,
(continued on next page)
| | |
| abfunds.com | | AB FLEXFEE EMERGING MARKETS GROWTH PORTFOLIO | 3 |
and will combine fundamental and quantitative analyses in its stock selection process. The Adviser will not target any particular country, sector or market capitalization weightings for the Fund.
Fluctuations in currency exchange rates can have a dramatic impact on the returns of equity securities. While the Adviser may hedge the foreign currency exposure resulting from the Fund’s security positions through the use of currency-related derivatives, it is not required to do so. The Fund may also take long and short positions in currencies (or related derivatives) independent of any such security positions, including taking a position in a currency when it does not hold any securities traded in that currency.
| | |
| 4 | AB FLEXFEE EMERGING MARKETS GROWTH PORTFOLIO | | abfunds.com |
DISCLOSURES AND RISKS
Benchmark Disclosure
The MSCI EM Index is unmanaged and does not reflect fees and expenses associated with the active management of a mutual fund portfolio. MSCI EM Index (free float-adjusted market-capitalization weighted) represents the equity market performance of emerging markets. MSCI makes no express or implied warranties or representations, and shall have no liability whatsoever with respect to any MSCI data contained herein. The MSCI data may not be further redistributed or used as a basis for other indices, any securities or financial products. This report is not approved, reviewed or produced by MSCI. An investor cannot invest directly in an index, and its results are not indicative of the performance for any specific investment, including the Fund.
A Word About Risk
Emerging Market Risk: Investments in emerging-market countries may have more risk because the markets are less developed and less liquid, and because these investments may be subject to increased economic, political, regulatory or other uncertainties.
Market Risk: The value of the Fund’s assets will fluctuate as the stock or bond market fluctuates. The value of its investments may decline, sometimes rapidly and unpredictably, simply because of economic changes or other events that affect large portions of the market. It includes the risk that a particular style of investing, such as the Fund’s growth approach, may underperform the market generally.
Foreign (Non-US) Risk: Investments in securities of non-US issuers may involve more risk than those of US issuers. These securities may fluctuate more widely in price and may be less liquid due to adverse market, economic, political, regulatory or other factors.
Currency Risk: Fluctuations in currency exchange rates may negatively affect the value of the Fund’s investments or reduce its returns.
Derivatives Risk: Derivatives may be illiquid, difficult to price, and leveraged so that small changes may produce disproportionate losses for the Fund, and may be subject to counterparty risk to a greater degree than more traditional investments.
Sector Risk: The Fund may have more risk because of concentrated investments in a particular market sector, such as the technology or financial services sector. Market or economic factors affecting that sector could have a major effect on the value of the Fund’s investments.
Management Risk: The Fund is subject to management risk because it is an actively managed investment fund. The Adviser will apply its investment
| | |
| abfunds.com | | AB FLEXFEE EMERGING MARKETS GROWTH PORTFOLIO | 5 |
DISCLOSURES AND RISKS (continued)
techniques and risk analyses in making investment decisions for the Fund, but there is no guarantee that its techniques will produce the intended results.
These risks are fully discussed in the Fund’s prospectus. As with all investments, you may lose money by investing in the Fund.
An Important Note About Historical Performance
The investment return and principal value of an investment in the Fund will fluctuate, so that shares, when redeemed, may be worth more or less than their original cost. Performance shown in this report represents past performance and does not guarantee future results. Current performance may be lower or higher than the performance information shown. You may obtain performance information current to the most recent month-end by visiting www.abfunds.com.
All fees and expenses related to the operation of the Fund have been deducted. Net asset value (“NAV”) returns do not reflect sales charges; if sales charges were reflected, the Fund’s quoted performance would be lower. SEC returns reflect the applicable sales charges for each share class: Returns for the different share classes will vary due to different expenses associated with each class. Performance assumes reinvestment of distributions and does not account for taxes.
| | |
| 6 | AB FLEXFEE EMERGING MARKETS GROWTH PORTFOLIO | | abfunds.com |
HISTORICAL PERFORMANCE
GROWTH OF A $10,000 INVESTMENT IN THE FUND (unaudited)
11/13/20141 TO 6/30/2017
This chart illustrates the total value of an assumed $10,000 investment in AB FlexFee Emerging Markets Growth Portfolio Advisor Class shares (from 11/13/20141 to 6/30/2017) as compared to the performance of the Fund’s benchmark.
| 1 | Inception date: 11/13/2014. |
| | |
| abfunds.com | | AB FLEXFEE EMERGING MARKETS GROWTH PORTFOLIO | 7 |
HISTORICAL PERFORMANCE (continued)
AVERAGE ANNUAL RETURNS AS OF JUNE 30, 2017 (unaudited)
| | | | | | | | |
| | | NAV Returns | | | SEC Returns
(reflects applicable
sales charges) | |
| ADVISOR CLASS SHARES1 | | | | | | | | |
| 1 Year | | | 24.06% | | | | 24.06% | |
| Since Inception2 | | | 3.59% | | | | 3.59% | |
The Fund’s prospectus fee table shows the Fund’s total annual operating expense ratios as 7.99% for Advisor Class shares, gross of any fee waivers or expense reimbursements. Contractual fee waivers and/or expense reimbursements limit the Fund’s annual operating expense ratios exclusive of acquired fund fees and expenses other than the advisory fees of any AB mutual funds in which the Fund may invest, interest expense, taxes, extraordinary expenses, and brokerage commissions and other transaction costs to 1.45% for Advisor Class shares. These waivers/reimbursements may not be terminated before October 31, 2017. Any fees waived and expenses borne by the Adviser may be reimbursed by the Fund until the end of the third fiscal year after the fiscal period in which the fee was waived or the expense was borne, provided that no reimbursement payment will be made that would cause the Fund’s total annual fund operating expenses to exceed these expense limitations percentages. Absent reimbursements or waivers, performance would have been lower. The Financial Highlights section of this report sets forth expense ratio data for the current reporting period; the expense ratios shown above may differ from the expense ratios in the Financial Highlights section since they are based on different time periods.
| 1 | Please note that this share class is for investors purchasing shares through accounts established under certain fee-based programs sponsored and maintained by certain broker-dealers and financial intermediaries, institutional pension plans and/or investment advisory clients of, and certain other persons associated with, the Adviser and its affiliates or the Fund. |
| 2 | Inception date: 11/13/2014. |
| | |
| 8 | AB FLEXFEE EMERGING MARKETS GROWTH PORTFOLIO | | abfunds.com |
HISTORICAL PERFORMANCE (continued)
SEC AVERAGE ANNUAL RETURNS
AS OF THE MOST RECENT CALENDAR QUARTER-END
JUNE 30, 2017 (unaudited)
| | | | |
| | | SEC Returns
(reflects applicable
sales charges) | |
| ADVISOR CLASS SHARES1 | | | | |
| 1 Year | | | 24.06% | |
| Since Inception2 | | | 3.59% | |
| 1 | Please note that this share class is for investors purchasing shares through accounts established under certain fee-based programs sponsored and maintained by certain broker-dealers and financial intermediaries, institutional pension plans and/or investment advisory clients of, and certain other persons associated with, the Adviser and its affiliates or the Fund. |
| 2 | Inception date: 11/13/2014. |
| | |
| abfunds.com | | AB FLEXFEE EMERGING MARKETS GROWTH PORTFOLIO | 9 |
EXPENSE EXAMPLE
(unaudited)
As a shareholder of the Fund, you incur two types of costs: (1) transaction costs, including sales charges (loads) on purchase payments, contingent deferred sales charges on redemptions and (2) ongoing costs, including management fees; distribution (12b-1) fees; and other Fund expenses. This example is intended to help you understand your ongoing costs (in dollars) of investing in the Fund and to compare these costs with the ongoing costs of investing in other mutual funds.
The Example is based on an investment of $1,000 invested at the beginning of the period and held for the entire period as indicated below.
Actual Expenses
The table below provides information about actual account values and actual expenses. You may use the information, together with the amount you invested, to estimate the expenses that you paid over the period. Simply divide your account value by $1,000 (for example, an $8,600 account value divided by $1,000 = 8.6), then multiply the result by the number under the heading entitled “Expenses Paid During Period” to estimate the expenses you paid on your account during this period.
Hypothetical Example for Comparison Purposes
The table below also provides information about hypothetical account values and hypothetical expenses based on the Fund’s actual expense ratio and an assumed annual rate of return of 5% before expenses, which is not the Fund’s actual return. The hypothetical account values and expenses may not be used to estimate the actual ending account balance or expenses you paid for the period. You may use this information to compare the ongoing costs of investing in the Fund and other funds by comparing this 5% hypothetical example with the 5% hypothetical examples that appear in the shareholder reports of other funds.
Please note that the expenses shown in the table are meant to highlight your ongoing costs only and do not reflect any transactional costs, such as sales charges (loads), or contingent deferred sales charges on redemptions. Therefore, the hypothetical example is useful in comparing ongoing costs only, and will not help you determine the relative total costs of owning different funds. In addition, if these transactional costs were included, your costs would have been higher.
| | | | | | | | | | | | | | | | |
| | | Beginning
Account Value
January 1, 2017 | | | Ending
Account Value
June 30, 2017 | | | Expenses Paid
During Period* | | | Annualized
Expense Ratio* | |
| Advisor Class | | | | | | | | | | | | | |
Actual | | $ | 1,000 | | | $ | 1,213.60 | | | $ | 7.68 | | | | 1.40 | % |
Hypothetical** | | $ | 1,000 | | | $ | 1,017.85 | | | $ | 7.00 | | | | 1.40 | % |
| * | Expenses are equal to the classes’ annualized expense ratios multiplied by the average account value over the period, multiplied by 181/365 (to reflect the one-half year period). |
| ** | Assumes 5% annual return before expenses. |
| | |
| 10 | AB FLEXFEE EMERGING MARKETS GROWTH PORTFOLIO | | abfunds.com |
PORTFOLIO SUMMARY
June 30, 2017 (unaudited)
PORTFOLIO STATISTICS
Net Assets ($mil): $5.4
| 1 | All data are as of June 30, 2017. The Fund’s sector and country breakdowns are expressed as a percentage of total investments and may vary over time. “Other” country weightings represent 1.2% or less in the following countries: Kenya, Poland, Qatar, Thailand and United Arab Emirates. |
Please note: The sector classifications presented herein are based on the Global Industry Classification Standard (GICS) which was developed by Morgan Stanley Capital International and Standard & Poor’s. The components are divided into sector, industry group, and industry sub-indices as classified by the GICS for each of the market capitalization indices in the broad market. These sector classifications are broadly defined. The “Portfolio of Investments” section of the report reflects more specific industry information and is consistent with the investment restrictions discussed in the Fund’s prospectus.
| | |
| abfunds.com | | AB FLEXFEE EMERGING MARKETS GROWTH PORTFOLIO | 11 |
PORTFOLIO SUMMARY (continued)
June 30, 2017 (unaudited)
TEN LARGEST HOLDINGS1
| | | | | | | | |
| Company | | U.S. $ Value | | | Percent of
Net Assets | |
| Samsung Electronics Co., Ltd. | | $ | 463,071 | | | | 8.5 | % |
| Alibaba Group Holding Ltd. (Sponsored ADR) | | | 361,972 | | | | 6.7 | |
| Taiwan Semiconductor Manufacturing Co., Ltd. | | | 341,610 | | | | 6.3 | |
| Tencent Holdings Ltd. | | | 254,713 | | | | 4.7 | |
| SK Hynix, Inc. | | | 250,239 | | | | 4.6 | |
| Housing Development Finance Corp., Ltd. | | | 193,432 | | | | 3.6 | |
| AIA Group Ltd. | | | 169,739 | | | | 3.1 | |
| ITC Ltd. | | | 168,393 | | | | 3.1 | |
| NetEase, Inc. (ADR) | | | 162,340 | | | | 3.0 | |
| Naspers Ltd. – Class N | | | 159,516 | | | | 2.9 | |
| | $ | 2,525,025 | | | | 46.5 | % |
| | |
| 12 | AB FLEXFEE EMERGING MARKETS GROWTH PORTFOLIO | | abfunds.com |
PORTFOLIO OF INVESTMENTS
June 30, 2017
| | | | | | | | | | | | |
| Company | | | | | Shares | | | U.S. $ Value | |
| | | | | |
| | | | | | | | | | | | |
COMMON STOCKS – 99.8% | | | | | | | | | | | | |
Information Technology – 35.1% | | | | | | | | | | | | |
Electronic Equipment, Instruments & Components – 0.9% | | | | | | | | | | | | |
Elite Material Co., Ltd. | | | | | | | 10,000 | | | $ | 48,462 | |
| | | | | | | | | | | | |
| | | |
Internet Software & Services – 14.3% | | | | | | | | | | | | |
Alibaba Group Holding Ltd. (Sponsored ADR)(a) | | | | | | | 2,569 | | | | 361,972 | |
NetEase, Inc. (ADR) | | | | | | | 540 | | | | 162,340 | |
Tencent Holdings Ltd. | | | | | | | 7,100 | | | | 254,713 | |
| | | | | | | | | | | | |
| | | | | | | | | | | 779,025 | |
| | | | | | | | | | | | |
IT Services – 0.5% | | | | | | | | | | | | |
HCL Technologies Ltd. | | | | | | | 1,970 | | | | 25,946 | |
| | | | | | | | | | | | |
| | | |
Semiconductors & Semiconductor Equipment – 10.9% | | | | | | | | | | | | |
SK Hynix, Inc. | | | | | | | 4,250 | | | | 250,239 | |
Taiwan Semiconductor Manufacturing Co., Ltd. | | | | | | | 50,000 | | | | 341,610 | |
| | | | | | | | | | | | |
| | | | | | | | | | | 591,849 | |
| | | | | | | | | | | | |
Technology Hardware, Storage & Peripherals – 8.5% | | | | | | | | | | | | |
Samsung Electronics Co., Ltd. | | | | | | | 137 | | | | 285,347 | |
Samsung Electronics Co., Ltd. (Preference Shares) | | | | | | | 109 | | | | 177,724 | |
| | | | | | | | | | | | |
| | | | | | | | | | | 463,071 | |
| | | | | | | | | | | | |
| | | | | | | | | | | 1,908,353 | |
| | | | | | | | | | | | |
Financials – 29.5% | | | | | | | | | | | | |
Banks – 19.5% | | | | | | | | | | | | |
Abu Dhabi Commercial Bank PJSC | | | | | | | 27,760 | | | | 52,782 | |
Banco Davivienda SA (Preference Shares) | | | | | | | 12,259 | | | | 135,483 | |
Banco Macro SA (ADR) | | | | | | | 570 | | | | 52,548 | |
Bank Central Asia Tbk PT | | | | | | | 4,500 | | | | 6,137 | |
Bank Mandiri Persero Tbk PT | | | | | | | 87,500 | | | | 83,871 | |
China Construction Bank Corp. – Class H | | | | | | | 166,000 | | | | 129,089 | |
China Merchants Bank Co., Ltd. – Class H | | | | | | | 9,500 | | | | 28,627 | |
Credicorp Ltd. | | | | | | | 580 | | | | 104,046 | |
Grupo Financiero Galicia SA (ADR) | | | | | | | 670 | | | | 28,569 | |
HDFC Bank Ltd. | | | | | | | 2,740 | | | | 70,578 | |
HDFC Bank Ltd. (ADR) | | | | | | | 690 | | | | 60,010 | |
IndusInd Bank Ltd.(a) | | | | | | | 3,100 | | | | 71,026 | |
Industrial & Commercial Bank of China Ltd. – Class H(a) | | | | | | | 83,000 | | | | 56,015 | |
Kasikornbank PCL (Foreign Shares) | | | | | | | 8,800 | | | | 51,681 | |
Qatar National Bank QPSC | | | | | | | 286 | | | | 9,923 | |
Sberbank of Russia PJSC (Sponsored ADR) | | | | | | | 11,385 | | | | 118,290 | |
| | | | | | | | | | | | |
| | | | | | | | | | | 1,058,675 | |
| | | | | | | | | | | | |
Consumer Finance – 0.6% | | | | | | | | | | | | |
KRUK SA | | | | | | | 400 | | | | 33,238 | |
| | | | | | | | | | | | |
| | |
| abfunds.com | | AB FLEXFEE EMERGING MARKETS GROWTH PORTFOLIO | 13 |
PORTFOLIO OF INVESTMENTS (continued)
| | | | | | | | | | | | |
| Company | | | | | Shares | | | U.S. $ Value | |
| | | | | |
| | | | | | | | | | | | |
Diversified Financial Services – 2.0% | | | | | | | | | | | | |
Cielo SA | | | | | | | 7,340 | | | $ | 54,504 | |
FirstRand Ltd. | | | | | | | 14,740 | | | | 53,157 | |
| | | | | | | | | | | | |
| | | | | | | | | | | 107,661 | |
| | | | | | | | | | | | |
Insurance – 3.8% | | | | | | | | | | | | |
AIA Group Ltd. | | | | | | | 23,200 | | | | 169,739 | |
Max Financial Services Ltd. | | | | | | | 3,832 | | | | 37,217 | |
| | | | | | | | | | | | |
| | | | | | | | | | | 206,956 | |
| | | | | | | | | | | | |
Thrifts & Mortgage Finance – 3.6% | | | | | | | | | | | | |
Housing Development Finance Corp., Ltd. | | | | | | | 7,760 | | | | 193,432 | |
| | | | | | | | | | | | |
| | | | | | | | | | | 1,599,962 | |
| | | | | | | | | | | | |
Consumer Discretionary – 12.7% | | | | | | | | | | | | |
Diversified Consumer Services – 4.0% | | | | | | | | | | | | |
Kroton Educacional SA | | | | | | | 6,000 | | | | 26,931 | |
New Oriental Education & Technology Group, Inc. (Sponsored ADR)(a) | | | | | | | 1,265 | | | | 89,170 | |
Tarena International, Inc. (ADR) | | | | | | | 5,499 | | | | 98,487 | |
| | | | | | | | | | | | |
| | | | | | | | | | | 214,588 | |
| | | | | | | | | | | | |
Hotels, Restaurants & Leisure – 1.1% | | | | | | | | | | | | |
IMAX China Holding, Inc.(a)(b) | | | | | | | 7,300 | | | | 22,390 | |
Premium Leisure Corp. | | | | | | | 1,301,000 | | | | 39,963 | |
| | | | | | | | | | | | |
| | | | | | | | | | | 62,353 | |
| | | | | | | | | | | | |
Household Durables – 2.0% | | | | | | | | | | | | |
Basso Industry Corp. | | | | | | | 25,000 | | | | 69,863 | |
Cuckoo Electronics Co., Ltd. | | | | | | | 294 | | | | 37,247 | |
| | | | | | | | | | | | |
| | | | | | | | | | | 107,110 | |
| | | | | | | | | | | | |
Internet & Direct Marketing Retail – 1.0% | | | | | | | | | | | | |
Ctrip.com International Ltd. (ADR)(a) | | | | | | | 1,040 | | | | 56,014 | |
| | | | | | | | | | | | |
| | | |
Media – 3.8% | | | | | | | | | | | | |
Naspers Ltd. – Class N | | | | | | | 810 | | | | 159,516 | |
Sun TV Network Ltd. | | | | | | | 3,620 | | | | 45,743 | |
| | | | | | | | | | | | |
| | | | | | | | | | | 205,259 | |
| | | | | | | | | | | | |
Textiles, Apparel & Luxury Goods – 0.8% | | | | | | | | | | | | |
Welspun India Ltd. | | | | | | | 34,740 | | | | 44,453 | |
| | | | | | | | | | | | |
| | | | | | | | | | | 689,777 | |
| | | | | | | | | | | | |
Consumer Staples – 7.1% | | | | | | | | | | | | |
Food & Staples Retailing – 3.1% | | | | | | | | | | | | |
Lenta Ltd. (GDR)(a)(b) | | | | | | | 10,572 | | | | 61,423 | |
X5 Retail Group NV (GDR)(a)(b) | | | | | | | 3,010 | | | | 104,297 | |
| | | | | | | | | | | | |
| | | | | | | | | | | 165,720 | |
| | | | | | | | | | | | |
Personal Products – 0.9% | | | | | | | | | | | | |
Amorepacific Corp. | | | | | | | 95 | | | | 25,231 | |
LG Household & Health Care Ltd. | | | | | | | 28 | | | | 24,329 | |
| | | | | | | | | | | | |
| | | | | | | | | | | 49,560 | |
| | | | | | | | | | | | |
| | |
| 14 | AB FLEXFEE EMERGING MARKETS GROWTH PORTFOLIO | | abfunds.com |
PORTFOLIO OF INVESTMENTS (continued)
| | | | | | | | | | | | |
| Company | | | | | Shares | | | U.S. $ Value | |
| | | | | |
| | | | | | | | | | | | |
Tobacco – 3.1% | | | | | | | | | | | | |
ITC Ltd. | | | | | | | 33,730 | | | $ | 168,393 | |
| | | | | | | | | | | | |
| | | | | | | | | | | 383,673 | |
| | | | | | | | | | | | |
Health Care – 6.4% | | | | | | | | | | | | |
Biotechnology – 3.2% | | | | | | | | | | | | |
Biocon Ltd.(a) | | | | | | | 6,330 | | | | 32,317 | |
China Biologic Products, Inc.(a) | | | | | | | 1,240 | | | | 140,244 | |
| | | | | | | | | | | | |
| | | | | | | | | | | 172,561 | |
| | | | | | | | | | | | |
Health Care Equipment & Supplies – 0.5% | | | | | | | | | | | | |
Yestar Healthcare Holdings Co., Ltd. | | | | | | | 57,500 | | | | 29,312 | |
| | | | | | | | | | | | |
| | | |
Health Care Providers & Services – 0.8% | | | | | | | | | | | | |
Dino Polska SA(a)(b) | | | | | | | 2,538 | | | | 32,115 | |
Wuxi Biologics Cayman, Inc.(a)(b) | | | | | | | 3,200 | | | | 12,050 | |
| | | | | | | | | | | | |
| | | | | | | | | | | 44,165 | |
| | | | | | | | | | | | |
Pharmaceuticals – 1.9% | | | | | | | | | | | | |
Aurobindo Pharma Ltd. | | | | | | | 4,890 | | | | 51,710 | |
China Medical System Holdings Ltd. | | | | | | | 30,000 | | | | 51,872 | |
| | | | | | | | | | | | |
| | | | | | | | | | | 103,582 | |
| | | | | | | | | | | | |
| | | | | | | | | | | 349,620 | |
| | | | | | | | | | | | |
Energy – 4.9% | | | | | | | | | | | | |
Oil, Gas & Consumable Fuels – 4.9% | | | | | | | | | | | | |
LUKOIL PJSC (Sponsored ADR) | | | | | | | 2,133 | | | | 103,965 | |
Novatek PJSC (Sponsored GDR)(b) | | | | | | | 800 | | | | 89,225 | |
Petroleo Brasileiro SA (Preference Shares)(a) | | | | | | | 13,100 | | | | 48,914 | |
YPF SA (Sponsored ADR) | | | | | | | 1,140 | | | | 24,966 | |
| | | | | | | | | | | | |
| | | | | | | | | | | 267,070 | |
| | | | | | | | | | | | |
Telecommunication Services – 1.4% | | | | | | | | | | | | |
Diversified Telecommunication Services – 1.2% | | | | | | | | | | | | |
Tower Bersama Infrastructure Tbk PT | | | | | | | 124,000 | | | | 62,927 | |
| | | | | | | | | | | | |
| | | |
Wireless Telecommunication Services – 0.2% | | | | | | | | | | | | |
Safaricom Ltd. | | | | | | | 61,700 | | | | 13,387 | |
| | | | | | | | | | | | |
| | | | | | | | | | | 76,314 | |
| | | | | | | | | | | | |
Industrials – 1.3% | | | | | | | | | | | | |
Construction & Engineering – 0.4% | | | | | | | | | | | | |
IRB Infrastructure Developers Ltd. | | | | | | | 6,720 | | | | 21,758 | |
| | | | | | | | | | | | |
| | | |
Industrial Conglomerates – 0.5% | | | | | | | | | | | | |
SM Investments Corp. | | | | | | | 1,835 | | | | 29,174 | |
| | | | | | | | | | | | |
| | | |
Professional Services – 0.4% | | | | | | | | | | | | |
51job, Inc. (ADR)(a) | | | | | | | 410 | | | | 18,339 | |
| | | | | | | | | | | | |
| | | | | | | | | | | 69,271 | |
| | | | | | | | | | | | |
Real Estate – 1.0% | | | | | | | | | | | | |
Real Estate Management & Development – 1.0% | | | | | | | | | | | | |
Ayala Land, Inc. | | | | | | | 68,200 | | | | 53,730 | |
| | | | | | | | | | | | |
| | |
| abfunds.com | | AB FLEXFEE EMERGING MARKETS GROWTH PORTFOLIO | 15 |
PORTFOLIO OF INVESTMENTS (continued)
| | | | | | | | | | | | |
| Company | | | | | Shares | | | U.S. $ Value | |
| | | | | |
| | | | | | | | | | | | |
Utilities – 0.4% | | | | | | | | | | | | |
Electric Utilities – 0.4% | | | | | | | | | | | | |
Equatorial Energia SA | | | | | | | 1,400 | | | $ | 22,896 | |
| | | | | | | | | | | | |
| | | |
Total Common Stocks
(cost $4,418,765) | | | | | | | | | | | 5,420,666 | |
| | | | | | | | | | | | |
| | | | | | | | | | | | |
SHORT-TERM INVESTMENTS – 1.0% | | | | | | | | | | | | |
Investment Companies – 0.9% | | | | | | | | | | | | |
AB Fixed Income Shares, Inc. – Government Money Market Portfolio – Class AB, 0.79%(c)(d)
(cost $49,739) | | | | | | | 49,739 | | | | 49,739 | |
| | | | | | | | | | | | |
| | | |
| | | | | | Principal
Amount
(000) | | | | |
Time Deposits – 0.1% | | | | | | | | | | | | |
BBH, Grand Cayman | | | | | | | | | | | | |
(1.45)%, 7/03/17 | | | CHF | | | | – 0 | –* | | | 13 | |
(0.567)%, 7/03/17 | | | EUR | | | | – 0 | –* | | | 112 | |
0.005%, 7/03/17 | | | HKD | | | | 11 | | | | 1,357 | |
0.01%, 7/03/17 | | | SGD | | | | – 0 | –* | | | 41 | |
0.05%, 7/03/17 | | | GBP | | | | – 0 | –* | | | 39 | |
5.75%, 7/03/17 | | | ZAR | | | | 5 | | | | 399 | |
| | | | | | | | | | | | |
| | | |
Total Time Deposits
(cost $1,961) | | | | | | | | | | | 1,961 | |
| | | | | | | | | | | | |
| | | |
Total Short-Term Investments
(cost $51,700) | | | | | | | | | | | 51,700 | |
| | | | | | | | | | | | |
| | | |
Total Investments – 100.8%
(cost $4,470,465) | | | | | | | | | | | 5,472,366 | |
Other assets less liabilities – (0.8)% | | | | | | | | | | | (42,334 | ) |
| | | | | | | | | | | | |
| | | |
Net Assets – 100.0% | | | | | | | | | | $ | 5,430,032 | |
| | | | | | | | | | | | |
| * | Principal amount less than 500. |
| (a) | Non-income producing security. |
| (b) | Security is exempt from registration under Rule 144A of the Securities Act of 1933. These securities are considered restricted, but liquid and may be resold in transactions exempt from registration, normally to qualified institutional buyers. At June 30, 2017, the aggregate market value of these securities amounted to $321,500 or 5.9% of net assets. |
| (c) | Investment in affiliated money market mutual fund. The rate shown represents the 7-day yield as of period end. |
| (d) | To obtain a copy of the fund’s shareholder report, please go to the Securities and Exchange Commission’s website at www.sec.gov, or call AB at (800) 227-4618. |
| | |
| 16 | AB FLEXFEE EMERGING MARKETS GROWTH PORTFOLIO | | abfunds.com |
PORTFOLIO OF INVESTMENTS (continued)
Currency Abbreviations:
CHF – Swiss Franc
EUR – Euro
GBP – Great British Pound
HKD – Hong Kong Dollar
SGD – Singapore Dollar
ZAR – South African Rand
Glossary:
ADR – American Depositary Receipt
GDR – Global Depositary Receipt
PJSC – Public Joint Stock Company
QPSC – Qualified Personal Service Corporation
See notes to financial statements.
| | |
| abfunds.com | | AB FLEXFEE EMERGING MARKETS GROWTH PORTFOLIO | 17 |
STATEMENT OF ASSETS OF LIABILITIES
June 30, 2017
| | | | |
| Assets | | | | |
Investments in securities, at value | | | | |
Unaffiliated issuers (cost $4,420,726) | | $ | 5,422,627 | |
Affiliated issuers (cost $49,739) | | | 49,739 | |
Foreign currencies, at value (cost $539) | | | 579 | |
Receivable for investment securities sold and foreign currency transactions | | | 35,208 | |
Dividends receivable | | | 24,303 | |
Receivable from Adviser | | | 23,157 | |
Affiliated dividends receivable | | | 18 | |
| | | | |
Total assets | | | 5,555,631 | |
| | | | |
| Liabilities | | | | |
Payable for investment securities purchased and foreign currency transactions | | | 58,722 | |
Legal fee payable | | | 14,708 | |
Custody fee payable | | | 13,649 | |
Audit and tax fee payable | | | 9,603 | |
Accrued foreign capital gains tax payable | | | 9,183 | |
Transfer Agent fee payable | | | 1,107 | |
Due to Custodian | | | 4 | |
Accrued expenses and other liabilities | | | 18,623 | |
| | | | |
Total liabilities | | | 125,599 | |
| | | | |
Net Assets | | $ | 5,430,032 | |
| | | | |
| Composition of Net Assets | | | | |
Capital stock, at par | | $ | 50 | |
Additional paid-in capital | | | 4,972,229 | |
Undistributed net investment income | | | 7,111 | |
Accumulated net realized loss on investment and foreign currency transactions | | | (542,133 | ) |
Net unrealized appreciation on investments and foreign currency denominated assets and liabilities | | | 992,775 | |
| | | | |
| | $ | 5,430,032 | |
| | | | |
Net Asset Value Per Share—30 billion shares of capital stock authorized, $.0001 par value
| | | | | | | | | | | | |
| Class | | Net Assets | | | Shares
Outstanding | | | Net Asset
Value | |
| |
| Advisor | | $ | 5,430,032 | | | | 498,000 | | | $ | 10.90 | |
| |
See notes to financial statements.
| | |
| 18 | AB FLEXFEE EMERGING MARKETS GROWTH PORTFOLIO | | abfunds.com |
STATEMENT OF OPERATIONS
Year Ended June 30, 2017
| | | | | | | | |
| Investment Income | | | | | | | | |
Dividends | | | | | | | | |
Unaffiliated issuers (net of foreign taxes withheld of $9,342) | | $ | 83,862 | | | | | |
Affiliated issuers | | | 127 | | | | | |
Interest | | | 54 | | | $ | 84,043 | |
| | | | | | | | |
| Expenses | | | | | | | | |
Advisory fee (see Note B) | | | 56,842 | | | | | |
Transfer agency—Class A | | | 15 | | | | | |
Transfer agency—Class C | | | 19 | | | | | |
Transfer agency—Advisor Class | | | 7,267 | | | | | |
Distribution fee—Class A | | | 22 | | | | | |
Distribution fee—Class C | | | 86 | | | | | |
Custodian | | | 76,498 | | | | | |
Audit and tax | | | 69,624 | | | | | |
Administrative | | | 62,175 | | | | | |
Legal | | | 34,947 | | | | | |
Directors’ fees | | | 27,099 | | | | | |
Printing | | | 6,124 | | | | | |
Miscellaneous | | | 22,059 | | | | | |
| | | | | | | | |
Total expenses | | | 362,777 | | | | | |
Less: expenses waived and reimbursed by the Adviser (see Note B) | | | (294,983 | ) | | | | |
| | | | | | | | |
Net expenses | | | | | | | 67,794 | |
| | | | | | | | |
Net investment income | | | | | | | 16,249 | |
| | | | | | | | |
| Realized and Unrealized Gain (Loss) on Investment and Foreign Currency Transactions | | | | | | | | |
Net realized gain (loss) on: | | | | | | | | |
Investment transactions | | | | | | | 65,942 | (a) |
Foreign currency transactions | | | | | | | (5,722 | ) |
Net change in unrealized appreciation/depreciation on: | | | | | | | | |
Investments | | | | | | | 976,437 | (b) |
Foreign currency denominated assets and liabilities | | | | | | | 129 | |
| | | | | | | | |
Net gain on investment and foreign currency transactions | | | | | | | 1,036,786 | |
| | | | | | | | |
Net Increase in Net Assets from Operations | | | | | | $ | 1,053,035 | |
| | | | | | | | |
| (a) | Net of foreign capital gains taxes of $2,671. |
| (b) | Net of increase in accrued foreign capital gains taxes of $7,152. |
See notes to financial statements.
| | |
| abfunds.com | | AB FLEXFEE EMERGING MARKETS GROWTH PORTFOLIO | 19 |
STATEMENT OF CHANGES IN NET ASSETS
| | | | | | | | |
| | | Year Ended
June 30,
2017 | | | Year Ended
June 30,
2016 | |
| Increase (Decrease) in Net Assets from Operations | | | | | | | | |
Net investment income | | $ | 16,249 | | | $ | 11,658 | |
Net realized gain (loss) on investment and foreign currency transactions | | | 60,220 | | | | (588,565 | ) |
Net change in unrealized appreciation/depreciation on investments and foreign currency denominated assets and liabilities | | | 976,566 | | | | 180,617 | |
Contributions from Affiliates (see Note B) | | | – 0 | – | | | 119 | |
| | | | | | | | |
Net increase (decrease) in net assets from operations | | | 1,053,035 | | | | (396,171 | ) |
| Dividends to Shareholders from | | | | | | | | |
Net investment income | | | | | | | | |
Class A | | | (5 | ) | | | (6 | ) |
Advisor Class | | | (12,998 | ) | | | (10,508 | ) |
| Capital Stock Transactions | | | | | | | | |
Net decrease | | | (21,297 | ) | | | – 0 | – |
| | | | | | | | |
Total increase (decrease) | | | 1,018,735 | | | | (406,685 | ) |
| Net Assets | | | | | | | | |
Beginning of period | | | 4,411,297 | | | | 4,817,982 | |
| | | | | | | | |
End of period (including undistributed net investment income of $7,111 and $12,258, respectively) | | $ | 5,430,032 | | | $ | 4,411,297 | |
| | | | | | | | |
See notes to financial statements.
| | |
| 20 | AB FLEXFEE EMERGING MARKETS GROWTH PORTFOLIO | | abfunds.com |
NOTES TO FINANCIAL STATEMENTS
June 30, 2017
NOTE A
Significant Accounting Policies
AB Cap Fund, Inc. (the “Company”), which is a Maryland corporation, is registered under the Investment Company Act of 1940 as an open-end management investment company. The Company operates as a series company currently comprised of 31 portfolios. Each portfolio is considered to be a separate entity for financial reporting and tax purposes. This report relates only to the AB FlexFee Emerging Markets Growth Portfolio (the “Fund”), a non-diversified portfolio. On December 29, 2016, the Fund’s name was changed from the AB Emerging Markets Growth Portfolio to the AB Performance Fee Series – Emerging Markets Growth Portfolio. On May 9, 2017, the Fund’s name was changed to its current name, the AB FlexFee Emerging Markets Growth Portfolio. The Fund has authorized issuance of Class A, Class C, Advisor Class, Class R, Class K, Class I, Class Z, Class T, Class 1, and Class 2 shares. No classes are being publicly offered. Class R, Class K, Class I, Class Z, Class T, Class 1 or Class 2 shares have not been issued, and no shares of Class A or Class C were outstanding as of June 30, 2017. As of June 30, 2017, AllianceBernstein L.P. (the “Adviser”) was the sole shareholder of the Advisor Class shares. Advisor Class shares are sold without an initial or contingent deferred sales charge and are not subject to ongoing distribution expenses. All ten classes of shares have identical voting, dividend, liquidation and other rights, except that the classes bear different distribution and transfer agency expenses. Each class has exclusive voting rights with respect to its distribution plan. The financial statements have been prepared in conformity with U.S. generally accepted accounting principles (“U.S. GAAP”), which require management to make certain estimates and assumptions that affect the reported amounts of assets and liabilities in the financial statements and amounts of income and expenses during the reporting period. Actual results could differ from those estimates. The Fund is an investment company under U.S. GAAP and follows the accounting and reporting guidance applicable to investment companies. The following is a summary of significant accounting policies followed by the Fund.
1. Security Valuation
Portfolio securities are valued at their current market value determined on the basis of market quotations or, if market quotations are not readily available or are deemed unreliable, at “fair value” as determined in accordance with procedures established by and under the general supervision of the Fund’s Board of Directors (the “Board”).
In general, the market values of securities which are readily available and deemed reliable are determined as follows: securities listed on a national securities exchange (other than securities listed on the NASDAQ Stock
| | |
| abfunds.com | | AB FLEXFEE EMERGING MARKETS GROWTH PORTFOLIO | 21 |
NOTES TO FINANCIAL STATEMENTS (continued)
Market, Inc. (“NASDAQ”)) or on a foreign securities exchange are valued at the last sale price at the close of the exchange or foreign securities exchange. If there has been no sale on such day, the securities are valued at the last traded price from the previous day. Securities listed on more than one exchange are valued by reference to the principal exchange on which the securities are traded; securities listed only on NASDAQ are valued in accordance with the NASDAQ Official Closing Price; listed or over the counter (“OTC”) market put or call options are valued at the mid level between the current bid and ask prices. If either a current bid or current ask price is unavailable, the Adviser will have discretion to determine the best valuation (e.g. last trade price in the case of listed options); open futures are valued using the closing settlement price or, in the absence of such a price, the most recent quoted bid price. If there are no quotations available for the day of valuation, the last available closing settlement price is used; U.S. Government securities and any other debt instruments having 60 days or less remaining until maturity are generally valued at market by an independent pricing vendor, if a market price is available. If a market price is not available, the securities are valued at amortized cost. This methodology is commonly used for short- term securities that have an original maturity of 60 days or less, as well as short-term securities that had an original term to maturity that exceeded 60 days. In instances when amortized cost is utilized, the Valuation Committee (the “Committee”) must reasonably conclude that the utilization of amortized cost is approximately the same as the fair value of the security. Such factors the Committee will consider include, but are not limited to, an impairment of the creditworthiness of the issuer or material changes in interest rates. Fixed-income securities, including mortgage-backed and asset-backed securities, may be valued on the basis of prices provided by a pricing service or at a price obtained from one or more of the major broker-dealers. In cases where broker-dealer quotes are obtained, the Adviser may establish procedures whereby changes in market yields or spreads are used to adjust, on a daily basis, a recently obtained quoted price on a security. Swaps and other derivatives are valued daily, primarily using independent pricing services, independent pricing models using market inputs, as well as third party broker-dealers or counterparties. Open end mutual funds are valued at the closing net asset value per share, while exchange traded funds are valued at the closing market price per share.
Securities for which market quotations are not readily available (including restricted securities) or are deemed unreliable are valued at fair value as deemed appropriate by the Adviser. Factors considered in making this determination may include, but are not limited to, information obtained by contacting the issuer, analysts, analysis of the issuer’s financial statements or other available documents. In addition, the Fund may use fair value pricing for securities primarily traded in non-U.S. markets because
| | |
| 22 | AB FLEXFEE EMERGING MARKETS GROWTH PORTFOLIO | | abfunds.com |
NOTES TO FINANCIAL STATEMENTS (continued)
most foreign markets close well before the Fund values its securities at 4:00 p.m., Eastern Time. The earlier close of these foreign markets gives rise to the possibility that significant events, including broad market moves, may have occurred in the interim and may materially affect the value of those securities. To account for this, the Fund may frequently value many of its foreign equity securities using fair value prices based on third party vendor modeling tools to the extent available.
2. Fair Value Measurements
In accordance with U.S. GAAP regarding fair value measurements, fair value is defined as the price that the Fund would receive to sell an asset or pay to transfer a liability in an orderly transaction between market participants at the measurement date. U.S. GAAP establishes a framework for measuring fair value, and a three-level hierarchy for fair value measurements based upon the transparency of inputs to the valuation of an asset or liability (including those valued based on their market values as described in Note A.1 above). Inputs may be observable or unobservable and refer broadly to the assumptions that market participants would use in pricing the asset or liability. Observable inputs reflect the assumptions market participants would use in pricing the asset or liability based on market data obtained from sources independent of the Fund. Unobservable inputs reflect the Fund’s own assumptions about the assumptions that market participants would use in pricing the asset or liability based on the best information available in the circumstances. Each investment is assigned a level based upon the observability of the inputs which are significant to the overall valuation. The three-tier hierarchy of inputs is summarized below.
| | • | | Level 1—quoted prices in active markets for identical investments |
| | • | | Level 2—other significant observable inputs (including quoted prices for similar investments, interest rates, prepayment speeds, credit risk, etc.) |
| | • | | Level 3—significant unobservable inputs (including the Fund’s own assumptions in determining the fair value of investments) |
Where readily available market prices or relevant bid prices are not available for certain equity investments, such investments may be valued based on similar publicly traded investments, movements in relevant indices since last available prices or based upon underlying company fundamentals and comparable company data (such as multiples to earnings or other multiples to equity). Where an investment is valued using an observable input such as another publicly traded security, the investment will be classified as Level 2. If management determines that an adjustment is appropriate based on restrictions on resale, illiquidity or uncertainty, and such adjustment is a significant component of the valuation, the investment will be
| | |
| abfunds.com | | AB FLEXFEE EMERGING MARKETS GROWTH PORTFOLIO | 23 |
NOTES TO FINANCIAL STATEMENTS (continued)
classified as Level 3. An investment will also be classified as Level 3 where management uses company fundamentals and other significant inputs to determine the valuation.
The following table summarizes the valuation of the Fund’s investments by the above fair value hierarchy levels as of June 30, 2017:
| | | | | | | | | | | | | | | | |
Investments in
Securities | | Level 1 | | | Level 2 | | | Level 3 | | | Total | |
Assets: | | | | | | | | | | | | | | | | |
Common Stocks: | | | | | | | | | | | | | | | | |
Information Technology | | $ | 524,312 | | | $ | 1,384,041 | | | $ | – 0 | – | | $ | 1,908,353 | |
Financials | | | 605,131 | | | | 994,831 | | | | – 0 | – | | | 1,599,962 | |
Consumer Discretionary | | | 310,565 | | | | 379,212 | | | | – 0 | – | | | 689,777 | |
Consumer Staples | | | 165,720 | | | | 217,953 | | | | – 0 | – | | | 383,673 | |
Health Care | | | 213,721 | | | | 135,899 | | | | – 0 | – | | | 349,620 | |
Energy | | | 73,880 | | | | 193,190 | | | | – 0 | – | | | 267,070 | |
Telecommunication Services | | | 13,387 | | | | 62,927 | | | | – 0 | – | | | 76,314 | |
Industrials | | | 18,339 | | | | 50,932 | | | | – 0 | – | | | 69,271 | |
Real Estate | | | – 0 | – | | | 53,730 | | | | – 0 | – | | | 53,730 | |
Utilities | | | 22,896 | | | | – 0 | – | | | – 0 | – | | | 22,896 | |
Short-Term Investments: | | | | | | | | | | | | | | | | |
Investment Companies | | | 49,739 | | | | – 0 | – | | | – 0 | – | | | 49,739 | |
Time Deposits | | | – 0 | – | | | 1,961 | | | | – 0 | – | | | 1,961 | |
| | | | | | | | | | | | | | | | |
Total Investments in Securities | | | 1,997,690 | | | | 3,474,676 | † | | | – 0 | – | | | 5,472,366 | |
Other Financial Instruments*: | | | – 0 | – | | | – 0 | – | | | – 0 | – | | | – 0 | – |
| | | | | | | | | | | | | | | | |
Total^ | | $ | 1,997,690 | | | $ | 3,474,676 | | | $ | – 0 | – | | $ | 5,472,366 | |
| | | | | | | | | | | | | | | | |
| † | A significant portion of the Fund’s foreign equity investments are categorized as Level 2 investments since they are valued using fair value prices based on third party vendor modeling tools to the extent available, see note A.1. |
| * | Other financial instruments are derivative instruments, such as futures, forwards and swaps, which are valued at the unrealized appreciation/depreciation on the instrument. |
| ^ | An amount of $196,550 was transferred from Level 2 to Level 1 due to the above mentioned foreign equity fair valuation by the third party vendor was not used during the reporting period. There were no transfers from Level 1 to Level 2 during the reporting period. |
The Fund recognizes all transfers between levels of the fair value hierarchy assuming the financial instrument was transferred at the beginning of the reporting period.
The Adviser established the Committee to oversee the pricing and valuation of all securities held in the Fund. The Committee operates under pricing and valuation policies and procedures established by the Adviser and approved by the Board, including pricing policies which set forth the mechanisms and processes to be employed on a daily basis to implement these policies and procedures. In particular, the pricing policies describe
| | |
| 24 | AB FLEXFEE EMERGING MARKETS GROWTH PORTFOLIO | | abfunds.com |
NOTES TO FINANCIAL STATEMENTS (continued)
how to determine market quotations for securities and other instruments. The Committee’s responsibilities include: 1) fair value and liquidity determinations (and oversight of any third parties to whom any responsibility for fair value and liquidity determinations is delegated), and 2) regular monitoring of the Adviser’s pricing and valuation policies and procedures and modification or enhancement of these policies and procedures (or recommendation of the modification of these policies and procedures) as the Committee believes appropriate.
The Committee is also responsible for monitoring the implementation of the pricing policies by the Adviser’s Pricing Group (the “Pricing Group”) and any third party which performs certain pricing functions in accordance with the pricing policies. The Pricing Group is responsible for the oversight of the third party on a day-to-day basis. The Committee and the Pricing Group perform a series of activities to provide reasonable assurance of the accuracy of prices including: 1) periodic vendor due diligence meetings, review of methodologies, new developments and process at vendors, 2) daily comparison of security valuation versus prior day for all securities that exceeded established thresholds, and 3) daily review of unpriced, stale, and variance reports with exceptions reviewed by senior management and the Committee.
In addition, several processes outside of the pricing process are used to monitor valuation issues including: 1) performance and performance attribution reports are monitored for anomalous impacts based upon benchmark performance, and 2) portfolio managers review all portfolios for performance and analytics (which are generated using the Adviser’s prices).
3. Currency Translation
Assets and liabilities denominated in foreign currencies and commitments under forward currency exchange contracts are translated into U.S. dollars at the mean of the quoted bid and ask prices of such currencies against the U.S. dollar. Purchases and sales of portfolio securities are translated into U.S. dollars at the rates of exchange prevailing when such securities were acquired or sold. Income and expenses are translated into U.S. dollars at rates of exchange prevailing when accrued.
Net realized gain or loss on foreign currency transactions represents foreign exchange gains and losses from sales and maturities of foreign fixed income investments, foreign currency exchange contracts, holding of foreign currencies, currency gains or losses realized between the trade and settlement dates on foreign investment transactions, and the difference between the amounts of dividends, interest and foreign withholding taxes recorded on the Fund’s books and the U.S. dollar equivalent amounts actually received or paid. Net unrealized currency gains and losses from
| | |
| abfunds.com | | AB FLEXFEE EMERGING MARKETS GROWTH PORTFOLIO | 25 |
NOTES TO FINANCIAL STATEMENTS (continued)
valuing foreign currency denominated assets and liabilities at period end exchange rates are reflected as a component of net unrealized appreciation and depreciation of foreign currency denominated assets and liabilities.
4. Taxes
It is the Fund’s policy to meet the requirements of the Internal Revenue Code applicable to regulated investment companies and to distribute all of its investment company taxable income and net realized gains, if any, to shareholders. Therefore, no provisions for federal income or excise taxes are required. The Fund may be subject to taxes imposed by countries in which it invests. Such taxes are generally based on income and/or capital gains earned or repatriated. Taxes are accrued and applied to net investment income, net realized gains and net unrealized appreciation/depreciation as such income and/or gains are earned.
In accordance with U.S. GAAP requirements regarding accounting for uncertainties in income taxes, management has analyzed the Fund’s tax positions taken or expected to be taken on federal and state income tax returns for all open tax years (all years since inception of the Fund) and has concluded that no provision for income tax is required in the Fund’s financial statements.
5. Investment Income and Investment Transactions
Dividend income is recorded on the ex-dividend date or as soon as the Fund is informed of the dividend. Interest income is accrued daily. Investment transactions are accounted for on the date securities are purchased or sold. Investment gains and losses are determined on the identified cost basis. The Fund amortizes premiums and accretes discounts as adjustments to interest income.
6. Class Allocations
All income earned and expenses incurred by the Fund are borne on a pro-rata basis by each settled class of shares, based on the proportionate interest in the Fund represented by the net assets of such class, except for class specific expenses which are allocated to the respective class. Expenses of the Company are charged proportionately to each portfolio or based on other appropriate methods. Realized and unrealized gains and losses are allocated among the various share classes based on their respective net assets.
7. Dividends and Distributions
Dividends and distributions to shareholders, if any, are recorded on the ex-dividend date. Income dividends and capital gains distributions are determined in accordance with federal tax regulations and may differ from
| | |
| 26 | AB FLEXFEE EMERGING MARKETS GROWTH PORTFOLIO | | abfunds.com |
NOTES TO FINANCIAL STATEMENTS (continued)
those determined in accordance with U.S. GAAP. To the extent these differences are permanent, such amounts are reclassified within the capital accounts based on their federal tax basis treatment; temporary differences do not require such reclassification.
NOTE B
Advisory Fee and Other Transactions with Affiliates
Under the terms of the investment advisory agreement, the Fund pays the Adviser an advisory fee at an annual rate of 1.175% of the first $1 billion of the Fund’s average daily net assets, 1.05% of the next $1 billion up to $2 billion, 1.00% of the excess of $2 billion up to $3 billion, .90% of the excess of $3 billion up to $6 billion, and .85% of the excess of $6 billion. The fee is accrued daily and paid monthly. The Adviser has agreed to waive its fees and bear certain expenses to the extent necessary to limit total operating expenses (excluding acquired fund fees and expenses other than the advisory fees of any AB Mutual Funds in which the Fund may invest, interest expense, taxes, extraordinary expenses, and brokerage commissions and other transaction costs) on an annual basis (the “Expense Caps”) to 1.70%, 2.45% and 1.45% of the daily average net assets for Class A, Class C and Advisor Class shares, respectively. Any fees waived and expenses borne by the Adviser are subject to repayment by the Fund until the end of the third fiscal year after the fiscal period in which the fee was waived or the expense was borne; such waivers that are subject to repayment amount to $155,421 for the fiscal period ended June 30, 2015 and $215,507 for the year ended June 30, 2016. For the year ended June 30, 2017 the reimbursements/waivers amounted to $230,326. In any case, no repayment will be made that would cause the Fund’s total annual operating expenses to exceed the net fee percentages set forth above. The Expense Caps may not be terminated by the Adviser prior to one year from the date the Fund’s shares are first offered to the public. Also, the Adviser is currently voluntarily waiving its advisory fee for the Fund in an additional amount of .05% of average daily net assets, although this additional waiver can be terminated by the Adviser at any time. For the year ended June 30, 2017, such waiver amounted to $2,420.
Pursuant to the investment advisory agreement, the Fund may reimburse the Adviser for certain legal and accounting services provided to the Fund by the Adviser. For the year ended June 30, 2017, the Adviser voluntarily agreed to waive such fees that amounted to $62,175.
The Fund compensates AllianceBernstein Investor Services, Inc. (“ABIS”), a wholly-owned subsidiary of the Adviser, under a Transfer Agency Agreement for providing personnel and facilities to perform transfer agency services for the Fund. ABIS may make payments to intermediaries that
| | |
| abfunds.com | | AB FLEXFEE EMERGING MARKETS GROWTH PORTFOLIO | 27 |
NOTES TO FINANCIAL STATEMENTS (continued)
provide omnibus account services, sub-accounting services and/or networking services. Such compensation retained by ABIS amounted to $5,531 for the year ended June 30, 2017.
AllianceBernstein Investments, Inc. (the “Distributor”), a wholly-owned subsidiary of the Adviser, serves as the distributor of the Fund’s shares. The Distributor has advised the Fund that it has retained no front-end sales charges from the sale of Class A shares nor received any contingent deferred sales charges imposed upon redemptions by shareholders of Class A and Class C shares, respectively, for the year ended June 30, 2017.
The Fund may invest in AB Government Money Market Portfolio (the “Government Money Market Portfolio”) which has a contractual annual advisory fee rate of .20% of the portfolio’s average daily net assets and bears its own expenses. In connection with the investment by the Fund in the Government Money Market Portfolio, the Adviser has agreed to waive its advisory fee from the Fund in an amount equal to the Fund’s pro rata share of the effective advisory fee of Government Money Market Portfolio, as borne indirectly by the Fund as an acquired fund fee and expense. For the year ended June 30, 2017, such waiver amounted to $62. A summary of the Fund’s transactions in shares of the Government Money Market Portfolio for the year ended June 30, 2017 is as follows:
| | | | | | | | | | | | | | | | | | |
Market Value
June 30, 2016
(000) | | | Purchases
at Cost
(000) | | | Sales
Proceeds
(000) | | | Market Value
June 30, 2017
(000) | | | Dividend
Income
(000) | |
| $ | 5 | | | $ | 1,594 | | | $ | 1,549 | | | $ | 50 | | | $ | – 0 – | * |
| * | Amount is less than $500. |
Brokerage commissions paid on investment transactions for the year ended June 30, 2017 amounted to $7,909, of which $0 and $0, respectively was paid to Sanford C. Bernstein & Co. LLC or Sanford C. Bernstein Limited, affiliates of the Adviser.
NOTE C
Distribution Services Agreement
The Fund has adopted a Distribution Services Agreement (the “Agreement”) pursuant to Rule 12b-1 under the Investment Company Act of 1940. Under the Agreement, the Fund pays distribution and servicing fees to the Distributor at an annual rate of up to .25% of the Fund’s average daily net assets attributable to Class A shares and 1% of the Fund’s average daily net assets attributable to Class C shares. There are no distribution and servicing fees on Advisor Class shares. The fees are accrued daily and paid monthly. The Agreement provides that the Distributor will use such payments in their entirety for distribution assistance and promotional activities. Since the commencement of the Fund’s operations, the
| | |
| 28 | AB FLEXFEE EMERGING MARKETS GROWTH PORTFOLIO | | abfunds.com |
NOTES TO FINANCIAL STATEMENTS (continued)
Distributor has incurred no expenses in excess of the distribution costs reimbursed by the Fund for Class C shares. While such costs may be recovered from the Fund in future periods so long as the Agreement is in effect, the rate of the distribution and servicing fees payable under the Agreement may not be increased without a shareholder vote. In accordance with the Agreement, there is no provision for recovery of unreimbursed distribution costs incurred by the Distributor beyond the current fiscal year for Class A shares. The Agreement also provides that the Adviser may use its own resources to finance the distribution of the Fund’s shares.
NOTE D
Investment Transactions
Purchases and sales of investment securities (excluding short-term investments) for the year ended June 30, 2017 were as follows:
| | | | | | | | |
| | | Purchases | | | Sales | |
Investment securities (excluding
U.S. government securities) | | $ | 3,852,494 | | | $ | 3,867,296 | |
U.S. government securities | | | – 0 | – | | | – 0 | – |
The cost of investments for federal income tax purposes, gross unrealized appreciation and unrealized depreciation (excluding foreign currency contracts) are as follows:
| | | | |
Cost | | $ | 4,490,334 | |
| | | | |
Gross unrealized appreciation | | $ | 1,143,833 | |
Gross unrealized depreciation | | | (161,801 | ) |
| | | | |
Net unrealized appreciation | | $ | 982,032 | |
| | | | |
1. Derivative Financial Instruments
The Fund may use derivatives in an effort to earn income and enhance returns, to replace more traditional direct investments, to obtain exposure to otherwise inaccessible markets (collectively, “investment purposes”), or to hedge or adjust the risk profile of its portfolio.
The Fund did not engage in derivative transactions for the year ended June 30, 2017.
2. Currency Transactions
The Fund may invest in non-U.S. Dollar-denominated securities on a currency hedged or unhedged basis. The Fund may seek investment opportunities by taking long or short positions in currencies through the use of currency-related derivatives, including forward currency exchange contracts, futures and options on futures, swaps, and other options. The Fund may enter into transactions for investment opportunities when it anticipates
| | |
| abfunds.com | | AB FLEXFEE EMERGING MARKETS GROWTH PORTFOLIO | 29 |
NOTES TO FINANCIAL STATEMENTS (continued)
that a foreign currency will appreciate or depreciate in value but securities denominated in that currency are not held by the Fund and do not present attractive investment opportunities. Such transactions may also be used when the Adviser believes that it may be more efficient than a direct investment in a foreign currency-denominated security. The Fund may also conduct currency exchange contracts on a spot basis (i.e., for cash at the spot rate prevailing in the currency exchange market for buying or selling currencies).
NOTE E
Capital Stock
Each class consists of 3,000,000,000 authorized shares. Transactions in capital shares for each class were as follows:
| | | | | | | | | | | | | | | | | | | | | | | | |
| | | | | | | | | | | | | | | | | | | | | | | | |
| | | Shares | | | | | | Amount | | | | |
| | | Year Ended
June 30,
2017 | | | Year Ended
June 30,
2016 | | | | | | Year Ended
June 30,
2017 | | | Year Ended
June 30,
2016 | | | | |
| | | | | | | | |
| Class A | | | | | | | | | | | | | | | | | | | | | | | | |
Shares redeemed | | | (1,000 | ) | | | – 0 | – | | | | | | $ | (10,750 | ) | | $ | – 0 | – | | | | |
| | | | | |
Net decrease | | | (1,000 | ) | | | – 0 | – | | | | | | $ | (10,750 | ) | | $ | – 0 | – | | | | |
| | | | | |
| | | | | | | | | | | | | | | | | | | | | | | | |
| Class C | | | | | | | | | | | | | | | | | | | | | | | | |
Shares redeemed | | | (1,000 | ) | | | – 0 | – | | | | | | $ | (10,550 | ) | | $ | – 0 | – | | | | |
| | | | | |
Net decrease | | | (1,000 | ) | | | – 0 | – | | | | | | $ | (10,550 | ) | | $ | – 0 | – | | | | |
| | | | | |
| | | | | | | | | | | | | | | | | | | | | | | | |
| Advisor Class | | | | | | | | | | | | | | | | | | | | | | | | |
Shares sold | | | – 0 | –(a) | | | – 0 | – | | | | | | $ | 3 | | | $ | – 0 | – | | | | |
| | | | | |
Net increase | | | – 0 | –(a) | | | – 0 | – | | | | | | $ | 3 | | | $ | – 0 | – | | | | |
| | | | | |
NOTE F
Risks Involved in Investing in the Fund
Emerging Market Risk—Investments in emerging market countries may have more risk because the markets are less developed and less liquid, and because these investments may be subject to increased economic, political, regulatory or other uncertainties.
Foreign (Non-U.S.) Risk—Investments in securities of non-U.S. issuers may involve more risk than those of U.S. issuers. These securities may fluctuate more widely in price and may be less liquid due to adverse market, economic, political, regulatory or other factors.
Currency Risk—Fluctuations in currency exchange rates may negatively affect the value of the Fund’s investments or reduce its returns.
| | |
| 30 | AB FLEXFEE EMERGING MARKETS GROWTH PORTFOLIO | | abfunds.com |
NOTES TO FINANCIAL STATEMENTS (continued)
Derivatives Risk—The Fund may enter into derivative transactions such as forwards, options, futures and swaps. Derivatives may be illiquid, difficult to price, and leveraged so that small changes may produce disproportionate losses for the Fund, and may be subject to counterparty risk to a greater degree than more traditional investments. Derivatives may result in significant losses, including losses that are far greater than the value of the derivatives reflected in the statement of assets and liabilities.
Sector Risk—The Fund may have more risk because of concentrated investments in a particular market sector, such as the technology or financial services sector. Market or economic factors affecting that sector could have a major effect on the value of the Fund’s investments.
Indemnification Risk—In the ordinary course of business, the Fund enters into contracts that contain a variety of indemnifications. The Fund’s maximum exposure under these arrangements is unknown. However, the Fund has not had prior claims or losses pursuant to these indemnification provisions and expects the risk of loss thereunder to be remote. Therefore, the Fund has not accrued any liability in connection with these indemnification provisions.
NOTE G
Joint Credit Facility
A number of open-end mutual funds managed by the Adviser, including the Fund, participate in a $280 million revolving credit facility (the “Facility”) intended to provide short-term financing if necessary, subject to certain restrictions in connection with abnormal redemption activity. Commitment fees related to the Facility are paid by the participating funds and are included in miscellaneous expenses in the statement of operations. The Fund did not utilize the Facility during the year ended June 30, 2017.
NOTE H
Distributions to Shareholders
The tax character of distributions paid during the fiscal years ended June 30, 2017 and June 30, 2016 were as follows:
| | | | | | | | |
| | | 2017 | | | 2016 | |
Distributions paid from: | | | | | | | | |
Ordinary income | | $ | 13,003 | | | $ | 10,514 | |
| | | | | | | | |
Total taxable distributions paid | | $ | 13,003 | | | $ | 10,514 | |
| | | | | | | | |
| | |
| abfunds.com | | AB FLEXFEE EMERGING MARKETS GROWTH PORTFOLIO | 31 |
NOTES TO FINANCIAL STATEMENTS (continued)
As of June 30, 2017, the components of accumulated earnings/(deficit) on a tax basis were as follows:
| | | | |
Undistributed ordinary income | | $ | 15,081 | |
Accumulated capital and other losses | | | (530,234 | )(a) |
Unrealized appreciation/(depreciation) | | | 972,906 | (b) |
| | | | |
Total accumulated earnings/(deficit) | | $ | 457,753 | |
| | | | |
| (a) | As of June 30, 2017, the Fund had a net capital loss carryforward of $530,234. During the fiscal year, the Fund utilized $73,080 of capital loss carryforwards to offset current year net realized gains. |
| (b) | The difference between book-basis and tax-basis unrealized appreciation/ (depreciation) is attributable primarily to the tax deferral of losses on wash sales and the tax treatment of passive foreign investment companies (PFICs). |
For tax purposes, net realized capital losses may be carried over to offset future capital gains, if any. Funds are permitted to carry forward capital losses for an indefinite period, and such losses will retain their character as either short-term or long-term capital losses. As of June 30, 2017, the Fund had a net short-term capital loss carryforward of $278,486 and a net long-term capital loss carryforward of $251,748 which may be carried forward for an indefinite period.
During the current fiscal year, permanent differences primarily due to foreign currency reclassifications and reclassifications of foreign capital gains tax resulted in a net decrease in undistributed net investment income and a net decrease in accumulated net realized loss on investments and foreign currency transactions. These reclassifications had no effect on net assets.
NOTE I
Other
In October 2016, the U.S. Securities and Exchange Commission adopted new rules and amended existing rules (together, “final rules”) intended to modernize the reporting and disclosure of information by registered investment companies. In part, the final rules amend Regulation S-X and require standardized, enhanced disclosure about derivatives in investment company financial statements, as well as other amendments. The compliance date for the amendments to Regulation S-X is August 1, 2017 (for reporting period end dates of August 31, 2017 or after). Management has evaluated the impact of the amendments and expects the effect of the adoption of the final rules on financial statements will be limited to additional disclosures.
NOTE J
Subsequent Events
Effective July 1, 2017, under an amended investment advisory agreement, the Fund calculates and accrues daily a base fee, at an annualized rate of
| | |
| 32 | AB FLEXFEE EMERGING MARKETS GROWTH PORTFOLIO | | abfunds.com |
NOTES TO FINANCIAL STATEMENTS (continued)
.75% of the Fund’s average daily net assets (“Base Fee”). The management fee is increased or decreased from the Base Fee by a performance adjustment (“Performance Adjustment”) that depends on whether, and to what extent, the investment performance of the Advisor Class shares of the Fund (“Measuring Class”) exceeds, or is exceeded by, the performance of the MSCI Emerging Markets Index with IDCo Fair Value Pricing (net) (“Index”) plus 1.75% (“Index Hurdle”) over the Performance Period (as defined below). The Performance Adjustment is calculated and accrued daily, according to a schedule that adds or subtracts .004% of the Fund’s average daily net assets for each .01% of absolute performance by which the performance of the Measuring Class exceeds or lags the Index Hurdle for the period from the beginning of the Performance Period through the current business day. The maximum Performance Adjustment (positive or negative) will not exceed an annualized rate of +/- .70% (“Maximum Performance Adjustment”) of the Fund’s average daily net assets, which would occur when the performance of the Measuring Class exceeds, or is exceeded by, the Index Hurdle by 1.75% for the Performance Period. On a monthly basis, the Fund will pay the Adviser the minimum fee rate of .05% on an annualized basis (Base Fee minus the Maximum Performance Adjustment) applied to the average daily net assets for the month. At the end of the Performance Period, the Fund will pay to the Adviser the total Management Fee, less the amount of any minimum fees paid during the Performance Period and any waivers described below in this section. The Performance Period is initially from July 1, 2017 to December 31, 2018 and thereafter each 12-month period beginning on the first business day in the month of January through December 31 of the same year. In addition, the Adviser has agreed to waive its management fee by limiting the Fund’s accrual of the management fee (base fee plus performance adjustment) on any day to the amount corresponding to the maximum fee rate multiplied by the Fund’s current net assets as of the preceding day if such amount is less than the amount that would have been accrued based on the Fund’s average daily net assets for the performance period. Also effective July 1, 2017, the Adviser has agreed to waive its fees and bear certain expenses through December 31, 2018 to the extent necessary to limit total expenses (other than the management fee, acquired fund fees and expenses other than the advisory fees of any AB Mutual Funds in which the Fund may invest, interest expense, taxes, extraordinary expenses, and brokerage commissions and other transaction costs) on an annual basis from exceeding .10% of average daily net assets. Any fees waived and expenses borne by the Adviser will be subject to repayment by the Fund until the end of the third fiscal year after the fiscal period in which the fees were waived or the expenses were borne. In any case, no repayment will be made that would cause the Fund’s total annual expenses (subject to the exclusions set forth above) to exceed .10%.
| | |
| abfunds.com | | AB FLEXFEE EMERGING MARKETS GROWTH PORTFOLIO | 33 |
NOTES TO FINANCIAL STATEMENTS (continued)
Management has evaluated subsequent events for possible recognition or disclosure in the financial statements through the date the financial statements are issued. Management has determined that there are no other material events that would require disclosure in the Fund’s financial statements through this date.
| | |
| 34 | AB FLEXFEE EMERGING MARKETS GROWTH PORTFOLIO | | abfunds.com |
FINANCIAL HIGHLIGHTS
Selected Data For A Share Of Capital Stock Outstanding Throughout Each Period
| | | | | | | | | | | | |
| | | Advisor Class | |
| | | Year Ended June 30, | | | November 13,
2014(a) to
June 30,
2015 | |
| | 2017 | | | 2016 | | |
| | | | |
| | | | | | | | | | | | |
Net asset value, beginning of period | | | $ 8.82 | | | | $ 9.64 | | | | $ 10.00 | |
| | | | |
Income From Investment Operations | | | | | | | | | | | | |
Net investment income(b)(c) | | | .03 | | | | .02 | | | | .01 | |
Net realized and unrealized gain (loss) on investment and foreign currency transactions | | | 2.08 | | | | (.82 | ) | | | (.37 | ) |
Contributions from Affiliates | | | – 0 | – | | | .00 | (d) | | | – 0 | – |
| | | | |
Net increase (decrease) in net asset value from operations | | | 2.11 | | | | (.80 | ) | | | (.36 | ) |
| | | | |
Less: Dividends | | | | | | | | | | | | |
Dividends from net investment income | | | (0.03 | ) | | | (.02 | ) | | | – 0 | – |
| | | | |
Net asset value, end of period | | | $ 10.90 | | | | $ 8.82 | | | | $ 9.64 | |
| | | | |
Total Return | | | | | | | | | | | | |
Total investment return based on net asset value(e) | | | 24.06 | % | | | (8.27 | )% | | | (3.60 | )% |
Ratios/Supplemental Data | | | | | | | | | | | | |
Net assets, end of period (000’s omitted) | | | $5,430 | | | | $4,394 | | | | $4,799 | |
Ratio to average net assets of: | | | | | | | | | | | | |
Expenses, net of waivers/reimbursements | | | 1.40 | % | | | 1.40 | % | | | 1.45 | %(f) |
Expenses, before waivers/reimbursements | | | 7.50 | % | | | 7.99 | % | | | 8.01 | %(f) |
Net investment income(c) | | | .34 | % | | | .28 | % | | | .22 | %(f) |
Portfolio turnover rate | | | 79 | % | | | 77 | % | | | 31 | % |
| (a) | Commencement of operations. |
| (b) | Based on average shares outstanding. |
| (c) | Net of expenses waived/reimbursed by the Adviser. |
| (d) | Amount is less than $0.005. |
| (e) | Total investment return is calculated assuming an initial investment made at the net asset value at the beginning of the period, reinvestment of all dividends and distributions at net asset value during the period, and redemption on the last day of the period. Initial sales charge or contingent deferred sales charge is not reflected in the calculation of total investment return. Total investment return does not reflect the deduction of taxes that a shareholder would pay on fund distributions or the redemption of fund shares. Total investment return for a period of less than one year is not annualized. |
See notes to financial statements.
| | |
| abfunds.com | | AB FLEXFEE EMERGING MARKETS GROWTH PORTFOLIO | 35 |
REPORT OF INDEPENDENT REGISTERED
PUBLIC ACCOUNTING FIRM
To the Board of Directors and the Shareholders of
AB FlexFee Emerging Markets Growth Portfolio
We have audited the accompanying statement of assets and liabilities, including the portfolio of investments, of AB FlexFee Emerging Markets Growth Portfolio (the “Fund”), (formerly known as “AB Emerging Markets Growth Portfolio”) one of the funds constituting AB Cap Fund, Inc., as of June 30, 2017, and the related statement of operations for the year then ended, the statements of changes in net assets for each of the two years in the period then ended and the financial highlights for each of the two years in the period then ended and the period November 13, 2014 (commencement of operations) to June 30, 2015. These financial statements and financial highlights are the responsibility of the Fund’s management. Our responsibility is to express an opinion on these financial statements and financial highlights based on our audits.
We conducted our audits in accordance with the standards of the Public Company Accounting Oversight Board (United States). Those standards require that we plan and perform the audit to obtain reasonable assurance about whether the financial statements and financial highlights are free of material misstatement. We were not engaged to perform an audit of the Fund’s internal control over financial reporting. Our audits included consideration of internal control over financial reporting as a basis for designing audit procedures that are appropriate in the circumstances, but not for the purpose of expressing an opinion on the effectiveness of the Fund’s internal control over financial reporting. Accordingly, we express no such opinion. An audit also includes examining, on a test basis, evidence supporting the amounts and disclosures in the financial statements and financial highlights, assessing the accounting principles used and significant estimates made by management, and evaluating the overall financial statement presentation. Our procedures included confirmation of securities owned as of June 30, 2017 by correspondence with the custodian and others or by other appropriate auditing procedures where replies from others were not received. We believe that our audits provide a reasonable basis for our opinion.
In our opinion, the financial statements and financial highlights referred to above present fairly, in all material respects, the financial position of AB FlexFee Emerging Markets Growth Portfolio (formerly known as “AB Emerging Markets Growth Portfolio”), one of the funds constituting the AB Cap Fund, Inc., at June 30, 2017, the results of its operations for the year then ended, the changes in its net assets for each of the two years in the period then ended and the financial highlights for each of the two years in the period then ended and the period November 13, 2014 (commencement of operations) to June 30, 2015, in conformity with U.S. generally accepted accounting principles.

New York, New York
August 25, 2017
| | |
| 36 | AB FLEXFEE EMERGING MARKETS GROWTH PORTFOLIO | | abfunds.com |
2017 FEDERAL TAX INFORMATION
(unaudited)
For Federal income tax purposes, the following information is furnished with respect to the distributions paid by the Fund for the taxable year ended June 30, 2017. For corporate shareholders 11.65% of dividends paid qualify for the dividends received deduction.
For individual shareholders, the Fund designates 100.00% of dividends paid as qualified dividend income.
The Fund intends to make an election to pass through foreign taxes to its shareholders. For the taxable year ended June 30, 2017, $12,013 of foreign taxes may be passed through and the associated foreign source income for information reporting purposes is $93,731.
Shareholders should not use the above information to prepare their income tax returns. The information necessary to complete your income tax returns will be included with your Form 1099-DIV which will be sent to you separately in January 2018.
| | |
| abfunds.com | | AB FLEXFEE EMERGING MARKETS GROWTH PORTFOLIO | 37 |
BOARD OF DIRECTORS
| | |
Marshall C. Turner, Jr.(1) , Chairman John H. Dobkin(1) Michael J. Downey(1) William H. Foulk, Jr.(1) D. James Guzy(1) | | Nancy P. Jacklin(1) Robert M. Keith, President and Chief Executive Officer Carol C. McMullen(1) Garry L. Moody(1) Earl D. Weiner(1) |
OFFICERS
| | |
Philip L. Kirstein, Senior Vice President and Independent Compliance Officer Laurent Saltiel(2), Vice President
Emilie D. Wrapp, Secretary | | Joseph J. Mantineo, Treasurer and Chief Financial Officer Phyllis J. Clarke, Controller
Vincent S. Noto, Chief Compliance Officer |
| | |
Custodian and Accounting Agent Brown Brothers Harriman & Co. 50 Post Office Square Boston, MA 02110 Principal Underwriter AllianceBernstein Investments, Inc. 1345 Avenue of the Americas New York, NY 10105 Transfer Agent AllianceBernstein Investor Services, Inc. P.O. Box 786003 San Antonio, TX 78278-6003 Toll-Free (800) 221-5672 | | Independent Registered Public Accounting Firm Ernst & Young LLP 5 Times Square New York, NY 10036 Legal Counsel Seward & Kissel LLP One Battery Park Plaza New York, NY 10004 |
| 1 | Member of the Audit Committee, the Governance and Nominating Committee and the Independent Directors Committee. |
| 2 | The day-to-day management of, and investment decisions for, the portfolio is made by the Adviser. Mr. Saltiel is the investment professional with the most significant responsibility for the day-to-day management of the Fund’s portfolio. |
| | |
| 38 | AB FLEXFEE EMERGING MARKETS GROWTH PORTFOLIO | | abfunds.com |
MANAGEMENT OF THE FUND
Board of Directors Information
The business and affairs of the Fund are managed under the direction of the Board of Directors. Certain information concerning the Fund’s Directors is set forth below.
| | | | | | | | |
NAME,
ADDRESS*, AGE,
(YEAR FIRST ELECTED**) | | PRINCIPAL
OCCUPATION(S)
DURING PAST FIVE YEARS
AND OTHER INFORMATION | | PORTFOLIOS
IN FUND
COMPLEX
OVERSEEN BY
DIRECTOR | | | OTHER PUBLIC
COMPANY
DIRECTORSHIPS
CURRENTLY HELD
BY DIRECTOR |
| INTERESTED DIRECTOR | | | | | | |
Robert M. Keith, # 1345 Avenue of the Americas New York, NY 10105 57 (2015) | | Senior Vice President of AllianceBernstein L.P. (the “Adviser”) and the head of AllianceBernstein Investments, Inc. (“ABI”) since July 2008; Director of ABI and President of the AB Mutual Funds. Previously, he served as Executive Managing Director of ABI from December 2006 to June 2008. Prior to joining ABI in 2006, Executive Managing Director of Bernstein Global Wealth Management, and prior thereto, Senior Managing Director and Global Head of Client Service and Sales of the Adviser’s institutional investment management business since 2004. Prior thereto, he was Managing Director and Head of North American Client Service and Sales in the Adviser’s institutional investment management business, with which he had been associated since prior to 2004. | | | 97 | | | None |
| | | | | | | | |
| | |
| abfunds.com | | AB FLEXFEE EMERGING MARKETS GROWTH PORTFOLIO | 39 |
MANAGEMENT OF THE FUND (continued)
| | | | | | | | |
NAME,
ADDRESS*, AGE,
(YEAR FIRST ELECTED**) | | PRINCIPAL
OCCUPATION(S)
DURING PAST FIVE YEARS
AND OTHER INFORMATION | | PORTFOLIOS
IN FUND
COMPLEX
OVERSEEN BY
DIRECTOR | | | OTHER PUBLIC
COMPANY
DIRECTORSHIPS
CURRENTLY HELD
BY DIRECTOR |
DISINTERESTED DIRECTORS
| | | | | | |
Marshall C. Turner, Jr., ## Chairman of the Board 75 (2015) | | Private Investor since prior to 2012. Former Chairman and CEO of Dupont Photomasks, Inc. (components of semi-conductor manufacturing). He has extensive operating leadership, and venture capital investing experience, including five interim or full-time CEO roles, and prior service as general partner of institutional venture capital partnerships. He also has extensive non-profit board leadership experience, and currently serves on the boards of two education and science-related non-profit organizations. He has served as a director of one AB Fund since 1992, and director or trustee of multiple AB funds since 2005. He has been Chairman of the AB Funds since January 2014, and the Chairman of the Independent Directors Committees of such AB Funds since February 2014. | | | 97 | | | Xilinx, Inc. (programmable logic semi-conductors) since 2007 |
| | | | | | | | |
John H. Dobkin, ## 75 (2015) | | Independent Consultant since prior to 2012. Formerly, President of Save Venice, Inc. (preservation organization) from 2001–2002; Senior Advisor from June 1999-June 2000 and President of Historic Hudson Valley (historic preservation) from December 1989-May 1999. Previously, Director of the National Academy of Design. He has served as a director or trustee of various AB Funds since 1992, and as Chairman of the Audit Committees of a number of such AB Funds from 2001-2008. | | | 96 | | | None |
| | | | | | | | |
| | |
| 40 | AB FLEXFEE EMERGING MARKETS GROWTH PORTFOLIO | | abfunds.com |
MANAGEMENT OF THE FUND (continued)
| | | | | | | | |
NAME,
ADDRESS*, AGE,
(YEAR FIRST ELECTED**) | | PRINCIPAL
OCCUPATION(S)
DURING PAST FIVE YEARS
AND OTHER INFORMATION | | PORTFOLIOS
IN FUND
COMPLEX
OVERSEEN BY
DIRECTOR | | | OTHER PUBLIC
COMPANY
DIRECTORSHIPS
CURRENTLY HELD
BY DIRECTOR |
DISINTERESTED DIRECTORS
(continued) | | | | | | |
Michael J. Downey, ## 73 (2015) | | Private Investor since prior to 2012. Formerly, managing partner of Lexington Capital, LLC (investment advisory firm) from December 1997 until December 2003. He also served as a Director of Prospect Acquisition Corp. (financial services) from 2007 until 2009. From 1987 until 1993, Chairman and CEO of Prudential Mutual Fund Management, director of the Prudential mutual funds, and member of the Executive Committee of Prudential Securities Inc. He has served as a director or trustee of the AB Funds since 2005 and is a director and Chairman of one other registered investment company. | | | 97 | | | The Asia Pacific Fund, Inc. (registered investment company) since prior to 2012 |
| | | | | | | | |
William H. Foulk, Jr., ## 84 (2015) | | Investment Adviser and an Independent Consultant since prior to 2012. Previously, he was Senior Manager of Barrett Associates, Inc., a registered investment adviser. He was formerly Deputy Comptroller and Chief Investment Officer of the State of New York and, prior thereto, Chief Investment Officer of the New York Bank for Savings. He has served as a director or trustee of various AB Funds since 1983, and was Chairman of the Independent Directors Committees of the AB Funds from 2003 until early February 2014. He served as Chairman of such AB Funds from 2003 through December 2013. He is also active in a number of mutual fund related organizations and committees. | | | 97 | | | None |
| | |
| abfunds.com | | AB FLEXFEE EMERGING MARKETS GROWTH PORTFOLIO | 41 |
MANAGEMENT OF THE FUND (continued)
| | | | | | | | |
NAME,
ADDRESS*, AGE,
(YEAR FIRST ELECTED**) | | PRINCIPAL
OCCUPATION(S)
DURING PAST FIVE YEARS
AND OTHER INFORMATION | | PORTFOLIOS
IN FUND
COMPLEX
OVERSEEN BY
DIRECTOR | | | OTHER PUBLIC
COMPANY
DIRECTORSHIPS
CURRENTLY HELD
BY DIRECTOR |
DISINTERESTED DIRECTORS
(continued) | | | | | | |
D. James Guzy, ## 81 (2015) | | Chairman of the Board of SRC Computers, Inc. (semi-conductors), with which he has been associated since prior to 2012. He served as Chairman of the Board of PLX Technology (semi-conductors) since prior to 2012 until November 2013. He was a director of Intel Corporation (semi-conductors) from 1969 until 2008, and served as Chairman of the Finance Committee of such company for several years until May 2008. He has served as a director or trustee of one or more of the AB Funds since 1982. | | | 94 | | | None |
| | | | | | | | |
Nancy P. Jacklin, ## 69 (2015) | | Private Investor since prior to 2012. Professorial Lecturer at the Johns Hopkins School of Advanced International Studies (2008-2015). U.S. Executive Director of the International Monetary Fund (which is responsible for ensuring the stability of the international monetary system), (December 2002-May 2006); Partner, Clifford Chance (1992-2002); Sector Counsel, International Banking and Finance, and Associate General Counsel, Citicorp (1985-1992); Assistant General Counsel (International), Federal Reserve Board of Governors (1982-1985); and Attorney Advisor, U.S. Department of the Treasury (1973-1982). Member of the Bar of the District of Columbia and of New York; and member of the Council on Foreign Relations. She has served as a director or trustee of the AB Funds since 2006 and has been Chairman of the Governance and Nominating Committees of the AB Funds since August 2014. | | | 97 | | | None |
| | |
| 42 | AB FLEXFEE EMERGING MARKETS GROWTH PORTFOLIO | | abfunds.com |
MANAGEMENT OF THE FUND (continued)
| | | | | | | | |
NAME,
ADDRESS*, AGE,
(YEAR FIRST ELECTED**) | | PRINCIPAL
OCCUPATION(S)
DURING PAST FIVE YEARS
AND OTHER INFORMATION | | PORTFOLIOS
IN FUND
COMPLEX
OVERSEEN BY
DIRECTOR | | | OTHER PUBLIC
COMPANY
DIRECTORSHIPS
CURRENTLY HELD
BY DIRECTOR |
DISINTERESTED DIRECTORS
(continued) | | | | | | |
Carol C. McMullen, ## 62 (2016) | | Managing Director of Slalom Consulting (consulting) since 2014, private investor and member of the Partners Healthcare Investment Committee. Formerly, Director of Norfolk & Dedham Group (mutual property and casualty insurance) from 2011 until November 2016; Director of Partners Community Physicians Organization (healthcare) from 2014 until December 2016; and Managing Director of The Crossland Group (consulting) from 2012 until 2013. She has held a number of senior positions in the asset and wealth management industries, including at Eastern Bank (where her roles included President of Eastern Wealth Management), Thomson Financial (Global Head of Sales for Investment Management), and Putnam Investments (where her roles included Head of Global Investment Research). She has served on a number of private company and nonprofit boards, and as a director or trustee of the AB Funds since June 2016. | | | 97 | | | None |
| | | | | | | | |
| | |
| abfunds.com | | AB FLEXFEE EMERGING MARKETS GROWTH PORTFOLIO | 43 |
MANAGEMENT OF THE FUND (continued)
| | | | | | | | |
NAME,
ADDRESS*, AGE,
(YEAR FIRST ELECTED**) | | PRINCIPAL
OCCUPATION(S)
DURING PAST FIVE YEARS
AND OTHER INFORMATION | | PORTFOLIOS
IN FUND
COMPLEX
OVERSEEN BY
DIRECTOR | | | OTHER PUBLIC
COMPANY
DIRECTORSHIPS
CURRENTLY HELD
BY DIRECTOR |
DISINTERESTED DIRECTORS
(continued) | | | | | | |
Garry L. Moody, ## 65 (2015) | | Independent Consultant. Formerly, Partner, Deloitte & Touche LLP (1995-2008) where he held a number of senior positions, including Vice Chairman, and U.S. and Global Investment Management Practice Managing Partner; President, Fidelity Accounting and Custody Services Company (1993-1995), where he was responsible for the accounting, pricing, custody and reporting for the Fidelity mutual funds; and Partner, Ernst & Young LLP (1975-1993), where he served as the National Director of Mutual Fund Tax Services and Managing Partner of its Chicago Office Tax department. He is a member of the Trustee Advisory Board of BoardIQ, a biweekly publication focused on issues and news affecting directors of mutual funds. He has served as a director or trustee and as Chairman of the Audit Committees of the AB Funds since 2008. | | | 97 | | | None |
| | | | | | | | |
Earl D. Weiner, ## 78 (2015) | | Of Counsel, and Partner prior to January 2007, of the law firm Sullivan & Cromwell LLP and is a former member of the ABA Federal Regulation of Securities Committee Task Force to draft editions of the Fund Director’s Guidebook. He also serves as a director or trustee of various non-profit organizations and has served as Chairman or Vice Chairman of a number of them. He has served as a director or trustee of the AB Funds since 2007 and served as Chairman of the Governance and Nominating Committees of the AB Funds from 2007 until August 2014. | | | 97 | | | None |
| | |
| 44 | AB FLEXFEE EMERGING MARKETS GROWTH PORTFOLIO | | abfunds.com |
MANAGEMENT OF THE FUND (continued)
| * | The address for each of the Fund’s disinterested Directors is c/o AllianceBernstein L.P., Attention: Philip L. Kirstein, 1345 Avenue of the Americas, New York, NY 10105. |
| ** | There is no stated term of office for the Fund’s Directors. |
| *** | The information above includes each Director’s principal occupation during the last five years and other information relating to the experience, attributes and skills relevant to each Director’s qualifications to serve as a Director, which led to the conclusion that each Director should serve as a Director for the Fund. |
| # | Mr. Keith is an “interested person” of the Fund, as defined in the 1940 Act, due to his position as a Senior Vice President of the Adviser. |
| ## | Member of the Audit Committee, the Governance and Nominating Committee and the Independent Directors Committee. |
| | |
| abfunds.com | | AB FLEXFEE EMERGING MARKETS GROWTH PORTFOLIO | 45 |
MANAGEMENT OF THE FUND (continued)
Officer Information
Certain information concerning the Fund’s Officers is listed below:
| | | | |
Robert M. Keith
57 | | President and Chief Executive Officer | | See biography above. |
| | | | |
Philip L. Kirstein
72 | | Senior Vice President and Independent Compliance Officer | | Senior Vice President and Independent Compliance Officer of the AB Funds, with which he has been associated since October 2004. Prior thereto, he was Of Counsel to Kirkpatrick & Lockhart, LLP from October 2003 to October 2004, and General Counsel of Merrill Lynch Investment Managers, L.P., since prior to March 2003. |
| | | | |
Laurent Saltiel 47 | | Vice President | | Senior Vice President of the Adviser with which he has been associated since prior to 2012. |
| | | | |
Emilie D. Wrapp
61 | | Secretary | | Senior Vice President, Assistant General Counsel and Assistant Secretary of ABI**, with which she has been associated since prior to 2012. |
| | | | |
Joseph J. Mantineo
58 | | Treasurer and Chief Financial Officer | | Senior Vice President of AllianceBernstein Investor Services (“ABIS”)**, with which he has been associated since prior to 2012. |
| | | | |
Phyllis J. Clarke
56 | | Controller | | Vice President of ABIS**, with which she has been associated since prior to 2012. |
| | | | |
Vincent S. Noto 52 | | Chief Compliance Officer | | Senior Vice President since 2015 and Mutual Fund Chief Compliance Officer of the Adviser** since 2014. Prior thereto, he was Vice President and Director of Mutual Fund Compliance of the Adviser** since prior to 2012. |
| * | The address for each of the Fund’s Officers is 1345 Avenue of the Americas, New York, NY 10105. |
| ** | The Adviser, ABI and ABIS are affiliates of the Fund. |
| | The Fund’s Statement of Additional Information (“SAI”) has additional information about the Fund’s Directors and Officers and is available without charge upon request. Contact your financial representative or AB at (800) 227-4618, or visit www.abfunds.com, for a free prospectus or SAI. |
| | |
| 46 | AB FLEXFEE EMERGING MARKETS GROWTH PORTFOLIO | | abfunds.com |
Information Regarding the Review and Approval of the Fund’s Advisory Agreement
At a meeting held on January 31-February 1, 2017 (the “Meeting”), the disinterested directors (the “directors”) of AB Cap Fund, Inc. (the “Company”) unanimously approved an amendment to the Company’s Advisory Agreement with the Adviser in respect of AB FlexFee™ Emerging Markets Growth Portfolio (the “Fund”) to change the Fund’s advisory fee effective July 1, 2017. The amended Advisory Agreement was approved for an initial two-year period. (The Fund was formerly known as AB Emerging Markets Growth Portfolio and, at the time of the approval of the amended Advisory Agreement, AB Performance Fee Series – Emerging Markets Growth Portfolio.)
Prior to approval of the Advisory Agreement, the directors had requested from the Adviser, and received and evaluated, extensive materials. They reviewed the proposed Advisory Agreement with the Adviser and with experienced counsel who are independent of the Adviser, who advised on the relevant legal standards. The directors also reviewed an independent evaluation prepared by the Company’s Senior Officer (who is also the Company’s Independent Compliance Officer), who acted as their independent fee consultant, of the reasonableness of the proposed performance-based advisory fee (which consists of a base fee plus or minus a performance adjustment), in which the Senior Officer concluded that the proposed contractual fee for the Fund was reasonable. The directors also discussed the proposed approval in private sessions with counsel and the Company’s Senior Officer.
The directors considered their knowledge of the nature and quality of the services to be provided by the Adviser to the Fund gained from their experience as directors or trustees of most of the registered investment companies advised by the Adviser, their overall confidence in the Adviser’s integrity and competence they have gained from that experience, the Adviser’s initiative in identifying and raising potential issues with the directors and its responsiveness, frankness and attention to concerns raised by the directors in the past, including the Adviser’s willingness to consider and implement organizational and operational changes designed to improve investment results and the services provided to the AB Funds. The directors noted that they have four regular meetings each year, at each of which they receive presentations from the Adviser on the investment results of the AB Funds and review extensive materials and information presented by the Adviser.
The directors also considered all factors they believed relevant, including the specific matters discussed below. During the course of their deliberations, the directors evaluated, among other things, the reasonableness of the proposed advisory fee. The directors did not identify any particular information that was all-important or controlling, and different directors may have attributed different weights to the various factors. The directors determined that the selection of the Adviser to manage the Fund and the
| | |
| abfunds.com | | AB FLEXFEE EMERGING MARKETS GROWTH PORTFOLIO | 47 |
overall arrangements between the Fund and the Adviser, as provided in the Advisory Agreement, including the proposed advisory fee, were fair and reasonable in light of the services to be performed, expenses to be incurred and such other matters as the directors considered relevant in the exercise of their business judgment. The material factors and conclusions that formed the basis for the directors’ determinations included the following:
Nature, Extent and Quality of Services to be Provided
The directors considered the scope and quality of services to be provided by the Adviser under the Advisory Agreement, including the quality of the investment research capabilities of the Adviser and the other resources it has dedicated to performing services for the AB Funds. They also noted the professional experience and qualifications of the Fund’s portfolio management team and other senior personnel of the Adviser. The directors also considered that the Advisory Agreement provides that the Fund will reimburse the Adviser for the cost to it of providing certain clerical, accounting, administrative and other services to the Fund by employees of the Adviser or its affiliates. Requests for these reimbursements will be subject to the directors’ approval on a quarterly basis and, to the extent requested and paid, result in a higher rate of total compensation from the Fund to the Adviser than the fee rate stated in the Advisory Agreement. The directors noted that the methodology to be used to determine the reimbursement amounts had been reviewed by an independent consultant retained by the Company’s Senior Officer. The quality of administrative and other services, including the Adviser’s role in coordinating the activities of the Fund’s other service providers, also was considered. The directors concluded that, overall, they were satisfied with the nature, extent and quality of services to be provided to the Fund under the Advisory Agreement.
Costs of Services to be Provided and Profitability
Because the Fund had not yet commenced operations, the directors were unable to consider historical information about the profitability of the Fund. However, the Adviser agreed to provide the directors with profitability information in connection with future proposed continuances of the Advisory Agreement. They also considered the costs to be borne by the Adviser in providing services to the Fund and that the Fund was unlikely to be profitable to the Adviser unless it achieves a material level of net assets. The directors also noted that, due to the performance fee component of the advisory fee, profitability would tend to be higher with better performance relative to the Fund’s benchmark, which they considered to create an appropriate alignment of incentives.
Fall-Out Benefits
The directors considered the other benefits to the Adviser and its affiliates from their proposed relationships with the Fund, including, but not limited to, benefits relating to 12b-1 fees and sales charges to be received by the Fund’s principal underwriter (which is a wholly owned subsidiary of the
| | |
| 48 | AB FLEXFEE EMERGING MARKETS GROWTH PORTFOLIO | | abfunds.com |
Adviser) in respect of certain classes of the Fund’s shares; and transfer agency fees to be paid by the Fund to a wholly owned subsidiary of the Adviser. The directors recognized that the Adviser’s future profitability would be somewhat lower without these benefits. The directors understood that the Adviser also might derive reputational and other benefits from its association with the Fund.
Investment Results
At the Meeting, the directors reviewed performance information for the Fund’s prior operations as AB Cap Fund – AB Emerging Markets Growth Portfolio and noted as well the Adviser’s experience in managing emerging markets growth accounts. Based on this information, together with the Adviser’s written and oral presentations regarding the management of the Fund and their general knowledge and confidence in the Adviser’s expertise in managing mutual funds, the directors concluded that they were satisfied that the Adviser was capable of providing high quality Fund management services to the Fund.
Advisory Fees and Other Expenses
The directors considered the proposed advisory fee rate payable by the Fund to the Adviser and information prepared by three analytical services that are not affiliated with the Adviser (the “15(c) service providers”), concerning advisory fee rates paid by other funds in the same category as the Fund at a hypothetical common asset level of $250 million. The directors recognized that it is difficult to make comparisons of advisory fees because there are variations in the services that are included in the fees paid by other funds. The directors considered the Fund’s proposed contractual effective advisory fee rate against a peer group median.
The directors recognized that the Adviser’s total compensation from the Fund pursuant to the Advisory Agreement would be increased by amounts paid pursuant to the expense reimbursement provision in the Advisory Agreement, and that the impact of such expense reimbursement would depend on the size of the Fund and the extent to which the Adviser requests reimbursements pursuant to this provision.
The directors also considered the Adviser’s fee schedule for institutional clients pursuing a similar investment style. For this purpose, they reviewed the relevant advisory fee information from the Adviser’s Form ADV and the evaluation from the Company’s Senior Officer and noted the differences between the Fund’s proposed fee schedule, on the one hand, and the institutional fee schedule and the schedule of fees charged to any offshore funds and any sub-advised funds, on the other. The directors noted that the Adviser may, in some cases, agree to fee rates with large institutional clients that are lower than those reviewed by the directors and that they had previously discussed with the Adviser its policies in respect of such arrangements.
| | |
| abfunds.com | | AB FLEXFEE EMERGING MARKETS GROWTH PORTFOLIO | 49 |
The Adviser reviewed with the directors the significantly greater scope of the services it provides to the Fund relative to institutional, offshore fund and sub-advised fund clients. In light of the substantial differences in services rendered by the Adviser to institutional, offshore fund and sub-advised fund clients as compared to funds such as the Fund, the directors considered these fee comparisons inapt and did not place significant weight on them in their deliberations.
The directors noted that the Fund may invest in shares of exchange-traded funds (“ETFs”), subject to the restrictions and limitations of the Investment Company Act of 1940 as these may be varied as a result of exemptive orders issued by the SEC. The directors also noted that ETFs pay advisory fees pursuant to their advisory contracts. The directors concluded, based on the Adviser’s explanation of how it may use ETFs when they are the most cost-effective way to obtain desired exposures or to “equitize” cash inflows pending purchases of underlying securities, that the proposed advisory fee would be for services in addition to, rather than duplicative of, the services provided under the advisory contracts of the ETFs in which the Fund may invest.
The directors also considered the projected total expense ratio of the Advisor Class shares of the Fund in comparison to a peer group and a peer universe selected by each 15(c) service provider. The directors also considered the Adviser’s proposed expense cap for the “other expenses” of the Fund (expenses excluding the advisory fee, Rule 12b-1 fees, and certain other expenses typically excluded from the Adviser’s expense caps) for the period ending December 31, 2018. The directors noted that it was likely that the expense ratios of some of the other funds in the Fund’s category were lowered by waivers or reimbursements by those funds’ investment advisers, which in some cases might be voluntary or temporary. The directors view the projected expense ratio information as relevant to their evaluation of the Adviser’s services because the Adviser is responsible for coordinating services provided to the Fund by others. Based on their review, the directors concluded that the Fund’s projected expense ratio was acceptable.
Economies of Scale
The directors noted that the proposed advisory fee schedule for the Fund does not contain breakpoints and that they had previously discussed their strong preference for breakpoints in advisory contracts with the Adviser. The directors took into consideration prior presentations by an independent consultant on economies of scale in the mutual fund industry and for the AB Funds, and by the Adviser concerning certain of its views on economies of scale. The directors also had requested and received from the Adviser certain updates on economies of scale in advance of the Meeting. The directors believe that economies of scale may be realized (if at all) by the Adviser across a variety of products and services, and not
| | |
| 50 | AB FLEXFEE EMERGING MARKETS GROWTH PORTFOLIO | | abfunds.com |
only in respect of a single fund. The directors noted that there is no established methodology for setting breakpoints that give effect to the fund-specific services provided by a fund’s adviser and to the economies of scale that an adviser may realize in its overall mutual fund business or those components of it which directly or indirectly affect a fund’s operations. The directors observed that in the mutual fund industry as a whole, as well as among funds similar to the Fund, there is no uniformity or pattern in the fees and asset levels at which breakpoints (if any) apply. The directors also noted that the advisory agreements for many funds do not have breakpoints at all. The directors informed the Adviser that they would monitor the Fund’s assets and its profitability to the Adviser and anticipated revisiting the question of breakpoints in the future if circumstances warranted doing so.
| | |
| abfunds.com | | AB FLEXFEE EMERGING MARKETS GROWTH PORTFOLIO | 51 |
This page is not part of the Shareholder Report or the Financial Statements.
AB FAMILY OF FUNDS
US EQUITY
US CORE
Core Opportunities Fund
Select US Equity Portfolio
US GROWTH
Concentrated Growth Fund
Discovery Growth Fund
Growth Fund
Large Cap Growth Fund
Small Cap Growth Portfolio
US VALUE
Discovery Value Fund
Equity Income Fund
Relative Value Fund1
Small Cap Value Portfolio
Value Fund
INTERNATIONAL/ GLOBAL EQUITY
INTERNATIONAL/ GLOBAL CORE
Global Core Equity Portfolio
International Portfolio
International Strategic Core Portfolio
Sustainable Global Thematic Fund1
Tax-Managed International Portfolio
Tax-Managed Wealth Appreciation Strategy
Wealth Appreciation Strategy
INTERNATIONAL/ GLOBAL GROWTH
Concentrated International Growth Portfolio
International Growth Fund
INTERNATIONAL/ GLOBAL EQUITY (continued)
INTERNATIONAL/ GLOBAL VALUE
Asia ex-Japan Equity Portfolio
International Value Fund
FIXED INCOME
MUNICIPAL
High Income Municipal Portfolio
Intermediate California Municipal Portfolio
Intermediate Diversified Municipal Portfolio
Intermediate New York Municipal Portfolio
Municipal Bond Inflation Strategy
Tax-Aware Fixed Income Portfolio
National Portfolio
Arizona Portfolio
California Portfolio
Massachusetts Portfolio
Minnesota Portfolio
New Jersey Portfolio
New York Portfolio
Ohio Portfolio
Pennsylvania Portfolio
Virginia Portfolio
TAXABLE
Bond Inflation Strategy
Global Bond Fund
High Income Fund
High Yield Portfolio
Income Fund
Intermediate Bond Portfolio
Limited Duration High Income Portfolio
Short Duration Portfolio
ALTERNATIVES
All Market Real Return Portfolio
Credit Long/Short Portfolio
Global Real Estate Investment Fund
Select US Long/Short Portfolio
Unconstrained Bond Fund
MULTI-ASSET
All Market Income Portfolio
All Market Total Return Portfolio1
Conservative Wealth Strategy
Emerging Markets Multi-Asset Portfolio
Global Risk Allocation Fund
Tax-Managed All Market Income Portfolio1
TARGET-DATE
Multi-Manager Select Retirement Allocation Fund
Multi-Manager Select 2010 Fund
Multi-Manager Select 2015 Fund
Multi-Manager Select 2020 Fund
Multi-Manager Select 2025 Fund
Multi-Manager Select 2030 Fund
Multi-Manager Select 2035 Fund
Multi-Manager Select 2040 Fund
Multi-Manager Select 2045 Fund
Multi-Manager Select 2050 Fund
Multi-Manager Select 2055 Fund
CLOSED-END FUNDS
Alliance California Municipal Income Fund
AllianceBernstein Global High Income Fund
AllianceBernstein National Municipal Income Fund
We also offer Government Exchange Reserves, which serves as the money market fund exchange vehicle for the AB mutual funds. An investment in Government Exchange Reserves is not a deposit in a bank and is not insured or guaranteed by the Federal Deposit Insurance Corporation or any other government agency. Although the Fund seeks to preserve the value of your investment at $1.00 per share, it is possible to lose money by investing in the Fund.
Investors should consider the investment objectives, risks, charges and expenses of the Fund carefully before investing. For copies of our prospectus or summary prospectus, which contain this and other information, visit us online at www.abfunds.com or contact your AB representative. Please read the prospectus and/or summary prospectus carefully before investing.
| 1 | Prior to November 1, 2016, Sustainable Global Thematic Fund was named Global Thematic Growth Fund; prior to January 9, 2017, Relative Value Fund was named Growth & Income Fund; prior to April 17, 2017, Tax-Managed All Market Income Portfolio was named Tax-Managed Balanced Wealth Strategy; prior to April 24, 2017, All Market Total Return Portfolio was named Balanced Wealth Strategy. |
| | |
| 52 | AB FLEXFEE EMERGING MARKETS GROWTH PORTFOLIO | | abfunds.com |

AB FLEXFEE EMERGING MARKETS GROWTH PORTFOLIO
1345 Avenue of the Americas
New York, NY 10105
800 221 5672
FFEMG-0151-0617 
JUN 06.30.17
ANNUAL REPORT
AB GLOBAL CORE EQUITY PORTFOLIO


| | |
| |
| Investment Products Offered | | • Are Not FDIC Insured • May Lose Value • Are Not Bank Guaranteed |
Investors should consider the investment objectives, risks, charges and expenses of the Fund carefully before investing. For copies of our prospectus or summary prospectus, which contain this and other information, visit us online at www.abfunds.com or contact your AB representative. Please read the prospectus and/or summary prospectus carefully before investing.
This shareholder report must be preceded or accompanied by the Fund’s prospectus for individuals who are not current shareholders of the Fund.
You may obtain a description of the Fund’s proxy voting policies and procedures, and information regarding how the Fund voted proxies relating to portfolio securities during the most recent 12-month period ended June 30, without charge. Simply visit AB’s website at www.abfunds.com, or go to the Securities and Exchange Commission’s (the “Commission”) website at www.sec.gov, or call AB at (800) 227 4618.
The Fund files its complete schedule of portfolio holdings with the Commission for the first and third quarters of each fiscal year on Form N-Q. The Fund’s Forms N-Q are available on the Commission’s website at www.sec.gov. The Fund’s Forms N-Q may also be reviewed and copied at the Commission’s Public Reference Room in Washington, DC; information on the operation of the Public Reference Room may be obtained by calling (800) SEC 0330. AB publishes full portfolio holdings for the Fund monthly at www.abfunds.com.
AllianceBernstein Investments, Inc. (ABI) is the distributor of the AB family of mutual funds. ABI is a member of FINRA and is an affiliate of AllianceBernstein L.P., the Adviser of the funds.
The [A/B] logo is a registered service mark of AllianceBernstein and AllianceBernstein® is a registered service mark used by permission of the owner, AllianceBernstein L.P.
| | |
| FROM THE PRESIDENT | |  |
Dear Shareholder,
We are pleased to provide this report for AB Global Core Equity Portfolio (the “Fund”). Please review the discussion of Fund performance, the market conditions during the reporting period and the Fund’s investment strategy.
As always, AB strives to keep clients ahead of what’s next by:
| + | | Transforming uncommon insights into uncommon knowledge with a global research scope |
| + | | Navigating markets with seasoned investment experience and sophisticated solutions |
| + | | Providing thoughtful investment insights and actionable ideas |
Whether you’re an individual investor or a multi-billion-dollar institution, we put knowledge and experience to work for you.
AB’s global research organization connects and collaborates across platforms and teams to deliver impactful insights and innovative products. Better insights lead to better opportunities—anywhere in the world.
For additional information about AB’s range of products and shareholder resources, please log on to www.abfunds.com.
Thank you for your investment in the AB Mutual Funds.
Sincerely,

Robert M. Keith
President and Chief Executive Officer, AB Mutual Funds
| | |
| abfunds.com | | AB GLOBAL CORE EQUITY PORTFOLIO | 1 |
ANNUAL REPORT
August 10, 2017
This report provides management’s discussion of fund performance for AB Global Core Equity Portfolio for the annual reporting period ended June 30, 2017.
The Fund’s investment objective is to seek long-term growth of capital.
NAV RETURNS AS OF JUNE 30, 2017 (unaudited)
| | | | | | | | |
| | | 6 Months | | | 12 Months | |
| AB GLOBAL CORE EQUITY PORTFOLIO | | | | | | | | |
| Class A Shares | | | 14.23% | | | | 21.81% | |
| Class C Shares | | | 13.80% | | | | 20.80% | |
| Advisor Class Shares1 | | | 14.41% | | | | 22.09% | |
| MSCI ACWI (net) | | | 11.48% | | | | 18.78% | |
| 1 | Please note that this share class is for investors purchasing shares through accounts established under certain fee-based programs sponsored and maintained by certain broker-dealers and financial intermediaries, institutional pension plans and/or investment advisory clients of, and certain other persons associated with, the Adviser and its affiliates or the Fund. |
Please keep in mind that high, double-digit returns are highly unusual and cannot be sustained. Investors should also be aware that these returns were primarily achieved during favorable market conditions.
INVESTMENT RESULTS
The table above shows the Fund’s performance compared with its benchmark, the Morgan Stanley Capital International All Country World Index (“MSCI ACWI”) net, for the six- and 12-month periods ended June 30, 2017.
For both periods, all share classes outperformed the benchmark, before sales charges. For the 12-month period, security selection, sector allocation and currency positioning all contributed, while country positioning (a result of bottom-up security analysis combined with fundamental research) detracted, relative to the benchmark. Security selection in the financials and consumer discretionary sectors contributed, while selections in industrials and technology detracted. Underweights in energy and consumer staples contributed, while overweights in telecommunications and health care detracted. Currency selection was positive, as an overweight to the Israeli new shekel and an underweight to the Japanese yen contributed, while an overweight to the euro detracted. Country selection was negative, as losses from an overweight to Israel more than offset gains from an overweight to Germany.
Performance during the six-month period was driven by stock selection. While sector selection and country positioning were also positive, currency
| | |
| 2 | AB GLOBAL CORE EQUITY PORTFOLIO | | abfunds.com |
selection was negative, versus the benchmark. Stock selection contributed in the financials and consumer discretionary sectors, and detracted in technology and health care. An underweight in the energy sector contributed, offsetting an overweight in telecommunications, which detracted. Country selection was positive, as gains from an underweight to Canada and overweight to Denmark more than offset losses from an overweight to Russia. The Fund’s underweight in the Australian dollar was a large detractor from returns.
The Fund did not utilize derivatives during the six- or 12-month periods.
MARKET REVIEW AND INVESTMENT STRATEGY
Aside from a few fleeting downturns, global stocks surged during the 12-month period ended June 30, 2017. A number of geopolitical developments unfolded during the period amidst a steadily accelerating global economy. Fallout from the UK’s decision to leave the European Union (“Brexit”), Donald Trump’s surprise ascension to the US presidency and a decisive victory by newcomer French president Emmanuel Macron all played a role. Financial markets were buoyed by Trump’s win, although investors fretted about White House turmoil and policy risk at times. UK prime minister Theresa May further rattled markets when she called for a snap parliamentary election three years ahead of schedule in an attempt to shore up her mandate ahead of Brexit negotiations. The move backfired, however, heightening political uncertainty when May’s Conservative Party was left with a minority position. On the other hand, investors were reassured a few days later when Macron’s centrist party secured a resounding majority in the French parliament.
The Fund’s strategy remains combining active stock selection, investing in value creators at the right price, and doing so in a core portfolio setup, minimizing unintended factor risks. As such, the Fund’s Senior Investment Management Team (the “Team”) tends to avoid taking large positions relative to the market on styles, regions and sectors. Factor returns tend to be volatile, validated over recent years with quality stocks outperforming in 2015, value outperforming in 2016 and growth leading the way for the first half of 2017. Despite different themes and factors driving the market, the Team’s strategy has consistently outperformed for 2015, 2016 and the first half of 2017 with excess returns achieved through stock picking rather than timing or style biases.
INVESTMENT POLICIES
The Fund invests primarily in a portfolio of equity securities of issuers from markets around the world. Under normal circumstances, the Fund invests at least 80% of its net assets in equity securities, at least 40% of its net assets in securities of non-US companies, and
(continued on next page)
| | |
| abfunds.com | | AB GLOBAL CORE EQUITY PORTFOLIO | 3 |
invests in companies in at least three countries (including the United States).
The Fund is principally comprised of companies considered by the Adviser to offer good prospects for attractive returns relative to the general stock market. The Adviser will seek companies that are attractively valued and have the ability to generate high and sustainable returns on invested capital. In addition to returns on invested capital, other criteria that the Adviser will consider include strong business fundamentals, capable management, prudent corporate governance, a strong balance sheet, strong earnings power, high earnings quality, low downside risk and substantial upside potential. In managing the Fund, the Adviser will not seek to have a bias towards any investment style, economic sector, country or company size. The Fund’s holdings of non-US companies will frequently include companies located in emerging markets, and at times emerging-market companies will make up a significant portion of the Fund.
Fluctuations in currency exchange rates can have a dramatic impact on the returns of equity securities. While the Adviser may hedge the foreign currency exposure resulting from the Fund’s security positions through the use of currency-related derivatives, it is not required to do so.
| | |
| 4 | AB GLOBAL CORE EQUITY PORTFOLIO | | abfunds.com |
DISCLOSURES AND RISKS
Benchmark Disclosure
The MSCI ACWI is unmanaged and does not reflect fees and expenses associated with the active management of a mutual fund portfolio. The MSCI ACWI (net; free float-adjusted, market capitalization weighted) represents the equity market performance of developed and emerging markets. MSCI makes no express or implied warranties or representations, and shall have no liability whatsoever with respect to any MSCI data contained herein. The MSCI data may not be further redistributed or used as a basis for other indices, any securities or financial products. This report is not approved, reviewed or produced by MSCI. Net returns include the reinvestment of dividends after deduction of non-US withholding tax. An investor cannot invest directly in an index or average, and their results are not indicative of the performance for any specific investment, including the Fund.
A Word About Risk
Market Risk: The value of the Fund’s assets will fluctuate as the stock or bond market fluctuates. The value of its investments may decline, sometimes rapidly and unpredictably, simply because of economic changes or other events that affect large portions of the market. It includes the risk that a particular style of investing, such as growth, may underperform the market generally.
Foreign (Non-US) Risk: Investments in securities of non-US issuers may involve more risk than those of US issuers. These securities may fluctuate more widely in price and may be less liquid due to adverse market, economic, political, regulatory or other factors. These risks may be heightened with respect to investments in emerging-market countries, where there may be an increased amount of economic, political and social instability.
Emerging Market Risk: Investments in emerging-market countries may have more risk because the markets are less developed and less liquid as well as being subject to increased economic, political, regulatory or other uncertainties.
Currency Risk: Fluctuations in currency exchange rates may negatively affect the value of the Fund’s investments or reduce its returns.
Non-Diversification Risk: The Fund may have more risk because it is “non-diversified”, meaning that it can invest more of its assets in a smaller number of issuers. Accordingly, changes in the value of a single security may have a more significant effect, either negative or positive, on the Fund’s net asset value (“NAV”).
Management Risk: The Fund is subject to management risk because it is an actively managed investment fund. The Adviser will apply its investment
| | |
| abfunds.com | | AB GLOBAL CORE EQUITY PORTFOLIO | 5 |
DISCLOSURES AND RISKS (continued)
techniques and risk analyses in making investment decisions for the Fund, but there is no guarantee that its techniques will produce the intended results.
These risks are fully discussed in the Fund’s prospectus. As with all investments, you may lose money by investing in the Fund.
An Important Note About Historical Performance
The investment return and principal value of an investment in the Fund will fluctuate, so that shares, when redeemed, may be worth more or less than their original cost. Performance shown in this report represents past performance and does not guarantee future results. Current performance may be lower or higher than the performance information shown. You may obtain performance information current to the most recent month-end by visiting www.abfunds.com.
All fees and expenses related to the operation of the Fund have been deducted. NAV returns do not reflect sales charges; if sales charges were reflected, the Fund’s quoted performance would be lower. SEC returns reflect the applicable sales charges for each share class: a 4.25% maximum front-end sales charge for Class A shares; and a 1% 1-year contingent deferred sales charge for Class C shares. Returns for the different share classes will vary due to different expenses associated with each class. Performance assumes reinvestment of distributions and does not account for taxes.
| | |
| 6 | AB GLOBAL CORE EQUITY PORTFOLIO | | abfunds.com |
HISTORICAL PERFORMANCE
GROWTH OF A $10,000 INVESTMENT IN THE FUND (unaudited)
11/12/20141 TO 6/30/2017
This chart illustrates the total value of an assumed $10,000 investment in AB Global Core Equity Portfolio Class A shares (from 11/12/20141 to 6/30/2017) as compared to the performance of the Fund’s benchmark. The chart reflects the deduction of the maximum 4.25% sales charge from the initial $10,000 investment in the Fund and assumes the reinvestment of dividends and capital gains distributions.
| 1 | Inception date: 11/12/2014. |
| | |
| abfunds.com | | AB GLOBAL CORE EQUITY PORTFOLIO | 7 |
HISTORICAL PERFORMANCE (continued)
AVERAGE ANNUAL RETURNS AS OF JUNE 30, 2017 (unaudited)
| | | | | | | | |
| | | NAV Returns | | | SEC Returns (reflects applicable sales charges) | |
| CLASS A SHARES | | | | | | | | |
| 1 Year | | | 21.81% | | | | 16.64% | |
| Since Inception1 | | | 7.07% | | | | 5.33% | |
| CLASS C SHARES | | | | | | | | |
| 1 Year | | | 20.80% | | | | 19.80% | |
| Since Inception1 | | | 6.24% | | | | 6.24% | |
| ADVISOR CLASS SHARES2 | | | | | | | | |
| 1 Year | | | 22.09% | | | | 22.09% | |
| Since Inception1 | | | 7.32% | | | | 7.32% | |
The Fund’s current prospectus fee table shows the Fund’s total annual operating expense ratios as 1.38%, 2.09% and 1.08% for Class A, Class C and Advisor Class shares, respectively, gross of any fee waivers or expense reimbursements. Contractual fee waivers and/or expense reimbursements limit the Fund’s annual operating expense ratios exclusive of acquired fund fees and expenses other than the advisory fees of any AB mutual funds in which the Fund may invest, interest expense, taxes, extraordinary expenses, and brokerage commissions and other transaction costs to 1.15%, 1.90% and 0.90% for Class A, Class C and Advisor Class shares, respectively. These waivers/reimbursements may not be terminated before November 1, 2017 and may be extended by the Adviser for additional one-year terms. Any fees waived and expenses borne by the Adviser may be reimbursed by the Fund until the end of the third fiscal year after the fiscal period in which the fee was waived or the expense was borne, provided that no reimbursement payment will be made that would cause the Fund’s total annual operating expenses to exceed the expense limitations. Absent reimbursements or waivers, performance would have been lower. The Financial Highlights section of this report sets forth expense ratio data for the current reporting period; the expense ratios shown above may differ from the expense ratios in the Financial Highlights section since they are based on different time periods.
| 1 | Inception date: 11/12/2014. |
| 2 | Please note that this share class is offered at NAV to eligible investors and the SEC returns are the same as the NAV returns. Please note that this share class is for investors purchasing shares through accounts established under certain fee-based programs sponsored and maintained by certain broker-dealers and financial intermediaries, institutional pension plans and/or investment advisory clients of, and certain other persons associated with, the Adviser and its affiliates or the Fund. |
| | |
| 8 | AB GLOBAL CORE EQUITY PORTFOLIO | | abfunds.com |
HISTORICAL PERFORMANCE (continued)
SEC AVERAGE ANNUAL RETURNS
AS OF THE MOST RECENT CALENDAR QUARTER-END
JUNE 30, 2017 (unaudited)
| | | | |
| | | SEC Returns (reflects applicable sales charges) | |
| CLASS A SHARES | | | | |
| 1 Year | | | 16.64% | |
| Since Inception1 | | | 5.33% | |
| CLASS C SHARES | | | | |
| 1 Year | | | 19.80% | |
| Since Inception1 | | | 6.24% | |
| ADVISOR CLASS SHARES2 | | | | |
| 1 Year | | | 22.09% | |
| Since Inception1 | | | 7.32% | |
| 1 | Inception date: 11/12/2014. |
| 2 | Please note that this share class is for investors purchasing shares through accounts established under certain fee-based programs sponsored and maintained by certain broker-dealers and financial intermediaries, institutional pension plans and/or investment advisory clients of, and certain other persons associated with, the Adviser and its affiliates or the Fund. |
| | |
| abfunds.com | | AB GLOBAL CORE EQUITY PORTFOLIO | 9 |
EXPENSE EXAMPLE
(unaudited)
As a shareholder of the Fund, you incur two types of costs: (1) transaction costs, including sales charges (loads) on purchase payments, contingent deferred sales charges on redemptions and (2) ongoing costs, including management fees; distribution (12b-1) fees; and other Fund expenses. This example is intended to help you understand your ongoing costs (in dollars) of investing in the Fund and to compare these costs with the ongoing costs of investing in other mutual funds.
The Example is based on an investment of $1,000 invested at the beginning of the period and held for the entire period as indicated below.
Actual Expenses
The table below provides information about actual account values and actual expenses. You may use the information, together with the amount you invested, to estimate the expenses that you paid over the period. Simply divide your account value by $1,000 (for example, an $8,600 account value divided by $1,000 = 8.6), then multiply the result by the number under the heading entitled “Expenses Paid During Period” to estimate the expenses you paid on your account during this period.
Hypothetical Example for Comparison Purposes
The table below also provides information about hypothetical account values and hypothetical expenses based on the Fund’s actual expense ratio and an assumed annual rate of return of 5% before expenses, which is not the Fund’s actual return. The hypothetical account values and expenses may not be used to estimate the actual ending account balance or expenses you paid for the period. You may use this information to compare the ongoing costs of investing in the Fund and other funds by comparing this 5% hypothetical example with the 5% hypothetical examples that appear in the shareholder reports of other funds.
Please note that the expenses shown in the table are meant to highlight your ongoing costs only and do not reflect any transactional costs, such as sales charges (loads), or contingent deferred sales charges on redemptions. Therefore, the hypothetical example is useful in comparing ongoing costs only, and will not help you determine the relative total costs of owning different funds. In addition, if these transactional costs were included, your costs would have been higher.
| | | | | | | | | | | | | | | | |
| | | Beginning
Account Value
1/1/2017 | | | Ending
Account Value
6/30/2017 | | | Expenses Paid
During Period* | | | Annualized
Expense Ratio* | |
| Class A | | | | | | | | | | | | | | | | |
Actual | | $ | 1,000 | | | $ | 1,142.30 | | | $ | 6.11 | | | | 1.15 | % |
Hypothetical** | | $ | 1,000 | | | $ | 1,019.09 | | | $ | 5.76 | | | | 1.15 | % |
| Class C | | | | | | | | | | | | | | | | |
Actual | | $ | 1,000 | | | $ | 1,138.00 | | | $ | 10.07 | | | | 1.90 | % |
Hypothetical** | | $ | 1,000 | | | $ | 1,015.37 | | | $ | 9.49 | | | | 1.90 | % |
| Advisor Class | | | | | | | | | | | | | | | | |
Actual | | $ | 1,000 | | | $ | 1,144.10 | | | $ | 4.78 | | | | 0.90 | % |
Hypothetical** | | $ | 1,000 | | | $ | 1,020.33 | | | $ | 4.51 | | | | 0.90 | % |
| * | Expenses are equal to the classes’ annualized expense ratios multiplied by the average account value over the period, multiplied by 181/365 (to reflect the one-half year period). |
| ** | Assumes 5% annual return before expenses. |
| | |
| 10 | AB GLOBAL CORE EQUITY PORTFOLIO | | abfunds.com |
PORTFOLIO SUMMARY
June 30, 2017 (unaudited)
PORTFOLIO STATISTICS
Net Assets ($mil): $316.8
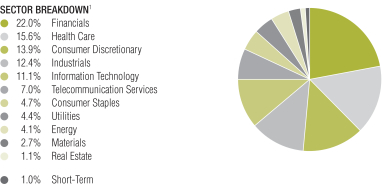
| 1 | All data are as of June 30, 2017. The Fund’s sector and country breakdowns are expressed as a percentage of total investments and may vary over time. “Other” country weightings represent 1.6% or less in the following countries: Brazil, Chile, Netherlands, Russia, Spain and Taiwan. |
Please note: The sector classifications presented herein are based on the Global Industry Classification Standard (GICS) which was developed by Morgan Stanley Capital International and Standard & Poor’s. The components are divided into sector, industry group, and industry sub-indices as classified by the GICS for each of the market capitalization indices in the broad market. These sector classifications are broadly defined. The “Portfolio of Investments” section of the report reflects more specific industry information and is consistent with the investment restrictions discussed in the Fund’s prospectus.
| | |
| abfunds.com | | AB GLOBAL CORE EQUITY PORTFOLIO | 11 |
PORTFOLIO SUMMARY (continued)
June 30, 2017 (unaudited)
TEN LARGEST HOLDINGS1
| | | | | | | | |
| Company | | U.S. $ Value | | | Percent of
Net Assets | |
| Service Corp. International/US | | $ | 16,087,108 | | | | 5.1 | % |
| KDDI Corp. | | | 14,302,876 | | | | 4.5 | |
| Anthem, Inc. | | | 14,033,557 | | | | 4.4 | |
| Microsoft Corp. | | | 12,958,771 | | | | 4.1 | |
| Teva Pharmaceutical Industries Ltd. (Sponsored ADR) | | | 11,476,181 | | | | 3.6 | |
| Moody’s Corp. | | | 11,161,585 | | | | 3.5 | |
| NIKE, Inc. – Class B | | | 10,883,317 | | | | 3.4 | |
| Jyske Bank A/S | | | 9,839,735 | | | | 3.1 | |
| Dover Corp. | | | 9,175,563 | | | | 2.9 | |
| UnitedHealth Group, Inc. | | | 9,014,935 | | | | 2.9 | |
| | $ | 118,933,628 | | | | 37.5 | % |
| | |
| 12 | AB GLOBAL CORE EQUITY PORTFOLIO | | abfunds.com |
PORTFOLIO OF INVESTMENTS
June 30, 2017
| | | | | | | | | | | | |
| Company | | | | | Shares | | | U.S. $ Value | |
| |
| | | | | | | | | | | | |
COMMON STOCKS – 99.0% | | | | | | | | | | | | |
Financials – 22.1% | | | | | | | | | | | | |
Banks – 8.8% | | | | | | | | | | | | |
Citigroup, Inc. | | | | | | | 80,760 | | | $ | 5,401,229 | |
DBS Group Holdings Ltd. | | | | | | | 495,100 | | | | 7,451,640 | |
Jyske Bank A/S | | | | | | | 169,873 | | | | 9,839,735 | |
Wells Fargo & Co. | | | | | | | 92,900 | | | | 5,147,589 | |
| | | | | | | | | | | | |
| | | | | | | | | | | 27,840,193 | |
| | | | | | | | | | | | |
Capital Markets – 10.0% | | | | | | | | | | | | |
BlackRock, Inc. – Class A | | | | | | | 7,806 | | | | 3,297,333 | |
Julius Baer Group Ltd.(a) | | | | | | | 100,510 | | | | 5,310,570 | |
London Stock Exchange Group PLC | | | | | | | 49,826 | | | | 2,370,098 | |
Moody’s Corp. | | | | | | | 91,729 | | | | 11,161,585 | |
S&P Global, Inc. | | | | | | | 44,373 | | | | 6,478,014 | |
Singapore Exchange Ltd. | | | | | | | 574,300 | | | | 3,060,721 | |
| | | | | | | | | | | | |
| | | | | | | | | | | 31,678,321 | |
| | | | | | | | | | | | |
Consumer Finance – 2.0% | | | | | | | | | | | | |
American Express Co. | | | | | | | 76,165 | | | | 6,416,140 | |
| | | | | | | | | | | | |
| | | |
Diversified Financial Services – 1.3% | | | | | | | | | | | | |
Cielo SA | | | | | | | 529,483 | | | | 3,931,686 | |
| | | | | | | | | | | | |
| | | | | | | | | | | 69,866,340 | |
| | | | | | | | | | | | |
Health Care – 15.6% | | | | | | | | | | | | |
Biotechnology – 4.0% | | | | | | | | | | | | |
Biogen, Inc.(a) | | | | | | | 19,050 | | | | 5,169,408 | |
Gilead Sciences, Inc. | | | | | | | 107,011 | | | | 7,574,238 | |
| | | | | | | | | | | | |
| | | | | | | | | | | 12,743,646 | |
| | | | | | | | | | | | |
Health Care Providers & Services – 7.3% | | | | | | | | | | | | |
Anthem, Inc. | | | | | | | 74,595 | | | | 14,033,557 | |
UnitedHealth Group, Inc. | | | | | | | 48,619 | | | | 9,014,935 | |
| | | | | | | | | | | | |
| | | | | | | | | | | 23,048,492 | |
| | | | | | | | | | | | |
Pharmaceuticals – 4.3% | | | | | | | | | | | | |
Roche Holding AG | | | | | | | 8,270 | | | | 2,113,109 | |
Teva Pharmaceutical Industries Ltd. (Sponsored ADR) | | | | | | | 345,460 | | | | 11,476,181 | |
| | | | | | | | | | | | |
| | | | | | | | | | | 13,589,290 | |
| | | | | | | | | | | | |
| | | | | | | | | | | 49,381,428 | |
| | | | | | | | | | | | |
Consumer Discretionary – 13.9% | | | | | | | | | | | | |
Auto Components – 1.0% | | | | | | | | | | | | |
Autoliv, Inc.(b) | | | | | | | 28,420 | | | | 3,120,516 | |
| | | | | | | | | | | | |
| | | |
Diversified Consumer Services – 6.0% | | | | | | | | | | | | |
Service Corp. International/US | | | | | | | 480,930 | | | | 16,087,108 | |
Sotheby’s(a) | | | | | | | 53,040 | | | | 2,846,657 | |
| | | | | | | | | | | | |
| | | | | | | | | | | 18,933,765 | |
| | | | | | | | | | | | |
| | |
| abfunds.com | | AB GLOBAL CORE EQUITY PORTFOLIO | 13 |
PORTFOLIO OF INVESTMENTS (continued)
| | | | | | | | | | | | |
| Company | | | | | Shares | | | U.S. $ Value | |
| |
| | | | | | | | | | | | |
Hotels, Restaurants & Leisure – 0.6% | | | | | | | | | | | | |
Telepizza Group SA(a)(c) | | | | | | | 332,225 | | | $ | 1,916,227 | |
| | | | | | | | | | | | |
| | | |
Media – 1.1% | | | | | | | | | | | | |
Omnicom Group, Inc. | | | | | | | 40,480 | | | | 3,355,792 | |
| | | | | | | | | | | | |
| | | |
Textiles, Apparel & Luxury Goods – 5.2% | | | | | | | | | | | | |
NIKE, Inc. – Class B | | | | | | | 184,463 | | | | 10,883,317 | |
Samsonite International SA | | | | | | | 1,374,000 | | | | 5,740,294 | |
| | | | | | | | | | | | |
| | | | | | | | | | | 16,623,611 | |
| | | | | | | | | | | | |
| | | | | | | | | | | 43,949,911 | |
| | | | | | | | | | | | |
Industrials – 12.3% | | | | | | | | | | | | |
Air Freight & Logistics – 1.0% | | | | | | | | | | | | |
CH Robinson Worldwide, Inc. | | | | | | | 47,980 | | | | 3,295,266 | |
| | | | | | | | | | | | |
| | | |
Airlines – 1.3% | | | | | | | | | | | | |
Japan Airlines Co., Ltd. | | | | | | | 137,200 | | | | 4,249,864 | |
| | | | | | | | | | | | |
| | | |
Commercial Services & Supplies – 2.3% | | | | | | | | | | | | |
Stericycle, Inc.(a) | | | | | | | 61,400 | | | | 4,686,048 | |
Taiwan Secom Co., Ltd. | | | | | | | 859,000 | | | | 2,589,425 | |
| | | | | | | | | | | | |
| | | | | | | | | | | 7,275,473 | |
| | | | | | | | | | | | |
Machinery – 5.6% | | | | | | | | | | | | |
Dover Corp. | | | | | | | 114,380 | | | | 9,175,563 | |
Kone Oyj – Class B | | | | | | | 165,425 | | | | 8,416,016 | |
| | | | | | | | | | | | |
| | | | | | | | | | | 17,591,579 | |
| | | | | | | | | | | | |
Professional Services – 2.1% | | | | | | | | | | | | |
RELX NV | | | | | | | 325,600 | | | | 6,712,834 | |
| | | | | | | | | | | | |
| | | | | | | | | | | 39,125,016 | |
| | | | | | | | | | | | |
Information Technology – 11.1% | | | | | | | | | | | | |
Communications Equipment – 0.8% | | | | | | | | | | | | |
Cisco Systems, Inc. | | | | | | | 77,052 | | | | 2,411,728 | |
| | | | | | | | | | | | |
| | | |
Internet Software & Services – 1.8% | | | | | | | | | | | | |
Alphabet, Inc. – Class C(a) | | | | | | | 6,360 | | | | 5,779,523 | |
| | | | | | | | | | | | |
| | | |
IT Services – 2.4% | | | | | | | | | | | | |
Visa, Inc. – Class A | | | | | | | 80,576 | | | | 7,556,417 | |
| | | | | | | | | | | | |
| | | |
Semiconductors & Semiconductor Equipment – 2.0% | | | | | | | | | | | | |
Intel Corp. | | | | | | | 115,870 | | | | 3,909,454 | |
Taiwan Semiconductor Manufacturing Co., Ltd. | | | | | | | 378,000 | | | | 2,582,576 | |
| | | | | | | | | | | | |
| | | | | | | | | | | 6,492,030 | |
| | | | | | | | | | | | |
Software – 4.1% | | | | | | | | | | | | |
Microsoft Corp. | | | | | | | 187,999 | | | | 12,958,771 | |
| | | | | | | | | | | | |
| | | | | | | | | | | 35,198,469 | |
| | | | | | | | | | | | |
| | |
| 14 | AB GLOBAL CORE EQUITY PORTFOLIO | | abfunds.com |
PORTFOLIO OF INVESTMENTS (continued)
| | | | | | | | | | | | |
| Company | | | | | Shares | | | U.S. $ Value | |
| |
| | | | | | | | | | | | |
Telecommunication Services – 7.0% | | | | | | | | | | | | |
Wireless Telecommunication Services – 7.0% | | | | | | | | | | | | |
KDDI Corp. | | | | | | | 540,800 | | | $ | 14,302,876 | |
MTN Group Ltd. | | | | | | | 906,450 | | | | 7,901,929 | |
| | | | | | | | | | | | |
| | | | | | | | | | | 22,204,805 | |
| | | | | | | | | | | | |
Consumer Staples – 4.7% | | | | | | | | | | | | |
Food & Staples Retailing – 0.7% | | | | | | | | | | | | |
CVS Health Corp. | | | | | | | 29,010 | | | | 2,334,145 | |
| | | | | | | | | | | | |
| | | |
Food Products – 1.7% | | | | | | | | | | | | |
Danone SA | | | | | | | 69,281 | | | | 5,200,066 | |
| | | | | | | | | | | | |
| | | |
Personal Products – 2.3% | | | | | | | | | | | | |
Estee Lauder Cos., Inc. (The) – Class A | | | | | | | 48,750 | | | | 4,679,025 | |
L’Oreal SA | | | | | | | 13,100 | | | | 2,731,540 | |
| | | | | | | | | | | | |
| | | | | | | | | | | 7,410,565 | |
| | | | | | | | | | | | |
| | | | | | | | | | | 14,944,776 | |
| | | | | | | | | | | | |
Utilities – 4.4% | | | | | | | | | | | | |
Electric Utilities – 1.6% | | | | | | | | | | | | |
Enel Americas SA (Sponsored ADR) | | | | | | | 252,052 | | | | 2,376,850 | |
Enel Chile SA (ADR) | | | | | | | 500,850 | | | | 2,754,675 | |
| | | | | | | | | | | | |
| | | | | | | | | | | 5,131,525 | |
| | | | | | | | | | | | |
Water Utilities – 2.8% | | | | | | | | | | | | |
Guangdong Investment Ltd. | | | | | | | 6,344,000 | | | | 8,743,060 | |
| | | | | | | | | | | | |
| | | | | | | | | | | 13,874,585 | |
| | | | | | | | | | | | |
Energy – 4.1% | | | | | | | | | | | | |
Energy Equipment & Services – 1.0% | | | | | | | | | | | | |
Schlumberger Ltd. | | | | | | | 45,740 | | | | 3,011,522 | |
| | | | | | | | | | | | |
| | | |
Oil, Gas & Consumable Fuels – 3.1% | | | | | | | | | | | | |
ConocoPhillips | | | | | | | 55,800 | | | | 2,452,968 | |
LUKOIL PJSC (Sponsored ADR) | | | | | | | 77,099 | | | | 3,761,660 | |
Royal Dutch Shell PLC – Class B | | | | | | | 139,800 | | | | 3,753,129 | |
| | | | | | | | | | | | |
| | | | | | | | | | | 9,967,757 | |
| | | | | | | | | | | | |
| | | | | | | | | | | 12,979,279 | |
| | | | | | | | | | | | |
Materials – 2.7% | | | | | | | | | | | | |
Chemicals – 2.7% | | | | | | | | | | | | |
BASF SE | | | | | | | 66,214 | | | | 6,145,262 | |
Johnson Matthey PLC | | | | | | | 67,970 | | | | 2,543,888 | |
| | | | | | | | | | | | |
| | | | | | | | | | | 8,689,150 | |
| | | | | | | | | | | | |
Real Estate – 1.1% | | | | | | | | | | | | |
Real Estate Management & Development – 1.1% | | | | | | | | | | | | |
CBRE Group, Inc. – Class A(a) | | | | | | | 95,370 | | | | 3,471,468 | |
| | | | | | | | | | | | |
| | | |
Total Common Stocks
(cost $282,595,661) | | | | | | | | | | | 313,685,227 | |
| | | | | | | | | | | | |
| | |
| abfunds.com | | AB GLOBAL CORE EQUITY PORTFOLIO | 15 |
PORTFOLIO OF INVESTMENTS (continued)
| | | | | | | | | | | | |
| Company | | | | | Shares | | | U.S. $ Value | |
| |
| | | | | | | | | | | | |
SHORT-TERM INVESTMENTS – 1.0% | | | | | | | | | | | | |
Investment Companies – 0.9% | | | | | | | | | | | | |
AB Fixed Income Shares, Inc. – Government Money Market Portfolio – Class AB, 0.79%(d)(e)
(cost $2,914,390) | | | | | | | 2,914,390 | | | $ | 2,914,390 | |
| | | | | | | | | | | | |
| | | |
| | | | | | Principal
Amount
(000) | | | | |
Time Deposits – 0.1% | | | | | | | | | | | | |
BBH, Grand Cayman
(1.45)%, 7/03/17 | | | CHF | | | | 28 | | | | 29,218 | |
(1.032)%, 7/03/17 | | | SEK | | | | 1 | | | | 113 | |
(0.70)%, 7/03/17 | | | DKK | | | | 177 | | | | 27,205 | |
0.05%, 7/03/17 | | | GBP | | | | 100 | | | | 130,501 | |
0.05%, 7/04/17 | | | CAD | | | | – 0 | –* | | | 1 | |
0.418%, 7/03/17 | | | AUD | | | | – 0 | –* | | | 2 | |
BNP Paribas, Paris
0.005%, 7/03/17 | | | HKD | | | | 461 | | | | 59,078 | |
0.01%, 7/03/17 | | | SGD | | | | 43 | | | | 30,986 | |
Sumitomo, Tokyo
(0.567)%, 7/03/17 | | | EUR | | | | 28 | | | | 31,790 | |
(0.26)%, 7/03/17 | | | JPY | | | | 3,195 | | | | 28,403 | |
Wells Fargo, Grand Cayman
5.75%, 7/03/17 | | | ZAR | | | | 402 | | | | 30,691 | |
| | | | | | | | | | | | |
| | | |
Total Time Deposits
(cost $365,358) | | | | | | | | | | | 367,988 | |
| | | | | | | | | | | | |
| | | |
Total Short-Term Investments
(cost $3,279,748) | | | | | | | | | | | 3,282,378 | |
| | | | | | | | | | | | |
Total Investments Before Security Lending Collateral for Securities Loaned – 100.0%
(cost $285,875,409) | | | | | | | | | | | 316,967,605 | |
| | | | | | | | | | | | |
| | | |
| | | | | | Shares | | | | |
INVESTMENTS OF CASH COLLATERAL FOR SECURITIES LOANED – 1.0% | | | | | | | | | | | | |
Investment Companies – 1.0% | | | | | | | | | | | | |
AB Fixed Income Shares, Inc. – Government Money Market Portfolio – Class AB, 0.79%(d)(e)
(cost $3,129,531) | | | | | | | 3,129,531 | | | | 3,129,531 | |
| | | | | | | | | | | | |
| | | |
Total Investments – 101.0%
(cost $289,004,940) | | | | | | | | | | | 320,097,136 | |
Other assets less liabilities – (1.0)% | | | | | | | | | | | (3,287,329 | ) |
| | | | | | | | | | | | |
| | | |
Net Assets – 100.0% | | | | | | | | | | $ | 316,809,807 | |
| | | | | | | | | | | | |
| | |
| 16 | AB GLOBAL CORE EQUITY PORTFOLIO | | abfunds.com |
PORTFOLIO OF INVESTMENTS (continued)
| * | Principal amount less than 500. |
| (a) | Non-income producing security. |
| (b) | Represents entire or partial securities out on loan. See Note E for securities lending information. |
| (c) | Security is exempt from registration under Rule 144A of the Securities Act of 1933. This security is considered restricted, but liquid and may be resold in transactions exempt from registration, normally to qualified institutional buyers. At June 30, 2017, the market value of this security amounted to $1,916,227 or 0.6% of net assets. |
| (d) | To obtain a copy of the fund’s shareholder report, please go to the Securities and Exchange Commission’s website at www.sec.gov, or call AB at (800) 227-4618. |
| (e) | Investment in affiliated money market mutual fund. The rate shown represents the 7-day yield as of period end. |
Currency Abbreviations:
AUD – Australian Dollar
CAD – Canadian Dollar
CHF – Swiss Franc
DKK – Danish Krone
EUR – Euro
GBP – Great British Pound
HKD – Hong Kong Dollar
JPY – Japanese Yen
SEK – Swedish Krona
SGD – Singapore Dollar
ZAR – South African Rand
Glossary:
ADR – American Depositary Receipt
PJSC – Public Joint Stock Company
See notes to financial statements.
| | |
| abfunds.com | | AB GLOBAL CORE EQUITY PORTFOLIO | 17 |
STATEMENT OF ASSETS & LIABILITIES
June 30, 2017
| | | | |
| Assets | | | | |
Investments in securities, at value | | | | |
Unaffiliated issuers (cost $282,961,019) | | $ | 314,053,215 | (a) |
Affiliated issuers (cost $6,043,921—including investment of cash collateral for securities loaned of $3,129,531) | | | 6,043,921 | |
Foreign currencies, at value (cost $48) | | | 45 | |
Receivable for capital stock sold | | | 2,544,694 | |
Dividends receivable | | | 705,900 | |
| Affiliated dividends receivable | | | 2,568 | |
| | | | |
Total assets | | | 323,350,343 | |
| | | | |
| Liabilities | | | | |
Payable for collateral received on securities loaned | | | 3,129,531 | |
Payable for investment securities purchased and foreign currency transactions | | | 2,820,964 | |
Payable for capital stock redeemed | | | 325,234 | |
Advisory fee payable | | | 159,910 | |
Administrative fee payable | | | 15,653 | |
Transfer Agent fee payable | | | 4,124 | |
Distribution fee payable | | | 1,175 | |
Due to Custodian | | | 178 | |
Accrued expenses and other liabilities | | | 83,767 | |
| | | | |
Total liabilities | | | 6,540,536 | |
| | | | |
Net Assets | | $ | 316,809,807 | |
| | | | |
| Composition of Net Assets | | | | |
Capital stock, at par | | $ | 2,697 | |
Additional paid-in capital | | | 279,758,803 | |
Undistributed net investment income | | | 2,894,987 | |
Accumulated net realized gain on investment
and foreign currency transactions | | | 3,058,926 | |
Net unrealized appreciation on investments
and foreign currency denominated assets and liabilities | | | 31,094,394 | |
| | | | |
| | $ | 316,809,807 | |
| | | | |
Net Asset Value Per Share—11 billion shares of capital stock authorized, $.0001 par value
| | | | | | | | | | | | |
| Class | | Net Assets | | | Shares
Outstanding | | | Net Asset
Value | |
| |
| A | | $ | 5,910,903 | | | | 504,536 | | | $ | 11.72 | * |
| |
| C | | $ | 69,848 | | | | 6,008 | | | $ | 11.63 | |
| |
| Advisor | | $ | 310,829,056 | | | | 26,457,383 | | | $ | 11.75 | |
| |
| (a) | Includes securities on loan with a value of $3,089,223 (See Note E). |
| * | The maximum offering price per share for Class A shares was $12.24, which reflects a sales charge of 4.25%. |
See notes to financial statements.
| | |
| 18 | AB GLOBAL CORE EQUITY PORTFOLIO | | abfunds.com |
STATEMENT OF OPERATIONS
Year Ended June 30, 2017
| | | | | | | | |
| Investment Income | | | | | | | | |
Dividends | | | | | | | | |
Unaffiliated issuers (net of foreign taxes withheld of $403,745) | | $ | 5,252,726 | | | | | |
Affiliated issuers | | | 12,833 | | | | | |
Securities lending income | | | 19,926 | | | | | |
Interest | | | 635 | | | $ | 5,286,120 | |
| | | | | | | | |
| Expenses | | | | | | | | |
Advisory fee (see Note B) | | | 1,637,988 | | | | | |
Transfer agency—Class A | | | 870 | | | | | |
Transfer agency—Class C | | | 43 | | | | | |
Transfer agency—Advisor Class | | | 60,051 | | | | | |
Distribution fee—Class A | | | 7,378 | | | | | |
Distribution fee—Class C | | | 371 | | | | | |
Custodian | | | 100,234 | | | | | |
Registration fees | | | 63,998 | | | | | |
Audit and tax | | | 63,828 | | | | | |
Administrative | | | 61,303 | | | | | |
Legal | | | 38,577 | | | | | |
Printing | | | 28,428 | | | | | |
Directors’ fees | | | 27,097 | | | | | |
Miscellaneous | | | 33,809 | | | | | |
| | | | | | | | |
Total expenses | | | 2,123,975 | | | | | |
Less: expenses waived and reimbursed by the Adviser (see Note B and Note E) | | | (154,699 | ) | | | | |
| | | | | | | | |
Net expenses | | | | | | | 1,969,276 | |
| | | | | | | | |
Net investment income | | | | | | | 3,316,844 | |
| | | | | | | | |
| Realized and Unrealized Gain (Loss) on Investment and Foreign Currency Transactions | | | | | | | | |
Net realized gain (loss) on: | | | | | | | | |
Investment transactions | | | | | | | 11,070,247 | |
Foreign currency transactions | | | | | | | (6,942 | ) |
Net change in unrealized appreciation/depreciation on: | | | | | | | | |
Investments | | | | | | | 30,464,250 | |
Foreign currency denominated assets and liabilities | | | | | | | 3,541 | |
| | | | | | | | |
Net gain on investment and foreign currency transactions | | | | | | | 41,531,096 | |
| | | | | | | | |
Net Increase in Net Assets from Operations | | | | | | $ | 44,847,940 | |
| | | | | | | | |
See notes to financial statements.
| | |
| abfunds.com | | AB GLOBAL CORE EQUITY PORTFOLIO | 19 |
STATEMENT OF CHANGES IN NET ASSETS
| | | | | | | | |
| | | Year Ended
June 30, 2017 | | | Year Ended
June 30, 2016 | |
Increase (Decrease) in Net Assets
from Operations | | | | | | | | |
Net investment income | | $ | 3,316,844 | | | $ | 2,102,871 | |
Net realized gain (loss) on investment and foreign currency transactions | | | 11,063,305 | | | | (7,863,917 | ) |
Net change in unrealized appreciation/depreciation on investments and foreign currency denominated assets and liabilities | | | 30,467,791 | | | | 3,140,144 | |
| | | | | | | | |
Net increase (decrease) in net assets from operations | | | 44,847,940 | | | | (2,620,902 | ) |
| Dividends to Shareholders from | | | | | | | | |
Net investment income | | | | | | | | |
Class A | | | (8,866 | ) | | | (1,957 | ) |
Class C | | | (179 | ) | | | – 0 | – |
Advisor Class | | | (1,917,949 | ) | | | (1,198,525 | ) |
Net realized gain on investment and foreign currency transactions | | | | | | | | |
Class A | | | – 0 | – | | | (664 | ) |
Class C | | | – 0 | – | | | (33 | ) |
Advisor Class | | | – 0 | – | | | (349,964 | ) |
| Capital Stock Transactions | | | | | | | | |
Net increase | | | 116,326,193 | | | | 60,317,099 | |
| | | | | | | | |
Total increase | | | 159,247,139 | | | | 56,145,054 | |
| Net Assets | | | | | | | | |
Beginning of period | | | 157,562,668 | | | | 101,417,614 | |
| | | | | | | | |
End of period (including undistributed net investment income of $2,894,987 and $1,481,188, respectively) | | $ | 316,809,807 | | | $ | 157,562,668 | |
| | | | | | | | |
See notes to financial statements.
| | |
| 20 | AB GLOBAL CORE EQUITY PORTFOLIO | | abfunds.com |
NOTES TO FINANCIAL STATEMENTS
June 30, 2017
NOTE A
Significant Accounting Policies
AB Cap Fund, Inc. (the “Company”), which is a Maryland corporation, is registered under the Investment Company Act of 1940 as an open-end management investment company. The Company operates as a series company currently comprised of 31 portfolios. Each portfolio is considered to be a separate entity for financial reporting and tax purposes. This report relates only to the AB Global Core Equity Portfolio (the “Fund”), a non-diversified portfolio. The Fund has authorized the issuance of Class A, Class B, Class C, Advisor Class, Class R, Class K, Class I, Class Z, Class T, Class 1, and Class 2 shares. Class B, Class R, Class K, Class I, Class Z, Class T, Class 1, and Class 2 shares are not currently being offered. Class A shares are sold with a front-end sales charge of up to 4.25% for purchases not exceeding $1,000,000. With respect to purchases of $1,000,000 or more, Class A shares redeemed within one year of purchase may be subject to a contingent deferred sales charge of 1%. Class C shares are subject to a contingent deferred sales charge of 1% on redemptions made within the first year after purchase, and 0% after the first year of purchase. Effective April 10, 2017, Class C shares will automatically convert to Class A shares ten years after the end of the calendar month of purchase. Advisor Class shares are sold without an initial or contingent deferred sales charge and are not subject to ongoing distribution expenses. All eleven classes of shares have identical voting, dividend, liquidation and other rights, except that the classes bear different distribution and transfer agency expenses. Each class has exclusive voting rights with respect to its distribution plan. The financial statements have been prepared in conformity with U.S. generally accepted accounting principles (“U.S. GAAP”), which require management to make certain estimates and assumptions that affect the reported amounts of assets and liabilities in the financial statements and amounts of income and expenses during the reporting period. Actual results could differ from those estimates. The Fund is an investment company under U.S. GAAP and follows the accounting and reporting guidance applicable to investment companies. The following is a summary of significant accounting policies followed by the Fund.
1. Security Valuation
Portfolio securities are valued at their current market value determined on the basis of market quotations or, if market quotations are not readily available or are deemed unreliable, at “fair value” as determined in accordance with procedures established by and under the general supervision of the Company’s Board of Directors (the “Board”).
In general, the market values of securities which are readily available and deemed reliable are determined as follows: securities listed on a national
| | |
| abfunds.com | | AB GLOBAL CORE EQUITY PORTFOLIO | 21 |
NOTES TO FINANCIAL STATEMENTS (continued)
securities exchange (other than securities listed on the NASDAQ Stock Market, Inc. (“NASDAQ”)) or on a foreign securities exchange are valued at the last sale price at the close of the exchange or foreign securities exchange. If there has been no sale on such day, the securities are valued at the last traded price from the previous day. Securities listed on more than one exchange are valued by reference to the principal exchange on which the securities are traded; securities listed only on NASDAQ are valued in accordance with the NASDAQ Official Closing Price; listed or over the counter (“OTC”) market put or call options are valued at the mid level between the current bid and ask prices. If either a current bid or current ask price is unavailable, AllianceBernstein L.P. (the “Adviser”) will have discretion to determine the best valuation (e.g. last trade price in the case of listed options); open futures are valued using the closing settlement price or, in the absence of such a price, the most recent quoted bid price. If there are no quotations available for the day of valuation, the last available closing settlement price is used; U.S. Government securities and any other debt instruments having 60 days or less remaining until maturity are generally valued at market by an independent pricing vendor, if a market price is available. If a market price is not available, the securities are valued at amortized cost. This methodology is commonly used for short term securities that have an original maturity of 60 days or less, as well as short term securities that had an original tern to maturity that exceeded 60 days. In instances when amortized cost is utilized, the Valuation Committee (the “Committee”) must reasonably conclude that the utilization of amortized cost is approximately the same as the fair value of the security. Such factors the Committee will consider include, but are not limited to, an impairment of the creditworthiness of the issuer or material changes in interest rates. Fixed-income securities, including mortgage-backed and asset-backed securities, may be valued on the basis of prices provided by a pricing service or at a price obtained from one or more of the major broker-dealers. In cases where broker/dealer quotes are obtained, the Adviser may establish procedures whereby changes in market yields or spreads are used to adjust, on a daily basis, a recently obtained quoted price on a security; swaps and other derivatives are valued daily, primarily using independent pricing services, independent pricing models using market inputs, as well as third party broker-dealers or counterparties. Open end mutual funds are valued at the closing net asset value per share, while exchange traded funds are valued at the closing market price per share.
Securities for which market quotations are not readily available (including restricted securities) or are deemed unreliable are valued at fair value as deemed appropriate by the Adviser. Factors considered in making this determination may include, but are not limited to, information obtained by contacting the issuer, analysts, analysis of the issuer’s financial statements or other available documents. In addition, the Fund may use fair value pricing for securities primarily traded in non-U.S. markets because most foreign
| | |
| 22 | AB GLOBAL CORE EQUITY PORTFOLIO | | abfunds.com |
NOTES TO FINANCIAL STATEMENTS (continued)
markets close well before the Fund values its securities at 4:00 p.m., Eastern Time. The earlier close of these foreign markets gives rise to the possibility that significant events, including broad market moves, may have occurred in the interim and may materially affect the value of those securities. To account for this, the Fund may frequently value many of its foreign equity securities using fair value prices based on third party vendor modeling tools to the extent available.
2. Fair Value Measurements
In accordance with U.S. GAAP regarding fair value measurements, fair value is defined as the price that the Fund would receive to sell an asset or pay to transfer a liability in an orderly transaction between market participants at the measurement date. U.S. GAAP establishes a framework for measuring fair value, and a three-level hierarchy for fair value measurements based upon the transparency of inputs to the valuation of an asset or liability (including those valued based on their market values as described in Note A.1 above). Inputs may be observable or unobservable and refer broadly to the assumptions that market participants would use in pricing the asset or liability. Observable inputs reflect the assumptions market participants would use in pricing the asset or liability based on market data obtained from sources independent of the Fund. Unobservable inputs reflect the Fund’s own assumptions about the assumptions that market participants would use in pricing the asset or liability based on the best information available in the circumstances. Each investment is assigned a level based upon the observability of the inputs which are significant to the overall valuation. The three-tier hierarchy of inputs is summarized below.
| | • | | Level 1—quoted prices in active markets for identical investments |
| | • | | Level 2—other significant observable inputs (including quoted prices for similar investments, interest rates, prepayment speeds, credit risk, etc.) |
| | • | | Level 3—significant unobservable inputs (including the Fund’s own assumptions in determining the fair value of investments) |
Where readily available market prices or relevant bid prices are not available for certain equity investments, such investments may be valued based on similar publicly traded investments, movements in relevant indices since last available prices or based upon underlying company fundamentals and comparable company data (such as multiples to earnings or other multiples to equity). Where an investment is valued using an observable input such as another publicly traded security, the investment will be classified as Level 2. If management determines that an adjustment is appropriate based on restrictions on resale, illiquidity or uncertainty, and such adjustment is a significant component of the valuation, the investment will be
| | |
| abfunds.com | | AB GLOBAL CORE EQUITY PORTFOLIO | 23 |
NOTES TO FINANCIAL STATEMENTS (continued)
classified as Level 3. An investment will also be classified as Level 3 where management uses company fundamentals and other significant inputs to determine the valuation.
The following table summarizes the valuation of the Fund’s investments by the above fair value hierarchy levels as of June 30, 2017:
| | | | | | | | | | | | | | | | |
Investments in
Securities | | Level 1 | | | Level 2 | | | Level 3 | | | Total | |
Assets: | | | | | | | | | | | | | | | | |
Common Stocks: | | | | | | | | | | | | | | | | |
Financials | | $ | 41,833,576 | | | $ | 28,032,764 | | | $ | – 0 | – | | $ | 69,866,340 | |
Health Care | | | 47,268,319 | | | | 2,113,109 | | | | – 0 | – | | | 49,381,428 | |
Consumer Discretionary | | | 38,209,617 | | | | 5,740,294 | | | | – 0 | – | | | 43,949,911 | |
Industrials | | | 19,746,302 | | | | 19,378,714 | | | | – 0 | – | | | 39,125,016 | |
Information Technology | | | 32,615,893 | | | | 2,582,576 | | | | – 0 | – | | | 35,198,469 | |
Telecommunication Services | | | – 0 | – | | | 22,204,805 | | | | – 0 | – | | | 22,204,805 | |
Consumer Staples | | | 7,013,170 | | | | 7,931,606 | | | | – 0 | – | | | 14,944,776 | |
Utilities | | | 5,131,525 | | | | 8,743,060 | | | | – 0 | – | | | 13,874,585 | |
Energy | | | 9,226,150 | | | | 3,753,129 | | | | – 0 | – | | | 12,979,279 | |
Materials | | | – 0 | – | | | 8,689,150 | | | | – 0 | – | | | 8,689,150 | |
Real Estate | | | 3,471,468 | | | | – 0 | – | | | – 0 | – | | | 3,471,468 | |
Short-Term Investments: | | | | | | | | | | | | | | | | |
Investment Companies | | | 2,914,390 | | | | – 0 | – | | | – 0 | – | | | 2,914,390 | |
Time Deposits | | | – 0 | – | | | 367,988 | | | | – 0 | – | | | 367,988 | |
Investments of Cash Collateral for Securities Loaned in
Affiliated Money Market Fund | | | 3,129,531 | | | | – 0 | – | | | – 0 | – | | | 3,129,531 | |
| | | | | | | | | | | | | | | | |
Total Investments in Securities | | | 210,559,941 | | | | 109,537,195 | † | | | – 0 | – | | | 320,097,136 | |
Other Financial Instruments* | | | – 0 | – | | | – 0 | – | | | – 0 | – | | | – 0 | – |
| | | | | | | | | | | | | | | | |
Total^ | | $ | 210,559,941 | | | $ | 109,537,195 | | | $ | – 0 | – | | $ | 320,097,136 | |
| | | | | | | | | | | | | | | | |
| † | A significant portion of the Fund’s foreign equity investments are categorized as Level 2 investments since they are valued using fair value prices based on third party vendor modeling tools to the extent available, see Note A.1. |
| * | Other financial instruments are derivative instruments, such as futures, forwards and swaps, which are valued at the unrealized appreciation/depreciation on the instrument. |
| ^ | There were no transfers between any levels during the reporting period. |
The Fund recognizes all transfers between levels of the fair value hierarchy assuming the financial instrument was transferred at the beginning of the reporting period.
The Adviser established the Committee to oversee the pricing and valuation of all securities held in the Fund. The Committee operates under pricing and valuation policies and procedures established by the Adviser and approved by the Board, including pricing policies which set forth the mechanisms and processes to be employed on a daily basis to implement these policies and procedures. In particular, the pricing policies describe how to determine market quotations for securities and other instruments.
| | |
| 24 | AB GLOBAL CORE EQUITY PORTFOLIO | | abfunds.com |
NOTES TO FINANCIAL STATEMENTS (continued)
The Committee’s responsibilities include: 1) fair value and liquidity determinations (and oversight of any third parties to whom any responsibility for fair value and liquidity determinations is delegated), and 2) regular monitoring of the Adviser’s pricing and valuation policies and procedures and modification or enhancement of these policies and procedures (or recommendation of the modification of these policies and procedures) as the Committee believes appropriate.
The Committee is also responsible for monitoring the implementation of the pricing policies by the Adviser’s Pricing Group (the “Pricing Group”) and any third party which performs certain pricing functions in accordance with the pricing policies. The Pricing Group is responsible for the oversight of the third party on a day-to-day basis. The Committee and the Pricing Group perform a series of activities to provide reasonable assurance of the accuracy of prices including: 1) periodic vendor due diligence meetings, review of methodologies, new developments and process at vendors, 2) daily comparison of security valuation versus prior day for all securities that exceeded established thresholds, and 3) daily review of unpriced, stale, and variance reports with exceptions reviewed by senior management and the Committee.
In addition, several processes outside of the pricing process are used to monitor valuation issues including: 1) performance and performance attribution reports are monitored for anomalous impacts based upon benchmark performance, and 2) portfolio managers review all portfolios for performance and analytics (which are generated using the Adviser’s prices).
3. Currency Translation
Assets and liabilities denominated in foreign currencies and commitments under forward currency exchange contracts are translated into U.S. dollars at the mean of the quoted bid and ask prices of such currencies against the U.S. dollar. Purchases and sales of portfolio securities are translated into U.S. dollars at the rates of exchange prevailing when such securities were acquired or sold. Income and expenses are translated into U.S. dollars at rates of exchange prevailing when accrued.
Net realized gain or loss on foreign currency transactions represents foreign exchange gains and losses from sales and maturities of foreign fixed income investments, foreign currency exchange contracts, holding of foreign currencies, currency gains or losses realized between the trade and settlement dates on foreign investment transactions, and the difference between the amounts of dividends, interest and foreign withholding taxes recorded on the Fund’s books and the U.S. dollar equivalent amounts actually received or paid. Net unrealized currency gains and losses from
| | |
| abfunds.com | | AB GLOBAL CORE EQUITY PORTFOLIO | 25 |
NOTES TO FINANCIAL STATEMENTS (continued)
valuing foreign currency denominated assets and liabilities at period end exchange rates are reflected as a component of net unrealized appreciation and depreciation of foreign currency denominated assets and liabilities.
4. Taxes
It is the Fund’s policy to meet the requirements of the Internal Revenue Code applicable to regulated investment companies and to distribute all of its investment company taxable income and net realized gains, if any, to shareholders. Therefore, no provisions for federal income or excise taxes are required. The Fund may be subject to taxes imposed by countries in which it invests. Such taxes are generally based on income and/or capital gains earned or repatriated. Taxes are accrued and applied to net investment income, net realized gains and net unrealized appreciation/depreciation as such income and/or gains are earned.
In accordance with U.S. GAAP requirements regarding accounting for uncertainties in income taxes, management has analyzed the Fund’s tax positions taken or expected to be taken on federal and state income tax returns for all open tax years (all years since inception of the Fund) and has concluded that no provision for income tax is required in the Fund’s financial statements.
5. Investment Income and Investment Transactions
Dividend income is recorded on the ex-dividend date or as soon as the Fund is informed of the dividend. Interest income is accrued daily. Investment transactions are accounted for on the date securities are purchased or sold. Investment gains and losses are determined on the identified cost basis. The Fund amortizes premiums and accretes discounts as adjustments to interest income.
6. Class Allocations
All income earned and expenses incurred by the Fund are borne on a pro-rata basis by each outstanding class of shares, based on the proportionate interest in the Fund represented by the net assets of such class, except for class specific expenses which are allocated to the respective class. Expenses of the Company are charged proportionately to each portfolio or based on other appropriate methods. Realized and unrealized gains and losses are allocated among the various share classes based on their respective net assets.
7. Dividends and Distributions
Dividends and distributions to shareholders, if any, are recorded on the ex-dividend date. Income dividends and capital gains distributions are determined in accordance with federal tax regulations and may differ from those determined in accordance with U.S. GAAP. To the extent these
| | |
| 26 | AB GLOBAL CORE EQUITY PORTFOLIO | | abfunds.com |
NOTES TO FINANCIAL STATEMENTS (continued)
differences are permanent, such amounts are reclassified within the capital accounts based on their federal tax basis treatment; temporary differences do not require such reclassification.
NOTE B
Advisory Fee and Other Transactions with Affiliates
Under the terms of the investment advisory agreement, the Fund pays the Adviser an advisory fee at an annual rate of .75% of the first $2.5 billion of the Fund’s average daily net assets, .65% of the excess over $2.5 billion up to $5 billion, and .60% of the excess of $5 billion. The fee is accrued daily and paid monthly. The Adviser has agreed to waive its fees and bear certain expenses to the extent necessary to limit total operating expenses (excluding acquired fund fees and expenses other than the advisory fees of any AB Mutual Funds in which the Fund may invest, interest expense, taxes, extraordinary expenses, and brokerage commissions and other transaction costs) on an annual basis (the “Expense Caps”) to 1.15%, 1.90% and .90% of the daily average net assets for Class A, Class C and Advisor Class shares, respectively. Any fees waived and expenses borne by the Adviser through January 19, 2016 are subject to repayment by the Fund until the end of the third fiscal year after the fiscal period in which the fee was waived or the expense was borne; such waivers that are subject to repayment amount to $269,481 for the fiscal period ended June 30, 2015, and $117,707 for the fiscal period ended June 30, 2016. In any case, no repayment will be made that would cause the Fund’s total annual operating expenses to exceed the net fee percentages set forth above. For the year ended June 30, 2017, the reimbursements/waivers amounted to $149,385. The expense caps may not be terminated by the Adviser before November 1, 2017.
Pursuant to the investment advisory agreement, the Fund may reimburse the Adviser for certain legal and accounting services provided to the Fund by the Adviser. For the year ended June 30, 2017, the reimbursement for such services amounted to $61,303.
The Fund compensates AllianceBernstein Investor Services, Inc. (“ABIS”), a wholly-owned subsidiary of the Adviser, under a Transfer Agency Agreement for providing personnel and facilities to perform transfer agency services for the Fund. ABIS may make payments to intermediaries that provide omnibus account services, sub-accounting services and/or networking services. Such compensation retained by ABIS amounted to $42,816 for the year ended June 30, 2017.
AllianceBernstein Investments, Inc. (the “Distributor”), a wholly-owned subsidiary of the Adviser, serves as the distributor of the Fund’s shares. The Distributor has advised the Fund that it has retained front-end sales
| | |
| abfunds.com | | AB GLOBAL CORE EQUITY PORTFOLIO | 27 |
NOTES TO FINANCIAL STATEMENTS (continued)
charges of $83 from the sale of Class A shares and received no contingent deferred sales charges imposed upon redemptions by shareholders of Class A and Class C shares, respectively, for the year ended June 30, 2017.
The Fund may invest in AB Government Money Market Portfolio (the “Government Money Market Portfolio”) which has a contractual annual advisory fee rate of .20% of the portfolio’s average daily net assets and bears its own expenses. In connection with the investment by the Fund in the Government Money Market Portfolio, the Adviser has agreed to waive its advisory fee from the Fund in an amount equal to the Fund’s pro rata share of the effective advisory fees of Government Money Market Portfolio, as borne indirectly by the Fund as an acquired fund fee and expense. For the year ended June 30, 2017, such waiver amounted to $2,470. A summary of the Fund’s transactions in shares of the Government Money Market Portfolio for the year ended June 30, 2017 is as follows:
| | | | | | | | | | | | | | | | | | |
Market Value
June 30, 2016
(000) | | | Purchases
at Cost
(000) | | | Sales
Proceeds
(000) | | | Market Value
June 30, 2017
(000) | | | Dividend
Income
(000) | |
| $ | 752 | | | $ | 72,753 | | | $ | 70,591 | | | $ | 2,914 | | | $ | 6 | |
Brokerage commissions paid on investment transactions for the year ended June 30, 2017 amounted to $181,677, of which $0 and $0, respectively, was paid to Sanford C. Bernstein & Co., LLC or Sanford C. Bernstein Limited, affiliates of the Adviser.
NOTE C
Distribution Services Agreement
The Fund has adopted a Distribution Services Agreement (the “Agreement”) pursuant to Rule 12b-1 under the Investment Company Act of 1940. Under the Agreement, the Fund pays distribution and servicing fees to the Distributor at an annual rate of up to .25% of the Fund’s average daily net assets attributable to Class A shares and 1% of the Fund’s average daily net assets attributable to Class C shares. There are no distribution and servicing fees on the Advisor Class. The fees are accrued daily and paid monthly. The Agreement provides that the Distributor will use such payments in their entirety for distribution assistance and promotional activities. Since the commencement of the Fund’s operations, the Distributor has incurred no expenses in excess of the distribution costs reimbursed by the Fund for Class C shares. While such costs may be recovered from the Fund in future periods so long as the Agreement is in effect, the rate of the distribution and servicing fees payable under the Agreement may not be increased without a shareholder vote. In accordance with the Agreement, there is no provision for recovery of unreimbursed distribution costs incurred by the Distributor beyond the
| | |
| 28 | AB GLOBAL CORE EQUITY PORTFOLIO | | abfunds.com |
NOTES TO FINANCIAL STATEMENTS (continued)
current fiscal year for Class A shares. The Agreement also provides that the Adviser may use its own resources to finance the distribution of the Fund’s shares.
NOTE D
Investment Transactions
Purchases and sales of investment securities (excluding short-term investments) for the year ended June 30, 2017 were as follows:
| | | | | | | | |
| | | Purchases | | | Sales | |
Investment securities (excluding
U.S. government securities) | | $ | 227,658,916 | | | $ | 112,109,618 | |
U.S. government securities | | | – 0 | – | | | – 0 | – |
The cost of investments for federal income tax purposes, gross unrealized appreciation and unrealized depreciation (excluding foreign currency contracts) are as follows:
| | | | |
Cost | | $ | 290,214,426 | |
| | | | |
Gross unrealized appreciation | | $ | 37,497,096 | |
Gross unrealized depreciation | | | (7,614,386 | ) |
| | | | |
Net unrealized appreciation | | $ | 29,882,710 | |
| | | | |
1. Derivative Financial Instruments
The Fund may use derivatives in an effort to earn income and enhance returns, to replace more traditional direct investments, to obtain exposure to otherwise inaccessible markets (collectively, “investment purposes”), or to hedge or adjust the risk profile of its portfolio.
The Fund did not engage in derivative transactions during the year ended June 30, 2017.
2. Currency Transactions
The Fund may invest in non-U.S. Dollar-denominated securities on a currency hedged or unhedged basis. The Fund may seek investment opportunities by taking long or short positions in currencies through the use of currency-related derivatives, including forward currency exchange contracts, futures and options on futures, swaps, and other options. The Fund may enter into transactions for investment opportunities when it anticipates that a foreign currency will appreciate or depreciate in value but securities denominated in that currency are not held by the Fund and do not present attractive investment opportunities. Such transactions may also be used when the Adviser believes that it may be more efficient than a direct investment in a foreign currency-denominated security. The Fund may also conduct currency exchange contracts on a spot basis (i.e., for cash at the spot rate prevailing in the currency exchange market for buying or selling currencies).
| | |
| abfunds.com | | AB GLOBAL CORE EQUITY PORTFOLIO | 29 |
NOTES TO FINANCIAL STATEMENTS (continued)
NOTE E
Securities Lending
The Fund may enter into securities lending transactions. Under the Fund’s securities lending program, all loans of securities will be collateralized continually by cash. The Fund will be compensated for the loan from a portion of the net return from the income earned on cash collateral after a rebate is paid to the borrower (in some cases, this rebate may be a “negative rebate” or fee paid by the borrower to the Fund in connection with the loan), and payments are made for fees of the securities lending agent and for certain other administrative expenses. It is the policy of the Fund to receive collateral consisting of cash in an amount exceeding the value of the securities loaned. A Fund will have the right to call a loan and obtain the securities loaned at any time on notice to the borrower within the normal and customary settlement time for the securities. While the securities are on loan, the borrower is obligated to pay the Fund amounts equal to any income or other distributions from the securities. The Fund will not be able to exercise voting rights with respect to any securities during the existence of a loan, but will have the right to regain ownership of loaned securities in order to exercise voting or other ownership rights. The lending agent has agreed to indemnify the Fund in the case of default of any securities borrower. Collateral received and securities loaned are marked to market daily to ensure that the securities loaned are secured by collateral. The lending agent currently invests the cash collateral received in Government Money Market Portfolio, an eligible money market vehicle, in accordance with the investment restrictions of the Fund, and as approved by the Board. Prior to June 20, 2016, such cash collateral received was invested in AB Exchange Reserves. The collateral received on securities loaned is recorded as an asset as well as a corresponding liability in the statement of assets and liabilities. When the Fund lends securities, its investment performance will continue to reflect changes in the value of the securities loaned. At June 30, 2017, the Fund had securities on loan with a value of $3,089,223 and had received cash collateral which has been invested into Government Money Market Portfolio of $3,129,531. The cash collateral will be adjusted on the next business day to maintain the required collateral amount. The Fund earned securities lending income of $19,926 and $7,266 from the borrowers and Government Money Market Portfolio, respectively, for the year ended June 30, 2017; these amounts are reflected in the statement of operations. In connection with the cash collateral investment by the Fund in the Government Money Market Portfolio, the Adviser has agreed to waive a portion of the Fund’s share of the advisory fees of Government Money Market Portfolio, as borne indirectly by the Fund as an acquired fund fee and expense. For the year ended June 30, 2017, such waiver amounted to $2,844. A principal risk of lending portfolio securities is that the borrower will fail to return the loaned securities upon termination of the loan and that the collateral will not be
| | |
| 30 | AB GLOBAL CORE EQUITY PORTFOLIO | | abfunds.com |
NOTES TO FINANCIAL STATEMENTS (continued)
sufficient to replace the loaned securities. A summary of the Fund’s transactions in shares of Government Money Market Portfolio for the year ended June 30, 2017 is as follows:
| | | | | | | | | | | | | | |
Market Value June 30, 2016 (000) | | | Purchases
at Cost
(000) | | | Sales
Proceeds
(000) | | | Market Value
June 30, 2017
(000) | |
| $ | 1,934 | | | $ | 49,146 | | | $ | 47,950 | | | $ | 3,130 | |
NOTE F
Capital Stock
Each class consists of 1,000,000,000 authorized shares. Transactions in capital shares for each class were as follows:
| | | | | | | | | | | | | | | | | | | | | | | | |
| | | | | | | | | | | | | | | | | | | | | | | | |
| | | Shares | | | | | | Amount | | | | |
| | | Year Ended June 30, 2017 | | | Year Ended June 30, 2016 | | | | | | Year Ended June 30, 2017 | | | Year Ended June 30, 2016 | | | | |
| | | | | | | | |
| Class A | | | | | | | | | | | | | | | | | | | | | | | | |
Shares sold | | | 439,101 | | | | 98,333 | | | | | | | $ | 4,648,624 | | | $ | 973,417 | | | | | |
| | | | | |
Shares issued in reinvestment of dividends and distributions | | | 861 | | | | 278 | | | | | | | | 8,866 | | | | 2,622 | | | | | |
| | | | | |
Shares redeemed | | | (32,224 | ) | | | (6,505 | ) | | | | | | | (340,256 | ) | | | (64,145 | ) | | | | |
| | | | | |
Net increase | | | 407,738 | | | | 92,106 | | | | | | | $ | 4,317,234 | | | $ | 911,894 | | | | | |
| | | | | |
| | | | | | | | | | | | | | | | | | | | | | | | |
| Class C | | | | | | | | | | | | | | | | | | | | | | | | |
Shares sold | | | 4,612 | | | | 505 | | | | | | | $ | 50,044 | | | $ | 4,787 | | | | | |
| | | | | |
Shares issued in reinvestment of dividends and distributions | | | 13 | | | | 1 | | | | | | | | 134 | | | | 7 | | | | | |
| | | | | |
Shares redeemed | | | (255 | ) | | | – 0 | – | | | | | | | (2,786 | ) | | | – 0 | – | | | | |
| | | | | |
Net increase | | | 4,370 | | | | 506 | | | | | | | $ | 47,392 | | | $ | 4,794 | | | | | |
| | | | | |
| | | | | | | | | | | | | | | | | | | | | | | | |
| Advisor Class | | | | | | | | | | | | | | | | | | | | | | | | |
Shares sold | | | 13,534,525 | | | | 8,300,996 | | | | | | | $ | 146,150,623 | | | $ | 80,038,179 | | | | | |
| | | | | |
Shares issued in reinvestment of dividends and distributions | | | 174,287 | | | | 154,237 | | | | | | | | 1,798,641 | | | | 1,457,540 | | | | | |
| | | | | |
Shares redeemed | | | (3,357,275 | ) | | | (2,321,309 | ) | | | | | | | (35,987,697 | ) | | | (22,095,308 | ) | | | | |
| | | | | |
Net increase | | | 10,351,537 | | | | 6,133,924 | | | | | | | $ | 111,961,567 | | | $ | 59,400,411 | | | | | |
| | | | | |
NOTE G
Risks Involved in Investing in the Fund
Foreign (Non-U.S.) Risk—Investments in securities of non-U.S. issuers may involve more risk than those of U.S. issuers. These securities may fluctuate more widely in price and may be less liquid due to adverse market,
| | |
| abfunds.com | | AB GLOBAL CORE EQUITY PORTFOLIO | 31 |
NOTES TO FINANCIAL STATEMENTS (continued)
economic, political, regulatory or other factors. These risks may be heightened with respect to investments in emerging market countries, where there may be an increased amount of economic, political and social instability.
Emerging Market Risk—Investments in emerging market countries may have more risk because the markets are less developed and less liquid as well as being subject to increased economic, political, regulatory or other uncertainties.
Currency Risk—Fluctuations in currency exchange rates may negatively affect the value of the Fund’s investments or reduce its returns.
Non-Diversification Risk—The Fund may have more risk because it is “non-diversified,” meaning that it can invest more of its assets in a smaller number of issuers. Accordingly, changes in the value of a single security may have a more significant effect, either negative or positive, on the Fund’s net asset value, or NAV.
Indemnification Risk—In the ordinary course of business, the Fund enters into contracts that contain a variety of indemnifications. The Fund’s maximum exposure under these arrangements is unknown. However, the Fund has not had prior claims or losses pursuant to these indemnification provisions and expects the risk of loss thereunder to be remote. Therefore, the Fund has not accrued any liability in connection with these indemnification provisions.
NOTE H
Joint Credit Facility
A number of open-end mutual funds managed by the Adviser, including the Fund, participate in a $280 million revolving credit facility (the “Facility”) intended to provide short-term financing if necessary, subject to certain restrictions in connection with abnormal redemption activity. Commitment fees related to the Facility are paid by the participating funds and are included in miscellaneous expenses in the statement of operations. The Fund did not utilize the Facility during the year ended June 30, 2017.
NOTE I
Distributions to Shareholders
The tax character of distributions paid during the fiscal years ended June 30, 2017 and June 30, 2016 were as follows:
| | | | | | | | |
| | | 2017 | | | 2016 | |
Distributions paid from: | | | | | | | | |
Ordinary income | | $ | 1,926,994 | | | $ | 1,551,143 | |
| | | | | | | | |
Total taxable distributions paid | | $ | 1,926,994 | | | $ | 1,551,143 | |
| | | | | | | | |
| | |
| 32 | AB GLOBAL CORE EQUITY PORTFOLIO | | abfunds.com |
NOTES TO FINANCIAL STATEMENTS (continued)
As of June 30, 2017, the components of accumulated earnings/(deficit) on a tax basis were as follows:
| | | | |
Undistributed ordinary income | | $ | 2,894,987 | |
Undistributed capital gains | | | 4,268,412 | (a) |
Unrealized appreciation/(depreciation) | | | 29,884,908 | (b) |
| | | | |
Total accumulated earnings/(deficit) | | $ | 37,048,307 | |
| | | | |
| (a) | During the fiscal year, the Fund utilized $6,589,640 of capital loss forwards to offset current year net realized gains. |
| (b) | The difference between book-basis and tax-basis unrealized appreciation/(depreciation) is attributable primarily to the tax deferral of losses on wash sales. |
For tax purposes, net realized capital losses may be carried over to offset future capital gains, if any. Funds are permitted to carry forward capital losses for an indefinite period, and such losses will retain their character as either short-term or long-term capital losses. As of June 30, 2017, the Fund did not have any capital loss carryforwards.
During the current fiscal year, permanent differences primarily due to the tax treatment of passive foreign investment companies (PFICs) and foreign currency reclassifications resulted in a net increase in undistributed net investment income, and a net decrease in accumulated net realized gain on investment and foreign currency transactions. These reclassifications had no effect on net assets.
NOTE J
Other
In October 2016, the U.S. Securities and Exchange Commission adopted new rules and amended existing rules (together, “final rules”) intended to modernize the reporting and disclosure of information by registered investment companies. In part, the final rules amend Regulation S-X and require standardized, enhanced disclosure about derivatives in investment company financial statements, as well as other amendments. The compliance date for the amendments to Regulation S-X is August 1, 2017 (for reporting period end dates of August 31, 2017 or after). Management has evaluated the impact of the amendments and expects the effect of the adoption of the final rules on financial statements will be limited to additional disclosures.
NOTE K
Subsequent Events
Management has evaluated subsequent events for possible recognition or disclosure in the financial statements through the date the financial statements are issued. Management has determined that there are no material events that would require disclosure in the Fund’s financial statements through this date.
| | |
| abfunds.com | | AB GLOBAL CORE EQUITY PORTFOLIO | 33 |
FINANCIAL HIGHLIGHTS
Selected Data For A Share Of Capital Stock Outstanding Throughout Each Period
| | | | | | | | | | | | |
| | | Class A | |
| | | Year Ended June 30, | | | November 12,
2014(a) to
June 30,
2015 | |
| | 2017 | | | 2016 | | |
| | | | |
| | | | | | | | | | | | |
Net asset value, beginning of period | | | $ 9.70 | | | | $ 10.15 | | | | $ 10.00 | |
| | | | |
Income From Investment Operations | | | | | | | | | | | | |
Net investment income(b)(c) | | | .16 | | | | .16 | | | | .06 | |
Net realized and unrealized gain (loss) on investment and foreign currency transactions | | | 1.94 | | | | (.51 | ) | | | .11 | † |
| | | | |
Net increase (decrease) in net asset value from operations | | | 2.10 | | | | (.35 | ) | | | .17 | |
| | | | |
Less: Dividends and Distributions | | | | | | | | | | | | |
Dividends from net investment income | | | (.08 | ) | | | (.07 | ) | | | (.02 | ) |
Distributions from net realized gain on investment and foreign currency transactions | | | – 0 | – | | | (.03 | ) | | | – 0 | – |
| | | | |
Total dividends and distributions | | | (.08 | ) | | | (.10 | ) | | | (.02 | ) |
| | | | |
Net asset value, end of period | | | $ 11.72 | | | | $ 9.70 | | | | $ 10.15 | |
| | | | |
Total Return | | | | | | | | | | | | |
Total investment return based on net asset value(d) | | | 21.81 | % | | | (3.40 | )% | | | 1.72 | % |
Ratios/Supplemental Data | | | | | | | | | | | | |
Net assets, end of period (000’s omitted) | | | $5,911 | | | | $939 | | | | $48 | |
Ratio to average net assets of: | | | | | | | | | | | | |
Expenses, net of waivers/reimbursements | | | 1.15 | % | | | 1.15 | % | | | 1.15 | %(e) |
Expenses, before waivers/reimbursements | | | 1.22 | % | | | 1.38 | % | | | 2.84 | %(e) |
Net investment income(c) | | | 1.43 | % | | | 1.64 | % | | | .90 | %(e) |
Portfolio turnover rate | | | 51 | % | | | 51 | % | | | 24 | % |
See footnote summary on page 36.
| | |
| 34 | AB GLOBAL CORE EQUITY PORTFOLIO | | abfunds.com |
FINANCIAL HIGHLIGHTS (continued)
Selected Data For A Share Of Capital Stock Outstanding Throughout Each Period
| | | | | | | | | | | | |
| | | Class C | |
| | | Year Ended June 30, | | | November 12,
2014(a) to
June 30,
2015 | |
| | 2017 | | | 2016 | | |
| | | | |
| | | | | | | | | | | | |
Net asset value, beginning of period | | | $ 9.67 | | | | $ 10.11 | | | | $ 10.00 | |
| | | | |
Income From Investment Operations | | | | | | | | | | | | |
Net investment income(b)(c) | | | .05 | | | | .06 | | | | .05 | |
Net realized and unrealized gain (loss) on investment and foreign currency transactions | | | 1.96 | | | | (.47 | ) | | | .07 | † |
| | | | |
Net increase (decrease) in net asset value from operations | | | 2.01 | | | | (.41 | ) | | | .12 | |
| | | | |
Less: Dividends and Distributions | | | | | | | | | | | | |
Dividends from net investment income | | | (.05 | ) | | | – 0 | – | | | (.01 | ) |
Distributions from net realized gain on investment and foreign currency transactions | | | – 0 | – | | | (.03 | ) | | | – 0 | – |
| | | | |
Total dividends and distributions | | | (.05 | ) | | | (.03 | ) | | | (.01 | ) |
| | | | |
Net asset value, end of period | | | $ 11.63 | | | | $ 9.67 | | | | $ 10.11 | |
| | | | |
Total Return | | | | | | | | | | | | |
Total investment return based on net asset value(d) | | | 20.80 | % | | | (4.09 | )% | | | 1.22 | % |
Ratios/Supplemental Data | | | | | | | | | | | | |
Net assets, end of period (000’s omitted) | | | $70 | | | | $16 | | | | $11 | |
Ratio to average net assets of: | | | | | | | | | | | | |
Expenses, net of waivers/reimbursements | | | 1.90 | % | | | 1.90 | % | | | 1.90 | %(e) |
Expenses, before waivers/reimbursements | | | 2.06 | % | | | 2.09 | % | | | 4.73 | %(e) |
Net investment income(c) | | | .49 | % | | | .61 | % | | | .81 | %(e) |
Portfolio turnover rate | | | 51 | % | | | 51 | % | | | 24 | % |
See footnote summary on page 36.
| | |
| abfunds.com | | AB GLOBAL CORE EQUITY PORTFOLIO | 35 |
FINANCIAL HIGHLIGHTS (continued)
Selected Data For A Share Of Capital Stock Outstanding Throughout Each Period
| | | | | | | | | | | | |
| | | Advisor Class | |
| | | Year Ended June 30, | | | November 12,
2014(a) to
June 30,
2015 | |
| | 2017 | | | 2016 | | |
| | | | |
| | | | | | | | | | | | |
Net asset value, beginning of period | | | $ 9.72 | | | | $ 10.16 | | | | $ 10.00 | |
| | | | |
Income From Investment Operations | | | | | | | | | | | | |
Net investment income(b)(c) | | | .16 | | | | .15 | | | | .18 | |
Net realized and unrealized gain (loss) on investment and foreign currency transactions | | | 1.97 | | | | (.48 | ) | | | .01 | † |
| | | | |
Net increase (decrease) in net asset value from operations | | | 2.13 | | | | (.33 | ) | | | .19 | |
| | | | |
Less: Dividends and Distributions | | | | | | | | | | | | |
Dividends from net investment income | | | (.10 | ) | | | (.08 | ) | | | (.03 | ) |
Distributions from net realized gain on investment and foreign currency transactions | | | – 0 | – | | | (.03 | ) | | | – 0 | – |
| | | | |
Total dividends and distributions | | | (.10 | ) | | | (.11 | ) | | | (.03 | ) |
| | | | |
Net asset value, end of period | | | $ 11.75 | | | | $ 9.72 | | | | $ 10.16 | |
| | | | |
Total Return | | | | | | | | | | | | |
Total investment return based on net asset value(d) | | | 22.09 | % | | | (3.17 | )% | | | 1.86 | % |
Ratios/Supplemental Data | | | | | | | | | | | | |
Net assets, end of period (000’s omitted) | | | $310,829 | | | | $156,608 | | | | $101,359 | |
Ratio to average net assets of: | | | | | | | | | | | | |
Expenses, net of waivers/reimbursements | | | .90 | % | | | .90 | % | | | .90 | %(e) |
Expenses, before waivers/reimbursements | | | .97 | % | | | 1.08 | % | | | 2.43 | %(e) |
Net investment income(c) | | | 1.52 | % | | | 1.59 | % | | | 2.71 | %(e) |
Portfolio turnover rate | | | 51 | % | | | 51 | % | | | 24 | % |
| (a) | Commencement of operations. |
| (b) | Based on average shares outstanding. |
| (c) | Net of expenses waived/reimbursed by the Adviser. |
| (d) | Total investment return is calculated assuming an initial investment made at the net asset value at the beginning of the period, reinvestment of all dividends and distributions at net asset value during the period, and redemption on the last day of the period. Initial sales charge or contingent deferred sales charge is not reflected in the calculation of total investment return. Total investment return does not reflect the deduction of taxes that a shareholder would pay on fund distributions or the redemption of fund shares. Total investment return for a period of less than one year is not annualized. |
| † | Due to timing of sales and repurchase of capital shares, the net realized and unrealized gain (loss) per share is not in accord with the Fund’s change in net realized and unrealized gain (loss) on investment transactions for the period. |
See notes to financial statements.
| | |
| 36 | AB GLOBAL CORE EQUITY PORTFOLIO | | abfunds.com |
REPORT OF INDEPENDENT REGISTERED
PUBLIC ACCOUNTING FIRM
To the Board of Directors and the Shareholders of AB Global Core Equity Portfolio
We have audited the accompanying statement of assets and liabilities, including the portfolio of investments, of AB Global Core Equity Portfolio (the “Fund”), one of the funds constituting AB Cap Fund, Inc., as of June 30, 2017, and the related statement of operations for the year then ended, the statements of changes in net assets for each of the two years in the period then ended, and financial highlights for each of the two years in the period then ended and the period November 12, 2014 (commencement of operations) to June 30, 2015. These financial statements and financial highlights are the responsibility of the Fund’s management. Our responsibility is to express an opinion on these financial statements and financial highlights based on our audits.
We conducted our audits in accordance with the standards of the Public Company Accounting Oversight Board (United States). Those standards require that we plan and perform the audit to obtain reasonable assurance about whether the financial statements and financial highlights are free of material misstatement. We were not engaged to perform an audit of the Fund’s internal control over financial reporting. Our audits included consideration of internal control over financial reporting as a basis for designing audit procedures that are appropriate in the circumstances, but not for the purpose of expressing an opinion on the effectiveness of the Fund’s internal control over financial reporting. Accordingly, we express no such opinion. An audit also includes examining, on a test basis, evidence supporting the amounts and disclosures in the financial statements and financial highlights, assessing the accounting principles used and significant estimates made by management, and evaluating the overall financial statement presentation. Our procedures included confirmation of securities owned as of June 30, 2017 by correspondence with the custodian and others or by other appropriate auditing procedures where replies from others were not received. We believe that our audits provide a reasonable basis for our opinion.
In our opinion, the financial statements and financial highlights referred to above present fairly, in all material respects, the financial position of AB Global Core Equity Portfolio, one of the funds constituting the AB Cap Fund, Inc., at June 30, 2017, the results of its operations for the year then ended, the changes in its net assets for each of the two years in the period then ended, and financial highlights for each of the two years in the period then ended and the period November 12, 2014 (commencement of operations) to June 30, 2015, in conformity with U.S. generally accepted accounting principles.

New York, New York
August 25, 2017
| | |
| abfunds.com | | AB GLOBAL CORE EQUITY PORTFOLIO | 37 |
2017 FEDERAL TAX INFORMATION
(unaudited)
For Federal income tax purposes, the following information is furnished with respect to the distributions paid by the Fund during the taxable period ended June 30, 2017. For individual shareholders, the Fund designates 100% of dividends paid as qualified dividend income. For corporate shareholders, 74.80% of dividends paid qualify for the dividends received deduction.
Shareholders should not use the above information to prepare their income tax returns. The information necessary to complete your income tax returns will be included with your Form 1099-DIV which will be sent to you separately in January 2018.
| | |
| 38 | AB GLOBAL CORE EQUITY PORTFOLIO | | abfunds.com |
BOARD OF DIRECTORS
| | |
Marshall C. Turner, Jr.(1), Chairman John H. Dobkin(1) Michael J. Downey(1) William H. Foulk, Jr.(1) D. James Guzy(1) Nancy P. Jacklin(1) | | Robert M. Keith, President and Chief Executive Officer Carol C. McMullen(1) Garry L. Moody(1) Earl D. Weiner(1) |
OFFICERS
| | |
Philip L. Kirstein, Senior Vice President and Independent Compliance Officer David Dalgas(2), Vice President Klaus Ingemann(2), Vice President | | Joseph J. Mantineo, Treasurer and Chief Financial Officer Emilie D. Wrapp, Secretary Phyllis J. Clarke, Controller Vincent S. Noto, Chief Compliance Officer |
| | |
Custodian and Accounting Agent Brown Brothers Harriman & Co. 50 Post Office Square Boston, MA 02110 Principal Underwriter AllianceBernstein Investments, Inc. 1345 Avenue of the Americas New York, NY 10105 Transfer Agent AllianceBernstein Investor Services,
Inc. P.O. Box 786003 San Antonio, TX 78278-6003 Toll-Free (800) 221-5672 | | Independent Registered Public Accounting Firm Ernst & Young LLP 5 Times Square New York, NY 10036 Legal Counsel Seward & Kissel LLP One Battery Park Plaza New York, NY 10004 |
| 1 | Member of the Audit Committee, the Governance and Nominating Committee and the Independent Directors Committee. |
| 2 | The day-to-day management of, and investment decisions for, the Investment Policy Team portfolio are made by the Adviser’s Investment Policy Team. Messrs. Dalgas and Ingemann are the investment professionals with the most significant responsibility for the day-to-day management of the Fund’s portfolio. |
| | |
| abfunds.com | | AB GLOBAL CORE EQUITY PORTFOLIO | 39 |
MANAGEMENT OF THE FUND
| | | | | | | | |
NAME, ADDRESS*, AGE, (YEAR FIRST ELECTED**) | | PRINCIPAL OCCUPATION(S) DURING PAST FIVE YEARS AND OTHER INFORMATION | | PORTFOLIOS
IN FUND
COMPLEX OVERSEEN BY DIRECTOR | | | OTHER PUBLIC COMPANY DIRECTORSHIPS CURRENTLY HELD BY DIRECTOR |
| INTERESTED DIRECTOR | | | | | | |
Robert M. Keith, # 1345 Avenue of the Americas New York, NY 10105 57 (2014) | | Senior Vice President of AllianceBernstein L.P. (the “Adviser”) and the head of AllianceBernstein Investments, Inc. (“ABI”) since July 2008; Director of ABI and President of the AB Mutual Funds. Previously, he served as Executive Managing Director of ABI from December 2006 to June 2008. Prior to joining ABI in 2006, Executive Managing Director of Bernstein Global Wealth Management, and prior thereto, Senior Managing Director and Global Head of Client Service and Sales of the Adviser’s institutional investment management business since 2004. Prior thereto, he was Managing Director and Head of North American Client Service and Sales in the Adviser’s institutional investment management business, with which he had been associated since prior to 2004. | | | 97 | | | None |
| | |
| 40 | AB GLOBAL CORE EQUITY PORTFOLIO | | abfunds.com |
MANAGEMENT OF THE FUND (continued)
| | | | | | | | |
NAME, ADDRESS*, AGE, (YEAR FIRST ELECTED**) | | PRINCIPAL OCCUPATION(S) DURING PAST FIVE YEARS AND OTHER INFORMATION | | PORTFOLIOS
IN FUND
COMPLEX OVERSEEN BY DIRECTOR | | | OTHER PUBLIC COMPANY DIRECTORSHIPS CURRENTLY HELD BY DIRECTOR |
| DISINTERESTED DIRECTORS | | | | | | |
Marshall C. Turner, Jr., ## Chairman of the Board 75 (2014) | | Private Investor since prior to 2012. Former Chairman and CEO of Dupont Photomasks, Inc. (components of semi-conductor manufacturing). He has extensive operating leadership, and venture capital investing experience, including five interim or full-time CEO roles, and prior service as general partner of institutional venture capital partnerships. He also has extensive non-profit board leadership experience, and currently serves on the boards of two education and science-related non-profit organizations. He has served as a director of one AB fund since 1992, and director or trustee of multiple AB Funds since 2005. He has been Chairman of the AB Funds since January 2014, and the Chairman of the Independent Directors Committees of such AB Funds since February 2014. | | | 97 | | | Xilinx, Inc. (programmable logic semi-conductors) since 2007 |
| | | | | | | | |
John H. Dobkin, ## 75 (2014) | | Independent Consultant since prior to 2012. Formerly, President of Save Venice, Inc. (preservation organization) from 2001-2002; Senior Advisor from June 1999-June 2000 and President of Historic Hudson Valley (historic preservation) from December 1989-May 1999. Previously, Director of the National Academy of Design. He has served as a director or trustee of various AB Funds since 1992, and as Chairman of the Audit Committees of a number of such AB Funds from 2001-2008. | | | 96 | | | None |
| | |
| abfunds.com | | AB GLOBAL CORE EQUITY PORTFOLIO | 41 |
MANAGEMENT OF THE FUND (continued)
| | | | | | | | |
NAME, ADDRESS*, AGE, (YEAR FIRST ELECTED**) | | PRINCIPAL OCCUPATION(S) DURING PAST FIVE YEARS AND OTHER INFORMATION | | PORTFOLIOS
IN FUND
COMPLEX OVERSEEN BY DIRECTOR | | | OTHER PUBLIC COMPANY DIRECTORSHIPS CURRENTLY HELD BY DIRECTOR |
DISINTERESTED DIRECTORS (continued) | | | | | | |
Michael J. Downey, ## 73 (2014) | | Private Investor since prior to 2012. Formerly, managing partner of Lexington Capital, LLC (investment advisory firm) from December 1997 until December 2003. He served as a Director of Prospect Acquisition Corp. (financial services) from 2007 until 2009. From 1987 until 1993, Chairman and CEO of Prudential Mutual Fund Management, director of the Prudential mutual funds, and member of the Executive Committee of Prudential Securities Inc. He has served as a director or trustee of the AB Funds since 2005 and is a director and Chairman of one other registered investment company. | | | 97 | | | The Asia Pacific Fund, Inc. (registered investment company) since prior to 2012 |
| | | | | | | | |
William H. Foulk, Jr., ## 84 (2014) | | Investment Adviser and an Independent Consultant since prior to 2012. Previously, he was Senior Manager of Barrett Associates, Inc., a registered investment adviser. He was formerly Deputy Comptroller and Chief Investment Officer of the State of New York and, prior thereto, Chief Investment Officer of the New York Bank for Savings. He has served as a director or trustee of various AB Funds since 1983, and was Chairman of the Independent Directors Committees of the AB Funds from 2003 until early February 2014. He served as Chairman of such AB Funds from 2003 through December 2013. He is also active in a number of mutual fund related organizations and committees. | | | 97 | | | None |
| | |
| 42 | AB GLOBAL CORE EQUITY PORTFOLIO | | abfunds.com |
MANAGEMENT OF THE FUND (continued)
| | | | | | | | |
NAME, ADDRESS*, AGE, (YEAR FIRST ELECTED**) | | PRINCIPAL OCCUPATION(S) DURING PAST FIVE YEARS AND OTHER INFORMATION | | PORTFOLIOS
IN FUND
COMPLEX OVERSEEN BY DIRECTOR | | | OTHER PUBLIC COMPANY DIRECTORSHIPS CURRENTLY HELD BY DIRECTOR |
DISINTERESTED DIRECTORS (continued) | | | | | | |
D. James Guzy, ## 81 (2014) | | Chairman of the Board of SRC Computers, Inc. (semi-conductors), with which he has been associated since prior to 2012. He served as Chairman of the Board of PLX Technology (semi-conductors) since prior to 2012 until November 2013. He was a director of Intel Corporation (semi-conductors) from 1969 until 2008, and served as Chairman of the Finance Committee of such company for several years until May 2008. He has served as a director or trustee of one or more of the AB Funds since 1982. | | | 94 | | | None |
| | | | | | | | |
Nancy P. Jacklin, ## 69 (2014) | | Private Investor since prior to 2012. Professorial Lecturer at the Johns Hopkins School of Advanced International Studies (2008-2015). U.S. Executive Director of the International Monetary Fund (which is responsible for ensuring the stability of the international monetary system), (December 2002-May 2006); Partner, Clifford Chance (1992-2002); Sector Counsel, International Banking and Finance, and Associate General Counsel, Citicorp (1985-1992); Assistant General Counsel (International), Federal Reserve Board of Governors (1982-1985); and Attorney Advisor, U.S. Department of the Treasury (1973-1982). Member of the Bar of the District of Columbia and of New York; and member of the Council on Foreign Relations. She has served as a director or trustee of the AB Funds since 2006 and has been Chairman of the Governance and Nominating Committees of the AB Funds since August 2014. | | | 97 | | | None |
| | |
| abfunds.com | | AB GLOBAL CORE EQUITY PORTFOLIO | 43 |
MANAGEMENT OF THE FUND (continued)
| | | | | | | | |
NAME, ADDRESS*, AGE, (YEAR FIRST ELECTED**) | | PRINCIPAL OCCUPATION(S) DURING PAST FIVE YEARS AND OTHER INFORMATION | | PORTFOLIOS
IN FUND
COMPLEX OVERSEEN BY DIRECTOR | | | OTHER PUBLIC COMPANY DIRECTORSHIPS CURRENTLY HELD BY DIRECTOR |
DISINTERESTED DIRECTORS (continued) | | | | | | |
Carol C. McMullen, ## 62 (2014) | | Managing Director of Slalom Consulting (consulting) since 2014, private investor and member of the Partners Healthcare Investment Committee. Formerly, Director of Norfolk & Dedham Group (mutual property and casualty insurance) from 2011 until November 2016; Director of Partners Community Physicians Organization (healthcare) from 2014 until December 2016; and Managing Director of The Crossland Group (consulting) from 2012 until 2013. She has held a number of senior positions in the asset and wealth management industries, including at Eastern Bank (where her roles included President of Eastern Wealth Management), Thomson Financial (Global Head of Sales for Investment Management), and Putnam Investments (where her roles included Head of Global Investment Research). She has served on a number of private company and nonprofit boards, and as a director or trustee of the AB Funds since June 2016. | | | 97 | | | None |
| | |
| 44 | AB GLOBAL CORE EQUITY PORTFOLIO | | abfunds.com |
MANAGEMENT OF THE FUND (continued)
| | | | | | | | |
NAME, ADDRESS*, AGE, (YEAR FIRST ELECTED**) | | PRINCIPAL OCCUPATION(S) DURING PAST FIVE YEARS AND OTHER INFORMATION | | PORTFOLIOS
IN FUND
COMPLEX OVERSEEN BY DIRECTOR | | | OTHER PUBLIC COMPANY DIRECTORSHIPS CURRENTLY HELD BY DIRECTOR |
DISINTERESTED DIRECTORS (continued) | | | | | | |
Garry L. Moody, ## 65 (2014) | | Independent Consultant. Formerly, Partner, Deloitte & Touche LLP (1995-2008) where he held a number of senior positions, including Vice Chairman, and U.S. and Global Investment Management Practice Managing Partner; President, Fidelity Accounting and Custody Services Company (1993-1995), where he was responsible for the accounting, pricing, custody and reporting for the Fidelity mutual funds; and Partner, Ernst & Young LLP (1975-1993), where he served as the National Director of Mutual Fund Tax Services and Managing Partner of its Chicago Office Tax department. He is a member of the Trustee Advisory Board of BoardIQ, a biweekly publication focused on issues and news affecting directors of mutual funds. He has served as a director or trustee and as Chairman of the Audit Committees of the AB Funds since 2008. | | | 97 | | | None |
| | | | | | | | |
Earl D. Weiner, ## 78 (2014) | | Of Counsel, and Partner prior to January 2007, of the law firm Sullivan & Cromwell LLP and is a former member of the ABA Federal Regulation of Securities Committee Task Force to draft editions of the Fund Director’s Guidebook. He also serves as a director or trustee of various non-profit organizations and has served as Chairman or Vice Chairman of a number of them. He has served as a director or trustee of the AB Funds since 2007 and served as Chairman of the Governance and Nominating Committees of the AB Funds from 2007 until August 2014. | | | 97 | | | None |
| | |
| abfunds.com | | AB GLOBAL CORE EQUITY PORTFOLIO | 45 |
MANAGEMENT OF THE FUND (continued)
| * | The address for each of the Fund’s disinterested Directors is c/o AllianceBernstein L.P., Attention: Philip L. Kirstein, 1345 Avenue of the Americas, New York, NY 10105. |
| ** | There is no stated term of office for the Fund’s Directors. |
| *** | The information above includes each Director’s principal occupation during the last five years and other information relating to the experience, attributes and skills relevant to each Director’s qualifications to serve as a Director, which led to the conclusion that each Director should serve as a Director for the Fund. |
| # | Mr. Keith is an “interested person” of the Fund, as defined in the 1940 Act, due to his position as a Senior Vice President of the Adviser. |
| ## | Member of the Audit Committee, the Governance and Nominating Committee and the Independent Directors Committee. |
| | |
| 46 | AB GLOBAL CORE EQUITY PORTFOLIO | | abfunds.com |
MANAGEMENT OF THE FUND (continued)
Officer Information
Certain information concerning the Fund’s Officers is listed below:
| | | | |
Robert M. Keith
57 | | President and Chief Executive Officer | | See biography above. |
| | | | |
Philip L. Kirstein
72 | | Senior Vice President and Independent Compliance Officer | | Senior Vice President and Independent Compliance Officer of the AB Funds, with which he has been associated since October 2004. Prior thereto, he was Of Counsel to Kirkpatrick & Lockhart, LLP from October 2003 to October 2004, and General Counsel of Merrill Lynch Investment Managers, L.P., since prior to March 2003. |
| | | | |
David Dalgas
46 | | Vice President | | Senior Vice President of the Adviser** since 2014 and Chief Investment Officer of AB Global Core Equity. Prior thereto, he served as Head of Equities, Chief Investment Officer of CPH Capital Fondsmæglerselskab A/S (“CPH Capital”), with which he has been associated since prior to 2012. |
| | | | |
Klaus Ingemann 43 | | Vice President | | Senior Vice President of the Adviser** since 2014. Prior thereto, he was an executive member of the investment board of CPH Capital, with which he has been associated since prior to 2012. |
| | | | |
Emilie D. Wrapp
61 | | Secretary | | Senior Vice President, Assistant General Counsel and Assistant Secretary of ABI**, with which she has been associated since prior to 2012. |
| | | | |
Joseph J. Mantineo
58 | | Treasurer and Chief Financial Officer | | Senior Vice President of AllianceBernstein Investor Services (“ABIS”)**, with which he has been associated since prior to 2012. |
| | | | |
Phyllis J. Clarke
56 | | Controller | | Vice President of ABIS**, with which she has been associated since prior to 2012. |
| | | | |
Vincent S. Noto 52 | | Chief Compliance Officer | | Senior Vice President since 2015 and Mutual Fund Chief Compliance Officer of the Adviser** since 2014. Prior thereto, he was Vice President and Director of Mutual Fund Compliance of the Adviser** since prior to 2012. |
| * | The address for each of the Fund’s Officers is 1345 Avenue of the Americas, New York, NY 10105. |
| ** | The Adviser, ABI and ABIS are affiliates of the Fund. |
The Fund’s Statement of Additional Information (“SAI”) has additional information about the Fund’s Directors and Officers and is available without charge upon request. Contact your financial representative or AB at (800) 227-4618, or visit www.abfunds.com, for a free prospectus or SAI.
| | |
| abfunds.com | | AB GLOBAL CORE EQUITY PORTFOLIO | 47 |
Information Regarding the Review and Approval of the Fund’s Advisory Agreement
The disinterested directors (the “directors”) of AB Cap Fund, Inc. (the “Company”) unanimously approved the continuance of the Company’s Advisory Agreement with the Adviser in respect of AB Global Core Equity Portfolio (the “Fund”) at a meeting held on May 2-4, 2017 (the “Meeting”).
Prior to approval of the continuance of the Advisory Agreement, the directors had requested from the Adviser, and received and evaluated, extensive materials. They reviewed the proposed continuance of the Advisory Agreement with the Adviser and with experienced counsel who are independent of the Adviser, who advised on the relevant legal standards. The directors also reviewed an independent evaluation prepared by the Company’s Senior Officer (who is also the Company’s Independent Compliance Officer), who acted as their independent fee consultant, of the reasonableness of the advisory fee, in which the Senior Officer concluded that the contractual fee for the Fund was reasonable. The directors also discussed the proposed continuance in private sessions with counsel and the Company’s Senior Officer.
The directors considered their knowledge of the nature and quality of the services provided by the Adviser to the Fund gained from their experience as directors or trustees of most of the registered investment companies advised by the Adviser, their overall confidence in the Adviser’s integrity and competence they have gained from that experience, the Adviser’s initiative in identifying and raising potential issues with the directors and its responsiveness, frankness and attention to concerns raised by the directors in the past, including the Adviser’s willingness to consider and implement organizational and operational changes designed to improve investment results and the services provided to the AB Funds. The directors noted that they have four regular meetings each year, at each of which they review extensive materials and information from the Adviser, including information on the investment performance of the Fund.
The directors also considered all factors they believed relevant, including the specific matters discussed below. During the course of their deliberations, the directors evaluated, among other things, the reasonableness of the advisory fee. The directors did not identify any particular information that was all-important or controlling, and different directors may have attributed different weights to the various factors. The directors determined that the selection of the Adviser to manage the Fund and the overall arrangements between the Fund and the Adviser, as provided in the Advisory Agreement, including the advisory fee, were fair and reasonable in light of the services performed, expenses incurred and such other matters as the directors considered relevant in the exercise of their business judgment. The material factors and conclusions that formed the basis for the directors’ determinations included the following:
Nature, Extent and Quality of Services Provided
The directors considered the scope and quality of services provided by the Adviser under the Advisory Agreement, including the quality of the investment
| | |
| 48 | AB GLOBAL CORE EQUITY PORTFOLIO | | abfunds.com |
research capabilities of the Adviser and the other resources it has dedicated to performing services for the Fund. They also noted the professional experience and qualifications of the Fund’s portfolio management team and other senior personnel of the Adviser. The directors also considered that the Advisory Agreement provides that the Fund will reimburse the Adviser for the cost to it of providing certain clerical, accounting, administrative and other services to the Fund by employees of the Adviser or its affiliates. Requests for these reimbursements are made on a quarterly basis and subject to approval by the directors. Reimbursements, to the extent requested and paid, result in a higher rate of total compensation from the Fund to the Adviser than the fee rate stated in the Advisory Agreement. The directors noted that the methodology used to determine the reimbursement amounts had been reviewed by an independent consultant retained by the Company’s Senior Officer. The quality of administrative and other services, including the Adviser’s role in coordinating the activities of the Fund’s other service providers, also was considered. The directors concluded that, overall, they were satisfied with the nature, extent and quality of services provided to the Fund under the Advisory Agreement.
Costs of Services Provided and Profitability
The directors reviewed a schedule of the revenues and expenses and related notes indicating the profitability of the Fund to the Adviser for calendar years 2015 and 2016 that had been prepared with an expense allocation methodology arrived at in consultation with an independent consultant retained by the Company’s Senior Officer. The directors noted the assumptions and methods of allocation used by the Adviser in preparing fund-specific profitability data and understood that there are a number of potentially acceptable allocation methodologies for information of this type. The directors noted that the profitability information reflected all revenues and expenses of the Adviser’s relationship with the Fund, including those relating to its subsidiaries that provide transfer agency, distribution and brokerage services to the Fund. The directors recognized that it is difficult to make comparisons of the profitability of the Advisory Agreement with the profitability of advisory contracts for unaffiliated funds because comparative information is not generally publicly available and is affected by numerous factors. The directors focused on the profitability of the Adviser’s relationship with the Fund before taxes and distribution expenses. The directors noted that the Fund was not profitable to the Adviser in the periods reviewed.
Fall-Out Benefits
The directors considered the other benefits to the Adviser and its affiliates from their relationships with the Fund, including, but not limited to, benefits relating to soft dollar arrangements (whereby investment advisers receive brokerage and research services from brokers that execute agency transactions for their clients); 12b-1 fees and sales charges received by the Fund’s principal underwriter (which is a wholly owned subsidiary of the
| | |
| abfunds.com | | AB GLOBAL CORE EQUITY PORTFOLIO | 49 |
Adviser) in respect of certain classes of the Fund’s shares; brokerage commissions paid by the Fund to brokers affiliated with the Adviser; and transfer agency fees paid by the Fund to a wholly owned subsidiary of the Adviser. The directors recognized that the Fund’s unprofitability to the Adviser would be exacerbated without these benefits. The directors understood that the Adviser also might derive reputational and other benefits from its association with the Fund.
Investment Results
In addition to the information reviewed by the directors in connection with the Meeting, the directors receive detailed performance information for the Fund at each regular Board meeting during the year.
At the Meeting, the directors reviewed information prepared by an analytical service that is not affiliated with the Adviser (the “15(c) service provider”), showing the performance of the Class A Shares of the Fund against a peer group and a peer universe, and information prepared by the Adviser showing performance of the Class A Shares against a broad-based securities market index, in each case for the 1-year period ended February 28, 2017 and (in the case of comparisons with the broad-based securities market index) for the period from inception. Based on their review, the directors concluded that the Fund’s investment performance was acceptable.
Advisory Fees and Other Expenses
The directors considered the advisory fee rate paid by the Fund to the Adviser and information prepared by the 15(c) service provider concerning advisory fee rates paid by other funds in the same category as the Fund at a common asset level. The directors recognized that it is difficult to make comparisons of advisory fees because there are variations in the services that are included in the fees paid by other funds. The directors compared the Fund’s contractual effective advisory fee rate with a peer group median and took into account the impact on the advisory fee rate of the administrative expense reimbursement paid to the Adviser in the latest fiscal year.
The directors also considered the Adviser’s fee schedule for institutional clients pursuing a similar investment style. For this purpose, they reviewed the relevant advisory fee information from the Adviser’s Form ADV and the evaluation from the Company’s Senior Officer and noted the differences between the Fund’s fee schedule, on the one hand, and the institutional fee schedule and the schedule of fees charged to any offshore funds and any sub-advised funds, on the other. The directors noted that the Adviser may, in some cases, agree to fee rates with large institutional clients that are lower than those reviewed by the directors and that they had previously discussed with the Adviser its policies in respect of such arrangements.
The Adviser reviewed with the directors the significantly greater scope of the services it provides to the Fund relative to institutional, offshore fund
| | |
| 50 | AB GLOBAL CORE EQUITY PORTFOLIO | | abfunds.com |
and sub-advised fund clients. In light of the substantial differences in services rendered by the Adviser to institutional, offshore fund and sub-advised fund clients as compared to funds such as the Fund, the directors considered these fee comparisons inapt and did not place significant weight on them in their deliberations.
The directors noted that the Fund may invest in shares of exchange-traded funds (“ETFs”), subject to the restrictions and limitations of the Investment Company Act of 1940 as these may be varied as a result of exemptive orders issued by the SEC. The directors also noted that ETFs pay advisory fees pursuant to their advisory contracts. The directors concluded, based on the Adviser’s explanation of how it may use ETFs when they are the most cost-effective way to obtain desired exposures for a fund or to temporarily “equitize” cash inflows pending purchases of underlying securities, that the advisory fee for the Fund would be paid for services that would be in addition to, rather than duplicative of, the services provided under the advisory contracts of the ETFs.
The directors also considered the total expense ratio of the Class A shares of the Fund in comparison to a peer group and a peer universe selected by the 15(c) service provider. The Class A expense ratio of the Fund was based on the Fund’s latest fiscal year and the directors considered the effects of any fee waivers and/or expense reimbursements as a result of the Adviser’s expense cap. The directors noted that it was likely that the expense ratios of some of the other funds in the Fund’s category were lowered by waivers or reimbursements by those funds’ investment advisers, which in some cases might be voluntary or temporary. The directors view expense ratio information as relevant to their evaluation of the Adviser’s services because the Adviser is responsible for coordinating services provided to the Fund by others. Based on their review, the directors concluded that the Fund’s expense ratio was acceptable.
Economies of Scale
The directors noted that the advisory fee schedule for the Fund contains breakpoints that reduce the fee rates on assets above specified levels. The directors took into consideration prior presentations by an independent consultant on economies of scale in the mutual fund industry and for the AB Funds, and by the Adviser concerning certain of its views on economies of scale. The directors also had requested and received from the Adviser certain updates on economies of scale in advance of the Meeting. The directors believe that economies of scale may be realized (if at all) by the Adviser across a variety of products and services, and not only in respect of a single fund. The directors noted that there is no established methodology for setting breakpoints that give effect to the fund-specific services provided by a fund’s adviser and to the economies of scale that an adviser may realize in its overall mutual fund business or those components of it which directly or indirectly affect a fund’s operations. The directors observed that
| | |
| abfunds.com | | AB GLOBAL CORE EQUITY PORTFOLIO | 51 |
in the mutual fund industry as a whole, as well as among funds similar to the Fund, there is no uniformity or pattern in the fees and asset levels at which breakpoints (if any) apply. The directors also noted that the advisory agreements for many funds do not have breakpoints at all. Having taken these factors into account, the directors concluded that the Fund’s shareholders would benefit from a sharing of economies of scale in the event the Fund’s net assets exceed a breakpoint in the future.
| | |
| 52 | AB GLOBAL CORE EQUITY PORTFOLIO | | abfunds.com |
This page is not part of the Shareholder Report or the Financial Statements.
AB FAMILY OF FUNDS
US EQUITY
US CORE
Core Opportunities Fund
Select US Equity Portfolio
US GROWTH
Concentrated Growth Fund
Discovery Growth Fund
Growth Fund
Large Cap Growth Fund
Small Cap Growth Portfolio
US VALUE
Discovery Value Fund
Equity Income Fund
Relative Value Fund1
Small Cap Value Portfolio
Value Fund
INTERNATIONAL/ GLOBAL EQUITY
INTERNATIONAL/ GLOBAL CORE
Global Core Equity Portfolio
International Portfolio
International Strategic Core Portfolio
Sustainable Global Thematic Fund1
Tax-Managed International Portfolio
Tax-Managed Wealth Appreciation Strategy
Wealth Appreciation Strategy
INTERNATIONAL/ GLOBAL GROWTH
Concentrated International Growth Portfolio
International Growth Fund
INTERNATIONAL/ GLOBAL EQUITY (continued)
INTERNATIONAL/ GLOBAL VALUE
Asia ex-Japan Equity Portfolio
International Value Fund
FIXED INCOME
MUNICIPAL
High Income Municipal Portfolio
Intermediate California Municipal Portfolio
Intermediate Diversified Municipal Portfolio
Intermediate New York Municipal Portfolio
Municipal Bond Inflation Strategy
Tax-Aware Fixed Income Portfolio
National Portfolio
Arizona Portfolio
California Portfolio
Massachusetts Portfolio
Minnesota Portfolio
New Jersey Portfolio
New York Portfolio
Ohio Portfolio
Pennsylvania Portfolio
Virginia Portfolio
TAXABLE
Bond Inflation Strategy
Global Bond Fund
High Income Fund
High Yield Portfolio
Income Fund
Intermediate Bond Portfolio
Limited Duration High Income Portfolio
Short Duration Portfolio
ALTERNATIVES
All Market Real Return Portfolio
Credit Long/Short Portfolio
Global Real Estate Investment Fund
Select US Long/Short Portfolio
Unconstrained Bond Fund
MULTI-ASSET
All Market Income Portfolio
All Market Total Return Portfolio1
Conservative Wealth Strategy
Emerging Markets Multi-Asset Portfolio
Global Risk Allocation Fund
Tax-Managed All Market Income Portfolio1
TARGET-DATE
Multi-Manager Select Retirement Allocation Fund
Multi-Manager Select 2010 Fund
Multi-Manager Select 2015 Fund
Multi-Manager Select 2020 Fund
Multi-Manager Select 2025 Fund
Multi-Manager Select 2030 Fund
Multi-Manager Select 2035 Fund
Multi-Manager Select 2040 Fund
Multi-Manager Select 2045 Fund
Multi-Manager Select 2050 Fund
Multi-Manager Select 2055 Fund
CLOSED-END FUNDS
Alliance California Municipal Income Fund
AllianceBernstein Global High Income Fund
AllianceBernstein National Municipal Income Fund
We also offer Government Exchange Reserves, which serves as the money market fund exchange vehicle for the AB mutual funds. An investment in Government Exchange Reserves is not a deposit in a bank and is not insured or guaranteed by the Federal Deposit Insurance Corporation or any other government agency. Although the Fund seeks to preserve the value of your investment at $1.00 per share, it is possible to lose money by investing in the Fund.
Investors should consider the investment objectives, risks, charges and expenses of the Fund carefully before investing. For copies of our prospectus or summary prospectus, which contain this and other information, visit us online at www.abfunds.com or contact your AB representative. Please read the prospectus and/or summary prospectus carefully before investing.
| 1 | Prior to November 1, 2016, Sustainable Global Thematic Fund was named Global Thematic Growth Fund; prior to January 9, 2017, Relative Value Fund was named Growth & Income Fund; prior to April 17, 2017, Tax-Managed All Market Income Portfolio was named Tax-Managed Balanced Wealth Strategy; prior to April 24, 2017, All Market Total Return Portfolio was named Balanced Wealth Strategy. |
| | |
| abfunds.com | | AB GLOBAL CORE EQUITY PORTFOLIO | 53 |
NOTES
| | |
| 54 | AB GLOBAL CORE EQUITY PORTFOLIO | | abfunds.com |
NOTES
| | |
| abfunds.com | | AB GLOBAL CORE EQUITY PORTFOLIO | 55 |
NOTES
| | |
| 56 | AB GLOBAL CORE EQUITY PORTFOLIO | | abfunds.com |
NOTES
| | |
| abfunds.com | | AB GLOBAL CORE EQUITY PORTFOLIO | 57 |
NOTES
| | |
| 58 | AB GLOBAL CORE EQUITY PORTFOLIO | | abfunds.com |
NOTES
| | |
| abfunds.com | | AB GLOBAL CORE EQUITY PORTFOLIO | 59 |
NOTES
| | |
| 60 | AB GLOBAL CORE EQUITY PORTFOLIO | | abfunds.com |

AB GLOBAL CORE EQUITY PORTFOLIO
1345 Avenue of the Americas
New York, NY 10105
800 221 5672
GCE-0151-0617 
JUN 06.30.17
ANNUAL REPORT
AB INTERNATIONAL STRATEGIC CORE PORTFOLIO


| | |
| |
| Investment Products Offered | | • Are Not FDIC Insured • May Lose Value • Are Not Bank Guaranteed |
Investors should consider the investment objectives, risks, charges and expenses of the Fund carefully before investing. For copies of our prospectus or summary prospectus, which contain this and other information, visit us online at www.abfunds.com or contact your AB representative. Please read the prospectus and/or summary prospectus carefully before investing.
This shareholder report must be preceded or accompanied by the Fund’s prospectus for individuals who are not current shareholders of the Fund.
You may obtain a description of the Fund’s proxy voting policies and procedures, and information regarding how the Fund voted proxies relating to portfolio securities during the most recent 12-month period ended June 30, without charge. Simply visit AB’s website at www.abfunds.com, or go to the Securities and Exchange Commission’s (the “Commission”) website at www.sec.gov, or call AB at (800) 227 4618.
The Fund files its complete schedule of portfolio holdings with the Commission for the first and third quarters of each fiscal year on Form N-Q. The Fund’s Forms N-Q are available on the Commission’s website at www.sec.gov. The Fund’s Forms N-Q may also be reviewed and copied at the Commission’s Public Reference Room in Washington, DC; information on the operation of the Public Reference Room may be obtained by calling (800) SEC 0330. AB publishes full portfolio holdings for the Fund monthly at www.abfunds.com.
AllianceBernstein Investments, Inc. (ABI) is the distributor of the AB family of mutual funds. ABI is a member of FINRA and is an affiliate of AllianceBernstein L.P., the Adviser of the funds.
The [A/B] logo is a registered service mark of AllianceBernstein and AllianceBernstein® is a registered service mark used by permission of the owner, AllianceBernstein L.P.
| | |
| FROM THE PRESIDENT | |  |
Dear Shareholder,
We are pleased to provide this report for AB International Strategic Core Portfolio (the “Fund”). Please review the discussion of Fund performance, the market conditions during the reporting period and the Fund’s investment strategy.
As always, AB strives to keep clients ahead of what’s next by:
| + | | Transforming uncommon insights into uncommon knowledge with a global research scope |
| + | | Navigating markets with seasoned investment experience and sophisticated solutions |
| + | | Providing thoughtful investment insights and actionable ideas |
Whether you’re an individual investor or a multi-billion-dollar institution, we put knowledge and experience to work for you.
AB’s global research organization connects and collaborates across platforms and teams to deliver impactful insights and innovative products. Better insights lead to better opportunities—anywhere in the world.
For additional information about AB’s range of products and shareholder resources, please log on to www.abfunds.com.
Thank you for your investment in the AB Mutual Funds.
Sincerely,

Robert M. Keith
President and Chief Executive Officer, AB Mutual Funds
| | |
| abfunds.com | | AB INTERNATIONAL STRATEGIC CORE PORTFOLIO | 1 |
ANNUAL REPORT
August 17, 2017
This report provides management’s discussion of fund performance for AB International Strategic Core Portfolio for the annual reporting period ended June 30, 2017.
The Fund’s investment objective is to seek long-term growth of capital.
NAV RETURNS AS OF JUNE 30, 2017 (unaudited)
| | | | | | | | |
| | | 6 Months | | | 12 Months | |
| AB INTERNATIONAL STRATEGIC CORE PORTFOLIO | | | | | | | | |
| Class A Shares | | | 15.00% | | | | 13.72% | |
| Class C Shares | | | 14.57% | | | | 12.92% | |
| Advisor Class Shares1 | | | 15.21% | | | | 13.98% | |
| MSCI EAFE Index (net) | | | 13.81% | | | | 20.27% | |
| 1 | Please note that this share class is for investors purchasing shares through accounts established under certain fee-based programs sponsored and maintained by certain broker-dealers and financial intermediaries, institutional pension plans and/or investment advisory clients of, and certain other persons associated with, the Adviser and its affiliates or the Fund. |
Please keep in mind that high, double-digit returns are highly unusual and cannot be sustained. Investors should also be aware that these returns were primarily achieved during favorable market conditions.
INVESTMENT RESULTS
The table above shows the Fund’s performance compared to its benchmark, the Morgan Stanley Capital International Europe, Australasia, Far East (“MSCI EAFE”) Index (net), for the six- and 12-month periods ended June 30, 2017.
All share classes of the Fund outperformed the benchmark for the six-month period, and underperformed for the 12-month period, before sales charges. For the 12-month period, security selection detracted, particularly within the financials, consumer discretionary and technology sectors, relative to the benchmark. Sector selection was positive. An overweight to the technology and financials sectors contributed, while an underweight to the materials and industrials sectors detracted. An overweight to Israel and underweight to Japan detracted.
For the six-month period, security selection was positive. Security selection in the health care and consumer discretionary sectors contributed, and detracted in the consumer staples and materials sectors. Sector selection was also positive. An overweight to the technology sector was the largest contributor. Country-wise, overweights to Canada and Israel detracted, and an underweight to Japan contributed.
| | |
| 2 | AB INTERNATIONAL STRATEGIC CORE PORTFOLIO | | abfunds.com |
The Fund utilized derivatives in the form of currency forwards for hedging and investment purposes, which added to performance for the six-month period and detracted for the 12-month period, and stock index futures for investment purposes, which added to absolute performance for both periods.
MARKET REVIEW AND INVESTMENT STRATEGY
Aside from a few fleeting downturns, global stocks surged during the 12-month period ended June 30, 2017. Emerging-market equities led the rally, recording material gains. Against the backdrop of a gradually improving global economy, geopolitical developments dominated headlines. The aftermath of the UK’s decision to leave the European Union (“Brexit”), Donald Trump’s surprising victory in the US presidential election, and a resounding win by newly elected French president Emmanuel Macron all impacted markets. Financial markets rallied on Trump’s win, though at times both policy risk and upheaval in the White House rattled investors. UK prime minister Theresa May further surprised markets when she called for a snap parliamentary election three years ahead of schedule in an effort to firm up the country’s mandate going into Brexit negotiations. The election increased political uncertainty when May’s Conservative Party failed to secure a majority position. In contrast, investors were relieved when centrist, pro-EU candidate Macron was elected France’s next president and his party then won a parliamentary majority.
The Fund’s Senior Investment Management Team (the “Team”) continued to be aware of the valuations of the most stable companies in the investable universe. The Fund has been positioned in such a way to avoid the most crowded positions, mindful of the risks particularly in a rising-rate environment, while at the same time aiming to provide downside protection in case of a sell-off. The Team continued to uncover attractive opportunities with below-market volatility and looked for a diverse set of opportunities in companies with attractive business models, strong capital stewardship, business models with strong recurring revenues even in cyclical industries, and companies benefiting from favorable regulations.
INVESTMENT POLICIES
The Adviser seeks to achieve the Fund’s investment objective by investing, under normal circumstances, primarily in common stocks of non-US companies, and in companies in at least three countries other than the United States.
The Fund will invest in companies that are determined by the Adviser to offer favorable long-term sustainable profitability, price stability, and attractive valuations. The Adviser will employ an integrated approach that combines both fundamental and quantitative research to identify attractive investment opportunities. Factors that the Adviser will
(continued on next page)
| | |
| abfunds.com | | AB INTERNATIONAL STRATEGIC CORE PORTFOLIO | 3 |
consider in this regard will include: a company’s record and projections of profitability, accuracy and availability of information with respect to the company, success and experience of management, competitive advantage, low stock price volatility, and liquidity of the company’s securities. The Adviser will compare these results to the characteristics of the general stock markets to determine the relative attractiveness of each company at a given time. The Adviser will weigh economic, political and market factors in making investment decisions. The Adviser will seek to manage the Fund so that it is subject to less share price volatility than many other international mutual funds, although there can be no guarantee that the Adviser will be successful in this regard.
The Fund will primarily invest in mid- and large-capitalization companies, which are currently defined for the Fund as companies that have market capitalizations of $1.5 billion or more. The Fund’s holdings of non-US companies will generally include some companies located in emerging markets.
Fluctuations in currency exchange rates can have a dramatic impact on the returns of equity securities. The Adviser may adjust the foreign currency exposure resulting from the Fund’s security positions through the use of currency-related derivatives, primarily in an effort to minimize the currency risk to which the Fund is subject. However, the Adviser is not required to use such derivatives.
| | |
| 4 | AB INTERNATIONAL STRATEGIC CORE PORTFOLIO | | abfunds.com |
DISCLOSURES AND RISKS
Benchmark Disclosure
The MSCI EAFE Index is unmanaged and does not reflect fees and expenses associated with the active management of a mutual fund portfolio. The MSCI EAFE Index (net, free float-adjusted market-capitalization weighted) represents the equity market performance of developed markets, excluding the US and Canada. MSCI makes no express or implied warranties or representations, and shall have no liability whatsoever with respect to any MSCI data contained herein. The MSCI data may not be further redistributed or used as a basis for other indices, any securities or financial products. This report is not approved, reviewed or produced by MSCI. Net returns include the reinvestment of dividends after deduction of non-US withholding tax. An investor cannot invest directly in an index, and its results are not indicative of the performance for any specific investment, including the Fund.
A Word About Risk
Market Risk: The value of the Fund’s assets will fluctuate as the stock or bond market fluctuates. The value of its investments may decline, sometimes rapidly and unpredictably, simply because of economic changes or other events that affect large portions of the market.
Foreign (Non-US) Risk: Investments in securities of non-US issuers may involve more risk than those of US issuers. These securities may fluctuate more widely in price and may be less liquid due to adverse market, economic, political, regulatory or other factors. These risks may be heightened with respect to investments in emerging-market countries, where there may be an increased amount of economic, political and social instability.
Currency Risk: Fluctuations in currency exchange rates may negatively affect the value of the Fund’s investments or reduce its returns.
Capitalization Risk: Investments in mid-capitalization companies may be more volatile than investments in large-capitalization companies. Investments in mid-capitalization companies may have additional risks because these companies have limited product lines, markets or financial resources.
Derivatives Risk: Derivatives may be illiquid, difficult to price, and leveraged so that small changes may produce disproportionate losses for the Fund, and may be subject to counterparty risk to a greater degree than more traditional investments.
Non-Diversification Risk: The Fund may have more risk because it is “non-diversified”, meaning that it can invest more of its assets in a smaller number of issuers. Accordingly, changes in the value of a single security may have a more significant effect, either negative or positive, on the Fund’s net asset value (“NAV”).
| | |
| abfunds.com | | AB INTERNATIONAL STRATEGIC CORE PORTFOLIO | 5 |
DISCLOSURES AND RISKS (continued)
Management Risk: The Fund is subject to management risk because it is an actively managed investment fund. The Adviser will apply its investment techniques and risk analyses in making investment decisions for the Fund, but there is no guarantee that its techniques will produce the intended results.
These risks are fully discussed in the Fund’s prospectus. As with all investments, you may lose money by investing in the Fund.
An Important Note About Historical Performance
The investment return and principal value of an investment in the Fund will fluctuate, so that shares, when redeemed, may be worth more or less than their original cost. Performance shown in this report represents past performance and does not guarantee future results. Current performance may be lower or higher than the performance information shown. You may obtain performance information current to the most recent month-end by visiting www.abfunds.com. The Fund has been in operation only for a short period of time, and therefore has a very limited historical performance period. This limited performance period is unlikely to be representative of the performance the Fund will achieve over a longer period.
All fees and expenses related to the operation of the Fund have been deducted. NAV returns do not reflect sales charges; if sales charges were reflected, the Fund’s quoted performance would be lower. SEC returns reflect the applicable sales charges for each share class: a 4.25% maximum front-end sales charge for Class A shares and a 1% 1-year contingent deferred sales charge for Class C shares. Returns for the different share classes will vary due to different expenses associated with each class. Performance assumes reinvestment of distributions and does not account for taxes.
| | |
| 6 | AB INTERNATIONAL STRATEGIC CORE PORTFOLIO | | abfunds.com |
HISTORICAL PERFORMANCE
GROWTH OF A $10,000 INVESTMENT IN THE FUND (unaudited)
7/29/20151 TO 6/30/2017
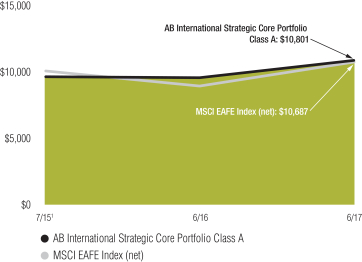
This chart illustrates the total value of an assumed $10,000 investment in AB International Strategic Core Portfolio Class A shares (from 7/29/20151 to 6/30/2017) as compared to the performance of the Fund’s benchmark. The chart reflects the deduction of the maximum 4.25% sales charge from the initial $10,000 investment in the Fund and assumes the reinvestment of dividends and capital gains distributions.
| 1 | Inception date: 7/29/2015. |
| | |
| abfunds.com | | AB INTERNATIONAL STRATEGIC CORE PORTFOLIO | 7 |
HISTORICAL PERFORMANCE (continued)
AVERAGE ANNUAL RETURNS AS OF JUNE 30, 2017 (unaudited)
| | | | | | | | |
| | | NAV Returns | | | SEC Returns
(reflects applicable
sales charges) | |
| CLASS A SHARES | | | | | | | | |
| 1 Year | | | 13.72% | | | | 8.93% | |
| Since Inception1 | | | 6.45% | | | | 4.09% | |
| CLASS C SHARES | | | | | | | | |
| 1 Year | | | 12.92% | | | | 11.92% | |
| Since Inception1 | | | 5.66% | | | | 5.66% | |
| ADVISOR CLASS SHARES2 | | | | | | | | |
| 1 Year | | | 13.98% | | | | 13.98% | |
| Since Inception1 | | | 6.68% | | | | 6.68% | |
The Fund’s prospectus fee table shows the Fund’s total annual operating expense ratios as 23.67%, 15.57% and 14.60% for Class A, Class C and Advisor Class shares, respectively, gross of any fee waivers or expense reimbursements. Contractual fee waivers and/or expense reimbursements limit the Fund’s annual operating expense ratios exclusive of acquired fund fees and expenses other than the advisory fees of any AB mutual funds in which the Fund may invest, interest expense, taxes, extraordinary expenses, and brokerage commissions and other transaction costs to 1.20%, 1.95% and 0.95% for Class A, Class C and Advisor Class shares, respectively. These waivers/reimbursements may not be terminated before November 1, 2017. Any fees waived and expenses borne by the Adviser may be reimbursed by the Fund until the end of the third fiscal year after the fiscal period in which the fee was waived or the expense was borne, provided that no reimbursement payment will be made that would cause the Fund’s total annual operating expenses to exceed the expense limitations. Absent reimbursements or waivers, performance would have been lower. The Financial Highlights section of this report sets forth expense ratio data for the current reporting period; the expense ratios shown above may differ from the expense ratios in the Financial Highlights section since they are based on different time periods.
| 1 | Inception date: 7/29/2015. |
| 2 | This share class is offered at NAV to eligible investors and the SEC returns are the same as the NAV returns. Please note that this share class is for investors purchasing shares through accounts established under certain fee-based programs sponsored and maintained by certain broker-dealers and financial intermediaries, institutional pension plans and/or investment advisory clients of, and certain other persons associated with, the Adviser and its affiliates or the Fund. |
| | |
| 8 | AB INTERNATIONAL STRATEGIC CORE PORTFOLIO | | abfunds.com |
HISTORICAL PERFORMANCE (continued)
SEC AVERAGE ANNUAL RETURNS
AS OF THE MOST RECENT CALENDAR QUARTER-END
JUNE 30, 2017 (unaudited)
| | | | |
| | | SEC Returns
(reflects applicable
sales charges) | |
| CLASS A SHARES | | | | |
| 1 Year | | | 8.93% | |
| Since Inception1 | | | 4.09% | |
| CLASS C SHARES | | | | |
| 1 Year | | | 11.92% | |
| Since Inception1 | | | 5.66% | |
| ADVISOR CLASS SHARES2 | | | | |
| 1 Year | | | 13.98% | |
| Since Inception1 | | | 6.68% | |
| 1 | Inception date: 7/29/2015. |
| 2 | Please note that this share class is for investors purchasing shares through accounts established under certain fee-based programs sponsored and maintained by certain broker-dealers and financial intermediaries, institutional pension plans and/or investment advisory clients of, and certain other persons associated with, the Adviser and its affiliates or the Fund. |
| | |
| abfunds.com | | AB INTERNATIONAL STRATEGIC CORE PORTFOLIO | 9 |
EXPENSE EXAMPLE
(unaudited)
As a shareholder of the Fund, you incur two types of costs: (1) transaction costs, including sales charges (loads) on purchase payments, contingent deferred sales charges on redemptions and (2) ongoing costs, including management fees; distribution (12b-1) fees; and other Fund expenses. This example is intended to help you understand your ongoing costs (in dollars) of investing in the Fund and to compare these costs with the ongoing costs of investing in other mutual funds.
This Example is based on an investment of $1,000 invested at the beginning of the period and held for the entire period as indicated below.
Actual Expenses
The table below provides information about actual account values and actual expenses. You may use the information, together with the amount you invested, to estimate the expenses that you paid over the period. Simply divide your account value by $1,000 (for example, an $8,600 account value divided by $1,000 = 8.6), then multiply the result by the number under the heading entitled “Expenses Paid During Period” to estimate the expenses you paid on your account during this period.
Hypothetical Example for Comparison Purposes
The table below also provides information about hypothetical account values and hypothetical expenses based on the Fund’s actual expense ratio and an assumed annual rate of return of 5% before expenses, which is not the Fund’s actual return. The hypothetical account values and expenses may not be used to estimate the actual ending account balance or expenses you paid for the period. You may use this information to compare the ongoing costs of investing in the Fund and other funds by comparing this 5% hypothetical example with the 5% hypothetical examples that appear in the shareholder reports of other funds.
Please note that the expenses shown in the table are meant to highlight your ongoing costs only and do not reflect any transactional costs, such as sales charges (loads), or contingent deferred sales charges on redemptions. Therefore, the hypothetical example is useful in comparing ongoing costs only, and will not help you determine the relative total costs of owning different funds. In addition, if these transactional costs were included, your costs would have been higher.
| | | | | | | | | | | | | | | | | | | | | | | | |
| | | Beginning
Account
Value
1/1/2017 | | | Ending
Account
Value
6/30/2017 | | | Expenses
Paid
During
Period* | | | Annualized
Expense
Ratio* | | | Total
Expenses
Paid
During
Period+ | | | Total
Annualized
Expense
Ratio+ | |
| Class A | | | | | | | | | | | | | | | | | | | | | | | | |
Actual | | $ | 1,000 | | | $ | 1,150.00 | | | $ | 6.34 | | | | 1.19 | % | | $ | 6.40 | | | | 1.20 | % |
Hypothetical** | | $ | 1,000 | | | $ | 1,018.89 | | | $ | 5.96 | | | | 1.19 | % | | $ | 6.01 | | | | 1.20 | % |
| | |
| 10 | AB INTERNATIONAL STRATEGIC CORE PORTFOLIO | | abfunds.com |
EXPENSE EXAMPLE (continued)
| | | | | | | | | | | | | | | | | | | | | | | | |
| | | Beginning
Account
Value
1/1/2017 | | | Ending
Account
Value
6/30/2017 | | | Expenses
Paid
During
Period* | | | Annualized
Expense
Ratio* | | | Total
Expenses
Paid
During
Period+ | | | Total
Annualized
Expense
Ratio+ | |
| Class C | | | | | | | | | | | | | | | | | | | | | | | | |
Actual | | $ | 1,000 | | | $ | 1,145.70 | | | $ | 10.32 | | | | 1.94 | % | | $ | 10.37 | | | | 1.95 | % |
Hypothetical** | | $ | 1,000 | | | $ | 1,015.17 | | | $ | 9.69 | | | | 1.94 | % | | $ | 9.74 | | | | 1.95 | % |
| Advisor Class | | | | | | | | | | | | | | | | | | | | | | | | |
Actual | | $ | 1,000 | | | $ | 1,152.10 | | | $ | 5.02 | | | | 0.94 | % | | $ | 5.07 | | | | 0.95 | % |
Hypothetical** | | $ | 1,000 | | | $ | 1,020.13 | | | $ | 4.71 | | | | 0.94 | % | | $ | 4.76 | | | | 0.95 | % |
| * | Expenses are equal to the classes’ annualized expense ratios multiplied by the average account value over the period, multiplied by 181/365 (to reflect the one-half year period). |
| ** | Assumes 5% annual return before expenses. |
| + | In connection with the Fund’s investments in affiliated/unaffiliated underlying portfolios, the Fund incurs no direct expenses, but bears proportionate shares of the fees and expenses (i.e., operating, administrative and investment advisory fees) of the affiliated/unaffiliated underlying portfolios. The Adviser has contractually agreed to waive its fees from the Fund in an amount equal to the Fund’s pro rata share of certain acquired fund fees and expenses of the affiliated underlying portfolios. The Fund’s total expenses are equal to the classes’ annualized expense ratio plus the Fund’s pro rata share of the weighted average expense ratio of the affiliated/unaffiliated underlying portfolios in which it invests, multiplied by the average account value over the period, multiplied by 181/365 (to reflect the one-half year period). |
| | |
| abfunds.com | | AB INTERNATIONAL STRATEGIC CORE PORTFOLIO | 11 |
PORTFOLIO SUMMARY
June 30, 2017 (unaudited)
PORTFOLIO STATISTICS
Net Assets ($mil): $35.6
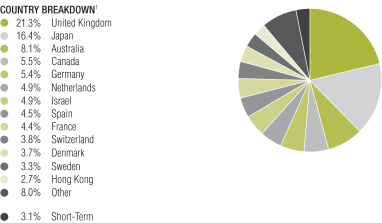
| 1 | All data are as of June 30, 2017. The Fund’s sector and country breakdowns are expressed as a percentage of total investments and may vary over time. The Fund also enters into derivative transactions, which may be used for hedging or investment purposes (see “Portfolio of Investments” section of the report for additional details). “Other” country weightings represent 2.5% or less in the following countries: Finland, Italy, Norway, Portugal, Singapore and South Korea. |
Please note: The sector classifications presented herein are based on the Global Industry Classification Standard (GICS) which was developed by Morgan Stanley Capital International and Standard & Poor’s. The components are divided into sector, industry group, and industry sub-indices as classified by the GICS for each of the market capitalization indices in the broad market. These sector classifications are broadly defined. The “Portfolio of Investments” section of the report reflects more specific industry information and is consistent with the investment restrictions discussed in the Fund’s prospectus.
| | |
| 12 | AB INTERNATIONAL STRATEGIC CORE PORTFOLIO | | abfunds.com |
PORTFOLIO SUMMARY (continued)
June 30, 2017 (unaudited)
TEN LARGEST HOLDINGS1
| | | | | | | | |
| Company | | U.S. $ Value | | | Percent of
Net Assets | |
| Amadeus IT Group SA – Class A | | $ | 781,508 | | | | 2.2 | % |
| Aristocrat Leisure Ltd. | | | 764,802 | | | | 2.2 | |
| Check Point Software Technologies Ltd. | | | 715,892 | | | | 2.0 | |
| RELX PLC | | | 695,527 | | | | 2.0 | |
| British American Tobacco PLC | | | 682,860 | | | | 1.9 | |
| Oracle Corp. Japan | | | 676,496 | | | | 1.9 | |
| Logitech International SA | | | 651,674 | | | | 1.8 | |
| SAP SE | | | 604,896 | | | | 1.7 | |
| Bandai Namco Holdings, Inc. | | | 591,095 | | | | 1.7 | |
| Reckitt Benckiser Group PLC | | | 584,416 | | | | 1.6 | |
| | $ | 6,749,166 | | | | 19.0 | % |
| | |
| abfunds.com | | AB INTERNATIONAL STRATEGIC CORE PORTFOLIO | 13 |
PORTFOLIO OF INVESTMENTS
June 30, 2017
| | | | | | | | |
| Company | | Shares | | | U.S. $ Value | |
| |
| | | | | | | | |
COMMON STOCKS – 87.1% | | | | | | | | |
Financials – 23.1% | | | | | | | | |
Banks – 15.0% | | | | | | | | |
Bank Hapoalim BM | | | 43,859 | | | $ | 295,749 | |
Bank of Queensland Ltd. | | | 26,390 | | | | 232,184 | |
BOC Hong Kong Holdings Ltd. | | | 85,000 | | | | 406,786 | |
Danske Bank A/S | | | 4,600 | | | | 176,976 | |
DBS Group Holdings Ltd. | | | 36,300 | | | | 546,343 | |
DNB ASA | | | 20,410 | | | | 347,476 | |
Mitsubishi UFJ Financial Group, Inc. | | | 81,900 | | | | 552,419 | |
National Australia Bank Ltd. | | | 18,310 | | | | 416,524 | |
Nordea Bank AB | | | 27,390 | | | | 348,851 | |
Oversea-Chinese Banking Corp., Ltd. | | | 33,300 | | | | 260,850 | |
Royal Bank of Canada | | | 6,889 | | | | 500,207 | |
Seven Bank Ltd. | | | 50,000 | | | | 179,273 | |
Sumitomo Mitsui Financial Group, Inc. | | | 9,300 | | | | 363,114 | |
Swedbank AB – Class A | | | 14,110 | | | | 344,367 | |
Toronto-Dominion Bank (The) | | | 7,130 | | | | 359,304 | |
| | | | | | | | |
| | | | | | | 5,330,423 | |
| | | | | | | | |
Capital Markets – 3.1% | | | | | | | | |
Euronext NV(a) | | | 8,901 | | | | 462,273 | |
IG Group Holdings PLC | | | 35,087 | | | | 259,731 | |
Thomson Reuters Corp. | | | 8,156 | | | | 377,611 | |
| | | | | | | | |
| | | | | | | 1,099,615 | |
| | | | | | | | |
Diversified Financial Services – 0.9% | | | | | | | | |
ORIX Corp. | | | 20,300 | | | | 315,865 | |
| | | | | | | | |
| | |
Insurance – 4.1% | | | | | | | | |
Admiral Group PLC | | | 6,580 | | | | 171,704 | |
Direct Line Insurance Group PLC | | | 81,950 | | | | 379,471 | |
Euler Hermes Group | | | 2,580 | | | | 306,462 | |
NN Group NV | | | 4,820 | | | | 171,029 | |
Talanx AG | | | 4,300 | | | | 160,845 | |
Tryg A/S | | | 12,760 | | | | 279,049 | |
| | | | | | | | |
| | | | | | | 1,468,560 | |
| | | | | | | | |
| | | | | | | 8,214,463 | |
| | | | | | | | |
Information Technology – 18.0% | | | | | | | | |
Internet Software & Services – 1.5% | | | | | | | | |
Moneysupermarket.com Group PLC | | | 114,087 | | | | 525,479 | |
| | | | | | | | |
| | |
IT Services – 3.6% | | | | | | | | |
Amadeus IT Group SA – Class A | | | 13,074 | | | | 781,508 | |
Capgemini SE | | | 2,270 | | | | 234,497 | |
CGI Group, Inc. – Class A(b) | | | 5,374 | | | | 274,584 | |
| | | | | | | | |
| | | | | | | 1,290,589 | |
| | | | | | | | |
| | |
| 14 | AB INTERNATIONAL STRATEGIC CORE PORTFOLIO | | abfunds.com |
PORTFOLIO OF INVESTMENTS (continued)
| | | | | | | | |
| Company | | Shares | | | U.S. $ Value | |
| |
| | | | | | | | |
Semiconductors & Semiconductor
Equipment – 1.0% | | | | | | | | |
SCREEN Holdings Co., Ltd. | | | 5,000 | | | $ | 334,463 | |
| | | | | | | | |
| | |
Software – 9.3% | | | | | | | | |
Check Point Software Technologies Ltd.(b) | | | 6,563 | | | | 715,892 | |
Constellation Software, Inc./Canada | | | 468 | | | | 244,830 | |
Nice Ltd. | | | 6,937 | | | | 546,540 | |
Oracle Corp. Japan | | | 10,400 | | | | 676,496 | |
Playtech PLC | | | 19,240 | | | | 238,333 | |
Sage Group PLC (The) | | | 32,839 | | | | 294,269 | |
SAP SE | | | 5,779 | | | | 604,896 | |
| | | | | | | | |
| | | | | | | 3,321,256 | |
| | | | | | | | |
Technology Hardware, Storage &
Peripherals – 2.6% | | | | | | | | |
Logitech International SA | | | 17,710 | | | | 651,674 | |
Samsung Electronics Co., Ltd. | | | 131 | | | | 272,850 | |
| | | | | | | | |
| | | | | | | 924,524 | |
| | | | | | | | |
| | | | | | | 6,396,311 | |
| | | | | | | | |
Industrials – 11.9% | | | | | | | | |
Aerospace & Defense – 1.2% | | | | | | | | |
BAE Systems PLC | | | 26,630 | | | | 219,838 | |
QinetiQ Group PLC | | | 65,152 | | | | 229,517 | |
| | | | | | | | |
| | | | | | | 449,355 | |
| | | | | | | | |
Airlines – 2.1% | | | | | | | | |
Japan Airlines Co., Ltd. | | | 11,200 | | | | 346,928 | |
Qantas Airways Ltd. | | | 88,400 | | | | 388,566 | |
| | | | | | | | |
| | | | | | | 735,494 | |
| | | | | | | | |
Commercial Services & Supplies – 1.2% | | | | | | | | |
G4S PLC | | | 98,600 | | | | 419,338 | |
| | | | | | | | |
| | |
Machinery – 0.5% | | | | | | | | |
Kone Oyj – Class B | | | 3,424 | | | | 174,196 | |
| | | | | | | | |
| | |
Professional Services – 4.7% | | | | | | | | |
Experian PLC | | | 27,342 | | | | 561,136 | |
RELX PLC | | | 32,175 | | | | 695,527 | |
Wolters Kluwer NV | | | 10,014 | | | | 423,522 | |
| | | | | | | | |
| | | | | | | 1,680,185 | |
| | | | | | | | |
Road & Rail – 0.8% | | | | | | | | |
Central Japan Railway Co. | | | 1,700 | | | | 277,639 | |
| | | | | | | | |
| | |
Transportation Infrastructure – 1.4% | | | | | | | | |
Aena SA(a) | | | 2,490 | | | | 486,233 | |
| | | | | | | | |
| | | | | | | 4,222,440 | |
| | | | | | | | |
| | |
| abfunds.com | | AB INTERNATIONAL STRATEGIC CORE PORTFOLIO | 15 |
PORTFOLIO OF INVESTMENTS (continued)
| | | | | | | | |
| Company | | Shares | | | U.S. $ Value | |
| |
| | | | | | | | |
Consumer Discretionary – 9.5% | | | | | | | | |
Distributors – 1.3% | | | | | | | | |
PALTAC Corp. | | | 13,300 | | | $ | 448,208 | |
| | | | | | | | |
| | |
Hotels, Restaurants & Leisure – 2.1% | | | | | | | | |
Aristocrat Leisure Ltd. | | | 44,114 | | | | 764,802 | |
| | | | | | | | |
| | |
Household Durables – 0.8% | | | | | | | | |
Fujitsu General Ltd. | | | 12,600 | | | | 292,194 | |
| | | | | | | | |
| | |
Leisure Products – 1.7% | | | | | | | | |
Bandai Namco Holdings, Inc. | | | 17,300 | | | | 591,095 | |
| | | | | | | | |
| | |
Media – 2.1% | | | | | | | | |
CTS Eventim AG & Co. KGaA | | | 1,254 | | | | 55,527 | |
Informa PLC | | | 20,702 | | | | 180,571 | |
UBM PLC | | | 24,700 | | | | 221,973 | |
WPP PLC | | | 14,285 | | | | 300,795 | |
| | | | | | | | |
| | | | | | | 758,866 | |
| | | | | | | | |
Textiles, Apparel & Luxury Goods – 1.5% | | | | | | | | |
HUGO BOSS AG | | | 7,400 | | | | 518,758 | |
| | | | | | | | |
| | | | | | | 3,373,923 | |
| | | | | | | | |
Consumer Staples – 6.7% | | | | | | | | |
Beverages – 1.5% | | | | | | | | |
Diageo PLC | | | 10,730 | | | | 317,091 | |
Royal Unibrew A/S | | | 4,633 | | | | 222,244 | |
| | | | | | | | |
| | | | | | | 539,335 | |
| | | | | | | | |
Food Products – 1.7% | | | | | | | | |
Nestle SA (REG) | | | 2,330 | | | | 203,217 | |
Salmar ASA | | | 15,640 | | | | 387,672 | |
| | | | | | | | |
| | | | | | | 590,889 | |
| | | | | | | | |
Household Products – 1.6% | | | | | | | | |
Reckitt Benckiser Group PLC | | | 5,765 | | | | 584,416 | |
| | | | | | | | |
| | |
Tobacco – 1.9% | | | | | | | | |
British American Tobacco PLC | | | 10,021 | | | | 682,860 | |
| | | | | | | | |
| | | | | | | 2,397,500 | |
| | | | | | | | |
Health Care – 5.4% | | | | | | | | |
Pharmaceuticals – 5.4% | | | | | | | | |
Indivior PLC(b) | | | 33,440 | | | | 136,165 | |
Novo Nordisk A/S – Class B | | | 5,580 | | | | 239,757 | |
Recordati SpA | | | 9,914 | | | | 402,203 | |
Roche Holding AG | | | 1,417 | | | | 362,065 | |
Sanofi | | | 5,666 | | | | 542,916 | |
Shionogi & Co., Ltd. | | | 4,400 | | | | 245,335 | |
| | | | | | | | |
| | | | | | | 1,928,441 | |
| | | | | | | | |
| | |
| 16 | AB INTERNATIONAL STRATEGIC CORE PORTFOLIO | | abfunds.com |
PORTFOLIO OF INVESTMENTS (continued)
| | | | | | | | |
| Company | | Shares | | | U.S. $ Value | |
| |
| | | | | | | | |
Materials – 4.4% | | | | | | | | |
Chemicals – 2.8% | | | | | | | | |
Covestro AG(a) | | | 5,385 | | | $ | 390,381 | |
Croda International PLC | | | 7,768 | | | | 393,391 | |
Nippon Shokubai Co., Ltd. | | | 3,400 | | | | 219,617 | |
| | | | | | | | |
| | | | | | | 1,003,389 | |
| | | | | | | | |
Containers & Packaging – 1.6% | | | | | | | | |
Amcor Ltd./Australia | | | 44,019 | | | | 548,377 | |
| | | | | | | | |
| | | | | | | 1,551,766 | |
| | | | | | | | |
Telecommunication Services – 4.2% | | | | | | | | |
Diversified Telecommunication
Services – 4.2% | | | | | | | | |
Com Hem Holding AB | | | 26,250 | | | | 364,553 | |
HKT Trust & HKT Ltd. – Class SS | | | 341,000 | | | | 448,118 | |
Nippon Telegraph & Telephone Corp. | | | 8,400 | | | | 396,514 | |
TDC A/S | | | 50,790 | | | | 295,364 | |
| | | | | | | | |
| | | | | | | 1,504,549 | |
| | | | | | | | |
Energy – 3.0% | | | | | | | | |
Oil, Gas & Consumable Fuels – 3.0% | | | | | | | | |
Caltex Australia Ltd. | | | 9,300 | | | | 225,835 | |
Royal Dutch Shell PLC – Class B | | | 19,251 | | | | 516,820 | |
TOTAL SA | | | 6,722 | | | | 333,727 | |
| | | | | | | | |
| | | | | | | 1,076,382 | |
| | | | | | | | |
Utilities – 0.9% | | | | | | | | |
Electric Utilities – 0.9% | | | | | | | | |
EDP - Energias de Portugal SA | | | 50,070 | | | | 163,790 | |
Endesa SA | | | 7,110 | | | | 164,018 | |
| | | | | | | | |
| | | | | | | 327,808 | |
| | | | | | | | |
Total Common Stocks
(cost $28,510,288) | | | | | | | 30,993,583 | |
| | | | | | | | |
| | | | | | | | |
SHORT-TERM INVESTMENTS – 2.8% | | | | | | | | |
Investment Companies – 2.8% | | | | | | | | |
AB Fixed Income Shares, Inc. – Government Money Market Portfolio – Class AB, 0.79%(c)(d)
(cost $997,419) | | | 997,419 | | | | 997,419 | |
| | | | | | | | |
| | |
Total Investments – 89.9%
(cost $29,507,707) | | | | | | | 31,991,002 | |
Other assets less liabilities – 10.1% | | | | | | | 3,579,919 | |
| | | | | | | | |
| | |
Net Assets – 100.0% | | | | | | $ | 35,570,921 | |
| | | | | | | | |
| | |
| abfunds.com | | AB INTERNATIONAL STRATEGIC CORE PORTFOLIO | 17 |
PORTFOLIO OF INVESTMENTS (continued)
FORWARD CURRENCY EXCHANGE CONTRACTS (see Note D)
| | | | | | | | | | | | | | | | |
| Counterparty | | Contracts to
Deliver (000) | | | In Exchange
For
(000) | | | Settlement
Date | | | Unrealized
Appreciation/
(Depreciation) | |
Brown Brothers Harriman & Co. | | | AUD 151 | | | | USD 112 | | | | 7/18/17 | | | $ | (3,813 | ) |
Brown Brothers Harriman & Co. | | | CAD 874 | | | | USD 648 | | | | 7/18/17 | | | | (25,878 | ) |
Brown Brothers Harriman & Co. | | | CHF 228 | | | | USD 233 | | | | 7/18/17 | | | | (4,620 | ) |
Brown Brothers Harriman & Co. | | | EUR 974 | | | | USD 1,081 | | | | 7/18/17 | | | | (31,783 | ) |
Brown Brothers Harriman & Co. | | | GBP 110 | | | | USD 144 | | | | 7/18/17 | | | | 310 | |
Brown Brothers Harriman & Co. | | | GBP 1,011 | | | | USD 1,292 | | | | 7/18/17 | | | | (23,219 | ) |
Brown Brothers Harriman & Co. | | | HKD 760 | | | | USD 98 | | | | 7/18/17 | | | | 187 | |
Brown Brothers Harriman & Co. | | | ILS 2,450 | | | | USD 678 | | | | 7/18/17 | | | | (24,242 | ) |
Brown Brothers Harriman & Co. | | | JPY 64,651 | | | | USD 584 | | | | 7/18/17 | | | | 9,333 | |
Brown Brothers Harriman & Co. | | | NOK 4,420 | | | | USD 517 | | | | 7/18/17 | | | | (12,679 | ) |
Brown Brothers Harriman & Co. | | | SEK 5,772 | | | | USD 650 | | | | 7/18/17 | | | | (35,221 | ) |
Brown Brothers Harriman & Co. | | | SGD 425 | | | | USD 304 | | | | 7/18/17 | | | | (4,850 | ) |
Brown Brothers Harriman & Co. | | | USD 114 | | | | AUD 151 | | | | 7/18/17 | | | | 2,475 | |
Brown Brothers Harriman & Co. | | | USD 139 | | | | CAD 184 | | | | 7/18/17 | | | | 3,180 | |
Brown Brothers Harriman & Co. | | | USD 797 | | | | CHF 793 | | | | 7/18/17 | | | | 29,481 | |
Brown Brothers Harriman & Co. | | | USD 2,223 | | | | EUR 2,022 | | | | 7/18/17 | | | | 88,212 | |
Brown Brothers Harriman & Co. | | | USD 676 | | | | GBP 528 | | | | 7/18/17 | | | | 11,843 | |
Brown Brothers Harriman & Co. | | | USD 281 | | | | HKD 2,185 | | | | 7/18/17 | | | | (815 | ) |
Brown Brothers Harriman & Co. | | | USD 241 | | | | ILS 850 | | | | 7/18/17 | | | | 2,454 | |
Brown Brothers Harriman & Co. | | | USD 783 | | | | JPY 86,837 | | | | 7/18/17 | | | | (10,082 | ) |
Brown Brothers Harriman & Co. | | | USD 89 | | | | NOK 766 | | | | 7/18/17 | | | | 2,537 | |
Brown Brothers Harriman & Co. | | | USD 581 | | | | SEK 5,065 | | | | 7/18/17 | | | | 20,933 | |
Brown Brothers Harriman & Co. | | | USD 37 | | | | SGD 52 | | | | 7/18/17 | | | | 281 | |
Brown Brothers Harriman & Co. | | | AUD 497 | | | | USD 377 | | | | 10/17/17 | | | | (4,366 | ) |
Brown Brothers Harriman & Co. | | | GBP 298 | | | | USD 383 | | | | 10/17/17 | | | | (5,940 | ) |
Brown Brothers Harriman & Co. | | | ILS 628 | | | | USD 178 | | | | 10/17/17 | | | | (2,566 | ) |
Brown Brothers Harriman & Co. | | | NOK 623 | | | | USD 73 | | | | 10/17/17 | | | | (1,583 | ) |
Brown Brothers Harriman & Co. | | | SGD 128 | | | | USD 92 | | | | 10/17/17 | | | | (750 | ) |
Brown Brothers Harriman & Co. | | | USD 75 | | | | AUD 99 | | | | 10/17/17 | | | | 866 | |
Brown Brothers Harriman & Co. | | | USD 344 | | | | CHF 332 | | | | 10/17/17 | | | | 5,071 | |
Brown Brothers Harriman & Co. | | | USD 343 | | | | EUR 305 | | | | 10/17/17 | | | | 7,594 | |
Brown Brothers Harriman & Co. | | | USD 484 | | | | JPY 53,496 | | | | 10/17/17 | | | | (6,217 | ) |
Deutsche Bank AG | | | ILS 2,542 | | | | USD 700 | | | | 7/18/17 | | | | (28,972 | ) |
Goldman Sachs Bank USA | | | CAD 1,485 | | | | USD 1,109 | | | | 7/18/17 | | | | (36,654 | ) |
JPMorgan Chase Bank, NA | | | KRW 239,457 | | | | USD 213 | | | | 7/18/17 | | | | 4,067 | |
Royal Bank of Scotland PLC | | | USD 512 | | | | CHF 511 | | | | 7/18/17 | | | | 21,037 | |
Royal Bank of Scotland PLC | | | USD 808 | | | | EUR 755 | | | | 7/18/17 | | | | 54,165 | |
Royal Bank of Scotland PLC | | | USD 1,401 | | | | JPY 154,860 | | | | 7/18/17 | | | | (23,687 | ) |
| | | | | | | | | | | | | | | | |
| | | | | | | | | | | | | | $ | (23,911 | ) |
| | | | | | | | | | | | | | | | |
| (a) | Security is exempt from registration under Rule 144A of the Securities Act of 1933. These securities are considered restricted, but liquid and may be resold in transactions exempt from registration, normally to qualified institutional buyers. At June 30, 2017, the aggregate market value of these securities amounted to $1,338,887 or 3.8% of net assets. |
| (b) | Non-income producing security. |
| (c) | To obtain a copy of the fund’s shareholder report, please go to the Securities and Exchange Commission’s website at www.sec.gov, or call AB at (800) 227-4618. |
| (d) | Investment in affiliated money market mutual fund. The rate shown represents the 7-day yield as of period end. |
| | |
| 18 | AB INTERNATIONAL STRATEGIC CORE PORTFOLIO | | abfunds.com |
PORTFOLIO OF INVESTMENTS (continued)
Currency Abbreviations:
AUD – Australian Dollar
CAD – Canadian Dollar
CHF – Swiss Franc
EUR – Euro
GBP – Great British Pound
HKD – Hong Kong Dollar
ILS – Israeli Shekel
JPY – Japanese Yen
KRW – South Korean Won
NOK – Norwegian Krone
SEK – Swedish Krona
SGD – Singapore Dollar
USD – United States Dollar
Glossary:
REG – Registered Shares
See notes to financial statements.
| | |
| abfunds.com | | AB INTERNATIONAL STRATEGIC CORE PORTFOLIO | 19 |
STATEMENT OF ASSETS & LIABILITIES
June 30, 2017
| | | | |
| Assets | | | | |
Investments in securities, at value | | | | |
Unaffiliated issuers (cost $28,510,288) | | $ | 30,993,583 | |
Affiliated issuers (cost $997,419) | | | 997,419 | |
Foreign currencies, at value (cost $112,565) | | | 113,043 | |
Receivable for capital stock sold | | | 3,702,921 | |
Unrealized appreciation on forward currency exchange contracts | | | 264,026 | |
Receivable for investment securities sold and foreign currency transactions | | | 250,478 | |
Receivable from Adviser | | | 192,382 | |
Unaffiliated dividends receivable | | | 80,137 | |
Affiliated dividends receivable | | | 446 | |
| | | | |
Total assets | | | 36,594,435 | |
| | | | |
| Liabilities | | | | |
Payable for investment securities purchased and foreign currency transactions | | | 598,440 | |
Unrealized depreciation on forward currency exchange contracts | | | 287,937 | |
Payable for capital stock redeemed | | | 51,215 | |
Transfer Agent fee payable | | | 1,519 | |
Distribution fee payable | | | 99 | |
Due to Custodian | | | 18 | |
Accrued expenses and other liabilities | | | 84,286 | |
| | | | |
Total liabilities | | | 1,023,514 | |
| | | | |
Net Assets | | $ | 35,570,921 | |
| | | | |
| Composition of Net Assets | | | | |
Capital stock, at par | | $ | 322 | |
Additional paid-in capital | | | 32,923,281 | |
Undistributed net investment income | | | 258,504 | |
Accumulated net realized loss on investment and foreign currency transactions | | | (73,073 | ) |
Net unrealized appreciation on investments and foreign currency denominated assets and liabilities | | | 2,461,887 | |
| | | | |
| | $ | 35,570,921 | |
| | | | |
Net Asset Value Per Share—11 billion shares of capital stock authorized, $.0001 par value
| | | | | | | | | | | | |
| Class | | Net Assets | | | Shares
Outstanding | | | Net Asset
Value | |
| |
| A | | $ | 234,087 | | | | 21,197 | | | $ | 11.04 | * |
| |
| C | | $ | 62,005 | | | | 5,632 | | | $ | 11.01 | |
| |
| Advisor | | $ | 35,274,829 | | | | 3,188,404 | | | $ | 11.06 | |
| |
| * | The maximum offering price per share for Class A shares was $11.53, which reflects a sales charge of 4.25%. |
See notes to financial statements.
| | |
| 20 | AB INTERNATIONAL STRATEGIC CORE PORTFOLIO | | abfunds.com |
STATEMENT OF OPERATIONS
Year Ended June 30, 2017
| | | | | | | | |
| Investment Income | | | | | | | | |
Dividends | | | | | | | | |
Unaffiliated issuers (net of foreign taxes withheld of $58,306) | | $ | 480,895 | | | | | |
Affiliated issuers | | | 2,555 | | | $ | 483,450 | |
| | | | | | | | |
| Expenses | | | | | | | | |
Advisory fee (see Note B) | | | 102,426 | | | | | |
Transfer agency—Class A | | | 118 | | | | | |
Transfer agency—Class C | | | 45 | | | | | |
Transfer agency—Advisor Class | | | 14,244 | | | | | |
Distribution fee—Class A | | | 282 | | | | | |
Distribution fee—Class C | | | 221 | | | | | |
Custodian | | | 185,148 | | | | | |
Administrative | | | 63,377 | | | | | |
Audit and tax | | | 71,175 | | | | | |
Registration fees | | | 48,085 | | | | | |
Legal | | | 40,550 | | | | | |
Directors’ fees | | | 27,232 | | | | | |
Printing | | | 15,173 | | | | | |
Amortization of offering expenses | | | 4,502 | | | | | |
Miscellaneous | | | 24,756 | | | | | |
| | | | | | | | |
Total expenses | | | 597,334 | | | | | |
Less: expenses waived and reimbursed by the Adviser (see Note B) | | | (468,100 | ) | | | | |
| | | | | | | | |
Net expenses | | | | | | | 129,234 | |
| | | | | | | | |
Net investment income | | | | | | | 354,216 | |
| | | | | | | | |
| Realized and Unrealized Gain (Loss) on Investment and Foreign Currency Transactions | | | | | | | | |
Net realized gain (loss) on: | | | | | | | | |
Investment transactions | | | | | | | (37,598 | ) |
Futures | | | | | | | 84,920 | |
Foreign currency transactions | | | | | | | (74,844 | ) |
Net change in unrealized appreciation/depreciation on: | | | | | | | | |
Investments | | | | | | | 2,514,151 | |
Foreign currency denominated assets and liabilities | | | | | | | (29,542 | ) |
| | | | | | | | |
Net gain on investment and foreign currency transactions | | | | | | | 2,457,087 | |
| | | | | | | | |
Net Increase in Net Assets from Operations | | | | | | $ | 2,811,303 | |
| | | | | | | | |
See notes to financial statements.
| | |
| abfunds.com | | AB INTERNATIONAL STRATEGIC CORE PORTFOLIO | 21 |
STATEMENT OF CHANGES IN NET ASSETS
| | | | | | | | |
| | | Year Ended
June 30,
2017 | | | July 29, 2015(a)
to
June 30, 2016 | |
| Increase (Decrease) in Net Assets from Operations | | | | | | | | |
Net investment income | | $ | 354,216 | | | $ | 61,891 | |
Net realized loss on investment and foreign currency transactions | | | (27,522 | ) | | | (60,452 | ) |
Net change in unrealized appreciation/depreciation on investments and foreign currency denominated assets and liabilities | | | 2,484,609 | | | | (22,722 | ) |
| | | | | | | | |
Net increase (decrease) in net assets from operations | | | 2,811,303 | | | | (21,283 | ) |
| Dividends to Shareholders from | | | | | | | | |
Net investment income | | | | | | | | |
Class A | | | (746 | ) | | | (124 | ) |
Class C | | | – 0 | – | | | (93 | ) |
Advisor Class | | | (106,830 | ) | | | (39,783 | ) |
| Capital Stock Transactions | | | | | | | | |
Net increase | | | 29,868,216 | | | | 3,060,261 | |
| | | | | | | | |
Total increase | | | 32,571,943 | | | | 2,998,978 | |
| Net Assets | | | | | | | | |
Beginning of period | | | 2,998,978 | | | | – 0 | – |
| | | | | | | | |
End of period (including undistributed net investment income of $258,504 and $85,236, respectively) | | $ | 35,570,921 | | | $ | 2,998,978 | |
| | | | | | | | |
| (a) | Commencement of operations. |
See notes to financial statements.
| | |
| 22 | AB INTERNATIONAL STRATEGIC CORE PORTFOLIO | | abfunds.com |
NOTES TO FINANCIAL STATEMENTS
June 30, 2017
NOTE A
Significant Accounting Policies
AB Cap Fund, Inc. (the “Company”), which is a Maryland corporation, is registered under the Investment Company Act of 1940 as an open-end management investment company. The Company operates as a series company currently comprised of 31 portfolios. Each portfolio is considered to be a separate entity for financial reporting and tax purposes. This report relates only to the AB International Strategic Core Portfolio (the “Fund”), a non-diversified portfolio. AB International Strategic Core Portfolio commenced operations on July 29, 2015. The Fund has authorized the issuance of Class A, Class B, Class C, Advisor Class, Class R, Class K, Class I, Class Z, Class T, Class 1, and Class 2 shares. Class B, Class R, Class K, Class I, Class Z, Class T, Class 1, and Class 2 shares are not currently being offered. Class A shares are sold with a front-end sales charge of up to 4.25% for purchases not exceeding $1,000,000. With respect to purchases of $1,000,000 or more, Class A shares redeemed within one year of purchase may be subject to a contingent deferred sales charge of 1%. Class C shares are subject to a contingent deferred sales charge of 1% on redemptions made within the first year after purchase, and 0% after the first year of purchase. Effective April 10, 2017, Class C shares will automatically convert to Class A shares ten years after the end of the calendar month of purchase. Advisor Class shares are sold without an initial or contingent deferred sales charge and are not subject to ongoing distribution expenses. All eleven classes of shares have identical voting, dividend, liquidation and other rights, except that the classes bear different distribution and transfer agency expenses. Each class has exclusive voting rights with respect to its distribution plan. The financial statements have been prepared in conformity with U.S. generally accepted accounting principles (“U.S. GAAP”), which require management to make certain estimates and assumptions that affect the reported amounts of assets and liabilities in the financial statements and amounts of income and expenses during the reporting period. Actual results could differ from those estimates. The Fund is an investment company under U.S. GAAP and follows the accounting and reporting guidance applicable to investment companies. The following is a summary of significant accounting policies followed by the Fund.
1. Security Valuation
Portfolio securities are valued at their current market value determined on the basis of market quotations or, if market quotations are not readily available or are deemed unreliable, at “fair value” as determined in accordance with procedures established by and under the general supervision of the Company’s Board of Directors (the “Board”).
| | |
| abfunds.com | | AB INTERNATIONAL STRATEGIC CORE PORTFOLIO | 23 |
NOTES TO FINANCIAL STATEMENTS (continued)
In general, the market values of securities which are readily available and deemed reliable are determined as follows: securities listed on a national securities exchange (other than securities listed on the NASDAQ Stock Market, Inc. (“NASDAQ”)) or on a foreign securities exchange are valued at the last sale price at the close of the exchange or foreign securities exchange. If there has been no sale on such day, the securities are valued at the last traded price from the previous day. Securities listed on more than one exchange are valued by reference to the principal exchange on which the securities are traded; securities listed only on NASDAQ are valued in accordance with the NASDAQ Official Closing Price; listed or over the counter (“OTC”) market put or call options are valued at the mid level between the current bid and ask prices. If either a current bid or current ask price is unavailable, AllianceBernstein L.P. (the “Adviser”) will have discretion to determine the best valuation (e.g. last trade price in the case of listed options); open futures are valued using the closing settlement price or, in the absence of such a price, the most recent quoted bid price. If there are no quotations available for the day of valuation, the last available closing settlement price is used; U.S. Government securities and any other debt instruments having 60 days or less remaining until maturity are generally valued at market by an independent pricing vendor, if a market price is available. If a market price is not available, the securities are valued at amortized cost. This methodology is commonly used for short term securities that have an original maturity of 60 days or less, as well as short term securities that had an original tern to maturity that exceeded 60 days. In instances when amortized cost is utilized, the Valuation Committee (the “Committee”) must reasonably conclude that the utilization of amortized cost is approximately the same as the fair value of the security. Such factors the Committee will consider include, but are not limited to, an impairment of the creditworthiness of the issuer or material changes in interest rates. Fixed-income securities, including mortgage-backed and asset-backed securities, may be valued on the basis of prices provided by a pricing service or at a price obtained from one or more of the major broker-dealers. In cases where broker-dealer quotes are obtained, the Adviser may establish procedures whereby changes in market yields or spreads are used to adjust, on a daily basis, a recently obtained quoted price on a security; swaps and other derivatives are valued daily, primarily using independent pricing services, independent pricing models using market inputs, as well as third party broker-dealers or counterparties. Open end mutual funds are valued at the closing net asset value per share, while exchange traded funds are valued at the closing market price per share.
Securities for which market quotations are not readily available (including restricted securities) or are deemed unreliable are valued at fair value as deemed appropriate by the Adviser. Factors considered in making this determination may include, but are not limited to, information obtained by
| | |
| 24 | AB INTERNATIONAL STRATEGIC CORE PORTFOLIO | | abfunds.com |
NOTES TO FINANCIAL STATEMENTS (continued)
contacting the issuer, analysts, analysis of the issuer’s financial statements or other available documents. In addition, the Fund may use fair value pricing for securities primarily traded in non-U.S. markets because most foreign markets close well before the Fund values its securities at 4:00 p.m., Eastern Time. The earlier close of these foreign markets gives rise to the possibility that significant events, including broad market moves, may have occurred in the interim and may materially affect the value of those securities. To account for this, the Fund may frequently value many of its foreign equity securities using fair value prices based on third party vendor modeling tools to the extent available.
2. Fair Value Measurements
In accordance with U.S. GAAP regarding fair value measurements, fair value is defined as the price that the Fund would receive to sell an asset or pay to transfer a liability in an orderly transaction between market participants at the measurement date. U.S. GAAP establishes a framework for measuring fair value, and a three-level hierarchy for fair value measurements based upon the transparency of inputs to the valuation of an asset or liability (including those valued based on their market values as described in Note A.1 above). Inputs may be observable or unobservable and refer broadly to the assumptions that market participants would use in pricing the asset or liability. Observable inputs reflect the assumptions market participants would use in pricing the asset or liability based on market data obtained from sources independent of the Fund. Unobservable inputs reflect the Fund’s own assumptions about the assumptions that market participants would use in pricing the asset or liability based on the best information available in the circumstances. Each investment is assigned a level based upon the observability of the inputs which are significant to the overall valuation. The three-tier hierarchy of inputs is summarized below.
| | • | | Level 1—quoted prices in active markets for identical investments |
| | • | | Level 2—other significant observable inputs (including quoted prices for similar investments, interest rates, prepayment speeds, credit risk, etc.) |
| | • | | Level 3—significant unobservable inputs (including the Fund’s own assumptions in determining the fair value of investments) |
Where readily available market prices or relevant bid prices are not available for certain equity investments, such investments may be valued based on similar publicly traded investments, movements in relevant indices since last available prices or based upon underlying company fundamentals and comparable company data (such as multiples to earnings or other multiples to equity). Where an investment is valued using an observable input such as another publicly traded security, the investment will be classified
| | |
| abfunds.com | | AB INTERNATIONAL STRATEGIC CORE PORTFOLIO | 25 |
NOTES TO FINANCIAL STATEMENTS (continued)
as Level 2. If management determines that an adjustment is appropriate based on restrictions on resale, illiquidity or uncertainty, and such adjustment is a significant component of the valuation, the investment will be classified as Level 3. An investment will also be classified as Level 3 where management uses company fundamentals and other significant inputs to determine the valuation.
The fair value of debt instruments, such as bonds, and over-the-counter derivatives is generally based on market price quotations, recently executed market transactions (where observable) or industry recognized modeling techniques and are generally classified as Level 2. Pricing vendor inputs to Level 2 valuations may include quoted prices for similar investments in active markets, interest rate curves, coupon rates, currency rates, yield curves, option adjusted spreads, default rates, credit spreads and other unique security features in order to estimate the relevant cash flows which is then discounted to calculate fair values. If these inputs are unobservable and significant to the fair value, these investments will be classified as Level 3. In addition, non-agency rated investments are classified as Level 3.
The following table summarizes the valuation of the Fund’s investments by the above fair value hierarchy levels as of June 30, 2017:
| | | | | | | | | | | | | | | | |
Investments in
Securities | | Level 1 | | | Level 2 | | | Level 3 | | | Total | |
Assets: | | | | | | | | | | | | | | | | |
Common Stocks: | | | | | | | | | | | | | | | | |
Financials | | $ | 1,543,584 | | | $ | 6,670,879 | | | $ | – 0 | – | | $ | 8,214,463 | |
Information Technology | | | 1,235,306 | | | | 5,161,005 | | | | – 0 | – | | | 6,396,311 | |
Industrials | | | – 0 | – | | | 4,222,440 | | | | – 0 | – | | | 4,222,440 | |
Consumer Discretionary | | | – 0 | – | | | 3,373,923 | | | | – 0 | – | | | 3,373,923 | |
Consumer Staples | | | 222,244 | | | | 2,175,256 | | | | – 0 | – | | | 2,397,500 | |
Health Care | | | 402,203 | | | | 1,526,238 | | | | – 0 | – | | | 1,928,441 | |
Materials | | | – 0 | – | | | 1,551,766 | | | | – 0 | – | | | 1,551,766 | |
Telecommunication Services | | | 812,671 | | | | 691,878 | | | | – 0 | – | | | 1,504,549 | |
Energy | | | – 0 | – | | | 1,076,382 | | | | – 0 | – | | | 1,076,382 | |
Utilities | | | – 0 | – | | | 327,808 | | | | – 0 | – | | | 327,808 | |
Short-Term Investments: | | | | | | | | | | | | | | | | |
Investment Companies | | | 997,419 | | | | – 0 | – | | | – 0 | – | | | 997,419 | |
| | | | | | | | | | | | | | | | |
Total Investments in Securities | | | 5,213,427 | | | | 26,777,575 | † | | | – 0 | – | | | 31,991,002 | |
Other Financial Instruments*: | | | | | | | | | | | | | | | | |
Assets | | | | | | | | | | | | | | | | |
Forward Currency Exchange Contracts | | | – 0 | – | | | 264,026 | | | | – 0 | – | | | 264,026 | |
Liabilities | | | | | | | | | | | | | | | | |
Forward Currency Exchange Contracts | | | – 0 | – | | | (287,937 | ) | | | – 0 | – | | | (287,937 | ) |
| | | | | | | | | | | | | | | | |
Total^ | | $ | 5,213,427 | | | $ | 26,753,664 | | | $ | – 0 | – | | $ | 31,967,091 | |
| | | | | | | | | | | | | | | | |
| † | A significant portion of the Fund’s foreign equity investments are categorized as Level 2 investments since they are valued using fair value prices based on third party vendor modeling tools to the extent available, see Note A.1. |
| | |
| 26 | AB INTERNATIONAL STRATEGIC CORE PORTFOLIO | | abfunds.com |
NOTES TO FINANCIAL STATEMENTS (continued)
| * | Other financial instruments are derivative instruments, such as futures, forwards and swaps, which are valued at the unrealized appreciation/depreciation on the instrument. |
| ^ | An amount of $110,975 was transferred from Level 2 to Level 1 due to the above mentioned foreign equity fair valuation using third party vendor modeling tools during the reporting period. There were no transfers from Level 1 to Level 2 during the reporting period. |
The Fund recognizes all transfers between levels of the fair value hierarchy assuming the financial instrument was transferred at the beginning of the reporting period.
The Adviser established the Committee to oversee the pricing and valuation of all securities held in the Fund. The Committee operates under pricing and valuation policies and procedures established by the Adviser and approved by the Board, including pricing policies which set forth the mechanisms and processes to be employed on a daily basis to implement these policies and procedures. In particular, the pricing policies describe how to determine market quotations for securities and other instruments. The Committee’s responsibilities include: 1) fair value and liquidity determinations (and oversight of any third parties to whom any responsibility for fair value and liquidity determinations is delegated), and 2) regular monitoring of the Adviser’s pricing and valuation policies and procedures and modification or enhancement of these policies and procedures (or recommendation of the modification of these policies and procedures) as the Committee believes appropriate.
The Committee is also responsible for monitoring the implementation of the pricing policies by the Adviser’s Pricing Group (the “Pricing Group”) and any third party which performs certain pricing functions in accordance with the pricing policies. The Pricing Group is responsible for the oversight of the third party on a day-to-day basis. The Committee and the Pricing Group perform a series of activities to provide reasonable assurance of the accuracy of prices including: 1) periodic vendor due diligence meetings, review of methodologies, new developments and process at vendors, 2) daily comparison of security valuation versus prior day for all securities that exceeded established thresholds, and 3) daily review of unpriced, stale, and variance reports with exceptions reviewed by senior management and the Committee.
In addition, several processes outside of the pricing process are used to monitor valuation issues including: 1) performance and performance attribution reports are monitored for anomalous impacts based upon benchmark performance, and 2) portfolio managers review all portfolios for performance and analytics (which are generated using the Adviser’s prices).
| | |
| abfunds.com | | AB INTERNATIONAL STRATEGIC CORE PORTFOLIO | 27 |
NOTES TO FINANCIAL STATEMENTS (continued)
3. Currency Translation
Assets and liabilities denominated in foreign currencies and commitments under forward currency exchange contracts are translated into U.S. dollars at the mean of the quoted bid and ask prices of such currencies against the U.S. dollar. Purchases and sales of portfolio securities are translated into U.S. dollars at the rates of exchange prevailing when such securities were acquired or sold. Income and expenses are translated into U.S. dollars at rates of exchange prevailing when accrued.
Net realized gain or loss on foreign currency transactions represents foreign exchange gains and losses from sales and maturities of foreign fixed income investments, foreign currency exchange contracts, holding of foreign currencies, currency gains or losses realized between the trade and settlement dates on foreign investment transactions, and the difference between the amounts of dividends, interest and foreign withholding taxes recorded on the Fund’s books and the U.S. dollar equivalent amounts actually received or paid. Net unrealized currency gains and losses from valuing foreign currency denominated assets and liabilities at period end exchange rates are reflected as a component of net unrealized appreciation and depreciation on foreign currency denominated assets and liabilities.
4. Taxes
It is the Fund’s policy to meet the requirements of the Internal Revenue Code applicable to regulated investment companies and to distribute all of its investment company taxable income and net realized gains, if any, to shareholders. Therefore, no provisions for federal income or excise taxes are required. The Fund may be subject to taxes imposed by countries in which it invests. Such taxes are generally based on income and/or capital gains earned or repatriated. Taxes are accrued and applied to net investment income, net realized gains and net unrealized appreciation/depreciation as such income and/or gains are earned.
In accordance with U.S. GAAP requirements regarding accounting for uncertainties in income taxes, management has analyzed the Fund’s tax positions taken or expected to be taken on federal and state income tax returns for all open tax years (all years since inception of the Fund) and has concluded that no provision for income tax is required in the Fund’s financial statements.
5. Investment Income and Investment Transactions
Dividend income is recorded on the ex-dividend date or as soon as the Fund is informed of the dividend. Interest income is accrued daily. Investment transactions are accounted for on the date securities are purchased or sold. Investment gains and losses are determined on the identified cost
| | |
| 28 | AB INTERNATIONAL STRATEGIC CORE PORTFOLIO | | abfunds.com |
NOTES TO FINANCIAL STATEMENTS (continued)
basis. The Fund amortizes premiums and accretes discounts as adjustments to interest income.
6. Class Allocations
All income earned and expenses incurred by the Fund are borne on a pro-rata basis by each outstanding class of shares, based on the proportionate interest in the Fund represented by the net assets of such class, except for class specific expenses which are allocated to the respective class. Expenses of the Company are charged proportionately to each portfolio or based on other appropriate methods. Realized and unrealized gains and losses are allocated among the various share classes based on their respective net assets.
7. Dividends and Distributions
Dividends and distributions to shareholders, if any, are recorded on the ex-dividend date. Income dividends and capital gains distributions are determined in accordance with federal tax regulations and may differ from those determined in accordance with U.S. GAAP. To the extent these differences are permanent, such amounts are reclassified within the capital accounts based on their federal tax basis treatment; temporary differences do not require such reclassification.
8. Offering Expenses
Offering expenses of $56,814 were deferred and amortized on a straight line basis over a one year period starting from July 29, 2015 (commencement of operations).
NOTE B
Advisory Fee and Other Transactions with Affiliates
Under the terms of the investment advisory agreement, the Fund pays the Adviser an advisory fee at an annual rate of .75% of the first $2.5 billion, .65% of the excess of $2.5 billion up to $5 billion and .60% of the excess over $5 billion of the Fund’s average daily net assets. The fee is accrued daily and paid monthly. The Adviser has agreed to waive its fees and bear certain expenses to the extent necessary to limit total operating expenses (excluding acquired fund fees and expenses other than the advisory fees of any AB Mutual Funds in which the Fund may invest, interest expense, taxes, extraordinary expenses, and brokerage commissions and other transaction costs) on an annual basis (the “Expense Caps”) to 1.20%, 1.95% and .95% of the daily average net assets for Class A, Class C and Advisor Class shares, respectively. Any fees waived and expenses borne by the Adviser through June 30, 2017 are subject to repayment by the Fund until the end of the third fiscal year after the fiscal period in which the fee was waived or the expense was borne; such waivers that are subject to repayment amount to $309,933 for the fiscal period ended June 30, 2016.
| | |
| abfunds.com | | AB INTERNATIONAL STRATEGIC CORE PORTFOLIO | 29 |
NOTES TO FINANCIAL STATEMENTS (continued)
In any case, no repayment will be made that would cause the Fund’s total annual operating expenses to exceed the net fee percentages set forth above. For the year ended June 30, 2017 the reimbursements/waivers amounted to $403,707. The Expense Caps may not be terminated by the Adviser before November 1, 2017.
Pursuant to the investment advisory agreement, the Fund may reimburse the Adviser for certain legal and accounting services provided to the Fund by the Adviser. For the year ended June 30, 2017, the Adviser voluntarily agreed to waive such fees that amounted to $63,377.
The Fund compensates AllianceBernstein Investor Services, Inc. (“ABIS”), a wholly-owned subsidiary of the Adviser, under a Transfer Agency Agreement for providing personnel and facilities to perform transfer agency services for the Fund. ABIS may make payments to intermediaries that provide omnibus account services, sub-accounting services and/or networking services. Such compensation retained by ABIS amounted to $12,412 for the year ended June 30, 2017.
AllianceBernstein Investments, Inc. (the “Distributor”), a wholly-owned subsidiary of the Adviser, serves as the distributor of the Fund’s shares. The Distributor has advised the Fund that it has retained front-end sales charges of $96 from the sale of Class A shares and received no contingent deferred sales charges imposed upon redemptions by shareholders of Class A and Class C shares, respectively, for the year ended June 30, 2017.
The Fund may invest in AB Government Money Market Portfolio (the “Government Money Market Portfolio”) which has a contractual annual advisory fee rate of .20% of the portfolio’s average daily net assets and bears its own expenses. In connection with the investment by the Fund in the Government Money Market Portfolio, the Adviser has agreed to waive its advisory fee from the Fund in an amount equal to the Fund’s pro rata share of the effective advisory fees of Government Money Market Portfolio, as borne indirectly by the Fund as an acquired fund fee and expense. For the year ended June 30, 2017, such waiver amounted to $1,016. A summary of the Fund’s transactions in shares of the Government Money Market Portfolio for the year ended June 30, 2017 is as follows:
| | | | | | | | | | | | | | | | |
Market Value
June 30, 2016
(000) | | Purchases
at Cost
(000) | | | Sales
Proceeds
(000) | | | Market Value
June 30, 2017
(000) | | | Dividend
Income
(000) | |
| $ 62 | | $ | 17,103 | | | $ | 16,168 | | | $ | 997 | | | $ | 3 | |
Brokerage commissions paid on investment transactions for the year ended June 30, 2017 amounted to $25,261, of which $0 and $0, respectively, was paid to
| | |
| 30 | AB INTERNATIONAL STRATEGIC CORE PORTFOLIO | | abfunds.com |
NOTES TO FINANCIAL STATEMENTS (continued)
Sanford C. Bernstein & Co., LLC or Sanford C. Bernstein Limited affiliates of the Adviser.
NOTE C
Distribution Services Agreement
The Fund has adopted a Distribution Services Agreement (the “Agreement”) pursuant to Rule 12b-1 under the Investment Company Act of 1940. Under the Agreement, the Fund pays distribution and servicing fees to the Distributor at an annual rate of up to .25% of the Fund’s average daily net assets attributable to Class A shares and 1% of the Fund’s average daily net assets attributable to Class C shares. There are no distribution and servicing fees on the Advisor Class. The fees are accrued daily and paid monthly. The Agreement provides that the Distributor will use such payments in their entirety for distribution assistance and promotional activities. Since the commencement of the Fund’s operations, the Distributor has incurred expenses in excess of the distribution costs reimbursed by the Fund in the amounts of $199 for Class C shares. While such costs may be recovered from the Fund in future periods so long as the Agreement is in effect, the rate of the distribution and servicing fees payable under the Agreement may not be increased without a shareholder vote. In accordance with the Agreement, there is no provision for recovery of unreimbursed distribution costs incurred by the Distributor beyond the current fiscal year for Class A shares. The Agreement also provides that the Adviser may use its own resources to finance the distribution of the Fund’s shares.
NOTE D
Investment Transactions
Purchases and sales of investment securities (excluding short-term investments) for the year ended June 30, 2017 were as follows:
| | | | | | | | |
| | | Purchases | | | Sales | |
Investment securities (excluding U.S. government securities) | | $ | 34,335,292 | | | $ | 8,675,509 | |
U.S. government securities | | | – 0 | – | | | – 0 | – |
The cost of investments for federal income tax purposes, gross unrealized appreciation and unrealized depreciation (excluding foreign currency contracts) are as follows:
| | | | |
Cost | | $ | 29,642,480 | |
| | | | |
Gross unrealized appreciation | | $ | 2,615,172 | |
Gross unrealized depreciation | | | (266,650 | ) |
| | | | |
Net unrealized appreciation | | $ | 2,348,522 | |
| | | | |
| | |
| abfunds.com | | AB INTERNATIONAL STRATEGIC CORE PORTFOLIO | 31 |
NOTES TO FINANCIAL STATEMENTS (continued)
1. Derivative Financial Instruments
The Fund may use derivatives in an effort to earn income and enhance returns, to replace more traditional direct investments, to obtain exposure to otherwise inaccessible markets (collectively, “investment purposes”), or to hedge or adjust the risk profile of its portfolio.
The principal types of derivatives utilized by the Fund, as well as the methods in which they may be used are:
| | • | | Forward Currency Exchange Contracts |
The Fund may enter into forward currency exchange contracts in order to hedge its exposure to changes in foreign currency exchange rates on its foreign portfolio holdings, to hedge certain firm purchase and sale commitments denominated in foreign currencies and for non-hedging purposes as a means of making direct investments in foreign currencies, as described below under “Currency Transactions”.
A forward currency exchange contract is a commitment to purchase or sell a foreign currency at a future date at a negotiated forward rate. The gain or loss arising from the difference between the original contract and the closing of such contract would be included in net realized gain or loss on foreign currency transactions. Fluctuations in the value of open forward currency exchange contracts are recorded for financial reporting purposes as unrealized appreciation and/or depreciation by the Fund. Risks may arise from the potential inability of a counterparty to meet the terms of a contract and from unanticipated movements in the value of a foreign currency relative to the U.S. dollar.
During the year ended June 30, 2017, the Fund held forward currency exchange contracts for hedging and non-hedging purposes.
The Fund may buy or sell futures for investment purposes or for the purpose of hedging its fund against adverse effects of potential movements in the market. The Fund bears the market risk that arises from changes in the value of these instruments and the imperfect correlation between movements in the price of the futures and movements in the price of the assets, reference rates or indices which they are designed to track. Among other things, the Fund may purchase or sell futures for foreign currencies or options thereon for non-hedging purposes as a means of making direct investment in foreign currencies, as described below under “Currency Transactions”.
At the time the Fund enters into a future, the Fund deposits and maintains as collateral an initial margin with the broker, as required by the exchange on which the transaction is effected. Such amount is
| | |
| 32 | AB INTERNATIONAL STRATEGIC CORE PORTFOLIO | | abfunds.com |
NOTES TO FINANCIAL STATEMENTS (continued)
shown as cash collateral due from broker on the statement of assets and liabilities. Pursuant to the contract, the Fund agrees to receive from or pay to the broker an amount of cash equal to the daily fluctuation in the value of the contract. Such receipts or payments are known as variation margin and are recorded by the Fund as unrealized gains or losses. Risks may arise from the potential inability of a counterparty to meet the terms of the contract. The credit/counterparty risk for exchange-traded futures is generally less than privately negotiated futures, since the clearinghouse, which is the issuer or counterparty to each exchange-traded future, has robust risk mitigation standards, including the requirement to provide initial and variation margin. When the contract is closed, the Fund records a realized gain or loss equal to the difference between the value of the contract at the time it was opened and the time it was closed.
Use of long futures subjects the Fund to risk of loss in excess of the amounts shown on the statement of assets and liabilities, up to the notional value of the future. Use of short futures subjects the Fund to unlimited risk of loss. Under some circumstances, futures exchanges may establish daily limits on the amount that the price of a future can vary from the previous day’s settlement price, which could effectively prevent liquidation of unfavorable positions.
During the year ended June 30, 2017, the Fund held futures for non-hedging purposes.
The Fund typically enters into International Swaps and Derivatives Association, Inc. Master Agreements (“ISDA Master Agreement”) or similar master agreements (collectively, “Master Agreements”) with its derivative contract counterparties in order to, among other things, reduce its credit risk to counterparties. ISDA Master Agreements include provisions for general obligations, representations, collateral and events of default or termination. Under an ISDA Master Agreement, the Fund typically may offset with the counterparty certain derivative financial instrument’s payables and/or receivables with collateral held and/or posted and create one single net payment (close-out netting) in the event of default or termination.
Various Master Agreements govern the terms of certain transactions with counterparties, including transactions such as derivative transactions, repurchase and reverse repurchase agreements. These Master Agreements typically attempt to reduce the counterparty risk associated with such transactions by specifying credit protection mechanisms and providing standardization that improves legal certainty. Cross-termination provisions under Master Agreements typically provide that a default in connection with one transaction between the Fund and a counterparty gives the non-defaulting party the right to terminate any other transactions
| | |
| abfunds.com | | AB INTERNATIONAL STRATEGIC CORE PORTFOLIO | 33 |
NOTES TO FINANCIAL STATEMENTS (continued)
in place with the defaulting party to create one single net payment due to/due from the defaulting party. In the event of a default by a Master Agreements counterparty, the return of collateral with market value in excess of the Fund’s net liability, held by the defaulting party, may be delayed or denied.
The Fund’s Master Agreements may contain provisions for early termination of OTC derivative transactions in the event the net assets of the Fund decline below specific levels (“net asset contingent features”). If these levels are triggered, the Fund’s counterparty has the right to terminate such transaction and require the Fund to pay or receive a settlement amount in connection with the terminated transaction. For additional details, please refer to netting arrangements by counterparty tables below.
During the year ended June 30, 2017, the Fund had entered into the following derivatives:
| | | | | | | | | | | | |
| | | Asset Derivatives | | | Liability Derivatives | |
Derivative Type | | Statement of
Assets and
Liabilities
Location | | Fair Value | | | Statement of
Assets and
Liabilities
Location | | Fair Value | |
Foreign exchange contracts | | Unrealized appreciation on forward currency exchange contracts | | $ | 264,026 | | | Unrealized depreciation on forward currency exchange contracts | | $ | 287,937 | |
| | | | | | | | | | | | |
Total | | | | $ | 264,026 | | | | | $ | 287,937 | |
| | | | | | | | | | | | |
| | | | | | | | | | |
Derivative Type | | Location of
Gain or (Loss) on
Derivatives Within
Statement of
Operations | | Realized Gain
or (Loss) on
Derivatives | | | Change in
Unrealized
Appreciation or
(Depreciation) | |
Foreign exchange contracts | | Net realized gain/(loss) on foreign currency transactions; Net change in unrealized appreciation/depreciation on foreign currency denominated assets and liabilities | | $ | (84,389 | ) | | $ | (31,711 | ) |
| | | |
Equity contracts | | Net realized gain/(loss) on futures; Net change in unrealized appreciation/depreciation on futures | | | 84,920 | | | | – 0 | – |
| | | | | | | | | | |
Total | | | | $ | 531 | | | $ | (31,711 | ) |
| | | | | | | | | | |
| | |
| 34 | AB INTERNATIONAL STRATEGIC CORE PORTFOLIO | | abfunds.com |
NOTES TO FINANCIAL STATEMENTS (continued)
The following table represents the average monthly volume of the Fund’s derivative transactions during the year ended June 30, 2017:
| | | | |
Forward Currency Exchange Contracts: | | | | |
Average principal amount on buy contracts | | $ | 3,503,303 | |
Average principal amount on sale contracts | | $ | 3,371,537 | |
Futures: | | | | |
Average original value of buy contracts | | $ | 507,203 | (a) |
| (a) | Positions were open seven months during the reporting period. |
For financial reporting purposes, the Fund does not offset derivative assets and derivative liabilities that are subject to netting arrangements in the statement of assets and liabilities.
All derivatives held at period end were subject to netting arrangements. The following tables present the Fund’s derivative assets and liabilities by counterparty net of amounts available for offset under Master Agreements (“MA”) and net of the related collateral received/pledged by the Fund as of June 30, 2017:
| | | | | | | | | | | | | | | | | | | | |
Counterparty | | Derivative
Assets
Subject to
a MA | | | Derivatives
Available
for Offset | | | Cash
Collateral
Received | | | Security
Collateral
Received | | | Net Amount
of Derivatives
Assets | |
OTC Derivatives: | | | | | | | | | | | | | | | | | | | | |
Brown Brothers Harriman & Co. | | $ | 184,757 | | | $ | (184,757 | ) | | $ | – 0 | – | | $ | – 0 | – | | $ | – 0 | – |
JPMorgan Chase Bank, NA | | | 4,067 | | | | – 0 | – | | | – 0 | – | | | – 0 | – | | | 4,067 | |
Royal Bank of Scotland PLC | | | 75,202 | | | | (23,687 | ) | | | – 0 | – | | | – 0 | – | | | 51,515 | |
| | | | | | | | | | | | | | | | | | | | |
Total | | $ | 264,026 | | | $ | (208,444 | ) | | $ | – 0 | – | | $ | – 0 | – | | $ | 55,582 | ^ |
| | | | | | | | | | | | | | | | | | | | |
| | | | | | | | | | | | | | | | | | | | |
Counterparty | | Derivative
Liabilities
Subject to
a MA | | | Derivatives
Available
for Offset | | | Cash
Collateral
Pledged | | | Security
Collateral
Pledged | | | Net Amount
of Derivatives
Liabilities | |
OTC Derivatives: | | | | | | | | | | | | | | | | | | | | |
Brown Brothers Harriman & Co. | | | 198,624 | | | $ | (184,757 | ) | | $ | –0 | – | | $ | –0 | – | | $ | 13,867 | |
Deutsche Bank AG | | | 28,972 | | | | – 0 | – | | | – 0 | – | | | – 0 | – | | | 28,972 | |
Goldman Sachs Bank USA | | | 36,654 | | | | – 0 | – | | | – 0 | – | | | – 0 | – | | | 36,654 | |
Royal Bank of Scotland PLC | | | 23,687 | | | | (23,687 | ) | | | – 0 | – | | | – 0 | – | | | – 0 | – |
| | | | | | | | | | | | | | | | | | | | |
Total | | $ | 287,937 | | | $ | (208,444 | ) | | $ | –0 | – | | $ | –0 | – | | $ | 79,493 | ^ |
| | | | | | | | | | | | | | | | | | | | |
| ^ | Net amount represents the net unrealized receivable/payable that would be due from/to the counterparty in the event of default or termination. The net from OTC financial derivative instruments can only be netted across transactions governed under the same master agreement with the same counterparty. |
| | |
| abfunds.com | | AB INTERNATIONAL STRATEGIC CORE PORTFOLIO | 35 |
NOTES TO FINANCIAL STATEMENTS (continued)
2. Currency Transactions
The Fund may invest in non-U.S. dollar-denominated securities on a currency hedged or unhedged basis. The Fund may seek investment opportunities by taking long or short positions in currencies through the use of currency-related derivatives, including forward currency exchange contracts, futures and options on futures, swaps, and other options. The Fund may enter into transactions for investment opportunities when it anticipates that a foreign currency will appreciate or depreciate in value but securities denominated in that currency are not held by the Fund and do not present attractive investment opportunities. Such transactions may also be used when the Adviser believes that it may be more efficient than a direct investment in a foreign currency-denominated security. The Fund may also conduct currency exchange contracts on a spot basis (i.e., for cash at the spot rate prevailing in the currency exchange market for buying or selling currencies).
NOTE E
Capital Stock
Each class consists of 1,000,000,000 authorized shares. Transactions in capital shares for each class were as follows:
| | | | | | | | | | | | | | | | | | | | | | | | |
| | | | | | | | | | | | | | | | | | | | | |
| | | Shares | | | | | | Amount | | | | |
| | | Year Ended
June 30, 2017 | | | July 29, 2015* to
June 30, 2016 | | | | | | Year Ended
June 30, 2017 | | | July 29, 2015* to
June 30, 2016 | | | | |
| | | | | | | | | | | | |
| Class A | | | | | | | | | | | | | | | | | | | | | | | | |
Shares sold | | | 15,275 | | | | 5,847 | | | | | | | $ | 156,424 | | | $ | 57,757 | | | | | |
| | | | | | | | | | | | | | | | | | | | | | | | |
Shares issued in reinvestment of dividends | | | 79 | | | | – 0 | – | | | | | | | 746 | | | | – 0 | – | | | | |
| | | | | | | | | | | | | | | | | | | | | | | | |
Shares converted from Class C | | | – 0 | –(a) | | | – 0 | – | | | | | | | 1 | | | | – 0 | – | | | | |
| | | | | | | | | | | | | | | | | | | | | | | | |
Shares redeemed | | | (4 | ) | | | – 0 | – | | | | | | | (44 | ) | | | – 0 | – | | | | |
| | | | | | | | | | | | | | | | | | | | | | | | |
Net increase | | | 15,350 | | | | 5,847 | | | | | | | $ | 157,127 | | | $ | 57,757 | | | | | |
| | | | | | | | | | | | | | | | | | | | | | | | |
| | | | | | | | | | | | | | | | | | | | | | | | |
| Class C | | | | | | | | | | | | | | | | | | | | | | | | |
Shares sold | | | 4,632 | | | | 1,000 | | | | | | | $ | 47,518 | | | $ | 10,002 | | | | | |
| | | | | | | | | | | | | | | | | | | | | | | | |
Shares converted to Class A | | | – 0 | –(a) | | | – 0 | – | | | | | | | (1 | ) | | | – 0 | – | | | | |
| | | | | | | | | | | | | | | | | | | | | | | | |
Net increase | | | 4,632 | | | | 1,000 | | | | | | | $ | 47,517 | | | $ | 10,002 | | | | | |
| | | | | | | | | | | | | | | | | | | | | | | | |
| | | | | | | | | | | | | | | | | | | | | | | | |
| Advisor Class | | | | | | | | | | | | | | | | | | | | | | | | |
Shares sold | | | 2,998,834 | | | | 299,292 | | | | | | | $ | 30,819,111 | | | $ | 2,992,502 | | | | | |
| | | | | | | | | | | | | | | | | | | | | | | | |
Shares issued in reinvestment of dividends | | | 9,679 | | | | – 0 | – | | | | | | | 91,761 | | | | – 0 | – | | | | |
| | | | | | | | | | | | | | | | | | | | | | | | |
Shares redeemed | | | (119,401 | ) | | | – 0 | – | | | | | | | (1,247,300 | ) | | | – 0 | – | | | | |
| | | | | | | | | | | | | | | | | | | | | | | | |
Net increase | | | 2,889,112 | | | | 299,292 | | | | | | | $ | 29,663,572 | | | $ | 2,992,502 | | | | | |
| | | | | | | | | | | | | | | | | | | | | | | | |
| * | Commencement of operations. |
| | |
| 36 | AB INTERNATIONAL STRATEGIC CORE PORTFOLIO | | abfunds.com |
NOTES TO FINANCIAL STATEMENTS (continued)
NOTE F
Risks Involved in Investing in the Fund
Foreign (Non-U.S.) Risk—Investments in securities of non-U.S. issuers may involve more risk than those of U.S. issuers. These securities may fluctuate more widely in price and may be less liquid due to adverse market, economic, political, regulatory or other factors. These risks may be heightened with respect to investments in emerging-market countries, where there may be an increased amount of economic, political and social instability.
Currency Risk—Fluctuations in currency exchange rates may negatively affect the value of the Fund’s investments or reduce its returns.
Capitalization Risk—Investments in mid-capitalization companies may be more volatile than investments in large-capitalization companies. Investments in mid-capitalization companies may have additional risks because these companies have limited product lines, markets or financial resources.
Derivatives Risk—The Fund may enter into derivative transactions such as forwards, options, futures and swaps. Derivatives may be illiquid, difficult to price, and leveraged so that small changes may produce disproportionate losses for the Fund, and subject to counterparty risk to a greater degree than more traditional investments. Derivatives may result in significant losses, including losses that are far greater than the value of the derivatives reflected on the statement of assets and liabilities.
Non-Diversification Risk—The Fund may have more risk because it is “non-diversified”, meaning that it can invest more of its assets in a smaller number of issuers. Accordingly, changes in the value of one security could have a more significant effect, either negative or positive, on the Fund’s net asset value, or NAV.
Indemnification Risk—In the ordinary course of business, the Fund enters into contracts that contain a variety of indemnifications. The Fund’s maximum exposure under these arrangements is unknown. However, the Fund has not had prior claims or losses pursuant to these indemnification provisions and expects the risk of loss thereunder to be remote. Therefore, the Fund has not accrued any liability in connection with these indemnification provisions.
NOTE G
Joint Credit Facility
A number of open-end mutual funds managed by the Adviser, including the Fund, participate in a $280 million revolving credit facility (the “Facility”)
| | |
| abfunds.com | | AB INTERNATIONAL STRATEGIC CORE PORTFOLIO | 37 |
NOTES TO FINANCIAL STATEMENTS (continued)
intended to provide short-term financing, if necessary, subject to certain restrictions in connection with abnormal redemption activity. Commitment fees related to the Facility are paid by the participating funds and are included in miscellaneous expenses in the statement of operations. The Fund did not utilize the Facility during the year ended June 30, 2017.
NOTE H
Tax Information
The tax character of distributions paid during the fiscal year ended June 30, 2017 and fiscal period ended June 30, 2016 were as follows:
| | | | | | | | |
| | | 2017 | | | 2016 | |
Distributions paid from: | | | | | | | | |
Ordinary income | | $ | 107,576 | | | $ | 40,000 | |
| | | | | | | | |
Total taxable distributions paid | | $ | 107,576 | | | $ | 40,000 | |
| | | | | | | | |
As of June 30, 2017, the components of accumulated earnings/(deficit) on a tax basis were as follows:
| | | | |
Undistributed ordinary income | | $ | 270,982 | |
Accumulated capital and other losses | | | 31,257 | (a) |
Unrealized appreciation/(depreciation) | | | 2,345,079 | (b) |
| | | | |
Total accumulated earnings/(deficit) | | $ | 2,647,318 | |
| | | | |
| (a) | During the fiscal year, the Fund utilized $119,292 of capital loss carry forwards to offset current year net realized gains. |
| (b) | The difference between book-basis and tax-basis unrealized appreciation/ (depreciation) is attributable primarily to the tax deferral of losses on wash sales, the tax treatment of swaps, and the recognition for tax purposes of unrealized gains/losses on certain derivative instruments. |
For tax purposes, net realized capital losses may be carried over to offset future capital gains, if any. Funds are permitted to carry forward capital losses for an indefinite period, and such losses will retain their character as either short-term or long-term capital losses. As of June 30, 2017 the Fund did not have any capital loss carryforwards.
During the current fiscal year, permanent differences primarily due to the tax treatment of passive foreign investment companies (PFICs), foreign currency reclassifications, the tax treatment of offering costs and excise taxes paid resulted in a net decrease in undistributed net investment income, a net decrease in accumulated net realized loss on investment and foreign currency transactions and a net decrease in additional paid-in capital. These reclassifications had no effect on net assets.
| | |
| 38 | AB INTERNATIONAL STRATEGIC CORE PORTFOLIO | | abfunds.com |
NOTES TO FINANCIAL STATEMENTS (continued)
NOTE I
Other
In October 2016, the U.S. Securities and Exchange Commission adopted new rules and amended existing rules (together, “final rules”) intended to modernize the reporting and disclosure of information by registered investment companies. In part, the final rules amend Regulation S-X and require standardized, enhanced disclosure about derivatives in investment company financial statements, as well as other amendments. The compliance date for the amendments to Regulation S-X is August 1, 2017 (for the reporting period end dates of August 31, 2017 or after). Management has evaluated the impact of the amendments and expects the effect of the adoption of the final rules on financial statements will be limited to additional disclosures.
NOTE J
Subsequent Events
Management has evaluated subsequent events for possible recognition or disclosure in the financial statements through the date the financial statements are issued. Management has determined that there are no material events that would require disclosure in the Fund’s financial statements through this date.
| | |
| abfunds.com | | AB INTERNATIONAL STRATEGIC CORE PORTFOLIO | 39 |
FINANCIAL HIGHLIGHTS
Selected Data For A Share Of Capital Stock Outstanding Throughout Each Period
| | | | | | | | |
| | | Class A | |
| | | Year Ended
June 30,
2017 | | | July 29,
2015(a) to
June 30,
2016 | |
| | | | |
| | | | | | | | |
Net asset value, beginning of period | | | $ 9.79 | | | | $ 10.00 | |
| | | | |
Income From Investment Operations | | | | | | | | |
Net investment income(b)(c) | | | .22 | | | | .26 | |
Net realized and unrealized gain (loss) on investment and foreign currency transactions | | | 1.11 | | | | (.35 | ) |
| | | | |
Net increase (decrease) in net asset value from operations | | | 1.33 | | | | (.09 | ) |
| | | | |
Less: Dividends | | | | | | | | |
Dividends from net investment income | | | (.08 | ) | | | (.12 | ) |
| | | | |
Net asset value, end of period | | | $ 11.04 | | | | $ 9.79 | |
| | | | |
Total Return | | | | | | | | |
Total investment return based on net asset value(d) | | | 13.72 | % | | | (.84 | )% |
Ratios/Supplemental Data | | | | | | | | |
Net assets, end of period (000’s omitted) | | | $234 | | | | $57 | |
Ratio to average net assets of: | | | | | | | | |
Expenses, net of waivers/reimbursements(e) | | | 1.19 | % | | | 1.20 | %(f) |
Expenses, before waivers/reimbursements(e) | | | 5.13 | % | | | 23.67 | %(f) |
Net investment income(c) | | | 2.15 | % | | | 2.87 | %(f) |
Portfolio turnover rate | | | 64 | % | | | 52 | % |
See footnote summary on page 42.
| | |
| 40 | AB INTERNATIONAL STRATEGIC CORE PORTFOLIO | | abfunds.com |
FINANCIAL HIGHLIGHTS (continued)
Selected Data For A Share Of Capital Stock Outstanding Throughout Each Period
| | | | | | | | |
| | | Class C | |
| | | Year Ended
June 30,
2017 | | | July 29,
2015(a) to
June 30,
2016 | |
| | | | |
| | | | | | | | |
Net asset value, beginning of period | | | $ 9.75 | | | | $ 10.00 | |
| | | | |
Income From Investment Operations | | | | | | | | |
Net investment income(b)(c) | | | .19 | | | | .12 | |
Net realized and unrealized gain (loss) on investment and foreign currency transactions | | | 1.07 | | | | (.28 | ) |
| | | | |
Net increase (decrease) in net asset value from operations | | | 1.26 | | | | (.16 | ) |
| | | | |
Less: Dividends | | | | | | | | |
Dividends from net investment income | | | – 0 | – | | | (.09 | ) |
| | | | |
Net asset value, end of period | | | $ 11.01 | | | | $ 9.75 | |
| | | | |
Total Return | | | | | | | | |
Total investment return based on net asset value(d) | | | 12.92 | % | | | (1.55 | )% |
Ratios/Supplemental Data | | | | | | | | |
Net assets, end of period (000’s omitted) | | | $62 | | | | $10 | |
Ratio to average net assets of: | | | | | | | | |
Expenses, net of waivers/reimbursements(e) | | | 1.94 | % | | | 1.95 | %(f) |
Expenses, before waivers/reimbursements(e) | | | 5.70 | % | | | 15.57 | %(f) |
Net investment income(c) | | | 1.80 | % | | | 1.31 | %(f) |
Portfolio turnover rate | | | 64 | % | | | 52 | % |
See footnote summary on page 42.
| | |
| abfunds.com | | AB INTERNATIONAL STRATEGIC CORE PORTFOLIO | 41 |
FINANCIAL HIGHLIGHTS (continued)
Selected Data For A Share Of Capital Stock Outstanding Throughout Each Period
| | | | | | | | |
| | | Advisor Class | |
| | | Year Ended
June 30,
2017 | | | July 29,
2015(a) to
June 30,
2016 | |
| | | | |
| | | | | | | | |
Net asset value, beginning of period | | | $ 9.80 | | | | $ 10.00 | |
| | | | |
Income From Investment Operations | | | | | | | | |
Net investment income(b)(c) | | | .27 | | | | .21 | |
Net realized and unrealized gain (loss) on investment and foreign currency transactions | | | 1.08 | | | | (.28 | ) |
| | | | |
Net increase (decrease) in net asset value from operations | | | 1.35 | | | | (.07 | ) |
| | | | |
Less: Dividends | | | | | | | | |
Dividends from net investment income | | | (.09 | ) | | | (.13 | ) |
| | | | |
Net asset value, end of period | | | $ 11.06 | | | | $ 9.80 | |
| | | | |
Total Return | | | | | | | | |
Total investment return based on net asset value(d) | | | 13.98 | % | | | (.63 | )% |
Ratios/Supplemental Data | | | | | | | | |
Net assets, end of period (000’s omitted) | | | $35,275 | | | | $2,932 | |
Ratio to average net assets of: | | | | | | | | |
Expenses, net of waivers/reimbursements(e) | | | .94 | % | | | .95 | %(f) |
Expenses, before waivers/reimbursements(e) | | | 4.37 | % | | | 14.60 | %(f) |
Net investment income(c) | | | 2.60 | % | | | 2.32 | %(f) |
Portfolio turnover rate | | | 64 | % | | | 52 | % |
| (a) | Commencement of operations. |
| (b) | Based on average shares outstanding. |
| (c) | Net of expenses waived/reimbursed by the Adviser. |
| (d) | Total investment return is calculated assuming an initial investment made at the net asset value at the beginning of the period, reinvestment of all dividends and distributions at net asset value during the period, and redemption on the last day of the period. Initial sales charge or contingent deferred sales charge is not reflected in the calculation of total investment return. Total investment return does not reflect the deduction of taxes that a shareholder would pay on fund distributions or the redemption of fund shares. Total investment return for a period of less than one year is not annualized. |
| (e) | In connection with the Fund’s investments in affiliated underlying portfolios, the Fund incurs no direct expenses but bears proportionate shares of the acquired fund fees and expenses (i.e. operating, administrative and investment advisory fees) of the affiliated underlying portfolios. The Adviser has contractually agreed to waive its fees from the Fund in an amount equal to the Fund’s pro rata share of certain acquired fund fees and expenses, and for the year ended June 30, 2017, such waiver amounted to 0.01% for the Fund. |
See notes to financial statements.
| | |
| 42 | AB INTERNATIONAL STRATEGIC CORE PORTFOLIO | | abfunds.com |
REPORT OF INDEPENDENT REGISTERED
PUBLIC ACCOUNTING FIRM
To the Board of Directors and the Shareholders of AB International Strategic Core Portfolio
We have audited the accompanying statement of assets and liabilities, including the portfolio of investments, of AB International Strategic Core Portfolio (the “Fund”), one of the funds constituting the AB Cap Fund, Inc., as of June 30, 2017, and the related statement of operations for the year then ended, and the statements of changes in net assets and the financial highlights for the year then ended and the period July 29, 2015 (commencement of operations) to June 30, 2016. These financial statements and financial highlights are the responsibility of the Fund’s management. Our responsibility is to express an opinion on these financial statements and financial highlights based on our audits.
We conducted our audits in accordance with the standards of the Public Company Accounting Oversight Board (United States). Those standards require that we plan and perform the audit to obtain reasonable assurance about whether the financial statements and financial highlights are free of material misstatement. We were not engaged to perform an audit of the Fund’s internal control over financial reporting. Our audits included consideration of internal control over financial reporting as a basis for designing audit procedures that are appropriate in the circumstances, but not for the purpose of expressing an opinion on the effectiveness of the Fund’s internal control over financial reporting. Accordingly, we express no such opinion. An audit also includes examining, on a test basis, evidence supporting the amounts and disclosures in the financial statements and financial highlights, assessing the accounting principles used and significant estimates made by management, and evaluating the overall financial statement presentation. Our procedures included confirmation of securities owned as of June 30, 2017 by correspondence with the custodian and others or by other appropriate auditing procedures where replies from others were not received. We believe that our audits provide a reasonable basis for our opinion.
In our opinion, the financial statements and financial highlights referred to above present fairly, in all material respects, the financial position of AB International Strategic Core Portfolio, one of the portfolios constituting the AB Cap Fund, Inc., at June 30, 2017, the results of its operations for the year then ended, and the changes in its net assets and the financial highlights for the year then ended and the period July 29 2015 (commencement of operations) to June 30, 2016, in conformity with U.S. generally accepted accounting principles.

New York, New York
August 25, 2017
| | |
| abfunds.com | | AB INTERNATIONAL STRATEGIC CORE PORTFOLIO | 43 |
2017 FEDERAL TAX INFORMATION
(unaudited)
For Federal income tax purposes, the following information is furnished with respect to the earnings of the Fund for the taxable period ended June 30, 2017.
For corporate shareholders, .16% of dividends paid qualify for the dividends received deduction. For individual shareholders, the Fund designates 77.70% of dividends paid as qualified dividend income.
The Fund intends to make an election to pass through foreign taxes to its shareholders. For the taxable period ended June 30, 2017, $44,951 of foreign taxes may be passed through and the associated foreign source income for information reporting purposes is $537,809.
Shareholders should not use the above information to prepare their income tax returns. The information necessary to complete your income tax returns will be included with your Form 1099-DIV which will be sent to you separately in January 2018.
| | |
| 44 | AB INTERNATIONAL STRATEGIC CORE PORTFOLIO | | abfunds.com |
BOARD OF DIRECTORS
| | |
Marshall C. Turner, Jr.(1), Chairman John H. Dobkin(1) Michael J. Downey(1) William H. Foulk, Jr.(1) D. James Guzy(1) | | Nancy P. Jacklin(1) Robert M. Keith, President and Chief Executive Officer Carol C. McMullen(1) Garry L. Moody(1) Earl D. Weiner(1) |
OFFICERS
| | |
Philip L. Kirstein, Senior Vice President and Independent Compliance Officer Kent W. Hargis(2), Vice President Sammy Suzuki(2), Vice President Emilie D. Wrapp, Secretary | | Phyllis J. Clarke, Controller Vincent S. Noto, Chief Compliance Officer Joseph J. Mantineo, Treasurer and Chief Financial Officer |
| | |
Custodian and Accounting Agent Brown Brothers Harriman & Co. 50 Post Office Square Boston, MA 02110 Principal Underwriter AllianceBernstein Investments, Inc. 1345 Avenue of the Americas New York, NY 10105 Transfer Agent AllianceBernstein Investor Services, Inc. P.O. Box 786003 San Antonio, TX 78278-6003 Toll-Free (800) 221-5672 | | Independent Registered Public Accounting Firm Ernst & Young LLP 5 Times Square New York, NY 10036 Legal Counsel Seward & Kissel LLP One Battery Park Plaza New York, NY 10004 |
| 1 | Member of the Audit Committee, the Governance and Nominating Committee and the Independent Directors Committee. |
| 2 | The day-to-day management of, and investment decisions for, the Fund are made by its senior management team. Messrs. Hargis and Suzuki are the investment professionals with the most significant responsibility for the day-to-day management of the Fund’s portfolio. |
| | |
| abfunds.com | | AB INTERNATIONAL STRATEGIC CORE PORTFOLIO | 45 |
MANAGEMENT OF THE FUND
| | | | | | | | |
NAME, ADDRESS*, AGE, (YEAR FIRST ELECTED**) | | PRINCIPAL OCCUPATION(S) DURING PAST FIVE YEARS AND OTHER
INFORMATION*** | | PORTFOLIOS IN FUND COMPLEX OVERSEEN BY DIRECTOR | | | OTHER PUBLIC COMPANY DIRECTORSHIPS CURRENTLY HELD BY DIRECTOR |
| INTERESTED DIRECTOR | | | | | | | | |
Robert M. Keith, #
1345 Avenue of the Americas
New York, NY 10105
57
(2015) | | Senior Vice President of AllianceBernstein L.P. (the “Adviser”) and the head of AllianceBernstein Investments, Inc. (“ABI”) since July 2008; Director of ABI and President of the AB Mutual Funds. Previously, he served as Executive Managing Director of ABI from December 2006 to June 2008. Prior to joining ABI in 2006, Executive Managing Director of Bernstein Global Wealth Management, and prior thereto, Senior Managing Director and Global Head of Client Service and Sales of the Adviser’s institutional investment management business since 2004. Prior thereto, he was Managing Director and Head of North American Client Service and Sales in the Adviser’s institutional investment management business, with which he had been associated since prior to 2004. | | | 97 | | | None |
| | |
| 46 | AB INTERNATIONAL STRATEGIC CORE PORTFOLIO | | abfunds.com |
MANAGEMENT OF THE FUND (continued)
| | | | | | | | |
NAME, ADDRESS*, AGE, (YEAR FIRST ELECTED**) | | PRINCIPAL OCCUPATION(S) DURING PAST FIVE YEARS AND OTHER
INFORMATION*** | | PORTFOLIOS IN FUND COMPLEX OVERSEEN BY DIRECTOR | | | OTHER PUBLIC COMPANY DIRECTORSHIPS CURRENTLY HELD BY DIRECTOR |
| DISINTERESTED DIRECTORS | | | | | | |
Marshall C. Turner, Jr., ## Chairman of the Board 75 (2015) | | Private Investor since prior to 2012. Former Chairman and CEO of Dupont Photomasks, Inc. (components of semi- conductor manufacturing). He has extensive operating leadership and venture capital investing experience, including five interim or full-time CEO roles, and prior service as general partner of institutional venture capital partnerships. He also has extensive non-profit board leadership experience, and currently serves on the boards of two education and science-related non-profit organizations. He has served as a director of one AB Fund since 1992, and director or trustee of multiple AB Funds since 2005. He has been Chairman of the AB Funds since January 2014, and the Chairman of the Independent Directors Committees of such AB Funds since February 2014. | | | 97 | | | Xilinx, Inc. (programmable logic semi-conductors) since 2007 |
| | | | | | | | |
John H. Dobkin, ## 75 (2015) | | Independent Consultant since prior to 2012. Formerly, President of Save Venice, Inc. (preservation organization) from 2001-2002; Senior Advisor from June 1999-June 2000 and President of Historic Hudson Valley (historic preservation) from December 1989-May 1999. Previously, Director of the National Academy of Design. He has served as a director or trustee of various AB Funds since 1992, and as Chairman of the Audit Committees of a number of such AB Funds from 2001-2008. | | | 96 | | | None |
| | |
| abfunds.com | | AB INTERNATIONAL STRATEGIC CORE PORTFOLIO | 47 |
MANAGEMENT OF THE FUND (continued)
| | | | | | | | |
NAME, ADDRESS*, AGE, (YEAR FIRST ELECTED**) | | PRINCIPAL OCCUPATION(S) DURING PAST FIVE YEARS AND OTHER INFORMATION*** | | PORTFOLIOS IN FUND COMPLEX OVERSEEN BY DIRECTOR | | | OTHER PUBLIC COMPANY DIRECTORSHIPS CURRENTLY HELD BY DIRECTOR |
DISINTERESTED DIRECTORS
(continued) | | | | | | |
Michael J. Downey, ## 73 (2015) | | Private Investor since prior to 2012. Formerly, managing partner of Lexington Capital, LLC (investment advisory firm) from December 1997 until December 2003. He served as a Director of Prospect Acquisition Corp. (financial services) from 2007 until 2009. From 1987 until 1993, Chairman and CEO of Prudential Mutual Fund Management, director of the Prudential mutual funds, and member of the Executive Committee of Prudential Securities Inc. He has served as a director or trustee of the AB Funds since 2005 and is a director and Chairman of one other registered investment company. | | | 97 | | | The Asia Pacific Fund, Inc. (registered investment company) since prior to 2012 |
| | | | | | | | |
William H. Foulk, Jr., ## 84 (2015) | | Investment Adviser and an Independent Consultant since prior to 2012. Previously, he was Senior Manager of Barrett Associates, Inc., a registered investment adviser. He was formerly Deputy Comptroller and Chief Investment Officer of the State of New York and, prior thereto, Chief Investment Officer of the New York Bank for Savings. He has served as a director or trustee of various AB Funds since 1983, and was Chairman of the Independent Directors Committees of the AB Funds from 2003 until early February 2014. He served as Chairman of such AB Funds from 2003 through December 2013. He is also active in a number of mutual fund related organizations and committees. | | | 97 | | | None |
| | |
| 48 | AB INTERNATIONAL STRATEGIC CORE PORTFOLIO | | abfunds.com |
MANAGEMENT OF THE FUND (continued)
| | | | | | | | |
NAME, ADDRESS*, AGE, (YEAR FIRST ELECTED**) | | PRINCIPAL OCCUPATION(S) DURING PAST FIVE YEARS AND OTHER INFORMATION*** | | PORTFOLIOS IN FUND COMPLEX OVERSEEN BY DIRECTOR | | | OTHER PUBLIC COMPANY DIRECTORSHIPS CURRENTLY HELD BY DIRECTOR |
DISINTERESTED DIRECTORS
(continued) | | | | | | |
D. James Guzy, ## 81
(2015) | | Chairman of the Board of SRC Computers, Inc. (semi-conductors), with which he has been associated since prior to 2012. He served as Chairman of the Board of PLX Technology (semi-conductors) since prior to 2012 until November 2013. He was a director of Intel Corporation (semi-conductors) from 1969 until 2008, and served as Chairman of the Finance Committee of such company for several years until May 2008. He has served as a director or trustee of one or more of the AB Funds since 1982. | | | 94 | | | None |
| | | | | | | | |
Nancy P. Jacklin, ## 69 (2015) | | Private Investor since prior to 2012. Professorial Lecturer at the Johns Hopkins School of Advanced International Studies (2008-2015). U.S. Executive Director of the International Monetary Fund (which is responsible for ensuring the stability of the international monetary system), (December 2002-May 2006); Partner, Clifford Chance (1992-2002); Sector Counsel, International Banking and Finance, and Associate General Counsel, Citicorp (1985-1992); Assistant General Counsel (International), Federal Reserve Board of Governors (1982-1985); and Attorney Advisor, U.S. Department of the Treasury (1973-1982). Member of the Bar of the District of Columbia and of New York; and member of the Council on Foreign Relations. She has served as a director or trustee of the AB Funds since 2006 and has been Chairman of the Governance and Nominating Committees of the AB Funds since August 2014. | | | 97 | | | None |
| | |
| abfunds.com | | AB INTERNATIONAL STRATEGIC CORE PORTFOLIO | 49 |
MANAGEMENT OF THE FUND (continued)
| | | | | | | | |
NAME, ADDRESS*, AGE, (YEAR FIRST ELECTED**) | | PRINCIPAL OCCUPATION(S) DURING PAST FIVE YEARS AND OTHER INFORMATION*** | | PORTFOLIOS IN FUND COMPLEX OVERSEEN BY DIRECTOR | | | OTHER PUBLIC COMPANY DIRECTORSHIPS CURRENTLY HELD BY DIRECTOR |
DISINTERESTED DIRECTORS
(continued) | | | | | | |
Carol C. McMullen, ## 62 (2016) | | Managing Director of Slalom Consulting (consulting) since 2014, private investor and member of the Partners Healthcare Investment Committee. Formerly, Director of Norfolk & Dedham Group (mutual property and casualty insurance) from 2011 until November 2016; Director of Partners Community Physicians Organization (healthcare) from 2014 until December 2016; and Managing Director of The Crossland Group (consulting) from 2012 until 2013. She has held a number of senior positions in the asset and wealth management industries, including at Eastern Bank (where her roles included President of Eastern Wealth Management), Thomson Financial (Global Head of Sales for Investment Management), and Putnam Investments (where her roles included Head of Global Investment Research). She has served on a number of private company and nonprofit boards, and as a director or trustee of the AB Funds since June 2016. | | | 97 | | | None |
| | |
| 50 | AB INTERNATIONAL STRATEGIC CORE PORTFOLIO | | abfunds.com |
MANAGEMENT OF THE FUND (continued)
| | | | | | | | |
NAME, ADDRESS*, AGE, (YEAR FIRST ELECTED**) | | PRINCIPAL OCCUPATION(S) DURING PAST FIVE YEARS AND OTHER INFORMATION*** | | PORTFOLIOS IN FUND COMPLEX OVERSEEN BY DIRECTOR | | | OTHER PUBLIC COMPANY DIRECTORSHIPS CURRENTLY HELD BY DIRECTOR |
DISINTERESTED DIRECTORS
(continued) | | | | | | |
Garry L. Moody, ## 65 (2015) | | Independent Consultant. Formerly, Partner, Deloitte & Touche LLP (1995-2008) where he held a number of senior positions, including Vice Chairman, and U.S. and Global Investment Management Practice Managing Partner; President, Fidelity Accounting and Custody Services Company (1993-1995), where he was responsible for the accounting, pricing, custody and reporting for the Fidelity mutual funds; and Partner, Ernst & Young LLP (1975-1993), where he served as the National Director of Mutual Fund Tax Services and Managing Partner of its Chicago Office Tax department. He is a member of the Trustee Advisory Board of BoardIQ, a biweekly publication focused on issues and news affecting directors of mutual funds. He has served as a director or trustee and as Chairman of the Audit Committees of the AB Funds since 2008. | | | 97 | | | None |
| | | | | | | | |
Earl D. Weiner, ## 78 (2015) | | Of Counsel, and Partner prior to January 2007, of the law firm Sullivan & Cromwell LLP and is a former member of the ABA Federal Regulation of Securities Committee Task Force to draft editions of the Fund Director’s Guidebook. He also serves as a director or trustee of various non-profit organizations and has served as Chairman or Vice Chairman of a number of them. He has served as a director or trustee of the AB Funds since 2007 and served as Chairman of the Governance and Nominating Committees of the AB Funds from 2007 until August 2014. | | | 97 | | | None |
| | |
| abfunds.com | | AB INTERNATIONAL STRATEGIC CORE PORTFOLIO | 51 |
MANAGEMENT OF THE FUND (continued)
| * | The address for each of the Fund’s disinterested Directors is c/o AllianceBernstein L.P., Attention: Philip L. Kirstein, 1345 Avenue of the Americas, New York, NY 10105. |
| ** | There is no stated term of office for the Fund’s Directors. |
| *** | The information above includes each Director’s principal occupation during the last five years and other information relating to the experience, attributes, and skills relevant to each Director’s qualifications to serve as a Director, which led to the conclusion that each Director should serve as a Director for the Fund. |
| # | Mr. Keith is an “interested person” of the Fund, as defined in the 1940 Act, due to his position as a Senior Vice President of the Adviser. |
| ## | Member of the Audit Committee, the Governance and Nominating Committee and the Independent Directors Committee. |
| | |
| 52 | AB INTERNATIONAL STRATEGIC CORE PORTFOLIO | | abfunds.com |
MANAGEMENT OF THE FUND (continued)
Officer Information
| | | | |
Robert M. Keith 57 | | President and Chief Executive Officer | | See biography above. |
| | | | |
Philip L. Kirstein 72 | | Senior Vice President and Independent Compliance Officer | | Senior Vice President and Independent Compliance Officer of the AB Funds, with which he has been associated since October 2004. Prior thereto, he was Of Counsel to Kirkpatrick & Lockhart, LLP from October 2003 to October 2004, and General Counsel of Merrill Lynch Investment Managers, L.P., since prior to March 2003. |
| | | | |
Kent W. Hargis 48 | | Vice President | | Senior Vice President of the Adviser**, with which he has been associated since prior to 2012. |
| | | | |
Sammy Suzuki 46 | | Vice President | | Senior Vice President of the Adviser**, with which he has been associated since prior to 2012. |
| | | | |
Emilie D. Wrapp 61 | | Secretary | | Senior Vice President, Assistant General Counsel and Assistant Secretary of ABI**, with which she has been associated since prior to 2012. |
| | | | |
Joseph J. Mantineo 58 | | Treasurer and Chief Financial Officer | | Senior Vice President of AllianceBernstein Investor Services (“ABIS”)**, with which he has been associated since prior to 2012. |
| | | | |
Phyllis J. Clarke 56 | | Controller | | Vice President of ABIS**, with which she has been associated since prior to 2012. |
| | | | |
Vincent S. Noto 52 | | Chief Compliance Officer | | Senior Vice President since 2015 and Mutual Fund Chief Compliance Officer since 2014. Prior thereto, he was Vice President and Director of Mutual Fund Compliance of the Adviser** since prior to 2012. |
| * | The address for each of the Fund’s Officers is 1345 Avenue of the Americas, New York, NY 10105. |
| ** | The Adviser, ABI and ABIS are affiliates of the Fund. |
| | The Fund’s Statement of Additional Information (“SAl”) has additional information about the Fund’s Directors and Officers and is available without charge upon request. Contact your financial representative or AB at 1-(800) 227-4618, or visit www.abfunds.com, for a free prospectus or SAI. |
| | |
| abfunds.com | | AB INTERNATIONAL STRATEGIC CORE PORTFOLIO | 53 |
Information Regarding the Review and Approval of the Fund’s Advisory Agreement
The disinterested directors (the “directors”) of AB Cap Fund, Inc. (the “Company”) unanimously approved the continuance of the Company’s Advisory Agreement with the Adviser in respect of AB International Strategic Core Portfolio (the “Fund”) at a meeting held on May 2-4, 2017 (the “Meeting”).
Prior to approval of the continuance of the Advisory Agreement, the directors had requested from the Adviser, and received and evaluated, extensive materials. They reviewed the proposed continuance of the Advisory Agreement with the Adviser and with experienced counsel who are independent of the Adviser, who advised on the relevant legal standards. The directors also reviewed an independent evaluation prepared by the Company’s Senior Officer (who is also the Company’s Independent Compliance Officer), who acted as their independent fee consultant, of the reasonableness of the advisory fee, in which the Senior Officer concluded that the contractual fee for the Fund was reasonable. The directors also discussed the proposed continuance in private sessions with counsel and the Company’s Senior Officer.
The directors considered their knowledge of the nature and quality of the services provided by the Adviser to the Fund gained from their experience as directors or trustees of most of the registered investment companies advised by the Adviser, their overall confidence in the Adviser’s integrity and competence they have gained from that experience, the Adviser’s initiative in identifying and raising potential issues with the directors and its responsiveness, frankness and attention to concerns raised by the directors in the past, including the Adviser’s willingness to consider and implement organizational and operational changes designed to improve investment results and the services provided to the AB Funds. The directors noted that they have four regular meetings each year, at each of which they review extensive materials and information from the Adviser, including information on the investment performance of the Fund.
The directors also considered all factors they believed relevant, including the specific matters discussed below. During the course of their deliberations, the directors evaluated, among other things, the reasonableness of the advisory fee. The directors did not identify any particular information that was all-important or controlling, and different directors may have attributed different weights to the various factors. The directors determined that the selection of the Adviser to manage the Fund and the overall arrangements between the Fund and the Adviser, as provided in the Advisory Agreement, including the advisory fee, were fair and reasonable in light of the services performed, expenses incurred and such other matters as the directors considered relevant in the exercise of their business
| | |
| 54 | AB INTERNATIONAL STRATEGIC CORE PORTFOLIO | | abfunds.com |
judgment. The material factors and conclusions that formed the basis for the directors’ determinations included the following:
Nature, Extent and Quality of Services Provided
The directors considered the scope and quality of services provided by the Adviser under the Advisory Agreement, including the quality of the investment research capabilities of the Adviser and the other resources it has dedicated to performing services for the Fund. They also noted the professional experience and qualifications of the Fund’s portfolio management team and other senior personnel of the Adviser. The directors also considered that the Advisory Agreement provides that the Fund will reimburse the Adviser for the cost to it of providing certain clerical, accounting, administrative and other services to the Fund by employees of the Adviser or its affiliates. Requests for these reimbursements are made on a quarterly basis and subject to approval by the directors. Reimbursements, to the extent requested and paid, result in a higher rate of total compensation from the Fund to the Adviser than the fee rate stated in the Advisory Agreement. The directors noted that the methodology used to determine the reimbursement amounts had been reviewed by an independent consultant retained by the Company’s Senior Officer. The quality of administrative and other services, including the Adviser’s role in coordinating the activities of the Fund’s other service providers, also was considered. The directors concluded that, overall, they were satisfied with the nature, extent and quality of services provided to the Fund under the Advisory Agreement.
Costs of Services Provided and Profitability
The directors reviewed a schedule of the revenues and expenses and related notes indicating the profitability of the Fund to the Adviser for the period ended December 31, 2015 and calendar year 2016 that had been prepared with an expense allocation methodology arrived at in consultation with an independent consultant retained by the Company’s Senior Officer. The directors noted the assumptions and methods of allocation used by the Adviser in preparing fund-specific profitability data and understood that there are a number of potentially acceptable allocation methodologies for information of this type. The directors noted that the profitability information reflected all revenues and expenses of the Adviser’s relationship with the Fund, including those relating to its subsidiaries that provide transfer agency, distribution and brokerage services to the Fund. The directors recognized that it is difficult to make comparisons of the profitability of the Advisory Agreement with the profitability of advisory contracts for unaffiliated funds because comparative information is not generally publicly available and is affected by numerous factors. The directors focused on the profitability of the Adviser’s relationship with the Fund before taxes and distribution expenses. The directors noted that the Fund was not profitable to the Adviser in the periods reviewed.
| | |
| abfunds.com | | AB INTERNATIONAL STRATEGIC CORE PORTFOLIO | 55 |
Fall-Out Benefits
The directors considered the other benefits to the Adviser and its affiliates from their relationships with the Fund, including, but not limited to, benefits relating to soft dollar arrangements (whereby investment advisers receive brokerage and research services from brokers that execute agency transactions for their clients); 12b-1 fees and sales charges received by the Fund’s principal underwriter (which is a wholly owned subsidiary of the Adviser) in respect of certain classes of the Fund’s shares; brokerage commissions paid by the Fund to brokers affiliated with the Adviser; and transfer agency fees paid by the Fund to a wholly owned subsidiary of the Adviser. The directors recognized that the Fund’s unprofitability to the Adviser would be exacerbated without these benefits. The directors understood that the Adviser also might derive reputational and other benefits from its association with the Fund.
Investment Results
In addition to the information reviewed by the directors in connection with the Meeting, the directors receive detailed performance information for the Fund at each regular Board meeting during the year.
At the Meeting, the directors reviewed information prepared by an analytical service that is not affiliated with the Adviser (the “15(c) service provider”), showing the performance of the Class A Shares of the Fund against a peer group and a peer universe, and information prepared by the Adviser showing performance of the Class A Shares against a broad-based securities market index, in each case for the 1-year period ended February 28, 2017 and (in the case of comparisons with the broad-based securities market index) for the period from inception. Based on their review, the directors concluded that the Fund’s investment performance was acceptable.
Advisory Fees and Other Expenses
The directors considered the advisory fee rate paid by the Fund to the Adviser and information prepared by the 15(c) service provider concerning advisory fee rates paid by other funds in the same category as the Fund at a common asset level. The directors recognized that it is difficult to make comparisons of advisory fees because there are variations in the services that are included in the fees paid by other funds. The directors compared the Fund’s contractual effective advisory fee rate with a peer group median and took into account the impact on the advisory fee rate of the administrative expense reimbursement paid to the Adviser in the latest fiscal year.
The directors also considered the Adviser’s fee schedule for institutional clients pursuing a similar investment style. For this purpose, they reviewed the relevant advisory fee information from the Adviser’s Form ADV and the evaluation from the Company’s Senior Officer and noted the differences
| | |
| 56 | AB INTERNATIONAL STRATEGIC CORE PORTFOLIO | | abfunds.com |
between the Fund’s fee schedule, on the one hand, and the institutional fee schedule and the schedule of fees charged to any offshore funds and any sub-advised funds, on the other. The directors noted that the Adviser may, in some cases, agree to fee rates with large institutional clients that are lower than those reviewed by the directors and that they had previously discussed with the Adviser its policies in respect of such arrangements.
The Adviser reviewed with the directors the significantly greater scope of the services it provides to the Fund relative to institutional, offshore fund and sub-advised fund clients. In light of the substantial differences in services rendered by the Adviser to institutional, offshore fund and sub-advised fund clients as compared to funds such as the Fund, the directors considered these fee comparisons inapt and did not place significant weight on them in their deliberations.
The directors noted that the Fund may invest in shares of exchange-traded funds (“ETFs”), subject to the restrictions and limitations of the Investment Company Act of 1940 as these may be varied as a result of exemptive orders issued by the SEC. The directors also noted that ETFs pay advisory fees pursuant to their advisory contracts. The directors concluded, based on the Adviser’s explanation of how it may use ETFs when they are the most cost-effective way to obtain desired exposures for a fund or to temporarily “equitize” cash inflows pending purchases of underlying securities, that the advisory fee for the Fund would be paid for services that would be in addition to, rather than duplicative of, the services provided under the advisory contracts of the ETFs.
The directors also considered the total expense ratio of the Class A shares of the Fund in comparison to a peer group and a peer universe selected by the 15(c) service provider. The Class A expense ratio of the Fund was based on the Fund’s latest fiscal year and the directors considered the effects of any fee waivers and/or expense reimbursements as a result of the Adviser’s expense cap. The directors noted that it was likely that the expense ratios of some of the other funds in the Fund’s category were lowered by waivers or reimbursements by those funds’ investment advisers, which in some cases might be voluntary or temporary. The directors view expense ratio information as relevant to their evaluation of the Adviser’s services because the Adviser is responsible for coordinating services provided to the Fund by others. Based on their review, the directors concluded that the Fund’s expense ratio was acceptable.
Economies of Scale
The directors noted that the advisory fee schedule for the Fund contains breakpoints that reduce the fee rates on assets above specified levels. The directors took into consideration prior presentations by an independent consultant on economies of scale in the mutual fund industry and for the
| | |
| abfunds.com | | AB INTERNATIONAL STRATEGIC CORE PORTFOLIO | 57 |
AB Funds, and by the Adviser concerning certain of its views on economies of scale. The directors also had requested and received from the Adviser certain updates on economies of scale in advance of the Meeting. The directors believe that economies of scale may be realized (if at all) by the Adviser across a variety of products and services, and not only in respect of a single fund. The directors noted that there is no established methodology for setting breakpoints that give effect to the fund-specific services provided by a fund’s adviser and to the economies of scale that an adviser may realize in its overall mutual fund business or those components of it which directly or indirectly affect a fund’s operations. The directors observed that in the mutual fund industry as a whole, as well as among funds similar to the Fund, there is no uniformity or pattern in the fees and asset levels at which breakpoints (if any) apply. The directors also noted that the advisory agreements for many funds do not have breakpoints at all. Having taken these factors into account, the directors concluded that the Fund’s shareholders would benefit from a sharing of economies of scale in the event the Fund’s net assets exceed a breakpoint in the future.
| | |
| 58 | AB INTERNATIONAL STRATEGIC CORE PORTFOLIO | | abfunds.com |
This page is not part of the Shareholder Report or the Financial Statements.
AB FAMILY OF FUNDS
US EQUITY
US CORE
Core Opportunities Fund
Select US Equity Portfolio
US GROWTH
Concentrated Growth Fund
Discovery Growth Fund
Growth Fund
Large Cap Growth Fund
Small Cap Growth Portfolio
US VALUE
Discovery Value Fund
Equity Income Fund
Relative Value Fund1
Small Cap Value Portfolio
Value Fund
INTERNATIONAL/ GLOBAL EQUITY
INTERNATIONAL/ GLOBAL CORE
Global Core Equity Portfolio
International Portfolio
International Strategic Core Portfolio
Sustainable Global Thematic Fund1
Tax-Managed International Portfolio
Tax-Managed Wealth Appreciation Strategy
Wealth Appreciation Strategy
INTERNATIONAL/ GLOBAL GROWTH
Concentrated International Growth Portfolio
International Growth Fund
INTERNATIONAL/ GLOBAL EQUITY (continued)
INTERNATIONAL/ GLOBAL VALUE
Asia ex-Japan Equity Portfolio
International Value Fund
FIXED INCOME
MUNICIPAL
High Income Municipal Portfolio
Intermediate California Municipal Portfolio
Intermediate Diversified Municipal Portfolio
Intermediate New York Municipal Portfolio
Municipal Bond Inflation Strategy
Tax-Aware Fixed Income Portfolio
National Portfolio
Arizona Portfolio
California Portfolio
Massachusetts Portfolio
Minnesota Portfolio
New Jersey Portfolio
New York Portfolio
Ohio Portfolio
Pennsylvania Portfolio
Virginia Portfolio
TAXABLE
Bond Inflation Strategy
Global Bond Fund
High Income Fund
High Yield Portfolio
Income Fund
Intermediate Bond Portfolio
Limited Duration High Income Portfolio
Short Duration Portfolio
ALTERNATIVES
All Market Real Return Portfolio
Credit Long/Short Portfolio
Global Real Estate Investment Fund
Select US Long/Short Portfolio
Unconstrained Bond Fund
MULTI-ASSET
All Market Income Portfolio
All Market Total Return Portfolio1
Conservative Wealth Strategy
Emerging Markets Multi-Asset Portfolio
Global Risk Allocation Fund
Tax-Managed All Market Income Portfolio1
TARGET-DATE
Multi-Manager Select Retirement Allocation Fund
Multi-Manager Select 2010 Fund
Multi-Manager Select 2015 Fund
Multi-Manager Select 2020 Fund
Multi-Manager Select 2025 Fund
Multi-Manager Select 2030 Fund
Multi-Manager Select 2035 Fund
Multi-Manager Select 2040 Fund
Multi-Manager Select 2045 Fund
Multi-Manager Select 2050 Fund
Multi-Manager Select 2055 Fund
CLOSED-END FUNDS
Alliance California Municipal Income Fund
AllianceBernstein Global High Income Fund
AllianceBernstein National Municipal Income Fund
We also offer Government Exchange Reserves, which serves as the money market fund exchange vehicle for the AB mutual funds. An investment in Government Exchange Reserves is not a deposit in a bank and is not insured or guaranteed by the Federal Deposit Insurance Corporation or any other government agency. Although the Fund seeks to preserve the value of your investment at $1.00 per share, it is possible to lose money by investing in the Fund.
Investors should consider the investment objectives, risks, charges and expenses of the Fund carefully before investing. For copies of our prospectus or summary prospectus, which contain this and other information, visit us online at www.abfunds.com or contact your AB representative. Please read the prospectus and/or summary prospectus carefully before investing.
| 1 | Prior to November 1, 2016, Sustainable Global Thematic Fund was named Global Thematic Growth Fund; prior to January 9, 2017, Relative Value Fund was named Growth & Income Fund; prior to April 17, 2017, Tax-Managed All Market Income Portfolio was named Tax-Managed Balanced Wealth Strategy; prior to April 24, 2017, All Market Total Return Portfolio was named Balanced Wealth Strategy. |
| | |
| abfunds.com | | AB INTERNATIONAL STRATEGIC CORE PORTFOLIO | 59 |
NOTES
| | |
| 60 | AB INTERNATIONAL STRATEGIC CORE PORTFOLIO | | abfunds.com |

AB INTERNATIONAL STRATEGIC CORE PORTFOLIO
1345 Avenue of the Americas
New York, NY 10105
800 221 5672
ISCP-0151-0617 
JUN 06.30.17
ANNUAL REPORT
AB SELECT US EQUITY PORTFOLIO


| | |
| |
| Investment Products Offered | | • Are Not FDIC Insured • May Lose Value • Are Not Bank Guaranteed |
Investors should consider the investment objectives, risks, charges and expenses of the Fund carefully before investing. For copies of our prospectus or summary prospectus, which contain this and other information, visit us online at www.abfunds.com or contact your AB representative. Please read the prospectus and/or summary prospectus carefully before investing.
This shareholder report must be preceded or accompanied by the Fund’s prospectus for individuals who are not current shareholders of the Fund.
You may obtain a description of the Fund’s proxy voting policies and procedures, and information regarding how the Fund voted proxies relating to portfolio securities during the most recent 12-month period ended June 30, without charge. Simply visit AB’s website at www.abfunds.com, or go to the Securities and Exchange Commission’s (the “Commission”) website at www.sec.gov, or call AB at (800) 227 4618.
The Fund files its complete schedule of portfolio holdings with the Commission for the first and third quarters of each fiscal year on Form N-Q. The Fund’s Forms N-Q are available on the Commission’s website at www.sec.gov. The Fund’s Forms N-Q may also be reviewed and copied at the Commission’s Public Reference Room in Washington, DC; information on the operation of the Public Reference Room may be obtained by calling (800) SEC 0330. AB publishes full portfolio holdings for the Fund monthly at www.abfunds.com.
AllianceBernstein Investments, Inc. (ABI) is the distributor of the AB family of mutual funds. ABI is a member of FINRA and is an affiliate of AllianceBernstein L.P., the Adviser of the funds.
The [A/B] logo is a registered service mark of AllianceBernstein and AllianceBernstein® is a registered service mark used by permission of the owner, AllianceBernstein L.P.
| | |
| FROM THE PRESIDENT | |  |
Dear Shareholder,
We are pleased to provide this report for AB Select US Equity Portfolio (the “Fund”). Please review the discussion of Fund performance, the market conditions during the reporting period and the Fund’s investment strategy.
As always, AB strives to keep clients ahead of what’s next by:
| + | | Transforming uncommon insights into uncommon knowledge with a global research scope |
| + | | Navigating markets with seasoned investment experience and sophisticated solutions |
| + | | Providing thoughtful investment insights and actionable ideas |
Whether you’re an individual investor or a multi-billion-dollar institution, we put knowledge and experience to work for you.
AB’s global research organization connects and collaborates across platforms and teams to deliver impactful insights and innovative products. Better insights lead to better opportunities—anywhere in the world.
For additional information about AB’s range of products and shareholder resources, please log on to www.abfunds.com.
Thank you for your investment in the AB Mutual Funds.
Sincerely,

Robert M. Keith
President and Chief Executive Officer, AB Mutual Funds
| | |
| abfunds.com | | AB SELECT US EQUITY PORTFOLIO | 1 |
ANNUAL REPORT
August 10, 2017
This report provides management’s discussion of fund performance for AB Select US Equity Portfolio for the annual reporting period ended June 30, 2017.
The Fund’s investment objective is long-term growth of capital.
NAV RETURNS AS OF JUNE 30, 2017 (unaudited)
| | | | | | | | |
| | | 6 Months | | | 12 Months | |
| AB SELECT US EQUITY PORTFOLIO | | | | | | | | |
| Class A Shares | | | 8.46% | | | | 16.47% | |
| Class C Shares | | | 8.11% | | | | 15.59% | |
| Advisor Class Shares1 | | | 8.61% | | | | 16.82% | |
| Class R Shares1 | | | 8.28% | | | | 16.14% | |
| Class K Shares1 | | | 8.43% | | | | 16.38% | |
| Class I Shares1 | | | 8.62% | | | | 16.76% | |
| S&P 500 Index | | | 9.34% | | | | 17.90% | |
| 1 | Please note that these share classes are for investors purchasing shares through accounts established under certain fee-based programs sponsored and maintained by certain broker-dealers and financial intermediaries, institutional pension plans and/or investment advisory clients of, and certain other persons associated with, the Adviser and its affiliates or the Fund. |
Please keep in mind that high, double-digit returns are highly unusual and cannot be sustained. Investors should also be aware that these returns were primarily achieved during favorable market conditions.
INVESTMENT RESULTS
The table above shows the Fund’s performance compared to its benchmark, the Standard & Poor’s (“S&P”) 500 Index, for the six- and 12-month periods ended June 30, 2017.
During both periods, all share classes underperformed the benchmark, before sales charges. For the 12-month period, security selection within the consumer staples, industrials, financials and energy sectors detracted relative to the benchmark. An underweight to the technology sector and the Fund’s cash position detracted as well. However, underweights to the telecommunications, energy and consumer staples sectors, as well as overweights to financials and industrials, contributed. Security selection within the consumer discretionary, technology, real estate and utilities sectors also added to returns.
For the six-month period, security selection within the consumer staples and financials sectors detracted, relative to the benchmark. An overweight
| | |
| 2 | AB SELECT US EQUITY PORTFOLIO | | abfunds.com |
to financials, underweight to technology and the Fund’s cash position also detracted. However, security selection within the health care, technology, utilities and real estate sectors contributed, as did underweights to energy and telecommunications.
The Fund utilized derivatives in the form of total return swaps for investment purposes, which had an immaterial impact on absolute returns for both periods.
MARKET REVIEW AND INVESTMENT STRATEGY
At the start of the 12-month period ended June 30, 2017, fears of rising interest rates led defensive stocks to underperform, while cyclical stocks outperformed. Despite a surprising outcome in the November US elections, and an increase in the fed funds rate by the US Federal Reserve (the “Fed”), markets rallied at the end of 2016.
In the six-month period, the S&P 500 continued its push higher. However, enthusiasm waned as investors questioned the Republican Party’s ability to pass pro-growth policies, the Fed raised the fed funds rate again in March, long-term interest rates declined and oil prices faced significant volatility. This confluence of factors led value stocks to underperform, while growth stocks outperformed during the first half of 2017. At the end of the reporting period, the Fed released positive stress test results, leading to strong performance in financial stocks. The S&P 500 Index returned 17.90% in the 12-month period and 9.34% over the six-month period.
INVESTMENT POLICIES
Under normal circumstances, the Fund invests at least 80% of its net assets in equity securities of US companies. For purposes of this requirement, equity securities include common stock, preferred stock and derivatives related to common and preferred stocks.
The Adviser selects investments for the Fund through an intensive “bottom-up” approach that places an emphasis on companies that are engaged in business activities with solid long-term growth potential and operating in industries with high barriers to entry, that have strong cash flows and other financial metrics, and that have transparent financial statements and business models. The Adviser also evaluates the quality of company management based on a series of criteria, including: (1) management’s focus on shareholder returns, such as through a demonstrated commitment to dividends and dividend growth, share buybacks or other shareholder-friendly corporate actions; (2) management’s employment of conservative accounting methodologies; (3) management incentives, such as direct equity ownership; and (4) management accessibility. The Adviser seeks to
(continued on next page)
| | |
| abfunds.com | | AB SELECT US EQUITY PORTFOLIO | 3 |
identify companies where events or catalysts may drive the company’s share price higher, such as earnings and/or revenue growth above consensus forecasts, potential market recognition of undervaluation or overstated market-risk discount, or the institution of shareholder-focused changes discussed in the preceding sentence. In light of this catalyst-focused approach, the Adviser expects to engage in active and frequent trading for the Fund. The Adviser may reduce or eliminate the Fund’s holdings in a company’s securities for a number of reasons, including if its evaluation of the above factors changes adversely, if the anticipated events or catalysts do not occur or do not affect the price of the securities as expected, or if the anticipated events or catalysts do occur and cause the securities to be, in the Adviser’s view, overvalued or fully valued. At any given time the Fund may emphasize growth stocks over value stocks, or vice versa.
The Fund’s investments will be focused on securities of companies with large- and medium-market capitalizations, but it may also invest in securities of small-capitalization companies. The Adviser anticipates that the Fund’s portfolio normally will include between 30-80 companies. The Fund may invest in non-US companies, but will limit its investments in such companies to no more than 10% of its net assets. The Fund may purchase securities in initial public offerings and expects to do so on a regular basis.
| | |
| 4 | AB SELECT US EQUITY PORTFOLIO | | abfunds.com |
DISCLOSURES AND RISKS
Benchmark Disclosure
The S&P® 500 Index is unmanaged and does not reflect fees and expenses associated with the active management of a mutual fund portfolio. The S&P 500 Index includes 500 US stocks and is a common representation of the performance of the overall US stock market. An investor cannot invest directly in an index, and its results are not indicative of the performance for any specific investment, including the Fund.
A Word About Risk
Market Risk: The value of the Fund’s assets will fluctuate as the stock, bond or currency markets fluctuate. The value of the Fund’s investments may decline, sometimes rapidly and unpredictably, simply because of economic changes or other events that affect large portions of the market.
Capitalization Risk: Investments in small- and mid-capitalization companies may be more volatile than investments in large-capitalization companies. Investments in these companies may have additional risks because these companies may have limited product lines, markets or financial resources.
Active Trading Risk: The Fund expects to engage in active and frequent trading of its portfolio securities and its portfolio turnover rate may greatly exceed 100%. A higher rate of portfolio turnover increases transaction costs, which may negatively affect the Fund’s return. In addition, a high rate of portfolio turnover may result in substantial short-term gains, which may have adverse tax consequences for Fund shareholders.
Management Risk: The Fund is subject to management risk because it is an actively managed investment fund. The Adviser will apply its investment techniques and risk analyses in making investment decisions for the Fund, but there is no guarantee that its techniques will produce the intended results.
These risks are fully discussed in the Fund’s prospectus. As with all investments, you may lose money by investing in the Fund.
An Important Note About Historical Performance
The investment return and principal value of an investment in the Fund will fluctuate, so that shares, when redeemed, may be worth more or less than their original cost. Performance shown in this report represents past performance and does not guarantee future results. Current performance may be lower or higher than the performance information shown. You may obtain performance information current to the most recent month-end by visiting www.abfunds.com.
| | |
| abfunds.com | | AB SELECT US EQUITY PORTFOLIO | 5 |
DISCLOSURES AND RISKS (continued)
All fees and expenses related to the operation of the Fund have been deducted. Net asset value (“NAV”) returns do not reflect sales charges; if sales charges were reflected, the Fund’s quoted performance would be lower. SEC returns reflect the applicable sales charges for each share class: a 4.25% maximum front-end sales charge for Class A shares and a 1% 1-year contingent deferred sales charge for Class C shares. Returns for the different share classes will vary due to different expenses associated with each class. Performance assumes reinvestment of distributions and does not account for taxes.
| | |
| 6 | AB SELECT US EQUITY PORTFOLIO | | abfunds.com |
HISTORICAL PERFORMANCE
GROWTH OF A $10,000 INVESTMENT IN THE FUND (unaudited)
12/8/20111 TO 6/30/2017
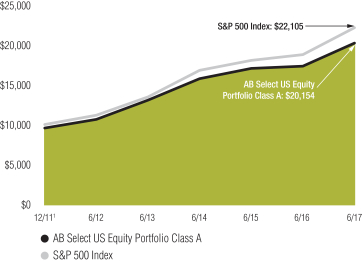
This chart illustrates the total value of an assumed $10,000 investment in AB Select US Equity Portfolio Class A shares (from 12/8/20111 to 6/30/2017) as compared to the performance of the Fund’s benchmark. The chart reflects the deduction of the maximum 4.25% sales charge from the initial $10,000 investment in the Fund and assumes the reinvestment of dividends and capital gains distributions.
| 1 | Inception date: 12/8/2011. |
| | |
| abfunds.com | | AB SELECT US EQUITY PORTFOLIO | 7 |
HISTORICAL PERFORMANCE (continued)
AVERAGE ANNUAL RETURNS AS OF JUNE 30, 2017 (unaudited)
| | | | | | | | |
| | | NAV Returns | | | SEC Returns (reflects applicable
sales charges) | |
| CLASS A SHARES | | | | | | | | |
| 1 Year | | | 16.47% | | | | 11.54% | |
| 5 Years | | | 13.58% | | | | 12.61% | |
| Since Inception1 | | | 14.31% | | | | 13.43% | |
| CLASS C SHARES | | | | | | | | |
| 1 Year | | | 15.59% | | | | 14.59% | |
| 5 Years | | | 12.75% | | | | 12.75% | |
| Since Inception1 | | | 13.48% | | | | 13.48% | |
| ADVISOR CLASS SHARES2 | | | | | | | | |
| 1 Year | | | 16.82% | | | | 16.82% | |
| 5 Years | | | 13.90% | | | | 13.90% | |
| Since Inception1 | | | 14.64% | | | | 14.64% | |
| CLASS R SHARES2 | | | | | | | | |
| 1 Year | | | 16.14% | | | | 16.14% | |
| 5 Years | | | 13.30% | | | | 13.30% | |
| Since Inception1 | | | 14.02% | | | | 14.02% | |
| CLASS K SHARES2 | | | | | | | | |
| 1 Year | | | 16.38% | | | | 16.38% | |
| 5 Years | | | 13.51% | | | | 13.51% | |
| Since Inception1 | | | 14.26% | | | | 14.26% | |
| CLASS I SHARES2 | | | | | | | | |
| 1 Year | | | 16.76% | | | | 16.76% | |
| 5 Years | | | 13.87% | | | | 13.87% | |
| Since Inception1 | | | 14.62% | | | | 14.62% | |
The Fund’s current prospectus fee table shows the Fund’s total annual operating expense ratios as 1.45%, 2.20%, 1.20%, 1.72%, 1.60% and 1.18% for Class A, Class C, Advisor Class, Class R, Class K and Class I shares, respectively, gross of any fee waivers or expense reimbursements. Contractual fee waivers and/or expense reimbursements limit the Fund’s annual operating expense ratios exclusive of acquired fund fees and expenses other than the advisory fees of any AB mutual funds in which the Fund may invest, interest expense, taxes, extraordinary expenses, and brokerage commissions and other transaction costs to 1.55% for Class K shares. These waivers/reimbursements may not be terminated before November 1, 2017. Absent reimbursements or waivers, performance would have been lower. The Financial Highlights section of this report sets forth expense ratio data for the current reporting period; the expense ratios shown above may differ from the expense ratios in the Financial Highlights section since they are based on different time periods.
| 1 | Inception date: 12/8/2011. |
| 2 | These share classes are offered at NAV to eligible investors and their SEC returns are the same as their NAV returns. Please note that these share classes are for investors purchasing shares through accounts established under certain fee-based programs sponsored and maintained by certain broker-dealers and financial intermediaries, institutional pension plans and/or investment advisory clients of, and certain other persons associated with, the Adviser and its affiliates or the Fund. |
| | |
| 8 | AB SELECT US EQUITY PORTFOLIO | | abfunds.com |
HISTORICAL PERFORMANCE (continued)
SEC AVERAGE ANNUAL RETURNS
AS OF THE MOST RECENT CALENDAR QUARTER-END
JUNE 30, 2017 (unaudited)
| | | | |
| | | SEC Returns (reflects applicable
sales charges) | |
| CLASS A SHARES | | | | |
| 1 Year | | | 11.54% | |
| 5 Years | | | 12.61% | |
| Since Inception1 | | | 13.43% | |
| CLASS C SHARES | | | | |
| 1 Year | | | 14.59% | |
| 5 Years | | | 12.75% | |
| Since Inception1 | | | 13.48% | |
| ADVISOR CLASS SHARES2 | | | | |
| 1 Year | | | 16.82% | |
| 5 Years | | | 13.90% | |
| Since Inception1 | | | 14.64% | |
| CLASS R SHARES2 | | | | |
| 1 Year | | | 16.14% | |
| 5 Years | | | 13.30% | |
| Since Inception1 | | | 14.02% | |
| CLASS K SHARES2 | | | | |
| 1 Year | | | 16.38% | |
| 5 Years | | | 13.51% | |
| Since Inception1 | | | 14.26% | |
| CLASS I SHARES2 | | | | |
| 1 Year | | | 16.76% | |
| 5 Years | | | 13.87% | |
| Since Inception1 | | | 14.62% | |
| 1 | Inception date: 12/8/2011. |
| 2 | Please note that these share classes are for investors purchasing shares through accounts established under certain fee-based programs sponsored and maintained by certain broker-dealers and financial intermediaries, institutional pension plans and/or investment advisory clients of, and certain other persons associated with, the Adviser and its affiliates or the Fund. |
| | |
| abfunds.com | | AB SELECT US EQUITY PORTFOLIO | 9 |
EXPENSE EXAMPLE
(unaudited)
As a shareholder of the Fund, you incur two types of costs: (1) transaction costs, including sales charges (loads) on purchase payments, contingent deferred sales charges on redemptions and (2) ongoing costs, including management fees; distribution (12b-1) fees; and other Fund expenses. This example is intended to help you understand your ongoing costs (in dollars) of investing in the Fund and to compare these costs with the ongoing costs of investing in other mutual funds.
The Example is based on an investment of $1,000 invested at the beginning of the period and held for the entire period as indicated below.
Actual Expenses
The table below provides information about actual account values and actual expenses. You may use the information, together with the amount you invested, to estimate the expenses that you paid over the period. Simply divide your account value by $1,000 (for example, an $8,600 account value divided by $1,000 = 8.6), then multiply the result by the number under the heading entitled “Expenses Paid During Period” to estimate the expenses you paid on your account during this period.
Hypothetical Example for Comparison Purposes
The table below also provides information about hypothetical account values and hypothetical expenses based on the Fund’s actual expense ratio and an assumed annual rate of return of 5% before expenses, which is not the Fund’s actual return. The hypothetical account values and expenses may not be used to estimate the actual ending account balance or expenses you paid for the period. You may use this information to compare the ongoing costs of investing in the Fund and other funds by comparing this 5% hypothetical example with the 5% hypothetical examples that appear in the shareholder reports of other funds.
Please note that the expenses shown in the table are meant to highlight your ongoing costs only and do not reflect any transactional costs, such as sales charges (loads), or contingent deferred sales charges on redemptions. Therefore, the hypothetical example is useful in comparing ongoing costs only, and will not help you determine the relative total costs of owning different funds. In addition, if these transactional costs were included, your costs would have been higher.
| | | | | | | | | | | | | | | | | | | | | | | | |
| | | Beginning
Account
Value
1/1/2017 | | | Ending
Account
Value
6/30/2017 | | | Expenses
Paid
During
Period* | | | Annualized
Expense
Ratio* | | | Effective
Expenses
Paid
During
Period+ | | | Effective
Annualized
Expense
Ratio+ | |
| Class A | | | | | | | | | | | | | | | | | | | | | | | | |
Actual | | $ | 1,000 | | | $ | 1,084.60 | | | $ | 7.44 | | | | 1.44 | % | | $ | 7.55 | | | | 1.46 | % |
Hypothetical** | | $ | 1,000 | | | $ | 1,017.65 | | | $ | 7.20 | | | | 1.44 | % | | $ | 7.30 | | | | 1.46 | % |
| | |
| 10 | AB SELECT US EQUITY PORTFOLIO | | abfunds.com |
EXPENSE EXAMPLE (continued)
| | | | | | | | | | | | | | | | | | | | | | | | |
| | | Beginning
Account
Value
1/1/2017 | | | Ending
Account
Value
6/30/2017 | | | Expenses
Paid
During
Period* | | | Annualized
Expense
Ratio* | | | Effective
Expenses
Paid
During
Period+ | | | Effective
Annualized
Expense
Ratio+ | |
| Class C | | | | | | | | | | | | | | | | | | | | | | | | |
Actual | | $ | 1,000 | | | $ | 1,081.10 | | | $ | 11.35 | | | | 2.20 | % | | $ | 11.40 | | | | 2.21 | % |
Hypothetical** | | $ | 1,000 | | | $ | 1,013.88 | | | $ | 10.99 | | | | 2.20 | % | | $ | 11.04 | | | | 2.21 | % |
| Advisor Class | | | | | | | | | | | | | | | | | | | | | | | | |
Actual | | $ | 1,000 | | | $ | 1,086.10 | | | $ | 6.16 | | | | 1.19 | % | | $ | 6.26 | | | | 1.21 | % |
Hypothetical** | | $ | 1,000 | | | $ | 1,018.89 | | | $ | 5.96 | | | | 1.19 | % | | $ | 6.06 | | | | 1.21 | % |
| Class R | | | | | | | | | | | | | | | | | | | | | | | | |
Actual | | $ | 1,000 | | | $ | 1,082.80 | | | $ | 8.93 | | | | 1.73 | % | | $ | 8.99 | | | | 1.74 | % |
Hypothetical** | | $ | 1,000 | | | $ | 1,016.22 | | | $ | 8.65 | | | | 1.73 | % | | $ | 8.70 | | | | 1.74 | % |
| Class K | | | | | | | | | | | | | | | | | | | | | | | | |
Actual | | $ | 1,000 | | | $ | 1,084.30 | | | $ | 8.01 | | | | 1.55 | % | | $ | 8.11 | | | | 1.57 | % |
Hypothetical** | | $ | 1,000 | | | $ | 1,017.11 | | | $ | 7.75 | | | | 1.55 | % | | $ | 7.85 | | | | 1.57 | % |
| Class I | | | | | | | | | | | | | | | | | | | | | | | | |
Actual | | $ | 1,000 | | | $ | 1,086.20 | | | $ | 6.10 | | | | 1.18 | % | | $ | 6.21 | | | | 1.20 | % |
Hypothetical** | | $ | 1,000 | | | $ | 1,018.94 | | | $ | 5.91 | | | | 1.18 | % | | $ | 6.01 | | | | 1.20 | % |
| * | Expenses are equal to the classes’ annualized expense ratios multiplied by the average account value over the period, multiplied by 181/365, (to reflect the one-half year period). |
| ** | Assumes 5% annual return before expenses. |
| + | In connection with the Fund’s investments in affiliated/unaffiliated underlying portfolios, the Fund incurs no direct expenses, but bears proportionate shares of the acquired fund fees and expenses (i.e., operating, administrative and investment advisory fees) of the affiliated/unaffiliated underlying portfolios. Currently the Adviser has contractually agreed to waive its fees from the Fund in an amount equal to the Fund’s pro rata share of certain acquired fund fees and expenses of the affiliated underlying portfolios. The Fund’s effective expenses are equal to the classes’ annualized expense ratio plus the Fund’s pro-rata share of the weighted average expense ratio of the affiliated/unaffiliated underlying portfolios in which it invests, multiplied by the average account value over the period, multiplied by 181/365 (to reflect the one-half year period). |
| | |
| abfunds.com | | AB SELECT US EQUITY PORTFOLIO | 11 |
PORTFOLIO SUMMARY
June 30, 2017 (unaudited)
PORTFOLIO STATISTICS
Net Assets ($mil): $279.8
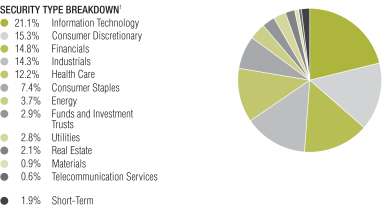
TEN LARGEST HOLDINGS2
| | | | | | | | |
| Security | | U.S. $ Value | | | Percent of
Net Assets | |
| McDonald’s Corp. | | $ | 17,197,264 | | | | 6.1 | % |
| Honeywell International, Inc. | | | 14,181,390 | | | | 5.1 | |
| Northrop Grumman Corp. | | | 13,312,981 | | | | 4.8 | |
| Alphabet, Inc. – Class C | | | 10,032,379 | | | | 3.6 | |
| Johnson & Johnson | | | 9,922,940 | | | | 3.5 | |
| JPMorgan Chase & Co. | | | 9,792,505 | | | | 3.5 | |
| Norfolk Southern Corp. | | | 9,283,397 | | | | 3.3 | |
| Berkshire Hathaway, Inc. – Class B | | | 8,028,815 | | | | 2.9 | |
| NextEra Energy, Inc. | | | 7,625,734 | | | | 2.7 | |
| iShares Nasdaq Biotechnology ETF | | | 7,586,417 | | | | 2.7 | |
| | $ | 106,963,822 | | | | 38.2 | % |
| 1 | All data are as of June 30, 2017. The Fund’s sector breakdown is expressed as a percentage of total investments and may vary over time. |
Please note: The sector classifications presented herein are based on the Global Industry Classification Standard (GICS) which was developed by Morgan Stanley Capital International and Standard & Poor’s. The components are divided into sector, industry group, and industry sub-indices as classified by the GICS for each of the market capitalization indices in the broad market. These sector classifications are broadly defined. The “Portfolio of Investments” section of the report reflects more specific industry information and is consistent with the investment restrictions discussed in the Fund’s prospectus.
| | |
| 12 | AB SELECT US EQUITY PORTFOLIO | | abfunds.com |
PORTFOLIO OF INVESTMENTS
June 30, 2017
| | | | | | | | | | | | |
| Company | | | | | Shares | | | U.S. $ Value | |
| |
| | | | | | | | | | | | |
COMMON STOCKS – 94.1% | | | | | | | | | | | | |
Information Technology – 20.7% | | | | | | | | | | | | |
Communications Equipment – 1.8% | | | | | | | | | | | | |
Cisco Systems, Inc. | | | | | | | 162,404 | | | $ | 5,083,245 | |
| | | | | | | | | | | | |
| | | |
Internet Software & Services – 6.3% | | | | | | | | | | | | |
Alibaba Group Holding Ltd. (Sponsored ADR)(a) | | | | | | | 1,920 | | | | 270,528 | |
Alphabet, Inc. – Class C(a) | | | | | | | 11,040 | | | | 10,032,379 | |
eBay, Inc.(a) | | | | | | | 120,869 | | | | 4,220,745 | |
Facebook, Inc. – Class A(a) | | | | | | | 21,475 | | | | 3,242,296 | |
| | | | | | | | | | | | |
| | | | | | | | | | | 17,765,948 | |
| | | | | | | | | | | | |
IT Services – 3.1% | | | | | | | | | | | | |
Cognizant Technology Solutions Corp. – Class A | | | | | | | 51,251 | | | | 3,403,066 | |
PayPal Holdings, Inc.(a) | | | | | | | 35,811 | | | | 1,921,976 | |
Visa, Inc. – Class A | | | | | | | 34,561 | | | | 3,241,131 | |
| | | | | | | | | | | | |
| | | | | | | | | | | 8,566,173 | |
| | | | | | | | | | | | |
Semiconductors & Semiconductor Equipment – 2.2% | | | | | | | | | | | | |
Broadcom Ltd. | | | | | | | 7,648 | | | | 1,782,366 | |
Intel Corp. | | | | | | | 33,458 | | | | 1,128,873 | |
Micron Technology, Inc.(a) | | | | | | | 50,352 | | | | 1,503,511 | |
Texas Instruments, Inc. | | | | | | | 20,817 | | | | 1,601,452 | |
| | | | | | | | | | | | |
| | | | | | | | | | | 6,016,202 | |
| | | | | | | | | | | | |
Software – 4.6% | | | | | | | | | | | | |
Activision Blizzard, Inc. | | | | | | | 34,199 | | | | 1,968,836 | |
Electronic Arts, Inc.(a) | | | | | | | 7,540 | | | | 797,129 | |
Microsoft Corp. | | | | | | | 93,757 | | | | 6,462,670 | |
Oracle Corp. | | | | | | | 33,788 | | | | 1,694,130 | |
Take-Two Interactive Software, Inc.(a) | | | | | | | 26,849 | | | | 1,970,180 | |
| | | | | | | | | | | | |
| | | | | | | | | | | 12,892,945 | |
| | | | | | | | | | | | |
Technology Hardware, Storage & Peripherals – 2.7% | | | | | | | | | | | | |
Apple, Inc. | | | | | | | 41,724 | | | | 6,009,091 | |
Western Digital Corp. | | | | | | | 17,510 | | | | 1,551,386 | |
| | | | | | | | | | | | |
| | | | | | | | | | | 7,560,477 | |
| | | | | | | | | | | | |
| | | | | | | | | | | 57,884,990 | |
| | | | | | | | | | | | |
Consumer Discretionary – 15.1% | | | | | | | | | | | | |
Hotels, Restaurants & Leisure – 8.9% | | | | | | | | | | | | |
Carnival Corp. | | | | | | | 76,161 | | | | 4,993,877 | |
Hilton Worldwide Holdings, Inc. | | | | | | | 15,649 | | | | 967,891 | |
McDonald’s Corp. | | | | | | | 112,283 | | | | 17,197,264 | |
MGM Resorts International | | | | | | | 52,550 | | | | 1,644,289 | |
| | | | | | | | | | | | |
| | | | | | | | | | | 24,803,321 | |
| | | | | | | | | | | | |
| | |
| abfunds.com | | AB SELECT US EQUITY PORTFOLIO | 13 |
PORTFOLIO OF INVESTMENTS (continued)
| | | | | | | | | | | | |
| Company | | | | | Shares | | | U.S. $ Value | |
| |
| | | | | | | | | | | | |
Household Durables – 0.9% | | | | | | | | | | | | |
Lennar Corp. – Class A | | | | | | | 47,139 | | | $ | 2,513,452 | |
| | | | | | | | | | | | |
| | | |
Internet & Direct Marketing Retail – 1.4% | | | | | | | | | | | | |
Amazon.com, Inc.(a) | | | | | | | 1,162 | | | | 1,124,816 | |
Blue Apron Holdings, Inc.(a) | | | | | | | 11,747 | | | | 109,717 | |
Priceline Group, Inc. (The)(a) | | | | | | | 1,400 | | | | 2,618,728 | |
| | | | | | | | | | | | |
| | | | | | | | | | | 3,853,261 | |
| | | | | | | | | | | | |
Internet Software & Services – 0.0% | | | | | | | | | | | | |
Delivery Hero AG(a)(b) | | | | | | | 3,754 | | | | 121,593 | |
| | | | | | | | | | | | |
| | | |
Media – 3.1% | | | | | | | | | | | | |
CBS Corp. – Class B | | | | | | | 86,924 | | | | 5,544,013 | |
DISH Network Corp. – Class A(a) | | | | | | | 18,281 | | | | 1,147,315 | |
Walt Disney Co. (The) | | | | | | | 18,417 | | | | 1,956,806 | |
| | | | | | | | | | | | |
| | | | | | | | | | | 8,648,134 | |
| | | | | | | | | | | | |
Specialty Retail – 0.8% | | | | | | | | | | | | |
Lowe’s Cos., Inc. | | | | | | | 29,800 | | | | 2,310,394 | |
| | | | | | | | | | | | |
| | | | | | | | | | | 42,250,155 | |
| | | | | | | | | | | | |
Industrials – 14.7% | | | | | | | | | | | | |
Aerospace & Defense – 4.8% | | | | | | | | | | | | |
Northrop Grumman Corp. | | | | | | | 51,860 | | | | 13,312,981 | |
| | | | | | | | | | | | |
| | | |
Airlines – 0.9% | | | | | | | | | | | | |
Delta Air Lines, Inc. | | | | | | | 45,872 | | | | 2,465,161 | |
| | | | | | | | | | | | |
| | | |
Industrial Conglomerates – 5.1% | | | | | | | | | | | | |
Honeywell International, Inc. | | | | | | | 106,395 | | | | 14,181,390 | |
| | | | | | | | | | | | |
| | | |
Road & Rail – 3.9% | | | | | | | | | | | | |
Norfolk Southern Corp. | | | | | | | 76,281 | | | | 9,283,397 | |
Union Pacific Corp. | | | | | | | 16,414 | | | | 1,787,649 | |
| | | | | | | | | | | | |
| | | | | | | | | | | 11,071,046 | |
| | | | | | | | | | | | |
| | | | | | | | | | | 41,030,578 | |
| | | | | | | | | | | | |
Financials – 14.2% | | | | | | | | | | | | |
Banks – 8.4% | | | | | | | | | | | | |
Bank of America Corp. | | | | | | | 308,701 | | | | 7,489,086 | |
JPMorgan Chase & Co. | | | | | | | 107,139 | | | | 9,792,505 | |
US Bancorp | | | | | | | 117,987 | | | | 6,125,885 | |
| | | | | | | | | | | | |
| | | | | | | | | | | 23,407,476 | |
| | | | | | | | | | | | |
Capital Markets – 1.3% | | | | | | | | | | | | |
Morgan Stanley | | | | | | | 85,248 | | | | 3,798,651 | |
| | | | | | | | | | | | |
| | | |
Diversified Financial Services – 2.9% | | | | | | | | | | | | |
Berkshire Hathaway, Inc. – Class B(a) | | | | | | | 47,404 | | | | 8,028,815 | |
| | | | | | | | | | | | |
Insurance – 1.6% | | | | | | | | | | | | |
Athene Holding Ltd. – Class A(a) | | | | | | | 40,876 | | | | 2,027,858 | |
| | |
| 14 | AB SELECT US EQUITY PORTFOLIO | | abfunds.com |
PORTFOLIO OF INVESTMENTS (continued)
| | | | | | | | | | | | |
| Company | | | | | Shares | | | U.S. $ Value | |
| |
| | | | | | | | | | | | |
Progressive Corp. (The) | | | | | | | 57,186 | | | $ | 2,521,331 | |
| | | | | | | | | | | | |
| | | | | | | | | | | 4,549,189 | |
| | | | | | | | | | | | |
| | | | | | | | | | | 39,784,131 | |
| | | | | | | | | | | | |
Health Care – 12.1% | | | | | | | | | | | | |
Health Care Equipment & Supplies – 2.1% | | | | | | | | | | | | |
Medtronic PLC | | | | | | | 52,347 | | | | 4,645,796 | |
Zimmer Biomet Holdings, Inc. | | | | | | | 10,709 | | | | 1,375,036 | |
| | | | | | | | | | | | |
| | | | | | | | | | | 6,020,832 | |
| | | | | | | | | | | | |
Health Care Providers & Services – 3.9% | | | | | | | | | | | | |
Aetna, Inc. | | | | | | | 34,294 | | | | 5,206,858 | |
Humana, Inc. | | | | | | | 5,662 | | | | 1,362,391 | |
UnitedHealth Group, Inc. | | | | | | | 23,515 | | | | 4,360,151 | |
| | | | | | | | | | | | |
| | | | | | | | | | | 10,929,400 | |
| | | | | | | | | | | | |
Pharmaceuticals – 6.1% | | | | | | | | | | | | |
Eli Lilly & Co. | | | | | | | 17,830 | | | | 1,467,409 | |
Johnson & Johnson | | | | | | | 75,009 | | | | 9,922,940 | |
Pfizer, Inc. | | | | | | | 98,781 | | | | 3,318,054 | |
Zoetis, Inc. | | | | | | | 36,724 | | | | 2,290,843 | |
| | | | | | | | | | | | |
| | | | | | | | | | | 16,999,246 | |
| | | | | | | | | | | | |
| | | | | | | | | | | 33,949,478 | |
| | | | | | | | | | | | |
Consumer Staples – 7.4% | | | | | | | | | | | | |
Beverages – 0.8% | | | | | | | | | | | | |
Constellation Brands, Inc. – Class A | | | | | | | 10,852 | | | | 2,102,358 | |
| | | | | | | | | | | | |
| | | |
Food & Staples Retailing – 0.6% | | | | | | | | | | | | |
Kroger Co. (The) | | | | | | | 65,268 | | | | 1,522,050 | |
| | | | | | | | | | | | |
| | | |
Food Products – 3.0% | | | | | | | | | | | | |
Campbell Soup Co. | | | | | | | 51,582 | | | | 2,690,001 | |
Kraft Heinz Co. (The) | | | | | | | 39,360 | | | | 3,370,791 | |
Mondelez International, Inc. – Class A | | | | | | | 55,354 | | | | 2,390,739 | |
| | | | | | | | | | | | |
| | | | | | | | | | | 8,451,531 | |
| | | | | | | | | | | | |
Personal Products – 1.0% | | | | | | | | | | | | |
Estee Lauder Cos., Inc. (The) – Class A | | | | | | | 29,456 | | | | 2,827,187 | |
| | | | | | | | | | | | |
| | | |
Tobacco – 2.0% | | | | | | | | | | | | |
Altria Group, Inc. | | | | | | | 76,779 | | | | 5,717,732 | |
| | | | | | | | | | | | |
| | | | | | | | | | | 20,620,858 | |
| | | | | | | | | | | | |
Energy – 3.7% | | | | | | | | | | | | |
Oil, Gas & Consumable Fuels – 3.7% | | | | | | | | | | | | |
Chevron Corp. | | | | | | | 37,884 | | | | 3,952,438 | |
EOG Resources, Inc. | | | | | | | 41,598 | | | | 3,765,451 | |
Occidental Petroleum Corp. | | | | | | | 42,526 | | | | 2,546,031 | |
| | | | | | | | | | | | |
| | | | | | | | | | | 10,263,920 | |
| | | | | | | | | | | | |
| | |
| abfunds.com | | AB SELECT US EQUITY PORTFOLIO | 15 |
PORTFOLIO OF INVESTMENTS (continued)
| | | | | | | | | | | | |
| Company | | | | | Shares | | | U.S. $ Value | |
| |
| | | | | | | | | | | | |
Utilities – 2.7% | | | | | | | | | | | | |
Electric Utilities – 2.7% | | | | | | | | | | | | |
NextEra Energy, Inc. | | | | | | | 54,419 | | | $ | 7,625,734 | |
| | | | | | | | | | | | |
| | | |
Real Estate – 2.1% | | | | | | | | | | | | |
Equity Real Estate Investment Trusts (REITs) – 2.1% | | | | | | | | | | | | |
Crown Castle International Corp. | | | | | | | 59,205 | | | | 5,931,157 | |
| | | | | | | | | | | | |
| | | |
Materials – 0.8% | | | | | | | | | | | | |
Containers & Packaging – 0.8% | | | | | | | | | | | | |
Berry Global Group, Inc.(a) | | | | | | | 41,756 | | | | 2,380,510 | |
| | | | | | | | | | | | |
| | | |
Telecommunication Services – 0.6% | | | | | | | | | | | | |
Wireless Telecommunication Services – 0.6% | | | | | | | | | | | | |
T-Mobile US, Inc.(a) | | | | | | | 26,308 | | | | 1,594,791 | |
| | | | | | | | | | | | |
| | | |
Total Common Stocks
(cost $222,212,183) | | | | | | | | | | | 263,316,302 | |
| | | | | | | | | | | | |
| | | | | | | | | | | | |
INVESTMENT COMPANIES – 2.9% | | | | | | | | | | | | |
Funds and Investment Trusts – 2.9% | | | | | | | | | | | | |
iShares Nasdaq Biotechnology ETF(c) | | | | | | | 24,466 | | | | 7,586,417 | |
Altaba, Inc.(a) | | | | | | | 9,883 | | | | 538,426 | |
| | | | | | | | | | | | |
| | | |
Total Investment Companies
(cost $7,223,477) | | | | | | | | | | | 8,124,843 | |
| | | | | | | | | | | | |
| | | | | | | | | | | | |
PREFERRED STOCKS – 0.4% | | | | | | | | | | | | |
Consumer Discretionary – 0.1% | | | | | | | | | | | | |
Household Durables – 0.1% | | | | | | | | | | | | |
Honest Co., Inc. (The)(a)(d)(e) | | | | | | | 4,005 | | | | 161,862 | |
| | | | | | | | | | | | |
| | | |
Information Technology – 0.3% | | | | | | | | | | | | |
Internet Software & Services – 0.3% | | | | | | | | | | | | |
Lyft, Inc.(a)(d)(e) | | | | | | | 25,539 | | | | 821,079 | |
| | | | | | | | | | | | |
| | | |
Total Preferred Stocks
(cost $1,004,328) | | | | | | | | | | | 982,941 | |
| | | | | | | | | | | | |
| | | | | | | | | | | | |
SHORT-TERM INVESTMENTS – 1.8% | | | | | | | | | | | | |
Investment Companies – 1.8% | | | | | | | | | | | | |
AB Fixed Income Shares, Inc. – Government Money Market Portfolio – Class AB, 0.79%(c)(f)
(cost $5,159,107) | | | | | | | 5,159,107 | | | | 5,159,107 | |
| | | | | | | | | | | | |
| | |
| 16 | AB SELECT US EQUITY PORTFOLIO | | abfunds.com |
PORTFOLIO OF INVESTMENTS (continued)
| | | | | | | | | | | | |
| | | |
| | | | | | Principal
Amount
(000) | | | U.S. $ Value | |
| | | | | | | | | | | | |
| | | | | | | | | | | | |
Time Deposits – 0.0% | | | | | | | | | | | | |
BBH, Grand Cayman
(1.45)%, 7/03/17 | | | CHF | | | | 34 | | | $ | 35,335 | |
0.05%, 7/03/17 | | | GBP | | | | 0 | * | | | 5 | |
0.05%, 7/04/17 | | | CAD | | | | 0 | * | | | 7 | |
Sumitomo, Tokyo
(0.26)%, 7/03/17 | | | JPY | | | | 3,305 | | | | 29,389 | |
| | | | | | | | | | | | |
| | | |
Total Time Deposits
(cost $63,522) | | | | | | | | | | | 64,736 | |
| | | | | | | | | | | | |
| | | |
Total Short-Term Investments
(cost $5,222,629) | | | | | | | | | | | 5,223,843 | |
| | | | | | | | | | | | |
| | | |
Total Investments – 99.2%
(cost $235,662,617) | | | | | | | | | | | 277,647,929 | |
Other assets less liabilities – 0.8% | | | | | | | | | | | 2,124,344 | |
| | | | | | | | | | | | |
| | | |
Net Assets – 100.0% | | | | | | | | | | $ | 279,772,273 | |
| | | | | | | | | | | | |
TOTAL RETURN SWAPS (see Note D)
| | | | | | | | | | | | | | | | | | | | |
Counterparty &
Referenced Obligation | | # of Shares
or Units | | | Rate Paid/
Received by
the Fund | | | Notional
Amount
(000) | | | Maturity
Date | | | Unrealized
Appreciation/
(Depreciation) | |
Receive Total Return on Reference Obligation | |
Morgan Stanley Capital Services, LLC | | | | | | | | | | | | | |
KKR & Co. LP | | | 1,221 | | | | FedFundEffective30 | | | $ | 22 | | | | 1/11/19 | | | $ | 245 | |
KKR & Co. LP | | | 109 | | | | FedFundEffective30 | | | | 2 | | | | 1/11/19 | | | | (6 | ) |
KKR & Co. LP | | | 179 | | | | FedFundEffective30 | | | | 3 | | | | 1/11/19 | | | | (14 | ) |
KKR & Co. LP | | | 348 | | | | FedFundEffective30 | | | | 7 | | | | 1/11/19 | | | | (74 | ) |
KKR & Co. LP | | | 2,127 | | | | FedFundEffective30 | | | | 40 | | | | 1/11/19 | | | | (179 | ) |
KKR & Co. LP | | | 1,112 | | | | FedFundEffective30 | | | | 21 | | | | 1/11/19 | | | | (469 | ) |
KKR & Co. LP | | | 37,328 | | | | FedFundEffective30 | | | | 637 | | | | 1/11/19 | | | | 67,216 | |
KKR & Co. LP | | | 29,387 | | | | FedFundEffective30 | | | | 501 | | | | 1/11/19 | | | | 53,237 | |
KKR & Co. LP | | | 6,278 | | | | FedFundEffective30 | | | | 110 | | | | 1/11/19 | | | | 8,306 | |
KKR & Co. LP | | | 8,878 | | | | FedFundEffective30 | | | | 160 | | | | 1/11/19 | | | | 7,422 | |
KKR & Co. LP | | | 7,991 | | | | FedFundEffective30 | | | | 144 | | | | 1/11/19 | | | | 5,187 | |
KKR & Co. LP | | | 5,113 | | | | FedFundEffective30 | | | | 91 | | | | 1/11/19 | | | | 5,066 | |
KKR & Co. LP | | | 4,441 | | | | FedFundEffective30 | | | | 81 | | | | 1/11/19 | | | | 3,226 | |
KKR & Co. LP | | | 1,791 | | | | FedFundEffective30 | | | | 31 | | | | 1/11/19 | | | | 2,853 | |
KKR & Co. LP | | | 2,296 | | | | FedFundEffective30 | | | | 41 | | | | 1/11/19 | | | | 2,611 | |
KKR & Co. LP | | | 1,774 | | | | FedFundEffective30 | | | | 31 | | | | 1/11/19 | | | | 2,367 | |
KKR & Co. LP | | | 3,581 | | | | FedFundEffective30 | | | | 65 | | | | 1/11/19 | | | | 2,159 | |
KKR & Co. LP | | | 1,586 | | | | FedFundEffective30 | | | | 28 | | | | 1/11/19 | | | | 1,580 | |
KKR & Co. LP | | | 1,349 | | | | FedFundEffective30 | | | | 24 | | | | 1/11/19 | | | | 1,488 | |
KKR & Co. LP | | | 768 | | | | FedFundEffective30 | | | | 13 | | | | 1/11/19 | | | | 1,293 | |
KKR & Co. LP | | | 1,409 | | | | FedFundEffective30 | | | | 25 | | | | 1/11/19 | | | | 928 | |
KKR & Co. LP | | | 1,530 | | | | FedFundEffective30 | | | | 28 | | | | 1/11/19 | | | | 730 | |
KKR & Co. LP | | | 1,424 | | | | FedFundEffective30 | | | | 26 | | | | 1/11/19 | | | | 553 | |
| | |
| abfunds.com | | AB SELECT US EQUITY PORTFOLIO | 17 |
PORTFOLIO OF INVESTMENTS (continued)
| | | | | | | | | | | | | | | | | | | | |
Counterparty &
Referenced Obligation | | # of Shares
or Units | | | Rate Paid/
Received by
the Fund | | | Notional
Amount
(000) | | | Maturity
Date | | | Unrealized
Appreciation/
(Depreciation) | |
KKR & Co. LP | | | 855 | | | | FedFundEffective30 | | | $ | 15 | | | | 1/11/19 | | | $ | 483 | |
KKR & Co. LP | | | 2,449 | | | | FedFundEffective30 | | | | 45 | | | | 1/11/19 | | | | 480 | |
KKR & Co. LP | | | 697 | | | | FedFundEffective30 | | | | 13 | | | | 1/11/19 | | | | 430 | |
KKR & Co. LP | | | 675 | | | | FedFundEffective30 | | | | 12 | | | | 1/11/19 | | | | 92 | |
KKR & Co. LP | | | 55 | | | | FedFundEffective30 | | | | 1 | | | | 1/11/19 | | | | 46 | |
KKR & Co. LP | | | 40 | | | | FedFundEffective30 | | | | 1 | | | | 1/11/19 | | | | 16 | |
KKR & Co. LP | | | 1,064 | | | | FedFundEffective30 | | | | 20 | | | | 1/11/19 | | | | 9 | |
KKR & Co. LP | | | 508 | | | | FedFundEffective30 | | | | 9 | | | | 1/11/19 | | | | (38 | ) |
KKR & Co. LP | | | 2,449 | | | | FedFundEffective30 | | | | 45 | | | | 1/11/19 | | | | (44 | ) |
KKR & Co. LP | | | 1,281 | | | | FedFundEffective30 | | | | 24 | | | | 1/11/19 | | | | (99 | ) |
KKR & Co. LP | | | 497 | | | | FedFundEffective30 | | | | 9 | | | | 1/11/19 | | | | (102 | ) |
KKR & Co. LP | | | 1,281 | | | | FedFundEffective30 | | | | 24 | | | | 1/11/19 | | | | (167 | ) |
| | | | | | | | | | | | | | | | | | | | |
| | | | | | | | | | | | | | | | | | $ | 166,831 | |
| | | | | | | | | | | | | | | | | | | | |
| * | Principal amount less than 500. |
| (a) | Non-income producing security. |
| (b) | Security is exempt from registration under Rule 144A of the Securities Act of 1933. This security is considered restricted, but liquid and may be resold in transactions exempt from registration, normally to qualified institutional buyers. At June 30, 2017, the market value of this security amounted to $121,593 or 0.0% of net assets. |
| (c) | To obtain a copy of the fund’s shareholder report, please go to the Securities and Exchange Commission’s website at www.sec.gov. Additionally, shareholder reports for AB funds can be obtained by calling AB at (800) 227-4618. |
| (d) | Fair valued by the Adviser. |
| (f) | Investment in affiliated money market mutual fund. The rate shown represents the 7-day yield as of period end. |
Currency Abbreviations:
CAD – Canadian Dollar
CHF – Swiss Franc
GBP – Great British Pound
JPY – Japanese Yen
USD – United States Dollar
Glossary:
ADR – American Depositary Receipt
ETF – Exchange Traded Fund
See notes to financial statements.
| | |
| 18 | AB SELECT US EQUITY PORTFOLIO | | abfunds.com |
STATEMENT OF ASSETS & LIABILITIES
June 30, 2017
| | | | |
| Assets | | | | |
Investments in securities, at value | | | | |
Unaffiliated issuers (cost $230,503,510) | | $ | 272,488,822 | |
Affiliated issuers (cost $5,159,107) | | | 5,159,107 | |
Cash | | | 2,566,413 | |
Cash collateral due from broker | | | 2,103,000 | |
Receivable for investment securities sold and foreign currency transactions | | | 11,429,700 | |
Receivable for capital stock sold | | | 200,738 | |
Unrealized appreciation on total return swaps | | | 168,023 | |
Dividends receivable | | | 152,436 | |
Affiliated dividends receivable | | | 2,383 | |
| | | | |
Total assets | | | 294,270,622 | |
| | | | |
| Liabilities | | | | |
Payable for investment securities purchased | | | 12,496,893 | |
Payable for capital stock redeemed | | | 1,637,594 | |
Advisory fee payable | | | 232,039 | |
Administrative fee payable | | | 14,597 | |
Distribution fee payable | | | 11,808 | |
Transfer Agent fee payable | | | 3,666 | |
Unrealized depreciation on total return swaps | | | 1,192 | |
Due to Custodian | | | 47 | |
Accrued expenses and other liabilities | | | 100,513 | |
| | | | |
Total liabilities | | | 14,498,349 | |
| | | | |
Net Assets | | $ | 279,772,273 | |
| | | | |
| Composition of Net Assets | | | | |
Capital stock, at par | | $ | 1,696 | |
Additional paid-in capital | | | 220,579,480 | |
Undistributed net investment income | | | 214,624 | |
Accumulated net realized gain on investment
and foreign currency transactions | | | 16,824,291 | |
Net unrealized appreciation on investments
and foreign currency denominated assets and liabilities | | | 42,152,182 | |
| | | | |
| | $ | 279,772,273 | |
| | | | |
Net Asset Value Per Share—30 billion shares of capital stock authorized, $.0001 par value
| | | | | | | | | | | | |
| Class | | Net Assets | | | Shares
Outstanding | | | Net Asset
Value | |
| |
| A | | $ | 11,693,761 | | | | 706,865 | | | $ | 16.54 | * |
| |
| C | | $ | 10,646,710 | | | | 670,835 | | | $ | 15.87 | |
| |
| Advisor | | $ | 239,658,938 | | | | 14,501,165 | | | $ | 16.53 | |
| |
| R | | $ | 16,318 | | | | 1,006 | | | $ | 16.22 | |
| |
| K | | $ | 2,635,858 | | | | 161,439 | | | $ | 16.33 | |
| |
| I | | $ | 15,120,688 | | | | 922,948 | | | $ | 16.38 | |
| |
| * | The maximum offering price per share for Class A shares was $17.27, which reflects a sales charge of 4.25%. |
See notes to financial statements.
| | |
| abfunds.com | | AB SELECT US EQUITY PORTFOLIO | 19 |
STATEMENT OF OPERATIONS
Year Ended June 30, 2017
| | | | | | | | |
| Investment Income | | | | | | | | |
Dividends | | | | | | | | |
Unaffiliated issuers (net of foreign taxes withheld of $2,547) | | $ | 5,380,332 | | | | | |
Affiliated issuers | | | 33,629 | | | $ | 5,413,961 | |
| | | | | | | | |
| Expenses | | | | | | | | |
Advisory fee (see Note B) | | | 2,902,608 | | | | | |
Distribution fee—Class A | | | 55,459 | | | | | |
Distribution fee—Class C | | | 115,792 | | | | | |
Distribution fee—Class R | | | 77 | | | | | |
Distribution fee—Class K | | | 8,600 | | | | | |
Transfer agency—Class A | | | 7,201 | | | | | |
Transfer agency—Class C | | | 4,132 | | | | | |
Transfer agency—Advisor Class | | | 75,819 | | | | | |
Transfer agency—Class R | | | 9 | | | | | |
Transfer agency—Class K | | | 6,880 | | | | | |
Transfer agency—Class I | | | 4,032 | | | | | |
Custodian | | | 163,019 | | | | | |
Registration fees | | | 79,816 | | | | | |
Administrative | | | 60,829 | | | | | |
Audit and tax | | | 53,327 | | | | | |
Legal | | | 40,148 | | | | | |
Directors’ fees | | | 27,099 | | | | | |
Printing | | | 25,620 | | | | | |
Miscellaneous | | | 48,245 | | | | | |
| | | | | | | | |
Total expenses | | | 3,678,712 | | | | | |
Less: expenses waived and reimbursed by the Adviser (see Note B) | | | (21,183 | ) | | | | |
| | | | | | | | |
Net expenses | | | | | | | 3,657,529 | |
| | | | | | | | |
Net investment income | | | | | | | 1,756,432 | |
| | | | | | | | |
| Realized and Unrealized Gain (Loss) on Investment and Foreign Currency Transactions | | | | | | | | |
Net realized gain (loss) on: | | | | | | | | |
Investment transactions | | | | | | | 36,749,078 | |
Swaps | | | | | | | 13,192 | |
Foreign currency transactions | | | | | | | 22,940 | |
Net change in unrealized appreciation/depreciation on: | | | | | | | | |
Investments | | | | | | | 6,204,723 | |
Swaps | | | | | | | 166,831 | |
Foreign currency denominated assets and liabilities | | | | | | | 39 | |
| | | | | | | | |
Net gain on investment and foreign currency transactions | | | | | | | 43,156,803 | |
| | | | | | | | |
Net Increase in Net Assets from Operations | | | | | | $ | 44,913,235 | |
| | | | | | | | |
See notes to financial statements.
| | |
| 20 | AB SELECT US EQUITY PORTFOLIO | | abfunds.com |
STATEMENT OF CHANGES IN NET ASSETS
| | | | | | | | |
| | | Year Ended
June 30, 2017 | | | Year Ended
June 30, 2016 | |
| Increase (Decrease) in Net Assets from Operations | | | | | | | | |
Net investment income | | $ | 1,756,432 | | | $ | 1,714,576 | |
Net realized gain on investment and foreign currency transactions | | | 36,785,210 | | | | 3,277,026 | |
Net change in unrealized appreciation/depreciation on investments and foreign currency denominated assets and liabilities | | | 6,371,593 | | | | (404,636 | ) |
| | | | | | | | |
Net increase in net assets from operations | | | 44,913,235 | | | | 4,586,966 | |
Dividends and Distributions to
Shareholders from | | | | | | | | |
Net investment income | | | | | | | | |
Class A | | | – 0 | – | | | (19,514 | ) |
Advisor Class | | | (1,382,521 | ) | | | (1,048,883 | ) |
Class R | | | (16 | ) | | | – 0 | – |
Class K | | | (8,361 | ) | | | (2,568 | ) |
Class I | | | (99,162 | ) | | | (145,456 | ) |
Net realized gain on investment and foreign currency transactions | | | | | | | | |
Class A | | | (494,730 | ) | | | (1,280,486 | ) |
Class C | | | (416,739 | ) | | | (1,090,322 | ) |
Advisor Class | | | (8,393,430 | ) | | | (18,289,480 | ) |
Class R | | | (541 | ) | | | (1,115 | ) |
Class K | | | (140,108 | ) | | | (263,651 | ) |
Class I | | | (599,992 | ) | | | (2,493,212 | ) |
| Capital Stock Transactions | | | | | | | | |
Net decrease | | | (51,185,153 | ) | | | (20,448,350 | ) |
| | | | | | | | |
Total decrease | | | (17,807,518 | ) | | | (40,496,071 | ) |
| Net Assets | | | | | | | | |
Beginning of period | | | 297,579,791 | | | | 338,075,862 | |
| | | | | | | | |
End of period (including undistributed net investment income of $214,624 and $0, respectively) | | $ | 279,772,273 | | | $ | 297,579,791 | |
| | | | | | | | |
See notes to financial statements.
| | |
| abfunds.com | | AB SELECT US EQUITY PORTFOLIO | 21 |
NOTES TO FINANCIAL STATEMENTS
June 30, 2017
NOTE A
Significant Accounting Policies
AB Cap Fund, Inc. (the “Company”), which is a Maryland corporation, is registered under the Investment Company Act of 1940 as an open-end management investment company. The Company operates as a series company currently comprised of 31 portfolios. Each portfolio is considered to be a separate entity for financial reporting and tax purposes. This report relates only to the AB Select US Equity Portfolio (the “Fund”), a diversified portfolio. The Fund has authorized the issuance of Class A, Class B, Class C, Advisor Class, Class R, Class K, Class I, Class T, Class 1, and Class 2 shares. Class B, Class T, Class 1, and Class 2 shares are not currently being offered. As of June 30, 2017, AllianceBernstein L.P. (the “Adviser”) was the sole shareholder of Class R shares. Class A shares are sold with a front-end sales charge of up to 4.25% for purchases not exceeding $1,000,000. With respect to purchases of $1,000,000 or more, Class A shares redeemed within one year of purchase may be subject to a contingent deferred sales charge of 1%. Class C shares are subject to a contingent deferred sales charge of 1% on redemptions made within the first year after purchase, and 0% after the first year of purchase. Effective April 10, 2017, Class C shares will automatically convert to Class A shares ten years after the end of the calendar month of purchase. Class R and Class K shares are sold without an initial or contingent deferred sales charge. Advisor Class and Class I shares are sold without an initial or contingent deferred sales charge and are not subject to ongoing distribution expenses. All ten classes of shares have identical voting, dividend, liquidation and other rights, except that the classes bear different distribution and transfer agency expenses. Each class has exclusive voting rights with respect to its distribution plan. The financial statements have been prepared in conformity with U.S. generally accepted accounting principles (“U.S. GAAP”), which require management to make certain estimates and assumptions that affect the reported amounts of assets and liabilities in the financial statements and amounts of income and expenses during the reporting period. Actual results could differ from those estimates. The Fund is an investment company under U.S. GAAP and follows the accounting and reporting guidance applicable to investment companies. The following is a summary of significant accounting policies followed by the Fund.
1. Security Valuation
Portfolio securities are valued at their current market value determined on the basis of market quotations or, if market quotations are not readily available or are deemed unreliable, at “fair value” as determined in accordance with procedures established by and under the general supervision of the Company’s Board of Directors (the “Board”).
| | |
| 22 | AB SELECT US EQUITY PORTFOLIO | | abfunds.com |
NOTES TO FINANCIAL STATEMENTS (continued)
In general, the market values of securities which are readily available and deemed reliable are determined as follows: securities listed on a national securities exchange (other than securities listed on the NASDAQ Stock Market, Inc. (“NASDAQ”) or on a foreign securities exchange are valued at the last sale price at the close of the exchange or foreign securities exchange. If there has been no sale on such day, the securities are valued at the last traded price from the previous day. Securities listed on more than one exchange are valued by reference to the principal exchange on which the securities are traded; securities listed only on NASDAQ are valued in accordance with the NASDAQ Official Closing Price; listed or over the counter (“OTC”) market put or call options are valued at the mid level between the current bid and ask prices. If either a current bid or current ask price is unavailable, the Adviser will have discretion to determine the best valuation (e.g. last trade price in the case of listed options); open futures contracts are valued using the closing settlement price or, in the absence of such a price, the most recent quoted bid price. If there are no quotations available for the day of valuation, the last available closing settlement price is used; U.S. Government securities and any other debt instruments having 60 days or less remaining until maturity are generally valued at market by an independent pricing vendor, if a market price is available. If a market price is not available, the securities are valued at amortized cost. This methodology is commonly used for short- term securities that have an original maturity of 60 days or less, as well as short-term securities that had an original term to maturity that exceeded 60 days. In instances when amortized cost is utilized, the Valuation Committee (the “Committee”) must reasonably conclude that the utilization of amortized cost is approximately the same as the fair value of the security. Such factors the Committee will consider include, but are not limited to, an impairment of the creditworthiness of the issuer or material changes in interest rates. Fixed-income securities, including mortgage-backed and asset-backed securities, may be valued on the basis of prices provided by a pricing service or at a price obtained from one or more of the major broker-dealers. In cases where broker/dealer quotes are obtained, the Adviser may establish procedures whereby changes in market yields or spreads are used to adjust, on a daily basis, a recently obtained quoted price on a security; swaps and other derivatives are valued daily, primarily using independent pricing services, independent pricing models using market inputs, as well as third party broker-dealers or counterparties. Open end mutual funds are valued at the closing net asset value per share, while exchange traded funds are valued at the closing market price per share.
Securities for which market quotations are not readily available (including restricted securities) or are deemed unreliable are valued at fair value as deemed appropriate by the Adviser. Factors considered in making this determination may include, but are not limited to, information obtained by
| | |
| abfunds.com | | AB SELECT US EQUITY PORTFOLIO | 23 |
NOTES TO FINANCIAL STATEMENTS (continued)
contacting the issuer, analysts, analysis of the issuer’s financial statements or other available documents. In addition, the Fund may use fair value pricing for securities primarily traded in non-U.S. markets because most foreign markets close well before the Fund values its securities at 4:00 p.m., Eastern Time. The earlier close of these foreign markets gives rise to the possibility that significant events, including broad market moves, may have occurred in the interim and may materially affect the value of those securities. To account for this, the Fund may frequently value many of its foreign equity securities using fair value prices based on third party vendor modeling tools to the extent available.
2. Fair Value Measurements
In accordance with U.S. GAAP regarding fair value measurements, fair value is defined as the price that the Fund would receive to sell an asset or pay to transfer a liability in an orderly transaction between market participants at the measurement date. U.S. GAAP establishes a framework for measuring fair value, and a three-level hierarchy for fair value measurements based upon the transparency of inputs to the valuation of an asset or liability (including those valued based on their market values as described in Note A.1 above). Inputs may be observable or unobservable and refer broadly to the assumptions that market participants would use in pricing the asset or liability. Observable inputs reflect the assumptions market participants would use in pricing the asset or liability based on market data obtained from sources independent of the Fund. Unobservable inputs reflect the Fund’s own assumptions about the assumptions that market participants would use in pricing the asset or liability based on the best information available in the circumstances. Each investment is assigned a level based upon the observability of the inputs which are significant to the overall valuation. The three-tier hierarchy of inputs is summarized below.
| | • | | Level 1—quoted prices in active markets for identical investments |
| | • | | Level 2—other significant observable inputs (including quoted prices for similar investments, interest rates, prepayment speeds, credit risk, etc.) |
| | • | | Level 3—significant unobservable inputs (including the Fund’s own assumptions in determining the fair value of investments) |
The fair value of debt instruments, such as bonds, and over-the-counter derivatives is generally based on market price quotations, recently executed market transactions (where observable) or industry recognized modeling techniques and are generally classified as Level 2. Pricing vendor inputs to Level 2 valuations may include quoted prices for similar investments in active markets, interest rate curves, coupon rates, currency rates, yield curves, option adjusted spreads, default rates, credit spreads and other unique security features in order to estimate the relevant cash flows which is then discounted to calculate fair values. If these inputs are
| | |
| 24 | AB SELECT US EQUITY PORTFOLIO | | abfunds.com |
NOTES TO FINANCIAL STATEMENTS (continued)
unobservable and significant to the fair value, these investments will be classified as Level 3. In addition, non-agency rated investments are classified as Level 3.
Where readily available market prices or relevant bid prices are not available for certain equity investments, such investments may be valued based on similar publicly traded investments, movements in relevant indices since last available prices or based upon underlying company fundamentals and comparable company data (such as multiples to earnings or other multiples to equity). Where an investment is valued using an observable input such as another publicly traded security, the investment will be classified as Level 2. If management determines that an adjustment is appropriate based on restrictions on resale, illiquidity or uncertainty, and such adjustment is a significant component of the valuation, the investment will be classified as Level 3. An investment will also be classified as Level 3 where management uses company fundamentals and other significant inputs to determine the valuation.
The following table summarizes the valuation of the Fund’s investments by the above fair value hierarchy levels as of June 30, 2017:
| | | | | | | | | | | | | | | | |
Investments in Securities | | Level 1 | | | Level 2 | | | Level 3 | | | Total | |
Assets: | | | | | | | | | | | | | | | | |
Common Stocks: | | | | | | | | | | | | | | | | |
Information Technology | | $ | 57,884,990 | | | $ | – 0 | – | | $ | – 0 | – | | $ | 57,884,990 | |
Consumer Discretionary | | | 42,250,155 | | | | – 0 | – | | | – 0 | – | | | 42,250,155 | |
Industrials | | | 41,030,578 | | | | – 0 | – | | | – 0 | – | | | 41,030,578 | |
Financials | | | 39,784,131 | | | | – 0 | – | | | – 0 | – | | | 39,784,131 | |
Health Care | | | 33,949,478 | | | | – 0 | – | | | – 0 | – | | | 33,949,478 | |
Consumer Staples | | | 20,620,858 | | | | – 0 | – | | | – 0 | – | | | 20,620,858 | |
Energy | | | 10,263,920 | | | | – 0 | – | | | – 0 | – | | | 10,263,920 | |
Utilities | | | 7,625,734 | | | | – 0 | – | | | – 0 | – | | | 7,625,734 | |
Real Estate | | | 5,931,157 | | | | – 0 | – | | | – 0 | – | | | 5,931,157 | |
Materials | | | 2,380,510 | | | | – 0 | – | | | – 0 | – | | | 2,380,510 | |
Telecommunication Services | | | 1,594,791 | | | | – 0 | – | | | – 0 | – | | | 1,594,791 | |
Investment Companies | | | 8,124,843 | | | | – 0 | – | | | – 0 | – | | | 8,124,843 | |
Preferred Stocks | | | – 0 | – | | | – 0 | – | | | 982,941 | | | | 982,941 | |
Short-Term Investments: | | | | | | | | | | | | | | | | |
Investment Companies | | | 5,159,107 | | | | – 0 | – | | | – 0 | – | | | 5,159,107 | |
Time Deposits | | | – 0 | – | | | 64,736 | | | | – 0 | – | | | 64,736 | |
| | | | | | | | | | | | | | | | |
Total Investments in Securities | | | 276,600,252 | | | | 64,736 | | | | 982,941 | | | | 277,647,929 | |
Other Financial Instruments*: | | | | | | | | | | | | | | | | |
Assets | | | | | | | | | | | | | | | | |
Total Return Swaps | | | – 0 | – | | | 168,023 | | | | – 0 | – | | | 168,023 | |
Liabilities | | | | | | | | | | | | | | | | |
Total Return Swaps | | | – 0 | – | | | (1,192 | ) | | | – 0 | – | | | (1,192 | ) |
| | | | | | | | | | | | | | | | |
Total^ | | $ | 276,600,252 | | | $ | 231,567 | | | $ | 982,941 | | | $ | 277,814,760 | |
| | | | | | | | | | | | | | | | |
| * | Other financial instruments are derivative instruments, such as futures, forwards and swaps, which are valued at the unrealized appreciation/depreciation on the instrument. |
| ^ | There were no transfers between any levels during the reporting period. |
| | |
| abfunds.com | | AB SELECT US EQUITY PORTFOLIO | 25 |
NOTES TO FINANCIAL STATEMENTS (continued)
The Fund recognizes all transfers between levels of the fair value hierarchy assuming the financial instrument was transferred at the beginning of the reporting period.
The following is a reconciliation of investments in which significant unobservable inputs (Level 3) were used in determining fair value.
| | | | | | | | | | | | |
| | | Common
Stocks -
Consumer
Discretionary | | | Preferred
Stocks | | | Total | |
Balance as of 6/30/16 | | $ | 179,985 | | | $ | – 0 | – | | $ | 179,985 | |
Accrued discounts/(premiums) | | | – 0 | – | | | – 0 | – | | | – 0 | – |
Realized gain (loss) | | | – 0 | – | | | – 0 | – | | | – 0 | – |
Change in unrealized appreciation/depreciation | | | – 0 | – | | | (18,123 | ) | | | (18,123 | ) |
Purchases | | | – 0 | – | | | 821,079 | | | | 821,079 | |
Reclassification | | | (179,985 | ) | | | 179,985 | | | | – 0 | – |
Transfers into Level 3 | | | – 0 | – | | | – 0 | – | | | – 0 | – |
Transfers out of Level 3 | | | – 0 | – | | | – 0 | – | | | – 0 | – |
| | | | | | | | | | | | |
Balance as of 6/30/17 | | $ | – 0 | – | | $ | 982,941 | | | $ | 982,941 | |
| | | | | | | | | | | | |
Net change in unrealized appreciation/depreciation from investments held as of 6/30/17** | | $ | – 0 | – | | $ | (18,123 | ) | | $ | (18,123 | ) |
| | | | | | | | | | | | |
| ** | The unrealized appreciation/depreciation is included in net change in unrealized appreciation/depreciation on investments and other financial instruments in the accompanying statement of operations. |
The Adviser established the Committee to oversee the pricing and valuation of all securities held in the Fund. The Committee operates under pricing and valuation policies and procedures established by the Adviser and approved by the Board, including pricing policies which set forth the mechanisms and processes to be employed on a daily basis to implement these policies and procedures. In particular, the pricing policies describe how to determine market quotations for securities and other instruments. The Committee’s responsibilities include: 1) fair value and liquidity determinations (and oversight of any third parties to whom any responsibility for fair value and liquidity determinations is delegated), and 2) regular monitoring of the Adviser’s pricing and valuation policies and procedures and modification or enhancement of these policies and procedures (or recommendation of the modification of these policies and procedures) as the Committee believes appropriate.
The Committee is also responsible for monitoring the implementation of the pricing policies by the Adviser’s Pricing Group (the “Pricing Group”) and any third party which performs certain pricing functions in accordance with the pricing policies. The Pricing Group is responsible for the oversight of the third party on a day-to-day basis. The Committee and the Pricing Group perform a series of activities to provide reasonable assurance of the accuracy of prices including: 1) periodic vendor due diligence meetings, review methodologies, new developments and process at vendors, 2) daily
| | |
| 26 | AB SELECT US EQUITY PORTFOLIO | | abfunds.com |
NOTES TO FINANCIAL STATEMENTS (continued)
comparison of security valuation versus prior day for all securities that exceeded established thresholds, and 3) daily review of unpriced, stale, and variance reports with exceptions reviewed by senior management and the Committee.
In addition, several processes outside of the pricing process are used to monitor valuation issues including: 1) performance and performance attribution reports are monitored for anomalous impacts based upon benchmark performance, and 2) portfolio managers review all portfolios for performance and analytics (which are generated using the Adviser’s prices).
3. Currency Translation
Assets and liabilities denominated in foreign currencies and commitments under forward currency exchange contracts are translated into U.S. dollars at the mean of the quoted bid and ask prices of such currencies against the U.S. dollar. Purchases and sales of portfolio securities are translated into U.S. dollars at the rates of exchange prevailing when such securities were acquired or sold. Income and expenses are translated into U.S. dollars at the rates of exchange prevailing when accrued.
Net realized gain or loss on foreign currency transactions represents foreign exchange gains and losses from sales and maturities of foreign fixed income investments, foreign currency exchange contracts, holding of foreign currencies, currency gains or losses realized between the trade and settlement dates on foreign investment transactions, and the difference between the amounts of dividends, interest and foreign withholding taxes recorded on the Fund’s books and the U.S. dollar equivalent amounts actually received or paid. Net unrealized currency gains and losses from valuing foreign currency denominated assets and liabilities at period end exchange rates are reflected as a component of net unrealized appreciation and depreciation of foreign currency denominated assets and liabilities.
4. Taxes
It is the Fund’s policy to meet the requirements of the Internal Revenue Code applicable to regulated investment companies and to distribute all of its investment company taxable income and net realized gains, if any, to shareholders. Therefore, no provisions for federal income or excise taxes are required. The Fund may be subject to taxes imposed by countries in which it invests. Such taxes are generally based on income and/or capital gains earned or repatriated. Taxes are accrued and applied to net investment income, net realized gains and net unrealized appreciation/depreciation as such income and/or gains are earned.
In accordance with U.S. GAAP requirements regarding accounting for uncertainties in income taxes, management has analyzed the Fund’s tax positions taken or expected to be taken on federal and state income tax
| | |
| abfunds.com | | AB SELECT US EQUITY PORTFOLIO | 27 |
NOTES TO FINANCIAL STATEMENTS (continued)
returns for all open tax years (all years since inception of the Fund) and has concluded that no provision for income tax is required in the Fund’s financial statements.
5. Investment Income and Investment Transactions
Dividend income is recorded on the ex-dividend date or as soon as the Fund is informed of the dividend. Interest income is accrued daily. Investment transactions are accounted for on the date securities are purchased or sold. Investment gains or losses are determined on the identified cost basis. The Fund amortizes premiums and accretes discounts as adjustments to interest income.
6. Class Allocations
All income earned and expenses incurred by the Fund are borne on a pro-rata basis by each settled class of shares, based on the proportionate interest in the Fund represented by the net assets of such class, except for class specific expenses which are allocated to the respective class. Expenses of the Company are charged proportionately to each portfolio or based on other appropriate methods. Realized and unrealized gains and losses are allocated among the various share classes based on their respective net assets.
7. Dividends and Distributions
Dividends and distributions to shareholders, if any, are recorded on the ex-dividend date. Income dividends and capital gains distributions are determined in accordance with federal tax regulations and may differ from those determined in accordance with U.S. GAAP. To the extent these differences are permanent, such amounts are reclassified within the capital accounts based on their federal tax basis treatment; temporary differences do not require such reclassification.
NOTE B
Advisory Fee and Other Transactions with Affiliates
Under the terms of the investment advisory agreement, the Fund pays the Adviser an advisory fee at an annual rate of 1.00% of the Fund’s average daily net assets. The fee is accrued daily and paid monthly. The Adviser has agreed to reimburse its fees and bear certain expenses to the extent necessary to limit total operating expenses (excluding acquired fund fees and expenses other than the advisory fees of any AB Mutual Funds in which the Fund may invest, interest expense, taxes, extraordinary expenses, and brokerage commissions and other transaction costs), on an annual basis (the “Expense Caps”) to 1.55%, 2.30%, 1.30%, 1.80%, 1.55% and 1.30% of the daily average net assets for Class A, Class C, Advisor Class, Class R, Class K and Class I shares, respectively. The Expense Caps may not be terminated before November 1, 2017. For the
| | |
| 28 | AB SELECT US EQUITY PORTFOLIO | | abfunds.com |
NOTES TO FINANCIAL STATEMENTS (continued)
year ended June 30, 2017, such waiver/reimbursement amounted to $2,427.
Pursuant to the investment advisory agreement, the Fund may reimburse the Adviser for certain legal and accounting services provided to the Fund by the Adviser. For the year ended June 30, 2017, the reimbursement for such services amounted to $60,829.
The Fund compensates AllianceBernstein Investor Services, Inc. (“ABIS”), a wholly-owned subsidiary of the Adviser, under a Transfer Agency Agreement for providing personnel and facilities to perform transfer agency services for the Fund. ABIS may make payments to intermediaries that provide omnibus account services, sub-accounting services and/or networking services. The compensation retained by ABIS amounted to $47,222 for the year ended June 30, 2017.
AllianceBernstein Investments, Inc. (the “Distributor”), a wholly-owned subsidiary of the Adviser, serves as the distributor of the Fund’s shares. The Distributor has advised the Fund that it has retained front-end sales charges of $1,241 from the sale of Class A shares and received $504 and $1,085 in contingent deferred sales charges imposed upon redemption by shareholders of Class A and Class C shares, respectively, for the year ended June 30, 2017.
The Fund may invest in AB Government Money Market Portfolio (the “Government Money Market Portfolio”) which has a contractual annual advisory fee rate of .20% of the portfolio’s average daily net assets and bears its own expenses. In connection with the investment by the Fund in the Government Money Market Portfolio, the Adviser has agreed to waive its advisory fee from the Fund in an amount equal to the Fund’s pro rata share of the effective advisory fee of Government Money Market Portfolio, as borne indirectly by the Fund as an acquired fund fee and expense. For the year ended June 30, 2017, such waiver amounted to $18,756. A summary of the Fund’s transactions in shares of the Government Money Market Portfolio for the year ended June 30, 2017 is as follows:
| | | | | | | | | | | | | | | | | | |
Market Value
June 30, 2016
(000) | | | Purchases
at Cost
(000) | | | Sales
Proceeds
(000) | | | Market Value
June 30, 2017
(000) | | | Dividend
Income
(000) | |
| $ | 9,588 | | | $ | 167,086 | | | $ | 171,515 | | | $ | 5,159 | | | $ | 34 | |
Brokerage commissions paid on investment transactions for the year ended June 30, 2017 amounted to $556,033, of which $0 and $0, respectively, was paid to Sanford C. Bernstein & Co., LLC and Sanford C. Bernstein Limited, affiliates of the Adviser.
| | |
| abfunds.com | | AB SELECT US EQUITY PORTFOLIO | 29 |
NOTES TO FINANCIAL STATEMENTS (continued)
NOTE C
Distribution Services Agreement
The Fund has adopted a Distribution Services Agreement (the “Agreement”) pursuant to Rule 12b-1 under the Investment Company Act of 1940. Under the Agreement, the Fund pays distribution and servicing fees to the Distributor at an annual rate of up to .30% of the Fund’s average daily net assets attributable to Class A shares, 1% of the Fund’s average daily net assets attributable to Class C shares, .50% of the Fund’s average daily net assets attributable to Class R shares and .25% of the Fund’s average daily net assets attributable to Class K shares. Effective October 31, 2014, payments under the Agreement in respect of Class A shares are limited to an annual rate of .25% of Class A shares’ average daily net assets. There are no distribution and servicing fees on Advisor Class and Class I shares. The fees are accrued daily and paid monthly. The Agreement provides that the Distributor will use such payments in their entirety for distribution assistance and promotional activities. Since the commencement of the Fund’s operation, the Distributor has incurred expenses in excess of the distribution costs reimbursed by the Fund in the amounts of $75,137, $56 and $1,513 for Class C, Class R and Class K shares, respectively. While such costs may be recovered from the Fund in future periods so long as the Agreement is in effect, the rate of the distribution and servicing fees payable under the Agreement may not be increased without a shareholder vote. In accordance with the Agreement, there is no provision for recovery of unreimbursed distribution costs, incurred by the Distributor, beyond the current fiscal year for Class A shares. The Agreement also provides that the Adviser may use its own resources to finance the distribution of the Fund’s shares.
NOTE D
Investment Transactions
Purchases and sales of investment securities (excluding short-term investments) for the year ended June 30, 2017 were as follows:
| | | | | | | | |
| | | Purchases | | | Sales | |
Investment securities (excluding U.S. government securities) | | $ | 813,684,052 | | | $ | 873,086,739 | |
U.S. government securities | | | – 0 | – | | | – 0 | – |
The cost of investments for federal income tax purposes, gross unrealized appreciation and unrealized depreciation (excluding foreign currency contracts and swaps) are as follows:
| | | | |
Cost | | $ | 241,918,586 | |
| | | | |
Gross unrealized appreciation | | $ | 42,839,375 | |
Gross unrealized depreciation | | | (7,110,032 | ) |
| | | | |
Net unrealized appreciation | | $ | 35,729,343 | |
| | | | |
| | |
| 30 | AB SELECT US EQUITY PORTFOLIO | | abfunds.com |
NOTES TO FINANCIAL STATEMENTS (continued)
1. Derivative Financial Instruments
The Fund may use derivatives in an effort to earn income and enhance returns, to replace more traditional direct investments, to obtain exposure to otherwise inaccessible markets (collectively, “investment purposes”), or to hedge or adjust the risk profile of its portfolio.
The principal types of derivatives utilized by the Fund, as well as the methods in which they may be used are:
The Fund may enter into swaps to hedge its exposure to interest rates, credit risk, or currencies. The Fund may also enter into swaps for non-hedging purposes as a means of gaining market exposures including by making direct investments in foreign currencies, as described below under “Currency Transactions” or in order to take a “long” or “short” position with respect to an underlying referenced asset described below under “Total Return Swaps”. A swap is an agreement that obligates two parties to exchange a series of cash flows at specified intervals based upon or calculated by reference to changes in specified prices or rates for a specified amount of an underlying asset. The payment flows are usually netted against each other, with the difference being paid by one party to the other. In addition, collateral may be pledged or received by the Fund in accordance with the terms of the respective swaps to provide value and recourse to the Fund or its counterparties in the event of default, bankruptcy or insolvency by one of the parties to the swap.
Risks may arise as a result of the failure of the counterparty to the swap to comply with the terms of the swap. The loss incurred by the failure of a counterparty is generally limited to the net interim payment to be received by the Fund, and/or the termination value at the end of the contract. Therefore, the Fund considers the creditworthiness of each counterparty to a swap in evaluating potential counterparty risk. This risk is mitigated by having a netting arrangement between the Fund and the counterparty and by the posting of collateral by the counterparty to the Fund to cover the Fund’s exposure to the counterparty. Additionally, risks may arise from unanticipated movements in interest rates or in the value of the underlying securities. The Fund accrues for the interim payments on swaps on a daily basis, with the net amount recorded within unrealized appreciation/depreciation of swaps on the statement of assets and liabilities, where applicable. Once the interim payments are settled in cash, the net amount is recorded as realized gain/(loss) on swaps on the statement of operations, in addition to any realized gain/(loss) recorded upon the termination of swaps. Upfront premiums paid or received are recognized as cost or proceeds on the statement of assets and
| | |
| abfunds.com | | AB SELECT US EQUITY PORTFOLIO | 31 |
NOTES TO FINANCIAL STATEMENTS (continued)
liabilities and are amortized on a straight line basis over the life of the contract. Amortized upfront premiums are included in net realized gain/(loss) from swaps on the statement of operations. Fluctuations in the value of swaps are recorded as a component of net change in unrealized appreciation/depreciation of swaps on the statement of operations.
Total Return Swaps:
The Fund may enter into total return swaps in order to take a “long” or “short” position with respect to an underlying referenced asset. The Fund is subject to market price volatility of the underlying referenced asset. A total return swap involves commitments to pay interest in exchange for a market linked return based on a notional amount. To the extent that the total return of the security, group of securities or index underlying the transaction exceeds or falls short of the offsetting interest obligation, the Fund will receive a payment from or make a payment to the counterparty.
During the year ended June 30, 2017, the Fund held total return swaps for non-hedging purposes.
The Fund typically enters into International Swaps and Derivatives Association, Inc. Master Agreements (“ISDA Master Agreement”) or similar master agreements (collectively, “Master Agreements”) with its derivative contract counterparties in order to, among other things, reduce its credit risk to counterparties. ISDA Master Agreements include provisions for general obligations, representations, collateral and events of default or termination. Under an ISDA Master Agreement, the Fund typically may offset with the counterparty certain derivative financial instruments’ payables and/or receivables with collateral held and/or posted and create one single net payment (close-out netting) in the event of default or termination.
Various Master Agreements govern the terms of certain transactions with counterparties, including transactions such as derivative transactions, repurchase and reverse repurchase agreements. These Master Agreements typically attempt to reduce the counterparty risk associated with such transactions by specifying credit protection mechanisms and providing standardization that improves legal certainty. Cross-termination provisions under Master Agreements typically provide that a default in connection with one transaction between the Fund and a counterparty gives the non-defaulting party the right to terminate any other transactions in place with the defaulting party to create one single net payment due to/due from the defaulting party. In the event of a default by a Master Agreements counterparty, the return of collateral with market value in excess of the Fund’s net liability, held by the defaulting party, may be delayed or denied.
| | |
| 32 | AB SELECT US EQUITY PORTFOLIO | | abfunds.com |
NOTES TO FINANCIAL STATEMENTS (continued)
The Fund’s Master Agreements may contain provisions for early termination of OTC derivative transactions in the event the net assets of the Fund decline below specific levels (“net asset contingent features”). If these levels are triggered, the Fund’s counterparty has the right to terminate such transaction and require the Fund to pay or receive a settlement amount in connection with the terminated transaction. For additional details, please refer to netting arrangements by counterparty table below.
During the year ended June 30, 2017, the Fund had entered into the following derivatives:
| | | | | | | | | | | | |
| | | Asset Derivatives | | | Liability Derivatives | |
Derivative Type | | Statement of
Assets and
Liabilities
Location | | Fair Value | | | Statement of
Assets and
Liabilities
Location | | Fair Value | |
Equity contracts | | Unrealized
appreciation on
total return swaps | | $ | 168,023 | | | Unrealized
depreciation on
total return swaps | | $ | 1,192 | |
| | | | | | | | | | | | |
Total | | | | $ | 168,023 | | | | | $ | 1,192 | |
| | | | | | | | | | | | |
| | | | | | | | | | |
Derivative Type | | Location of Gain or
(Loss) on Derivatives Within
Statement of Operations | | Realized Gain
or (Loss) on
Derivatives | | | Change in
Unrealized
Appreciation or
(Depreciation) | |
Equity contracts | | Net realized gain/(loss) on swaps; Net change in unrealized appreciation/depreciation on swaps | | $ | 13,192 | | | $ | 166,831 | |
| | | | | | | | | | |
Total | | | | $ | 13,192 | | | $ | 166,831 | |
| | | | | | | | | | |
The following table represents the average monthly volume of the Fund’s derivative transactions during the year ended June 30, 2017.
| | | | |
Total Return Swaps: | | | | |
Average notional amount | | $ | 116,314 | (a) |
| (a) | Position was open for six months during the reporting period. |
For financial reporting purposes, the Fund does not offset derivative assets and derivative liabilities that are subject to netting arrangements in the statement of assets and liabilities.
| | |
| abfunds.com | | AB SELECT US EQUITY PORTFOLIO | 33 |
NOTES TO FINANCIAL STATEMENTS (continued)
All derivatives held at year end were subject to netting arrangements. The following tables present the Fund’s derivative assets and liabilities by counterparty net of amounts available for offset under Master Agreements (“MA”) and net of the related collateral received/pledged by the Fund as of June 30, 2017:
| | | | | | | | | | | | | | | | | | | | |
Counterparty | | Derivative
Assets
Subject
to a MA | | | Derivatives
Available for
Offset | | | Cash
Collateral
Received | | | Security
Collateral
Received | | | Net Amount
of Derivatives
Assets | |
OTC Derivatives: | | | | | | | | | | | | | | | | | | | | |
Morgan Stanley Capital Services, LLC | | $ | 168,023 | | | $ | (1,192 | ) | | $ | – 0 | – | | $ | – 0 | – | | $ | 166,831 | |
| | | | | | | | | | | | | | | | | | | | |
Total | | $ | 168,023 | | | $ | (1,192 | ) | | $ | – 0 | – | | $ | – 0 | – | | $ | 166,831 | ^ |
| | | | | | | | | | | | | | | | | | | | |
| | | | | |
Counterparty | | Derivative
Liabilities
Subject
to a MA | | | Derivatives
Available for
Offset | | | Cash
Collateral
Pledged* | | | Security
Collateral
Pledged | | | Net Amount
of Derivatives
Liabilities | |
OTC Derivatives: | | | | | | | | | | | | | | | | | | | | |
Morgan Stanley Capital Services, LLC | | $ | 1,192 | | | $ | (1,192 | ) | | $ | – 0 | – | | $ | – 0 | – | | $ | – 0 | – |
| | | | | | | | | | | | | | | | | | | | |
Total | | $ | 1,192 | | | $ | (1,192 | ) | | $ | – 0 | – | | $ | – 0 | – | | $ | – 0 | –^ |
| | | | | | | | | | | | | | | | | | | | |
| ^ | Net amount represents the net unrealized receivable/payable that would be due from/to the counterparty in the event of default or termination. The net from OTC financial derivative instruments can only be netted across transactions governed under the same master agreement with the same counterparty. |
| * | The actual collateral received/pledged is more than the amount reported due to over-collateralization. |
2. Currency Transactions
The Fund may invest in non-U.S. Dollar-denominated securities on a currency hedged or unhedged basis. The Fund may seek investment opportunities by taking long or short positions in currencies through the use of currency-related derivatives, including forward currency exchange contracts, futures and options on futures, swaps, and other options. The Fund may enter into transactions for investment opportunities when it anticipates that a foreign currency will appreciate or depreciate in value but securities denominated in that currency are not held by the Fund and do not present attractive investment opportunities. Such transactions may also be used when the Adviser believes that it may be more efficient than a direct investment in a foreign currency-denominated security. The Fund may also conduct currency exchange contracts on a spot basis (i.e., for cash at the spot rate prevailing in the currency exchange market for buying or selling currencies).
| | |
| 34 | AB SELECT US EQUITY PORTFOLIO | | abfunds.com |
NOTES TO FINANCIAL STATEMENTS (continued)
NOTE E
Capital Stock
Each class consists of 3,000,000,000 authorized shares. Transactions in capital shares for each class were as follows:
| | | | | | | | | | | | | | | | | | | | | | | | |
| | | | | | | | | | | | | | | | | | | | | | | | |
| | | Shares | | | | | | Amount | | | | |
| | | Year Ended
June 30,
2017 | | | Year Ended
June 30, 2016 | | | | | | Year Ended
June 30, 2017 | | | Year Ended
June 30, 2016 | | | | |
| | | | | | | | |
| Class A | | | | | | | | | | | | | | | | | | | | | | | | |
Shares sold | | | 226,987 | | | | 2,372,142 | | | | | | | $ | 3,472,359 | | | $ | 33,822,481 | | | | | |
| | | | | |
Shares issued in reinvestment of dividends and distributions | | | 28,659 | | | | 77,495 | | | | | | | | 438,773 | | | | 1,134,523 | | | | | |
| | | | | |
Shares converted from Class C | | | 27,780 | | | | – 0 | – | | | | | | | 450,040 | | | | – 0 | – | | | | |
| | | | | |
Shares redeemed | | | (2,492,130 | ) | | | (752,142 | ) | | | | | | | (37,674,327 | ) | | | (10,946,966 | ) | | | | |
| | | | | |
Net increase (decrease) | | | (2,208,704 | ) | | | 1,697,495 | | | | | | | $ | (33,313,155 | ) | | $ | 24,010,038 | | | | | |
| | | | | |
| | | | | | | | | | | | | | | | | | | | | | | | |
| Class C | | | | | | | | | | | | | | | | | | | | | | | | |
Shares sold | | | 87,795 | | | | 112,508 | | | | | | | $ | 1,324,313 | | | $ | 1,617,589 | | | | | |
| | | | | |
Shares issued in reinvestment of dividends and distributions | | | 20,142 | | | | 54,917 | | | | | | | | 297,095 | | | | 781,473 | | | | | |
| | | | | |
Shares converted to Class A | | | (28,923 | ) | | | – 0 | – | | | | | | | (450,040 | ) | | | – 0 | – | | | | |
| | | | | |
Shares redeemed | | | (294,710 | ) | | | (386,129 | ) | | | | | | | (4,420,760 | ) | | | (5,466,400 | ) | | | | |
| | | | | |
Net decrease | | | (215,696 | ) | | | (218,704 | ) | | | | | | $ | (3,249,392 | ) | | $ | (3,067,338 | ) | | | | |
| | | | | |
| | | | | | | | | | | | | | | | | | | | | | | | |
| Advisor Class | | | | | | | | | | | | | | | | | | | | | | | | |
Shares sold | | | 3,758,917 | | | | 2,571,730 | | | | | | | $ | 57,383,777 | | | $ | 38,564,108 | | | | | |
| | | | | |
Shares issued in reinvestment of dividends and distributions | | | 473,806 | | | | 1,220,673 | | | | | | | | 7,239,762 | | | | 17,895,068 | | | | | |
| | | | | |
Shares redeemed | | | (4,454,445 | ) | | | (5,764,565 | ) | | | | | | | (69,353,149 | ) | | | (84,296,051 | ) | | | | |
| | | | | |
Net decrease | | | (221,722 | ) | | | (1,972,162 | ) | | | | | | $ | (4,729,610 | ) | | $ | (27,836,875 | ) | | | | |
| | | | | |
| | | | | | | | | | | | | | | | | | | | | | | | |
| Class K | | | | | | | | | | | | | | | | | | | | | | | | |
Shares sold | | | 20,734 | | | | 21,989 | | | | | | | $ | 317,742 | | | $ | 316,394 | | | | | |
| | | | | |
Shares issued in reinvestment of dividends and distributions | | | 9,819 | | | | 18,348 | | | | | | | | 148,469 | | | | 266,218 | | | | | |
| | | | | |
Shares redeemed | | | (125,950 | ) | | | (16,979 | ) | | | | | | | (1,947,981 | ) | | | (244,866 | ) | | | | |
| | | | | |
Net increase (decrease) | | | (95,397 | ) | | | 23,358 | | | | | | | $ | (1,481,770 | ) | | $ | 337,746 | | | | | |
| | | | | |
| | |
| abfunds.com | | AB SELECT US EQUITY PORTFOLIO | 35 |
NOTES TO FINANCIAL STATEMENTS (continued)
| | | | | | | | | | | | | | | | | | | | | | | | |
| | | Shares | | | | | | Amount | | | | |
| | | Year Ended
June 30,
2017 | | | Year Ended
June 30, 2016 | | | | | | Year Ended
June 30, 2017 | | | Year Ended
June 30, 2016 | | | | |
| | | | | | | | |
| Class I | | | | | | | | | | | | | | | | | | | | | | | | |
Shares sold | | | 215,458 | | | | 158,372 | | | | | | | $ | 3,310,147 | | | $ | 2,320,384 | | | | | |
| | | | | |
Shares issued in reinvestment of dividends and distributions | | | 46,179 | | | | 176,677 | | | | | | | | 699,154 | | | | 2,567,117 | | | | | |
| | | | | |
Shares redeemed | | | (807,907 | ) | | | (1,332,541 | ) | | | | | | | (12,420,527 | ) | | | (18,779,422 | ) | | | | |
| | | | | |
Net decrease | | | (546,270 | ) | | | (997,492 | ) | | | | | | $ | (8,411,226 | ) | | $ | (13,891,921 | ) | | | | |
| | | | | |
Class R did not have any transactions in capital shares for years ended June 30, 2017 and June 30, 2016.
NOTE F
Risks Involved in Investing in the Fund
Capitalization Risk—Investments in small- and mid-capitalization companies may be more volatile than investments in large-capitalization companies. Investments in these companies may have additional risks because these companies have limited product lines, markets or financial resources.
Active Trading Risk—The Fund expects to engage in active and frequent trading of its portfolio securities and its portfolio turnover rate may greatly exceed 100%. A higher rate of portfolio turnover increases transaction costs, which may negatively affect the Fund’s return. In addition, a high rate of portfolio turnover may result in substantial short-term gains, which may have adverse tax consequences for Fund shareholders.
Indemnification Risk—In the ordinary course of business, the Fund enters into contracts that contain a variety of indemnifications. The Fund’s maximum exposure under these arrangements is unknown. However, the Fund has not had prior claims or losses pursuant to these indemnification provisions and expects the risk of loss thereunder to be remote. Therefore, the Fund has not accrued any liability in connection with these indemnification provisions.
NOTE G
Joint Credit Facility
A number of open-end mutual funds managed by the Adviser, including the Fund, participate in a $280 million revolving credit facility (the “Facility”) intended to provide short-term financing if necessary, subject to certain restrictions in connection with abnormal redemption activity. Commitment fees related to the Facility are paid by the participating funds and are included in miscellaneous expenses in the statement of operations. The Fund did not utilize the Facility during the year ended June 30, 2017.
| | |
| 36 | AB SELECT US EQUITY PORTFOLIO | | abfunds.com |
NOTES TO FINANCIAL STATEMENTS (continued)
NOTE H
Distributions to Shareholders
The tax character of distributions paid during the fiscal years ended June 30, 2017 and June 30, 2016 were as follows:
| | | | | | | | |
| | | 2017 | | | 2016 | |
Distributions paid from: | | | | | | | | |
Ordinary income | | $ | 7,344,823 | | | $ | 12,047,105 | |
Long-term capital gains | | | 4,190,777 | | | | 12,587,582 | |
| | | | | | | | |
Total taxable distributions paid | | $ | 11,535,600 | | | $ | 24,634,687 | |
| | | | | | | | |
As of June 30, 2017, the components of accumulated earnings/(deficit) on a tax basis were as follows:
| | | | |
Undistributed ordinary income | | $ | 10,918,353 | |
Undistributed capital gains | | | 12,376,531 | |
Unrealized appreciation/(depreciation) | | | 35,896,213 | (a) |
| | | | |
Total accumulated earnings/(deficit) | | $ | 59,191,097 | |
| | | | |
| (a) | The difference between book-basis and tax-basis unrealized appreciation/(depreciation) is attributable primarily to the tax deferral of losses on wash sales, and the tax treatment of swaps. |
For tax purposes, net capital losses may be carried over to offset future capital gains, if any. Funds are permitted to carry forward capital losses for an indefinite period, and such losses will retain their character as either short-term or long-term capital losses. As of June 30, 2017, the Fund did not have any capital loss carryforwards.
During the current fiscal year, permanent differences primarily due to the tax treatment of swaps, foreign currency reclassifications, the redesignation of dividends, and the utilization of earnings and profits distributed to shareholders on redemption of shares, resulted in a net decrease in undistributed net investment income, a net decrease in accumulated net realized gain on investment and foreign currency transactions and a net increase in additional paid-in capital. These reclassifications had no effect on net assets.
NOTE I
Other
In October 2016, the U.S. Securities and Exchange Commission adopted new rules and amended existing rules (together, “final rules”) intended to modernize the reporting and disclosure of information by registered investment companies. In part, the final rules amend Regulation S-X and require standardized, enhanced disclosure about derivatives in investment company financial statements, as well as other amendments. The compliance date for the amendments to Regulation S-X is August 1, 2017 (for reporting period end dates of August 31, 2017 or after). Management has
| | |
| abfunds.com | | AB SELECT US EQUITY PORTFOLIO | 37 |
NOTES TO FINANCIAL STATEMENTS (continued)
evaluated the impact of the amendments and expects the effect of the adoption of the final rules on financial statements will be limited to additional disclosures.
NOTE J
Subsequent Events
Management has evaluated subsequent events for possible recognition or disclosure in the financial statements through the date the financial statements are issued. Management has determined that there are no material events that would require disclosure in the Fund’s financial statements through this date.
| | |
| 38 | AB SELECT US EQUITY PORTFOLIO | | abfunds.com |
FINANCIAL HIGHLIGHTS
Selected Data For A Share Of Capital Stock Outstanding Throughout Each Period
| | | | | | | | | | | | | | | | | | | | |
| | | Class A | |
| | | Year Ended June 30, | |
| | 2017 | | | 2016 | | | 2015 | | | 2014 | | | 2013 | |
| | | | |
| | | | | | | | | | | | | | | | | | | | |
Net asset value, beginning of period | | | $ 14.70 | | | | $ 15.56 | | | | $ 15.62 | | | | $ 13.26 | | | | $ 11.13 | |
| | | | |
Income From Investment Operations | | | | | | | | | | | | | | | | | | | | |
Net investment income(a) | | | .06 | (b) | | | .06 | (b) | | | .01 | | | | .02 | | | | .04 | (b) |
Net realized and unrealized gain on investment and foreign currency transactions | | | 2.32 | | | | .21 | | | | 1.20 | | | | 2.68 | | | | 2.42 | |
Contributions from Affiliates | | | – 0 | – | | | – 0 | – | | | .00 | (c) | | | – 0 | – | | | – 0 | – |
| | | | |
Net increase in net asset value from operations | | | 2.38 | | | | .27 | | | | 1.21 | | | | 2.70 | | | | 2.46 | |
| | | | |
Less: Dividends and Distributions | | | | | | | | | | | | | | | | | | | | |
Dividends from net investment income | | | – 0 | – | | | (.02 | ) | | | (.03 | ) | | | (.02 | ) | | | (.00 | )(c) |
Distributions from net realized gain on investment and foreign currency transactions | | | (.54 | ) | | | (1.11 | ) | | | (1.24 | ) | | | (.32 | ) | | | (.33 | ) |
| | | | |
Total dividends and distributions | | | (.54 | ) | | | (1.13 | ) | | | (1.27 | ) | | | (.34 | ) | | | (.33 | ) |
| | | | |
Net asset value, end of period | | | $ 16.54 | | | | $ 14.70 | | | | $ 15.56 | | | | $ 15.62 | | | | $ 13.26 | |
| | | | |
Total Return | | | | | | | | | | | | | | | | | | | | |
Total investment return based on net asset value(d) | | | 16.47 | % | | | 1.74 | % | | | 8.02 | % | | | 20.53 | % | | | 22.53 | % |
Ratios/Supplemental Data | | | | | | | | | | | | | | | | | | | | |
Net assets, end of period (000’s omitted) | | | $11,694 | | | | $42,856 | | | | $18,958 | | | | $17,535 | | | | $10,285 | |
Ratio to average net assets of: | | | | | | | | | | | | | | | | | | | | |
Expenses, net of waivers/reimbursements(e) | | | 1.45 | % | | | 1.45 | % | | | 1.45 | % | | | 1.49 | % | | | 1.60 | % |
Expenses, before waivers/reimbursements(e) | | | 1.45 | % | | | 1.45 | % | | | 1.45 | % | | | 1.49 | % | | | 2.02 | % |
Net investment income | | | .37 | %(b) | | | .44 | %(b) | | | .08 | % | | | .12 | % | | | .34 | %(b) |
Portfolio turnover rate | | | 292 | % | | | 269 | % | | | 348 | % | | | 495 | % | | | 560 | % |
See footnote summary on page 44.
| | |
| abfunds.com | | AB SELECT US EQUITY PORTFOLIO | 39 |
FINANCIAL HIGHLIGHTS (continued)
Selected Data For A Share Of Capital Stock Outstanding Throughout Each Period
| | | | | | | | | | | | | | | | | | | | |
| | | Class C | |
| | | Year Ended June 30, | |
| | 2017 | | | 2016 | | | 2015 | | | 2014 | | | 2013 | |
| | | | |
| | | | | | | | | | | | | | | | | | | | |
Net asset value, beginning of period | | | $ 14.23 | | | | $ 15.19 | | | | $ 15.34 | | | | $ 13.11 | | | | $ 11.09 | |
| | | | |
Income From Investment Operations | | | | | | | | | | | | | | | | | | | | |
Net investment loss(a) | | | (.05 | )(b) | | | (.06 | )(b) | | | (.10 | ) | | | (.08 | ) | | | (.05 | )(b) |
Net realized and unrealized gain on investment and foreign currency transactions | | | 2.23 | | | | .21 | | | | 1.19 | | | | 2.63 | | | | 2.40 | |
Contributions from Affiliates | | | – 0 | – | | | – 0 | – | | | .00 | (c) | | | – 0 | – | | | – 0 | – |
| | | | |
Net increase in net asset value from operations | | | 2.18 | | | | .15 | | | | 1.09 | | | | 2.55 | | | | 2.35 | |
| | | | |
Less: Distributions | | | | | | | | | | | | | | | | | | | | |
Distributions from net realized gain on investment and foreign currency transactions | | | (.54 | ) | | | (1.11 | ) | | | (1.24 | ) | | | (.32 | ) | | | (.33 | ) |
| | | | |
Net asset value, end of period | | | $ 15.87 | | | | $ 14.23 | | | | $ 15.19 | | | | $ 15.34 | | | | $ 13.11 | |
| | | | |
Total Return | | | | | | | | | | | | | | | | | | | | |
Total investment return based on net asset value(d) | | | 15.59 | % | | | 0.98 | % | | | 7.31 | % | | | 19.65 | % | | | 21.59 | % |
Ratios/Supplemental Data | | | | | | | | | | | | | | | | | | | | |
Net assets, end of period (000’s omitted) | | | $10,647 | | | | $12,613 | | | | $16,791 | | | | $10,645 | | | | $2,528 | |
Ratio to average net assets of: | | | | | | | | | | | | | | | | | | | | |
Expenses, net of waivers/reimbursements(e) | | | 2.20 | % | | | 2.20 | % | | | 2.19 | % | | | 2.20 | % | | | 2.30 | % |
Expenses, before waivers/reimbursements(e) | | | 2.21 | % | | | 2.20 | % | | | 2.19 | % | | | 2.20 | % | | | 2.70 | % |
Net investment loss | | | (.33 | )%(b) | | | (.41 | )%(b) | | | (.66 | )% | | | (.57 | )% | | | (.43 | )%(b) |
Portfolio turnover rate | | | 292 | % | | | 269 | % | | | 348 | % | | | 495 | % | | | 560 | % |
See footnote summary on page 44.
| | |
| 40 | AB SELECT US EQUITY PORTFOLIO | | abfunds.com |
FINANCIAL HIGHLIGHTS (continued)
Selected Data For A Share Of Capital Stock Outstanding Throughout Each Period
| | | | | | | | | | | | | | | | | | | | |
| | | Advisor Class | |
| | | Year Ended June 30, | |
| | | 2017 | | | 2016 | | | 2015 | | | 2014 | | | 2013 | |
| | | | |
| | | | | | | | | | | | | | | | | | | | |
Net asset value, beginning of period | | | $ 14.73 | | | | $ 15.60 | | | | $ 15.64 | | | | $ 13.26 | | | | $ 11.15 | |
| | | | |
Income From Investment Operations | | | | | | | | | | | | | | | | | | | | |
Net investment income(a) | | | .10 | (b) | | | .09 | (b) | | | .05 | | | | .06 | | | | .07 | (b) |
Net realized and unrealized gain on investment and foreign currency transactions | | | 2.33 | | | | .21 | | | | 1.21 | | | | 2.68 | | | | 2.43 | |
Contributions from Affiliates | | | – 0 | – | | | – 0 | – | | | .00 | (c) | | | – 0 | – | | | – 0 | – |
| | | | |
Net increase in net asset value from operations | | | 2.43 | | | | .30 | | | | 1.26 | | | | 2.74 | | | | 2.50 | |
| | | | |
Less: Dividends and Distributions | | | | | | | | | | | | | | | | | | | | |
Dividends from net investment income | | | (.09 | ) | | | (.06 | ) | | | (.06 | ) | | | (.04 | ) | | | (.06 | ) |
Distributions from net realized gain on investment and foreign currency transactions | | | (.54 | ) | | | (1.11 | ) | | | (1.24 | ) | | | (.32 | ) | | | (.33 | ) |
| | | | |
Total dividends and distributions | | | (.63 | ) | | | (1.17 | ) | | | (1.30 | ) | | | (.36 | ) | | | (.39 | ) |
| | | | |
Net asset value, end of period | | | $ 16.53 | | | | $ 14.73 | | | | $ 15.60 | | | | $ 15.64 | | | | $ 13.26 | |
| | | | |
Total Return | | | | | | | | | | | | | | | | | | | | |
Total investment return based on net asset value(d) | | | 16.82 | % | | | 1.91 | % | | | 8.40 | % | | | 20.89 | % | | | 22.88 | % |
Ratios/Supplemental Data | | | | | | | | | | | | | | | | | | | | |
Net assets, end of period
(000’s omitted) | | | $239,659 | | | | $216,896 | | | | $260,521 | | | | $225,377 | | | | $116,470 | |
Ratio to average net assets of: | | | | | | | | | | | | | | | | | | | | |
Expenses, net of waivers/reimbursements(e) | | | 1.20 | % | | | 1.20 | % | | | 1.19 | % | | | 1.19 | % | | | 1.30 | % |
Expenses, before waivers/reimbursements(e) | | | 1.20 | % | | | 1.20 | % | | | 1.19 | % | | | 1.19 | % | | | 2.01 | % |
Net investment income | | | .67 | %(b) | | | .60 | %(b) | | | .34 | % | | | .42 | % | | | .56 | %(b) |
Portfolio turnover rate | | | 292 | % | | | 269 | % | | | 348 | % | | | 495 | % | | | 560 | % |
See footnote summary on page 44.
| | |
| abfunds.com | | AB SELECT US EQUITY PORTFOLIO | 41 |
FINANCIAL HIGHLIGHTS (continued)
Selected Data For A Share Of Capital Stock Outstanding Throughout Each Period
| | | | | | | | | | | | | | | | | | | | |
| | | Class R | |
| | | Year Ended June 30, | |
| | 2017 | | | 2016 | | | 2015 | | | 2014 | | | 2013 | |
| | | | |
| | | | | | | | | | | | | | | | | | | | |
Net asset value, beginning of period | | | $ 14.48 | | | | $ 15.37 | | | | $ 15.44 | | | | $ 13.13 | | | | $ 11.05 | |
| | | | |
Income From Investment Operations | | | | | | | | | | | | | | | | | | | | |
Net investment income (loss)(a) | | | .02 | (b) | | | .01 | (b) | | | (.03 | ) | | | (.01 | ) | | | .01 | (b) |
Net realized and unrealized gain on investment and foreign currency transactions | | | 2.28 | | | | .21 | | | | 1.20 | | | | 2.64 | | | | 2.40 | |
Contributions from Affiliates | | | – 0 | – | | | – 0 | – | | | .00 | (c) | | | – 0 | – | | | – 0 | – |
| | | | |
Net increase in net asset value from operations | | | 2.30 | | | | .22 | | | | 1.17 | | | | 2.63 | | | | 2.41 | |
| | | | |
Less: Dividends and Distributions | | | | | | | | | | | | | | | | | | | | |
Dividends from net investment income | | | (.02 | ) | | | – 0 | – | | | – 0 | – | | | – 0 | – | | | (.00 | )(c) |
Distributions from net realized gain on investment and foreign currency transactions | | | (.54 | ) | | | (1.11 | ) | | | (1.24 | ) | | | (.32 | ) | | | (.33 | ) |
| | | | |
Total dividends and distributions | | | (.56 | ) | | | (1.11 | ) | | | (1.24 | ) | | | (.32 | ) | | | (.33 | ) |
| | | | |
Net asset value, end of period | | | $ 16.22 | | | | $ 14.48 | | | | $ 15.37 | | | | $ 15.44 | | | | $ 13.13 | |
| | | | |
Total Return | | | | | | | | | | | | | | | | | | | | |
Total investment return based on net asset value(d) | | | 16.14 | % | | | 1.44 | % | | | 7.80 | % | | | 20.23 | % | | | 22.26 | % |
Ratios/Supplemental Data | | | | | | | | | | | | | | | | | | | | |
Net assets, end of period (000’s omitted) | | | $16 | | | | $15 | | | | $15 | | | | $16 | | | | $13 | |
Ratio to average net assets of: | | | | | | | | | | | | | | | | | | | | |
Expenses, net of waivers/reimbursements(e) | | | 1.74 | % | | | 1.72 | % | | | 1.72 | % | | | 1.70 | % | | | 1.80 | % |
Expenses, before waivers/reimbursements(e) | | | 1.74 | % | | | 1.72 | % | | | 1.72 | % | | | 1.70 | % | | | 3.27 | % |
Net investment income (loss) | | | .12 | %(b) | | | .09 | %(b) | | | (.18 | )% | | | (.10 | )% | | | .04 | %(b) |
Portfolio turnover rate | | | 292 | % | | | 269 | % | | | 348 | % | | | 495 | % | | | 560 | % |
See footnote summary on page 44.
| | |
| 42 | AB SELECT US EQUITY PORTFOLIO | | abfunds.com |
FINANCIAL HIGHLIGHTS (continued)
Selected Data For A Share Of Capital Stock Outstanding Throughout Each Period
| | | | | | | | | | | | | | | | | | | | |
| | | Class K | |
| | | Year Ended June 30, | |
| | 2017 | | | 2016 | | | 2015 | | | 2014 | | | 2013 | |
| | | | |
| | | | | | | | | | | | | | | | | | | | |
Net asset value, beginning of period | | | $ 14.56 | | | | $ 15.43 | | | | $ 15.47 | | | | $ 13.14 | | | | $ 11.07 | |
| | | | |
Income From Investment Operations | | | | | | | | | | | | | | | | | | | | |
Net investment income(a)(b) | | | .05 | | | | .04 | | | | (.00 | )(c) | | | .01 | | | | .04 | |
Net realized and unrealized gain on investment and foreign currency transactions | | | 2.29 | | | | .21 | | | | 1.20 | | | | 2.64 | | | | 2.41 | |
Contributions from Affiliates | | | – 0 | – | | | – 0 | – | | | .00 | (c) | | | – 0 | – | | | – 0 | – |
| | | | |
Net increase in net asset value from operations | | | 2.34 | | | | .25 | | | | 1.20 | | | | 2.65 | | | | 2.45 | |
| | | | |
Less: Dividends and Distributions | | | | | | | | | | | | | | | | | | | | |
Dividends from net investment income | | | (.03 | ) | | | (.01 | ) | | | – 0 | – | | | – 0 | – | | | (.05 | ) |
Distributions from net realized gain on investment and foreign currency transactions | | | (.54 | ) | | | (1.11 | ) | | | (1.24 | ) | | | (.32 | ) | | | (.33 | ) |
| | | | |
Total dividends and distributions | | | (.57 | ) | | | (1.12 | ) | | | (1.24 | ) | | | (.32 | ) | | | (.38 | ) |
| | | | |
Net asset value, end of period | | | $ 16.33 | | | | $ 14.56 | | | | $ 15.43 | | | | $ 15.47 | | | | $ 13.14 | |
| | | | |
Total Return | | | | | | | | | | | | | | | | | | | | |
Total investment return based on net asset value(d) | | | 16.38 | % | | | 1.58 | % | | | 8.05 | % | | | 20.37 | % | | | 22.58 | % |
Ratios/Supplemental Data | | | | | | | | | | | | | | | | | | | | |
Net assets, end of period (000’s omitted) | | | $2,636 | | | | $3,739 | | | | $3,604 | | | | $2,678 | | | | $1,620 | |
Ratio to average net assets of: | | | | | | | | | | | | | | | | | | | | |
Expenses, net of waivers/reimbursements(e) | | | 1.55 | % | | | 1.55 | % | | | 1.55 | % | | | 1.55 | % | | | 1.55 | % |
Expenses, before waivers/reimbursements(e) | | | 1.62 | % | | | 1.60 | % | | | 1.59 | % | | | 1.62 | % | | | 2.64 | % |
Net investment income (loss)(b) | | | .32 | % | | | .27 | % | | | (.02 | )% | | | .07 | % | | | .29 | % |
Portfolio turnover rate | | | 292 | % | | | 269 | % | | | 348 | % | | | 495 | % | | | 560 | % |
See footnote summary on page 44.
| | |
| abfunds.com | | AB SELECT US EQUITY PORTFOLIO | 43 |
FINANCIAL HIGHLIGHTS (continued)
Selected Data For A Share Of Capital Stock Outstanding Throughout Each Period
| | | | | | | | | | | | | | | | | | | | |
| | | Class I | |
| | | Year Ended June 30, | |
| | 2017 | | | 2016 | | | 2015 | | | 2014 | | | 2013 | |
| | | | |
| | | | | | | | | | | | | | | | | | | | |
Net asset value, beginning of period | | | $ 14.61 | | | | $ 15.48 | | | | $ 15.52 | | | | $ 13.17 | | | | $ 11.09 | |
| | | | |
Income From Investment Operations | | | | | | | | | | | | | | | | | | | | |
Net investment income(a) | | | .11 | (b) | | | .08 | (b) | | | .05 | | | | .06 | | | | .07 | (b) |
Net realized and unrealized gain on investment and foreign currency transactions | | | 2.29 | | | | .22 | | | | 1.20 | | | | 2.65 | | | | 2.40 | |
Contributions from Affiliates | | | – 0 | – | | | – 0 | – | | | .00 | (c) | | | – 0 | – | | | – 0 | – |
| | | | |
Net increase in net asset value from operations | | | 2.40 | | | | .30 | | | | 1.25 | | | | 2.71 | | | | 2.47 | |
| | | | |
Less: Dividends and Distributions | | | | | | | | | | | | | | | | | | | | |
Dividends from net investment income | | | (.09 | ) | | | (.06 | ) | | | (.05 | ) | | | (.04 | ) | | | (.06 | ) |
Distributions from net realized gain on investment and foreign currency transactions | | | (.54 | ) | | | (1.11 | ) | | | (1.24 | ) | | | (.32 | ) | | | (.33 | ) |
| | | | |
Total dividends and distributions | | | (.63 | ) | | | (1.17 | ) | | | (1.29 | ) | | | (.36 | ) | | | (.39 | ) |
| | | | |
Net asset value, end of period | | | $ 16.38 | | | | $ 14.61 | | | | $ 15.48 | | | | $ 15.52 | | | | $ 13.17 | |
| | | | |
Total Return | | | | | | | | | | | | | | | | | | | | |
Total investment return based on net asset value(d) | | | 16.76 | % | | | 2.00 | % | | | 8.34 | % | | | 20.81 | % | | | 22.82 | % |
Ratios/Supplemental Data | | | | | | | | | | | | | | | | | | | | |
Net assets, end of period (000’s omitted) | | | $15,121 | | | | $21,461 | | | | $38,186 | | | | $30,164 | | | | $8,179 | |
Ratio to average net assets of: | | | | | | | | | | | | | | | | | | | | |
Expenses, net of waivers/reimbursements(e) | | | 1.19 | % | | | 1.18 | % | | | 1.22 | % | | | 1.18 | % | | | 1.30 | % |
Expenses, before waivers/reimbursements(e) | | | 1.19 | % | | | 1.18 | % | | | 1.22 | % | | | 1.18 | % | | | 2.78 | % |
Net investment income | | | .72 | %(b) | | | .57 | %(b) | | | .31 | % | | | .40 | % | | | .55 | %(b) |
Portfolio turnover rate | | | 292 | % | | | 269 | % | | | 348 | % | | | 495 | % | | | 560 | % |
| (a) | Based on average shares outstanding. |
| (b) | Net of expenses waived/reimbursed by the Adviser. |
| (c) | Amount is less than $0.005 |
| (d) | Total investment return is calculated assuming an initial investment made at the net asset value at the beginning of the period, reinvestment of all dividends and distributions at net asset value during the period, and redemption on the last day of the period. Initial sales charge or contingent deferred sales charge is not reflected in the calculation of total investment return. Total investment return does not reflect the deduction of taxes that a shareholder would pay on fund distributions or the redemption of fund shares. Total investment return for a period of less than one year is not annualized. |
| (e) | In connection with the Fund’s investments in affiliated underlying portfolios, the Fund incurs no direct expenses but bears proportionate shares of the acquired fund fees and expenses (i.e. operating, administrative and investment advisory fees) of the affiliated underlying portfolios. The Adviser has contractually agreed to waive its fees from the Fund in an amount equal to the Fund’s pro rata share of certain acquired fund fees and expenses, and for year ended June 30, 2017, such waiver amounted to 0.01% for the Fund. |
See notes to financial statements.
| | |
| 44 | AB SELECT US EQUITY PORTFOLIO | | abfunds.com |
REPORT OF INDEPENDENT REGISTERED
PUBLIC ACCOUNTING FIRM
To the Board of Directors and Shareholders of AB Select US Equity Portfolio
We have audited the accompanying statement of assets and liabilities, including the portfolio of investments, of AB Select US Equity Portfolio (the “Fund”), one of the funds constituting the AB Cap Fund, Inc., as of June 30, 2017, and the related statement of operations for the year then ended, the statements of changes in net assets for each of the two years in the period then ended, and the financial highlights for each of the five years in the period then ended. These financial statements and financial highlights are the responsibility of the Fund’s management. Our responsibility is to express an opinion on these financial statements and financial highlights based on our audits.
We conducted our audits in accordance with the standards of the Public Company Accounting Oversight Board (United States). Those standards require that we plan and perform the audit to obtain reasonable assurance about whether the financial statements and financial highlights are free of material misstatement. We were not engaged to perform an audit of the Fund’s internal control over financial reporting. Our audits included consideration of internal control over financial reporting as a basis for designing audit procedures that are appropriate in the circumstances, but not for the purpose of expressing an opinion on the effectiveness of the Fund’s internal control over financial reporting. Accordingly, we express no such opinion. An audit also includes examining, on a test basis, evidence supporting the amounts and disclosures in the financial statements and financial highlights, assessing the accounting principles used and significant estimates made by management, and evaluating the overall financial statement presentation. Our procedures included confirmation of securities owned as of June 30, 2017 by correspondence with the custodian and others or by other appropriate auditing procedures where replies from others were not received. We believe that our audits provide a reasonable basis for our opinion.
In our opinion, the financial statements and financial highlights referred to above present fairly, in all material respects, the financial position of AB Select US Equity Portfolio, one of the portfolios constituting the AB Cap Fund, Inc., at June 30, 2017, the results of its operations for the year then ended, the changes in its net assets for each of the two years in the period then ended, and the financial highlights for each of the five years in the period then ended, in conformity with U.S. generally accepted accounting principles.

New York, New York
August 25, 2017
| | |
| abfunds.com | | AB SELECT US EQUITY PORTFOLIO | 45 |
2017 FEDERAL TAX INFORMATION
(unaudited)
For Federal income tax purposes, the following information is furnished with respect to the distributions paid by the Fund during the taxable year ended June 30, 2017. For corporate shareholders, 24.94% of dividends paid qualify for the dividends received deduction. For individual shareholders, the fund designates 23.92% of dividends paid as qualified dividend income.
Shareholders should not use the above information to prepare their income tax returns. The information necessary to complete your income tax returns will be included with your Form 1099-DIV which will be sent to you separately in January 2018.
| | |
| 46 | AB SELECT US EQUITY PORTFOLIO | | abfunds.com |
BOARD OF DIRECTORS
| | |
Marshall C. Turner, Jr.(1), Chairman John H. Dobkin(1) Michael J. Downey(1) William H. Foulk, Jr.(1) D. James Guzy(1) | | Nancy P. Jacklin(1) Robert M. Keith, President and Chief Executive Officer Carol C. McMullen(1) Garry L. Moody(1) Earl D. Weiner(1) |
OFFICERS
| | |
Philip L. Kirstein, Senior Vice President and Independent Compliance Officer Kurt A. Feuerman(2), Vice President Anthony Nappo(2), Vice President Emilie D. Wrapp, Secretary | | Joseph J. Mantineo, Treasurer and Chief Financial Officer Phyllis J. Clarke, Controller Vincent S. Noto, Chief Compliance Officer |
| | |
Custodian and Accounting Agent Brown Brothers Harriman & Co. 50 Post Office Square Boston, MA 02110 Principal Underwriter AllianceBernstein Investments, Inc. 1345 Avenue of the Americas New York, NY 10105 Legal Counsel Seward & Kissel LLP One Battery Park Plaza New York, NY 10004 | | Independent Registered Public Accounting Firm Ernst & Young LLP 5 Times Square New York, NY 10036 Transfer Agent AllianceBernstein Investor Services, Inc. P.O. Box 786003 San Antonio, TX 78278-6003 Toll-Free 1-(800) 221-5672 |
| 1 | Member of the Audit Committee, the Governance and Nominating Committee and the Independent Directors Committee. |
| 2 | Messrs. Kurt A. Feuerman and Anthony Nappo are the investment professionals primarily responsible for the day-to-day management of, and investment decisions for, the Fund’s Portfolio. |
| | |
| abfunds.com | | AB SELECT US EQUITY PORTFOLIO | 47 |
MANAGEMENT OF THE FUND
Board of Directors Information
The business and affairs of the Fund are managed under the direction of the Board of Directors. Certain information concerning the Fund’s Directors is set forth below.
| | | | | | | | |
NAME,
ADDRESS,* AGE AND
(YEAR FIRST ELECTED**) | | PRINCIPAL
OCCUPATION(S) DURING PAST FIVE YEARS
AND OTHER
INFORMATION*** | | PORTFOLIOS
IN FUND
COMPLEX
OVERSEEN BY
DIRECTOR | | | OTHER PUBLIC
DIRECTORSHIPS
CURRENTLY HELD BY
DIRECTOR |
| INTERESTED DIRECTOR | | | | | | | | |
Robert M. Keith, + 1345 Avenue of the Americas New York, NY 10105 57 (2011) | | Senior Vice President of AllianceBernstein L.P. (the “Adviser”) and the head of AllianceBernstein Investments, Inc. (“ABI”) since July 2008; Director of ABI and President of the AB Mutual Funds. Previously, he served as Executive Managing Director of ABI from December 2006 to June 2008. Prior to joining ABI in 2006, Executive Managing Director of Bernstein Global Wealth Management, and prior thereto, Senior Managing Director and Global Head of Client Service and Sales of the Adviser’s institutional investment management business since 2004. Prior thereto, he was Managing Director and Head of North American Client Service and Sales in the Adviser’s institutional investment management business, with which he had been associated since prior to 2004. | | | 97 | | | None |
| | | | | | | | |
| | |
| 48 | AB SELECT US EQUITY PORTFOLIO | | abfunds.com |
MANAGEMENT OF THE FUND (continued)
| | | | | | | | |
NAME,
ADDRESS,* AGE AND
(YEAR FIRST ELECTED**) | | PRINCIPAL
OCCUPATION(S) DURING PAST FIVE YEARS
AND OTHER
INFORMATION*** | | PORTFOLIOS
IN FUND
COMPLEX
OVERSEEN BY
DIRECTOR | | | OTHER PUBLIC
DIRECTORSHIPS
CURRENTLY HELD BY
DIRECTOR |
| DISINTERESTED DIRECTORS | | | | | | |
Marshall C. Turner, Jr., # Chairman of the Board
75 (2011) | | Private Investor since prior to 2012. Former Chairman and CEO of Dupont Photomasks, Inc. (components of semi-conductor manufacturing). He has extensive operating leadership, and venture capital investing experience, including five interim or full-time CEO roles, and prior service as general partner of institutional venture capital partnerships. He also has extensive non-profit board leadership experience, and currently serves on the boards of two education and science-related non-profit organizations. He has served as a director of one AB Fund since 1992, and director or trustee of multiple AB Funds since 2005. He has been Chairman of the AB Funds since January 2014, and the Chairman of the Independent Directors Committees of such AB Funds since February 2014. | | | 97 | | | Xilinx, Inc. (programmable logic semi-conductors) since 2007 |
| | | | | | | | |
John H. Dobkin, # 75 (2011) | | Independent Consultant since prior to 2012. Formerly, President of Save Venice, Inc. (preservation organization) from 2001-2002; Senior Advisor from June 1999-June 2000 and President of Historic Hudson Valley (historic preservation) from December 1989-May 1999. Previously, Director of the National Academy of Design. He has served as a director or trustee of various AB Funds since 1992, and as Chairman of the Audit Committees of a number of such AB Funds from 2001-2008. | | | 96 | | | None |
| | | | | | | | |
| | |
| abfunds.com | | AB SELECT US EQUITY PORTFOLIO | 49 |
MANAGEMENT OF THE FUND (continued)
| | | | | | | | |
NAME,
ADDRESS,* AGE AND
(YEAR FIRST ELECTED**) | | PRINCIPAL
OCCUPATION(S) DURING PAST FIVE YEARS
AND OTHER
INFORMATION*** | | PORTFOLIOS
IN FUND
COMPLEX
OVERSEEN BY
DIRECTOR | | | OTHER PUBLIC
DIRECTORSHIPS
CURRENTLY HELD BY
DIRECTOR |
DISINTERESTED DIRECTORS
(continued) | | | | | | |
Michael J. Downey, # 73 (2011) | | Private Investor since prior to 2012. Formerly, managing partner of Lexington Capital, LLC (investment advisory firm) from December 1997 until December 2003. He served as a Director of Prospect Acquisition Corp. (financial services) from 2007 until 2009. From 1987 until 1993, Chairman and CEO of Prudential Mutual Fund Management, director of the Prudential mutual funds, and member of the Executive Committee of Prudential Securities Inc. He has served as a director or trustee of the AB Funds since 2005 and is a director and Chairman of one other registered investment company. | | | 97 | | | The Asia Pacific Fund, Inc. (registered investment company) since prior to 2012 |
| | | | | | | | |
William H. Foulk, Jr., # 84 (2011) | | Investment Adviser and an Independent Consultant since prior to 2012. Previously, he was Senior Manager of Barrett Associates, Inc., a registered investment adviser. He was formerly Deputy Comptroller and Chief Investment Officer of the State of New York and, prior thereto, Chief Investment Officer of the New York Bank for Savings. He has served as a director or trustee of various AB Funds since 1983, and was Chairman of the Independent Directors Committees of the AB Funds from 2003 until early February 2014. He served as Chairman of such Funds from 2003 through December 2013. He is also active in a number of mutual fund related organizations and committees. | | | 97 | | | None |
| | | | | | | | |
| | |
| 50 | AB SELECT US EQUITY PORTFOLIO | | abfunds.com |
MANAGEMENT OF THE FUND (continued)
| | | | | | | | |
NAME,
ADDRESS,* AGE AND
(YEAR FIRST ELECTED**) | | PRINCIPAL
OCCUPATION(S) DURING PAST FIVE YEARS
AND OTHER
INFORMATION*** | | PORTFOLIOS
IN FUND
COMPLEX
OVERSEEN BY
DIRECTOR | | | OTHER PUBLIC
DIRECTORSHIPS
CURRENTLY HELD BY
DIRECTOR |
DISINTERESTED DIRECTORS
(continued) | | | | | | |
D. James Guzy, # 81 (2011) | | Chairman of the Board of SRC Computers, Inc. (semi-conductors), with which he has been associated since prior to 2012. He served as Chairman of the Board of PLX Technology (semi-conductors) since prior to 2012 until November 2013. He was a director of Intel Corporation (semi-conductors) from 1969 until 2008, and served as Chairman of the Finance Committee of such company for several years until May 2008. He has served as a director or trustee of one or more of the AB Funds since 1982. | | | 94 | | | None |
| | | | | | | | |
Nancy P. Jacklin, # 69 (2011) | | Private Investor since prior to 2012. Professorial Lecturer at the Johns Hopkins School of Advanced International Studies (2008-2015). U.S. Executive Director of the International Monetary Fund (which is responsible for ensuring the stability of the international monetary system), (December 2002-May 2006); Partner, Clifford Chance (1992-2002); Sector Counsel, International Banking and Finance, and Associate General Counsel, Citicorp (1985-1992); Assistant General Counsel (International), Federal Reserve Board of Governors (1982-1985); and Attorney Advisor, U.S. Department of the Treasury (1973-1982). Member of the Bar of the District of Columbia and of New York; and member of the Council on Foreign Relations. She has served as a director or trustee of the AB Funds since 2006 and has been Chairman of the Governance and Nominating Committees of the AB Funds since August 2014. | | | 97 | | | None |
| | |
| abfunds.com | | AB SELECT US EQUITY PORTFOLIO | 51 |
MANAGEMENT OF THE FUND (continued)
| | | | | | | | |
NAME,
ADDRESS,* AGE AND
(YEAR FIRST ELECTED**) | | PRINCIPAL
OCCUPATION(S) DURING PAST FIVE YEARS
AND OTHER
INFORMATION*** | | PORTFOLIOS
IN FUND
COMPLEX
OVERSEEN BY
DIRECTOR | | | OTHER PUBLIC
DIRECTORSHIPS
CURRENTLY HELD BY
DIRECTOR |
DISINTERESTED DIRECTORS
(continued) | | | | | | |
Carol C. McMullen, # 62 (2016) | | Managing Director of Slalom Consulting (consulting) since 2014, private investor and member of the Partners Healthcare Investment Committee. Formerly, Director of Norfolk & Dedham Group (mutual property and casualty insurance) from 2011 until November 2016; Director of Partners Community Physicians Organization (healthcare) from 2014 until December 2016; and Managing Director of The Crossland Group (consulting) from 2012 until 2013. She has held a number of senior positions in the asset and wealth management industries, including at Eastern Bank (where her roles included President of Eastern Wealth Management), Thomson Financial (Global Head of Sales for Investment Management), and Putnam Investments (where her roles included Head of Global Investment Research). She has served on a number of private company and nonprofit boards, and as a director or trustee of the AB Funds since June 2016. | | | 97 | | | None |
| | | | | | | | |
| | |
| 52 | AB SELECT US EQUITY PORTFOLIO | | abfunds.com |
MANAGEMENT OF THE FUND (continued)
| | | | | | | | |
NAME,
ADDRESS,* AGE AND
(YEAR FIRST ELECTED**) | | PRINCIPAL
OCCUPATION(S) DURING PAST FIVE YEARS
AND OTHER
INFORMATION*** | | PORTFOLIOS
IN FUND
COMPLEX
OVERSEEN BY
DIRECTOR | | | OTHER PUBLIC
DIRECTORSHIPS
CURRENTLY HELD BY
DIRECTOR |
DISINTERESTED DIRECTORS
(continued) | | | | | | |
Garry L. Moody, # 65 (2011) | | Independent Consultant. Formerly, Partner, Deloitte & Touche LLP (1995-2008) where he held a number of senior positions, including Vice Chairman, and U.S. and Global Investment Management Practice Managing Partner; President, Fidelity Accounting and Custody Services Company (1993-1995), where he was responsible for the accounting, pricing, custody and reporting for the Fidelity mutual funds; and Partner, Ernst & Young LLP (1975-1993), where he served as the National Director of Mutual Fund Tax Services and Managing Partner of its Chicago Office Tax department. He is a member of the Trustee Advisory Board of BoardIQ, a biweekly publication focused on issues and news affecting directors of mutual funds. He has served as a director or trustee and as Chairman of the Audit Committees of the AB Funds since 2008. | | | 97 | | | None |
Earl D. Weiner, # 78 (2011) | | Of Counsel, and Partner prior to January 2007, of the law firm Sullivan & Cromwell LLP and is a former member of ABA Federal Regulation of Securities Committee Task Force to draft editions of the Fund Director’s Guidebook. He also serves as a director or trustee of various non-profit organizations and has served as Chairman or Vice Chairman of a number of them. He has served as a director or trustee of the AB Funds since 2007 and served as Chairman of the Governance and Nominating Committees of the AB Funds from 2007 until August 2014. | | | 97 | | | None |
| | |
| abfunds.com | | AB SELECT US EQUITY PORTFOLIO | 53 |
MANAGEMENT OF THE FUND (continued)
| * | The address for each of the Fund’s disinterested Directors is c/o AllianceBernstein L.P. Attention: Philip L. Kirstein, 1345 Avenue of the Americas, New York, NY 10105. |
| ** | There is no stated term of office for the Fund’s Directors. |
| *** | The information above includes each Director’s principal occupation during the last five years and other information relating to the experience, attributes, and skills relevant to each Director’s qualifications to serve as a Director, which led to the conclusion that each Director should serve as a Director for the Fund. |
| + | Mr. Keith is an “interested person” of the Fund, as defined in the 1940 Act, due to his position as a Senior Vice President of the Adviser. |
| # | Member of the Audit Committee, the Governance and Nominating Committee and the Independent Directors Committee. |
| | |
| 54 | AB SELECT US EQUITY PORTFOLIO | | abfunds.com |
MANAGEMENT OF THE FUND (continued)
Officer Information
Certain information concerning the Fund’s Officers is listed below:
| | | | |
NAME, ADDRESS* AND AGE | | POSITION(S) HELD WITH FUND | | PRINCIPAL OCCUPATION DURING PAST FIVE YEARS |
Robert M. Keith 57 | | President and Chief Executive Officer | | See biography above. |
| | | | |
Philip L. Kirstein 72 | | Senior Vice President and Independent Compliance Officer | | Senior Vice President and Independent Compliance Officer of the AB Funds, with which he has been associated since October 2004. Prior thereto, he was Of Counsel to Kirkpatrick & Lockhart, LLP from October 2003 to October 2004, and General Counsel of Merrill Lynch Investment Managers, L.P., since prior to March 2003. |
| | | | |
Kurt A. Feuerman 61 | | Vice President | | Senior Vice President of the Adviser**, with which he has been associated since prior to 2012. |
| | | | |
Anthony Nappo 45 | | Vice President | | Senior Vice President of the Adviser**, with which he been associated since prior to 2012. |
| | | | |
Emilie D. Wrapp 61 | | Secretary | | Senior Vice President, Assistant General Counsel and Assistant Secretary of ABI**, with which she has been associated since prior to 2012. |
| | | | |
Joseph J. Mantineo 58 | | Treasurer and Chief Financial Officer | | Senior Vice President of AllianceBernstein Investor Services (“ABIS”)**, with which he has been associated since prior to 2012. |
| | | | |
Phyllis J. Clarke 56 | | Controller | | Vice President of ABIS**, with which she has been associated since prior to 2012. |
| | | | |
Vincent S. Noto 52 | | Chief Officer | | Senior Vice President since 2015 and Mutual Fund Chief Compliance Officer of the Adviser** since 2014. Prior thereto, he was Vice President and Director of Mutual Fund Compliance of the Adviser** since 2012. |
| * | The address for each of the Fund’s Officers is 1345 Avenue of the Americas, New York, NY 10105. |
| ** | The Adviser, ABI and ABIS are affiliates of the Fund. |
| | The Fund’s Statement of Additional Information (“SAI”) has additional information about the Fund’s Directors and Officers and is available without charge upon request. Contact your financial representative or AB at 1-(800) 227-4618, or visit www.abfunds.com, for a free prospectus or SAI. |
| | |
| abfunds.com | | AB SELECT US EQUITY PORTFOLIO | 55 |
Information Regarding the Review and Approval of the Fund’s Advisory Agreement
The disinterested directors (the “directors”) of AB Cap Fund, Inc. (the “Company”) unanimously approved the continuance of the Company’s Advisory Agreement with the Adviser in respect of AB Select US Equity Portfolio (the “Fund”) at a meeting held on May 2-4, 2017 (the “Meeting”).
Prior to approval of the continuance of the Advisory Agreement, the directors had requested from the Adviser, and received and evaluated, extensive materials. They reviewed the proposed continuance of the Advisory Agreement with the Adviser and with experienced counsel who are independent of the Adviser, who advised on the relevant legal standards. The directors also reviewed an independent evaluation prepared by the Company’s Senior Officer (who is also the Company’s Independent Compliance Officer), who acted as their independent fee consultant, of the reasonableness of the advisory fee, in which the Senior Officer concluded that the contractual fee for the Fund was reasonable. The directors also discussed the proposed continuance in private sessions with counsel and the Company’s Senior Officer.
The directors considered their knowledge of the nature and quality of the services provided by the Adviser to the Fund gained from their experience as directors or trustees of most of the registered investment companies advised by the Adviser, their overall confidence in the Adviser’s integrity and competence they have gained from that experience, the Adviser’s initiative in identifying and raising potential issues with the directors and its responsiveness, frankness and attention to concerns raised by the directors in the past, including the Adviser’s willingness to consider and implement organizational and operational changes designed to improve investment results and the services provided to the AB Funds. The directors noted that they have four regular meetings each year, at each of which they review extensive materials and information from the Adviser, including information on the investment performance of the Fund.
The directors also considered all factors they believed relevant, including the specific matters discussed below. During the course of their deliberations, the directors evaluated, among other things, the reasonableness of the advisory fee. The directors did not identify any particular information that was all-important or controlling, and different directors may have attributed different weights to the various factors. The directors determined that the selection of the Adviser to manage the Fund and the overall arrangements between the Fund and the Adviser, as provided in the Advisory Agreement, including the advisory fee, were fair and reasonable in light of the services performed, expenses incurred and such other matters as the directors considered relevant in the exercise of their business judgment.
| | |
| 56 | AB SELECT US EQUITY PORTFOLIO | | abfunds.com |
The material factors and conclusions that formed the basis for the directors’ determinations included the following:
Nature, Extent and Quality of Services Provided
The directors considered the scope and quality of services provided by the Adviser under the Advisory Agreement, including the quality of the investment research capabilities of the Adviser and the other resources it has dedicated to performing services for the Fund. They also noted the professional experience and qualifications of the Fund’s portfolio management team and other senior personnel of the Adviser. The directors also considered that the Advisory Agreement provides that the Fund will reimburse the Adviser for the cost to it of providing certain clerical, accounting, administrative and other services to the Fund by employees of the Adviser or its affiliates. Requests for these reimbursements are made on a quarterly basis and subject to approval by the directors. Reimbursements, to the extent requested and paid, result in a higher rate of total compensation from the Fund to the Adviser than the fee rate stated in the Advisory Agreement. The directors noted that the methodology used to determine the reimbursement amounts had been reviewed by an independent consultant retained by the Company’s Senior Officer. The quality of administrative and other services, including the Adviser’s role in coordinating the activities of the Fund’s other service providers, also was considered. The directors concluded that, overall, they were satisfied with the nature, extent and quality of services provided to the Fund under the Advisory Agreement.
Costs of Services Provided and Profitability
The directors reviewed a schedule of the revenues and expenses and related notes indicating the profitability of the Fund to the Adviser for calendar years 2015 and 2016 that had been prepared with an expense allocation methodology arrived at in consultation with an independent consultant retained by the Company’s Senior Officer. The directors noted the assumptions and methods of allocation used by the Adviser in preparing fund-specific profitability data and understood that there are a number of potentially acceptable allocation methodologies for information of this type. The directors noted that the profitability information reflected all revenues and expenses of the Adviser’s relationship with the Fund, including those relating to its subsidiaries that provide transfer agency, distribution and brokerage services to the Fund. The directors recognized that it is difficult to make comparisons of the profitability of the Advisory Agreement with the profitability of advisory contracts for unaffiliated funds because comparative information is not generally publicly available and is affected by numerous factors. The directors focused on the profitability of the Adviser’s relationship with the Fund before taxes and distribution expenses. The directors concluded that the Adviser’s level of profitability from its relationship with the Fund was not unreasonable.
| | |
| abfunds.com | | AB SELECT US EQUITY PORTFOLIO | 57 |
Fall-Out Benefits
The directors considered the other benefits to the Adviser and its affiliates from their relationships with the Fund, including, but not limited to, benefits relating to soft dollar arrangements (whereby investment advisers receive brokerage and research services from brokers that execute agency transactions for their clients); 12b-1 fees and sales charges received by the Fund’s principal underwriter (which is a wholly owned subsidiary of the Adviser) in respect of certain classes of the Fund’s shares; brokerage commissions paid by the Fund to brokers affiliated with the Adviser; and transfer agency fees paid by the Fund to a wholly owned subsidiary of the Adviser. The directors recognized that the Adviser’s profitability would be somewhat lower without these benefits. The directors understood that the Adviser also might derive reputational and other benefits from its association with the Fund.
Investment Results
In addition to the information reviewed by the directors in connection with the Meeting, the directors receive detailed performance information for the Fund at each regular Board meeting during the year.
At the Meeting, the directors reviewed information prepared by an analytical service that is not affiliated with the Adviser (the “15(c) service provider”), showing the performance of the Class A Shares of the Fund against a peer group and a peer universe, and information prepared by the Adviser showing performance of the Class A Shares against a broad-based securities market index, in each case for the 1-, 3- and 5-year periods ended February 28, 2017 and (in the case of comparisons with the broad-based securities market index) for the period from inception. Based on their review, the directors concluded that the Fund’s investment performance was acceptable.
Advisory Fees and Other Expenses
The directors considered the advisory fee rate paid by the Fund to the Adviser and information prepared by the 15(c) service provider concerning advisory fee rates paid by other funds in the same category as the Fund at a common asset level. The directors recognized that it is difficult to make comparisons of advisory fees because there are variations in the services that are included in the fees paid by other funds. The directors compared the Fund’s contractual advisory fee rate with a peer group median and took into account the impact on the advisory fee rate of the administrative expense reimbursement paid to the Adviser in the latest fiscal year.
The directors also considered the Adviser’s fee schedule for institutional clients pursuing a similar investment style. For this purpose, they reviewed the relevant advisory fee information from the Adviser’s Form ADV and the evaluation from the Company’s Senior Officer and noted the differences between the Fund’s fee schedule, on the one hand, and the institutional
| | |
| 58 | AB SELECT US EQUITY PORTFOLIO | | abfunds.com |
fee schedule and the schedule of fees charged to any offshore funds and any sub-advised funds, on the other. The directors noted that the Adviser may, in some cases, agree to fee rates with large institutional clients that are lower than those reviewed by the directors and that they had previously discussed with the Adviser its policies in respect of such arrangements.
The Adviser reviewed with the directors the significantly greater scope of the services it provides to the Fund relative to institutional, offshore fund and sub-advised fund clients. In light of the substantial differences in services rendered by the Adviser to institutional, offshore fund and sub-advised fund clients as compared to funds such as the Fund, the directors considered these fee comparisons inapt and did not place significant weight on them in their deliberations.
The directors noted that the Fund invests in shares of exchange-traded funds (“ETFs”), subject to the restrictions and limitations of the Investment Company Act of 1940 as these may be varied as a result of exemptive orders issued by the SEC. The directors also noted that ETFs pay advisory fees pursuant to their advisory contracts, and that the Adviser had provided, and they had reviewed, information about the expense ratios of the relevant ETFs. The directors concluded, based on the Adviser’s explanation of how it uses ETFs when they are the most cost-effective way to obtain desired exposures for a fund or to temporarily “equitize” cash inflows pending purchases of underlying securities, that the advisory fee for the Fund is paid for services that are in addition to, rather than duplicative of, the services provided under the advisory contracts of the ETFs.
The directors also considered the total expense ratio of the Class A shares of the Fund in comparison to a peer group and a peer universe selected by the 15(c) service provider. The Class A expense ratio of the Fund was based on the Fund’s latest fiscal year and the directors considered the effects of any fee waivers and/or expense reimbursements as a result of the Adviser’s expense cap. The directors noted that it was likely that the expense ratios of some of the other funds in the Fund’s category were lowered by waivers or reimbursements by those funds’ investment advisers, which in some cases might be voluntary or temporary. The directors view expense ratio information as relevant to their evaluation of the Adviser’s services because the Adviser is responsible for coordinating services provided to the Fund by others. The directors noted that the Fund’s expense ratio was above the medians. After reviewing and discussing the Adviser’s explanations of the reasons for this, the directors concluded that the Fund’s expense ratio was acceptable.
Economies of Scale
The directors noted that the advisory fee schedule for the Fund does not contain breakpoints, and that they had discussed their strong preference for breakpoints in advisory contracts with the Adviser. The directors took
| | |
| abfunds.com | | AB SELECT US EQUITY PORTFOLIO | 59 |
into consideration prior presentations by an independent consultant on economies of scale in the mutual fund industry and for the AB Funds, and by the Adviser concerning certain of its views on economies of scale. The directors also had requested and received from the Adviser certain updates on economies of scale in advance of the Meeting. The directors believe that economies of scale may be realized (if at all) by the Adviser across a variety of products and services, and not only in respect of a single fund. The directors noted that there is no established methodology for setting breakpoints that give effect to the fund-specific services provided by a fund’s adviser and to the economies of scale that an adviser may realize in its overall mutual fund business or those components of it which directly or indirectly affect a fund’s operations. The directors observed that in the mutual fund industry as a whole, as well as among funds similar to the Fund, there is no uniformity or pattern in the fees and asset levels at which breakpoints (if any) apply. The directors also noted that the advisory agreements for many funds do not have breakpoints at all. The directors informed the Adviser that they would monitor the Fund’s assets (which were well below the level at which they would anticipate adding an initial breakpoint) and its profitability to the Adviser and anticipated revisiting the question of breakpoints in the future if circumstances warranted doing so.
| | |
| 60 | AB SELECT US EQUITY PORTFOLIO | | abfunds.com |
This page is not part of the Shareholder Report or the Financial Statements.
AB FAMILY OF FUNDS
US EQUITY
US CORE
Core Opportunities Fund
Select US Equity Portfolio
US GROWTH
Concentrated Growth Fund
Discovery Growth Fund
Growth Fund
Large Cap Growth Fund
Small Cap Growth Portfolio
US VALUE
Discovery Value Fund
Equity Income Fund
Relative Value Fund1
Small Cap Value Portfolio
Value Fund
INTERNATIONAL/ GLOBAL EQUITY
INTERNATIONAL/ GLOBAL CORE
Global Core Equity Portfolio
International Portfolio
International Strategic Core Portfolio
Sustainable Global Thematic Fund1
Tax-Managed International Portfolio
Tax-Managed Wealth Appreciation Strategy
Wealth Appreciation Strategy
INTERNATIONAL/ GLOBAL GROWTH
Concentrated International Growth Portfolio
International Growth Fund
INTERNATIONAL/ GLOBAL EQUITY (continued)
INTERNATIONAL/ GLOBAL VALUE
Asia ex-Japan Equity Portfolio
International Value Fund
FIXED INCOME
MUNICIPAL
High Income Municipal Portfolio
Intermediate California Municipal Portfolio
Intermediate Diversified Municipal Portfolio
Intermediate New York Municipal Portfolio
Municipal Bond Inflation Strategy
Tax-Aware Fixed Income Portfolio
National Portfolio
Arizona Portfolio
California Portfolio
Massachusetts Portfolio
Minnesota Portfolio
New Jersey Portfolio
New York Portfolio
Ohio Portfolio
Pennsylvania Portfolio
Virginia Portfolio
TAXABLE
Bond Inflation Strategy
Global Bond Fund
High Income Fund
High Yield Portfolio
Income Fund
Intermediate Bond Portfolio
Limited Duration High Income Portfolio
Short Duration Portfolio
ALTERNATIVES
All Market Real Return Portfolio
Credit Long/Short Portfolio
Global Real Estate Investment Fund
Select US Long/Short Portfolio
Unconstrained Bond Fund
MULTI-ASSET
All Market Income Portfolio
All Market Total Return Portfolio1
Conservative Wealth Strategy
Emerging Markets Multi-Asset Portfolio
Global Risk Allocation Fund
Tax-Managed All Market Income Portfolio1
TARGET-DATE
Multi-Manager Select Retirement Allocation Fund
Multi-Manager Select 2010 Fund
Multi-Manager Select 2015 Fund
Multi-Manager Select 2020 Fund
Multi-Manager Select 2025 Fund
Multi-Manager Select 2030 Fund
Multi-Manager Select 2035 Fund
Multi-Manager Select 2040 Fund
Multi-Manager Select 2045 Fund
Multi-Manager Select 2050 Fund
Multi-Manager Select 2055 Fund
CLOSED-END FUNDS
Alliance California Municipal Income Fund
AllianceBernstein Global High Income Fund
AllianceBernstein National Municipal Income Fund
We also offer Government Exchange Reserves, which serves as the money market fund exchange vehicle for the AB mutual funds. An investment in Government Exchange Reserves is not a deposit in a bank and is not insured or guaranteed by the Federal Deposit Insurance Corporation or any other government agency. Although the Fund seeks to preserve the value of your investment at $1.00 per share, it is possible to lose money by investing in the Fund.
Investors should consider the investment objectives, risks, charges and expenses of the Fund carefully before investing. For copies of our prospectus or summary prospectus, which contain this and other information, visit us online at www.abfunds.com or contact your AB representative. Please read the prospectus and/or summary prospectus carefully before investing.
| 1 | Prior to November 1, 2016, Sustainable Global Thematic Fund was named Global Thematic Growth Fund; prior to January 9, 2017, Relative Value Fund was named Growth & Income Fund; prior to April 17, 2017, Tax-Managed All Market Income Portfolio was named Tax-Managed Balanced Wealth Strategy; prior to April 24, 2017, All Market Total Return Portfolio was named Balanced Wealth Strategy. |
| | |
| abfunds.com | | AB SELECT US EQUITY PORTFOLIO | 61 |
NOTES
| | |
| 62 | AB SELECT US EQUITY PORTFOLIO | | abfunds.com |
NOTES
| | |
| abfunds.com | | AB SELECT US EQUITY PORTFOLIO | 63 |
NOTES
| | |
| 64 | AB SELECT US EQUITY PORTFOLIO | | abfunds.com |
NOTES
| | |
| abfunds.com | | AB SELECT US EQUITY PORTFOLIO | 65 |
NOTES
| | |
| 66 | AB SELECT US EQUITY PORTFOLIO | | abfunds.com |
NOTES
| | |
| abfunds.com | | AB SELECT US EQUITY PORTFOLIO | 67 |
NOTES
| | |
| 68 | AB SELECT US EQUITY PORTFOLIO | | abfunds.com |

AB SELECT US EQUITY PORTFOLIO
1345 Avenue of the Americas
New York, NY 10105
800 221 5672
SUE-0151-0617 
JUN 06.30.17
ANNUAL REPORT
AB SELECT US LONG/SHORT PORTFOLIO


| | |
| |
| Investment Products Offered | | • Are Not FDIC Insured • May Lose Value • Are Not Bank Guaranteed |
Investors should consider the investment objectives, risks, charges and expenses of the Fund carefully before investing. For copies of our prospectus or summary prospectus, which contain this and other information, visit us online at www.abfunds.com or contact your AB representative. Please read the prospectus and/or summary prospectus carefully before investing.
This shareholder report must be preceded or accompanied by the Fund’s prospectus for individuals who are not current shareholders of the Fund.
You may obtain a description of the Fund’s proxy voting policies and procedures, and information regarding how the Fund voted proxies relating to portfolio securities during the most recent 12-month period ended June 30, without charge. Simply visit AB’s website at www.abfunds.com, or go to the Securities and Exchange Commission’s (the “Commission”) website at www.sec.gov, or call AB at (800) 227 4618.
The Fund files its complete schedule of portfolio holdings with the Commission for the first and third quarters of each fiscal year on Form N-Q. The Fund’s Forms N-Q are available on the Commission’s website at www.sec.gov. The Fund’s Forms N-Q may also be reviewed and copied at the Commission’s Public Reference Room in Washington, DC; information on the operation of the Public Reference Room may be obtained by calling (800) SEC 0330. AB publishes full portfolio holdings for the Fund monthly at www.abfunds.com.
AllianceBernstein Investments, Inc. (ABI) is the distributor of the AB family of mutual funds. ABI is a member of FINRA and is an affiliate of AllianceBernstein L.P., the Adviser of the funds.
The [A/B] logo is a registered service mark of AllianceBernstein and AllianceBernstein® is a registered service mark used by permission of the owner, AllianceBernstein L.P.
| | |
| FROM THE PRESIDENT | |  |
Dear Shareholder,
We are pleased to provide this report for AB Select US Long/Short Portfolio (the “Fund”). Please review the discussion of Fund performance, the market conditions during the reporting period and the Fund’s investment strategy.
As always, AB strives to keep clients ahead of what’s next by:
| + | | Transforming uncommon insights into uncommon knowledge with a global research scope |
| + | | Navigating markets with seasoned investment experience and sophisticated solutions |
| + | | Providing thoughtful investment insights and actionable ideas |
Whether you’re an individual investor or a multi-billion-dollar institution, we put knowledge and experience to work for you.
AB’s global research organization connects and collaborates across platforms and teams to deliver impactful insights and innovative products. Better insights lead to better opportunities—anywhere in the world.
For additional information about AB’s range of products and shareholder resources, please log on to www.abfunds.com.
Thank you for your investment in the AB Mutual Funds.
Sincerely,

Robert M. Keith
President and Chief Executive Officer, AB Mutual Funds
| | |
| abfunds.com | | AB SELECT US LONG/SHORT PORTFOLIO | 1 |
ANNUAL REPORT
August 11, 2017
This report provides management’s discussion of fund performance for AB Select US Long/Short Portfolio for the annual reporting period ended June 30, 2017.
The Fund’s investment objective is long-term growth of capital.
NAV RETURNS AS OF JUNE 30, 2017 (unaudited)
| | | | | | | | |
| | | 6 Months | | | 12 Months | |
| AB SELECT US LONG/SHORT PORTFOLIO | | | | | | | | |
| Class A | | | 3.98% | | | | 7.72% | |
| Class C | | | 3.58% | | | | 6.94% | |
| Advisor Class1 | | | 4.10% | | | | 7.99% | |
| Class R1 | | | 3.85% | | | | 7.43% | |
| Class K1 | | | 3.89% | | | | 7.72% | |
| Class I1 | | | 4.10% | | | | 8.07% | |
| S&P 500 Index | | | 9.34% | | | | 17.90% | |
| 1 | Please note that these share classes are for investors purchasing shares through accounts established under certain fee-based programs sponsored and maintained by certain broker-dealers and financial intermediaries, institutional pension plans and/or investment advisory clients of, and certain other persons associated with, the Adviser and its affiliates or the Fund. |
INVESTMENT RESULTS
The table above shows the Fund’s performance compared to its benchmark, the Standard & Poor’s (“S&P”) 500 Index, for the six- and 12-month periods ended June 30, 2017.
All share classes underperformed the benchmark for both periods, before sales charges. During the 12-month period, the Fund’s net market exposure ranged from 44% to 60%, ending the period at 58%. The Fund’s below-market exposure led to underperformance relative to the fully invested benchmark; however, the Fund’s security selection within both its long and short holdings contributed to absolute returns. Within the Fund’s long holdings, gains from selection in the technology, financials and consumer discretionary sectors more than offset losses from selection within consumer staples, energy and health care. Within the Fund’s short holdings, gains associated with market and sector hedges, as well as short selection within real estate, more than offset losses associated with selection in technology, industrials and financials.
During the six-month period, the Fund’s net market exposure ranged from 53% to 58%, ending the period at 58%. As in the 12-month period, the
| | |
| 2 | AB SELECT US LONG/SHORT PORTFOLIO | | abfunds.com |
Fund’s below-market exposure and short selection led to underperformance relative to the fully invested benchmark; however, the Fund’s security selection within its long holdings contributed to absolute returns. Within the Fund’s long holdings, gains from selection in the technology, health care, consumer discretionary, utilities and real estate sectors more than offset losses from selection within energy, financials, consumer staples and telecommunications. Within the Fund’s short holdings, gains from selection within real estate and consumer discretionary were more than offset by losses from market and sector hedges and selection within industrials and technology.
The Fund utilized derivatives in the form of written options and total return swaps for investment purposes, as well as futures for hedging purposes, which had an immaterial impact on absolute performance during both periods.
MARKET REVIEW AND INVESTMENT STRATEGY
At the start of the 12-month period ended June 30, 2017, fears of rising interest rates led defensive stocks to underperform, while cyclical stocks outperformed. Despite a surprising outcome in the November US elections, and an increase in the fed funds rate by the US Federal Reserve (the “Fed”), markets rallied at the end of 2016.
In the six-month period, the S&P 500 continued its push higher. However, enthusiasm waned as investors questioned the Republican Party’s ability to pass pro-growth policies, the Fed raised the fed funds rate again in March, long-term interest rates declined and oil prices faced significant volatility. This confluence of factors led value stocks to underperform, while growth stocks outperformed during the first half of 2017. At the end of the reporting period, the Fed released positive stress test results, leading to strong performance in financial stocks. The S&P 500 Index returned 17.90% in the 12-month period and 9.34% over the six-month period.
INVESTMENT POLICIES
Under normal circumstances, the Fund invests at least 80% of its net assets in equity securities of US companies, short positions in such securities, and cash and US cash equivalents.
The Adviser selects investments for the Fund’s long positions through an intensive “bottom-up” approach that places an emphasis on companies that are engaged in business activities with solid long-term growth potential and high barriers to entry, that have strong cash flows and other financial metrics, and that have transparent financial statements and business models. The Adviser also evaluates the quality of company management based on a series of criteria, includ-
(continued on next page)
| | |
| abfunds.com | | AB SELECT US LONG/SHORT PORTFOLIO | 3 |
ing: (1) management’s focus on shareholder returns, such as through a demonstrated commitment to dividends and dividend growth, share buybacks or other shareholder-friendly corporate actions; (2) management’s employment of conservative accounting methodologies; (3) management incentives, such as direct equity ownership; and (4) management accessibility. The Adviser seeks to identify companies where events or catalysts may drive the company’s share price higher, such as earnings and/or revenue growth above consensus forecasts, potential market recognition of undervaluation or overstated market-risk discount, or the institution of any of the shareholder-friendly practices discussed in the preceding sentence. In light of this catalyst-focused approach, the Adviser expects to engage in active and frequent trading for the Fund.
The Adviser may reduce or eliminate the Fund’s holdings in a company’s securities for a number of reasons, including if its evaluation of the above factors changes adversely, if the anticipated events or catalysts do not occur or do not affect the price of the securities as expected, or if the anticipated events or catalysts do occur and cause the securities to be, in the Adviser’s view, overvalued or fully valued. At any given time the Fund may emphasize growth stocks over value stocks, or vice versa.
In determining securities to be sold short, the Adviser looks for companies facing near-term difficulties such as high valuations, quality of earnings issues, or weakness in demand due to economic factors or long-term issues such as changing technology or competitive concerns in their industries. The Fund may also sell securities of exchange-traded funds (“ETFs”) short, including to hedge its exposure to specific market sectors or if it believes a specific sector or asset will decline in value. When the Fund sells securities short, it sells a stock that it does not own (but has borrowed) at its current market price in anticipation that the price of the stock will decline. To complete, or close out, the short sale transaction, the Fund buys the same stock in the market at a later date and returns it to the lender.
The Adviser derives the ratio between long and short positions for the Fund based on its bottom-up analysis supplemented with macro-economic and market analyses. Under normal market conditions, the net long exposure of the Fund (long exposure minus short exposure) will range between 30% and 70%. The Adviser seeks to minimize the variability of Fund returns through industry diversification as well as by managing long and short exposures and/or by holding a material level of cash and/or cash equivalents. For example, the Fund may hold long positions in equity securities with a value equal to 60% of its net
(continued on next page)
| | |
| 4 | AB SELECT US LONG/SHORT PORTFOLIO | | abfunds.com |
assets and have short sale obligations equal to 15% of its net assets, resulting in 45% net long exposure. Assuming a 60% long exposure, 40% of Fund assets will be held in cash or cash equivalents, including cash and cash equivalents held to cover the Fund’s short sale obligations. During periods of excessive market risk, the Adviser may reduce the net long exposure of the Fund. The Fund may at times hold long and short positions that in the aggregate exceed the value of its net assets (i.e., so that the Fund is effectively leveraged).
The Fund’s investments will be focused on securities of companies with large- and medium-market capitalizations, but it may also take long and short positions in securities of small-capitalization companies. The Fund may invest in non-US companies, but currently intends to limit its investments in such companies to no more than 10% of its net assets. The Fund may purchase securities in initial public offerings and expects to do so on a regular basis.
The Fund may enter into derivatives transactions, such as options, futures contracts, forwards and swaps, as part of its investment strategies or for hedging or other risk management purposes. These transactions may be used, for example, as a means to take a short position in a security or sector without actually selling securities short.
| | |
| abfunds.com | | AB SELECT US LONG/SHORT PORTFOLIO | 5 |
DISCLOSURES AND RISKS
Benchmark Disclosure
The S&P® 500 Index is unmanaged and does not reflect fees and expenses associated with the active management of a mutual fund portfolio. The S&P 500 Index includes 500 US stocks and is a common representation of the performance of the overall US stock market. An investor cannot invest directly in an index, and its results are not indicative of the performance for any specific investment, including the Fund.
A Word About Risk
Market Risk: The value of the Fund’s assets will fluctuate as the stock, bond or currency markets fluctuate. The value of the Fund’s investments may decline, sometimes rapidly and unpredictably, simply because of economic changes or other events that affect large portions of the market.
Short Sale Risk: Short sales involve the risk that the Fund will incur a loss by subsequently buying a security at a higher price than the price at which it sold the security. The amount of such loss is theoretically unlimited, as it will be based on the increase in value of the security sold short. In contrast, the risk of loss from a long position is limited to the Fund’s investment in the security, because the price of the security cannot fall below zero. The Fund may not always be able to close out a short position on favorable terms.
Derivatives Risk: Derivatives may be illiquid, difficult to price, and leveraged so that small changes may produce disproportionate losses for the Fund, and may be subject to counterparty risk to a greater degree than more traditional investments.
Leverage Risk: To the extent the Fund uses leveraging techniques, the value of its shares may be more volatile because leverage tends to exaggerate the effect of any increase or decrease in the value of the Fund’s investments.
Capitalization Risk: Investments in small- and mid-capitalization companies may be more volatile than investments in large-capitalization companies. Investments in these companies may have additional risks because these companies may have limited product lines, markets or financial resources.
Active Trading Risk: The Fund expects to engage in active and frequent trading of its portfolio securities and its portfolio turnover rate is expected to greatly exceed 100%. A higher rate of portfolio turnover increases transaction costs, which may negatively affect the Fund’s return. In addition, a high rate of portfolio turnover may result in substantial short-term gains, which may have adverse tax consequences for Fund shareholders.
| | |
| 6 | AB SELECT US LONG/SHORT PORTFOLIO | | abfunds.com |
DISCLOSURES AND RISKS (continued)
Management Risk: The Fund is subject to management risk because it is an actively managed investment fund. The Adviser will apply its investment techniques and risk analyses in making investment decisions for the Fund, but there is no guarantee that its techniques will produce the intended results.
These risks are fully discussed in the Fund’s prospectus. As with all investments, you may lose money by investing in the Fund.
An Important Note About Historical Performance
The investment return and principal value of an investment in the Fund will fluctuate, so that shares, when redeemed, may be worth more or less than their original cost. Performance shown in this report represents past performance and does not guarantee future results. Current performance may be lower or higher than the performance information shown. You may obtain performance information current to the most recent month-end by visiting www.abfunds.com.
All fees and expenses related to the operation of the Fund have been deducted. Net asset value (“NAV”) returns do not reflect sales charges; if sales charges were reflected, the Fund’s quoted performance would be lower. SEC returns reflect the applicable sales charges for each share class: a 4.25% maximum front-end sales charge for Class A shares and a 1% 1-year contingent deferred sales charge for Class C shares. Returns for the different share classes will vary due to different expenses associated with each class. Performance assumes reinvestment of distributions and does not account for taxes.
| | |
| abfunds.com | | AB SELECT US LONG/SHORT PORTFOLIO | 7 |
HISTORICAL PERFORMANCE
GROWTH OF A $10,000 INVESTMENT IN THE FUND (unaudited)
12/12/20121 TO 6/30/2017
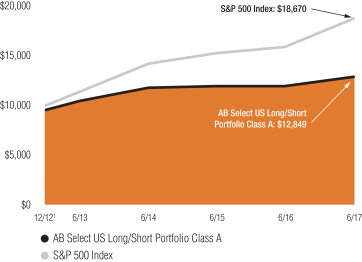
This chart illustrates the total value of an assumed $10,000 investment in AB Select US Long/Short Portfolio Class A shares (from 12/12/20121 to 6/30/2017) as compared to the performance of the Fund’s benchmark. The chart reflects the deduction of the maximum 4.25% sales charge from the initial $10,000 investment in the Fund and assumes the reinvestment of dividends and capital gains distributions.
| 1 | Inception date: 12/12/2012. |
| | |
| 8 | AB SELECT US LONG/SHORT PORTFOLIO | | abfunds.com |
HISTORICAL PERFORMANCE (continued)
AVERAGE RETURNS AS OF JUNE 30, 2017 (unaudited)
| | | | | | | | |
| | | NAV Returns | | | SEC Returns (reflects applicable
sales charges) | |
| CLASS A SHARES | | | | | | | | |
| 1 Year | | | 7.72% | | | | 3.11% | |
| Since Inception1 | | | 6.67% | | | | 5.67% | |
| CLASS C SHARES | | | | | | | | |
| 1 Year | | | 6.94% | | | | 5.94% | |
| Since Inception1 | | | 5.89% | | | | 5.89% | |
| ADVISOR CLASS SHARES2 | | | | | | | | |
| 1 Year | | | 7.99% | | | | 7.99% | |
| Since Inception1 | | | 6.95% | | | | 6.95% | |
| CLASS R SHARES2 | | | | | | | | |
| 1 Year | | | 7.43% | | | | 7.43% | |
| Since Inception1 | | | 6.41% | | | | 6.41% | |
| CLASS K SHARES2 | | | | | | | | |
| 1 Year | | | 7.72% | | | | 7.72% | |
| Since Inception1 | | | 6.67% | | | | 6.67% | |
| CLASS I SHARES2 | | | | | | | | |
| 1 Year | | | 8.07% | | | | 8.07% | |
| Since Inception1 | | | 6.98% | | | | 6.98% | |
The Fund’s current prospectus fee table shows the Fund’s total annual operating expense ratios (including dividend expense, borrowing costs and brokerage expense or securities sold short) as 2.16%, 2.91%, 1.91%, 2.45%, 2.14% and 1.87% for Class A, Class C, Advisor Class, Class R, Class K and Class I shares, respectively, gross of any fee waivers or expense reimbursements. Contractual fee waivers and/or expense reimbursements limit the Fund’s annual operating expense ratios exclusive of expenses associated with acquired fund fees and expenses other than the advisory fees of any AB mutual funds in which the Fund may invest, dividend expense, borrowing costs, brokerage expense on securities sold, interest expense, taxes, extraordinary expenses, and brokerage commissions and other transaction costs to 1.90%, 2.65%, 1.65%, 2.15%, 1.90% and 1.65% for Class A, Class C, Advisor Class, Class R, Class K and Class I shares, respectively. These waivers/reimbursements may not be terminated before November 1, 2017. Absent reimbursements or waivers, performance would have been lower. The Financial Highlights section of this report sets forth expense ratio data for the current reporting period; the expense ratios shown above may differ from the expense ratios in the Financial Highlights section since they are based on different time periods.
| 1 | Inception date: 12/12/2012. |
| 2 | These share classes are offered at NAV to eligible investors and their SEC returns are the same as their NAV returns. Please note that these share classes are for investors purchasing shares through accounts established under certain fee-based programs sponsored and maintained by certain broker-dealers and financial intermediaries, institutional pension plans and/or investment advisory clients of, and certain other persons associated with, the Adviser and its affiliates or the Fund. |
| | |
| abfunds.com | | AB SELECT US LONG/SHORT PORTFOLIO | 9 |
HISTORICAL PERFORMANCE (continued)
SEC AVERAGE RETURNS
AS OF THE MOST RECENT CALENDAR QUARTER-END
JUNE 30, 2017 (unaudited)
| | | | |
| | | SEC Returns (reflects applicable
sales charges) | |
| CLASS A SHARES | | | | |
| 1 Year | | | 3.11% | |
| Since Inception1 | | | 5.67% | |
| CLASS C SHARES | | | | |
| 1 Year | | | 5.94% | |
| Since Inception1 | | | 5.89% | |
| ADVISOR CLASS SHARES2 | | | | |
| 1 Year | | | 7.99% | |
| Since Inception1 | | | 6.95% | |
| CLASS R SHARES2 | | | | |
| 1 Year | | | 7.43% | |
| Since Inception1 | | | 6.41% | |
| CLASS K SHARES2 | | | | |
| 1 Year | | | 7.72% | |
| Since Inception1 | | | 6.67% | |
| CLASS I SHARES2 | | | | |
| 1 Year | | | 8.07% | |
| Since Inception1 | | | 6.98% | |
| 1 | Inception date: 12/12/2012. |
| 2 | Please note that these share classes are for investors purchasing shares through accounts established under certain fee-based programs sponsored and maintained by certain broker-dealers and financial intermediaries, institutional pension plans and/or investment advisory clients of, and certain other persons associated with, the Adviser and its affiliates or the Fund. |
| | |
| 10 | AB SELECT US LONG/SHORT PORTFOLIO | | abfunds.com |
EXPENSE EXAMPLE
(unaudited)
As a shareholder of the Fund, you incur two types of costs: (1) transaction costs, including sales charges (loads) on purchase payments, contingent deferred sales charges on redemptions and (2) ongoing costs, including management fees; distribution (12b-1) fees; and other Fund expenses. This example is intended to help you understand your ongoing costs (in dollars) of investing in the Fund and to compare these costs with the ongoing costs of investing in other mutual funds.
The Example is based on an investment of $1,000 invested at the beginning of the period and held for the entire period as indicated below.
Actual Expenses
The table below provides information about actual account values and actual expenses. You may use the information, together with the amount you invested, to estimate the expenses that you paid over the period. Simply divide your account value by $1,000 (for example, an $8,600 account value divided by $1,000 = 8.6), then multiply the result by the number under the heading entitled “Expenses Paid During Period” to estimate the expenses you paid on your account during this period.
Hypothetical Example for Comparison Purposes
The table below also provides information about hypothetical account values and hypothetical expenses based on the Fund’s actual expense ratio and an assumed annual rate of return of 5% before expenses, which is not the Fund’s actual return. The hypothetical account values and expenses may not be used to estimate the actual ending account balance or expenses you paid for the period. You may use this information to compare the ongoing costs of investing in the Fund and other funds by comparing this 5% hypothetical example with the 5% hypothetical examples that appear in the shareholder reports of other funds.
Please note that the expenses shown in the table are meant to highlight your ongoing costs only and do not reflect any transactional costs, such as sales charges (loads), or contingent deferred sales charges on redemptions. Therefore, the hypothetical example is useful in comparing ongoing costs only, and will not help you determine the relative total costs of owning different funds. In addition, if these transactional costs were included, your costs would have been higher.
| | | | | | | | | | | | | | | | | | | | | | | | |
| | | Beginning
Account
Value
January 1,
2017 | | | Ending
Account
Value
June 30,
2017 | | | Expenses
Paid
During
Period* | | | Annualized
Expense
Ratio* | | | Effective
Expenses
Paid
During
Period+ | | | Effective
Annualized
Expense
Ratio+ | |
| Class A | | | | | | | | | | | | | | | | | | | | | | | | |
Actual | | $ | 1,000 | | | $ | 1,039.80 | | | $ | 10.22 | | | | 2.02 | % | | $ | 10.57 | | | | 2.09 | % |
Hypothetical** | | $ | 1,000 | | | $ | 1,014.78 | | | $ | 10.09 | | | | 2.02 | % | | $ | 10.44 | | | | 2.09 | % |
| | |
| abfunds.com | | AB SELECT US LONG/SHORT PORTFOLIO | 11 |
EXPENSE EXAMPLE (continued)
| | | | | | | | | | | | | | | | | | | | | | | | |
| | | Beginning
Account
Value
January 1,
2017 | | | Ending
Account
Value
June 30,
2017 | | | Expenses
Paid
During
Period* | | | Annualized
Expense
Ratio* | | | Effective
Expenses
Paid
During
Period+ | | | Effective
Annualized
Expense
Ratio+ | |
| Class C | | | | | | | | | | | | | | | | | | | | | | | | |
Actual | | $ | 1,000 | | | $ | 1,035.80 | | | $ | 14.08 | | | | 2.79 | % | | $ | 14.44 | | | | 2.86 | % |
Hypothetical** | | $ | 1,000 | | | $ | 1,010.96 | | | $ | 13.91 | | | | 2.79 | % | | $ | 14.26 | | | | 2.86 | % |
| Advisor Class | | | | | | | | | | | | | | | | | | | | | | | | |
Actual | | $ | 1,000 | | | $ | 1,041.00 | | | $ | 9.01 | | | | 1.78 | % | | $ | 9.36 | | | | 1.85 | % |
Hypothetical** | | $ | 1,000 | | | $ | 1,015.97 | | | $ | 8.90 | | | | 1.78 | % | | $ | 9.25 | | | | 1.85 | % |
| Class R | | | | | | | | | | | | | | | | | | | | | | | | |
Actual | | $ | 1,000 | | | $ | 1,038.50 | | | $ | 11.88 | | | | 2.35 | % | | $ | 12.23 | | | | 2.42 | % |
Hypothetical** | | $ | 1,000 | | | $ | 1,013.14 | | | $ | 11.73 | | | | 2.35 | % | | $ | 12.08 | | | | 2.42 | % |
| Class K | | | | | | | | | | | | | | | | | | | | | | | | |
Actual | | $ | 1,000 | | | $ | 1,038.90 | | | $ | 10.46 | | | | 2.07 | % | | $ | 10.82 | | | | 2.14 | % |
Hypothetical** | | $ | 1,000 | | | $ | 1,014.53 | | | $ | 10.34 | | | | 2.07 | % | | $ | 10.69 | | | | 2.14 | % |
| Class I | | | | | | | | | | | | | | | | | | | | | | | | |
Actual | | $ | 1,000 | | | $ | 1,041.00 | | | $ | 8.86 | | | | 1.75 | % | | $ | 9.21 | | | | 1.82 | % |
Hypothetical** | | $ | 1,000 | | | $ | 1,016.12 | | | $ | 8.75 | | | | 1.75 | % | | $ | 9.10 | | | | 1.82 | % |
| * | Expenses are equal to the classes’ annualized expense ratios multiplied by the average account value over the period, multiplied by 181/365 (to reflect the one-half year period). |
| ** | Assumes 5% annual return before expenses. |
| + | In connection with the Fund’s investments in affiliated/unaffiliated underlying portfolios, the Fund incurs no direct expenses, but bears proportionate shares of the acquired fund fees and expenses (i.e., operating, administrative and investment advisory fees) of the affiliated/unaffiliated underlying portfolios. Currently the Adviser has contractually agreed to waive its fees from the Fund in an amount equal to the Fund’s pro rata share of certain acquired fund fees and expenses of the affiliated underlying portfolios. The Fund’s effective expenses are equal to the classes’ annualized expense ratio plus the Fund’s pro rata share of the weighted average expense ratio of the affiliated/unaffiliated underlying portfolios in which it invests, multiplied by the average account value over the period, multiplied by 181/365 (to reflect the one-half year period). |
| | |
| 12 | AB SELECT US LONG/SHORT PORTFOLIO | | abfunds.com |
PORTFOLIO SUMMARY
June 30, 2017 (unaudited)
PORTFOLIO STATISTICS
Net Assets ($mil): $929.2
SECTOR BREAKDOWN1
| | | | | | | | |
| | | Long | | | Short | |
| Consumer Discretionary | | | 11.4 | % | | | -0.2 | % |
| Consumer Staples | | | 5.5 | | | | — | |
| Energy | | | 2.6 | | | | — | |
| Financials | | | 10.1 | | | | — | |
| Funds and Investment Trusts | | | 2.1 | | | | -8.9 | |
| Health Care | | | 8.6 | | | | -0.2 | |
| Industrials | | | 10.4 | | | | -0.3 | |
| Information Technology | | | 15.4 | | | | — | |
| Materials | | | 0.6 | | | | — | |
| Real Estate | | | 1.5 | | | | -0.5 | |
| Telecommunication Services | | | 0.4 | | | | — | |
| Utilities | | | 1.9 | | | | — | |
TEN LARGEST HOLDINGS1
| | | | | | | | | | | | | | |
| Long | | | | | | | | Short | | | |
| Company | | | | | | | | Company | | | |
| McDonald’s Corp. | | | 4.4 | % | | | | | | CSX Corp. | | | -0.2 | % |
| Honeywell International, Inc. | | | 3.6 | | | | | | | Omega Healthcare Investors, Inc. | | | -0.1 | |
| Northrop Grumman Corp. | | | 3.4 | | | | | | | Snap-on, Inc. | | | -0.1 | |
| Alphabet, Inc. | | | 2.6 | | | | | | | Entercom Communications Corp. | | | -0.1 | |
| Johnson & Johnson | | | 2.5 | | | | | | | Cerner Corp. | | | -0.1 | |
| JPMorgan Chase & Co. | | | 2.5 | | | | | | | HCA Healthcare, Inc. | | | -0.1 | |
| Norfolk Southern Corp. | | | 2.4 | | | | | | | Tesla, Inc. | | | -0.1 | |
| Berkshire Hathaway, Inc. | | | 2.0 | | | | | | | Akamai Technologies, Inc. | | | -0.1 | |
| NextEra Energy, Inc. | | | 1.9 | | | | | | | Chesapeake Lodging Trust | | | -0.1 | |
| iShares Nasdaq Biotechnology ETF | | | 1.9 | | | | | | | Chatham Lodging Trust | | | -0.1 | |
| 1 | Holdings are expressed as a percentage of total net assets and may vary over time. |
Please note: The sector classifications presented herein are based on the Global Industry Classification Standard (GICS) which was developed by Morgan Stanley Capital International and Standard & Poor’s. The components are divided into sector, industry group, and industry sub-indices as classified by the GICS for each of the market capitalization indices in the broad market. These sector classifications are broadly defined. The “Portfolio of Investments” section of the report reflects more specific industry information and is consistent with the investment restrictions discussed in the Fund’s prospectus.
| | |
| abfunds.com | | AB SELECT US LONG/SHORT PORTFOLIO | 13 |
PORTFOLIO OF INVESTMENTS
June 30, 2017
| | | | | | | | |
| Company | |
Shares | | | U.S. $ Value | |
| |
COMMON STOCKS – 68.0% | |
Information Technology – 15.1% | |
Communications Equipment – 1.3% | |
Cisco Systems, Inc. | | | 391,460 | | | $ | 12,252,698 | |
| | | | | | | | |
|
Internet Software & Services – 4.7% | |
Alibaba Group Holding Ltd. (Sponsored ADR)(a) | | | 4,613 | | | | 649,972 | |
Alphabet, Inc. – Class C(a) | | | 26,281 | | | | 23,882,333 | |
eBay, Inc.(a) | | | 285,390 | | | | 9,965,784 | |
Facebook, Inc. – Class A(a) | | | 51,120 | | | | 7,718,098 | |
Pandora Media, Inc.(a)(b) | | | 133,268 | | | | 1,188,750 | |
| | | | | | | | |
| | | | | | | 43,404,937 | |
| | | | | | | | |
IT Services – 2.2% | |
Cognizant Technology Solutions Corp. – Class A | | | 121,002 | | | | 8,034,533 | |
PayPal Holdings, Inc.(a) | | | 84,555 | | | | 4,538,067 | |
Visa, Inc. – Class A | | | 81,604 | | | | 7,652,823 | |
| | | | | | | | |
| | | | | | | 20,225,423 | |
| | | | | | | | |
Semiconductors & Semiconductor Equipment – 1.6% | |
Broadcom Ltd. | | | 18,196 | | | | 4,240,578 | |
Intel Corp. | | | 79,000 | | | | 2,665,460 | |
Micron Technology, Inc.(a) | | | 119,606 | | | | 3,571,435 | |
Texas Instruments, Inc. | | | 50,353 | | | | 3,873,656 | |
| | | | | | | | |
| | | | | | | 14,351,129 | |
| | | | | | | | |
Software – 3.4% | |
Activision Blizzard, Inc. | | | 80,518 | | | | 4,635,421 | |
Electronic Arts, Inc.(a) | | | 29,503 | | | | 3,119,057 | |
Microsoft Corp. | | | 222,988 | | | | 15,370,563 | |
Oracle Corp. | | | 79,786 | | | | 4,000,470 | |
Take-Two Interactive Software, Inc.(a) | | | 63,180 | | | | 4,636,148 | |
| | | | | | | | |
| | | | | | | 31,761,659 | |
| | | | | | | | |
Technology Hardware, Storage & Peripherals – 1.9% | |
Apple, Inc. | | | 99,260 | | | | 14,295,425 | |
Western Digital Corp. | | | 41,676 | | | | 3,692,494 | |
| | | | | | | | |
| | | | | | | 17,987,919 | |
| | | | | | | | |
| | | | | | | 139,983,765 | |
| | | | | | | | |
Consumer Discretionary – 11.3% | |
Hotels, Restaurants & Leisure – 6.4% | |
Carnival Corp. | | | 179,561 | | | | 11,773,815 | |
Hilton Worldwide Holdings, Inc. | | | 36,956 | | | | 2,285,728 | |
McDonald’s Corp. | | | 265,115 | | | | 40,605,013 | |
MGM Resorts International | | | 124,078 | | | | 3,882,401 | |
Norwegian Cruise Line Holdings Ltd.(a) | | | 23,521 | | | | 1,276,955 | |
| | | | | | | | |
| | | | | | | 59,823,912 | |
| | | | | | | | |
| | |
| 14 | AB SELECT US LONG/SHORT PORTFOLIO | | abfunds.com |
PORTFOLIO OF INVESTMENTS (continued)
| | | | | | | | |
| Company | |
Shares | | | U.S. $ Value | |
| |
Household Durables – 0.6% | |
Lennar Corp. – Class A | | | 111,283 | | | $ | 5,933,610 | |
| | | | | | | | |
|
Internet & Direct Marketing Retail – 1.0% | |
Amazon.com, Inc.(a) | | | 2,764 | | | | 2,675,552 | |
Blue Apron Holdings, Inc.(a) | | | 38,854 | | | | 362,896 | |
Priceline Group, Inc. (The)(a) | | | 3,305 | | | | 6,182,069 | |
| | | | | | | | |
| | | | | | | 9,220,517 | |
| | | | | | | | |
Internet Software & Services – 0.1% | |
Delivery Hero AG(a)(c) | | | 12,413 | | | | 394,135 | |
| | | | | | | | |
|
Media – 2.5% | |
CBS Corp. – Class B | | | 205,004 | | | | 13,075,155 | |
DISH Network Corp. – Class A(a) | | | 43,163 | | | | 2,708,910 | |
Manchester United PLC – Class A(b) | | | 152,211 | | | | 2,473,429 | |
Walt Disney Co. (The) | | | 43,449 | | | | 4,616,456 | |
| | | | | | | | |
| | | | | | | 22,873,950 | |
| | | | | | | | |
Specialty Retail – 0.6% | |
Lowe’s Cos., Inc. | | | 70,370 | | | | 5,455,786 | |
| | | | | | | | |
|
Textiles, Apparel & Luxury Goods – 0.1% | |
Lululemon Athletica, Inc.(a) | | | 13,797 | | | | 823,267 | |
| | | | | | | | |
| | | | | | | 104,525,177 | |
| | | | | | | | |
Industrials – 10.4% | |
Aerospace & Defense – 3.4% | |
Northrop Grumman Corp. | | | 122,417 | | | | 31,425,668 | |
| | | | | | | | |
|
Airlines – 0.6% | |
Delta Air Lines, Inc. | | | 108,313 | | | | 5,820,741 | |
| | | | | | | | |
|
Industrial Conglomerates – 3.6% | |
Honeywell International, Inc. | | | 251,153 | | | | 33,476,183 | |
| | | | | | | | |
|
Road & Rail – 2.8% | |
Norfolk Southern Corp. | | | 180,088 | | | | 21,916,710 | |
Union Pacific Corp. | | | 38,728 | | | | 4,217,866 | |
| | | | | | | | |
| | | | | | | 26,134,576 | |
| | | | | | | | |
| | | | | | | 96,857,168 | |
| | | | | | | | |
Financials – 10.1% | |
Banks – 5.9% | |
Bank of America Corp. | | | 728,252 | | | | 17,667,393 | |
JPMorgan Chase & Co. | | | 252,782 | | | | 23,104,275 | |
US Bancorp | | | 278,484 | | | | 14,458,889 | |
| | | | | | | | |
| | | | | | | 55,230,557 | |
| | | | | | | | |
Capital Markets – 1.0% | |
Morgan Stanley | | | 200,961 | | | | 8,954,822 | |
| | | | | | | | |
| | |
| abfunds.com | | AB SELECT US LONG/SHORT PORTFOLIO | 15 |
PORTFOLIO OF INVESTMENTS (continued)
| | | | | | | | |
| Company | |
Shares | | | U.S. $ Value | |
| |
Diversified Financial Services – 2.0% | |
Berkshire Hathaway, Inc. – Class B(a) | | | 111,926 | | | $ | 18,956,907 | |
| | | | | | | | |
|
Insurance – 1.2% | |
Athene Holding Ltd. – Class A(a) | | | 96,519 | | | | 4,788,308 | |
Progressive Corp. (The) | | | 135,024 | | | | 5,953,208 | |
| | | | | | | | |
| | | | | | | 10,741,516 | |
| | | | | | | | |
| | | | | | | 93,883,802 | |
| | | | | | | | |
Health Care – 8.6% | |
Health Care Equipment & Supplies – 1.5% | |
Medtronic PLC | | | 123,596 | | | | 10,969,145 | |
Zimmer Biomet Holdings, Inc. | | | 25,285 | | | | 3,246,594 | |
| | | | | | | | |
| | | | | | | 14,215,739 | |
| | | | | | | | |
Health Care Providers & Services – 2.8% | |
Aetna, Inc. | | | 80,975 | | | | 12,294,434 | |
Humana, Inc. | | | 13,316 | | | | 3,204,096 | |
UnitedHealth Group, Inc. | | | 55,527 | | | | 10,295,817 | |
| | | | | | | | |
| | | | | | | 25,794,347 | |
| | | | | | | | |
Pharmaceuticals – 4.3% | |
Eli Lilly & Co. | | | 42,088 | | | | 3,463,842 | |
Johnson & Johnson | | | 177,120 | | | | 23,431,205 | |
Pfizer, Inc. | | | 233,240 | | | | 7,834,532 | |
Zoetis, Inc. | | | 86,701 | | | | 5,408,408 | |
| | | | | | | | |
| | | | | | | 40,137,987 | |
| | | | | | | | |
| | | | | | | 80,148,073 | |
| | | | | | | | |
Consumer Staples – 5.5% | |
Beverages – 0.5% | |
Constellation Brands, Inc. – Class A | | | 25,629 | | | | 4,965,106 | |
| | | | | | | | |
|
Food & Staples Retailing – 0.4% | |
Kroger Co. (The) | | | 153,969 | | | | 3,590,557 | |
| | | | | | | | |
|
Food Products – 2.4% | |
Campbell Soup Co. | | | 121,744 | | | | 6,348,950 | |
Hershey Co. (The) | | | 19,363 | | | | 2,079,005 | |
Kraft Heinz Co. (The) | | | 92,850 | | | | 7,951,674 | |
Mondelez International, Inc. – Class A | | | 130,685 | | | | 5,644,285 | |
| | | | | | | | |
| | | | | | | 22,023,914 | |
| | | | | | | | |
Personal Products – 0.7% | |
Estee Lauder Cos., Inc. (The) – Class A | | | 69,550 | | | | 6,675,409 | |
| | | | | | | | |
|
Tobacco – 1.5% | |
Altria Group, Inc. | | | 181,293 | | | | 13,500,890 | |
| | | | | | | | |
| | | | | | | 50,755,876 | |
| | | | | | | | |
| | |
| 16 | AB SELECT US LONG/SHORT PORTFOLIO | | abfunds.com |
PORTFOLIO OF INVESTMENTS (continued)
| | | | | | | | |
| Company | |
Shares | | | U.S. $ Value | |
| |
Energy – 2.6% | |
Oil, Gas & Consumable Fuels – 2.6% | |
Chevron Corp. | | | 89,376 | | | $ | 9,324,598 | |
EOG Resources, Inc. | | | 98,153 | | | | 8,884,809 | |
Occidental Petroleum Corp. | | | 100,362 | | | | 6,008,673 | |
| | | | | | | | |
| | | | | | | 24,218,080 | |
| | | | | | | | |
Utilities – 1.9% | |
Electric Utilities – 1.9% | |
NextEra Energy, Inc. | | | 128,490 | | | | 18,005,304 | |
| | | | | | | | |
| | |
Real Estate – 1.5% | | | | | | | | |
Equity Real Estate Investment Trusts (REITs) – 1.5% | | | | | | | | |
Crown Castle International Corp. | | | 139,790 | | | | 14,004,162 | |
| | | | | | | | |
| | |
Materials – 0.6% | | | | | | | | |
Containers & Packaging – 0.6% | | | | | | | | |
Berry Global Group, Inc.(a) | | | 98,596 | | | | 5,620,958 | |
| | | | | | | | |
| | |
Telecommunication Services – 0.4% | | | | | | | | |
Wireless Telecommunication Services – 0.4% | | | | | | | | |
T-Mobile US, Inc.(a) | | | 62,109 | | | | 3,765,048 | |
| | | | | | | | |
| | |
Total Common Stocks
(cost $605,553,262) | | | | | | | 631,767,413 | |
| | | | | | | | |
| | | | | | | | |
INVESTMENT COMPANIES – 2.1% | | | | | | | | |
Funds and Investment Trusts – 2.1% | | | | | | | | |
Altaba, Inc.(a) | | | 23,881 | | | | 1,301,037 | |
iShares Nasdaq Biotechnology ETF(d) | | | 57,510 | | | | 17,832,701 | |
| | | | | | | | |
| | |
Total Investment Companies
(cost $18,048,518) | | | | | | | 19,133,738 | |
| | | | | | | | |
| | | | | | | | |
PREFERRED STOCKS – 0.4% | | | | | | | | |
Information Technology – 0.3% | | | | | | | | |
Internet Software & Services – 0.3% | |
Lyft, Inc.
0.00%(a)(e)(f) | | | 85,511 | | | | 2,749,179 | |
| | | | | | | | |
|
Consumer Discretionary – 0.1% | |
Household Durables – 0.1% | |
Honest Co. (The)
0.00%(a)(e)(f) | | | 20,767 | | | | 839,298 | |
| | | | | | | | |
| | |
Total Preferred Stocks
(cost $3,699,373) | | | | | | | 3,588,477 | |
| | | | | | | | |
| | |
| abfunds.com | | AB SELECT US LONG/SHORT PORTFOLIO | 17 |
PORTFOLIO OF INVESTMENTS (continued)
| | | | | | | | |
| Company | |
Shares | | | U.S. $ Value | |
| |
SHORT-TERM INVESTMENTS – 29.2% | | | | | | | | |
Investment Companies – 28.7% | | | | | | | | |
AB Fixed Income Shares, Inc. – Government Money Market Portfolio – Class AB,
0.79%(d)(g)
(cost $266,493,780) | | | 266,493,780 | | | $ | 266,493,780 | |
| | | | | | | | |
| | |
| | | Principal
Amount
(000) | | | | |
U.S. Treasury Bills – 0.5% | |
U.S. Treasury Bill
Zero Coupon, 8/17/17(h)
(cost $4,994,207) | | $ | 5,000 | | | | 4,994,207 | |
| | | | | | | | |
| | |
Total Short-Term Investments
(cost $271,487,987) | | | | | | | 271,487,987 | |
| | | | | | | | |
Total Investments Before Securities Lending Collateral For Securities
Loaned – 99.7%
(cost $898,789,140) | | | | | | | 925,977,615 | |
| | | | | | | | |
| | |
| | | Shares | | | | |
INVESTMENTS OF CASH COLLATERAL FOR SECURITIES
LOANED – 0.1% | | | | | | | | |
Investment Companies – 0.1% | | | | | | | | |
AB Fixed Income Shares, Inc. – Government Money Market Portfolio – Class AB,
0.79%(d)(g)
(cost $1,344,771) | | | 1,344,771 | | | | 1,344,771 | |
| | | | | | | | |
| | |
Total Investments Before Securities Sold Short – 99.8%
(cost $900,133,911) | | | | | | | 927,322,386 | |
| | | | | | | | |
| | | | | | | | |
SECURITIES SOLD SHORT – (10.1)% | | | | | | | | |
Investment Companies – (8.9)% | | | | | | | | |
Funds and Investment Trusts – (8.9)% | | | | | | | | |
SPDR S&P 500 ETF Trust(d)
(proceeds $82,925,547) | | | (341,219 | ) | | | (82,506,754 | ) |
| | | | | | | | |
| | | | | | | | |
COMMON STOCKS – (1.2)% | | | | | | | | |
Real Estate – (0.5)% | | | | | | | | |
Equity Real Estate Investment Trusts (REITs) – (0.5)% | | | | | | | | |
Acadia Realty Trust | | | (6,094 | ) | | | (169,413 | ) |
Agree Realty Corp. | | | (3,783 | ) | | | (173,526 | ) |
American Assets Trust, Inc. | | | (4,336 | ) | | | (170,795 | ) |
Ashford Hospitality Trust, Inc. | | | (30,540 | ) | | | (185,683 | ) |
Brixmor Property Group, Inc. | | | (9,003 | ) | | | (160,974 | ) |
CBL & Associates Properties, Inc. | | | (20,377 | ) | | | (171,778 | ) |
| | |
| 18 | AB SELECT US LONG/SHORT PORTFOLIO | | abfunds.com |
PORTFOLIO OF INVESTMENTS (continued)
| | | | | | | | |
| Company | |
Shares | | | U.S. $ Value | |
| |
Chatham Lodging Trust | | | (9,859 | ) | | $ | (198,067 | ) |
Chesapeake Lodging Trust | | | (8,102 | ) | | | (198,256 | ) |
GGP, Inc. | | | (8,344 | ) | | | (196,585 | ) |
Kimco Realty Corp. | | | (8,839 | ) | | | (162,196 | ) |
Macerich Co. (The) | | | (3,039 | ) | | | (176,444 | ) |
Omega Healthcare Investors, Inc. | | | (37,010 | ) | | | (1,222,070 | ) |
Pennsylvania Real Estate Investment Trust | | | (12,855 | ) | | | (145,519 | ) |
Regency Centers Corp. | | | (2,753 | ) | | | (172,448 | ) |
Retail Opportunity Investments Corp. | | | (8,492 | ) | | | (162,962 | ) |
Simon Property Group, Inc. | | | (1,116 | ) | | | (180,524 | ) |
SL Green Realty Corp. | | | (1,800 | ) | | | (190,440 | ) |
Tanger Factory Outlet Centers, Inc. | | | (6,250 | ) | | | (162,375 | ) |
Taubman Centers, Inc. | | | (2,753 | ) | | | (163,941 | ) |
Urban Edge Properties | | | (6,821 | ) | | | (161,862 | ) |
Vornado Realty Trust | | | (1,930 | ) | | | (181,227 | ) |
Washington Prime Group, Inc. | | | (22,385 | ) | | | (187,363 | ) |
| | | | | | | | |
| | | | | | | (4,894,448 | ) |
| | | | | | | | |
Industrials – (0.3)% | | | | | | | | |
Machinery – (0.1)% | | | | | | | | |
Snap-on, Inc. | | | (6,880 | ) | | | (1,087,040 | ) |
| | | | | | | | |
| | |
Road & Rail – (0.2)% | | | | | | | | |
CSX Corp. | | | (34,551 | ) | | | (1,885,102 | ) |
| | | | | | | | |
| | | | | | | (2,972,142 | ) |
| | | | | | | | |
Health Care – (0.2)% | | | | | | | | |
Health Care Providers & Services – (0.1)% | | | | | | | | |
HCA Healthcare, Inc.(a) | | | (8,851 | ) | | | (771,807 | ) |
| | | | | | | | |
| | |
Health Care Technology – (0.1)% | | | | | | | | |
Cerner Corp.(a) | | | (11,916 | ) | | | (792,057 | ) |
| | | | | | | | |
| | | | | | | (1,563,864 | ) |
| | | | | | | | |
Consumer Discretionary – (0.2)% | | | | | | | | |
Automobiles – (0.1)% | | | | | | | | |
Tesla, Inc.(a) | | | (1,402 | ) | | | (506,977 | ) |
| | | | | | | | |
| | |
Media – (0.1)% | | | | | | | | |
Entercom Communications Corp. – Class A | | | (96,854 | ) | | | (1,002,439 | ) |
| | | | | | | | |
| | | | | | | (1,509,416 | ) |
| | | | | | | | |
Information Technology – 0.0% | | | | | | | | |
Internet Software & Services – 0.0% | | | | | | | | |
Akamai Technologies, Inc.(a) | | | (6,984 | ) | | | (347,873 | ) |
| | | | | | | | |
| | |
Total Common Stocks
(proceeds $10,998,690) | | | | | | | (11,287,743 | ) |
| | | | | | | | |
| | |
Total Securities Sold Short
(proceeds $93,924,237) | | | | | | | (93,794,497 | ) |
| | | | | | | | |
| | |
Total Investments, Net of Securities Sold Short – 89.7%
(cost $806,209,674) | | | | | | | 833,527,889 | |
Other assets less liabilities – 10.3% | | | | | | | 95,634,462 | |
| | | | | | | | |
| | |
Net Assets – 100.0% | | | | | | $ | 929,162,351 | |
| | | | | | | | |
| | |
| abfunds.com | | AB SELECT US LONG/SHORT PORTFOLIO | 19 |
PORTFOLIO OF INVESTMENTS (continued)
FUTURES (see Note D)
| | | | | | | | | | | | | | | | | | | | |
| Type | | Number of
Contracts | | | Expiration
Month | | | Original
Value | | | Value at
June 30,
2017 | | | Unrealized
Appreciation/
(Depreciation) | |
Sold Contracts | | | | | | | | | | | | | | | | | |
S&P 500 E Mini Futures | | | 197 | | | | September 2017 | | | $ | 23,878,040 | | | $ | 23,845,865 | | | $ | 32,175 | |
TOTAL RETURN SWAPS (see Note D)
| | | | | | | | | | | | | | | | | | |
Counterparty &
Referenced Obligation | | # of
Shares
or Units | | | Rate
Paid/
Received | | Notional
Amount
(000) | | | Maturity
Date | | | Unrealized
Appreciation/
(Depreciation) | |
Receive Total Return on Reference Obligation | | | | | | | | | |
Morgan Stanley Capital Services LLC | | | | | | | | | |
KKR & Co. LP | | | 2,727 | | | FedFundEffective
Plus 0.30% | | $ | 50 | | | | 1/11/19 | | | $ | 682 | |
KKR & Co. LP | | | 10,689 | | | FedFundEffective
Plus 0.30% | | | 198 | | | | 1/11/19 | | | | 343 | |
KKR & Co. LP | | | 3,448 | | | FedFundEffective
Plus 0.30% | | | 64 | | | | 1/11/19 | | | | 320 | |
KKR & Co. LP | | | 1,396 | | | FedFundEffective
Plus 0.30% | | | 26 | | | | 1/11/19 | | | | (50 | ) |
KKR & Co. LP | | | 2,807 | | | FedFundEffective
Plus 0.30% | | | 53 | | | | 1/11/19 | | | | (687 | ) |
KKR & Co. LP | | | 5,355 | | | FedFundEffective
Plus 0.30% | | | 101 | | | | 1/11/19 | | | | (1,437 | ) |
KKR & Co. LP | | | 11,281 | | | FedFundEffective
Plus 0.35% | | | 202 | | | | 1/11/19 | | | | 7,485 | |
KKR & Co. LP | | | 7,946 | | | FedFundEffective
Plus 0.30% | | | 143 | | | | 1/11/19 | | | | 3,911 | |
KKR & Co. LP | | | 3,698 | | | FedFundEffective
Plus 0.35% | | | 65 | | | | 1/11/19 | | | | 3,221 | |
KKR & Co. LP | | | 3,573 | | | FedFundEffective
Plus 0.30% | | | 63 | | | | 1/11/19 | | | | 3,076 | |
KKR & Co. LP | | | 5,755 | | | FedFundEffective
Plus 0.30% | | | 105 | | | | 1/11/19 | | | | 1,530 | |
KKR & Co. LP | | | 926 | | | FedFundEffective
Plus 0.30% | | | 16 | | | | 1/11/19 | | | | 697 | |
KKR & Co. LP | | | 5,755 | | | FedFundEffective
Plus 0.30% | | | 107 | | | | 1/11/19 | | | | 300 | |
KKR & Co. LP | | | 2,996 | | | FedFundEffective
Plus 0.30% | | | 56 | | | | 1/11/19 | | | | (21 | ) |
KKR & Co. LP | | | 1,435 | | | FedFundEffective
Plus 0.30% | | | 27 | | | | 1/11/19 | | | | (74 | ) |
KKR & Co. LP | | | 2,996 | | | FedFundEffective
Plus 0.30% | | | 56 | | | | 1/11/19 | | | | (180 | ) |
KKR & Co. LP | | | 3,543 | | | FedFundEffective
Plus 0.30% | | | 66 | | | | 1/11/19 | | | | (333 | ) |
KKR & Co. LP | | | 2,891 | | | FedFundEffective
Plus 0.30% | | | 55 | | | | 1/11/19 | | | | (824 | ) |
KKR & Co. LP | | | 3,569 | | | FedFundEffective
Plus 0.30% | | | 67 | | | | 1/11/19 | | | | (971 | ) |
| | |
| 20 | AB SELECT US LONG/SHORT PORTFOLIO | | abfunds.com |
PORTFOLIO OF INVESTMENTS (continued)
| | | | | | | | | | | | | | | | | | | | |
Counterparty &
Referenced Obligation | | # of
Shares
or Units | | | Rate
Paid/
Received | | | Notional
Amount
(000) | | | Maturity
Date | | | Unrealized
Appreciation/
(Depreciation) | |
KKR & Co. LP | | | 3,797 | | |
| FedFundEffective
Plus 0.30% |
| | $ | 72 | | | | 1/11/19 | | | $ | (1,662 | ) |
KKR & Co. LP | | | 74,543 | | |
| FedFundEffective
Plus 0.30% |
| | | 1,272 | | | | 1/11/19 | | | | 109,385 | |
KKR & Co. LP | | | 59,955 | | |
| FedFundEffective
Plus 0.30% |
| | | 1,022 | | | | 1/11/19 | | | | 88,717 | |
KKR & Co. LP | | | 13,009 | | |
| FedFundEffective
Plus 0.30% |
| | | 228 | | | | 1/11/19 | | | | 12,892 | |
KKR & Co. LP | | | 23,916 | | |
| FedFundEffective
Plus 0.30% |
| | | 432 | | | | 1/11/19 | | | | 11,602 | |
KKR & Co. LP | | | 19,707 | | |
| FedFundEffective
Plus 0.35% |
| | | 355 | | | | 1/11/19 | | | | 9,994 | |
KKR & Co. LP | | | 7,617 | | |
| FedFundEffective
Plus 0.35% |
| | | 136 | | | | 1/11/19 | | | | 5,627 | |
KKR & Co. LP | | | 9,022 | | |
| FedFundEffective
Plus 0.35% |
| | | 163 | | | | 1/11/19 | | | | 4,195 | |
KKR & Co. LP | | | 9,857 | | |
| FedFundEffective
Plus 0.35% |
| | | 179 | | | | 1/11/19 | | | | 3,915 | |
KKR & Co. LP | | | 2,468 | | |
| FedFundEffective
Plus 0.30% |
| | | 42 | | | | 1/11/19 | | | | 3,380 | |
KKR & Co. LP | | | 3,632 | | |
| FedFundEffective
Plus 0.30% |
| | | 65 | | | | 1/11/19 | | | | 2,660 | |
KKR & Co. LP | | | 1,849 | | |
| FedFundEffective
Plus 0.35% |
| | | 33 | | | | 1/11/19 | | | | 1,353 | |
KKR & Co. LP | | | 3,939 | | |
| FedFundEffective
Plus 0.30% |
| | | 72 | | | | 1/11/19 | | | | 809 | |
| | | | | | | | | | | | | | | | | | | | |
Pay Total Return on Reference Obligation | |
Morgan Stanley Capital Services LLC | |
Tallgrass Energy Partners | | | 15,188 | | |
| FedFundEffective
Plus 0.30% |
| | | 727 | | | | 1/11/19 | | | | (33,064 | ) |
| | | | | | | | | | | | | | | | | | | | |
| | | | | | | | | | | | | | | | | | $ | 236,791 | |
| | | | | | | | | | | | | | | | | | | | |
| (a) | Non-income producing security. |
| (b) | Represents entire or partial securities out on loan. See Note E for securities lending information. |
| (c) | Security is exempt from registration under Rule 144A of the Securities Act of 1933. This security is considered restricted, but liquid and may be resold in transactions exempt from registration, normally to qualified institutional buyers. At June 30, 2017, the market value of this security amounted to $394,135 or 0.0% of net assets. |
| (d) | To obtain a copy of the fund’s shareholder report, please go to the Securities and Exchange Commission’s website at www.sec.gov. Additionally, shareholder reports for AB funds can be obtained by calling AB at (800) 227-4618. |
| (e) | Fair valued by the Adviser. |
| (g) | Investment in affiliated money market mutual fund. The rate shown represents the 7-day yield as of period end. |
| (h) | Position, or a portion thereof, has been segregated to collateralize OTC derivatives outstanding. |
Glossary:
ADR – American Depositary Receipt
ETF – Exchange Traded Fund
FedFundEffective – Federal Funds Effective Rate
SPDR – Standard & Poor’s Depository Receipt
See notes to financial statements.
| | |
| abfunds.com | | AB SELECT US LONG/SHORT PORTFOLIO | 21 |
STATEMENT OF ASSETS & LIABILITIES
June 30, 2017
| | | | |
| Assets | |
Investments in securities, at value | | | | |
Unaffiliated issuers (cost $632,295,360) | | $ | 659,483,835 | (a) |
Affiliated issuers (cost $267,838,551—including investment of cash collateral for securities loaned of $1,344,771) | | | 267,838,551 | |
Deposit at broker for securities sold short | | | 106,154,219 | |
Cash collateral due from broker | | | 7,565,520 | |
Foreign currencies, at value (cost $203,660) | | | 206,300 | |
Receivable for investment securities sold | | | 26,933,485 | |
Receivable for capital stock sold | | | 3,647,581 | |
Unaffiliated dividends and interest receivable | | | 433,986 | |
Unrealized appreciation on total return swaps | | | 276,094 | |
Affiliated dividends receivable | | | 162,410 | |
| | | | |
Total assets | | | 1,072,701,981 | |
| | | | |
| Liabilities | | | | |
Payable for securities sold short, at value (proceeds received $93,924,237) | | | 93,794,497 | |
Payable for investment securities purchased and foreign currency transactions | | | 42,084,762 | |
Payable for capital stock redeemed | | | 4,227,965 | |
Payable for collateral received on securities loaned | | | 1,344,771 | |
Advisory fee payable | | | 1,115,289 | |
Dividend expense payable | | | 442,633 | |
Distribution fee payable | | | 116,849 | |
Unrealized depreciation on total return swaps | | | 39,303 | |
Administrative fee payable | | | 13,542 | |
Transfer Agent fee payable | | | 11,615 | |
Payable for variation margin on exchange-traded derivatives | | | 8,865 | |
Accrued expenses and other liabilities | | | 339,539 | |
| | | | |
Total liabilities | | | 143,539,630 | |
| | | | |
Net Assets | | $ | 929,162,351 | |
| | | | |
| Composition of Net Assets | | | | |
Capital stock, at par | | $ | 7,530 | |
Additional paid-in capital | | | 902,827,963 | |
Accumulated net realized loss on investment and foreign currency transactions | | | (1,262,790 | ) |
Net unrealized appreciation on investments and foreign currency denominated assets and liabilities | | | 27,589,648 | |
| | | | |
| | $ | 929,162,351 | |
| | | | |
Net Asset Value Per Share—30 billion shares of capital stock authorized, $.0001 par value
| | | | | | | | | | | | |
Class | | Net Assets | | | Shares
Outstanding | | | Net Asset
Value | |
| |
| A | | $ | 113,846,698 | | | | 9,272,848 | | | $ | 12.28 | * |
| |
| C | | $ | 111,027,643 | | | | 9,362,734 | | | $ | 11.86 | |
| |
| Advisor | | $ | 692,136,110 | | | | 55,686,473 | | | $ | 12.43 | |
| |
| R | | $ | 390,973 | | | | 32,212 | | | $ | 12.14 | |
| |
| K | | $ | 12,285 | | | | 1,000.21 | | | $ | 12.28 | |
| |
| I | | $ | 11,748,642 | | | | 943,985 | | | $ | 12.45 | |
| |
| (a) | Includes securities on loan with a value of $1,265,126 (see Note E). |
| * | The maximum offering price per share for Class A shares was $12.83 which reflects a sales charge of 4.25%. |
See notes to financial statements.
| | |
| 22 | AB SELECT US LONG/SHORT PORTFOLIO | | abfunds.com |
STATEMENT OF OPERATIONS
Year Ended June 30, 2017
| | | | | | | | |
| Investment Income | | | | | | | | |
Dividends | | | | | | | | |
Unaffiliated issuers (net of foreign taxes withheld of $3,118) | | $ | 11,887,036 | | | | | |
Affiliated issuers | | | 1,474,142 | | | | | |
Interest | | | 95,687 | | | | | |
Securities lending income | | | 68,026 | | | | | |
Other income | | | 162,236 | | | $ | 13,687,127 | |
| | | | | | | | |
| Expenses | | | | | | | | |
Advisory fee (see Note B) | | | 16,671,793 | | | | | |
Distribution fee—Class A | | | 347,884 | | | | | |
Distribution fee—Class C | | | 1,330,881 | | | | | |
Distribution fee—Class R | | | 2,801 | | | | | |
Distribution fee—Class K | | | 48 | | | | | |
Transfer agency—Class A | | | 99,646 | | | | | |
Transfer agency—Class C | | | 96,106 | | | | | |
Transfer agency—Advisor Class | | | 526,380 | | | | | |
Transfer agency—Class R | | | 1,067 | | | | | |
Transfer agency—Class K | | | 26 | | | | | |
Transfer agency—Class I | | | 3,883 | | | | | |
Custodian | | | 260,989 | | | | | |
Printing | | | 94,849 | | | | | |
Registration fees | | | 64,427 | | | | | |
Audit and tax | | | 57,871 | | | | | |
Administrative | | | 54,471 | | | | | |
Legal | | | 40,838 | | | | | |
Directors’ fees | | | 27,099 | | | | | |
Miscellaneous | | | 47,870 | | | | | |
| | | | | | | | |
Total operating expenses (see Note B) | | | 19,728,929 | | | | | |
Dividend expense on securities sold short and interest expense | | | 1,810,108 | | | | | |
| | | | | | | | |
Total expenses | | | 21,539,037 | | | | | |
Less: expenses waived and reimbursed by the Adviser (see Notes B & E) | | | (760,373 | ) | | | | |
| | | | | | | | |
Net expenses | | | | | | | 20,778,664 | |
| | | | | | | | |
Net investment loss | | | | | | | (7,091,537 | ) |
| | | | | | | | |
| Realized and Unrealized Gain (Loss) on Investment and Foreign Currency Transactions | | | | | | | | |
Net realized gain (loss) on: | | | | | | | | |
Investment transactions | | | | | | | 98,453,148 | |
Securities sold short | | | | | | | (15,476,359 | ) |
Futures | | | | | | | 455,989 | |
Options written | | | | | | | (572,694 | ) |
Swaps | | | | | | | 33,949 | |
Foreign currency transactions | | | | | | | (62,087 | ) |
Net change in unrealized appreciation/depreciation of: | | | | | | | | |
Investments | | | | | | | 831,953 | |
Securities sold short | | | | | | | 658,669 | |
Futures | | | | | | | 32,175 | |
Swaps | | | | | | | 236,791 | |
Foreign currency denominated assets and liabilities | | | | | | | 2,685 | |
| | | | | | | | |
Net gain on investment and foreign currency transactions | | | | | | | 84,594,219 | |
| | | | | | | | |
Net Increase in Net Assets from Operations | | | | | | $ | 77,502,682 | |
| | | | | | | | |
See notes to financial statements.
| | |
| abfunds.com | | AB SELECT US LONG/SHORT PORTFOLIO | 23 |
STATEMENT OF CHANGES IN NET ASSETS
| | | | | | | | |
| | | Year Ended
June 30,
2017 | | | Year Ended
June 30,
2016 | |
| Increase (Decrease) in Net Assets from Operations | | | | | | | | |
Net investment loss | | $ | (7,091,537 | ) | | $ | (13,267,823 | ) |
Net realized gain (loss) on investment and foreign currency transactions | | | 82,831,946 | | | | (26,243,659 | ) |
Net change in unrealized appreciation/depreciation of investments and foreign currency denominated assets and liabilities | | | 1,762,273 | | | | 31,502,780 | |
| | | | | | | | |
Net increase (decrease) in net assets from operations | | | 77,502,682 | | | | (8,008,702 | ) |
| Distributions to Shareholders from | | | | | | | | |
Net realized gain on investment transactions | | | | | | | | |
Class A | | | – 0 | – | | | (7,196,224 | ) |
Class C | | | – 0 | – | | | (6,719,845 | ) |
Advisor Class | | | – 0 | – | | | (34,563,006 | ) |
Class R | | | – 0 | – | | | (20,624 | ) |
Class K | | | – 0 | – | | | (985 | ) |
Class I | | | – 0 | – | | | (425,374 | ) |
| Capital Stock Transactions | | | | | | | | |
Net decrease | | | (304,361,022 | ) | | | (540,525,969 | ) |
| | | | | | | | |
Total decrease | | | (226,858,340 | ) | | | (597,460,729 | ) |
| Net Assets | | | | | | | | |
Beginning of period | | | 1,156,020,691 | | | | 1,753,481,420 | |
| | | | | | | | |
End of period (including distributions in excess of net investment income of $0 and ($3,420,626), respectively) | | $ | 929,162,351 | | | $ | 1,156,020,691 | |
| | | | | | | | |
See notes to financial statements.
| | |
| 24 | AB SELECT US LONG/SHORT PORTFOLIO | | abfunds.com |
NOTES TO FINANCIAL STATEMENTS
June 30, 2017
NOTE A
Significant Accounting Policies
AB Cap Fund, Inc. (the “Company”), which is a Maryland corporation, is registered under the Investment Company Act of 1940 as an open-end management investment company. The Company operates as a series company currently comprised of 31 portfolios. Each portfolio is considered to be a separate entity for financial reporting and tax purposes. This report relates only to the AB Select US Long/Short Portfolio (the “Fund”), a diversified portfolio. The Fund has authorized the issuance of Class A, Class B, Class C, Advisor Class, Class R, Class K, Class I, Class T, Class 1 and Class 2 shares. Class B, Class T, Class 1 and Class 2 shares have not been issued. Class A shares are sold with a front-end sales charge of up to 4.25% for purchases not exceeding $1,000,000. Class C shares are subject to a contingent deferred sales charge of 1% on redemptions made within the first year after purchase, and 0% after the first year of purchase. Effective April 10, 2017, Class C shares will automatically convert to Class A shares ten years after the end of the calendar month of purchase. Class R and Class K shares are sold without an initial or contingent deferred sales charge. Advisor Class and Class I shares are sold without an initial or contingent deferred sales charge and are not subject to ongoing distribution expenses. All ten classes of shares have identical voting, dividend, liquidation and other rights, except that the classes bear different distribution and transfer agency expenses. Each class has exclusive voting rights with respect to its distribution plan. The financial statements have been prepared in conformity with U.S. generally accepted accounting principles (“U.S. GAAP”) which require management to make certain estimates and assumptions that affect the reported amounts of assets and liabilities in the financial statements and amounts of income and expenses during the reporting period. Actual results could differ from those estimates. The Fund is an investment company under U.S. GAAP and follows the accounting and reporting guidance applicable to investment companies. The following is a summary of significant accounting policies followed by the Fund.
1. Security Valuation
Portfolio securities are valued at their current market value determined on the basis of market quotations or, if market quotations are not readily available or are deemed unreliable, at “fair value” as determined in accordance with procedures established by and under the general supervision of the Company’s Board of Directors (the “Board”).
In general, the market values of securities which are readily available and deemed reliable are determined as follows: securities listed on a national securities exchange (other than securities listed on the NASDAQ Stock
| | |
| abfunds.com | | AB SELECT US LONG/SHORT PORTFOLIO | 25 |
NOTES TO FINANCIAL STATEMENTS (continued)
Market, Inc. (“NASDAQ”)) or on a foreign securities exchange are valued at the last sale price at the close of the exchange or foreign securities exchange. If there has been no sale on such day, the securities are valued at the last traded price from the previous day. Securities listed on more than one exchange are valued by reference to the principal exchange on which the securities are traded; securities listed only on NASDAQ are valued in accordance with the NASDAQ Official Closing Price; listed or over the counter (“OTC”) market put or call options are valued at the mid level between the current bid and ask prices. If either a current bid or current ask price is unavailable, the Adviser will have discretion to determine the best valuation (e.g. last trade price in the case of listed options); open futures are valued using the closing settlement price or, in the absence of such a price, the most recent quoted bid price. If there are no quotations available for the day of valuation, the last available closing settlement price is used; U.S. Government securities and any other debt instruments having 60 days or less remaining until maturity are generally valued at market by an independent pricing vendor, if a market price is available. If a market price is not available, the securities are valued at amortized cost. This methodology is commonly used for short term securities that have an original maturity of 60 days or less, as well as short term securities that had an original term to maturity that exceeded 60 days. In instances when amortized cost is utilized, the Valuation Committee (the “Committee”) must reasonably conclude that the utilization of amortized cost is approximately the same as the fair value of the security. Such factors the Committee will consider include, but are not limited to, an impairment of the creditworthiness of the issuer or material changes in interest rates. Fixed-income securities, including mortgage-backed and asset-backed securities, may be valued on the basis of prices provided by a pricing service or at a price obtained from one or more of the major broker-dealers. In cases where broker-dealer quotes are obtained, the Adviser may establish procedures whereby changes in market yields or spreads are used to adjust, on a daily basis, a recently obtained quoted price on a security. Swaps and other derivatives are valued daily, primarily using independent pricing services, independent pricing models using market inputs, as well as third party broker-dealers or counterparties. Open end mutual funds are valued at the closing net asset value per share, while exchange traded funds are valued at the closing market price per share.
Securities for which market quotations are not readily available (including restricted securities) or are deemed unreliable are valued at fair value as deemed appropriate by the Adviser. Factors considered in making this determination may include, but are not limited to, information obtained by contacting the issuer, analysts, analysis of the issuer’s financial statements or other available documents. In addition, the Fund may use fair value pricing for securities primarily traded in non-U.S. markets because most foreign
| | |
| 26 | AB SELECT US LONG/SHORT PORTFOLIO | | abfunds.com |
NOTES TO FINANCIAL STATEMENTS (continued)
markets close well before the Fund values its securities at 4:00 p.m., Eastern Time. The earlier close of these foreign markets gives rise to the possibility that significant events, including broad market moves, may have occurred in the interim and may materially affect the value of those securities. To account for this, the Fund may frequently value many of its foreign equity securities using fair value prices based on third party vendor modeling tools to the extent available.
2. Fair Value Measurements
In accordance with U.S. GAAP regarding fair value measurements, fair value is defined as the price that the Fund would receive to sell an asset or pay to transfer a liability in an orderly transaction between market participants at the measurement date. U.S. GAAP establishes a framework for measuring fair value, and a three-level hierarchy for fair value measurements based upon the transparency of inputs to the valuation of an asset or liability (including those valued based on their market values as described in Note A.1 above). Inputs may be observable or unobservable and refer broadly to the assumptions that market participants would use in pricing the asset or liability. Observable inputs reflect the assumptions market participants would use in pricing the asset or liability based on market data obtained from sources independent of the Fund. Unobservable inputs reflect the Fund’s own assumptions about the assumptions that market participants would use in pricing the asset or liability based on the best information available in the circumstances. Each investment is assigned a level based upon the observability of the inputs which are significant to the overall valuation. The three-tier hierarchy of inputs is summarized below.
| | • | | Level 1—quoted prices in active markets for identical investments |
| | • | | Level 2—other significant observable inputs (including quoted prices for similar investments, interest rates, prepayment speeds, credit risk, etc.) |
| | • | | Level 3—significant unobservable inputs (including the Fund’s own assumptions in determining the fair value of investments) |
Where readily available market prices or relevant bid prices are not available for certain equity investments, such investments may be valued based on similar publicly traded investments, movements in relevant indices since last available prices or based upon underlying company fundamentals and comparable company data (such as multiples to earnings or other multiples to equity). Where an investment is valued using an observable input, such as another publicly traded security, the investment will be classified as Level 2. If management determines that an adjustment is appropriate based on restrictions on resale, illiquidity or uncertainty, and such adjustment is a significant component of the valuation, the investment will be
| | |
| abfunds.com | | AB SELECT US LONG/SHORT PORTFOLIO | 27 |
NOTES TO FINANCIAL STATEMENTS (continued)
classified as Level 3. An investment will also be classified as Level 3 where management uses company fundamentals and other significant inputs to determine the valuation.
Options are valued using market-based inputs to models, broker or dealer quotations, or alternative pricing sources with reasonable levels of price transparency, where such inputs and models are available. Alternatively the values may be obtained through unobservable management determined inputs and/or management’s proprietary models. Where models are used, the selection of a particular model to value an option depends upon the contractual terms of, and specific risks inherent in, the option as well as the availability of pricing information in the market. Valuation models require a variety of inputs, including contractual terms, market prices, measures of volatility and correlations of such inputs. Exchange traded options generally will be classified as Level 2. For options that do not trade on exchange but trade in liquid markets, inputs can generally be verified and model selection does not involve significant management judgment. Options are classified within Level 2 on the fair value hierarchy when all of the significant inputs can be corroborated to market evidence. Otherwise such instruments are classified as Level 3.
The following table summarizes the valuation of the Fund’s investments by the above fair value hierarchy levels as of June 30, 2017:
| | | | | | | | | | | | | | | | |
Investments in Securities: | | Level 1 | | | Level 2 | | | Level 3 | | | Total | |
Assets: | | | | | | | | | | | | | | | | |
Common Stocks(a) | | $ | 631,767,413 | | | $ | – 0 | – | | $ | – 0 | – | | $ | 631,767,413 | |
Investment Companies | | | 19,133,738 | | | | – 0 | – | | | – 0 | – | | | 19,133,738 | |
Preferred Stocks | | | – 0 | – | | | – 0 | – | | | 3,588,477 | | | | 3,588,477 | |
Short-Term Investments: | | | | | | | | | | | | | | | | |
Investment Companies | | | 266,493,780 | | | | – 0 | – | | | – 0 | – | | | 266,493,780 | |
U.S. Treasury Bills | | | – 0 | – | | | 4,994,207 | | | | – 0 | – | | | 4,994,207 | |
Investments of Cash Collateral for Securities Loaned in Affiliated Money Market Fund | | | 1,344,771 | | | | – 0 | – | | | – 0 | – | | | 1,344,771 | |
Liabilities: | | | | | | | | | | | | | | | | |
Investment Companies | | | (82,506,754 | ) | | | – 0 | – | | | – 0 | – | | | (82,506,754 | ) |
Common Stocks(a) | | | (11,287,743 | ) | | | – 0 | – | | | – 0 | – | | | (11,287,743 | ) |
| | | | | | | | | | | | | | | | |
Total Investments in Securities | | | 824,945,205 | | | | 4,994,207 | | | | 3,588,477 | | | | 833,527,889 | |
Other Financial Instruments(b): | | | | | | | | | | | | | | | | |
Assets: | | | | | | | | | | | | | | | | |
Futures | | | 32,175 | | | | – 0 | – | | | – 0 | – | | | 32,175 | (c) |
Total Return Swaps | | | – 0 | – | | | 276,094 | | | | – 0 | – | | | 276,094 | |
| | |
| 28 | AB SELECT US LONG/SHORT PORTFOLIO | | abfunds.com |
NOTES TO FINANCIAL STATEMENTS (continued)
| | | | | | | | | | | | | | | | |
Investments in Securities: | | Level 1 | | | Level 2 | | | Level 3 | | | Total | |
Liabilities: | | | | | | | | | | | | | | | | |
Total Return Swaps | | $ | – 0 | – | | $ | (39,303 | ) | | $ | – 0 | – | | $ | (39,303 | ) |
| | | | | | | | | | | | | | | | |
Total | | $ | 824,977,380 | | | $ | 5,230,998 | | | $ | 3,588,477 | | | $ | 833,796,855 | |
| | | | | | | | | | | | | | | | |
| (a) | See Portfolio of Investments for sector classifications. |
| (b) | Other financial instruments are derivative instruments, such as futures, forwards and swaps, which are valued at the unrealized appreciation/(depreciation) on the instrument. |
| (c) | Only variation margin receivable/(payable) at period end is reported within the statement of assets and liabilities. This amount reflects cumulative unrealized appreciation/(depreciation) of exchange-traded derivatives as reported in the portfolio of investments. |
| (d) | There were no transfers between any levels during the reporting period. |
The Fund recognizes all transfers between levels of the fair value hierarchy assuming the financial instruments were transferred at the beginning of the reporting period.
The following is a reconciliation of investments in which significant unobservable inputs (Level 3) were used in determining fair value.
| | | | | | | | |
| | | Preferred Stocks | | | Total | |
Balance as of 6/30/16 | | $ | 933,269 | | | $ | 933,269 | |
Accrued discounts/(premiums) | | | – 0 | – | | | – 0 | – |
Realized gain (loss) | | | – 0 | – | | | – 0 | – |
Change in unrealized appreciation/depreciation | | | (93,971 | ) | | | (93,971 | ) |
Purchases | | | 2,749,179 | | | | 2,749,179 | |
Sales | | | – 0 | – | | | – 0 | – |
Transfers in to Level 3 | | | – 0 | – | | | – 0 | – |
Transfers out of Level 3 | | | – 0 | – | | | – 0 | – |
| | | | | | | | |
Balance as of 6/30/17 | | $ | 3,588,477 | | | $ | 3,588,477 | |
| | | | | | | | |
Net change in unrealized appreciation/depreciation from investments held as of 6/30/17(a) | | $ | (93,971 | ) | | $ | (93,971 | ) |
| | | | | | | | |
| (a) | The unrealized appreciation/(depreciation) is included in net change in unrealized appreciation/(depreciation) on investments and other financial instruments in the accompanying statement of operations. |
The Adviser established the Committee to oversee the pricing and valuation of all securities held in the Fund. The Committee operates under pricing and valuation policies and procedures established by the Adviser and approved by the Board, including pricing policies which set forth the mechanisms and processes to be employed on a daily basis to implement these policies and procedures. In particular, the pricing policies describe how to determine market quotations for securities and other instruments. The Committee’s responsibilities include: 1) fair value and liquidity determinations (and oversight of any third parties to whom any responsibility for fair value and liquidity determinations is delegated), and 2) regular monitoring of the Adviser’s pricing and valuation policies and procedures and
| | |
| abfunds.com | | AB SELECT US LONG/SHORT PORTFOLIO | 29 |
NOTES TO FINANCIAL STATEMENTS (continued)
modification or enhancement of these policies and procedures (or recommendation of the modification of these policies and procedures) as the Committee believes appropriate.
The Committee is also responsible for monitoring the implementation of the pricing policies by the Adviser’s Pricing Group (the “Pricing Group”) and any third party which performs certain pricing functions in accordance with the pricing policies. The Pricing Group is responsible for the oversight of the third party on a day-to-day basis. The Committee and the Pricing Group perform a series of activities to provide reasonable assurance of the accuracy of prices including: 1) periodic vendor due diligence meetings, review of methodologies, new developments and processes at vendors, 2) daily comparison of security valuation versus prior day for all securities that exceeded established thresholds, and 3) daily review of unpriced, stale, and variance reports with exceptions reviewed by senior management and the Committee.
In addition, several processes outside of the pricing process are used to monitor valuation issues including: 1) performance and performance attribution reports are monitored for anomalous impacts based upon benchmark performance, and 2) portfolio managers review all portfolios for performance and analytics (which are generated using the Adviser’s prices).
3. Currency Translation
Assets and liabilities denominated in foreign currencies and commitments under forward currency exchange contracts are translated into U.S. dollars at the mean of the quoted bid and ask prices of such currencies against the U.S. dollar. Purchases and sales of portfolio securities are translated into U.S. dollars at the rates of exchange prevailing when such securities were acquired or sold. Income and expenses are translated into U.S. dollars at rates of exchange prevailing when accrued.
Net realized gain or loss on foreign currency transactions represents foreign exchange gains and losses from sales and maturities of foreign fixed income investments, foreign currency exchange contracts, holding of foreign currencies, currency gains or losses realized between the trade and settlement dates on foreign investment transactions, and the difference between the amounts of dividends, interest and foreign withholding taxes recorded on the Fund’s books and the U.S. dollar equivalent amounts actually received or paid. Net unrealized currency gains and losses from valuing foreign currency denominated assets and liabilities at period end exchange rates are reflected as a component of net unrealized appreciation or depreciation of foreign currency denominated assets and liabilities.
| | |
| 30 | AB SELECT US LONG/SHORT PORTFOLIO | | abfunds.com |
NOTES TO FINANCIAL STATEMENTS (continued)
4. Taxes
It is the Fund’s policy to meet the requirements of the Internal Revenue Code applicable to regulated investment companies and to distribute all of its investment company taxable income and net realized gains, if any, to shareholders. Therefore, no provisions for federal income or excise taxes are required. The Fund may be subject to taxes imposed by countries in which it invests. Such taxes are generally based on income and/or capital gains earned or repatriated. Taxes are accrued and applied to net investment income, net realized gains and net unrealized appreciation/depreciation as such income and/or gains are earned.
In accordance with U.S. GAAP requirements regarding accounting for uncertainties in income taxes, management has analyzed the Fund’s tax positions taken or expected to be taken on federal and state income tax returns for all open tax years (the current and the prior three tax years) and has concluded that no provision for income tax is required in the Fund’s financial statements.
5. Investment Income and Investment Transactions
Dividend income is recorded on the ex-dividend date or as soon as the Fund is informed of the dividend. Interest income is accrued daily. Investment transactions are accounted for on the date the securities are purchased or sold. Investment gains or losses are determined on the identified cost basis. The Fund amortizes premiums and accretes discounts as adjustments to interest income.
6. Class Allocations
All income earned and expenses incurred by the Fund are borne on a pro-rata basis by each outstanding class of shares, based on the proportionate interest in the Fund represented by the net assets of such class, except for class specific expenses which are allocated to the respective class. Expenses of the Company are charged proportionately to each portfolio or based on other appropriate methods. Realized and unrealized gains and losses are allocated among the various share classes based on respective net assets.
7. Dividends and Distributions
Dividends and distributions to shareholders, if any, are recorded on the ex-dividend date. Income dividends and capital gains distributions are determined in accordance with federal tax regulations and may differ from those determined in accordance with U.S. GAAP. To the extent these differences are permanent, such amounts are reclassified within the capital accounts based on their federal tax basis treatment; temporary differences do not require such reclassification.
| | |
| abfunds.com | | AB SELECT US LONG/SHORT PORTFOLIO | 31 |
NOTES TO FINANCIAL STATEMENTS (continued)
NOTE B
Advisory Fee and Other Transactions with Affiliates
Under the terms of the investment advisory agreement, the Fund pays the Adviser an advisory fee at an annual rate of 1.50% of the first $2.5 billion and 1.475% thereafter of the Fund’s average daily net assets. Effective February 3, 2017, the advisory fee was reduced from 1.70% to 1.50% of the first $2.5 billion and 1.60% to 1.475% thereafter of the Fund’s average daily net assets. The Adviser has agreed to waive its fees and bear certain expenses to the extent necessary to limit total operating expenses (excluding dividend expense, borrowing costs and brokerage expense on securities sold short) on an annual basis (the “Expense Caps”) to 1.90%, 2.65%, 1.65%, 2.15%, 1.90% and 1.65%, of average daily net assets for Class A, Class C, Advisor Class, Class R, Class K and Class I shares, respectively. Effective February 3, 2017, the Expense Caps were reduced from 2.20% to 1.90%, 2.95% to 2.65%, 1.95% to 1.65%, 2.45% to 2.15%, 2.20% to 1.90% and 1.95% to 1.65%, of average daily net assets for Class A, Class C, Advisor Class, Class R, Class K and Class I shares, respectively. For the year ended June 30, 2017, such reimbursements/waivers amounted to $263.
Pursuant to the investment advisory agreement, the Fund may reimburse the Adviser for certain legal and accounting services provided to the Fund by the Adviser. For the year ended June 30, 2017, the reimbursement for such services amounted to $54,471.
The Fund compensates AllianceBernstein Investor Services, Inc. (“ABIS”), a wholly-owned subsidiary of the Adviser, under a Transfer Agency Agreement for providing personnel and facilities to perform transfer agency services for the Fund. ABIS may make payments to intermediaries that provide omnibus account services, sub-accounting services and/or networking services. Such compensation retained by ABIS amounted to $194,323 for the year ended June 30, 2017.
AllianceBernstein Investments, Inc. (the “Distributor”), a wholly-owned subsidiary of the Adviser, serves as the distributor of the Fund’s shares. The Distributor has advised the Fund that it has retained front-end sales charges of $3,930 from the sale of Class A shares and received $6,710 and $9,463 in contingent deferred sales charges imposed upon redemptions by shareholders of Class A and C shares, respectively, for the year ended June 30, 2017.
The Fund may invest in AB Government Money Market Portfolio (the “Government Money Market Portfolio”) which has a contractual annual advisory fee rate of .20% of the portfolio’s average daily net assets and bears its own expenses. In connection with the investment by the Fund in
| | |
| 32 | AB SELECT US LONG/SHORT PORTFOLIO | | abfunds.com |
NOTES TO FINANCIAL STATEMENTS (continued)
the Government Money Market Portfolio, the Adviser has agreed to waive its advisory fee from the Fund in an amount equal to the Fund’s pro rata share of the effective advisory fee of Government Money Market Portfolio, as borne indirectly by the Fund as an acquired fund fee and expense. For the year ended June 30, 2017, such waiver amounted to $746,550. A summary of the Fund’s transactions in shares of the Government Money Market Portfolio for the year ended June 30, 2017 is as follows:
| | | | | | | | | | | | | | | | | | |
Market Value 6/30/16 (000) | | | Purchases
at Cost
(000) | | | Sales
Proceeds
(000) | | | Market Value
6/30/17
(000) | | | Dividend
Income
(000) | |
| $ | 411,826 | | | $ | 471,506 | | | $ | 616,838 | | | $ | 266,494 | | | $ | 1,432 | |
Brokerage commissions paid on investment transactions for the year ended June 30, 2017 amounted to $2,092,664, of which $0 and $0, respectively, was paid to Sanford C. Bernstein & Co. LLC and Sanford C. Bernstein Limited, affiliates of the Adviser.
NOTE C
Distribution Services Agreement
The Fund has adopted a Distribution Services Agreement (the “Agreement”) pursuant to Rule 12b-1 under the Investment Company Act of 1940. Under the Agreement, the Fund pays distribution and servicing fees to the Distributor at an annual rate of up to .25% of the Fund’s average daily net assets attributable to Class A shares, 1% of the Fund’s average daily net assets attributable to Class C shares, .50% of the Fund’s average daily net assets attributable to Class R shares, and .25% of the Fund’s average daily net assets attributable to Class K shares. Effective October 31, 2014, payments under the Agreement in respect of Class A shares are limited to an annual rate of .25% of Class A shares average daily net assets. There are no distribution and servicing fees on the Advisor Class and Class I shares. The fees are accrued daily and paid monthly. The Agreement provides that the Distributor will use such payments in their entirety for distribution assistance and promotional activities. Since the commencement of the Fund’s operations, the Distributor has incurred expenses in excess of the distribution costs reimbursed by the Fund in the amounts of $-0-, $-0- and $-0- for Class C, Class R and Class K shares, respectively. While such costs may be recovered from the Fund in future periods so long as the Agreement is in effect, the rate of the distribution and servicing fees payable under the Agreement may not be increased without a shareholder vote. In accordance with the Agreement, there is no provision for recovery of unreimbursed distribution costs incurred by the Distributor beyond the current fiscal year for Class A shares. The Agreement also provides that the Adviser may use its own resources to finance the distribution of the Fund’s shares.
| | |
| abfunds.com | | AB SELECT US LONG/SHORT PORTFOLIO | 33 |
NOTES TO FINANCIAL STATEMENTS (continued)
NOTE D
Investment Transactions
Purchases and sales of investment securities (excluding short-term investments) for the year ended June 30, 2017, were as follows:
| | | | | | | | | | | | | | |
| Purchases | | | Sales | | | Securities
Sold Short | | | Covers on
Securities Sold
Short | |
| $ | 1,940,422,625 | | | $ | 2,129,869,713 | | | $ | 1,936,881,390 | | | $ | 1,938,686,973 | |
During the year ended June 30, 2017, there were no purchases or sales of U.S. Government Securities.
The cost of investments for federal income tax purposes, gross unrealized appreciation and unrealized depreciation (excluding futures and foreign currency transactions) are as follows:
| | | | | | | | | | | | | | | | | | | | | | |
| | | | Gross Unrealized | | | Net
Unrealized
Appreciation
on
Investments | | | Net
Unrealized
Depreciation
on
Securities
Sold Short | | | Net
Unrealized
Appreciation | |
Cost of
Investments | | | Appreciation
on
Investments | | | Depreciation
on
Investments | | | | |
| $ | 913,428,749 | | | $ | 31,960,929 | | | $ | (18,067,292 | ) | | $ | 13,893,637 | | | $ | (11,822,134 | )(a) | | $ | 2,071,503 | |
| (a) | Gross unrealized appreciation was $618,570 and gross unrealized depreciation was $(12,440,704), resulting in net unrealized appreciation of $(11,822,134). |
1. Derivative Financial Instruments
The Fund may use derivatives in an effort to earn income and enhance returns, to replace more traditional direct investments, to obtain exposure to otherwise inaccessible markets (collectively, “investment purposes”), or to hedge or adjust the risk profile of its portfolio.
The principal types of derivatives utilized by the Fund, as well as the methods in which they may be used are:
The Fund may buy or sell futures for investment purposes or for the purpose of hedging its portfolio against adverse effects of potential movements in the market. The Fund bears the market risk that arises from changes in the value of these instruments and the imperfect correlation between movements in the price of the futures and movements in the price of the assets, reference rates or indices which they are designed to track. Among other things, the Fund may purchase or sell futures for foreign currencies or options thereon for non-hedging purposes as a means of making direct investment in foreign currencies, as described below under “Currency Transactions”.
| | |
| 34 | AB SELECT US LONG/SHORT PORTFOLIO | | abfunds.com |
NOTES TO FINANCIAL STATEMENTS (continued)
At the time the Fund enters into futures, the Fund deposits and maintains as collateral an initial margin with the broker, as required by the exchange on which the transaction is effected. Such amount is shown as cash collateral due from broker on the statement of assets and liabilities. Pursuant to the contract, the Fund agrees to receive from or pay to the broker an amount of cash equal to the daily fluctuation in the value of the contract. Such receipts or payments are known as variation margin and are recorded by the Fund as unrealized gains or losses. Risks may arise from the potential inability of a counterparty to meet the terms of the contract. The credit/counterparty risk for exchange-traded futures is generally less than privately negotiated futures, since the clearinghouse, which is the issuer or counterparty to each exchange-traded future, has robust risk mitigation standards, including the requirement to provide initial and variation margin. When the contract is closed, the Fund records a realized gain or loss equal to the difference between the value of the contract at the time it was opened and the time it was closed.
During the year ended June 30, 2017, the Fund held futures for hedging purposes.
For hedging and investment purposes, the Fund may purchase and write (sell) put and call options on U.S. and foreign securities, including government securities, and foreign currencies that are traded on U.S. and foreign securities exchanges and over-the-counter markets. Among other things, the Fund may use options transactions for non-hedging purposes as a means of making direct investments in foreign currencies, as described below under “Currency Transactions” and may use options strategies involving the purchase and/or writing of various combinations of call and/or put options, for hedging and investment purposes.
The risk associated with purchasing an option is that the Fund pays a premium whether or not the option is exercised. Additionally, the Fund bears the risk of loss of the premium and change in market value should the counterparty not perform under the contract. If a put or call option purchased by the Fund were permitted to expire without being sold or exercised, its premium would represent a loss to the Fund. Put and call options purchased are accounted for in the same manner as portfolio securities. The cost of securities acquired through the exercise of call options is increased by premiums paid. The proceeds from securities sold through the exercise of put options are decreased by the premiums paid.
When the Fund writes an option, the premium received by the Fund is recorded as a liability and is subsequently adjusted to the current
| | |
| abfunds.com | | AB SELECT US LONG/SHORT PORTFOLIO | 35 |
NOTES TO FINANCIAL STATEMENTS (continued)
market value of the option written. Premiums received from written options which expire unexercised are recorded by the Fund on the expiration date as realized gains from options written. The difference between the premium received and the amount paid on effecting a closing purchase transaction, including brokerage commissions, is also treated as a realized gain, or if the premium received is less than the amount paid for the closing purchase transaction, as a realized loss. If a call option is exercised, the premium received is added to the proceeds from the sale of the underlying security or currency in determining whether the Fund has realized a gain or loss. If a put option is exercised, the premium received reduces the cost basis of the security or currency purchased by the Fund. In writing an option, the Fund bears the market risk of an unfavorable change in the price of the security or currency underlying the written option. Exercise of an option written by the Fund could result in the Fund selling or buying a security or currency at a price different from the current market value.
During the year ended June 30, 2017, the Fund held written options for non-hedging purposes.
For the year ended June 30, 2017, the Fund had the following transactions in written options:
| | | | | | | | |
| | | Number of
Contracts | | | Premiums
Received | |
Options written outstanding as of 6/30/16 | | | – 0 | – | | $ | – 0 | – |
Options written | | | 1,929 | | | | 3,400,919 | |
Options expired | | | – 0 | – | | | – 0 | – |
Options bought back | | | (1,929 | ) | | | (3,400,919 | ) |
Options exercised | | | – 0 | – | | | – 0 | – |
| | | | | | | | |
Options written outstanding as of 6/30/17 | | | – 0 | – | | $ | – 0 | – |
| | | | | | | | |
The Fund may enter into swaps to hedge its exposure to interest rates, credit risk, equity markets and currencies. The Fund may also enter into swaps for non-hedging purposes as a means of gaining market exposures, including by making direct investments in foreign currencies, as described below under “Currency Transactions” or in order to take a “long” or “short” position with respect to an underlying referenced asset described below under “Total Return Swaps”. A swap is an agreement that obligates two parties to exchange a series of cash flows at specified intervals based upon or calculated by reference to changes in specified prices or rates for a specified amount of an underlying asset. The payment flows are usually netted against each other, with the difference being paid by one party to the
| | |
| 36 | AB SELECT US LONG/SHORT PORTFOLIO | | abfunds.com |
NOTES TO FINANCIAL STATEMENTS (continued)
other. In addition, collateral may be pledged or received by the Fund in accordance with the terms of the respective swaps to provide value and recourse to the Fund or its counterparties in the event of default, bankruptcy or insolvency by one of the parties to the swap.
Risks may arise as a result of the failure of the counterparty to the swap to comply with the terms of the swap. The loss incurred by the failure of a counterparty is generally limited to the net interim payment to be received by the Fund, and/or the termination value at the end of the contract. Therefore, the Fund considers the creditworthiness of each counterparty to a swap in evaluating potential counterparty risk. This risk is mitigated by having a netting arrangement between the Fund and the counterparty and by the posting of collateral by the counterparty to the Fund to cover the Fund’s exposure to the counterparty. Additionally, risks may arise from unanticipated movements in interest rates or in the value of the underlying securities. The Fund accrues for the interim payments on swaps on a daily basis, with the net amount recorded within unrealized appreciation/depreciation of swaps on the statement of assets and liabilities, where applicable. Once the interim payments are settled in cash, the net amount is recorded as realized gain/(loss) on swaps on the statement of operations, in addition to any realized gain/(loss) recorded upon the termination of swaps. Upfront premiums paid or received are recognized as cost or proceeds on the statement of assets and liabilities and are amortized on a straight line basis over the life of the contract. Amortized upfront premiums are included in net realized gain/(loss) from swaps on the statement of operations. Fluctuations in the value of swaps are recorded as a component of net change in unrealized appreciation/depreciation of swaps on the statement of operations.
Total Return Swaps:
The Fund may enter into total return swaps in order to take a “long” or “short” position with respect to an underlying referenced asset. The Fund is subject to market price volatility of the underlying referenced asset. A total return swap involves commitments to pay interest in exchange for a market linked return based on a notional amount. To the extent that the total return of the security, group of securities or index underlying the transaction exceeds or falls short of the offsetting interest obligation, the Fund will receive a payment from or make a payment to the counterparty.
During the year ended June 30, 2017, the Fund held total return swaps for non-hedging purposes.
The Fund typically enters into International Swaps and Derivatives Association, Inc. Master Agreements (“ISDA Master Agreement”) or similar master agreements (collectively, “Master Agreements”) with its derivative contract
| | |
| abfunds.com | | AB SELECT US LONG/SHORT PORTFOLIO | 37 |
NOTES TO FINANCIAL STATEMENTS (continued)
counterparties in order to, among other things, reduce its credit risk to counterparties. ISDA Master Agreements include provisions for general obligations, representations, collateral and events of default or termination. Under an ISDA Master Agreement, the Fund typically may offset with the counterparty certain derivative financial instruments’ payables and/or receivables with collateral held and/or posted and create one single net payment (close-out netting) in the event of default or termination.
Various Master Agreements govern the terms of certain transactions with counterparties, including transactions such as derivative transactions, repurchase and reverse repurchase agreements. These Master Agreements typically attempt to reduce the counterparty risk associated with such transactions by specifying credit protection mechanisms and providing standardization that improves legal certainty. Cross-termination provisions under Master Agreements typically provide that a default in connection with one transaction between the Fund and a counterparty gives the non-defaulting party the right to terminate any other transactions in place with the defaulting party to create one single net payment due to/due from the defaulting party. In the event of a default by a Master Agreements counterparty, the return of collateral with market value in excess of the Fund’s net liability, held by the defaulting party, may be delayed or denied.
The Fund’s Master Agreements may contain provisions for early termination of OTC derivative transactions in the event the net assets of the Fund decline below specific levels (“net asset contingent features”). If these levels are triggered, the Fund’s counterparty has the right to terminate such transaction and require the Fund to pay or receive a settlement amount in connection with the terminated transaction. For additional details, please refer to netting arrangements by counterparty tables below.
During the year ended June 30, 2017, the Fund had entered into the following derivatives:
| | | | | | | | | | | | |
| | | Asset Derivatives | | | Liability Derivatives | |
Derivative Type | | Statement of Assets and Liabilities Location | | Fair Value | | | Statement of Assets and Liabilities Location | | Fair Value | |
Equity contracts | | Receivable/Payable for variation margin on exchange-traded derivatives | | $ | 32,175 | * | | | | | | |
| | | | |
Equity contracts | | Unrealized appreciation on total return swaps | | | 276,094 | | | Unrealized depreciation on total return swaps | | $ | 39,303 | |
| | | | | | | | | | | | |
Total | | | | $ | 308,269 | | | | | $ | 39,303 | |
| | | | | | | | | | | | |
| * | Only variation margin receivable/payable at period end is reported within the statement of assets and liabilities. This amount reflects cumulative appreciation/(depreciation) of exchange-traded derivatives as reported in the portfolio of investments. |
| | |
| 38 | AB SELECT US LONG/SHORT PORTFOLIO | | abfunds.com |
NOTES TO FINANCIAL STATEMENTS (continued)
| | | | | | | | | | |
Derivative Type | | Location of Gain or (Loss) on Derivatives Within Statement of Operations | | Realized Gain
or (Loss) on
Derivatives | | | Change in
Unrealized
Appreciation or
(Depreciation) | |
Interest rate contracts | | Net realized gain (loss) on futures; Net change in unrealized appreciation/depreciation of futures | | $ | 922,738 | | | $ | – 0 | – |
| | | |
Equity contracts | | Net realized gain (loss) on futures; Net change in unrealized appreciation/depreciation of futures | | | (466,749 | ) | | | 32,175 | |
| | | |
Equity contracts | | Net realized gain (loss) on options written; Net change in unrealized appreciation/depreciation of options written | | | (572,694 | ) | | | – 0 | – |
| | | |
Equity contracts | | Net realized gain (loss) on swaps; Net change in unrealized appreciation/depreciation of swaps | | | 33,949 | | | | 236,791 | |
| | | | | | | | | | |
Total | | | | $ | (82,756 | ) | | $ | 268,966 | |
| | | | | | | | | | |
The following table represents the average monthly volume of the Fund’s derivative transactions during the year ended June 30, 2017:
| | | | |
Futures: | | | | |
Average original value of sale contracts | | $ | 26,861,904 | (a) |
Total Return Swaps: | | | | |
Average notional amount | | $ | 4,702,704 | (b) |
| (a) | Positions were open for five months during the year. |
| (b) | Positions were open for six months during the year. |
For financial reporting purposes, the Fund does not offset derivative assets and derivative liabilities that are subject to netting arrangements in the statement of assets and liabilities.
| | |
| abfunds.com | | AB SELECT US LONG/SHORT PORTFOLIO | 39 |
NOTES TO FINANCIAL STATEMENTS (continued)
All derivatives held at period end were subject to netting arrangements. The following table presents the Fund’s derivative assets and liabilities by counterparty net of amounts available for offset under Master Agreements (“MA”) and net of the related collateral received/pledged by the Fund as of June 30, 2017:
| | | | | | | | | | | | | | | | | | | | |
Counterparty | | Derivative
Assets
Subject to a
MA | | | Derivative
Available for
Offset | | | Cash
Collateral
Received | | | Security
Collateral
Received | | | Net Amount
of Derivatives
Assets | |
OTC Derivatives: | |
Morgan Stanley Capital Services LLC | | $ | 276,094 | | | $ | (39,303 | ) | | $ | – 0 | – | | $ | – 0 | – | | $ | 236,791 | |
| | | | | | | | | | | | | | | | | | | | |
Total | | $ | 276,094 | | | $ | (39,303 | ) | | $ | – 0 | – | | $ | – 0 | – | | $ | 236,791 | ^ |
| | | | | | | | | | | | | | | | | | | | |
| | | | | | | | | | | | | | | | | | | | |
Counterparty | | Derivative
Liabilities
Subject to a
MA | | | Derivative
Available
for Offset | | | Cash
Collateral
Pledged* | | | Security
Collateral
Pledged* | | | Net Amount
of Derivatives
Liabilities | |
Exchange-Traded Derivatives: | |
Morgan Stanley & Co., Inc.** | | $ | 8,865 | | | $ | – 0 | – | | $ | (8,865 | ) | | $ | – 0 | – | | $ | – 0 | – |
| | | | | | | | | | | | | | | | | | | | |
Total | | $ | 8,865 | | | $ | – 0 | – | | $ | (8,865 | ) | | $ | – 0 | – | | $ | – 0 | – |
| | | | | | | | | | | | | | | | | | | | |
OTC Derivatives: | | | | | | | | | | | | | | | | | | | | |
Morgan Stanley Capital Services LLC | | $ | 39,303 | | | $ | (39,303 | ) | | $ | – 0 | – | | $ | – 0 | – | | $ | – 0 | – |
| | | | | | | | | | | | | | | | | | | | |
Total | | $ | 39,303 | | | $ | (39,303 | ) | | $ | – 0 | – | | $ | – 0 | – | | $ | – 0 | – |
| | | | | | | | | | | | | | | | | | | | |
| * | The actual collateral received/pledged is more than the amount reported due to over-collateralization. |
| ** | Cash has been posted for initial margin requirements for exchange-traded derivatives outstanding at June 30, 2017. |
| ^ | Net amount represents the net receivable/payable that would be due from/to the counterparty in the event of default or termination. The net amount from OTC financial derivative instruments can only be netted across transactions governed under the same master agreement with the same counterparty. |
2. Currency Transactions
The Fund may invest in non-U.S. Dollar-denominated securities on a currency hedged or unhedged basis. The Fund may seek investment opportunities by taking long or short positions in currencies through the use of currency-related derivatives, including forward currency exchange contracts, futures and options on futures, swaps, and other options. The Fund may enter into transactions for investment opportunities when it anticipates that a foreign currency will appreciate or depreciate in value but securities denominated in that currency are not held by the Fund and do not present attractive investment opportunities. Such transactions may also be used when the Adviser believes that it may be more efficient than a direct investment in a foreign currency-denominated security. The Fund may also conduct currency exchange contracts on a spot basis (i.e., for cash at the spot rate prevailing in the currency exchange market for buying or selling currencies).
| | |
| 40 | AB SELECT US LONG/SHORT PORTFOLIO | | abfunds.com |
NOTES TO FINANCIAL STATEMENTS (continued)
3. Short Sales
The Fund may sell securities short. A short sale is a transaction in which the Fund sells securities it does not own, but has borrowed, in anticipation of a decline in the market price of the securities. The Fund is obligated to replace the borrowed securities at their market prices at the time of settlement. The Fund’s obligation to replace the securities borrowed in connection with a short sale will be fully secured by collateral deposited with the broker. The Fund is liable to the buyer for any dividends/interest payable on securities while those securities are in a short position. These dividends/interest are recorded as an expense of the Fund. Short sales by the Fund involve certain risks and special considerations. Possible losses from short sales differ from losses that could be incurred from a purchase of a security because losses from short sales may be unlimited, whereas losses from purchases cannot exceed the total amount invested.
NOTE E
Securities Lending
The Fund may enter into securities lending transactions. Under the Fund’s securities lending program, all loans of securities will be collateralized continually by cash. The Fund will be compensated for the loan from a portion of the net return from the income earned on cash collateral after a rebate is paid to the borrower (in some cases, this rebate may be a “negative rebate” or fee paid by the borrower to the Fund in connection with the loan), and payments are made for fees of the securities lending agent and for certain other administrative expenses. It is the policy of the Fund to receive collateral consisting of cash in an amount exceeding the value of the securities loaned. The Fund will have the right to call a loan and obtain the securities loaned at any time on notice to the borrower within the normal and customary settlement time for the securities. While the securities are on loan, the borrower is obligated to pay the Fund amounts equal to any income or other distributions from the securities. The Fund will not be able to exercise voting rights with respect to any securities during the existence of a loan, but will have the right to regain ownership of loaned securities in order to exercise voting or other ownership rights. The lending agent has agreed to indemnify the Fund in the case of default of any securities borrower. Collateral received and securities loaned are marked to market daily to ensure that the securities loaned are secured by collateral. The lending agent currently invests the cash collateral received in Government Money Market Portfolio, an eligible money market vehicle, in accordance with the investment restrictions of the Fund, and as approved by the Board. The collateral received on securities loaned is recorded as an asset as well as a corresponding liability in the statement of assets and liabilities. When the Fund lends securities, its investment performance will continue to reflect changes in the value of the securities loaned. At June 30, 2017, the Fund had securities on loan with a value of $1,265,126 and had
| | |
| abfunds.com | | AB SELECT US LONG/SHORT PORTFOLIO | 41 |
NOTES TO FINANCIAL STATEMENTS (continued)
received cash collateral which has been invested into Government Money Market Portfolio of $1,344,771. The cash collateral will be adjusted on the next business day to maintain the required collateral amount. The Fund earned securities lending income of $68,026 and $41,723 from the borrowers and Government Money Market Portfolio, respectively, for the year ended June 30, 2017; these amounts are reflected in the statement of operations. In connection with the cash collateral investment by the Fund in the Government Money Market Portfolio, the Adviser has agreed to waive a portion of the Fund’s share of the advisory fees of Government Money Market Portfolio, as borne indirectly by the Fund as an acquired fund fee and expense. For the year ended June 30, 2017, such waiver amounted to $13,560. A principal risk of lending portfolio securities is that the borrower may fail to return the loaned securities upon termination of the loan and that the collateral will not be sufficient to replace the loaned securities.
| | | | | | | | | | | | | | |
Market Value 6/30/16 (000) | | | Purchases
at Cost
(000) | | | Sales
Proceeds
(000) | | | Market Value
6/30/17
(000) | |
| $ | – 0 | – | | $ | 223,238 | | | $ | 221,893 | | | $ | 1,345 | |
NOTE F
Capital Stock
Each class consists of 3,000,000,000 authorized shares. Transactions in capital shares for each class were as follows:
| | | | | | | | | | | | | | | | | | | | | | | | |
| | | | | | | | | | | | | | | | | | | | | | | | |
| | | Shares | | | | | | Amount | | | | |
| | | Year Ended
June 30,
2017 | | | Year Ended
June 30, 2016 | | | | | | Year Ended
June 30, 2017 | | | Year Ended
June 30, 2016 | | | | |
| | | | | | | | |
| Class A | | | | | |
Shares sold | | | 1,470,451 | | | | 3,980,888 | | | | | | | $ | 17,484,612 | | | $ | 45,579,496 | | | | | |
| | | | | |
Shares issued in reinvestment of distributions | | | – 0 | – | | | 512,108 | | | | | | | | – 0 | – | | | 5,832,905 | | | | | |
| | | | | |
Shares converted from Class C | | | 36,048 | | | | – 0 | – | | | | | | | 438,516 | | | | – 0 | – | | | | |
| | | | | |
Shares redeemed | | | (6,802,494 | ) | | | (16,103,448 | ) | | | | | | | (80,665,383 | ) | | | (185,367,221 | ) | | | | |
| | | | | |
Net decrease | | | (5,295,995 | ) | | | (11,610,452 | ) | | | | | | $ | (62,742,255 | ) | | $ | (133,954,820 | ) | | | | |
| | | | | |
| | |
| 42 | AB SELECT US LONG/SHORT PORTFOLIO | | abfunds.com |
NOTES TO FINANCIAL STATEMENTS (continued)
| | | | | | | | | | | | | | | | | | | | | | | | |
| | | | | | | | | | | | | | | | | | | | | | | | |
| | | Shares | | | | | | Amount | | | | |
| | | Year Ended
June 30,
2017 | | | Year Ended
June 30, 2016 | | | | | | Year Ended
June 30, 2017 | | | Year Ended
June 30, 2016 | | | | |
| | | | | | | | |
| Class C | | | | | |
Shares sold | | | 479,206 | | | | 1,541,834 | | | | | | | $ | 5,495,405 | | | $ | 17,289,997 | | | | | |
| | | | | |
Shares issued in reinvestment of distributions | | | – 0 | – | | | 551,643 | | | | | | | | – 0 | – | | | 6,139,797 | | | | | |
| | | | | |
Shares converted to Class A | | | (37,275 | ) | | | – 0 | – | | | | | | | (438,516 | ) | | | – 0 | – | | | | |
| | | | | |
Shares redeemed | | | (5,506,099 | ) | | | (7,756,112 | ) | | | | | | | (62,928,210 | ) | | | (86,407,219 | ) | | | | |
| | | | | |
Net decrease | | | (5,064,168 | ) | | | (5,662,635 | ) | | | | | | $ | (57,871,321 | ) | | $ | (62,977,425 | ) | | | | |
| | | | | |
| | | | | | | | | | | | | | | | | | | | | | | | |
| Advisor Class | | | | | |
Shares sold | | | 16,674,164 | | | | 26,748,409 | | | | | | | $ | 200,190,446 | | | $ | 309,059,528 | | | | | |
| | | | | |
Shares issued in reinvestment of distributions | | | – 0 | – | | | 2,387,638 | | | | | | | | – 0 | – | | | 27,433,956 | | | | | |
| | | | | |
Shares redeemed | | | (31,948,016 | ) | | | (58,473,392 | ) | | | | | | | (381,643,335 | ) | | | (669,940,124 | ) | | | | |
| | | | | |
Net decrease | | | (15,273,852 | ) | | | (29,337,345 | ) | | | | | | $ | (181,452,889 | ) | | $ | (333,446,640 | ) | | | | |
| | | | | |
| | | | | | | | | | | | | | | | | | | | | | | | |
| Class R | | | | | |
Shares sold | | | 11,304 | | | | 16,174 | | | | | | | $ | 130,662 | | | $ | 180,055 | | | | | |
| | | | | |
Shares issued in reinvestment of distributions | | | – 0 | – | | | 1,824 | | | | | | | | – 0 | – | | | 20,624 | | | | | |
| | | | | |
Shares redeemed | | | (40,806 | ) | | | (10,163 | ) | | | | | | | (473,192 | ) | | | (116,471 | ) | | | | |
| | | | | |
Net increase (decrease) | | | (29,502 | ) | | | 7,835 | | | | | | | $ | (342,530 | ) | | $ | 84,208 | | | | | |
| | | | | |
| | | | | | | | | | | | | | | | | | | | | | | | |
Class K | | | | | |
Shares sold | | | 15 | | | | 87 | | | | | | | $ | 180 | | | $ | 977 | | | | | |
| | | | | |
Shares issued in reinvestment of distributions | | | – 0 | – | | | 53 | | | | | | | | – 0 | – | | | 604 | | | | | |
| | | | | |
Shares redeemed | | | (1,717 | ) | | | – 0 | – | | | | | | | (19,864 | ) | | | – 0 | – | | | | |
| | | | | |
Net increase (decrease) | | | (1,702 | ) | | | 140 | | | | | | | $ | (19,684 | ) | | $ | 1,581 | | | | | |
| | | | | |
| | | | | | | | | | | | | | | | | | | | | | | | |
| Class I | | | | | |
Shares sold | | | 2,167 | | | | 2,300 | | | | | | | $ | 27,000 | | | $ | 27,105 | | | | | |
| | | | | |
Shares issued in reinvestment of distributions | | | – 0 | – | | | 36,036 | | | | | | | | – 0 | – | | | 414,423 | | | | | |
| | | | | |
Shares redeemed | | | (162,865 | ) | | | (893,932 | ) | | | | | | | (1,959,343 | ) | | | (10,674,401 | ) | | | | |
| | | | | |
Net decrease | | | (160,698 | ) | | | (855,596 | ) | | | | | | $ | (1,932,343 | ) | | $ | (10,232,873 | ) | | | | |
| | | | | |
| | |
| abfunds.com | | AB SELECT US LONG/SHORT PORTFOLIO | 43 |
NOTES TO FINANCIAL STATEMENTS (continued)
NOTE G
Risks Involved in Investing in the Fund
Short Sale Risk—Short sales involve the risk that the Fund will incur a loss by subsequently buying a security at a higher price than the price at which it sold the security. The amount of such loss is theoretically unlimited, as it will be based on the increase in value of the security sold short. In contrast, the risk of loss from a long position is limited to the Fund’s investment in the security, because the price of the security cannot fall below zero. The Fund may not always be able to close out a short position on favorable terms.
Derivatives Risk—The Fund may enter into derivative transactions such as forwards, options, futures and swaps. Derivatives may be illiquid, difficult to price, and leveraged so that small changes may produce disproportionate losses for the Fund, and subject to counterparty risk to a greater degree than more traditional investments. Derivatives may result in significant losses, including losses that are far greater than the value of the derivatives reflected on the statement of assets and liabilities.
Leverage Risk—When the Fund borrows money or otherwise leverages its investments, its performance may be volatile because leverage tends to exaggerate the effect of any increase or decrease in the value of the Fund’s investments. The Fund may create leverage through the use of reverse repurchase arrangements, forward currency exchange contracts, forward commitments, dollar rolls or futures or by borrowing money. The use of other types of derivative instruments by the Fund, such as options and swaps, may also result in a form of leverage. Leverage may result in higher returns to the Fund than if the Fund were not leveraged, but may also adversely affect returns, particularly if the market is declining.
Capitalization Risk—Investments in small- and mid-capitalization companies may be more volatile than investments in large-capitalization companies. Investments in these companies may have additional risks because these companies have limited product lines, markets or financial resources.
Active Trading Risk—The Fund expects to engage in active and frequent trading of its portfolio securities and its portfolio turnover rate is expected to greatly exceed 100%. A higher rate of portfolio turnover increases transaction costs, which may negatively affect the Fund’s return. In addition, a high rate of portfolio turnover may result in substantial short-term gains, which may have adverse tax consequences for Fund shareholders.
Indemnification Risk—In the ordinary course of business, the Fund enters into contracts that contain a variety of indemnifications. The Fund’s maximum exposure under these arrangements is unknown. However, the Fund has not had prior claims or losses pursuant to these indemnification provisions and expects the risk of loss thereunder to be remote. Therefore, the Fund has not accrued any liability in connection with these indemnification provisions.
| | |
| 44 | AB SELECT US LONG/SHORT PORTFOLIO | | abfunds.com |
NOTES TO FINANCIAL STATEMENTS (continued)
NOTE H
Joint Credit Facility
A number of open-end mutual funds managed by the Adviser, including the Fund, participate in a $280 million revolving credit facility (the “Facility”) intended to provide short-term financing, if necessary, subject to certain restrictions in connection with abnormal redemption activity. Commitment fees related to the Facility are paid by the participating funds and are included in miscellaneous expenses in the statement of operations. The Fund did not utilize the Facility during the year ended June 30, 2017.
NOTE I
Distributions to Shareholders
The tax character of distributions paid during the fiscal years ended June 30, 2017 and June 30, 2016 were as follows:
| | | | | | | | |
| | | 2017 | | | 2016 | |
Distributions paid from: | | | | | | | | |
Ordinary income | | $ | – 0 | – | | $ | 48,607,641 | |
Long-term capital gains | | | – 0 | – | | | 318,417 | |
| | | | | | | | |
Total taxable distributions | | $ | – 0 | – | | $ | 48,926,058 | |
| | | | | | | | |
As of June 30, 2017, the components of accumulated earnings/(deficit) on a tax basis were as follows:
| | | | |
Undistributed ordinary income | | $ | 24,172,147 | |
Accumulated capital and other losses | | | (156,049 | )(a) |
Unrealized appreciation/(depreciation) | | | 2,310,761 | (b) |
| | | | |
Total accumulated earnings/(deficit) | | $ | 26,326,859 | |
| | | | |
| (a) | As of June 30, 2017, the fund had deferred losses on unsettled shorts of $156,049. |
| (b) | The difference between book-basis and tax-basis unrealized appreciation/(depreciation) is attributable primarily to the tax deferral of losses on wash sales, the tax treatment of swaps, and the recognition for tax purposes of unrealized gains/losses on certain derivative instruments. |
For tax purposes, net realized capital losses may be carried over to offset future capital gains, if any. Funds are permitted to carry forward capital losses for an indefinite period, and such losses will retain their character as either short-term or long-term capital losses. As of June 30, 2017, the Fund did not have any capital loss carryforwards.
During the current fiscal year, permanent differences primarily due to the tax treatment of swaps, foreign currency reclassifications, the disallowance of a net operating loss, the utilization of a net operating loss to offset capital gains, and tax reclassifications of earnings from short sales resulted in a net decrease in distributions in excess of net investment income, a net decrease in accumulated net realized gain on investment and foreign currency transactions, and a net decrease in additional paid-in capital. These reclassifications had no effect on net assets.
| | |
| abfunds.com | | AB SELECT US LONG/SHORT PORTFOLIO | 45 |
NOTES TO FINANCIAL STATEMENTS (continued)
NOTE J
Other
In October 2016, the U.S. Securities and Exchange Commission adopted new rules and amended existing rules (together, “final rules”) intended to modernize the reporting and disclosure of information by registered investment companies. In part, the final rules amend Regulation S-X and require standardized, enhanced disclosure about derivatives in investment company financial statements, as well as other amendments. The compliance date for the amendments to Regulation S-X is August 1, 2017 (for reporting period end dates of August 31, 2017 or after). Management has evaluated the impact of the amendments and expects the effect of the adoption of the final rules on financial statements will be limited to additional disclosures.
NOTE K
Recent Accounting Pronouncements
In March 2017, the Financial Accounting Standards Board issued an Accounting Standards Update, ASU 2017-08, Receivables—Nonrefundable Fees and Other Costs (Subtopic 310-20), Premium Amortization on Purchased Callable Debt Securities (the “ASU”) which amends the amortization period for certain purchased callable debt securities held at a premium, shortening such period to the earliest call date. The ASU does not require any accounting change for debt securities held at a discount; the discount continues to be amortized to maturity. The ASU is effective for fiscal years, and interim periods within those fiscal years, beginning after December 15, 2018. At this time, management is evaluating the implications of these changes on the financial statements.
NOTE L
Subsequent Events
Management has evaluated subsequent events for possible recognition or disclosure in the financial statements through the date the financial statements are issued. Management has determined that there are no material events that would require disclosure in the Fund’s financial statements through this date.
| | |
| 46 | AB SELECT US LONG/SHORT PORTFOLIO | | abfunds.com |
FINANCIAL HIGHLIGHTS
Selected Data For A Share Of Capital Stock Outstanding Throughout Each Period
| | | | | | | | | | | | | | | | | | | | |
| | | Class A | |
| | | Year Ended June 30, | | | December 12,
2012(a) to
June 30, 2013 | |
| | | 2017 | | | 2016 | | | 2015 | | | 2014 | | |
| | | | |
| | | | | | | | | | | | | | | | | | | | |
Net asset value, beginning of period | | | $ 11.40 | | | | $ 11.77 | | | | $ 12.12 | | | | $ 10.92 | | | | $ 10.00 | |
| | | | |
Income From Investment Operations | | | | | | | | | | | | | | | | | | | | |
Net investment income (loss)(b) | | | (.09 | )(c) | | | (.11 | )(c) | | | (.16 | ) | | | (.10 | )(d) | | | (.04 | )(c)(d) |
Net realized and unrealized gain on investment and foreign currency transactions | | | .97 | | | | .12 | | | | .31 | | | | 1.47 | | | | .96 | |
| | | | |
Net increase in net asset value from operations | | | .88 | | | | .01 | | | | .15 | | | | 1.37 | | | | .92 | |
| | | | |
Less: Distributions | | | | | | | | | | | | | | | | | | | | |
Distributions from net realized gain on investment transactions | | | – 0 | – | | | (.38 | ) | | | (.50 | ) | | | (.17 | ) | | | – 0 | – |
| | | | |
Net asset value, end of period | | | $ 12.28 | | | | $ 11.40 | | | | $ 11.77 | | | | $ 12.12 | | | | $ 10.92 | |
| | | | |
Total Return | | | | | | | | | | | | | | | | | | | | |
Total investment return based on net asset value(e) | | | 7.72 | % | | | .02 | % | | | 1.31 | % | | | 12.55 | % | | | 9.20 | % |
Ratios/Supplemental Data | | | | | | | | | | | | | | | | | | | | |
Net assets, end of period
(000’s omitted) | | | $113,847 | | | | $166,015 | | | | $308,235 | | | | $480,571 | | | | $24,783 | |
Ratio to average net
assets of: | | | | | | | | | | | | | | | | | | | | |
Expenses, net of waivers/reimbursements(f)(g) | | | 2.11 | % | | | 2.29 | % | | | 2.27 | % | | | 2.31 | % | | | 2.34 | %^ |
Expenses, before waivers/reimbursements(f)(g) | | | 2.18 | % | | | 2.30 | % | | | 2.27 | % | | | 2.36 | % | | | 3.41 | %^ |
Net investment income (loss) | | | (.77 | )%(c) | | | (.98 | )%(c) | | | (1.34 | )% | | | (.88 | )%(d) | | | (.94 | )%(c)(d)^ |
Portfolio turnover rate (excluding securities sold short) | | | 295 | % | | | 329 | % | | | 535 | % | | | 581 | % | | | 282 | % |
Portfolio turnover rate (including securities sold short) | | | 528 | % | | | 519 | % | | | 718 | % | | | 673 | % | | | 321 | % |
See footnote summary on page 53.
| | |
| abfunds.com | | AB SELECT US LONG/SHORT PORTFOLIO | 47 |
FINANCIAL HIGHLIGHTS (continued)
Selected Data For A Share Of Capital Stock Outstanding Throughout Each Period
| | | | | | | | | | | | | | | | | | | | |
| | | Class C | |
| | | Year Ended June 30, | | | December 12
2012(a) to
June 30, 2013 | |
| | | 2017 | | | 2016 | | | 2015 | | | 2014 | | |
| | | | |
| | | | | | | | | | | | | | | | | | | | |
Net asset value, beginning of period | | | $ 11.09 | | | | $ 11.55 | | | | $ 11.99 | | | | $ 10.88 | | | | $ 10.00 | |
| | | | |
Income From
Investment Operations | | | | | | | | | | | | | | | | | | | | |
Net investment income (loss)(b) | | | (.18 | )(c) | | | (.19 | )(c) | | | (.25 | ) | | | (.19 | ) | | | (.05 | )(c) |
Net realized and unrealized gain on investment and foreign currency transactions | | | .95 | | | | .11 | | | | .31 | | | | 1.47 | | | | .93 | |
| | | | |
Net increase (decrease) in net asset value from operations | | | .77 | | | | (.08 | ) | | | .06 | | | | 1.28 | | | | .88 | |
| | | | |
Less: Distributions | | | | | | | | | | | | | | | | | | | | |
Distributions from net realized gain on investment transactions | | | – 0 | – | | | (.38 | ) | | | (.50 | ) | | | (.17 | ) | | | – 0 | – |
| | | | |
Net asset value, end of period | | | $ 11.86 | | | | $ 11.09 | | | | $ 11.55 | | | | $ 11.99 | | | | $ 10.88 | |
| | | | |
Total Return | | | | | | | | | | | | | | | | | | | | |
Total investment return based on net asset value(e) | | | 6.94 | % | | | (.78 | )% | | | .56 | % | | | 11.76 | % | | | 8.80 | % |
Ratios/Supplemental Data | | | | | | | | | | | | | | | | | | | | |
Net assets, end of period
(000’s omitted) | | | $111,027 | | | | $159,990 | | | | $232,110 | | | | $182,059 | | | | $3,836 | |
Ratio to average net
assets of: | | | | | | | | | | | | | | | | | | | | |
Expenses, net of waivers/reimbursements(f)(g) | | | 2.86 | % | | | 3.05 | % | | | 3.04 | % | | | 3.06 | % | | | 3.06 | %^ |
Expenses, before waivers/reimbursements(f)(g) | | | 2.94 | % | | | 3.06 | % | | | 3.04 | % | | | 3.06 | % | | | 3.53 | %^ |
Net investment income (loss) | | | (1.53 | )%(c) | | | (1.73 | )%(c) | | | (2.09 | )% | | | (1.64 | )% | | | (1.62 | )%(c)^ |
Portfolio turnover rate (excluding securities sold short) | | | 295 | % | | | 329 | % | | | 535 | % | | | 581 | % | | | 282 | % |
Portfolio turnover rate (including securities sold short) | | | 528 | % | | | 519 | % | | | 718 | % | | | 673 | % | | | 321 | % |
See footnote summary on page 53.
| | |
| 48 | AB SELECT US LONG/SHORT PORTFOLIO | | abfunds.com |
FINANCIAL HIGHLIGHTS (continued)
Selected Data For A Share Of Capital Stock Outstanding Throughout Each Period
| | | | | | | | | | | | | | | | | | | | |
| | | Advisor Class | |
| | | Year Ended June 30, | | | December 12,
2012(a) to
June 30,
2013 | |
| | | 2017 | | | 2016 | | | 2015 | | | 2014 | | |
| | | | |
| | | | | | | | | | | | | | | | | | | | |
Net asset value, beginning of period | | | $ 11.51 | | | | $ 11.86 | | | | $ 12.17 | | | | $ 10.94 | | | | $ 10.00 | |
| | | | |
Income From Investment Operations | | | | | | | | | | | | | | | | | | | | |
Net investment income (loss)(b) | | | (.06 | )(c) | | | (.08 | )(c) | | | (.13 | ) | | | (.07 | ) | | | (.02 | )(c) |
Net realized and unrealized gain on investment and foreign currency transactions | | | .98 | | | | .11 | | | | .32 | | | | 1.47 | | | | .96 | |
| | | | |
Net increase in net asset value from operations | | | .92 | | | | .03 | | | | .19 | | | | 1.40 | | | | .94 | |
| | | | |
Less: Distributions | |
Distributions from net realized gain on investment transactions | | | – 0 | – | | | (.38 | ) | | | (.50 | ) | | | (.17 | ) | | | – 0 | – |
| | | | |
Net asset value, end of period | | | $ 12.43 | | | | $ 11.51 | | | | $ 11.86 | | | | $ 12.17 | | | | $ 10.94 | |
| | | | |
Total Return | | | | | | | | | | | | | | | | | | | | |
Total investment return based on net asset value(e) | | | 7.99 | % | | | .27 | % | | | 1.56 | % | | | 12.80 | % | | | 9.40 | % |
Ratios/Supplemental Data | | | | | | | | | | | | | | | | | | | | |
Net assets, end of period
(000’s omitted) | | | $692,136 | | | | $816,563 | | | | $1,189,226 | | | | $810,892 | | | | $23,466 | |
Ratio to average net
assets of: | | | | | | | | | | | | | | | | | | | | |
Expenses, net of waivers/reimbursements(f)(g) | | | 1.86 | % | | | 2.05 | % | | | 2.04 | % | | | 2.06 | % | | | 2.05 | %^ |
Expenses, before waivers/reimbursements(f)(g) | | | 1.94 | % | | | 2.06 | % | | | 2.04 | % | | | 2.06 | % | | | 2.90 | %^ |
Net investment income (loss) | | | (.53 | )%(c) | | | (.73 | )%(c) | | | (1.09 | )% | | | (.63 | )% | | | (.60 | )%(c)^ |
Portfolio turnover rate (excluding securities sold short) | | | 295 | % | | | 329 | % | | | 535 | % | | | 581 | % | | | 282 | % |
Portfolio turnover rate (including securities sold short) | | | 528 | % | | | 519 | % | | | 718 | % | | | 673 | % | | | 321 | % |
See footnote summary on page 53.
| | |
| abfunds.com | | AB SELECT US LONG/SHORT PORTFOLIO | 49 |
FINANCIAL HIGHLIGHTS (continued)
Selected Data For A Share Of Capital Stock Outstanding Throughout Each Period
| | | | | | | | | | | | | | | | | | | | |
| | | Class R | |
| | | Year Ended June 30, | | | December 12,
2012(a) to June 30, 2013 | |
| | | 2017 | | | 2016 | | | 2015 | | | 2014 | | |
| | | | |
| | | | | | | | | | | | | | | | | | | | |
Net asset value, beginning of period | | | $ 11.30 | | | | $ 11.70 | | | | $ 12.07 | | | | $ 10.91 | | | | $ 10.00 | |
| | | | |
Income From Investment Operations | | | | | | | | | | | | | | | | | | | | |
Net investment income (loss)(b) | | | (.13 | )(c) | | | (.14 | )(c) | | | (.18 | ) | | | (.13 | ) | | | (.05 | )(c) |
Net realized and unrealized gain on investment and foreign currency transactions | | | .97 | | | | .12 | | | | .31 | | | | 1.46 | | | | .96 | |
| | | | |
Net increase (decrease) in net asset value from operations | | | .84 | | | | (.02 | ) | | | .13 | | | | 1.33 | | | | .91 | |
| | | | |
Less: Distributions | | | | | | | | | | | | | | | | | | | | |
Distributions from net realized gain on investment transactions | | | – 0 | – | | | (.38 | ) | | | (.50 | ) | | | (.17 | ) | | | – 0 | – |
| | | | |
Net asset value, end of period | | | $ 12.14 | | | | $ 11.30 | | | | $ 11.70 | | | | $ 12.07 | | | | $ 10.91 | |
| | | | |
Total Return | | | | | | | | | | | | | | | | | | | | |
Total investment return based on net asset value(e) | | | 7.43 | % | | | (.25 | )% | | | 1.15 | % | | | 12.19 | % | | | 9.10 | % |
Ratios/Supplemental Data | | | | | | | | | | | | | | | | | | | | |
Net assets, end of period
(000’s omitted) | | | $391 | | | | $698 | | | | $630 | | | | $121 | | | | $61 | |
Ratio to average net
assets of: | | | | | | | | | | | | | | | | | | | | |
Expenses, net of waivers/reimbursements(f)(g) | | | 2.44 | % | | | 2.54 | % | | | 2.57 | % | | | 2.56 | % | | | 2.52 | %^ |
Expenses, before waivers/reimbursements(f)(g) | | | 2.56 | % | | | 2.55 | % | | | 2.57 | % | | | 2.56 | % | | | 4.30 | %^ |
Net investment income (loss) | | | (1.09 | )%(c) | | | (1.20 | )%(c) | | | (1.55 | )% | | | (1.12 | )% | | | (1.06 | )%(c)^ |
Portfolio turnover rate (excluding securities sold short) | | | 295 | % | | | 329 | % | | | 535 | % | | | 581 | % | | | 282 | % |
Portfolio turnover rate (including securities sold short) | | | 528 | % | | | 519 | % | | | 718 | % | | | 673 | % | | | 321 | % |
See footnote summary on page 53.
| | |
| 50 | AB SELECT US LONG/SHORT PORTFOLIO | | abfunds.com |
FINANCIAL HIGHLIGHTS (continued)
Selected Data For A Share Of Capital Stock Outstanding Throughout Each Period
| | | | | | | | | | | | | | | | | | | | |
| | | Class K | |
| | | Year Ended June 30, | | | December 12,
2012(a) to
June 30,
2013
| |
| | | 2017 | | | 2016 | | | 2015 | | | 2014 | | |
| | | | |
| | | | | | | | | | | | | | | | | | | | |
Net asset value, beginning of period | | | $ 11.40 | | | | $ 11.78 | | | | $ 12.11 | | | | $ 10.92 | | | | $ 10.00 | |
| | | | |
Income From Investment Operations | | | | | | | | | | | | | | | | | | | | |
Net investment income (loss)(b) | | | (.10 | )(c) | | | (.11 | )(c) | | | (.16 | ) | | | (.12 | )(c) | | | (.06 | )(c) |
Net realized and unrealized gain on investment and foreign currency transactions | | | .98 | | | | .11 | | | | .33 | | | | 1.48 | | | | .98 | |
| | | | |
Net increase in net asset value from operations | | | .88 | | | | – 0 | – | | | .17 | | | | 1.36 | | | | .92 | |
| | | | |
Less: Distributions | |
Distributions from net realized gain on investment transactions | | | – 0 | – | | | (.38 | ) | | | (.50 | ) | | | (.17 | ) | | | – 0 | – |
| | | | |
Net asset value, end of period | | | $ 12.28 | | | | $ 11.40 | | | | $ 11.78 | | | | $ 12.11 | | | | $ 10.92 | |
| | | | |
Total Return | | | | | | | | | | | | | | | | | | | | |
Total investment return based on net asset value(e) | | | 7.72 | % | | | .01 | % | | | 1.40 | % | | | 12.46 | % | | | 9.20 | % |
Ratios/Supplemental Data | | | | | | | | | | | | | | | | | | | | |
Net assets, end of period
(000’s omitted) | | | $12 | | | | $31 | | | | $30 | | | | $12 | | | | $11 | |
Ratio to average net
assets of: | | | | | | | | | | | | | | | | | | | | |
Expenses, net of waivers/reimbursements(f)(g) | | | 2.14 | % | | | 2.27 | % | | | 2.31 | % | | | 2.31 | % | | | 2.28 | %^ |
Expenses, before waivers/reimbursements(f)(g) | | | 2.23 | % | | | 2.28 | % | | | 2.31 | % | | | 2.33 | % | | | 4.59 | %^ |
Net investment income (loss) | | | (.83 | )%(c) | | | (.94 | )%(c) | | | (1.33 | )% | | | (.99 | )%(c) | | | (.95 | )%(c)^ |
Portfolio turnover rate (excluding securities sold short) | | | 295 | % | | | 329 | % | | | 535 | % | | | 581 | % | | | 282 | % |
Portfolio turnover rate (including securities sold short) | | | 528 | % | | | 519 | % | | | 718 | % | | | 673 | % | | | 321 | % |
See footnote summary on page 53.
| | |
| abfunds.com | | AB SELECT US LONG/SHORT PORTFOLIO | 51 |
FINANCIAL HIGHLIGHTS (continued)
Selected Data For A Share Of Capital Stock Outstanding Throughout Each Period
| | | | | | | | | | | | | | | | | | | | |
| | | Class I | |
| | | Year Ended June 30, | | | December 12,
2012(a) to
June 30, 2013 | |
| | | 2017 | | | 2016 | | | 2015 | | | 2014 | | |
| | | | |
| | | | | | | | | | | | | | | | | | | | |
Net asset value, beginning of period | | | $ 11.52 | | | | $ 11.86 | | | | $ 12.16 | | | | $ 10.93 | | | | $ 10.00 | |
| | | | |
Income From Investment Operations | | | | | | | | | | | | | | | | | | | | |
Net investment income (loss)(b) | | | (.06 | )(c) | | | (.08 | )(c) | | | (.12 | ) | | | (.08 | )(c) | | | (.04 | )(c) |
Net realized and unrealized gain on investment and foreign currency transactions | | | .99 | | | | .12 | | | | .32 | | | | 1.48 | | | | .97 | |
| | | | |
Net increase in net asset value from operations | | | .93 | | | | .04 | | | | .20 | | | | 1.40 | | | | .93 | |
| | | | |
Less: Distributions | | | | | | | | | | | | | | | | | | | | |
Distributions from net realized gain on investment transactions | | | – 0 | – | | | (.38 | ) | | | (.50 | ) | | | (.17 | ) | | | – 0 | – |
| | | | |
Net asset value, end of period | | | $ 12.45 | | | | $ 11.52 | | | | $ 11.86 | | | | $ 12.16 | | | | $ 10.93 | |
| | | | |
Total Return | | | | | | | | | | | | | | | | | | | | |
Total investment return based on net asset value(e) | | | 8.07 | % | | | .27 | % | | | 1.73 | % | | | 12.81 | % | | | 9.30 | % |
Ratios/Supplemental Data | | | | | | | | | | | | | | | | | | | | |
Net assets, end of period
(000’s omitted) | | | $11,749 | | | | $12,724 | | | | $23,250 | | | | $34,519 | | | | $27,282 | |
Ratio to average net assets of: | | | | | | | | | | | | | | | | | | | | |
Expenses, net of waivers/reimbursements(f)(g) | | | 1.82 | % | | | 1.97 | % | | | 1.97 | % | | | 2.07 | % | | | 2.02 | %^ |
Expenses, before waivers/reimbursements(f)(g) | | | 1.90 | % | | | 1.98 | % | | | 1.97 | % | | | 2.09 | % | | | 4.32 | %^ |
Net investment income (loss) | | | (.49 | )%(c) | | | (.67 | )%(c) | | | (1.03 | )% | | | (.71 | )%(c) | | | (.70 | )%(c)^ |
Portfolio turnover rate (excluding securities sold short) | | | 295 | % | | | 329 | % | | | 535 | % | | | 581 | % | | | 282 | % |
Portfolio turnover rate (including securities sold short) | | | 528 | % | | | 519 | % | | | 718 | % | | | 673 | % | | | 321 | % |
See footnote summary on page 53.
| | |
| 52 | AB SELECT US LONG/SHORT PORTFOLIO | | abfunds.com |
FINANCIAL HIGHLIGHTS (continued)
Selected Data For A Share Of Capital Stock Outstanding Throughout Each Period
| (a) | Commencement of operations. |
| (b) | Based on average shares outstanding. |
| (c) | Net of fees and expenses waived/reimbursed by the Adviser. |
| (d) | Net of fees and expenses waived by the Distributor. |
| (e) | Total investment return is calculated assuming an initial investment made at the net asset value at the beginning of the period, reinvestment of all dividends and distributions at net asset value during the period, and redemption on the last day of the period. Initial sales charges or contingent deferred sales charges are not reflected in the calculation of total investment return. Total return does not reflect the deduction of taxes that a shareholder would pay on fund distributions or the redemption of fund shares. Total investment return calculated for a period of less than one year is not annualized. |
| (f) | The expense ratios presented below exclude non-operating expenses: |
| | | | | | | | | | | | | | | | | | | | |
| | | Year Ended June 30, | |
| | | 2017 | | | 2016 | | | 2015 | | | 2014 | | | 2013 | |
| | | | |
Class A | | | | | | | | | | | | | | | | | | | | |
Net of waivers/reimbursements | | | 1.94 | % | | | 2.09 | % | | | 2.09 | % | | | 2.17 | % | | | 2.25 | %^ |
Before waivers/reimbursements | | | 2.01 | % | | | 2.09 | % | | | 2.09 | % | | | 2.22 | % | | | 3.32 | %^ |
Class C | | | | | | | | | | | | | | | | | | | | |
Net of waivers/reimbursements | | | 2.69 | % | | | 2.84 | % | | | 2.85 | % | | | 2.92 | % | | | 2.95 | %^ |
Before waivers/reimbursements | | | 2.76 | % | | | 2.84 | % | | | 2.85 | % | | | 2.92 | % | | | 3.42 | %^ |
Advisor Class | | | | | | | | | | | | | | | | | | | | |
Net of waivers/reimbursements | | | 1.68 | % | | | 1.84 | % | | | 1.85 | % | | | 1.92 | % | | | 1.95 | %^ |
Before waivers/reimbursements | | | 1.76 | % | | | 1.84 | % | | | 1.85 | % | | | 1.92 | % | | | 2.80 | %^ |
Class R | | | | | | | | | | | | | | | | | | | | |
Net of waivers/reimbursements | | | 2.28 | % | | | 2.32 | % | | | 2.34 | % | | | 2.44 | % | | | 2.45 | %^ |
Before waivers/reimbursements | | | 2.40 | % | | | 2.32 | % | | | 2.34 | % | | | 2.44 | % | | | 4.23 | %^ |
Class K | | | | | | | | | | | | | | | | | | | | |
Net of waivers/reimbursements | | | 1.98 | % | | | 2.05 | % | | | 2.07 | % | | | 2.19 | % | | | 2.20 | %^ |
Before waivers/reimbursements | | | 2.08 | % | | | 2.05 | % | | | 2.07 | % | | | 2.22 | % | | | 4.52 | %^ |
Class I | | | | | | | | | | | | | | | | | | | | |
Net of waivers/reimbursements | | | 1.64 | % | | | 1.77 | % | | | 1.78 | % | | | 1.95 | % | | | 1.95 | %^ |
Before waivers/reimbursements | | | 1.72 | % | | | 1.77 | % | | | 1.78 | % | | | 1.97 | % | | | 4.24 | %^ |
| (g) | In connection with the Fund’s investments in affiliated underlying portfolios, the Fund incurs no direct expenses, but bears proportionate shares of the acquired fund fees and expenses (i.e., operating, administrative and investment advisory fees) of the affiliated underlying portfolios. The Adviser has voluntarily agreed to waive its fees from the Fund in an amount equal to the Fund’s pro rata share of certain acquired fund fees and expenses, and for the year ended June 30, 2017, such waiver amounted to 0.07% annualized for the Fund. |
See notes to financial statements.
| | |
| abfunds.com | | AB SELECT US LONG/SHORT PORTFOLIO | 53 |
REPORT OF INDEPENDENT REGISTERED
PUBLIC ACCOUNTING FIRM
To the Board of Directors and Shareholders of AB Select US Long/Short Portfolio
We have audited the accompanying statement of assets and liabilities, including the portfolio of investments, of AB Select US Long/Short Portfolio (the “Fund”), one of the funds constituting the AB Cap Fund, Inc., as of June 30, 2017, and the related statement of operations for the year then ended, the statements of changes in net assets for each of the two years in the period then ended, and the financial highlights for each of the four years in the period then ended and the period December 12, 2012 (commencement of operations) to June 30, 2013. These financial statements and financial highlights are the responsibility of the Fund’s management. Our responsibility is to express an opinion on these financial statements and financial highlights based on our audits.
We conducted our audits in accordance with the standards of the Public Company Accounting Oversight Board (United States). Those standards require that we plan and perform the audit to obtain reasonable assurance about whether the financial statements and financial highlights are free of material misstatement. We were not engaged to perform an audit of the Fund’s internal control over financial reporting. Our audits included consideration of internal control over financial reporting as a basis for designing audit procedures that are appropriate in the circumstances, but not for the purpose of expressing an opinion on the effectiveness of the Fund’s internal control over financial reporting. Accordingly, we express no such opinion. An audit also includes examining, on a test basis, evidence supporting the amounts and disclosures in the financial statements and financial highlights, assessing the accounting principles used and significant estimates made by management, and evaluating the overall financial statement presentation. Our procedures included confirmation of securities owned as of June 30, 2017 by correspondence with the custodian and others or by other appropriate auditing procedures where replies from others were not received. We believe that our audits provide a reasonable basis for our opinion.
In our opinion, the financial statements and financial highlights referred to above present fairly, in all material respects, the financial position of AB Select US Long/Short Portfolio, one of the funds constituting the AB Cap Fund, Inc., at June 30, 2017, and the results of its operations for the year then ended, the changes in its net assets for each of the two years in the period then ended, and the financial highlights for each of the four years in the period then ended and the period December 12, 2012 (commencement of operations) to June 30, 2013, in conformity with U.S. generally accepted accounting principles.

New York, New York
August 25, 2017
| | |
| 54 | AB SELECT US LONG/SHORT PORTFOLIO | | abfunds.com |
BOARD OF DIRECTORS
Marshall C. Turner, Jr.(1), Chairman
John H. Dobkin(1)
Michael J. Downey(1)
William H. Foulk, Jr.(1)
D. James Guzy(1)
Nancy P. Jacklin(1)
Robert M. Keith, President and Chief Executive Officer
Carol C. McMullen(1)
Garry L. Moody(1)
Earl D. Weiner(1)
OFFICERS
Philip L. Kirstein, Senior Vice President and Independent Compliance Officer
Kurt A. Feuerman(2), Vice President
Anthony Nappo(2), Vice President
Emilie D. Wrapp, Secretary
Joseph J. Mantineo, Treasurer and Chief Financial Officer
Phyllis J. Clarke, Controller
Vincent S. Noto, Chief Compliance Officer
| | |
Custodian and Accounting Agent State Street Bank and Trust Company State Street Corporation CCB/5
1 Iron Street Boston, MA 02210 Principal Underwriter AllianceBernstein Investments, Inc
1345 Avenue of the Americas
New York, NY 10105 Legal Counsel Seward & Kissel LLP
One Battery Park Plaza
New York, NY 10004 | | Independent Registered Public Accounting Firm Ernst & Young LLP
5 Times Square
New York, NY 10036 Transfer Agent AllianceBernstein Investor Services,
Inc.
P.O. Box 786003
San Antonio, TX 78278-6003
Toll-Free 1-(800) 221-5672 |
| 1 | Member of the Audit Committee, the Governance and Nominating Committee and the Independent Directors Committee. |
| 2 | The day-to-day management of, and investment decisions for, the Fund’s portfolio are made by Messrs. Kurt A. Feuerman and Anthony Nappo. |
| | |
| abfunds.com | | AB SELECT US LONG/SHORT PORTFOLIO | 55 |
MANAGEMENT OF THE FUND
Board of Directors Information
The business and affairs of the Fund are managed under the direction of the Board of Directors. Certain information concerning the Fund’s Directors is set forth below.
| | | | | | | | |
NAME, ADDRESS,* AGE AND (YEAR FIRST ELECTED**) | | PRINCIPAL OCCUPATION(S) DURING PAST FIVE YEARS AND OTHER INFORMATION*** | | PORTFOLIOS IN FUND COMPLEX OVERSEEN BY
DIRECTOR | | | OTHER PUBLIC COMPANY DIRECTORSHIPS CURRENTLY HELD
BY DIRECTOR |
| INTERESTED DIRECTOR | | | | | | |
Robert M. Keith, + 1345 Avenue of the Americas New York, NY 10105 57 (2012) | | Senior Vice President of the Adviser and the head of AllianceBernstein Investments, Inc. (“ABI”) since July 2008; Director of ABI and President of the AB Mutual Funds. Previously, he served as Executive Managing Director of ABI from December 2006 to June 2008. Prior to joining ABI in 2006, Executive Managing Director of Bernstein Global Wealth Management, and prior thereto, Senior Managing Director and Global Head of Client Service and Sales of the Adviser’s institutional investment management business since 2004. Prior thereto, he was Managing Director and Head of North American Client Service and Sales in the Adviser’s institutional investment management business, with which he had been associated since prior to 2004. | | | 97 | | | None |
| | | | | | | | |
| | |
| 56 | AB SELECT US LONG/SHORT PORTFOLIO | | abfunds.com |
MANAGEMENT OF THE FUND (continued)
| | | | | | | | |
NAME, ADDRESS,* AGE AND (YEAR FIRST ELECTED**) | | PRINCIPAL OCCUPATION(S) DURING PAST FIVE YEARS AND OTHER INFORMATION*** | | PORTFOLIOS IN FUND COMPLEX OVERSEEN BY
DIRECTOR | | | OTHER PUBLIC COMPANY DIRECTORSHIPS CURRENTLY HELD BY DIRECTOR |
| DISINTERESTED DIRECTORS | | | | | | |
Marshall C. Turner, Jr., # Chairman of the Board
75 (2012) | | Private Investor since prior to 2012. Former Chairman and CEO of Dupont Photomasks, Inc. (components of semi-conductor manufacturing). He has extensive operating leadership, and venture capital investing experience, including five interim or full-time CEO roles, and prior service as general partner of institutional venture capital partnerships. He also has extensive non-profit board leadership experience, and currently serves on the boards of two education and science-related non-profit organizations. He has served as a director of one AB fund since 1992, and director or trustee of multiple AB Funds since 2005. He has been Chairman of the AB Funds since January 2014, and the Chairman of the Independent Directors Committees of such AB Funds since February 2014. | | | 97 | | | Xilinx, Inc. (programmable logic semi-conductors) since 2007 |
| | | | | | | | |
John H. Dobkin, # 75 (2012) | | Independent Consultant since prior to 2012. Formerly, President of Save Venice, Inc. (preservation organization) from 2001–2002, Senior Advisor from June 1999-June 2000 and President of Historic Hudson Valley (historic preservation) from December 1989-May 1999. Previously, Director of the National Academy of Design. He has served as a director or trustee of various AB Funds since 1992, and as Chairman of the Audit Committees of a number of such AB Funds from 2001-2008. | | | 96 | | | None |
| | | | | | | | |
| | |
| abfunds.com | | AB SELECT US LONG/SHORT PORTFOLIO | 57 |
MANAGEMENT OF THE FUND (continued)
| | | | | | | | |
NAME, ADDRESS,* AGE AND (YEAR FIRST ELECTED**) | | PRINCIPAL OCCUPATION(S) DURING PAST FIVE YEARS AND OTHER INFORMATION*** | | PORTFOLIOS IN FUND COMPLEX OVERSEEN BY
DIRECTOR | | | OTHER PUBLIC COMPANY DIRECTORSHIPS CURRENTLY HELD BY DIRECTOR |
DISINTERESTED DIRECTORS (continued) | | | | | | |
Michael J. Downey, # 73 (2012) | | Private Investor since prior to 2012. Formerly, managing partner of Lexington Capital, LLC (investment advisory firm) from December 1997 until December 2003. He also served as a Director of Prospect Acquisition Corp. (financial services) from 2007 until 2009. From 1987 until 1993, Chairman and CEO of Prudential Mutual Fund Management, director of the Prudential mutual funds, and member of the Executive Committee of Prudential Securities Inc. He has served as a director or trustee of the AB Funds since 2005 and is a director and Chairman of one other registered investment company. | | | 97 | | | The Asia Pacific Fund, Inc. (registered investment company) since prior to 2012 |
| | | | | | | | |
William H. Foulk, Jr., # 84 (2012) | | Investment Adviser and an Independent Consultant since prior to 2012. Previously, he was Senior Manager of Barrett Associates, Inc., a registered investment adviser. He was formerly Deputy Comptroller and Chief Investment Officer of the State of New York and, prior thereto, Chief Investment Officer of the New York Bank for Savings. He has served as a director or trustee of various AB Funds since 1983, and was Chairman of the Independent Directors Committees of the AB Funds from 2003 until early February 2014. He served as Chairman of such Funds from 2003 through December 2013. He is also active in a number of mutual fund related organizations and committees. | | | 97 | | | None |
| | |
| 58 | AB SELECT US LONG/SHORT PORTFOLIO | | abfunds.com |
MANAGEMENT OF THE FUND (continued)
| | | | | | | | |
NAME, ADDRESS,* AGE AND (YEAR FIRST ELECTED**) | | PRINCIPAL OCCUPATION(S) DURING PAST FIVE YEARS AND OTHER INFORMATION*** | | PORTFOLIOS IN FUND COMPLEX OVERSEEN BY
DIRECTOR | | | OTHER
PUBLIC COMPANY DIRECTORSHIPS CURRENTLY HELD BY DIRECTOR |
DISINTERESTED DIRECTORS (continued) | | | | | | |
D. James Guzy, # 81 (2012) | | Chairman of the Board of SRC Computers, Inc. (semi-conductors), with which he has been associated since prior to 2012. He served as Chairman of the Board of PLX Technology (semi-conductors) since prior to 2012 until November 2013. He was a director of Intel Corporation (semi-conductors) from 1969 until 2008, and served as Chairman of the Finance Committee of such company for several years until May 2008. He has served as a director or trustee of one or more of the AB Funds since 1982. | | | 94 | | | None |
| | | | | | | | |
Nancy P. Jacklin, # 69 (2012) | | Private Investor since prior to 2012. Professorial Lecturer at the Johns Hopkins School of Advanced International Studies (2008-2015). U.S. Executive Director of the International Monetary Fund (which is responsible for ensuring the stability of the international monetary system), (December 2002-May 2006); Partner, Clifford Chance (1992-2002); Sector Counsel, International Banking and Finance, and Associate General Counsel, Citicorp (1985-1992); Assistant General Counsel (International), Federal Reserve Board of Governors (1982-1985); and Attorney Advisor, U.S. Department of the Treasury (1973-1982). Member of the Bar of the District of Columbia and of New York; and member of the Council on Foreign Relations. She has served as a director or trustee of the AB Funds since 2006 and has been Chairman at the Governance and Nominating Committees of the AB Funds since August 2014. | | | 97 | | | None |
| | |
| abfunds.com | | AB SELECT US LONG/SHORT PORTFOLIO | 59 |
MANAGEMENT OF THE FUND (continued)
| | | | | | | | |
NAME, ADDRESS,* AGE AND (YEAR FIRST ELECTED**) | | PRINCIPAL OCCUPATION(S) DURING PAST FIVE YEARS AND OTHER INFORMATION*** | | PORTFOLIOS IN FUND COMPLEX OVERSEEN BY
DIRECTOR | | | OTHER PUBLIC COMPANY DIRECTORSHIPS CURRENTLY HELD BY DIRECTOR |
DISINTERESTED DIRECTORS (continued) | | | | | | |
Carol C. McMullen, # 62 (2016) | | Managing Director of Slalom Consulting (consulting) since 2014, private investor and member of the Partners Healthcare Investment Committee. Formerly, Director of Norfolk & Dedham Group (mutual property and casualty insurance) from 2011 until November 2016; Director of Partners Community Physicians Organization (healthcare) from 2014 until December 2016; and Managing Director of The Crossland Group (consulting) from 2012 until 2013. She has held a number of senior positions in the asset and wealth management industries, including at Eastern Bank (where her roles included President of Eastern Wealth Management), Thomson Financial (Global Head of Sales for Investment Management), and Putnam Investments (where her roles included Head of Global Investment Research). She has served on a number of private company and nonprofit boards, and as a director or trustee of the AB Funds since June 2016. | | | 97 | | | None |
| | | | | | | | |
| | |
| 60 | AB SELECT US LONG/SHORT PORTFOLIO | | abfunds.com |
MANAGEMENT OF THE FUND (continued)
| | | | | | | | |
NAME, ADDRESS,* AGE AND (YEAR FIRST ELECTED**) | | PRINCIPAL OCCUPATION(S) DURING PAST FIVE YEARS AND OTHER INFORMATION*** | | PORTFOLIOS IN FUND COMPLEX OVERSEEN BY
DIRECTOR | | | OTHER PUBLIC COMPANY DIRECTORSHIPS CURRENTLY HELD BY DIRECTOR |
DISINTERESTED DIRECTORS (continued) | | | | | | |
Garry L. Moody, # 65 (2012) | | Independent Consultant. Formerly, Partner, Deloitte & Touche LLP (1995-2008) where he held a number of senior positions, including Vice Chairman, and U.S. and Global Investment Management Practice Managing Partner; President, Fidelity Accounting and Custody Services Company (1993-1995), where he was responsible for the accounting, pricing, custody and reporting for the Fidelity mutual funds; and Partner, Ernst & Young LLP (1975-1993), where he served as the National Director of Mutual Fund Tax Services and Managing Partner of its Chicago Office Tax department. He is a member of the Trustee Advisory Board of BoardIQ, a biweekly publication focused on issues and news affecting directors of mutual funds. He has served as a director or trustee and as Chairman of the Audit Committees of the AB Funds since 2008. | | | 97 | | | None |
| | | | | | | | |
Earl D. Weiner, # 78 (2012) | | Of Counsel, and Partner prior to January 2007, of the law firm Sullivan & Cromwell LLP and is a former member of ABA Federal Regulation of Securities Committee Task Force to draft editions of the Fund Director’s Guidebook. He also serves as a director or trustee of various non-profit organizations and has served as Chairman or Vice Chairman of a number of them. He has served as a director or trustee of the AB Funds since 2007 and served as Chairman of the Governance and Nominating Committees of the AB Funds from 2007 until August 2014. | | | 97 | | | None |
| | |
| abfunds.com | | AB SELECT US LONG/SHORT PORTFOLIO | 61 |
MANAGEMENT OF THE FUND (continued)
| * | The address for each of the Fund’s disinterested Directors is c/o AllianceBernstein L.P., Attention: Philip L. Kirstein, 1345 Avenue of the Americas, New York, NY 10105. |
| ** | There is no stated term of office for the Fund’s Directors. |
| *** | The information above includes each Director’s principal occupation during the last five years and other information relating to the experience, attributes, and skills relevant to each Director’s qualifications to serve as a Director, which led to the conclusion that each Director should serve as a Director for the Fund. |
| + | Mr. Keith is an “interested person”, as defined in the 1940 Act, of the Fund due to his position as a Senior Vice President of the Adviser. |
| # | Member of the Audit Committee, the Governance and Nominating Committee and the Independent Directors Committee. |
| | |
| 62 | AB SELECT US LONG/SHORT PORTFOLIO | | abfunds.com |
MANAGEMENT OF THE FUND (continued)
Officer Information
Certain information concerning the Fund’s Officers is listed below:
| | | | |
NAME, ADDRESS* AND AGE | | POSITION(S) HELD WITH FUND | | PRINCIPAL OCCUPATION DURING PAST FIVE YEARS |
Robert M. Keith, Jr.
57 | | President and Chief Executive Officer | | See biography above. |
| | | | |
Philip L. Kirstein
72 | | Senior Vice President and Independent Compliance Officer | | Senior Vice President and Independent Compliance Officer of the AB Funds, with which he has been associated since October 2004. Prior thereto, he was Of Counsel to Kirkpatrick & Lockhart, LLP from October 2003 to October 2004, and General Counsel of Merrill Lynch Investment Managers, L.P., since prior to March 2003. |
| | | | |
Kurt A. Feuerman
61 | | Vice President | | Senior Vice President of the Adviser**, with which he has been associated since prior to 2012. |
| | | | |
Anthony Nappo
45 | | Vice President | | Senior Vice President of the Adviser**, with which he has been associated since prior to 2012. |
| | | | |
Emilie D. Wrapp
61 | | Secretary | | Senior Vice President, Assistant General Counsel and Assistant Secretary of ABI**, with which she has been associated since prior to 2012. |
| | | | |
Joseph J. Mantineo
58 | | Treasurer and Chief Financial Officer | | Senior Vice President of AllianceBernstein Investor Services (“ABIS”)**, with which he has been associated since prior to 2012. |
| | | | |
Phyllis J. Clarke,
56 | | Controller | | Vice President of ABIS**, with which she has been associated since prior to 2012. |
| | | | |
Vincent S. Noto
52 | | Chief Compliance Officer | | Senior Vice President since 2015 and Mutual Fund Chief Compliance Officer of the Adviser** since 2014. Prior thereto, he was Vice President and Director of Mutual Fund Compliance of the Adviser** since 2012. |
| * | The address for each of the Fund’s Officers is 1345 Avenue of the Americas, New York, NY 10105. |
| ** | The Adviser, ABI and ABIS are affiliates of the Fund. |
| | The Fund’s Statement of Additional Information (“SAI”) has additional information about the Fund’s Directors and Officers and is available without charge upon request. Contact your financial representative or AB at 1-(800) 227-4618, or visit www.abfunds.com, for a free prospectus or SAI. |
| | |
| abfunds.com | | AB SELECT US LONG/SHORT PORTFOLIO | 63 |
Information Regarding the Review and Approval of the Fund’s Advisory Agreement
The disinterested directors (the “directors”) of AB Cap Fund, Inc. (the “Company”) unanimously approved the continuance of the Company’s Advisory Agreement with the Adviser in respect of AB Select US Long/Short Portfolio (the “Fund”) at a meeting held on May 2-4, 2017 (the “Meeting”).
Prior to approval of the continuance of the Advisory Agreement, the directors had requested from the Adviser, and received and evaluated, extensive materials. They reviewed the proposed continuance of the Advisory Agreement with the Adviser and with experienced counsel who are independent of the Adviser, who advised on the relevant legal standards. The directors also reviewed an independent evaluation prepared by the Company’s Senior Officer (who is also the Company’s Independent Compliance Officer), who acted as their independent fee consultant, of the reasonableness of the advisory fee, in which the Senior Officer concluded that the contractual fee for the Fund was reasonable. The directors also discussed the proposed continuance in private sessions with counsel and the Company’s Senior Officer.
The directors considered their knowledge of the nature and quality of the services provided by the Adviser to the Fund gained from their experience as directors or trustees of most of the registered investment companies advised by the Adviser, their overall confidence in the Adviser’s integrity and competence they have gained from that experience, the Adviser’s initiative in identifying and raising potential issues with the directors and its responsiveness, frankness and attention to concerns raised by the directors in the past, including the Adviser’s willingness to consider and implement organizational and operational changes designed to improve investment results and the services provided to the AB Funds. The directors noted that they have four regular meetings each year, at each of which they review extensive materials and information from the Adviser, including information on the investment performance of the Fund.
The directors also considered all factors they believed relevant, including the specific matters discussed below. During the course of their deliberations, the directors evaluated, among other things, the reasonableness of the advisory fee. The directors did not identify any particular information that was all-important or controlling, and different directors may have attributed different weights to the various factors. The directors determined that the selection of the Adviser to manage the Fund and the overall arrangements between the Fund and the Adviser, as provided in the Advisory Agreement, including the advisory fee, were fair and reasonable in light of the services performed, expenses incurred and such other matters as the directors considered relevant in the exercise of their business judgment. The material factors and conclusions that formed the basis for the directors’ determinations included the following:
| | |
| 64 | AB SELECT US LONG/SHORT PORTFOLIO | | abfunds.com |
Nature, Extent and Quality of Services Provided
The directors considered the scope and quality of services provided by the Adviser under the Advisory Agreement, including the quality of the investment research capabilities of the Adviser and the other resources it has dedicated to performing services for the Fund. They also noted the professional experience and qualifications of the Fund’s portfolio management team and other senior personnel of the Adviser. The directors also considered that the Advisory Agreement provides that the Fund will reimburse the Adviser for the cost to it of providing certain clerical, accounting, administrative and other services to the Fund by employees of the Adviser or its affiliates. Requests for these reimbursements are made on a quarterly basis and subject to approval by the directors. Reimbursements, to the extent requested and paid, result in a higher rate of total compensation from the Fund to the Adviser than the fee rate stated in the Advisory Agreement. The directors noted that the methodology used to determine the reimbursement amounts had been reviewed by an independent consultant retained by the Company’s Senior Officer. The quality of administrative and other services, including the Adviser’s role in coordinating the activities of the Fund’s other service providers, also was considered. The directors concluded that, overall, they were satisfied with the nature, extent and quality of services provided to the Fund under the Advisory Agreement.
Costs of Services Provided and Profitability
The directors reviewed a schedule of the revenues and expenses and related notes indicating the profitability of the Fund to the Adviser for calendar years 2015 and 2016 that had been prepared with an expense allocation methodology arrived at in consultation with an independent consultant retained by the Company’s Senior Officer. The directors noted the assumptions and methods of allocation used by the Adviser in preparing fund-specific profitability data and understood that there are a number of potentially acceptable allocation methodologies for information of this type. The directors noted that the profitability information reflected all revenues and expenses of the Adviser’s relationship with the Fund, including those relating to its subsidiaries that provide transfer agency, distribution and brokerage services to the Fund. The directors recognized that it is difficult to make comparisons of the profitability of the Advisory Agreement with the profitability of advisory contracts for unaffiliated funds because comparative information is not generally publicly available and is affected by numerous factors. The directors focused on the profitability of the Adviser’s relationship with the Fund before taxes and distribution expenses. The directors concluded that the Adviser’s level of profitability from its relationship with the Fund was not unreasonable. The directors noted that the reduction in the advisory fee rate effective since February 3, 2017 would likely impact the Adviser’s profitability analysis in future years.
Fall-Out Benefits
The directors considered the other benefits to the Adviser and its affiliates from their relationships with the Fund, including, but not limited to, benefits
| | |
| abfunds.com | | AB SELECT US LONG/SHORT PORTFOLIO | 65 |
relating to soft dollar arrangements (whereby investment advisers receive brokerage and research services from brokers that execute agency transactions for their clients); 12b-1 fees and sales charges received by the Fund’s principal underwriter (which is a wholly owned subsidiary of the Adviser) in respect of certain classes of the Fund’s shares; brokerage commissions paid by the Fund to brokers affiliated with the Adviser; and transfer agency fees paid by the Fund to a wholly owned subsidiary of the Adviser. The directors recognized that the Adviser’s profitability would be somewhat lower without these benefits. The directors understood that the Adviser also might derive reputational and other benefits from its association with the Fund.
Investment Results
In addition to the information reviewed by the directors in connection with the Meeting, the directors receive detailed performance information for the Fund at each regular Board meeting during the year.
At the Meeting, the directors reviewed information prepared by an analytical service that is not affiliated with the Adviser (the “15(c) service provider”), showing the performance of the Class A Shares of the Fund against a peer group and a peer universe, and information prepared by the Adviser showing performance of the Class A Shares against a broad-based securities market index, in each case for the 1- and 3-year periods ended February 28, 2017 and (in the case of comparisons with the broad-based securities market index) for the period from inception. Based on their review, the directors concluded that the Fund’s investment performance was acceptable.
Advisory Fees and Other Expenses
The directors considered the advisory fee rate paid by the Fund to the Adviser and information prepared by the 15(c) service provider concerning advisory fee rates paid by other funds in the same category as the Fund at a common asset level. The directors recognized that it is difficult to make comparisons of advisory fees because there are variations in the services that are included in the fees paid by other funds. The directors compared the Fund’s pro forma contractual effective advisory fee rate (reflecting a reduction in the advisory fee rate effective since February 3, 2017) with a peer group median and took into account the impact on the advisory fee rate of the administrative expense reimbursement paid to the Adviser in the latest fiscal year.
The directors also considered the Adviser’s fee schedule for institutional clients pursuing a similar investment style. For this purpose, they reviewed the relevant advisory fee information from the Adviser’s Form ADV and the evaluation from the Company’s Senior Officer and noted the differences between the Fund’s fee schedule, on the one hand, and the institutional fee schedule and the schedule of fees charged to any offshore funds and
| | |
| 66 | AB SELECT US LONG/SHORT PORTFOLIO | | abfunds.com |
any sub-advised funds, on the other. The directors noted that the Adviser may, in some cases, agree to fee rates with large institutional clients that are lower than those reviewed by the directors and that they had previously discussed with the Adviser its policies in respect of such arrangements.
The Adviser reviewed with the directors the significantly greater scope of the services it provides to the Fund relative to institutional, offshore fund and sub-advised fund clients. In light of the substantial differences in services rendered by the Adviser to institutional, offshore fund and sub-advised fund clients as compared to funds such as the Fund, the directors considered these fee comparisons inapt and did not place significant weight on them in their deliberations.
The directors noted that the Fund invests in shares of exchange-traded funds (“ETFs”), subject to the restrictions and limitations of the Investment Company Act of 1940 as these may be varied as a result of exemptive orders issued by the SEC. The directors also noted that ETFs pay advisory fees pursuant to their advisory contracts, and that the Adviser had provided, and they had reviewed, information about the expense ratios of the relevant ETFs. The directors concluded, based on the Adviser’s explanation of how it uses ETFs when they are the most cost-effective way to obtain desired exposures for a fund or to temporarily “equitize” cash inflows pending purchases of underlying securities, that the advisory fee for the Fund is paid for services that are in addition to, rather than duplicative of, the services provided under the advisory contracts of the ETFs.
The directors also considered the total expense ratio of the Class A shares of the Fund in comparison to a peer group and a peer universe selected by the 15(c) service provider. The Class A expense ratio of the Fund was based on the Fund’s latest fiscal year and the information included the pro forma expense ratio to reflect the reduction in the Fund’s expense ratio effective since February 3, 2017. The directors considered the effects of any fee waivers and/or expense reimbursements as a result of the Adviser’s expense cap, which had been set at a lower level since the advisory fee reduction that took effect on February 3, 2017. The directors noted that it was likely that the expense ratios of some of the other funds in the Fund’s category were lowered by waivers or reimbursements by those funds’ investment advisers, which in some cases might be voluntary or temporary. The directors view expense ratio information as relevant to their evaluation of the Adviser’s services because the Adviser is responsible for coordinating services provided to the Fund by others. The directors noted that the Fund’s pro forma expense ratio was above the peer group median. After reviewing and discussing the Adviser’s explanations of the reasons for this, the directors concluded that the Fund’s pro forma expense ratio was acceptable.
| | |
| abfunds.com | | AB SELECT US LONG/SHORT PORTFOLIO | 67 |
Economies of Scale
The directors noted that the advisory fee schedule for the Fund contains a breakpoint that reduces the fee rate on assets above a specified level. The directors took into consideration prior presentations by an independent consultant on economies of scale in the mutual fund industry and for the AB Funds, and by the Adviser concerning certain of its views on economies of scale. The directors also had requested and received from the Adviser certain updates on economies of scale in advance of the Meeting. The directors believe that economies of scale may be realized (if at all) by the Adviser across a variety of products and services, and not only in respect of a single fund. The directors noted that there is no established methodology for setting breakpoints that give effect to the fund-specific services provided by a fund’s adviser and to the economies of scale that an adviser may realize in its overall mutual fund business or those components of it which directly or indirectly affect a fund’s operations. The directors observed that in the mutual fund industry as a whole, as well as among funds similar to the Fund, there is no uniformity or pattern in the fees and asset levels at which breakpoints (if any) apply. The directors also noted that the advisory agreements for many funds do not have breakpoints at all. Having taken these factors into account, the directors concluded that the Fund’s shareholders would benefit from a sharing of economies of scale in the event the Fund’s net assets exceed the breakpoint in the future.
| | |
| 68 | AB SELECT US LONG/SHORT PORTFOLIO | | abfunds.com |
This page is not part of the Shareholder Report or the Financial Statements.
AB FAMILY OF FUNDS
US EQUITY
US CORE
Core Opportunities Fund
Select US Equity Portfolio
US GROWTH
Concentrated Growth Fund
Discovery Growth Fund
Growth Fund
Large Cap Growth Fund
Small Cap Growth Portfolio
US VALUE
Discovery Value Fund
Equity Income Fund
Relative Value Fund1
Small Cap Value Portfolio
Value Fund
INTERNATIONAL/ GLOBAL EQUITY
INTERNATIONAL/ GLOBAL CORE
Global Core Equity Portfolio
International Portfolio
International Strategic Core Portfolio
Sustainable Global Thematic Fund1
Tax-Managed International Portfolio
Tax-Managed Wealth Appreciation Strategy
Wealth Appreciation Strategy
INTERNATIONAL/ GLOBAL GROWTH
Concentrated International Growth Portfolio
International Growth Fund
INTERNATIONAL/ GLOBAL EQUITY (continued)
INTERNATIONAL/ GLOBAL VALUE
Asia ex-Japan Equity Portfolio
International Value Fund
FIXED INCOME
MUNICIPAL
High Income Municipal Portfolio
Intermediate California Municipal Portfolio
Intermediate Diversified Municipal Portfolio
Intermediate New York Municipal Portfolio
Municipal Bond Inflation Strategy
Tax-Aware Fixed Income Portfolio
National Portfolio
Arizona Portfolio
California Portfolio
Massachusetts Portfolio
Minnesota Portfolio
New Jersey Portfolio
New York Portfolio
Ohio Portfolio
Pennsylvania Portfolio
Virginia Portfolio
TAXABLE
Bond Inflation Strategy
Global Bond Fund
High Income Fund
High Yield Portfolio
Income Fund
Intermediate Bond Portfolio
Limited Duration High Income Portfolio
Short Duration Portfolio
ALTERNATIVES
All Market Real Return Portfolio
Credit Long/Short Portfolio
Global Real Estate Investment Fund
Select US Long/Short Portfolio
Unconstrained Bond Fund
MULTI-ASSET
All Market Income Portfolio
All Market Total Return Portfolio1
Conservative Wealth Strategy
Emerging Markets Multi-Asset Portfolio
Global Risk Allocation Fund
Tax-Managed All Market Income Portfolio1
TARGET-DATE
Multi-Manager Select Retirement Allocation Fund
Multi-Manager Select 2010 Fund
Multi-Manager Select 2015 Fund
Multi-Manager Select 2020 Fund
Multi-Manager Select 2025 Fund
Multi-Manager Select 2030 Fund
Multi-Manager Select 2035 Fund
Multi-Manager Select 2040 Fund
Multi-Manager Select 2045 Fund
Multi-Manager Select 2050 Fund
Multi-Manager Select 2055 Fund
CLOSED-END FUNDS
Alliance California Municipal Income Fund
AllianceBernstein Global High Income Fund
AllianceBernstein National Municipal Income Fund
We also offer Government Exchange Reserves, which serves as the money market fund exchange vehicle for the AB mutual funds. An investment in Government Exchange Reserves is not a deposit in a bank and is not insured or guaranteed by the Federal Deposit Insurance Corporation or any other government agency. Although the Fund seeks to preserve the value of your investment at $1.00 per share, it is possible to lose money by investing in the Fund.
Investors should consider the investment objectives, risks, charges and expenses of the Fund carefully before investing. For copies of our prospectus or summary prospectus, which contain this and other information, visit us online at www.abfunds.com or contact your AB representative. Please read the prospectus and/or summary prospectus carefully before investing.
| 1 | Prior to November 1, 2016, Sustainable Global Thematic Fund was named Global Thematic Growth Fund; prior to January 9, 2017, Relative Value Fund was named Growth & Income Fund; prior to April 17, 2017, Tax-Managed All Market Income Portfolio was named Tax-Managed Balanced Wealth Strategy; prior to April 24, 2017, All Market Total Return Portfolio was named Balanced Wealth Strategy. |
| | |
| abfunds.com | | AB SELECT US LONG/SHORT PORTFOLIO | 69 |
NOTES
| | |
| 70 | AB SELECT US LONG/SHORT PORTFOLIO | | abfunds.com |
NOTES
| | |
| abfunds.com | | AB SELECT US LONG/SHORT PORTFOLIO | 71 |
NOTES
| | |
| 72 | AB SELECT US LONG/SHORT PORTFOLIO | | abfunds.com |
NOTES
| | |
| abfunds.com | | AB SELECT US LONG/SHORT PORTFOLIO | 73 |
NOTES
| | |
| 74 | AB SELECT US LONG/SHORT PORTFOLIO | | abfunds.com |
NOTES
| | |
| abfunds.com | | AB SELECT US LONG/SHORT PORTFOLIO | 75 |
NOTES
| | |
| 76 | AB SELECT US LONG/SHORT PORTFOLIO | | abfunds.com |

AB SELECT US LONG/SHORT PORTFOLIO
1345 Avenue of the Americas
New York, NY 10105
800 221 5672
SULS-0151-0617 
ITEM 2. CODE OF ETHICS.
(a) The registrant has adopted a code of ethics that applies to its principal executive officer, principal financial officer and principal accounting officer. A copy of the registrant’s code of ethics is filed herewith as Exhibit 12(a)(1).
(b) During the period covered by this report, no material amendments were made to the provisions of the code of ethics adopted in 2(a) above.
(c) During the period covered by this report, no implicit or explicit waivers to the provisions of the code of ethics adopted in 2(a) above were granted.
ITEM 3. AUDIT COMMITTEE FINANCIAL EXPERT.
The registrant’s Board of Directors has determined that independent directors William H. Foulk, Jr., Garry L. Moody and Marshall C. Turner, Jr. qualify as audit committee financial experts.
ITEM 4. PRINCIPAL ACCOUNTANT FEES AND SERVICES.
(a) - (c) The following table sets forth the aggregate fees billed by the independent registered public accounting firm Ernst & Young LLP, for the Fund’s last two fiscal years for professional services rendered for: (i) the audit of the Fund’s annual financial statements included in the Fund’s annual report to stockholders; (ii) assurance and related services that are reasonably related to the performance of the audit of the Fund’s financial statements and are not reported under (i), which include advice and education related to accounting and auditing issues and quarterly press release review (for those Funds which issue press releases), and preferred stock maintenance testing (for those Funds that issue preferred stock); and (iii) tax compliance, tax advice and tax return preparation.
| | | | | | | | | | | | | | | | |
| | | | | | Audit-Related | |
| | | | | | Audit Fees | | | Fees | | | Tax Fees | |
AB Emerging Markets Growth | | | 2016 | | | $ | 41,926 | | | $ | — | | | $ | 21,888 | |
| | | 2017 | | | $ | 41,926 | | | $ | 3,000 | | | $ | 24,537 | |
AB Select US Equity | | | 2016 | | | $ | 31,889 | | | $ | 15 | | | $ | 20,816 | |
| | | 2017 | | | $ | 31,889 | | | $ | 20 | | | $ | 19,258 | |
AB Select US Long/Short | | | 2016 | | | $ | 36,098 | | | $ | 62 | | | $ | 16,618 | |
| | | 2017 | | | $ | 36,098 | | | $ | 66 | | | $ | 20,455 | |
AB Concentrated Growth | | | 2016 | | | $ | 21,212 | | | $ | 17 | | | $ | 18,481 | |
| | | 2017 | | | $ | 21,212 | | | $ | 26 | | | $ | 14,425 | |
AB Concentrated International Growth | | | 2016 | | | $ | 25,735 | | | $ | — | | | $ | 15,619 | |
| | | 2017 | | | $ | 25,735 | | | $ | 2,500 | | | $ | 12,758 | |
AB Global Core Equity | | | 2016 | | | $ | 41,926 | | | $ | 8 | | | $ | 19,459 | |
| | | 2017 | | | $ | 41,926 | | | $ | 19 | | | $ | 24,144 | |
AB Emerging Market Core | | | 2016 | | | $ | 31,444 | | | $ | — | | | $ | 6,339 | |
| | | 2017 | | | $ | 41,925 | | | $ | — | | | $ | 21,128 | |
AB International Strategic Core | | | 2016 | | | $ | 31,746 | | | $ | — | | | $ | 15,208 | |
| | | 2017 | | | $ | 42,328 | | | $ | — | | | $ | 11,491 | |
(d) Not applicable.
(e) (1) Beginning with audit and non-audit service contracts entered into on or after May 6, 2003, the Fund’s Audit Committee policies and procedures require the pre-approval of all audit and non-audit services provided to the Fund by the Fund’s independent registered public accounting firm. The Fund’s Audit Committee policies and procedures also require pre-approval of all audit and non-audit services provided to the Adviser and Service Affiliates to the extent that these services are directly related to the operations or financial reporting of the Fund.
(e) (2) All of the amounts for Audit Fees, Audit-Related Fees and Tax Fees in the table under Item 4 (a) – (c) are for services pre-approved by the Fund’s Audit Committee.
(f) Not applicable.
(g) The following table sets forth the aggregate non-audit services provided to the Fund, the Fund’s Adviser and entities that control, are controlled by or under common control with the Adviser that provide ongoing services to the Fund:
| | | | | | | | | | | | |
| | | | | | All Fees for
Non-Audit Services
Provided to the
Portfolio, the Adviser
and Service Affiliates | | | Total Amount of
Foregoing Column Pre-
approved by the Audit
Committee
(Portion Comprised of
Audit Related Fees)
(Portion Comprised of
Tax Fees) | |
AB Emerging Markets Growth | | | 2016 | | | $ | 492,018 | | | $ | 21,888 | |
| | | | | | | | | | $ | — | |
| | | | | | | | | | $ | (21,888 | ) |
| | | 2017 | | | $ | 556,442 | | | $ | 27,537 | |
| | | | | | | | | | $ | (3,000 | ) |
| | | | | | | | | | $ | (24,537 | ) |
AB Select US Equity | | | 2016 | | | $ | 490,946 | | | $ | 20,816 | |
| | | | | | | | | | $ | — | |
| | | | | | | | | | $ | (20,816 | ) |
| | | 2017 | | | $ | 548,183 | | | $ | 19,278 | |
| | | | | | | | | | $ | (20 | ) |
| | | | | | | | | | $ | (19,258 | ) |
AB Select US Long/Short | | | 2016 | | | $ | 486,748 | | | $ | 16,618 | |
| | | | | | | | | | $ | — | |
| | | | | | | | | | $ | (16,618 | ) |
| | | 2017 | | | $ | 549,360 | | | $ | 20,455 | |
| | | | | | | | | | $ | — | |
| | | | | | | | | | $ | (20,455 | ) |
AB Concentrated Growth | | | 2016 | | | $ | 488,611 | | | $ | 18,481 | |
| | | | | | | | | | $ | — | |
| | | | | | | | | | $ | (18,481 | ) |
| | | 2017 | | | $ | 543,356 | | | $ | 14,451 | |
| | | | | | | | | | $ | (26 | ) |
| | | | | | | | | | $ | (14,425 | ) |
AB Concentrated International Growth | | | 2016 | | | $ | 485,749 | | | $ | 15,619 | |
| | | | | | | | | | $ | — | |
| | | | | | | | | | $ | (15,619 | ) |
| | | 2017 | | | $ | 544,163 | | | $ | 15,258 | |
| | | | | | | | | | $ | (2,500 | ) |
| | | | | | | | | | $ | (12,758 | ) |
AB Global Core Equity | | | 2016 | | | $ | 489,589 | | | $ | 19,459 | |
| | | | | | | | | | $ | — | |
| | | | | | | | | | $ | (19,459 | ) |
| | | 2017 | | | $ | 553,049 | | | $ | 24,163 | |
| | | | | | | | | | $ | (19 | ) |
| | | | | | | | | | $ | (24,144 | ) |
AB Emerging Market Core | | | 2016 | | | $ | 476,469 | | | $ | 6,339 | |
| | | | | | | | | | $ | — | |
| | | | | | | | | | $ | (6,339 | ) |
| | | 2017 | | | $ | 550,033 | | | $ | 21,128 | |
| | | | | | | | | | $ | — | |
| | | | | | | | | | $ | (21,128 | ) |
AB International Strategic Core | | | 2016 | | | $ | 485,338 | | | $ | 15,208 | |
| | | | | | | | | | $ | — | |
| | | | | | | | | | $ | (15,208 | ) |
| | | 2017 | | | $ | 540,396 | | | $ | 11,491 | |
| | | | | | | | | | $ | — | |
| | | | | | | | | | $ | (11,491 | ) |
(h) The Audit Committee of the Fund has considered whether the provision of any non-audit services not pre-approved by the Audit Committee provided by the Fund’s independent registered public accounting firm to the Adviser and Service Affiliates is compatible with maintaining the auditor’s independence.
ITEM 5. AUDIT COMMITTEE OF LISTED REGISTRANTS.
Not applicable to the registrant.
ITEM 6. SCHEDULE OF INVESTMENTS.
Please see Schedule of Investments contained in the Report to Shareholders included under Item 1 of this Form N-CSR.
ITEM 7. DISCLOSURE OF PROXY VOTING POLICIES AND PROCEDURES FOR CLOSED-END MANAGEMENT INVESTMENT COMPANIES.
Not applicable to the registrant.
ITEM 8. PORTFOLIO MANAGERS OF CLOSED-END MANAGEMENT INVESTMENT COMPANIES.
Not applicable to the registrant.
ITEM 9. PURCHASES OF EQUITY SECURITIES BY CLOSED-END MANAGEMENT INVESTMENT COMPANY AND AFFILIATED PURCHASERS.
Not applicable to the registrant.
ITEM 10. SUBMISSION OF MATTERS TO A VOTE OF SECURITY HOLDERS.
There have been no material changes to the procedures by which shareholders may recommend nominees to the Fund’s Board of Directors since the Fund last provided disclosure in response to this item.
ITEM 11. CONTROLS AND PROCEDURES.
(a) The registrant’s principal executive officer and principal financial officer have concluded that the registrant’s disclosure controls and procedures (as defined in Rule 30a-2(c) under the Investment Company Act of 1940, as amended) are effective at the reasonable assurance level based on their evaluation of these controls and procedures as of a date within 90 days of the filing date of this document.
(b) There were no changes in the registrant’s internal controls over financial reporting that occurred during the second fiscal quarter of the period that has materially affected, or is reasonably likely to materially affect, the registrant’s internal control over financial reporting.
ITEM 12. EXHIBITS.
The following exhibits are attached to this Form N-CSR:
| | |
EXHIBIT NO. | | DESCRIPTION OF EXHIBIT |
| |
| 12 (a) (1) | | Code of Ethics that is subject to the disclosure of Item 2 hereof |
| |
| 12 (b) (1) | | Certification of Principal Executive Officer Pursuant to Section 302 of the Sarbanes-Oxley Act of 2002 |
| |
| 12 (b) (2) | | Certification of Principal Financial Officer Pursuant to Section 302 of the Sarbanes-Oxley Act of 2002 |
| |
| 12 (c) | | Certification of Principal Executive Officer and Principal Financial Officer Pursuant to Section 906 of the Sarbanes-Oxley Act of 2002 |
SIGNATURES
Pursuant to the requirements of the Securities Exchange Act of 1934 and the Investment Company Act of 1940, the registrant has duly caused this report to be signed on its behalf by the undersigned, thereunto duly authorized.
(Registrant): AB Cap Fund, Inc.
| | |
| By: | | /s/ Robert M. Keith |
| | Robert M. Keith |
| | President |
Date: August 29, 2017
Pursuant to the requirements of the Securities Exchange Act of 1934 and the Investment Company Act of 1940, this report has been signed below by the following persons on behalf of the registrant and in the capacities and on the dates indicated.
| | |
| By: | | /s/ Robert M. Keith |
| | Robert M. Keith |
| | President |
Date: August 29, 2017
| | |
| By: | | /s/ Joseph J. Mantineo |
| | Joseph J. Mantineo |
| | Treasurer and Chief Financial Officer |
Date: August 29, 2017