UNITED STATES
SECURITIES AND EXCHANGE COMMISSION
WASHINGTON, D.C. 20549
FORMN-CSR
CERTIFIED SHAREHOLDER REPORT OF REGISTERED
MANAGEMENT INVESTMENT COMPANIES
Investment Company Act file number:811-01716
AB CAP FUND, INC.
(Exact name of registrant as specified in charter)
1345 Avenue of the Americas, New York, New York 10105
(Address of principal executive offices) (Zip code)
Joseph J. Mantineo
AllianceBernstein L.P.
1345 Avenue of the Americas
New York, New York 10105
(Name and address of agent for service)
Registrant’s telephone number, including area code: (800)221-5672
Date of fiscal year end: November 30, 2019
Date of reporting period: November 30, 2019
| ITEM 1. | REPORTS TO STOCKHOLDERS. |
NOV 11.30.19

ANNUAL REPORT
AB ALL CHINA EQUITY PORTFOLIO

Beginning January 1, 2021, as permitted by new regulations adopted by the Securities and Exchange Commission, the Fund’s annual and semi-annual shareholder reports will no longer be sent by mail, unless you specifically request paper copies of the reports. Instead, the reports will be made available on a website, and you will be notified by mail each time a report is posted and provided with a website address to access the report.
If you already elected to receive shareholder reports electronically, you will not be affected by this change and you need not take any action. You may elect to receive shareholder reports and other communications from the Fund electronically at any time by contacting your financial intermediary (such as a broker-dealer or bank) or, if you are a direct investor, by calling the Fund at (800) 221 5672.
You may elect to receive all future reports in paper form free of charge. If you invest through a financial intermediary, you can contact your financial intermediary to request that you continue to receive paper copies of your shareholder reports; if you invest directly with the Fund, you can call the Fund at (800) 221 5672. Your election to receive reports in paper form will apply to all funds held in your account with your financial intermediary or, if you invest directly, to all AB Mutual Funds you hold.
| | |
| |
| Investment Products Offered | | • Are Not FDIC Insured• May Lose Value• Are Not Bank Guaranteed |
Investors should consider the investment objectives, risks, charges and expenses of the Fund carefully before investing. For copies of our prospectus or summary prospectus, which contain this and other information, visit us online at www.abfunds.com or contact your AB representative. Please read the prospectus and/or summary prospectus carefully before investing.
This shareholder report must be preceded or accompanied by the Fund’s prospectus for individuals who are not current shareholders of the Fund.
You may obtain a description of the Fund’s proxy voting policies and procedures, and information regarding how the Fund voted proxies relating to portfolio securities during the most recent12-month period ended June 30, without charge. Simply visit AB’s website at www.abfunds.com, or go to the Securities and Exchange Commission’s (the “Commission”) website at www.sec.gov, or call AB at (800) 227 4618.
The Fund files its complete schedule of portfolio holdings with the Commission for the first and third quarters of each fiscal year as an exhibit to its reports on Form N-PORT. The Fund’s Form N-PORT reports are available on the Commission’s website at www.sec.gov. The Fund’s Forms N-PORT may also be reviewed and copied at the Commission’s Public Reference Room in Washington, DC; information on the operation of the Public Reference Room may be obtained by calling (800) SEC 0330. AB publishes full portfolio holdings for the Fund monthly at www.abfunds.com.
AllianceBernstein Investments, Inc. (ABI) is the distributor of the AB family of mutual funds. ABI is a member of FINRA and is an affiliate of AllianceBernstein L.P., the Adviser of the funds.
The [A/B] logo is a registered service mark of AllianceBernstein and AllianceBernstein® is a registered service mark used by permission of the owner, AllianceBernstein L.P.
| | |
| FROM THE PRESIDENT | |  |
Dear Shareholder,
We are pleased to provide this report for AB All China Equity Portfolio (the “Fund”). Please review the discussion of Fund performance, the market conditions during the reporting period and the Fund’s investment strategy.
As always, AB strives to keep clients ahead of what’s next by:
| + | | Transforming uncommon insights into uncommon knowledge with a global research scope |
| + | | Navigating markets with seasoned investment experience and sophisticated solutions |
| + | | Providing thoughtful investment insights and actionable ideas |
Whether you’re an individual investor or a multi-billion-dollar institution, we put knowledge and experience to work for you.
AB’s global research organization connects and collaborates across platforms and teams to deliver impactful insights and innovative products. Better insights lead to better opportunities—anywhere in the world.
For additional information about AB’s range of products and shareholder resources, please log on to www.abfunds.com.
Thank you for your investment in the AB Mutual Funds.
Sincerely,

Robert M. Keith
President and Chief Executive Officer, AB Mutual Funds
| | |
| |
| abfunds.com | | AB ALL CHINA EQUITY PORTFOLIO | 1 |
ANNUAL REPORT
January 12, 2020
This report provides management’s discussion of fund performance for AB All China Equity Portfolio for the annual reporting period ended November 30, 2019.
The Fund’s investment objective is to seek long-term growth of capital.
NAV RETURNS AS OF NOVEMBER 30, 2019(unaudited)
| | | | | | | | |
| | |
| | | 6 Months | | | 12 Months | |
| | |
| AB ALL CHINA EQUITY PORTFOLIO | | | | | | | | |
| | |
| Class A Shares | | | 9.63% | | | | 19.71% | |
| | |
| Advisor Class Shares1 | | | 9.72% | | | | 19.93% | |
| | |
| MSCI China All Shares Index (net)2 | | | 7.44% | | | | 12.01% | |
| 1 | Please note that this share class is for investors purchasing shares through accounts established under certainfee-based programs sponsored and maintained by certain broker-dealers and financial intermediaries, institutional pension plans and/or investment advisory clients of, and certain other persons associated with, the Adviser and its affiliates or the Fund. |
| 2 | MSCI discontinued the calculation and publication of MSCI All China Equity Index as of November 27, 2019, necessitating a change in the Fund’s benchmark and leaving the MSCI China All Shares Index as the sole index providing broad exposure to the entire market for Chinese equities, including China share classes listed in Hong Kong, Shanghai, Shenzhen and outside of China. MSCI China All Shares Index captures large andmid-cap representation across ChinaA-shares,B-shares,H-shares,Red-chips,P-chips and foreign listings (e.g. American depositary receipts). |
Please keep in mind that high, double-digit returns are highly unusual and cannot be sustained. Investors should also be aware that these returns were primarily achieved during favorable market conditions.
INVESTMENT RESULTS
The table above shows the Fund’s performance compared to its benchmark, the Morgan Stanley Capital International (“MSCI”) China All Shares Index (net), for thesix- and12-month periods ended November 30, 2019.
All share classes of the Fund outperformed the MSCI China All Shares Index for both periods, before sales charges. The Fund was supported by its focus on idiosyncratic opportunities that are relatively unaffected by theUS-China trade tensions or economic cycles.
Consumer staples companies, such as those benefiting from the spending power of the growing middle class and meat producers that benefited from higher pork prices in the wake of the African swine flu outbreak, contributed, relative to the benchmark. Construction machinery makers, underpinned by resilient infrastructure spending, also contributed. On the other hand, energy companies struggled due to the weakness in oil and coal prices, and pharmaceuticals were battered by downward pressure on drug pricing.
| | |
| |
| 2 | AB ALL CHINA EQUITY PORTFOLIO | | abfunds.com |
During the 12-month period, stock selection in industrials, real estate and consumer staples contributed, relative to the benchmark, while stock selection in energy and information technology, as well as an underweight position in health care, detracted.
During thesix-month period, security selection within the industrials, financials and consumer discretionary sectors contributed to performance, while stock selection in consumer staples and utilities, as well as an underweight position in technology, detracted.
The Fund utilized futures for hedging purposes, which had no material impact on absolute performance for either period.
MARKET REVIEW AND INVESTMENT STRATEGY
US and international stocks recorded double-digit returns and emerging markets rallied during the12-month period ended November 30, 2019. After declining at the end of 2018, equity markets rebounded dramatically in January as strong corporate earnings and optimism about a trade truce between the US and China calmed investors. Trade war tensions resurfaced, however, and emerging geopolitical pressures increased market volatility. Late in the third quarter, equity market performance was accompanied by a sharp style rotation as quality-growth and lower-volatility stocks, which had performed strongly earlier in the year, lagged and value stocks outperformed. However, for the most part, growth stocks continued to outperform value stocks over the entire period. In November, investors gained confidence that aphase-one trade deal could be reached by the end of the year.
Chinese equities made solid gains in thesix- and12-month periods ended November 30, 2019, in spite of the heightenedUS-China trade tensions, as hopes grew that the two countries could reach a phase-one trade agreement.
Given the wide range of potential outcomes for theUS-China trade talks, the Fund’s Senior Investment Management Team focused on identifying idiosyncratic opportunities that are relatively unaffected by the trade issue or economic cycles.
INVESTMENT POLICIES
The Adviser seeks to achieve the Fund’s investment objective by investing, under normal circumstances, at least 80% of the Fund’s net assets in a portfolio of equity securities of companies economically tied to the People’s Republic of China (“China”) (including Hong Kong). A company will be considered to be economically tied to China if it: (i) is domiciled or organized in China; (ii) has securities that are traded
(continued on next page)
| | |
| |
| abfunds.com | | AB ALL CHINA EQUITY PORTFOLIO | 3 |
principally in China; or (iii) conducts a substantial part of its economic activities in China. Equity securities may include common stocks, preferred stocks, the equity securities of real estate investment trusts, depositary receipts and derivative instruments related to equity securities. The Adviser expects to invest Fund assets both in shares of companies that trade on the Shanghai Stock Exchange or the Shenzhen Stock Exchange (“China A shares”) and shares of companies economically tied to China that trade in Hong Kong or outside of China.
The Adviser believes that, over time, securities that are undervalued by the market relative to their long-term earnings power can provide high returns. The Adviser will utilize fundamental analysis and its quantitative models to attempt to identify these securities for investment by the Fund, attempting to balance factors relating to valuation, company quality and investor sentiment, and will seek to build a portfolio that delivers attractive risk-adjusted returns.
The Adviser may, but frequently will not, hedge the foreign currency exposure resulting from the Fund’s security positions through the use of currency-related derivatives. The Fund is“non-diversified”.
| | |
| |
| 4 | AB ALL CHINA EQUITY PORTFOLIO | | abfunds.com |
DISCLOSURES AND RISKS
Benchmark Disclosure
The MSCI China All Shares Index is unmanaged and does not reflect fees and expenses associated with the active management of a mutual fund portfolio. The MSCI China All Shares Index captures large- andmid-cap representation across ChinaA-shares,B-shares,H-shares,Red-chips,P-chips and foreign listings (e.g. American depositary receipts). The index aims to reflect the opportunity set of China share classes listed in Hong Kong, Shanghai, Shenzhen and outside of China. MSCI makes no express or implied warranties or representations, and shall have no liability whatsoever with respect to any MSCI data contained herein. The MSCI data may not be further redistributed or used as a basis for other indices, any securities or financial products. This report is not approved, reviewed or produced by MSCI. Net returns reflect the reinvestment of dividends after deduction ofnon-US withholding tax. An investor cannot invest directly in an index, and its results are not indicative for any specific investment, including the Fund.
A Word About Risk
Market Risk: The value of the Fund’s investments will fluctuate as the stock market fluctuates. The value of its investments may decline, sometimes rapidly and unpredictably, simply because of economic changes or other events that affect large portions of the market. It includes the risk that a particular style of investing, such as the Fund’s value approach, may underperform the market generally.
Foreign(Non-US) Risk: Investments in securities ofnon-US issuers may involve more risk than those of US issuers. These securities may fluctuate more widely in price and may be more difficult to trade or dispose of due to adverse market, economic, political, regulatory or other factors. Investments in emerging-market countries such as China may involve more risk than investments in developed countries because the markets in emerging-market countries are less developed and less liquid and are subject to increased economic, political, regulatory or other uncertainties. In addition, the value of the Fund’s investments may decline because of factors such as unfavorable or unsuccessful government actions and reduction in government or central bank support.
China/Single Country Risk: Investments in issuers located in a particular country or geographic region may have more risk because of particular market factors affecting that country or region, including political instability or unpredictable economic conditions. Risks of investments in securities of companies in China include the volatility of the Chinese stock market, heavy dependence on exports, which may be affected adversely by trade barriers or disputes or may decrease, sometimes significantly, when the world economy weakens, and the continuing importance of the role of the Chinese government, which may take actions that affect economic and
| | |
| |
| abfunds.com | | AB ALL CHINA EQUITY PORTFOLIO | 5 |
DISCLOSURES AND RISKS(continued)
market practices. While the Chinese economy has grown at a rapid rate in recent years, the rate of growth has been declining, and there can be no assurance that China’s economy will continue to grow in the future. Investments in China A shares are subject to quotas that may restrict daily trading and generally are less liquid than shares of companies in developed markets. Risks of investments in companies based in Hong Kong include heavy reliance on the US economy and regional economies, particularly the Chinese economy, which makes these investments vulnerable to changes in these economies.
Currency Risk: Fluctuations in currency exchange rates may negatively affect the value of the Fund’s investments in equity securities denominated in foreign currencies or reduce the Fund’s returns. Emerging-market currencies may be more volatile and less liquid, and subject to significantly greater risk of currency controls and convertibility restrictions, than currencies of developed countries.
Depositary Receipts Risk: Investing in depositary receipts involves risks that are similar to the risks of direct investments in foreign securities. For example, investing in depositary receipts may involve risks relating to political, economic or regulatory conditions in foreign countries. In addition, the issuers of the securities underlying certain depositary receipts are under no obligation to distribute shareholder communications or pass through any voting rights with respect to the deposited securities to the holders of such receipts.
Illiquid Investments Risk: Illiquid investments risk exists when certain investments are or become difficult to purchase or sell. Difficulty in selling such investments may result in sales at disadvantageous prices affecting the value of your investment in the Fund. Causes of illiquid investments risk may include low trading volumes and large positions. Foreign fixed-income securities may have more illiquid investments risk because secondary trading markets for these securities may be smaller and less well-developed and the securities may trade less frequently. Illiquid investments risk may be higher in a rising interest-rate environment, when the value and liquidity of fixed-income securities generally go down.
Non-Diversification Risk: The Fund may have more risk because it is“non-diversified”, meaning that it can invest more of its assets in a smaller number of issuers. Accordingly, changes in the value of a single security may have a more significant effect, either negative or positive, on the Fund’s net asset value (“NAV”).
Management Risk: The Fund is subject to management risk because it is an actively managed investment fund. The Adviser will apply its investment techniques and risk analyses in making investment decisions for the Fund, but there is no guarantee that its techniques will produce the intended results.
| | |
| |
| 6 | AB ALL CHINA EQUITY PORTFOLIO | | abfunds.com |
DISCLOSURES AND RISKS(continued)
These risks are fully discussed in the Fund’s prospectus. As with all investments, you may lose money by investing in the Fund.
An Important Note About Historical Performance
The investment return and principal value of an investment in the Fund will fluctuate, so that shares, when redeemed, may be worth more or less than their original cost. Performance shown in this report represents past performance and does not guarantee future results. Current performance may be lower or higher than the performance information shown. You may obtain performance information current to the most recentmonth-end by visiting www.abfunds.com. The Fund has been in operation only for a short period of time, and therefore has a very limited historical performance period. This limited performance period is unlikely to be representative of the performance the Fund will achieve over a longer period.
All fees and expenses related to the operation of the Fund have been deducted. NAV returns do not reflect sales charges; if sales charges were reflected, the Fund’s quoted performance would be lower. SEC returns reflect the applicable sales charges for each share class: a 4.25% maximumfront-end sales charge for Class A shares. Returns for the different share classes will vary due to different expenses associated with each class. Performance assumes reinvestment of distributions and does not account for taxes.
| | |
| |
| abfunds.com | | AB ALL CHINA EQUITY PORTFOLIO | 7 |
HISTORICAL PERFORMANCE
GROWTH OF A $10,000 INVESTMENT IN THE FUND(unaudited)
7/25/20181 TO 11/30/2019
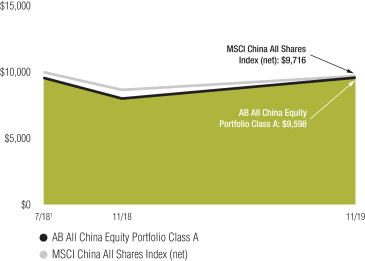
This chart illustrates the total value of an assumed $10,000 investment in AB All China Equity Portfolio Class A shares (from 7/25/20181 to 11/30/2019) as compared to the performance of the Fund’s benchmark. The chart reflects the deduction of the maximum 4.25% sales charge from the initial $10,000 investment in the Fund and assumes the reinvestment of dividends and capital gains distributions.
| 1 | Inception date: 7/25/2018. |
| | |
| |
| 8 | AB ALL CHINA EQUITY PORTFOLIO | | abfunds.com |
HISTORICAL PERFORMANCE(continued)
AVERAGE ANNUAL RETURNS AS OF NOVEMBER 30, 2019(unaudited)
| | | | | | | | |
| | |
| | | NAV Returns | | | SEC Returns
(reflects applicable
sales charges) | |
| | |
| CLASS A SHARES | | | | | | | | |
| | |
| 1 Year | | | 19.71% | | | | 14.64% | |
| | |
| Since Inception1 | | | 0.15% | | | | -2.99% | |
| | |
| ADVISOR CLASS SHARES2 | | | | | | | | |
| | |
| 1 Year | | | 19.93% | | | | 19.93% | |
| | |
| Since Inception1 | | | 0.37% | | | | 0.37% | |
The Fund’s current prospectus fee table shows the Fund’s total annual operating expense ratios as 4.23% and 4.55% for Class A and Advisor Class shares, respectively, gross of any fee waivers or expense reimbursements. Contractual fee waivers and/or expense reimbursements limit the Fund’s annual operating expense ratios exclusive of acquired fund fees and expenses other than the advisory fees of any AB mutual funds in which the Fund may invest, interest expense, taxes, extraordinary expenses, and brokerage commissions and other transaction costs to 1.50% and 1.25% for Class A and Advisor Class shares, respectively. These waivers/reimbursements may not be terminated before February 28, 2020 and may be extended by the Adviser for additionalone-year terms. Any fees waived and expenses borne by the Adviser may be reimbursed by the Fund until the end of the third fiscal year after the fiscal period in which the fee was waived or the expense was borne, provided that no reimbursement payment will be made that would cause the Fund’s covered operating expenses to exceed the applicable expense limitations. Absent reimbursements or waivers, performance would have been lower. The Financial Highlights section of this report sets forth expense ratio data for the current reporting period; the expense ratios shown above may differ from the expense ratios in the Financial Highlights section since they are based on different time periods.
| 1 | Inception date: 7/25/2018. |
| 2 | This share class is offered at NAV to eligible investors and the SEC returns are the same as the NAV returns. Please note that this share class is for investors purchasing shares through accounts established under certainfee-based programs sponsored and maintained by certain broker-dealers and financial intermediaries, institutional pension plans and/or investment advisory clients of, and certain other persons associated with, the Adviser and its affiliates or the Fund. |
| | |
| |
| abfunds.com | | AB ALL CHINA EQUITY PORTFOLIO | 9 |
HISTORICAL PERFORMANCE(continued)
SEC AVERAGE ANNUAL RETURNS
AS OF THE MOST RECENT CALENDARQUARTER-END
DECEMBER 31, 2019(unaudited)
| | | | |
| |
| | | SEC Returns
(reflects applicable
sales charges) | |
| |
| CLASS A SHARES | | | | |
| |
| 1 Year | | | 31.26% | |
| |
| Since Inception1 | | | 2.06% | |
| |
| ADVISOR CLASS SHARES2 | | | | |
| |
| 1 Year | | | 37.67% | |
| |
| Since Inception1 | | | 5.46% | |
| 1 | Inception date: 7/25/2018. |
| 2 | Please note that this share class is for investors purchasing shares through accounts established under certainfee-based programs sponsored and maintained by certain broker-dealers and financial intermediaries, institutional pension plans and/or investment advisory clients of, and certain other persons associated with, the Adviser and its affiliates or the Fund. |
| | |
| |
| 10 | AB ALL CHINA EQUITY PORTFOLIO | | abfunds.com |
EXPENSE EXAMPLE
(unaudited)
As a shareholder of the Fund, you incur two types of costs: (1) transaction costs, including sales charges (loads) on purchase payments, contingent deferred sales charges on redemptions and (2) ongoing costs, including management fees; distribution (12b-1) fees; and other Fund expenses. This example is intended to help you understand your ongoing costs (in dollars) of investing in the Fund and to compare these costs with the ongoing costs of investing in other mutual funds.
The Example is based on an investment of $1,000 invested at the beginning of the period and held for the entire period as indicated below.
Actual Expenses
The table below provides information about actual account values and actual expenses. You may use the information, together with the amount you invested, to estimate the expenses that you paid over the period. Simply divide your account value by $1,000 (for example, an $8,600 account value divided by $1,000 = 8.6), then multiply the result by the number under the heading entitled “Expenses Paid During Period” to estimate the expenses you paid on your account during this period.
Hypothetical Example for Comparison Purposes
The table below also provides information about hypothetical account values and hypothetical expenses based on the Fund’s actual expense ratio and an assumed annual rate of return of 5% before expenses, which is not the Fund’s actual return. The hypothetical account values and expenses may not be used to estimate the actual ending account balance or expenses you paid for the period. You may use this information to compare the ongoing costs of investing in the Fund and other funds by comparing this 5% hypothetical example with the 5% hypothetical examples that appear in the shareholder reports of other funds.
Please note that the expenses shown in the table are meant to highlight your ongoing costs only and do not reflect any transactional costs, such as sales charges (loads), or contingent deferred sales charges on redemptions. Therefore, the hypothetical example is useful in comparing ongoing costs only, and will not help you determine the relative total costs of owning different funds. In addition, if these transactional costs were included, your costs would have been higher.
| | |
| |
| abfunds.com | | AB ALL CHINA EQUITY PORTFOLIO | 11 |
EXPENSE EXAMPLE(continued)
| | | | | | | | | | | | | | | | |
| | | Beginning
Account Value
June 1, 2019 | | | Ending
Account Value
November 30, 2019 | | | Expenses Paid
During Period* | | | Annualized
Expense Ratio* | |
| Class A | | | | | | | | | | | | | | | | |
Actual | | $ | 1,000 | | | $ | 1,096.30 | | | $ | 7.88 | | | | 1.50 | % |
Hypothetical** | | $ | 1,000 | | | $ | 1,017.55 | | | $ | 7.59 | | | | 1.50 | % |
| Advisor Class | | | | | | | | | | | | | | | | |
Actual | | $ | 1,000 | | | $ | 1,097.20 | | | $ | 6.57 | | | | 1.25 | % |
Hypothetical** | | $ | 1,000 | | | $ | 1,018.80 | | | $ | 6.33 | | | | 1.25 | % |
| * | Expenses are equal to the classes’ annualized expense ratios multiplied by the average account value over the period, multiplied by 183/365 (to reflect the one-half year period). |
| ** | Assumes 5% annual return before expenses. |
| | |
| |
| 12 | AB ALL CHINA EQUITY PORTFOLIO | | abfunds.com |
PORTFOLIO SUMMARY
November 30, 2019(unaudited)
PORTFOLIO STATISTICS
Net Assets ($mil): $89.4
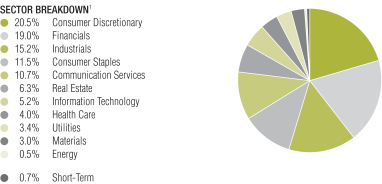
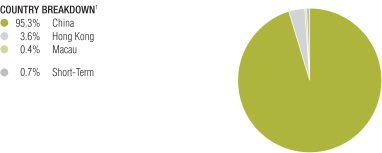
| 1 | All data are as of November 30, 2019. The Fund’s sector and country breakdowns are expressed as a percentage of total investments and may vary over time. |
Please note: The sector classifications presented herein are based on the Global Industry Classification Standard (GICS) which was developed by Morgan Stanley Capital International and Standard & Poor’s. The components are divided into sector, industry group, and industrysub-indices as classified by the GICS for each of the market capitalization indices in the broad market. These sector classifications are broadly defined. The “Portfolio of Investments” section of the report reflects more specific industry information and is consistent with the investment restrictions discussed in the Fund’s prospectus.
| | |
| |
| abfunds.com | | AB ALL CHINA EQUITY PORTFOLIO | 13 |
PORTFOLIO SUMMARY(continued)
November 30, 2019(unaudited)
TEN LARGEST HOLDINGS1
| | | | | | | | |
| | |
| Company | | U.S. $ Value | | | Percent of
Net Assets | |
| | |
| Alibaba Group Holding Ltd. (Sponsored ADR) | | $ | 9,559,000 | | | | 10.7 | % |
| | |
| Tencent Holdings Ltd. | | | 6,588,900 | | | | 7.4 | |
| | |
| Ping An Insurance Group Co. of China Ltd. – Class A | | | 6,063,049 | | | | 6.8 | |
| | |
| China Construction Bank Corp. – Class H | | | 3,830,463 | | | | 4.3 | |
| | |
| Luxshare Precision Industry Co., Ltd. – Class A | | | 3,152,734 | | | | 3.5 | |
| | |
| Sany Heavy Industry Co., Ltd. – Class A | | | 2,668,258 | | | | 3.0 | |
| | |
| Wuliangye Yibin Co., Ltd. – Class A | | | 2,545,383 | | | | 2.8 | |
| | |
| Li Ning Co., Ltd. | | | 1,959,972 | | | | 2.2 | |
| | |
| Zoomlion Heavy Industry Science and Technology Co., Ltd. – Class A | | | 1,950,279 | | | | 2.2 | |
| | |
| Weichai Power Co., Ltd. – Class A | | | 1,860,577 | | | | 2.1 | |
| | |
| | $ | 40,178,615 | | | | 45.0 | % |
| | |
| |
| 14 | AB ALL CHINA EQUITY PORTFOLIO | | abfunds.com |
PORTFOLIO OF INVESTMENTS
November 30, 2019
| | | | | | | | |
| Company | | Shares | | | U.S. $ Value | |
| |
COMMON STOCKS – 99.2% | | | | | | | | |
Consumer Discretionary – 20.5% | | | | | | | | |
Automobiles – 2.7% | | | | | | | | |
Geely Automobile Holdings Ltd. | | | 570,000 | | | $ | 1,065,983 | |
Guangzhou Automobile Group Co., Ltd. – Class H | | | 1,278,000 | | | | 1,364,650 | |
| | | | | | | | |
| | | | | | | 2,430,633 | |
| | | | | | | | |
Hotels, Restaurants & Leisure – 2.2% | | | | | | | | |
China International Travel Service Corp., Ltd. – Class A | | | 77,973 | | | | 930,292 | |
Galaxy Entertainment Group Ltd. | | | 53,000 | | | | 347,069 | |
Shenzhen Overseas Chinese Town Co., Ltd. – Class A | | | 687,006 | | | | 673,728 | |
| | | | | | | | |
| | | | | | | 1,951,089 | |
| | | | | | | | |
Household Durables – 0.8% | | | | | | | | |
Midea Group Co., Ltd. – Class A | | | 88,200 | | | | 681,511 | |
| | | | | | | | |
| | |
Internet & Direct Marketing Retail – 10.7% | | | | | | | | |
Alibaba Group Holding Ltd. (Sponsored ADR)(a) | | | 47,795 | | | | 9,559,000 | |
| | | | | | | | |
| | |
Textiles, Apparel & Luxury Goods – 4.1% | | | | | | | | |
Bosideng International Holdings Ltd. | | | 1,684,000 | | | | 804,496 | |
Li Ning Co., Ltd. | | | 611,000 | | | | 1,959,972 | |
Stella International Holdings Ltd. | | | 569,500 | | | | 938,491 | |
| | | | | | | | |
| | | | | | | 3,702,959 | |
| | | | | | | | |
| | | | | | | 18,325,192 | |
| | | | | | | | |
Financials – 18.9% | | | | | | | | |
Banks – 9.3% | | | | | | | | |
China Construction Bank Corp. – Class H | | | 4,815,000 | | | | 3,830,463 | |
Industrial Bank Co., Ltd. – Class A | | | 633,800 | | | | 1,702,856 | |
Ping An Bank Co., Ltd. – Class A | | | 693,173 | | | | 1,507,506 | |
Shanghai Pudong Development Bank Co., Ltd. | | | 769,900 | | | | 1,304,157 | |
| | | | | | | | |
| | | | | | | 8,344,982 | |
| | | | | | | | |
Capital Markets – 2.8% | | | | | | | | |
CITIC Securities Co., Ltd. – Class A | | | 532,710 | | | | 1,621,776 | |
Haitong Securities Co., Ltd. – Class H | | | 891,600 | | | | 889,587 | |
| | | | | | | | |
| | | | | | | 2,511,363 | |
| | | | | | | | |
Insurance – 6.8% | | | | | | | | |
Ping An Insurance Group Co. of China Ltd. – Class A | | | 509,593 | | | | 6,063,049 | |
| | | | | | | | |
| | | | | | | 16,919,394 | |
| | | | | | | | |
Industrials – 15.2% | | | | | | | | |
Commercial Services & Supplies – 1.0% | | | | | | | | |
A-Living Services Co., Ltd. – Class H(b) | | | 284,750 | | | | 918,684 | |
| | | | | | | | |
| | |
Electrical Equipment – 3.5% | | | | | | | | |
Luxshare Precision Industry Co., Ltd. – Class A | | | 651,330 | | | | 3,152,734 | |
| | | | | | | | |
| | |
| |
| abfunds.com | | AB ALL CHINA EQUITY PORTFOLIO | 15 |
PORTFOLIO OF INVESTMENTS(continued)
| | | | | | | | |
| Company | | Shares | | | U.S. $ Value | |
| |
Machinery – 7.3% | | | | | | | | |
Sany Heavy Industry Co., Ltd. – Class A | | | 1,295,321 | | | $ | 2,668,258 | |
Weichai Power Co., Ltd. – Class A | | | 991,596 | | | | 1,860,577 | |
Zoomlion Heavy Industry Science and Technology Co., Ltd. – Class A | | | 2,303,945 | | | | 1,950,279 | |
| | | | | | | | |
| | | | | | | 6,479,114 | |
| | | | | | | | |
Trading Companies & Distributors – 1.4% | | | | | | | | |
BOC Aviation Ltd.(b) | | | 134,900 | | | | 1,274,197 | |
| | | | | | | | |
| | |
Transportation Infrastructure – 2.0% | | | | | | | | |
Shenzhen Expressway Co., Ltd. – Class H | | | 1,300,000 | | | | 1,733,886 | |
| | | | | | | | |
| | | | | | | 13,558,615 | |
| | | | | | | | |
Consumer Staples – 11.5% | | | | | | | | |
Beverages – 6.7% | | | | | | | | |
Kweichow Moutai Co., Ltd. – Class A | | | 9,163 | | | | 1,471,471 | |
Luzhou Laojiao Co., Ltd. – Class A | | | 69,600 | | | | 809,314 | |
Tsingtao Brewery Co., Ltd. – Class A | | | 162,434 | | | | 1,171,486 | |
Wuliangye Yibin Co., Ltd. – Class A | | | 140,236 | | | | 2,545,383 | |
| | | | | | | | |
| | | | | | | 5,997,654 | |
| | | | | | | | |
Food Products – 4.8% | | | | | | | | |
COFCO Meat Holdings Ltd.(a)(c) | | | 1,063,000 | | | | 328,787 | |
Fujian Sunner Development Co., Ltd. – Class A | | | 264,762 | | | | 895,218 | |
Jiangxi Zhengbang Technology Co., Ltd. | | | 158,700 | | | | 330,002 | |
New Hope Liuhe Co., Ltd. – Class A | | | 244,460 | | | | 715,268 | |
Wens Foodstuffs Group Co., Ltd. – Class A | | | 155,300 | | | | 790,930 | |
WH Group Ltd.(b) | | | 1,200,500 | | | | 1,232,800 | |
| | | | | | | | |
| | | | | | | 4,293,005 | |
| | | | | | | | |
| | | | | | | 10,290,659 | |
| | | | | | | | |
Communication Services – 10.7% | | | | | | | | |
Entertainment – 2.1% | | | | | | | | |
G-bits Network Technology Xiamen Co., Ltd. – Class A | | | 12,100 | | | | 504,851 | |
NetEase, Inc. (ADR) | | | 4,300 | | | | 1,355,876 | |
| | | | | | | | |
| | | | | | | 1,860,727 | |
| | | | | | | | |
Interactive Media & Services – 7.4% | | | | | | | | |
Tencent Holdings Ltd. | | | 156,150 | | | | 6,588,900 | |
| | | | | | | | |
| | |
Media – 0.4% | | | | | | | | |
Bluefocus Intelligent Communications Group Co., Ltd. – Class A | | | 464,300 | | | | 344,741 | |
| | | | | | | | |
| | |
Wireless Telecommunication Services – 0.8% | | | | | | | | |
China Mobile Ltd. | | | 103,500 | | | | 780,357 | |
| | | | | | | | |
| | | | | | | 9,574,725 | |
| | | | | | | | |
| | |
| |
| 16 | AB ALL CHINA EQUITY PORTFOLIO | | abfunds.com |
PORTFOLIO OF INVESTMENTS(continued)
| | | | | | | | |
| Company | | Shares | | | U.S. $ Value | |
| |
Real Estate – 6.3% | | | | | | | | |
Real Estate Management & Development – 6.3% | | | | | | | | |
China Resources Land Ltd. | | | 246,000 | | | $ | 1,065,005 | |
CIFI Holdings Group Co., Ltd. | | | 2,185,083 | | | | 1,591,953 | |
Poly Developments and Holdings Group Co., Ltd. – Class A | | | 501,600 | | | | 1,030,263 | |
Times China Holdings Ltd. | | | 931,000 | | | | 1,752,647 | |
Times Neighborhood Holdings(a)(d) | | | 358,076 | | | | 221,212 | |
| | | | | | | | |
| | | | | | | 5,661,080 | |
| | | | | | | | |
Information Technology – 5.2% | | | | | | | | |
Electronic Equipment, Instruments & Components – 5.2% | | | | | | | | |
Accelink Technologies Co., Ltd. – Class A | | | 106,500 | | | | 422,510 | |
Lens Technology Co., Ltd. – Class A | | | 448,300 | | | | 818,064 | |
Shengyi Technology Co., Ltd. – Class A | | | 541,942 | | | | 1,766,145 | |
Shennan Circuits Co., Ltd. – Class A | | | 58,120 | | | | 1,207,578 | |
WUS Printed Circuit Kunshan Co., Ltd. – Class A | | | 122,800 | | | | 393,029 | |
| | | | | | | | |
| | | | | | | 4,607,326 | |
| | | | | | | | |
Health Care – 4.0% | | | | | | | | |
Health Care Providers & Services – 1.2% | | | | | | | | |
Shanghai Pharmaceuticals Holding Co., Ltd. – Class H | | | 611,800 | | | | 1,097,259 | |
| | | | | | | | |
| | |
Pharmaceuticals – 2.8% | | | | | | | | |
CSPC Pharmaceutical Group Ltd. | | | 298,000 | | | | 678,216 | |
Jiangsu Hengrui Medicine Co., Ltd. – Class A | | | 148,948 | | | | 1,820,125 | |
| | | | | | | | |
| | | | | | | 2,498,341 | |
| | | | | | | | |
| | | | | | | 3,595,600 | |
| | | | | | | | |
Utilities – 3.4% | | | | | | | | |
Gas Utilities – 1.5% | | | | | | | | |
China Resources Gas Group Ltd. | | | 124,000 | | | | 690,454 | |
ENN Energy Holdings Ltd. | | | 64,000 | | | | 695,590 | |
| | | | | | | | |
| | | | | | | 1,386,044 | |
| | | | | | | | |
Independent Power and Renewable Electricity Producers – 1.9% | | | | | | | | |
China Resources Power Holdings Co., Ltd. | | | 320,000 | | | | 416,127 | |
Huaneng Lancang River Hydropower, Inc. –Class A | | | 987,600 | | | | 587,406 | |
Huaneng Power International, Inc. – Class H | | | 1,364,000 | | | | 676,058 | |
| | | | | | | | |
| | | | | | | 1,679,591 | |
| | | | | | | | |
| | | | | | | 3,065,635 | |
| | | | | | | | |
Materials – 3.0% | | | | | | | | |
Construction Materials – 3.0% | | | | | | | | |
Anhui Conch Cement Co., Ltd. – Class A | | | 158,250 | | | | 1,031,771 | |
China Resources Cement Holdings Ltd. | | | 816,000 | | | | 977,654 | |
Tangshan Jidong Cement Co., Ltd. – Class A | | | 295,300 | | | | 624,514 | |
| | | | | | | | |
| | | | | | | 2,633,939 | |
| | | | | | | | |
| | |
| |
| abfunds.com | | AB ALL CHINA EQUITY PORTFOLIO | 17 |
PORTFOLIO OF INVESTMENTS(continued)
| | | | | | | | |
| Company | | Shares | | | U.S. $ Value | |
| |
Energy – 0.5% | | | | | | | | |
Energy Equipment & Services – 0.5% | | | | | | | | |
China Oilfield Services Ltd. – Class H | | | 326,000 | | | $ | 438,866 | |
| | | | | | | | |
| | |
Total Common Stocks
(cost $77,455,897) | | | | | | | 88,671,031 | |
| | | | | | | | |
| | | | | | | | |
RIGHTS – 0.0% | | | | | | | | |
Real Estate – 0.0% | | | | | | | | |
Real Estate Management & Development – 0.0% | | | | | | | | |
Times China Holdings Ltd., expiring 12/31/49(a)(d)
(cost $0) | | | 38,791 | | | | – 0 | – |
| | | | | | | | |
| | | | | | | | |
SHORT-TERM INVESTMENTS – 0.7% | | | | | | | | |
Investment Companies – 0.7% | | | | | | | | |
AB Fixed Income Shares, Inc. – Government Money Market Portfolio – Class AB, 1.58%(e)(f)(g)
(cost $647,227) | | | 647,227 | | | | 647,227 | |
| | | | | | | | |
Total Investments Before Security Lending Collateral for Securities Loaned – 99.9%
(cost $78,103,124) | | | | | | | 89,318,258 | |
| | | | | | | | |
INVESTMENTS OF CASH COLLATERAL FOR SECURITIES LOANED – 0.3% | | | | | | | | |
Investment Companies – 0.3% | | | | | | | | |
AB Fixed Income Shares, Inc. – Government Money Market Portfolio – Class AB, 1.58%(e)(f)(g)
(cost $253,440) | | | 253,440 | | | | 253,440 | |
| | | | | | | | |
| | |
Total Investments – 100.2%
(cost $78,356,564) | | | | | | | 89,571,698 | |
Other assets less liabilities – (0.2)% | | | | | | | (214,957 | ) |
| | | | | | | | |
| | |
Net Assets – 100.0% | | | | | | $ | 89,356,741 | |
| | | | | | | | |
| (a) | Non-income producing security. |
| (b) | Security is exempt from registration under Rule 144A of the Securities Act of 1933. These securities are considered restricted, but liquid and may be resold in transactions exempt from registration, normally to qualified institutional buyers. At November 30, 2019, the aggregate market value of these securities amounted to $3,425,681 or 3.8% of net assets. |
| (c) | Represents entire or partial securities out on loan. See Note E for securities lending information. |
| (d) | Security in which significant unobservable inputs (Level 3) were used in determining fair value. |
| (e) | To obtain a copy of the fund’s shareholder report, please go to the Securities and Exchange Commission’s website at www.sec.gov, or call AB at(800) 227-4618. |
| (f) | Affiliated investments. |
| (g) | The rate shown represents the 7-day yield as of period end. |
Glossary:
ADR – American Depositary Receipt
See notes to financial statements.
| | |
| |
| 18 | AB ALL CHINA EQUITY PORTFOLIO | | abfunds.com |
STATEMENT OF ASSETS & LIABILITIES
November 30, 2019
| | | | |
| Assets | | | | |
Investments in securities, at value | | | | |
Unaffiliated issuers (cost $77,455,897) | | $ | 88,671,031 | (a) |
Affiliated issuers (cost $900,667—including investment of cash collateral for securities loaned of $253,440) | | | 900,667 | |
Foreign currencies, at value (cost $25,952) | | | 25,889 | |
Receivable for capital stock sold | | | 240,130 | |
Unaffiliated dividends receivable | | | 1,412 | |
Affiliated dividends receivable | | | 1,266 | |
| | | | |
Total assets | | | 89,840,395 | |
| | | | |
| Liabilities | | | | |
Payable for collateral received on securities loaned | | | 253,440 | |
Advisory fee payable | | | 98,394 | |
Audit and tax fee payable | | | 39,170 | |
Custody fee payable | | | 26,758 | |
Directors’ fee payable | | | 5,808 | |
Transfer Agent fee payable | | | 3,000 | |
Payable for capital stock redeemed | | | 2,455 | |
Distribution fee payable | | | 386 | |
Due to Custodian | | | 32 | |
Accrued expenses and other liabilities | | | 54,211 | |
| | | | |
Total liabilities | | | 483,654 | |
| | | | |
Net Assets | | $ | 89,356,741 | |
| | | | |
| Composition of Net Assets | | | | |
Capital stock, at par | | $ | 889 | |
Additionalpaid-in capital | | | 80,150,441 | |
Distributable earnings | | | 9,205,411 | |
| | | | |
| | $ | 89,356,741 | |
| | | | |
Net Asset Value Per Share—11 billion shares of capital stock authorized, $.0001 par value
| | | | | | | | | | | | |
| Class | | Net Assets | | | Shares
Outstanding | | | Net Asset
Value | |
| |
| A | | $ | 1,858,628 | | | | 185,449 | | | $ | 10.02 | * |
| |
| Advisor | | $ | 87,498,113 | | | | 8,702,315 | | | $ | 10.05 | |
| |
| (a) | Includes securities on loan with a value of $237,543 (See Note E). |
| * | The maximum offering price per share for Class A shares was $10.46 which reflects a sales charge of 4.25%. |
See notes to financial statements.
| | |
| |
| abfunds.com | | AB ALL CHINA EQUITY PORTFOLIO | 19 |
STATEMENT OF OPERATIONS
Year Ended November 30, 2019
| | | | | | | | |
| Investment Income | | | | | | | | |
Dividends | | | | | | | | |
Unaffiliated issuers (net of foreign taxes withheld of $136,219) | | $ | 1,715,103 | | | | | |
Affiliated issuers | | | 37,134 | | | | | |
Securities lending income | | | 6,388 | | | | | |
Interest | | | 219 | | | $ | 1,758,844 | |
| | | | | | | | |
| Expenses | | | | | | | | |
Advisory fee (see Note B) | | | 660,927 | | | | | |
Transfer agency—Class A | | | 485 | | | | | |
Transfer agency—Advisor Class | | | 20,050 | | | | | |
Distribution fee—Class A | | | 4,092 | | | | | |
Custodian | | | 96,702 | | | | | |
Administrative | | | 84,267 | | | | | |
Amortization of offering expenses | | | 82,710 | | | | | |
Audit and tax | | | 54,967 | | | | | |
Registration fees | | | 41,847 | | | | | |
Legal | | | 31,534 | | | | | |
Directors’ fees | | | 22,861 | | | | | |
Printing | | | 15,073 | | | | | |
Miscellaneous | | | 48,050 | | | | | |
| | | | | | | | |
Total expenses | | | 1,163,565 | | | | | |
Less: expenses waived and reimbursed by the Adviser (see Note B and Note E) | | | (291,037 | ) | | | | |
| | | | | | | | |
Net expenses | | | | | | | 872,528 | |
| | | | | | | | |
Net investment income | | | | | | | 886,316 | |
| | | | | | | | |
| Realized and Unrealized Gain (Loss) on Investment and Foreign Currency Transactions | | | | | | | | |
Net realized gain (loss) on: | | | | | | | | |
Investment transactions | | | | | | | (1,688,527 | ) |
Futures | | | | | | | (198,436 | ) |
Foreign currency transactions | | | | | | | 19,138 | |
Net change in unrealized appreciation/depreciation on: | | | | | | | | |
Investments | | | | | | | 12,066,681 | |
Foreign currency denominated assets and liabilities | | | | | | | 698 | |
| | | | | | | | |
Net gain on investment and foreign currency transactions | | | | | | | 10,199,554 | |
| | | | | | | | |
Net Increase in Net Assets from Operations | | | | | | $ | 11,085,870 | |
| | | | | | | | |
See notes to financial statements.
| | |
| |
| 20 | AB ALL CHINA EQUITY PORTFOLIO | | abfunds.com |
STATEMENT OF CHANGES IN NET ASSETS
| | | | | | | | |
| | | Year Ended
November 30,
2019 | | | July 25, 2018(a)
to
November 30, 2018 | |
| Increase (Decrease) in Net Assets from Operations | | | | | | | | |
Net investment income (loss) | | $ | 886,316 | | | $ | (22,503 | ) |
Net realized loss on investment and foreign currency transactions | | | (1,867,825 | ) | | | (1,060,108 | ) |
Net change in unrealized appreciation/depreciation on investments and foreign currency denominated assets and liabilities | | | 12,067,379 | | | | (852,308 | ) |
| | | | | | | | |
Net increase (decrease) in net assets from operations | | | 11,085,870 | | | | (1,934,919 | ) |
| Capital Stock Transactions | | | | | | | | |
Net increase | | | 41,440,861 | | | | 38,764,929 | |
| | | | | | | | |
Total increase | | | 52,526,731 | | | | 36,830,010 | |
| Net Assets | | | | | | | | |
Beginning of period | | | 36,830,010 | | | | – 0 | – |
| | | | | | | | |
End of period | | $ | 89,356,741 | | | $ | 36,830,010 | |
| | | | | | | | |
| (a) | Commencement of operations. |
See notes to financial statements.
| | |
| |
| abfunds.com | | AB ALL CHINA EQUITY PORTFOLIO | 21 |
NOTES TO FINANCIAL STATEMENTS
November 30, 2019
NOTE A
Significant Accounting Policies
AB Cap Fund, Inc. (the “Company”), which is a Maryland corporation, is registered under the Investment Company Act of 1940 as anopen-end management investment company. The Company operates as a series company comprised of 28 portfolios currently in operation. Each portfolio is considered to be a separate entity for financial reporting and tax purposes. This report relates only to the AB All China Equity Portfolio (the “Fund”), anon-diversified portfolio. The Fund commenced operations on July 25, 2018. The Fund has authorized the issuance of Class A, Class B, Class C, Advisor Class, Class R, Class K, Class I, Class Z, Class T, Class 1 and Class 2 shares. Class B, Class C, Class R, Class K, Class I, Class Z, Class T, Class 1 and Class 2 shares are not currently being offered. Class A shares are sold with afront-end sales charge of up to 4.25% for purchases not exceeding $1,000,000. With respect to purchases of $1,000,000 or more, Class A shares redeemed within one year of purchase may be subject to a contingent deferred sales charge of 1%. Advisor Class shares are sold without an initial or contingent deferred sales charge and are not subject to ongoing distribution expenses. All eleven classes of shares have identical voting, dividend, liquidation and other rights, except that the classes bear different distribution and transfer agency expenses. Each class has exclusive voting rights with respect to its distribution plan. The financial statements have been prepared in conformity with U.S. generally accepted accounting principles (“U.S. GAAP”), which require management to make certain estimates and assumptions that affect the reported amounts of assets and liabilities in the financial statements and amounts of income and expenses during the reporting period. Actual results could differ from those estimates. The Fund is an investment company under U.S. GAAP and follows the accounting and reporting guidance applicable to investment companies. The following is a summary of significant accounting policies followed by the Fund.
1. Security Valuation
Portfolio securities are valued at their current market value determined on the basis of market quotations or, if market quotations are not readily available or are deemed unreliable, at “fair value” as determined in accordance with procedures established by and under the general supervision of the Company’s Board of Directors (the “Board”).
In general, the market values of securities which are readily available and deemed reliable are determined as follows: securities listed on a national securities exchange (other than securities listed on the NASDAQ Stock Market, Inc. (“NASDAQ”)) or on a foreign securities exchange are valued at the last sale price at the close of the exchange or foreign securities exchange. If there has been no sale on such day, the securities are valued
| | |
| |
| 22 | AB ALL CHINA EQUITY PORTFOLIO | | abfunds.com |
NOTES TO FINANCIAL STATEMENTS(continued)
at the last traded price from the previous day. Securities listed on more than one exchange are valued by reference to the principal exchange on which the securities are traded; securities listed only on NASDAQ are valued in accordance with the NASDAQ Official Closing Price; listed or over the counter (“OTC”) market put or call options are valued at the mid level between the current bid and ask prices. If either a current bid or current ask price is unavailable, AllianceBernstein L.P. (the “Adviser”) will have discretion to determine the best valuation (e.g., last trade price in the case of listed options); open futures are valued using the closing settlement price or, in the absence of such a price, the most recent quoted bid price. If there are no quotations available for the day of valuation, the last available closing settlement price is used; U.S. Government securities and any other debt instruments having 60 days or less remaining until maturity are generally valued at market by an independent pricing vendor, if a market price is available. If a market price is not available, the securities are valued at amortized cost. This methodology is commonly used for short term securities that have an original maturity of 60 days or less, as well as short term securities that had an original term to maturity that exceeded 60 days. In instances when amortized cost is utilized, the Valuation Committee (the “Committee”) must reasonably conclude that the utilization of amortized cost is approximately the same as the fair value of the security. Such factors the Committee will consider include, but are not limited to, an impairment of the creditworthiness of the issuer or material changes in interest rates. Fixed-income securities, including mortgage-backed and asset-backed securities, may be valued on the basis of prices provided by a pricing service or at a price obtained from one or more of the major broker-dealers. In cases where broker-dealer quotes are obtained, the Adviser may establish procedures whereby changes in market yields or spreads are used to adjust, on a daily basis, a recently obtained quoted price on a security. Swaps and other derivatives are valued daily, primarily using independent pricing services, independent pricing models using market inputs, as well as third party broker-dealers or counterparties. Open end mutual funds are valued at the closing net asset value per share, while exchange traded funds are valued at the closing market price per share.
Securities for which market quotations are not readily available (including restricted securities) or are deemed unreliable are valued at fair value as deemed appropriate by the Adviser. Factors considered in making this determination may include, but are not limited to, information obtained by contacting the issuer, analysts, analysis of the issuer’s financial statements or other available documents. In addition, the Fund may use fair value pricing for securities primarily traded innon-U.S. markets because most foreign markets close well before the Fund values its securities at 4:00 p.m., Eastern Time. The earlier close of these foreign markets gives rise to the possibility that significant events, including broad market moves, may have
| | |
| |
| abfunds.com | | AB ALL CHINA EQUITY PORTFOLIO | 23 |
NOTES TO FINANCIAL STATEMENTS(continued)
occurred in the interim and may materially affect the value of those securities. To account for this, the Fund generally values many of its foreign equity securities using fair value prices based on third party vendor modeling tools to the extent available.
2. Fair Value Measurements
In accordance with U.S. GAAP regarding fair value measurements, fair value is defined as the price that the Fund would receive to sell an asset or pay to transfer a liability in an orderly transaction between market participants at the measurement date. U.S. GAAP establishes a framework for measuring fair value, and a three-level hierarchy for fair value measurements based upon the transparency of inputs to the valuation of an asset or liability (including those valued based on their market values as described in Note A.1 above). Inputs may be observable or unobservable and refer broadly to the assumptions that market participants would use in pricing the asset or liability. Observable inputs reflect the assumptions market participants would use in pricing the asset or liability based on market data obtained from sources independent of the Fund. Unobservable inputs reflect the Fund’s own assumptions about the assumptions that market participants would use in pricing the asset or liability based on the best information available in the circumstances. Each investment is assigned a level based upon the observability of the inputs which are significant to the overall valuation. The three-tier hierarchy of inputs is summarized below.
| | • | | Level 1—quoted prices in active markets for identical investments |
| | • | | Level 2—other significant observable inputs (including quoted prices for similar investments, interest rates, prepayment speeds, credit risk, etc.) |
| | • | | Level 3—significant unobservable inputs (including the Fund’s own assumptions in determining the fair value of investments) |
Where readily available market prices or relevant bid prices are not available for certain equity investments, such investments may be valued based on similar publicly traded investments, movements in relevant indices since last available prices or based upon underlying company fundamentals and comparable company data (such as multiples to earnings or other multiples to equity). Where an investment is valued using an observable input, such as another publicly traded security, the investment will be classified as Level 2. If management determines that an adjustment is appropriate based on restrictions on resale, illiquidity or uncertainty, and such adjustment is a significant component of the valuation, the investment will be classified as Level 3. An investment will also be classified as Level 3 where management uses company fundamentals and other significant inputs to determine the valuation.
| | |
| |
| 24 | AB ALL CHINA EQUITY PORTFOLIO | | abfunds.com |
NOTES TO FINANCIAL STATEMENTS(continued)
The following table summarizes the valuation of the Fund’s investments by the above fair value hierarchy levels as of November 30, 2019:
| | | | | | | | | | | | | | | | |
Investments in
Securities | | Level 1 | | | Level 2 | | | Level 3 | | | Total | |
Assets: | | | | | | | | | | | | | | | | |
Common Stocks: | | | | | | | | | | | | | | | | |
Consumer Discretionary | | $ | 10,497,491 | | | $ | 7,827,701 | | | $ | – 0 | – | | $ | 18,325,192 | |
Financials | | | – 0 | – | | | 16,919,394 | | | | – 0 | – | | | 16,919,394 | |
Industrials | | | – 0 | – | | | 13,558,615 | | | | – 0 | – | | | 13,558,615 | |
Consumer Staples | | | 330,002 | | | | 9,960,657 | | | | – 0 | – | | | 10,290,659 | |
Communication Services | | | 1,355,876 | | | | 8,218,849 | | | | – 0 | – | | | 9,574,725 | |
Real Estate | | | – 0 | – | | | 5,439,868 | | | | 221,212 | | | | 5,661,080 | |
Information Technology | | | – 0 | – | | | 4,607,326 | | | | – 0 | – | | | 4,607,326 | |
Health Care | | | – 0 | – | | | 3,595,600 | | | | – 0 | – | | | 3,595,600 | |
Utilities | | | – 0 | – | | | 3,065,635 | | | | – 0 | – | | | 3,065,635 | |
Materials | | | – 0 | – | | | 2,633,939 | | | | – 0 | – | | | 2,633,939 | |
Energy | | | – 0 | – | | | 438,866 | | | | – 0 | – | | | 438,866 | |
Rights | | | – 0 | – | | | – 0 | – | | | 0 | # | | | – 0 | – |
Short-Term Investments: | | | | | | | | | | | | | | | | |
Investment Companies | | | 647,227 | | | | – 0 | – | | | – 0 | – | | | 647,227 | |
Investments of Cash Collateral for Securities Loaned in Affiliated Money Market Fund | | | 253,440 | | | | – 0 | – | | | – 0 | – | | | 253,440 | |
| | | | | | | | | | | | | | | | |
Total Investments in Securities | | | 13,084,036 | | | | 76,266,450 | † | | | 221,212 | | | | 89,571,698 | |
Other Financial Instruments* | | | – 0 | – | | | – 0 | – | | | – 0 | – | | | – 0 | – |
| | | | | | | | | | | | | | | | |
Total | | $ | 13,084,036 | | | $ | 76,266,450 | | | $ | 221,212 | | | $ | 89,571,698 | |
| | | | | | | | | | | | | | | | |
| # | The Fund held securities with zero market value at period end. |
| † | A significant portion of the Fund’s foreign equity investments are categorized as Level 2 investments since they are valued using fair value prices based on third party vendor modeling tools to the extent available, see Note A.1. |
| * | Other financial instruments are derivative instruments, such as futures, forwards and swaps, which are valued at the unrealized appreciation/(depreciation) on the instrument. Other financial instruments may also include swaps with upfront premiums, options written and swaptions written which are valued at market value. |
3. Currency Translation
Assets and liabilities denominated in foreign currencies and commitments under forward currency exchange contracts are translated into U.S. dollars at the mean of the quoted bid and ask prices of such currencies against the U.S. dollar. Purchases and sales of portfolio securities are translated into U.S. dollars at the rates of exchange prevailing when such securities were acquired or sold. Income and expenses are translated into U.S. dollars at the rates of exchange prevailing when accrued.
Net realized gain or loss on foreign currency transactions represents foreign exchange gains and losses from sales and maturities of foreign fixed
| | |
| |
| abfunds.com | | AB ALL CHINA EQUITY PORTFOLIO | 25 |
NOTES TO FINANCIAL STATEMENTS(continued)
income investments, holding of foreign currencies, currency gains or losses realized between the trade and settlement dates on foreign investment transactions, and the difference between the amounts of dividends, interest and foreign withholding taxes recorded on the Fund’s books and the U.S. dollar equivalent amounts actually received or paid. Net unrealized currency gains and losses from valuing foreign currency denominated assets and liabilities at period end exchange rates are reflected as a component of net unrealized appreciation or depreciation of foreign currency denominated assets and liabilities.
4. Taxes
It is the Fund’s policy to meet the requirements of the Internal Revenue Code applicable to regulated investment companies and to distribute all of its investment company taxable income and net realized gains, if any, to shareholders. Therefore, no provisions for federal income or excise taxes are required. The Fund may be subject to taxes imposed by countries in which it invests. Such taxes are generally based on income and/or capital gains earned or repatriated. Taxes are accrued and applied to net investment income, net realized gains and net unrealized appreciation/depreciation as such income and/or gains are earned.
In accordance with U.S. GAAP requirements regarding accounting for uncertainties in income taxes, management has analyzed the Fund’s tax positions taken or expected to be taken on federal and state income tax returns for all open tax years (the current and the prior tax year) and has concluded that no provision for income tax is required in the Fund’s financial statements.
5. Investment Income and Investment Transactions
Dividend income is recorded on theex-dividend date or as soon as the Fund is informed of the dividend. Interest income is accrued daily. Investment transactions are accounted for on the date the securities are purchased or sold. Investment gains or losses are determined on the identified cost basis. The Fund amortizes premiums and accretes discounts as adjustments to interest income.
6. Class Allocations
All income earned and expenses incurred by the Fund are borne on apro-rata basis by each outstanding class of shares, based on the proportionate interest in the Fund represented by the net assets of such class, except for class specific expenses which are allocated to the respective class. Expenses of the Company are charged proportionately to each portfolio or based on other appropriate methods. Realized and unrealized gains and losses are allocated among the various share classes based on respective net assets.
| | |
| |
| 26 | AB ALL CHINA EQUITY PORTFOLIO | | abfunds.com |
NOTES TO FINANCIAL STATEMENTS(continued)
7. Dividends and Distributions
Dividends and distributions to shareholders, if any, are recorded on theex-dividend date. Income dividends and capital gains distributions are determined in accordance with federal tax regulations and may differ from those determined in accordance with U.S. GAAP. To the extent these differences are permanent, such amounts are reclassified within the capital accounts based on their federal tax basis treatment; temporary differences do not require such reclassification.
8. Offering Expenses
Offering expenses of $118,284 were deferred and amortized on a straight line basis over a one year period starting from July 25, 2018 (commencement of operations).
NOTE B
Advisory Fee and Other Transactions with Affiliates
Under the terms of the investment advisory agreement, the Fund pays the Adviser an advisory fee at an annual rate of .95% of Fund’s average daily net assets. The fee is accrued daily and paid monthly. The Adviser has agreed to waive its fees and bear certain expenses to the extent necessary to limit total operating expenses (excluding acquired fund fees and expenses other than the advisory fees of any AB mutual funds in which the Fund may invest, interest expense, taxes, extraordinary expenses, and brokerage commissions and other transaction costs), on an annual basis (the “Expense Caps”) to 1.50% and 1.25% of the daily average net assets for Class A and Advisor Class, respectively. For the year ended November 30, 2019, such reimbursements/waivers amounted to $205,172. The Expense Caps may not be terminated by the Adviser before February 28, 2020. Any fees waived and expenses borne by the Adviser through July 25, 2019 are subject to repayment by the Fund until the end of the third fiscal year after the fiscal period in which the fee was waived or the expense was borne; such waivers that are subject to repayment amount to $218,709 for the period ended November 30, 2018 and $202,645 for the year ended November 30, 2019. In any case, no repayment will be made that would cause the Fund’s total annual operating expenses to exceed the Expense Caps’ net fee percentages set forth above.
Pursuant to the investment advisory agreement, the Fund may reimburse the Adviser for certain legal and accounting services provided to the Fund by the Adviser. For the year ended November 30, 2019, the Adviser voluntarily agreed to waive such fees in the amount of $84,267.
The Fund compensates AllianceBernstein Investor Services, Inc. (“ABIS”), a wholly-owned subsidiary of the Adviser, under a Transfer Agency Agreement for providing personnel and facilities to perform transfer agency services for the Fund. ABIS may make payments to intermediaries that provide
| | |
| |
| abfunds.com | | AB ALL CHINA EQUITY PORTFOLIO | 27 |
NOTES TO FINANCIAL STATEMENTS(continued)
omnibus account services,sub-accounting services and/or networking services. Such compensation retained by ABIS amounted to $18,000 for the year ended November 30, 2019.
AllianceBernstein Investments, Inc. (the “Distributor”), a wholly-owned subsidiary of the Adviser, serves as the distributor of the Fund’s shares. The Distributor has advised the Fund that it has retained nofront-end sales charges from the sale of Class A shares and received no contingent deferred sales charges imposed upon redemptions by shareholders of Class A for the year ended November 30, 2019.
The Fund may invest in AB Government Money Market Portfolio (the “Government Money Market Portfolio”) which has a contractual annual advisory fee rate of .20% of the portfolio’s average daily net assets and bears its own expenses. The Adviser has contractually agreed to waive .10% of the advisory fee of Government Money Market Portfolio (resulting in a net advisory fee of .10%) until August 31, 2020. In connection with the investment by the Fund in Government Money Market Portfolio, the Adviser has contractually agreed to waive its advisory fee from the Fund in an amount equal to the Fund’s pro rata share of the effective advisory fee of Government Money Market Portfolio, as borne indirectly by the Fund as an acquired fund fee and expense. For the year ended November 30, 2019, such waiver amounted to $1,549.
A summary of the Fund’s transactions in AB mutual funds for the year ended November 30, 2019 is as follows:
| | | | | | | | | | | | | | | | | | | | |
Fund | | Market Value
11/30/18
(000) | | | Purchases
at Cost
(000) | | | Sales
Proceeds
(000) | | | Market Value
11/30/19
(000) | | | Dividend
Income
(000) | |
Government Money Market Portfolio | | $ | 607 | | | $ | 34,724 | | | $ | 34,684 | | | $ | 647 | | | $ | 34 | |
Government Money Market Portfolio* | | $ | – 0 | – | | $ | 1,826 | | | $ | 1,573 | | | $ | 253 | | | $ | 3 | |
| | | | | | | | | | | | | | | | | | | | |
Total | | | | | | | | | | | | | | $ | 900 | | | $ | 37 | |
| | | | | | | | | | | | | | | | | | | | |
| * | Investment of cash collateral for securities lending transactions (see Note E). |
During the second quarter of 2018, AXA S.A. (“AXA”), a French holding company for the AXA Group, a worldwide leader in life, property and casualty and health insurance and asset management, completed the sale of a minority stake in its subsidiary, AXA Equitable Holdings, Inc. (now named Equitable Holdings, Inc.)(“Equitable”), through an initial public
| | |
| |
| 28 | AB ALL CHINA EQUITY PORTFOLIO | | abfunds.com |
NOTES TO FINANCIAL STATEMENTS(continued)
offering. Equitable is the holding company for a diverse group of financial services companies, including an approximately 65.3% economic interest in the Adviser and a 100% interest in AllianceBernstein Corporation, the general partner of the Adviser. Since the initial sale, AXA has completed additional offerings, most recently during the fourth quarter of 2019. As a result, AXA currently owns 10.1% of the outstanding shares of common stock of Equitable, and no longer owns a controlling interest in Equitable. AXA previously announced its intention to sell its entire interest in Equitable over time, subject to market conditions and other factors (the “Plan”). Most of AXA’s remaining Equitable shares are to be delivered on redemption of AXA bonds mandatorily exchangeable into Equitable shares and maturing in May 2021. AXA retains sole discretion to determine the timing of any future sales of its remaining shares of Equitable common stock.
The latest transaction under the Plan, which occurred on November 13, 2019, resulted in the indirect transfer of a “controlling block” of voting securities of the Adviser (a “Change of Control Event”) and was deemed an “assignment” causing a termination of the Fund’s investment advisory agreement. In order to ensure that investment advisory services could continue uninterrupted in the event of a Change of Control Event, the Board previously approved a new investment advisory agreement with the Adviser. Shareholders of the Fund subsequently approved the new investment advisory agreement, which became effective on November 13, 2019.
NOTE C
Distribution Services Agreement
The Fund has adopted a Distribution Services Agreement (the “Agreement”) pursuant to Rule12b-1 under the Investment Company Act of 1940. Under the Agreement, the Fund pays distribution and servicing fees to the Distributor at an annual rate of up to .25% of the Fund’s average daily net assets attributable to Class A shares. There are no distribution and servicing fees on the Advisor Class. The fees are accrued daily and paid monthly. The Agreement provides that the Distributor will use such payments in their entirety for distribution assistance and promotional activities. In accordance with the Agreement, there is no provision for recovery of unreimbursed distribution costs incurred by the Distributor beyond the current fiscal year for Class A shares. The Agreement also provides that the Adviser may use its own resources to finance the distribution of the Fund’s shares.
| | |
| |
| abfunds.com | | AB ALL CHINA EQUITY PORTFOLIO | 29 |
NOTES TO FINANCIAL STATEMENTS(continued)
NOTE D
Investment Transactions
Purchases and sales of investment securities (excluding short-term investments) for the year ended November 30, 2019 were as follows:
| | | | | | | | |
| | | Purchases | | | Sales | |
Investment securities (excluding U.S. government securities) | | $ | 83,913,825 | | | $ | 41,689,700 | |
U.S. government securities | | | – 0 | – | | | – 0 | – |
The cost of investments for federal income tax purposes, gross unrealized appreciation and unrealized depreciation are as follows:
| | | | |
Cost | | $ | 78,753,594 | |
| | | | |
Gross unrealized appreciation | | $ | 13,272,265 | |
Gross unrealized depreciation | | | (2,454,161 | ) |
| | | | |
Net unrealized appreciation | | $ | 10,818,104 | |
| | | | |
1. Derivative Financial Instruments
The Fund may use derivatives in an effort to earn income and enhance returns, to replace more traditional direct investments, to obtain exposure to otherwise inaccessible markets (collectively, “investment purposes”), or to hedge or adjust the risk profile of its portfolio.
The principal type of derivative utilized by the Fund, as well as the methods in which they may be used are:
The Fund may buy or sell futures for investment purposes or for the purpose of hedging its portfolio against adverse effects of potential movements in the market. The Fund bears the market risk that arises from changes in the value of these instruments and the imperfect correlation between movements in the price of the futures and movements in the price of the assets, reference rates or indices which they are designed to track. Among other things, the Fund may purchase or sell futures for foreign currencies or options thereon fornon-hedging purposes as a means of making direct investment in foreign currencies, as described below under “Currency Transactions”.
At the time the Fund enters into futures, the Fund deposits and maintains as collateral an initial margin with the broker, as required by the exchange on which the transaction is effected. Such amount is shown as cash collateral due from broker on the statement of assets and liabilities. Pursuant to the contract, the Fund agrees to receive from or pay to the broker an amount of cash equal to the daily fluctuation in the value of the contract. Such receipts or payments are known as variation margin and are recorded by the Fund as unrealized
| | |
| |
| 30 | AB ALL CHINA EQUITY PORTFOLIO | | abfunds.com |
NOTES TO FINANCIAL STATEMENTS(continued)
gains or losses. Risks may arise from the potential inability of a counterparty to meet the terms of the contract. The credit/counterparty risk for exchange-traded futures is generally less than privately negotiated futures, since the clearinghouse, which is the issuer or counterparty to each exchange-traded future, has robust risk mitigation standards, including the requirement to provide initial and variation margin. When the contract is closed, the Fund records a realized gain or loss equal to the difference between the value of the contract at the time it was opened and the time it was closed.
Use of long futures subjects the Fund to risk of loss in excess of the amounts shown on the statement of assets and liabilities, up to the notional value of the futures. Use of short futures subjects the Fund to unlimited risk of loss. Under some circumstances, futures exchanges may establish daily limits on the amount that the price of futures can vary from the previous day’s settlement price, which could effectively prevent liquidation of unfavorable positions.
During year ended November 30, 2019, the Fund held futures for hedging purposes.
During the year ended November 30, 2019, the Fund had entered into the following derivatives:
| | | | | | | | | | |
Derivative Type | | Location of Gain
or (Loss) on
Derivatives Within
Statement of
Operations | | Realized Gain
or (Loss) on
Derivatives | | | Change in
Unrealized
Appreciation or
(Depreciation) | |
Equity contracts | | Net realized gain/(loss) on futures; Net change in unrealized appreciation/ depreciation on futures | | $ | (198,436 | ) | | $ | – 0 | – |
| | | | | | | | | | |
Total | | | | $ | (198,436 | ) | | $ | – 0 | – |
| | | | | | | | | | |
The following table represents the average monthly volume of the Fund’s derivative transactions during the year ended November 30, 2019:
| | | | |
Futures: | | | | |
Average notional amount of buy contracts | | $ | 1,885,615 | (a) |
| (a) | Positions were open for one month during the period. |
2. Currency Transactions
The Fund may invest innon-U.S. Dollar-denominated securities on a currency hedged or unhedged basis. The Fund may seek investment opportunities by taking long or short positions in currencies through the use of currency-related derivatives, including forward currency exchange contracts, futures and options on futures, swaps, and other options. The Fund
| | |
| |
| abfunds.com | | AB ALL CHINA EQUITY PORTFOLIO | 31 |
NOTES TO FINANCIAL STATEMENTS(continued)
may enter into transactions for investment opportunities when it anticipates that a foreign currency will appreciate or depreciate in value but securities denominated in that currency are not held by the Fund and do not present attractive investment opportunities. Such transactions may also be used when the Adviser believes that it may be more efficient than a direct investment in a foreign currency-denominated security. The Fund may also conduct currency exchange contracts on a spot basis (i.e., for cash at the spot rate prevailing in the currency exchange market for buying or selling currencies).
NOTE E
Securities Lending
The Fund may enter into securities lending transactions. Under the Fund’s securities lending program, all loans of securities will be collateralized continually by cash collateral and/ornon-cash collateral.Non-cash collateral will include only securities issued or guaranteed by the U.S. government or its agencies or instrumentalities. The Fund cannot sell or repledge anynon-cash collateral, such collateral will not be reflected in the portfolio of investments. If a loan is collateralized by cash, the Fund will be compensated for the loan from a portion of the net return from the income earned on cash collateral after a rebate is paid to the borrower (in some cases, this rebate may be a “negative rebate” or fee paid by the borrower to the Fund in connection with the loan), and payments are made for fees of the securities lending agent and for certain other administrative expenses. If the Fund receivesnon-cash collateral, the Fund will receive a fee from the borrower generally equal to a negotiated percentage of the market value of the loaned securities. The Fund will have the right to call a loan and obtain the securities loaned at any time on notice to the borrower within the normal and customary settlement time for the securities. While the securities are on loan, the borrower is obligated to pay the Fund amounts equal to any income or other distributions from the securities. The Fund will not be able to exercise voting rights with respect to any securities during the existence of a loan, but will have the right to regain ownership of loaned securities in order to exercise voting or other ownership rights. Collateral received and securities loaned are marked to market daily to ensure that the securities loaned are secured by collateral. The lending agent currently invests the cash collateral received in Government Money Market Portfolio, an eligible money market vehicle, in accordance with the investment restrictions of the Fund, and as approved by the Board. The collateral received on securities loaned is recorded as an asset as well as a corresponding liability in the statement of assets and liabilities. The collateral will be adjusted the next business day to maintain the required collateral amount. The amounts of securities lending income from the borrowers and Government Money Market Portfolio are reflected in the statement of operations. When the Fund earns net securities lending income from
| | |
| |
| 32 | AB ALL CHINA EQUITY PORTFOLIO | | abfunds.com |
NOTES TO FINANCIAL STATEMENTS(continued)
Government Money Market Portfolio, the income is inclusive of a rebate expense paid to the borrower. In connection with the cash collateral investment by the Fund in the Government Money Market Portfolio, the Adviser has agreed to waive a portion of the Fund’s share of the advisory fees of Government Money Market Portfolio, as borne indirectly by the Fund as an acquired fund fee and expense. When the Fund lends securities, its investment performance will continue to reflect changes in the value of the securities loaned. A principal risk of lending portfolio securities is that the borrower may fail to return the loaned securities upon termination of the loan and that the collateral will not be sufficient to replace the loaned securities. The lending agent has agreed to indemnify the Fund in the case of default of any securities borrower.
A summary of the Fund’s transactions surrounding securities lending for the year ended November 30, 2019 is as follows:
| | | | | | | | | | | | | | | | | | | | |
| | | | | | | | | | | | Government Money
Market Portfolio | |
Market Value
of Securities
on Loan* | | Cash
Collateral* | | | Market Value
of Non-Cash
Collateral* | | | Income from
Borrowers | | | Income
Earned | | | Advisory
Fee Waived | |
| $ 237,543 | | $ | 253,440 | | | $ | – 0 | – | | $ | 6,388 | | | $ | 2,921 | | | $ | 49 | |
| * | As of November 30, 2019. |
NOTE F
Capital Stock
Each class consists of 1,000,000,000 authorized shares. Transactions in capital shares for each class were as follows:
| | | | | | | | | | | | | | | | | | | | | | | | |
| | | | | | | | | | | | | | | | | | | | | | | | |
| | | Shares | | | | | | Amount | | | | |
| | | Year Ended
November 30,
2019 | | | July 25, 2018* to
November 30, 2018 | | | | | | Year Ended
November 30, 2019 | | | July 25, 2018* to
November 30, 2018 | | | | |
| | | | | | | | |
| Class A | | | | | | | | | | | | | | | | | | | | | | | | |
Shares sold | | | 103,591 | | | | 81,858 | | | | | | | $ | 846,500 | | | $ | 774,914 | | | | | |
| | | | | |
Shares redeemed | | | – 0 | – | | | 0 | (a) | | | | | | | – 0 | – | | | (1 | ) | | | | |
| | | | | |
Net increase | | | 103,591 | | | | 81,858 | | | | | | | $ | 846,500 | | | $ | 774,913 | | | | | |
| | | | | |
| | | | | | | | | | | | | | | | | | | | | | | | |
| Advisor Class | | | | | | | | | | | | | | | | | | | | | | | | |
Shares sold | | | 4,945,639 | | | | 4,325,262 | | | | | | | $ | 45,991,000 | | | $ | 38,080,012 | | | | | |
| | | | | |
Shares redeemed | | | (557,767 | ) | | | (10,819 | ) | | | | | | | (5,396,639 | ) | | | (89,996 | ) | | | | |
| | | | | |
Net increase | | | 4,387,872 | | | | 4,314,443 | | | | | | | $ | 40,594,361 | | | $ | 37,990,016 | | | | | |
| | | | | |
| * | Commencement of operations. |
| | |
| |
| abfunds.com | | AB ALL CHINA EQUITY PORTFOLIO | 33 |
NOTES TO FINANCIAL STATEMENTS(continued)
NOTE G
Risks Involved in Investing in the Fund
Foreign(Non-U.S.) Risk—Investments in securities ofnon-U.S. issuers may involve more risk than those of U.S. issuers. These securities may fluctuate more widely in price and may be more difficult to trade or dispose of due to adverse market, economic, political, regulatory or other factors. Investments in emerging market countries such as China may involve more risk than investments in developed countries because the markets in emerging market countries are less developed and less liquid and are subject to increased economic, political, regulatory, or other uncertainties. In addition, the value of the Fund’s investments may decline because of factors such as unfavorable or unsuccessful government actions and reduction in government or central bank support.
China/Single Country Risk—Investments in issuers located in a particular country or geographic region may have more risk because of particular market factors affecting that country or region, including political instability or unpredictable economic conditions. Risks of investments in securities of companies in China include the volatility of the Chinese stock market, heavy dependence on exports, which may be affected adversely by trade barriers or disputes or may decrease, sometimes significantly, when the world economy weakens, and the continuing importance of the role of the Chinese Government, which may take actions that affect economic and market practices. While the Chinese economy has grown at a rapid rate in recent years, the rate of growth has been declining, and there can be no assurance that China’s economy will continue to grow in the future. Investments in China A shares are subject to quotas that may restrict daily trading and generally are less liquid than shares of companies in developed markets. Risks of investments in companies based in Hong Kong include heavy reliance on the U.S. economy and regional economies, particularly the Chinese economy, which makes these investments vulnerable to changes in these economies.
Currency Risk—Fluctuations in currency exchange rates may negatively affect the value of the Fund’s investments in equity securities denominated in foreign currencies or reduce the Fund’s returns. Emerging market currencies may be more volatile and less liquid, and subject to significantly greater risk of currency controls and convertibility restrictions, than currencies of developed countries.
Depositary Receipts Risk—Investing in depositary receipts involves risks that are similar to the risks of direct investments in foreign securities. For example, investing in depositary receipts may involve risks relating to political, economic or regulatory conditions in foreign countries. In addition, the issuers of the securities underlying certain depositary receipts are
| | |
| |
| 34 | AB ALL CHINA EQUITY PORTFOLIO | | abfunds.com |
NOTES TO FINANCIAL STATEMENTS(continued)
under no obligation to distribute shareholder communications or pass through any voting rights with respect to the deposited securities to the holders of such receipts.
Illiquid Investments Risk—Illiquid investments risk exists when certain investments are or become difficult to purchase or sell. Difficulty in selling such investments may result in sales at disadvantageous prices affecting the value of your investment in the Fund. Causes of illiquid investments risk may include low trading volumes and large positions. Foreign fixed-income securities may have more illiquid investments risk because secondary trading markets for these securities may be smaller and less well-developed and the securities may trade less frequently. Illiquid investments risk may be higher in a rising interest rate environment, when the value and liquidity of fixed-income securities generally go down.
Non-Diversification Risk—The Fund may have more risk because it is“non-diversified”, meaning that it can invest more of its assets in a smaller number of issuers. Accordingly, changes in the value of a single security may have a more significant effect, either negative or positive, on the Fund’s net asset value, or NAV.
LIBOR Risk—The Fund may invest in certain debt securities, derivatives or other financial instruments that utilize the London Interbank Offered Rate, or “LIBOR,” as a “benchmark” or “reference rate” for various interest rate calculations. In July 2017, the United Kingdom Financial Conduct Authority, which regulates LIBOR, announced a desire to phase out the use of LIBOR by the end of 2021. Although financial regulators and industry working groups have suggested alternative reference rates, such as European Interbank Offer Rate (“EURIBOR”), Sterling Overnight Interbank Average Rate (“SONIA”) and Secured Overnight Financing Rate (“SOFR”), global consensus on alternative rates is lacking and the process for amending existing contracts or instruments to transition away from LIBOR remains unclear. The elimination of LIBOR or changes to other reference rates or any other changes or reforms to the determination or supervision of reference rates could have an adverse impact on the market for, or value of, any securities or payments linked to those reference rates, which may adversely affect the Fund’s performance and/or net asset value. Uncertainty and risk also remain regarding the willingness and ability of issuers and lenders to include revised provisions in new and existing contracts or instruments. Consequently, the transition away from LIBOR to other reference rates may lead to increased volatility and illiquidity in markets that are tied to LIBOR, fluctuations in values of LIBOR-related investments or investments in issuers that utilize LIBOR, increased difficulty in borrowing or refinancing and diminished effectiveness of hedging strategies, adversely affecting the Fund’s performance. Furthermore, the risks
| | |
| |
| abfunds.com | | AB ALL CHINA EQUITY PORTFOLIO | 35 |
NOTES TO FINANCIAL STATEMENTS(continued)
associated with the expected discontinuation of LIBOR and transition may be exacerbated if the work necessary to effect an orderly transition to an alternative reference rate is not completed in a timely manner. Because the usefulness of LIBOR as a benchmark could deteriorate during the transition period, these effects could occur prior to the end of 2021.
Indemnification Risk—In the ordinary course of business, the Fund enters into contracts that contain a variety of indemnifications. The Fund’s maximum exposure under these arrangements is unknown. However, the Fund has not had prior claims or losses pursuant to these indemnification provisions and expects the risk of loss thereunder to be remote. Therefore, the Fund has not accrued any liability in connection with these indemnification provisions.
NOTE H
Joint Credit Facility
A number ofopen-end mutual funds managed by the Adviser, including the Fund, participate in a $325 million revolving credit facility (the “Facility”) intended to provide short-term financing, if necessary, subject to certain restrictions in connection with abnormal redemption activity. Commitment fees related to the Facility are paid by the participating funds and are included in miscellaneous expenses in the statement of operations. The Fund did not utilize the Facility during the year ended November 30, 2019.
NOTE I
Distributions to Shareholders
The tax character of distributions paid during the fiscal years ended November 30, 2019 and November 30, 2018 were as follows:
| | | | | | | | |
| | | 2019 | | | 2018 | |
Distributions paid from: | | | | | | | | |
Ordinary income | | $ | – 0 | – | | $ | – 0 | – |
| | | | | | | | |
Total taxable distributions paid | | $ | – 0 | – | | $ | – 0 | – |
| | | | | | | | |
As of November 30, 2019, the components of accumulated earnings/(deficit) on a tax basis were as follows:
| | | | |
Undistributed ordinary income | | $ | 940,273 | |
Accumulated capital and other losses | | | (2,552,903 | )(a) |
Unrealized appreciation/(depreciation) | | | 10,818,041 | (b) |
| | | | |
Total accumulated earnings/(deficit) | | $ | 9,205,411 | |
| | | | |
| (a) | As of November 30, 2019, the Fund had a net capital loss carryforward of $2,552,903. |
| (b) | The differences between book-basis and tax-basis unrealized appreciation/(depreciation) are attributable primarily to the tax deferral of losses on wash sales. |
| | |
| |
| 36 | AB ALL CHINA EQUITY PORTFOLIO | | abfunds.com |
NOTES TO FINANCIAL STATEMENTS(continued)
For tax purposes, net realized capital losses may be carried over to offset future capital gains, if any. Funds are permitted to carry forward capital losses for an indefinite period, and such losses will retain their character as either short-term or long-term capital losses. As of November 30, 2019, the Fund had a net short-term capital loss carryforward of $2,389,580 and a net long-term capital loss carryforward of $163,323, which may be carried forward for an indefinite period.
During the current fiscal year, permanent differences primarily due to the tax treatment of offering costs resulted in a net increase in distributable earnings and a net decrease in additional paid-in capital. These reclassifications had no effect on net assets.
NOTE J
Recent Accounting Pronouncements
In August 2018, the Financial Accounting Standards Board issued an Accounting Standards Update, ASU2018-13, Fair Value Measurement (Topic 820), Disclosure Framework-Changes to the Disclosure Requirements for Fair Value Measurement which removes, modifies and adds disclosures to Topic 820. The amendments in this ASU2018-13 (“ASU”) apply to all entities that are required, under existing U.S. GAAP, to make disclosures about recurring or nonrecurring fair value measurements. The amendments in this ASU are effective for all entities for fiscal years, and interim periods within those fiscal years, beginning after December 15, 2019. Management has evaluated the impact of the amendments and elected to early adopt the ASU. The adoption of this ASU did not have a material impact on the disclosure and presentation of the financial statements of the Fund.
NOTE K
Subsequent Events
Management has evaluated subsequent events for possible recognition or disclosure in the financial statements through the date the financial statements are issued. Management has determined that there are no material events that would require disclosure in the Fund’s financial statements through this date.
| | |
| |
| abfunds.com | | AB ALL CHINA EQUITY PORTFOLIO | 37 |
FINANCIAL HIGHLIGHTS
Selected Data For A Share Of Capital Stock Outstanding Throughout Each Period
| | | | | | | | |
| | | Class A | |
| | | Year Ended
November 30,
2019 | | | July 25,
2018(a) to
November 30,
2018 | |
| | | | |
| | | | | | | | |
Net asset value, beginning of period | | | $ 8.37 | | | | $ 10.00 | |
| | | | |
Income From Investment Operations | | | | | | | | |
| | |
Net investment income (loss)(b)(c) | | | .10 | | | | (.01 | ) |
| | |
Net realized and unrealized gain (loss) on investment and foreign currency transactions | | | 1.55 | | | | (1.62 | ) |
| | | | |
Net increase (decrease) in net asset value from operations | | | 1.65 | | | | (1.63 | ) |
| | | | |
Net asset value, end of period | | | $ 10.02 | | | | $ 8.37 | |
| | | | |
| | |
Total Return | | | | | | | | |
| | |
Total investment return based on net asset value(d) | | | 19.71 | % | | | (16.30 | )% |
| | |
Ratios/Supplemental Data | | | | | | | | |
| | |
Net assets, end of period (000’s omitted) | | | $1,859 | | | | $685 | |
| | |
Ratio to average net assets of: | | | | | | | | |
| | |
Expenses, net of waivers/reimbursements | | | 1.50 | % | | | 1.50 | %(e) |
| | |
Expenses, before waivers/reimbursements | | | 1.93 | % | | | 4.81 | %(e) |
| | |
Net investment income (loss)(c) | | | 1.00 | % | | | (.33 | )%(e) |
| | |
Portfolio turnover rate | | | 62 | % | | | 38 | % |
See footnote summary on page 39.
| | |
| |
| 38 | AB ALL CHINA EQUITY PORTFOLIO | | abfunds.com |
FINANCIAL HIGHLIGHTS(continued)
Selected Data For A Share Of Capital Stock Outstanding Throughout Each Period
| | | | | | | | |
| | | Advisor Class | |
| | | Year Ended
November 30,
2019 | | | July 25,
2018(a) to
November 30,
2018 | |
| | | | |
| | | | | | | | |
Net asset value, beginning of period | | | $ 8.38 | | | | $ 10.00 | |
| | | | |
Income From Investment Operations | | | | | | | | |
| | |
Net investment income (loss)(b)(c) | | | .12 | | | | (.01 | ) |
| | |
Net realized and unrealized gain (loss) on investment and foreign currency transactions | | | 1.55 | | | | (1.61 | ) |
| | | | |
Net increase (decrease) in net asset value from operations | | | 1.67 | | | | (1.62 | ) |
| | | | |
Net asset value, end of period | | | $ 10.05 | | | | $ 8.38 | |
| | | | |
| | |
Total Return | | | | | | | | |
| | |
Total investment return based on net asset value(d) | | | 19.93 | % | | | (16.20 | )% |
| | |
Ratios/Supplemental Data | | | | | | | | |
| | |
Net assets, end of period (000’s omitted) | | | $87,498 | | | | $36,145 | |
| | |
Ratio to average net assets of: | | | | | | | | |
| | |
Expenses, net of waivers/reimbursements | | | 1.25 | % | | | 1.25 | %(e) |
| | |
Expenses, before waivers/reimbursements | | | 1.67 | % | | | 5.13 | %(e) |
| | |
Net investment income (loss)(c) | | | 1.28 | % | | | (.37 | )%(e) |
| | |
Portfolio turnover rate | | | 62 | % | | | 38 | % |
| (a) | Commencement of operations. |
| (b) | Based on average shares outstanding. |
| (c) | Net of expenses waived/reimbursed by the Adviser. |
| (d) | Total investment return is calculated assuming an initial investment made at the net asset value at the beginning of the period, reinvestment of all dividends and distributions at net asset value during the period, and redemption on the last day of the period. Initial sales charge or contingent deferred sales charge is not reflected in the calculation of total investment return. Total investment return does not reflect the deduction of taxes that a shareholder would pay on fund distributions or the redemption of fund shares. Total investment return for a period of less than one year is not annualized. |
See notes to financial statements.
| | |
| |
| abfunds.com | | AB ALL CHINA EQUITY PORTFOLIO | 39 |
REPORT OF INDEPENDENT REGISTERED
PUBLIC ACCOUNTING FIRM
To the Shareholders and the Board of Directors of
AB All China Equity Portfolio
Opinion on the Financial Statements
We have audited the accompanying statement of assets and liabilities of AB All China Equity Portfolio (the “Fund”) (one of the portfolios constituting AB Cap Fund, Inc. (the “Company”)), including the portfolio of investments, as of November 30, 2019, and the related statement of operations for the year then ended, the statements of changes in net assets and the financial highlights for the year ended November 30, 2019 and the period from July 25, 2018 (commencement of operations) through November 30, 2018 and the related notes (collectively referred to as the “financial statements”). In our opinion, the financial statements present fairly, in all material respects, the financial position of the Fund (one of the portfolios constituting AB Cap Fund, Inc.) at November 30, 2019, the results of its operations for the year then ended, and the changes in its net assets and its financial highlights for the year ended November 30, 2019 and the period from July 25, 2018 (commencement of operations) through November 30, 2018, in conformity with U.S. generally accepted accounting principles.
Basis for Opinion
These financial statements are the responsibility of the Company’s management. Our responsibility is to express an opinion on the Fund’s financial statements based on our audits. We are a public accounting firm registered with the Public Company Accounting Oversight Board (United States) (“PCAOB”) and are required to be independent with respect to the Company in accordance with the U.S. federal securities laws and the applicable rules and regulations of the Securities and Exchange Commission and the PCAOB.
We conducted our audits in accordance with the standards of the PCAOB. Those standards require that we plan and perform the audit to obtain reasonable assurance about whether the financial statements are free of material misstatement, whether due to error or fraud. The Company is not required to have, nor were we engaged to perform, an audit of the Company’s internal control over financial reporting. As part of our audits, we are required to obtain an understanding of internal control over financial reporting but not for the purpose of expressing an opinion on the effectiveness of the Company’s internal control over financial reporting. Accordingly, we express no such opinion.
Our audits included performing procedures to assess the risks of material misstatement of the financial statements, whether due to error or fraud, and performing procedures that respond to those risks. Such procedures
| | |
| |
| 40 | AB ALL CHINA EQUITY PORTFOLIO | | abfunds.com |
REPORT OF INDEPENDENT REGISTERED
PUBLIC ACCOUNTING FIRM(continued)
included examining, on a test basis, evidence regarding the amounts and disclosures in the financial statements. Our procedures included confirmation of securities owned as of November 30, 2019, by correspondence with the custodian and others or by other appropriate auditing procedures where replies from others were not received. Our audits also included evaluating the accounting principles used and significant estimates made by management, as well as evaluating the overall presentation of the financial statements. We believe that our audits provide a reasonable basis for our opinion.

We have served as the auditor of one or more of the AB investment companies since 1968.
New York, New York
January 24, 2020
| | |
| |
| abfunds.com | | AB ALL CHINA EQUITY PORTFOLIO | 41 |
BOARD OF DIRECTORS
| | |
Marshall C. Turner, Jr.(1),Chairman Jorge A. Bermudez(1)* Michael J. Downey(1) Nancy P. Jacklin(1) | | Robert M. Keith,President and Chief Executive Officer Carol C. McMullen(1) Garry L. Moody(1) Earl D. Weiner(1) |
OFFICERS
| | |
John Lin(2),Vice President Stuart Rae(2),Vice President Emilie D. Wrapp,Secretary Michael B. Reyes,Senior Analyst | | Joseph J. Mantineo,Treasurer and Chief Financial Officer Vincent S. Noto,Chief Compliance Officer Phyllis J. Clarke,Controller |
| | |
Custodian and Accounting Agent Brown Brothers Harriman & Co. 50 Post Office Square Boston, MA 02110 Principal Underwriter AllianceBernstein Investments, Inc. 1345 Avenue of the Americas New York, NY 10105 Legal Counsel Seward & Kissel LLP One Battery Park Plaza New York, NY 10004 | | Independent Registered Public Accounting Firm Ernst & Young LLP 5 Times Square New York, NY 10036 Transfer Agent AllianceBernstein Investor Services, Inc. P.O. Box 786003 San Antonio, TX 78278-6003 Toll-Free (800)221-5672 |
| 1 | Member of the Audit Committee, the Governance and Nominating Committee and the Independent Directors Committee. |
| 2 | Theday-to-day management of, and investment decisions for, the Fund’s portfolio are made by the Adviser’s China Equity Team. Messrs. Lin and Rae are the investment professionals with the most significant responsibility for the day-to-day management of the Fund’s portfolio. |
| * | Mr. Bermudez will join the Board on January 1, 2020. |
| | |
| |
| 42 | AB ALL CHINA EQUITY PORTFOLIO | | abfunds.com |
MANAGEMENT OF THE FUND
Board of Directors Information
The business and affairs of the Fund are managed under the direction of the Board of Directors. Certain information concerning the Fund’s Directors is set forth below.
| | | | | | | | |
NAME, ADDRESS* AND AGE (YEAR FIRST ELECTED**) | | PRINCIPAL OCCUPATION(S) DURING PAST FIVE YEARS AND OTHER INFORMATION*** | | PORTFOLIOS IN AB FUND COMPLEX OVERSEEN BY DIRECTOR | | | OTHER PUBLIC COMPANY DIRECTORSHIPS CURRENTLY HELD BY DIRECTOR |
| INTERESTED DIRECTOR | | | | | | | | |
| | | |
Robert M. Keith,+ 1345 Avenue of the Americas New York, NY 10105 59 (2018) | | Senior Vice President of AllianceBernstein L.P. (the “Adviser”) and head of AllianceBernstein Investments, Inc. (“ABI”) since July 2008; Director of ABI and President of the AB Mutual Funds. Previously, he served as Executive Managing Director of ABI from December 2006 to June 2008. Prior to joining ABI in 2006, Executive Managing Director of Bernstein Global Wealth Management, and prior thereto, Senior Managing Director and Global Head of Client Service and Sales of the Adviser’s institutional Investment management business since 2004. Prior thereto, he was Managing Director and Head of North American Client Service and Sales in the Adviser’s institutional investment management business, with which he had been associated since prior to 2004. | | | 91 | | | None |
| | | | | | | | |
| | |
| |
| abfunds.com | | AB ALL CHINA EQUITY PORTFOLIO | 43 |
MANAGEMENT OF THE FUND (continued)
| | | | | | | | |
NAME, ADDRESS* AND AGE (YEAR FIRST ELECTED**) | | PRINCIPAL OCCUPATION(S) DURING PAST FIVE YEARS AND OTHER INFORMATION*** | | PORTFOLIOS IN AB FUND COMPLEX OVERSEEN BY DIRECTOR | | | OTHER PUBLIC COMPANY DIRECTORSHIPS CURRENTLY HELD BY DIRECTOR |
| DISINTERESTED DIRECTORS | | | | | | |
| | | |
Marshall C. Turner, Jr.,# Chairman of the Board 78 (2018) | | Private Investor since prior to 2015. Former Chairman and CEO of Dupont Photomasks, Inc. (components of semiconductor manufacturing). He has extensive operating leadership, experience and venture capital investing experience, including five interim or full-time CEO roles, and prior service as general partner of institutional venture capital partnerships. He also has extensivenon-profit board leadership experience, and currently serves on the boards of two education and science-relatednon-profit organizations. He has served as a director of one AB Fund since 1992, and director or trustee of all AB Funds since 2005. He has been Chairman of the AB Funds since January 2014, and the Chairman of the Independent Directors Committees of such AB Funds since
February 2014. | | | 91 | | | Xilinx, Inc. (programmable logic semiconductors) since 2007 |
| | | | | | | | |
| | |
| |
| 44 | AB ALL CHINA EQUITY PORTFOLIO | | abfunds.com |
MANAGEMENT OF THE FUND (continued)
| | | | | | | | |
NAME, ADDRESS* AND AGE (YEAR FIRST ELECTED**) | | PRINCIPAL OCCUPATION(S) DURING PAST FIVE YEARS AND OTHER INFORMATION*** | | PORTFOLIOS IN AB FUND COMPLEX OVERSEEN BY DIRECTOR | | | OTHER PUBLIC COMPANY DIRECTORSHIPS CURRENTLY HELD BY DIRECTOR |
DISINTERESTED DIRECTORS
(continued) | | | | | | |
| | | |
Jorge A. Bermudez,^ 68 (2020) | | Private investor since prior to 2015. Former Chief Risk Officer of Citigroup, Inc., a global financial services company, from November 2007 to March 2008, Chief Executive Officer of Citigroup’s Commercial Business Group in North America and Citibank Texas from 2005 to 2007, and a variety of other executive and leadership roles at various businesses within Citigroup prior to then; Chairman (2018) of the Texas A&M Foundation Board of Trustees (Trustee since 2013) and Chairman of the Smart Grid Center Board at Texas A&M University since 2012; director of, among others, Citibank N.A. from 2005 to 2008, the Federal Reserve Bank of Dallas, Houston Branch from 2009 to 2011, the Federal Reserve Bank of Dallas from 2011 to 2017, and the Electric Reliability Council of Texas from 2010 to 2016. He has served as director or trustee of the AB Funds since 2020. | | | 91 | | | Moody’s Corporation since April 2011. |
| | | | | | | | |
| | | |
Michael J. Downey,# 76 (2018) | | Private Investor since prior to 2015. Formerly, Chairman of The Asia Pacific Fund, Inc. (registered investment company) since prior to 2015 until January 2019. From 1987 until 1993, Chairman and CEO of Prudential Mutual Fund Management, director of the Prudential mutual funds, and member of the Executive Committee of Prudential Securities Inc. He has served as a director or trustee of the AB Funds since 2005. | | | 91 | | | None |
| | | | | | | | |
| | |
| |
| abfunds.com | | AB ALL CHINA EQUITY PORTFOLIO | 45 |
MANAGEMENT OF THE FUND (continued)
| | | | | | | | |
NAME, ADDRESS* AND AGE (YEAR FIRST ELECTED**) | | PRINCIPAL OCCUPATION(S) DURING PAST FIVE YEARS AND OTHER INFORMATION*** | | PORTFOLIOS IN AB FUND COMPLEX OVERSEEN BY DIRECTOR | | | OTHER PUBLIC COMPANY DIRECTORSHIPS CURRENTLY HELD BY DIRECTOR |
DISINTERESTED DIRECTORS
(continued) | | | | | | |
| | | |
Nancy P. Jacklin,# 71 (2018) | | Private Investor since prior to 2015. Professorial Lecturer at the Johns Hopkins School of Advanced International Studies (2008-2015). U.S. Executive Director of the International Monetary Fund (which is responsible for ensuring the stability of the international monetary system) (December2002-May 2006); Partner, Clifford Chance (1992-2002); Sector Counsel, International Banking and Finance, and Associate General Counsel, Citicorp (1985-1992); Assistant General Counsel (International), Federal Reserve Board of Governors (1982-1985); and Attorney Advisor, U.S. Department of the Treasury (1973-1982). Member of the Bar of the District of Columbia and of New York; and member of the Council on Foreign Relations. She has served as a director or trustee of the AB Funds since 2006 and has been Chair of the Governance and Nominating Committees of the AB Funds since August 2014. | | | 91 | | | None |
| | | | | | | | |
| | |
| |
| 46 | AB ALL CHINA EQUITY PORTFOLIO | | abfunds.com |
MANAGEMENT OF THE FUND (continued)
| | | | | | | | |
NAME, ADDRESS* AND AGE (YEAR FIRST ELECTED**) | | PRINCIPAL OCCUPATION(S) DURING PAST FIVE YEARS AND OTHER INFORMATION*** | | PORTFOLIOS IN AB FUND COMPLEX OVERSEEN BY DIRECTOR | | | OTHER PUBLIC COMPANY DIRECTORSHIPS CURRENTLY HELD BY DIRECTOR |
DISINTERESTED DIRECTORS
(continued) | | | | | | |
| | | |
Carol C. McMullen,# 64 (2018) | | Managing Director of Slalom Consulting (consulting) since 2014, private investor and member of the Advisory Board of Butcher Box (since 2018). Formerly, member, Partners Healthcare Investment Committee (2010-2019); Director of Norfolk & Dedham Group (mutual property and casualty insurance) from 2011 until November 2016; Director of Partners Community Physicians Organization (healthcare) from 2014 until December 2016; and Managing Director of The Crossland Group (consulting) from 2012 until 2013. She has held a number of senior positions in the asset and wealth management industries, including at Eastern Bank (where her roles included President of Eastern Wealth Management), Thomson Financial (Global Head of Sales for Investment Management), and Putnam Investments (where her roles included Chief Investment Officer, Core and Growth and Head of Global Investment Research). She has served on a number of private company andnon-profit boards, and as a director or trustee of the AB Funds since June 2016. | | | 91 | | | None |
| | |
| |
| abfunds.com | | AB ALL CHINA EQUITY PORTFOLIO | 47 |
MANAGEMENT OF THE FUND (continued)
| | | | | | | | |
NAME, ADDRESS* AND AGE (YEAR FIRST ELECTED**) | | PRINCIPAL OCCUPATION(S) DURING PAST FIVE YEARS AND OTHER INFORMATION*** | | PORTFOLIOS IN AB FUND COMPLEX OVERSEEN BY DIRECTOR | | | OTHER PUBLIC COMPANY DIRECTORSHIPS CURRENTLY HELD BY DIRECTOR |
DISINTERESTED DIRECTORS
(continued) | | | | | | |
| | | |
Garry L. Moody,# 67 (2018) | | Formerly, Partner, Deloitte & Touche LLP (1995-2008) where he held a number of senior positions, including Vice Chairman, and U.S. and Global Investment Management Practice Managing Partner; President, Fidelity Accounting and Custody Services Company (1993-1995), where he was responsible for accounting, pricing, custody and reporting for the Fidelity mutual funds; and Partner, Ernst & Young LLP (1975-1993), where he served as the National Director of Mutual Fund Tax Services and Managing Partner of its Chicago Office Tax department. He is a member of the Trustee Advisory Board of BoardIQ, a biweekly publication focused on issues and news affecting directors of mutual funds. He is also a member of the Investment Company Institute’s Board of Governors and the Independent Directors Council Governing Council. He has served as a director or trustee, and as Chairman of the Audit Committees, of the AB Funds since 2008. | | | 91 | | | None |
| | | | | | | | |
| | |
| |
| 48 | AB ALL CHINA EQUITY PORTFOLIO | | abfunds.com |
MANAGEMENT OF THE FUND (continued)
| | | | | | | | |
NAME, ADDRESS* AND AGE (YEAR FIRST ELECTED**) | | PRINCIPAL OCCUPATION(S) DURING PAST FIVE YEARS AND OTHER INFORMATION*** | | PORTFOLIOS IN AB FUND COMPLEX OVERSEEN BY DIRECTOR | | | OTHER PUBLIC COMPANY DIRECTORSHIPS CURRENTLY HELD BY DIRECTOR |
DISINTERESTED DIRECTORS
(continued) | | | | | | |
| | | |
Earl D. Weiner,# 80 (2018) | | Senior Counsel since 2017, Of Counsel from 2007 to 2016, and Partner prior to then, of the law firm Sullivan & Cromwell LLP. He is a former member of the ABA Federal Regulation of Securities Committee Task Force to draft editions of the Fund Director’s Guidebook. He also serves as a director or trustee of variousnon-profit organizations and has served as Chairman or Vice Chairman of a number of them. He has served as a director or trustee of the AB Funds since 2007 and served as Chairman of the Governance and Nominating Committees of the AB Funds from 2007 until August 2014. | | | 91 | | | None |
| * | The address for each of the Fund’s disinterested Directors is c/o AllianceBernstein L.P., Attention: Legal & Compliance Department—Mutual Fund Legal, 1345 Avenue of the Americas, New York, NY 10105. |
| ** | There is no stated term of office for the Fund’s Directors. |
| *** | The information above includes each Director’s principal occupation during the last five years and other information relating to the experience, attributes and skills relevant to each Director’s qualifications to serve as a Director, which led to the conclusion that each Director should serve as a Director for the Fund. |
| + | Mr. Keith is an “interested person” of the Fund, as defined in the “1940 Act”, due to his position as a Senior Vice President of the Adviser. |
| # | Member of the Audit Committee, the Governance and Nominating Committee and the Independent Directors Committee. |
| ^ | Mr. Bermudez will be a Member of the Audit Committee, the Governance and Nominating Committee and the Independent Directors Committee when he joins the Board on January 1, 2020. |
| | |
| |
| abfunds.com | | AB ALL CHINA EQUITY PORTFOLIO | 49 |
MANAGEMENT OF THE FUND (continued)
Officer Information
Certain information concerning the Fund’s officers is set forth below.
| | | | |
NAME, ADDRESS,*
AND AGE | | POSITION(S)
HELD WITH FUND | | PRINCIPAL OCCUPATION
DURING PAST 5 YEARS |
Robert M. Keith
59 | | President and Chief Executive Officer | | See biography above. |
| | | | |
John Lin
42 | | Vice President | | Senior Vice President of the Adviser**, with which he has been associated since prior to 2015. He is also a Senior Research Analyst for China Value Research. |
| | | | |
Stuart Rae
54 | | Vice President | | Senior Vice President of the Adviser**, with which he has been associated since prior to 2015. He is also Chief Investment Officer of the Asia-Pacific Value Equities. |
| | | | |
Emilie D. Wrapp
64 | | Secretary | | Senior Vice President, Assistant General Counsel and Assistant Secretary of ABI**, with which she has been associated since prior to 2015. |
| | | | |
Michael B. Reyes
43 | | Senior Analyst | | Vice President of the Adviser**, with which he has been associated since prior to 2015. |
| | | | |
Joseph J. Mantineo
60 | | Treasurer and Chief Financial Officer | | Senior Vice President of AllianceBernstein Investor Services, Inc. (“ABIS**”), with which he has been associated since prior to 2015. |
| | | | |
Phyllis J. Clarke
59 | | Controller | | Vice President of ABIS**, with which she has been associated since prior to 2015. |
| | | | |
Vincent S. Noto
55 | | Chief Compliance Officer | | Senior Vice President since 2015 and Mutual Fund Chief Compliance Officer of the Adviser** since 2014. Prior thereto, he was Vice President and Director of Mutual Fund Compliance of the Adviser since 2012. |
| * | The address for each of the Fund’s Officers is 1345 Avenue of the Americas, New York, NY 10105. |
| ** | The Adviser, ABI and ABIS are affiliates of the Fund. |
The Fund’s Statement of Additional Information (“SAI”) has additional information about the Fund’s Directors and Officers and is available without charge upon request. Contact your financial representative orAB at (800) 227-4618, or visit www.abfunds.com, for a free prospectus or SAI.
| | |
| |
| 50 | AB ALL CHINA EQUITY PORTFOLIO | | abfunds.com |
Information Regarding the Review and Approval of the Fund’s Advisory Agreement
The disinterested directors (the “directors”) of AB Cap Fund, Inc. (the “Company”) unanimously approved the Company’s Advisory Agreement with the Adviser in respect of AB All China Equity Portfolio (the “Fund”) for an initialtwo-year period at a meeting held onMay 1-3, 2018 (the “Meeting”).
Prior to approval of the Advisory Agreement, the directors had requested from the Adviser, and received and evaluated, extensive materials. They reviewed the proposed Advisory Agreement with the Adviser and with experienced counsel who are independent of the Adviser, who advised on the relevant legal standards. The directors also reviewed additional materials, including materials from an outside consultant, who acted as their independent fee consultant, and comparative analytical data prepared by the Senior Analyst for the Fund. The directors also discussed the proposed approval in private sessions with counsel.
The directors considered their knowledge of the nature and quality of the services to be provided by the Adviser to the Fund gained from their experience as directors or trustees of most of the registered investment companies advised by the Adviser, their overall confidence in the Adviser’s integrity and competence they have gained from that experience, the Adviser’s initiative in identifying and raising potential issues with the directors and its responsiveness, frankness and attention to concerns raised by the directors in the past, including the Adviser’s willingness to consider and implement organizational and operational changes designed to improve investment results and the services provided to the AB Funds. The directors noted that they have four regular meetings each year, at each of which they review extensive materials and information from the Adviser, including information on the investment performance of the AB Funds.
The directors also considered all factors they believed relevant, including the specific matters discussed below. During the course of their deliberations, the directors evaluated, among other things, the reasonableness of the proposed advisory fee. The directors did not identify any particular information that wasall-important or controlling, and different directors may have attributed different weights to the various factors. The directors determined that the selection of the Adviser to manage the Fund and the overall arrangements between the Fund and the Adviser, as provided in the Advisory Agreement, including the proposed advisory fee, were fair and reasonable in light of the services to be performed, expenses to be incurred and such other matters as the directors considered relevant in the exercise of their business judgment. The material factors and conclusions that formed the basis for the directors’ determinations included the following:
Nature, Extent and Quality of Services to be Provided
The directors considered the scope and quality of services to be provided by the Adviser under the Advisory Agreement, including the quality of the
| | |
| |
| abfunds.com | | AB ALL CHINA EQUITY PORTFOLIO | 51 |
investment research capabilities of the Adviser and the other resources it has dedicated to performing services for the AB Funds. They also noted the professional experience and qualifications of the Fund’s portfolio management team and other senior personnel of the Adviser. The directors also considered that the Advisory Agreement provides that the Fund will reimburse the Adviser for the cost to it of providing certain clerical, accounting, administrative and other services to the Fund by employees of the Adviser or its affiliates. Requests for these reimbursements will be subject to the directors’ approval on a quarterly basis and, to the extent requested and paid, result in a higher rate of total compensation from the Fund to the Adviser than the fee rate stated in the Advisory Agreement. The directors noted that the methodology to be used to determine the reimbursement amounts had been reviewed by an independent consultant retained by the Company’s former Independent Compliance Officer. The quality of administrative and other services, including the Adviser’s role in coordinating the activities of the Fund’s other service providers, also was considered. The directors concluded that, overall, they were satisfied with the nature, extent and quality of services to be provided to the Fund under the Advisory Agreement.
Costs of Services to be Provided and Profitability
Because the Fund had not yet commenced operations, the directors were unable to consider historical information about the profitability of the Fund. However, the Adviser agreed to provide the directors with profitability information in connection with future proposed continuances of the Advisory Agreement. They also considered the costs to be borne by the Adviser in providing services to the Fund and that the Fund was unlikely to be profitable to the Adviser unless it achieves a material level of net assets.
Fall-Out Benefits
The directors considered the other benefits to the Adviser and its affiliates from their proposed relationships with the Fund, including, but not limited to, benefits relating to soft dollar arrangements (whereby investment advisers receive brokerage and research services from brokers that execute agency transactions for their clients);12b-1 fees and sales charges to be received by the Fund’s principal underwriter (which is a wholly owned subsidiary of the Adviser) in respect of certain classes of the Fund’s shares; brokerage commissions to be paid by the Fund to brokers affiliated with the Adviser; and transfer agency fees to be paid by the Fund to a wholly owned subsidiary of the Adviser. The directors recognized that the Adviser’s future profitability would be somewhat lower without these benefits. The directors understood that the Adviser also might derive reputational and other benefits from its association with the Fund.
Investment Results
Since the Fund had not yet commenced operations, no performance or other historical information for the Fund was available. Based on the Adviser’s written
| | |
| |
| 52 | AB ALL CHINA EQUITY PORTFOLIO | | abfunds.com |
and oral presentations regarding the proposed management of the Fund and their general knowledge and confidence in the Adviser’s expertise in managing mutual funds, the directors concluded that they were satisfied that the Adviser was capable of providing high quality Fund management services to the Fund.
Advisory Fees and Other Expenses
The directors considered the proposed advisory fee rate payable by the Fund to the Adviser and information prepared by an analytical service that is not affiliated with the Adviser (the “15(c) service provider”), concerning advisory fee rates payable by other funds in the same category as the Fund, based on the Fund’s projected net assets of $250 million. The directors recognized that it is difficult to make comparisons of advisory fees because there are variations in the services that are included in the fees paid by other funds. The directors considered the Fund’s proposed contractual advisory fee rate against a peer group median.
The directors recognized that the Adviser’s total compensation from the Fund pursuant to the Advisory Agreement would be increased by amounts paid pursuant to the expense reimbursement provision in the Advisory Agreement, and that the impact of such expense reimbursement would depend on the size of the Fund and the extent to which the Adviser requests reimbursements pursuant to this provision.
The directors also considered the Adviser’s fee schedule for other clients pursuing a similar investment style. For this purpose, they reviewed the relevant advisory fee information from the Adviser’s Form ADV and the materials from the Fund’s Senior Analyst and noted the differences between the Fund’s proposed fee schedule, on the one hand, and the Adviser’s institutional fee schedule and the schedule of fees charged by the Adviser to any offshore funds and anysub-advised funds, on the other. The directors noted that the Adviser may, in some cases, agree to fee rates with large institutional clients that are lower than those reviewed by the directors and that they had previously discussed with the Adviser its policies in respect of such arrangements.
The Adviser reviewed with the directors the significantly greater scope of the services it will provide to the Fund relative to institutional, offshore fund andsub-advised fund clients. In this regard, the Adviser noted, among other things, that, compared to institutional and offshore accounts, the Fund (i) demands considerably more portfolio management, research and trading resources due to significantly higher daily cash flows; (ii) has more tax and regulatory restrictions; (iii) must prepare and distribute regulatory and other communications about fund operations; and (iv) must provide shareholder servicing to retail investors. The Adviser also reviewed the greater legal risks presented by the large and changing population of Fund shareholders who may assert claims against the Adviser in individual or class actions, and the greater entrepreneurial risk in offering new fund products, which require substantial investment to launch, may not succeed, and generally must be
| | |
| |
| abfunds.com | | AB ALL CHINA EQUITY PORTFOLIO | 53 |
priced to compete with larger, more established funds resulting in lack of profitability to the Adviser until a new fund achieves scale. In light of the substantial differences in services rendered by the Adviser to institutional, offshore fund andsub-advised fund clients as compared to funds such as the Fund, and the different risk profile, the directors considered these fee comparisons inapt and did not place significant weight on them in their deliberations.
The directors noted that the Fund may invest in shares of exchange-traded funds (“ETFs”), subject to the restrictions and limitations of the Investment Company Act of 1940 as these may be varied as a result of exemptive orders issued by the SEC. The directors also noted that ETFs pay advisory fees pursuant to their advisory contracts. The directors concluded, based on the Adviser’s explanation of how it may use ETFs when they are the most cost-effective way to obtain desired exposures or to “equitize” cash inflows pending purchases of underlying securities, that the proposed advisory fee would be for services in addition to, rather than duplicative of, the services provided under the advisory contracts of the ETFs in which the Fund may invest.
The directors also considered the projected total expense ratio of the Class A shares of the Fund in comparison to a group of similar funds (“peer group”) and a larger group of similar funds (“peer universe”) selected by the 15(c) service provider. The directors also considered the Adviser’s proposed expense cap for the Fund for a one year period. The directors noted that it was likely that the expense ratios of some of the other funds in the Fund’s category were lowered by waivers or reimbursements by those funds’ investment advisers, which in some cases might be voluntary or temporary. The directors view the projected expense ratio information as relevant to their evaluation of the Adviser’s services because the Adviser is responsible for coordinating services provided to the Fund by others. Based on their review, the directors concluded that the Fund’s projected expense ratio was acceptable.
Economies of Scale
The directors noted that the proposed advisory fee schedule for the Fund does not contain breakpoints and that they had previously discussed their strong preference for breakpoints in advisory contracts with the Adviser. The directors took into consideration prior presentations by an independent consultant on economies of scale in the mutual fund industry and for the AB Funds, and by the Adviser concerning certain of its views on economies of scale. The directors also had requested and received from the Adviser certain updates on economies of scale in advance of the Meeting. The directors believe that economies of scale may be realized (if at all) by the Adviser across a variety of products and services, and not only in respect of a single fund. The directors noted that there is no established methodology for setting breakpoints that give effect to the fund-specific services provided by a fund’s adviser and to the economies of
| | |
| |
| 54 | AB ALL CHINA EQUITY PORTFOLIO | | abfunds.com |
scale that an adviser may realize in its overall mutual fund business or those components of it which directly or indirectly affect a fund’s operations. The directors observed that in the mutual fund industry as a whole, as well as among funds similar to the Fund, there is no uniformity or pattern in the fees and asset levels at which breakpoints (if any) apply. The directors also noted that the advisory agreements for many funds do not have breakpoints at all. The directors informed the Adviser that they would monitor the Fund’s assets and its profitability to the Adviser and anticipated revisiting the question of breakpoints in the future if circumstances warranted doing so.
| | |
| |
| abfunds.com | | AB ALL CHINA EQUITY PORTFOLIO | 55 |
This page is not part of the Shareholder Report or the Financial Statements.
AB FAMILY OF FUNDS
US EQUITY
US CORE
Core Opportunities Fund
FlexFee™ US Thematic Portfolio
Select US Equity Portfolio
US GROWTH
Concentrated Growth Fund
Discovery Growth Fund
FlexFee™ Large Cap Growth Portfolio
Growth Fund
Large Cap Growth Fund
Small Cap Growth Portfolio
US VALUE
Discovery Value Fund
Equity Income Fund
Relative Value Fund
Small Cap Value Portfolio
Value Fund
INTERNATIONAL/ GLOBAL EQUITY
INTERNATIONAL/ GLOBAL CORE
FlexFee™ International Strategic Core Portfolio
Global Core Equity Portfolio
International Portfolio
International Strategic Core Portfolio
Sustainable Global Thematic Fund
Tax-Managed International Portfolio
Tax-Managed Wealth Appreciation Strategy
Wealth Appreciation Strategy
INTERNATIONAL/ GLOBAL GROWTH
Concentrated International Growth Portfolio
FlexFee™ Emerging Markets Growth Portfolio
INTERNATIONAL/ GLOBAL EQUITY(continued)
Sustainable International Thematic Fund
INTERNATIONAL/ GLOBAL VALUE
All China Equity Portfolio
International Value Fund
FIXED INCOME
MUNICIPAL
High Income Municipal Portfolio
Intermediate California Municipal Portfolio
Intermediate Diversified Municipal Portfolio
Intermediate New York Municipal Portfolio
Municipal Bond Inflation Strategy
Tax-Aware Fixed Income Portfolio
National Portfolio
Arizona Portfolio
California Portfolio
Massachusetts Portfolio
Minnesota Portfolio
New Jersey Portfolio
New York Portfolio
Ohio Portfolio
Pennsylvania Portfolio
Virginia Portfolio
TAXABLE
Bond Inflation Strategy
FlexFee™ High Yield Portfolio
FlexFee™ International Bond Portfolio
Global Bond Fund
High Income Fund
Income Fund
Intermediate Duration Portfolio
Limited Duration High Income Portfolio
Short Duration Portfolio
Total Return Bond Portfolio1
ALTERNATIVES
All Market Real Return Portfolio
Global Real Estate Investment Fund
Select US Long/Short Portfolio
Unconstrained Bond Fund
MULTI-ASSET
All Market Income Portfolio
All Market Total Return Portfolio
Conservative Wealth Strategy
Emerging Markets Multi-Asset Portfolio
Global Risk Allocation Fund
Tax-Managed All Market Income Portfolio
TARGET-DATE
Multi-Manager Select Retirement Allocation Fund
Multi-Manager Select 2010 Fund
Multi-Manager Select 2015 Fund
Multi-Manager Select 2020 Fund
Multi-Manager Select 2025 Fund
Multi-Manager Select 2030 Fund
Multi-Manager Select 2035 Fund
Multi-Manager Select 2040 Fund
Multi-Manager Select 2045 Fund
Multi-Manager Select 2050 Fund
Multi-Manager Select 2055 Fund
Multi-Manager Select 2060 Fund
CLOSED-END FUNDS
AllianceBernstein Global High Income Fund
AllianceBernstein National Municipal Income Fund
We also offer Government Money Market Portfolio, which serves as the money market fund exchange vehicle for the AB mutual funds. You could lose money by investing in the Fund. Although the Fund seeks to preserve the value of your investment at $1.00 per share, it cannot guarantee it will do so. The Fund may impose a fee upon sale of your shares or may temporarily suspend your ability to sell shares if the Fund’s liquidity falls below required minimums because of market conditions or other factors. An investment in the Fund is not insured or guaranteed by the Federal Deposit Insurance Corporation or any other government agency. The Fund’s sponsor has no legal obligation to provide financial support to the Fund, and you should not expect that the sponsor will provide financial support to the Fund at any time.
Investors should consider the investment objectives, risks, charges and expenses of the Fund carefully before investing. For copies of our prospectus or summary prospectus, which contain this and other information, visit us online at www.abfunds.com or contact your AB representative. Please read the prospectus and/or summary prospectus carefully before investing.
| 1 | Prior to July 12, 2019, Total Return Bond Portfolio was named Intermediate Bond Portfolio. |
| | |
| |
| 56 | AB ALL CHINA EQUITY PORTFOLIO | | abfunds.com |
NOTES
| | |
| |
| abfunds.com | | AB ALL CHINA EQUITY PORTFOLIO | 57 |
NOTES
| | |
| |
| 58 | AB ALL CHINA EQUITY PORTFOLIO | | abfunds.com |
NOTES
| | |
| |
| abfunds.com | | AB ALL CHINA EQUITY PORTFOLIO | 59 |
NOTES
| | |
| |
| 60 | AB ALL CHINA EQUITY PORTFOLIO | | abfunds.com |
AB ALL CHINA EQUITY PORTFOLIO
1345 Avenue of the Americas
New York, NY 10105
800 221 5672
ACE-0151-1119 
NOV 11.30.19

ANNUAL REPORT
AB ALL MARKET INCOME PORTFOLIO

Beginning January 1, 2021, as permitted by new regulations adopted by the Securities and Exchange Commission, the Fund’s annual and semi-annual shareholder reports will no longer be sent by mail, unless you specifically request paper copies of the reports. Instead, the reports will be made available on a website, and you will be notified by mail each time a report is posted and provided with a website address to access the report.
If you already elected to receive shareholder reports electronically, you will not be affected by this change and you need not take any action. You may elect to receive shareholder reports and other communications from the Fund electronically at any time by contacting your financial intermediary (such as a broker-dealer or bank) or, if you are a direct investor, by calling the Fund at (800) 221 5672.
You may elect to receive all future reports in paper form free of charge. If you invest through a financial intermediary, you can contact your financial intermediary to request that you continue to receive paper copies of your shareholder reports; if you invest directly with the Fund, you can call the Fund at (800) 221 5672. Your election to receive reports in paper form will apply to all funds held in your account with your financial intermediary or, if you invest directly, to all AB Mutual Funds you hold.
| | |
| |
| Investment Products Offered | | • Are Not FDIC Insured• May Lose Value• Are Not Bank Guaranteed |
Investors should consider the investment objectives, risks, charges and expenses of the Fund carefully before investing. For copies of our prospectus or summary prospectus, which contain this and other information, visit us online at www.abfunds.com or contact your AB representative. Please read the prospectus and/or summary prospectus carefully before investing.
This shareholder report must be preceded or accompanied by the Fund’s prospectus for individuals who are not current shareholders of the Fund.
You may obtain a description of the Fund’s proxy voting policies and procedures, and information regarding how the Fund voted proxies relating to portfolio securities during the most recent12-month period ended June 30, without charge. Simply visit AB’s website at www.abfunds.com, or go to the Securities and Exchange Commission’s (the “Commission”) website at www.sec.gov, or call AB at (800) 227 4618.
The Fund files its complete schedule of portfolio holdings with the Commission for the first and third quarters of each fiscal year as an exhibit to its reports on Form N-PORT. The Fund’s Form N-PORT reports are available on the Commission’s website at www.sec.gov. The Fund’s Forms N-PORT may also be reviewed and copied at the Commission’s Public Reference Room in Washington, DC; information on the operation of the Public Reference Room may be obtained by calling (800) SEC 0330. AB publishes full portfolio holdings for the Fund monthly at www.abfunds.com.
AllianceBernstein Investments, Inc. (ABI) is the distributor of the AB family of mutual funds. ABI is a member of FINRA and is an affiliate of AllianceBernstein L.P., the Adviser of the funds.
The [A/B] logo is a registered service mark of AllianceBernstein and AllianceBernstein® is a registered service mark used by permission of the owner, AllianceBernstein L.P.
| | |
| FROM THE PRESIDENT | |  |
Dear Shareholder,
We are pleased to provide this report for AB All Market Income Portfolio (the “Fund”). Please review the discussion of Fund performance, the market conditions during the reporting period and the Fund’s investment strategy.
As always, AB strives to keep clients ahead of what’s next by:
| + | | Transforming uncommon insights into uncommon knowledge with a global research scope |
| + | | Navigating markets with seasoned investment experience and sophisticated solutions |
| + | | Providing thoughtful investment insights and actionable ideas |
Whether you’re an individual investor or a multi-billion-dollar institution, we put knowledge and experience to work for you.
AB’s global research organization connects and collaborates across platforms and teams to deliver impactful insights and innovative products. Better insights lead to better opportunities—anywhere in the world.
For additional information about AB’s range of products and shareholder resources, please log on to www.abfunds.com.
Thank you for your investment in the AB Mutual Funds.
Sincerely,

Robert M. Keith
President and Chief Executive Officer, AB Mutual Funds
| | |
| |
| abfunds.com | | AB ALL MARKET INCOME PORTFOLIO | 1 |
ANNUAL REPORT
January 13, 2020
This report provides management’s discussion of fund performance for AB All Market Income Portfolio for the annual reporting period ended November 30, 2019.
The Fund’s investment objective is to seek current income with consideration of capital appreciation.
NAV RETURNS AS OF NOVEMBER 30, 2019(unaudited)
| | | | | | | | |
| | |
| | | 6 Months | | | 12 Months | |
| | |
| AB ALL MARKET INCOME PORTFOLIO1 | | | | | | | | |
| | |
| Class A Shares | | | 6.44% | | | | 11.65% | |
| | |
| Class C Shares | | | 6.05% | | | | 10.85% | |
| | |
| Advisor Class Shares2 | | | 6.68% | | | | 12.03% | |
| | |
| Primary Benchmark: MSCI ACWI (net) | | | 12.11% | | | | 13.68% | |
| | |
Bloomberg Barclays Global Aggregate Bond Index
(USD hedged) | | | 3.73% | | | | 10.00% | |
| 1 | The returns shown are based on net asset values calculated for shareholder transactions and may differ from the returns shown in the Financial Highlights, which reflect adjustments made to the net asset values in accordance with accounting principles generally accepted in the United States of America. |
| 2 | Please note that this share class is for investors purchasing shares through accounts established under certainfee-based programs sponsored and maintained by certain broker-dealers and financial intermediaries, institutional pension plans and/or investment advisory clients of, and certain other persons associated with, the Adviser and its affiliates or the Fund. |
INVESTMENT RESULTS
The table above shows the Fund’s performance compared to its primary benchmark, the Morgan Stanley Capital International All Country World Index (“MSCI ACWI”) (net), and the Bloomberg Barclays Global Aggregate Bond Index (USD hedged) for thesix- and12-month periods ended November 30, 2019.
During both periods, all share classes of the Fund underperformed the primary benchmark, but outperformed the Bloomberg Barclays Global Aggregate Bond Index (USD hedged), before sales charges. The Fund’s strategic decision to achieve diversification involved holding assets other than equities; overall, this diversification detracted from performance, relative to theall-equity benchmark, because fixed-income asset classes returned less than equities during both periods.
Within the equity allocation, security selection detracted over both periods, particularly in income equities, which underperformed the market capitalization weighted index. For the12-month period, selection within preferred
| | |
| |
| 2 | AB ALL MARKET INCOME PORTFOLIO | | abfunds.com |
real estate investment trusts and developed equities contributed. For thesix-month period, selection within global and preferred real estate investment trusts contributed. In fixed income, allocations to Treasuries and emerging-market bonds were positive for both periods. Fixed-income holdings underperformed the Bloomberg Barclays Global Aggregate Bond Index during the12-month period but outperformed during thesix-month period.
The Fund utilized derivatives in the form of futures, forwards, interest rate swaps, credit default swaps, total return swaps, inflation (“CPI”) swaps and written options for hedging and investment purposes. For both periods, futures, forwards, interest rate swaps, credit default swaps and total return swaps contributed, while inflation swaps and written options detracted from absolute returns.
MARKET REVIEW AND INVESTMENT STRATEGY
US and international stocks recorded double-digit returns and emerging markets rallied during the12-month period ended November 30, 2019. After declining at the end of 2018, equity markets rebounded dramatically in January as strong corporate earnings and optimism about a trade truce between the US and China calmed investors. Trade war tensions resurfaced, however, and emerging geopolitical pressures increased market volatility. Late in the third quarter, equity market performance was accompanied by a sharp style rotation as quality-growth and lower-volatility stocks, which had performed strongly earlier in the year, lagged and value stocks outperformed. However, for the most part, growth stocks continued to outperform value stocks over the entire period. In November, investors gained confidence that aphase-one trade deal could be reached by the end of the year.
Global fixed-income markets performed strongly over the12-month period. Given their interest-rate sensitivity, long-dated developed-market treasuries and emerging-market sovereign debt were strong performers until September, when interest rates began to trend higher. As spreads remained near historical lows, investment-grade corporate bond returns were also robust, outperforming high-yield bonds. Manufacturing results broadly remained weak but appeared to be stabilizing in the US and China. Inflation remained below target in most developed countries and fell in emerging markets. The US Federal Reserve lowered interest rates three times, and the European Central Bank cut rates to a record low and announced the resumption of quantitative easing. The Reserve Bank of Australia cut interest rates three times to a new low, while the Bank of Japan issued guidance for low interest rates well into 2020. The Bank of Canada maintained interest rates, as the country’s overall economy remained in balance.
The Fund’s Senior Investment Management Team (the “Team”) continues to focus on generating high, stable income with capital growth by investing in global fixed income, global equities andnon-traditional assets. The Team utilizes rigorous quantitative research tools and fundamental expertise across all regions and markets.
| | |
| |
| abfunds.com | | AB ALL MARKET INCOME PORTFOLIO | 3 |
INVESTMENT POLICIES
The Adviser will allocate the Fund’s investments primarily among a broad range of income-producing securities, including common stock of companies that regularly pay dividends (including real estate investment trusts), debt securities (including high-yield debt securities, also known as “junk bonds”), preferred stocks and derivatives related to these types of securities. In addition, the Fund may engage in certain alternative income strategies that generally utilize derivatives to diversify sources of income and manage risk. The Fund pursues a global strategy, typically investing in securities of issuers located in the United States and in other countries throughout the world, including emerging-market countries.
In selecting equity securities for the Fund, the Adviser will focus on securities that have high-dividend yields and are undervalued by the market relative to their long-term earnings potential. The Adviser intends to gain exposure to high-yield debt securities through investment in the AB High Income Fund and may, in the future, gain such exposure through direct investments in high-income securities. It is expected that the Fund will pursue a number of generally derivatives-based alternative investment strategies, such as taking long positions in currency derivatives on higher yielding currencies and/or short positions in currency derivatives on lower yielding currencies.
The Adviser will adjust the Fund’s investment exposure utilizing the Adviser’s Dynamic Asset Allocation (“DAA”) approach. DAA comprises a series of analytical and forecasting tools employed by the Adviser to gauge fluctuations in the risk/return profile of various asset classes. DAA seeks to adjust the Fund’s investment exposure in changing market conditions and thereby reduce overall portfolio volatility by mitigating the effects of market fluctuations, while preserving consistent long-term return potential. For example, the Adviser may seek to reduce the Fund’s risk exposure to one or more asset classes when DAA suggests that market risks relevant to those asset classes are rising but return opportunities are declining. In addition to directly increasing or decreasing asset class exposure by buying or selling securities in that asset class, the Adviser may pursue DAA implementation for the Fund by investing in derivatives and exchange-traded funds (“ETFs”).
The Adviser intends to utilize a variety of derivatives in its management of the Fund. The Adviser may use derivatives to gain exposure to an asset class, such as using interest-rate derivatives to gain exposure to sovereign bonds. As noted above, the Adviser may separately pursue certain alternative investment strategies that utilize derivatives, and
(continued on next page)
| | |
| |
| 4 | AB ALL MARKET INCOME PORTFOLIO | | abfunds.com |
may enter into derivatives in making the adjustments called for by DAA. As a result of the use of derivatives and short sales of securities, the Fund will frequently be leveraged, with gross investment exposure substantially in excess of its net assets.
Currency exchange rate fluctuations can have a dramatic impact on returns. The Fund’s foreign currency exposures will come both from investments in equity and debt securities priced or denominated in foreign currencies and from direct holdings of foreign currencies and currency-related derivatives. The Adviser may seek to hedge all or a portion of the currency exposure resulting from Fund investments or decide not to hedge this exposure. The Adviser may seek investment opportunities by taking long or short positions in currencies through the use of currency-related derivatives.
| | |
| |
| abfunds.com | | AB ALL MARKET INCOME PORTFOLIO | 5 |
DISCLOSURES AND RISKS
Benchmark Disclosure
The MSCI ACWI and the Bloomberg Barclays Global Aggregate Bond Index (USD hedged) are unmanaged and do not reflect fees and expenses associated with the active management of a mutual fund portfolio. The MSCI ACWI (net, free float-adjusted, market capitalization weighted) represents the equity market performance of developed and emerging markets. The Bloomberg Barclays Global Aggregate Bond Index represents the performance of the global investment-grade developed fixed-income markets, hedged to the US dollar. MSCI makes no express or implied warranties or representations and shall have no liability whatsoever with respect to any MSCI data contained herein. The MSCI data may not be further redistributed or used as a basis for other indices or any securities or financial products. This report is not approved, reviewed or produced by MSCI. Net returns include the reinvestment of dividends after deduction ofnon-US withholding tax. An investor cannot invest directly in an index or average, and their results are not indicative of the performance for any specific investment, including the Fund.
A Word About Risk
Credit Risk:An issuer or guarantor of a fixed-income security, or the counterparty to a derivatives or other contract, may be unable or unwilling to make timely payments of interest or principal, or to otherwise honor its obligations. The issuer or guarantor may default, causing a loss of the full principal amount of a security and accrued interest. The degree of risk for a particular security may be reflected in its credit rating. There is the possibility that the credit rating of a fixed-income security may be downgraded after purchase, which may adversely affect the value of the security. Investments in fixed-income securities with lower ratings tend to have a higher probability that an issuer will default or fail to meet its payment obligations.
High-Yield Debt Securities Risk:Investments in fixed-income securities with lower ratings (commonly known as “junk bonds”) tend to have a higher probability that an issuer will default or fail to meet its payment obligations. These securities may be subject to greater price volatility due to such factors as specific corporate developments, interest-rate sensitivity, negative perceptions of the junk bond market generally and less secondary market liquidity.
Interest-Rate Risk:Changes in interest rates will affect the value of investments in fixed-income securities. When interest rates rise, the value of existing investments in fixed-income securities tends to fall and this decrease in value may not be offset by higher income from new investments. Interest-rate risk is generally greater for fixed-income securities with longer maturities or durations.
| | |
| |
| 6 | AB ALL MARKET INCOME PORTFOLIO | | abfunds.com |
DISCLOSURES AND RISKS(continued)
Inflation Risk:This is the risk that the value of assets or income from investments will be less in the future as inflation decreases the value of money. As inflation increases, the value of the Fund’s assets can decline as can the value of the Fund’s distributions. This risk is significantly greater for fixed-income securities with longer maturities.
Foreign(Non-US) Risk:Investments in securities ofnon-US issuers may involve more risk than those of US issuers. These securities may fluctuate more widely in price and may be more difficult to trade or dispose of due to adverse market, economic, political, regulatory or other factors.
Emerging-Market Risk:Investments in emerging-market countries may have more risk because the markets are less developed and less liquid as well as being subject to increased economic, political, regulatory or other uncertainties.
Currency Risk:Fluctuations in currency exchange rates may negatively affect the value of the Fund’s investments or reduce its returns.
Derivatives Risk:Derivatives may be difficult to price or unwind and leveraged so that small changes may produce disproportionate losses for the Fund. Derivatives may also be subject to counterparty risk to a greater degree than more traditional investments.
Short Sale Risk:Short sales involve the risk that the Fund will incur a loss by subsequently buying a security at a higher price than the price at which it sold the security. The amount of such loss is theoretically unlimited, as it will be based on the increase in value of the security sold short. In contrast, the risk of loss from a long position is limited to the Fund’s investment in the security, because the price of the security cannot fall below zero. The Fund may not always be able to close out a short position on favorable terms.
Leverage Risk:To the extent the Fund uses leveraging techniques, its net asset value (“NAV”) may be more volatile because leverage tends to exaggerate the effect of changes in interest rates and any increase or decrease in the value of the Fund’s investments.
Market Risk:The value of the Fund’s assets will fluctuate as the stock or bond market fluctuates. The value of its investments may decline, sometimes rapidly and unpredictably, simply because of economic changes or other events that affect large portions of the market.
Illiquid Investments Risk:Illiquid investments risk exists when certain investments are or become difficult to purchase or sell. Difficulty in selling such investments may result in sales at disadvantageous prices affecting
| | |
| |
| abfunds.com | | AB ALL MARKET INCOME PORTFOLIO | 7 |
DISCLOSURES AND RISKS(continued)
the value of your investment in the Fund. Causes of illiquid investments risk may include low trading volumes and large positions. Foreign fixed-income securities may have more illiquid investments risk because secondary trading markets for these securities may be smaller and less well-developed and the securities may trade less frequently. Illiquid investments risk may be higher in a rising interest-rate environment, when the value and liquidity of fixed-income securities generally go down.
Management Risk:The Fund is subject to management risk because it is an actively managed investment fund. The Adviser will apply its investment techniques and risk analyses in making investment decisions for the Fund, but there is no guarantee that its techniques will produce the intended results.
These risks are fully discussed in the Fund’s prospectus. As with all investments, you may lose money by investing in the Fund.
An Important Note About Historical Performance
The investment return and principal value of an investment in the Fund will fluctuate, so that shares, when redeemed, may be worth more or less than their original cost. Performance shown in this report represents past performance and does not guarantee future results. Current performance may be lower or higher than the performance information shown. You may obtain performance information current to the most recentmonth-end by visiting www.abfunds.com.
All fees and expenses related to the operation of the Fund have been deducted. NAV returns do not reflect sales charges; if sales charges were reflected, the Fund’s quoted performance would be lower. SEC returns reflect the applicable sales charges for each share class: a 4.25% maximumfront-end sales charge for Class A shares and a 1%1-year contingent deferred sales charge for Class C shares. Returns for the different share classes will vary due to different expenses associated with each class. Performance assumes reinvestment of distributions and does not account for taxes.
| | |
| |
| 8 | AB ALL MARKET INCOME PORTFOLIO | | abfunds.com |
HISTORICAL PERFORMANCE
GROWTH OF A $10,000 INVESTMENT IN THE FUND(unaudited)
12/18/20141 TO 11/30/2019
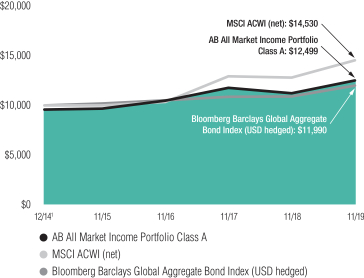
This chart illustrates the total value of an assumed $10,000 investment in AB All Market Income Portfolio Class A shares (from 12/18/20141 to 11/30/2019) as compared to the performance of the Fund’s benchmarks. The chart reflects the deduction of the maximum 4.25% sales charge from the initial $10,000 investment in the Fund and assumes the reinvestment of dividends and capital gains distributions.
| 1 | Inception date: 12/18/2014. |
| | |
| |
| abfunds.com | | AB ALL MARKET INCOME PORTFOLIO | 9 |
HISTORICAL PERFORMANCE(continued)
AVERAGE ANNUAL RETURNS AS OF NOVEMBER 30, 2019(unaudited)
| | | | | | | | |
| | |
| | | NAV Returns | | | SEC Returns
(reflects applicable
sales charges) | |
| | |
| CLASS A SHARES | | | | | | | | |
| | |
| 1 Year | | | 11.65% | | | | 6.94% | |
| | |
| Since Inception1 | | | 5.52% | | | | 4.61% | |
| | |
| CLASS C SHARES | | | | | | | | |
| | |
| 1 Year | | | 10.85% | | | | 9.85% | |
| | |
| Since Inception1 | | | 4.75% | | | | 4.75% | |
| | |
| ADVISOR CLASS SHARES2 | | | | | | | | |
| | |
| 1 Year | | | 12.03% | | | | 12.03% | |
| | |
| Since Inception1 | | | 5.80% | | | | 5.80% | |
The Fund’s current prospectus fee table shows the Fund’s total annual operating expense ratios as 1.63%, 2.39% and 1.38% for Class A, Class C and Advisor Class shares, respectively, gross of any fee waivers or expense reimbursements. Contractual fee waivers and/or expense reimbursements limit the Fund’s annual operating expense ratios exclusive of acquired fund fees and expenses, interest expense, taxes, extraordinary expenses, and brokerage commissions and other transaction costs to 0.99%, 1.74% and 0.74% for Class A, Class C and Advisor Class shares, respectively. These waivers/reimbursements may not be terminated before February 28, 2020 and may be extended by the Adviser for additionalone-year terms. Any fees waived and expenses borne by the Adviser through May 10, 2016 under the expense limitations in effect prior to that date may be reimbursed by the Fund until the end of the third fiscal year after the fiscal period in which the fee was waived or the expense was borne, provided that no reimbursement payment will be made that would cause the Fund’s covered operating expenses to exceed the expense limitation. Absent reimbursements or waivers, performance would have been lower. The Financial Highlights section of this report sets forth expense ratio data for the current reporting period; the expense ratios shown above may differ from the expense ratios in the Financial Highlights section since they are based on different time periods.
| 1 | Inception date: 12/18/2014. |
| 2 | This share class is offered at NAV to eligible investors and the SEC returns are the same as the NAV returns. Please note that this share class is for investors purchasing shares through accounts established under certainfee-based programs sponsored and maintained by certain broker-dealers and financial intermediaries, institutional pension plans and/or investment advisory clients of, and certain other persons associated with, the Adviser and its affiliates or the Fund. |
| | |
| |
| 10 | AB ALL MARKET INCOME PORTFOLIO | | abfunds.com |
HISTORICAL PERFORMANCE(continued)
SEC AVERAGE ANNUAL RETURNS
AS OF THE MOST RECENT CALENDARQUARTER-END
DECEMBER 31, 2019(unaudited)
| | | | |
| |
| | | SEC Returns
(reflects applicable
sales charges) | |
| |
| CLASS A SHARES | | | | |
| |
| 1 Year | | | 13.16% | |
| |
| 5 Years | | | 4.78% | |
| |
| Since Inception1 | | | 4.95% | |
| |
| CLASS C SHARES | | | | |
| |
| 1 Year | | | 16.38% | |
| |
| 5 Years | | | 4.92% | |
| |
| Since Inception1 | | | 5.08% | |
| |
| ADVISOR CLASS SHARES2 | | | | |
| |
| 1 Year | | | 18.62% | |
| |
| 5 Years | | | 5.97% | |
| |
| Since Inception1 | | | 6.13% | |
| 1 | Inception date: 12/18/2014. |
| 2 | Please note that this share class is for investors purchasing shares through accounts established under certainfee-based programs sponsored and maintained by certain broker-dealers and financial intermediaries, institutional pension plans and/or investment advisory clients of, and certain other persons associated with, the Adviser and its affiliates or the Fund. |
| | |
| |
| abfunds.com | | AB ALL MARKET INCOME PORTFOLIO | 11 |
EXPENSE EXAMPLE
(unaudited)
As a shareholder of the Fund, you incur two types of costs: (1) transaction costs, including sales charges (loads) on purchase payments, contingent deferred sales charges on redemptions and (2) ongoing costs, including management fees; distribution (12b-1) fees; and other Fund expenses. This example is intended to help you understand your ongoing costs (in dollars) of investing in the Fund and to compare these costs with the ongoing costs of investing in other mutual funds.
The Example is based on an investment of $1,000 invested at the beginning of the period and held for the entire period as indicated below.
Actual Expenses
The table below provides information about actual account values and actual expenses. You may use the information, together with the amount you invested, to estimate the expenses that you paid over the period. Simply divide your account value by $1,000 (for example, an $8,600 account value divided by $1,000 = 8.6), then multiply the result by the number under the heading entitled “Expenses Paid During Period” to estimate the expenses you paid on your account during this period.
Hypothetical Example for Comparison Purposes
The table below also provides information about hypothetical account values and hypothetical expenses based on the Fund’s actual expense ratio and an assumed annual rate of return of 5% before expenses, which is not the Fund’s actual return. The hypothetical account values and expenses may not be used to estimate the actual ending account balance or expenses you paid for the period. You may use this information to compare the ongoing costs of investing in the Fund and other funds by comparing this 5% hypothetical example with the 5% hypothetical examples that appear in the shareholder reports of other funds.
Please note that the expenses shown in the table are meant to highlight your ongoing costs only and do not reflect any transactional costs, such as sales charges (loads), or contingent deferred sales charges on redemptions. Therefore, the hypothetical example is useful in comparing ongoing costs only, and will not help you determine the relative total costs of owning different funds. In addition, if these transactional costs were included, your costs would have been higher.
| | | | | | | | | | | | | | | | | | | | | | | | |
| | | Beginning
Account
Value
June 1, 2019 | | | Ending
Account
Value
November 30,
2019 | | | Expenses
Paid
During
Period* | | | Annualized
Expense
Ratio* | | | Total
Expenses
Paid
During
Period+ | | | Total
Annualized
Expense
Ratio+ | |
| Class A | | | | | | | | | | | | | | | | | | | | | | | | |
Actual | | $ | 1,000 | | | $ | 1,064.40 | | | $ | 4.04 | | | | 0.78 | % | | $ | 5.23 | | | | 1.01 | % |
Hypothetical** | | $ | 1,000 | | | $ | 1,021.16 | | | $ | 3.95 | | | | 0.78 | % | | $ | 5.11 | | | | 1.01 | % |
| | |
| |
| 12 | AB ALL MARKET INCOME PORTFOLIO | | abfunds.com |
EXPENSE EXAMPLE(continued)
| | | | | | | | | | | | | | | | | | | | | | | | |
| | | Beginning
Account
Value
June 1, 2019 | | | Ending
Account
Value
November 30,
2019 | | | Expenses
Paid
During
Period* | | | Annualized
Expense
Ratio* | | | Total
Expenses
Paid
During
Period+ | | | Total
Annualized
Expense
Ratio+ | |
| Class C | | | | | | | | | | | | | | | | | | | | | | | | |
Actual | | $ | 1,000 | | | $ | 1,060.50 | | | $ | 7.90 | | | | 1.53 | % | | $ | 9.09 | | | | 1.76 | % |
Hypothetical** | | $ | 1,000 | | | $ | 1,017.40 | | | $ | 7.74 | | | | 1.53 | % | | $ | 8.90 | | | | 1.76 | % |
| Advisor Class | | | | | | | | | | | | | | | | | | | | | | | | |
Actual | | $ | 1,000 | | | $ | 1,066.80 | | | $ | 2.75 | | | | 0.53 | % | | $ | 3.94 | | | | .76 | % |
Hypothetical** | | $ | 1,000 | | | $ | 1,022.41 | | | $ | 2.69 | | | | 0.53 | % | | $ | 3.85 | | | | .76 | % |
| * | Expenses are equal to the classes’ annualized expense ratios, multiplied by the average account value over the period, multiplied by 183/365 (to reflect theone-half year period), respectively. |
| ** | Assumes 5% annual return before expenses. |
| + | In connection with the Fund’s investments in affiliated/unaffiliated underlying portfolios, the Fund incurs no direct expenses, but bears proportionate shares of the acquired fund fees and expenses (i.e., operating, administrative and investment advisory fees) of the affiliated/unaffiliated underlying portfolios. Currently the Adviser has contractually agreed to waive its fees from the Fund in an amount equal to the Fund’s pro rata share of certain acquired fund fees and expenses of the affiliated underlying portfolios and other expenses of AB High Income Fund. The Fund’s effective expenses are equal to the classes’ annualized expense ratio plus the Fund’s pro rata share of the weighted average expense ratio of the affiliated/unaffiliated underlying portfolios in which it invests, multiplied by the average account value over the period, multiplied by 183/365 (to reflect theone-half year period). |
| | |
| |
| abfunds.com | | AB ALL MARKET INCOME PORTFOLIO | 13 |
PORTFOLIO SUMMARY
November 30, 2019(unaudited)
PORTFOLIO STATISTICS
Net Assets ($mil): $108.1
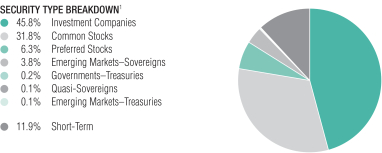
TEN LARGEST HOLDINGS2
| | | | | | | | |
| | |
| Security | | U.S. $ Value | | | Percent of
Net Assets | |
| | |
| AB High Income Fund, Inc. – Class Z | | $ | 38,946,747 | | | | 36.0 | % |
| | |
| JPMorgan Alerian MLP Index ETN | | | 2,560,338 | | | | 2.4 | |
| | |
| iShares Mortgage Real Estate ETF | | | 2,422,075 | | | | 2.2 | |
| | |
| Financial Select Sector SPDR Fund | | | 1,138,012 | | | | 1.1 | |
| | |
| Vanguard Real Estate ETF | | | 1,118,236 | | | | 1.0 | |
| | |
| iShares International Developed Real Estate ETF | | | 965,405 | | | | 0.9 | |
| | |
| Apple, Inc. | | | 715,695 | | | | 0.7 | |
| | |
| Microsoft Corp. | | | 699,224 | | | | 0.6 | |
| | |
| Invesco KBW Premium Yield Equity REIT ETF | | | 509,460 | | | | 0.5 | |
| | |
| Vornado Realty Trust | | | 429,053 | | | | 0.4 | |
| | |
| | $ | 49,504,245 | | | | 45.8 | % |
| 1 | All data are as of November 30, 2019. The Fund’s security type breakdown is expressed as a percentage of total investments (excluding security lending collateral) and may vary over time. The Fund also enters into derivative transactions, which may be used for hedging or investment purposes (see “Portfolio of Investments” section of the report for additional details). |
| | |
| |
| 14 | AB ALL MARKET INCOME PORTFOLIO | | abfunds.com |
PORTFOLIO OF INVESTMENTS
November 30, 2019
| | | | | | | | | | | | |
| Company | | | | | Shares | | | U.S. $ Value | |
| |
INVESTMENT COMPANIES – 44.1% | | | | | | | | | | | | |
Funds and Investment Trusts – 44.1%(a) | | | | | | | | | | | | |
AB High Income Fund, Inc. – Class Z(b) | | | | | | | 4,749,603 | | | $ | 38,946,747 | |
Financial Select Sector SPDR Fund | | | | | | | 37,745 | | | | 1,138,012 | |
Invesco KBW Premium Yield Equity REIT ETF | | | | | | | 16,230 | | | | 509,460 | |
iShares International Developed Real Estate ETF | | | | | | | 31,663 | | | | 965,405 | |
iShares Mortgage Real Estate ETF(c) | | | | | | | 55,160 | | | | 2,422,075 | |
JPMorgan Alerian MLP Index ETN(c) | | | | | | | 127,127 | | | | 2,560,338 | |
Vanguard Real Estate ETF | | | | | | | 12,015 | | | | 1,118,236 | |
| | | | | | | | | | | | |
| | | |
Total Investment Companies
(cost $49,586,940) | | | | | | | | | | | 47,660,273 | |
| | | | | | | | | | | | |
| | | | | | | | | | | | |
COMMON STOCKS – 30.6% | | | | | | | | | | | | |
Financials – 5.5% | | | | | | | | | | | | |
Banks – 1.5% | | | | | | | | | | | | |
Bank LeumiLe-Israel BM | | | | | | | 6,080 | | | | 44,064 | |
Bank of America Corp. | | | | | | | 1,673 | | | | 55,744 | |
BNP Paribas SA | | | | | | | 1,781 | | | | 99,846 | |
CIT Group, Inc. | | | | | | | 2,815 | | | | 128,139 | |
Citigroup, Inc. | | | | | | | 3,604 | | | | 270,732 | |
DBS Group Holdings Ltd. | | | | | | | 1,200 | | | | 22,146 | |
DNB ASA | | | | | | | 730 | | | | 12,246 | |
Fifth Third Bancorp | | | | | | | 1,152 | | | | 34,779 | |
Hang Seng Bank Ltd. | | | | | | | 500 | | | | 10,193 | |
Intesa Sanpaolo SpA | | | | | | | 70,812 | | | | 179,169 | |
JPMorgan Chase & Co. | | | | | | | 1,210 | | | | 159,429 | |
KBC Group NV | | | | | | | 328 | | | | 23,875 | |
Nordea Bank Abp | | | | | | | 23,519 | | | | 166,587 | |
PNC Financial Services Group, Inc. (The) | | | | | | | 190 | | | | 29,110 | |
Royal Bank of Canada | | | | | | | 378 | | | | 30,942 | |
Societe Generale SA | | | | | | | 5,429 | | | | 170,613 | |
Swedbank AB – Class A | | | | | | | 11,124 | | | | 144,853 | |
Toronto-Dominion Bank (The) | | | | | | | 583 | | | | 33,616 | |
Wells Fargo & Co. | | | | | | | 210 | | | | 11,437 | |
Westpac Banking Corp. | | | | | | | 2,438 | | | | 40,677 | |
| | | | | | | | | | | | |
| | | | | | | | | | | 1,668,197 | |
| | | | | | | | | | | | |
Capital Markets – 1.1% | | | | | | | | | | | | |
Ameriprise Financial, Inc. | | | | | | | 1,071 | | | | 175,505 | |
CME Group, Inc. – Class A | | | | | | | 125 | | | | 25,341 | |
Daiwa Securities Group, Inc.(c) | | | | | | | 28,200 | | | | 143,068 | |
IGM Financial, Inc. | | | | | | | 5,405 | | | | 155,440 | |
Investec PLC | | | | | | | 24,247 | | | | 137,425 | |
Moody’s Corp. | | | | | | | 817 | | | | 185,189 | |
Nomura Holdings, Inc. | | | | | | | 34,900 | | | | 178,879 | |
| | |
| |
| abfunds.com | | AB ALL MARKET INCOME PORTFOLIO | 15 |
PORTFOLIO OF INVESTMENTS(continued)
| | | | | | | | | | | | |
| Company | | | | | Shares | | | U.S. $ Value | |
| |
Partners Group Holding AG | | | | | | | 32 | | | $ | 26,987 | |
S&P Global, Inc. | | | | | | | 755 | | | | 199,811 | |
| | | | | | | | | | | | |
| | | | | | | | | | | 1,227,645 | |
| | | | | | | | | | | | |
| | | |
Consumer Finance – 0.2% | | | | | | | | | | | | |
Ally Financial, Inc. | | | | | | | 5,267 | | | | 167,701 | |
| | | | | | | | | | | | |
| | | |
Diversified Financial Services – 0.2% | | | | | | | | | | | | |
Berkshire Hathaway, Inc. – Class B(d) | | | | | | | 177 | | | | 38,993 | |
Voya Financial, Inc. | | | | | | | 2,800 | | | | 163,184 | |
| | | | | | | | | | | | |
| | | | | | | | | | | 202,177 | |
| | | | | | | | | | | | |
Insurance – 2.2% | | | | | | | | | | | | |
Admiral Group PLC | | | | | | | 750 | | | | 20,735 | |
Aegon NV | | | | | | | 17,588 | | | | 79,206 | |
American Financial Group, Inc./OH | | | | | | | 218 | | | | 23,917 | |
American International Group, Inc. | | | | | | | 270 | | | | 14,218 | |
Aviva PLC | | | | | | | 23,705 | | | | 123,640 | |
Fidelity National Financial, Inc. | | | | | | | 810 | | | | 38,580 | |
Gjensidige Forsikring ASA | | | | | | | 2,601 | | | | 48,916 | |
iA Financial Corp., Inc. | | | | | | | 3,095 | | | | 158,443 | |
Japan Post Holdings Co., Ltd. | | | | | | | 13,400 | | | | 126,047 | |
Legal & General Group PLC | | | | | | | 44,301 | | | | 160,767 | |
Manulife Financial Corp. | | | | | | | 9,120 | | | | 179,406 | |
MetLife, Inc. | | | | | | | 3,645 | | | | 181,922 | |
Poste Italiane SpA(e) | | | | | | | 12,442 | | | | 145,039 | |
Power Corp. of Canada | | | | | | | 6,734 | | | | 163,445 | |
Power Financial Corp. | | | | | | | 6,417 | | | | 156,910 | |
Principal Financial Group, Inc. | | | | | | | 2,809 | | | | 154,776 | |
Progressive Corp. (The) | | | | | | | 340 | | | | 24,837 | |
Prudential Financial, Inc. | | | | | | | 1,764 | | | | 165,146 | |
Reinsurance Group of America, Inc. – Class A | | | | | | | 125 | | | | 20,682 | |
RenaissanceRe Holdings Ltd. | | | | | | | 14 | | | | 2,637 | |
Sampo Oyj – Class A | | | | | | | 570 | | | | 23,049 | |
Suncorp Group Ltd.(c) | | | | | | | 13,370 | | | | 121,122 | |
Swiss Re AG | | | | | | | 135 | | | | 14,623 | |
Zurich Insurance Group AG | | | | | | | 548 | | | | 215,065 | |
| | | | | | | | | | | | |
| | | | | | | | | | | 2,363,128 | |
| | | | | | | | | | | | |
Mortgage Real Estate Investment Trusts (REITs) – 0.3% | | | | | | | | | | | | |
AGNC Investment Corp. | | | | | | | 9,753 | | | | 168,922 | |
Annaly Capital Management, Inc. | | | | | | | 13,005 | | | | 121,337 | |
| | | | | | | | | | | | |
| | | | | | | | | | | 290,259 | |
| | | | | | | | | | | | |
| | | |
Thrifts & Mortgage Finance – 0.0% | | | | | | | | | | | | |
Essent Group Ltd. | | | | | | | 46 | | | | 2,514 | |
| | | | | | | | | | | | |
| | | | | | | | | | | 5,921,621 | |
| | | | | | | | | | | | |
| | |
| |
| 16 | AB ALL MARKET INCOME PORTFOLIO | | abfunds.com |
PORTFOLIO OF INVESTMENTS(continued)
| | | | | | | | | | | | |
| Company | | | | | Shares | | | U.S. $ Value | |
| |
Information Technology – 5.4% | | | | | | | | | | | | |
Communications Equipment – 0.1% | | | | | | | | | | | | |
Juniper Networks, Inc. | | | | | | | 1,917 | | | $ | 48,040 | |
| | | | | | | | | | | | |
| | | |
Electronic Equipment, Instruments & Components – 0.1% | | | | | | | | | | | | |
Hitachi Ltd. | | | | | | | 3,800 | | | | 149,659 | |
| | | | | | | | | | | | |
| | | |
IT Services – 1.3% | | | | | | | | | | | | |
Amadeus IT Group SA – Class A | | | | | | | 275 | | | | 21,880 | |
Automatic Data Processing, Inc. | | | | | | | 1,450 | | | | 247,631 | |
Booz Allen Hamilton Holding Corp. | | | | | | | 370 | | | | 26,921 | |
Broadridge Financial Solutions, Inc. | | | | | | | 1,242 | | | | 153,648 | |
Capgemini SE | | | | | | | 166 | | | | 19,637 | |
Fidelity National Information Services, Inc.(f) | | | | | | | 140 | | | | 19,341 | |
Global Payments, Inc. | | | | | | | 78 | | | | 14,126 | |
Leidos Holdings, Inc. | | | | | | | 578 | | | | 52,506 | |
Mastercard, Inc. – Class A | | | | | | | 1,229 | | | | 359,150 | |
Paychex, Inc.(f) | | | | | | | 2,427 | | | | 209,014 | |
Visa, Inc. – Class A | | | | | | | 504 | | | | 92,993 | |
Western Union Co. (The) – Class W(c) | | | | | | | 5,847 | | | | 157,167 | |
| | | | | | | | | | | | |
| | | | | | | | | | | 1,374,014 | |
| | | | | | | | | | | | |
Semiconductors & Semiconductor Equipment – 1.2% | | | | | | | | | | | | |
Applied Materials, Inc. | | | | | | | 3,380 | | | | 195,702 | |
Intel Corp.(f) | | | | | | | 5,631 | | | | 326,879 | |
KLA Corp. | | | | | | | 979 | | | | 160,419 | |
Lam Research Corp. | | | | | | | 680 | | | | 181,444 | |
QUALCOMM, Inc. | | | | | | | 2,520 | | | | 210,546 | |
Texas Instruments, Inc. | | | | | | | 2,003 | | | | 240,781 | |
| | | | | | | | | | | | |
| | | | | | | | | | | 1,315,771 | |
| | | | | | | | | | | | |
Software – 1.8% | | | | | | | | | | | | |
Cadence Design Systems, Inc.(d) | | | | | | | 2,490 | | | | 174,922 | |
Check Point Software Technologies Ltd.(d) | | | | | | | 341 | | | | 40,197 | |
Citrix Systems, Inc. – Class C | | | | | | | 160 | | | | 18,050 | |
Constellation Software, Inc./Canada | | | | | | | 35 | | | | 37,417 | |
Fortinet, Inc.(d) | | | | | | | 340 | | | | 35,737 | |
Intuit, Inc. | | | | | | | 155 | | | | 40,128 | |
Micro Focus International PLC | | | | | | | 7,378 | | | | 108,122 | |
Microsoft Corp. | | | | | | | 4,619 | | | | 699,224 | |
Nice Ltd.(d) | | | | | | | 277 | | | | 41,954 | |
Oracle Corp.(f) | | | | | | | 766 | | | | 43,003 | |
Oracle Corp. Japan | | | | | | | 400 | | | | 36,834 | |
Paycom Software, Inc.(d) | | | | | | | 675 | | | | 186,847 | |
ServiceNow, Inc.(d) | | | | | | | 744 | | | | 210,582 | |
| | |
| |
| abfunds.com | | AB ALL MARKET INCOME PORTFOLIO | 17 |
PORTFOLIO OF INVESTMENTS(continued)
| | | | | | | | | | | | |
| Company | | | | | Shares | | | U.S. $ Value | |
| |
SS&C Technologies Holdings, Inc. | | | | | | | 2,550 | | | $ | 153,128 | |
Synopsys, Inc.(d) | | | | | | | 1,186 | | | | 167,273 | |
| | | | | | | | | | | | |
| | | | | | | | | | | 1,993,418 | |
| | | | | | | | | | | | |
Technology Hardware, Storage & Peripherals – 0.9% | | | | | | | | | | | | |
Apple, Inc.(f) | | | | | | | 2,678 | | | | 715,695 | |
HP, Inc. | | | | | | | 1,658 | | | | 33,293 | |
Seagate Technology PLC | | | | | | | 2,964 | | | | 176,892 | |
| | | | | | | | | | | | |
| | | | | | | | | | | 925,880 | |
| | | | | | | | | | | | |
| | | | | | | | | | | 5,806,782 | |
| | | | | | | | | | | | |
Consumer Discretionary – 3.0% | | | | | | | | | | | | |
Auto Components – 0.1% | | | | | | | | | | | | |
Aisin Seiki Co., Ltd. | | | | | | | 2,200 | | | | 83,278 | |
| | | | | | | | | | | | |
| | | |
Automobiles – 0.5% | | | | | | | | | | | | |
Fiat Chrysler Automobiles NV | | | | | | | 10,362 | | | | 152,506 | |
Ford Motor Co. | | | | | | | 19,179 | | | | 173,762 | |
Nissan Motor Co., Ltd. | | | | | | | 25,200 | | | | 155,610 | |
| | | | | | | | | | | | |
| | | | | | | | | | | 481,878 | |
| | | | | | | | | | | | |
Diversified Consumer Services – 0.2% | | | | | | | | | | | | |
H&R Block, Inc.(c) | | | | | | | 6,260 | | | | 152,619 | |
| | | | | | | | | | | | |
| | | |
Hotels, Restaurants & Leisure – 0.3% | | | | | | | | | | | | |
Aristocrat Leisure Ltd. | | | | | | | 1,537 | | | | 35,300 | |
Compass Group PLC | | | | | | | 550 | | | | 13,476 | |
Las Vegas Sands Corp. | | | | | | | 2,512 | | | | 157,628 | |
McDonald’s Corp. | | | | | | | 133 | | | | 25,866 | |
Starbucks Corp. | | | | | | | 1,431 | | | | 122,250 | |
| | | | | | | | | | | | |
| | | | | | | | | | | 354,520 | |
| | | | | | | | | | | | |
Household Durables – 0.6% | | | | | | | | | | | | |
Auto Trader Group PLC | | | | | | | 3,870 | | | | 28,110 | |
Barratt Developments PLC | | | | | | | 18,344 | | | | 158,147 | |
Lennar Corp. – Class A | | | | | | | 2,850 | | | | 170,003 | |
Persimmon PLC | | | | | | | 5,164 | | | | 170,764 | |
Whirlpool Corp. | | | | | | | 1,012 | | | | 144,817 | |
| | | | | | | | | | | | |
| | | | | | | | | | | 671,841 | |
| | | | | | | | | | | | |
Internet & Direct Marketing Retail – 0.3% | | | | | | | | | | | | |
Amazon.com, Inc.(d)(f) | | | | | | | 201 | | | | 361,961 | |
| | | | | | | | | | | | |
| | | |
Leisure Products – 0.1% | | | | | | | | | | | | |
Polaris, Inc. | | | | | | | 1,550 | | | | 151,435 | |
| | | | | | | | | | | | |
| | | |
Multiline Retail – 0.4% | | | | | | | | | | | | |
Dollar General Corp. | | | | | | | 222 | | | | 34,934 | |
Harvey Norman Holdings Ltd.(c) | | | | | | | 51,754 | | | | 150,772 | |
| | |
| |
| 18 | AB ALL MARKET INCOME PORTFOLIO | | abfunds.com |
PORTFOLIO OF INVESTMENTS(continued)
| | | | | | | | | | |
| Company | | | | Shares | | | U.S. $ Value | |
| |
Next PLC | | | | | 798 | | | $ | 69,726 | |
Target Corp. | | | | | 267 | | | | 33,378 | |
Wesfarmers Ltd. | | | | | 6,482 | | | | 186,380 | |
| | | | | | | | | | |
| | | | | | | | | 475,190 | |
| | | | | | | | | | |
Specialty Retail – 0.3% | | | | | | | | | | |
AutoZone, Inc.(d) | | | | | 25 | | | | 29,448 | |
Hennes & Mauritz AB – Class B(c) | | | | | 2,593 | | | | 50,049 | |
Home Depot, Inc. (The)(f) | | | | | 252 | | | | 55,569 | |
O’Reilly Automotive, Inc.(d) | | | | | 387 | | | | 171,162 | |
Ross Stores, Inc.(f) | | | | | 386 | | | | 44,834 | |
TJX Cos., Inc. (The) | | | | | 233 | | | | 14,243 | |
| | | | | | | | | | |
| | | | | | | | | 365,305 | |
| | | | | | | | | | |
Textiles, Apparel & Luxury Goods – 0.2% | | | | | | | | | | |
adidas AG | | | | | 496 | | | | 154,521 | |
Deckers Outdoor Corp.(d) | | | | | 131 | | | | 22,032 | |
Pandora A/S | | | | | 664 | | | | 26,730 | |
| | | | | | | | | | |
| | | | | | | | | 203,283 | |
| | | | | | | | | | |
| | | | | | | | | 3,301,310 | |
| | | | | | | | | | |
Health Care – 2.9% | | | | | | | | | | |
Biotechnology – 0.8% | | | | | | | | | | |
Alnylam Pharmaceuticals, Inc.(d) | | | | | 1,790 | | | | 209,681 | |
Amgen, Inc. | | | | | 1,108 | | | | 260,070 | |
Exact Sciences Corp.(c)(d) | | | | | 1,722 | | | | 139,499 | |
Gilead Sciences, Inc. | | | | | 3,260 | | | | 219,202 | |
Seattle Genetics, Inc.(d) | | | | | 240 | | | | 28,884 | |
Vertex Pharmaceuticals, Inc.(d) | | | | | 155 | | | | 34,371 | |
| | | | | | | | | | |
| | | | | | | | | 891,707 | |
| | | | | | | | | | |
Health Care Equipment & Supplies – 0.8% | | | | | | | | | | |
Baxter International, Inc. | | | | | 2,262 | | | | 185,416 | |
Coloplast A/S – Class B | | | | | 854 | | | | 100,896 | |
Edwards Lifesciences Corp.(d) | | | | | 819 | | | | 200,606 | |
ResMed, Inc. | | | | | 1,180 | | | | 176,528 | |
Stryker Corp. | | | | | 901 | | | | 184,579 | |
| | | | | | | | | | |
| | | | | | | | | 848,025 | |
| | | | | | | | | | |
Health Care Providers & Services – 0.1% | | | | | | | | | | |
Anthem, Inc.(f) | | | | | 73 | | | | 21,072 | |
Galenica AG(d)(e) | | | | | 360 | | | | 21,660 | |
UnitedHealth Group, Inc.(f) | | | | | 219 | | | | 61,292 | |
| | | | | | | | | | |
| | | | | | | | | 104,024 | |
| | | | | | | | | | |
Health Care Technology – 0.1% | | | | | | | | | | |
Cerner Corp. | | | | | 2,249 | | | | 161,006 | |
| | | | | | | | | | |
| | |
| |
| abfunds.com | | AB ALL MARKET INCOME PORTFOLIO | 19 |
PORTFOLIO OF INVESTMENTS(continued)
| | | | | | | | | | | | |
| Company | | | | | Shares | | | U.S. $ Value | |
| |
Life Sciences Tools & Services – 0.1% | | | | | | | | | | | | |
Agilent Technologies, Inc. | | | | | | | 765 | | | $ | 61,789 | |
| | | | | | | | | | | | |
| | | |
Pharmaceuticals – 1.0% | | | | | | | | | | | | |
Astellas Pharma, Inc. | | | | | | | 3,800 | | | | 64,876 | |
Bristol-Myers Squibb Co. | | | | | | | 447 | | | | 25,452 | |
Eli Lilly & Co. | | | | | | | 1,285 | | | | 150,795 | |
GlaxoSmithKline PLC | | | | | | | 221 | | | | 5,021 | |
Johnson & Johnson | | | | | | | 1,083 | | | | 148,902 | |
Merck & Co., Inc.(f) | | | | | | | 3,898 | | | | 339,828 | |
Novo Nordisk A/S – Class B | | | | | | | 514 | | | | 28,893 | |
Pfizer, Inc.(f) | | | | | | | 628 | | | | 24,191 | |
Roche Holding AG | | | | | | | 184 | | | | 56,726 | |
Zoetis, Inc. | | | | | | | 1,647 | | | | 198,496 | |
| | | | | | | | | | | | |
| | | | | | | | | | | 1,043,180 | |
| | | | | | | | | | | | |
| | | | | | | | | | | 3,109,731 | |
| | | | | | | | | | | | |
Industrials – 2.6% | | | | | | | | | | | | |
Aerospace & Defense – 0.1% | | | | | | | | | | | | |
Airbus SE | | | | | | | 91 | | | | 13,372 | |
BAE Systems PLC | | | | | | | 2,424 | | | | 17,951 | |
L3Harris Technologies, Inc. | | | | | | | 142 | | | | 28,555 | |
MTU Aero Engines AG | | | | | | | 49 | | | | 13,265 | |
| | | | | | | | | | | | |
| | | | | | | | | | | 73,143 | |
| | | | | | | | | | | | |
Air Freight & Logistics – 0.2% | | | | | | | | | | | | |
CH Robinson Worldwide, Inc. | | | | | | | 120 | | | | 9,222 | |
Kuehne & Nagel International AG | | | | | | | 990 | | | | 160,907 | |
SG Holdings Co., Ltd. | | | | | | | 700 | | | | 16,807 | |
| | | | | | | | | | | | |
| | | | | | | | | | | 186,936 | |
| | | | | | | | | | | | |
Airlines – 0.1% | | | | | | | | | | | | |
Air Canada(d) | | | | | | | 470 | | | | 17,710 | |
Qantas Airways Ltd. | | | | | | | 8,714 | | | | 43,100 | |
| | | | | | | | | | | | |
| | | | | | | | | | | 60,810 | |
| | | | | | | | | | | | |
Building Products – 0.1% | | | | | | | | | | | | |
LIXIL Group Corp.(c) | | | | | | | 8,200 | | | | 138,628 | |
| | | | | | | | | | | | |
| | | |
Commercial Services & Supplies – 0.0% | | | | | | | | | | | | |
Republic Services, Inc. – Class A | | | | | | | 174 | | | | 15,425 | |
| | | | | | | | | | | | |
| | | |
Construction & Engineering – 0.2% | | | | | | | | | | | | |
Obayashi Corp. | | | | | | | 8,100 | | | | 85,904 | |
Skanska AB – Class B | | | | | | | 5,510 | | | | 121,750 | |
| | | | | | | | | | | | |
| | | | | | | | | | | 207,654 | |
| | | | | | | | | | | | |
Electrical Equipment – 0.1% | | | | | | | | | | | | |
Eaton Corp. PLC | | | | | | | 1,708 | | | | 157,990 | |
| | | | | | | | | | | | |
| | |
| |
| 20 | AB ALL MARKET INCOME PORTFOLIO | | abfunds.com |
PORTFOLIO OF INVESTMENTS(continued)
| | | | | | | | | | | | |
| Company | | | | | Shares | | | U.S. $ Value | |
| |
Machinery – 0.8% | | | | | | | | | | | | |
Caterpillar, Inc. | | | | | | | 269 | | | $ | 38,932 | |
Cummins, Inc. | | | | | | | 814 | | | | 148,848 | |
JTEKT Corp. | | | | | | | 4,700 | | | | 58,468 | |
Metso Oyj | | | | | | | 4,074 | | | | 156,208 | |
Mitsubishi Heavy Industries Ltd. | | | | | | | 4,100 | | | | 156,992 | |
PACCAR, Inc. | | | | | | | 2,195 | | | | 178,607 | |
Volvo AB – Class B | | | | | | | 10,755 | | | | 166,272 | |
| | | | | | | | | | | | |
| | | | | | | | | | | 904,327 | |
| | | | | | | | | | | | |
Marine – 0.1% | | | | | | | | | | | | |
Mitsui OSK Lines Ltd. | | | | | | | 5,700 | | | | 149,571 | |
| | | | | | | | | | | | |
| | | |
Professional Services – 0.2% | | | | | | | | | | | | |
Experian PLC | | | | | | | 810 | | | | 26,869 | |
Randstad NV | | | | | | | 2,652 | | | | 154,397 | |
RELX PLC | | | | | | | 1,553 | | | | 37,624 | |
Wolters Kluwer NV | | | | | | | 446 | | | | 32,033 | |
| | | | | | | | | | | | |
| | | | | | | | | | | 250,923 | |
| | | | | | | | | | | | |
Road & Rail – 0.1% | | | | | | | | | | | | |
Nippon Express Co., Ltd. | | | | | | | 1,700 | | | | 107,893 | |
| | | | | | | | | | | | |
| | | |
Trading Companies & Distributors – 0.3% | | | | | | | | | | | | |
AerCap Holdings NV(d) | | | | | | | 2,660 | | | | 164,414 | |
Fastenal Co. | | | | | | | 3,309 | | | | 117,536 | |
| | | | | | | | | | | | |
| | | | | | | | | | | 281,950 | |
| | | | | | | | | | | | |
Transportation Infrastructure – 0.3% | | | | | | | | | | | | |
Aena SME SA(e) | | | | | | | 833 | | | | 152,850 | |
Sydney Airport | | | | | | | 26,300 | | | | 163,506 | |
| | | | | | | | | | | | |
| | | | | | | | | | | 316,356 | |
| | | | | | | | | | | | |
| | | | | | | | | | | 2,851,606 | |
| | | | | | | | | | | | |
Energy – 2.5% | | | | | | | | | | | | |
Oil, Gas & Consumable Fuels – 2.5% | | | | | | | | | | | | |
BP PLC (Sponsored ADR) | | | | | | | 9,288 | | | | 347,557 | |
Chevron Corp. | | | | | | | 3,333 | | | | 390,394 | |
Exxon Mobil Corp. | | | | | | | 5,989 | | | | 408,030 | |
HollyFrontier Corp. | | | | | | | 3,020 | | | | 155,681 | |
LUKOIL PJSC (Sponsored ADR) | | | | | | | 3,864 | | | | 368,162 | |
Marathon Petroleum Corp. | | | | | | | 2,840 | | | | 172,218 | |
Repsol SA | | | | | | | 1,222 | | | | 19,238 | |
Royal Dutch Shell PLC (ADR) | | | | | | | 5,302 | | | | 304,812 | |
Royal Dutch Shell PLC – Class B | | | | | | | 1,455 | | | | 41,273 | |
TOTAL SA | | | | | | | 6,947 | | | | 364,404 | |
Vermilion Energy, Inc.(c) | | | | | | | 8,679 | | | | 124,798 | |
| | | | | | | | | | | | |
| | | | | | | | | | | 2,696,567 | |
| | | | | | | | | | | | |
| | |
| |
| abfunds.com | | AB ALL MARKET INCOME PORTFOLIO | 21 |
PORTFOLIO OF INVESTMENTS(continued)
| | | | | | | | | | | | |
| Company | | | | | Shares | | | U.S. $ Value | |
| |
Communication Services – 2.2% | | | | | | | | | | | | |
Diversified Telecommunication Services – 1.5% | | | | | | | | | | | | |
Altice USA, Inc. – Class A(d) | | | | | | | 1,381 | | | $ | 35,326 | |
AT&T, Inc.(f) | | | | | | | 8,796 | | | | 328,794 | |
BCE, Inc. | | | | | | | 1,462 | | | | 70,376 | |
BT Group PLC | | | | | | | 15,162 | | | | 37,537 | |
CenturyLink, Inc. | | | | | | | 11,310 | | | | 163,882 | |
Cogeco Communications, Inc. | | | | | | | 150 | | | | 12,956 | |
Comcast Corp. – Class A | | | | | | | 765 | | | | 33,775 | |
Elisa Oyj | | | | | | | 3,098 | | | | 165,583 | |
Eutelsat Communications SA(c) | | | | | | | 7,844 | | | | 128,680 | |
HKT Trust & HKT Ltd. – Class SS | | | | | | | 17,000 | | | | 24,932 | |
Nippon Telegraph & Telephone Corp. | | | | | | | 600 | | | | 30,311 | |
Telecom Italia SpA/Milano (Savings Shares) | | | | | | | 230,220 | | | | 141,650 | |
Telenor ASA | | | | | | | 9,153 | | | | 167,112 | |
Verizon Communications, Inc. | | | | | | | 5,240 | | | | 315,658 | |
| | | | | | | | | | | | |
| | | | | | | | | | | 1,656,572 | |
| | | | | | | | | | | | |
Entertainment – 0.1% | | | | | | | | | | | | |
Daiichikosho Co., Ltd. | | | | | | | 200 | | | | 9,913 | |
Live Nation Entertainment, Inc.(d) | | | | | | | 693 | | | | 48,378 | |
Walt Disney Co. (The) | | | | | | | 181 | | | | 27,436 | |
| | | | | | | | | | | | |
| | | | | | | | | | | 85,727 | |
| | | | | | | | | | | | |
Interactive Media & Services – 0.4% | | | | | | | | | | | | |
Alphabet, Inc. – Class A(d)(f) | | | | | | | 88 | | | | 114,760 | |
Alphabet, Inc. – Class C(d)(f) | | | | | | | 114 | | | | 148,765 | |
Facebook, Inc. – Class A(d)(f) | | | | | | | 930 | | | | 187,525 | |
| | | | | | | | | | | | |
| | | | | | | | | | | 451,050 | |
| | | | | | | | | | | | |
Media – 0.2% | | | | | | | | | | | | |
Omnicom Group, Inc.(c) | | | | | | | 1,911 | | | | 151,886 | |
| | | | | | | | | | | | |
| | | | | | | | | | | 2,345,235 | |
| | | | | | | | | | | | |
Consumer Staples – 2.0% | | | | | | | | | | | | |
Beverages – 0.6% | | | | | | | | | | | | |
Carlsberg A/S – Class B | | | | | | | 1,081 | | | | 155,516 | |
Coca-Cola Amatil Ltd. | | | | | | | 7,790 | | | | 59,989 | |
Coca-Cola Co. (The) | | | | | | | 179 | | | | 9,559 | |
Coca-Cola European Partners PLC | | | | | | | 1,268 | | | | 63,983 | |
PepsiCo, Inc. | | | | | | | 2,262 | | | | 307,247 | |
| | | | | | | | | | | | |
| | | | | | | | | | | 596,294 | |
| | | | | | | | | | | | |
Food & Staples Retailing – 0.1% | | | | | | | | | | | | |
Casino Guichard Perrachon SA(c) | | | | | | | 823 | | | | 36,217 | |
Koninklijke Ahold Delhaize NV | | | | | | | 982 | | | | 25,293 | |
Sysco Corp. | | | | | | | 309 | | | | 24,890 | |
Walmart, Inc. | | | | | | | 394 | | | | 46,921 | |
| | | | | | | | | | | | |
| | | | | | | | | | | 133,321 | |
| | | | | | | | | | | | |
| | |
| |
| 22 | AB ALL MARKET INCOME PORTFOLIO | | abfunds.com |
PORTFOLIO OF INVESTMENTS(continued)
| | | | | | | | | | | | |
| Company | | | | | Shares | | | U.S. $ Value | |
| |
Food Products – 0.6% | | | | | | | | | | | | |
General Mills, Inc. | | | | | | | 3,226 | | | $ | 172,010 | |
Hershey Co. (The) | | | | | | | 1,055 | | | | 156,309 | |
Morinaga & Co., Ltd./Japan | | | | | | | 300 | | | | 15,303 | |
Nestle SA | | | | | | | 881 | | | | 91,487 | |
Salmar ASA | | | | | | | 710 | | | | 33,798 | |
Tyson Foods, Inc. – Class A | | | | | | | 2,012 | | | | 180,859 | |
| | | | | | | | | | | | |
| | | | | | | | | | | 649,766 | |
| | | | | | | | | | | | |
Household Products – 0.3% | | | | | | | | | | | | |
Procter & Gamble Co. (The) | | | | | | | 2,931 | | | | 357,758 | |
| | | | | | | | | | | | |
| | | |
Personal Products – 0.2% | | | | | | | | | | | | |
Unilever NV | | | | | | | 3,464 | | | | 206,084 | |
Unilever PLC | | | | | | | 342 | | | | 20,259 | |
| | | | | | | | | | | | |
| | | | | | | | | | | 226,343 | |
| | | | | | | | | | | | |
Tobacco – 0.2% | | | | | | | | | | | | |
Imperial Brands PLC | | | | | | | 7,522 | | | | 165,500 | |
Philip Morris International, Inc.(f) | | | | | | | 426 | | | | 35,328 | |
| | | | | | | | | | | | |
| | | | | | | | | | | 200,828 | |
| | | | | | | | | | | | |
| | | | | | | | | | | 2,164,310 | |
| | | | | | | | | | | | |
Utilities – 1.7% | | | | | | | | | | | | |
Electric Utilities – 0.8% | | | | | | | | | | | | |
Endesa SA | | | | | | | 5,710 | | | | 155,225 | |
Enel SpA | | | | | | | 28,969 | | | | 218,950 | |
PPL Corp. | | | | | | | 5,080 | | | | 172,872 | |
Southern Co. (The) | | | | | | | 3,126 | | | | 193,781 | |
SSE PLC | | | | | | | 10,100 | | | | 169,810 | |
| | | | | | | | | | | | |
| | | | | | | | | | | 910,638 | |
| | | | | | | | | | | | |
Gas Utilities – 0.2% | | | | | | | | | | | | |
AltaGas Ltd. | | | | | | | 3,169 | | | | 46,999 | |
Snam SpA | | | | | | | 29,894 | | | | 148,526 | |
| | | | | | | | | | | | |
| | | | | | | | | | | 195,525 | |
| | | | | | | | | | | | |
Independent Power and Renewable Electricity Producers – 0.2% | | | | | | | | | | | | |
AES Corp./VA | | | | | | | 9,227 | | | | 174,482 | |
| | | | | | | | | | | | |
| | | |
Multi-Utilities – 0.5% | | | | | | | | | | | | |
Atco Ltd./Canada – Class I | | | | | | | 4,240 | | | | 160,848 | |
CenterPoint Energy, Inc.(f) | | | | | | | 5,915 | | | | 145,272 | |
Centrica PLC | | | | | | | 164,530 | | | | 170,698 | |
Consolidated Edison, Inc. | | | | | | | 851 | | | | 73,943 | |
| | | | | | | | | | | | |
| | | | | | | | | | | 550,761 | |
| | | | | | | | | | | | |
| | | | | | | | | | | 1,831,406 | |
| | | | | | | | | | | | |
| | |
| |
| abfunds.com | | AB ALL MARKET INCOME PORTFOLIO | 23 |
PORTFOLIO OF INVESTMENTS(continued)
| | | | | | | | | | | | |
| Company | | | | | Shares | | | U.S. $ Value | |
| |
Real Estate – 1.6% | | | | | | | | | | | | |
Equity Real Estate Investment Trusts (REITs) – 1.5% | | | | | | | | | | | | |
Covivio | | | | | | | 1,327 | | | $ | 146,800 | |
Extra Space Storage, Inc. | | | | | | | 1,332 | | | | 141,259 | |
ICADE | | | | | | | 1,670 | | | | 167,165 | |
Iron Mountain, Inc.(c) | | | | | | | 4,964 | | | | 159,444 | |
Kimco Realty Corp. | | | | | | | 7,503 | | | | 162,215 | |
Klepierre SA | | | | | | | 4,053 | | | | 145,462 | |
Merlin Properties Socimi SA | | | | | | | 1,881 | | | | 26,842 | |
Nippon Building Fund, Inc. | | | | | | | 3 | | | | 22,508 | |
RioCan Real Estate Investment Trust | | | | | | | 3,527 | | | | 72,064 | |
Stockland | | | | | | | 48,199 | | | | 164,588 | |
VEREIT, Inc. | | | | | | | 17,233 | | | | 168,194 | |
Vicinity Centres | | | | | | | 48,315 | | | | 87,489 | |
Vornado Realty Trust | | | | | | | 2,520 | | | | 162,716 | |
| | | | | | | | | | | | |
| | | | | | | | | | | 1,626,746 | |
| | | | | | | | | | | | |
Real Estate Management & Development – 0.1% | | | | | | | | | | | | |
Daito Trust Construction Co., Ltd. | | | | | | | 100 | | | | 12,253 | |
Nomura Real Estate Holdings, Inc. | | | | | | | 3,700 | | | | 89,504 | |
Vonovia SE | | | | | | | 353 | | | | 18,374 | |
| | | | | | | | | | | | |
| | | | | | | | | | | 120,131 | |
| | | | | | | | | | | | |
| | | | | | | | | | | 1,746,877 | |
| | | | | | | | | | | | |
Materials – 1.2% | | | | | | | | | | | | |
Chemicals – 0.5% | | | | | | | | | | | | |
Akzo Nobel NV | | | | | | | 1,088 | | | | 104,191 | |
LyondellBasell Industries NV – Class A | | | | | | | 1,790 | | | | 165,646 | |
Mitsubishi Chemical Holdings Corp. | | | | | | | 20,300 | | | | 150,651 | |
Sumitomo Chemical Co., Ltd. | | | | | | | 32,700 | | | | 147,654 | |
| | | | | | | | | | | | |
| | | | | | | | | | | 568,142 | |
| | | | | | | | | | | | |
Metals & Mining – 0.7% | | | | | | | | | | | | |
Alumina Ltd. | | | | | | | 92,154 | | | | 144,001 | |
BHP Group Ltd. | | | | | | | 7,465 | | | | 192,486 | |
Evraz PLC | | | | | | | 33,598 | | | | 160,897 | |
Fortescue Metals Group Ltd. | | | | | | | 26,612 | | | | 175,249 | |
Newmont Goldcorp Corp. | | | | | | | 2,491 | | | | 95,654 | |
| | | | | | | | | | | | |
| | | | | | | | | | | 768,287 | |
| | | | | | | | | | | | |
| | | | | | | | | | | 1,336,429 | |
| | | | | | | | | | | | |
Total Common Stocks
(cost $30,837,632) | | | | | | | | | | | 33,111,874 | |
| | | | | | | | | | | | |
| | | | | | | | | | | | |
| | |
| |
| 24 | AB ALL MARKET INCOME PORTFOLIO | | abfunds.com |
PORTFOLIO OF INVESTMENTS(continued)
| | | | | | | | | | | | |
| Company | | | | | Shares | | | U.S. $ Value | |
| |
PREFERRED STOCKS – 6.1% | | | | | | | | | | | | |
Real Estate – 6.1% | | | | | | | | | | | | |
Diversified REITs – 1.4% | | | | | | | | | | | | |
Armada Hoffler Properties, Inc.
Series A
6.75% | | | | | | | 5,425 | | | $ | 147,072 | |
Colony Capital, Inc.
Series I
7.15% | | | | | | | 9,600 | | | | 222,048 | |
Colony Capital, Inc.
Series J
7.125% | | | | | | | 2,500 | | | | 57,450 | |
Gladstone Commercial Corp.
Series D
7.00% | | | | | | | 7,711 | | | | 200,871 | |
Gladstone Commercial Corp.
Series E
6.625% | | | | | | | 2,150 | | | | 56,244 | |
Global Net Lease, Inc.
Series A
7.25% | | | | | | | 7,900 | | | | 205,953 | |
Global Net Lease, Inc.
Series B
6.875% | | | | | | | 4,450 | | | | 110,360 | |
PS Business Parks, Inc.
Series W
5.20%(c) | | | | | | | 1,600 | | | | 40,416 | |
PS Business Parks, Inc.
Series Y
5.20% | | | | | | | 6,600 | | | | 167,310 | |
PS Business Parks, Inc.
Series Z
4.875% | | | | | | | 2,700 | | | | 67,635 | |
Vornado Realty Trust
Series K
5.70% | | | | | | | 4,000 | | | | 101,440 | |
Vornado Realty Trust
Series L
5.40% | | | | | | | 4,100 | | | | 103,361 | |
| | | | | | | | | | | | |
| | | | | | | | | | | 1,480,160 | |
| | | | | | | | | | | | |
Hotel & Resort REITs – 1.0% | | | | | | | | | | | | |
Ashford Hospitality Trust, Inc.
Series F
7.375% | | | | | | | 5,000 | �� | | | 110,650 | |
Ashford Hospitality Trust, Inc.
Series G
7.375% | | | | | | | 4,000 | | | | 85,720 | |
| | |
| |
| abfunds.com | | AB ALL MARKET INCOME PORTFOLIO | 25 |
PORTFOLIO OF INVESTMENTS(continued)
| | | | | | | | | | |
| Company | | | | Shares | | | U.S. $ Value | |
| |
Ashford Hospitality Trust, Inc.
Series I
7.50%(c) | | | | | 2,350 | | | $ | 51,113 | |
Hersha Hospitality Trust
Series C
6.875% | | | | | 3,400 | | | | 85,034 | |
Hersha Hospitality Trust
Series D
6.50% | | | | | 2,100 | | | | 52,416 | |
Pebblebrook Hotel Trust
Series D
6.375% | | | | | 3,700 | | | | 93,980 | |
Pebblebrook Hotel Trust
Series E
6.375% | | | | | 1,250 | | | | 31,475 | |
Pebblebrook Hotel Trust
Series F
6.30% | | | | | 2,400 | | | | 60,576 | |
Summit Hotel Properties, Inc.
Series D
6.45% | | | | | 3,525 | | | | 89,741 | |
Summit Hotel Properties, Inc.
Series E
6.25% | | | | | 5,975 | | | | 150,391 | |
Sunstone Hotel Investors, Inc.
Series E
6.95% | | | | | 5,225 | | | | 136,320 | |
Sunstone Hotel Investors, Inc.
Series F
6.45% | | | | | 5,125 | | | | 132,635 | |
| | | | | | | | | | |
| | | | | | | | | 1,080,051 | |
| | | | | | | | | | |
Industrial REITs – 0.4% | | | | | | | | | | |
Monmouth Real Estate Investment Corp.
Series C
6.125% | | | | | 7,600 | | | | 189,924 | |
Rexford Industrial Realty, Inc.
Series A
5.875% | | | | | 3,400 | | | | 87,210 | |
Rexford Industrial Realty, Inc.
Series B
5.875% | | | | | 4,725 | | | | 122,434 | |
Rexford Industrial Realty, Inc.
Series C
5.625% | | | | | 3,975 | | | | 102,515 | |
| | | | | | | | | | |
| | | | | | | | | 502,083 | |
| | | | | | | | | | |
| | |
| |
| 26 | AB ALL MARKET INCOME PORTFOLIO | | abfunds.com |
PORTFOLIO OF INVESTMENTS(continued)
| | | | | | | | | | |
| Company | | | | Shares | | | U.S. $ Value | |
| |
Office REITs – 0.2% | | | | | | | | | | |
City Office REIT, Inc.
Series A
6.625% | | | | | 7,000 | | | $ | 178,710 | |
SL Green Realty Corp.
Series I
6.50% | | | | | 800 | | | | 20,624 | |
Vornado Realty Trust
Series M
5.25% | | | | | 2,400 | | | | 61,536 | |
| | | | | | | | | | |
| | | | | | | | | 260,870 | |
| | | | | | | | | | |
Real Estate Operating Companies – 0.3% | | | | | | | | | | |
Brookfield Property Partners LP
Series A2
6.375% | | | | | 12,000 | | | | 304,200 | |
| | | | | | | | | | |
| | | |
Residential REITs – 0.6% | | | | | | | | | | |
American Homes 4 Rent
Series D
6.50% | | | | | 5,000 | | | | 131,550 | |
American Homes 4 Rent
Series E
6.35% | | | | | 5,875 | | | | 152,867 | |
Investors Real Estate Trust
Series C
6.625% | | | | | 1,200 | | | | 31,236 | |
UMH Properties, Inc.
Series C
6.75% | | | | | 7,000 | | | | 181,020 | |
UMH Properties, Inc.
Series D
6.375% | | | | | 5,800 | | | | 145,000 | |
| | | | | | | | | | |
| | | | | | | | | 641,673 | |
| | | | | | | | | | |
Retail REITs – 1.5% | | | | | | | | | | |
Brookfield Property REIT, Inc.
Series A
6.375% | | | | | 4,300 | | | | 108,575 | |
Cedar Realty Trust, Inc.
Series C
6.50% | | | | | 4,425 | | | | 102,218 | |
Kimco Realty Corp.
Series L
5.125% | | | | | 7,550 | | | | 191,241 | |
National Retail Properties, Inc.
Series F
5.20% | | | | | 5,000 | | | | 126,250 | |
| | |
| |
| abfunds.com | | AB ALL MARKET INCOME PORTFOLIO | 27 |
PORTFOLIO OF INVESTMENTS(continued)
| | | | | | | | | | |
| Company | | | | Shares | | | U.S. $ Value | |
| |
Saul Centers, Inc.
Series D
6.125% | | | | | 8,000 | | | $ | 213,520 | |
Saul Centers, Inc.
Series E
6.00% | | | | | 1,500 | | | | 40,035 | |
SITE Centers Corp.
Series A
6.375% | | | | | 6,775 | | | | 179,876 | |
Spirit Realty Capital, Inc.
Series A
6.00% | | | | | 2,600 | | | | 66,300 | |
Taubman Centers, Inc.
Series J
6.50% | | | | | 7,450 | | | | 188,857 | |
Taubman Centers, Inc.
Series K
6.25% | | | | | 2,800 | | | | 71,596 | |
Urstadt Biddle Properties, Inc.
Series H
6.25% | | | | | 5,250 | | | | 136,238 | |
Urstadt Biddle Properties, Inc.
Series K
5.875% | | | | | 6,500 | | | | 165,425 | |
| | | | | | | | | | |
| | | | | | | | | 1,590,131 | |
| | | | | | | | | | |
Specialized REITs – 0.7% | | | | | | | | | | |
Digital Realty Trust, Inc.
Series J
5.25% | | | | | 7,000 | | | | 176,750 | |
EPR Properties
Series G
5.75% | | | | | 10,225 | | | | 263,600 | |
National Storage Affiliates Trust
Series A
6.00% | | | | | 5,700 | | | | 152,760 | |
Public Storage
Series C
5.125% | | | | | 2,625 | | | | 66,833 | |
Public Storage
Series V
5.375% | | | | | 1,650 | | | | 41,679 | |
Public Storage
Series W
5.20% | | | | | 700 | | | | 17,626 | |
| | | | | | | | | | |
| | | | | | | | | 719,248 | |
| | | | | | | | | | |
Total Preferred Stocks
(cost $6,377,233) | | | | | | | | | 6,578,416 | |
| | | | | | | | | | |
| | |
| |
| 28 | AB ALL MARKET INCOME PORTFOLIO | | abfunds.com |
PORTFOLIO OF INVESTMENTS(continued)
| | | | | | | | | | | | |
| | | | | | Principal
Amount
(000) | | | U.S. $ Value | |
| |
EMERGING MARKETS – SOVEREIGNS – 3.7% | | | | | | | | | | | | |
Angola – 0.2% | | | | | | | | | | | | |
Angolan Government International Bond
9.125%, 11/26/49(e) | | | U.S.$ | | | | 200 | | | $ | 199,850 | |
| | | | | | | | | | | | |
| | | |
Argentina – 0.1% | | | | | | | | | | | | |
Argentine Republic Government International Bond
7.50%, 4/22/26 | | | | | | | 150 | | | | 65,175 | |
6.625%, 7/06/28 | | | | | | | 150 | | | | 59,813 | |
| | | | | | | | | | | | |
| | | | | | | | | | | 124,988 | |
| | | | | | | | | | | | |
Costa Rica – 0.4% | | | | | | | | | | | | |
Costa Rica Government International Bond
7.158%, 3/12/45(e) | | | | | | | 400 | | | | 403,250 | |
| | | | | | | | | | | | |
| | | |
Dominican Republic – 0.3% | | | | | | | | | | | | |
Dominican Republic International Bond
6.40%, 6/05/49(e) | | | | | | | 200 | | | | 210,062 | |
6.85%, 1/27/45(e) | | | | | | | 100 | | | | 109,844 | |
| | | | | | | | | | | | |
| | | | | | | | | | | 319,906 | |
| | | | | | | | | | | | |
Ecuador – 0.1% | | | | | | | | | | | | |
Ecuador Government International Bond
9.65%, 12/13/26(e) | | | | | | | 200 | | | | 165,875 | |
| | | | | | | | | | | | |
| | | |
Egypt – 0.4% | | | | | | | | | | | | |
Egypt Government International Bond
6.125%, 1/31/22(e) | | | | | | | 200 | | | | 207,437 | |
8.70%, 3/01/49(e) | | | | | | | 200 | | | | 214,625 | |
| | | | | | | | | | | | |
| | | | | | | | | | | 422,062 | |
| | | | | | | | | | | | |
Gabon – 0.2% | | | | | | | | | | | | |
Gabon Government International Bond
6.375%, 12/12/24(e) | | | | | | | 200 | | | | 199,750 | |
| | | | | | | | | | | | |
| | | |
Ghana – 0.2% | | | | | | | | | | | | |
Ghana Government International Bond
8.95%, 3/26/51(e) | | | | | | | 200 | | | | 196,063 | |
| | | | | | | | | | | | |
| | | |
Iraq – 0.2% | | | | | | | | | | | | |
Iraq International Bond
6.752%, 3/09/23(e) | | | | | | | 200 | | | | 202,063 | |
| | | | | | | | | | | | |
| | |
| |
| abfunds.com | | AB ALL MARKET INCOME PORTFOLIO | 29 |
PORTFOLIO OF INVESTMENTS(continued)
| | | | | | | | | | | | |
| | | | | | Principal
Amount
(000) | | | U.S. $ Value | |
| |
Ivory Coast – 0.2% | | | | | | | | | | | | |
Ivory Coast Government International Bond
5.375%, 7/23/24(e) | | | U.S.$ | | | | 200 | | | $ | 207,250 | |
| | | | | | | | | | | | |
| | | |
Kenya – 0.2% | | | | | | | | | | | | |
Kenya Government International Bond
8.25%, 2/28/48(e) | | | | | | | 200 | | | | 204,812 | |
| | | | | | | | | | | | |
| | | |
Lebanon – 0.0% | | | | | | | | | | | | |
Lebanon Government International Bond
Series G
6.60%, 11/27/26(e) | | | | | | | 107 | | | | 48,384 | |
| | | | | | | | | | | | |
| | | |
Nigeria – 0.3% | | | | | | | | | | | | |
Nigeria Government International Bond
7.625%, 11/28/47(e) | | | | | | | 400 | | | | 377,000 | |
| | | | | | | | | | | | |
| | | |
Senegal – 0.4% | | | | | | | | | | | | |
Senegal Government International Bond
6.75%, 3/13/48(e) | | | | | | | 400 | | | | 389,875 | |
| | | | | | | | | | | | |
| | | |
Sri Lanka – 0.4% | | | | | | | | | | | | |
Sri Lanka Government International Bond
6.85%, 3/14/24(e) | | | | | | | 200 | | | | 199,209 | |
7.85%, 3/14/29(e) | | | | | | | 200 | | | | 194,000 | |
| | | | | | | | | | | | |
| | | | | | | | | | | 393,209 | |
| | | | | | | | | | | | |
Ukraine – 0.1% | | | | | | | | | | | | |
Ukraine Government International Bond
7.75%, 9/01/27(e) | | | | | | | 150 | | | | 158,100 | |
| | | | | | | | | | | | |
| | | |
Total Emerging Markets – Sovereigns
(cost $4,067,040) | | | | | | | | | | | 4,012,437 | |
| | | | | | | | | | | | |
| | | | | | | | | | | | |
GOVERNMENTS – TREASURIES – 0.2% | | | | | | | | | | | | |
Indonesia – 0.2% | | | | | | | | | | | | |
Indonesia Treasury Bond
Series FR70
8.375%, 3/15/24 | | | IDR | | | | 1,105,000 | | | | 83,629 | |
Series FR71
9.00%, 3/15/29 | | | | | | | 1,438,000 | | | | 113,623 | |
| | | | | | | | | | | | |
| | | |
Total Governments – Treasuries
(cost $189,233) | | | | | | | | | | | 197,252 | |
| | | | | | | | | | | | |
| | |
| |
| 30 | AB ALL MARKET INCOME PORTFOLIO | | abfunds.com |
PORTFOLIO OF INVESTMENTS(continued)
| | | | | | | | | | | | |
| | | | | | Principal
Amount
(000) | | | U.S. $ Value | |
| |
QUASI-SOVEREIGNS – 0.1% | | | | | | | | | | | | |
Quasi-Sovereign Bonds – 0.1% | | | | | | | | | | | | |
Mexico – 0.1% | | | | | | | | | | | | |
Petroleos Mexicanos
7.69%, 1/23/50(e)
(cost $92,677) | | | U.S.$ | | | | 97 | | | $ | 103,984 | |
| | | | | | | | | | | | |
| | | | | | | | | | | | |
EMERGING MARKETS – TREASURIES – 0.1% | | | | | | | | | | | | |
Brazil – 0.1% | | | | | | | | | | | | |
Brazil Notas do Tesouro Nacional Serie F
Series NTNF
10.00%, 1/01/23
(cost $93,210) | | | BRL | | | | 343 | | | | 89,905 | |
| | | | | | | | | | | | |
| | | | | | | | | | | | |
SHORT-TERM INVESTMENTS – 11.4% | | | | | | | | | | | | |
Investment Companies – 11.3% | | | | | | | | | | | | |
AB Fixed Income Shares, Inc. – Government Money Market Portfolio – Class AB, 1.58%(a)(b)(g)
(cost $12,176,200) | | | | | | | 12,176,200 | | | | 12,176,200 | |
| | | | | | | | | | | | |
| | | | | | | | | | | | |
GOVERNMENTS – TREASURIES – 0.1% | | | | | | | | | | | | |
Nigeria – 0.0% | | | | | | | | | | | | |
Nigeria Treasury Bills
Zero Coupon,1/30/20-3/19/20 | | | NGN | | | | 26,360 | | | | 70,075 | |
| | | | | | | | | | | | |
| | | |
Egypt – 0.1% | | | | | | | | | | | | |
Egypt Treasury Bills Series 273D
Zero Coupon, 4/21/20 | | | EGP | | | | 1,675 | | | | 98,119 | |
| | | | | | | | | | | | |
| | | |
Total Governments – Treasuries
(cost $167,966) | | | | | | | | | | | 168,194 | |
| | | | | | | | | | | | |
| | | |
Total Short-Term Investments
(cost $12,344,166) | | | | | | | | | | | 12,344,394 | |
| | | | | | | | | | | | |
Total Investments Before Security Lending Collateral for Securities Loaned – 96.3%
(cost $103,588,131) | | | | | | | | | | | 104,098,535 | |
| | | | | | | | | | | | |
| | |
| |
| abfunds.com | | AB ALL MARKET INCOME PORTFOLIO | 31 |
PORTFOLIO OF INVESTMENTS(continued)
| | | | | | | | | | |
| | | | | Principal
Amount
(000) | | | U.S. $ Value | |
| |
INVESTMENTS OF CASH COLLATERAL FOR SECURITIES LOANED – 3.3% | | | | | | | | | | |
Investment Companies – 3.3% | | | | | | | | | | |
AB Fixed Income Shares, Inc. – Government Money Market Portfolio – Class AB, 1.58%(a)(b)(g)
(cost $3,631,826) | | | | | 3,631,826 | | | $ | 3,631,826 | |
| | | | | | | | | | |
| | | |
Total Investments – 99.6%
(cost $107,219,957) | | | | | | | | | 107,730,361 | |
Other assets less liabilities – 0.4% | | | | | | | | | 408,520 | |
| | | | | | | | | | |
| | | |
Net Assets – 100.0% | | | | | | | | $ | 108,138,881 | |
| | | | | | | | | | |
FUTURES (see Note D)
| | | | | | | | | | | | | | | | |
| Description | | Number of
Contracts | | | Expiration
Month | | | Current
Notional | | | Value and
Unrealized
Appreciation/
(Depreciation) | |
Purchased Contracts | |
10 Yr Australian Bond Futures | | | 10 | | | | December 2019 | | | $ | 994,657 | | | $ | 10,248 | |
10 Yr Mini Japan Government Bond Futures | | | 38 | | | | December 2019 | | | | 5,318,680 | | | | (54,166 | ) |
Amsterdam Index Futures | | | 2 | | | | December 2019 | | | | 263,211 | | | | 42 | |
CAC40 10 Euro Futures | | | 9 | | | | December 2019 | | | | 584,956 | | | | (459 | ) |
Canadian 10 Yr Bond Futures | | | 6 | | | | March 2020 | | | | 632,703 | | | | 442 | |
DAX Index Futures | | | 1 | | | | December 2019 | | | | 364,875 | | | | 24,209 | |
FTSE 100 Index Futures | | | 5 | | | | December 2019 | | | | 476,258 | | | | 4,829 | |
FTSE/MIB Index Futures | | | 1 | | | | December 2019 | | | | 128,211 | | | | 7,608 | |
IBEX 35 Index Futures | | | 1 | | | | December 2019 | | | | 102,744 | | | | (601 | ) |
Long Gilt Futures | | | 5 | | | | March 2020 | | | | 858,492 | | | | (148 | ) |
OMXS30 Index Futures | | | 12 | | | | December 2019 | | | | 216,815 | | | | (4,477 | ) |
S&P 500E-Mini Futures | | | 9 | | | | December 2019 | | | | 1,414,665 | | | | 46,120 | |
TOPIX Index Futures | | | 5 | | | | December 2019 | | | | 775,452 | | | | 18,428 | |
|
Sold Contracts | |
Euro STOXX 50 Index Futures | | | 26 | | | | December 2019 | | | | 1,060,504 | | | | (55,711 | ) |
FTSE 100 Index Futures | | | 4 | | | | December 2019 | | | | 381,006 | | | | (5,761 | ) |
Hang Seng Index Futures | | | 2 | | | | December 2019 | | | | 336,386 | | | | 12,189 | |
Mini S&P TSX 60 Futures | | | 2 | | | | December 2019 | | | | 76,616 | | | | (1,894 | ) |
MSCI EAFE Futures | | | 8 | | | | December 2019 | | | | 790,920 | | | | (35,770 | ) |
MSCI Singapore IX ETS Futures | | | 11 | | | | December 2019 | | | | 296,234 | | | | 1,560 | |
S&P 500E-Mini Futures | | | 13 | | | | December 2019 | | | | 2,043,405 | | | | (84,408 | ) |
S&P TSX 60 Index Futures | | | 6 | | | | December 2019 | | | | 919,401 | | | | (22,671 | ) |
SPI 200 Futures | | | 6 | | | | December 2019 | | | | 695,610 | | | | (21,544 | ) |
TOPIX Index Futures | | | 4 | | | | December 2019 | | | | 620,362 | | | | (33,405 | ) |
| | | | | | | | | | | | | | | | |
| | | | | | | | | | $ | (195,340 | ) |
| | | | | | | | | | | | | | | | |
| | |
| |
| 32 | AB ALL MARKET INCOME PORTFOLIO | | abfunds.com |
PORTFOLIO OF INVESTMENTS(continued)
FORWARD CURRENCY EXCHANGE CONTRACTS (see Note D)
| | | | | | | | | | | | | | | | |
| Counterparty | | Contracts to
Deliver
(000) | | | In Exchange
For
(000) | | | Settlement
Date | | | Unrealized
Appreciation/
(Depreciation) | |
Bank of America, NA | | USD | 873 | | | RUB | 56,099 | | | | 1/17/20 | | | $ | (5,546 | ) |
Barclays Bank PLC | | PHP | 12,232 | | | USD | 237 | | | | 12/06/19 | | | | (3,960 | ) |
Barclays Bank PLC | | INR | 5,878 | | | USD | 82 | | | | 1/16/20 | | | | 602 | |
Barclays Bank PLC | | KRW | 5,226 | | | USD | 4 | | | | 2/06/20 | | | | 58 | |
Barclays Bank PLC | | CNY | 1,906 | | | USD | 270 | | | | 2/13/20 | | | | (577 | ) |
Barclays Bank PLC | | NZD | 808 | | | USD | 516 | | | | 1/17/20 | | | | (3,082 | ) |
Barclays Bank PLC | | AUD | 754 | | | USD | 512 | | | | 1/23/20 | | | | 1,128 | |
Barclays Bank PLC | | CHF | 1,037 | | | USD | 1,055 | | | | 1/10/20 | | | | 14,330 | |
Barclays Bank PLC | | USD | 729 | | | CHF | 726 | | | | 1/10/20 | | | | (219 | ) |
Barclays Bank PLC | | USD | 518 | | | NZD | 805 | | | | 1/17/20 | | | | (406 | ) |
Barclays Bank PLC | | USD | 903 | | | CNY | 6,426 | | | | 2/13/20 | | | | 9,517 | |
Barclays Bank PLC | | USD | 925 | | | TRY | 5,502 | | | | 12/05/19 | | | | 31,160 | |
Barclays Bank PLC | | USD | 600 | | | TWD | 18,170 | | | | 2/20/20 | | | | (1,176 | ) |
Barclays Bank PLC | | USD | 412 | | | PHP | 20,928 | | | | 12/06/19 | | | | 3 | |
Barclays Bank PLC | | USD | 535 | | | INR | 38,554 | | | | 1/16/20 | | | | 18 | |
BNP Paribas SA | | COP | 689,394 | | | USD | 207 | | | | 1/15/20 | | | | 11,710 | |
BNP Paribas SA | | USD | 1,465 | | | NOK | 13,141 | | | | 1/08/20 | | | | (39,694 | ) |
BNP Paribas SA | | USD | 1,208 | | | SEK | 11,700 | | | | 1/08/20 | | | | 16,792 | |
Citibank, NA | | KRW | 143,647 | | | USD | 123 | | | | 2/06/20 | | | | 1,049 | |
Citibank, NA | | PHP | 66,049 | | | USD | 1,268 | | | | 12/06/19 | | | | (31,807 | ) |
Citibank, NA | | USD | 570 | | | CZK | 13,380 | | | | 1/09/20 | | | | 7,535 | |
Citibank, NA | | USD | 459 | | | PHP | 23,817 | | | | 12/06/19 | | | | 9,714 | |
Citibank, NA | | USD | 600 | | | IDR | 8,504,063 | | | | 2/27/20 | | | | (3,009 | ) |
Credit Suisse International | | SEK | 8,506 | | | USD | 874 | | | | 1/08/20 | | | | (16,466 | ) |
Credit Suisse International | | NOK | 6,838 | | | USD | 754 | | | | 1/08/20 | | | | 12,030 | |
Credit Suisse International | | BRL | 4,182 | | | USD | 991 | | | | 1/03/20 | | | | 4,862 | |
Credit Suisse International | | BRL | 4,182 | | | USD | 990 | | | | 12/03/19 | | | | 2,268 | |
Credit Suisse International | | USD | 993 | | | BRL | 4,182 | | | | 12/03/19 | | | | (4,854 | ) |
Deutsche Bank AG | | PEN | 1,896 | | | USD | 567 | | | | 1/15/20 | | | | 10,260 | |
Goldman Sachs International | | HUF | 415,124 | | | USD | 1,371 | | | | 1/09/20 | | | | 1,070 | |
Goldman Sachs International | | USD | 1,014 | | | JPY | 109,551 | | | | 1/30/20 | | | | (8,287 | ) |
JPMorgan Chase Bank, NA | | AUD | 1,006 | | | USD | 695 | | | | 1/23/20 | | | | 13,450 | |
JPMorgan Chase Bank, NA | | CHF | 1,242 | | | USD | 1,257 | | | | 1/10/20 | | | | 10,074 | |
JPMorgan Chase Bank, NA | | USD | 690 | | | AUD | 1,006 | | | | 1/23/20 | | | | (8,566 | ) |
Morgan Stanley Capital Services, Inc. | | CLP | 857,608 | | | USD | 1,159 | | | | 1/15/20 | | | | 89,853 | |
State Street Bank & Trust Co. | | HUF | 48,384 | | | USD | 165 | | | | 1/09/20 | | | | 5,049 | |
State Street Bank & Trust Co. | | JPY | 21,930 | | | USD | 203 | | | | 1/30/20 | | | | 1,655 | |
State Street Bank & Trust Co. | | NOK | 18,764 | | | USD | 2,070 | | | | 1/08/20 | | | | 33,995 | |
State Street Bank & Trust Co. | | CZK | 6,165 | | | USD | 265 | | | | 1/09/20 | | | | (1,260 | ) |
State Street Bank & Trust Co. | | THB | 4,924 | | | USD | 163 | | | | 1/16/20 | | | | 62 | |
State Street Bank & Trust Co. | | SEK | 9,769 | | | USD | 1,009 | | | | 1/08/20 | | | | (13,843 | ) |
State Street Bank & Trust Co. | | TRY | 3,528 | | | USD | 604 | | | | 12/05/19 | | | | (8,790 | ) |
| | |
| |
| abfunds.com | | AB ALL MARKET INCOME PORTFOLIO | 33 |
PORTFOLIO OF INVESTMENTS(continued)
| | | | | | | | | | | | | | | | |
| Counterparty | | Contracts to
Deliver
(000) | | | In Exchange
For
(000) | | | Settlement
Date | | | Unrealized
Appreciation/
(Depreciation) | |
State Street Bank & Trust Co. | | JPY | 1,311 | | | USD | 12 | | | | 12/16/19 | | | $ | 91 | |
State Street Bank & Trust Co. | | NZD | 682 | | | USD | 436 | | | | 1/17/20 | | | | (2,393 | ) |
State Street Bank & Trust Co. | | AUD | 558 | | | USD | 379 | | | | 1/23/20 | | | | 800 | |
State Street Bank & Trust Co. | | ILS | 404 | | | USD | 116 | | | | 12/16/19 | | | | (582 | ) |
State Street Bank & Trust Co. | | CAD | 334 | | | USD | 251 | | | | 1/23/20 | | | | (551 | ) |
State Street Bank & Trust Co. | | NOK | 314 | | | USD | 34 | | | | 12/16/19 | | | | 19 | |
State Street Bank & Trust Co. | | EUR | 394 | | | USD | 438 | | | | 1/16/20 | | | | 1,572 | |
State Street Bank & Trust Co. | | EUR | 259 | | | USD | 286 | | | | 1/16/20 | | | | (709 | ) |
State Street Bank & Trust Co. | | CHF | 1,045 | | | USD | 1,060 | | | | 1/10/20 | | | | 11,427 | |
State Street Bank & Trust Co. | | CAD | 141 | | | USD | 106 | | | | 12/16/19 | | | | 133 | |
State Street Bank & Trust Co. | | HKD | 112 | | | USD | 14 | | | | 12/16/19 | | | | (24 | ) |
State Street Bank & Trust Co. | | CHF | 96 | | | USD | 97 | | | | 12/16/19 | | | | 1,036 | |
State Street Bank & Trust Co. | | GBP | 156 | | | USD | 196 | | | | 12/16/19 | | | | (5,457 | ) |
State Street Bank & Trust Co. | | EUR | 85 | | | USD | 94 | | | | 12/16/19 | | | | (14 | ) |
State Street Bank & Trust Co. | | DKK | 61 | | | USD | 9 | | | | 12/16/19 | | | | (2 | ) |
State Street Bank & Trust Co. | | AUD | 44 | | | USD | 30 | | | | 12/16/19 | | | | 284 | |
State Street Bank & Trust Co. | | SGD | 11 | | | USD | 8 | | | | 12/16/19 | | | | 29 | |
State Street Bank & Trust Co. | | USD | 1,600 | | | CHF | 1,577 | | | | 1/10/20 | | | | (18,450 | ) |
State Street Bank & Trust Co. | | USD | 5 | | | CHF | 5 | | | | 12/16/19 | | | | (2 | ) |
State Street Bank & Trust Co. | | USD | 6 | | | EUR | 5 | | | | 12/16/19 | | | | (35 | ) |
State Street Bank & Trust Co. | | USD | 6 | | | GBP | 5 | | | | 12/16/19 | | | | 29 | |
State Street Bank & Trust Co. | | USD | 11 | | | AUD | 16 | | | | 12/16/19 | | | | (7 | ) |
State Street Bank & Trust Co. | | USD | 14 | | | HKD | 112 | | | | 12/16/19 | | | | (3 | ) |
State Street Bank & Trust Co. | | USD | 354 | | | CAD | 472 | | | | 1/23/20 | | | | 1,015 | |
State Street Bank & Trust Co. | | USD | 1,146 | | | EUR | 1,030 | | | | 1/16/20 | | | | (7,560 | ) |
State Street Bank & Trust Co. | | USD | 361 | | | NZD | 562 | | | | 1/17/20 | | | | (169 | ) |
State Street Bank & Trust Co. | | USD | 1,311 | | | SEK | 12,730 | | | | 1/08/20 | | | | 21,982 | |
State Street Bank & Trust Co. | | USD | 24 | | | SEK | 229 | | | | 12/16/19 | | | | 411 | |
State Street Bank & Trust Co. | | USD | 515 | | | AUD | 754 | | | | 1/23/20 | | | | (4,330 | ) |
State Street Bank & Trust Co. | | USD | 64 | | | JPY | 6,960 | | | | 12/16/19 | | | | (387 | ) |
State Street Bank & Trust Co. | | USD | 319 | | | NZD | 503 | | | | 1/17/20 | | | | 4,120 | |
State Street Bank & Trust Co. | | USD | 688 | | | NOK | 6,281 | | | | 1/08/20 | | | | (6,167 | ) |
State Street Bank & Trust Co. | | USD | 181 | | | NOK | 1,618 | | | | 12/16/19 | | | | (5,484 | ) |
State Street Bank & Trust Co. | | USD | 107 | | | CZK | 2,450 | | | | 1/09/20 | | | | (1,494 | ) |
State Street Bank & Trust Co. | | USD | 372 | | | ZAR | 5,551 | | | | 1/23/20 | | | | 3,919 | |
State Street Bank & Trust Co. | | USD | 783 | | | MXN | 15,162 | | | | 1/07/20 | | | | (11,809 | ) |
State Street Bank & Trust Co. | | USD | 342 | | | HUF | 102,735 | | | | 1/09/20 | | | | (3,358 | ) |
UBS AG | | PHP | 33,536 | | | USD | 658 | | | | 3/12/20 | | | | 859 | |
UBS AG | | BRL | 4,182 | | | USD | 1,048 | | | | 12/03/19 | | | | 59,957 | |
UBS AG | | GBP | 449 | | | USD | 584 | | | | 1/10/20 | | | | 1,998 | |
UBS AG | | USD | 877 | | | EUR | 792 | | | | 1/16/20 | | | | (1,533 | ) |
UBS AG | | USD | 990 | | | BRL | 4,182 | | | | 12/03/19 | | | | (2,269 | ) |
UBS AG | | USD | 660 | | | PHP | 33,536 | | | | 12/06/19 | | | | (319 | ) |
| | | | | | | | | | | | | | | | |
| | | $ | 173,275 | |
| | | | | | | | | | | | | | | | |
| | |
| |
| 34 | AB ALL MARKET INCOME PORTFOLIO | | abfunds.com |
PORTFOLIO OF INVESTMENTS(continued)
CALL OPTIONS WRITTEN (see Note D)
| | | | | | | | | | | | | | | | | | | | | | | | |
| Description | | Counterparty | | Contracts | | | Exercise
Price | | | Expiration
Month | | Notional
(000) | | | Premiums
Received | | | U.S. $ Value | |
Euro STOXX 50 Index(h) | | Citibank, NA | | | 320 | | | EUR | 3,825.00 | | | December 2019 | | EUR | 1,224 | | | $ | 2,825 | | | $ | (1,282 | ) |
Nikkei 225 Index(h) | | Goldman
Sachs Bank
USA | | | 5,000 | | | JPY | 24,250.00 | | | December 2019 | | JPY | 121,250 | | | | 548 | | | | (447 | ) |
FTSE 100 Index(h) | | Citibank, NA | | | 70 | | | GBP | 7,625.00 | | | December 2019 | | GBP | 534 | | | | 611 | | | | (618 | ) |
S&P 500 Index(h) | | Goldman
Sachs
International | | | 2,500 | | | USD | 3,240.00 | | | December 2019 | | USD | 8,100 | | | | 4,175 | | | | (7,692 | ) |
| | | | | | | | | | | | | | | | | | | | | | | | |
| | | $ | 8,159 | | | $ | (10,039 | ) |
| | | | | | | | | | | | | | | | | | | | | | | | |
PUT OPTIONS WRITTEN (see Note D)
| | | | | | | | | | | | | | | | | | | | | | | | | | |
| Description | | Counterparty | | Contracts | | | Exercise
Price | | | Expiration
Month | | | Notional
(000) | | | Premiums
Received | | | U.S. $ Value | |
Nikkei 225 Index(h) | | Goldman
Sachs Bank
USA | | | 5,000 | | | JPY | 22,375.00 | | | | December 2019 | | | JPY | 111,875 | | | $ | 1,874 | | | $ | (1,952 | ) |
FTSE 100 Index(h) | | Citibank, NA | | | 70 | | | GBP | 7,100.00 | | | | December 2019 | | | GBP | 497 | | | | 2,250 | | | | (2,588 | ) |
S&P 500 Index(h) | | Goldman
Sachs
International | | | 2,500 | | | USD | 3,005.00 | | | | December 2019 | | | USD | 7,513 | | | | 17,700 | | | | (19,025 | ) |
Euro STOXX 50 Index(h) | | Citibank, NA | | | 320 | | | EUR | 3,500.00 | | | | December 2019 | | | EUR | 1,120 | | | | 1,974 | | | | (2,257 | ) |
| | | | | | | | | | | | | | | | | | | | | | | | | | |
| | | $ | 23,798 | | | $ | (25,822 | ) |
| | | | | | | | | | | | | | | | | | | | | | | | | | |
CENTRALLY CLEARED CREDIT DEFAULT SWAPS (see Note D)
| | | | | | | | | | | | | | | | | | | | | | | | | | |
Description
| | Fixed
Rate
(Pay)
Receive | | | Payment
Frequency | | Implied
Credit
Spread at
November 30,
2019 | | | Notional
Amount
(000) | | | Market
Value | | | Upfront
Premiums
Paid
(Received) | | | Unrealized
Appreciation/
(Depreciation) | |
Sale Contracts – 3.6% | | | | | | | | | | | | | | | | | | | | |
CDX-NAHY Series 33, 5 Year Index, 12/20/24* | | | 5.00 | % | | Quarterly | | | 3.25 | % | | USD | 3,660 | | | $ | 316,972 | | | $ | 265,571 | | | $ | 51,401 | |
CENTRALLY CLEARED INTEREST RATE SWAPS (see Note D)
| | | | | | | | | | | | | | | | | | | | |
| | | | | Rate Type | | | | | | | | | | | |
Notional
Amount
(000) | | Termination
Date | | Payments
made
by the
Fund | | Payments
received
by the
Fund | | Payment
Frequency Paid/
Received | | Market
Value | | | Upfront
Premiums
Paid
(Received) | | | Unrealized
Appreciation/
(Depreciation) | |
| USD 310 | | 8/21/20 | | 3 Month
LIBOR | | 1.620% | | Quarterly/
Semi-Annual | | $ | 860 | | | $ | — | | | $ | 860 | |
| USD 1,050 | | 1/10/22 | | 3 Month
LIBOR | | 1.941% | | Quarterly/Semi-Annual | | | 11,811 | | | | — | | | | 11,811 | |
| EUR 110 | | 6/02/27 | | 6 Month
EURIBOR | | 0.762% | | Semi-Annual/ Annual | | | 8,511 | | | | — | | | | 8,511 | |
| | |
| |
| abfunds.com | | AB ALL MARKET INCOME PORTFOLIO | 35 |
PORTFOLIO OF INVESTMENTS(continued)
| | | | | | | | | | | | | | | | | | | | |
| | | | | Rate Type | | | | | | | | | | | |
Notional
Amount
(000) | | Termination
Date | | Payments
made
by the
Fund | | Payments
received
by the
Fund | | Payment
Frequency
Paid/
Received | | Market
Value | | | Upfront
Premiums
Paid
(Received) | | | Unrealized
Appreciation/
(Depreciation) | |
USD 210 | | 10/10/27 | | 3 Month
LIBOR | | 2.354% | | Quarterly/
Semi-Annual | | $ | 11,002 | | | $ | — | | | $ | 11,002 | |
USD 280 | | 11/08/27 | | 3 Month
LIBOR | | 2.326% | | Quarterly/
Semi-Annual | | | 14,183 | | | | — | | | | 14,183 | |
USD 360 | | 12/27/27 | | 3 Month
LIBOR | | 2.492% | | Quarterly/
Semi-Annual | | | 25,292 | | | | — | | | | 25,292 | |
USD 1,200 | | 1/09/28 | | 3 Month
LIBOR | | 2.468% | | Quarterly/
Semi-Annual | | | 82,988 | | | | — | | | | 82,988 | |
USD 300 | | 1/16/28 | | 3 Month
LIBOR | | 2.558% | | Quarterly/
Semi-Annual | | | 22,729 | | | | — | | | | 22,729 | |
USD 350 | | 1/23/28 | | 3 Month
LIBOR | | 2.690% | | Quarterly/
Semi-Annual | | | 30,307 | | | | — | | | | 30,307 | |
USD 660 | | 3/09/28 | | 3 Month
LIBOR | | 2.931% | | Quarterly/
Semi-Annual | | | 66,372 | | | | — | | | | 66,372 | |
USD 120 | | 4/25/28 | | 3 Month
LIBOR | | 3.011% | | Quarterly/
Semi-Annual | | | 12,962 | | | | — | | | | 12,962 | |
EUR 1,870 | | 7/16/28 | | 6 Month
EURIBOR | | 0.871% | | Semi-Annual/
Annual | | | 171,176 | | | | — | | | | 171,176 | |
USD 590 | | 2/14/29 | | 3 Month
LIBOR | | 2.707% | | Quarterly/
Semi-Annual | | | 56,352 | | | | — | | | | 56,352 | |
USD 130 | | 5/02/29 | | 3 Month
LIBOR | | 2.501% | | Quarterly/
Semi-Annual | | | 9,386 | | | | — | | | | 9,386 | |
EUR 200 | | 5/03/29 | | 6 Month
EURIBOR | | 0.523% | | Semi-Annual/
Annual | | | 11,265 | | | | — | | | | 11,265 | |
USD 140 | | 7/03/29 | | 1.973% | | 3 Month
LIBOR | | Semi-Annual/
Quarterly | | | (4,142 | ) | | | — | | | | (4,142 | ) |
NZD 80 | | 7/30/29 | | 3 Month
BKBM | | 1.678% | | Quarterly/
Semi-Annual | | | 1,228 | | | | — | | | | 1,228 | |
AUD 190 | | 8/02/29 | | 1.360% | | 6 Month
BBSW | | Semi-Annual/
Semi-Annual | | | (2,123 | ) | | | — | | | | (2,123 | ) |
NOK 990 | | 8/05/29 | | 6 Month
NIBOR | | 1.760% | | Semi-Annual/
Annual | | | (1,134 | ) | | | — | | | | (1,134 | ) |
AUD 300 | | 8/12/29 | | 1.151% | | 6 Month
BBSW | | Semi-Annual/
Semi-Annual | | | 691 | | | | — | | | | 691 | |
USD 470 | | 8/13/29 | | 1.602% | | 3 Month
LIBOR | | Semi-Annual/
Quarterly | | | 2,132 | | | | — | | | | 2,132 | |
GBP 440 | | 8/29/29 | | 0.583% | | 6 Month
LIBOR | | Semi-Annual/
Semi-Annual | | | 17,653 | | | | — | | | | 17,653 | |
NOK 6,330 | | 9/02/29 | | 6 Month
NIBOR | | 1.520% | | Semi-Annual/
Annual | | | (22,106 | ) | | | — | | | | (22,106 | ) |
NZD 310 | | 9/02/29 | | 3 Month
BKBM | | 1.190% | | Quarterly/
Semi-Annual | | | (5,095 | ) | | | — | | | | (5,095 | ) |
CHF 210 | | 9/02/29 | | 6 Month
LIBOR | | (0.610)% | | Semi-Annual/
Annual | | | (6,878 | ) | | | — | | | | (6,878 | ) |
USD 350 | | 9/11/29 | | 3 Month
LIBOR | | 1.509% | | Quarterly/
Semi-Annual | | | (6,559 | ) | | | — | | | | (6,559 | ) |
EUR 280 | | 9/12/29 | | 6 Month
EURIBOR | | (0.157)% | | Semi-Annual/
Annual | | | (5,941 | ) | | | — | | | | (5,941 | ) |
| | |
| |
| 36 | AB ALL MARKET INCOME PORTFOLIO | | abfunds.com |
PORTFOLIO OF INVESTMENTS(continued)
| | | | | | | | | | | | | | | | | | | | | | | | | | | | |
| | | | | | Rate Type | | | | | | | | | | | | | |
Notional
Amount
(000) | | Termination
Date | | | Payments
made
by the
Fund | | | Payments
received
by the
Fund | | | Payment
Frequency
Paid/
Received | | | Market
Value | | | Upfront
Premiums
Paid
(Received) | | | Unrealized
Appreciation/
(Depreciation) | |
CAD 90 | | | 9/20/29 | | |
| 3 Month
CDOR |
| | | 1.777% | | |
| Semi-Annual/
Semi-Annual |
| | $ | (773 | ) | | $ | — | | | $ | (773 | ) |
NOK 1,620 | | | 9/24/29 | | |
| 6 Month
NIBOR |
| | | 1.681% | | |
| Semi-Annual/
Annual |
| | | (3,176 | ) | | | — | | | | (3,176 | ) |
CHF 540 | | | 9/24/29 | | |
| 6 Month
LIBOR |
| | | (0.383)% | | |
| Semi-Annual/
Annual |
| | | (5,762 | ) | | | — | | | | (5,762 | ) |
NZD 290 | | | 9/24/29 | | |
| 3 Month
BKBM |
| | | 1.248% | | |
| Quarterly/
Semi-Annual |
| | | (3,876 | ) | | | — | | | | (3,876 | ) |
USD 270 | | | 9/24/29 | | | | 1.655% | | |
| 3 Month
LIBOR |
| |
| Semi-Annual/
Quarterly |
| | | 1,394 | | | | — | | | | 1,394 | |
AUD 1,600 | | | 9/30/29 | | | | 1.140% | | |
| 6 Month
BBSW |
| |
| Semi-Annual/
Semi-Annual |
| | | 6,164 | | | | — | | | | 6,164 | |
CHF 920 | | | 10/01/29 | | |
| 6 Month
LIBOR |
| | | (0.420)% | | |
| Semi-Annual/
Annual |
| | | (13,474 | ) | | | — | | | | (13,474 | ) |
NZD 530 | | | 10/01/29 | | |
| 3 Month
BKBM |
| | | 1.220% | | |
| Quarterly/
Semi-Annual |
| | | (8,048 | ) | | | — | | | | (8,048 | ) |
USD 260 | | | 10/17/29 | | |
| 3 Month
LIBOR |
| | | 1.634% | | |
| Quarterly/
Semi-Annual |
| | | (1,719 | ) | | | — | | | | (1,719 | ) |
SEK 1,620 | | | 10/28/29 | | |
| 3 Month
STIBOR |
| | | 0.465% | | |
| Quarterly/
Annual |
| | | (1,591 | ) | | | — | | | | (1,591 | ) |
NOK 1,270 | | | 10/28/29 | | |
| 6 Month
NIBOR |
| | | 1.835% | | |
| Semi-Annual/
Annual |
| | | (598 | ) | | | — | | | | (598 | ) |
USD 830 | | | 10/28/29 | | | | 1.675% | | |
| 3 Month
LIBOR |
| |
| Semi-Annual/
Quarterly |
| | | 2,261 | | | | — | | | | 2,261 | |
JPY 210 | | | 10/28/29 | | | | -0.005% | | |
| 6 Month
LIBOR |
| |
| Semi-Annual/
Semi-Annual |
| | | 12 | | | | — | | | | 12 | |
AUD 120 | | | 11/01/29 | | | | 1.310% | | |
| 6 Month
BBSW |
| |
| Semi-Annual/
Semi-Annual |
| | | (831 | ) | | | — | | | | (831 | ) |
NOK 3,040 | | | 11/04/29 | | |
| 6 Month
NIBOR |
| | | 1.861% | | |
| Semi-Annual/
Annual |
| | | (683 | ) | | | — | | | | (683 | ) |
CHF 1,090 | | | 11/04/29 | | |
| 6 Month
LIBOR |
| | | (0.235)% | | |
| Semi-Annual/
Annual |
| | | 3,851 | | | | — | | | | 3,851 | |
EUR 100 | | | 11/04/29 | | |
| 6 Month
EURIBOR |
| | | 0.026% | | |
| Semi-Annual/
Annual |
| | | (273 | ) | | | — | | | | (273 | ) |
USD 240 | | | 11/18/29 | | |
| 3 Month
LIBOR |
| | | 1.728% | | |
| Quarterly/
Semi-Annual |
| | | 547 | | | | — | | | | 547 | |
EUR 180 | | | 11/18/29 | | |
| 6 Month
EURIBOR |
| | | 0.073% | | |
| Semi-Annual/
Annual |
| | | 378 | | | | — | | | | 378 | |
USD 220 | | | 8/21/45 | | |
| 3 Month
LIBOR |
| | | 2.630% | | |
| Quarterly/
Semi-Annual |
| | | 36,124 | | | | — | | | | 36,124 | |
USD 70 | | | 9/04/45 | | |
| 3 Month
LIBOR |
| | | 2.708% | | |
| Quarterly/
Semi-Annual |
| | | 12,261 | | | | — | | | | 12,261 | |
| | | | | | | | | | | | | | | | | | | | | | | | | | | | |
| | | | | | | | | | | | | | | | | | $ | 525,110 | | | $ | — | | | $ | 525,110 | |
| | | | | | | | | | | | | | | | | | | | | | | | | | | | |
| | |
| |
| abfunds.com | | AB ALL MARKET INCOME PORTFOLIO | 37 |
PORTFOLIO OF INVESTMENTS(continued)
INFLATION (CPI) SWAPS (see Note D)
| | | | | | | | | | | | | | | | | | | | | | | | | | | | | | | | |
| | | | | | | | | Rate Type | | | | | | | | | | | | | |
Swap
Counterparty | | Notional
Amount
(000) | | | Termination
Date | | | Payments
made
by the
Fund | | | Payments
received
by the
Fund | | | Payment
Frequency
Paid/
Received | | | Market
Value | | | Upfront
Premiums
Paid
(Received) | | | Unrealized
Appreciation/
(Depreciation) | |
Bank of America, NA | | USD | 8,300 | | | | 1/05/23 | | | | 2.163% | | | | CPI# | | | | Maturity | | | $ | (164,673 | ) | | $ | — | | | $ | (164,673 | ) |
Bank of America, NA | | USD | 610 | | | | 1/19/23 | | | | 2.213% | | | | CPI# | | | | Maturity | | | | (14,072 | ) | | | — | | | | (14,072 | ) |
Deutsche Bank AG | | USD | 1,920 | | | | 10/01/20 | | | | 1.273% | | | | CPI# | | | | Maturity | | | | 49,464 | | | | — | | | | 49,464 | |
JPMorgan Chase Bank, NA | | USD | 400 | | | | 11/10/21 | | | | 1.896% | | | | CPI# | | | | Maturity | | | | 3 | | | | — | | | | 3 | |
| | | | | | | | | | | | | | | | | | | | | | | | | | | | | | | | |
| | | | | | | | | | | | | | | | | | | | | | $ | (129,278 | ) | | $ | — | | | $ | (129,278 | ) |
| | | | | | | | | | | | | | | | | | | | | | | | | | | | | | | | |
| # | Variable interest rate based on the rate of inflation as determined by the Consumer Price Index (CPI). |
TOTAL RETURN SWAPS (see Note D)
| | | | | | | | | | | | | | | | | | | | |
Counterparty &
Referenced Obligation | | Rate
Paid/
Received | | | Payment
Frequency | | | Current
Notional
(000) | | | Maturity
Date | | | Unrealized
Appreciation/
(Depreciation) | |
Receive Total Return on Reference Obligation | |
Goldman Sachs International | | | | | | | | | | | | | | | | | | | | |
GSABHY01(1) | |
| LIBOR
Plus 0.90% |
| | | Quarterly | | | | USD 1,073 | | | | 2/18/20 | | | $ | 18,350 | |
GSABHY01 | |
| LIBOR
Plus 0.90% |
| | | Quarterly | | | | USD 11 | | | | 2/18/20 | | | | 193 | |
JPMorgan Chase Bank, NA | |
JPABSAA1(2) | | | LIBOR | | | | Maturity | | | | USD 33,879 | | | | 12/31/19 | | | | (4,066 | ) |
JPQABHY1(3) | | | 0.20% | | | | Quarterly | | | | USD 2,194 | | | | 2/18/20 | | | | 137,493 | |
JPQABHY1 | | | 0.20% | | | | Quarterly | | | | USD 177 | | | | 2/18/20 | | | | 11,099 | |
|
Pay Total Return on Reference Obligation | |
Morgan Stanley Capital Services LLC | |
Swiss Marketing Index Future | | | 0.00% | | | | Annual | | | | CHF 314 | | | | 12/20/19 | | | | (321 | ) |
| | | | | | | | | | | | | | | | | | | | |
| | | | | | | | | | | | | | | | | | $ | 162,748 | |
| | | | | | | | | | | | | | | | | | | | |
| (a) | To obtain a copy of the fund’s shareholder report, please go to the Securities and Exchange Commission’s website at www.sec.gov. Additionally, shareholder reports for AB funds can be obtained by calling AB at (800)227-4618. |
| (b) | Affiliated investments. |
| (c) | Represents entire or partial securities out on loan. See Note E for securities lending information. |
| (d) | Non-income producing security. |
| (e) | Security is exempt from registration under Rule 144A of the Securities Act of 1933. These securities are considered restricted, but liquid and may be resold in transactions exempt from registration, normally to qualified institutional buyers. At November 30, 2019, the aggregate market value of these securities amounted to $4,310,982 or 4.0% of net assets. |
| (f) | Position, or a portion thereof, has been segregated to collateralize margin requirements for open futures contracts. |
| (g) | The rate shown represents the7-day yield as of period end. |
| (h) | One contract relates to 1 share. |
| | |
| |
| 38 | AB ALL MARKET INCOME PORTFOLIO | | abfunds.com |
PORTFOLIO OF INVESTMENTS(continued)
Currency Abbreviations:
AUD – Australian Dollar
BRL – Brazilian Real
CAD – Canadian Dollar
CHF – Swiss Franc
CLP – Chilean Peso
CNY – Chinese Yuan Renminbi
COP – Colombian Peso
CZK – Czech Koruna
DKK – Danish Krone
EGP – Egyptian Pound
EUR – Euro
GBP – Great British Pound
HKD – Hong Kong Dollar
HUF – Hungarian Forint
IDR – Indonesian Rupiah
ILS – Israeli Shekel
INR – Indian Rupee
JPY – Japanese Yen
KRW – South Korean Won
MXN – Mexican Peso
NGN – Nigerian Naira
NOK – Norwegian Krone
NZD – New Zealand Dollar
PEN – Peruvian Sol
PHP – Philippine Peso
RUB – Russian Ruble
SEK – Swedish Krona
SGD – Singapore Dollar
THB – Thailand Baht
TRY – Turkish Lira
TWD – New Taiwan Dollar
USD – United States Dollar
ZAR – South African Rand
Glossary:
ADR – American Depositary Receipt
BBSW – Bank Bill Swap Reference Rate (Australia)
BKBM – Bank Bill Benchmark (New Zealand)
CAC – Cotation Assistée en Continu (Continuous Assisted Quotation)
CDOR – Canadian Dealer Offered Rate
CDX-NAHY – North American High Yield Credit Default Swap Index
CME – Chicago Mercantile Exchange
DAX – Deutscher Aktien Index (German Stock Index)
EAFE – Europe, Australia, and Far East
ETF – Exchange Traded Fund
ETN – Exchange Traded Note
ETS – Emission Trading Scheme
EURIBOR – Euro Interbank Offered Rate
FTSE – Financial Times Stock Exchange
IBEX – International Business Exchange
LIBOR – London Interbank Offered Rates
MIB – Milano Italia Borsa
MSCI – Morgan Stanley Capital International
NIBOR – Norwegian Interbank Offered Rate
OMXS – Stockholm Stock Exchange
PJSC – Public Joint Stock Company
| | |
| |
| abfunds.com | | AB ALL MARKET INCOME PORTFOLIO | 39 |
PORTFOLIO OF INVESTMENTS(continued)
REIT – Real Estate Investment Trust
SPDR – Standard & Poor’s Depository Receipt
SPI – Share Price Index
STIBOR – Stockholm Interbank Offered Rate
TOPIX – Tokyo Price Index
TSX – Toronto Stock Exchange
| (1) | The following table represents the (long/(short)) index basket holdings underlying the total return swap with GSABHY01 as of November 30, 2019. |
| | | | | | | | | | | | |
| Security Description | | Shares | | | Current Notional | | | Percent of
Basket’s Value | |
GSABHYS1 | | | (11,794 | ) | | $ | (1,196,136 | ) | | | (111.5 | )% |
Russell 2000 Index | | | 24 | | | | 38,258 | | | | 3.6 | % |
Russell 1000 Index | | | 22 | | | | 37,462 | | | | 3.5 | % |
| (2) | The following table represents the 50 largest (long/(short)) equity basket holdings underlying the total return swap with JPABSAA1 as of November 30, 2019. |
| | | | | | | | | | | | |
| Security Description | | Shares | | | Current Notional | | | Percent of
Basket’s Value | |
S&P 500 TR | | | (2,551 | ) | | $ | (16,230,464 | ) | | | (47.9 | )% |
MSCI Daily TR Gross EAFE | | | (1,158 | ) | | | (9,693,636 | ) | | | (28.6 | )% |
J.P. Morgan Cash Index USD 1 Month | | | (25,898 | ) | | | (7,825,506 | ) | | | (23.1 | )% |
Microsoft Corp. | | | 6,803 | | | | 1,029,879 | | | | 3.0 | % |
MSCI Daily TR Gross Canada | | | (124 | ) | | | (979,674 | ) | | | (2.9 | )% |
Roche HoldingAG-Genusschein | | | 2,649 | | | | 816,800 | | | | 2.4 | % |
Apple, Inc. | | | 2,870 | | | | 767,082 | | | | 2.3 | % |
Walmart, Inc. | | | 5,219 | | | | 621,477 | | | | 1.8 | % |
Automatic Data Processing | | | 3,410 | | | | 582,416 | | | | 1.7 | % |
Bank LeumiLe-Israel | | | 67,616 | | | | 568,209 | | | | 1.7 | % |
Qantas Airways Ltd. | | | 115,075 | | | | 568,209 | | | | 1.7 | % |
RELX PLC | | | 23,446 | | | | 568,209 | | | | 1.7 | % |
Ross Stores, Inc. | | | 4,892 | | | | 568,209 | | | | 1.7 | % |
Oracle Corp. | | | 9,995 | | | | 561,106 | | | | 1.7 | % |
Royal Dutch Shell PLC – Class B | | | 198 | | | | 561,106 | | | | 1.7 | % |
UnitedHealth Group, Inc. | | | 1,967 | | | | 550,453 | | | | 1.6 | % |
Oracle Corp./Japan | | | 5,832 | | | | 536,247 | | | | 1.6 | % |
Check Point Software Tech | | | 4,489 | | | | 529,144 | | | | 1.6 | % |
Merck & Co., Inc. | | | 5,907 | | | | 514,938 | | | | 1.5 | % |
Paychex, Inc. | | | 5,938 | | | | 511,388 | | | | 1.5 | % |
Fidelity National Financial | | | 10,737 | | | | 511,388 | | | | 1.5 | % |
Dollar General Corp. | | | 3,047 | | | | 479,426 | | | | 1.4 | % |
Constellation Software, Inc. | | | 445 | | | | 475,876 | | | | 1.4 | % |
Adidas AG | | | 1,492 | | | | 465,220 | | | | 1.4 | % |
Philip Morris International | | | 5,567 | | | | 461,670 | | | | 1.4 | % |
Auto Trader Group PLC | | | 635 | | | | 461,670 | | | | 1.4 | % |
Aristocrat Leisure Ltd. | | | 19,967 | | | | 458,120 | | | | 1.4 | % |
Toronto-Dominion Bank | | | 7,822 | | | | 451,017 | | | | 1.3 | % |
Nice Ltd. | | | 2,930 | | | | 443,914 | | | | 1.3 | % |
Comcast Corp. – Class A | | | 9,894 | | | | 436,811 | | | | 1.3 | % |
Procter & Gamble Co./The | | | 3,550 | | | | 433,261 | | | | 1.3 | % |
Wolters Kluwer | | | 5,882 | | | | 422,605 | | | | 1.2 | % |
Salmar ASA | | | 8,717 | | | | 415,502 | | | | 1.2 | % |
Royal Bank of Canada | | | 5,032 | | | | 411,952 | | | | 1.2 | % |
| | |
| |
| 40 | AB ALL MARKET INCOME PORTFOLIO | | abfunds.com |
PORTFOLIO OF INVESTMENTS(continued)
| | | | | | | | | | | | |
| Security Description | | Shares | | | Current Notional | | | Percent of
Basket’s Value | |
Enel SPA | | | 53,248 | | | $ | 402,528 | | | | 1.2 | % |
AutoZone, Inc. | | | 332 | | | | 390,642 | | | | 1.2 | % |
American Financial Group, Inc. | | | 3,561 | | | | 390,642 | | | | 1.2 | % |
Home Depot, Inc. | | | 1,772 | | | | 390,642 | | | | 1.2 | % |
PNC Financial Services Group | | | 2,457 | | | | 376,440 | | | | 1.1 | % |
L3Harris Technologies, Inc. | | | 1,854 | | | | 372,886 | | | | 1.1 | % |
Novo NordiskA/S-B | | | 6,566 | | | | 369,337 | | | | 1.1 | % |
Morinaga & Co., Ltd. | | | 7,179 | | | | 365,783 | | | | 1.1 | % |
Nippon Telegraph & Telephone | | | 7,247 | | | | 365,783 | | | | 1.1 | % |
Partners Group Holding AG | | | 421 | | | | 355,130 | | | | 1.0 | % |
Admiral Group PLC | | | 128 | | | | 355,130 | | | | 1.0 | % |
Booz Allen Hamilton Holdings | | | 4,881 | | | | 355,130 | | | | 1.0 | % |
NeslteSA-REG | | | 3,415 | | | | 355,130 | | | | 1.0 | % |
Eli Lilly & Co. | | | 3,026 | | | | 355,130 | | | | 1.0 | % |
Koninklijke Ahold Delhaize | | | 13,360 | | | | 344,478 | | | | 1.0 | % |
Experian PLC | | | 103 | | | | 340,924 | | | | 1.0 | % |
Other Long | | | 424,970 | | | | 12,564,516 | | | | 37.1 | % |
| (3) | The following table represents the 50 largest (long/(short)) equity basket holdings underlying the total return swap with JPQABHY1 as of November 30, 2019. |
| | | | | | | | | | | | |
| Security Description | | Shares | | | Current Notional | | | Percent of
Basket’s Value | |
J.P. Morgan Cash Index USD 1 Month | | | (6,805 | ) | | $ | (2,056,087 | ) | | | (93.7 | )% |
Molina Healthcare, Inc. | | | 805 | | | | 109,059 | | | | 5.0 | % |
Hologic, Inc. | | | 2,088 | | | | 107,141 | | | | 4.9 | % |
Veon Ltd. | | | 40,443 | | | | 106,769 | | | | 4.9 | % |
Hilton Worldwide Holdings, Inc. | | | 1,001 | | | | 105,120 | | | | 4.8 | % |
Wyndham Hotels & Resorts, Inc. | | | 1,809 | | | | 104,800 | | | | 4.8 | % |
Elanco Animal Health, Inc. | | | 3,764 | | | | 104,309 | | | | 4.8 | % |
Wellcare Health Plans, Inc. | | | 321 | | | | 103,526 | | | | 4.7 | % |
Eldorado Resorts, Inc. | | | 1,927 | | | | 103,133 | | | | 4.7 | % |
Teleflex, Inc. | | | 291 | | | | 102,916 | | | | 4.7 | % |
Marriott Vacations World | | | 836 | | | | 102,739 | | | | 4.7 | % |
Rexnord Corp. | | | 3,230 | | | | 102,038 | | | | 4.7 | % |
Acadia Healthcare Co., Inc. | | | 3,172 | | | | 102,028 | | | | 4.6 | % |
AES Corp. | | | 5,392 | | | | 101,970 | | | | 4.6 | % |
MSCI, Inc. | | | 393 | | | | 101,791 | | | | 4.6 | % |
Lamb Weston Holdings, Inc. | | | 1,208 | | | | 101,472 | | | | 4.6 | % |
Spectrum Brands Holdings, Inc. | | | 1,618 | | | | 101,139 | | | | 4.6 | % |
Norwegian Cruise Line Holdings | | | 1,878 | | | | 100,726 | | | | 4.6 | % |
Hannon Armstrong Sustainable | | | 3,428 | | | | 100,614 | | | | 4.6 | % |
Verisign, Inc. | | | 526 | | | | 100,387 | | | | 4.6 | % |
CIT Group, Inc. | | | 2,204 | | | | 100,340 | | | | 4.6 | % |
YUM! Brands, Inc. | | | 995 | | | | 100,150 | | | | 4.6 | % |
Lamar Advertising Co. – Class A | | | 1,198 | | | | 99,956 | | | | 4.6 | % |
Ladder Capital Corp. – REIT | | | 5,781 | | | | 99,953 | | | | 4.6 | % |
Starwood Property Trust, Inc. | | | 4,078 | | | | 99,911 | | | | 4.6 | % |
Crown Holdings, Inc. | | | 1,314 | | | | 99,711 | | | | 4.5 | % |
IQVIA Holdings, Inc. | | | 682 | | | | 99,515 | | | | 4.5 | % |
Ball Corp. | | | 1,503 | | | | 99,269 | | | | 4.5 | % |
Boyd Gaming Corp. | | | 3,368 | | | | 99,050 | | | | 4.5 | % |
Lennar Corp. – Class A | | | 1,650 | | | | 98,433 | | | | 4.5 | % |
| | |
| |
| abfunds.com | | AB ALL MARKET INCOME PORTFOLIO | 41 |
PORTFOLIO OF INVESTMENTS(continued)
| | | | | | | | | | | | |
| Security Description | | Shares | | | Current Notional | | | Percent of
Basket’s Value | |
US Foods Holding Corp. | | | 2,472 | | | $ | 98,317 | | | | 4.5 | % |
QORVO, Inc. | | | 942 | | | | 98,173 | | | | 4.5 | % |
Gartner, Inc. | | | 610 | | | | 97,835 | | | | 4.5 | % |
CDW Corp./DE | | | 722 | | | | 97,561 | | | | 4.4 | % |
Colfax Corp. | | | 2,894 | | | | 97,524 | | | | 4.4 | % |
Sensata Technologies Holding | | | 1,879 | | | | 96,763 | | | | 4.4 | % |
Sabre Corp. | | | 4,310 | | | | 96,665 | | | | 4.4 | % |
HD Supply Holdings, Inc. | | | 2,418 | | | | 96,276 | | | | 4.4 | % |
Carter’s, Inc. | | | 930 | | | | 96,077 | | | | 4.4 | % |
HollyFrontier Corp. | | | 1,861 | | | | 95,936 | | | | 4.4 | % |
Constellium SE | | | 6,783 | | | | 95,905 | | | | 4.4 | % |
Charter Communications, Inc. – Class A | | | 204 | | | | 95,803 | | | | 4.4 | % |
Fiat Chrysler Automobiles NV | | | 6,155 | | | | 90,793 | | | | 4.1 | % |
Carvana Co. | | | (701 | ) | | | (66,784 | ) | | | (3.0 | )% |
GrubHub, Inc. | | | (1,438 | ) | | | (62,014 | ) | | | (2.8 | )% |
Vector Group Ltd. | | | (4,503 | ) | | | (60,515 | ) | | | (2.8 | )% |
L Brands, Inc. | | | (3,065 | ) | | | (58,656 | ) | | | (2.7 | )% |
Uber Technologies, Inc. | | | (1,972 | ) | | | (58,380 | ) | | | (2.7 | )% |
Tronox Holdings PLC – Class A | | | (4,785 | ) | | | (55,408 | ) | | | (2.5 | )% |
Ares Management Corp. – Class A | | | (1,652 | ) | | | (54,663 | ) | | | (2.5 | )% |
Other (Short) | | | (172,717 | ) | | | (1,599,410 | ) | | | (72.9 | )% |
See notes to financial statements.
| | |
| |
| 42 | AB ALL MARKET INCOME PORTFOLIO | | abfunds.com |
STATEMENT OF ASSETS & LIABILITIES
November 30, 2019
| | | | |
| Assets | | | | |
Investments in securities, at value | | | | |
Unaffiliated issuers (cost $50,836,526) | | $ | 52,975,588 | (a) |
Affiliated issuers (cost $56,383,431—including investment of cash collateral for securities loaned of $3,631,826) | | | 54,754,773 | |
Cash | | | 39,780 | |
Cash collateral due from broker | | | 777,241 | |
Foreign currencies, at value (cost $2,968,850) | | | 2,990,678 | |
Unrealized appreciation on forward currency exchange contracts | | | 397,925 | |
Unaffiliated dividends and interest receivable | | | 278,211 | |
Affiliated dividends receivable | | | 226,773 | |
Receivable for capital stock sold | | | 200,012 | |
Unrealized appreciation on total return swaps | | | 167,135 | |
Receivable for investment securities sold | | | 65,403 | |
Unrealized appreciation on inflation swaps | | | 49,467 | |
Receivable for terminated total return swaps | | | 11,789 | |
Receivable for variation margin on futures | | | 8,664 | |
Receivable due from Adviser | | | 2,332 | |
| | | | |
Total assets | | | 112,945,771 | |
| | | | |
| Liabilities | | | | |
Options written, at value (premiums received $31,957) | | | 35,861 | |
Payable for collateral received on securities loaned | | | 3,631,826 | |
Payable for investment securities purchased | | | 315,475 | |
Unrealized depreciation on forward currency exchange contracts | | | 224,650 | |
Unrealized depreciation on inflation swaps | | | 178,745 | |
Payable for capital stock redeemed | | | 132,352 | |
Payable for terminated total return swaps | | | 102,215 | |
Payable for variation margin on centrally cleared swaps | | | 10,988 | |
Directors’ fees payable | | | 5,807 | |
Unrealized depreciation on total return swaps | | | 4,387 | |
Distribution fee payable | | | 2,415 | |
Transfer Agent fee payable | | | 1,403 | |
Accrued expenses and other liabilities | | | 160,766 | |
| | | | |
Total liabilities | | | 4,806,890 | |
| | | | |
Net Assets | | $ | 108,138,881 | |
| | | | |
| Composition of Net Assets | | | | |
Capital stock, at par | | $ | 1,086 | |
Additionalpaid-in capital | | | 111,108,239 | |
Accumulated loss | | | (2,970,444 | ) |
| | | | |
| | $ | 108,138,881 | |
| | | | |
| (a) | Includes securities on loan with a value of $6,322,857 (see Note E). |
See notes to financial statements.
| | |
| |
| abfunds.com | | AB ALL MARKET INCOME PORTFOLIO | 43 |
STATEMENT OF ASSETS & LIABILITIES(continued)
Net Asset Value Per Share—11 billion shares of capital stock authorized, $.0001 par value
| | | | | | | | | | | | |
| Class | | Net Assets | | | Shares Outstanding | | | Net Asset
Value | |
| |
| A | | $ | 7,462,937 | | | | 750,496 | | | $ | 9.94 | * |
| |
| C | | $ | 1,105,285 | | | | 111,176 | | | $ | 9.94 | |
| |
| Advisor | | $ | 99,570,659 | | | | 9,998,627 | | | $ | 9.96 | |
| |
| * | The maximum offering price per share for Class A shares was $10.38 which reflects a sales charge of 4.25%. |
See notes to financial statements.
| | |
| |
| 44 | AB ALL MARKET INCOME PORTFOLIO | | abfunds.com |
STATEMENT OF OPERATIONS
Year Ended November 30, 2019
| | | | | | | | |
| Investment Income | | | | | | | | |
Dividends | | | | | | | | |
Unaffiliated issuers (net of foreign taxes withheld of $54,903) | | $ | 1,085,539 | | | | | |
Affiliated issuers | | | 2,987,201 | | | | | |
Interest (net of foreign taxes withheld of $62) | | | 252,964 | | | | | |
Securities lending income | | | 4,569 | | | $ | 4,330,273 | |
| | | | | | | | |
| Expenses | | | | | | | | |
Advisory fee (see Note B) | | | 554,994 | | | | | |
Distribution fee—Class A | | | 16,627 | | | | | |
Distribution fee—Class C | | | 9,078 | | | | | |
Transfer agency—Class A | | | 2,227 | | | | | |
Transfer agency—Class C | | | 331 | | | | | |
Transfer agency—Advisor Class | | | 31,056 | | | | | |
Custodian | | | 182,652 | | | | | |
Audit and tax | | | 120,500 | | | | | |
Administrative | | | 81,331 | | | | | |
Registration fees | | | 54,076 | | | | | |
Legal | | | 41,986 | | | | | |
Printing | | | 33,848 | | | | | |
Directors’ fees | | | 22,863 | | | | | |
Miscellaneous | | | 38,936 | | | | | |
| | | | | | | | |
Total expenses | | | 1,190,505 | | | | | |
Less: expenses waived and reimbursed by the Adviser (see Notes B & E) | | | (631,766 | ) | | | | |
| | | | | | | | |
Net expenses | | | | | | | 558,739 | |
| | | | | | | | |
Net investment income | | | | | | | 3,771,534 | |
| | | | | | | | |
See notes to financial statements.
| | |
| |
| abfunds.com | | AB ALL MARKET INCOME PORTFOLIO | 45 |
STATEMENT OF OPERATIONS(continued)
| | | | | | | | |
| Realized and Unrealized Gain (Loss) on Investment and Foreign Currency Transactions | | | | | | | | |
Net realized gain (loss) on: | | | | | | | | |
Affiliated Underlying Portfolios | | | | | | $ | (3,111,517 | ) |
Investment transactions(a) | | | | | | | (862,795 | ) |
Forward currency exchange contracts | | | | | | | 922,108 | |
Futures | | | | | | | 720,934 | |
Options written | | | | | | | (364,108 | ) |
Swaps | | | | | | | 1,904,144 | |
Foreign currency transactions | | | | | | | (216,772 | ) |
Net change in unrealized appreciation/depreciation of: | | | | | | | | |
Affiliated Underlying Portfolios | | | | | | | 3,974,163 | |
Investments(b) | | | | | | | 4,537,898 | |
Forward currency exchange contracts | | | | | | | (43,018 | ) |
Futures | | | | | | | (261,868 | ) |
Options written | | | | | | | (17,056 | ) |
Swaps | | | | | | | 457,224 | |
Foreign currency denominated assets and liabilities | | | | | | | 37,726 | |
| | | | | | | | |
Net gain on investment and foreign currency transactions | | | | | | | 7,677,063 | |
| | | | | | | | |
Net Increase in Net Assets from Operations | | | | | | $ | 11,448,597 | |
| | | | | | | | |
| (a) | Net of foreign capital gains taxes of $2,743. |
| (b) | Net of increase in accrued foreign capital gains taxes of $871. |
See notes to financial statements.
| | |
| |
| 46 | AB ALL MARKET INCOME PORTFOLIO | | abfunds.com |
STATEMENT OF CHANGES IN NET ASSETS
| | | | | | | | |
| | | Year Ended
November 30,
2019 | | | Year Ended
November 30,
2018 | |
| Increase (Decrease) in Net Assets from Operations | | | | | | | | |
Net investment income | | $ | 3,771,534 | | | $ | 5,769,185 | |
Net realized loss on investment and foreign currency transactions | | | (1,008,006 | ) | | | (3,190,201 | ) |
Net change in unrealized appreciation/depreciation of investments and foreign currency denominated assets and liabilities | | | 8,685,069 | | | | (7,917,084 | ) |
Contributions from Affiliates (see Note B) | | | – 0 | – | | | 297 | |
| | | | | | | | |
Net increase (decrease) in net assets from operations | | | 11,448,597 | | | | (5,337,803 | ) |
Distributions to Shareholders | | | | | | | | |
Class A | | | (295,752 | ) | | | (348,982 | ) |
Class C | | | (33,952 | ) | | | (30,983 | ) |
Advisor Class | | | (4,400,064 | ) | | | (6,879,566 | ) |
| Capital Stock Transactions | | | | | | | | |
Net increase (decrease) | | | (2,700,241 | ) | | | 21,377,562 | |
| | | | | | | | |
Total increase | | | 4,018,588 | | | | 8,780,228 | |
| Net Assets | | | | | | | | |
Beginning of period | | | 104,120,293 | | | | 95,340,065 | |
| | | | | | | | |
End of period | | $ | 108,138,881 | | | $ | 104,120,293 | |
| | | | | | | | |
See notes to financial statements.
| | |
| |
| abfunds.com | | AB ALL MARKET INCOME PORTFOLIO | 47 |
NOTES TO FINANCIAL STATEMENTS
November 30, 2019
NOTE A
Significant Accounting Policies
AB Cap Fund, Inc. (the “Company”), which is a Maryland corporation, is registered under the Investment Company Act of 1940 as anopen-end management investment company. The Company operates as a series company currently comprised of 28 portfolios. Each portfolio is considered to be a separate entity for financial reporting and tax purposes. This report relates only to the AB All Market Income Portfolio (the “Fund”), a diversified portfolio. The Fund has authorized the issuance of Class A, Class B, Class C, Advisor Class, Class R, Class K, Class I, Class Z, Class T, Class 1 and Class 2 shares. Class B, Class R, Class K, Class I, Class Z, Class T, Class 1 and Class 2 shares have not been issued. Class A shares are sold with afront-end sales charge of up to 4.25% for purchases not exceeding $1,000,000. With respect to purchases of $1,000,000 or more, Class A shares redeemed within one year of purchase may be subject to a contingent deferred sales charge of 1%. Class C shares are subject to a contingent deferred sales charge of 1% on redemptions made within the first year after purchase, and 0% after the first year of purchase. Class C shares will automatically convert to Class A shares ten years after the end of the calendar month of purchase. Advisor Class shares are sold without any initial or contingent deferred sales charge and are not subject to ongoing distribution expenses. All eleven classes of shares have identical voting, dividend, liquidation and other rights, except that the classes bear different distribution and transfer agency expenses. Each class has exclusive voting rights with respect to its distribution plan. The financial statements have been prepared in conformity with U.S. generally accepted accounting principles (“U.S. GAAP”) which require management to make certain estimates and assumptions that affect the reported amounts of assets and liabilities in the financial statements and amounts of income and expenses during the reporting period. Actual results could differ from those estimates. The Fund is an investment company under U.S. GAAP and follows the accounting and reporting guidance applicable to investment companies. The following is a summary of significant accounting policies followed by the Fund.
1. Security Valuation
Portfolio securities are valued at their current market value determined on the basis of market quotations or, if market quotations are not readily available or are deemed unreliable, at “fair value” as determined in accordance with procedures established by and under the general supervision of the Company’s Board of Directors (the “Board”).
In general, the market values of securities which are readily available and deemed reliable are determined as follows: securities listed on a national securities exchange (other than securities listed on the NASDAQ Stock
| | |
| |
| 48 | AB ALL MARKET INCOME PORTFOLIO | | abfunds.com |
NOTES TO FINANCIAL STATEMENTS(continued)
Market, Inc. (“NASDAQ”)) or on a foreign securities exchange are valued at the last sale price at the close of the exchange or foreign securities exchange. If there has been no sale on such day, the securities are valued at the last traded price from the previous day. Securities listed on more than one exchange are valued by reference to the principal exchange on which the securities are traded; securities listed only on NASDAQ are valued in accordance with the NASDAQ Official Closing Price; listed or over the counter (“OTC”) market put or call options are valued at the mid level between the current bid and ask prices. If either a current bid or current ask price is unavailable, AllianceBernstein L.P. (the “Adviser”) will have discretion to determine the best valuation (e.g., last trade price in the case of listed options); open futures are valued using the closing settlement price or, in the absence of such a price, the most recent quoted bid price. If there are no quotations available for the day of valuation, the last available closing settlement price is used; U.S. Government securities and any other debt instruments having 60 days or less remaining until maturity are generally valued at market by an independent pricing vendor, if a market price is available. If a market price is not available, the securities are valued at amortized cost. This methodology is commonly used for short term securities that have an original maturity of 60 days or less, as well as short term securities that had an original term to maturity that exceeded 60 days. In instances when amortized cost is utilized, the Valuation Committee (the “Committee”) must reasonably conclude that the utilization of amortized cost is approximately the same as the fair value of the security. Such factors the Committee will consider include, but are not limited to, an impairment of the creditworthiness of the issuer or material changes in interest rates. Fixed-income securities, including mortgage-backed and asset-backed securities, may be valued on the basis of prices provided by a pricing service or at a price obtained from one or more of the major broker-dealers. In cases where broker-dealer quotes are obtained, the Adviser may establish procedures whereby changes in market yields or spreads are used to adjust, on a daily basis, a recently obtained quoted price on a security. Swaps and other derivatives are valued daily, primarily using independent pricing services, independent pricing models using market inputs, as well as third party broker-dealers or counterparties. Open end mutual funds are valued at the closing net asset value per share, while exchange traded funds are valued at the closing market price per share.
Securities for which market quotations are not readily available (including restricted securities) or are deemed unreliable are valued at fair value as deemed appropriate by the Adviser. Factors considered in making this determination may include, but are not limited to, information obtained by contacting the issuer, analysts, analysis of the issuer’s financial statements or other available documents. In addition, the Fund may use fair value pricing for securities primarily traded innon-U.S. markets because most foreign
| | |
| |
| abfunds.com | | AB ALL MARKET INCOME PORTFOLIO | 49 |
NOTES TO FINANCIAL STATEMENTS(continued)
markets close well before the Fund values its securities at 4:00 p.m., Eastern Time. The earlier close of these foreign markets gives rise to the possibility that significant events, including broad market moves, may have occurred in the interim and may materially affect the value of those securities. To account for this, the Fund generally values many of its foreign equity securities using fair value prices based on third party vendor modeling tools to the extent available.
2. Fair Value Measurements
In accordance with U.S. GAAP regarding fair value measurements, fair value is defined as the price that the Fund would receive to sell an asset or pay to transfer a liability in an orderly transaction between market participants at the measurement date. U.S. GAAP establishes a framework for measuring fair value, and a three-level hierarchy for fair value measurements based upon the transparency of inputs to the valuation of an asset or liability (including those valued based on their market values as described in Note A.1 above). Inputs may be observable or unobservable and refer broadly to the assumptions that market participants would use in pricing the asset or liability. Observable inputs reflect the assumptions market participants would use in pricing the asset or liability based on market data obtained from sources independent of the Fund. Unobservable inputs reflect the Fund’s own assumptions about the assumptions that market participants would use in pricing the asset or liability based on the best information available in the circumstances. Each investment is assigned a level based upon the observability of the inputs which are significant to the overall valuation. The three-tier hierarchy of inputs is summarized below.
| | • | | Level 1—quoted prices in active markets for identical investments |
| | • | | Level 2—other significant observable inputs (including quoted prices for similar investments, interest rates, prepayment speeds, credit risk, etc.) |
| | • | | Level 3—significant unobservable inputs (including the Fund’s own assumptions in determining the fair value of investments) |
The fair value of debt instruments, such as bonds, andover-the-counter derivatives is generally based on market price quotations, recently executed market transactions (where observable) or industry recognized modeling techniques and are generally classified as Level 2. Pricing vendor inputs to Level 2 valuations may include quoted prices for similar investments in active markets, interest rate curves, coupon rates, currency rates, yield curves, option adjusted spreads, default rates, credit spreads and other unique security features in order to estimate the relevant cash flows which are then discounted to calculate fair values. If these inputs are unobservable and significant to the fair value, these investments will be classified as Level 3.
| | |
| |
| 50 | AB ALL MARKET INCOME PORTFOLIO | | abfunds.com |
NOTES TO FINANCIAL STATEMENTS(continued)
Where readily available market prices or relevant bid prices are not available for certain equity investments, such investments may be valued based on similar publicly traded investments, movements in relevant indices since last available prices or based upon underlying company fundamentals and comparable company data (such as multiples to earnings or other multiples to equity). Where an investment is valued using an observable input, such as another publicly traded security, the investment will be classified as Level 2. If management determines that an adjustment is appropriate based on restrictions on resale, illiquidity or uncertainty, and such adjustment is a significant component of the valuation, the investment will be classified as Level 3. An investment will also be classified as Level 3 where management uses company fundamentals and other significant inputs to determine the valuation.
Options are valued using market-based inputs to models, broker or dealer quotations, or alternative pricing sources with reasonable levels of price transparency, where such inputs and models are available. Alternatively, the values may be obtained through unobservable management determined inputs and/or management’s proprietary models. Where models are used, the selection of a particular model to value an option depends upon the contractual terms of, and specific risks inherent in, the option as well as the availability of pricing information in the market. Valuation models require a variety of inputs, including contractual terms, market prices, measures of volatility and correlations of such inputs. Exchange traded options generally will be classified as Level 2. For options that do not trade on exchange but trade in liquid markets, inputs can generally be verified and model selection does not involve significant management judgment. Options are classified within Level 2 on the fair value hierarchy when all of the significant inputs can be corroborated to market evidence. Otherwise such instruments are classified as Level 3.
The following table summarizes the valuation of the Fund’s investments by the above fair value hierarchy levels as of November 30, 2019:
| | | | | | | | | | | | | | | | |
Investments in Securities: | | Level 1 | | | Level 2 | | | Level 3 | | | Total | |
Assets: | | | | | | | | | | | | | | | | |
Investment Companies | | $ | 47,660,273 | | | $ | – 0 | – | | $ | – 0 | – | | $ | 47,660,273 | |
Common Stocks: | | | | | | | | | | | | | | | | |
Financials | | | 3,777,273 | | | | 2,144,348 | | | | – 0 | – | | | 5,921,621 | |
Information Technology | | | 5,428,696 | | | | 378,086 | | | | – 0 | – | | | 5,806,782 | |
Consumer Discretionary | | | 2,097,241 | | | | 1,204,069 | | | | – 0 | – | | | 3,301,310 | |
Health Care | | | 2,961,448 | | | | 148,283 | | | | – 0 | – | | | 3,109,731 | |
Industrials | | | 1,321,469 | | | | 1,530,137 | | | | – 0 | – | | | 2,851,606 | |
Energy | | | 2,271,652 | | | | 424,915 | | | | – 0 | – | | | 2,696,567 | |
Communication Services | | | 1,805,100 | | | | 540,135 | | | | – 0 | – | | | 2,345,235 | |
Consumer Staples | | | 1,546,597 | | | | 617,713 | | | | – 0 | – | | | 2,164,310 | |
| | |
| |
| abfunds.com | | AB ALL MARKET INCOME PORTFOLIO | 51 |
NOTES TO FINANCIAL STATEMENTS(continued)
| | | | | | | | | | | | | | | | |
Investments in Securities: | | Level 1 | | | Level 2 | | | Level 3 | | | Total | |
Utilities | | $ | 1,138,895 | | | $ | 692,511 | | | $ | – 0 | – | | $ | 1,831,406 | |
Real Estate | | | 1,033,057 | | | | 713,820 | | | | – 0 | – | | | 1,746,877 | |
Materials | | | 261,300 | | | | 1,075,129 | | | | – 0 | – | | | 1,336,429 | |
Preferred Stocks | | | 6,578,416 | | | | – 0 | – | | | – 0 | – | | | 6,578,416 | |
Emerging Markets – Sovereigns | | | – 0 | – | | | 4,012,437 | | | | – 0 | – | | | 4,012,437 | |
Governments – Treasuries | | | – 0 | – | | | 197,252 | | | | – 0 | – | | | 197,252 | |
Quasi-Sovereigns | | | – 0 | – | | | 103,984 | | | | – 0 | – | | | 103,984 | |
Emerging Markets – Treasuries | | | – 0 | – | | | 89,905 | | | | – 0 | – | | | 89,905 | |
Short-Term Investments: | | | | | | | | | | | | | | | | |
Investment Companies | | | 12,176,200 | | | | – 0 | – | | | – 0 | – | | | 12,176,200 | |
Governments – Treasuries | | | – 0 | – | | | 168,194 | | | | – 0 | – | | | 168,194 | |
Investments of Cash Collateral for Securities Loaned in Affiliated Money Market Fund | | | 3,631,826 | | | | – 0 | – | | | – 0 | – | | | 3,631,826 | |
| | | | | | | | | | | | | | | | |
Total Investments in Securities | | | 93,689,443 | | | | 14,040,918 | | | | – 0 | – | | | 107,730,361 | |
Other Financial Instruments(a): | | | | | | | | | | | | | | | | |
Assets: | | | | | | | | | | | | | | | | |
Futures | | | 56,810 | | | | 68,865 | | | | – 0 | – | | | 125,675 | (b) |
Forward Currency Exchange Contracts | | | – 0 | – | | | 397,925 | | | | – 0 | – | | | 397,925 | |
Centrally Cleared Credit Default Swaps | | | – 0 | – | | | 316,972 | | | | – 0 | – | | | 316,972 | (b) |
Centrally Cleared Interest Rate Swaps | | | – 0 | – | | | 619,892 | | | | – 0 | – | | | 619,892 | (b) |
Inflation (CPI) Swaps | | | – 0 | – | | | 49,467 | | | | – 0 | – | | | 49,467 | |
Total Return Swaps | | | – 0 | – | | | 167,135 | | | | – 0 | – | | | 167,135 | |
Liabilities: | | | | | | | | | | | | | | | | |
Futures | | | (199,057 | ) | | | (121,958 | ) | | | – 0 | – | | | (321,015 | )(b) |
Forward Currency Exchange Contracts | | | – 0 | – | | | (224,650 | ) | | | – 0 | – | | | (224,650 | ) |
Call Options Written | | | – 0 | – | | | (10,039 | ) | | | – 0 | – | | | (10,039 | ) |
Put Options Written | | | – 0 | – | | | (25,822 | ) | | | – 0 | – | | | (25,822 | ) |
Centrally Cleared Interest Rate Swaps | | | – 0 | – | | | (94,782 | ) | | | – 0 | – | | | (94,782 | )(b) |
Inflation (CPI) Swaps | | | – 0 | – | | | (178,745 | ) | | | – 0 | – | | | (178,745 | ) |
Total Return Swaps | | | – 0 | – | | | (4,387 | ) | | | – 0 | – | | | (4,387 | ) |
| | | | | | | | | | | | | | | | |
Total | | $ | 93,547,196 | | | $ | 15,000,791 | | | $ | – 0 | – | | $ | 108,547,987 | |
| | | | | | | | | | | | | | | | |
| (a) | Other financial instruments are derivative instruments, such as futures, forwards and swaps, which are valued at the unrealized appreciation/(depreciation) on the instrument. Other financial instruments may also include swaps with upfront premiums, options written and swaptions written which are valued at market value. |
| (b) | Only variation margin receivable/(payable) at period end is reported within the statement of assets and liabilities. This amount reflects cumulative unrealized appreciation/(depreciation) on futures and centrally cleared swaps as reported in the portfolio of investments. Where applicable, centrally cleared swaps with upfront premiums are presented here at market value. |
3. Currency Translation
Assets and liabilities denominated in foreign currencies and commitments under forward currency exchange contracts are translated into U.S. dollars at the mean of the quoted bid and ask prices of such currencies against the U.S. dollar. Purchases and sales of portfolio securities are translated
| | |
| |
| 52 | AB ALL MARKET INCOME PORTFOLIO | | abfunds.com |
NOTES TO FINANCIAL STATEMENTS(continued)
into U.S. dollars at the rates of exchange prevailing when such securities were acquired or sold. Income and expenses are translated into U.S. dollars at rates of exchange prevailing when accrued.
Net realized gain or loss on foreign currency transactions represents foreign exchange gains and losses from sales and maturities of foreign fixed income investments, holding of foreign currencies, currency gains or losses realized between the trade and settlement dates on foreign investment transactions, and the difference between the amounts of dividends, interest and foreign withholding taxes recorded on the Fund’s books and the U.S. dollar equivalent amounts actually received or paid. Net unrealized currency gains and losses from valuing foreign currency denominated assets and liabilities at period end exchange rates are reflected as a component of net unrealized appreciation or depreciation of foreign currency denominated assets and liabilities.
4. Taxes
It is the Fund’s policy to meet the requirements of the Internal Revenue Code applicable to regulated investment companies and to distribute all of its investment company taxable income and net realized gains, if any, to shareholders. Therefore, no provisions for federal income or excise taxes are required. The Fund may be subject to taxes imposed by countries in which it invests. Such taxes are generally based on income and/or capital gains earned or repatriated. Taxes are accrued and applied to net investment income, net realized gains and net unrealized appreciation/depreciation as such income and/or gains are earned.
In accordance with U.S. GAAP requirements regarding accounting for uncertainties in income taxes, management has analyzed the Fund’s tax positions taken or expected to be taken on federal and state income tax returns for all open tax years (the current and the prior three tax years) and has concluded that no provision for income tax is required in the Fund’s financial statements.
5. Investment Income and Investment Transactions
Dividend income is recorded on theex-dividend date or as soon as the Fund is informed of the dividend. Interest income is accrued daily. Investment transactions are accounted for on the date the securities are purchased or sold. Investment gains or losses are determined on the identified cost basis. The Fund amortizes premiums and accretes discounts as adjustments to interest income.
6. Class Allocations
All income earned and expenses incurred by the Fund are borne on apro-rata basis by each outstanding class of shares, based on the proportionate interest in the Fund represented by the net assets of such class,
| | |
| |
| abfunds.com | | AB ALL MARKET INCOME PORTFOLIO | 53 |
NOTES TO FINANCIAL STATEMENTS(continued)
except for class specific expenses which are allocated to the respective class. Expenses of the Company are charged proportionately to each portfolio or based on other appropriate methods. Realized and unrealized gains and losses are allocated among the various share classes based on respective net assets.
7. Dividends and Distributions
Dividends and distributions to shareholders, if any, are recorded on theex-dividend date. Income dividends and capital gains distributions are determined in accordance with federal tax regulations and may differ from those determined in accordance with U.S. GAAP. To the extent these differences are permanent, such amounts are reclassified within the capital accounts based on their federal tax basis treatment; temporary differences do not require such reclassification.
NOTE B
Advisory Fee and Other Transactions with Affiliates
Under the terms of the investment advisory agreement, the Fund pays the Adviser an advisory fee at an annual rate of .55% of the first $2.5 billion, .45% for the next $2.5 billion and .40% in excess of $5 billion, of the Fund’s average daily net assets. The Adviser has agreed to waive its fees and bear certain expenses to the extent necessary to limit total operating expenses (excluding acquired fund fees and expenses, interest expense, taxes, extraordinary expenses, and brokerage commissions and other transaction costs) on an annual basis (the “Expense Caps”) to ..99%, 1.74% and .74% of daily average net assets for Class A, Class C, and Advisor Class shares, respectively. For the year ended November 30, 2019, such reimbursements/waivers amounted to $333,497. The Expense Caps may not be terminated by the Adviser before February 28, 2020. Any fees waived and expenses borne by the Adviser through May 10, 2016 are subject to repayment by the Fund until the end of the third fiscal year after the fiscal period in which the fee were waived or the expense were borne; such waivers that are subject to repayment amounted to $192,023 for the year ended November 30, 2016. In any case, no reimbursement payment will be made that would cause the Fund’s total annual fund operating expenses to exceed the Expense Caps’ net fee percentages set forth above.
Pursuant to the investment advisory agreement, the Fund may reimburse the Adviser for certain legal and accounting services provided to the Fund by the Adviser. For the year ended November 30, 2019, the Adviser voluntarily agreed to waive such fees in the amount of $81,331.
The Fund compensates AllianceBernstein Investor Services, Inc. (“ABIS”), a wholly-owned subsidiary of the Adviser, under a Transfer Agency Agreement for providing personnel and facilities to perform transfer agency
| | |
| |
| 54 | AB ALL MARKET INCOME PORTFOLIO | | abfunds.com |
NOTES TO FINANCIAL STATEMENTS(continued)
services for the Fund. ABIS may make payments to intermediaries that provide omnibus account services,sub-accounting services and/or networking services. Such compensation retained by ABIS amounted to $17,883 for the year ended November 30, 2019.
AllianceBernstein Investments, Inc. (the “Distributor”), a wholly-owned subsidiary of the Adviser, serves as the distributor of the Fund’s shares. The Distributor has advised the Fund that it has retainedfront-end sales charges of $1,696 from the sale of Class A shares and received $0 and $0 in contingent deferred sales charges imposed upon redemptions by shareholders of Class A and Class C shares, respectively, for the year ended November 30, 2019.
The Fund may invest in AB Government Money Market Portfolio (the “Government Money Market Portfolio”) which has a contractual annual advisory fee rate of .20% of the portfolio’s average daily net assets and bears its own expenses. The Adviser has contractually agreed to waive .10% of the advisory fee of Government Money Market Portfolio (resulting in a net advisory fee of .10%) until August 31, 2020. In connection with the investment by the Fund in Government Money Market Portfolio, the Adviser has contractually agreed to waive its advisory fee from the Fund in an amount equal to the Fund’s pro rata share of the effective advisory fee of Government Money Market Portfolio, as borne indirectly by the Fund as an acquired fund fee and expense. For the year ended November 30, 2019, such waiver amounted to $14,799.
The Fund currently invests in AB High Income Fund, Inc. (“ABHI”), anopen-end management investment company managed by the Adviser. The Adviser has contractually agreed to waive its management fees and/or bear Fund expenses through February 28, 2020 in an amount equal to the Fund’s proportionate share of all advisory fees and other expenses of ABHI that are indirectly borne by the Fund. For the year ended November 30, 2019, such waiver amounted to $201,260.
A summary of the Fund’s transactions in AB mutual funds for the year ended November 30, 2019 is as follows:
| | | | | | | | | | | | | | | | | | | | | | | | | | | | | | | | |
| | | | Distributions | |
| Fund | | Market
Value
11/30/18
(000) | | | Purchases
at Cost
(000) | | | Sales
Proceeds
(000) | | | Realized
Gain
(Loss)
(000) | | | Change in
Unrealized
Appr./
(Depr.)
(000) | | | Market
Value
11/30/19
(000) | | | Dividend
Income
(000) | | | Realized
Gains
(000) | |
Government Money Market Portfolio | | $ | 3,669 | | | $ | 125,529 | | | $ | 117,022 | | | $ | – 0 | – | | $ | – 0 | – | | $ | 12,176 | | | $ | 323 | | | $ | – 0 | – |
| | |
| |
| abfunds.com | | AB ALL MARKET INCOME PORTFOLIO | 55 |
NOTES TO FINANCIAL STATEMENTS(continued)
| | | | | | | | | | | | | | | | | | | | | | | | | | | | | | | | |
| | | | Distributions | |
| Fund | | Market
Value
11/30/18
(000) | | | Purchases
at Cost
(000) | | | Sales
Proceeds
(000) | | | Realized
Gain
(Loss)
(000) | | | Change in
Unrealized
Appr./
(Depr.)
(000) | | | Market
Value
11/30/19
(000) | | | Dividend
Income
(000) | | | Realized
Gains
(000) | |
AB High Income Fund, Inc. | | $ | 52,851 | | | $ | 12,043 | | | $ | 26,809 | | | $ | (3,112 | ) | | $ | 3,974 | | | $ | 38,947 | | | $ | 2,630 | | | $ | – 0 | – |
Government Money Market Portfolio* | | | 3,128 | | | | 34,248 | | | | 33,744 | | | | – 0 | – | | | – 0 | – | | | 3,632 | | | | 34 | | | | – 0 | – |
| | | | | | | | | | | | | | | | | | | | | | | | | | | | | | | | |
Total | | | | | | | | | | | | | | $ | (3,112 | ) | | $ | 3,974 | | | $ | 54,755 | | | $ | 2,987 | | | $ | – 0 | – |
| | | | | | | | | | | | | | | | | | | | | | | | | | | | | | | | |
| * | Investments of cash collateral for securities lending transactions (see Note E). |
During the year ended November 30, 2018, the Adviser reimbursed the Fund $297 for trading losses incurred due to a trade entry error.
During the second quarter of 2018, AXA S.A. (“AXA”), a French holding company for the AXA Group, a worldwide leader in life, property and casualty and health insurance and asset management, completed the sale of a minority stake in its subsidiary, AXA Equitable Holdings, Inc. (now named Equitable Holdings, Inc.)(“Equitable”), through an initial public offering. Equitable is the holding company for a diverse group of financial services companies, including an approximately 65.3% economic interest in the Adviser and a 100% interest in AllianceBernstein Corporation, the general partner of the Adviser. Since the initial sale, AXA has completed additional offerings, most recently during the fourth quarter of 2019. As a result, AXA currently owns 10.1% of the outstanding shares of common stock of Equitable, and no longer owns a controlling interest in Equitable. AXA previously announced its intention to sell its entire interest in Equitable over time, subject to market conditions and other factors (the “Plan”). Most of AXA’s remaining Equitable shares are to be delivered on redemption of AXA bonds mandatorily exchangeable into Equitable shares and maturing in May 2021. AXA retains sole discretion to determine the timing of any future sales of its remaining shares of Equitable common stock.
The latest transaction under the Plan, which occurred on November 13, 2019, resulted in the indirect transfer of a “controlling block” of voting securities of the Adviser (a “Change of Control Event”) and was deemed an “assignment” causing a termination of the Fund’s investment advisory agreement. In order to ensure that investment advisory services could continue uninterrupted in the event of a Change of Control Event, the Board previously approved a new investment advisory agreement with the Adviser. Shareholders of the Fund subsequently approved the new investment advisory agreement, which became effective on November 13, 2019.
| | |
| |
| 56 | AB ALL MARKET INCOME PORTFOLIO | | abfunds.com |
NOTES TO FINANCIAL STATEMENTS(continued)
NOTE C
Distribution Services Agreement
The Fund has adopted a Distribution Services Agreement (the “Agreement”) pursuant to Rule12b-1 under the Investment Company Act of 1940. Under the Agreement, the Fund pays distribution and servicing fees to the Distributor at an annual rate of up to .25% of the Fund’s average daily net assets attributable to Class A shares, 1% of the Fund’s average daily net assets attributable to Class C shares. There are no distribution and servicing fees on the Advisor Class shares. The fees are accrued daily and paid monthly. The Agreement provides that the Distributor will use such payments in their entirety for distribution assistance and promotional activities. Since the commencement of the Fund’s operations, the Distributor has incurred expenses in excess of the distribution costs reimbursed by the Fund in the amount of $3,602 for Class C shares. While such costs may be recovered from the Fund in future periods so long as the Agreement is in effect, the rate of the distribution and servicing fees payable under the Agreement may not be increased without a shareholder vote. In accordance with the Agreement, there is no provision for recovery of unreimbursed distribution costs incurred by the Distributor beyond the current fiscal year for Class A shares. The Agreement also provides that the Adviser may use its own resources to finance the distribution of the Fund’s shares.
NOTE D
Investment Transactions
Purchases and sales of investment securities (excluding short-term investments) for the year ended November 30, 2019 were as follows:
| | | | | | | | |
| | | Purchases | | | Sales | |
Investment securities (excluding U.S. government securities) | | $ | 64,642,966 | | | $ | 72,789,800 | |
U.S. government securities | | | – 0 | – | | | – 0 | – |
The cost of investments for federal income tax purposes, gross unrealized appreciation and unrealized depreciation are as follows:
| | | | |
Cost | | $ | 108,660,967 | |
| | | | |
Gross unrealized appreciation | | $ | 5,024,948 | |
Gross unrealized depreciation | | | (5,714,008 | ) |
| | | | |
Net unrealized depreciation | | $ | (689,060 | ) |
| | | | |
1. Derivative Financial Instruments
The Fund may use derivatives in an effort to earn income and enhance returns, to replace more traditional direct investments, to obtain exposure to otherwise inaccessible markets (collectively, “investment purposes”), or to hedge or adjust the risk profile of its portfolio.
| | |
| |
| abfunds.com | | AB ALL MARKET INCOME PORTFOLIO | 57 |
NOTES TO FINANCIAL STATEMENTS(continued)
The principal types of derivatives utilized by the Fund, as well as the methods in which they may be used are:
The Fund may buy or sell futures for investment purposes or for the purpose of hedging its portfolio against adverse effects of potential movements in the market. The Fund bears the market risk that arises from changes in the value of these instruments and the imperfect correlation between movements in the price of the futures and movements in the price of the assets, reference rates or indices which they are designed to track. Among other things, the Fund may purchase or sell futures for foreign currencies or options thereon fornon-hedging purposes as a means of making direct investment in foreign currencies, as described below under “Currency Transactions”.
At the time the Fund enters into futures, the Fund deposits and maintains as collateral an initial margin with the broker, as required by the exchange on which the transaction is effected. Such amount is shown as cash collateral due from broker on the statement of assets and liabilities. Pursuant to the contract, the Fund agrees to receive from or pay to the broker an amount of cash equal to the daily fluctuation in the value of the contract. Such receipts or payments are known as variation margin and are recorded by the Fund as unrealized gains or losses. Risks may arise from the potential inability of a counterparty to meet the terms of the contract. The credit/counterparty risk for exchange-traded futures is generally less than privately negotiated futures, since the clearinghouse, which is the issuer or counterparty to each exchange-traded future, has robust risk mitigation standards, including the requirement to provide initial and variation margin. When the contract is closed, the Fund records a realized gain or loss equal to the difference between the value of the contract at the time it was opened and the time it was closed.
During the year ended November 30, 2019, the Fund held futures for hedging andnon-hedging purposes.
| | • | | Forward Currency Exchange Contracts |
The Fund may enter into forward currency exchange contracts in order to hedge its exposure to changes in foreign currency exchange rates on its foreign portfolio holdings, to hedge certain firm purchase and sale commitments denominated in foreign currencies and fornon-hedging purposes as a means of making direct investments in foreign currencies, as described below under “Currency Transactions”.
| | |
| |
| 58 | AB ALL MARKET INCOME PORTFOLIO | | abfunds.com |
NOTES TO FINANCIAL STATEMENTS(continued)
A forward currency exchange contract is a commitment to purchase or sell a foreign currency at a future date at a negotiated forward rate. The gain or loss arising from the difference between the original contract and the closing of such contract would be included in net realized gain or loss on forward currency exchange contracts. Fluctuations in the value of open forward currency exchange contracts are recorded for financial reporting purposes as unrealized appreciation and/or depreciation by the Fund. Risks may arise from the potential inability of a counterparty to meet the terms of a contract and from unanticipated movements in the value of a foreign currency relative to the U.S. dollar.
During the year ended November 30, 2019, the Fund held forward currency exchange contracts for hedging andnon-hedging purposes.
For hedging and investment purposes, the Fund may purchase and write (sell) put and call options on U.S. and foreign securities, including government securities, and foreign currencies that are traded on U.S. and foreign securities exchanges andover-the-counter markets. Among other things, the Fund may use options transactions fornon-hedging purposes as a means of making direct investments in foreign currencies, as described below under “Currency Transactions” and may use options strategies involving the purchase and/or writing of various combinations of call and/or put options, for hedging and investment purposes.
The risk associated with purchasing an option is that the Fund pays a premium whether or not the option is exercised. Additionally, the Fund bears the risk of loss of the premium and change in market value should the counterparty not perform under the contract. If a put or call option purchased by the Fund were permitted to expire without being sold or exercised, its premium would represent a loss to the Fund. Put and call options purchased are accounted for in the same manner as portfolio securities. The cost of securities acquired through the exercise of call options is increased by premiums paid. The proceeds from securities sold through the exercise of put options are decreased by the premiums paid.
When the Fund writes an option, the premium received by the Fund is recorded as a liability and is subsequently adjusted to the current market value of the option written. The Fund’s maximum payment for written put options equates to the number of shares multiplied by the strike price. In certain circumstances maximum payout amounts may be partially offset by recovery values of the respective referenced assets and upfront premium received upon entering into the contract. Premiums received from written options which expire unexercised are
| | |
| |
| abfunds.com | | AB ALL MARKET INCOME PORTFOLIO | 59 |
NOTES TO FINANCIAL STATEMENTS(continued)
recorded by the Fund on the expiration date as realized gains from options written. The difference between the premium received and the amount paid on effecting a closing purchase transaction, including brokerage commissions, is also treated as a realized gain, or if the premium received is less than the amount paid for the closing purchase transaction, as a realized loss. If a call option is exercised, the premium received is added to the proceeds from the sale of the underlying security or currency in determining whether the Fund has realized a gain or loss. If a put option is exercised, the premium received reduces the cost basis of the security or currency purchased by the Fund. In writing an option, the Fund bears the market risk of an unfavorable change in the price of the security or currency underlying the written option. Exercise of an option written by the Fund could result in the Fund selling or buying a security or currency at a price different from the current market value.
During the year ended November 30, 2019, the Fund held written options for hedging andnon-hedging purposes.
The Fund may enter into swaps to hedge its exposure to interest rates, credit risk or currencies. The Fund may also enter into swaps fornon-hedging purposes as a means of gaining market exposures, making direct investments in foreign currencies, as described below under “Currency Transactions” or in order to take a “long” or “short” position with respect to an underlying referenced asset described below under “Total Return Swaps”. A swap is an agreement that obligates two parties to exchange a series of cash flows at specified intervals based upon or calculated by reference to changes in specified prices or rates for a specified amount of an underlying asset. The payment flows are usually netted against each other, with the difference being paid by one party to the other. In addition, collateral may be pledged or received by the Fund in accordance with the terms of the respective swaps to provide value and recourse to the Fund or its counterparties in the event of default, bankruptcy or insolvency by one of the parties to the swap.
Risks may arise as a result of the failure of the counterparty to the swap to comply with the terms of the swap. The loss incurred by the failure of a counterparty is generally limited to the net interim payment to be received by the Fund, and/or the termination value at the end of the contract. Therefore, the Fund considers the creditworthiness of each counterparty to a swap in evaluating potential counterparty risk. This risk is mitigated by having a netting arrangement between the Fund and the counterparty and by the posting of collateral by the counterparty to the Fund to cover the Fund’s exposure to the counterparty. Additionally,
| | |
| |
| 60 | AB ALL MARKET INCOME PORTFOLIO | | abfunds.com |
NOTES TO FINANCIAL STATEMENTS(continued)
risks may arise from unanticipated movements in interest rates or in the value of the underlying securities. The Fund accrues for the interim payments on swaps on a daily basis, with the net amount recorded within unrealized appreciation/depreciation of swaps on the statement of assets and liabilities, where applicable. Once the interim payments are settled in cash, the net amount is recorded as realized gain/(loss) on swaps on the statement of operations, in addition to any realized gain/(loss) recorded upon the termination of swaps. Upfront premiums paid or received for OTC swaps are recognized as cost or proceeds on the statement of assets and liabilities and are amortized on a straight line basis over the life of the contract. Amortized upfront premiums are included in net realized gain/(loss) from swaps on the statement of operations. Fluctuations in the value of swaps are recorded as a component of net change in unrealized appreciation/depreciation of swaps on the statement of operations.
Certain standardized swaps, including certain interest rate swaps and credit default swaps, are (or soon will be) subject to mandatory central clearing. Cleared swaps are transacted through futures commission merchants (“FCMs”) that are members of central clearinghouses, with the clearinghouse serving as central counterparty, similar to transactions in futures contracts. Centralized clearing will be required for additional categories of swaps on aphased-in basis based on requirements published by the Securities and Exchange Commission and Commodity Futures Trading Commission.
At the time the Fund enters into a centrally cleared swap, the Fund deposits and maintains as collateral an initial margin with the broker, as required by the clearinghouse on which the transaction is effected. Such amount is shown as cash collateral due from broker on the statement of assets and liabilities. Pursuant to the contract, the Fund agrees to receive from or pay to the broker an amount of cash equal to the daily fluctuation in the value of the contract. Such receipts or payments are known as variation margin and are recorded by the Fund as unrealized gains or losses. Risks may arise from the potential inability of a counterparty to meet the terms of the contract. The credit/counterparty risk for centrally cleared swaps is generally less thannon-centrally cleared swaps, since the clearinghouse, which is the issuer or counterparty to each centrally cleared swap, has robust risk mitigation standards, including the requirement to provide initial and variation margin. When the contract is closed, the Fund records a realized gain or loss equal to the difference between the value of the contract at the time it was opened and the time it was closed.
| | |
| |
| abfunds.com | | AB ALL MARKET INCOME PORTFOLIO | 61 |
NOTES TO FINANCIAL STATEMENTS(continued)
Interest Rate Swaps:
The Fund is subject to interest rate risk exposure in the normal course of pursuing its investment objectives. Because the Fund holds fixed rate bonds, the value of these bonds may decrease if interest rates rise. To help hedge against this risk and to maintain its ability to generate income at prevailing market rates, the Fund may enter into interest rate swaps. Interest rate swaps are agreements between two parties to exchange cash flows based on a notional amount. The Fund may elect to pay a fixed rate and receive a floating rate, or, receive a fixed rate and pay a floating rate on a notional amount.
In addition, the Fund may also enter into interest rate swap transactions to preserve a return or spread on a particular investment or portion of its portfolio, or protecting against an increase in the price of securities the Fund anticipates purchasing at a later date. Interest rate swaps involve the exchange by a Fund with another party of their respective commitments to pay or receive interest (e.g., an exchange of floating rate payments for fixed rate payments) computed based on a contractually-based principal (or “notional”) amount. Interest rate swaps are entered into on a net basis (i.e., the two payment streams are netted out, with the Fund receiving or paying, as the case may be, only the net amount of the two payments).
During the year ended November 30, 2019, the Fund held interest rate swaps for hedging andnon-hedging purposes.
Inflation (CPI) Swaps:
Inflation swap agreements are contracts in which one party agrees to pay the cumulative percentage increase in a price index (the Consumer Price Index with respect to CPI swaps) over the term of the swap (with some lag on the inflation index), and the other pays a compounded fixed rate. Inflation swaps may be used to protect the net asset value, or NAV, of a Fund against an unexpected change in the rate of inflation measured by an inflation index since the value of these agreements is expected to increase if there are unexpected inflation increases.
During the year ended November 30, 2019, the Fund held inflation (CPI) swaps for hedging andnon-hedging purposes.
Credit Default Swaps:
The Fund may enter into credit default swaps, including to manage its exposure to the market or certain sectors of the market, to reduce its risk exposure to defaults by corporate and sovereign issuers held by the Fund, or to create exposure to corporate or sovereign issuers to which it is not otherwise exposed. The Fund may purchase credit protection (“Buy Contract”) or provide credit protection (“Sale
| | |
| |
| 62 | AB ALL MARKET INCOME PORTFOLIO | | abfunds.com |
NOTES TO FINANCIAL STATEMENTS(continued)
Contract”) on the referenced obligation of the credit default swap. During the term of the swap, the Fund receives/(pays) fixed payments from/(to) the respective counterparty, calculated at the agreed upon rate applied to the notional amount. If the Fund is a buyer/(seller) of protection and a credit event occurs, as defined under the terms of the swap, the Fund will either (i) receive from the seller/(pay to the buyer) of protection an amount equal to the notional amount of the swap (the “Maximum Payout Amount”) and deliver/(take delivery of) the referenced obligation or (ii) receive/(pay) a net settlement amount in the form of cash or securities equal to the notional amount of the swap less the recovery value of the referenced obligation. In certain circumstances Maximum Payout Amounts may be partially offset by recovery values of the respective referenced obligations, upfront premium received upon entering into the agreement, or net amounts received from settlement of buy protection credit default swaps entered into by the Fund for the same referenced obligations with the same counterparty.
Credit default swaps may involve greater risks than if a Fund had invested in the referenced obligation directly. Credit default swaps are subject to general market risk, liquidity risk, counterparty risk and credit risk. If the Fund is a buyer of protection and no credit event occurs, it will lose the payments it made to its counterparty. If the Fund is a seller of protection and a credit event occurs, the value of the referenced obligation received by the Fund coupled with the periodic payments previously received, may be less than the Maximum Payout Amount it pays to the buyer, resulting in a net loss to the Fund.
Implied credit spreads over U.S. Treasuries of comparable maturity utilized in determining the market value of credit default swaps on issuers as of period end are disclosed in the portfolio of investments. The implied spreads serve as an indicator of the current status of the payment/performance risk and typically reflect the likelihood of default by the issuer of the referenced obligation. The implied credit spread of a particular reference obligation also reflects the cost of buying/selling protection and may reflect upfront payments required to be made to enter into the agreement. Widening credit spreads typically represent a deterioration of the referenced obligation’s credit soundness and greater likelihood of default or other credit event occurring as defined under the terms of the agreement. A credit spread identified as “Defaulted” indicates a credit event has occurred for the referenced obligation.
During the year ended November 30, 2019, the Fund held credit default swaps for hedging andnon-hedging purposes.
| | |
| |
| abfunds.com | | AB ALL MARKET INCOME PORTFOLIO | 63 |
NOTES TO FINANCIAL STATEMENTS(continued)
Total Return Swaps:
The Fund may enter into total return swaps in order to take a “long” or “short” position with respect to an underlying referenced asset. The Fund is subject to market price volatility of the underlying referenced asset. A total return swap involves commitments to pay interest in exchange for a market linked return based on a notional amount. To the extent that the total return of the security, group of securities or index underlying the transaction exceeds or falls short of the offsetting interest obligation, the Fund will receive a payment from or make a payment to the counterparty.
During the year ended November 30, 2019, the Fund held total return swaps for hedging andnon-hedging purposes.
The Fund typically enters into International Swaps and Derivatives Association, Inc. Master Agreements (“ISDA Master Agreement”) with its OTC derivative contract counterparties in order to, among other things, reduce its credit risk to OTC counterparties. ISDA Master Agreements include provisions for general obligations, representations, collateral and events of default or termination. Under an ISDA Master Agreement, the Fund typically may offset with the OTC counterparty certain derivative financial instruments’ payables and/or receivables with collateral held and/or posted and create one single net payment(close-out netting) in the event of default or termination. In the event of a default by an OTC counterparty, the return of collateral with market value in excess of the Fund’s net liability, held by the defaulting party, may be delayed or denied.
The Fund’s ISDA Master Agreements may contain provisions for early termination of OTC derivative transactions in the event the net assets of the Fund decline below specific levels (“net asset contingent features”). If these levels are triggered, the Fund’s OTC counterparty has the right to terminate such transaction and require the Fund to pay or receive a settlement amount in connection with the terminated transaction. If OTC derivatives were held at period end, please refer to netting arrangements by the OTC counterparty table below for additional details.
During the year ended November 30, 2019, the Fund had entered into the following derivatives:
| | | | | | | | | | | | |
| | | Asset Derivatives | | | Liability Derivatives | |
Derivative Type | | Statement of
Assets and
Liabilities Location | | Fair Value | | | Statement of
Assets and
Liabilities
Location | | Fair Value | |
Interest rate contracts | | Receivable/Payable for variation margin on futures | | $ | 10,690 | * | | Receivable/Payable for variation margin on futures | | $ | 54,314 | * |
| | |
| |
| 64 | AB ALL MARKET INCOME PORTFOLIO | | abfunds.com |
NOTES TO FINANCIAL STATEMENTS(continued)
| | | | | | | | | | | | |
| | | Asset Derivatives | | | Liability Derivatives | |
Derivative Type | | Statement of
Assets and
Liabilities
Location | | Fair Value | | | Statement of
Assets and
Liabilities
Location | | Fair Value | |
| | | | |
Equity contracts | | Receivable/Payable for variation margin on futures | | $ | 114,985 | * | | Receivable/Payable for variation margin on futures | | $ | 266,701 | * |
| | | | |
Credit contracts | | Receivable/Payable for variation margin on centrally cleared swaps | | | 51,401 | * | | | | | | |
| | | | |
Interest rate contracts | | Receivable/Payable for variation margin on centrally cleared swaps | | | 619,892 | * | | Receivable/Payable for variation margin on centrally cleared swaps | | | 94,782 | * |
| | | | |
Foreign currency contracts | | Unrealized appreciation on forward currency exchange contracts | | | 397,925 | | | Unrealized depreciation on forward currency exchange contracts | | | 224,650 | |
| | | | |
Equity contracts | | | | | | | | Options written, at value | | | 35,861 | |
| | | | |
Interest rate contracts | | Unrealized appreciation on inflation swaps | | | 49,467 | | | Unrealized depreciation on inflation swaps | | | 178,745 | |
| | | | |
Equity contracts | | Unrealized appreciation on total return swaps | | | 167,135 | | | Unrealized depreciation on total return swaps | | | 4,387 | |
| | | | | | | | | | | | |
Total | | | | $ | 1,411,495 | | | | | $ | 859,440 | |
| | | | | | | | | | | | |
| * | Only variation margin receivable/payable at period end is reported within the statement of assets and liabilities. This amount reflects cumulative unrealized appreciation/(depreciation) on futures and centrally cleared swaps as reported in the portfolio of investments. |
| | | | | | | | | | |
Derivative Type | | Location of
Gain or (Loss)
on Derivatives
Within Statement
of Operations | | Realized Gain
or (Loss) on
Derivatives | | | Change in
Unrealized
Appreciation or
(Depreciation) | |
Interest rate contracts | | Net realized gain (loss) on futures; Net change in unrealized appreciation/depreciation of futures | | $ | 449,339 | | | $ | (92,916 | ) |
| | | |
Equity contracts | | Net realized gain (loss) on futures; Net change in unrealized appreciation/depreciation of futures | | | 271,595 | | | | (168,952 | ) |
| | |
| |
| abfunds.com | | AB ALL MARKET INCOME PORTFOLIO | 65 |
NOTES TO FINANCIAL STATEMENTS(continued)
| | | | | | | | | | |
Derivative Type | | Location of
Gain or (Loss)
on Derivatives
Within Statement
of Operations | | Realized Gain
or (Loss) on
Derivatives | | | Change in
Unrealized
Appreciation or
(Depreciation) | |
| | | |
Foreign currency contracts | | Net realized gain (loss) on forward currency exchange contracts; Net change in unrealized appreciation/depreciation of forward currency exchange contracts | | $ | 922,108 | | | $ | (43,018 | ) |
| | | |
Equity contracts | | Net realized gain (loss) on options written; Net change in unrealized appreciation/depreciation of options written | | | (364,108 | ) | | | (17,056 | ) |
| | | |
Interest rate contracts | | Net realized gain (loss) on swaps; Net change in unrealized appreciation/depreciation of swaps | | | 19,722 | | | | 686,164 | |
| | | |
Credit contracts | | Net realized gain (loss) on swaps; Net change in unrealized appreciation/depreciation of swaps | | | 360,793 | | | | (391,688 | ) |
| | | |
Equity contracts | | Net realized gain (loss) on swaps; Net change in unrealized appreciation/depreciation of swaps | | | 1,523,629 | | | | 162,748 | |
| | | | | | | | | | |
Total | | | | $ | 3,183,078 | | | $ | 135,282 | |
| | | | | | | | | | |
The following table represents the average monthly volume of the Fund’s derivative transactions during the year ended November 30, 2019:
| | | | |
Futures: | | | | |
Average notional amount of buy contracts | | $ | 14,211,686 | |
Average notional amount of sale contracts | | $ | 6,114,217 | |
Forward Currency Exchange Contracts: | | | | |
Average principal amount of buy contracts | | $ | 18,086,909 | |
Average principal amount of sale contracts | | $ | 18,356,604 | |
Options Written: | | | | |
Average notional amount | | $ | 14,063,429 | |
Inflation Swaps: | | | | |
Average notional amount | | $ | 11,230,000 | |
| | |
| |
| 66 | AB ALL MARKET INCOME PORTFOLIO | | abfunds.com |
NOTES TO FINANCIAL STATEMENTS(continued)
| | | | |
Centrally Cleared Interest Rate Swaps: | | | | |
Average notional amount | | $ | 21,694,495 | |
Centrally Cleared Credit Default Swaps: | | | | |
Average notional amount of buy contracts | | $ | 1,294,844 | (a) |
Average notional amount of sale contracts | | $ | 2,942,291 | (b) |
Total Return Swaps: | | | | |
Average notional amount | | $ | 58,145,003 | |
| (a) | Positions were open for one month during the year. |
| (b) | Positions were open for five months during the year. |
For financial reporting purposes, the Fund does not offset derivative assets and derivative liabilities that are subject to netting arrangements in the statement of assets and liabilities.
All OTC derivatives held at period end were subject to netting arrangements. The following table presents the Fund’s derivative assets and liabilities by OTC counterparty net of amounts available for offset under ISDA Master Agreements (“MA”) and net of the related collateral received/pledged by the Fund as of November 30, 2019. Exchange-traded derivatives and centrally cleared swaps are not subject to netting arrangements and as such are excluded from the table.
| | | | | | | | | | | | | | | | | | | | |
Counterparty | | Derivative
Assets
Subject to
a MA | | | Derivatives
Available
for Offset | | | Cash
Collateral
Received* | | | Security
Collateral
Received* | | | Net
Amount of
Derivative
Assets | |
Barclays Bank PLC | | $ | 56,816 | | | $ | (9,420 | ) | | $ | – 0 | – | | $ | – 0 | – | | $ | 47,396 | |
BNP Paribas SA | | | 28,502 | | | | (28,502 | ) | | | – 0 | – | | | – 0 | – | | | – 0 | – |
Citibank, NA | | | 18,298 | | | | (18,298 | ) | | | – 0 | – | | | – 0 | – | | | – 0 | – |
Credit Suisse International | | | 19,160 | | | | (19,160 | ) | | | – 0 | – | | | – 0 | – | | | – 0 | – |
Deutsche Bank AG | | | 59,724 | | | | – 0 | – | | | – 0 | – | | | – 0 | – | | | 59,724 | |
Goldman Sachs International/Goldman Sachs Bank USA | | | 19,613 | | | | (19,613 | ) | | | – 0 | – | | | – 0 | – | | | – 0 | – |
JPMorgan Chase Bank, NA | | | 172,119 | | | | (12,632 | ) | | | – 0 | – | | | – 0 | – | | | 159,487 | |
Morgan Stanley Capital Services, Inc./Morgan Stanley Capital Services LLC | | | 89,853 | | | | (321 | ) | | | – 0 | – | | | – 0 | – | | | 89,532 | |
State Street Bank & Trust Co. | | | 87,628 | | | | (87,628 | ) | | | – 0 | – | | | – 0 | – | | | – 0 | – |
UBS AG | | | 62,814 | | | | (4,121 | ) | | | – 0 | – | | | – 0 | – | | | 58,693 | |
| | | | | | | | | | | | | | | | | | | | |
Total | | $ | 614,527 | | | $ | (199,695 | ) | | $ | – 0 | – | | $ | – 0 | – | | $ | 414,832 | ^ |
| | | | | | | | | | | | | | | | | | | | |
| | | | | |
Counterparty | | Derivative
Liabilities
Subject to
a MA | | | Derivatives
Available
for Offset | | | Cash
Collateral
Pledged* | | | Security
Collateral
Pledged* | | | Net
Amount of
Derivative
Liabilities | |
Bank of America, NA | | $ | 184,291 | | | $ | – 0 | – | | $ | (184,291 | ) | | $ | – 0 | – | | $ | – 0 | – |
Barclays Bank PLC | | | 9,420 | | | | (9,420 | ) | | | – 0 | – | | | – 0 | – | | | – 0 | – |
BNP Paribas SA | | | 39,694 | | | | (28,502 | ) | | | – 0 | – | | | – 0 | – | | | 11,192 | |
| | |
| |
| abfunds.com | | AB ALL MARKET INCOME PORTFOLIO | 67 |
NOTES TO FINANCIAL STATEMENTS(continued)
| | | | | | | | | | | | | | | | | | | | |
Counterparty | | Derivative
Liabilities
Subject to
a MA | | | Derivatives
Available
for Offset | | | Cash
Collateral
Pledged* | | | Security
Collateral
Pledged* | | | Net
Amount of
Derivative
Liabilities | |
Citibank, NA | | $ | 41,561 | | | $ | (18,298 | ) | | $ | – 0 | – | | $ | – 0 | – | | $ | 23,263 | |
Credit Suisse International | | | 21,320 | | | | (19,160 | ) | | | – 0 | – | | | – 0 | – | | | 2,160 | |
Goldman Sachs International/Goldman Sachs Bank USA | | | 37,403 | | | | (19,613 | ) | | | – 0 | – | | | – 0 | – | | | 17,790 | |
JPMorgan Chase Bank, NA | | | 12,632 | | | | (12,632 | ) | | | – 0 | – | | | – 0 | – | | | – 0 | – |
Morgan Stanley Capital Services, Inc./Morgan Stanley Capital Services LLC | | | 321 | | | | (321 | ) | | | – 0 | – | | | – 0 | – | | | – 0 | – |
State Street Bank & Trust Co. | | | 92,880 | | | | (87,628 | ) | | | – 0 | – | | | – 0 | – | | | 5,252 | |
UBS AG | | | 4,121 | | | | (4,121 | ) | | | – 0 | – | | | – 0 | – | | | – 0 | – |
| | | | | | | | | | | | | | | | | | | | |
Total | | $ | 443,643 | | | $ | (199,695 | ) | | $ | (184,291 | ) | | $ | – 0 | – | | $ | 59,657 | ^ |
| | | | | | | | | | | | | | | | | | | | |
| * | The actual collateral received/pledged may be more than the amount reported due to over-collateralization. |
| ^ | Net amount represents the net receivable/payable that would be due from/to the counterparty in the event of default or termination. The net amount from OTC financial derivative instruments can only be netted across transactions governed under the same master agreement with the same counterparty. |
2. Currency Transactions
The Fund may invest innon-U.S. Dollar-denominated securities on a currency hedged or unhedged basis. The Fund may seek investment opportunities by taking long or short positions in currencies through the use of currency-related derivatives, including forward currency exchange contracts, futures and options on futures, swaps, and other options. The Fund may enter into transactions for investment opportunities when it anticipates that a foreign currency will appreciate or depreciate in value but securities denominated in that currency are not held by the Fund and do not present attractive investment opportunities. Such transactions may also be used when the Adviser believes that it may be more efficient than a direct investment in a foreign currency-denominated security. The Fund may also conduct currency exchange contracts on a spot basis (i.e., for cash at the spot rate prevailing in the currency exchange market for buying or selling currencies).
NOTE E
Securities Lending
The Fund may enter into securities lending transactions. Under the Fund’s securities lending program, all loans of securities will be collateralized continually by cash collateral and/ornon-cash collateral.Non-cash collateral will include only securities issued or guaranteed by the U.S. government or its agencies or instrumentalities. The Fund cannot sell or repledge anynon-cash collateral, such collateral will not be reflected in the portfolio of investments. If a loan is collateralized by cash, the Fund will be compensated for the loan from a portion of the net return from the income earned on cash collateral after a rebate is paid to the borrower (in some cases, this rebate may be a “negative rebate” or fee paid by the borrower to the
| | |
| |
| 68 | AB ALL MARKET INCOME PORTFOLIO | | abfunds.com |
NOTES TO FINANCIAL STATEMENTS(continued)
Fund in connection with the loan), and payments are made for fees of the securities lending agent and for certain other administrative expenses. If the Fund receivesnon-cash collateral, the Fund will receive a fee from the borrower generally equal to a negotiated percentage of the market value of the loaned securities. The Fund will have the right to call a loan and obtain the securities loaned at any time on notice to the borrower within the normal and customary settlement time for the securities. While the securities are on loan, the borrower is obligated to pay the Fund amounts equal to any income or other distributions from the securities. The Fund will not be able to exercise voting rights with respect to any securities during the existence of a loan, but will have the right to regain ownership of loaned securities in order to exercise voting or other ownership rights. Collateral received and securities loaned are marked to market daily to ensure that the securities loaned are secured by collateral. The lending agent currently invests the cash collateral received in Government Money Market Portfolio, an eligible money market vehicle, in accordance with the investment restrictions of the Fund, and as approved by the Board. The collateral received on securities loaned is recorded as an asset as well as a corresponding liability in the statement of assets and liabilities. The collateral will be adjusted the next business day to maintain the required collateral amount. The amounts of securities lending income from the borrowers and Government Money Market Portfolio are reflected in the statement of operations. When the Fund earns net securities lending income from Government Money Market Portfolio, the income is inclusive of a rebate expense paid to the borrower. In connection with the cash collateral investment by the Fund in Government Money Market Portfolio, the Adviser has agreed to waive a portion of the Fund’s share of the advisory fees of Government Money Market Portfolio, as borne indirectly by the Fund as an acquired fund fee and expense. When the Fund lends securities, its investment performance will continue to reflect changes in the value of the securities loaned. A principal risk of lending portfolio securities is that the borrower may fail to return the loaned securities upon termination of the loan and that the collateral will not be sufficient to replace the loaned securities. The lending agent has agreed to indemnify the Fund in the case of default of any securities borrower.
A summary of the Fund’s transactions surrounding securities lending for the year ended November 30, 2019 is as follows:
| | | | | | | | | | | | | | | | | | | | | | |
Market Value
of Securities
on Loan* | | | Cash
Collateral* | | | Market Value
of Non-Cash
Collateral* | | | Income from
Borrowers | | | Government Money
Market Portfolio | |
| | Income
Earned | | | Advisory Fee
Waived | |
| $ | 6,322,857 | | | $ | 3,631,826 | | | $ | 2,882,959 | | | $ | 4,569 | | | $ | 34,120 | | | $ | 879 | |
| * | As of November 30, 2019. |
| | |
| |
| abfunds.com | | AB ALL MARKET INCOME PORTFOLIO | 69 |
NOTES TO FINANCIAL STATEMENTS(continued)
NOTE F
Capital Stock
Each class consists of 1,000,000,000 authorized shares. Transactions in capital shares for each class were as follows:
| | | | | | | | | | | | | | | | | | | | | | | | |
| | | | | | | | | | | | | | | | | | | | | | | | |
| | | Shares | | | | | | Amount | | | | |
| | | Year Ended
November 30,
2019 | | | Year Ended
November 30,
2018 | | | | | | Year Ended
November 30,
2019 | | | Year Ended
November 30,
2018 | | | | |
| | | | | | | | |
| Class A | | | | | | | | | | | | | | | | | | | | | | | | |
Shares sold | | | 188,088 | | | | 102,220 | | | | | | | $ | 1,776,194 | | | $ | 1,001,195 | | | | | |
| | | | | |
Shares issued in reinvestment of dividends and distributions | | | 26,790 | | | | 31,127 | | | | | | | | 256,931 | | | | 309,753 | | | | | |
| | | | | |
Shares redeemed | | | (65,268 | ) | | | (35,354 | ) | | | | | | | (614,489 | ) | | | (349,175 | ) | | | | |
| | | | | |
Net increase | | | 149,610 | | | | 97,993 | | | | | | | $ | 1,418,636 | | | $ | 961,773 | | | | | |
| | | | | |
| | | | | | | | | | | | | | | | | | | | | | | | |
| Class C | | | | | | | | | | | | | | | | | | | | | | | | |
Shares sold | | | 53,240 | | | | 51,008 | | | | | | | $ | 513,693 | | | $ | 509,381 | | | | | |
| | | | | |
Shares issued in reinvestment of dividends and distributions | | | 1,923 | | | | 2,604 | | | | | | | | 18,464 | | | | 25,923 | | | | | |
| | | | | |
Shares redeemed | | | (19,621 | ) | | | (18,708 | ) | | | | | | | (191,311 | ) | | | (184,314 | ) | | | | |
| | | | | |
Net increase | | | 35,542 | | | | 34,904 | | | | | | | $ | 340,846 | | | $ | 350,990 | | | | | |
| | | | | |
| | | | | | | | | | | | | | | | | | | | | | | | |
| Advisor Class | | | | | | | | | | | | | | | | | | | | | | | | |
Shares sold | | | 4,911,372 | | | | 6,630,521 | | | | | | | $ | 47,025,856 | | | $ | 66,324,482 | | | | | |
| | | | | |
Shares issued in reinvestment of dividends and distributions | | | 346,143 | | | | 469,334 | | | | | | | | 3,318,980 | | | | 4,669,341 | | | | | |
| | | | | |
Shares redeemed | | | (5,758,592 | ) | | | (5,181,003 | ) | | | | | | | (54,804,559 | ) | | | (50,929,024 | ) | | | | |
| | | | | |
Net increase (decrease) | | | (501,077 | ) | | | 1,918,852 | | | | | | | $ | (4,459,723 | ) | | $ | 20,064,799 | | | | | |
| | | | | |
NOTE G
Risks Involved in Investing in the Fund
Credit Risk—An issuer or guarantor of a fixed-income security, or the counterparty to a derivatives or other contract, may be unable or unwilling to make timely payments of interest or principal, or to otherwise honor its obligations. The issuer or guarantor may default, causing a loss of the full principal amount of a security and accrued interest. The degree of risk for a particular security may be reflected in its credit rating. There is the possibility that the credit rating of a fixed-income security may be downgraded after purchase, which may adversely affect the value of the security. Investments in fixed-income securities with lower ratings tend to have a higher probability that an issuer will default or fail to meet its payment obligations.
| | |
| |
| 70 | AB ALL MARKET INCOME PORTFOLIO | | abfunds.com |
NOTES TO FINANCIAL STATEMENTS(continued)
High Yield Debt Securities Risk—Investments in fixed-income securities with lower ratings (commonly known as “junk bonds”) tend to have a higher probability that an issuer will default or fail to meet its payment obligations. These securities may be subject to greater price volatility due to such factors as specific corporate developments, interest rate sensitivity, negative perceptions of the junk bond market generally and less secondary market liquidity.
Interest Rate Risk—Changes in interest rates will affect the value of investments in fixed-income securities. When interest rates rise, the value of existing investments in fixed-income securities tends to fall and this decrease in value may not be offset by higher income from new investments. Interest rate risk is generally greater for fixed-income securities with longer maturities or durations.
Inflation Risk—This is the risk that the value of assets or income from investments will be less in the future as inflation decreases the value of money. As inflation increases, the value of the Fund’s assets can decline as can the value of the Fund’s distributions. This risk is significantly greater for fixed-income securities with longer maturities.
Foreign(Non-U.S.) Risk—Investments in securities ofnon-U.S. issuers may involve more risk than those of U.S. issuers. These securities may fluctuate more widely in price and may be more difficult to trade or dispose of due to adverse market, economic, political, regulatory or other factors.
Emerging Market Risk—Investments in emerging market countries may have more risk because the markets are less developed and less liquid as well as being subject to increased economic, political, regulatory or other uncertainties.
Currency Risk—Fluctuations in currency exchange rates may negatively affect the value of the Fund’s investments or reduce its returns.
Derivatives Risk—The Fund may enter into derivative transactions such as forwards, options, futures and swaps. Derivatives may be illiquid, difficult to price, and leveraged so that small changes may produce disproportionate losses for the Fund, and subject to counterparty risk to a greater degree than more traditional investments. Derivatives may result in significant losses, including losses that are far greater than the value of the derivatives reflected on the statement of assets and liabilities.
Short Sale Risk—Short sales involve the risk that the Fund will incur a loss by subsequently buying a security at a higher price than the price at which it sold the security. The amount of such loss is theoretically
| | |
| |
| abfunds.com | | AB ALL MARKET INCOME PORTFOLIO | 71 |
NOTES TO FINANCIAL STATEMENTS(continued)
unlimited, as it will be based on the increase in value of the security sold short. In contrast, the risk of loss from a long position is limited to the Fund’s investment in the security, because the price of the security cannot fall below zero. The Fund may not always be able to close out a short position on favorable terms.
Leverage Risk—When the Fund borrows money or otherwise leverages its investments, its performance may be volatile because leverage tends to exaggerate the effect of any increase or decrease in the value of the Fund’s investments. The Fund may create leverage through the use of reverse repurchase arrangements, forward currency exchange contracts, forward commitments, dollar rolls or futures or by borrowing money. The use of other types of derivative instruments by the Fund, such as options and swaps, may also result in a form of leverage. Leverage may result in higher returns to the Fund than if the Fund were not leveraged, but may also adversely affect returns, particularly if the market is declining.
Illiquid Investments Risk—Illiquid investments risk exists when certain investments are or become difficult to purchase or sell. Difficulty in selling such investments may result in sales at disadvantageous prices affecting the value of your investment in the Fund. Causes of illiquid investments risk may include low trading volumes and large positions. Foreign fixed-income securities may have more illiquid investments risk because secondary trading markets for these securities may be smaller and less welldeveloped and the securities may trade less frequently. Illiquid investments risk may be higher in a rising interest rate environment, when the value and liquidity of fixed-income securities generally go down.
LIBOR Risk—The Fund may invest in certain debt securities, derivatives or other financial instruments that utilize the London Interbank Offered Rate, or “LIBOR,” as a “benchmark” or “reference rate” for various interest rate calculations. In July 2017, the United Kingdom Financial Conduct Authority, which regulates LIBOR, announced a desire to phase out the use of LIBOR by the end of 2021. Although financial regulators and industry working groups have suggested alternative reference rates, such as European Interbank Offer Rate (“EURIBOR”), Sterling Overnight Interbank Average Rate (“SONIA”) and Secured Overnight Financing Rate (“SOFR”), global consensus on alternative rates is lacking and the process for amending existing contracts or instruments to transition away from LIBOR remains unclear. The elimination of LIBOR or changes to other reference rates or any other changes or reforms to the determination or supervision of reference rates could have an adverse impact on the market for, or value of, any securities or payments linked to those reference rates, which may adversely affect the Fund’s performance and/or net asset value. Uncertainty and risk also remain regarding the willingness and ability
| | |
| |
| 72 | AB ALL MARKET INCOME PORTFOLIO | | abfunds.com |
NOTES TO FINANCIAL STATEMENTS(continued)
of issuers and lenders to include revised provisions in new and existing contracts or instruments. Consequently, the transition away from LIBOR to other reference rates may lead to increased volatility and illiquidity in markets that are tied to LIBOR, fluctuations in values of LIBOR-related investments or investments in issuers that utilize LIBOR, increased difficulty in borrowing or refinancing and diminished effectiveness of hedging strategies, adversely affecting the Fund’s performance. Furthermore, the risks associated with the expected discontinuation of LIBOR and transition may be exacerbated if the work necessary to effect an orderly transition to an alternative reference rate is not completed in a timely manner. Because the usefulness of LIBOR as a benchmark could deteriorate during the transition period, these effects could occur prior to the end of 2021.
Indemnification Risk—In the ordinary course of business, the Fund enters into contracts that contain a variety of indemnifications. The Fund’s maximum exposure under these arrangements is unknown. However, the Fund has not had prior claims or losses pursuant to these indemnification provisions and expects the risk of loss thereunder to be remote. Therefore, the Fund has not accrued any liability in connection with these indemnification provisions.
NOTE H
Joint Credit Facility
A number ofopen-end mutual funds managed by the Adviser, including the Fund, participate in a $325 million revolving credit facility (the “Facility”) intended to provide short-term financing, if necessary, subject to certain restrictions in connection with abnormal redemption activity. Commitment fees related to the Facility are paid by the participating funds and are included in miscellaneous expenses in the statement of operations. The Fund did not utilize the Facility during the year ended November 30, 2019.
NOTE I
Distributions to Shareholders
The tax character of distributions paid during the fiscal years ended November 30, 2019 and November 30, 2018 were as follows:
| | | | | | | | |
| | | 2019 | | | 2018 | |
Distributions paid from: | | | | | | | | |
Ordinary income | | $ | 4,729,768 | | | $ | 7,259,531 | |
| | | | | | | | |
Total taxable distributions | | $ | 4,729,768 | | | $ | 7,259,531 | |
| | | | | | | | |
| | |
| |
| abfunds.com | | AB ALL MARKET INCOME PORTFOLIO | 73 |
NOTES TO FINANCIAL STATEMENTS(continued)
As of November 30, 2019, the components of accumulated earnings/(deficit) on a tax basis were as follows:
| | | | |
Undistributed ordinary income | | $ | 9,912 | |
Accumulated capital and other losses | | | (2,305,365 | )(a) |
Unrealized appreciation/(depreciation) | | | (672,070 | )(b) |
| | | | |
Total accumulated earnings/(deficit) | | $ | (2,967,523 | )(c) |
| | | | |
| (a) | As of November 30, 2019, the Fund had a net capital loss carryforward of $2,305,365. |
| (b) | The differences between book-basis and tax-basis unrealized appreciation/(depreciation) are attributable primarily to the recognition for tax purposes of unrealized gains/losses on certain derivative instruments, the tax treatment of passive foreign investment companies (PFICs), the tax treatment of swaps, and the tax deferral of losses on wash sales. |
| (c) | The difference between book-basis and tax basis components of accumulated earnings/(deficit) is attributable primarily to the accrual of foreign capital gains tax. |
For tax purposes, net realized capital losses may be carried over to offset future capital gains, if any. Funds are permitted to carry forward capital losses for an indefinite period, and such losses will retain their character as either short-term or long-term capital losses. As of November 30, 2019, the Fund had a net short-term capital loss carryforward of $21,319 and a net long-term capital loss carryforward of $2,284,046, which may be carried forward for an indefinite period.
During the current fiscal year, permanent differences primarily due to taxable overdistributions resulted in a net decrease in accumulated loss and a net decrease in additional paid-in capital. These reclassifications had no effect on net assets.
NOTE J
Recent Accounting Pronouncements
In March 2017, the Financial Accounting Standards Board issued an Accounting Standards Update, ASU2017-08, Receivables—Nonrefundable Fees and Other Costs (Subtopic310-20), Premium Amortization on Purchased Callable Debt Securities which amends the amortization period for certain purchased callable debt securities held at a premium, shortening such period to the earliest call date. ASU2017-08 does not require any accounting change for debt securities held at a discount; the discount continues to be amortized to maturity. ASU2017-08 is effective for fiscal years, and interim periods within those fiscal years, beginning after December 15, 2018. At this time, management is evaluating the implications of these changes on the financial statements.
In August 2018, the Financial Accounting Standards Board issued an Accounting Standards Update, ASU2018-13, Fair Value Measurement (Topic 820), Disclosure Framework—Changes to the Disclosure Requirements for Fair Value Measurement which removes, modifies and adds disclosures to Topic 820. The amendments in this ASU2018-13 (“ASU”)
| | |
| |
| 74 | AB ALL MARKET INCOME PORTFOLIO | | abfunds.com |
NOTES TO FINANCIAL STATEMENTS(continued)
apply to all entities that are required, under existing U.S. GAAP, to make disclosures about recurring or nonrecurring fair value measurements. The amendments in this ASU are effective for all entities for fiscal years, and interim periods within those fiscal years, beginning after December 15, 2019. Management has evaluated the impact of the amendments and elected to early adopt the ASU. The adoption of this ASU did not have a material impact on the disclosure and presentation of the financial statements of the Fund.
NOTE K
Subsequent Events
Management has evaluated subsequent events for possible recognition or disclosure in the financial statements through the date the financial statements are issued. Management has determined that there are no material events that would require disclosure in the Fund’s financial statements through this date.
| | |
| |
| abfunds.com | | AB ALL MARKET INCOME PORTFOLIO | 75 |
FINANCIAL HIGHLIGHTS
Selected Data For A Share Of Capital Stock Outstanding Throughout Each Period
| | | | | | | | | | | | | | | | | | | | |
| | | Class A | |
| | | Year Ended November 30, | | | December 18,
2014(a) to
November 30, 2015 | |
| | | 2019 | | | 2018 | | | 2017 | | | 2016 | |
| | | | |
| | | | | | | | | | | | | | | | | | | | |
Net asset value, beginning of period | | | $ 9.30 | | | | $ 10.43 | | | | $ 9.90 | | | | $ 9.75 | | | | $ 10.00 | |
| | | | |
Income From Investment Operations | | | | | | | | | | | | | | | | | | | | |
| | | | | |
Net investment income(b)(c) | | | .33 | | | | .48 | | | | .45 | | | | .39 | | | | .35 | |
| | | | | |
Net realized and unrealized gain (loss) on investment and foreign currency transactions | | | .74 | | | | (.95 | ) | | | .72 | | | | .37 | | | | (.24 | ) |
| | | | | |
Contributions from Affiliates | | | – 0 | – | | | .00 | (d) | | | – 0 | – | | | – 0 | – | | | – 0 | – |
| | | | |
Net increase (decrease) in net asset value from operations | | | 1.07 | | | | (.47 | ) | | | 1.17 | | | | .76 | | | | .11 | |
| | | | |
Less: Dividends and Distributions | | | | | | | | | | | | | | | | | | | | |
| | | | | |
Dividends from net investment income | | | (.43 | ) | | | (.45 | ) | | | (.64 | ) | | | (.52 | ) | | | (.36 | ) |
| | | | | |
Distributions from net realized gain on investment transactions | | | – 0 | – | | | (.21 | ) | | | – 0 | – | | | (.09 | ) | | | – 0 | – |
| | | | |
Total dividends and distributions | | | (.43 | ) | | | (.66 | ) | | | (.64 | ) | | | (.61 | ) | | | (.36 | ) |
| | | | |
Net asset value, end of period | | | $ 9.94 | | | | $ 9.30 | | | | $ 10.43 | | | | $ 9.90 | | | | $ 9.75 | |
| | | | |
| | | | | |
Total Return | | | | | | | | | | | | | | | | | | | | |
| | | | | |
Total investment return based on net asset value(e) | | | 11.77 | % | | | (4.80 | )% | | | 12.30 | % | | | 8.20 | % | | | 1.04 | % |
| | | | | |
Ratios/Supplemental Data | | | | | | | | | | | | | | | | | | | | |
| | | | | |
Net assets, end of period (000’s omitted) | | | $7,463 | | | | $5,590 | | | | $5,247 | | | | $399 | | | | $18 | |
| | | | | |
Ratio to average net assets of: | | | | | | | | | | | | | | | | | | | | |
| | | | | |
Expenses, net of waivers/reimbursements(f)‡ | | | .78 | % | | | .74 | % | | | .76 | % | | | .78 | % | | | .77 | %^ |
| | | | | |
Expenses, before waivers/reimbursements(f)‡ | | | 1.41 | % | | | 1.37 | % | | | 1.80 | % | | | 3.91 | % | | | 3.92 | %^ |
| | | | | |
Net investment income(c) | | | 3.43 | % | | | 4.85 | % | | | 4.39 | % | | | 4.04 | % | | | 3.67 | %^ |
| | | | | |
Portfolio turnover rate | | | 77 | % | | | 74 | % | | | 69 | % | | | 94 | % | | | 88 | % |
| | | | | | | | | | | | | | | | | | | | |
| |
‡ Expense ratios exclude the estimated acquired fund fees of the affiliated/unaffiliated underlying | |
portfolios | | | .24 | % | | | .26 | % | | | .23 | % | | | .22 | % | | | .21 | %^ |
See footnote summary on page 79.
| | |
| |
| 76 | AB ALL MARKET INCOME PORTFOLIO | | abfunds.com |
FINANCIAL HIGHLIGHTS(continued)
Selected Data For A Share Of Capital Stock Outstanding Throughout Each Period
| | | | | | | | | | | | | | | | | | | | |
| | | Class C | |
| | | Year Ended November 30, | | | December 18,
2014(a) to
November 30, 2015 | |
| | | 2019 | | | 2018 | | | 2017 | | | 2016 | |
| | | | |
| | | | | | | | | | | | | | | | | | | | |
Net asset value, beginning of period | | | $ 9.30 | | | | $ 10.44 | | | | $ 9.90 | | | | $ 9.75 | | | | $ 10.00 | |
| | | | |
Income From Investment Operations | | | | | | | | | | | | | | | | | | | | |
| | | | | |
Net investment income(b)(c) | | | .25 | | | | .40 | | | | .37 | | | | .33 | | | | .28 | |
| | | | | |
Net realized and unrealized gain (loss) on investment and foreign currency transactions | | | .75 | | | | (.95 | ) | | | .73 | | | | .36 | | | | (.24 | ) |
| | | | | |
Contributions from Affiliates | | | – 0 | – | | | .00 | (d) | | | – 0 | – | | | – 0 | – | | | – 0 | – |
| | | | |
Net increase (decrease) in net asset value from operations | | | 1.00 | | | | (.55 | ) | | | 1.10 | | | | .69 | | | | .04 | |
| | | | |
Less: Dividends and Distributions | | | | | | | | | | | | | | | | | | | | |
| | | | | |
Dividends from net investment income | | | (.36 | ) | | | (.38 | ) | | | (.56 | ) | | | (.45 | ) | | | (.29 | ) |
| | | | | |
Distributions from net realized gain on investment transactions | | | – 0 | – | | | (.21 | ) | | | – 0 | – | | | (.09 | ) | | | – 0 | – |
| | | | |
Total dividends and distributions | | | (.36 | ) | | | (.59 | ) | | | (.56 | ) | | | (.54 | ) | | | (.29 | ) |
| | | | |
Net asset value, end of period | | | $ 9.94 | | | | $ 9.30 | | | | $ 10.44 | | | | $ 9.90 | | | | $ 9.75 | |
| | | | |
| | | | | |
Total Return | | | | | | | | | | | | | | | | | | | | |
| | | | | |
Total investment return based on net asset value(e) | | | 10.98 | % | | | (5.57 | )%(g) | | | 11.42 | % | | | 7.42 | % | | | .31 | % |
| | | | | |
Ratios/Supplemental Data | | | | | | | | | | | | | | | | | | | | |
| | | | | |
Net assets, end of period (000’s omitted) | | | $1,105 | | | | $704 | | | | $426 | | | | $102 | | | | $10 | |
| | | | | |
Ratio to average net assets of: | | | | | | | | | | | | | | | | | | | | |
| | | | | |
Expenses, net of waivers/reimbursements(f)‡ | | | 1.53 | % | | | 1.49 | % | | | 1.52 | % | | | 1.54 | % | | | 1.52 | %^ |
| | | | | |
Expenses, before waivers/reimbursements(f)‡ | | | 2.16 | % | | | 2.13 | % | | | 2.65 | % | | | 4.70 | % | | | 4.57 | %^ |
| | | | | |
Net investment income(c) | | | 2.65 | % | | | 4.11 | % | | | 3.63 | % | | | 3.35 | % | | | 2.89 | %^ |
| | | | | |
Portfolio turnover rate | | | 77 | % | | | 74 | % | | | 69 | % | | | 94 | % | | | 88 | % |
| | | | | | | | | | | | | | | | | | | | |
| |
‡ Expense ratios exclude the estimated acquired fund fees of the affiliated/unaffiliated underlying | |
portfolios | | | .24 | % | | | .26 | % | | | .23 | % | | | .22 | % | | | .21 | %^ |
See footnote summary on page 79.
| | |
| |
| abfunds.com | | AB ALL MARKET INCOME PORTFOLIO | 77 |
FINANCIAL HIGHLIGHTS(continued)
Selected Data For A Share Of Capital Stock Outstanding Throughout Each Period
| | | | | | | | | | | | | | | | | | | | |
| | | Advisor Class | |
| | | Year Ended November 30, | | | December 18,
2014(a) to
November 30, 2015 | |
| | | 2019 | | | 2018 | | | 2017 | | | 2016 | |
| | | | |
| | | | | | | | | | | | | | | | | | | | |
Net asset value, beginning of period | | | $ 9.32 | | | | $ 10.45 | | | | $ 9.91 | | | | $ 9.75 | | | | $ 10.00 | |
| | | | |
Income From Investment Operations | | | | | | | | | | | | | | | | | | | | |
| | | | | |
Net investment income(b)(c) | | | .36 | | | | .50 | | | | .47 | | | | .50 | | | | .37 | |
| | | | | |
Net realized and unrealized gain (loss) on investment and foreign currency transactions | | | .73 | | | | (.95 | ) | | | .73 | | | | .29 | | | | (.24 | ) |
| | | | | |
Contributions from Affiliates | | | – 0 | – | | | .00 | (d) | | | – 0 | – | | | – 0 | – | | | – 0 | – |
| | | | |
Net increase (decrease) in net asset value from operations | | | 1.09 | | | | (.45 | ) | | | 1.20 | | | | .79 | | | | .13 | |
| | | | |
Less: Dividends and Distributions | | | | | | | | | | | | | | | | | | | | |
| | | | | |
Dividends from net investment income | | | (.45 | ) | | | (.47 | ) | | | (.66 | ) | | | (.54 | ) | | | (.38 | ) |
| | | | | |
Distributions from net realized gain on investment transactions | | | – 0 | – | | | (.21 | ) | | | – 0 | – | | | (.09 | ) | | | – 0 | – |
| | | | |
Total dividends and distributions | | | (.45 | ) | | | (.68 | ) | | | (.66 | ) | | | (.63 | ) | | | (.38 | ) |
| | | | |
Net asset value, end of period | | | $ 9.96 | | | | $ 9.32 | | | | $ 10.45 | | | | $ 9.91 | | | | $ 9.75 | |
| | | | |
| | | | | |
Total Return | | | | | | | | | | | | | | | | | | | | |
| | | | | |
Total investment return based on net asset value(e) | | | 12.03 | % | | | (4.56 | )% | | | 12.53 | % | | | 8.51 | % | | | 1.25 | % |
| | | | | |
Ratios/Supplemental Data | | | | | | | | | | | | | | | | | | | | |
| | | | | |
Net assets, end of period (000’s omitted) | | | $99,571 | | | | $97,826 | | | | $89,667 | | | | $19,926 | | | | $17,919 | |
| | | | | |
Ratio to average net assets of: | | | | | | | | | | | | | | | | | | | | |
| | | | | |
Expenses, net of waivers/reimbursements(f)‡ | | | .53 | % | | | .49 | % | | | .52 | % | | | .53 | % | | | .53 | %^ |
| | | | | |
Expenses, before waivers/reimbursements(f)‡ | | | 1.15 | % | | | 1.12 | % | | | 1.61 | % | | | 3.40 | % | | | 3.52 | %^ |
| | | | | |
Net investment income(c) | | | 3.77 | % | | | 5.09 | % | | | 4.64 | % | | | 5.08 | % | | | 3.88 | %^ |
| | | | | |
Portfolio turnover rate | | | 77 | % | | | 74 | % | | | 69 | % | | | 94 | % | | | 88 | % |
| | | | | | | | | | | | | | | | | | | | |
| |
‡ Expense ratios exclude the estimated acquired fund fees of the affiliated/unaffiliated underlying | |
portfolios | | | .24 | % | | | .26 | % | | | .23 | % | | | .22 | % | | | .21 | %^ |
See footnote summary on page 79.
| | |
| |
| 78 | AB ALL MARKET INCOME PORTFOLIO | | abfunds.com |
FINANCIAL HIGHLIGHTS(continued)
Selected Data For A Share Of Capital Stock Outstanding Throughout Each Period
| (a) | Commencement of operations. |
| (b) | Based on average shares outstanding. |
| (c) | Net of expenses waived/reimbursed by the Adviser. |
| (d) | Amount is less than $.005. |
| (e) | Total investment return is calculated assuming an initial investment made at the net asset value at the beginning of the period, reinvestment of all dividends and distributions at net asset value during the period, and redemption on the last day of the period. Initial sales charges or contingent deferred sales charges are not reflected in the calculation of total investment return. Total return does not reflect the deduction of taxes that a shareholder would pay on fund distributions or the redemption of fund shares. Total investment return calculated for a period of less than one year is not annualized. |
| (f) | In connection with the Fund’s investments in affiliated underlying portfolios, the Fund incurs no direct expenses, but bears proportionate shares of the fees and expenses (i.e., operating, administrative and investment advisory fees) of the affiliated underlying portfolios. The Adviser has contractually agreed to waive its fees from the Fund in an amount equal to the Fund’s pro rata share of certain acquired fund fees and expenses, and for the period shown below, such waiver amounted to: |
| | | | | | | | | | | | | | | | | | | | |
| | | Year Ended November 30, | | | December 18,
2014(a) to
November 30.
2015 | |
| | | 2019 | | | 2018 | | | 2017 | | | 2016 | |
Class A | | | .21 | % | | | .25 | % | | | .22 | % | | | .21 | % | | | .22 | %^ |
Class C | | | .21 | % | | | .25 | % | | | .22 | % | | | .20 | % | | | .22 | %^ |
Advisor Class | | | .21 | % | | | .25 | % | | | .22 | % | | | .21 | % | | | .21 | %^ |
| (g) | The net asset value and total return include adjustments in accordance with accounting principles generally accepted in the United States of America for financial reporting purposes. As such, the net asset value and total return for shareholder transactions may differ from financial statements. |
See notes to financial statements.
| | |
| |
| abfunds.com | | AB ALL MARKET INCOME PORTFOLIO | 79 |
REPORT OF INDEPENDENT REGISTERED
PUBLIC ACCOUNTING FIRM
To the Shareholders and the Board of Directors of
AB All Market Income Portfolio
Opinion on the Financial Statements
We have audited the accompanying statement of assets and liabilities of AB All Market Income Portfolio (the “Fund”) (one of the funds constituting AB Cap Fund, Inc. (the “Company”)), including the portfolio of investments, as of November 30, 2019, and the related statement of operations for the year then ended, the statements of changes in net assets for each of the two years in the period then ended, the financial highlights for each of the four years in the period then ended and for the period from December 18, 2014 (commencement of operations) through November 30, 2015 and the related notes (collectively referred to as the “financial statements”). In our opinion, the financial statements present fairly, in all material respects, the financial position of the Fund (one of the funds constituting AB Cap Fund, Inc.) at November 30, 2019, the results of its operations for the year then ended, the changes in its net assets for each of the two years in the period then ended and its financial highlights for each of the four years in the period then ended and for the period from December 18, 2014 (commencement of operations) through November 30, 2015, in conformity with U.S. generally accepted accounting principles.
Basis for Opinion
These financial statements are the responsibility of the Company’s management. Our responsibility is to express an opinion on the Fund’s financial statements based on our audits. We are a public accounting firm registered with the Public Company Accounting Oversight Board (United States) (“PCAOB”) and are required to be independent with respect to the Company in accordance with the U.S. federal securities laws and the applicable rules and regulations of the Securities and Exchange Commission and the PCAOB.
We conducted our audits in accordance with the standards of the PCAOB. Those standards require that we plan and perform the audit to obtain reasonable assurance about whether the financial statements are free of material misstatement, whether due to error or fraud. The Company is not required to have, nor were we engaged to perform, an audit of the Company’s internal control over financial reporting. As part of our audits, we are required to obtain an understanding of internal control over financial reporting, but not for the purpose of expressing an opinion on the effectiveness of the Company’s internal control over financial reporting. Accordingly, we express no such opinion.
| | |
| |
| 80 | AB ALL MARKET INCOME PORTFOLIO | | abfunds.com |
REPORT OF INDEPENDENT REGISTERED
PUBLIC ACCOUNTING FIRM(continued)
Our audits included performing procedures to assess the risks of material misstatement of the financial statements, whether due to error or fraud, and performing procedures that respond to those risks. Such procedures included examining, on a test basis, evidence regarding the amounts and disclosures in the financial statements. Our procedures included confirmation of securities owned as of November 30, 2019, by correspondence with the custodian and others or by other appropriate auditing procedures where replies from others were not received. Our audits also included evaluating the accounting principles used and significant estimates made by management, as well as evaluating the overall presentation of the financial statements. We believe that our audits provide a reasonable basis for our opinion.

We have served as the auditor of one or more of the AB investment companies since 1968.
New York, New York
January 24, 2020
| | |
| |
| abfunds.com | | AB ALL MARKET INCOME PORTFOLIO | 81 |
2019 FEDERAL TAX INFORMATION
(unaudited)
For Federal income tax purposes, the following information is furnished with respect to the distributions paid by the Fund during the taxable year ended November 30, 2019. For individual shareholders, the Fund designates 20.75% of dividends paid as qualified dividend income. For corporate shareholders, 7.10% of dividends paid qualify for the dividends received deduction.
For foreign shareholders, 36.87% of ordinary income dividends paid may be considered to be qualifying to be taxed as interest-related dividends.
Shareholders should not use the above information to prepare their income tax returns. The information necessary to complete your income tax returns will be included with your Form 1099-DIV which will be sent to you separately in January 2020.
| | |
| |
| 82 | AB ALL MARKET INCOME PORTFOLIO | | abfunds.com |
BOARD OF DIRECTORS
| | |
Marshall C. Turner, Jr.(1),Chairman Jorge A. Bermudez(1)* Michael J. Downey(1) Nancy P. Jacklin(1) | | Robert M. Keith,President and Chief Executive Officer Carol C. McMullen(1) Garry L. Moody(1) Earl D. Weiner(1) |
OFFICERS
| | |
Morgan C. Harting(2), Vice President Daniel J. Loewy(2), Vice President Emilie D. Wrapp,Secretary Michael B. Reyes,Senior Analyst | | Joseph J. Mantineo,Treasurer and Chief Financial Officer Phyllis J. Clarke,Controller Vincent S. Noto,Chief Compliance Officer |
| | |
Custodian and Accounting Agent State Street Bank and Trust Company State Street Corporation CCB/5 1 Iron Street Boston, MA 02210 Principal Underwriter AllianceBernstein Investments, Inc. 1345 Avenue of the Americas New York, NY 10105 Transfer Agent AllianceBernstein Investor Services, Inc. P.O. Box 786003 San Antonio, TX 78278-6003 Toll-Free (800) 221-5672 | | Independent Registered Public Accounting Firm Ernst & Young LLP 5 Times Square New York, NY 10036 Legal Counsel Seward & Kissel LLP One Battery Park Plaza New York, NY 10004 |
| 1 | Member of the Audit Committee, the Governance and Nominating Committee, and the Independent Directors Committee. |
| 2 | The day-to-day management of, and investment decisions for, the Fund are made by its Multi-Asset Solutions Team. Messrs. Harting and Loewy are the investment professionals with the most significant responsibility for the day-to-day management of the Fund’s portfolio. |
| * | Mr. Bermudez will join the Board on January 1, 2020. |
| | |
| |
| abfunds.com | | AB ALL MARKET INCOME PORTFOLIO | 83 |
MANAGEMENT OF THE FUND
Board of Directors Information
The business and affairs of the Fund are managed under the direction of the Board of Directors. Certain information concerning the Fund’s Directors is set forth below.
| | | | | | | | |
NAME,
ADDRESS*, AGE AND
(YEAR FIRST ELECTED**) | | PRINCIPAL
OCCUPATION(S)
DURING PAST FIVE (5) YEARS
AND OTHER INFORMATION*** | | PORTFOLIOS IN AB FUND COMPLEX OVERSEEN BY
DIRECTOR | | | OTHER PUBLIC COMPANY DIRECTORSHIPS CURRENTLY
HELD BY
DIRECTOR |
| INTERESTED DIRECTOR | | | | | | |
| | | |
Robert M. Keith,+ 1345 Avenue of the Americas, New York, NY 10105 59 (2014) | | Senior Vice President of AllianceBernstein L.P. (the “Adviser”) and the head of AllianceBernstein Investments, Inc. (“ABI”) since July 2008; Director of ABI and President of the AB Mutual Funds. Previously, he served as Executive Managing Director of ABI from December 2006 to June 2008. Prior to joining ABI in 2006, Executive Managing Director of Bernstein Global Wealth Management, and prior thereto, Senior Managing Director and Global Head of Client Service and Sales of the Adviser’s institutional investment management business since 2004. Prior thereto, he was Managing Director and Head of North American Client Service and Sales in the Adviser’s institutional investment management business, with which he had been associated since prior to 2004. | | | 91 | | | None |
| | |
| |
| 84 | AB ALL MARKET INCOME PORTFOLIO | | abfunds.com |
MANAGEMENT OF THE FUND(continued)
| | | | | | | | |
NAME,
ADDRESS*, AGE AND (YEAR FIRST ELECTED**) | | PRINCIPAL OCCUPATION(S) DURING PAST FIVE (5) YEARS AND OTHER INFORMATION*** | | PORTFOLIOS IN AB FUND COMPLEX OVERSEEN BY
DIRECTOR | | | OTHER PUBLIC COMPANY DIRECTORSHIPS CURRENTLY
HELD BY
DIRECTOR |
INDEPENDENT DIRECTORS
| | | | | | |
| | | |
Marshall C. Turner, Jr.,# Chairman of the Board 78 (2014) | | Private Investor since prior to 2015. Former Chairman and CEO of Dupont Photomasks, Inc. (components of semi-conductor manufacturing). He has extensive operating leadership, and venture capital investing experience, including five interim or full-time CEO roles, and prior service as a general partner of institutional venture capital partnerships. He also has extensive non-profit board leadership experience, and currently serves on the boards of two education and science-related non-profit organizations. He has served as a director of one AB Fund since 1992, and director or trustee of all AB funds since 2005. He has been Chairman of the AB Funds since January 2014, and the Chairman of the Independent Directors Committees of such AB Funds since February 2014. | | | 91 | | | Xilinx, Inc. (programmable logic semi-conductors) since 2007 |
| | |
| |
| abfunds.com | | AB ALL MARKET INCOME PORTFOLIO | 85 |
MANAGEMENT OF THE FUND(continued)
| | | | | | | | |
NAME,
ADDRESS*, AGE AND (YEAR FIRST ELECTED**) | | PRINCIPAL OCCUPATION(S) DURING PAST FIVE (5) YEARS AND OTHER INFORMATION*** | | PORTFOLIOS IN AB FUND COMPLEX OVERSEEN BY
DIRECTOR | | | OTHER PUBLIC COMPANY DIRECTORSHIPS CURRENTLY
HELD BY
DIRECTOR |
INDEPENDENT DIRECTORS
(continued) | | | | | | |
| | | |
Jorge A. Bermudez,# ^ 68 (2020) | | Private investor since prior to 2015. Former Chief Risk Officer of Citigroup, Inc., a global financial services company, from November 2007 to March 2008, Chief Executive Officer of Citigroup’s Commercial Business Group in North America and Citibank Texas from 2005 to 2007, and a variety of other executive and leadership roles at various businesses within Citigroup prior to then; Chairman (2018) of the Texas A&M Foundation Board of Trustees (Trustee since 2013) and Chairman of the Smart Grid Center Board at Texas A&M University since 2012; director of, among others, Citibank N.A. from 2005 to 2008, the Federal Reserve Bank of Dallas, Houston Branch from 2009 to 2011, the Federal Reserve Bank of Dallas from 2011 to 2017, and the Electric Reliability Council of Texas from 2010 to 2016. He has served as director or trustee of the AB Funds since 2020. | | | 91 | | | Moody’s Corporation since April 2011 |
| | | | | | | | |
| | | |
Michael J. Downey,# 76 (2014) | | Private Investor since prior to 2015. Formerly, Chairman of The Asia Pacific Fund, Inc. (registered investment company) since prior to 2015 until January 2019. From 1987 until 1993, Chairman and CEO of Prudential Mutual Fund Management, director of the Prudential mutual funds, and member of the Executive Committee of Prudential Securities Inc. He has served as a director or trustee of the AB Funds since 2005. | | | 91 | | | None |
| | |
| |
| 86 | AB ALL MARKET INCOME PORTFOLIO | | abfunds.com |
MANAGEMENT OF THE FUND(continued)
| | | | | | | | |
NAME,
ADDRESS*, AGE AND (YEAR FIRST ELECTED**) | | PRINCIPAL OCCUPATION(S) DURING PAST FIVE (5) YEARS AND OTHER INFORMATION*** | | PORTFOLIOS IN AB FUND COMPLEX OVERSEEN BY
DIRECTOR | | | OTHER PUBLIC COMPANY DIRECTORSHIPS CURRENTLY
HELD BY
DIRECTOR |
INDEPENDENT DIRECTORS
(continued) | | | | | | |
| | | |
Nancy P. Jacklin,# 71 (2014) | | Private Investor since prior to 2015. Professorial Lecturer at the Johns Hopkins School of Advanced International Studies (2008-2015). U.S. Executive Director of the International Monetary Fund (which is responsible for ensuring the stability of the international monetary system) (December 2002 – May 2006); Partner, Clifford Chance (1992-2002); Sector Counsel, International Banking and Finance, and Associate General Counsel, Citicorp (1985-1992); Assistant General Counsel (International), Federal Reserve Board of Governors (1982-1985); and Attorney Advisor, U.S. Department of the Treasury (1973-1982). Member of the Bar of the District of Columbia and of New York; and member of the Council on Foreign Relations. She has served as a director or trustee of the AB Funds since 2006 and has been Chair of the Governance and Nominating Committees of the AB Funds since August 2014. | | | 91 | | | None |
| | |
| |
| abfunds.com | | AB ALL MARKET INCOME PORTFOLIO | 87 |
MANAGEMENT OF THE FUND(continued)
| | | | | | | | |
NAME,
ADDRESS*, AGE AND (YEAR FIRST ELECTED**) | | PRINCIPAL OCCUPATION(S) DURING PAST FIVE (5) YEARS AND OTHER INFORMATION*** | | PORTFOLIOS IN AB FUND COMPLEX OVERSEEN BY
DIRECTOR | | | OTHER PUBLIC COMPANY DIRECTORSHIPS CURRENTLY
HELD BY
DIRECTOR |
INDEPENDENT DIRECTORS
(continued) | | | | | | |
| | | |
Carol C. McMullen,# 64 (2016) | | Managing Director of Slalom Consulting (consulting) since 2014, private investor and member of the Advisory Board of Butcher Box (since 2018). Formerly, member, Partners Healthcare Investment Committee (2010-2019); Director of Norfolk & Dedham Group (mutual property and casualty insurance) from 2011 until November 2016; Director of Partners Community Physicians Organization (healthcare) from 2014 until December 2016 and Managing Director of The Crossland Group (consulting) from 2012 to 2013. She has held a number of senior positions in the asset and wealth management industries, including at Eastern Bank (where her roles included President of Eastern Wealth Management), Thomson Financial (Global Head of Sales for Investment Management), and Putnam Investments (where her roles included Chief Investment Officer, Core and Growth and Head of Global Investment Research). She has served on a number of private company and non-profit boards, and as a director or trustee of the AB Funds since June 2016. | | | 91 | | | None |
| | |
| |
| 88 | AB ALL MARKET INCOME PORTFOLIO | | abfunds.com |
MANAGEMENT OF THE FUND(continued)
| | | | | | | | |
NAME,
ADDRESS*, AGE AND (YEAR FIRST ELECTED**) | | PRINCIPAL OCCUPATION(S) DURING PAST FIVE (5) YEARS AND OTHER INFORMATION*** | | PORTFOLIOS IN AB FUND COMPLEX OVERSEEN BY
DIRECTOR | | | OTHER PUBLIC COMPANY DIRECTORSHIPS CURRENTLY
HELD BY
DIRECTOR |
INDEPENDENT DIRECTORS
(continued) | | | | | | |
| | | |
Garry L. Moody,# 67 (2014) | | Formerly, Partner, Deloitte & Touche LLP (1995-2008) where he held a number of senior positions, including Vice Chairman, and U.S. and Global Investment Management Practice Managing Partner; President, Fidelity Accounting and Custody Services Company (1993-1995), where he was responsible for accounting, pricing, custody and reporting for the Fidelity mutual funds; and Partner, Ernst & Young LLP (1975-1993), where he served as the National Director of Mutual Fund Tax Services and Managing Partner of its Chicago Office Tax department. He is a member of the Trustee Advisory Board of Board IQ, a biweekly publication focused on issues and news affecting directors of mutual funds. He is also a member of the Investment Company Institute’s Board of Governors and the Independent Directors Council Governing Council. He has served as a director or trustee, and as Chair of the Audit Committees, of the AB Funds since 2008. | | | 91 | | | None |
| | | | | | | | |
| | |
| |
| abfunds.com | | AB ALL MARKET INCOME PORTFOLIO | 89 |
MANAGEMENT OF THE FUND(continued)
| | | | | | | | |
NAME,
ADDRESS*, AGE AND (YEAR FIRST ELECTED**) | | PRINCIPAL OCCUPATION(S) DURING PAST FIVE (5) YEARS AND OTHER INFORMATION*** | | PORTFOLIOS IN AB FUND COMPLEX OVERSEEN BY
DIRECTOR | | | OTHER PUBLIC COMPANY DIRECTORSHIPS CURRENTLY
HELD BY
DIRECTOR |
INDEPENDENT DIRECTORS
(continued) | | | | | | |
| | | |
Earl D. Weiner,# 80 (2014) | | Senior Counsel since 2017, Of Counsel from 2007 to 2016, and Partner prior to then, of the law firm Sullivan & Cromwell LLP. He is a former member of the ABA Federal Regulation of Securities Committee Task Force to draft editions of the Fund Director’s Guidebook. He also serves as a director or trustee of various non-profit organizations and has served as Chairman or Vice Chairman of a number of them. He has served as a director or trustee of the AB Funds since 2007 and served as Chairman of the Governance and Nominating Committees of the AB Funds from 2007 until August 2014. | | | 91 | | | None |
| * | The address for each of the Fund’s Directors is c/o AllianceBernstein L.P., Attention: Legal and Compliance Department—Mutual Fund Legal, 1345 Avenue of the Americas, New York, NY 10105. |
| ** | There is no stated term of office for the Fund’s Directors. |
| *** | The information above includes each Director’s principal occupation during the last five years and other information relating to the experience, attributes, and skills relevant to each Director’s qualifications to serve as a Director, which led to the conclusion that each Director should serve as a Director for the Fund. |
| + | Mr. Keith is an “interested person”, as defined in Section 2(a)(19) of the 1940 Act, of the Fund due to his position as a Senior Vice President of the Adviser. |
| # | Member of the Audit Committee, the Governance and Nominating Committee, and the Independent Directors Committee. |
| ^ | Mr. Bermudez will be a Member of the Audit Committee, the Governance and Nominating Committee, and the Independent Directors Committee when he joins the Board on January 1, 2020. |
| | |
| |
| 90 | AB ALL MARKET INCOME PORTFOLIO | | abfunds.com |
MANAGEMENT OF THE FUND(continued)
Officer Information
Certain Information concerning the Fund’s Officers is listed below.
| | | | |
NAME, ADDRESS* AND AGE | | POSITION(S)
HELD WITH FUND | | PRINCIPAL OCCUPATION
DURING PAST FIVE (5) YEARS |
Robert M. Keith 59 | | President and Chief Executive Officer | | See biography above. |
| | | | |
Morgan C. Harting 48 | | Vice President | | Senior Vice President of the Adviser**, with which he has been associated since prior to 2015. |
| | | | |
Daniel J. Loewy 45 | | Vice President | | Senior Vice President of the Adviser**, with which he has been associated since prior to 2015. He is also Chief Investment Officer and Head of Multi-Asset Solutions. |
| | | | |
Emilie D. Wrapp 64 | | Secretary | | Senior Vice President, Assistant General Counsel and Assistant Secretary of ABI**, with which she has been associated since prior to 2015. |
| | | | |
Michael B. Reyes 43 | | Senior Analyst | | Vice President of the Adviser**, with which he has been associated since prior to 2015. |
| | | | |
Joseph J. Mantineo 60 | | Treasurer and Chief Financial Officer | | Senior Vice President of AllianceBernstein Investor Services (“ABIS”)**, with which he has been associated since prior to 2015. |
| | | | |
Phyllis J. Clarke 59 | | Controller | | Vice President of ABIS**, with which she has been associated since prior to 2015. |
| | | | |
Vincent S. Noto 55 | | Chief Compliance Officer | | Senior Vice President since 2015 and Mutual Fund Chief Compliance Officer of the Adviser** since 2014. Prior thereto, he was Vice President and Director of Mutual Fund Compliance of the Adviser** since 2012. |
| * | The address for each of the Fund’s Officers is 1345 Avenue of the Americas, New York, NY 10105. |
| ** | The Adviser, ABI and ABIS are affiliates of the Fund. |
The Fund’s Statement of Additional Information (“SAI”) has additional information about the Fund’s Directors and Officers and is available without charge upon request. Contact your financial representative or AB at (800) 227-4618, or visit www.abfunds.com, for a free prospectus or SAI.
| | |
| |
| abfunds.com | | AB ALL MARKET INCOME PORTFOLIO | 91 |
Information Regarding the Review and Approval of the Fund’s Advisory Agreement
The disinterested directors (the “directors”) of AB Cap Fund, Inc. (the “Company”) unanimously approved the continuance of the Company’s Advisory Agreement with the Adviser in respect of AB All Market Income Portfolio (the “Fund”) at a meeting held onJuly 30-31, 2019 (the “Meeting”).
Prior to approval of the continuance of the Advisory Agreement, the directors had requested from the Adviser, and received and evaluated, extensive materials. They reviewed the proposed continuance of the Advisory Agreement with the Adviser and with experienced counsel who are independent of the Adviser, who advised on the relevant legal standards. The directors also reviewed additional materials, including comparative analytical data prepared by the Senior Analyst for the Fund. The directors also discussed the proposed continuance in private sessions with counsel.
The directors considered their knowledge of the nature and quality of the services provided by the Adviser to the Fund gained from their experience as directors or trustees of most of the registered investment companies advised by the Adviser, their overall confidence in the Adviser’s integrity and competence they have gained from that experience, the Adviser’s initiative in identifying and raising potential issues with the directors and its responsiveness, frankness and attention to concerns raised by the directors in the past, including the Adviser’s willingness to consider and implement organizational and operational changes designed to improve investment results and the services provided to the AB Funds. The directors noted that they have four regular meetings each year, at each of which they review extensive materials and information from the Adviser, including information on the investment performance of the Fund and the underlying funds advised by the Adviser in which the Fund invests.
The directors also considered all factors they believed relevant, including the specific matters discussed below. During the course of their deliberations, the directors evaluated, among other things, the reasonableness of the advisory fee. The directors did not identify any particular information that wasall-important or controlling, and different directors may have attributed different weights to the various factors. The directors determined that the selection of the Adviser to manage the Fund and the overall arrangements between the Fund and the Adviser, as provided in the Advisory Agreement, including the advisory fee, were fair and reasonable in light of the services performed, expenses incurred and such other matters as the directors considered relevant in the exercise of their business judgment. The material factors and conclusions that formed the basis for the directors’ determinations included the following:
Nature, Extent and Quality of Services Provided
The directors considered the scope and quality of services provided by the Adviser under the Advisory Agreement, including the quality of the investment
| | |
| |
| 92 | AB ALL MARKET INCOME PORTFOLIO | | abfunds.com |
research capabilities of the Adviser and the other resources it has dedicated to performing services for the Fund. The directors noted that the Adviser from time to time reviews the Fund’s investment strategies and from time to time proposes changes intended to improve the Fund’s relative or absolute performance for the directors’ consideration. They also noted the professional experience and qualifications of the Fund’s portfolio management team and other senior personnel of the Adviser. The directors also considered that the Advisory Agreement provides that the Fund will reimburse the Adviser for the cost to it of providing certain clerical, accounting, administrative and other services to the Fund by employees of the Adviser or its affiliates. Requests for these reimbursements are made on a quarterly basis and subject to approval by the directors. The Adviser did not request any reimbursements from the Fund in the Fund’s latest fiscal year. The directors noted that the methodology used to determine the reimbursement amounts had been reviewed by an independent consultant retained by the Fund’s former Senior Officer/Independent Compliance Officer. The quality of administrative and other services, including the Adviser’s role in coordinating the activities of the Fund’s other service providers, also was considered. The directors concluded that, overall, they were satisfied with the nature, extent and quality of services provided to the Fund under the Advisory Agreement.
Costs of Services Provided and Profitability
The directors reviewed a schedule of the revenues and expenses and related notes indicating the profitability of the Fund to the Adviser for calendar years 2017 and 2018 that had been prepared with an expense allocation methodology arrived at in consultation with an independent consultant retained by the Fund’s former Senior Officer/Independent Compliance Officer. The directors noted the assumptions and methods of allocation used by the Adviser in preparing fund-specific profitability data and understood that there are a number of potentially acceptable allocation methodologies for information of this type. The directors noted that the profitability information reflected all revenues and expenses of the Adviser’s relationship with the Fund, including those relating to its subsidiaries that provide transfer agency, distribution and brokerage services to the Fund. The directors recognized that it is difficult to make comparisons of the profitability of the Advisory Agreement with the profitability of fund advisory contracts for unaffiliated funds because comparative information is not generally publicly available and is affected by numerous factors. The directors focused on the profitability of the Adviser’s relationship with the Fund before taxes and distribution expenses. The directors noted that the Fund was not profitable to the Adviser in the periods reviewed.
Fall-Out Benefits
The directors considered the other benefits to the Adviser and its affiliates from their relationships with the Fund and the underlying funds advised by the Adviser in which the Fund invests, including, but not limited to, benefits relating to soft dollar arrangements (whereby investment advisers receive
| | |
| |
| abfunds.com | | AB ALL MARKET INCOME PORTFOLIO | 93 |
brokerage and research services from brokers that execute agency transactions for their clients);12b-1 fees and sales charges received by the Fund’s principal underwriter (which is a wholly owned subsidiary of the Adviser) in respect of certain classes of the Fund’s shares; brokerage commissions paid by the Fund to brokers affiliated with the Adviser; and transfer agency fees paid by the Fund to a wholly owned subsidiary of the Adviser. The directors recognized that the Fund’s unprofitability to the Adviser would be exacerbated without these benefits. The directors understood that the Adviser also might derive reputational and other benefits from its association with the Fund.
Investment Results
In addition to the information reviewed by the directors in connection with the Meeting, the directors receive detailed performance information for the Fund at each regular Board meeting during the year.
At the Meeting, the directors reviewed performance information prepared by an independent service provider (the “15(c) service provider”), showing the performance of the Class A Shares of the Fund against a group of similar funds (“peer group”) and a larger group of similar funds (“peer universe”), each selected by the 15(c) service provider, and information prepared by the Adviser showing performance of the Class A Shares against a broad-based securities market index, in each case for the1- and3-year periods ended May 31, 2019 and (in the case of comparisons with the broad-based securities market index) for the period from inception. Based on their review, and their discussion with the Adviser of the reasons for the Fund’s underperformance in the periods reviewed, the directors concluded that the Fund’s investment performance was acceptable.
Advisory Fees and Other Expenses
The directors considered the advisory fee rate payable by the Fund to the Adviser and information prepared by the 15(c) service provider concerning advisory fee rates payable by other funds in the same category as the Fund. The directors recognized that it is difficult to make comparisons of advisory fees because there are variations in the services that are included in the fees paid by other funds. The directors compared the Fund’s contractual effective advisory fee rate with a peer group median.
The directors also considered the Adviser’s fee schedule for other clients utilizing investment strategies similar to the Fund’s. For this purpose, they reviewed the relevant advisory fee information from the Adviser’s Form ADV and in a report from the Fund’s Senior Analyst and noted the differences between the Fund’s fee schedule, on the one hand, and the Adviser’s institutional fee schedule and the schedule of fees charged by the Adviser to any offshore funds and for services to anysub-advised funds utilizing investment strategies similar to the Fund’s, on the other. The directors noted that the Adviser may, in some cases, agree to fee rates
| | |
| |
| 94 | AB ALL MARKET INCOME PORTFOLIO | | abfunds.com |
with large institutional clients that are lower than those reviewed by the directors and that they had previously discussed with the Adviser its policies in respect of such arrangements. The directors previously discussed these matters with an independent fee consultant.
The Adviser reviewed with the directors the significantly greater scope of the services it provides to the Fund relative to institutional, offshore fund andsub-advised fund clients. In this regard, the Adviser noted, among other things, that, compared to institutional and offshore orsub-advisory accounts, the Fund (i) demands considerably more portfolio management, research and trading resources due to significantly higher daily cash flows; (ii) has more tax and regulatory restrictions and compliance obligations; (iii) must prepare and file or distribute regulatory and other communications about fund operations; and (iv) must provide shareholder servicing to retail investors. The Adviser also reviewed the greater legal risks presented by the large and changing population of Fund shareholders who may assert claims against the Adviser in individual or class actions, and the greater entrepreneurial risk in offering new fund products, which require substantial investment to launch, may not succeed, and generally must be priced to compete with larger, more established funds resulting in lack of profitability to the Adviser until a new fund achieves scale. In light of the substantial differences in services rendered by the Adviser to institutional, offshore fund andsub-advised fund clients as compared to the Fund, and the different risk profile, the directors considered these fee comparisons inapt and did not place significant weight on them in their deliberations.
The directors noted that the Fund invests in shares of exchange-traded funds (“ETFs”), subject to the restrictions and limitations of the Investment Company Act of 1940 as these may be varied as a result of exemptive orders issued by the SEC. The directors also noted that ETFs pay advisory fees pursuant to their advisory contracts, and that the Adviser had provided, and they had reviewed, information about the expense ratios of the relevant ETFs. The directors concluded, based on the Adviser’s explanation of how it uses ETFs when they are the most cost-effective way to obtain desired exposures, in some cases pending purchases of underlying securities, that the advisory fee for the Fund is for services that are in addition to, rather than duplicative of, the services provided under the advisory contracts of the ETFs.
In connection with their review of the Fund’s advisory fee, the directors also considered the total expense ratio of the Class A shares of the Fund in comparison to a peer group and a peer universe selected by the 15(c) service provider. The Class A expense ratio of the Fund was based on the Fund’s latest fiscal year and the directors considered the Adviser’s expense cap for the Fund. The directors noted that it was likely that the expense ratios of some of the other funds in the Fund’s category were lowered by waivers or reimbursements by those funds’ investment advisers, which in
| | |
| |
| abfunds.com | | AB ALL MARKET INCOME PORTFOLIO | 95 |
some cases might be voluntary or temporary. The directors view expense ratio information as relevant to their evaluation of the Adviser’s services because the Adviser is responsible for coordinating services provided to the Fund by others. Based on their review, the directors concluded that the Fund’s expense ratio was acceptable.
Economies of Scale
The directors noted that the proposed advisory fee schedule for the Fund contains breakpoints that reduce the fee rates on assets above specified levels. The directors took into consideration prior presentations by an independent consultant on economies of scale in the mutual fund industry and for the AB Funds, and presentations from time to time by the Adviser concerning certain of its views on economies of scale. The directors also previously discussed economies of scale with an independent fee consultant. The directors also had requested and received from the Adviser certain updates on economies of scale in advance of the Meeting. The directors believe that economies of scale may be realized (if at all) by the Adviser across a variety of products and services, and not only in respect of a single fund. The directors noted that there is no established methodology for setting breakpoints that give effect to the fund-specific services provided by a fund’s adviser and to the economies of scale that an adviser may realize in its overall mutual fund business or those components of it which directly or indirectly affect a fund’s operations. The directors observed that in the mutual fund industry as a whole, as well as among funds similar to the Fund, there is no uniformity or pattern in the fees and asset levels at which breakpoints (if any) apply. The directors also noted that the advisory agreements for many funds do not have breakpoints at all. Having taken these factors into account, the directors concluded that the Fund’s shareholders would benefit from a sharing of economies of scale in the event the Fund’s net assets exceed a breakpoint in the future.
| | |
| |
| 96 | AB ALL MARKET INCOME PORTFOLIO | | abfunds.com |
This page is not part of the Shareholder Report or the Financial Statements.
AB FAMILY OF FUNDS
US EQUITY
US CORE
Core Opportunities Fund
FlexFee™ US Thematic Portfolio
Select US Equity Portfolio
US GROWTH
Concentrated Growth Fund
Discovery Growth Fund
FlexFee™ Large Cap Growth Portfolio
Growth Fund
Large Cap Growth Fund
Small Cap Growth Portfolio
US VALUE
Discovery Value Fund
Equity Income Fund
Relative Value Fund
Small Cap Value Portfolio
Value Fund
INTERNATIONAL/ GLOBAL EQUITY
INTERNATIONAL/ GLOBAL CORE
FlexFee™ International Strategic Core Portfolio
Global Core Equity Portfolio
International Portfolio
International Strategic Core Portfolio
Sustainable Global Thematic Fund
Tax-Managed International Portfolio
Tax-Managed Wealth Appreciation Strategy
Wealth Appreciation Strategy
INTERNATIONAL/ GLOBAL GROWTH
Concentrated International Growth Portfolio
FlexFee™ Emerging Markets Growth Portfolio
INTERNATIONAL/ GLOBAL EQUITY(continued)
Sustainable International Thematic Fund
INTERNATIONAL/ GLOBAL VALUE
All China Equity Portfolio
International Value Fund
FIXED INCOME
MUNICIPAL
High Income Municipal Portfolio
Intermediate California Municipal Portfolio
Intermediate Diversified Municipal Portfolio
Intermediate New York Municipal Portfolio
Municipal Bond Inflation Strategy
Tax-Aware Fixed Income Portfolio
National Portfolio
Arizona Portfolio
California Portfolio
Massachusetts Portfolio
Minnesota Portfolio
New Jersey Portfolio
New York Portfolio
Ohio Portfolio
Pennsylvania Portfolio
Virginia Portfolio
TAXABLE
Bond Inflation Strategy
FlexFee™ High Yield Portfolio
FlexFee™ International Bond Portfolio
Global Bond Fund
High Income Fund
Income Fund
Intermediate Duration Portfolio
Limited Duration High Income Portfolio
Short Duration Portfolio
Total Return Bond Portfolio1
ALTERNATIVES
All Market Real Return Portfolio
Global Real Estate Investment Fund
Select US Long/Short Portfolio
Unconstrained Bond Fund
MULTI-ASSET
All Market Income Portfolio
All Market Total Return Portfolio
Conservative Wealth Strategy
Emerging Markets Multi-Asset Portfolio
Global Risk Allocation Fund
Tax-Managed All Market Income Portfolio
TARGET-DATE
Multi-Manager Select Retirement Allocation Fund
Multi-Manager Select 2010 Fund
Multi-Manager Select 2015 Fund
Multi-Manager Select 2020 Fund
Multi-Manager Select 2025 Fund
Multi-Manager Select 2030 Fund
Multi-Manager Select 2035 Fund
Multi-Manager Select 2040 Fund
Multi-Manager Select 2045 Fund
Multi-Manager Select 2050 Fund
Multi-Manager Select 2055 Fund
Multi-Manager Select 2060 Fund
CLOSED-END FUNDS
AllianceBernstein Global High Income Fund
AllianceBernstein National Municipal Income Fund
We also offer Government Money Market Portfolio, which serves as the money market fund exchange vehicle for the AB mutual funds. You could lose money by investing in the Fund. Although the Fund seeks to preserve the value of your investment at $1.00 per share, it cannot guarantee it will do so. The Fund may impose a fee upon sale of your shares or may temporarily suspend your ability to sell shares if the Fund’s liquidity falls below required minimums because of market conditions or other factors. An investment in the Fund is not insured or guaranteed by the Federal Deposit Insurance Corporation or any other government agency. The Fund’s sponsor has no legal obligation to provide financial support to the Fund, and you should not expect that the sponsor will provide financial support to the Fund at any time.
Investors should consider the investment objectives, risks, charges and expenses of the Fund carefully before investing. For copies of our prospectus or summary prospectus, which contain this and other information, visit us online at www.abfunds.com or contact your AB representative. Please read the prospectus and/or summary prospectus carefully before investing.
| 1 | Prior to July 12, 2019, Total Return Bond Portfolio was named Intermediate Bond Portfolio. |
| | |
| |
| abfunds.com | | AB ALL MARKET INCOME PORTFOLIO | 97 |
NOTES
| | |
| |
| 98 | AB ALL MARKET INCOME PORTFOLIO | | abfunds.com |
NOTES
| | |
| |
| abfunds.com | | AB ALL MARKET INCOME PORTFOLIO | 99 |
NOTES
| | |
| |
| 100 | AB ALL MARKET INCOME PORTFOLIO | | abfunds.com |
AB ALL MARKET INCOME PORTFOLIO
1345 Avenue of the Americas
New York, NY 10105
800 221 5672
AMI-0151-1119 
NOV 11.30.19

ANNUAL REPORT
AB SMALL CAP VALUE PORTFOLIO

Beginning January 1, 2021, as permitted by new regulations adopted by the Securities and Exchange Commission, the Fund’s annual and semi-annual shareholder reports will no longer be sent by mail, unless you specifically request paper copies of the reports. Instead, the reports will be made available on a website, and you will be notified by mail each time a report is posted and provided with a website address to access the report.
If you already elected to receive shareholder reports electronically, you will not be affected by this change and you need not take any action. You may elect to receive shareholder reports and other communications from the Fund electronically at any time by contacting your financial intermediary (such as a broker-dealer or bank) or, if you are a direct investor, by calling the Fund at (800) 221 5672.
You may elect to receive all future reports in paper form free of charge. If you invest through a financial intermediary, you can contact your financial intermediary to request that you continue to receive paper copies of your shareholder reports; if you invest directly with the Fund, you can call the Fund at (800) 221 5672. Your election to receive reports in paper form will apply to all funds held in your account with your financial intermediary or, if you invest directly, to all AB Mutual Funds you hold.
| | |
| |
| Investment Products Offered | | • Are Not FDIC Insured• May Lose Value• Are Not Bank Guaranteed |
Investors should consider the investment objectives, risks, charges and expenses of the Fund carefully before investing. For copies of our prospectus or summary prospectus, which contain this and other information, visit us online at www.abfunds.com or contact your AB representative. Please read the prospectus and/or summary prospectus carefully before investing.
This shareholder report must be preceded or accompanied by the Fund’s prospectus for individuals who are not current shareholders of the Fund.
You may obtain a description of the Fund’s proxy voting policies and procedures, and information regarding how the Fund voted proxies relating to portfolio securities during the most recent12-month period ended June 30, without charge. Simply visit AB’s website at www.abfunds.com, or go to the Securities and Exchange Commission’s (the “Commission”) website at www.sec.gov, or call AB at (800) 227 4618.
The Fund files its complete schedule of portfolio holdings with the Commission for the first and third quarters of each fiscal year as an exhibit to its reports on Form N-PORT. The Fund’s Form N-PORT reports are available on the Commission’s website at www.sec.gov. The Fund’s Forms N-PORT may also be reviewed and copied at the Commission’s Public Reference Room in Washington, DC; information on the operation of the Public Reference Room may be obtained by calling (800) SEC 0330. AB publishes full portfolio holdings for the Fund monthly at www.abfunds.com.
AllianceBernstein Investments, Inc. (ABI) is the distributor of the AB family of mutual funds. ABI is a member of FINRA and is an affiliate of AllianceBernstein L.P., the Adviser of the funds.
The [A/B] logo is a registered service mark of AllianceBernstein and AllianceBernstein® is a registered service mark used by permission of the owner, AllianceBernstein L.P.
| | |
| FROM THE PRESIDENT | |  |
Dear Shareholder,
We are pleased to provide this report for AB Small Cap Value Portfolio (the “Fund”). Please review the discussion of Fund performance, the market conditions during the reporting period and the Fund’s investment strategy.
As always, AB strives to keep clients ahead of what’s next by:
| + | | Transforming uncommon insights into uncommon knowledge with a global research scope |
| + | | Navigating markets with seasoned investment experience and sophisticated solutions |
| + | | Providing thoughtful investment insights and actionable ideas |
Whether you’re an individual investor or a multi-billion-dollar institution, we put knowledge and experience to work for you.
AB’s global research organization connects and collaborates across platforms and teams to deliver impactful insights and innovative products. Better insights lead to better opportunities—anywhere in the world.
For additional information about AB’s range of products and shareholder resources, please log on to www.abfunds.com.
Thank you for your investment in the AB Mutual Funds.
Sincerely,

Robert M. Keith
President and Chief Executive Officer, AB Mutual Funds
| | |
| |
| abfunds.com | | AB SMALL CAP VALUE PORTFOLIO | 1 |
ANNUAL REPORT
January 8, 2020
This report provides management’s discussion of fund performance for AB Small Cap Value Portfolio for the annual reporting period ended November 30, 2019.
The Fund’s investment objective is to seek long-term growth of capital.
NAV RETURNS AS OF NOVEMBER 30, 2019(unaudited)
| | | | | | | | |
| | |
| | | 6 Months | | | 12 Months | |
| | |
| AB SMALL CAP VALUE PORTFOLIO | | | | | | | | |
| | |
| Class A Shares | | | 12.01% | | | | 4.22% | |
| | |
| Class C Shares | | | 11.70% | | | | 3.40% | |
| | |
| Advisor Class Shares1 | | | 12.16% | | | | 4.41% | |
| | |
| Russell 2000 Value Index | | | 10.86% | | | | 3.96% | |
| 1 | Please note that this share class is for investors purchasing shares through accounts established under certainfee-based programs sponsored and maintained by certain broker-dealers and financial intermediaries, institutional pension plans and/or investment advisory clients of, and certain other persons associated with, the Adviser and its affiliates or the Fund. |
INVESTMENT RESULTS
The table above shows the Fund’s performance compared with its benchmark, the Russell 2000 Value Index, for thesix- and12-month periods ended November 30, 2019.
During the12-month period, Advisor and Class A shares outperformed the benchmark, while Class C shares underperformed, before sales charges. Sector selection contributed, relative to the benchmark, as a result of an overweight to technology that was partially offset by an underweight to real estate. Overall, security selection detracted, primarily within the technology and industrials sectors, while selection within real estate and health care contributed.
During thesix-month period, all share classes outperformed the benchmark, before sales charges. Sector selection drove relative outperformance. An overweight to technology and an underweight to energy contributed, while underweights to health care and financials detracted. Overall security selection detracted, mainly within the technology and financials sectors, while selection within consumer discretionary and real estate contributed to performance.
The Fund did not utilize derivatives during thesix- or12-month periods.
| | |
| |
| 2 | AB SMALL CAP VALUE PORTFOLIO | | abfunds.com |
MARKET REVIEW AND INVESTMENT STRATEGY
US and international stocks recorded double-digit returns and emerging markets rallied during the12-month period ended November 30, 2019. After declining at the end of 2018, equity markets rebounded dramatically in January as strong corporate earnings and optimism about a trade truce between the US and China calmed investor sentiment. Escalation of the trade war continued, however, and emerging geopolitical pressures increased market volatility, restrained business spending and resulted in slowing global growth. Although low unemployment and relatively strong consumer spending continued to support the US economic expansion throughout the period, the US Federal Reserve implemented three consecutive rate cuts. Accommodative monetary policies put in place by the world’s central banks helped support capital markets abroad as well. Late in the third quarter, US equity market performance was accompanied by a sharp style rotation as quality-growth and lower-volatility stocks, which had performed strongly earlier in the year, lagged and value stocks outperformed. However, for the most part, growth stocks continued to outperform value stocks over the entire period andlarge-cap stocks outperformed theirsmall-cap peers. In November, investors gained confidence in the belief that aphase-one trade deal could be reached by the end of the year.
The Fund’s Senior Investment Management Team (the “Team”) seeks to invest opportunistically in what it considers to be undervalued companies with solid fundamentals and attractive long-term earnings prospects. The Fund’s emphasis continues to be at the stock-specific level, as the Team looks for companies that offer compelling valuation, strong free cash flow and significant company-level catalysts.
INVESTMENT POLICIES
The Fund invests primarily in a portfolio of equity securities of small-capitalization US companies. Under normal circumstances, the Fund invests at least 80% of its net assets in equity securities of small-capitalization companies. For purposes of this policy, small-capitalization companies are those that, at the time of investment, fall within the capitalization range between the smallest company in the Russell 2000 Value Index and the greater of $2.5 billion or the largest company in the Russell 2000 Value Index.
The Fund invests in companies that are determined by the Adviser to be undervalued, using the Adviser’s fundamental value approach. In selecting securities for the Fund, the Adviser uses its fundamental and quantitative research to identify companies whose long-term earnings power is not reflected in the current market price of the securities.
The Adviser seeks to manage the overall portfolio volatility relative to the Russell 2000 Value Index by favoring promising securities that offer the best balance between return and targeted risk.
| | |
| |
| abfunds.com | | AB SMALL CAP VALUE PORTFOLIO | 3 |
DISCLOSURES AND RISKS
Benchmark Disclosure
The Russell 2000® Value Index is unmanaged and does not reflect fees and expenses associated with the active management of a mutual fund portfolio. The Russell 2000 Value Index represents the performance of small-cap value companies within the US. An investor cannot invest directly in an index or average, and their results are not indicative of the performance for any specific investment, including the Fund.
A Word About Risk
Market Risk: The value of the Fund’s assets will fluctuate as the stock market fluctuates. The value of its investments may decline, sometimes rapidly and unpredictably, simply because of economic changes or other events that affect large portions of the market. It includes the risk that a particular style of investing, such as the Fund’s value approach, may underperform the market generally.
Capitalization Risk: Investments in small-capitalization companies may be more volatile than investments in large-capitalization companies. Investments in small-capitalization companies may have additional risks because these companies have limited product lines, markets or financial resources.
Management Risk: The Fund is subject to management risk because it is an actively managed investment fund. The Adviser will apply its investment techniques and risk analyses in making investment decisions for the Fund, but there is no guarantee that its techniques will produce the intended results.
These risks are fully discussed in the Fund’s prospectus. As with all investments, you may lose money by investing in the Fund.
An Important Note About Historical Performance
The investment return and principal value of an investment in the Fund will fluctuate, so that shares, when redeemed, may be worth more or less than their original cost. Performance shown in this report represents past performance and does not guarantee future results. Current performance may be lower or higher than the performance information shown. You may obtain performance information current to the most recentmonth-end by visiting www.abfunds.com.
All fees and expenses related to the operation of the Fund have been deducted. Net asset value (“NAV”) returns do not reflect sales charges; if sales charges were reflected, the Fund’s quoted performance would be lower. SEC returns reflect the applicable sales charges for each share class: a 4.25% maximumfront-end sales charge for Class A shares and a 1%1-year contingent deferred sales charge for Class C shares. Returns for the different share classes will vary due to different expenses associated with each class. Performance assumes reinvestment of distributions and does not account for taxes.
| | |
| |
| 4 | AB SMALL CAP VALUE PORTFOLIO | | abfunds.com |
HISTORICAL PERFORMANCE
GROWTH OF A $10,000 INVESTMENT IN THE FUND(unaudited)
12/3/20141 TO 11/30/2019
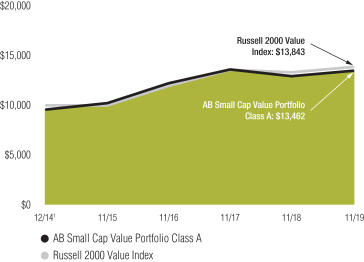
This chart illustrates the total value of an assumed $10,000 investment in AB Small Cap Value Portfolio Class A shares (from 12/3/20141 to 11/30/2019) as compared to the performance of the Fund’s benchmark. The chart reflects the deduction of the maximum 4.25% sales charge from the initial $10,000 investment in the Fund and assumes the reinvestment of dividends and capital gains distributions.
| 1 | Inception date: 12/3/2014. |
| | |
| |
| abfunds.com | | AB SMALL CAP VALUE PORTFOLIO | 5 |
HISTORICAL PERFORMANCE(continued)
AVERAGE ANNUAL RETURNS AS OF NOVEMBER 30, 2019(unaudited)
| | | | | | | | |
| | |
| | | NAV Returns | | | SEC Returns
(reflects applicable
sales charges) | |
| | |
| CLASS A SHARES | | | | | | | | |
| | |
| 1 Year | | | 4.22% | | | | -0.22% | |
| | |
| Since Inception1 | | | 7.06% | | | | 6.14% | |
| | |
| CLASS C SHARES | | | | | | | | |
| | |
| 1 Year | | | 3.40% | | | | 2.43% | |
| | |
| Since Inception1 | | | 6.25% | | | | 6.25% | |
| | |
| ADVISOR CLASS SHARES2 | | | | | | | | |
| | |
| 1 Year | | | 4.41% | | | | 4.41% | |
| | |
| Since Inception1 | | | 7.32% | | | | 7.32% | |
The Fund’s current prospectus fee table shows the Fund’s total annual operating expense ratios as 1.26%, 2.01% and 1.01% for Class A, Class C and Advisor Class shares, respectively, gross of any fee waivers or expense reimbursements. Contractual fee waivers and/or expense reimbursements limit the Fund’s annual operating expense ratios exclusive of expenses associated with acquired fund fees and expenses other than the advisory fees of any AB mutual funds in which the Fund may invest, interest expense, taxes, extraordinary expenses, and brokerage commissions and other transaction costs to 1.25%, 2.00% and 1.00% for Class A, Class C and Advisor Class shares, respectively. These waivers/reimbursements may not be terminated before February 28, 2020 and may be extended by the Adviser for additionalone-year terms. Any fees waived and expenses borne by the Adviser through December 2, 2015 under the expense limitations in effect prior to that date may be reimbursed by the Fund until the end of the third fiscal year after the fiscal period in which the fee was waived or the expense was borne, provided that no reimbursement payment will be made that would cause the Fund’s covered operating expenses to exceed the expense limitations. Absent reimbursements or waivers, performance would have been lower. The Financial Highlights section of this report sets forth expense ratio data for the current reporting period; the expense ratios shown above may differ from the expense ratios in the Financial Highlights section since they are based on different time periods.
| 1 | Inception date: 12/3/2014. |
| 2 | This share class is offered at NAV to eligible investors and the SEC returns are the same as the NAV returns. Please note that this share class is for investors purchasing shares through accounts established under certainfee-based programs sponsored and maintained by certain broker-dealers and financial intermediaries, institutional pension plans and/or investment advisory clients of, and certain other persons associated with, the Adviser and its affiliates or the Fund. |
| | |
| |
| 6 | AB SMALL CAP VALUE PORTFOLIO | | abfunds.com |
HISTORICAL PERFORMANCE(continued)
SEC AVERAGE ANNUAL RETURNS
AS OF THE MOST RECENT CALENDARQUARTER-END
DECEMBER 31, 2019(unaudited)
| | | | |
| |
| | | SEC Returns
(reflects applicable
sales charges) | |
| |
| CLASS A SHARES | | | | |
| |
| 1 Year | | | 17.01% | |
| |
| 5 Years | | | 6.04% | |
| |
| Since Inception1 | | | 6.60% | |
| |
| CLASS C SHARES | | | | |
| |
| 1 Year | | | 20.31% | |
| |
| 5 Years | | | 6.16% | |
| |
| Since Inception1 | | | 6.70% | |
| |
| ADVISOR CLASS SHARES2 | | | | |
| |
| 1 Year | | | 22.58% | |
| |
| 5 Years | | | 7.25% | |
| |
| Since Inception1 | | | 7.79% | |
| 1 | Inception date: 12/3/2014. |
| 2 | Please note that this share class is for investors purchasing shares through accounts established under certainfee-based programs sponsored and maintained by certain broker-dealers and financial intermediaries, institutional pension plans and/or investment advisory clients of, and certain other persons associated with, the Adviser and its affiliates or the Fund. |
| | |
| |
| abfunds.com | | AB SMALL CAP VALUE PORTFOLIO | 7 |
EXPENSE EXAMPLE
(unaudited)
As a shareholder of a mutual fund, you may incur two types of costs: (1) transaction costs, including sales charges (loads) on purchase payments, contingent deferred sales charges on redemptions and (2) ongoing costs, including management fees; distribution(12b-1) fees; and other fund expenses. This example is intended to help you understand your ongoing costs (in dollars) of investing in the Fund and to compare these costs with the ongoing costs of investing in other mutual funds.
The Example is based on an investment of $1,000 invested at the beginning of the period and held for the entire period as indicated below.
Actual Expenses
The table below provides information about actual account values and actual expenses. You may use the information in this line, together with the amount you invested, to estimate the expenses that you paid over the period. Simply divide your account value by $1,000 (for example, an $8,600 account value divided by $1,000 = 8.6), then multiply the result by the number in the first line under the heading entitled “Expenses Paid During Period” to estimate the expenses you paid on your account during this period.
Hypothetical Example for Comparison Purposes
The table below provides information about hypothetical account values and hypothetical expenses based on the Fund’s actual expense ratio and an assumed annual rate of return of 5% before expenses, which is not the Fund’s actual return. The hypothetical account values and expenses may not be used to estimate the actual ending account balance or expenses you paid for the period. You may use this information to compare the ongoing costs of investing in the Fund and other funds by comparing this 5% hypothetical example with the 5% hypothetical examples that appear in the shareholder reports of other funds.
Please note that the expenses shown in the table are meant to highlight your ongoing costs only and do not reflect any transactional costs, such as sales charges (loads), or contingent deferred sales charges on redemptions. Therefore, the hypothetical example is useful in comparing ongoing costs only, and will not help you determine the relative total costs of owning different funds. In addition, if these transactional costs were included, your costs would have been higher.
| | |
| |
| 8 | AB SMALL CAP VALUE PORTFOLIO | | abfunds.com |
EXPENSE EXAMPLE(continued)
| | | | | | | | | | | | | | | | |
| | | Beginning
Account Value
June 1, 2019 | | | Ending
Account Value
November 30, 2019 | | | Expenses Paid
During Period* | | | Annualized
Expense Ratio* | |
| Class A | | | | | | | | | | | | | | | | |
Actual | | $ | 1,000 | | | $ | 1,120.10 | | | $ | 6.48 | | | | 1.22 | % |
Hypothetical** | | $ | 1,000 | | | $ | 1,018.95 | | | $ | 6.17 | | | | 1.22 | % |
| Class C | | | | | | | | | | | | | | | | |
Actual | | $ | 1,000 | | | $ | 1,117.00 | | | $ | 10.56 | | | | 1.99 | % |
Hypothetical** | | $ | 1,000 | | | $ | 1,015.09 | | | $ | 10.05 | | | | 1.99 | % |
| Advisor Class | | | | | | | | | | | | | | | | |
Actual | | $ | 1,000 | | | $ | 1,121.60 | | | $ | 5.21 | | | | 0.98 | % |
Hypothetical** | | $ | 1,000 | | | $ | 1,020.16 | | | $ | 4.96 | | | | 0.98 | % |
| * | Expenses are equal to the classes’ annualized expense ratios, multiplied by the average account value over the period, multiplied by 183/365 (to reflect theone-half year period), respectively. |
| ** | Assumes 5% annual return before expenses. |
| | |
| |
| abfunds.com | | AB SMALL CAP VALUE PORTFOLIO | 9 |
PORTFOLIO SUMMARY
November 30, 2019(unaudited)
PORTFOLIO STATISTICS
Net Assets ($mil): $378.0
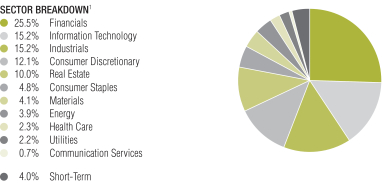
TEN LARGEST HOLDINGS2
| | | | | | | | |
| | |
| Company | | U.S. $ Value | | | Percent of
Net Assets | |
| | |
| Nomad Foods Ltd. | | $ | 5,928,069 | | | | 1.6 | % |
| | |
| Kulicke & Soffa Industries, Inc. | | | 5,848,730 | | | | 1.5 | |
| | |
| STAG Industrial, Inc. | | | 5,814,809 | | | | 1.5 | |
| | |
| IBERIABANK Corp. | | | 5,729,204 | | | | 1.5 | |
| | |
| WSFS Financial Corp. | | | 5,607,327 | | | | 1.5 | |
| | |
| Masonite International Corp. | | | 5,553,586 | | | | 1.5 | |
| | |
| El Pollo Loco Holdings, Inc. | | | 5,517,054 | | | | 1.5 | |
| | |
| NCR Corp. | | | 5,461,500 | | | | 1.4 | |
| | |
| Taylor Morrison Home Corp. – Class A | | | 5,311,296 | | | | 1.4 | |
| | |
| National Storage Affiliates Trust | | | 5,298,360 | | | | 1.4 | |
| | |
| | $ | 56,069,935 | | | | 14.8 | % |
| 1 | All data are as of November 30, 2019. The Fund’s sector breakdown is expressed as a percentage of total investments (excluding security lending collateral) and may vary over time. |
Please note: The sector classifications presented herein are based on the Global Industry Classification Standard (GICS) which was developed by Morgan Stanley Capital International and Standard & Poor’s. The components are divided into sector, industry group, and industrysub-indices as classified by the GICS for each of the market capitalization indices in the broad market. These sector classifications are broadly defined. The “Portfolio of Investments” section of the report reflects more specific industry information and is consistent with the investment restrictions discussed in the Fund’s prospectus.
| | |
| |
| 10 | AB SMALL CAP VALUE PORTFOLIO | | abfunds.com |
PORTFOLIO OF INVESTMENTS
November 30, 2019
| | | | | | | | |
| Company | | Shares | | | U.S. $ Value | |
| |
COMMON STOCKS – 97.7% | | | | | | | | |
| Financials – 25.9% | | | | | | | | |
Banks – 18.2% | | | | | | | | |
1st Source Corp. | | | 68,456 | | | $ | 3,519,323 | |
Associated Banc-Corp. | | | 225,680 | | | | 4,838,579 | |
Bank of Marin Bancorp | | | 56,156 | | | | 2,534,320 | |
Carter Bank & Trust(a) | | | 130,301 | | | | 2,751,957 | |
Heritage Financial Corp./WA | | | 183,022 | | | | 5,047,747 | |
IBERIABANK Corp. | | | 78,493 | | | | 5,729,204 | |
Independent Bank Group, Inc. | | | 83,200 | | | | 4,794,816 | |
Opus Bank | | | 133,538 | | | | 3,433,262 | |
Sandy Spring Bancorp, Inc. | | | 130,071 | | | | 4,599,311 | |
Sterling Bancorp/DE | | | 198,620 | | | | 4,055,820 | |
Synovus Financial Corp. | | | 125,645 | | | | 4,785,818 | |
Texas Capital Bancshares, Inc.(a) | | | 83,995 | | | | 4,854,911 | |
TriCo Bancshares | | | 99,723 | | | | 3,854,294 | |
Umpqua Holdings Corp. | | | 288,304 | | | | 4,719,536 | |
Webster Financial Corp. | | | 97,153 | | | | 4,730,380 | |
Zions Bancorp NA | | | 94,483 | | | | 4,703,364 | |
| | | | | | | | |
| | | | | | | 68,952,642 | |
| | | | | | | | |
Insurance – 3.5% | | | | | | | | |
First American Financial Corp. | | | 47,249 | | | | 3,005,981 | |
Kemper Corp. | | | 59,116 | | | | 4,369,855 | |
Selective Insurance Group, Inc. | | | 54,812 | | | | 3,629,651 | |
State Auto Financial Corp. | | | 71,952 | | | | 2,358,586 | |
| | | | | | | | |
| | | | | | | 13,364,073 | |
| | | | | | | | |
Thrifts & Mortgage Finance – 4.2% | | | | | | | | |
BankUnited, Inc. | | | 147,553 | | | | 5,173,208 | |
Essent Group Ltd. | | | 89,848 | | | | 4,910,193 | |
WSFS Financial Corp. | | | 125,753 | | | | 5,607,327 | |
| | | | | | | | |
| | | | | | | 15,690,728 | |
| | | | | | | | |
| | | | | | | 98,007,443 | |
| | | | | | | | |
| Information Technology – 15.5% | | | | | | | | |
Communications Equipment – 2.2% | | | | | | | | |
Casa Systems, Inc.(a) | | | 384,391 | | | | 1,414,559 | |
Extreme Networks, Inc.(a) | | | 366,047 | | | | 2,573,311 | |
NetScout Systems, Inc.(a) | | | 167,212 | | | | 4,213,742 | |
| | | | | | | | |
| | | | | | | 8,201,612 | |
| | | | | | | | |
Electronic Equipment, Instruments & Components – 2.6% | | | | | | | | |
Belden, Inc. | | | 73,632 | | | | 3,956,984 | |
KEMET Corp. | | | 76,390 | | | | 2,041,141 | |
TTM Technologies, Inc.(a) | | | 273,377 | | | | 3,665,985 | |
| | | | | | | | |
| | | | | | | 9,664,110 | |
| | | | | | | | |
IT Services – 2.2% | | | | | | | | |
Unisys Corp.(a) | | | 423,101 | | | | 4,814,889 | |
WNS Holdings Ltd. (ADR)(a) | | | 55,954 | | | | 3,531,817 | |
| | | | | | | | |
| | | | | | | 8,346,706 | |
| | | | | | | | |
| | |
| |
| abfunds.com | | AB SMALL CAP VALUE PORTFOLIO | 11 |
PORTFOLIO OF INVESTMENTS(continued)
| | | | | | | | |
| Company | | Shares | | | U.S. $ Value | |
| |
Semiconductors & Semiconductor Equipment – 3.7% | | | | | | | | |
Kulicke & Soffa Industries, Inc. | | | 233,110 | | | $ | 5,848,730 | |
MagnaChip Semiconductor Corp.(a)(b) | | | 310,128 | | | | 3,532,358 | |
MaxLinear, Inc. – Class A(a) | | | 175,265 | | | | 3,482,516 | |
Onto Innovation, Inc.(a) | | | 31,042 | | | | 1,041,769 | |
| | | | | | | | |
| | | | | | | 13,905,373 | |
| | | | | | | | |
Software – 3.4% | | | | | | | | |
A10 Networks, Inc.(a) | | | 536,621 | | | | 3,579,262 | |
CommVault Systems, Inc.(a) | | | 91,156 | | | | 4,614,317 | |
Verint Systems, Inc.(a) | | | 99,589 | | | | 4,841,021 | |
| | | | | | | | |
| | | | | | | 13,034,600 | |
| | | | | | | | |
Technology Hardware, Storage & Peripherals – 1.4% | | | | | | | | |
NCR Corp.(a) | | | 166,357 | | | | 5,461,500 | |
| | | | | | | | |
| | | | | | | 58,613,901 | |
| | | | | | | | |
| Industrials – 15.5% | | | | | | | | |
Aerospace & Defense – 1.3% | | | | | | | | |
AAR Corp. | | | 106,760 | | | | 4,771,104 | |
| | | | | | | | |
| | |
Air Freight & Logistics – 1.0% | | | | | | | | |
Hub Group, Inc. – Class A(a) | | | 75,538 | | | | 3,857,726 | |
| | | | | | | | |
| | |
Airlines – 2.2% | | | | | | | | |
Hawaiian Holdings, Inc. | | | 141,417 | | | | 4,283,521 | |
SkyWest, Inc. | | | 61,957 | | | | 3,880,987 | |
| | | | | | | | |
| | | | | | | 8,164,508 | |
| | | | | | | | |
Building Products – 1.5% | | | | | | | | |
Masonite International Corp.(a) | | | 77,348 | | | | 5,553,586 | |
| | | | | | | | |
| | |
Commercial Services & Supplies – 1.6% | | | | | | | | |
Knoll, Inc. | | | 108,432 | | | | 2,988,386 | |
Viad Corp. | | | 47,117 | | | | 2,963,659 | |
| | | | | | | | |
| | | | | | | 5,952,045 | |
| | | | | | | | |
Construction & Engineering – 1.8% | | | | | | | | |
Primoris Services Corp. | | | 175,093 | | | | 3,855,548 | |
Tutor Perini Corp.(a)(b) | | | 179,700 | | | | 2,862,621 | |
| | | | | | | | |
| | | | | | | 6,718,169 | |
| | | | | | | | |
Electrical Equipment – 1.9% | | | | | | | | |
EnerSys | | | 57,971 | | | | 4,067,825 | |
Regal Beloit Corp. | | | 39,390 | | | | 3,219,345 | |
| | | | | | | | |
| | | | | | | 7,287,170 | |
| | | | | | | | |
Machinery – 2.7% | | | | | | | | |
Kennametal, Inc. | | | 121,865 | | | | 4,244,558 | |
REV Group, Inc. | | | 280,981 | | | | 3,652,753 | |
Terex Corp. | | | 82,560 | | | | 2,317,459 | |
| | | | | | | | |
| | | | | | | 10,214,770 | |
| | | | | | | | |
| | |
| |
| 12 | AB SMALL CAP VALUE PORTFOLIO | | abfunds.com |
PORTFOLIO OF INVESTMENTS(continued)
| | | | | | | | |
| Company | | Shares | | | U.S. $ Value | |
| |
Road & Rail – 0.3% | | | | | | | | |
Covenant Transportation Group, Inc. – Class A(a) | | | 90,253 | | | $ | 1,212,098 | |
| | | | | | | | |
| | |
Trading Companies & Distributors – 1.2% | | | | | | | | |
BMC Stock Holdings, Inc.(a) | | | 61,676 | | | | 1,826,226 | |
MRC Global, Inc.(a) | | | 213,516 | | | | 2,848,304 | |
| | | | | | | | |
| | | | | | | 4,674,530 | |
| | | | | | | | |
| | | | | | | 58,405,706 | |
| | | | | | | | |
| Consumer Discretionary – 12.4% | | | | | | | | |
Auto Components – 1.5% | | | | | | | | |
Cooper-Standard Holdings, Inc.(a) | | | 58,249 | | | | 1,656,019 | |
Dana, Inc. | | | 246,136 | | | | 4,172,005 | |
| | | | | | | | |
| | | | | | | 5,828,024 | |
| | | | | | | | |
Diversified Consumer Services – 1.7% | | | | | | | | |
Houghton Mifflin Harcourt Co.(a) | | | 478,875 | | | | 2,810,996 | |
Regis Corp.(a) | | | 223,692 | | | | 3,608,152 | |
| | | | | | | | |
| | | | | | | 6,419,148 | |
| | | | | | | | |
Hotels, Restaurants & Leisure – 4.4% | | | | | | | | |
Bloomin’ Brands, Inc. | | | 189,825 | | | | 4,565,291 | |
El Pollo Loco Holdings, Inc.(a)(b) | | | 342,249 | | | | 5,517,054 | |
Papa John’s International, Inc. | | | 76,147 | | | | 4,818,582 | |
Red Robin Gourmet Burgers, Inc.(a) | | | 58,993 | | | | 1,608,739 | |
| | | | | | | | |
| | | | | | | 16,509,666 | |
| | | | | | | | |
Household Durables – 1.4% | | | | | | | | |
Taylor Morrison Home Corp. – Class A(a) | | | 228,738 | | | | 5,311,296 | |
| | | | | | | | |
| | |
Leisure Products – 1.1% | | | | | | | | |
Callaway Golf Co. | | | 202,788 | | | | 4,213,935 | |
| | | | | | | | |
| | |
Specialty Retail – 1.5% | | | | | | | | |
Citi Trends, Inc. | | | 163,411 | | | | 3,354,828 | |
Signet Jewelers Ltd.(b) | | | 115,162 | | | | 2,115,526 | |
| | | | | | | | |
| | | | | | | 5,470,354 | |
| | | | | | | | |
Textiles, Apparel & Luxury Goods – 0.8% | | | | | | | | |
Skechers U.S.A., Inc. – Class A(a) | | | 73,107 | | | | 2,940,364 | |
| | | | | | | | |
| | | | | | | 46,692,787 | |
| | | | | | | | |
| Real Estate – 10.1% | | | | | | | | |
Equity Real Estate Investment Trusts (REITs) – 10.1% | | | | | | | | |
Armada Hoffler Properties, Inc. | | | 182,748 | | | | 3,300,429 | |
City Office REIT, Inc. | | | 319,345 | | | | 4,288,803 | |
Cousins Properties, Inc. | | | 127,173 | | | | 5,149,235 | |
Easterly Government Properties, Inc. | | | 145,438 | | | | 3,382,888 | |
Empire State Realty Trust, Inc. – Class A | | | 164,887 | | | | 2,301,822 | |
Independence Realty Trust, Inc. | | | 341,619 | | | | 5,103,788 | |
National Storage Affiliates Trust | | | 158,160 | | | | 5,298,360 | |
RLJ Lodging Trust | | | 212,520 | | | | 3,631,967 | |
| | |
| |
| abfunds.com | | AB SMALL CAP VALUE PORTFOLIO | 13 |
PORTFOLIO OF INVESTMENTS(continued)
| | | | | | | | |
| Company | | Shares | | | U.S. $ Value | |
| |
STAG Industrial, Inc. | | | 187,635 | | | $ | 5,814,809 | |
| | | | | | | | |
| | | | | | | 38,272,101 | |
| | | | | | | | |
| Consumer Staples – 4.9% | | | | | | | | |
Beverages – 1.1% | | | | | | | | |
Cott Corp. | | | 328,841 | | | | 4,396,604 | |
| | | | | | | | |
| | |
Food Products – 3.8% | | | | | | | | |
Fresh Del Monte Produce, Inc. | | | 118,023 | | | | 3,859,352 | |
Hain Celestial Group, Inc. (The)(a)(b) | | | 179,934 | | | | 4,447,969 | |
Nomad Foods Ltd.(a) | | | 282,289 | | | | 5,928,069 | |
| | | | | | | | |
| | | | | | | 14,235,390 | |
| | | | | | | | |
| | | | | | | 18,631,994 | |
| | | | | | | | |
| Materials – 4.1% | | | | | | | | |
Chemicals – 1.9% | | | | | | | | |
Orion Engineered Carbons SA | | | 242,034 | | | | 4,400,178 | |
Trinseo SA | | | 75,294 | | | | 2,860,419 | |
| | | | | | | | |
| | | | | | | 7,260,597 | |
| | | | | | | | |
Containers & Packaging – 1.0% | | | | | | | | |
Graphic Packaging Holding Co. | | | 232,871 | | | | 3,788,811 | |
| | | | | | | | |
| | |
Metals & Mining – 1.2% | | | | | | | | |
Carpenter Technology Corp. | | | 86,505 | | | | 4,547,568 | |
| | | | | | | | |
| | | | | | | 15,596,976 | |
| | | | | | | | |
| Energy – 4.0% | | | | | | | | |
Energy Equipment & Services – 3.2% | | | | | | | | |
Dril-Quip, Inc.(a) | | | 80,530 | | | | 3,403,198 | |
Helix Energy Solutions Group, Inc.(a) | | | 331,736 | | | | 2,753,409 | |
Oil States International, Inc.(a) | | | 202,694 | | | | 3,230,942 | |
Patterson-UTI Energy, Inc. | | | 245,622 | | | | 2,195,861 | |
RPC, Inc.(b) | | | 114,970 | | | | 443,784 | |
| | | | | | | | |
| | | | | | | 12,027,194 | |
| | | | | | | | |
Oil, Gas & Consumable Fuels – 0.8% | | | | | | | | |
QEP Resources, Inc. | | | 400,635 | | | | 1,310,076 | |
SM Energy Co. | | | 201,354 | | | | 1,673,252 | |
| | | | | | | | |
| | | | | | | 2,983,328 | |
| | | | | | | | |
| | | | | | | 15,010,522 | |
| | | | | | | | |
| Health Care – 2.4% | | | | | | | | |
Health Care Providers & Services – 1.3% | | | | | | | | |
Molina Healthcare, Inc.(a) | | | 26,857 | | | | 3,639,123 | |
WellCare Health Plans, Inc.(a) | | | 3,536 | | | | 1,138,840 | |
| | | | | | | | |
| | | | | | | 4,777,963 | |
| | | | | | | | |
Life Sciences Tools & Services – 1.1% | | | | | | | | |
ICON PLC(a) | | | 25,645 | | | | 4,184,238 | |
| | | | | | | | |
| | | | | | | 8,962,201 | |
| | | | | | | | |
| | |
| |
| 14 | AB SMALL CAP VALUE PORTFOLIO | | abfunds.com |
PORTFOLIO OF INVESTMENTS(continued)
| | | | | | | | |
| Company | | Shares | | | U.S. $ Value | |
| |
| Utilities – 2.2% | | | | | | | | |
Electric Utilities – 1.1% | | | | | | | | |
PNM Resources, Inc. | | | 89,287 | | | $ | 4,325,955 | |
| | | | | | | | |
| | |
Multi-Utilities – 1.1% | | | | | | | | |
Black Hills Corp. | | | 53,011 | | | | 4,059,052 | |
| | | | | | | | |
| | | | | | | 8,385,007 | |
| | | | | | | | |
| Communication Services – 0.7% | | | | | | | | |
Media – 0.7% | | | | | | | | |
Criteo SA (Sponsored ADR)(a) | | | 157,667 | | | | 2,814,356 | |
| | | | | | | | |
| | |
Total Common Stocks
(cost $365,553,448) | | | | | | | 369,392,994 | |
| | | | | | | | |
| | | | | | | | |
SHORT-TERM INVESTMENTS – 4.1% | | | | | | | | |
Investment Companies – 4.1% | | | | | | | | |
AB Fixed Income Shares, Inc. – Government Money Market Portfolio – Class AB, 1.58%(c)(d)(e)
(cost $15,453,312) | | | 15,453,312 | | | | 15,453,312 | |
| | | | | | | | |
Total Investments Before Security Lending Collateral for Securities Loaned – 101.8%
(cost $381,006,760) | | | | | | | 384,846,306 | |
| | | | | | | | |
INVESTMENTS OF CASH COLLATERAL FOR SECURITIES LOANED – 0.1% | | | | | | | | |
Investment Companies – 0.1% | | | | | | | | |
AB Fixed Income Shares, Inc. – Government Money Market Portfolio – Class AB, 1.58%(c)(d)(e)
(cost $464,340) | | | 464,340 | | | | 464,340 | |
| | | | | | | | |
| | |
Total Investments – 101.9%
(cost $381,471,100) | | | | | | | 385,310,646 | |
Other assets less liabilities – (1.9)% | | | | | | | (7,342,160 | ) |
| | | | | | | | |
| | |
Net Assets – 100.0% | | | | | | $ | 377,968,486 | |
| | | | | | | | |
| (a) | Non-income producing security. |
| (b) | Represents entire or partial securities out on loan. See Note E for securities lending information. |
| (c) | Affiliated investments. |
| (d) | The rate shown represents the7-day yield as of period end. |
| (e) | To obtain a copy of the fund’s shareholder report, please go to the Securities and Exchange Commission’s website at www.sec.gov, or call AB at(800) 227-4618. |
Glossary:
ADR – American Depositary Receipt
See notes to financial statements.
| | |
| |
| abfunds.com | | AB SMALL CAP VALUE PORTFOLIO | 15 |
STATEMENT OF ASSETS & LIABILITIES
November 30, 2019
| | | | |
| Assets | |
Investments in securities, at value | | | | |
Unaffiliated issuers (cost $365,553,448) | | $ | 369,392,994 | (a) |
Affiliated issuers (cost $15,917,652—including investment of cash collateral for securities loaned of $464,340) | | | 15,917,652 | |
Cash | | | 115,372 | |
Receivable for capital stock sold | | | 413,617 | |
Unaffiliated dividends receivable | | | 209,715 | |
Receivable for investment securities sold | | | 152,229 | |
Affiliated dividends receivable | | | 10,106 | |
| | | | |
Total assets | | | 386,211,685 | |
| | | | |
| Liabilities | |
Payable for investment securities purchased | | | 7,340,067 | |
Payable for collateral received on securities loaned | | | 464,340 | |
Advisory fee payable | | | 234,041 | |
Administrative fee payable | | | 35,480 | |
Distribution fee payable | | | 34,026 | |
Payable for capital stock redeemed | | | 26,924 | |
Directors’ fees payable | | | 5,808 | |
Transfer Agent fee payable | | | 1,430 | |
Accrued expenses | | | 101,083 | |
| | | | |
Total liabilities | | | 8,243,199 | |
| | | | |
Net Assets | | $ | 377,968,486 | |
| | | | |
| Composition of Net Assets | |
Capital stock, at par | | $ | 3,028 | |
Additionalpaid-in capital | | | 366,096,396 | |
Distributable earnings | | | 11,869,062 | |
| | | | |
| | $ | 377,968,486 | |
| | | | |
Net Asset Value Per Share—11 billion shares of capital stock authorized, $.0001 par value
| | | | | | | | | | | | |
| Class | | Net Assets | | | Shares
Outstanding | | | Net Asset
Value | |
| |
| A | | $ | 163,493,547 | | | | 13,183,852 | | | $ | 12.40 | * |
| |
| C | | $ | 277,697 | | | | 23,285 | | | $ | 11.93 | |
| |
| Advisor | | $ | 214,197,242 | | | | 17,077,148 | | | $ | 12.54 | |
| |
| (a) | Includes securities on loan with a value of $7,676,327 (see Note E). |
| * | The maximum offering price per share for Class A shares was $12.95 which reflects a sales charge of 4.25%. |
See notes to financial statements.
| | |
| |
| 16 | AB SMALL CAP VALUE PORTFOLIO | | abfunds.com |
STATEMENT OF OPERATIONS
Year Ended November 30, 2019
| | | | | | | | |
| Investment Income | | | | | | | | |
Dividends | | | | | | | | |
Unaffiliated issuers (net of foreign taxes withheld of $27,779) | | $ | 4,510,722 | | | | | |
Affiliated issuers | | | 255,550 | | | | | |
Securities lending income | | | 3,508 | | | $ | 4,769,780 | |
| | | | | | | | |
| Expenses | | | | | | | | |
Advisory fee (see Note B) | | | 2,660,573 | | | | | |
Distribution fee—Class A | | | 412,195 | | | | | |
Distribution fee—Class C | | | 1,965 | | | | | |
Transfer agency—Class A | | | 44,436 | | | | | |
Transfer agency—Class C | | | 87 | | | | | |
Transfer agency—Advisor Class | | | 48,196 | | | | | |
Custodian | | | 109,511 | | | | | |
Administrative | | | 80,741 | | | | | |
Registration fees | | | 69,299 | | | | | |
Audit and tax | | | 52,467 | | | | | |
Legal | | | 41,249 | | | | | |
Printing | | | 26,674 | | | | | |
Directors’ fees | | | 22,861 | | | | | |
Recoupment of previously reimbursed expenses (see Note B) | | | 1,186 | | | | | |
Miscellaneous | | | 15,981 | | | | | |
| | | | | | | | |
Total expenses | | | 3,587,421 | | | | | |
Less: expenses waived and reimbursed by the Adviser (see Notes B & E) | | | (11,696 | ) | | | | |
| | | | | | | | |
Net expenses | | | | | | | 3,575,725 | |
| | | | | | | | |
Net investment income | | | | | | | 1,194,055 | |
| | | | | | | | |
| Realized and Unrealized Gain on Investment Transactions | | | | | | | | |
Net realized gain on investment transactions | | | | | | | 8,943,978 | |
Net change in unrealized appreciation/depreciation of investments | | | | | | | 6,024,450 | |
| | | | | | | | |
Net gain on investment transactions | | | | | | | 14,968,428 | |
| | | | | | | | |
Net Increase in Net Assets from Operations | | | | | | $ | 16,162,483 | |
| | | | | | | | |
See notes to financial statements.
| | |
| |
| abfunds.com | | AB SMALL CAP VALUE PORTFOLIO | 17 |
STATEMENT OF CHANGES IN NET ASSETS
| | | | | | | | |
| | | Year Ended
November 30,
2019 | | | Year Ended
November 30,
2018 | |
| Increase (Decrease) in Net Assets from Operations | | | | | | | | |
Net investment income | | $ | 1,194,055 | | | $ | 61,933 | |
Net realized gain on investment transactions | | | 8,943,978 | | | | 17,292,602 | |
Net change in unrealized appreciation/depreciation of investments | | | 6,024,450 | | | | (34,678,545 | ) |
| | | | | | | | |
Net increase (decrease) in net assets from operations | | | 16,162,483 | | | | (17,324,010 | ) |
Distributions to Shareholders | | | | | | | | |
Class A | | | (9,300,471 | ) | | | (10,665,866 | ) |
Class C | | | (8,159 | ) | | | (2,276 | ) |
Advisor Class | | | (7,499,581 | ) | | | (3,970,011 | ) |
| Capital Stock Transactions | | | | | | | | |
Net increase | | | 54,451,039 | | | | 84,497,633 | |
| | | | | | | | |
Total increase | | | 53,805,311 | | | | 52,535,470 | |
| Net Assets | | | | | | | | |
Beginning of period | | | 324,163,175 | | | | 271,627,705 | |
| | | | | | | | |
End of period | | $ | 377,968,486 | | | $ | 324,163,175 | |
| | | | | | | | |
See notes to financial statements.
| | |
| |
| 18 | AB SMALL CAP VALUE PORTFOLIO | | abfunds.com |
NOTES TO FINANCIAL STATEMENTS
November 30, 2019
NOTE A
Significant Accounting Policies
AB Cap Fund, Inc. (the “Company”), which is a Maryland corporation, is registered under the Investment Company Act of 1940 as anopen-end management investment company. The Company operates as a series company currently comprised of 28 portfolios. Each portfolio is considered to be a separate entity for financial reporting and tax purposes. This report relates only to the AB Small Cap Value Portfolio (the “Fund”), a diversified portfolio. The Fund has authorized the issuance of Class A, Class B, Class C, Advisor Class, Class R, Class K, Class I, Class Z, Class T, Class 1 and Class 2 shares. Class B, Class R, Class K, Class I, Class Z, Class T, Class 1 and Class 2 shares have not been issued. Class A shares are sold with afront-end sales charge of up to 4.25% for purchases not exceeding $1,000,000. With respect to purchases of $1,000,000 or more, Class A shares redeemed within one year of purchase may be subject to a contingent deferred sales charge of 1%. Class C shares are subject to a contingent deferred sales charge of 1% on redemptions made within the first year after purchase, and 0% after the first year of purchase. Class C shares will automatically convert to Class A shares ten years after the end of the calendar month of purchase. Advisor Class shares are sold without any initial or contingent deferred sales charge and are not subject to ongoing distribution expenses. All eleven classes of shares have identical voting, dividend, liquidation and other rights, except that the classes bear different distribution and transfer agency expenses. Each class has exclusive voting rights with respect to its distribution plan. The financial statements have been prepared in conformity with U.S. generally accepted accounting principles (“U.S. GAAP”) which require management to make certain estimates and assumptions that affect the reported amounts of assets and liabilities in the financial statements and amounts of income and expenses during the reporting period. Actual results could differ from those estimates. The Fund is an investment company under U.S. GAAP and follows the accounting and reporting guidance applicable to investment companies. The following is a summary of significant accounting policies followed by the Fund.
1. Security Valuation
Portfolio securities are valued at their current market value determined on the basis of market quotations or, if market quotations are not readily available or are deemed unreliable, at “fair value” as determined in accordance with procedures established by and under the general supervision of the Company’s Board of Directors (the “Board”).
In general, the market values of securities which are readily available and deemed reliable are determined as follows: securities listed on a national securities exchange (other than securities listed on the NASDAQ Stock
| | |
| |
| abfunds.com | | AB SMALL CAP VALUE PORTFOLIO | 19 |
NOTES TO FINANCIAL STATEMENTS(continued)
Market, Inc. (“NASDAQ”)) or on a foreign securities exchange are valued at the last sale price at the close of the exchange or foreign securities exchange. If there has been no sale on such day, the securities are valued at the last traded price from the previous day. Securities listed on more than one exchange are valued by reference to the principal exchange on which the securities are traded; securities listed only on NASDAQ are valued in accordance with the NASDAQ Official Closing Price; listed or over the counter (“OTC”) market put or call options are valued at the mid level between the current bid and ask prices. If either a current bid or current ask price is unavailable, AllianceBernstein L.P. (the “Adviser”) will have discretion to determine the best valuation (e.g., last trade price in the case of listed options); open futures are valued using the closing settlement price or, in the absence of such a price, the most recent quoted bid price. If there are no quotations available for the day of valuation, the last available closing settlement price is used; U.S. Government securities and any other debt instruments having 60 days or less remaining until maturity are generally valued at market by an independent pricing vendor, if a market price is available. If a market price is not available, the securities are valued at amortized cost. This methodology is commonly used for short term securities that have an original maturity of 60 days or less, as well as short term securities that had an original term to maturity that exceeded 60 days. In instances when amortized cost is utilized, the Valuation Committee (the “Committee”) must reasonably conclude that the utilization of amortized cost is approximately the same as the fair value of the security. Such factors the Committee will consider include, but are not limited to, an impairment of the creditworthiness of the issuer or material changes in interest rates. Fixed-income securities, including mortgage-backed and asset-backed securities, may be valued on the basis of prices provided by a pricing service or at a price obtained from one or more of the major broker-dealers. In cases where broker-dealer quotes are obtained, the Adviser may establish procedures whereby changes in market yields or spreads are used to adjust, on a daily basis, a recently obtained quoted price on a security. Swaps and other derivatives are valued daily, primarily using independent pricing services, independent pricing models using market inputs, as well as third party broker-dealers or counterparties. Open end mutual funds are valued at the closing net asset value per share, while exchange traded funds are valued at the closing market price per share.
Securities for which market quotations are not readily available (including restricted securities) or are deemed unreliable are valued at fair value as deemed appropriate by the Adviser. Factors considered in making this determination may include, but are not limited to, information obtained by contacting the issuer, analysts, analysis of the issuer’s financial statements or other available documents. In addition, the Fund may use fair value pricing for securities primarily traded innon-U.S. markets because
| | |
| |
| 20 | AB SMALL CAP VALUE PORTFOLIO | | abfunds.com |
NOTES TO FINANCIAL STATEMENTS(continued)
most foreign markets close well before the Fund values its securities at 4:00 p.m., Eastern Time. The earlier close of these foreign markets gives rise to the possibility that significant events, including broad market moves, may have occurred in the interim and may materially affect the value of those securities. To account for this, the Fund generally values many of its foreign equity securities using fair value prices based on third party vendor modeling tools to the extent available.
2. Fair Value Measurements
In accordance with U.S. GAAP regarding fair value measurements, fair value is defined as the price that the Fund would receive to sell an asset or pay to transfer a liability in an orderly transaction between market participants at the measurement date. U.S. GAAP establishes a framework for measuring fair value, and a three-level hierarchy for fair value measurements based upon the transparency of inputs to the valuation of an asset or liability (including those valued based on their market values as described in Note A.1 above). Inputs may be observable or unobservable and refer broadly to the assumptions that market participants would use in pricing the asset or liability. Observable inputs reflect the assumptions market participants would use in pricing the asset or liability based on market data obtained from sources independent of the Fund. Unobservable inputs reflect the Fund’s own assumptions about the assumptions that market participants would use in pricing the asset or liability based on the best information available in the circumstances. Each investment is assigned a level based upon the observability of the inputs which are significant to the overall valuation. The three-tier hierarchy of inputs is summarized below.
| | • | | Level 1—quoted prices in active markets for identical investments |
| | • | | Level 2—other significant observable inputs (including quoted prices for similar investments, interest rates, prepayment speeds, credit risk, etc.) |
| | • | | Level 3—significant unobservable inputs (including the Fund’s own assumptions in determining the fair value of investments) |
Where readily available market prices or relevant bid prices are not available for certain equity investments, such investments may be valued based on similar publicly traded investments, movements in relevant indices since last available prices or based upon underlying company fundamentals and comparable company data (such as multiples to earnings or other multiples to equity). Where an investment is valued using an observable input, such as another publicly traded security, the investment will be classified as Level 2. If management determines that an adjustment is appropriate based on restrictions on resale, illiquidity or uncertainty, and such adjustment is a significant component of the valuation, the investment will be classified as Level 3. An investment will also be classified as Level 3 where management uses company fundamentals and other significant inputs to determine the valuation.
| | |
| |
| abfunds.com | | AB SMALL CAP VALUE PORTFOLIO | 21 |
NOTES TO FINANCIAL STATEMENTS(continued)
The following table summarizes the valuation of the Fund’s investments by the above fair value hierarchy levels as of November 30, 2019:
| | | | | | | | | | | | | | | | |
Investments in
Securities: | | Level 1 | | | Level 2 | | | Level 3 | | | Total | |
Assets: | | | | | | | | | | | | | | | | |
Common Stocks(a) | | $ | 369,392,994 | | | $ | – 0 | – | | $ | – 0 | – | | $ | 369,392,994 | |
Short-Term Investments | | | 15,453,312 | | | | – 0 | – | | | – 0 | – | | | 15,453,312 | |
Investments of Cash Collateral for Securities Loaned in Affiliated Money Market Fund | | | 464,340 | | | | – 0 | – | | | – 0 | – | | | 464,340 | |
| | | | | | | | | | | | | | | | |
Total Investments in Securities | | | 385,310,646 | | | | – 0 | – | | | – 0 | – | | | 385,310,646 | |
Other Financial Instruments(b) | | | – 0 | – | | | – 0 | – | | | – 0 | – | | | – 0 | – |
| | | | | | | | | | | | | | | | |
Total | | $ | 385,310,646 | | | $ | – 0 | – | | $ | – 0 | – | | $ | 385,310,646 | |
| | | | | | | | | | | | | | | | |
| (a) | See Portfolio of Investments for sector classifications. |
| (b) | Other financial instruments are derivative instruments, such as futures, forwards and swaps, which are valued at the unrealized appreciation/(depreciation) on the instrument. Other financial instruments may also include swaps with upfront premiums, options written and swaptions written which are valued at market value. |
3. Currency Translation
Assets and liabilities denominated in foreign currencies and commitments under forward currency exchange contracts are translated into U.S. dollars at the mean of the quoted bid and ask prices of such currencies against the U.S. dollar. Purchases and sales of portfolio securities are translated into U.S. dollars at the rates of exchange prevailing when such securities were acquired or sold. Income and expenses are translated into U.S. dollars at rates of exchange prevailing when accrued.
Net realized gain or loss on foreign currency transactions represents foreign exchange gains and losses from sales and maturities of foreign fixed income investments, holding of foreign currencies, currency gains or losses realized between the trade and settlement dates on foreign investment transactions, and the difference between the amounts of dividends, interest and foreign withholding taxes recorded on the Fund’s books and the U.S. dollar equivalent amounts actually received or paid. Net unrealized currency gains and losses from valuing foreign currency denominated assets and liabilities at period end exchange rates are reflected as a component of net unrealized appreciation or depreciation of foreign currency denominated assets and liabilities.
4. Taxes
It is the Fund’s policy to meet the requirements of the Internal Revenue Code applicable to regulated investment companies and to distribute all of its investment company taxable income and net realized gains, if any, to shareholders. Therefore, no provisions for federal income or excise
| | |
| |
| 22 | AB SMALL CAP VALUE PORTFOLIO | | abfunds.com |
NOTES TO FINANCIAL STATEMENTS(continued)
taxes are required. The Fund may be subject to taxes imposed by countries in which it invests. Such taxes are generally based on income and/or capital gains earned or repatriated. Taxes are accrued and applied to net investment income, net realized gains and net unrealized appreciation/depreciation as such income and/or gains are earned.
In accordance with U.S. GAAP requirements regarding accounting for uncertainties in income taxes, management has analyzed the Fund’s tax positions taken or expected to be taken on federal and state income tax returns for all open tax years (the current tax year and the prior three tax years) and has concluded that no provision for income tax is required in the Fund’s financial statements.
5. Investment Income and Investment Transactions
Dividend income is recorded on theex-dividend date or as soon as the Fund is informed of the dividend. Interest income is accrued daily. Investment transactions are accounted for on the date the securities are purchased or sold. Investment gains or losses are determined on the identified cost basis. The Fund amortizes premiums and accretes discounts as adjustments to interest income.
6. Class Allocations
All income earned and expenses incurred by the Fund are borne on apro-rata basis by each outstanding class of shares, based on the proportionate interest in the Fund represented by the net assets of such class, except for class specific expenses which are allocated to the respective class. Expenses of the Company are charged proportionately to each portfolio or based on other appropriate methods. Realized and unrealized gains and losses are allocated among the various share classes based on respective net assets.
7. Dividends and Distributions
Dividends and distributions to shareholders, if any, are recorded on theex-dividend date. Income dividends and capital gains distributions are determined in accordance with federal tax regulations and may differ from those determined in accordance with U.S. GAAP. To the extent these differences are permanent, such amounts are reclassified within the capital accounts based on their federal tax basis treatment; temporary differences do not require such reclassification.
NOTE B
Advisory Fee and Other Transactions with Affiliates
Under the terms of the investment advisory agreement, the Fund pays the Adviser an advisory fee at an annual rate of .80% of the Fund’s average daily net assets. The fee is accrued daily and paid monthly. The Adviser has agreed to waive its fees and bear certain expenses to the extent necessary to limit total operating expenses (excluding acquired fund fees and expenses other than the advisory fees of any AB mutual funds in
| | |
| |
| abfunds.com | | AB SMALL CAP VALUE PORTFOLIO | 23 |
NOTES TO FINANCIAL STATEMENTS(continued)
which the Fund may invest, interest expense, taxes, extraordinary expenses, and brokerage commissions and other transactions costs) on an annual basis (the “Expense Caps”) to 1.25%, 2.00%, and 1.00% of daily average net assets for Class A, Class C, and Advisor Class shares, respectively. For the year ended November 30, 2019, there were no such reimbursements. The Expense Caps may not be terminated by the Adviser before February 28, 2020. Any fees waived and expenses borne by the Adviser through December 2, 2015 are subject to repayment by the Fund until the end of the third fiscal year after the fiscal period in which the fee were waived or the expense were borne; such waivers that were subject to repayment amounted to $300,074 and $1,186 for the period ended November 30, 2015 and the year ended November 30, 2016, respectively. During the years ended November 30, 2019, November 30, 2018 and November 30, 2017, the Fund made repayments to the Adviser in the amount of $1,186, $163,284 and $35,439, respectively. In any case, no reimbursement payment will be made that would cause the Fund’s total annual operating expenses to exceed the net fee percentages set forth above.
Pursuant to the investment advisory agreement, the Fund may reimburse the Adviser for certain legal and accounting services provided to the Fund by the Adviser. For the year ended November 30, 2019, the reimbursement for such services amounted to $80,741.
The Fund compensates AllianceBernstein Investor Services, Inc. (“ABIS”), a wholly-owned subsidiary of the Adviser, under a Transfer Agency Agreement for providing personnel and facilities to perform transfer agency services for the Fund. ABIS may make payments to intermediaries that provide omnibus account services,sub-accounting services and/or networking services. Such compensation retained by ABIS amounted to $24,081 for the year ended November 30, 2019.
AllianceBernstein Investments, Inc. (the “Distributor”), a wholly-owned subsidiary of the Adviser, serves as the distributor of the Fund’s shares. The Distributor has advised the Fund that it has retainedfront-end sales charges of $98 from the sale of Class A shares and received $0 and $136 in contingent deferred sales charges imposed upon redemptions by shareholders of Class A and Class C shares, respectively, for the year ended November 30, 2019.
The Fund may invest in AB Government Money Market Portfolio (the “Government Money Market Portfolio”) which has a contractual annual advisory fee rate of ..20% of the portfolio’s average daily net assets and bears its own expenses. The Adviser has contractually agreed to waive .10% of the advisory fee of Government Money Market Portfolio (resulting
| | |
| |
| 24 | AB SMALL CAP VALUE PORTFOLIO | | abfunds.com |
NOTES TO FINANCIAL STATEMENTS(continued)
in a net advisory fee of .10%) until August 31, 2020. In connection with the investment by the Fund in Government Money Market Portfolio, the Adviser has contractually agreed to waive its advisory fee from the Fund in an amount equal to the Fund’s pro rata share of the effective advisory fee of Government Money Market Portfolio, as borne indirectly by the Fund as an acquired fund fee and expense. For the year ended November 30, 2019, such waiver amounted to $10,362.
A summary of the Fund’s transactions in AB mutual funds for the year ended November 30, 2019 is as follows:
| | | | | | | | | | | | | | | | | | | | |
Fund | | Market Value
11/30/18
(000) | | | Purchases
at Cost
(000) | | | Sales
Proceeds
(000) | | | Market Value
11/30/19
(000) | | | Dividend
Income
(000) | |
Government Money Market Portfolio | | $ | 13,708 | | | $ | 97,952 | | | $ | 96,206 | | | $ | 15,454 | | | $ | 227 | |
Government Money Market Portfolio* | | | 5,494 | | | | 36,246 | | | | 41,276 | | | | 464 | | | | 29 | |
| | | | | | | | | | | | | | | | | | | | |
Total | | | | | | | | | | | | | | $ | 15,918 | | | $ | 256 | |
| | | | | | | | | | | | | | | | | | | | |
| * | Investments of cash collateral for securities lending transactions (see Note E). |
During the second quarter of 2018, AXA S.A. (“AXA”), a French holding company for the AXA Group, a worldwide leader in life, property and casualty and health insurance and asset management, completed the sale of a minority stake in its subsidiary, AXA Equitable Holdings, Inc. (now named Equitable Holdings, Inc.) (“Equitable”), through an initial public offering. Equitable is the holding company for a diverse group of financial services companies, including an approximately 65.3% economic interest in the Adviser and a 100% interest in AllianceBernstein Corporation, the general partner of the Adviser. Since the initial sale, AXA has completed additional offerings, most recently during the fourth quarter of 2019. As a result, AXA currently owns 10.1% of the outstanding shares of common stock of Equitable, and no longer owns a controlling interest in Equitable. AXA previously announced its intention to sell its entire interest in Equitable over time, subject to market conditions and other factors (the “Plan”). Most of AXA’s remaining Equitable shares are to be delivered on redemption of AXA bonds mandatorily exchangeable into Equitable shares and maturing in May 2021. AXA retains sole discretion to determine the timing of any future sales of its remaining shares of Equitable common stock.
The latest transaction under the Plan, which occurred on November 13, 2019, resulted in the indirect transfer of a “controlling block” of voting securities of the Adviser (a “Change of Control Event”) and was deemed an “assignment” causing a termination of the Fund’s investment advisory
| | |
| |
| abfunds.com | | AB SMALL CAP VALUE PORTFOLIO | 25 |
NOTES TO FINANCIAL STATEMENTS(continued)
agreement. In order to ensure that investment advisory services could continue uninterrupted in the event of a Change of Control Event, the Board previously approved a new investment advisory agreement with the Adviser. Shareholders of the Fund subsequently approved the new investment advisory agreement, which became effective on November 13, 2019.
NOTE C
Distribution Services Agreement
The Fund has adopted a Distribution Services Agreement (the “Agreement”) pursuant to Rule12b-1 under the Investment Company Act of 1940. Under the Agreement, the Fund pays distribution and servicing fees to the Distributor at an annual rate of up to .25% of the Fund’s average daily net assets attributable to Class A shares and 1% of the Fund’s average daily net assets attributable to Class C shares. There are no distribution and servicing fees on the Advisor Class shares. The fees are accrued daily and paid monthly. The Agreement provides that the Distributor will use such payments in their entirety for distribution assistance and promotional activities. Since the commencement of the Fund’s operations, the Distributor has incurred expenses in excess of the distribution costs reimbursed by the Fund in the amount of $637 for Class C shares. While such costs may be recovered from the Fund in future periods so long as the Agreement is in effect, the rate of the distribution and servicing fees payable under the Agreement may not be increased without a shareholder vote. In accordance with the Agreement, there is no provision for recovery of unreimbursed distribution costs incurred by the Distributor beyond the current fiscal year for Class A shares. The Agreement also provides that the Adviser may use its own resources to finance the distribution of the Fund’s shares.
NOTE D
Investment Transactions
Purchases and sales of investment securities (excluding short-term investments) for the year ended November 30, 2019 were as follows:
| | | | | | | | |
| | | Purchases | | | Sales | |
Investment securities (excluding U.S. government securities) | | $ | 180,931,693 | | | $ | 130,758,884 | |
U.S. government securities | | | – 0 | – | | | – 0 | – |
The cost of investments for federal income tax purposes, gross unrealized appreciation and unrealized depreciation are as follows:
| | | | |
Cost | | $ | 383,987,115 | |
| | | | |
Gross unrealized appreciation | | $ | 35,449,013 | |
Gross unrealized depreciation | | | (34,125,482 | ) |
| | | | |
Net unrealized appreciation | | $ | 1,323,531 | |
| | | | |
| | |
| |
| 26 | AB SMALL CAP VALUE PORTFOLIO | | abfunds.com |
NOTES TO FINANCIAL STATEMENTS(continued)
1. Derivative Financial Instruments
The Fund may use derivatives in an effort to earn income and enhance returns, to replace more traditional direct investments, to obtain exposure to otherwise inaccessible markets (collectively, “investment purposes”), or to hedge or adjust the risk profile of its portfolio.
The Fund did not engage in derivatives transactions for the year ended November 30, 2019.
2. Currency Transactions
The Fund may invest innon-U.S. Dollar-denominated securities on a currency hedged or unhedged basis. The Fund may seek investment opportunities by taking long or short positions in currencies through the use of currency-related derivatives, including forward currency exchange contracts, futures and options on futures, swaps, and other options. The Fund may enter into transactions for investment opportunities when it anticipates that a foreign currency will appreciate or depreciate in value but securities denominated in that currency are not held by the Fund and do not present attractive investment opportunities. Such transactions may also be used when the Adviser believes that it may be more efficient than a direct investment in a foreign currency-denominated security. The Fund may also conduct currency exchange contracts on a spot basis (i.e., for cash at the spot rate prevailing in the currency exchange market for buying or selling currencies).
NOTE E
Securities Lending
The Fund may enter into securities lending transactions. Under the Fund’s securities lending program, all loans of securities will be collateralized continually by cash collateral and/ornon-cash collateral.Non-cash collateral will include only securities issued or guaranteed by the U.S. government or its agencies or instrumentalities. The Fund cannot sell or repledge anynon-cash collateral, such collateral will not be reflected in the portfolio of investments. If a loan is collateralized by cash, the Fund will be compensated for the loan from a portion of the net return from the income earned on cash collateral after a rebate is paid to the borrower (in some cases, this rebate may be a “negative rebate” or fee paid by the borrower to the Fund in connection with the loan), and payments are made for fees of the securities lending agent and for certain other administrative expenses. If the Fund receivesnon-cash collateral, the Fund will receive a fee from the borrower generally equal to a negotiated percentage of the market value of the loaned securities. The Fund will have the right to call a loan and obtain the securities loaned at any time on notice to the borrower within the normal and customary settlement time for the securities. While the securities are on loan, the borrower is obligated to pay the Fund amounts equal
| | |
| |
| abfunds.com | | AB SMALL CAP VALUE PORTFOLIO | 27 |
NOTES TO FINANCIAL STATEMENTS(continued)
to any income or other distributions from the securities. The Fund will not be able to exercise voting rights with respect to any securities during the existence of a loan, but will have the right to regain ownership of loaned securities in order to exercise voting or other ownership rights. Collateral received and securities loaned are marked to market daily to ensure that the securities loaned are secured by collateral. The lending agent currently invests the cash collateral received in Government Money Market Portfolio, an eligible money market vehicle, in accordance with the investment restrictions of the Fund, and as approved by the Board. The collateral received on securities loaned is recorded as an asset as well as a corresponding liability in the statement of assets and liabilities. The collateral will be adjusted the next business day to maintain the required collateral amount. The amounts of securities lending income from the borrowers and Government Money Market Portfolio are reflected in the statement of operations. When the Fund earns net securities lending income from Government Money Market Portfolio, the income is inclusive of a rebate expense paid to the borrower. In connection with the cash collateral investment by the Fund in Government Money Market Portfolio, the Adviser has agreed to waive a portion of the Fund’s share of the advisory fees of Government Money Market Portfolio, as borne indirectly by the Fund as an acquired fund fee and expense. When the Fund lends securities, its investment performance will continue to reflect changes in the value of the securities loaned. A principal risk of lending portfolio securities is that the borrower may fail to return the loaned securities upon termination of the loan and that the collateral will not be sufficient to replace the loaned securities. The lending agent has agreed to indemnify the Fund in the case of default of any securities borrower.
A summary of the Fund’s transactions surrounding securities lending for the year ended November 30, 2019 is as follows:
| | | | | | | | | | | | | | | | | | | | | | |
Market Value
of Securities
on Loan* | | | Cash
Collateral* | | | Market Value
ofNon-Cash
Collateral* | | | Income from
Borrowers | | | Government Money
Market Portfolio | |
| | Income
Earned | | | Advisory Fee
Waived | |
| $ | 7,676,327 | | | $ | 464,340 | | | $ | 7,411,251 | | | $ | 3,508 | | | $ | 29,273 | | | $ | 1,334 | |
| * | As of November 30, 2019. |
| | |
| |
| 28 | AB SMALL CAP VALUE PORTFOLIO | | abfunds.com |
NOTES TO FINANCIAL STATEMENTS(continued)
NOTE F
Capital Stock
Each class consists of 1,000,000,000 authorized shares. Transactions in capital shares for each class were as follows:
| | | | | | | | | | | | | | | | | | | | | | | | |
| | | | | | | | | | | | | | | | | | | | | | | | |
| | | Shares | | | | | | Amount | | | | |
| | | Year Ended
November 30,
2019 | | | Year Ended
November 30,
2018 | | | | | | Year Ended
November 30,
2019 | | | Year Ended
November 30,
2018 | | | | |
| | | | | | | | |
| Class A | | | | | | | | | | | | | | | | | | | | | | | | |
Shares sold | | | 419,752 | | | | 398,158 | | | | | | | $ | 4,865,731 | | | $ | 5,306,899 | | | | | |
| | | | | |
Shares issued in reinvestment of distributions | | | 817,078 | | | | 795,515 | | | | | | | | 9,151,275 | | | | 10,461,022 | | | | | |
| | | | | |
Shares converted from Class C | | | 93 | | | | 119 | | | | | | | | 1,114 | | | | 1,567 | | | | | |
| | | | | |
Shares redeemed | | | (2,334,788 | ) | | | (1,033,823 | ) | | | | | | | (27,081,220 | ) | | | (13,770,744 | ) | | | | |
| | | | | |
Net increase (decrease) | | | (1,097,865 | ) | | | 159,969 | | | | | | | $ | (13,063,100 | ) | | $ | 1,998,744 | | | | | |
| | | | | |
| | | | | | | | | | | | | | | | | | | | | | | | |
| Class C | | | | | | | | | | | | | | | | | | | | | | | | |
Shares sold | | | 15,541 | | | | 10,518 | | | | | | | $ | 173,638 | | | $ | 138,723 | | | | | |
| | | | | |
Shares issued in reinvestment of distributions | | | 692 | | | | 118 | | | | | | | | 7,506 | | | | 1,518 | | | | | |
| | | | | |
Shares converted to Class A | | | (97 | ) | | | (122 | ) | | | | | | | (1,114 | ) | | | (1,567 | ) | | | | |
| | | | | |
Shares redeemed | | | (5,376 | ) | | | (998 | ) | | | | | | | (60,529 | ) | | | (13,232 | ) | | | | |
| | | | | |
Net increase | | | 10,760 | | | | 9,516 | | | | | | | $ | 119,501 | | | $ | 125,442 | | | | | |
| | | | | |
| | | | | | | | | | | | | | | | | | | | | | | | |
| Advisor Class | | | | | |
Shares sold | | | 7,182,321 | | | | 6,937,847 | | | | | | | $ | 84,404,519 | | | $ | 93,245,986 | | | | | |
| | | | | |
Shares issued in reinvestment of distributions | | | 584,156 | | | | 299,298 | | | | | | | | 6,600,965 | | | | 3,968,694 | | | | | |
| | | | | |
Shares redeemed | | | (2,013,128 | ) | | | (1,130,885 | ) | | | | | | | (23,610,846 | ) | | | (14,841,233 | ) | | | | |
| | | | | |
Net increase | | | 5,753,349 | | | | 6,106,260 | | | | | | | $ | 67,394,638 | | | $ | 82,373,447 | | | | | |
| | | | | |
NOTE G
Risks Involved in Investing in the Fund
Capitalization Risk—Investments in small-capitalization companies may be more volatile than investments in large capitalization companies. Investments in small-capitalization companies may have additional risks because these companies have limited product lines, markets or financial resources.
LIBOR Risk—The Fund may invest in certain debt securities, derivatives or other financial instruments that utilize the London Interbank Offered Rate, or “LIBOR,” as a “benchmark” or “reference rate” for various interest
| | |
| |
| abfunds.com | | AB SMALL CAP VALUE PORTFOLIO | 29 |
NOTES TO FINANCIAL STATEMENTS(continued)
rate calculations. In July 2017, the United Kingdom Financial Conduct Authority, which regulates LIBOR, announced a desire to phase out the use of LIBOR by the end of 2021. Although financial regulators and industry working groups have suggested alternative reference rates, such as European Interbank Offer Rate (“EURIBOR”), Sterling Overnight Interbank Average Rate (“SONIA”) and Secured Overnight Financing Rate (“SOFR”), global consensus on alternative rates is lacking and the process for amending existing contracts or instruments to transition away from LIBOR remains unclear. The elimination of LIBOR or changes to other reference rates or any other changes or reforms to the determination or supervision of reference rates could have an adverse impact on the market for, or value of, any securities or payments linked to those reference rates, which may adversely affect the Fund’s performance and/or net asset value. Uncertainty and risk also remain regarding the willingness and ability of issuers and lenders to include revised provisions in new and existing contracts or instruments. Consequently, the transition away from LIBOR to other reference rates may lead to increased volatility and illiquidity in markets that are tied to LIBOR, fluctuations in values of LIBOR-related investments or investments in issuers that utilize LIBOR, increased difficulty in borrowing or refinancing and diminished effectiveness of hedging strategies, adversely affecting the Fund’s performance. Furthermore, the risks associated with the expected discontinuation of LIBOR and transition may be exacerbated if the work necessary to effect an orderly transition to an alternative reference rate is not completed in a timely manner. Because the usefulness of LIBOR as a benchmark could deteriorate during the transition period, these effects could occur prior to the end of 2021.
Indemnification Risk—In the ordinary course of business, the Fund enters into contracts that contain a variety of indemnifications. The Fund’s maximum exposure under these arrangements is unknown. However, the Fund has not had prior claims or losses pursuant to these indemnification provisions and expects the risk of loss thereunder to be remote. Therefore, the Fund has not accrued any liability in connection with these indemnification provisions.
NOTE H
Joint Credit Facility
A number ofopen-end mutual funds managed by the Adviser, including the Fund, participate in a $325 million revolving credit facility (the “Facility”) intended to provide short-term financing, if necessary, subject to certain restrictions in connection with abnormal redemption activity. Commitment fees related to the Facility are paid by the participating funds and are included in miscellaneous expenses in the statement of operations. The Fund did not utilize the Facility during the year ended November 30, 2019.
| | |
| |
| 30 | AB SMALL CAP VALUE PORTFOLIO | | abfunds.com |
NOTES TO FINANCIAL STATEMENTS(continued)
NOTE I
Distributions to Shareholders
The tax character of distributions paid during the fiscal years ended November 30, 2019 and November 30, 2018 were as follows:
| | | | | | | | |
| | | 2019 | | | 2018 | |
Distributions paid from: | | | | | | | | |
Ordinary income | | $ | 3,838,462 | | | $ | 2,391,640 | |
Net long-term capital gains | | | 12,969,749 | | | | 12,246,513 | |
| | | | | | | | |
Total taxable distributions paid | | $ | 16,808,211 | | | $ | 14,638,153 | |
| | | | | | | | |
As of November 30, 2019, the components of accumulated earnings/(deficit) on a tax basis were as follows:
| | | | |
Undistributed ordinary income | | $ | 6,212,444 | |
Undistributed capital gains | | | 4,333,087 | |
Unrealized appreciation/(depreciation) | | | 1,323,531 | (a) |
| | | | |
Total accumulated earnings/(deficit) | | $ | 11,869,062 | |
| | | | |
| (a) | The differences between book-basis and tax-basis unrealized appreciation/(depreciation) are attributable primarily to the tax deferral of losses on wash sales. |
For tax purposes, net realized capital losses may be carried over to offset future capital gains, if any. Funds are permitted to carry forward capital losses for an indefinite period, and such losses will retain their character as either short-term or long-term capital losses. As of November 30, 2019, the Fund did not have any capital loss carryforwards.
During the current fiscal year, permanent differences primarily due to the utilization of earnings and profits distributed to shareholders on redemption of shares resulted in a net decrease in distributable earnings and a net increase in additional paid-in capital. These reclassifications had no effect on net assets.
NOTE J
Recent Accounting Pronouncements
In August 2018, the Financial Accounting Standards Board issued an Accounting Standards Update, ASU2018-13, Fair Value Measurement (Topic 820), Disclosure Framework—Changes to the Disclosure Requirements for Fair Value Measurement which removes, modifies and adds disclosures to Topic 820. The amendments in this ASU2018-13 (“ASU”) apply to all entities that are required, under existing U.S. GAAP, to make disclosures about recurring or nonrecurring fair value measurements. The amendments in this ASU are effective for all entities for fiscal years, and interim periods within those fiscal years, beginning after December 15, 2019. Management has evaluated the impact of the amendments and
| | |
| |
| abfunds.com | | AB SMALL CAP VALUE PORTFOLIO | 31 |
NOTES TO FINANCIAL STATEMENTS(continued)
elected to early adopt the ASU. The adoption of this ASU did not have a material impact on the disclosure and presentation of the financial statements of the Fund.
NOTE K
Subsequent Events
Management has evaluated subsequent events for possible recognition or disclosure in the financial statements through the date the financial statements are issued. Management has determined that there are no material events that would require disclosure in the Fund’s financial statements through this date.
| | |
| |
| 32 | AB SMALL CAP VALUE PORTFOLIO | | abfunds.com |
FINANCIAL HIGHLIGHTS
Selected Data For A Share Of Capital Stock Outstanding Throughout Each Period
| | | | | | | | | | | | | | | | | | | | |
| | | Class A | |
| | | Year Ended November 30, | | | December 3, 2014(a) to November 30, | |
| | | 2019 | | | 2018 | | | 2017 | | | 2016 | | | 2015 | |
| | | | |
| | | | | | | | | | | | | | | | | | | | |
Net asset value, beginning of period | | | $ 12.59 | | | | $ 14.01 | | | | $ 12.65 | | | | $ 10.64 | | | | $ 10.00 | |
| | | | |
Income From Investment Operations | | | | | | | | | | | | | | | | | | | | |
| | | | | |
Net investment income (loss)(b)(c) | | | .03 | | | | (.01 | ) | | | (.02 | ) | | | (.01 | ) | | | .00 | (d) |
| | | | | |
Net realized and unrealized gain (loss) on investment transactions | | | .43 | | | | (.65 | ) | | | 1.45 | | | | 2.07 | | | | .66 | |
| | | | |
Net increase (decrease) in net asset value from operations | | | .46 | | | | (.66 | ) | | | 1.43 | | | | 2.06 | | | | .66 | |
| | | | |
Less: Dividends and Distributions | | | | | | | | | | | | | | | | | | | | |
| | | | | |
Dividends from net investment income | | | – 0 | – | | | – 0 | – | | | – 0 | – | | | (.01 | ) | | | (.02 | ) |
| | | | | |
Distributions from net realized gain on investment transactions | | | (.65 | ) | | | (.76 | ) | | | (.07 | ) | | | (.04 | ) | | | – 0 | – |
| | | | |
Total dividends and distributions | | | (.65 | ) | | | (.76 | ) | | | (.07 | ) | | | (.05 | ) | | | (.02 | ) |
| | | | |
Net asset value, end of period | | | $ 12.40 | | | | $ 12.59 | | | | $ 14.01 | | | | $ 12.65 | | | | $ 10.64 | |
| | | | |
Total Return | | | | | | | | | | | | | | | | | | | | |
| | | | | |
Total investment return based on net asset value(e) | | | 4.22 | % | | | (4.97 | )% | | | 11.35 | % | | | 19.52 | % | | | 6.62 | % |
| | | | | |
Ratios/Supplemental Data | | | | | | | | | | | | | | | | | | | | |
| | | | | |
Net assets, end of period (000’s omitted) | | | $163,493 | | | | $179,874 | | | | $197,908 | | | | $140,096 | | | | $79,707 | |
| | | | | |
Ratio to average net assets of: | | | | | | | | | | | | | | | | | | | | |
| | | | | |
Expenses, net of waivers/reimbursements(f)‡ | | | 1.20 | % | | | 1.24 | % | | | 1.24 | % | | | 1.25 | % | | | 1.25 | %^ |
| | | | | |
Expenses, before waivers/reimbursements(f)‡ | | | 1.20 | % | | | 1.25 | % | | | 1.25 | % | | | 1.43 | % | | | 1.91 | %^ |
| | | | | |
Net investment income (loss)(c) | | | .24 | % | | | (.07 | )% | | | (.18 | )% | | | (.12 | )% | | | .02 | %^ |
| | | | | |
Portfolio turnover rate | | | 40 | % | | | 42 | % | | | 36 | % | | | 51 | % | | | 43 | % |
| | | | | | | | | | | | | | | | | | | | |
| |
‡ Expense ratios exclude the estimated acquired fund fees of the affiliated/unaffiliated underlying | |
portfolios | | | 0 | % | | | .01 | % | | | .01 | % | | | .01 | % | | | 0 | % |
See footnote summary on page 36.
| | |
| |
| abfunds.com | | AB SMALL CAP VALUE PORTFOLIO | 33 |
FINANCIAL HIGHLIGHTS(continued)
Selected Data For A Share Of Capital Stock Outstanding Throughout Each Period
| | | | | | | | | | | | | | | | | | | | |
| | | Class C | |
| | | Year Ended November 30, | | | December 3, 2014(a) to November 30, | |
| | | 2019 | | | 2018 | | | 2017 | | | 2016 | | | 2015 | |
| | | | |
| | | | | | | | | | | | | | | | | | | | |
Net asset value, beginning of period | | | $ 12.23 | | | | $ 13.72 | | | | $ 12.48 | | | | $ 10.56 | | | | $ 10.00 | |
| | | | |
Income From Investment Operations | | | | | | | | | | | | | | | | | | | | |
| | | | | |
Net investment loss(b)(c) | | | (.06 | ) | | | (.11 | ) | | | (.12 | ) | | | (.09 | ) | | | (.08 | ) |
| | | | | |
Net realized and unrealized gain (loss) on investment transactions | | | .41 | | | | (.62 | ) | | | 1.43 | | | | 2.05 | | | | .66 | |
| | | | |
Net increase (decrease) in net asset value from operations | | | .35 | | | | (.73 | ) | | | 1.31 | | | | 1.96 | | | | .58 | |
| | | | |
Less: Dividends and Distributions | | | | | | | | | | | | | | | | | | | | |
| | | | | |
Dividends from net investment income | | | – 0 | – | | | – 0 | – | | | – 0 | – | | | – 0 | – | | | (.02 | ) |
| | | | | |
Distributions from net realized gain on investment transactions | | | (.65 | ) | | | (.76 | ) | | | (.07 | ) | | | (.04 | ) | | | – 0 | – |
| | | | |
Total dividends and distributions | | | (.65 | ) | | | (.76 | ) | | | (.07 | ) | | | (.04 | ) | | | (.02 | ) |
| | | | |
Net asset value, end of period | | | $ 11.93 | | | | $ 12.23 | | | | $ 13.72 | | | | $ 12.48 | | | | $ 10.56 | |
| | | | |
Total Return | | | | | | | | | | | | | | | | | | | | |
| | | | | |
Total investment return based on net asset value(e) | | | 3.40 | % | | | (5.62 | )% | | | 10.53 | % | | | 18.62 | % | | | 5.78 | % |
| | | | | |
Ratios/Supplemental Data | | | | | | | | | | | | | | | | | | | | |
| | | | | |
Net assets, end of period (000’s omitted) | | | $278 | | | | $153 | | | | $41 | | | | $53 | | | | $34 | |
| | | | | |
Ratio to average net assets of: | | | | | | | | | | | | | | | | | | | | |
| | | | | |
Expenses, net of waivers/reimbursements(f)‡ | | | 1.97 | % | | | 1.99 | % | | | 1.99 | % | | | 2.00 | % | | | 2.00 | %^ |
| | | | | |
Expenses, before waivers/reimbursements(f)‡ | | | 1.97 | % | | | 2.00 | % | | | 2.07 | % | | | 2.31 | % | | | 4.26 | %^ |
| | | | | |
Net investment loss(c) | | | (.54 | )% | | | (.82 | )% | | | (.94 | )% | | | (.84 | )% | | | (.75 | )%^ |
| | | | | |
Portfolio turnover rate | | | 40 | % | | | 42 | % | | | 36 | % | | | 51 | % | | | 43 | % |
| | | | | | | | | | | | | | | | | | | | |
| |
‡ Expense ratios exclude the estimated acquired fund fees of the affiliated/unaffiliated underlying | |
portfolios | | | 0 | % | | | .01 | % | | | .01 | % | | | .01 | % | | | 0 | % |
See footnote summary on page 36.
| | |
| |
| 34 | AB SMALL CAP VALUE PORTFOLIO | | abfunds.com |
FINANCIAL HIGHLIGHTS(continued)
Selected Data For A Share Of Capital Stock Outstanding Throughout Each Period
| | | | | | | | | | | | | | | | | | | | |
| | | Advisor Class | |
| | | Year Ended November 30, | | | December 3, 2014(a) to November 30, | |
| | | 2019 | | | 2018 | | | 2017 | | | 2016 | | | 2015 | |
| | | | |
| | | | | | | | | | | | | | | | | | | | |
Net asset value, beginning of period | | | $ 12.73 | | | | $ 14.12 | | | | $ 12.71 | | | | $ 10.66 | | | | $ 10.00 | |
| | | | |
Income From Investment Operations | | | | | | | | | | | | | | | | | | | | |
| | | | | |
Net investment income(b)(c) | | | .06 | | | | .03 | | | | .01 | | | | .01 | | | | .02 | |
| | | | | |
Net realized and unrealized gain (loss) on investment transactions | | | .43 | | | | (.66 | ) | | | 1.47 | | | | 2.09 | | | | .66 | |
| | | | |
Net increase (decrease) in net asset value from operations | | | .49 | | | | (.63 | ) | | | 1.48 | | | | 2.10 | | | | .68 | |
| | | | |
Less: Dividends and Distributions | | | | | | | | | | | | | | | | | | | | |
| | | | | |
Dividends from net investment income | | | (.03 | ) | | | – 0 | – | | | – 0 | – | | | (.01 | ) | | | (.02 | ) |
| | | | | |
Distributions from net realized gain on investment transactions | | | (.65 | ) | | | (.76 | ) | | | (.07 | ) | | | (.04 | ) | | | – 0 | – |
| | | | |
Total dividends and distributions | | | (.68 | ) | | | (.76 | ) | | | (.07 | ) | | | (.05 | ) | | | (.02 | ) |
| | | | |
Net asset value, end of period | | | $ 12.54 | | | | $ 12.73 | | | | $ 14.12 | | | | $ 12.71 | | | | $ 10.66 | |
| | | | |
Total Return | | | | | | | | | | | | | | | | | | | | |
| | | | | |
Total investment return based on net asset value(e) | | | 4.41 | % | | | (4.70 | )% | | | 11.69 | % | | | 19.74 | % | | | 6.83 | %(g) |
| | | | | |
Ratios/Supplemental Data | | | | | | | | | | | | | | | | | | | | |
| | | | | |
Net assets, end of period (000’s omitted) | | | $214,197 | | | | $144,136 | | | | $73,679 | | | | $7,635 | | | | $4,075 | |
| | | | | |
Ratio to average net assets of: | | | | | | | | | | | | | | | | | | | | |
| | | | | |
Expenses, net of waivers/reimbursements(f)‡ | | | .95 | % | | | .99 | % | | | .99 | % | | | 1.00 | % | | | 1.00 | %^ |
| | | | | |
Expenses, before waivers/reimbursements(f)‡ | | | .96 | % | | | 1.00 | % | | | 1.00 | % | | | 1.19 | % | | | 3.55 | %^ |
| | | | | |
Net investment income(c) | | | .48 | % | | | .20 | % | | | .07 | % | | | .11 | % | | | .24 | %^ |
| | | | | |
Portfolio turnover rate | | | 40 | % | | | 42 | % | | | 36 | % | | | 51 | % | | | 43 | % |
| | | | | | | | | | | | | | | | | | | | |
| |
‡ Expense ratios exclude the estimated acquired fund fees of the affiliated/unaffiliated underlying | |
portfolios | | | 0 | % | | | .01 | % | | | .01 | % | | | .01 | % | | | 0 | % |
See footnote summary on page 36.
| | |
| |
| abfunds.com | | AB SMALL CAP VALUE PORTFOLIO | 35 |
FINANCIAL HIGHLIGHTS(continued)
Selected Data For A Share Of Capital Stock Outstanding Throughout Each Period
| (a) | Commencement of operations. |
| (b) | Based on average shares outstanding. |
| (c) | Net of expenses waived/reimbursed by the Adviser. |
| (d) | Amount is less than $.005. |
| (e) | Total investment return is calculated assuming an initial investment made at the net asset value at the beginning of the period, reinvestment of all dividends and distributions at net asset value during the period, and redemption on the last day of the period. Initial sales charges or contingent deferred sales charges are not reflected in the calculation of total investment return. Total return does not reflect the deduction of taxes that a shareholder would pay on fund distributions or the redemption of fund shares. Total investment return calculated for a period of less than one year is not annualized. |
| (f) | In connection with the Fund’s investments in affiliated underlying portfolios, the Fund incurs no direct expenses, but bears proportionate shares of the fees and expenses (i.e., operating, administrative and investment advisory fees) of the affiliated underlying portfolios. The Adviser has contractually agreed to waive its fees from the Fund in an amount equal to the Fund’s pro rata share of certain acquired fund fees and expenses, and for the years ended November 30, 2018, November 30, 2017 and November 30, 2016, such waiver amounted to 0.01%, 0.01% and 0.01%, respectively. |
| (g) | The net asset value and total return include adjustments in accordance with accounting principles generally accepted in the United States of America for financial reporting purposes. As such, the net asset value and total return for shareholder transactions may differ from financial statements. |
See notes to financial statements.
| | |
| |
| 36 | AB SMALL CAP VALUE PORTFOLIO | | abfunds.com |
REPORT OF INDEPENDENT REGISTERED
PUBLIC ACCOUNTING FIRM
To the Shareholders and the Board of Directors of AB Small Cap Value Portfolio
Opinion on the Financial Statements
We have audited the accompanying statement of assets and liabilities of AB Small Cap Value Portfolio (the “Fund”) (one of the funds constituting AB Cap Fund, Inc. (the “Company”)), including the portfolio of investments, as of November 30, 2019, and the related statement of operations for the year then ended, the statements of changes in net assets for each of the two years in the period then ended, the financial highlights for each of the four years in the period then ended and for the period December 3, 2014 (commencement of operations) through November 30, 2015 and the related notes (collectively referred to as the “financial statements”). In our opinion, the financial statements present fairly, in all material respects, the financial position of the Fund (one of the funds constituting AB Cap Fund, Inc.) at November 30, 2019, the results of its operations for the year then ended, the changes in its net assets for each of the two years in the period then ended and its financial highlights for each of the four years in the period then ended and for the period December 3, 2014 (commencement of operations) through November 30, 2015, in conformity with U.S. generally accepted accounting principles.
Basis for Opinion
These financial statements are the responsibility of the Company’s management. Our responsibility is to express an opinion on the Fund’s financial statements based on our audits. We are a public accounting firm registered with the Public Company Accounting Oversight Board (United States) (“PCAOB”) and are required to be independent with respect to the Company in accordance with the U.S. federal securities laws and the applicable rules and regulations of the Securities and Exchange Commission and the PCAOB.
We conducted our audits in accordance with the standards of the PCAOB. Those standards require that we plan and perform the audit to obtain reasonable assurance about whether the financial statements are free of material misstatement, whether due to error or fraud. The Company is not required to have, nor were we engaged to perform, an audit of the Company’s internal control over financial reporting. As part of our audits, we are required to obtain an understanding of internal control over financial reporting, but not for the purpose of expressing an opinion on the effectiveness of the Company’s internal control over financial reporting. Accordingly, we express no such opinion.
| | |
| |
| abfunds.com | | AB SMALL CAP VALUE PORTFOLIO | 37 |
REPORT OF INDEPENDENT REGISTERED
PUBLIC ACCOUNTING FIRM(continued)
Our audits included performing procedures to assess the risks of material misstatement of the financial statements, whether due to error or fraud, and performing procedures that respond to those risks. Such procedures included examining, on a test basis, evidence regarding the amounts and disclosures in the financial statements. Our procedures included confirmation of securities owned as of November 30, 2019, by correspondence with the custodian and others or by other appropriate auditing procedures where replies from others were not received. Our audits also included evaluating the accounting principles used and significant estimates made by management, as well as evaluating the overall presentation of the financial statements. We believe that our audits provide a reasonable basis for our opinion.

We have served as the auditor of one or more of the AB investment companies since 1968.
New York, New York
January 24, 2020
| | |
| |
| 38 | AB SMALL CAP VALUE PORTFOLIO | | abfunds.com |
2019 FEDERAL TAX INFORMATION
(unaudited)
For Federal income tax purposes, the following information is furnished with respect to the distributions paid by the Fund during the taxable period ended November 30, 2019. For individual shareholders, the Fund designates 68.64% of dividends paid as qualified dividend income. For corporate shareholders, 62.81% of dividends paid qualify for the dividends received deduction.
Shareholders should not use the above information to prepare their income tax returns. The information necessary to complete your income tax returns will be included with your Form 1099-DIV which will be sent to you separately in January 2020.
| | |
| |
| abfunds.com | | AB SMALL CAP VALUE PORTFOLIO | 39 |
BOARD OF DIRECTORS
| | |
Marshall C. Turner, Jr.(1), Chairman Jorge A. Bermudez(1),* Michael J. Downey(1) Nancy P. Jacklin(1) | | Robert M. Keith,President and Chief Executive Officer Carol J. McMullen(1) Garry L. Moody(1) Earl D. Weiner(1) |
OFFICERS
| | |
James W. MacGregor(2),Vice President Erik A. Turenchalk(2),Vice President Emilie D. Wrapp,Secretary Michael B. Reyes,Senior Analyst | | Joseph J. Mantineo,Treasurer and Chief Financial Officer Phyllis J. Clarke,Controller Vincent S. Noto,Chief Compliance Officer |
| | |
| Custodian and Accounting Agent | | Legal Counsel |
State Street Bank and Trust Company State Street Corporation CCB/5 1 Iron Street
Boston, MA 02210 Principal Underwriter AllianceBernstein Investments, Inc. 1345 Avenue of the Americas New York, NY 10105 Transfer Agent AllianceBernstein Investor Services, Inc. P.O. Box 786003 San Antonio, TX 78278-6003 Toll-Free (800) 221-5672 | | Seward & Kissel LLP One Battery Park Plaza New York, NY 10004 Independent Registered Public Accounting Firm Ernst & Young LLP 5 Times Square New York, NY 10036 |
| 1 | Member of the Audit Committee, the Governance and Nominating Committee and the Independent Directors Committee. |
| 2 | The management of, and investment decisions for, the Fund’s portfolio are made by the Small/Mid Cap Value Senior Investment Management Team. Messrs. MacGregor and Turenchalk are the investment professionals with the most significant responsibility for the day-to-day management of the Fund’s portfolio. |
| * | Mr. Bermudez will join the Board on January 1, 2020. |
| | |
| |
| 40 | AB SMALL CAP VALUE PORTFOLIO | | abfunds.com |
MANAGEMENT OF THE FUND
Board of Directors Information
The business and affairs of the Fund are managed under the direction of the Board of Directors. Certain information concerning the Fund’s Directors is set forth below.
| | | | | | | | |
NAME,
ADDRESS*, AGE,
(YEAR FIRST ELECTED**) | | PRINCIPAL
OCCUPATION(S)
DURING PAST FIVE YEARS
AND OTHER INFORMATION*** | | PORTFOLIOS
IN AB FUND
COMPLEX
OVERSEEN BY
DIRECTOR | | | OTHER PUBLIC
COMPANY
DIRECTORSHIPS
CURRENTLY
HELD BY
DIRECTOR |
| INTERESTED DIRECTOR | | | | | | |
| | | |
Robert M. Keith,#
1345 Avenue of the Americas
New York, NY 10105
59
(2010) | | Senior Vice President of AllianceBernstein L.P. (the “Adviser”) and the head of AllianceBernstein Investments, Inc. (“ABI”) since July 2008; Director of ABI and President of the AB Mutual Funds. Previously, he served as Executive Managing Director of ABI from December 2006 to June 2008. Prior to joining ABI in 2006, Executive Managing Director of Bernstein Global Wealth Management, and prior thereto, Senior Managing Director and Global Head of Client Service and Sales of the Adviser’s institutional investment management business since 2004. Prior thereto, he was Managing Director and Head of North American Client Service and Sales in the Adviser’s institutional investment management business, with which he had been associated since prior to 2004. | | | 91 | | | None |
| | |
| |
| abfunds.com | | AB SMALL CAP VALUE PORTFOLIO | 41 |
MANAGEMENT OF THE FUND (continued)
| | | | | | | | |
NAME,
ADDRESS*, AGE,
(YEAR FIRST ELECTED**) | | PRINCIPAL
OCCUPATION(S)
DURING PAST FIVE YEARS
AND OTHER INFORMATION*** | | PORTFOLIOS
IN AB FUND
COMPLEX
OVERSEEN BY
DIRECTOR | | | OTHER PUBLIC
COMPANY
DIRECTORSHIPS
CURRENTLY
HELD BY
DIRECTOR |
| DISINTERESTED DIRECTORS | | | | | | |
| | | |
Marshall C. Turner, Jr.,##
Chairman of the Board
78
(2005) | | Private Investor since prior to 2015. Former Chairman and CEO of Dupont Photomasks, Inc. (components of semi-conductor manufacturing). He has extensive operating leadership and venture capital investing experience, including five interim or full-time CEO roles, and prior service as general partner of institutional venture capital partnerships. He also has extensive non-profit board leadership experience, and currently serves on the boards of two education and science-related non-profit organizations. He has served as a director of one AB Fund since 1992, and director or trustee of all AB Funds since 2005. He has been Chairman of the AB Funds since January 2014, and the Chairman of the Independent Directors Committees of such AB Funds since February 2014. | | | 91 | | | Xilinx, Inc. (programmable logicsemi- conductors) since 2007 |
| | | | | | | | |
| | |
| |
| 42 | AB SMALL CAP VALUE PORTFOLIO | | abfunds.com |
MANAGEMENT OF THE FUND (continued)
| | | | | | | | |
NAME,
ADDRESS*, AGE,
(YEAR FIRST ELECTED**) | | PRINCIPAL
OCCUPATION(S)
DURING PAST FIVE YEARS
AND OTHER INFORMATION*** | | PORTFOLIOS
IN AB FUND
COMPLEX
OVERSEEN BY
DIRECTOR | | | OTHER PUBLIC
COMPANY
DIRECTORSHIPS
CURRENTLY
HELD BY
DIRECTOR |
DISINTERESTED DIRECTORS
(continued) | | | | | | |
| | | |
Jorge A. Bermudez,^ 68 (2020) | | Private investor since prior to 2015. Former Chief Risk Officer of Citigroup, Inc., a global financial services company, from November 2007 to March 2008, Chief Executive Officer of Citigroup’s Commercial Business Group in North America and Citibank Texas from 2005 to 2007, and a variety of other executive and leadership roles at various businesses within Citigroup prior to then; Chairman (2018) of the Texas A&M Foundation Board of Trustees (Trustee since 2013) and Chairman of the Smart Grid Center Board at Texas A&M University since 2012; director of, among others, Citibank N.A. from 2005 to 2008, the Federal Reserve Bank of Dallas, Houston Branch from 2009 to 2011, the Federal Reserve Bank of Dallas from 2011 to 2017, and the Electric Reliability Council of Texas from 2010 to 2016. He has served as director or trustee of the AB Funds since 2020. | | | 91 | | | Moody’s Corporation since April 2011. |
| | | | | | | | |
| | | |
Michael J. Downey,##
76
(2005) | | Private Investor since prior to 2015. Formerly, Chairman of The Asia Pacific Fund, Inc. (registered investment company) since prior to 2015 until January 2019. From 1987 until 1993, Chairman and CEO of Prudential Mutual Fund Management, director of the Prudential mutual funds, and member of the Executive Committee of Prudential Securities, Inc. He has served as a director or trustee of the AB Funds since 2005. | | | | | | None |
| | | | | | | | |
| | |
| |
| abfunds.com | | AB SMALL CAP VALUE PORTFOLIO | ��43 |
MANAGEMENT OF THE FUND (continued)
| | | | | | | | |
NAME,
ADDRESS*, AGE,
(YEAR FIRST ELECTED**) | | PRINCIPAL
OCCUPATION(S)
DURING PAST FIVE YEARS
AND OTHER INFORMATION*** | | PORTFOLIOS
IN AB FUND
COMPLEX
OVERSEEN BY
DIRECTOR | | | OTHER PUBLIC
COMPANY
DIRECTORSHIPS
CURRENTLY
HELD BY
DIRECTOR |
DISINTERESTED DIRECTORS
(continued) | | | | | | |
| | | |
Nancy P. Jacklin,##
71
(2006) | | Private Investor since prior to 2015. Professorial Lecturer at the Johns Hopkins School of Advanced International Studies (2008-2015). U.S. Executive Director of the International Monetary Fund (which is responsible for ensuring the stability of the international monetary system), (December 2002-May 2006); Partner, Clifford Chance (1992-2002); Sector Counsel, International Banking and Finance, and Associate General Counsel, Citicorp (1985-1992); Assistant General Counsel (International), Federal Reserve Board of Governors (1982-1985); and Attorney Advisor, U.S. Department of the Treasury (1973-1982). Member of the Bar of the District of Columbia and of New York; and member of the Council on Foreign Relations. She has served as a director or trustee of the AB Funds since 2006 and has been Chair of the Governance and Nominating Committees of the AB Funds since August 2014. | | | 91 | | | None |
| | | | | | | | |
| | |
| |
| 44 | AB SMALL CAP VALUE PORTFOLIO | | abfunds.com |
MANAGEMENT OF THE FUND (continued)
| | | | | | | | |
NAME,
ADDRESS*, AGE,
(YEAR FIRST ELECTED**) | | PRINCIPAL
OCCUPATION(S)
DURING PAST FIVE YEARS
AND OTHER INFORMATION*** | | PORTFOLIOS
IN AB FUND
COMPLEX
OVERSEEN BY
DIRECTOR | | | OTHER PUBLIC
COMPANY
DIRECTORSHIPS
CURRENTLY
HELD BY
DIRECTOR |
DISINTERESTED DIRECTORS
(continued) | | | | | | |
| | | |
Carol C. McMullen,## 64 (2016) | | Managing Director of Slalom Consulting (consulting) since 2014, private investor and member of the Advisory Board of Butcher Box (since 2018). Formerly, member, Partners Healthcare Investment Committee (2010-2019); Director of Norfolk & Dedham Group (mutual property and casualty insurance) from 2011 until November 2016; Director of Partners Community Physicians Organization (healthcare) since 2014 until December 2016; and Managing Director of The Crossland Group (consulting) from 2012 until 2013. She has held a number of senior positions in the asset and wealth management industries, including at Eastern Bank (where her roles included President of Eastern Wealth Management), Thomson Financial (Global Head of Sales for Investment Management), and Putnam Investments (where her roles included Chief Investment Officer, Core and Growth and Head of Global Investment Research). She has served on a number of private company and non-profit boards, and as a director or trustee of the AB Funds since June 2016. | | | 91 | | | None |
| | |
| |
| abfunds.com | | AB SMALL CAP VALUE PORTFOLIO | 45 |
MANAGEMENT OF THE FUND (continued)
| | | | | | | | |
NAME,
ADDRESS*, AGE,
(YEAR FIRST ELECTED**) | | PRINCIPAL
OCCUPATION(S)
DURING PAST FIVE YEARS
AND OTHER INFORMATION*** | | PORTFOLIOS
IN AB FUND
COMPLEX
OVERSEEN BY
DIRECTOR | | | OTHER PUBLIC
COMPANY
DIRECTORSHIPS
CURRENTLY
HELD BY
DIRECTOR |
DISINTERESTED DIRECTORS
(continued) | | | | | | |
| | | |
Garry L. Moody,##
67
(2008) | | Formerly, Partner, Deloitte & Touche LLP (1995-2008) where he held a number of senior positions, including Vice Chairman, and U.S. and Global Investment Management Practice Managing Partner; President, Fidelity Accounting and Custody Services Company (1993-1995), where he was responsible for accounting, pricing, custody and reporting for the Fidelity mutual funds; and Partner, Ernst & Young LLP (1975-1993), where he served as the National Director of Mutual Fund Tax Services and Managing Partner of its Chicago Office Tax department. He is a member of the Trustee Advisory Board of BoardIQ, a biweekly publication focused on issues and news affecting directors of mutual funds. He is also a member of the Investment Company Institute’s Board of Governors and the Independent Directors Council Governing Council. He has served as a director or trustee, and as Chairman of the Audit Committees, of the AB Funds since 2008. | | | 91 | | | None |
| | | | | | | | |
| | |
| |
| 46 | AB SMALL CAP VALUE PORTFOLIO | | abfunds.com |
MANAGEMENT OF THE FUND (continued)
| | | | | | | | |
NAME,
ADDRESS*, AGE,
(YEAR FIRST ELECTED**) | | PRINCIPAL
OCCUPATION(S)
DURING PAST FIVE YEARS
AND OTHER INFORMATION*** | | PORTFOLIOS
IN AB FUND
COMPLEX
OVERSEEN BY
DIRECTOR | | | OTHER PUBLIC
COMPANY
DIRECTORSHIPS
CURRENTLY
HELD BY
DIRECTOR |
DISINTERESTED DIRECTORS
(continued) | | | | | | |
| | | |
Earl D. Weiner,##
80
(2007) | | Senior Counsel since 2017, Of Counsel from 2007 to 2016, and Partner prior to then, of the law firm Sullivan & Cromwell LLP. He is a former member of the ABA Federal Regulation of Securities Committee Task Force to draft editions of the Fund Director’s Guidebook. He also serves as a director or trustee of various non-profit organizations and has served as Chairman or Vice Chairman of a number of them. He has served as a director or trustee of the AB Funds since 2007 and served as Chairman of the Governance and Nominating Committees of the AB Funds from 2007 until August 2014. | | | 91 | | | None |
| * | The address for each of the Fund’s disinterested Directors is c/o AllianceBernstein L.P., Attention: Legal and Compliance Department—Mutual Fund Legal, 1345 Avenue of the Americas, New York, NY 10105 |
| ** | There is no stated term of office for the Fund’s Directors. |
| *** | The information above includes each Director’s principal occupation during the last five years and other information relating to the experience, attributes and skills relevant to each Director’s qualifications to serve as a Director, which led to the conclusion that each Director should serve as a Director for the Fund. |
| # | Mr. Keith is an “interested director” of the Fund, as defined in the 1940 Act, due to his position as a Senior Vice President of the Adviser. |
| ## | Member of the Audit Committee, the Governance and Nominating Committee and the Independent Directors Committee. |
| ^ | Mr. Bermudez will be a Member of the Audit Committee, the Governance and Nominating Committee and Independent Directors Committee when he joins the Board on January 1, 2020. |
| | |
| |
| abfunds.com | | AB SMALL CAP VALUE PORTFOLIO | 47 |
MANAGEMENT OF THE FUND (continued)
Officers of the Fund
Certain information concerning the Fund’s Officers is listed below.
| | | | |
NAME, ADDRESS*
AND AGE | | PRINCIPAL POSITION(S)
HELD WITH FUND | | PRINCIPAL OCCUPATION
DURING PAST FIVE YEARS |
Robert M. Keith 59 | | President and Chief Executive Officer | | See biography above. |
| | | | |
James W. MacGregor 52 | | Vice President | | Senior Vice President of the Adviser**, with which he has been associated since prior to 2015. He is also Chief Investment Officer of US Small and Mid-Cap Value Equities. |
| | | | |
Erik A. Turenchalk 46 | | Vice President | | Senior Vice President of the Adviser**, with which he has been associated since prior to 2015. |
| | | | |
Emilie D. Wrapp 64 | | Secretary | | Senior Vice President, Assistant General Counsel and Assistant Secretary of ABI**, with which she has been associated since prior to 2015. |
| | | | |
Michael B. Reyes 43 | | Senior Analyst | | Vice President of the Adviser**, with which he has been associated since prior to 2015. |
| | | | |
Joseph J. Mantineo 60 | | Treasurer and Chief Financial Officer | | Senior Vice President of AllianceBernstein Investor Services, Inc. (“ABIS”)**, with which he has been associated since prior to 2015. |
| | | | |
Phyllis J. Clarke 59 | | Controller | | Vice President of ABIS**, with which she has been associated since prior to 2015. |
| | | | |
Vincent S. Noto 55 | | Chief Compliance Officer | | Senior Vice President since 2015 and Mutual Fund Chief Compliance Officer of the Adviser** since 2014. Prior thereto, he was Vice President and Director of Mutual Fund Compliance of the Adviser** since 2012. |
| * | The address for each of the Fund’s Officers is 1345 Avenue of the Americas, New York, NY 10105. |
| ** | The Adviser, ABI and ABIS are affiliates of the Fund. |
The Fund’s Statement of Additional Information (“SAI”) has additional information about the Fund’s Trustees and Officers and is available without charge upon request. Contact your financial representative or AB at(800) 227-4618, or visit www.abfunds.com, for a free prospectus or SAI.
| | |
| |
| 48 | AB SMALL CAP VALUE PORTFOLIO | | abfunds.com |
Information Regarding the Review and Approval of the Fund’s Advisory Agreement
The disinterested directors (the “directors”) of AB Cap Fund, Inc. (the “Company”) unanimously approved the continuance of the Company’s Advisory Agreement with the Adviser in respect of AB Small Cap Value Portfolio (the “Fund”) at a meeting held onMay 7-9, 2019 (the “Meeting”).
Prior to approval of the continuance of the Advisory Agreement, the directors had requested from the Adviser, and received and evaluated, extensive materials. They reviewed the proposed continuance of the Advisory Agreement with the Adviser and with experienced counsel who are independent of the Adviser, who advised on the relevant legal standards. The directors also reviewed additional materials, including comparative analytical data prepared by the Senior Analyst for the Fund. The directors also discussed the proposed continuance in private sessions with counsel.
The directors considered their knowledge of the nature and quality of the services provided by the Adviser to the Fund gained from their experience as directors or trustees of most of the registered investment companies advised by the Adviser, their overall confidence in the Adviser’s integrity and competence they have gained from that experience, the Adviser’s initiative in identifying and raising potential issues with the directors and its responsiveness, frankness and attention to concerns raised by the directors in the past, including the Adviser’s willingness to consider and implement organizational and operational changes designed to improve investment results and the services provided to the AB Funds. The directors noted that they have four regular meetings each year, at each of which they review extensive materials and information from the Adviser, including information on the investment performance of the Fund.
The directors also considered all factors they believed relevant, including the specific matters discussed below. During the course of their deliberations, the directors evaluated, among other things, the reasonableness of the advisory fee. The directors did not identify any particular information that wasall-important or controlling, and different directors may have attributed different weights to the various factors. The directors determined that the selection of the Adviser to manage the Fund and the overall arrangements between the Fund and the Adviser, as provided in the Advisory Agreement, including the advisory fee, were fair and reasonable in light of the services performed, expenses incurred and such other matters as the directors considered relevant in the exercise of their business judgment. The material factors and conclusions that formed the basis for the directors’ determinations included the following:
Nature, Extent and Quality of Services Provided
The directors considered the scope and quality of services provided by the Adviser under the Advisory Agreement, including the quality of the
| | |
| |
| abfunds.com | | AB SMALL CAP VALUE PORTFOLIO | 49 |
investment research capabilities of the Adviser and the other resources it has dedicated to performing services for the Fund. The directors noted that the Adviser from time to time reviews the Fund’s investment strategies and from time to time proposes changes intended to improve the Fund’s relative or absolute performance for the directors’ consideration. They also noted the professional experience and qualifications of the Fund’s portfolio management team and other senior personnel of the Adviser. The directors also considered that the Advisory Agreement provides that the Fund will reimburse the Adviser for the cost to it of providing certain clerical, accounting, administrative and other services to the Fund by employees of the Adviser or its affiliates. Requests for these reimbursements are made on a quarterly basis and subject to approval by the directors. The directors noted that the methodology used to determine the reimbursement amounts had been reviewed by an independent consultant retained by the Fund’s prior Senior Officer/Independent Compliance Officer. The quality of administrative and other services, including the Adviser’s role in coordinating the activities of the Fund’s other service providers, also was considered. The directors concluded that, overall, they were satisfied with the nature, extent and quality of services provided to the Fund under the Advisory Agreement.
Costs of Services Provided and Profitability
The directors reviewed a schedule of the revenues and expenses and related notes indicating the profitability of the Fund to the Adviser for calendar years 2017 and 2018 that had been prepared with an expense allocation methodology arrived at in consultation with an independent consultant retained by the Fund’s prior Senior Officer/Independent Compliance Officer. The directors noted the assumptions and methods of allocation used by the Adviser in preparing fund-specific profitability data and understood that there are a number of potentially acceptable allocation methodologies for information of this type. The directors noted that the profitability information reflected all revenues and expenses of the Adviser’s relationship with the Fund, including those relating to its subsidiaries that provide transfer agency, distribution and brokerage services to the Fund. The directors recognized that it is difficult to make comparisons of the profitability of the Advisory Agreement with the profitability of advisory contracts for unaffiliated funds because comparative information is not generally publicly available and is affected by numerous factors. The directors focused on the profitability of the Adviser’s relationship with the Fund before taxes and distribution expenses. The directors concluded that the Adviser’s level of profitability from its relationship with the Fund was not unreasonable.
Fall-Out Benefits
The directors considered the other benefits to the Adviser and its affiliates from their relationships with the Fund and the underlying fund advised by the Adviser in which the Fund invests, including, but not limited to, benefits
| | |
| |
| 50 | AB SMALL CAP VALUE PORTFOLIO | | abfunds.com |
relating to soft dollar arrangements (whereby investment advisers receive brokerage and research services from brokers that execute agency transactions for their clients);12b-1 fees and sales charges received by the Fund’s principal underwriter (which is a wholly owned subsidiary of the Adviser) in respect of certain classes of the Fund’s shares; brokerage commissions paid by the Fund to brokers affiliated with the Adviser; and transfer agency fees paid by the Fund to a wholly owned subsidiary of the Adviser. The directors recognized that the Adviser’s profitability would be somewhat lower without these benefits. The directors understood that the Adviser also might derive reputational and other benefits from its association with the Fund.
Investment Results
In addition to the information reviewed by the directors in connection with the Meeting, the directors receive detailed performance information for the Fund at each regular Board meeting during the year.
At the Meeting, the directors reviewed performance information prepared by an independent service provider (the “15(c) service provider”), showing the performance of the Class A Shares of the Fund against a group of similar funds (“peer group”) and a larger group of similar funds (“peer universe”), each selected by the 15(c) service provider, and information prepared by the Adviser showing performance of the Class A Shares against a broad-based securities market index, in each case for the1- and3-year periods ended February 28, 2019 and (in the case of comparisons with the broad-based securities market index) for the period from inception. Based on their review, the directors concluded that the Fund’s investment performance was acceptable.
Advisory Fees and Other Expenses
The directors considered the advisory fee rate payable by the Fund to the Adviser and information prepared by the 15(c) service provider concerning advisory fee rates payable by other funds in the same category as the Fund. The directors recognized that it is difficult to make comparisons of advisory fees because there are variations in the services that are included in the fees paid by other funds. The directors compared the Fund’s contractual advisory fee rate with a peer group median and took into account the impact on the advisory fee rate of the administrative expense reimbursement paid to the Adviser in the latest fiscal year.
The directors also considered the Adviser’s fee schedule for other clients pursuing an investment strategy similar to the Fund’s. For this purpose, they reviewed the relevant advisory fee information from the Adviser’s Form ADV and in a report from the Fund’s Senior Analyst and noted the differences between the Fund’s fee schedule, on the one hand, and the Adviser’s institutional fee schedule and the schedule of fees charged by the Adviser to any offshore funds and for services to anysub-advised
| | |
| |
| abfunds.com | | AB SMALL CAP VALUE PORTFOLIO | 51 |
funds pursuing an investment strategy similar to the Fund’s, on the other. The directors noted that the Adviser may, in some cases, agree to fee rates with large institutional clients that are lower than those reviewed by the directors and that they had previously discussed with the Adviser its policies in respect of such arrangements. The directors previously discussed these matters with an independent fee consultant. The directors also compared the advisory fee rate for the Fund with that for another fund advised by the Adviser with a similar investment strategy.
The Adviser reviewed with the directors the significantly greater scope of the services it provides to the Fund relative to institutional, offshore fund andsub-advised fund clients. In this regard, the Adviser noted, among other things, that, compared to institutional and offshore orsub-advisory accounts, the Fund (i) demands considerably more portfolio management, research and trading resources due to significantly higher daily cash flows; (ii) has more tax and regulatory restrictions and compliance obligations; (iii) must prepare and file or distribute regulatory and other communications about fund operations; and (iv) must provide shareholder servicing to retail investors. The Adviser also reviewed the greater legal risks presented by the large and changing population of Fund shareholders who may assert claims against the Adviser in individual or class actions, and the greater entrepreneurial risk in offering new fund products, which require substantial investment to launch, may not succeed, and generally must be priced to compete with larger, more established funds resulting in lack of profitability to the Adviser until a new fund achieves scale. In light of the substantial differences in services rendered by the Adviser to institutional, offshore fund andsub-advised fund clients as compared to the Fund, and the different risk profile, the directors considered these fee comparisons inapt and did not place significant weight on them in their deliberations.
The directors noted that the Fund may invest in shares of exchange-traded funds (“ETFs”), subject to the restrictions and limitations of the Investment Company Act of 1940 as these may be varied as a result of exemptive orders issued by the SEC. The directors also noted that ETFs pay advisory fees pursuant to their advisory contracts. The directors concluded, based on the Adviser’s explanation of how it uses ETFs when they are the most cost-effective way to obtain desired exposures, in some cases pending purchases of underlying securities, that the advisory fee for the Fund would be for services that would be in addition to, rather than duplicative of, the services provided under the advisory contracts of the ETFs.
In connection with their review of the Fund’s advisory fee, the directors also considered the total expense ratio of the Class A shares of the Fund in comparison to a peer group and a peer universe selected by the 15(c) service provider. The Class A expense ratio of the Fund was based on the Fund’s latest fiscal year and the directors considered the Adviser’s expense cap for the Fund. The directors noted that it was likely that the expense ratios of some of the other funds in the Fund’s category were
| | |
| |
| 52 | AB SMALL CAP VALUE PORTFOLIO | | abfunds.com |
lowered by waivers or reimbursements by those funds’ investment advisers, which in some cases might be voluntary or temporary. The directors view expense ratio information as relevant to their evaluation of the Adviser’s services because the Adviser is responsible for coordinating services provided to the Fund by others. Based on their review, the directors concluded that the Fund’s expense ratio was acceptable.
Economies of Scale
The directors noted that the advisory fee schedule for the Fund does not contain breakpoints and that they had discussed their strong preference for breakpoints in advisory contracts with the Adviser. The directors took into consideration prior presentations by an independent consultant on economies of scale in the mutual fund industry and for the AB Funds, and presentations from time to time by the Adviser concerning certain of its views on economies of scale. The directors also previously discussed economies of scale with an independent fee consultant. The directors also had requested and received from the Adviser certain updates on economies of scale in advance of the Meeting. The directors believe that economies of scale may be realized (if at all) by the Adviser across a variety of products and services, and not only in respect of a single fund. The directors noted that there is no established methodology for setting breakpoints that give effect to the fund-specific services provided by a fund’s adviser and to the economies of scale that an adviser may realize in its overall mutual fund business or those components of it which directly or indirectly affect a fund’s operations. The directors observed that in the mutual fund industry as a whole, as well as among funds similar to the Fund, there is no uniformity or pattern in the fees and asset levels at which breakpoints (if any) apply. The directors also noted that the advisory agreements for many funds do not have breakpoints at all. The directors informed the Adviser that they would monitor the Fund’s asset level (which was well below the level at which they would anticipate adding an initial breakpoint) and its profitability to the Adviser and anticipated revisiting the question of breakpoints in the future if circumstances warranted doing so.
| | |
| |
| abfunds.com | | AB SMALL CAP VALUE PORTFOLIO | 53 |
This page is not part of the Shareholder Report or the Financial Statements.
AB FAMILY OF FUNDS
US EQUITY
US CORE
Core Opportunities Fund
FlexFee™ US Thematic Portfolio
Select US Equity Portfolio
US GROWTH
Concentrated Growth Fund
Discovery Growth Fund
FlexFee™ Large Cap Growth Portfolio
Growth Fund
Large Cap Growth Fund
Small Cap Growth Portfolio
US VALUE
Discovery Value Fund
Equity Income Fund
Relative Value Fund
Small Cap Value Portfolio
Value Fund
INTERNATIONAL/ GLOBAL EQUITY
INTERNATIONAL/ GLOBAL CORE
FlexFee™ International Strategic Core Portfolio
Global Core Equity Portfolio
International Portfolio
International Strategic Core Portfolio
Sustainable Global Thematic Fund
Tax-Managed International Portfolio
Tax-Managed Wealth Appreciation Strategy
Wealth Appreciation Strategy
INTERNATIONAL/ GLOBAL GROWTH
Concentrated International Growth Portfolio
FlexFee™ Emerging Markets Growth Portfolio
INTERNATIONAL/ GLOBAL EQUITY(continued)
Sustainable International Thematic Fund
INTERNATIONAL/ GLOBAL VALUE
All China Equity Portfolio
International Value Fund
FIXED INCOME
MUNICIPAL
High Income Municipal Portfolio
Intermediate California Municipal Portfolio
Intermediate Diversified Municipal Portfolio
Intermediate New York Municipal Portfolio
Municipal Bond Inflation Strategy
Tax-Aware Fixed Income Portfolio
National Portfolio
Arizona Portfolio
California Portfolio
Massachusetts Portfolio
Minnesota Portfolio
New Jersey Portfolio
New York Portfolio
Ohio Portfolio
Pennsylvania Portfolio
Virginia Portfolio
TAXABLE
Bond Inflation Strategy
FlexFee™ High Yield Portfolio
FlexFee™ International Bond Portfolio
Global Bond Fund
High Income Fund
Income Fund
Intermediate Duration Portfolio
Limited Duration High Income Portfolio
Short Duration Portfolio
Total Return Bond Portfolio1
ALTERNATIVES
All Market Real Return Portfolio
Global Real Estate Investment Fund
Select US Long/Short Portfolio
Unconstrained Bond Fund
MULTI-ASSET
All Market Income Portfolio
All Market Total Return Portfolio
Conservative Wealth Strategy
Emerging Markets Multi-Asset Portfolio
Global Risk Allocation Fund
Tax-Managed All Market Income Portfolio
TARGET-DATE
Multi-Manager Select Retirement Allocation Fund
Multi-Manager Select 2010 Fund
Multi-Manager Select 2015 Fund
Multi-Manager Select 2020 Fund
Multi-Manager Select 2025 Fund
Multi-Manager Select 2030 Fund
Multi-Manager Select 2035 Fund
Multi-Manager Select 2040 Fund
Multi-Manager Select 2045 Fund
Multi-Manager Select 2050 Fund
Multi-Manager Select 2055 Fund
Multi-Manager Select 2060 Fund
CLOSED-END FUNDS
AllianceBernstein Global High Income Fund
AllianceBernstein National Municipal Income Fund
We also offer Government Money Market Portfolio, which serves as the money market fund exchange vehicle for the AB mutual funds. You could lose money by investing in the Fund. Although the Fund seeks to preserve the value of your investment at $1.00 per share, it cannot guarantee it will do so. The Fund may impose a fee upon sale of your shares or may temporarily suspend your ability to sell shares if the Fund’s liquidity falls below required minimums because of market conditions or other factors. An investment in the Fund is not insured or guaranteed by the Federal Deposit Insurance Corporation or any other government agency. The Fund’s sponsor has no legal obligation to provide financial support to the Fund, and you should not expect that the sponsor will provide financial support to the Fund at any time.
Investors should consider the investment objectives, risks, charges and expenses of the Fund carefully before investing. For copies of our prospectus or summary prospectus, which contain this and other information, visit us online at www.abfunds.com or contact your AB representative. Please read the prospectus and/or summary prospectus carefully before investing.
| 1 | Prior to July 12, 2019, Total Return Bond Portfolio was named Intermediate Bond Portfolio. |
| | |
| |
| 54 | AB SMALL CAP VALUE PORTFOLIO | | abfunds.com |
NOTES
| | |
| |
| abfunds.com | | AB SMALL CAP VALUE PORTFOLIO | 55 |
NOTES
| | |
| |
| 56 | AB SMALL CAP VALUE PORTFOLIO | | abfunds.com |
NOTES
| | |
| |
| abfunds.com | | AB SMALL CAP VALUE PORTFOLIO | 57 |
NOTES
| | |
| |
| 58 | AB SMALL CAP VALUE PORTFOLIO | | abfunds.com |
NOTES
| | |
| |
| abfunds.com | | AB SMALL CAP VALUE PORTFOLIO | 59 |
NOTES
| | |
| |
| 60 | AB SMALL CAP VALUE PORTFOLIO | | abfunds.com |
AB SMALL CAP VALUE PORTFOLIO
1345 Avenue of the Americas
New York, NY 10105
800 221 5672
SCV-0151-1119 
ITEM 2. CODE OF ETHICS.
(a) The registrant has adopted a code of ethics that applies to its principal executive officer, principal financial officer and principal accounting officer. A copy of the registrant’s code of ethics is filed herewith as Exhibit 12(a)(1).
(b) During the period covered by this report, no material amendments were made to the provisions of the code of ethics adopted in 2(a) above.
(c) During the period covered by this report, no implicit or explicit waivers to the provisions of the code of ethics adopted in 2(a) above were granted.
ITEM 3. AUDIT COMMITTEE FINANCIAL EXPERT.
The registrant’s Board of Directors has determined that independent directors Garry L. Moody and Marshall C. Turner, Jr. qualify as audit committee financial experts.
ITEM 4. PRINCIPAL ACCOUNTANT FEES AND SERVICES.
(a) - (c) The following table sets forth the aggregate fees billed by the independent registered public accounting firm Ernst & Young LLP, for the Fund’s last two fiscal years for professional services rendered for: (i) the audit of the Fund’s annual financial statements included in the Fund’s annual report to stockholders; (ii) assurance and related services that are reasonably related to the performance of the audit of the Fund’s financial statements and are not reported under (i), which include advice and education related to accounting and auditing issues and quarterly press release review (for those Funds which issue press releases), and preferred stock maintenance testing (for those Funds that issue preferred stock); and (iii) tax compliance, tax advice and tax return preparation.
| | | | | | | | | | | | | | | | |
| | | | | | Audit-Related | | | | |
| | | | | | Audit Fees | | | Fees | | | Tax Fees | |
AB All Market Income | | | 2018 | | | $ | 84,412 | | | $ | 6 | | | $ | 32,787 | |
| | | 2019 | | | $ | 84,412 | | | $ | — | | | $ | 44,085 | |
AB Small Cap Value | | | 2018 | | | $ | 31,404 | | | $ | — | | | $ | 28,602 | |
| | | 2019 | | | $ | 31,404 | | | $ | — | | | $ | 33,180 | |
AB All China Equity | | | 2018 | | | $ | 25,481 | | | $ | — | | | $ | 14,065 | |
| | | 2019 | | | $ | 33,975 | | | $ | — | | | $ | 15,867 | |
(d) Not applicable.
(e) (1) Beginning with audit andnon-audit service contracts entered into on or after May 6, 2003, the Fund’s Audit Committee policies and procedures require thepre-approval of all audit andnon-audit services provided to the Fund by the Fund’s independent registered public accounting firm. The Fund’s Audit Committee policies and procedures also requirepre-approval of all audit andnon-audit services provided to the Adviser and Service Affiliates to the extent that these services are directly related to the operations or financial reporting of the Fund.
(e) (2) All of the amounts for Audit Fees, Audit-Related Fees and Tax Fees in the table under Item 4 (a) – (c) are for servicespre-approved by the Fund’s Audit Committee.
(f) Not applicable.
(g) The following table sets forth the aggregatenon-audit services provided to the Fund, the Fund’s Adviser and entities that control, are controlled by or under common control with the Adviser that provide ongoing services to the Fund:
| | | | | | | | | | | | |
| | | | | | All Fees for
Non-Audit Services
Provided to the
Portfolio, the Adviser
and Service
Affiliates | | | Total Amount
of Foregoing Column
Pre-approved by the
Audit Committee
(Portion Comprised of
Audit Related Fees)
(Portion Comprised of
Tax Fees) | |
AB All Market Income | | | 2018 | | | $ | 847,465 | | | $ | 32,793 | |
| | | | | | | | | | $ | (6 | ) |
| | | | | | | | | | $ | (32,787 | ) |
| | | 2019 | | | $ | 788,141 | | | $ | 44,085 | |
| | | | | | | | | | $ | — | |
| | | | | | | | | | $ | (44,085 | ) |
AB Small Cap Value | | | 2018 | | | $ | 843,274 | | | $ | 28,602 | |
| | | | | | | | | | $ | — | |
| | | | | | | | | | $ | (28,602 | ) |
| | | 2019 | | | $ | 777,236 | | | $ | 33,180 | |
| | | | | | | | | | $ | — | |
| | | | | | | | | | $ | (33,180 | ) |
AB All China Equity | | | 2018 | | | $ | 828,737 | | | $ | 14,065 | |
| | | | | | | | | | $ | — | |
| | | | | | | | | | $ | (14,065 | ) |
| | | 2019 | | | $ | 759,922 | | | $ | 15,867 | |
| | | | | | | | | | $ | — | |
| | | | | | | | | | $ | (15,867 | ) |
(h) The Audit Committee of the Fund has considered whether the provision of anynon-audit services notpre-approved by the Audit Committee provided by the Fund’s independent registered public accounting firm to the Adviser and Service Affiliates is compatible with maintaining the auditor’s independence.
ITEM 5. AUDIT COMMITTEE OF LISTED REGISTRANTS.
Not applicable to the registrant.
ITEM 6. SCHEDULE OF INVESTMENTS.
Please see Schedule of Investments contained in the Report to Shareholders included under Item 1 of this FormN-CSR.
ITEM 7. DISCLOSURE OF PROXY VOTING POLICIES AND PROCEDURES FORCLOSED-END MANAGEMENT INVESTMENT COMPANIES.
Not applicable to the registrant.
ITEM 8. PORTFOLIO MANAGERS OFCLOSED-END MANAGEMENT INVESTMENT COMPANIES.
Not applicable to the registrant.
ITEM 9. PURCHASES OF EQUITY SECURITIES BYCLOSED-END MANAGEMENT INVESTMENT COMPANY AND AFFILIATED PURCHASERS.
Not applicable to the registrant.
ITEM 10. SUBMISSION OF MATTERS TO A VOTE OF SECURITY HOLDERS.
There have been no material changes to the procedures by which shareholders may recommend nominees to the Fund’s Board of Directors since the Fund last provided disclosure in response to this item.
ITEM 11. CONTROLS AND PROCEDURES.
(a) The registrant’s principal executive officer and principal financial officer have concluded that the registrant’s disclosure controls and procedures (as defined in Rule30a-2(c) under the Investment Company Act of 1940, as amended) are effective at the reasonable assurance level based on their evaluation of these controls and procedures as of a date within 90 days of the filing date of this document.
(b) There were no changes in the registrant’s internal controls over financial reporting that occurred during the second fiscal quarter of the period that has materially affected, or is reasonably likely to materially affect, the registrant’s internal control over financial reporting.
ITEM 12. EXHIBITS.
The following exhibits are attached to this FormN-CSR:
| | |
EXHIBIT NO. | | DESCRIPTION OF EXHIBIT |
| |
12 (a) (1) | | Code of Ethics that is subject to the disclosure of Item 2 hereof |
| |
12 (b) (1) | | Certification of Principal Executive Officer Pursuant to Section 302 of the Sarbanes-Oxley Act of 2002 |
| |
12 (b) (2) | | Certification of Principal Financial Officer Pursuant to Section 302 of the Sarbanes-Oxley Act of 2002 |
| |
12 (c) | | Certification of Principal Executive Officer and Principal Financial Officer Pursuant to Section 906 of theSarbanes-Oxley Act of 2002 |
SIGNATURES
Pursuant to the requirements of the Securities Exchange Act of 1934 and the Investment Company Act of 1940, the registrant has duly caused this report to be signed on its behalf by the undersigned, thereunto duly authorized.
| | |
| (Registrant): AB Cap Fund, Inc. |
| |
| By: | | /s/ Robert M. Keith |
| | Robert M. Keith |
| | President |
Date: January 29, 2020
Pursuant to the requirements of the Securities Exchange Act of 1934 and the Investment Company Act of 1940, this report has been signed below by the following persons on behalf of the registrant and in the capacities and on the dates indicated.
| | |
| By: | | /s/ Robert M. Keith |
| | Robert M. Keith |
| | President |
Date: January 29, 2020
| | |
| By: | | /s/ Joseph J. Mantineo |
| | Joseph J. Mantineo |
| | Treasurer and Chief Financial Officer |
Date: January 29, 2020