UNITED STATES
SECURITIES AND EXCHANGE COMMISSION
WASHINGTON, D.C. 20549
FORMN-CSR
CERTIFIED SHAREHOLDER REPORT OF REGISTERED
MANAGEMENT INVESTMENT COMPANIES
Investment Company Act file number:811-01716
AB CAP FUND, INC.
(Exact name of registrant as specified in charter)
1345 Avenue of the Americas,
New York, New York 10105
(Address of principal executive offices) (Zip code)
Joseph J. Mantineo
AllianceBernstein L.P.
1345 Avenue of the Americas
New York, New York 10105
(Name and address of agent for service)
Registrant’s telephone number, including area code: (800)221-5672
Date of fiscal year end: March 31, 2020
Date of reporting period: March 31, 2020
| ITEM 1. | REPORTS TO STOCKHOLDERS. |
MAR 03.31.20

ANNUAL REPORT
AB EMERGING MARKETS
MULTI-ASSET PORTFOLIO

Beginning January 1, 2021, as permitted by new regulations adopted by the Securities and Exchange Commission, the Fund’s annual and semi-annual shareholder reports will no longer be sent by mail, unless you specifically request paper copies of the reports. Instead, the reports will be made available on a website, and you will be notified by mail each time a report is posted and provided with a website address to access the report.
If you already elected to receive shareholder reports electronically, you will not be affected by this change and you need not take any action. You may elect to receive shareholder reports and other communications from the Fund electronically at any time by contacting your financial intermediary (such as a broker-dealer or bank) or, if you are a direct investor, by calling the Fund at (800) 221 5672.
You may elect to receive all future reports in paper form free of charge. If you invest through a financial intermediary, you can contact your financial intermediary to request that you continue to receive paper copies of your shareholder reports; if you invest directly with the Fund, you can call the Fund at (800) 221 5672. Your election to receive reports in paper form will apply to all funds held in your account with your financial intermediary or, if you invest directly, to all AB Mutual Funds you hold.
| | |
| |
| Investment Products Offered | | • Are Not FDIC Insured• May Lose Value• Are Not Bank Guaranteed |
Investors should consider the investment objectives, risks, charges and expenses of the Fund carefully before investing. For copies of our prospectus or summary prospectus, which contain this and other information, visit us online at www.abfunds.com or contact your AB representative. Please read the prospectus and/or summary prospectus carefully before investing.
This shareholder report must be preceded or accompanied by the Fund’s prospectus for individuals who are not current shareholders of the Fund.
You may obtain a description of the Fund’s proxy voting policies and procedures, and information regarding how the Fund voted proxies relating to portfolio securities during the most recent12-month period ended June 30, without charge. Simply visit AB’s website at www.abfunds.com, or go to the Securities and Exchange Commission’s (the “Commission”) website at www.sec.gov, or call AB at (800) 227 4618.
The Fund files its complete schedule of portfolio holdings with the Commission for the first and third quarters of each fiscal year as an exhibit to its reports on Form N-PORT. The Fund’s Form N-PORT reports are available on the Commission’s website at www.sec.gov. The Fund’s Forms N-PORT may also be reviewed and copied at the Commission’s Public Reference Room in Washington, DC; information on the operation of the Public Reference Room may be obtained by calling (800) SEC 0330. AB publishes full portfolio holdings for the Fund monthly at www.abfunds.com.
AllianceBernstein Investments, Inc. (ABI) is the distributor of the AB family of mutual funds. ABI is a member of FINRA and is an affiliate of AllianceBernstein L.P., the Adviser of the funds.
The [A/B] logo is a registered service mark of AllianceBernstein and AllianceBernstein® is a registered service mark used by permission of the owner, AllianceBernstein L.P.
| | |
| FROM THE PRESIDENT | |  |
Dear Shareholder,
We are pleased to provide this report for AB Emerging Markets Multi-Asset Portfolio (the “Fund”). Please review the discussion of Fund performance, the market conditions during the reporting period and the Fund’s investment strategy.
As always, AB strives to keep clients ahead of what’s next by:
| + | | Transforming uncommon insights into uncommon knowledge with a global research scope |
| + | | Navigating markets with seasoned investment experience and sophisticated solutions |
| + | | Providing thoughtful investment insights and actionable ideas |
Whether you’re an individual investor or a multi-billion-dollar institution, we put knowledge and experience to work for you.
AB’s global research organization connects and collaborates across platforms and teams to deliver impactful insights and innovative products. Better insights lead to better opportunities—anywhere in the world.
For additional information about AB’s range of products and shareholder resources, please log on to www.abfunds.com.
Thank you for your investment in the AB Mutual Funds.
Sincerely,

Robert M. Keith
President and Chief Executive Officer, AB Mutual Funds
| | |
| |
| abfunds.com | | AB EMERGING MARKETS MULTI-ASSET PORTFOLIO | 1 |
ANNUAL REPORT
May 11, 2020
This report provides management’s discussion of fund performance for AB Emerging Markets Multi-Asset Portfolio for the annual reporting period ended March 31, 2020.
The Fund’s investment objective is to maximize total return. Total return is the sum of capital appreciation and income.
NAV RETURNS AS OF MARCH 31, 2020(unaudited)
| | | | | | | | |
| | |
| | | 6 Months | | | 12 Months | |
| | |
| AB EMERGING MARKETS MULTI-ASSET PORTFOLIO | | | | | | | | |
| | |
| Class A Shares | | | -15.37% | | | | -16.50% | |
| | |
| Class C Shares | | | -15.61% | | | | -17.11% | |
| | |
| Advisor Class Shares1 | | | -15.22% | | | | -16.24% | |
| | |
| Class R Shares1 | | | -15.35% | | | | -16.64% | |
| | |
| Class K Shares1 | | | -15.35% | | | | -16.55% | |
| | |
| Class I Shares1 | | | -15.24% | | | | -16.30% | |
| | |
| Class Z Shares1 | | | -15.22% | | | | -16.25% | |
| | |
| MSCI EM Index (net) | | | -14.55% | | | | -17.69% | |
| 1 | Please note that these share classes are for investors purchasing shares through accounts established under certainfee-based programs sponsored and maintained by certain broker-dealers and financial intermediaries, institutional pension plans and/or investment advisory clients of, and certain other persons associated with, the Adviser and its affiliates or the Fund. |
INVESTMENT RESULTS
The table above shows the Fund’s performance compared to its benchmark, the Morgan Stanley Capital International Emerging Markets (“MSCI EM”) Index (net), for thesix- and12-month periods ended March 31, 2020. The Fund’s benchmark is fully composed of equities, while the Fund invests in both equities and fixed income.
All share classes outperformed the benchmark for the12-month period but underperformed during thesix-month period, before sales charges. For both periods, the Fund’s fixed-income assets contributed while equity assets detracted, relative to theall-equity benchmark. Country selection (a result ofbottom-up security analysis combined with fundamental research) was negative, as an overweight to Greece detracted, while an overweight to China contributed. For the12-month period, equity security selection within the materials and energy sectors contributed, while selection in technology and health care detracted. For thesix-month period, equity security selection within technology and consumer discretionary detracted, while selection in financials and industrials contributed.
| | |
| |
| 2 | AB EMERGING MARKETS MULTI-ASSET PORTFOLIO | | abfunds.com |
The Fund utilized derivatives for hedging and investment purposes in the form of futures and purchased options, which detracted from absolute performance for both periods, while currency forwards, interest rate swaps and total return swaps contributed for both periods; credit default swaps contributed for thesix-month period, but detracted for the12-month period; written options were immaterial for thesix-month period, but contributed for the12-month period; variance swaps, which were utilized for hedging purposes, detracted for both periods.
MARKET REVIEW AND INVESTMENT STRATEGY
US, international and emerging-market stocks recorded negative returns during the12-month period ended March 31, 2020. The double-digit gains that equity markets posted throughout much of the year were wiped out as the novel coronavirus evolved into a worldwide pandemic. Emerging-market equities fell the most as countries more closely tied to commodities faced outsized pressure. In an effort to slow the rate of infection, many countries shut down all but the most essential activities, and investors struggled to assess the scale and duration of the resulting economic damage. Earlier in the period, equity markets experienced volatility amid the continuedUS-China trade dispute. The overall outlook for investors was balanced by supportive monetary policy from the US Federal Reserve (the “Fed”) and global central banks, as well as by improving economic data. The much-anticipatedphase-oneUS-China trade accord, strong 4Q:19 corporate earnings and the belief that the fallout from the coronavirus would be short-lived sparked a rally that sent global markets toall-time highs inmid-February. Early efforts to contain the virus proved ineffective, and manufacturing production and worldwide supply chains suffered. During March, growing fear around liquidity and the availability of credit caused an unusually swift and deep fall in global equity markets. Central banks and governments stepped in, culminating in an unprecedented $2 trillion economic stimulus package in the US. In the last week of the quarter, markets rallied in response. Growth stocks continued to outperform value stocks over the entire period, andlarge-cap stocks outperformed theirsmall-cap peers.
Global fixed-income market returns were mixed over the12-month period. In July, the Fed began a series of three25-basis-point (b.p.) insurance rate cuts due to slowing global growth concerns. The European Central Bank followed suit in September by lowering interest rates 10 b.p., primarily due to falling exports to China. Central bankers in numerous other developed and emerging markets also lowered interest rates. The UK’s exit from the European Union and aUS-China trade truce in January led markets higher until investor sentiment turned decidedly negative due to the spread ofCOVID-19. Investor fear led to an unprecedented flight to quality as credit spreads on risk assets quickly widened to levels not seen since the 2008–2009 global financial crisis. The market rout was met by monetary and fiscal policy action that was swift, large in scope and broad. The Fed
| | |
| |
| abfunds.com | | AB EMERGING MARKETS MULTI-ASSET PORTFOLIO | 3 |
lowered interest rates 150 b.p. to zero, and most other major central banks followed suit with substantial rate cuts. Developed-market treasury returns were positive and the best performers in the sudden March midmonth exodus away from risk assets. Investment-grade corporate bonds also posted positive results. High-yield bonds had negative returns for the period, primarily during the Marchsell-off. Emerging-market returns fell as sharply lower oil prices impacted emerging-market commodity exporters. The US dollar advanced against most developed- and emerging-market currencies except the Swiss franc and the yen, which are also considered safe haven currencies in periods of market stress.
The Fund’s Senior Investment Management Team (the “Team”) seeks to maximize total return by dynamically adjusting exposure to emerging markets by investing across asset classes. The Team’s emerging-market strategy searches for long-term growth with lower volatility. In seeking to reduce risk and provide downside protection, the Team pursues active stocks and flexible bond allocations. The Team utilizes a disciplined investment process, which draws on a rigorous quantitative research toolset with fundamental expertise across all regions and markets.
INVESTMENT POLICIES
The Fund invests at least 80% of its net assets under normal circumstances in securities of emerging-market issuers and/or the currencies of emerging-market countries. Examples of emerging-market countries include Argentina, Brazil, Chile, Croatia, Egypt, Hong Kong, India, Indonesia, Israel, Kazakhstan, Malaysia, Mexico, the People’s Republic of China, Peru, the Philippines, Poland, Russia, South Africa, South Korea, Taiwan, Thailand, Turkey and Venezuela. The Fund may invest up to 20% of its net assets in the securities of developed-market issuers.
The Fund invests in equity securities, debt securities and currencies, and does not attempt to maintain a constant or relatively constant allocation among these asset classes. Rather, allocations among asset classes are adjusted based on the Adviser’s view of the relative attractiveness of the asset classes. These allocations are informed by the Adviser’s proprietary asset allocation tools, which are comprised of a series of volatility, correlation and expected return forecasts. The Adviser reviews potential Fund investments in each asset class holistically from a country, currency, sector and security standpoint to optimize overall portfolio construction. Under normal circumstances, the Fund will invest between 30% and 95% of its net assets in equity securities, and between 0% and 65% of its net assets in debt securities, with any remainder held in cash (including foreign currency). The Fund is not constrained based on the country, region, market
(continued on next page)
| | |
| |
| 4 | AB EMERGING MARKETS MULTI-ASSET PORTFOLIO | | abfunds.com |
capitalization, credit quality or duration of its investments and its assets may at times be concentrated in a particular country or region.
The process for selecting equity securities for the Fund is primarilybottom-up. The Adviser seeks to identify stocks that are attractive based on valuation, profitability, earnings quality, business trends, price momentum and other measures. The process for selecting debt securities for the Fund is moretop-down. The Adviser believes that inefficiencies in the global debt markets arise from investor emotion, market complexity and conflicting investment agendas. The Adviser combines quantitative forecasts with fundamental credit and economic research in seeking to exploit these inefficiencies. The Adviser seeks to generate returns from the Fund’s fixed-income investments through a combination of country selection, currency allocation, sector analysis and security selection. Debt securities may include those of both corporate and governmental issuers, and may include below investment-grade debt securities (“junk bonds”). The Fund may invest in debt securities with a range of maturities from short- to long-term.
The Adviser considers both quantitative and fundamental factors in adjusting the Fund’s currency exposures. In addition to the Fund’s currency exposure that results from its investments in equity and debt securities denominated in foreign currencies (and any related hedging), the Fund may hold foreign currency (or related derivatives) independently of any such investments, and may hold a currency even if the Fund does not hold any securities denominated in that currency.
The Fund expects to utilize derivatives, such as futures contracts, forwards and swaps, and invest in exchange-traded funds (“ETFs”) to a significant extent. Derivatives and ETFs may provide more efficient and economical exposure to market segments than direct investments, and may also be a quicker and more efficient way to alter the Fund’s exposure than buying and selling direct investments. In determining when and to what extent to enter into derivatives transactions or to invest in ETFs, the Adviser will consider factors such as the relative risks and returns expected of potential investments and the cost of such transactions. Derivatives may also be used for hedging purposes, including to hedge against interest-rate, credit and currency fluctuations. The Adviser also expects to use derivatives frequently to effectively leverage the Fund by creating aggregate exposure somewhat in excess of the Fund’s net assets. The notional value of derivatives and ETFs linked to emerging-market securities or currencies are counted towards meeting the percentage minimums and ranges set forth above, including the requirement that the Fund invest at least 80% of its net assets in the securities of emerging-market issuers and/or the currencies of emerging-market countries.
| | |
| |
| abfunds.com | | AB EMERGING MARKETS MULTI-ASSET PORTFOLIO | 5 |
DISCLOSURES AND RISKS
Benchmark Disclosure
The MSCI EM Index is unmanaged and does not reflect fees and expenses associated with the active management of a mutual fund portfolio. The MSCI EM Index (net, free float-adjusted, market capitalization weighted) represents the equity market performance of emerging markets. MSCI makes no express or implied warranties or representations, and shall have no liability whatsoever with respect to any MSCI data contained herein. The MSCI data may not be further redistributed or used as a basis for other indices, any securities or financial products. This report is not approved, reviewed or produced by MSCI. Net returns include the reinvestment of dividends after deduction ofnon-US withholding tax. An investor cannot invest directly in an index or average, and their results are not indicative of the performance for any specific investment, including the Fund.
A Word About Risk
Emerging-Market Risk:Investments in emerging-market countries may involve more risk than investments in other foreign countries because the markets in emerging-market countries are less developed and less liquid, and because these investments may be subject to increased economic, political, regulatory or other uncertainties.
Market Risk:The market value of a security may move up or down, sometimes rapidly and unpredictably. These fluctuations may cause a security to be worth less than the price originally paid for it, or less than it was worth at an earlier time. Market risk may affect a single issuer, industry, sector of the economy or the market as a whole. Global economies and financial markets are increasingly interconnected, which increases the probabilities that conditions in one country or region might adversely impact issuers in a different country or region. Conditions affecting the general economy, including political, social, or economic instability at the local, regional, or global level may also affect the market value of a security. Health crises, such as pandemic and epidemic diseases, as well as other incidents that interrupt the expected course of events, such as natural disasters, war or civil disturbance, acts of terrorism, power outages and other unforeseeable and external events, and the public response to or fear of such diseases or events, have and may in the future have an adverse effect on the Fund’s investments and net asset value and can lead to increased market volatility. For example, any preventative or protective actions that governments may take in respect of such diseases or events may result in periods of business disruption, inability to obtain raw materials, supplies and component parts, and reduced or disrupted operations for the Fund’s portfolio companies. The occurrence and pendency of such diseases or events could adversely affect the economies and financial markets either in specific countries or worldwide.
| | |
| |
| 6 | AB EMERGING MARKETS MULTI-ASSET PORTFOLIO | | abfunds.com |
DISCLOSURES AND RISKS(continued)
Foreign(Non-US) Risk:Investments in securities ofnon-US issuers may involve more risk than those of US issuers. These securities may fluctuate more widely in price and may be more difficult to trade or dispose of due to adverse market, economic, political, regulatory or other factors.
Currency Risk:Fluctuations in currency exchange rates may negatively affect the value of the Fund’s investments or reduce its returns. Emerging-market currencies may be more volatile and less liquid, and subject to significantly greater risk of currency controls and convertibility restrictions, than currencies of developed countries.
Country Concentration Risk: The Fund may not always be diversified among countries or geographic regions and the effect on the Fund’s net asset value (“NAV”) of the specific risks identified above, such as political, regulatory and currency risks, may be magnified due to concentration of the Fund’s investments in a particular country or region.
Allocation Risk:The allocation of Fund assets among different asset classes, such as equity securities, debt securities and currencies, may have a significant effect on the Fund’s NAV when one of these asset classes is performing better or worse than others. The diversification benefits typically associated with investing in both equity and debt securities may be limited in the emerging-markets context, as movements in emerging-market equity and emerging-market debt markets may be more correlated than movements in the equity and debt markets of developed countries.
Capitalization Risk:Investments in small- andmid-capitalization companies may be more volatile than investments in large-capitalization companies. Investments in small-capitalization companies may have additional risks because these companies have limited product lines, markets or financial resources.
Interest-Rate Risk:Changes in interest rates will affect the value of investments in fixed-income securities. When interest rates rise, the value of existing investments in fixed-income securities tends to fall and this decrease in value may not be offset by higher income from new investments. Interest-rate risk is generally greater for fixed-income securities with longer maturities or durations.
Credit Risk:An issuer or guarantor of a fixed-income security, or the counterparty to a derivatives or other contract, may be unable or unwilling to make timely payments of interest or principal, or to otherwise honor its obligations. The issuer or guarantor may default, causing a loss of the full principal amount of a security and accrued interest. The degree of risk for a particular security may be reflected in its credit rating. There is the
| | |
| |
| abfunds.com | | AB EMERGING MARKETS MULTI-ASSET PORTFOLIO | 7 |
DISCLOSURES AND RISKS(continued)
possibility that the credit rating of a fixed-income security may be downgraded after purchase, which may adversely affect the value of the security.
Below Investment-Grade Securities Risk:Investments in fixed-income securities with lower ratings (commonly known as “junk bonds”) tend to have a higher probability that an issuer will default or fail to meet its payment obligations. These securities may be subject to greater price volatility due to factors such as specific corporate developments, interest-rate sensitivity and negative perceptions of the junk bond market generally, and may be more difficult to trade or dispose of than other types of securities.
Derivatives Risk:Derivatives may be difficult to price or unwind and leveraged so that small changes may produce disproportionate losses for the Fund. Derivatives may also be subject to counterparty risk to a greater degree than more traditional investments.
Leverage Risk:To the extent the Fund uses leveraging techniques, its NAV may be more volatile because leverage tends to exaggerate the effect of changes in interest rates and any increase or decrease in the value of the Fund’s investments.
Illiquid Investments Risk:Illiquid investments risk exists when certain investments are or become difficult to purchase or sell. Difficulty in selling such investments may result in sales at disadvantageous prices affecting the value of your investment in the Fund. Causes of illiquid investments risk may include low trading volumes, large positions and heavy redemptions of Fund shares. Illiquid investments risk may be higher in a rising interest-rate environment, when the value and liquidity of fixed-income securities generally decline.
Active Trading Risk: The Fund expects to engage in active and frequent trading of its portfolio securities and its portfolio turnover rate may greatly exceed 100%. A higher rate of portfolio turnover increases transaction costs, which may negatively affect the Fund’s return. In addition, a high rate of portfolio turnover may result in substantial short-term gains, which may have adverse tax consequences for Fund shareholders.
Management Risk:The Fund is subject to management risk because it is an actively managed investment fund. The Adviser will apply its investment techniques and risk analyses in making investment decisions, but there is no guarantee that its techniques will produce the intended results.
These risks are fully discussed in the Fund’s prospectus. As with all investments, you may lose money by investing in the Fund.
| | |
| |
| 8 | AB EMERGING MARKETS MULTI-ASSET PORTFOLIO | | abfunds.com |
DISCLOSURES AND RISKS(continued)
An Important Note About Historical Performance
The investment return and principal value of an investment in the Fund will fluctuate, so that shares, when redeemed, may be worth more or less than their original cost. Performance shown in this report represents past performance and does not guarantee future results. Current performance may be lower or higher than the performance information shown. You may obtain performance information current to the most recentmonth-end by visiting www.abfunds.com.
All fees and expenses related to the operation of the Fund have been deducted. NAV returns do not reflect sales charges; if sales charges were reflected, the Fund’s quoted performance would be lower. SEC returns reflect the applicable sales charges for each share class: a 4.25% maximumfront-end sales charge for Class A shares and a 1%1-year contingent deferred sales charge for Class C shares. Returns for the different share classes will vary due to different expenses associated with each class. Performance assumes reinvestment of distributions and does not account for taxes.
| | |
| |
| abfunds.com | | AB EMERGING MARKETS MULTI-ASSET PORTFOLIO | 9 |
HISTORICAL PERFORMANCE
GROWTH OF A $10,000 INVESTMENT IN THE FUND(unaudited)
8/31/20111 TO 3/31/2020
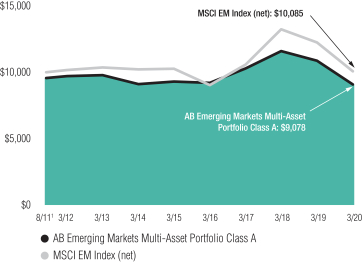
This chart illustrates the total value of an assumed $10,000 investment in AB Emerging Markets Multi-Asset Portfolio Class A shares (from 8/31/20111 to 3/31/2020) as compared to the performance of its benchmark. The chart reflects the deduction of the maximum 4.25% sales charge from the initial $10,000 investment in the Fund and assumes the reinvestment of dividends and capital gains distributions.
| 1 | Inception date: 8/31/2011. |
| | |
| |
| 10 | AB EMERGING MARKETS MULTI-ASSET PORTFOLIO | | abfunds.com |
HISTORICAL PERFORMANCE(continued)
AVERAGE ANNUAL RETURNS AS OF MARCH 31, 2020(unaudited)
| | | | | | | | |
| | |
| | | NAV
Returns | | | SEC Returns (reflects applicable
sales charges) | |
| | |
| CLASS A SHARES | | | | | | | | |
| | |
| 1 Year | | | -16.50% | | | | -20.01% | |
| | |
| 5 Years | | | -0.46% | | | | -1.32% | |
| | |
| Since Inception1 | | | -0.62% | | | | -1.12% | |
| | |
| CLASS C SHARES | | | | | | | | |
| | |
| 1 Year | | | -17.11% | | | | -17.91% | |
| | |
| 5 Years | | | -1.18% | | | | -1.18% | |
| | |
| Since Inception1 | | | -1.34% | | | | -1.34% | |
| | |
| ADVISOR CLASS SHARES2 | | | | | | | | |
| | |
| 1 Year | | | -16.24% | | | | -16.24% | |
| | |
| 5 Years | | | -0.19% | | | | -0.19% | |
| | |
| Since Inception1 | | | -0.35% | | | | -0.35% | |
| | |
| CLASS R SHARES2 | | | | | | | | |
| | |
| 1 Year | | | -16.64% | | | | -16.64% | |
| | |
| 5 Years | | | -0.69% | | | | -0.69% | |
| | |
| Since Inception1 | | | -0.84% | | | | -0.84% | |
| | |
| CLASS K SHARES2 | | | | | | | | |
| | |
| 1 Year | | | -16.55% | | | | -16.55% | |
| | |
| 5 Years | | | -0.46% | | | | -0.46% | |
| | |
| Since Inception1 | | | -0.61% | | | | -0.61% | |
| | |
| CLASS I SHARES2 | | | | | | | | |
| | |
| 1 Year | | | -16.30% | | | | -16.30% | |
| | |
| 5 Years | | | -0.21% | | | | -0.21% | |
| | |
| Since Inception1 | | | -0.36% | | | | -0.36% | |
| | |
| CLASS Z SHARES2 | | | | | | | | |
| | |
| 1 Year | | | -16.25% | | | | -16.25% | |
| | |
| Since Inception1 | | | -6.97% | | | | -6.97% | |
The Fund’s prospectus fee table shows the Fund’s total annual operating expense ratios as 1.81%, 2.59%, 1.59%, 2.24%, 1.97%, 1.47% and 1.61% for Class A, Class C, Advisor Class, Class R, Class K, Class I and Class Z shares, respectively, gross of any fee waivers or expense reimbursements. Contractual fee waivers and/or expense reimbursements limit the Fund’s annual operating expense ratios exclusive of expenses associated with acquired fund fees and expenses other than the advisory fees of any AB mutual funds in which the Fund may invest, interest expense and extraordinary expenses to 1.24%, 1.99%, 0.99%, 1.49%, 1.24%, 0.99% and 0.99% for Class A, Class C, Advisor Class, Class R, Class K, Class I and Class Z shares, respectively. These waivers/reimbursements may not be terminated before July 31, 2020. Absent reimbursements or waivers, performance would have been lower. The Financial Highlights section of this report sets forth expense ratio data for the current reporting period; the expense ratios shown above may differ from the expense ratios in the Financial Highlights section since they are based on different time periods.
(footnotes continued on next page)
| | |
| |
| abfunds.com | | AB EMERGING MARKETS MULTI-ASSET PORTFOLIO | 11 |
HISTORICAL PERFORMANCE(continued)
| 1 | Inception dates: 8/31/2011 for all share classes except Class Z; 7/31/2017 for Class Z shares. |
| 2 | These share classes are offered at NAV to eligible investors and their SEC returns are the same as their NAV returns. Please note that these share classes are for investors purchasing shares through accounts established under certain fee-based programs sponsored and maintained by certain broker-dealers and financial intermediaries, institutional pension plans and/or investment advisory clients of, and certain other persons associated with, the Adviser and its affiliates or the Fund. |
| | |
| |
| 12 | AB EMERGING MARKETS MULTI-ASSET PORTFOLIO | | abfunds.com |
HISTORICAL PERFORMANCE(continued)
SEC AVERAGE ANNUAL RETURNS
AS OF THE MOST RECENT CALENDAR QUARTER-END
MARCH 31, 2020(unaudited)
| | | | |
| |
| | | SEC Returns (reflects applicable
sales charges) | |
| |
| CLASS A SHARES | | | | |
| |
| 1 Year | | | -20.01% | |
| |
| 5 Years | | | -1.32% | |
| |
| Since Inception1 | | | -1.12% | |
| |
| CLASS C SHARES | | | | |
| |
| 1 Year | | | -17.91% | |
| |
| 5 Years | | | -1.18% | |
| |
| Since Inception1 | | | -1.34% | |
| |
| ADVISOR CLASS SHARES2 | | | | |
| |
| 1 Year | | | -16.24% | |
| |
| 5 Years | | | -0.19% | |
| |
| Since Inception1 | | | -0.35% | |
| |
| CLASS R SHARES2 | | | | |
| |
| 1 Year | | | -16.64% | |
| |
| 5 Years | | | -0.69% | |
| |
| Since Inception1 | | | -0.84% | |
| |
| CLASS K SHARES2 | | | | |
| |
| 1 Year | | | -16.55% | |
| |
| 5 Years | | | -0.46% | |
| |
| Since Inception1 | | | -0.61% | |
| |
| CLASS I SHARES2 | | | | |
| |
| 1 Year | | | -16.30% | |
| |
| 5 Years | | | -0.21% | |
| |
| Since Inception1 | | | -0.36% | |
| |
| CLASS Z SHARES2 | | | | |
| |
| 1 Year | | | -16.25% | |
| |
| Since Inception1 | | | -6.97% | |
| 1 | Inception dates: 8/31/2011 for all share classes except Class Z; 7/31/2017 for Class Z shares. |
| 2 | Please note that these share classes are for investors purchasing shares through accounts established under certain fee-based programs sponsored and maintained by certain broker-dealers and financial intermediaries, institutional pension plans and/or investment advisory clients of, and certain other persons associated with, the Adviser and its affiliates or the Fund. |
| | |
| |
| abfunds.com | | AB EMERGING MARKETS MULTI-ASSET PORTFOLIO | 13 |
EXPENSE EXAMPLE
(unaudited)
As a shareholder of the Fund, you incur two types of costs: (1) transaction costs, including sales charges (loads) on purchase payments, contingent deferred sales charges on redemptions and (2) ongoing costs, including management fees; distribution(12b-1) fees; and other Fund expenses. This example is intended to help you understand your ongoing costs (in dollars) of investing in the Fund and to compare these costs with the ongoing costs of investing in other mutual funds.
The Example is based on an investment of $1,000 invested at the beginning of the period and held for the entire period as indicated below.
Actual Expenses
The table below provides information about actual account values and actual expenses. You may use the information, together with the amount you invested, to estimate the expenses that you paid over the period. Simply divide your account value by $1,000 (for example, an $8,600 account value divided by $1,000 = 8.6), then multiply the result by the number under the heading entitled “Expenses Paid During Period” to estimate the expenses you paid on your account during this period.
Hypothetical Example for Comparison Purposes
The table below also provides information about hypothetical account values and hypothetical expenses based on the Fund’s actual expense ratio and an assumed annual rate of return of 5% before expenses, which is not the Fund’s actual return. The hypothetical account values and expenses may not be used to estimate the actual ending account balance or expenses you paid for the period. You may use this information to compare the ongoing costs of investing in the Fund and other funds by comparing this 5% hypothetical example with the 5% hypothetical examples that appear in the shareholder reports of other funds.
Please note that the expenses shown in the table are meant to highlight your ongoing costs only and do not reflect any transactional costs, such as sales charges (loads), or contingent deferred sales charges on redemptions. Therefore, the hypothetical example is useful in comparing ongoing costs only, and will not help you determine the relative total costs of owning different funds. In addition, if these transactional costs were included, your costs would have been higher.
| | |
| |
| 14 | AB EMERGING MARKETS MULTI-ASSET PORTFOLIO | | abfunds.com |
EXPENSE EXAMPLE(continued)
| | | | | | | | | | | | | | | | | | | | | | | | |
| | | Beginning
Account
Value
10/1/2019 | | | Ending
Account
Value
3/31/2020 | | | Expenses
Paid
During
Period* | | | Annualized
Expense
Ratio* | | | Total
Expenses
Paid
During
Period+ | | | Total
Annualized
Expense
Ratio+ | |
| Class A | | | | | | | | | | | | | | | | | | | | | | | | |
Actual | | $ | 1,000 | | | $ | 846.30 | | | $ | 5.72 | | | | 1.24 | % | | $ | 5.77 | | | | 1.25 | % |
Hypothetical** | | $ | 1,000 | | | $ | 1,018.80 | | | $ | 6.26 | | | | 1.24 | % | | $ | 6.31 | | | | 1.25 | % |
| Class C | | | | | | | | | | | | | | | | | | | | | | | | |
Actual | | $ | 1,000 | | | $ | 843.90 | | | $ | 9.17 | | | | 1.99 | % | | $ | 9.22 | | | | 2.00 | % |
Hypothetical** | | $ | 1,000 | | | $ | 1,015.05 | | | $ | 10.02 | | | | 1.99 | % | | $ | 10.08 | | | | 2.00 | % |
| Advisor Class | | | | | | | | | | | | | | | | | | | | | | | | |
Actual | | $ | 1,000 | | | $ | 847.80 | | | $ | 4.57 | | | | 0.99 | % | | $ | 4.62 | | | | 1.00 | % |
Hypothetical** | | $ | 1,000 | | | $ | 1,020.05 | | | $ | 5.00 | | | | 0.99 | % | | $ | 5.05 | | | | 1.00 | % |
| Class R | | | | | | | | | | | | | | | | | | | | | | | | |
Actual | | $ | 1,000 | | | $ | 846.50 | | | $ | 6.88 | | | | 1.49 | % | | $ | 6.92 | | | | 1.50 | % |
Hypothetical** | | $ | 1,000 | | | $ | 1,017.55 | | | $ | 7.52 | | | | 1.49 | % | | $ | 7.57 | | | | 1.50 | % |
| Class K | | | | | | | | | | | | | | | | | | | | | | | | |
Actual | | $ | 1,000 | | | $ | 846.50 | | | $ | 5.72 | | | | 1.24 | % | | $ | 5.77 | | | | 1.25 | % |
Hypothetical** | | $ | 1,000 | | | $ | 1,018.80 | | | $ | 6.26 | | | | 1.24 | % | | $ | 6.31 | | | | 1.25 | % |
| Class I | | | | | | | | | | | | | | | | | | | | | | | | |
Actual | | $ | 1,000 | | | $ | 847.60 | | | $ | 4.57 | | | | 0.99 | % | | $ | 4.57 | | | | 0.99 | % |
Hypothetical** | | $ | 1,000 | | | $ | 1,020.05 | | | $ | 5.00 | | | | 0.99 | % | | $ | 5.00 | | | | 0.99 | % |
| Class Z | | | | | | | | | | | | | | | | | | | | | | | | |
Actual | | $ | 1,000 | | | $ | 847.80 | | | $ | 4.57 | | | | 0.99 | % | | $ | 4.62 | | | | 1.00 | % |
Hypothetical** | | $ | 1,000 | | | $ | 1,020.05 | | | $ | 5.00 | | | | 0.99 | % | | $ | 5.05 | | | | 1.00 | % |
| * | Expenses are equal to the classes’ annualized expense ratios multiplied by the average account value over the period, multiplied by 183/366 (to reflect the one-half year period). |
| + | In connection with the Fund’s investments in affiliated/unaffiliated underlying portfolios, the Fund incurs no direct expenses, but bears proportionate shares of the fees and expenses (i.e., operating, administrative and investment advisory fees) of the affiliated/unaffiliated underlying portfolios. The Adviser has contractually agreed to waive its fees from the Fund in an amount equal to the Fund’s pro rata share of certain acquired fund fees and expenses of the affiliated underlying portfolios. The Fund’s total expenses are equal to the classes’ annualized expense ratio plus the Fund’s pro rata share of the weighted average expense ratio of the affiliated/unaffiliated underlying portfolios in which it invests, multiplied by the average account value over the period, multiplied by 183/366 (to reflect the one-half year period). |
| ** | Assumes 5% annual return before expenses. |
| | |
| |
| abfunds.com | | AB EMERGING MARKETS MULTI-ASSET PORTFOLIO | 15 |
PORTFOLIO SUMMARY
March 31, 2020(unaudited)
PORTFOLIO STATISTICS
Net Assets ($mil): $127.0
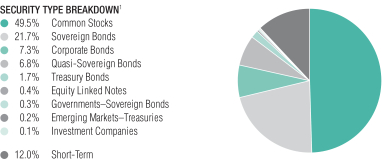
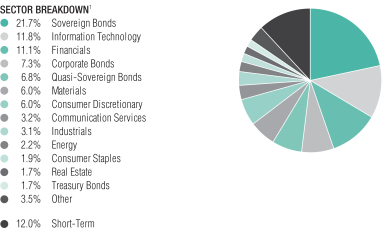
| 1 | All data are as of March 31, 2020. The Fund’s security type and sector breakdowns are expressed as a percentage of total investments (excluding security lending collateral) and may vary over time. The Fund also enters into derivative transactions, which may be used for hedging or investment purposes (see “Portfolio of Investments” section of the report for additional details). “Other” sector weightings represent 1.3% or less in the following sectors: Emerging Markets–Treasuries, Equity Linked Notes, Funds and Investment Trusts, Governments–Sovereign Bonds, Health Care, Regional Bonds and Utilities. |
| | |
| |
| 16 | AB EMERGING MARKETS MULTI-ASSET PORTFOLIO | | abfunds.com |
PORTFOLIO SUMMARY(continued)
March 31, 2020(unaudited)
TEN LARGEST HOLDINGS2
| | | | | | | | |
| | |
| Company | | U.S. $ Value | | | Percent of
Net Assets | |
| | |
| Samsung Electronics Co., Ltd. | | $ | 4,575,275 | | | | 3.5 | % |
| | |
| Alibaba Group Holding Ltd. | | | 3,322,885 | | | | 2.6 | |
| | |
| Ukraine Government International Bond | | | 2,364,973 | | | | 1.9 | |
| | |
| Taiwan Semiconductor Manufacturing Co., Ltd. | | | 2,349,605 | | | | 1.9 | |
| | |
| Dominican Republic International Bond | | | 2,222,747 | | | | 1.8 | |
| | |
| Perusahaan Listrik Negara PT | | | 2,099,344 | | | | 1.7 | |
| | |
| Tencent Holdings Ltd. | | | 1,878,250 | | | | 1.4 | |
| | |
| Panama Government International Bond | | | 1,784,596 | | | | 1.4 | |
| | |
| Petroleos Mexicanos | | | 1,657,100 | | | | 1.3 | |
| | |
| Anhui Conch Cement Co., Ltd. | | | 1,617,722 | | | | 1.3 | |
| | |
| | $ | 23,872,497 | | | | 18.8 | % |
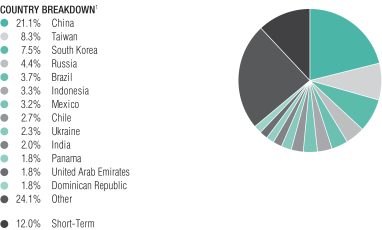
| 1 | All data are as of March 31, 2020. The Fund’s country breakdown is expressed as a percentage of total investments (excluding security lending collateral) and may vary over time. The Fund also enters into derivative transactions, which may be used for hedging or investment purposes (see “Portfolio of Investments” section of the report for additional details). “Other” country weightings represent 1.4% or less in the following: Angola, Argentina, Azerbaijan, Bahrain, Bermuda, Canada, Colombia, Costa Rica, Czech Republic, Ecuador, Egypt, El Salvador, Gabon, Georgia, Ghana, Greece, Guatemala, Honduras, Hong Kong, Hungary, Iraq, Israel, Ivory Coast, Jamaica, Japan, Kazakhstan, Kenya, Lebanon, Malaysia, Mongolia, Nigeria, Oman, Pakistan, Paraguay, Peru, Philippines, Poland, Portugal, Qatar, Saudi Arabia, Senegal, South Africa, Sri Lanka, Thailand, Trinidad & Tobago, Turkey, United Kingdom, Uruguay, Venezuela, Vietnam and Zambia. |
| | |
| |
| abfunds.com | | AB EMERGING MARKETS MULTI-ASSET PORTFOLIO | 17 |
PORTFOLIO OF INVESTMENTS
March 31, 2020
| | | | | | | | | | | | |
| Company | | | | |
Shares | | | U.S. $ Value | |
| |
COMMON STOCKS – 49.3% | | | | | | | | | | | | |
Information Technology – 11.7% | | | | | | | | | | | | |
Communications Equipment – 0.0% | | | | | | | | | | | | |
Yealink Network Technology Corp. Ltd. – Class A | | | | | | | 600 | | | $ | 6,806 | |
| | | | | | | | | | | | |
| | | |
Electronic Equipment, Instruments & Components – 2.1% | | | | | | | | | | | | |
AU Optronics Corp. | | | | | | | 252,000 | | | | 52,518 | |
Hon Hai Precision Industry Co., Ltd. | | | | | | | 387,000 | | | | 890,977 | |
Kingboard Laminates Holdings Ltd. | | | | | | | 15,500 | | | | 14,183 | |
Shennan Circuits Co., Ltd. – Class A | | | | | | | 20,000 | | | | 547,166 | |
Simplo Technology Co., Ltd. | | | | | | | 15,000 | | | | 130,557 | |
Tripod Technology Corp. | | | | | | | 133,000 | | | | 413,729 | |
Walsin Technology Corp. | | | | | | | 36,000 | | | | 190,194 | |
WPG Holdings Ltd. | | | | | | | 48,000 | | | | 56,187 | |
Yageo Corp. | | | | | | | 12,000 | | | | 107,764 | |
Zhen Ding Technology Holding Ltd. | | | | | | | 92,000 | | | | 281,160 | |
| | | | | | | | | | | | |
| | | | | | | | | | | 2,684,435 | |
| | | | | | | | | | | | |
IT Services – 0.6% | | | | | | | | | | | | |
GDS Holdings Ltd. (ADR)(a) | | | | | | | 12,200 | | | | 707,234 | |
HCL Technologies Ltd. | | | | | | | 7,844 | | | | 44,894 | |
| | | | | | | | | | | | |
| | | | | | | | | | | 752,128 | |
| | | | | | | | | | | | |
Semiconductors & Semiconductor Equipment – 4.6% | | | | | | | | | | | | |
Globalwafers Co., Ltd. | | | | | | | 20,000 | | | | 223,407 | |
MediaTek, Inc. | | | | | | | 53,000 | | | | 568,861 | |
Nanya Technology Corp. | | | | | | | 323,000 | | | | 568,475 | |
Novatek Microelectronics Corp. | | | | | | | 124,000 | | | | 699,137 | |
Phison Electronics Corp. | | | | | | | 7,000 | | | | 56,602 | |
Powertech Technology, Inc. | | | | | | | 23,000 | | | | 65,136 | |
Silergy Corp. | | | | | | | 4,000 | | | | 129,743 | |
SK Hynix, Inc. | | | | | | | 16,900 | | | | 1,142,509 | |
Taiwan Semiconductor Manufacturing Co., Ltd. | | | | | | | 261,000 | | | | 2,349,605 | |
United Microelectronics Corp. | | | | | | | 151,000 | | | | 67,703 | |
Xinyi Solar Holdings Ltd. | | | | | | | 18,000 | | | | 9,986 | |
| | | | | | | | | | | | |
| | | | | | | | | | | 5,881,164 | |
| | | | | | | | | | | | |
Technology Hardware, Storage & Peripherals – 4.4% | | | | | | | | | | | | |
Asustek Computer, Inc. | | | | | | | 63,000 | | | | 426,567 | |
Lenovo Group Ltd. | | | | | | | 122,000 | | | | 64,629 | |
Pegatron Corp. | | | | | | | 35,000 | | | | 66,789 | |
Quanta Computer, Inc. | | | | | | | 35,000 | | | | 69,305 | |
Samsung Electronics Co., Ltd. | | | | | | | 77,607 | | | | 3,017,478 | |
Samsung Electronics Co., Ltd. (Preference Shares) | | | | | | | 47,803 | | | | 1,557,787 | |
| | |
| |
| 18 | AB EMERGING MARKETS MULTI-ASSET PORTFOLIO | | abfunds.com |
PORTFOLIO OF INVESTMENTS(continued)
| | | | | | | | | | | | |
| Company | | | | |
Shares | | | U.S. $ Value | |
| |
Wistron Corp. | | | | | | | 412,000 | | | $ | 333,074 | |
| | | | | | | | | | | | |
| | | | | | | | | | | 5,535,629 | |
| | | | | | | | | | | | |
| | | | | | | | | | | 14,860,162 | |
| | | | | | | | | | | | |
Financials – 11.1% | | | | | | | | | | | | |
Banks – 7.9% | | | | | | | | | | | | |
Abu Dhabi Islamic Bank PJSC | | | | | | | 27,648 | | | | 29,657 | |
Agricultural Bank of China Ltd. – Class H | | | | | | | 1,404,000 | | | | 560,568 | |
AU Small Finance Bank Ltd.(b) | | | | | | | 5,265 | | | | 35,983 | |
Banco Santander Chile | | | | | | | 1,047,973 | | | | 39,132 | |
Banco Santander Mexico SA Institucion de Banca Multiple Grupo Financiero Santand | | | | | | | 69,726 | | | | 45,235 | |
Bank of Beijing Co., Ltd. – Class A | | | | | | | 100,900 | | | | 68,426 | |
Bank of China Ltd. – Class A | | | | | | | 125,500 | | | | 61,338 | |
Bank of China Ltd. – Class H | | | | | | | 921,000 | | | | 350,591 | |
Bank of Georgia Group PLC | | | | | | | 1,055 | | | | 11,975 | |
Bank Polska Kasa Opieki SA | | | | | | | 2,718 | | | | 36,428 | |
China CITIC Bank Corp., Ltd. – Class H | | | | | | | 3,286,000 | | | | 1,615,936 | |
China Construction Bank Corp. – Class H | | | | | | | 1,208,000 | | | | 981,919 | |
China Everbright Bank Co., Ltd. – Class H | | | | | | | 88,000 | | | | 33,475 | |
China Minsheng Banking Corp., Ltd. – Class H | | | | | | | 1,145,900 | | | | 847,558 | |
Commercial Bank of Ceylon PLC(c) | | | | | | | 148,463 | | | | 48,246 | |
Commercial Bank PSQC (The) | | | | | | | 67,576 | | | | 71,889 | |
Dubai Islamic Bank PJSC | | | | | | | 56,621 | | | | 55,299 | |
Halyk Savings Bank of Kazakhstan JSC (GDR)(b) | | | | | | | 24,630 | | | | 226,596 | |
Hana Financial Group, Inc. | | | | | | | 57,417 | | | | 1,080,222 | |
HDFC Bank Ltd. (ADR) | | | | | | | 25,021 | | | | 962,308 | |
Industrial Bank Co., Ltd. – Class A (NthSSE-SEHK) | | | | | | | 41,860 | | | | 93,233 | |
Industrial Bank of Korea | | | | | | | 36,490 | | | | 222,958 | |
KB Financial Group, Inc. | | | | | | | 17,270 | | | | 485,702 | |
Malayan Banking Bhd | | | | | | | 38,200 | | | | 65,906 | |
Masraf Al Rayan QSC | | | | | | | 70,498 | | | | 70,694 | |
MCB Bank Ltd. | | | | | | | 19,766 | | | | 17,620 | |
Mega Financial Holding Co., Ltd. | | | | | | | 58,000 | | | | 54,462 | |
Moneta Money Bank AS(b) | | | | | | | 113,419 | | | | 233,593 | |
Postal Savings Bank of China Co., Ltd.(b) | | | | | | | 121,000 | | | | 73,670 | |
Qatar Islamic Bank SAQ | | | | | | | 15,513 | | | | 60,774 | |
Sberbank of Russia PJSC (Sponsored ADR) | | | | | | | 66,039 | | | | 620,767 | |
Shinhan Financial Group Co., Ltd. | | | | | | | 4,634 | | | | 108,409 | |
TCS Group Holding PLC (GDR)(b) | | | | | | | 26,810 | | | | 309,924 | |
Turkiye Is Bankasi AS – Class C(a) | | | | | | | 519,670 | | | | 370,827 | |
Woori Financial Group, Inc. | | | | | | | 14,120 | | | | 87,848 | |
| | | | | | | | | | | | |
| | | | | | | | | | | 10,039,168 | |
| | | | | | | | | | | | |
| | |
| |
| abfunds.com | | AB EMERGING MARKETS MULTI-ASSET PORTFOLIO | 19 |
PORTFOLIO OF INVESTMENTS(continued)
| | | | | | | | | | | | |
| Company | | | | |
Shares | | | U.S. $ Value | |
| |
Capital Markets – 0.9% | | | | | | | | | | | | |
China Everbright Ltd. | | | | | | | 630,000 | | | $ | 923,471 | |
HDFC Asset Management Co., Ltd.(b) | | | | | | | 1,933 | | | | 53,727 | |
Samsung Securities Co., Ltd. | | | | | | | 2,534 | | | | 60,709 | |
Yuanta Financial Holding Co., Ltd. | | | | | | | 125,000 | | | | 63,819 | |
| | | | | | | | | | | | |
| | | | | | | | | | | 1,101,726 | |
| | | | | | | | | | | | |
Consumer Finance – 0.5% | | | | | | | | | | | | |
Manappuram Finance Ltd. | | | | | | | 66,727 | | | | 83,439 | |
Muangthai Capital PCL | | | | | | | 174,000 | | | | 185,572 | |
Muthoot Finance Ltd. | | | | | | | 13,050 | | | | 105,448 | |
Samsung Card Co., Ltd. | | | | | | | 10,471 | | | | 258,029 | |
| | | | | | | | | | | | |
| | | | | | | | | | | 632,488 | |
| | | | | | | | | | | | |
Diversified Financial Services – 0.9% | | | | | | | | | | | | |
Fubon Financial Holding Co., Ltd. | | | | | | | 411,000 | | | | 508,007 | |
Haci Omer Sabanci Holding AS | | | | | | | 287,249 | | | | 323,855 | |
REC Ltd. | | | | | | | 226,928 | | | | 266,987 | |
| | | | | | | | | | | | |
| | | | | | | | | | | 1,098,849 | |
| | | | | | | | | | | | |
Insurance – 0.9% | | | | | | | | | | | | |
BB Seguridade Participacoes SA | | | | | | | 25,200 | | | | 120,517 | |
Liberty Holdings Ltd. | | | | | | | 4,398 | | | | 16,204 | |
Momentum Metropolitan Holdings | | | | | | | 13,370 | | | | 11,654 | |
Old Mutual Ltd. | | | | | | | 29,350 | | | | 19,471 | |
Ping An Insurance Group Co. of China Ltd. – Class H | | | | | | | 59,000 | | | | 576,210 | |
Powszechny Zaklad Ubezpieczen SA | | | | | | | 9,192 | | | | 69,050 | |
Ruentex Industries Ltd.(a) | | | | | | | 174,200 | | | | 399,109 | |
| | | | | | | | | | | | |
| | | | | | | | | | | 1,212,215 | |
| | | | | | | | | | | | |
| | | | | | | | | | | 14,084,446 | |
| | | | | | | | | | | | |
Materials – 6.0% | | | | | | | | | | | | |
Chemicals – 1.2% | | | | | | | | | | | | |
Advanced Petrochemical Co. | | | | | | | 2,194 | | | | 25,834 | |
Asian Paints Ltd. | | | | | | | 2,997 | | | | 65,601 | |
Formosa Chemicals & Fibre Corp. | | | | | | | 150,000 | | | | 330,317 | |
Kumho Petrochemical Co., Ltd. | | | | | | | 3,400 | | | | 179,490 | |
Mesaieed Petrochemical Holding Co. | | | | | | | 39,760 | | | | 15,875 | |
Mitsubishi Gas Chemical Co., Inc. | | | | | | | 10,300 | | | | 111,146 | |
Nan Ya Plastics Corp. | | | | | | | 93,000 | | | | 167,323 | |
Sinopec Shanghai Petrochemical Co., Ltd. –Class H | | | | | | | 246,000 | | | | 60,662 | |
Tosoh Corp. | | | | | | | 52,800 | | | | 596,698 | |
Wanhua Chemical Group Co., Ltd. – Class A | | | | | | | 10,900 | | | | 62,789 | |
| | | | | | | | | | | | |
| | | | | | | | | | | 1,615,735 | |
| | | | | | | | | | | | |
Construction Materials – 3.3% | | | | | | | | | | | | |
Anhui Conch Cement Co., Ltd. – Class A | | | | | | | 157,119 | | | | 1,203,051 | |
Anhui Conch Cement Co., Ltd. – Class H | | | | | | | 60,363 | | | | 414,671 | |
| | |
| |
| 20 | AB EMERGING MARKETS MULTI-ASSET PORTFOLIO | | abfunds.com |
PORTFOLIO OF INVESTMENTS(continued)
| | | | | | | | | | | | |
| Company | | | | |
Shares | | | U.S. $ Value | |
| |
Asia Cement Corp. | | | | | | | 490,000 | | | $ | 636,193 | |
China Resources Cement Holdings Ltd. | | | | | | | 1,210,000 | | | | 1,421,539 | |
Huaxin Cement Co., Ltd. | | | | | | | 54,980 | | | | 177,314 | |
Taiwan Cement Corp. | | | | | | | 236,198 | | | | 306,754 | |
| | | | | | | | | | | | |
| | | | | | | | | | | 4,159,522 | |
| | | | | | | | | | | | |
Metals & Mining – 1.4% | | | | | | | | | | | | |
Anglo American Platinum Ltd. | | | | | | | 1,408 | | | | 58,816 | |
China Zhongwang Holdings Ltd. | | | | | | | 208,000 | | | | 54,328 | |
Eregli Demir ve Celik Fabrikalari TAS | | | | | | | 52,143 | | | | 59,084 | |
Glencore PLC(a) | | | | | | | 205,000 | | | | 310,277 | |
Iskenderun Demir ve Celik AS | | | | | | | 55,454 | | | | 52,398 | |
Jiangxi Copper Co., Ltd. – Class H | | | | | | | 309,000 | | | | 283,545 | |
Kumba Iron Ore Ltd. | | | | | | | 13,442 | | | | 209,598 | |
Maanshan Iron & Steel Co., Ltd. – Class H(d) | | | | | | | 206,000 | | | | 64,105 | |
Polyus PJSC (GDR)(b) | | | | | | | 2,248 | | | | 152,556 | |
POSCO | | | | | | | 1,330 | | | | 175,012 | |
Vedanta Ltd. | | | | | | | 431,974 | | | | 367,395 | |
| | | | | | | | | | | | |
| | | | | | | | | | | 1,787,114 | |
| | | | | | | | | | | | |
Paper & Forest Products – 0.1% | | | | | | | | | | | | |
Nine Dragons Paper Holdings Ltd. | | | | | | | 72,000 | | | | 65,234 | |
| | | | | | | | | | | | |
| | | | | | | | | | | 7,627,605 | |
| | | | | | | | | | | | |
Consumer Discretionary – 6.0% | | | | | | | | | | | | |
Automobiles – 0.1% | | | | | | | | | | | | |
Bajaj Auto Ltd. | | | | | | | 1,813 | | | | 48,042 | |
Hyundai Motor Co. | | | | | | | 884 | | | | 63,684 | |
Kia Motors Corp. | | | | | | | 2,880 | | | | 60,621 | |
| | | | | | | | | | | | |
| | | | | | | | | | | 172,347 | |
| | | | | | | | | | | | |
Diversified Consumer Services – 1.2% | | | | | | | | | | | | |
Cogna Educacao | | | | | | | 700 | | | | 539 | |
Fu Shou Yuan International Group Ltd. | | | | | | | 434,000 | | | | 379,335 | |
New Oriental Education & Technology Group, Inc. (Sponsored ADR)(a) | | | | | | | 8,263 | | | | 894,388 | |
YDUQS Part(a) | | | | | | | 52,300 | | | | 223,146 | |
| | | | | | | | | | | | |
| | | | | | | | | | | 1,497,408 | |
| | | | | | | | | | | | |
Hotels, Restaurants & Leisure – 0.7% | | | | | | | | | | | | |
OPAP SA | | | | | | | 118,020 | | | | 889,195 | |
| | | | | | | | | | | | |
| | | |
Household Durables – 0.2% | | | | | | | | | | | | |
Hisense Home Appliances Group Co., Ltd. –Class A | | | | | | | 146,900 | | | | 194,516 | |
| | | | | | | | | | | | |
| | | |
Internet & Direct Marketing Retail – 2.7% | | | | | | | | | | | | |
Alibaba Group Holding Ltd. (ADR)(a) | | | | | | | 17,086 | | | | 3,322,885 | |
JD.com, Inc. (ADR)(a) | | | | | | | 1,807 | | | | 73,184 | |
Naspers Ltd. – Class N | | | | | | | 253 | | | | 35,955 | |
| | |
| |
| abfunds.com | | AB EMERGING MARKETS MULTI-ASSET PORTFOLIO | 21 |
PORTFOLIO OF INVESTMENTS(continued)
| | | | | | | | | | | | |
| Company | | | | |
Shares | | | U.S. $ Value | |
| |
Vipshop Holdings Ltd. (ADR)(a) | | | | | | | 429 | | | $ | 6,684 | |
| | | | | | | | | | | | |
| | | | | | | | | | | 3,438,708 | |
| | | | | | | | | | | | |
Multiline Retail – 0.1% | | | | | | | | | | | | |
Lojas Americanas SA | | | | | | | 16,900 | | | | 46,998 | |
Lojas Americanas SA (Preference Shares) | | | | | | | 6,300 | | | | 21,824 | |
Magazine Luiza SA | | | | | | | 4,600 | | | | 34,517 | |
| | | | | | | | | | | | |
| | | | | | | | | | | 103,339 | |
| | | | | | | | | | | | |
Specialty Retail – 0.1% | | | | | | | | | | | | |
Abu Dhabi National Oil Co. for Distribution PJSC | | | | | | | 95,019 | | | | 69,845 | |
Home Product Center PCL | | | | | | | 139,200 | | | | 47,082 | |
Hotai Motor Co., Ltd. | | | | | | | 4,000 | | | | 64,590 | |
| | | | | | | | | | | | |
| | | | | | | | | | | 181,517 | |
| | | | | | | | | | | | |
Textiles, Apparel & Luxury Goods – 0.9% | | | | | | | | | | | | |
Li Ning Co., Ltd. | | | | | | | 275,500 | | | | 792,581 | |
Yue Yuen Industrial Holdings Ltd. | | | | | | | 203,500 | | | | 310,969 | |
| | | | | | | | | | | | |
| | | | | | | | | | | 1,103,550 | |
| | | | | | | | | | | | |
| | | | | | | | | | | 7,580,580 | |
| | | | | | | | | | | | |
Communication Services – 3.2% | | | | | | | | | | | | |
Diversified Telecommunication
Services – 0.4% | | | | | | | | | | | | |
Emirates Telecommunications Group Co. PJSC | | | | | | | 16,769 | | | | 63,360 | |
Hellenic Telecommunications Organization SA | | | | | | | 5,841 | | | | 70,609 | |
KT Corp. (Sponsored ADR) | | | | | | | 43,441 | | | | 337,971 | |
| | | | | | | | | | | | |
| | | | | | | | | | | 471,940 | |
| | | | | | | | | | | | |
Entertainment – 0.4% | | | | | | | | | | | | |
CD Projekt SA | | | | | | | 1,063 | | | | 73,210 | |
G-bits Network Technology Xiamen Co., Ltd. – Class A | | | | | | | 5,100 | | | | 292,778 | |
NCSoft Corp. | | | | | | | 302 | | | | 161,179 | |
| | | | | | | | | | | | |
| | | | | | | | | | | 527,167 | |
| | | | | | | | | | | | |
Interactive Media & Services – 2.1% | | | | | | | | | | | | |
Momo, Inc. (Sponsored ADR) | | | | | | | 11,140 | | | | 241,626 | |
Tencent Holdings Ltd. | | | | | | | 38,000 | | | | 1,878,250 | |
Yandex NV – Class A(a) | | | | | | | 16,340 | | | | 556,377 | |
| | | | | | | | | | | | |
| | | | | | | | | | | 2,676,253 | |
| | | | | | | | | | | | |
Wireless Telecommunication
Services – 0.3% | | | | | | | | | | | | |
Advanced Info Service PCL | | | | | | | 10,900 | | | | 66,760 | |
China Mobile Ltd. | | | | | | | 23,500 | | | | 176,116 | |
Globe Telecom, Inc. | �� | | | | | | 2,030 | | | | 76,932 | |
MTN Group Ltd. | | | | | | | 7,203 | | | | 19,314 | |
PLDT, Inc. | | | | | | | 2,390 | | | | 52,865 | |
| | |
| |
| 22 | AB EMERGING MARKETS MULTI-ASSET PORTFOLIO | | abfunds.com |
PORTFOLIO OF INVESTMENTS(continued)
| | | | | | | | | | | | |
| Company | | | | |
Shares | | | U.S. $ Value | |
| |
Vodacom Group Ltd. | | | | | | | 5,428 | | | $ | 35,511 | |
| | | | | | | | | | | | |
| | | | | | | | | | | 427,498 | |
| | | | | | | | | | | | |
| | | | | | | | | | | 4,102,858 | |
| | | | | | | | | | | | |
Industrials – 3.1% | | | | | | | | | | | | |
Building Products – 0.0% | | | | | | | | | | | | |
China Lesso Group Holdings Ltd. | | | | | | | 47,000 | | | | 60,846 | |
| | | | | | | | | | | | |
| | | |
Commercial Services & Supplies – 0.3% | | | | | | | | | | | | |
Sunny Friend Environmental Technology Co., Ltd. | | | | | | | 43,000 | | | | 328,709 | |
| | | | | | | | | | | | |
| | | |
Construction & Engineering – 0.4% | | | | | | | | | | | | |
China Communications Services Corp., Ltd. –Class H | | | | | | | 338,000 | | | | 243,040 | |
Daelim Industrial Co., Ltd. | | | | | | | 5,111 | | | | 306,461 | |
| | | | | | | | | | | | |
| | | | | | | | | | | 549,501 | |
| | | | | | | | | | | | |
Electrical Equipment – 0.1% | | | | | | | | | | | | |
ElSewedy Electric Co. | | | | | | | 28,779 | | | | 14,434 | |
WEG SA | | | | | | | 8,400 | | | | 54,269 | |
| | | | | | | | | | | | |
| | | | | | | | | | | 68,703 | |
| | | | | | | | | | | | |
Industrial Conglomerates – 0.1% | | | | | | | | | | | | |
NWS Holdings Ltd. | | | | | | | 142,000 | | | | 144,711 | |
| | | | | | | | | | | | |
| | | |
Machinery – 1.5% | | | | | | | | | | | | |
China Conch Venture Holdings Ltd. | | | | | | | 15,500 | | | | 68,743 | |
China Yuchai International Ltd. | | | | | | | 23,050 | | | | 248,018 | |
Sinotruk Hong Kong Ltd. | | | | | | | 370,500 | | | | 608,592 | |
Weichai Power Co., Ltd. – Class H | | | | | | | 83,000 | | | | 132,210 | |
Zoomlion Heavy Industry Science and Technology Co., Ltd. – Class A | | | | | | | 591,314 | | | | 470,126 | |
Zoomlion Heavy Industry Science and Technology Co., Ltd. – Class H | | | | | | | 479,600 | | | | 344,996 | |
| | | | | | | | | | | | |
| | | | | | | | | | | 1,872,685 | |
| | | | | | | | | | | | |
Road & Rail – 0.2% | | | | | | | | | | | | |
Daqin Railway Co., Ltd. – Class A | | | | | | | 243,400 | | | | 232,247 | |
GMexico Transportes SAB de CV(b) | | | | | | | 14,844 | | | | 13,015 | |
| | | | | | | | | | | | |
| | | | | | | | | | | 245,262 | |
| | | | | | | | | | | | |
Trading Companies & Distributors – 0.2% | | | | | | | | | | | | |
BOC Aviation Ltd.(b) | | | | | | | 44,000 | | | | 277,978 | |
| | | | | | | | | | | | |
| | | |
Transportation Infrastructure – 0.3% | | | | | | | | | | | | |
China Merchants Port Holdings Co., Ltd. | | | | | | | 54,000 | | | | 61,344 | |
Grupo Aeroportuario del Pacifico SAB de CV – Class B | | | | | | | 14,624 | | | | 79,067 | |
Jiangsu Expressway Co., Ltd. – Class H | | | | | | | 62,000 | | | | 68,911 | |
Shenzhen Expressway Co., Ltd. – Class H | | | | | | | 64,000 | | | | 64,705 | |
| | |
| |
| abfunds.com | | AB EMERGING MARKETS MULTI-ASSET PORTFOLIO | 23 |
PORTFOLIO OF INVESTMENTS(continued)
| | | | | | | | | | | | |
| Company | | | | |
Shares | | | U.S. $ Value | |
| |
Westports Holdings Bhd | | | | | | | 14,700 | | | $ | 11,555 | |
Zhejiang Expressway Co., Ltd. – Class H | | | | | | | 134,000 | | | | 92,609 | |
| | | | | | | | | | | | |
| | | | | | | | | | | 378,191 | |
| | | | | | | | | | | | |
| | | | | | | | | | | 3,926,586 | |
| | | | | | | | | | | | |
Energy – 2.2% | | | | | | | | | | | | |
Oil, Gas & Consumable Fuels – 2.2% | | | | | | | | | | | | |
Adaro Energy Tbk PT | | | | | | | 789,500 | | | | 47,175 | |
Bukit Asam Tbk PT | | | | | | | 463,000 | | | | 61,197 | |
China Petroleum & Chemical Corp. – Class H | | | | | | | 392,000 | | | | 191,534 | |
Ecopetrol SA | | | | | | | 121,347 | | | | 56,760 | |
Exxaro Resources Ltd. | | | | | | | 10,596 | | | | 58,083 | |
LUKOIL PJSC (Sponsored ADR) | | | | | | | 21,235 | | | | 1,256,263 | |
Oil & Gas Development Co., Ltd. | | | | | | | 113,605 | | | | 52,474 | |
Petroleo Brasileiro SA (Preference Shares) | | | | | | | 130,800 | | | | 352,166 | |
Petronet LNG Ltd. | | | | | | | 42,179 | | | | 111,585 | |
Qatar Fuel QSC | | | | | | | 15,889 | | | | 70,910 | |
Surgutneftegas PJSC (Sponsored ADR) | | | | | | | 96,530 | | | | 418,815 | |
Tatneft PJSC (Sponsored ADR)(c)(d) | | | | | | | 2,380 | | | | 100,555 | |
| | | | | | | | | | | | |
| | | | | | | | | | | 2,777,517 | |
| | | | | | | | | | | | |
Consumer Staples – 1.9% | | | | | | | | | | | | |
Beverages – 1.1% | | | | | | | | | | | | |
Tsingtao Brewery Co., Ltd. – Class A (NthSSE-SEHK) | | | | | | | 72,800 | | | | 466,382 | |
Wuliangye Yibin Co., Ltd. – Class A (NthSZ-SEHK) | | | | | | | 54,458 | | | | 875,874 | |
| | | | | | | | | | | | |
| | | | | | | | | | | 1,342,256 | |
| | | | | | | | | | | | |
Food & Staples Retailing – 0.3% | | | | | | | | | | | | |
Dino Polska SA(a)(b) | | | | | | | 8,520 | | | | 331,420 | |
Sun Art Retail Group Ltd. | | | | | | | 56,000 | | | | 82,384 | |
| | | | | | | | | | | | |
| | | | | | | | | | | 413,804 | |
| | | | | | | | | | | | |
Food Products – 0.3% | | | | | | | | | | | | |
GlaxoSmithKline Consumer Healthcare Ltd. | | | | | | | 309 | | | | 40,548 | |
Indofood Sukses Makmur Tbk PT | | | | | | | 41,000 | | | | 15,862 | |
Muyuan Foodstuff Co., Ltd. – Class A | | | | | | | 4,000 | | | | 68,266 | |
Nestle India Ltd. | | | | | | | 350 | | | | 75,547 | |
QL Resources Bhd | | | | | | | 12,500 | | | | 21,412 | |
Standard Foods Corp. | | | | | | | 25,000 | | | | 50,442 | |
Want Want China Holdings Ltd. | | | | | | | 97,000 | | | | 69,948 | |
| | | | | | | | | | | | |
| | | | | | | | | | | 342,025 | |
| | | | | | | | | | | | |
Household Products – 0.1% | | | | | | | | | | | | |
Hindustan Unilever Ltd. | | | | | | | 2,545 | | | | 77,182 | |
Kimberly-Clark de Mexico SAB de CV – Class A | | | | | | | 43,349 | | | | 65,894 | |
| | | | | | | | | | | | |
| | | | | | | | | | | 143,076 | |
| | | | | | | | | | | | |
| | |
| |
| 24 | AB EMERGING MARKETS MULTI-ASSET PORTFOLIO | | abfunds.com |
PORTFOLIO OF INVESTMENTS(continued)
| | | | | | | | | | | | |
| Company | | | | |
Shares | | | U.S. $ Value | |
| |
Personal Products – 0.0% | | | | | | | | | | | | |
Natura & Co. Holding SA | | | | | | | 9,100 | | | $ | 45,079 | |
| | | | | | | | | | | | |
| | | |
Tobacco – 0.1% | | | | | | | | | | | | |
Eastern Co. SAE | | | | | | | 89,288 | | | | 69,799 | |
KT&G Corp. | | | | | | | 1,170 | | | | 71,636 | |
| | | | | | | | | | | | |
| | | | | | | | | | | 141,435 | |
| | | | | | | | | | | | |
| | | | | | | | | | | 2,427,675 | |
| | | | | | | | | | | | |
Real Estate – 1.7% | | | | | | | | | | | | |
Equity Real Estate Investment Trusts (REITs) – 0.4% | | | | | | | | | | | | |
Fibra Uno Administracion SA de CV | | | | | | | 588,610 | | | | 462,005 | |
Fortress REIT Ltd. – Class A | | | | | | | 66,244 | | | | 37,408 | |
Resilient REIT Ltd. | | | | | | | 813 | | | | 1,455 | |
| | | | | | | | | | | | |
| | | | | | | | | | | 500,868 | |
| | | | | | | | | | | | |
Real Estate Management & Development – 1.3% | | | | | | | | | | | | |
Agile Group Holdings Ltd. | | | | | | | 56,000 | | | | 59,966 | |
Aldar Properties PJSC | | | | | | | 1,716,327 | | | | 708,152 | |
Barwa Real Estate Co. | | | | | | | 61,526 | | | | 50,609 | |
BR Malls Participacoes SA | | | | | | | 17,400 | | | | 33,420 | |
China Aoyuan Group Ltd. | | | | | | | 54,000 | | | | 62,219 | |
Emaar Malls PJSC | | | | | | | 40,040 | | | | 11,553 | |
Guangzhou R&F Properties Co., Ltd. – Class H | | | | | | | 52,400 | | | | 67,398 | |
Jinke Properties Group Co., Ltd. – Class A | | | | | | | 65,500 | | | | 73,007 | |
KWG Group Holdings Ltd. | | | | | | | 53,500 | | | | 74,963 | |
Logan Property Holdings Co., Ltd. | | | | | | | 44,000 | | | | 66,932 | |
Midea Real Estate Holding Ltd.(b) | | | | | | | 20,000 | | | | 49,127 | |
Powerlong Real Estate Holdings Ltd. | | | | | | | 313,000 | | | | 182,251 | |
Shui On Land Ltd. | | | | | | | 106,000 | | | | 17,664 | |
Times China Holdings Ltd. | | | | | | | 80,000 | | | | 131,829 | |
Yuexiu Property Co., Ltd. | | | | | | | 252,000 | | | | 45,027 | |
Yuzhou Properties Co., Ltd. | | | | | | | 161,000 | | | | 67,822 | |
| | | | | | | | | | | | |
| | | | | | | | | | | 1,701,939 | |
| | | | | | | | | | | | |
| | | | | | | | | | | 2,202,807 | |
| | | | | | | | | | | | |
Health Care – 1.3% | | | | | | | | | | | | |
Biotechnology – 0.2% | | | | | | | | | | | | |
Chongqing Zhifei Biological Products Co., Ltd. – Class A | | | | | | | 8,000 | | | | 75,838 | |
Shenzhen Kangtai Biological Products Co., Ltd. – Class A | | | | | | | 4,600 | | | | 73,500 | |
Zai Lab Ltd. (ADR)(a) | | | | | | | 1,431 | | | | 73,668 | |
| | | | | | | | | | | | |
| | | | | | | | | | | 223,006 | |
| | | | | | | | | | | | |
Health Care Equipment & Supplies – 0.2% | | | | | | | | | | | | |
Hartalega Holdings Bhd | | | | | | | 50,000 | | | | 79,438 | |
| | |
| |
| abfunds.com | | AB EMERGING MARKETS MULTI-ASSET PORTFOLIO | 25 |
PORTFOLIO OF INVESTMENTS(continued)
| | | | | | | | | | | | |
| Company | | | | |
Shares | | | U.S. $ Value | |
| |
Jafron Biomedical Co., Ltd. – Class A | | | | | | | 5,500 | | | $ | 72,818 | |
Shenzhen MindrayBio-Medical Electronics Co., Ltd. | | | | | | | 2,000 | | | | 72,751 | |
Top Glove Corp. Bhd | | | | | | | 52,500 | | | | 78,176 | |
| | | | | | | | | | | | |
| | | | | | | | | | | 303,183 | |
| | | | | | | | | | | | |
Health Care Providers & Services – 0.2% | | | | | | | | | | | | |
Jinxin Fertility Group Ltd.(a)(b)(d) | | | | | | | 262,000 | | | | 287,022 | |
| | | | | | | | | | | | |
| | | |
Life Sciences Tools & Services – 0.1% | | | | | | | | | | | | |
Divi’s Laboratories Ltd. | | | | | | | 2,565 | | | | 66,553 | |
Samsung Biologics Co., Ltd.(a)(b) | | | | | | | 182 | | | | 71,335 | |
| | | | | | | | | | | | |
| | | | | | | | | | | 137,888 | |
| | | | | | | | | | | | |
Pharmaceuticals – 0.6% | | | | | | | | | | | | |
China Medical System Holdings Ltd. | | | | | | | 364,000 | | | | 389,393 | |
Nanjing King-Friend Biochemical Pharmaceutical Co., Ltd. – Class A | | | | | | | 10,400 | | | | 73,357 | |
Richter Gedeon Nyrt | | | | | | | 12,664 | | | | 238,831 | |
| | | | | | | | | | | | |
| | | | | | | | | | | 701,581 | |
| | | | | | | | | | | | |
| | | | | | | | | | | 1,652,680 | |
| | | | | | | | | | | | |
Utilities – 1.1% | | | | | | | | | | | | |
Electric Utilities – 0.7% | | | | | | | | | | | | |
Adani Transmission Ltd.(a) | | | | | | | 3,703 | | | | 9,274 | |
Centrais Eletricas Brasileiras SA (Preference Shares) | | | | | | | 73,900 | | | | 370,204 | |
EDP – Energias de Portugal SA | | | | | | | 15,023 | | | | 60,443 | |
Equatorial Energia SA | | | | | | | 126,500 | | | | 428,475 | |
Manila Electric Co. | | | | | | | 4,520 | | | | 19,870 | |
| | | | | | | | | | | | |
| | | | | | | | | | | 888,266 | |
| | | | | | | | | | | | |
Gas Utilities – 0.1% | | | | | | | | | | | | |
Empresa De Energia De Bogota(a) | | | | | | | 18,136 | | | | 10,046 | |
Indraprastha Gas Ltd. | | | | | | | 13,398 | | | | 68,978 | |
Petronas Gas Bhd | | | | | | | 10,100 | | | | 35,855 | |
| | | | | | | | | | | | |
| | | | | | | | | | | 114,879 | |
| | | | | | | | | | | | |
Independent Power and Renewable Electricity Producers – 0.1% | | | | | | | | | | | | |
Colbun SA | | | | | | | 87,787 | | | | 9,539 | |
Engie Brasil Energia SA | | | | | | | 13,500 | | | | 101,118 | |
| | | | | | | | | | | | |
| | | | | | | | | | | 110,657 | |
| | | | | | | | | | | | |
Water Utilities – 0.2% | | | | | | | | | | | | |
Aguas Andinas SA – Class A | | | | | | | 113,781 | | | | 33,500 | |
Cia de Saneamento Basico do Estado de Sao Paulo | | | | | | | 23,200 | | | | 174,622 | |
| | | | | | | | | | | | |
| | | | | | | | | | | 208,122 | |
| | | | | | | | | | | | |
| | | | | | | | | | | 1,321,924 | |
| | | | | | | | | | | | |
Total Common Stocks
(cost $70,913,853) | | | | | | | | | | | 62,564,840 | |
| | | | | | | | | | | | |
| | |
| |
| 26 | AB EMERGING MARKETS MULTI-ASSET PORTFOLIO | | abfunds.com |
PORTFOLIO OF INVESTMENTS(continued)
| | | | | | | | | | | | |
| | | | | | Principal
Amount
(000) | | | U.S. $ Value | |
| |
FIXED INCOME – 37.7% | | | | | | | | | | | | |
Sovereign Bonds – 21.6% | | | | | | | | | | | | |
Abu Dhabi Government International Bond
3.125%, 09/30/2049(b) | | | U.S.$ | | | | 500 | | | $ | 465,000 | |
Angolan Government International Bond
8.25%, 05/09/2028(b) | | | | | | | 200 | | | | 76,000 | |
9.125%, 11/26/2049(b) | | | | | | | 711 | | | | 274,873 | |
9.50%, 11/12/2025(b) | | | | | | | 200 | | | | 79,000 | |
Argentine Republic Government International Bond
3.875%, 01/15/2022(b) | | | EUR | | | | 110 | | | | 30,026 | |
5.625%, 01/26/2022 | | | U.S.$ | | | | 178 | | | | 53,845 | |
6.625%, 07/06/2028 | | | | | | | 300 | | | | 82,875 | |
6.875%,01/26/2027-01/11/2048 | | | | | | | 2,921 | | | | 839,225 | |
7.125%, 06/28/2117 | | | | | | | 50 | | | | 13,547 | |
7.50%, 04/22/2026 | | | | | | | 840 | | | | 238,350 | |
7.82%, 12/31/2033 | | | EUR | | | | 33 | | | | 12,068 | |
Series NY
3.75%, 12/31/2038 | | | U.S.$ | | | | 483 | | | | 143,089 | |
8.28%, 12/31/2033 | | | | | | | 219 | | | | 76,961 | |
Bahrain Government International Bond
5.625%, 09/30/2031(b) | | | | | | | 200 | | | | 160,500 | |
6.00%, 09/19/2044(b) | | | | | | | 692 | | | | 523,974 | |
6.75%, 09/20/2029(b) | | | | | | | 244 | | | | 217,313 | |
7.00%, 10/12/2028(b) | | | | | | | 334 | | | | 305,088 | |
Bermuda Government International Bond
4.75%, 02/15/2029(b) | | | | | | | 275 | | | | 277,406 | |
Colombia Government International Bond
5.00%, 06/15/2045 | | | | | | | 302 | | | | 309,267 | |
Costa Rica Government International Bond
7.158%, 03/12/2045(b) | | | | | | | 355 | | | | 282,336 | |
Dominican Republic International Bond
5.50%, 01/27/2025(b) | | | | | | | 100 | | | | 95,750 | |
5.875%, 01/30/2060(b) | | | | | | | 210 | | | | 175,875 | |
6.00%, 07/19/2028(b) | | | | | | | 716 | | | | 667,670 | |
6.40%, 06/05/2049(b) | | | | | | | 514 | | | | 443,807 | |
6.50%, 02/15/2048(b) | | | | | | | 516 | | | | 453,048 | |
6.85%, 01/27/2045(b) | | | | | | | 430 | | | | 386,597 | |
Ecuador Government International Bond
7.875%,03/27/2025-01/23/2028(b) | | | | | | | 1,959 | | | | 537,225 | |
8.875%, 10/23/2027(b) | | | | | | | 401 | | | | 105,263 | |
9.65%, 12/13/2026(b) | | | | | | | 366 | | | | 96,990 | |
10.75%, 01/31/2029(b) | | | | | | | 434 | | | | 119,350 | |
Egypt Government International Bond
5.875%, 06/11/2025(b) | | | | | | | 530 | | | | 476,006 | |
7.903%, 02/21/2048(b) | | | | | | | 500 | | | | 400,157 | |
8.15%, 11/20/2059(b) | | | | | | | 280 | | | | 222,600 | |
| | |
| |
| abfunds.com | | AB EMERGING MARKETS MULTI-ASSET PORTFOLIO | 27 |
PORTFOLIO OF INVESTMENTS(continued)
| | | | | | | | | | |
| | | | | Principal
Amount
(000) | | | U.S. $ Value | |
| |
8.50%, 01/31/2047(b) | | U.S.$ | | | 305 | | | $ | 247,812 | |
El Salvador Government International Bond
5.875%, 01/30/2025(b) | | | | | 19 | | | | 16,673 | |
6.375%, 01/18/2027(b) | | | | | 160 | | | | 139,700 | |
7.125%, 01/20/2050(b) | | | | | 421 | | | | 324,828 | |
7.65%, 06/15/2035(b) | | | | | 98 | | | | 83,668 | |
7.75%, 01/24/2023(b) | | | | | 63 | | | | 61,405 | |
8.625%, 02/28/2029(b) | | | | | 200 | | | | 189,250 | |
Gabon Government International Bond
6.625%, 02/06/2031(b) | | | | | 600 | | | | 354,000 | |
6.95%, 06/16/2025(b) | | | | | 502 | | | | 331,634 | |
Ghana Government International Bond
7.875%, 02/11/2035(b) | | | | | 405 | | | | 277,931 | |
8.125%, 03/26/2032(b) | | | | | 200 | | | | 140,000 | |
8.95%, 03/26/2051(b) | | | | | 200 | | | | 139,813 | |
Guatemala Government Bond
4.375%, 06/05/2027(b) | | | | | 200 | | | | 191,688 | |
4.50%, 05/03/2026(b) | | | | | 200 | | | | 190,688 | |
6.125%, 06/01/2050(b) | | | | | 269 | | | | 264,965 | |
Honduras Government International Bond
6.25%, 01/19/2027(b) | | | | | 180 | | | | 189,900 | |
7.50%, 03/15/2024(b) | | | | | 290 | | | | 280,847 | |
Indonesia Government International Bond
2.85%, 02/14/2030 | | | | | 200 | | | | 193,735 | |
3.375%, 04/15/2023(b) | | | | | 450 | | | | 450,281 | |
4.125%, 01/15/2025(b) | | | | | 380 | | | | 389,019 | |
Iraq International Bond
6.752%, 03/09/2023(b) | | | | | 300 | | | | 240,750 | |
Ivory Coast Government International Bond
5.875%, 10/17/2031(b) | | EUR | | | 425 | | | | 400,620 | |
Jamaica Government International Bond
6.75%, 04/28/2028 | | U.S.$ | | | 200 | | | | 210,500 | |
7.875%, 07/28/2045 | | | | | 460 | | | | 485,300 | |
8.00%, 03/15/2039 | | | | | 108 | | | | 117,484 | |
Kazakhstan Government International Bond
5.125%, 07/21/2025(b) | | | | | 200 | | | | 215,250 | |
Kenya Government International Bond
8.00%, 05/22/2032(b) | | | | | 346 | | | | 320,915 | |
Lebanon Government International Bond
6.00%, 01/27/2023(a)(b)(e) | | | | | 36 | | | | 6,660 | |
6.65%, 04/22/2024(a)(b)(e) | | | | | 57 | | | | 10,545 | |
6.85%, 03/23/2027(a)(b)(e) | | | | | 481 | | | | 86,580 | |
Series E
6.10%, 10/04/2022(a)(b)(e) | | | | | 216 | | | | 39,960 | |
Series G
1.00%, 11/27/2026(a)(b)(e) | | | | | 170 | | | | 30,600 | |
6.20%, 02/26/2025(a)(b)(e) | | | | | 206 | | | | 37,080 | |
| | |
| |
| 28 | AB EMERGING MARKETS MULTI-ASSET PORTFOLIO | | abfunds.com |
PORTFOLIO OF INVESTMENTS(continued)
| | | | | | | | | | |
| | | | | Principal
Amount
(000) | | | U.S. $ Value | |
| |
Mexico Government International Bond
4.75%, 03/08/2044 | | U.S.$ | | | 140 | | | $ | 142,056 | |
Mongolia Government International Bond
5.625%, 05/01/2023(b) | | | | | 200 | | | | 178,375 | |
Nigeria Government International Bond
7.625%, 11/28/2047(b) | | | | | 433 | | | | 285,915 | |
7.696%, 02/23/2038(b) | | | | | 240 | | | | 161,400 | |
Oman Government International Bond
4.875%, 02/01/2025(b) | | | | | 440 | | | | 337,150 | |
6.75%, 01/17/2048(b) | | | | | 230 | | | | 151,225 | |
Panama Government International Bond
3.16%, 01/23/2030 | | | | | 447 | | | | 444,905 | |
4.00%, 09/22/2024 | | | | | 200 | | | | 208,688 | |
4.50%,04/16/2050-04/01/2056 | | | | | 1,037 | | | | 1,131,003 | |
Panama Notas del Tesoro
3.75%, 04/17/2026(b) | | | | | 113 | | | | 120,684 | |
Paraguay Government International Bond
5.40%, 03/30/2050(b) | | | | | 200 | | | | 187,313 | |
Perusahaan Penerbit SBSN Indonesia III
4.15%, 03/29/2027(b) | | | | | 200 | | | | 200,250 | |
Philippine Government International Bond
3.70%, 02/02/2042 | | | | | 266 | | | | 292,683 | |
Qatar Government International Bond
4.50%, 04/23/2028(b) | | | | | 300 | | | | 331,500 | |
5.103%, 04/23/2048(b) | | | | | 484 | | | | 587,304 | |
Republic of South Africa Government International Bond
5.00%, 10/12/2046 | | | | | 358 | | | | 247,803 | |
5.75%, 09/30/2049 | | | | | 430 | | | | 311,479 | |
Russian Foreign Bond—Eurobond
5.25%, 06/23/2047(b) | | | | | 1,000 | | | | 1,215,937 | |
5.875%, 09/16/2043(b) | | | | | 200 | | | | 248,187 | |
Saudi Government International Bond
4.625%, 10/04/2047(b) | | | | | 310 | | | | 316,975 | |
5.25%, 01/16/2050(b) | | | | | 401 | | | | 447,992 | |
Senegal Government International Bond
4.75%, 03/13/2028(b) | | EUR | | | 400 | | | | 398,560 | |
6.25%, 07/30/2024(b) | | U.S.$ | | | 280 | | | | 262,762 | |
6.75%, 03/13/2048(b) | | | | | 200 | | | | 163,750 | |
Sri Lanka Government International Bond
6.20%, 05/11/2027(b) | | | | | 200 | | | | 106,000 | |
6.85%, 11/03/2025(b) | | | | | 260 | | | | 142,675 | |
7.85%, 03/14/2029(b) | | | | | 240 | | | | 129,854 | |
Turkey Government International Bond
4.875%, 04/16/2043 | | | | | 423 | | | | 293,458 | |
5.75%, 05/11/2047 | | | | | 400 | | | | 288,960 | |
7.00%, 06/05/2020 | | | | | 95 | | | | 95,267 | |
| | |
| |
| abfunds.com | | AB EMERGING MARKETS MULTI-ASSET PORTFOLIO | 29 |
PORTFOLIO OF INVESTMENTS(continued)
| | | | | | | | | | | | |
| | | | | | Principal
Amount
(000) | | | U.S. $ Value | |
| |
Ukraine Government International Bond
6.75%, 06/20/2026(b) | | | EUR | | | | 173 | | | $ | 168,382 | |
7.375%, 09/25/2032(b) | | | U.S.$ | | | | 610 | | | | 552,431 | |
7.75%,09/01/2022-09/01/2026(b) | | | | | | | 1,523 | | | | 1,416,240 | |
Series GDP
0.00%, 05/31/2040(b) | | | | | | | 308 | | | | 227,920 | |
Uruguay Government International Bond
4.375%, 01/23/2031 | | | | | | | 98 | | | | 106,361 | |
4.975%, 04/20/2055 | | | | | | | 17 | | | | 19,763 | |
5.10%, 06/18/2050 | | | | | | | 49 | | | | 55,816 | |
Venezuela Government International Bond
11.95%, 08/05/2031(a)(e)(f) | | | | | | | 265 | | | | 23,805 | |
12.75%, 08/23/2022(a)(e)(f) | | | | | | | 564 | | | | 50,769 | |
Zambia Government International Bond
8.50%, 04/14/2024(b) | | | | | | | 200 | | | | 76,875 | |
| | | | | | | | | | | | |
| | | |
Total Sovereign Bonds
(cost $34,353,314) | | | | | | | | | | | 27,429,634 | |
| | | | | | | | | | | | |
| | | | | | | | | | | | |
Corporate Bonds – 7.2% | | | | | | | | | | | | |
Abu Dhabi National Energy Co. PJSC
4.00%, 10/03/2049(b) | | | | | | | 200 | | | | 181,500 | |
AES Gener SA
6.35%, 10/07/2079(b) | | | | | | | 200 | | | | 156,000 | |
AngloGold Ashanti Holdings PLC
5.125%, 08/01/2022 | | | | | | | 140 | | | | 133,175 | |
Bangkok Bank PCL/Hong Kong
3.733%, 09/25/2034(b) | | | | | | | 200 | | | | 172,071 | |
Braskem Netherlands Finance BV
4.50%, 01/10/2028(b) | | | | | | | 200 | | | | 157,938 | |
5.875%, 01/31/2050(b) | | | | | | | 200 | | | | 156,750 | |
BRF SA
4.875%, 01/24/2030(b) | | | | | | | 408 | | | | 338,322 | |
Celulosa Arauco y Constitucion SA
4.20%, 01/29/2030(b) | | | | | | | 200 | | | | 170,937 | |
Cemig Geracao e Transmissao SA
9.25%, 12/05/2024(b) | | | | | | | 200 | | | | 191,719 | |
Centrais Eletricas Brasileiras
4.625%, 02/04/2030(b) | | | | | | | 203 | | | | 179,655 | |
Centrais Eletricas Brasileiras SA
3.625%, 02/04/2025(b) | | | | | | | 207 | | | | 184,230 | |
Colbun SA
3.95%, 10/11/2027(b) | | | | | | | 263 | | | | 252,348 | |
CSN Resources SA
7.625%,02/13/2023-04/17/2026(b) | | | | | | | 400 | | | | 269,250 | |
Digicel Group One Ltd.
8.25%, 12/30/2022(f) | | | | | | | 53 | | | | 21,306 | |
| | |
| |
| 30 | AB EMERGING MARKETS MULTI-ASSET PORTFOLIO | | abfunds.com |
PORTFOLIO OF INVESTMENTS(continued)
| | | | | | | | | | |
| | | | | Principal
Amount
(000) | | | U.S. $ Value | |
| |
Digicel Group Two Ltd.
8.25%, 09/30/2022(b) | | U.S.$ | | | 292 | | | $ | 38,055 | |
DP World PLC
4.70%, 09/30/2049(b) | | | | | 200 | | | | 156,000 | |
Ecopetrol SA
5.875%, 05/28/2045 | | | | | 207 | | | | 185,265 | |
Empresa Electrica Cochrane SpA
5.50%, 05/14/2027(b) | | | | | 200 | | | | 177,687 | |
Empresas Publicas de Medellin ESP
4.25%, 07/18/2029(b) | | | | | 200 | | | | 167,937 | |
8.375%, 11/08/2027 | | COP | | | 418,000 | | | | 97,683 | |
Enel Americas SA
4.00%, 10/25/2026 | | U.S.$ | | | 248 | | | | 231,957 | |
Enel Chile SA
4.875%, 06/12/2028 | | | | | 140 | | | | 135,713 | |
Enel Generacion Chile SA
4.25%, 04/15/2024 | | | | | 40 | | | | 39,202 | |
Geopark Ltd.
5.50%, 01/17/2027(b) | | | | | 200 | | | | 97,000 | |
Globo Comunicacao e Participacoes SA
4.875%, 01/22/2030(b) | | | | | 477 | | | | 412,605 | |
GNL Quintero SA
4.634%, 07/31/2029(b) | | | | | 200 | | | | 193,500 | |
Gran Tierra Energy International Holdings Ltd.
6.25%, 02/15/2025(b) | | | | | 400 | | | | 106,286 | |
Industrias Penoles SAB de CV
4.15%, 09/12/2029(b) | | | | | 200 | | | | 175,781 | |
Infraestructura Energetica Nova SAB de CV
3.75%, 01/14/2028(b) | | | | | 334 | | | | 293,085 | |
Intercorp Financial Services, Inc.
4.125%, 10/19/2027(b) | | | | | 200 | | | | 179,687 | |
Intercorp Peru Ltd.
3.875%, 08/15/2029(b) | | | | | 200 | | | | 171,719 | |
Inversiones CMPC SA
3.85%, 01/13/2030(b) | | | | | 200 | | | | 178,000 | |
4.375%, 04/04/2027(b) | | | | | 220 | | | | 206,525 | |
KOC Holding AS
5.25%, 03/15/2023(b) | | | | | 200 | | | | 183,687 | |
Light Servicos de Eletricidade SA/Light Energia SA
7.25%, 05/03/2023(b) | | | | | 200 | | | | 182,000 | |
Lima Metro Line 2 Finance Ltd.
4.35%, 04/05/2036(b) | | | | | 346 | | | | 328,700 | |
MV24 Capital BV
6.748%, 06/01/2034(b) | | | | | 197 | | | | 156,031 | |
Nexa Resources SA
5.375%, 05/04/2027(b) | | | | | 200 | | | | 151,783 | |
| | |
| |
| abfunds.com | | AB EMERGING MARKETS MULTI-ASSET PORTFOLIO | 31 |
PORTFOLIO OF INVESTMENTS(continued)
| | | | | | | | | | |
| | | | | Principal
Amount
(000) | | | U.S. $ Value | |
| |
Odebrecht Finance Ltd.
7.125%, 06/26/2042(a)(b)(e) | | U.S.$ | | | 200 | | | $ | 10,025 | |
Orbia Advance Corp SAB de CV
4.00%, 10/04/2027(b) | | | | | 393 | | | | 341,910 | |
Peru LNG Srl
5.375%, 03/22/2030(b) | | | | | 279 | | | | 167,400 | |
Petkim Petrokimya Holding AS
5.875%, 01/26/2023(b) | | | | | 200 | | | | 164,938 | |
Prosus NV
3.68%, 01/21/2030(b) | | | | | 318 | | | | 288,744 | |
PTTEP Treasury Center Co., Ltd.
3.903%, 12/06/2059(b) | | | | | 210 | | | | 200,025 | |
Rumo Luxembourg SARL
7.375%, 02/09/2024(b) | | | | | 200 | | | | 199,219 | |
Southern Copper Corp.
5.25%, 11/08/2042 | | | | | 95 | | | | 96,485 | |
5.875%, 04/23/2045 | | | | | 88 | | | | 93,070 | |
Stillwater Mining Co.
7.125%, 06/27/2025(b) | | | | | 200 | | | | 180,096 | |
Tonon Luxembourg SA
6.50% (0.50% Cash and 6.00% PIK), 10/31/2024(f)(g)(h)(i) | | | | | 104 | | | | 3,143 | |
TransJamaican Highway Ltd.
5.75%, 10/10/2036(b) | | | | | 160 | | | | 153,600 | |
Transportadora de Gas Internacional SA ESP
5.55%, 11/01/2028(b) | | | | | 200 | | | | 190,890 | |
Ultrapar International SA
5.25%, 10/06/2026(b) | | | | | 200 | | | | 172,312 | |
Virgolino de Oliveira Finance SA
11.75%, 02/09/2022(a)(e)(f) | | | | | 202 | | | | 3,898 | |
Wijaya Karya Persero Tbk PT
7.70%, 01/31/2021(b) | | IDR | | | 2,000,000 | | | | 116,213 | |
| | | | | | | | | | |
| | | |
Total Corporate Bonds
(cost $11,652,324) | | | | | | | | | 9,193,057 | |
| | | | | | | | | | |
| | | | | | | | | | |
Quasi-Sovereign Bonds – 6.8% | |
Aeropuerto Internacional de Tocumen SA
6.00%, 11/18/2048(b) | | U.S.$ | | | 200 | | | | 215,850 | |
Corp. Nacional del Cobre de Chile
3.70%, 01/30/2050(b) | | | | | 1,357 | | | | 1,165,323 | |
4.375%, 02/05/2049(b) | | | | | 280 | | | | 270,438 | |
Empresa de Transmision Electrica SA
5.125%, 05/02/2049(b) | | | | | 200 | | | | 200,563 | |
Empresa de Transporte de Pasajeros Metro SA
5.00%, 01/25/2047(b) | | | | | 200 | | | | 200,000 | |
| | |
| |
| 32 | AB EMERGING MARKETS MULTI-ASSET PORTFOLIO | | abfunds.com |
PORTFOLIO OF INVESTMENTS(continued)
| | | | | | | | | | |
| | | | | Principal
Amount
(000) | | | U.S. $ Value | |
| |
Eskom Holdings SOC Ltd.
7.125%, 02/11/2025(b) | | U.S.$ | | | 200 | | | $ | 142,250 | |
KazMunayGas National Co. JSC
5.75%, 04/19/2047(b) | | | | | 200 | | | | 199,406 | |
MDGH – GMTN BV
2.875%, 11/07/2029(b) | | | | | 612 | | | | 577,740 | |
NAK Naftogaz Ukraine via Kondor Finance PLC
7.625%, 11/08/2026(b) | | | | | 200 | | | | 166,000 | |
Oil and Gas Holding Co. BSCC (The)
7.50%, 10/25/2027(b) | | | | | 200 | | | | 171,125 | |
7.625%, 11/07/2024(b) | | | | | 200 | | | | 176,000 | |
Pertamina Persero PT
4.15%, 02/25/2060(b) | | | | | 200 | | | | 166,594 | |
5.625%, 05/20/2043(b) | | | | | 200 | | | | 198,000 | |
Perusahaan Listrik Negara PT
3.375%, 02/05/2030(b) | | | | | 1,399 | | | | 1,278,280 | |
3.875%, 07/17/2029(b) | | | | | 200 | | | | 186,276 | |
4.875%, 07/17/2049(b) | | | | | 200 | | | | 190,007 | |
5.45%, 05/21/2028(b) | | | | | 220 | | | | 229,281 | |
6.15%, 05/21/2048(b) | | | | | 200 | | | | 215,500 | |
Petroleos de Venezuela SA
5.375%, 04/12/2027(a)(e)(f) | | | | | 226 | | | | 13,542 | |
6.00%, 11/15/2026(a)(e)(f) | | | | | 220 | | | | 13,200 | |
9.00%, 11/17/2021(a)(e)(f) | | | | | 128 | | | | 7,707 | |
Petroleos Mexicanos
5.95%, 01/28/2031(b) | | | | | 487 | | | | 336,030 | |
6.50%, 03/13/2027 | | | | | 154 | | | | 113,214 | |
6.75%, 09/21/2047 | | | | | 255 | | | | 164,883 | |
6.84%, 01/23/2030(b) | | | | | 52 | | | | 37,623 | |
6.875%, 08/04/2026 | | | | | 60 | | | | 45,450 | |
6.95%, 01/28/2060(b) | | | | | 1,140 | | | | 769,500 | |
7.69%, 01/23/2050(b) | | | | | 280 | | | | 190,400 | |
Petroliam Nasional Bhd
7.625%, 10/15/2026(b) | | | | | 266 | | | | 337,844 | |
State Oil Co. of the Azerbaijan Republic
6.95%, 03/18/2030(b) | | | | | 321 | | | | 316,887 | |
State Savings Bank of Ukraine Via SSB #1 PLC
9.625%, 03/20/2025(b) | | | | | 120 | | | | 109,200 | |
Trinidad Generation UnLtd.
5.25%, 11/04/2027(b) | | | | | 200 | | | | 177,250 | |
| | | | | | | | | | |
| | | |
Total Quasi-Sovereign Bonds
(cost $9,814,858) | | | | | | | | | 8,581,363 | |
| | | | | | | | | | |
| | |
| |
| abfunds.com | | AB EMERGING MARKETS MULTI-ASSET PORTFOLIO | 33 |
PORTFOLIO OF INVESTMENTS(continued)
| | | | | | | | | | | | |
| | | | | | Principal
Amount
(000) | | | U.S. $ Value | |
| |
Treasury Bonds – 1.6% | | | | | | | | | | | | |
Indonesia Treasury Bond
Series FR68
8.375%, 03/15/2034 | | | IDR | | | | 4,614,000 | | | $ | 282,753 | |
Mexican Bonos
Series M 20
8.50%, 05/31/2029 | | | MXN | | | | 11,821 | | | | 545,642 | |
Peru Government Bond
5.94%, 02/12/2029(b) | | | PEN | | | | 2,030 | | | | 635,705 | |
Russian Federal Bond – OFZ
Series 6215 7.00%, 08/16/2023 | | | RUB | | | | 8,298 | | | | 106,957 | |
Series 6222 7.10%, 10/16/2024 | | | | | | | 2,662 | | | | 34,599 | |
Series 6227 7.40%, 07/17/2024 | | | | | | | 37,543 | | | | 493,786 | |
| | | | | | | | | | | | |
| | | |
Total Treasury Bonds
(cost $2,435,757) | | | | | | | | | | | 2,099,442 | |
| | | | | | | | | | | | |
| | | |
Governments - Sovereign Bonds – 0.3% | | | | | | | | | | | | |
Israel Government International Bond
3.875%, 07/03/2050
(cost $375,000) | | | U.S.$ | | | | 375 | | | | 375,000 | |
| | | | | | | | | | | | |
| | | |
Emerging Markets - Treasuries – 0.2% | | | | | | | | | | | | |
Argentine Bonos del Tesoro
15.50%, 10/17/2026(c) | | | ARS | | | | 77 | | | | 293 | |
Ukraine Government Bond
16.75%, 06/02/2021 | | | UAH | | | | 7,259 | | | | 251,808 | |
| | | | | | | | | | | | |
| | | |
Total Emerging Markets – Treasuries
(cost $321,388) | | | | | | | | | | | 252,101 | |
| | | | | | | | | | | | |
| | | |
Regional Bonds – 0.0% | | | | | | | | | | | | |
Provincia de Neuquen Argentina
7.50%, 04/27/2025(b)
(cost $68,000) | | | U.S.$ | | | | 68 | | | | 41,480 | |
| | | | | | | | | | | | |
| | | |
Total Fixed Income
(cost $59,020,641) | | | | | | | | | | | 47,972,077 | |
| | | | | | | | | | | | |
| | | |
| | | | | | Shares | | | | |
EQUITY LINKED NOTES – 0.5% | | | | | | | | | | | | |
Information Technology – 0.5% | | | | | | | | | | | | |
Electronic Equipment, Instruments & Components – 0.5% | | | | | | | | | | | | |
FPT Corp., Macquarie Bank Ltd.,
expiring 03/31/2020(a) | | | | | | | 352,463 | | | | 613,382 | |
| | | | | | | | | | | | |
| | |
| |
| 34 | AB EMERGING MARKETS MULTI-ASSET PORTFOLIO | | abfunds.com |
PORTFOLIO OF INVESTMENTS(continued)
| | | | | | | | | | | | |
| Company | | | | |
Shares | | | U.S. $ Value | |
| |
INVESTMENT COMPANIES – 0.1% | | | | | | | | | | | | |
Funds and Investment Trusts – 0.1% | | | | | | | | | | | | |
VFMVN30 ETF Fund(a)(j) | | | | | | | 239,030 | | | $ | 107,864 | |
| | | | | | | | | | | | |
| | | |
Total Equity
(cost $833,359) | | | | | | | | | | | 721,246 | |
| | | | | | | | | | | | |
| | | | | | | | | | | | |
SHORT-TERM INVESTMENTS – 11.9% | | | | | | | | | | | | |
Investment Companies – 11.1% | | | | | | | | | | | | |
AB Fixed Income Shares, Inc. – Government Money Market Portfolio – Class AB, 0.53%(j)(k)(l)
(cost $14,136,632) | | | | | | | 14,136,632 | | | | 14,136,632 | |
| | | | | | | | | | | | |
| | | |
| | | | | | Principal
Amount
(000) | | | | |
Time Deposits – 0.3% | | | | | | | | | | | | |
BBH, Grand Cayman
(0.11)%, 04/01/2020 | | | SEK | | | | 9 | | | | 943 | |
0.01%, 04/01/2020 | | | NOK | | | | 2 | | | | 167 | |
0.01%, 04/01/2020 | | | SGD | | | | 1 | | | | 634 | |
0.02%, 04/01/2020 | | | AUD | | | | 6 | | | | 3,714 | |
0.04%, 04/01/2020 | | | CAD | | | | 1 | | | | 559 | |
4.00%, 04/01/2020 | | | ZAR | | | | 27 | | | | 1,505 | |
Citibank, London
(0.65)%, 04/01/2020 | | | EUR | | | | 133 | | | | 146,442 | |
0.03%, 04/01/2020 | | | GBP | | | | 22 | | | | 27,681 | |
Hong Kong & Shanghai Bank, Hong Kong
0.63%, 04/01/2020 | | | HKD | | | | 372 | | | | 47,938 | |
Sumitomo, Tokyo
(0.27)%, 04/01/2020 | | | JPY | | | | 13,751 | | | | 127,888 | |
| | | | | |
| | | |
Total Time Deposits
(cost $357,471) | | | | | | | | | | | 357,471 | |
| | | | | |
| | | |
Treasury Bill – 0.3% | | | | | | | | | | | | |
Egypt – 0.3% | | | | | | | | | | | | |
Egypt Treasury Bills
Series 364D
Zero Coupon, 08/18/2020
(cost $326,105) | | | EGP | | | | 5,375 | | | | 324,839 | |
| | | | | |
| | |
| |
| abfunds.com | | AB EMERGING MARKETS MULTI-ASSET PORTFOLIO | 35 |
PORTFOLIO OF INVESTMENTS(continued)
| | | | | | | | | | | | |
| | | | | | Principal
Amount
(000) | | | U.S. $ Value | |
| |
Treasury Bonds – 0.2% | | | | | | | | | | | | |
United Kingdom – 0.2% | | | | | | | | | | | | |
Standard Chartered Bank
Zero Coupon, 08/04/2020(b) (g)
(cost $341,332) | | | PKR | | | | 55,000 | | | $ | 311,201 | |
| | | | | | | | | | | | |
| | | |
Total Short-Term Investments
(cost $15,161,540) | | | | | | | | | | | 15,130,143 | |
| | | | | | | | | | | | |
Total Investments Before Security Lending Collateral for Securities Loaned – 99.5%
(cost $145,929,393) | | | | | | | | | | | 126,388,306 | |
| | | | | | | | | | | | |
| | | |
| | | | | | Shares | | | | |
| | | |
INVESTMENTS OF CASH COLLATERAL FOR SECURITIES LOANED – 0.3% | | | | | | | | | | | | |
Investment Companies – 0.3% | | | | | | | | | | | | |
AB Fixed Income Shares, Inc. – Government Money Market Portfolio – Class AB,
0.53%(j)(k)(l)
(cost $326,569) | | | | | | | 326,569 | | | | 326,569 | |
| | | | | | | | | | | | |
| | | |
Total Investments – 99.8%
(cost $146,255,962) | | | | | | | | | | | 126,714,875 | |
Other assets less liabilities – 0.2% | | | | | | | | | | | 293,980 | |
| | | | | | | | | | | | |
| | | |
Net Assets – 100.0% | | | | | | | | | | $ | 127,008,855 | |
| | | | | | | | | | | | |
FUTURES (see Note D)
| | | | | | | | | | | | | | | | |
| Description | | Number of
Contracts | | | Expiration
Month | | | Current
Notional | | | Value and
Unrealized
Appreciation/
(Depreciation) | |
Purchased Contracts | |
FTSE China A50 Index Futures | | | 122 | | | | April 2020 | | | $ | 1,526,858 | | | $ | 2,900 | |
Sold Contracts | |
MSCI Emerging Markets Index Futures | | | 337 | | | | June 2020 | | | | 14,202,865 | | | | (825,989 | ) |
| | | | | | | | | | | | | | | | |
| | | | | | | | | | | | | | $ | (823,089 | ) |
| | | | | | | | | | | | | | | | |
| | |
| |
| 36 | AB EMERGING MARKETS MULTI-ASSET PORTFOLIO | | abfunds.com |
PORTFOLIO OF INVESTMENTS(continued)
FORWARD CURRENCY EXCHANGE CONTRACTS (see Note D)
| | | | | | | | | | | | | | | | | | | | | | | | |
| Counterparty | | Contracts to
Deliver
(000) | | | In Exchange
For
(000) | | | Settlement
Date | | | Unrealized
Appreciation/
(Depreciation) | |
Australia and New Zealand Banking Group Ltd. | | | CNH | | | | 37,097 | | | | USD | | | | 5,301 | | | | 04/16/2020 | | | $ | 71,766 | |
Bank of America, NA | | | BRL | | | | 3,099 | | | | USD | | | | 596 | | | | 04/02/2020 | | | | (298 | ) |
Bank of America, NA | | | USD | | | | 669 | | | | BRL | | | | 3,099 | | | | 04/02/2020 | | | | (72,839 | ) |
Bank of America, NA | | | USD | | | | 147 | | | | RUB | | | | 10,585 | | | | 05/20/2020 | | | | (12,014 | ) |
Bank of America, NA | | | USD | | | | 2,040 | | | | KRW | | | | 2,464,256 | | | | 05/14/2020 | | | | (15,557 | ) |
Barclays Bank PLC | | | CLP | | | | 815,722 | | | | USD | | | | 976 | | | | 05/13/2020 | | | | 22,052 | |
Barclays Bank PLC | | | CNH | | | | 40,946 | | | | USD | | | | 5,898 | | | | 04/16/2020 | | | | 126,051 | |
Barclays Bank PLC | | | INR | | | | 32,102 | | | | USD | | | | 447 | | | | 04/23/2020 | | | | 25,679 | |
Barclays Bank PLC | | | USD | | | | 2,756 | | | | INR | | | | 199,162 | | | | 04/23/2020 | | | | (141,968 | ) |
Barclays Bank PLC | | | IDR | | | | 38,182,697 | | | | USD | | | | 2,609 | | | | 05/05/2020 | | | | 276,709 | |
Barclays Bank PLC | | | USD | | | | 4,396 | | | | IDR | | | | 63,791,546 | | | | 05/05/2020 | | | | (499,126 | ) |
Barclays Bank PLC | | | MYR | | | | 35,742 | | | | USD | | | | 8,483 | | | | 08/13/2020 | | | | 211,299 | |
Barclays Bank PLC | | | USD | | | | 6,524 | | | | MYR | | | | 27,142 | | | | 08/13/2020 | | | | (243,641 | ) |
Barclays Bank PLC | | | TWD | | | | 128,283 | | | | USD | | | | 4,310 | | | | 05/21/2020 | | | | 35,003 | |
Barclays Bank PLC | | | PHP | | | | 10,601 | | | | USD | | | | 206 | | | | 05/28/2020 | | | | 728 | |
BNP Paribas SA | | | CNH | | | | 11,492 | | | | USD | | | | 1,627 | | | | 04/16/2020 | | | | 6,987 | |
BNP Paribas SA | | | RUB | | | | 11,124 | | | | USD | | | | 142 | | | | 05/20/2020 | | | | 695 | |
BNP Paribas SA | | | ZAR | | | | 9,632 | | | | USD | | | | 555 | | | | 04/08/2020 | | | | 16,739 | |
Brown Brothers Harriman & Co. | | | HUF | | | | 39,163 | | | | USD | | | | 120 | | | | 05/20/2020 | | | | 287 | |
Brown Brothers Harriman & Co. | | | MXN | | | | 5,544 | | | | USD | | | | 260 | | | | 04/23/2020 | | | | 27,523 | |
Brown Brothers Harriman & Co. | | | MXN | | | | 5,936 | | | | USD | | | | 242 | | | | 04/23/2020 | | | | (7,263 | ) |
Brown Brothers Harriman & Co. | | | PLN | | | | 793 | | | | USD | | | | 193 | | | | 05/20/2020 | | | | 1,784 | |
Brown Brothers Harriman & Co. | | | PLN | | | | 793 | | | | USD | | | | 186 | | | | 05/20/2020 | | | | (5,520 | ) |
Brown Brothers Harriman & Co. | | | USD | | | | 197 | | | | PLN | | | | 820 | | | | 05/20/2020 | | | | 722 | |
Brown Brothers Harriman & Co. | | | USD | | | | 1,211 | | | | ZAR | | | | 18,597 | | | | 04/08/2020 | | | | (172,599 | ) |
Brown Brothers Harriman & Co. | | | ZAR | | | | 13,954 | | | | USD | | | | 871 | | | | 04/08/2020 | | | | 91,738 | |
Brown Brothers Harriman & Co. | | | THB | | | | 39,837 | | | | USD | | | | 1,236 | | | | 05/21/2020 | | | | 22,054 | |
Brown Brothers Harriman & Co. | | | TRY | | | | 1,855 | | | | USD | | | | 285 | | | | 05/28/2020 | | | | 9,187 | |
Citibank, NA | | | BRL | | | | 31,042 | | | | USD | | | | 7,074 | | | | 04/02/2020 | | | | 1,099,536 | |
Citibank, NA | | | BRL | | | | 11,483 | | | | USD | | | | 2,209 | | | | 04/02/2020 | | | | (1,106 | ) |
Citibank, NA | | | USD | | | | 6,804 | | | | BRL | | | | 35,373 | | | | 04/02/2020 | | | | 3,453 | |
Citibank, NA | | | USD | | | | 1,499 | | | | BRL | | | | 7,152 | | | | 04/02/2020 | | | | (122,858 | ) |
Citibank, NA | | | USD | | | | 328 | | | | CLP | | | | 286,807 | | | | 05/13/2020 | | | | 7,477 | |
Citibank, NA | | | USD | | | | 5,055 | | | | CNH | | | | 35,448 | | | | 04/16/2020 | | | | (57,953 | ) |
Citibank, NA | | | HUF | | | | 217,688 | | | | USD | | | | 667 | | | | 05/20/2020 | | | | 827 | |
Citibank, NA | | | MXN | | | | 29,486 | | | | USD | | | | 1,452 | | | | 04/23/2020 | | | | 213,321 | |
Citibank, NA | | | USD | | | | 190 | | | | KRW | | | | 232,587 | | | | 05/14/2020 | | | | 880 | |
Citibank, NA | | | USD | | | | 591 | | | | THB | | | | 19,323 | | | | 05/21/2020 | | | | (2,261 | ) |
Deutsche Bank AG | | | BRL | | | | 2,767 | | | | USD | | | | 532 | | | | 04/02/2020 | | | | (266 | ) |
| | |
| |
| abfunds.com | | AB EMERGING MARKETS MULTI-ASSET PORTFOLIO | 37 |
PORTFOLIO OF INVESTMENTS(continued)
| | | | | | | | | | | | | | | | | | | | |
| Counterparty | | Contracts to
Deliver
(000) | | | In Exchange
For
(000) | | | Settlement
Date | | | Unrealized
Appreciation/
(Depreciation) | |
Deutsche Bank AG | | USD | | | 554 | | | BRL | | | 2,767 | | | | 04/02/2020 | | | $ | (21,718 | ) |
Deutsche Bank AG | | BRL | | | 2,767 | | | USD | | | 553 | | | | 05/05/2020 | | | | 21,979 | |
Deutsche Bank AG | | USD | | | 1,930 | | | INR | | | 139,043 | | | | 04/23/2020 | | | | (104,237 | ) |
Deutsche Bank AG | | IDR | | | 12,148,403 | | | USD | | | 748 | | | | 05/05/2020 | | | | 6,031 | |
Deutsche Bank AG | | USD | | | 3,633 | | | MXN | | | 71,352 | | | | 04/23/2020 | | | | (634,978 | ) |
Deutsche Bank AG | | PEN | | | 5,390 | | | USD | | | 1,526 | | | | 05/13/2020 | | | | (42,094 | ) |
Deutsche Bank AG | | USD | | | 319 | | | PEN | | | 1,144 | | | | 05/13/2020 | | | | 13,368 | |
Deutsche Bank AG | | ZAR | | | 16,745 | | | USD | | | 1,065 | | | | 04/08/2020 | | | | 129,554 | |
Goldman Sachs Bank USA | | BRL | | | 9,367 | | | USD | | | 1,802 | | | | 04/02/2020 | | | | (901 | ) |
Goldman Sachs Bank USA | | USD | | | 2,087 | | | BRL | | | 9,367 | | | | 04/02/2020 | | | | (283,817 | ) |
Goldman Sachs Bank USA | | CNH | | | 24,700 | | | USD | | | 3,525 | | | | 04/16/2020 | | | | 43,168 | |
Goldman Sachs Bank USA | | USD | | | 16,816 | | | CNH | | | 119,376 | | | | 04/16/2020 | | | | 12,357 | |
Goldman Sachs Bank USA | | INR | | | 307,059 | | | USD | | | 4,103 | | | | 04/23/2020 | | | | 72,457 | |
Goldman Sachs Bank USA | | USD | | | 1,427 | | | IDR | | | 20,818,542 | | | | 05/05/2020 | | | | (155,311 | ) |
Goldman Sachs Bank USA | | MYR | | | 4,262 | | | USD | | | 1,025 | | | | 08/13/2020 | | | | 38,501 | |
Goldman Sachs Bank USA | | USD | | | 760 | | | MYR | | | 3,354 | | | | 08/13/2020 | | | | 16,029 | |
Goldman Sachs Bank USA | | USD | | | 5,727 | | | MYR | | | 24,428 | | | | 08/13/2020 | | | | (74,314 | ) |
Goldman Sachs Bank USA | | USD | | | 2,970 | | | TWD | | | 89,361 | | | | 05/21/2020 | | | | 7,674 | |
Goldman Sachs Bank USA | | USD | | | 1,271 | | | PHP | | | 67,124 | | | | 05/28/2020 | | | | 31,594 | |
Goldman Sachs Bank USA | | RUB | | | 3,044 | | | USD | | | 44 | | | | 05/20/2020 | | | | 5,270 | |
Goldman Sachs Bank USA | | KRW | | | 624,720 | | | USD | | | 520 | | | | 05/14/2020 | | | | 6,832 | |
HSBC Bank USA | | CNH | | | 79,435 | | | USD | | | 11,368 | | | | 04/16/2020 | | | | 169,935 | |
HSBC Bank USA | | USD | | | 399 | | | INR | | | 28,656 | | | | 04/23/2020 | | | | (22,645 | ) |
HSBC Bank USA | | USD | | | 555 | | | IDR | | | 7,950,491 | | | | 05/05/2020 | | | | (69,858 | ) |
HSBC Bank USA | | TWD | | | 25,357 | | | USD | | | 855 | | | | 05/21/2020 | | | | 9,561 | |
HSBC Bank USA | | USD | | | 165 | | | TWD | | | 4,917 | | | | 05/21/2020 | | | | (1,436 | ) |
HSBC Bank USA | | PHP | | | 52,067 | | | USD | | | 1,025 | | | | 05/28/2020 | | | | 14,518 | |
HSBC Bank USA | | USD | | | 139 | | | PHP | | | 7,297 | | | | 05/28/2020 | | | | 2,433 | |
HSBC Bank USA | | USD | | | 4,932 | | | ZAR | | | 73,898 | | | | 04/08/2020 | | | | (804,357 | ) |
HSBC Bank USA | | KRW | | | 2,201,643 | | | USD | | | 1,851 | | | | 05/14/2020 | | | | 42,787 | |
HSBC Bank USA | | USD | | | 3,751 | | | KRW | | | 4,798,267 | | | | 05/14/2020 | | | | 190,865 | |
HSBC Bank USA | | USD | | | 563 | | | KRW | | | 662,959 | | | | 05/14/2020 | | | | (18,869 | ) |
JPMorgan Chase Bank, NA | | BRL | | | 1,326 | | | USD | | | 296 | | | | 04/02/2020 | | | | 40,501 | |
JPMorgan Chase Bank, NA | | USD | | | 255 | | | BRL | | | 1,326 | | | | 04/02/2020 | | | | 128 | |
JPMorgan Chase Bank, NA | | COP | | | 1,260,470 | | | USD | | | 306 | | | | 05/13/2020 | | | | (3,810 | ) |
JPMorgan Chase Bank, NA | | USD | | | 725 | | | COP | | | 3,029,761 | | | | 05/13/2020 | | | | 18,823 | |
JPMorgan Chase Bank, NA | | CZK | | | 22,463 | | | USD | | | 875 | | | | 05/20/2020 | | | | (29,073 | ) |
JPMorgan Chase Bank, NA | | INR | | | 103,877 | | | USD | | | 1,383 | | | | 04/23/2020 | | | | 19,632 | |
JPMorgan Chase Bank, NA | | USD | | | 1,776 | | | INR | | | 135,588 | | | | 04/23/2020 | | | | 4,078 | |
JPMorgan Chase Bank, NA | | JPY | | | 30,691 | | | USD | | | 282 | | | | 04/09/2020 | | | | (3,719 | ) |
JPMorgan Chase Bank, NA | | USD | | | 1,542 | | | JPY | | | 167,640 | | | | 04/09/2020 | | | | 17,443 | |
JPMorgan Chase Bank, NA | | TWD | | | 46,441 | | | USD | | | 1,565 | | | | 05/21/2020 | | | | 16,983 | |
JPMorgan Chase Bank, NA | | USD | | | 534 | | | ZAR | | | 7,995 | | | | 04/08/2020 | | | | (87,110 | ) |
Morgan Stanley Capital Services LLC | | USD | | | 133 | | | COP | | | 525,262 | | | | 05/13/2020 | | | | (3,668 | ) |
Morgan Stanley Capital Services LLC | | IDR | | | 4,994,798 | | | USD | | | 358 | | | | 05/05/2020 | | | | 52,712 | |
Morgan Stanley Capital Services LLC | | USD | | | 119 | | | IDR | | | 1,823,395 | | | | 05/05/2020 | | | | (7,415 | ) |
Morgan Stanley Capital Services LLC | | MYR | | | 9,816 | | | USD | | | 2,166 | | | | 08/13/2020 | | | | (105,804 | ) |
| | |
| |
| 38 | AB EMERGING MARKETS MULTI-ASSET PORTFOLIO | | abfunds.com |
PORTFOLIO OF INVESTMENTS(continued)
| | | | | | | | | | | | | | | | | | | | |
| Counterparty | | Contracts to
Deliver
(000) | | | In Exchange
For
(000) | | | Settlement
Date | | | Unrealized
Appreciation/
(Depreciation) | |
Morgan Stanley Capital Services LLC | | USD | | | 1,974 | | | MYR | | | 8,399 | | | | 08/13/2020 | | | $ | (30,087 | ) |
Morgan Stanley Capital Services LLC | | RUB | | | 25,816 | | | USD | | | 322 | | | | 05/20/2020 | | | | (6,566 | ) |
Morgan Stanley Capital Services LLC | | ZAR | | | 7,817 | | | USD | | | 516 | | | | 04/08/2020 | | | | 79,625 | |
Morgan Stanley Capital Services LLC | | KRW | | | 9,781,594 | | | USD | | | 8,252 | | | | 05/14/2020 | | | | 217,334 | |
Royal Bank of Scotland PLC | | BRL | | | 5,650 | | | USD | | | 1,087 | | | | 04/02/2020 | | | | (544 | ) |
Royal Bank of Scotland PLC | | USD | | | 1,251 | | | BRL | | | 5,650 | | | | 04/02/2020 | | | | (163,624 | ) |
Royal Bank of Scotland PLC | | INR | | | 49,715 | | | USD | | | 686 | | | | 04/23/2020 | | | | 33,407 | |
Royal Bank of Scotland PLC | | TWD | | | 34,866 | | | USD | | | 1,165 | | | | 05/21/2020 | | | | 2,548 | |
Royal Bank of Scotland PLC | | KRW | | | 847,996 | | | USD | | | 712 | | | | 05/14/2020 | | | | 15,900 | |
Royal Bank of Scotland PLC | | USD | | | 2,628 | | | KRW | | | 3,106,280 | | | | 05/14/2020 | | | | (76,350 | ) |
Standard Chartered Bank | | INR | | | 51,927 | | | USD | | | 672 | | | | 04/23/2020 | | | | (9,746 | ) |
Standard Chartered Bank | | USD | | | 4,190 | | | INR | | | 301,523 | | | | 04/23/2020 | | | | (231,408 | ) |
Standard Chartered Bank | | TWD | | | 91,982 | | | USD | | | 3,086 | | | | 05/21/2020 | | | | 20,773 | |
Standard Chartered Bank | | USD | | | 5,310 | | | TWD | | | 160,275 | | | | 05/21/2020 | | | | 31,735 | |
Standard Chartered Bank | | USD | | | 1,158 | | | PHP | | | 58,931 | | | | 05/28/2020 | | | | (14,607 | ) |
Standard Chartered Bank | | KRW | | | 1,264,256 | | | USD | | | 1,063 | | | | 05/14/2020 | | | | 24,393 | |
UBS AG | | IDR | | | 11,766,144 | | | USD | | | 829 | | | | 05/05/2020 | | | | 110,524 | |
UBS AG | | USD | | | 620 | | | IDR | | | 8,810,452 | | | | 05/05/2020 | | | | (81,876 | ) |
UBS AG | | TWD | | | 27,374 | | | USD | | | 917 | | | | 05/21/2020 | | | | 4,758 | |
UBS AG | | USD | | | 160 | | | TWD | | | 4,843 | | | | 05/21/2020 | | | | 1,663 | |
UBS AG | | PHP | | | 42,532 | | | USD | | | 836 | | | | 05/28/2020 | | | | 10,519 | |
| | | | | | | | | | | | | | | | | | | | |
| | | $ | (614,322 | ) |
| | | | | | | | | | | | | | | | | | | | |
CENTRALLY CLEARED CREDIT DEFAULT SWAPS (see Note D)
| | | | | | | | | | | | | | | | | | | | | | | | | | | | | | | | |
Description
| | Fixed
Rate
(Pay)
Receive | | | Payment
Frequency | | | Implied
Credit
Spread at
March 31,
2020 | | | Notional
Amount
(000) | | | Market
Value | | | Upfront
Premiums
Paid
(Received) | | | Unrealized
Appreciation/
(Depreciation) | |
Buy Contracts | |
South Africa Government International Bond, 5.875%, 09/16/2025, 06/20/2025* | | | (1.00 | )% | | | Quarterly | | | | 4.12 | % | | | USD | | | | 289 | | | $ | 41,506 | | | $ | 39,418 | | | $ | 2,088 | |
|
Sale Contracts | |
CDX-EM Series 33, 5 Year Index, 06/20/2025* | | | 1.00 | | | | Quarterly | | | | 3.40 | | | | USD | | | | 1,380 | | | | (153,106 | ) | | | (190,021 | ) | | | 36,915 | |
| | | | | | | | | | | | | | | | | | | | | | | | | | | | | | | | |
| | | | | | | | | | | | | | | | | | | | | | $ | (111,600 | ) | | $ | (150,603 | ) | | $ | 39,003 | |
| | | | | | | | | | | | | | | | | | | | | | | | | | | | | | | | |
| | |
| |
| abfunds.com | | AB EMERGING MARKETS MULTI-ASSET PORTFOLIO | 39 |
PORTFOLIO OF INVESTMENTS(continued)
CENTRALLY CLEARED INTEREST RATE SWAPS (see Note D)
| | | | | | | | | | | | | | | | | | | | | | |
| | | | | | Rate Type | | | | | | | | | | | |
Notional
Amount
(000) | | Termination
Date | | | Payments
made
by the
Fund | | Payments
received
by the
Fund | | Payment
Frequency
Paid/
Received | | Market
Value | | | Upfront
Premiums
Paid
(Received) | | | Unrealized
Appreciation/
(Depreciation) | |
USD 6,000 | | | 10/02/2029 | | | 3 Month
LIBOR | | 1.589% | | Quarterly/
Semi-
Annual | | $ | 508,645 | | | $ | — | | | $ | 508,645 | |
CREDIT DEFAULT SWAPS (see Note D)
| | | | | | | | | | | | | | | | | | | | | | |
Swap
Counterparty &
Referenced
Obligation | | Fixed
Rate
(Pay)
Receive | | | Payment
Frequency | | Implied
Credit
Spread at
March 31,
2020 | | Notional
Amount
(000) | | Market
Value | | | Upfront
Premiums
Paid
(Received) | | | Unrealized
Appreciation/
(Depreciation) | |
Sale Contracts | | | | | |
Morgan Stanley & Co. International PLC Ukraine International Bond, 7.75%, 09/01/2023* | | | 1.00 | % | | Quarterly | | 8.22% | | USD 56 | | $ | (16,158 | ) | | $ | (16,090 | ) | | $ | (68 | ) |
TOTAL RETURN SWAPS (see Note D)
| | | | | | | | | | | | | | | | | | | | | | |
Counterparty &
Referenced Obligation | | Rate
Paid/
Received | | Payment
Frequency | | | Current
Notional
(000) | | | Maturity
Date | | | Unrealized
Appreciation/
(Depreciation) | |
Pay Total Return on Reference Obligation | | | | | | | | | |
Citibank, NA
iShares Trust JPMorgan USD Emerging Markets Bond Fund | | LIBOR plus
0.10% | | | Maturity | | | | USD | | | | 1,547 | | | | 04/15/2020 | | | $ | (19,417 | ) |
iShares Trust JPMorgan USD Emerging Markets Bond Fund | | LIBOR plus
0.10% | | | Maturity | | | | USD | | | | 4,496 | | | | 04/15/2020 | | | | (56,432 | ) |
Receive Total Return on Reference Obligation | |
Goldman Sachs International | | | | | | | | | | | | | | | | | | | | | | |
MSCI Emerging Markets Growth | | 3 Month
LIBOR plus
0.33% | | | Maturity | | | | USD | | | | 12,465 | | | | 12/15/2020 | | | | 417,860 | |
| | | | | | | | | | | | | | | | | | | | | | |
| | | | | | | | | | | | | | | | | | | | $ | 342,011 | |
| | | | | | | | | | | | | | | | | | | | | | |
| | |
| |
| 40 | AB EMERGING MARKETS MULTI-ASSET PORTFOLIO | | abfunds.com |
PORTFOLIO OF INVESTMENTS(continued)
VARIANCE SWAPS (see Note D)
| | | | | | | | | | | | | | | | | | | | | | | | | | | | |
Swap Counterparty & Referenced Obligation | | Volatility
Strike
Rate | | | Payment
Frequency | | | Notional
Amount
(000) | | | Market
Value | | | Upfront
Premiums
(Paid)
Received | | | Unrealized
Appreciation/
(Depreciation) | |
Buy Contracts | |
JPMorgan Chase Bank, NA | | | | | | | | | | | | | | | | | | | | | | | | | | | | |
Hang Seng China Enterprises Index 06/29/2020* | | | 20.54 | % | | | Maturity | | | | HKD | | | | 39 | | | $ | 93,378 | | | $ | — | | | $ | 93,378 | |
Hang Seng China Enterprises Index 06/29/2020* | | | 20.34 | | | | Maturity | | | | HKD | | | | 54 | | | | 158,893 | | | | — | | | | 158,893 | |
Hang Seng China Enterprises Index 06/29/2020* | | | 20.94 | | | | Maturity | | | | HKD | | | | 117 | | | | 267,835 | | | | — | | | | 267,835 | |
Hang Seng China Enterprises Index 06/29/2020* | | | 21.29 | | | | Maturity | | | | HKD | | | | 115 | | | | 255,685 | | | | — | | | | 255,685 | |
|
Sale Contracts | |
JPMorgan Chase Bank, NA | | | | | | | | | | | | | | | | | | | | | | | | | | | | |
Hang Seng China Enterprises Index 06/29/2020* | | | 21.10 | | | | Maturity | | | | HKD | | | | 121 | | | | (489,645 | ) | | | — | | | | (489,645 | ) |
UBS AG | | | | | | | | | | | | | | | | | | | | | | | | | | | | |
Hang Seng China Enterprises Index 06/29/2020* | | | 21.20 | | | | Maturity | | | | HKD | | | | 101 | | | | (405,275 | ) | | | — | | | | (405,275 | ) |
| | | | | | | | | | | | | | | | | | | | | | | | | | | | |
| | | | | | | | | | | | | | | | | | $ | (119,129 | ) | | $ | — | | | $ | (119,129 | ) |
| | | | | | | | | | | | | | | | | | | | | | | | | | | | |
| (a) | Non-income producing security. |
| (b) | Security is exempt from registration under Rule 144A of the Securities Act of 1933. These securities are considered restricted, but liquid and may be resold in transactions exempt from registration, normally to qualified institutional buyers. At March 31, 2020, the aggregate market value of these securities amounted to $40,420,431 or 31.8% of net assets. |
| (d) | Represents entire or partial securities out on loan. See Note E for securities lending information. |
| | |
| |
| abfunds.com | | AB EMERGING MARKETS MULTI-ASSET PORTFOLIO | 41 |
PORTFOLIO OF INVESTMENTS(continued)
| (f) | Security is exempt from registration under Rule 144A of the Securities Act of 1933. These securities, which represent 0.11% of net assets as of March 31, 2020, are considered illiquid and restricted. Additional information regarding such securities follows: |
| | | | | | | | | | | | | | | | |
144A/Restricted &
Illiquid Securities | | Acquisition
Date | | | Cost | | | Market
Value | | | Percentage of
Net Assets | |
Digicel Group One Ltd.
8.25%, 12/30/2022 | | | 1/14/19 | | | $ | 60,676 | | | $ | 21,306 | | | | 0.02 | % |
Petroleos de Venezuela SA
9.00%, 11/17/2021 | | | 6/14/17 | | | | 185,816 | | | | 34,449 | | | | 0.03 | % |
Tonon Luxembourg SA
6.50%, 10/31/2024 | | | 5/03/19 | | | | 232,072 | | | | 3,143 | | | | 0.00 | % |
Venezuela Government International Bond
12.75%, 08/23/2022 | | | 9/05/18 | | | | 312,796 | | | | 74,574 | | | | 0.06 | % |
Virgolino de Oliveira Finance SA
11.75%, 02/09/2022 | | | 7/12/13 | | | | 172,628 | | | | 3,898 | | | | 0.00 | % |
| (g) | Security in which significant unobservable inputs (Level 3) were used in determining fair value. |
| (h) | Fair valued by the Adviser. |
| (i) | Pay-In-Kind Payments (PIK). The issuer may pay cash interest and/or interest in additional debt securities. Rates shown are the rates in effect at March 31, 2020. |
| (j) | To obtain a copy of the fund’s shareholder report, please go to the Securities and Exchange Commission’s website at www.sec.gov. Additionally, shareholder reports for AB funds can be obtained by calling AB at (800)227-4618. |
| (k) | Affiliated investments. |
| (l) | The rate shown represents the7-day yield as of period end. |
Currency Abbreviations:
| | |
RUB – Russian Ruble ARS – Argentine Peso SEK – Swedish Krona AUD – Australian Dollar SGD – Singapore Dollar BRL – Brazilian Real THB – Thailand Baht CAD – Canadian Dollar TRY – Turkish Lira CLP – Chilean Peso TWD – New Taiwan Dollar CNH – Chinese Yuan Renminbi (Offshore) UAH – Ukrainian Hryvnia COP – Colombian Peso USD – United States Dollar CZK – Czech Koruna ZAR – South African Rand | | EGP – Egyptian Pound EUR – Euro GBP – Great British Pound HKD – Hong Kong Dollar HUF – Hungarian Forint IDR – Indonesian Rupiah INR – Indian Rupee JPY – Japanese Yen KRW – South Korean Won MXN – Mexican Peso MYR – Malaysian Ringgit NOK – Norwegian Krone PEN – Peruvian Sol PHP – Philippine Peso PKR – Pakistan Rupee PLN – Polish Zloty |
| | |
| |
| 42 | AB EMERGING MARKETS MULTI-ASSET PORTFOLIO | | abfunds.com |
PORTFOLIO OF INVESTMENTS(continued)
Glossary:
ADR – American Depositary Receipt
CDX-EM – Emerging Market Credit Default Swap Index
ETF – Exchange Traded Fund
FTSE – Financial Times Stock Exchange
GDR – Global Depositary Receipt
JSC – Joint Stock Company
LIBOR – London Interbank Offered Rates
MSCI – Morgan Stanley Capital International
PJSC – Public Joint Stock Company
REIT – Real Estate Investment Trust
See notes to financial statements.
| | |
| |
| abfunds.com | | AB EMERGING MARKETS MULTI-ASSET PORTFOLIO | 43 |
STATEMENT OF ASSETS & LIABILITIES
March 31, 2020
| | | | |
| Assets | | | | |
Investments in securities, at value
Unaffiliated issuers (cost $131,792,761) | | $ | 112,251,674 | (a) |
Affiliated issuers (cost $14,463,201—including investment of cash collateral for securities loaned of $326,569) | | | 14,463,201 | |
Cash collateral due from broker | | | 3,587,487 | |
Foreign currencies, at value (cost $1,044,936) | | | 1,007,721 | |
Receivable for terminated total return swaps | | | 3,845,795 | |
Unrealized appreciation on forward currency exchange contracts | | | 3,830,889 | |
Unaffiliated dividends and interest receivable | | | 1,279,271 | |
Unrealized appreciation on variance swaps | | | 775,791 | |
Receivable for investment securities sold and foreign currency transactions | | | 730,978 | |
Unrealized appreciation on total return swaps | | | 417,860 | |
Receivable for capital stock sold | | | 318,824 | |
Receivable for newly entered credit default swaps | | | 16,099 | |
Affiliated dividends receivable | | | 8,009 | |
| | | | |
Total assets | | | 142,533,599 | |
| | | | |
| Liabilities | | | | |
Unrealized depreciation on forward currency exchange contracts | | | 4,445,211 | |
Payable for terminated total return swaps | | | 3,065,208 | |
Due to Custodian | | | 2,121,559 | |
Payable for investment securities purchased | | | 2,021,515 | |
Cash collateral received from broker | | | 1,630,000 | |
Unrealized depreciation on variance swaps | | | 894,920 | |
Payable for capital stock redeemed | | | 469,149 | |
Collateral due to Securities Lending Agent | | | 326,569 | |
Payable for variation margin on futures | | | 115,977 | |
Unrealized depreciation on total return swaps | | | 75,849 | |
Payable for variation margin on centrally cleared swaps | | | 28,758 | |
Administrative fee payable | | | 20,080 | |
Market value of credit default swaps (net premiums received $16,090) | | | 16,158 | |
Advisory fee payable | | | 7,641 | |
Transfer Agent fee payable | | | 2,580 | |
Distribution fee payable | | | 1,586 | |
Accrued expenses and other liabilities | | | 281,984 | |
| | | | |
Total liabilities | | | 15,524,744 | |
| | | | |
Net Assets | | $ | 127,008,855 | |
| | | | |
| Composition of Net Assets | | | | |
Capital stock, at par | | $ | 1,799 | |
Additionalpaid-in capital | | | 171,092,901 | |
Accumulated loss | | | (44,085,845 | ) |
| | | | |
| | $ | 127,008,855 | |
| | | | |
See notes to financial statements.
| | |
| |
| 44 | AB EMERGING MARKETS MULTI-ASSET PORTFOLIO | | abfunds.com |
STATEMENT OF ASSETS & LIABILITIES(continued)
Net Asset Value Per Share—33 billion shares of capital stock authorized, $.0001 par value
| | | | | | | | | | | | |
| Class | | Net Assets | | | Shares
Outstanding | | | Net Asset
Value | |
| |
| A | | $ | 3,039,854 | | | | 431,560 | | | $ | 7.04 | * |
| |
| C | | $ | 1,010,259 | | | | 144,099 | | | $ | 7.01 | |
| |
| Advisor | | $ | 122,321,828 | | | | 17,325,134 | | | $ | 7.06 | |
| |
| R | | $ | 270,607 | | | | 38,385 | | | $ | 7.05 | |
| |
| K | | $ | 211,773 | | | | 30,089 | | | $ | 7.04 | |
| |
| I | | $ | 10,471 | | | | 1,497 | | | $ | 6.99 | |
| |
| Z | | $ | 144,063 | | | | 20,544 | | | $ | 7.01 | |
| |
| (a) | Includes securities on loan with a value of $307,741 (see Note E). |
| * | The maximum offering price per share for Class A shares was $7.35, which reflects a sales charge of 4.25%. |
See notes to financial statements.
| | |
| |
| abfunds.com | | AB EMERGING MARKETS MULTI-ASSET PORTFOLIO | 45 |
STATEMENT OF OPERATIONS
Year Ended March 31, 2020
| | | | | | | | |
| Investment Income | | | | | | | | |
Dividends
Unaffiliated issuers (net of foreign taxes withheld of $410,964) | | $ | 3,077,072 | | | | | |
Affiliated issuers | | | 263,649 | | | | | |
Interest (net of foreign taxes withheld of $19,720) | | | 2,914,996 | | | | | |
Securities lending income | | | 15,924 | | | $ | 6,271,641 | |
| | | | | | | | |
| Expenses | | | | | | | | |
Advisory fee (see Note B) | | | 1,210,318 | | | | | |
Transfer agency—Class A | | | 2,471 | | | | | |
Transfer agency—Class C | | | 1,028 | | | | | |
Transfer agency—Advisor Class | | | 75,168 | | | | | |
Transfer agency—Class R | | | 884 | | | | | |
Transfer agency—Class K | | | 569 | | | | | |
Transfer agency—Class I | | | 16 | | | | | |
Transfer agency—Class Z | | | 92 | | | | | |
Distribution fee—Class A | | | 11,207 | | | | | |
Distribution fee—Class C | | | 18,025 | | | | | |
Distribution fee—Class R | | | 1,625 | | | | | |
Distribution fee—Class K | | | 674 | | | | | |
Custodian | | | 371,379 | | | | | |
Registration fees | | | 113,784 | | | | | |
Audit and tax | | | 100,149 | | | | | |
Administrative | | | 83,924 | | | | | |
Printing | | | 42,074 | | | | | |
Legal | | | 39,829 | | | | | |
Directors’ fees | | | 21,253 | | | | | |
Miscellaneous | | | 93,362 | | | | | |
| | | | | | | | |
Total expenses | | | 2,187,831 | | | | | |
Less: expenses waived and reimbursed by the Adviser (see Note B and Note E) | | | (757,137 | ) | | | | |
| | | | | | | | |
Net expenses | | | | | | | 1,430,694 | |
| | | | | | | | |
Net investment income | | | | | | | 4,840,947 | |
| | | | | | | | |
See notes to financial statements.
| | |
| |
| 46 | AB EMERGING MARKETS MULTI-ASSET PORTFOLIO | | abfunds.com |
STATEMENT OF OPERATIONS(continued)
| | | | | | | | |
| Realized and Unrealized Gain (Loss) on Investment and Foreign Currency Transactions | | | | | | | | |
Net realized gain (loss) on: | | | | | | | | |
Investment transactions | | | | | | $ | (7,017,412 | )(a) |
Forward currency exchange contracts | | | | | | | 3,166,417 | |
Futures | | | | | | | (3,208,964 | ) |
Options written | | | | | | | 1,903 | |
Swaps | | | | | | | 544,874 | |
Foreign currency transactions | | | | | | | (285,272 | ) |
Net change in unrealized appreciation/depreciation on: | | | | | | | | |
Investments | | | | | | | (22,354,808 | )(b) |
Forward currency exchange contracts | | | | | | | (800,766 | ) |
Futures | | | | | | | (1,277,803 | ) |
Swaps | | | | | | | 849,681 | |
Foreign currency denominated assets and liabilities | | | | | | | (46,402 | ) |
| | | | | | | | |
Net loss on investment and foreign currency transactions | | | | | | | (30,428,552 | ) |
| | | | | | | | |
Net Decrease in Net Assets from Operations | | | | | | $ | (25,587,605 | ) |
| | | | | | | | |
| (a) | Includes foreign capital gains taxes of $49,723. |
| (b) | Net of increase in accrued foreign capital gains taxes of $742. |
See notes to financial statements.
| | |
| |
| abfunds.com | | AB EMERGING MARKETS MULTI-ASSET PORTFOLIO | 47 |
STATEMENT OF CHANGES IN NET ASSETS
| | | | | | | | |
| | | Year Ended
March 31,
2020 | | | Year Ended
March 31,
2019 | |
| Increase (Decrease) in Net Assets from Operations | | | | | | | | |
Net investment income | | $ | 4,840,947 | | | $ | 4,313,682 | |
Net realized loss on investment and foreign currency transactions | | | (6,798,454 | ) | | | (8,417,772 | ) |
Net change in unrealized appreciation/depreciation on investments and foreign currency denominated assets and liabilities | | | (23,630,098 | ) | | | (5,538,354 | ) |
| | | | | | | | |
Net decrease in net assets from operations | | | (25,587,605 | ) | | | (9,642,444 | ) |
| Distributions to Shareholders | | | | | | | | |
Class A | | | (226,443 | ) | | | (395,036 | ) |
Class C | | | (77,333 | ) | | | (105,468 | ) |
Advisor Class | | | (7,507,462 | ) | | | (5,672,588 | ) |
Class R | | | (16,542 | ) | | | (11,634 | ) |
Class K | | | (13,127 | ) | | | (15,613 | ) |
Class I | | | (1,984 | ) | | | (8,285 | ) |
Class Z | | | (8,209 | ) | | | (491 | ) |
| Capital Stock Transactions | | | | | | | | |
Net increase | | | 33,436,740 | | | | 510,771 | |
| | | | | | | | |
Total decrease | | | (1,965 | ) | | | (15,340,788 | ) |
| Net Assets | | | | | | | | |
Beginning of period | | | 127,010,820 | | | | 142,351,608 | |
| | | | | | | | |
End of period | | $ | 127,008,855 | | | $ | 127,010,820 | |
| | | | | | | | |
See notes to financial statements.
| | |
| |
| 48 | AB EMERGING MARKETS MULTI-ASSET PORTFOLIO | | abfunds.com |
NOTES TO FINANCIAL STATEMENTS
March 31, 2020
NOTE A
Significant Accounting Policies
AB Cap Fund, Inc. (the “Company”), which is a Maryland corporation, is registered under the Investment Company Act of 1940 as anopen-end management investment company. The Company operates as a series company currently comprised of 28 portfolios currently in operation. Each portfolio is considered to be a separate entity for financial reporting and tax purposes. This report relates only to the AB Emerging Markets Multi-Asset Portfolio (the “Fund”), a diversified portfolio. The Fund has authorized the issuance of Class A, Class B, Class C, Advisor Class, Class R, Class K, Class I, Class Z, Class T, Class 1 and Class 2 shares. Class B, Class T, Class 1, and Class 2 shares are not currently being offered. Class A shares are sold with afront-end sales charge of up to 4.25% for purchases not exceeding $1,000,000. With respect to purchases of $1,000,000 or more, Class A shares redeemed within one year of purchase may be subject to a contingent deferred sales charge of 1%. Class C shares are subject to a contingent deferred sales charge of 1% on redemptions made within the first year after purchase, and 0% after the first year of purchase. Class C shares will automatically convert to Class A shares ten years after the end of the calendar month of purchase. Class R and Class K shares are sold without an initial or contingent deferred sales charge. Advisor Class and Class I shares are sold without an initial or contingent deferred sales charge and are not subject to ongoing distribution expenses. All eleven classes of shares have identical voting, dividend, liquidation and other rights, except that the classes bear different distribution and transfer agency expenses. Each class has exclusive voting rights with respect to its distribution plan. The financial statements have been prepared in conformity with U.S. generally accepted accounting principles (“U.S. GAAP”), which require management to make certain estimates and assumptions that affect the reported amounts of assets and liabilities in the financial statements and amounts of income and expenses during the reporting period. Actual results could differ from those estimates. The Fund is an investment company under U.S. GAAP and follows the accounting and reporting guidance applicable to investment companies. The following is a summary of significant accounting policies followed by the Fund.
1. Security Valuation
Portfolio securities are valued at their current market value determined on the basis of market quotations or, if market quotations are not readily available or are deemed unreliable, at “fair value” as determined in accordance with procedures established by and under the general supervision of the Company’s Board of Directors (the “Board”).
In general, the market values of securities which are readily available and deemed reliable are determined as follows: securities listed on a national
| | |
| |
| abfunds.com | | AB EMERGING MARKETS MULTI-ASSET PORTFOLIO | 49 |
NOTES TO FINANCIAL STATEMENTS(continued)
securities exchange (other than securities listed on the NASDAQ Stock Market, Inc. (“NASDAQ”)) or on a foreign securities exchange are valued at the last sale price at the close of the exchange or foreign securities exchange. If there has been no sale on such day, the securities are valued at the last traded price from the previous day. Securities listed on more than one exchange are valued by reference to the principal exchange on which the securities are traded; securities listed only on NASDAQ are valued in accordance with the NASDAQ Official Closing Price; listed or over the counter (“OTC”) market put or call options are valued at the mid level between the current bid and ask prices. If either a current bid or current ask price is unavailable, AllianceBernstein L.P. (the “Adviser”) will have discretion to determine the best valuation (e.g., last trade price in the case of listed options); open futures are valued using the closing settlement price or, in the absence of such a price, the most recent quoted bid price. If there are no quotations available for the day of valuation, the last available closing settlement price is used; U.S. Government securities and any other debt instruments having 60 days or less remaining until maturity are generally valued at market by an independent pricing vendor, if a market price is available. If a market price is not available, the securities are valued at amortized cost. This methodology is commonly used for short term securities that have an original maturity of 60 days or less, as well as short term securities that had an original term to maturity that exceeded 60 days. In instances when amortized cost is utilized, the Valuation Committee (the “Committee”) must reasonably conclude that the utilization of amortized cost is approximately the same as the fair value of the security. Such factors the Committee will consider include, but are not limited to, an impairment of the creditworthiness of the issuer or material changes in interest rates. Fixed-income securities, including mortgage-backed and asset-backed securities, may be valued on the basis of prices provided by a pricing service or at a price obtained from one or more of the major broker-dealers. In cases where broker-dealer quotes are obtained, the Adviser may establish procedures whereby changes in market yields or spreads are used to adjust, on a daily basis, a recently obtained quoted price on a security. Swaps and other derivatives are valued daily, primarily using independent pricing services, independent pricing models using market inputs, as well as third party broker-dealers or counterparties. Open end mutual funds are valued at the closing net asset value per share, while exchange traded funds are valued at the closing market price per share.
Securities for which market quotations are not readily available (including restricted securities) or are deemed unreliable are valued at fair value as deemed appropriate by the Adviser. Factors considered in making this determination may include, but are not limited to, information obtained by contacting the issuer, analysts, analysis of the issuer’s financial statements
| | |
| |
| 50 | AB EMERGING MARKETS MULTI-ASSET PORTFOLIO | | abfunds.com |
NOTES TO FINANCIAL STATEMENTS(continued)
or other available documents. In addition, the Fund may use fair value pricing for securities primarily traded innon-U.S. markets because most foreign markets close well before the Fund values its securities at 4:00 p.m., Eastern Time. The earlier close of these foreign markets gives rise to the possibility that significant events, including broad market moves, may have occurred in the interim and may materially affect the value of those securities. To account for this, the Fund generally values many of its foreign equity securities using fair value prices based on third party vendor modeling tools to the extent available.
2. Fair Value Measurements
In accordance with U.S. GAAP regarding fair value measurements, fair value is defined as the price that the Fund would receive to sell an asset or pay to transfer a liability in an orderly transaction between market participants at the measurement date. U.S. GAAP establishes a framework for measuring fair value, and a three-level hierarchy for fair value measurements based upon the transparency of inputs to the valuation of an asset or liability (including those valued based on their market values as described in Note A.1 above). Inputs may be observable or unobservable and refer broadly to the assumptions that market participants would use in pricing the asset or liability. Observable inputs reflect the assumptions market participants would use in pricing the asset or liability based on market data obtained from sources independent of the Fund. Unobservable inputs reflect the Fund’s own assumptions about the assumptions that market participants would use in pricing the asset or liability based on the best information available in the circumstances. Each investment is assigned a level based upon the observability of the inputs which are significant to the overall valuation. The three-tier hierarchy of inputs is summarized below.
| | • | | Level 1—quoted prices in active markets for identical investments |
| | • | | Level 2—other significant observable inputs (including quoted prices for similar investments, interest rates, prepayment speeds, credit risk, etc.) |
| | • | | Level 3—significant unobservable inputs (including the Fund’s own assumptions in determining the fair value of investments) |
The fair value of debt instruments, such as bonds, andover-the-counter derivatives is generally based on market price quotations, recently executed market transactions (where observable) or industry recognized modeling techniques and are generally classified as Level 2. Pricing vendor inputs to Level 2 valuations may include quoted prices for similar investments in active markets, interest rate curves, coupon rates, currency rates, yield curves, option adjusted spreads, default rates, credit spreads and other unique security features in order to estimate the relevant cash flows which are then discounted to calculate fair values. If these inputs are
| | |
| |
| abfunds.com | | AB EMERGING MARKETS MULTI-ASSET PORTFOLIO | 51 |
NOTES TO FINANCIAL STATEMENTS(continued)
unobservable and significant to the fair value, these investments will be classified as Level 3.
Where readily available market prices or relevant bid prices are not available for certain equity investments, such investments may be valued based on similar publicly traded investments, movements in relevant indices since last available prices or based upon underlying company fundamentals and comparable company data (such as multiples to earnings or other multiples to equity). Where an investment is valued using an observable input, such as another publicly traded security, the investment will be classified as Level 2. If management determines that an adjustment is appropriate based on restrictions on resale, illiquidity or uncertainty, and such adjustment is a significant component of the valuation, the investment will be classified as Level 3. An investment will also be classified as Level 3 where management uses company fundamentals and other significant inputs to determine the valuation.
Other fixed income investments, including non– U.S. government and corporate debt, are generally valued using quoted market prices, if available, which are typically impacted by current interest rates, maturity dates and any perceived credit risk of the issuer. Additionally, in the absence of quoted market prices, these inputs are used by pricing vendors to derive a valuation based upon industry or proprietary models which incorporate issuer specific data with relevant yield/spread comparisons with more widely quoted bonds with similar key characteristics. Those investments for which there are observable inputs are classified as Level 2. Where the inputs are not observable, the investments are classified as Level 3.
The following table summarizes the valuation of the Fund’s investments by the above fair value hierarchy levels as of March 31, 2020:
| | | | | | | | | | | | | | | | |
Investments in Securities | | Level 1 | | | Level 2 | | | Level 3 | | | Total | |
Assets: | | | | | | | | | | | | | | | | |
Common Stocks: | | | | | | | | | | | | | | | | |
Information Technology | | $ | 707,234 | | | $ | 14,152,928 | | | $ | – 0 | – | | $ | 14,860,162 | |
Financials | | | 2,336,133 | | | | 11,748,313 | | | | – 0 | – | | | 14,084,446 | |
Materials | | | – 0 | – | | | 7,627,605 | | | | – 0 | – | | | 7,627,605 | |
Consumer Discretionary | | | 4,694,010 | | | | 2,886,570 | | | | – 0 | – | | | 7,580,580 | |
Communication Services | | | 1,171,485 | | | | 2,931,373 | | | | – 0 | – | | | 4,102,858 | |
Industrials | | | 394,369 | | | | 3,532,217 | | | | – 0 | – | | | 3,926,586 | |
Energy | | | 2,184,559 | | | | 592,958 | | | | – 0 | – | | | 2,777,517 | |
Consumer Staples | | | 132,385 | | | | 2,295,290 | | | | – 0 | – | | | 2,427,675 | |
Real Estate | | | 534,288 | | | | 1,668,519 | | | | – 0 | – | | | 2,202,807 | |
Health Care | | | 73,668 | | | | 1,579,012 | | | | – 0 | – | | | 1,652,680 | |
Utilities | | | 1,127,504 | | | | 194,420 | | | | – 0 | – | | | 1,321,924 | |
| | |
| |
| 52 | AB EMERGING MARKETS MULTI-ASSET PORTFOLIO | | abfunds.com |
NOTES TO FINANCIAL STATEMENTS(continued)
| | | | | | | | | | | | | | | | |
Investments in Securities | | Level 1 | | | Level 2 | | | Level 3 | | | Total | |
Fixed Income Securities: | | | | | | | | | | | | | | | | |
Sovereign Bonds | | $ | – 0 | – | | $ | 27,429,634 | | | $ | – 0 | – | | $ | 27,429,634 | |
Corporate Bonds | | | – 0 | – | | | 9,189,914 | | | | 3,143 | | | | 9,193,057 | |
Quasi–Sovereign Bonds | | | – 0 | – | | | 8,581,363 | | | | – 0 | – | | | 8,581,363 | |
Treasury Bonds | | | – 0 | – | | | 2,099,442 | | | | – 0 | – | | | 2,099,442 | |
Governments—Sovereign Bonds | | | – 0 | – | | | 375,000 | | | | – 0 | – | | | 375,000 | |
Emerging Markets—Treasuries | | | – 0 | – | | | 252,101 | | | | – 0 | – | | | 252,101 | |
Regional Bonds | | | – 0 | – | | | 41,480 | | | | – 0 | – | | | 41,480 | |
Equity Linked Notes | | | – 0 | – | | | 613,382 | | | | – 0 | – | | | 613,382 | |
Investment Companies | | | – 0 | – | | | 107,864 | | | | – 0 | – | | | 107,864 | |
Short–Term Investments: | | | | | | | | | | | | | | | | |
Investment Companies | | | 14,136,632 | | | | – 0 | – | | | – 0 | – | | | 14,136,632 | |
Time Deposits | | | – 0 | – | | | 357,471 | | | | – 0 | – | | | 357,471 | |
Treasury Bills | | | – 0 | – | | | 324,839 | | | | – 0 | – | | | 324,839 | |
Treasury Bonds | | | – 0 | – | | | – 0 | – | | | 311,201 | | | | 311,201 | |
Investments of Cash Collateral for Securities Loaned in Affiliated Money Market Fund | | | 326,569 | | | | – 0 | – | | | – 0 | – | | | 326,569 | |
| | | | | | | | | | | | | | | | |
Total Investments in Securities | | | 27,818,836 | | | | 98,581,695 | + | | | 314,344 | | | | 126,714,875 | |
Other Financial Instruments*: | | | | | | | | | | | | | | | | |
Assets | | | | | | | | | | | | | | | | |
Futures | | | – 0 | – | | | 2,900 | | | | – 0 | – | | | 2,900 | † |
Forward Currency Exchange Contracts | | | – 0 | – | | | 3,830,889 | | | | – 0 | – | | | 3,830,889 | |
Centrally Cleared Credit Default Swaps | | | – 0 | – | | | 41,506 | | | | – 0 | – | | | 41,506 | † |
Centrally Cleared Interest Rate Swaps | | | – 0 | – | | | 508,645 | | | | – 0 | – | | | 508,645 | † |
Total Return Swaps | | | – 0 | – | | | 417,860 | | | | – 0 | – | | | 417,860 | |
Variance Swaps | | | – 0 | – | | | 775,791 | | | | – 0 | – | | | 775,791 | |
Liabilities | | | | | | | | | | | | | | | | |
Futures | | | (825,989 | ) | | | – 0 | – | | | – 0 | – | | | (825,989 | )† |
Forward Currency Exchange Contracts | | | – 0 | – | | | (4,445,211 | ) | | | – 0 | – | | | (4,445,211 | ) |
Centrally Cleared Credit Default Swaps | | | – 0 | – | | | (153,106 | ) | | | – 0 | – | | | (153,106 | )† |
Credit Default Swaps | | | – 0 | – | | | (16,158 | ) | | | – 0 | – | | | (16,158 | ) |
Total Return Swaps | | | – 0 | – | | | (75,849 | ) | | | – 0 | – | | | (75,849 | ) |
Variance Swaps | | | – 0 | – | | | (894,920 | ) | | | – 0 | – | | | (894,920 | ) |
| | | | | | | | | | | | | | | | |
Total | | $ | 26,992,847 | | | $ | 98,574,042 | | | $ | 314,344 | | | $ | 125,881,233 | |
| | | | | | | | | | | | | | | | |
| * | Other financial instruments are derivative instruments, such as futures, forwards and swaps, which are valued at the unrealized appreciation/(depreciation) on the instrument. Other financial instruments may also include swaps with upfront premiums, options written and swaptions written which are valued at market value. |
| + | A significant portion of the Fund’s foreign equity investments are categorized as Level 2 investments since they are valued using fair value prices based on third party vendor modeling tools to the extent available, see Note A.1. |
| † | Only variation margin receivable/payable at period end is reported within the statement of assets and liabilities. This amount reflects cumulative unrealized appreciation/(depreciation) on futures and centrally cleared swaps as reported in the portfolio of investments. Where applicable, centrally cleared swaps with upfront premiums are presented here at market value. |
| | |
| |
| abfunds.com | | AB EMERGING MARKETS MULTI-ASSET PORTFOLIO | 53 |
NOTES TO FINANCIAL STATEMENTS(continued)
3. Currency Translation
Assets and liabilities denominated in foreign currencies and commitments under forward currency exchange contracts are translated into U.S. dollars at the mean of the quoted bid and ask prices of such currencies against the U.S. dollar. Purchases and sales of portfolio securities are translated into U.S. dollars at the rates of exchange prevailing when such securities were acquired or sold. Income and expenses are translated into U.S. dollars at the rates of exchange prevailing when accrued.
Net realized gain or loss on foreign currency transactions represents foreign exchange gains and losses from sales and maturities of foreign fixed income investments, holding of foreign currencies, currency gains or losses realized between the trade and settlement dates on foreign investment transactions, and the difference between the amounts of dividends, interest and foreign withholding taxes recorded on the Fund’s books and the U.S. dollar equivalent amounts actually received or paid. Net unrealized currency gains and losses from valuing foreign currency denominated assets and liabilities at period end exchange rates are reflected as a component of net unrealized appreciation or depreciation of foreign currency denominated assets and liabilities.
4. Taxes
It is the Fund’s policy to meet the requirements of the Internal Revenue Code applicable to regulated investment companies and to distribute all of its investment company taxable income and net realized gains, if any, to shareholders. Therefore, no provisions for federal income or excise taxes are required. The Fund may be subject to taxes imposed by countries in which it invests. Such taxes are generally based on income and/or capital gains earned or repatriated. Taxes are accrued and applied to net investment income, net realized gains and net unrealized appreciation/depreciation as such income and/or gains are earned.
In accordance with U.S. GAAP requirements regarding accounting for uncertainties in income taxes, management has analyzed the Fund’s tax positions taken or expected to be taken on federal and state income tax returns for all open tax years (the current and the prior three tax years) and has concluded that no provision for income tax is required in the Fund’s financial statements.
5. Investment Income and Investment Transactions
Dividend income is recorded on theex-dividend date or as soon as the Fund is informed of the dividend. Interest income is accrued daily. Investment transactions are accounted for on the date the securities are purchased or sold. Investment gains or losses are determined on the identified cost basis. The Fund amortizes premiums and accretes discounts as adjustments to interest income.
| | |
| |
| 54 | AB EMERGING MARKETS MULTI-ASSET PORTFOLIO | | abfunds.com |
NOTES TO FINANCIAL STATEMENTS(continued)
6. Class Allocations
All income earned and expenses incurred by the Fund are borne on apro-rata basis by each outstanding class of shares, based on the proportionate interest in the Fund represented by the net assets of such class, except for class specific expenses which are allocated to the respective class. Expenses of the Company are charged proportionately to each portfolio or based on other appropriate methods. Realized and unrealized gains and losses are allocated among the various share classes based on respective net assets.
7. Dividends and Distributions
Dividends and distributions to shareholders, if any, are recorded on theex-dividend date. Income dividends and capital gains distributions are determined in accordance with federal tax regulations and may differ from those determined in accordance with U.S. GAAP. To the extent these differences are permanent, such amounts are reclassified within the capital accounts based on their federal tax basis treatment; temporary differences do not require such reclassification.
NOTE B
Advisory Fee and Other Transactions with Affiliates
Under the terms of the investment advisory agreement, the Fund pays the Adviser an advisory fee at an annual rate of .85% of the first $1 billion, .80% of the next $1 billion, .75% of the next $1 billion and .70% in excess of $3 billion of the Fund’s average daily net assets. Prior to February 3, 2017, the Fund paid the Adviser at an annual rate of 1% of the first $1 billion, .95% of the next $1 billion, .90% of the next $1 billion and .85% in excess of $3 billion of the Fund’s average daily net assets. The fee is accrued daily and paid monthly. The Adviser has agreed to reimburse its fees and bear certain expenses to the extent necessary to limit total operating expenses on an annual basis (“the Expense Caps”) to 1.24%, 1.99%, .99%, 1.49%, 1.24%, .99% and .99% of the daily average net assets for the Class A, Class C, Advisor Class, Class R, Class K, Class I and Class Z shares, respectively. For the year ended March 31, 2020, such waiver/reimbursement amounted to $744,300. The Expense Caps may not be terminated before July 31, 2020.
Pursuant to the investment advisory agreement, the Fund may reimburse the Adviser for certain legal and accounting services provided to the Fund by the Adviser. For the year ended March 31, 2020, the reimbursement for such services amounted to $83,924.
The Fund compensates AllianceBernstein Investor Services, Inc. (“ABIS”), a wholly-owned subsidiary of the Adviser, under a Transfer Agency Agreement for providing personnel and facilities to perform transfer agency
| | |
| |
| abfunds.com | | AB EMERGING MARKETS MULTI-ASSET PORTFOLIO | 55 |
NOTES TO FINANCIAL STATEMENTS(continued)
services for the Fund. ABIS may make payments to intermediaries that provide omnibus account services,sub-accounting services and/or networking services. The compensation retained by ABIS amounted to $27,050 for the year ended March 31, 2020.
AllianceBernstein Investments, Inc. (the “Distributor”), a wholly-owned subsidiary of the Adviser, serves as the distributor of the Fund’s shares. The Distributor has advised the Fund that it has retainedfront-end sales charges of $176 from the sale of Class A shares and received $32 and $2,267 in contingent deferred sales charges imposed upon redemption by shareholders of Class A and Class C shares, respectively, for the year ended March 31, 2020.
The Fund may invest in AB Government Money Market Portfolio (the “Government Money Market Portfolio”) which has a contractual annual advisory fee rate of .20% of the portfolio’s average daily net assets and bears its own expenses. The Adviser has contractually agreed to waive .10% of the advisory fee of Government Money Market Portfolio (resulting in a net advisory fee of .10%) until August 31, 2020. In connection with the investment by the Fund in Government Money Market Portfolio, the Adviser has contractually agreed to waive its advisory fee from the Fund in an amount equal to the Fund’s pro rata share of the effective advisory fee of Government Money Market Portfolio, as borne indirectly by the Fund as an acquired fund fee and expense. For the year ended March 31, 2020, such waiver amounted to $12,644.
A summary of the Fund’s transactions in AB mutual funds for the year ended March 31, 2020 is as follows:
| | | | | | | | | | | | | | | | | | | | |
| | | | | | | | | | | | | | | Distributions | |
Fund | | Market Value
3/31/19
(000) | | | Purchases
at Cost
(000) | | | Sales
Proceeds
(000) | | | Market Value
3/31/20
(000) | | | Dividend
Income
(000) | |
Government
Money
Market
Portfolio | | $ | 19,689 | | | $ | 92,145 | | | $ | 97,697 | | | $ | 14,137 | | | $ | 256 | |
Government
Money
Market
Portfolio* | | | 755 | | | | 17,511 | | | | 17,940 | | | | 326 | | | | 8 | |
| | | | | | | | | | | | | | | | | | | | |
| Total | | | | | | | | | | | | | | $ | 14,463 | | | $ | 264 | |
| | | | | | | | | | | | | | | | | | | | |
| * | Investment of cash collateral for securities lending transactions (see Note E). |
During the second quarter of 2018, AXA S.A. (“AXA”), a French holding company for the AXA Group, completed the sale of a minority stake in its
| | |
| |
| 56 | AB EMERGING MARKETS MULTI-ASSET PORTFOLIO | | abfunds.com |
NOTES TO FINANCIAL STATEMENTS(continued)
subsidiary, AXA Equitable Holdings, Inc. (now named Equitable Holdings, Inc.)(“Equitable”), through an initial public offering. Equitable is the holding company for a diverse group of financial services companies, including an approximately 64.9% economic interest in the Adviser and a 100% interest in AllianceBernstein Corporation, the general partner of the Adviser. Since the initial sale, AXA has completed additional offerings, most recently during the fourth quarter of 2019. As a result, AXA currently owns less than 10% of the outstanding shares of common stock of Equitable, and no longer owns a controlling interest in Equitable. AXA previously announced its intention to sell its entire interest in Equitable over time, subject to market conditions and other factors (the “Plan”). Most of AXA’s remaining Equitable shares are to be delivered on redemption of AXA bonds mandatorily exchangeable into Equitable shares and maturing in May 2021. AXA retains sole discretion to determine the timing of any future sales of its remaining shares of Equitable common stock.
Sales under the Plan that were completed on November 13, 2019 resulted in the indirect transfer of a “controlling block” of voting securities of the Adviser (a “Change of Control Event”) and may have been deemed to have been an “assignment” causing a termination of the Fund’s investment advisory and administration agreements. In order to ensure that investment advisory and administration services could continue uninterrupted in the event of a Change of Control Event, the Board previously approved new investment advisory and administration agreements with the Adviser, and shareholders of the Fund subsequently approved the new investment advisory agreement. These agreements became effective on November 13, 2019.
NOTE C
Distribution Services Agreement
The Fund has adopted a Distribution Services Agreement (the “Agreement”) pursuant to Rule12b-1 under the Investment Company Act of 1940. Under the Agreement the Fund pays distribution and servicing fees to the Distributor at an annual rate of up to .30% of the Fund’s average daily net assets attributable to Class A shares, 1% of the Fund’s average daily net assets attributable to Class C shares, .50% of the Fund’s average daily net assets attributable to Class R shares and .25% of the Fund’s average daily net assets attributable to Class K shares. Payments under the Agreement in respect of Class A shares are currently limited to an annual rate of .25% of Class A share’s average daily net assets. There are no distribution and servicing fees on Advisor Class and Class I shares. The fees are accrued daily and paid monthly. The Agreement provides that the Distributor will use such payments in their entirety for distribution assistance and promotional activities. Since the commencement of the Fund’s operation, the Distributor has incurred expenses in excess of the distribution costs reimbursed by the Fund in the amounts of $6,648, $807
| | |
| |
| abfunds.com | | AB EMERGING MARKETS MULTI-ASSET PORTFOLIO | 57 |
NOTES TO FINANCIAL STATEMENTS(continued)
and $1,872 for Class C, Class K and Class R shares, respectively. While such costs may be recovered from the Fund in future periods so long as the Agreement is in effect, the rate of the distribution and servicing fees payable under the Agreement may not be increased without a shareholder vote. In accordance with the Agreement, there is no provision for recovery of unreimbursed distribution costs, incurred by the Distributor, beyond the current fiscal period for Class A shares. The Agreement also provides that the Adviser may use its own resources to finance the distribution of the Fund’s shares.
NOTE D
Investment Transactions
Purchases and sales of investment securities (excluding short-term investments) for the year ended March 31, 2020, were as follows:
| | | | | | | | |
| | | Purchases | | | Sales | |
Investment securities (excluding U.S. government securities) | | $ | 177,732,690 | | | $ | 139,561,267 | |
U.S. government securities | | | 3,826,689 | | | | 4,016,812 | |
The cost of investments for federal income tax purposes, gross unrealized appreciation and unrealized depreciation are as follows:
| | | | |
Cost | | $ | 151,833,898 | |
| | | | |
Gross unrealized appreciation | | $ | 8,869,245 | |
Gross unrealized depreciation | | | (34,005,206 | ) |
| | | | |
Net unrealized depreciation | | $ | (25,135,961 | ) |
| | | | |
1. Derivative Financial Instruments
The Fund may use derivatives in an effort to earn income and enhance returns, to replace more traditional direct investments, to obtain exposure to otherwise inaccessible markets (collectively, “investment purposes”), or to hedge or adjust the risk profile of its portfolio.
The principal types of derivatives utilized by the Fund, as well as the methods in which they may be used are:
| | • | | Forward Currency Exchange Contracts |
The Fund may enter into forward currency exchange contracts in order to hedge its exposure to changes in foreign currency exchange rates on its foreign portfolio holdings, to hedge certain firm purchase and sale commitments denominated in foreign currencies and fornon-hedging purposes as a means of making direct investments in foreign currencies, as described below under “Currency Transactions”.
| | |
| |
| 58 | AB EMERGING MARKETS MULTI-ASSET PORTFOLIO | | abfunds.com |
NOTES TO FINANCIAL STATEMENTS(continued)
A forward currency exchange contract is a commitment to purchase or sell a foreign currency at a future date at a negotiated forward rate. The gain or loss arising from the difference between the original contract and the closing of such contract would be included in net realized gain or loss on forward currency exchange contracts. Fluctuations in the value of open forward currency exchange contracts are recorded for financial reporting purposes as unrealized appreciation and/or depreciation by the Fund. Risks may arise from the potential inability of a counterparty to meet the terms of a contract and from unanticipated movements in the value of a foreign currency relative to the U.S. dollar.
During the year ended March 31, 2020, the Fund held forward currency exchange contracts for hedging andnon-hedging purposes.
The Fund may buy or sell futures for investment purposes or for the purpose of hedging its portfolio against adverse effects of potential movements in the market. The Fund bears the market risk that arises from changes in the value of these instruments and the imperfect correlation between movements in the price of the futures and movements in the price of the assets, reference rates or indices which they are designed to track. Among other things, the Fund may purchase or sell futures for foreign currencies or options thereon fornon-hedging purposes as a means of making direct investment in foreign currencies, as described below under “Currency Transactions”.
At the time the Fund enters into futures, the Fund deposits and maintains as collateral an initial margin with the broker, as required by the exchange on which the transaction is effected. Such amount is shown as cash collateral due from broker on the statement of assets and liabilities. Pursuant to the contract, the Fund agrees to receive from or pay to the broker an amount of cash equal to the daily fluctuation in the value of the contract. Such receipts or payments are known as variation margin and are recorded by the Fund as unrealized gains or losses. Risks may arise from the potential inability of a counterparty to meet the terms of the contract. The credit/counterparty risk for exchange-traded futures is generally less than privately negotiated futures, since the clearinghouse, which is the issuer or counterparty to each exchange-traded future, has robust risk mitigation standards, including the requirement to provide initial and variation margin. When the contract is closed, the Fund records a realized gain or loss equal to the difference between the value of the contract at the time it was opened and the time it was closed.
| | |
| |
| abfunds.com | | AB EMERGING MARKETS MULTI-ASSET PORTFOLIO | 59 |
NOTES TO FINANCIAL STATEMENTS(continued)
Use of long futures subjects the Fund to risk of loss in excess of the amounts shown on the statement of assets and liabilities, up to the notional value of the futures. Use of short futures subjects the Fund to unlimited risk of loss. Under some circumstances, futures exchanges may establish daily limits on the amount that the price of futures can vary from the previous day’s settlement price, which could effectively prevent liquidation of unfavorable positions.
During the year ended March 31, 2020, the Fund held futures for hedging andnon-hedging purposes.
For hedging and investment purposes, the Fund may purchase and write (sell) put and call options on U.S. and foreign securities, including government securities, and foreign currencies that are traded on U.S. and foreign securities exchanges andover-the-counter markets. Among other things, the Fund may use options transactions fornon-hedging purposes as a means of making direct investments in foreign currencies, as described below under “Currency Transactions” and may use options strategies involving the purchase and/or writing of various combinations of call and/or put options, for hedging and investment purposes.
The risk associated with purchasing an option is that the Fund pays a premium whether or not the option is exercised. Additionally, the Fund bears the risk of loss of the premium and change in market value should the counterparty not perform under the contract. If a put or call option purchased by the Fund were permitted to expire without being sold or exercised, its premium would represent a loss to the Fund. Put and call options purchased are accounted for in the same manner as portfolio securities. The cost of securities acquired through the exercise of call options is increased by premiums paid. The proceeds from securities sold through the exercise of put options are decreased by the premiums paid.
When the Fund writes an option, the premium received by the Fund is recorded as a liability and is subsequently adjusted to the current market value of the option written. The Fund’s maximum payment for written put options equates to the number of shares multiplied by the strike price. In certain circumstances maximum payout amounts may be partially offset by recovery values of the respective referenced assets and upfront premium received upon entering into the contract. Premiums received from written options which expire unexercised are recorded by the Fund on the expiration date as realized gains from options written. The difference between the premium received and the amount paid on effecting a closing purchase transaction, including brokerage commissions, is also treated as a realized gain, or if the
| | |
| |
| 60 | AB EMERGING MARKETS MULTI-ASSET PORTFOLIO | | abfunds.com |
NOTES TO FINANCIAL STATEMENTS(continued)
premium received is less than the amount paid for the closing purchase transaction, as a realized loss. If a call option is exercised, the premium received is added to the proceeds from the sale of the underlying security or currency in determining whether the Fund has realized a gain or loss. If a put option is exercised, the premium received reduces the cost basis of the security or currency purchased by the Fund. In writing an option, the Fund bears the market risk of an unfavorable change in the price of the security or currency underlying the written option. Exercise of an option written by the Fund could result in the Fund selling or buying a security or currency at a price different from the current market value.
The Fund may also invest in options on swap agreements, also called “swaptions”. A swaption is an option that gives the buyer the right, but not the obligation, to enter into a swap on a future date in exchange for paying a market-based “premium”. A receiver swaption gives the owner the right to receive the total return of a specified asset, reference rate, or index. A payer swaption gives the owner the right to pay the total return of a specified asset, reference rate, or index. Swaptions also include options that allow an existing swap to be terminated or extended by one of the counterparties. The Fund’s maximum payment for written put swaptions equates to the notional amount of the underlying swap. In certain circumstances maximum payout amounts may be partially offset by recovery values of the respective referenced assets and upfront premium received upon entering into the contract.
During the year ended March 31, 2020, the Fund held purchased options for hedging andnon-hedging purposes.
During the year ended March 31, 2020, the Fund held written options for hedging andnon-hedging purposes.
The Fund may enter into swaps to hedge its exposure to interest rates, credit risk or currencies. The Fund may also enter into swaps fornon-hedging purposes as a means of gaining market exposures including by making direct investments in foreign currencies, as described below under “Currency Transactions” or in order to take a “long” or “short” position with respect to an underlying referenced asset described below under “Total Return Swaps”. A swap is an agreement that obligates two parties to exchange a series of cash flows at specified intervals based upon or calculated by reference to changes in specified prices or rates for a specified amount of an underlying asset. The payment flows are usually netted against each other, with the difference being paid by one party to the other. In addition, collateral may be pledged or received by the Fund in
| | |
| |
| abfunds.com | | AB EMERGING MARKETS MULTI-ASSET PORTFOLIO | 61 |
NOTES TO FINANCIAL STATEMENTS(continued)
accordance with the terms of the respective swaps to provide value and recourse to the Fund or its counterparties in the event of default, bankruptcy or insolvency by one of the parties to the swap.
Risks may arise as a result of the failure of the counterparty to the swap to comply with the terms of the swap. The loss incurred by the failure of a counterparty is generally limited to the net interim payment to be received by the Fund, and/or the termination value at the end of the contract. Therefore, the Fund considers the creditworthiness of each counterparty to a swap in evaluating potential counterparty risk. This risk is mitigated by having a netting arrangement between the Fund and the counterparty and by the posting of collateral by the counterparty to the Fund to cover the Fund’s exposure to the counterparty. Additionally, risks may arise from unanticipated movements in interest rates or in the value of the underlying securities. The Fund accrues for the interim payments on swaps on a daily basis, with the net amount recorded within unrealized appreciation/depreciation of swaps on the statement of assets and liabilities, where applicable. Once the interim payments are settled in cash, the net amount is recorded as realized gain/(loss) on swaps on the statement of operations, in addition to any realized gain/(loss) recorded upon the termination of swaps. Upfront premiums paid or received for OTC swaps are recognized as cost or proceeds on the statement of assets and liabilities and are amortized on a straight line basis over the life of the contract. Amortized upfront premiums are included in net realized gain/(loss) from swaps on the statement of operations. Fluctuations in the value of swaps are recorded as a component of net change in unrealized appreciation/depreciation of swaps on the statement of operations.
Certain standardized swaps, including certain interest rate swaps and credit default swaps, are (or soon will be) subject to mandatory central clearing. Cleared swaps are transacted through futures commission merchants (“FCMs”) that are members of central clearinghouses, with the clearinghouse serving as central counterparty, similar to transactions in futures contracts. Centralized clearing will be required for additional categories of swaps on aphased-in basis based on requirements published by the Securities and Exchange Commission and Commodity Futures Trading Commission.
At the time the Fund enters into a centrally cleared swap, the Fund deposits and maintains as collateral an initial margin with the broker, as required by the clearinghouse on which the transaction is effected.
| | |
| |
| 62 | AB EMERGING MARKETS MULTI-ASSET PORTFOLIO | | abfunds.com |
NOTES TO FINANCIAL STATEMENTS(continued)
Such amount is shown as cash collateral due from broker on the statement of assets and liabilities. Pursuant to the contract, the Fund agrees to receive from or pay to the broker an amount of cash equal to the daily fluctuation in the value of the contract. Such receipts or payments are known as variation margin and are recorded by the Fund as unrealized gains or losses. Risks may arise from the potential inability of a counterparty to meet the terms of the contract. The credit/counterparty risk for centrally cleared swaps is generally less thannon-centrally cleared swaps, since the clearinghouse, which is the issuer or counterparty to each centrally cleared swap, has robust risk mitigation standards, including the requirement to provide initial and variation margin. When the contract is closed, the Fund records a realized gain or loss equal to the difference between the value of the contract at the time it was opened and the time it was closed.
Interest Rate Swaps:
The Fund is subject to interest rate risk exposure in the normal course of pursuing its investment objectives. Because the Fund holds fixed rate bonds, the value of these bonds may decrease if interest rates rise. To help hedge against this risk and to maintain its ability to generate income at prevailing market rates, the Fund may enter into interest rate swaps. Interest rate swaps are agreements between two parties to exchange cash flows based on a notional amount. The Fund may elect to pay a fixed rate and receive a floating rate, or, receive a fixed rate and pay a floating rate on a notional amount.
In addition, the Fund may also enter into interest rate swap transactions to preserve a return or spread on a particular investment or portion of its portfolio, or protecting against an increase in the price of securities the Fund anticipates purchasing at a later date. Interest rate swaps involve the exchange by a Fund with another party of their respective commitments to pay or receive interest (e.g., an exchange of floating rate payments for fixed rate payments) computed based on a contractually-based principal (or “notional”) amount. Interest rate swaps are entered into on a net basis (i.e., the two payment streams are netted out, with the Fund receiving or paying, as the case may be, only the net amount of the two payments).
During the year ended March 31, 2020, the Fund held interest rate swaps for hedging andnon-hedging purposes.
Credit Default Swaps:
The Fund may enter into credit default swaps, including to manage its exposure to the market or certain sectors of the market, to reduce its risk exposure to defaults by corporate and sovereign issuers held by the Fund, or to create exposure to corporate or sovereign issuers to which it is not otherwise exposed. The Fund may purchase credit
| | |
| |
| abfunds.com | | AB EMERGING MARKETS MULTI-ASSET PORTFOLIO | 63 |
NOTES TO FINANCIAL STATEMENTS(continued)
protection (“Buy Contract”) or provide credit protection (“Sale Contract”) on the referenced obligation of the credit default swap. During the term of the swap, the Fund receives/(pays) fixed payments from/(to) the respective counterparty, calculated at the agreed upon rate applied to the notional amount. If the Fund is a buyer/(seller) of protection and a credit event occurs, as defined under the terms of the swap, the Fund will either (i) receive from the seller/(pay to the buyer) of protection an amount equal to the notional amount of the swap (the “Maximum Payout Amount”) and deliver/(take delivery of) the referenced obligation or (ii) receive/(pay) a net settlement amount in the form of cash or securities equal to the notional amount of the swap less the recovery value of the referenced obligation. In certain circumstances Maximum Payout Amounts may be partially offset by recovery values of the respective referenced obligations, upfront premium received upon entering into the agreement, or net amounts received from settlement of buy protection credit default swaps entered into by the Fund for the same referenced obligation with the same counterparty.
Credit default swaps may involve greater risks than if the Fund had invested in the referenced obligation directly. Credit default swaps are subject to general market risk, liquidity risk, counterparty risk and credit risk. If the Fund is a buyer of protection and no credit event occurs, it will lose the payments it made to its counterparty. If the Fund is a seller of protection and a credit event occurs, the value of the referenced obligation received by the Fund coupled with the periodic payments previously received may be less than the Maximum Payout Amount it pays to the buyer, resulting in a net loss to the Fund.
Implied credit spreads over U.S. Treasuries of comparable maturity utilized in determining the market value of credit default swaps on issuers as of period end are disclosed in the portfolio of investments. The implied spreads serve as an indicator of the current status of the payment/performance risk and typically reflect the likelihood of default by the issuer of the referenced obligation. The implied credit spread of a particular reference obligation also reflects the cost of buying/selling protection and may reflect upfront payments required to be made to enter into the agreement. Widening credit spreads typically represent a deterioration of the referenced obligation’s credit soundness and greater likelihood of default or other credit event occurring as defined under the terms of the agreement. A credit spread identified as “Defaulted” indicates a credit event has occurred for the referenced obligation.
| | |
| |
| 64 | AB EMERGING MARKETS MULTI-ASSET PORTFOLIO | | abfunds.com |
NOTES TO FINANCIAL STATEMENTS(continued)
During the year ended March 31, 2020, the Fund held credit default swaps for hedging andnon-hedging purposes.
Total Return Swaps:
The Fund may enter into total return swaps in order to take a “long” or “short” position with respect to an underlying referenced asset. The Fund is subject to market price volatility of the underlying referenced asset. A total return swap involves commitments to pay interest in exchange for a market linked return based on a notional amount. To the extent that the total return of the security, group of securities or index underlying the transaction exceeds or falls short of the offsetting interest obligation, the Fund will receive a payment from or make a payment to the counterparty.
During the year ended March 31, 2020, the Fund held total return swaps for hedging andnon-hedging purposes.
Variance Swaps:
The Fund may enter into variance swaps to hedge equity market risk or adjust exposure to the equity markets. Variance swaps are contracts in which two parties agree to exchange cash payments based on the difference between the stated level of variance and the actual variance realized on underlying asset(s) or index(es). Actual “variance” as used here is defined as the sum of the square of the returns on the reference asset(s) or index(es) (which in effect is a measure of its “volatility”) over the length of the contract term. So the parties to a variance swap can be said to exchange actual volatility for a contractually stated rate of volatility.
During the year ended March 31, 2020, the Fund held variance swaps for hedging andnon-hedging purposes.
The Fund typically enters into International Swaps and Derivatives Association, Inc. Master Agreements (“ISDA Master Agreement”) with its OTC derivative contract counterparties in order to, among other things, reduce its credit risk to OTC counterparties. ISDA Master Agreements include provisions for general obligations, representations, collateral and events of default or termination. Under an ISDA Master Agreement, the Fund typically may offset with the OTC counterparty certain derivative financial instruments’ payables and/or receivables with collateral held and/or posted and create one single net payment(close-out netting) in the event of default or termination. In the event of a default by an OTC counterparty, the return of collateral with market value in excess of the Fund’s net liability, held by the defaulting party, may be delayed or denied.
The Fund’s ISDA Master Agreements may contain provisions for early termination of OTC derivative transactions in the event the net assets of
| | |
| |
| abfunds.com | | AB EMERGING MARKETS MULTI-ASSET PORTFOLIO | 65 |
NOTES TO FINANCIAL STATEMENTS(continued)
the Fund decline below specific levels (“net asset contingent features”). If these levels are triggered, the Fund’s OTC counterparty has the right to terminate such transaction and require the Fund to pay or receive a settlement amount in connection with the terminated transaction. If OTC derivatives were held at period end, please refer to netting arrangements by the OTC counterparty tables below for additional details.
During the year ended March 31, 2020 the Fund had entered into the following derivatives:
| | | | | | | | | | | | |
| | | Asset Derivatives | | | Liability Derivatives | |
Derivative Type | | Statement of
Assets and
Liabilities
Location | | Fair Value | | | Statement of
Assets and
Liabilities
Location | | Fair Value | |
Interest rate
contracts | | Receivable for variation margin on centrally cleared swaps | | $ | 508,645 | * | | | | | | |
| | | | |
Interest rate
contracts | | | | | | | | Unrealized depreciation on total return swaps | | $ | 75,849 | |
| | | | |
Foreign currency
contracts | | Unrealized appreciation on forward currency exchange contracts | | | 3,830,889 | | | Unrealized depreciation on forward currency exchange contracts | | | 4,445,211 | |
| | | | |
Credit contracts | | | | | | | | Market value of credit default swaps | | | 16,158 | |
| | | | |
Credit contracts | | Receivable for variation margin on centrally cleared swaps | | | 39,003 | * | | | | | | |
| | | | |
Equity contracts | | Unrealized appreciation on total return swaps | | | 417,860 | | | | | | | |
| | | | |
Equity contracts | | Unrealized appreciation on variance swaps | | | 775,791 | | | Unrealized depreciation on variance swaps | | | 894,920 | |
| | | | |
Equity contracts | | Receivable/Payable for variation margin
on futures | | | 2,900 | * | | Receivable/Payable for variation margin on futures | | | 825,989 | * |
| | | | | | | | | | | | |
Total | | | | $ | 5,575,088 | | | | | $ | 6,258,127 | |
| | | | | | | | | | | | |
| * | Only variation margin receivable/payable at period end is reported within the statement of assets and liabilities. This amount reflects cumulative unrealized appreciation/depreciation on futures and centrally cleared swaps as reported in the portfolio of investments. |
| | |
| |
| 66 | AB EMERGING MARKETS MULTI-ASSET PORTFOLIO | | abfunds.com |
NOTES TO FINANCIAL STATEMENTS(continued)
| | | | | | | | | | |
Derivative Type | | Location of Gain or
(Loss) on Derivatives
Within Statement of
Operations | | Realized Gain
or (Loss) on
Derivatives | | | Change in
Unrealized
Appreciation or
(Depreciation) | |
Interest rate
contracts | |
Net realized gain/(loss) on swaps; Net change in unrealized appreciation/ depreciation on swaps | |
$ |
3,780,134 |
| |
$ |
474,821 |
|
| | | |
Interest rate
contracts | |
Net realized gain/(loss)
on futures; Net change
in unrealized appreciation/
depreciation on futures | | | 1,163,422 | | | | (267,555 | ) |
| | | |
Foreign currency
contracts | |
Net realized gain/(loss) on forward currency exchange contracts; Net change in unrealized appreciation/depreciation on forward currency exchange contracts | |
|
3,166,417 |
| |
|
(800,766 |
) |
| | | |
Foreign currency
contracts | |
Net realized gain/(loss)
on investment transactions; Net change in unrealized appreciation/depreciation on investments | |
|
(12,564 |
) | |
|
– 0 |
– |
| | | |
Foreign currency
contracts | |
Net realized gain/(loss)
on options written;
Net change in unrealized appreciation/depreciation on options written | |
|
1,903 |
| |
|
– 0 |
– |
| | | |
Credit contracts | | Net realized gain/(loss)
on swaps; Net change in unrealized appreciation/ depreciation on swaps | | | (264,002 | ) | | | 39,222 | |
| | | |
Equity contracts | | Net realized gain/(loss)
on swaps; Net change in unrealized appreciation/ depreciation on swaps | | | (2,971,258 | ) | | | 335,638 | |
| | |
| |
| abfunds.com | | AB EMERGING MARKETS MULTI-ASSET PORTFOLIO | 67 |
NOTES TO FINANCIAL STATEMENTS(continued)
| | | | | | | | | | |
Derivative Type | | Location of Gain or
(Loss) on Derivatives
Within Statement of
Operations | | Realized Gain
or (Loss) on
Derivatives | | | Change in
Unrealized
Appreciation or
(Depreciation) | |
Equity contracts | | Net realized gain/(loss) on futures; Net change in unrealized appreciation/depreciation on futures | | $ | (4,372,386 | ) | | $ | (1,010,248 | ) |
| | | |
Equity contracts | | Net realized gain/(loss) on investment transactions; Net change in unrealized appreciation/depreciation on investments | | | (247,843 | ) | | | – 0 | – |
| | | | | | | | | | |
Total | | | | $ | 243,823 | | | $ | (1,228,888 | ) |
| | | | | | | | | | |
The following table represents the average monthly volume of the Fund’s derivative transactions during the year ended March 31, 2020:
| | | | |
Centrally Cleared Credit Default Swaps: | | | | |
Average notional amount of buy contracts | | $ | 927,077 | |
Average notional amount of sale contracts | | $ | 725,250 | (a) |
Centrally Cleared Interest Rate Swaps | | | | |
Average notional amount | | $ | 9,921,569 | (b) |
Credit Default Swaps: | | | | |
Average notional amount of sale contracts | | $ | 56,000 | (c) |
Forward Currency Exchange Contracts: | | | | |
Average principal amount of buy contracts | | $ | 68,938,489 | |
Average principal amount of sale contracts | | $ | 85,647,140 | |
Futures: | | | | |
Average notional amount of buy contracts | | $ | 22,240,465 | |
Average notional amount of sale contracts | | $ | 3,119,375 | (d) |
Total Return Swaps: | | | | |
Average notional amount | | $ | 17,296,109 | (e) |
Variance Swaps: | | | | |
Average notional amount | | $ | 541,337 | |
Options Written: | | | | |
Average notional amount | | $ | 169,884 | (f) |
Purchased Options: | | | | |
Average notional amount | | $ | 3,924,586 | (g) |
| (a) | Positions were open for seven months during the reporting period. |
| (b) | Positions were open for eight months during the reporting period. |
| (c) | Positions were open for one month during the reporting period. |
| (d) | Positions were open for five months during the reporting period. |
| (e) | Positions were open for ten months during the reporting period. |
| (f) | Positions were open for two months during the reporting period. |
| (g) | Positions were open for six months during the reporting period. |
| | |
| |
| 68 | AB EMERGING MARKETS MULTI-ASSET PORTFOLIO | | abfunds.com |
NOTES TO FINANCIAL STATEMENTS(continued)
For financial reporting purposes, the Fund does not offset derivative assets and derivative liabilities that are subject to netting arrangements in the statement of assets and liabilities.
All OTC derivatives held at period end were subject to netting arrangements. The following table presents the Fund’s derivative assets and liabilities by OTC counterparty net of amounts available for offset under ISDA Master Agreements (“MA”) and net of the related collateral received/pledged by the Fund as of March 31, 2020. Exchange-traded derivatives and centrally cleared swaps are not subject to netting arrangements and as such are excluded from the tables.
| | | | | | | | | | | | | | | | | | | | |
Counterparty | | Derivative
Assets
Subject
to a MA | | | Derivatives
Available
for Offset | | | Cash
Collateral
Received* | | | Security
Collateral
Received* | | | Net
Amount of
Derivative
Assets | |
Australia & New Zealand Banking Group Ltd | | $ | 71,766 | | | $ | – 0 | – | | $ | – 0 | – | | $ | – 0 | – | | $ | 71,766 | |
Barclays Bank PLC | | | 697,521 | | | | (697,521 | ) | | | – 0 | – | | | – 0 | – | | | – 0 | – |
BNP Paribas | | | 24,421 | | | | – 0 | – | | | – 0 | – | | | – 0 | – | | | 24,421 | |
Brown Brothers Harriman & Co. | | | 153,295 | | | | (153,295 | ) | | | – 0 | – | | | – 0 | – | | | – 0 | – |
Citibank, NA. | | | 1,325,494 | | | | (260,027 | ) | | | (960,000 | ) | | | – 0 | – | | | 105,467 | |
Deutsche Bank AG | | | 170,932 | | | | (170,932 | ) | | | – 0 | – | | | – 0 | – | | | – 0 | – |
Goldman Sachs Bank USA | | | 651,742 | | | | (514,343 | ) | | | (137,399 | ) | | | – 0 | – | | | – 0 | – |
HSBC Bank USA. | | | 430,099 | | | | (430,099 | ) | | | – 0 | – | | | – 0 | – | | | – 0 | – |
JPMorgan Chase Bank, NA. | | | 893,379 | | | | (613,357 | ) | | | (280,022 | ) | | | – 0 | – | | | – 0 | – |
Morgan Stanley Capital Services LLC/ | | | | | | | | | | | | | | | | | | | | |
Morgan Stanley & Co. International PLC | | | 349,671 | | | | (169,698 | ) | | | (90,000 | ) | | | – 0 | – | | | 89,973 | |
Royal Bank of Scotland PLC | | | 51,855 | | | | (51,855 | ) | | | – 0 | – | | | – 0 | – | | | – 0 | – |
Standard Chartered Bank. | | | 76,901 | | | | (76,901 | ) | | | – 0 | – | | | – 0 | – | | | – 0 | – |
UBS AG | | | 127,464 | | | | (127,464 | ) | | | – 0 | – | | | – 0 | – | | | – 0 | – |
| | | | | | | | | | | | | | | | | | | | |
Total | | $ | 5,024,540 | | | $ | (3,265,492 | ) | | $ | (1,467,421 | ) | | $ | – 0 | – | | $ | 291,627 | ^ |
| | | | | | | | | | | | | | | | | | | | |
| | | | | |
Counterparty | | Derivative
Liabilities
Subject
to a MA | | | Derivatives
Available
for Offset | | | Cash
Collateral
Pledged* | | | Security
Collateral
Pledged* | | | Net
Amount of
Derivative
Liabilities | |
Bank of America, NA. | | $ | 100,708 | | | $ | – 0 | – | | $ | – 0 | – | | $ | – 0 | – | | $ | 100,708 | |
Barclays Bank PLC | | | 884,735 | | | | (697,521 | ) | | | (187,214 | ) | | | – 0 | – | | | – 0 | – |
Brown Brothers Harriman & Co. | | | 185,382 | | | | (153,295 | ) | | | – 0 | – | | | – 0 | – | | | 32,087 | |
Citibank, NA. | | | 260,027 | | | | (260,027 | ) | | | – 0 | – | | | – 0 | – | | | – 0 | – |
Deutsche Bank AG | | | 803,293 | | | | (170,932 | ) | | | – 0 | – | | | – 0 | – | | | 632,361 | |
Goldman Sachs Bank USA | | | 514,343 | | | | (514,343 | ) | | | – 0 | – | | | – 0 | – | | | – 0 | – |
HSBC Bank USA. | | | 917,165 | | | | (430,099 | ) | | | – 0 | – | | | – 0 | – | | | 487,066 | |
JPMorgan Chase Bank, NA. | | | 613,357 | | | | (613,357 | ) | | | – 0 | – | | | – 0 | – | | | – 0 | – |
| | |
| |
| abfunds.com | | AB EMERGING MARKETS MULTI-ASSET PORTFOLIO | 69 |
NOTES TO FINANCIAL STATEMENTS(continued)
| | | | | | | | | | | | | | | | | | | | |
| | | | | |
Counterparty | | Derivative
Liabilities
Subject
to a MA | | | Derivatives
Available
for Offset | | | Cash
Collateral
Pledged* | | | Security
Collateral
Pledged* | | | Net
Amount of
Derivative
Liabilities | |
Morgan Stanley Capital Services LLC/ | | | | | | | | | | | | | | | | | | | | |
Morgan Stanley & Co. International PLC | | $ | 169,698 | | | $ | (169,698 | ) | | $ | – 0 | – | | $ | – 0 | – | | $ | – 0 | – |
Royal Bank of Scotland PLC | | | 240,518 | | | | (51,855 | ) | | | – 0 | – | | | – 0 | – | | | 188,663 | |
Standard Chartered Bank. | | | 255,761 | | | | (76,901 | ) | | | – 0 | – | | | – 0 | – | | | 178,860 | |
UBS AG | | | 487,151 | | | | (127,464 | ) | | | (359,687 | ) | | | – 0 | – | | | – 0 | – |
| | | | | | | | | | | | | | | | | | | | |
Total | | $ | 5,432,138 | | | $ | (3,265,492 | ) | | $ | (546,901 | ) | | $ | – 0 | – | | $ | 1,619,745 | ^ |
| | | | | | | | | | | | | | | | | | | | |
| * | The actual collateral received/pledged may be more than the amount reported due to overcollateralization. |
| ^ | Net amount represents the net receivable/payable that would be due from/to the counterparty in the event of default or termination. The net amount from OTC financial derivative instruments can only be netted across transactions governed under the same master agreement with the same counterparty. |
2. Currency Transactions
The Fund may invest innon-U.S. Dollar-denominated securities on a currency hedged or unhedged basis. The Fund may seek investment opportunities by taking long or short positions in currencies through the use of currency-related derivatives, including forward currency exchange contracts, futures and options on futures, swaps, and other options. The Fund may enter into transactions for investment opportunities when it anticipates that a foreign currency will appreciate or depreciate in value but securities denominated in that currency are not held by the Fund and do not present attractive investment opportunities. Such transactions may also be used when the Adviser believes that it may be more efficient than a direct investment in a foreign currency-denominated security. The Fund may also conduct currency exchange contracts on a spot basis (i.e., for cash at the spot rate prevailing in the currency exchange market for buying or selling currencies).
NOTE E
Securities Lending
The Fund may enter into securities lending transactions. Under the Fund’s securities lending program, all loans of securities will be collateralized continually by cash collateral and/ornon-cash collateral.Non-cash collateral will include only securities issued or guaranteed by the U.S. government or its agencies or instrumentalities. The Fund cannot sell or repledge anynon-cash collateral, such collateral will not be reflected in the portfolio of investments. If a loan is collateralized by cash, the Fund will be compensated for the loan from a portion of the net return from the income earned on cash collateral after a rebate is paid to the borrower (in some cases,
| | |
| |
| 70 | AB EMERGING MARKETS MULTI-ASSET PORTFOLIO | | abfunds.com |
NOTES TO FINANCIAL STATEMENTS(continued)
this rebate may be a “negative rebate” or fee paid by the borrower to the Fund in connection with the loan), and payments are made for fees of the securities lending agent and for certain other administrative expenses. If the Fund receivesnon-cash collateral, the Fund will receive a fee from the borrower generally equal to a negotiated percentage of the market value of the loaned securities. The Fund will have the right to call a loan and obtain the securities loaned at any time on notice to the borrower within the normal and customary settlement time for the securities. While the securities are on loan, the borrower is obligated to pay the Fund amounts equal to any income or other distributions from the securities. The Fund will not be able to exercise voting rights with respect to any securities during the existence of a loan, but will have the right to regain ownership of loaned securities in order to exercise voting or other ownership rights. Collateral received and securities loaned are marked to market daily to ensure that the securities loaned are secured by collateral. The lending agent currently invests the cash collateral received in Government Money Market Portfolio, an eligible money market vehicle, in accordance with the investment restrictions of the Fund, and as approved by the Board. The collateral received on securities loaned is recorded as an asset as well as a corresponding liability in the statement of assets and liabilities. The collateral will be adjusted the next business day to maintain the required collateral amount. The amounts of securities lending income from the borrowers and Government Money Market Portfolio are reflected in the statement of operations. When the Fund earns net securities lending income from Government Money Market Portfolio, the income is inclusive of a rebate expense paid to the borrower. In connection with the cash collateral investment by the Fund in the Government Money Market Portfolio, the Adviser has agreed to waive a portion of the Fund’s share of the advisory fees of Government Money Market Portfolio, as borne indirectly by the Fund as an acquired fund fee and expense. When the Fund lends securities, its investment performance will continue to reflect changes in the value of the securities loaned. A principal risk of lending portfolio securities is that the borrower may fail to return the loaned securities upon termination of the loan and that the collateral will not be sufficient to replace the loaned securities. The lending agent has agreed to indemnify the Fund in the case of default of any securities borrower.
| | |
| |
| abfunds.com | | AB EMERGING MARKETS MULTI-ASSET PORTFOLIO | 71 |
NOTES TO FINANCIAL STATEMENTS(continued)
A summary of the Fund’s transactions surrounding securities lending for the year ended March 31, 2020 is as follows:
| | | | | | | | | | | | | | | | | | | | |
| | | | | | | | | | | | Government Money Market Portfolio | |
Market Value
of Securities
on Loan* | | Cash
Collateral* | | | Market
Value of
Non-Cash
Collateral* | | | Income
from
Borrowers | | | Income Earned | | | Advisory Fee
Waived | |
$ 307,741 | | $ | 326,569 | | | $ | – 0 | – | | $ | 15,924 | | | $ | 7,534 | | | $ | 193 | |
NOTE F
Capital Stock
Each class consists of 3,000,000,000 authorized shares. Transactions in capital shares for each class were as follows:
| | | | | | | | | | | | | | | | | | | | | | | | |
| | | | | | | | | | | | | | | | | | | | | | | | |
| | | Shares | | | | | | Amount | | | | |
| | | Year Ended
March 31,
2020 | | | Year Ended
March 31,
2019 | | | | | | Year Ended
March 31,
2020 | | | Year Ended
March 31,
2019 | | | | |
| | | | | | | | |
| Class A | | | | | | | | | | | | | | | | | | | | | | | | |
Shares sold | | | 66,391 | | | | 275,968 | | | | | | | $ | 586,317 | | | $ | 2,527,510 | | | | | |
| | | | | |
Shares issued in reinvestment of dividends | | | 20,167 | | | | 39,549 | | | | | | | | 174,742 | | | | 337,699 | | | | | |
| | | | | |
Shares converted from Class C | | | 2,107 | | | | 7,865 | | | | | | | | 19,021 | | | | 69,150 | | | | | |
| | | | | |
Shares redeemed | | | (276,812 | ) | | | (789,121 | ) | | | | | | | (2,442,684 | ) | | | (6,847,556 | ) | | | | |
| | | | | |
Net decrease | | | (188,147 | ) | | | (465,739 | ) | | | | | | $ | (1,662,604 | ) | | $ | (3,913,197 | ) | | | | |
| | | | | |
| Class C | | | | | | | | | | | | | | | | | | | | | | | | |
Shares sold | | | 40,425 | | | | 33,811 | | | | | | | $ | 359,626 | | | $ | 309,472 | | | | | |
| | | | | |
Shares issued in reinvestment of dividends | | | 5,740 | | | | 7,855 | | | | | | | | 49,674 | | | | 65,999 | | | | | |
| | | | | |
Shares converted to Class A | | | (2,118 | ) | | | (7,903 | ) | | | | | | | (19,021 | ) | | | (69,150 | ) | | | | |
| | | | | |
Shares redeemed | | | (152,432 | ) | | | (61,752 | ) | | | | | | | (1,329,368 | ) | | | (549,357 | ) | | | | |
| | | | | |
Net decrease | | | (108,385 | ) | | | (27,989 | ) | | | | | | $ | (939,089 | ) | | $ | (243,036 | ) | | | | |
| | | | | |
| Advisor Class | | | | | | | | | | | | | | | | | | | | | | | | |
Shares sold | | | 9,841,326 | | | | 6,191,305 | | | | | | | $ | 86,432,145 | | | $ | 55,398,918 | | | | | |
| | | | | |
Shares issued in reinvestment of dividends | | | 687,376 | | | | 575,554 | | | | | | | | 5,958,078 | | | | 4,900,267 | | | | | |
| | | | | |
Shares redeemed | | | (6,500,438 | ) | | | (6,049,179 | ) | | | | | | | (56,383,580 | ) | | | (53,844,089 | ) | | | | |
| | | | | |
Net increase | | | 4,028,264 | | | | 717,680 | | | | | | | $ | 36,006,643 | | | $ | 6,455,096 | | | | | |
| | | | | |
| | |
| |
| 72 | AB EMERGING MARKETS MULTI-ASSET PORTFOLIO | | abfunds.com |
NOTES TO FINANCIAL STATEMENTS(continued)
| | | | | | | | | | | | | | | | | | | | | | | | |
| | | Shares | | | | | | Amount | | | | |
| | | Year Ended
March 31,
2020 | | | Year Ended
March 31,
2019 | | | | | | Year Ended
March 31,
2020 | | | Year Ended
March 31,
2019 | | | | |
| | | | | | | | |
| Class R | | | | | | | | | | | | | | | | | | | | | | | | |
Shares sold | | | 13,637 | | | | 32,672 | | | | | | | $ | 118,960 | | | $ | 273,093 | | | | | |
| | | | | |
Shares issued in reinvestment of dividends | | | 1,856 | | | | 1,315 | | | | | | | | 16,115 | | | | 11,210 | | | | | |
| | | | | |
Shares redeemed | | | (11,468 | ) | | | (32,422 | ) | | | | | | | (102,472 | ) | | | (278,570 | ) | | | | |
| | | | | |
Net increase | | | 4,025 | | | | 1,565 | | | | | | | $ | 32,603 | | | $ | 5,733 | | | | | |
| | | | | |
| Class K | | | | | | | | | | | | | | | | | | | | | | | | |
Shares sold | | | 5,645 | | | | 4,398 | | | | | | | $ | 49,674 | | | $ | 39,791 | | | | | |
| | | | | |
Shares issued in reinvestment of dividends | | | 1,466 | | | | 1,794 | | | | | | | | 12,677 | | | | 15,160 | | | | | |
| | | | | |
Shares redeemed | | | (12,273 | ) | | | (4,365 | ) | | | | | | | (105,183 | ) | | | (38,112 | ) | | | | |
| | | | | |
Net increase (decrease) | | | (5,162 | ) | | | 1,827 | | | | | | | $ | (42,832 | ) | | $ | 16,839 | | | | | |
| | | | | |
| Class I | | | | | | | | | | | | | | | | | | | | | | | | |
Shares sold | | | 1,188 | | | | 3,345 | | | | | | | $ | 10,371 | | | $ | 29,829 | | | | | |
| | | | | |
Shares issued in reinvestment of dividends | | | 172 | | | | 924 | | | | | | | | 1,484 | | | | 7,782 | | | | | |
| | | | | |
Shares redeemed | | | (16,916 | ) | | | (189,665 | ) | | | | | | | (144,303 | ) | | | (1,848,280 | ) | | | | |
| | | | | |
Net decrease | | | (15,556 | ) | | | (185,396 | ) | | | | | | $ | (132,448 | ) | | $ | (1,810,669 | ) | | | | |
| | | | | |
| Class Z | | | | | | | | | | | | | | | | | | | | | | | | |
Shares sold | | | 20,191 | | | | – 0 | – * | | | | | | $ | 180,632 | | | $ | 5 | | | | | |
| | | | | |
Shares issued in reinvestment of dividends | | | 895 | | | | – 0 | – | | | | | | | 7,714 | | | | – 0 | – | | | | |
| | | | | |
Shares redeemed | | | (1,562 | ) | | | – 0 | – | | | | | | | (13,879 | ) | | | – 0 | – | | | | |
| | | | | |
Net increase | | | 19,524 | | | | – 0 | – | | | | | | $ | 174,467 | | | $ | 5 | | | | | |
| | | | | |
| * | Amount is less than 0.5 shares. |
NOTE G
Risks Involved in Investing in the Fund
Market Risk—The market value of a security may move up or down, sometimes rapidly and unpredictably. These fluctuations may cause a security to be worth less than the price originally paid for it, or less than it was worth at an earlier time. Market risk may affect a single issuer, industry, sector of the economy or the market as a whole. Global economies and financial markets are increasingly interconnected, which increases the probabilities that conditions in one country or region might adversely impact issuers in a different country or region. Conditions affecting the general economy, including political, social, or economic instability at the local, regional, or global level may also affect the market value of a
| | |
| |
| abfunds.com | | AB EMERGING MARKETS MULTI-ASSET PORTFOLIO | 73 |
NOTES TO FINANCIAL STATEMENTS(continued)
security. Health crises, such as pandemic and epidemic diseases, as well as other incidents that interrupt the expected course of events, such as natural disasters, war or civil disturbance, acts of terrorism, power outages and other unforeseeable and external events, and the public response to or fear of such diseases or events, have and may in the future have an adverse effect on the Fund’s investments and net asset value and can lead to increased market volatility. For example, any preventative or protective actions that governments may take in respect of such diseases or events may result in periods of business disruption, inability to obtain raw materials, supplies and component parts, and reduced or disrupted operations for the Fund’s portfolio companies. The occurrence and pendency of such diseases or events could adversely affect the economies and financial markets either in specific countries or worldwide.
Emerging Market Risk—Investments in emerging market countries may involve more risk than investments in other foreign countries because the markets in emerging market countries are less developed and less liquid, and because these investments may be subject to increased economic, political, regulatory, or other uncertainties.
Foreign(Non-U.S.) Risk—Investments in securities ofnon-U.S. issuers may involve more risk than those of U.S. issuers. These securities may fluctuate more widely in price and may be more difficult to trade or dispose of due to adverse market, economic, political, regulatory or other factors.
Currency Risk—Fluctuations in currency exchange rates may negatively affect the value of the Fund’s investments or reduce its returns. Emerging market currencies may be more volatile and less liquid, and subject to significantly greater risk of currency controls and convertibility restrictions, than currencies of developed countries.
Country Concentration Risk—The Fund may not always be diversified among countries or geographic regions and the effect on the Fund’s net asset value, or NAV, of the specific risks identified above, such as political, regulatory and currency risks, may be magnified due to concentration of the Fund’s investments in a particular country or region.
Allocation Risk—The allocation of Fund assets among different asset classes, such as equity securities, debt securities and currencies, may have a significant effect on the Fund’s NAV when one of these asset classes is performing better or worse than others. The diversification benefits typically associated with investing in both equity and debt securities may be limited in the emerging markets context, as movements in emerging market equity and emerging market debt markets may be more correlated than movements in the equity and debt markets of developed countries.
| | |
| |
| 74 | AB EMERGING MARKETS MULTI-ASSET PORTFOLIO | | abfunds.com |
NOTES TO FINANCIAL STATEMENTS(continued)
Capitalization Risk—Investments in small- andmid-capitalization companies may be more volatile than investments in large-capitalization companies. Investments in small-capitalization companies may have additional risks because these companies have limited product lines, markets or financial resources.
Interest Rate Risk— Changes in interest rates will affect the value of investments in fixed-income securities. When interest rates rise, the value of existing investments in fixed-income securities tends to fall and this decrease in value may not be offset by higher income from new investments. Interest rate risk is generally greater for fixed-income securities with longer maturities or durations.
Credit Risk— An issuer or guarantor of a fixed-income security, or the counterparty to a derivatives or other contract, may be unable or unwilling to make timely payments of interest or principal, or to otherwise honor its obligations. The issuer or guaran- tor may default, causing a loss of the full principal amount of a security and accrued interest. The degree of risk for a particular security may be reflected in its credit rating. There is the possibility that the credit rating of a fixed-income security may be downgraded after purchase, which may adversely affect the value of the security.
Below Investment Grade Securities Risk—Investments in fixed-income securities with lower ratings (commonly known as “junk bonds”) tend to have a higher probability that an issuer will default or fail to meet its payment obligations. These securities may be subject to greater price volatility due to factors such as specific corporate developments, interest rate sensitivity and negative perceptions of the junk bond market generally, and may be more difficult to trade or dispose of than other types of securities.
Derivatives Risk—The Fund may enter into derivative transactions such as forwards, options, futures and swaps. Derivatives may be illiquid, difficult to price, and leveraged so that small changes may produce disproportionate losses for the Fund, and subject to counterparty risk to a greater degree than more traditional investments. Derivatives may result in significant losses, including losses that are far greater than the value of the derivatives reflected on the statement of assets and liabilities.
Leverage Risk—When the Fund borrows money or otherwise leverages its investments, its performance may be volatile because leverage tends to exaggerate the effect of any increase or decrease in the value of the Fund’s investments. The Fund may create leverage through the use of reverse repurchase arrangements, forward currency exchange contracts, forward commitments, dollar rolls or futures contracts or by borrowing
| | |
| |
| abfunds.com | | AB EMERGING MARKETS MULTI-ASSET PORTFOLIO | 75 |
NOTES TO FINANCIAL STATEMENTS(continued)
money. The use of other types of derivative instruments by the Fund, such as options and swaps, may also result in a form of leverage. Leverage may result in higher returns to the Fund than if the Fund were not leveraged, but may also adversely affect returns, particularly if the market is declining.
Illiquid Investments Risk—Illiquid investments risk exists when certain investments are or become difficult to purchase or sell. Difficulty in selling such investments may result in sales at disadvantageous prices affecting the value of your investment in the Fund. Causes of illiquid investments risk may include low trading volumes, large positions and heavy redemptions of Fund shares. Illiquid investments risk may be higher in a rising interest rate environment, when the value and liquidity of fixed income securities generally decline.
Active Trading Risk—The Fund expects to engage in active and frequent trading of its portfolio securities and its portfolio turnover rate may greatly exceed 100%. A higher rate of portfolio turnover increases transaction costs, which may negatively affect the Fund’s return. In addition, a high rate of portfolio turnover may result in substantial short-term gains, which may have adverse tax consequences for Fund shareholders.
LIBOR Risk—The Fund may invest in certain debt securities, derivatives or other financial instruments that utilize the London Interbank Offered Rate, or “LIBOR,” as a “benchmark” or “reference rate” for various interest rate calculations. In July 2017, the United Kingdom Financial Conduct Authority, which regulates LIBOR, announced a desire to phase out the use of LIBOR by the end of 2021. Although financial regulators and industry working groups have suggested alternative reference rates, such as European Interbank Offer Rate (“EURIBOR”), Sterling Overnight Interbank Average Rate (“SONIA”) and Secured Overnight Financing Rate (“SOFR”), global consensus on alternative rates is lacking and the process for amending existing contracts or instruments to transition away from LIBOR remains unclear. The elimination of LIBOR or changes to other reference rates or any other changes or reforms to the determination or supervision of reference rates could have an adverse impact on the market for, or value of, any securities or payments linked to those reference rates, which may adversely affect the Fund’s performance and/or net asset value. Uncertainty and risk also remain regarding the willingness and ability of issuers and lenders to include revised provisions in new and existing contracts or instruments. Consequently, the transition away from LIBOR to other reference rates may lead to increased volatility and illiquidity in markets that are tied to LIBOR, fluctuations in values of LIBOR-related investments or investments in issuers that utilize LIBOR, increased difficulty in borrowing or refinancing and diminished effectiveness of hedging strategies, adversely affecting the Fund’s performance. Furthermore, the risks
| | |
| |
| 76 | AB EMERGING MARKETS MULTI-ASSET PORTFOLIO | | abfunds.com |
NOTES TO FINANCIAL STATEMENTS(continued)
associated with the expected discontinuation of LIBOR and transition may be exacerbated if the work necessary to effect an orderly transition to an alternative reference rate is not completed in a timely manner. Because the usefulness of LIBOR as a benchmark could deteriorate during the transition period, these effects could occur prior to the end of 2021.
Indemnification Risk—In the ordinary course of business, the Fund enters into contracts that contain a variety of indemnifications. The Fund’s maximum exposure under these arrangements is unknown. However, the Fund has not had prior claims or losses pursuant to these indemnification provisions and expects the risk of loss thereunder to be remote. Therefore, the Fund has not accrued any liability in connection with these indemnification provisions.
Management Risk—The Fund is subject to management risk because it is an actively-managed investment fund. The Adviser will apply its investment techniques and risk analyses in making investment decisions for the Fund, but there is no guarantee that its techniques will produce the intended results.
NOTE H
Joint Credit Facility
A number ofopen-end mutual funds managed by the Adviser, including the Fund, participate in a $325 million revolving credit facility (the “Facility”) intended to provide short-term financing, if necessary, subject to certain restrictions in connection with abnormal redemption activity. Commitment fees related to the Facility are paid by the participating funds and are included in miscellaneous expenses in the statement of operations. The Fund did not utilize the Facility during the year ended March 31, 2020.
NOTE I
Distributions to Shareholders
The tax character of distributions paid during the fiscal years ended March 31, 2020 and March 31, 2019 were as follows:
| | | | | | | | |
| | | 2020 | | | 2019 | |
Distributions paid from: | | | | | | | | |
Ordinary income | | $ | 7,851,100 | | | $ | 6,209,115 | |
| | | | | | | | |
Total taxable distributions paid | | | 7,851,100 | | | | 6,209,115 | |
| | |
| |
| abfunds.com | | AB EMERGING MARKETS MULTI-ASSET PORTFOLIO | 77 |
NOTES TO FINANCIAL STATEMENTS(continued)
As of March 31, 2020, the components of accumulated earnings/(deficit) on a tax basis were as follows:
| | | | |
Undistributed ordinary income | | $ | 121,218 | |
Accumulated capital and other losses | | | (18,473,126 | )(a) |
Unrealized appreciation/(depreciation) | | | (25,189,121 | )(b) |
| | | | |
Total accumulated earnings/(deficit) | | $ | (43,541,029 | )(c) |
| | | | |
| (a) | As of March 31, 2020, the Fund had a net capital loss carryforward of $18,473,126. |
| (b) | The differences between book-basis andtax-basis unrealized appreciation/(depreciation) are attributable primarily to the tax deferral of losses on wash sales, the tax treatment of swaps, the tax treatment of passive foreign investment companies (PFICs), the tax treatment of callable bonds, and the recognition for tax purposes of unrealized gains/losses on certain derivative instruments. |
| (c) | The differences between book-basis andtax-basis components of accumulated earnings/(deficit) are attributable primarily to the tax treatment of defaulted securities and the accrual of foreign capital gains tax. |
For tax purposes, net realized capital losses may be carried over to offset future capital gains, if any. Funds are permitted to carry forward capital losses for an indefinite period, and such losses will retain their character as either short-term or long-term capital losses. As of March 31, 2020, the Fund had a net short-term capital loss carryforward of $12,188,841 and a net long-term capital loss carryforward of $6,284,285, which may be carried forward for an indefinite period.
During the current fiscal year, permanent differences primarily due to the tax treatment of callable bonds resulted in a net decrease in accumulated loss and a net decrease in additionalpaid-in capital. These reclassifications had no effect on net assets.
NOTE J
Recent Accounting Pronouncements
In March 2017, the Financial Accounting Standards Board issued an Accounting Standards Update, ASU2017-08, Receivables – Nonrefundable Fees and Other Costs (Subtopic310-20), Premium Amortization on Purchased Callable Debt Securities which amends the amortization period for certain purchased callable debt securities held at a premium, shortening such period to the earliest call date. ASU2017-08 does not require any accounting change for debt securities held at a discount; the discount continues to be amortized to maturity. ASU2017-08 is effective for fiscal years, and interim periods within those fiscal years, beginning after December 15, 2018. The Fund has adopted ASU2017-08, which did not have a material impact on the Fund’s financial position or the results of its operations, and had no impact on the Fund’s net assets.
NOTE K
Subsequent Events
Management has evaluated subsequent events for possible recognition or disclosure in the financial statements through the date the financial statements are issued. Management has determined that there are no material events that would require disclosure in the Fund’s financial statements through this date.
| | |
| |
| 78 | AB EMERGING MARKETS MULTI-ASSET PORTFOLIO | | abfunds.com |
FINANCIAL HIGHLIGHTS
Selected Data For A Share of Capital Stock Outstanding Throughout Each Period
| | | | | | | | | | | | | | | | | | | | |
| | | Class A | |
| | | Year Ended March 31, | |
| | | 2020 | | | 2019 | | | 2018 | | | 2017 | | | 2016 | |
| | | | | | | | | | | | | | | | | | | | |
| | | | | | | | | | | | | | | | | | | | |
Net asset value, beginning of period | | | $ 8.89 | | | | $ 10.00 | | | | $ 9.20 | | | | $ 8.59 | | | | $ 8.99 | |
| | | | | | | | |
Income From Investment Operations | | | | | | | | | | | | | | | | | | | | |
| | | | | |
Net investment income(a)(b) | | | .29 | | | | .30 | | | | .25 | | | | .24 | | | | .27 | |
| | | | | |
Net realized and unrealized gain (loss) on investment and foreign currency transactions | | | (1.68 | ) | | | (.95 | ) | | | .89 | | | | .74 | | | | (.37 | ) |
| | | | |
Net increase (decrease) in net asset value from operations | | | (1.39 | ) | | | (.65 | ) | | | 1.14 | | | | .98 | | | | (.10 | ) |
| | | | |
Less: Dividends and Distributions | | | | | | | | | | | | | | | | | | | | |
| | | | | |
Dividends from net investment income | | | (.46 | ) | | | (.46 | ) | | | (.33 | ) | | | (.30 | ) | | | (.20 | ) |
| | | | | |
Return of capital | | | – 0 | – | | | – 0 | – | | | (.01 | ) | | | (.07 | ) | | | (.10 | ) |
| | | | |
Total dividends and distributions | | | (.46 | ) | | | (.46 | ) | | | (.34 | ) | | | (.37 | ) | | | (.30 | ) |
| | | | |
Net asset value, end of period | | | $ 7.04 | | | | $ 8.89 | | | | $ 10.00 | | | | $ 9.20 | | | | $ 8.59 | |
| | | | |
| | | | | |
Total Return | | | | | | | | | | | | | | | | | | | | |
| | | | | |
Total investment return based on net asset value(c) | | | (16.50 | )% | | | (6.20 | )% | | | 12.56 | % | | | 11.82 | % | | | (.98 | )%^ |
| | | | | |
Ratios/Supplemental Data | | | | | | | | | | | | | | | | | | | | |
| | | | | |
Net assets, end of period (000’s omitted) | | | $3,040 | | | | $5,510 | | | | $10,849 | | | | $4,764 | | | | $1,643 | |
| | | | | |
Ratio to average net assets of: | | | | | | | | | | | | | | | | | | | | |
| | | | | |
Expenses, net of waivers/reimbursements(d)(e)† | | | 1.23 | % | | | 1.24 | % | | | 1.23 | % | | | 1.51 | % | | | 1.62 | % |
| | | | | |
Expenses, before waivers/reimbursements(d)(e)† | | | 1.76 | % | | | 1.80 | % | | | 1.92 | % | | | 2.92 | % | | | 3.22 | % |
| | | | | |
Net investment income(b) | | | 3.26 | % | | | 3.36 | % | | | 2.51 | % | | | 2.68 | % | | | 3.15 | % |
| | | | | |
Portfolio turnover rate | | | 117 | % | | | 110 | % | | | 74 | % | | | 118 | % | | | 108 | % |
| | | | | | | | | | | | | | | | | | | | |
| |
† Expense ratios exclude the estimated acquired fund fees of affiliated/unaffiliated underlying | |
portfolios | | | .01 | % | | | .01 | % | | | .02 | % | | | .02 | % | | | .01 | % |
See footnote summary on page 85-86.
| | |
| |
| abfunds.com | | AB EMERGING MARKETS MULTI-ASSET PORTFOLIO | 79 |
FINANCIAL HIGHLIGHTS(continued)
Selected Data For A Share of Capital Stock Outstanding Throughout Each Period
| | | | | | | | | | | | | | | | | | | | |
| | | Class C | |
| | | Year Ended March 31, | |
| | | 2020 | | | 2019 | | | 2018 | | | 2017 | | | 2016 | |
| | | | | | | | | | | | | | | | | | | | |
| | | | | | | | | | | | | | | | | | | | |
Net asset value, beginning of period | | | $ 8.85 | | | | $ 9.95 | | | | $ 9.19 | | | | $ 8.59 | | | | $ 8.97 | |
| | | | | | | | |
Income From Investment Operations | | | | | | | | | | | | | | | | | | | | |
| | | | | |
Net investment income(a)(b) | | | .22 | | | | .23 | | | | .16 | | | | .17 | | | | .22 | |
| | | | | |
Net realized and unrealized gain (loss) on investment and foreign currency transactions | | | (1.66 | ) | | | (.93 | ) | | | .89 | | | | .75 | | | | (.37 | ) |
| | | | |
Net increase (decrease) in net asset value from operations | | | (1.44 | ) | | | (.70 | ) | | | 1.05 | | | | .92 | | | | (.15 | ) |
| | | | |
Less: Dividends and Distributions | | | | | | | | | | | | | | | | | | | | |
| | | | | |
Dividends from net investment income | | | (.40 | ) | | | (.40 | ) | | | (.28 | ) | | | (.26 | ) | | | (.16 | ) |
| | | | | |
Return of capital | | | – 0 | – | | | – 0 | – | | | (.01 | ) | | | (.06 | ) | | | (.07 | ) |
| | | | |
Total dividends and distributions | | | (.40 | ) | | | (.40 | ) | | | (.29 | ) | | | (.32 | ) | | | (.23 | ) |
| | | | |
Net asset value, end of period | | | $ 7.01 | | | | $ 8.85 | | | | $ 9.95 | | | | $ 9.19 | | | | $ 8.59 | |
| | | | |
| | | | | |
Total Return | | | | | | | | | | | | | | | | | | | | |
| | | | | |
Total investment return based on net asset value(c) | | | (17.11 | )% | | | (6.79 | )%^ | | | 11.63 | %^ | | | 11.00 | %^ | | | (1.58 | )%^ |
| | | | | |
Ratios/Supplemental Data | | | | | | | | | | | | | | | | | | | | |
| | | | | |
Net assets, end of period (000’s omitted) | | | $1,010 | | | | $2,234 | | | | $2,792 | | | | $497 | | | | $95 | |
| | | | | |
Ratio to average net assets of: | | | | | | | | | | | | | | | | | | | | |
| | | | | |
Expenses, net of waivers/reimbursements(d)(e)† | | | 1.98 | % | | | 1.99 | % | | | 1.98 | % | | | 2.26 | % | | | 2.35 | % |
| | | | | |
Expenses, before waivers/reimbursements(d)(e)† | | | 2.51 | % | | | 2.58 | % | | | 2.69 | % | | | 3.69 | % | | | 3.93 | % |
| | | | | |
Net investment income(b) | | | 2.54 | % | | | 2.54 | % | | | 1.57 | % | | | 1.97 | % | | | 2.52 | % |
| | | | | |
Portfolio turnover rate | | | 117 | % | | | 110 | % | | | 74 | % | | | 118 | % | | | 108 | % |
| | | | | | | | | | | | | | | | | | | | |
| |
† Expense ratios exclude the estimated acquired fund fees of affiliated/unaffiliated underlying | |
portfolios | | | .01 | % | | | .01 | % | | | .02 | % | | | .02 | % | | | .01 | % |
See footnote summary on page 85-86.
| | |
| |
| 80 | AB EMERGING MARKETS MULTI-ASSET PORTFOLIO | | abfunds.com |
FINANCIAL HIGHLIGHTS(continued)
Selected Data For A Share of Capital Stock Outstanding Throughout Each Period
| | | | | | | | | | | | | | | | | | | | |
| | | Advisor Class | |
| | | Year Ended March 31, | |
| | | 2020 | | | 2019 | | | 2018 | | | 2017 | | | 2016 | |
| | | | | | | | | | | | | | | | | | | | |
| | | | | | | | | | | | | | | | | | | | |
Net asset value, beginning of period | | | $ 8.91 | | | | $ 10.02 | | | | $ 9.22 | | | | $ 8.61 | | | | $ 9.00 | |
| | | | | | | | |
Income From Investment Operations | | | | | | | | | | | | | | | | | | | | |
| | | | | |
Net investment income(a)(b) | | | .30 | | | | .32 | | | | .27 | | | | .27 | | | | .31 | |
| | | | | |
Net realized and unrealized gain (loss) on investment and foreign currency transactions | | | (1.66 | ) | | | (.95 | ) | | | .89 | | | | .74 | | | | (.38 | ) |
| | | | |
Net increase (decrease) in net asset value from operations | | | (1.36 | ) | | | (.63 | ) | | | 1.16 | | | | 1.01 | | | | (.07 | ) |
| | | | |
Less: Dividends and Distributions | | | | | | | | | | | | | | | | | | | | |
| | | | | |
Dividends from net investment income | | | (.49 | ) | | | (.48 | ) | | | (.35 | ) | | | (.33 | ) | | | (.22 | ) |
| | | | | |
Return of capital | | | – 0 | – | | | – 0 | – | | | (.01 | ) | | | (.07 | ) | | | (.10 | ) |
| | | | |
Total dividends and distributions | | | (.49 | ) | | | (.48 | ) | | | (.36 | ) | | | (.40 | ) | | | (.32 | ) |
| | | | |
Net asset value, end of period | | | $ 7.06 | | | | $ 8.91 | | | | $ 10.02 | | | | $ 9.22 | | | | $ 8.61 | |
| | | | |
| | | | | |
Total Return | | | | | | | | | | | | | | | | | | | | |
| | | | | |
Total investment return based on net asset value(c) | | | (16.24 | )% | | | (5.93 | )% | | | 12.78 | % | | | 12.07 | % | | | (.63 | )%^ |
| | | | | |
Ratios/Supplemental Data | | | | | | | | | | | | | | | | | | | | |
| | | | | |
Net assets, end of period (000’s omitted) | | | $122,322 | | | | $118,492 | | | | $126,029 | | | | $42,000 | | | | $17,572 | |
| | | | | |
Ratio to average net assets of: | | | | | | | | | | | | | | | | | | | | |
| | | | | |
Expenses, net of waivers/reimbursements(d)(e)† | | | .98 | % | | | .99 | % | | | .98 | % | | | 1.24 | % | | | 1.35 | % |
| | | | | |
Expenses, before waivers/reimbursements(d)(e)† | | | 1.51 | % | | | 1.58 | % | | | 1.67 | % | | | 2.64 | % | | | 2.92 | % |
| | | | | |
Net investment income(b) | | | 3.42 | % | | | 3.53 | % | | | 2.76 | % | | | 3.07 | % | | | 3.60 | % |
| | | | | |
Portfolio turnover rate | | | 117 | % | | | 110 | % | | | 74 | % | | | 118 | % | | | 108 | % |
| | | | | | | | | | | | | | | | | | | | |
| |
† Expense ratios exclude the estimated acquired fund fees of affiliated/unaffiliated underlying | |
portfolios | | | .01 | % | | | .01 | % | | | .02 | % | | | .02 | % | | | .01 | % |
See footnote summary on page 85-86.
| | |
| |
| abfunds.com | | AB EMERGING MARKETS MULTI-ASSET PORTFOLIO | 81 |
FINANCIAL HIGHLIGHTS(continued)
Selected Data For A Share of Capital Stock Outstanding Throughout Each Period
| | | | | | | | | | | | | | | | | | | | |
| | | Class R | |
| | | Year Ended March 31, | |
| | | 2020 | | | 2019 | | | 2018 | | | 2017 | | | 2016 | |
| | | | | | | | | | | | | | | | | | | | |
| | | | | | | | | | | | | | | | | | | | |
Net asset value, beginning of period | | | $ 8.88 | | | | $ 9.97 | | | | $ 9.17 | | | | $ 8.57 | | | | $ 8.96 | |
| | | | | | | | |
Income From Investment Operations | | | | | | | | | | | | | | | | | | | | |
| | | | | |
Net investment income(a)(b) | | | .25 | | | | .27 | | | | .22 | | | | .18 | | | | .26 | |
| | | | | |
Net realized and unrealized gain (loss) on investment and foreign currency transactions | | | (1.65 | ) | | | (.94 | ) | | | .89 | | | | .78 | | | | (.37 | ) |
| | | | |
Net increase (decrease) in net asset value from operations | | | (1.40 | ) | | | (.67 | ) | | | 1.11 | | | | .96 | | | | (.11 | ) |
| | | | |
Less: Dividends and Distributions | | | | | | | | | | | | | | | | | | | | |
| | | | | |
Dividends from net investment income | | | (.43 | ) | | | (.42 | ) | | | (.30 | ) | | | (.30 | ) | | | (.19 | ) |
| | | | | |
Return of capital | | | – 0 | – | | | – 0 | – | | | (.01 | ) | | | (.06 | ) | | | (.09 | ) |
| | | | |
Total dividends and distributions | | | (.43 | ) | | | (.42 | ) | | | (.31 | ) | | | (.36 | ) | | | (.28 | ) |
| | | | |
Net asset value, end of period | | | $ 7.05 | | | | $ 8.88 | | | | $ 9.97 | | | | $ 9.17 | | | | $ 8.57 | |
| | | | |
| | | | | |
Total Return | | | | | | | | | | | | | | | | | | | | |
| | | | | |
Total investment return based on net asset value(c) | | | (16.64 | )% | | | (6.39 | )% | | | 12.20 | % | | | 11.51 | % | | | (1.07 | )% |
| | | | | |
Ratios/Supplemental Data | | | | | | | | | | | | | | | | | | | | |
| | | | | |
Net assets, end of period (000’s omitted) | | | $271 | | | | $305 | | | | $327 | | | | $184 | | | | $9 | |
| | | | | |
Ratio to average net assets of: | | | | | | | | | | | | | | | | | | | | |
| | | | | |
Expenses, net of waivers/reimbursements(d)(e)† | | | 1.48 | % | | | 1.49 | % | | | 1.48 | % | | | 1.72 | % | | | 1.85 | % |
| | | | | |
Expenses, before waivers/reimbursements(d)(e)† | | | 2.23 | % | | | 2.23 | % | | | 2.29 | % | | | 3.24 | % | | | 3.39 | % |
| | | | | |
Net investment income(b) | | | 2.92 | % | | | 3.06 | % | | | 2.26 | % | | | 2.08 | % | | | 3.00 | % |
| | | | | |
Portfolio turnover rate | | | 117 | % | | | 110 | % | | | 74 | % | | | 118 | % | | | 108 | % |
| | | | | | | | | | | | | | | | | | | | |
| |
† Expense ratios exclude the estimated acquired fund fees of affiliated/unaffiliated underlying | |
portfolios | | | .01 | % | | | .01 | % | | | .02 | % | | | .02 | % | | | .01 | % |
See footnote summary on page 85-86.
| | |
| |
| 82 | AB EMERGING MARKETS MULTI-ASSET PORTFOLIO | | abfunds.com |
FINANCIAL HIGHLIGHTS(continued)
Selected Data For A Share of Capital Stock Outstanding Throughout Each Period
| | | | | | | | | | | | | | | | | | | | |
| | | Class K | |
| | | Year Ended March 31, | |
| | | 2020 | | | 2019 | | | 2018 | | | 2017 | | | 2016 | |
| | | | | | | | | | | | | | | | | | | | |
| | | | | | | | | | | | | | | | | | | | |
Net asset value, beginning of period | | | $ 8.87 | | | | $ 9.97 | | | | $ 9.16 | | | | $ 8.56 | | | | $ 8.95 | |
| | | | | | | | |
Income From Investment Operations | | | | | | | | | | | | | | | | | | | | |
| | | | | |
Net investment income(a)(b) | | | .29 | | | | .29 | | | | .26 | | | | .26 | | | | .24 | |
| | | | | |
Net realized and unrealized gain (loss) on investment and foreign currency transactions | | | (1.67 | ) | | | (.94 | ) | | | .88 | | | | .71 | | | | (.33 | ) |
| | | | |
Net increase (decrease) in net asset value from operations | | | (1.38 | ) | | | (.65 | ) | | | 1.14 | | | | .97 | | | | (.09 | ) |
| | | | |
Less: Dividends and Distributions | | | | | | | | | | | | | | | | | | | | |
| | | | | |
Dividends from net investment income | | | (.45 | ) | | | (.45 | ) | | | (.32 | ) | | | (.30 | ) | | | (.20 | ) |
| | | | | |
Return of capital | | | – 0 | – | | | – 0 | – | | | (.01 | ) | | | (.07 | ) | | | (.10 | ) |
| | | | |
Total dividends and distributions | | | (.45 | ) | | | (.45 | ) | | | (.33 | ) | | | (.37 | ) | | | (.30 | ) |
| | | | |
Net asset value, end of period | | | $ 7.04 | | | | $ 8.87 | | | | $ 9.97 | | | | $ 9.16 | | | | $ 8.56 | |
| | | | |
| | | | | |
Total Return | | | | | | | | | | | | | | | | | | | | |
| | | | | |
Total investment return based on net asset value(c) | | | (16.55 | )% | | | (6.19 | )% | | | 12.56 | % | | | 11.75 | % | | | (.86 | )%^ |
| | | | | |
Ratios/Supplemental Data | | | | | | | | | | | | | | | | | | | | |
| | | | | |
Net assets, end of period (000’s omitted) | | | $212 | | | | $313 | | | | $333 | | | | $298 | | | | $212 | |
| | | | | |
Ratio to average net assets of: | | | | | | | | | | | | | | | | | | | | |
| | | | | |
Expenses, net of waivers/reimbursements(d)(e)† | | | 1.23 | % | | | 1.24 | % | | | 1.23 | % | | | 1.53 | % | | | 1.60 | % |
| | | | | |
Expenses, before waivers/reimbursements(d)(e)† | | | 1.92 | % | | | 1.96 | % | | | 2.01 | % | | | 2.89 | % | | | 3.34 | % |
| | | | | |
Net investment income(b) | | | 3.34 | % | | | 3.26 | % | | | 2.67 | % | | | 2.94 | % | | | 2.87 | % |
| | | | | |
Portfolio turnover rate | | | 117 | % | | | 110 | % | | | 74 | % | | | 118 | % | | | 108 | % |
| | | | | | | | | | | | | | | | | | | | |
| |
† Expense ratios exclude the estimated acquired fund fees of affiliated/unaffiliated underlying | |
portfolios | | | .01 | % | | | .01 | % | | | .02 | % | | | .02 | % | | | .01 | % |
See footnote summary on page 85-86.
| | |
| |
| abfunds.com | | AB EMERGING MARKETS MULTI-ASSET PORTFOLIO | 83 |
FINANCIAL HIGHLIGHTS(continued)
Selected Data For A Share of Capital Stock Outstanding Throughout Each Period
| | | | | | | | | | | | | | | | | | | | |
| | | Class I | |
| | | Year Ended March 31, | |
| | | 2020 | | | 2019 | | | 2018 | | | 2017 | | | 2016 | |
| | | | | | | | | | | | | | | | | | | | |
| | | | | | | | | | | | | | | | | | | | |
Net asset value, beginning of period | | | $ 8.83 | | | | $ 9.94 | | | | $ 9.16 | | | | $ 8.56 | | | | $ 8.96 | |
| | | | | | | | |
Income From Investment Operations | | | | | | | | | | | | | | | | | | | | |
| | | | | |
Net investment income(a)(b) | | | .36 | | | | .28 | | | | .30 | | | | .28 | | | | .30 | |
| | | | | |
Net realized and unrealized gain (loss) on investment and foreign currency transactions | | | (1.72 | ) | | | (.90 | ) | | | .85 | | | | .72 | | | | (.37 | ) |
| | | | |
Net increase (decrease) in net asset value from operations | | | (1.36 | ) | | | (.62 | ) | | | 1.15 | | | | 1.00 | | | | (.07 | ) |
| | | | |
Less: Dividends and Distributions | | | | | | | | | | | | | | | | | | | | |
| | | | | |
Dividends from net investment income | | | (.48 | ) | | | (.49 | ) | | | (.36 | ) | | | (.33 | ) | | | (.22 | ) |
| | | | | |
Return of capital | | | – 0 | – | | | – 0 | – | | | (.01 | ) | | | (.07 | ) | | | (.11 | ) |
| | | | |
Total dividends and distributions | | | (.48 | ) | | | (.49 | ) | | | (.37 | ) | | | (.40 | ) | | | (.33 | ) |
| | | | |
Net asset value, end of period | | | $ 6.99 | | | | $ 8.83 | | | | $ 9.94 | | | | $ 9.16 | | | | $ 8.56 | |
| | | | |
| | | | | |
Total Return | | | | | | | | | | | | | | | | | | | | |
| | | | | |
Total investment return based on net asset value(c) | | | (16.30 | )% | | | (5.93 | )% | | | 12.68 | %^ | | | 12.15 | %^ | | | (.66 | )%^ |
| | | | | |
Ratios/Supplemental Data | | | | | | | | | | | | | | | | | | | | |
| | | | | |
Net assets, end of period (000’s omitted) | | | $10 | | | | $151 | | | | $2,012 | | | | $16,952 | | | | $15,342 | |
| | | | | |
Ratio to average net assets of: | | | | | | | | | | | | | | | | | | | | |
| | | | | |
Expenses, net of waivers/reimbursements(d)(e)† | | | .98 | % | | | .99 | % | | | .98 | % | | | 1.28 | % | | | 1.35 | % |
| | | | | |
Expenses, before waivers/reimbursements(d)(e)† | | | 1.46 | % | | | 1.46 | % | | | 1.58 | % | | | 2.51 | % | | | 2.85 | % |
| | | | | |
Net investment income(b) | | | 4.19 | % | | | 3.03 | % | | | 3.12 | % | | | 3.19 | % | | | 3.49 | % |
| | | | | |
Portfolio turnover rate | | | 117 | % | | | 110 | % | | | 74 | % | | | 118 | % | | | 108 | % |
| | | | | | | | | | | | | | | | | | | | |
| |
† Expense ratios exclude the estimated acquired fund fees of affiliated/unaffiliated underlying | |
portfolios | | | .01 | % | | | .01 | % | | | .02 | % | | | .02 | % | | | .01 | % |
See footnote summary on page 85-86.
| | |
| |
| 84 | AB EMERGING MARKETS MULTI-ASSET PORTFOLIO | | abfunds.com |
FINANCIAL HIGHLIGHTS(continued)
Selected Data For A Share of Capital Stock Outstanding Throughout Each Period
| | | | | | | | | | | | |
| | | Class Z | |
| | | Year Ended March 31, | | | July 31,
2017(f) to
March 31,
2018 | |
| | | 2020 | | | 2019 | |
| | | | | | | | | | | | |
| | | | | | | | | | | | |
Net asset value, beginning of period | | | $ 8.85 | | | | $ 9.95 | | | | $ 9.81 | |
| | | | | | | | |
Income From Investment Operations | | | | | | | | | | | | |
| | | |
Net investment income(a)(b) | | | .24 | | | | .31 | | | | .15 | |
| | | |
Net realized and unrealized gain (loss) on investment and foreign currency transactions | | | (1.59 | ) | | | (.93 | ) | | | .30 | |
| | | | |
Net increase (decrease) in net asset value from operations | | | (1.35 | ) | | | (.62 | ) | | | .45 | |
| | | | |
Less: Dividends and Distributions | | | | | | | | | | | | |
| | | |
Dividends from net investment income | | | (.49 | ) | | | (.48 | ) | | | (.30 | ) |
| | | |
Return of capital | | | – 0 | – | | | – 0 | – | | | (.01 | ) |
| | | | |
Total dividends and distributions | | | (.49 | ) | | | (.48 | ) | | | (.31 | ) |
| | | | |
Net asset value, end of period | | | $ 7.01 | | | | $ 8.85 | | | | $ 9.95 | |
| | | | |
| | | |
Total Return | | | | | | | | | | | | |
| | | |
Total investment return based on net asset value(c) | | | (16.25 | )% | | | (5.90 | )%^ | | | 4.66 | %^ |
| | | |
Ratios/Supplemental Data | | | | | | | | | | | | |
| | | |
Net assets, end of period (000’s omitted) | | | $144 | | | | $9 | | | | $10 | |
| | | |
Ratio to average net assets of: | | | | | | | | | | | | |
| | | |
Expenses, net of waivers/reimbursements(d)(e)† | | | .99 | % | | | .99 | % | | | .98 | %(g) |
| | | |
Expenses, before waivers/reimbursements(d)(e)† | | | 1.54 | % | | | 1.60 | % | | | 1.71 | %(g) |
| | | |
Net investment income(b) | | | 2.78 | % | | | 3.49 | % | | | 2.26 | %(g) |
| | | |
Portfolio turnover rate | | | 117 | % | | | 110 | % | | | 74 | % |
| | | | | | | | | | | | |
| |
† Expense ratios exclude the estimated acquired fund fees of affiliated/unaffiliated underlying | |
portfolios | | | .01 | % | | | .01 | % | | | .01 | % |
| (a) | Based on average shares outstanding. |
| (b) | Net of expenses waived/reimbursed by the Adviser. |
| (c) | Total investment return is calculated assuming an initial investment made at the net asset value at the beginning of the period, reinvestment of all dividends and distributions at net asset value during the period, and redemption on the last day of the period. Initial sales charge or contingent deferred sales charge is not reflected in the calculation of total investment return. Total investment return does not reflect the deduction of taxes that a shareholder would pay on fund distributions or the redemption of fund shares. Total investment return for a period of less than one year is not annualized. |
| (d) | In connection with the Fund’s investments in affiliated underlying portfolios, the Fund incurs no direct expenses but bears proportionate shares of the acquired fund fees and expenses (i.e. operating, administrative and investment advisory fees) of the affiliated underlying portfolios. The Adviser has contractually agreed to waive its fees from the Fund in an amount equal to the Fund’s pro rata share of certain acquired fund fees and expenses, and for the years ended March 31, 2020, March 31, 2019, March 31, 2018 and March 31, 2017, such waiver amounted to 0.01%, 0.01%, 0.01% and 0.02%, respectively. |
| | |
| |
| abfunds.com | | AB EMERGING MARKETS MULTI-ASSET PORTFOLIO | 85 |
FINANCIAL HIGHLIGHTS(continued)
Selected Data For A Share of Capital Stock Outstanding Throughout Each Period
| (e) | The expense ratios presented below exclude interest expense: |
| | | | | | | | | | | | | | | | | | | | |
| | | Year Ended March 31, | |
| | | 2020 | | | 2019 | | | 2018 | | | 2017 | | | 2016 | |
| | | | |
Class A | | | | | | | | | | | | | | | | | | | | |
Net of waivers/reimbursements | | | N/A | | | | 1.24 | % | | | N/A | | | | N/A | | | | N/A | |
Before waivers/reimbursements | | | N/A | | | | 1.80 | % | | | N/A | | | | N/A | | | | N/A | |
Class C | | | | | | | | | | | | | | | | | | | | |
Net of waivers/reimbursements | | | N/A | | | | 1.98 | % | | | N/A | | | | N/A | | | | N/A | |
Before waivers/reimbursements | | | N/A | | | | 2.57 | % | | | N/A | | | | N/A | | | | N/A | |
Advisor Class | | | | | | | | | | | | | | | | | | | | |
Net of waivers/reimbursements | | | N/A | | | | .98 | % | | | N/A | | | | N/A | | | | N/A | |
Before waivers/reimbursements | | | N/A | | | | 1.57 | % | | | N/A | | | | N/A | | | | N/A | |
Class R | | | | | | | | | | | | | | | | | | | | |
Net of waivers/reimbursements | | | N/A | | | | 1.48 | % | | | N/A | | | | N/A | | | | N/A | |
Before waivers/reimbursements | | | N/A | | | | 2.22 | % | | | N/A | | | | N/A | | | | N/A | |
Class K | | | | | | | | | | | | | | | | | | | | |
Net of waivers/reimbursements | | | N/A | | | | 1.24 | % | | | N/A | | | | N/A | | | | N/A | |
Before waivers/reimbursements | | | N/A | | | | 1.96 | % | | | N/A | | | | N/A | | | | N/A | |
Class I | | | | | | | | | | | | | | | | | | | | |
Net of waivers/reimbursements | | | N/A | | | | .98 | % | | | N/A | | | | N/A | | | | N/A | |
Before waivers/reimbursements | | | N/A | | | | 1.45 | % | | | N/A | | | | N/A | | | | N/A | |
| | | | | | | | | | | | |
| | | Year Ended March 31, | | | July 31,
2017(f) to
March 31,
2018(g) | |
| | | 2020 | | | 2019 | |
| | | | |
Class Z | | | | | | | | | | | | |
Net of waivers/reimbursements | | | N/A | | | | .99 | % | | | N/A | |
Before waivers/reimbursements | | | N/A | | | | 1.60 | % | | | N/A | |
| (f) | Commencement of distribution. |
| ^ | The net asset value and total return include adjustments in accordance with accounting principles generally accepted in the United States of America for financial reporting purposes. As such, the net asset value and total return for shareholder transactions may differ from financial statements. |
See notes to financial statements.
| | |
| |
| 86 | AB EMERGING MARKETS MULTI-ASSET PORTFOLIO | | abfunds.com |
REPORT OF INDEPENDENT REGISTERED
PUBLIC ACCOUNTING FIRM
To the Board of Directors and the Shareholders of AB Emerging Markets Multi-Asset Portfolio
Opinion on the Financial Statements
We have audited the accompanying statement of assets and liabilities of AB Emerging Markets Multi-Asset Portfolio (the “Fund”) (one of the portfolios constituting AB Cap Fund, Inc. (the “Company”)), including the portfolio of investments, as of March 31, 2020, and the related statement of operations for the year then ended, the statements of changes in net assets for each of the two years in the period then ended, the financial highlights for each of the five years in the period then ended and the related notes (collectively referred to as the “financial statements”). In our opinion, the financial statements present fairly, in all material respects, the financial position of the Fund (one of the portfolios constituting AB Cap Fund, Inc.) at March 31, 2020, the results of its operations for the year then ended, the changes in its net assets for each of the two years in the period then ended and its financial highlights for each of the five years in the period then ended, in conformity with U.S. generally accepted accounting principles.
Basis for Opinion
These financial statements are the responsibility of the Company’s management. Our responsibility is to express an opinion on the Fund’s financial statements based on our audits. We are a public accounting firm registered with the Public Company Accounting Oversight Board (United States) (“PCAOB”) and are required to be independent with respect to the Company in accordance with the U.S. federal securities laws and the applicable rules and regulations of the Securities and Exchange Commission and the PCAOB.
We conducted our audits in accordance with the standards of the PCAOB. Those standards require that we plan and perform the audit to obtain reasonable assurance about whether the financial statements are free of material misstatement, whether due to error or fraud. The Company is not required to have, nor were we engaged to perform, an audit of the Company’s internal control over financial reporting. As part of our audits we are required to obtain an understanding of internal control over financial reporting but not for the purpose of expressing an opinion on the effectiveness of the Company’s internal control over financial reporting. Accordingly, we express no such opinion.
Our audits included performing procedures to assess the risks of material misstatement of the financial statements, whether due to error or fraud, and performing procedures that respond to those risks. Such procedures included examining, on a test basis, evidence regarding the amounts and disclosures in the financial statements. Our procedures included confirmation of securities owned as of March 31, 2020, by correspondence with the custodian and others or by other appropriate auditing procedures where replies from others were not received. Our audits also included evaluating the accounting principles used and significant estimates made by management, as well as evaluating the overall presentation of the financial statements. We believe that our audits provide a reasonable basis for our opinion.

We have served as the auditor of one or more of the AB investment companies since 1968.
New York, New York
May 28, 2020
| | |
| |
| abfunds.com | | AB EMERGING MARKETS MULTI-ASSET PORTFOLIO | 87 |
2020 FEDERAL TAX INFORMATION
(unaudited)
For Federal income tax purposes, the following information is furnished with respect to the earnings of the Fund for the taxable year ended March 31, 2020.
For individual shareholders, the Fund designates 24.80% of dividends paid as qualified dividend income.
The Fund intends to make an election to pass through foreign taxes to its shareholders. For the taxable year ended March 31, 2020, $459,904 of foreign taxes may be passed through and the associated foreign source income for information reporting purposes is $3,478,839.
Shareholders should not use the above information to prepare their income tax returns. The information necessary to complete your income tax returns will be included with your Form 1099-DIV which will be sent to you separately in January 2021.
| | |
| |
| 88 | AB EMERGING MARKETS MULTI-ASSET PORTFOLIO | | abfunds.com |
BOARD OF DIRECTORS
| | |
Marshall C. Turner, Jr.(1),Chairman Jorge A. Bermudez(1) Michael J. Downey(1) Nancy P. Jacklin(1) | | Robert M. Keith,President and Chief Executive Officer Jeanette Loeb(1) Carol C. McMullen(1) Garry L. Moody(1) Earl D. Weiner(1) |
| |
| OFFICERS | | |
Henry S. D’Auria(2),Vice President Morgan C. Harting(2),
Vice President Shamaila Khan(2),Vice President Emilie D. Wrapp,Secretary | | Michael B. Reyes,Senior Analyst Joseph J. Mantineo,Treasurer and Chief Financial Officer Phyllis J. Clarke,Controller Vincent S. Noto,Chief Compliance Officer |
| | |
Custodian and Accounting Agent Brown Brothers Harriman & Co.
50 Post Office Square
Boston, MA 02110 Principal Underwriter AllianceBernstein Investments, Inc.
1345 Avenue of the Americas
New York, NY 10105 Legal Counsel Seward & Kissel LLP
One Battery Park Plaza
New York, NY 10004 | | Independent Registered Public Accounting Firm Ernst & Young LLP
5 Times Square
New York, NY 10036 Transfer Agent AllianceBernstein Investor
Services, Inc.
P.O. Box 786003
San Antonio, TX 78278-6003
Toll-Free (800) 221-5672 |
| 1 | Member of the Audit Committee, the Governance and Nominating Committee and the Independent Directors Committee. |
| 2 | Theday-to-day management of, and investment decisions for, the Fund’s portfolio are made by the Adviser’s Emerging Markets Multi-Asset Team. Messrs. D’Auria and Harting and Ms. Khan are the investment professionals with the most significant responsibility for theday-to-day management of the Fund’s portfolio. |
| | |
| |
| abfunds.com | | AB EMERGING MARKETS MULTI-ASSET PORTFOLIO | 89 |
MANAGEMENT OF THE FUND
Board of Directors Information
The business and affairs of the Fund are managed under the direction of the Board of Directors. Certain information concerning the Fund’s Directors is set forth below.
| | | | | | | | |
NAME,
ADDRESS*, AGE,
(YEAR FIRST ELECTED**) | | PRINCIPAL
OCCUPATION(S)
DURING PAST FIVE YEARS
AND OTHER RELEVANT
QUALIFICATIONS*** | | PORTFOLIOS IN AB FUND COMPLEX OVERSEEN BY DIRECTOR | | | OTHER PUBLIC COMPANY DIRECTORSHIPS CURRENTLY
HELD BY
DIRECTOR |
| INTERESTED DIRECTOR | | | | | | |
| | | |
Robert M. Keith,# 1345 Avenue of the Americas New York, NY 10105 60 (2011) | | Senior Vice President of AllianceBernstein L.P. (the “Adviser”) and the head of AllianceBernstein Investments, Inc. (“ABI”) since July 2008; Director of ABI and President of the AB Mutual Funds. Previously, he served as Executive Managing Director of ABI from December 2006 to June 2008. Prior to joining ABI in 2006, Executive Managing Director of Bernstein Global Wealth Management, and prior thereto, Senior Managing Director and Global Head of Client Service and Sales of the Adviser’s institutional investment management business since 2004. Prior thereto, he was Managing Director and Head of North American Client Service and Sales in the Adviser’s institutional investment management business, with which he had been associated since prior to 2004. | | | 90 | | | None |
| | |
| |
| 90 | AB EMERGING MARKETS MULTI-ASSET PORTFOLIO | | abfunds.com |
MANAGEMENT OF THE FUND(continued)
| | | | | | | | |
NAME,
ADDRESS*, AGE,
(YEAR FIRST ELECTED**) | | PRINCIPAL
OCCUPATION(S)
DURING PAST FIVE YEARS
AND OTHER RELEVANT
QUALIFICATIONS*** | | PORTFOLIOS IN AB FUND COMPLEX OVERSEEN BY DIRECTOR | | | OTHER PUBLIC COMPANY DIRECTORSHIPS CURRENTLY
HELD BY
DIRECTOR |
| DISINTERESTED DIRECTORS | | | | | | |
| | | |
Marshall C. Turner, Jr.,## Chairman of the Board 78 (2011) | | Private Investor since prior to 2015. Former Chairman and CEO of Dupont Photomasks, Inc. (components of semi-conductor manufacturing). He has extensive operating leadership, and venture capital investing experience, including five interim or full-time CEO roles, and prior service as general partner of institutional venture capital partnerships. He also has extensive non-profit board leadership experience, and currently serves on the boards of two education and science-related non-profit organizations. He has served as a director of one AB Fund since 1992, and director or trustee of all AB Funds since 2005. He has been Chairman of the AB Funds since January 2014, and the Chairman of the Independent Directors Committees of such Funds since February 2014. | | | 90 | | | Xilinx, Inc. (programmable logic semi-conductors) since 2007 |
| | | | | | | | |
| | |
| |
| abfunds.com | | AB EMERGING MARKETS MULTI-ASSET PORTFOLIO | 91 |
MANAGEMENT OF THE FUND(continued)
| | | | | | | | |
NAME,
ADDRESS*, AGE,
(YEAR FIRST ELECTED**) | | PRINCIPAL
OCCUPATION(S)
DURING PAST FIVE YEARS
AND OTHER RELEVANT
QUALIFICATIONS*** | | PORTFOLIOS IN AB FUND COMPLEX OVERSEEN BY DIRECTOR | | | OTHER PUBLIC COMPANY DIRECTORSHIPS CURRENTLY
HELD BY
DIRECTOR |
DISINTERESTED DIRECTORS
(continued) | | | | | | |
| | | |
Jorge A. Bermudez 69 (2020) | | Private investor since prior to 2015. Former Chief Risk Officer of Citigroup, Inc., a global financial services company, from November 2007 to March 2008, Chief Executive Officer of Citigroup’s Commercial Business Group in North America and Citibank Texas from 2005 to 2007, and a variety of other executive and leadership roles at various businesses within Citigroup prior to then; Chairman (2018) of the Texas A&M Foundation Board of Trustees (Trustee since 2013) and Chairman of the Smart Grid Center Board at Texas A&M University since 2012; director of, among others, Citibank N.A. from 2005 to 2008, the Federal Reserve Bank of Dallas, Houston Branch from 2009 to 2011, the Federal Reserve Bank of Dallas from 2011 to 2017, and the Electric Reliability Council of Texas from 2010 to 2016. He has served as director or trustee of the AB Funds since January 2020. | | | 90 | | | Moody’s Corporation since April 2011 |
| | | | | | | | |
| | |
| |
| 92 | AB EMERGING MARKETS MULTI-ASSET PORTFOLIO | | abfunds.com |
MANAGEMENT OF THE FUND(continued)
| | | | | | | | |
NAME,
ADDRESS*, AGE,
(YEAR FIRST ELECTED**) | | PRINCIPAL
OCCUPATION(S)
DURING PAST FIVE YEARS
AND OTHER RELEVANT
QUALIFICATIONS*** | | PORTFOLIOS IN AB FUND COMPLEX OVERSEEN BY DIRECTOR | | | OTHER PUBLIC COMPANY DIRECTORSHIPS CURRENTLY
HELD BY
DIRECTOR |
DISINTERESTED DIRECTORS
(continued) | | | | | | |
| | | |
Michael J. Downey,## 76 (2011) | | Private Investor since prior to 2015. Formerly, Chairman of The Asia Pacific Fund, Inc. (registered investment company) since prior to 2015 until January 2019. From 1987 until 1993, Chairman and CEO of Prudential Mutual Fund Management, director of the Prudential mutual funds, and member of the Executive Committee of Prudential Securities Inc. He has served as a director or trustee of the AB Funds since 2005. | | | 90 | | | None |
| | | | | | | | |
| | | |
Nancy P. Jacklin,## 72 (2011) | | Private Investor since prior to 2015. Professorial Lecturer at the Johns Hopkins School of Advanced International Studies (2008-2015). U.S. Executive Director of the International Monetary Fund (which is responsible for ensuring the stability of the international monetary system), (December 2002-May 2006); Partner, Clifford Chance (1992-2002); Sector Counsel, International Banking and Finance, and Associate General Counsel, Citicorp (1985-1992); Assistant General Counsel (International), Federal Reserve Board of Governors (1982-1985); and Attorney Advisor, U.S. Department of the Treasury (1973-1982). Member of the Bar of the District of Columbia and of New York; and member of the Council on Foreign Relations. She has served as a director or trustee of the AB Funds since 2006 and has been Chair of the Governance and Nominating Committees of the AB Funds since August 2014. | | | 90 | | | None |
| | | | | | | | |
| | |
| |
| abfunds.com | | AB EMERGING MARKETS MULTI-ASSET PORTFOLIO | 93 |
MANAGEMENT OF THE FUND(continued)
| | | | | | | | |
NAME,
ADDRESS*, AGE,
(YEAR FIRST ELECTED**) | | PRINCIPAL
OCCUPATION(S)
DURING PAST FIVE YEARS
AND OTHER RELEVANT
QUALIFICATIONS*** | | PORTFOLIOS IN AB FUND COMPLEX OVERSEEN BY DIRECTOR | | | OTHER PUBLIC COMPANY DIRECTORSHIPS CURRENTLY
HELD BY
DIRECTOR |
DISINTERESTED DIRECTORS
(continued) | | | | | | |
| | | |
Jeanette Loeb,## 67 (2020) | | Chief Executive Officer of PetCareRx (e-commerce pet pharmacy) from 2002 to 2011 and 2015 to present. Director of New York City Center since 2005. She was a director of AB Multi-Manager Alternative Fund, Inc. (fund of hedge funds) from 2012 to 2018. Formerly, affiliated with Goldman Sachs Group, Inc. (financial services) from 1977 to 1994, including as a partner thereof from 1986 to 1994. She has served as a Director of the AB Funds since April 2020. | | | 90 | | | Apollo Investment Corp. (business development company) since August 2011 |
| | | | | | | | |
| | | |
Carol C. McMullen,## 64 (2016) | | Managing Director of Slalom Consulting (consulting) since 2014, private investor and member of the Advisory Board of Butcher Box (since 2018). Formerly, member, Partners Healthcare Investment Committee (2010-2019); Director of Norfolk & Dedham Group (mutual property and casualty insurance) from 2011 until November 2016; Director of Partners Community Physicians Organization (healthcare) from 2014 until December 2016; and Managing Director of The Crossland Group (consulting) from 2012 until 2013. She has held a number of senior positions in the asset and wealth management industries, including at Eastern Bank (where her roles included President of Eastern Wealth Management), Thomson Financial (Global Head of Sales for Investment Management), and Putnam Investments (where her roles included Chief Investment Officer, Core and Growth and Head of Global Investment Research). She has served on a number of private company and non-profit boards, and as a director or trustee of the AB Funds since June 2016. | | | 90 | | | None |
| | |
| |
| 94 | AB EMERGING MARKETS MULTI-ASSET PORTFOLIO | | abfunds.com |
MANAGEMENT OF THE FUND(continued)
| | | | | | | | |
NAME,
ADDRESS*, AGE,
(YEAR FIRST ELECTED**) | | PRINCIPAL
OCCUPATION(S)
DURING PAST FIVE YEARS
AND OTHER RELEVANT
QUALIFICATIONS*** | | PORTFOLIOS IN AB FUND COMPLEX OVERSEEN BY DIRECTOR | | | OTHER PUBLIC COMPANY DIRECTORSHIPS CURRENTLY
HELD BY
DIRECTOR |
DISINTERESTED DIRECTORS
(continued) | | | | | | |
| | | |
Garry L. Moody,## 68 (2011) | | Private investor since prior to 2015. Formerly, Partner, Deloitte & Touche LLP (1995-2008) where he held a number of senior positions, including Vice Chairman, and U.S. and Global Investment Management Practice Managing Partner; President, Fidelity Accounting and Custody Services Company (1993-1995), where he was responsible for accounting, pricing, custody and reporting for the Fidelity mutual funds; and Partner, Ernst & Young LLP (1975-1993), where he served as the National Director of Mutual Fund Tax Services and Managing Partner of its Chicago Office Tax department. He is a member of the Trustee Advisory Board of BoardIQ, a biweekly publication focused on issues and news affecting directors of mutual funds. He is also a member of the Investment Company Institute’s Board of Governors and the Independent Directors Council Governing Council. He has served as a director or trustee, and as Chairman of the Audit Committees, of the AB Funds since 2008. | | | 90 | | | None |
| | | | | | | | |
| | |
| |
| abfunds.com | | AB EMERGING MARKETS MULTI-ASSET PORTFOLIO | 95 |
MANAGEMENT OF THE FUND(continued)
| | | | | | | | |
NAME,
ADDRESS*, AGE,
(YEAR FIRST ELECTED**) | | PRINCIPAL
OCCUPATION(S)
DURING PAST FIVE YEARS
AND OTHER RELEVANT
QUALIFICATIONS*** | | PORTFOLIOS IN AB FUND COMPLEX OVERSEEN BY DIRECTOR | | | OTHER PUBLIC COMPANY DIRECTORSHIPS CURRENTLY
HELD BY
DIRECTOR |
DISINTERESTED DIRECTORS
(continued) | | | | | | |
| | | |
Earl D. Weiner,## 80 (2011) | | Senior Counsel since 2017, Of Counsel from 2007 to 2016, and Partner prior to then, of the law firm Sullivan & Cromwell LLP. He is a former member of the ABA Federal Regulation of Securities Committee Task Force to draft editions of the Fund Director’s Guidebook. He also serves as a director or trustee of various non-profit organizations and has served as Chairman or Vice Chairman of a number of them. He has served as a director or trustee of the AB Funds since 2007 and served as Chairman of the Governance and Nominating Committees of the AB Funds from 2007 until August 2014. | | | 90 | | | None |
| * | The address for each of the Fund’s disinterested Directors is c/o AllianceBernstein L.P. Attention: Legal and Compliance Department, Mutual Fund Legal, 1345 Avenue of the Americas, New York, NY 10105. |
| ** | There is no stated term of office for the Fund’s Directors. |
| *** | The information above includes each Director’s principal occupation during the last five years and other information relating to the experience, attributes, and skills relevant to each Director’s qualifications to serve as a Director, which led to the conclusion that each Director should serve as a Director for the Fund. |
| # | Mr. Keith is an “interested person” of the Fund, as defined in the 1940 Act, due to his position as a Senior Vice President of the Adviser. |
| ## | Member of the Audit Committee, the Governance and Nominating Committee and the Independent Directors Committee. |
| | The Fund’s Statement of Additional Information (“SAI”) has additional information about the Fund’s Directors and Officers and is available without charge upon request. Contact your financial representativeor AB at 1-800-227-4618, or visit www.abfunds.com, for a free prospectus or SAI. |
| | |
| |
| 96 | AB EMERGING MARKETS MULTI-ASSET PORTFOLIO | | abfunds.com |
MANAGEMENT OF THE FUND(continued)
Officer Information
Certain information concerning the Fund’s Officers is listed below:
| | | | |
Robert M. Keith
60 | | President and Chief Executive Officer | | See biography above. |
| | | | |
Henry S. D’Auria
58 | | Vice President | | Senior Vice President of the Adviser**, with which he has been associated since prior to 2015. He is also Chief Investment Officer of Emerging Markets Value Equities. |
| | | | |
Morgan C. Harting
48 | | Vice President | | Senior Vice President of the Adviser**, with which he has been associated since prior to 2015. |
| | | | |
Shamaila Khan
49 | | Vice President | | Senior Vice President of the Adviser**, with which she has been associated since prior to 2015. She is also Director of Emerging Markets Debt. |
| | | | |
Emilie D. Wrapp
64 | | Secretary | | Senior Vice President, Assistant General Counsel and Assistant Secretary of ABI**, with which she has been associated since prior to 2015. |
| | | | |
Michael B. Reyes
43 | | Senior Analyst | | Vice President of the Adviser**, with which he has been associated since prior to 2015. |
| | | | |
Joseph J. Mantineo
61 | | Treasurer and Chief Financial Officer | | Senior Vice President of AllianceBernstein Investor Services (“ABIS”)**, with which he has been associated since prior to 2015. |
| | | | |
Phyllis J. Clarke
59 | | Controller | | Vice President of ABIS**, with which she has been associated since prior to 2015. |
| | | | |
Vincent S. Noto 55 | | Chief Compliance Officer | | Senior Vice President since 2015 and Mutual Fund Chief Compliance Officer of the Adviser** since prior to 2015. |
| * | The address for each of the Fund’s Officers is 1345 Avenue of the Americas, New York, NY 10105. |
| ** | The Adviser, ABI and ABIS are affiliates of the Fund. |
| | The Fund’s Statement of Additional Information (“SAI”) has additional information about the Fund’s Directors and Officers and is available without charge upon request. Contact your financial representative or AB at (800) 227-4618, or visit www.abfunds.com, for a free prospectus or SAI. |
| | |
| |
| abfunds.com | | AB EMERGING MARKETS MULTI-ASSET PORTFOLIO | 97 |
Operation and Effectiveness of the Funds’ Liquidity Risk Management Program:
In October 2016, the Securities and Exchange Commission (“SEC”) adopted theopen-end fund liquidity rule (the “Liquidity Rule”). In June 2018 the SEC adopted a requirement that funds disclose information about the operation and effectiveness of their Liquidity Risk Management Program (“LRMP”) in their reports to shareholders.
One of the requirements of the Liquidity Rule is for the Fund to designate an Administrator of the Fund’s Liquidity Risk Management Program. The Administrator of the Fund’s LRMP is AllianceBernstein L.P., the Fund’s investment adviser (the “Adviser”). The Adviser has delegated the responsibility to its Liquidity Risk Management Committee (the “Committee”). Another requirement of the Liquidity Rule is for the Fund’s Board of Directors/Trustees (the “Fund Board”) to receive an annual written report from the Administrator of the LRMP, which addresses the operation of the fund’s LRMP and assesses its adequacy and effectiveness. The Adviser provided the Fund Board with such annual report during the first quarter of 2020, which covered the period December 1, 2018 through December 31, 2019 (the “Program Reporting Period”).
The LRMP’s principal objectives include supporting the Fund’s compliance with limits on investments in illiquid assets and mitigating the risk that the Fund will be unable to meet its redemption obligations in a timely manner. Pursuant to the LRMP, the Fund classifies the liquidity of its portfolio investments into one of the four categories defined by the SEC: Highly Liquid, Moderately Liquid, Less Liquid, and Illiquid. These classifications are reported to the SEC on FormN-PORT.
During the Program Reporting Period, the Committee reviewed whether the Fund’s strategy is appropriate for anopen-end structure, taking into account any holdings of less liquid and illiquid assets. The Committee also performed an analysis to determine whether the Fund is required to maintain a Highly Liquid Investment Minimum (“HLIM”). If the Fund participated in derivative transactions, the exposure from such transactions were considered in the LRMP. The Committee also incorporated the following information when determining the Fund’s reasonably anticipated trading size for purposes of liquidity monitoring: historical net redemption activity, a Fund’s concentration in an issuer, shareholder concentration, investment performance, total net assets, and distribution channels.
The Adviser informed the Fund Board that the Committee believes the Funds’ LRMP is adequately designed, has been implemented as intended, and has operated effectively since its inception. No material exceptions have been noted since the implementation of the LRMP, and there were no liquidity events that impacted the Fund or its ability to timely meet redemptions during the Program Reporting Period.
| | |
| |
| 98 | AB EMERGING MARKETS MULTI-ASSET PORTFOLIO | | abfunds.com |
Information Regarding the Review and Approval of the Fund’s Advisory Agreement
The disinterested directors (the “directors”) of AB Cap Fund, Inc. (the “Company”) unanimously approved the continuance of the Company’s Advisory Agreement with the Adviser in respect of AB Emerging Markets Multi-Asset Portfolio (the “Fund”) at a meeting held on May 7-9, 2019 (the “Meeting”).*
Prior to approval of the continuance of the Advisory Agreement, the directors had requested from the Adviser, and received and evaluated, extensive materials. They reviewed the proposed continuance of the Advisory Agreement with the Adviser and with experienced counsel who are independent of the Adviser, who advised on the relevant legal standards. The directors also reviewed additional materials, including comparative analytical data prepared by the Senior Analyst for the Fund. The directors also discussed the proposed continuance in private sessions with counsel.
The directors considered their knowledge of the nature and quality of the services provided by the Adviser to the Fund gained from their experience as directors or trustees of most of the registered investment companies advised by the Adviser, their overall confidence in the Adviser’s integrity and competence they have gained from that experience, the Adviser’s initiative in identifying and raising potential issues with the directors and its responsiveness, frankness and attention to concerns raised by the directors in the past, including the Adviser’s willingness to consider and implement organizational and operational changes designed to improve investment results and the services provided to the AB Funds. The directors noted that they have four regular meetings each year, at each of which they review extensive materials and information from the Adviser, including information on the investment performance of the Fund.
The directors also considered all factors they believed relevant, including the specific matters discussed below. During the course of their deliberations, the directors evaluated, among other things, the reasonableness of the advisory fee. The directors did not identify any particular information that was all-important or controlling, and different directors may have attributed different weights to the various factors. The directors determined that the selection of the Adviser to manage the Fund and the overall arrangements between the Fund and the Adviser, as provided in the Advisory Agreement, including the advisory fee, were fair and reasonable in light of the services performed, expenses incurred and such other matters as the directors considered relevant in the exercise of their business
| | |
| |
| abfunds.com | | AB EMERGING MARKETS MULTI-ASSET PORTFOLIO | 99 |
| * | Following transactions completed on November 13, 2019 that may have been deemed to have been an “assignment” causing termination of the Fund’s investment advisory agreement, a new investment advisory agreement, having the same terms as the prior one, was entered into by the Fund and the Adviser. |
judgment. The material factors and conclusions that formed the basis for the directors’ determinations included the following:
Nature, Extent and Quality of Services Provided
The directors considered the scope and quality of services provided by the Adviser under the Advisory Agreement, including the quality of the investment research capabilities of the Adviser and the other resources it has dedicated to performing services for the Fund. The directors noted that the Adviser from time to time reviews the Fund’s investment strategies and from time to time proposes changes intended to improve the Fund’s relative or absolute performance for the directors’ consideration. They also noted the professional experience and qualifications of the Fund’s portfolio management team and other senior personnel of the Adviser. The directors also considered that the Advisory Agreement provides that the Fund will reimburse the Adviser for the cost to it of providing certain clerical, accounting, administrative and other services to the Fund by employees of the Adviser or its affiliates. Requests for these reimbursements are made on a quarterly basis and subject to approval by the directors. The Adviser did not request any reimbursements from the Fund in the Fund’s latest fiscal year. The directors noted that the methodology used to determine the reimbursement amounts had been reviewed by an independent consultant retained by the Fund’s former Senior Officer/Independent Compliance Officer. The quality of administrative and other services, including the Adviser’s role in coordinating the activities of the Fund’s other service providers, also was considered. The directors concluded that, overall, they were satisfied with the nature, extent and quality of services provided to the Fund under the Advisory Agreement.
Costs of Services Provided and Profitability
The directors reviewed a schedule of the revenues and expenses and related notes indicating the profitability of the Fund to the Adviser for calendar years 2017 and 2018 that had been prepared with an expense allocation methodology arrived at in consultation with an independent consultant retained by the Fund’s former Senior Officer/Independent Compliance Officer. The directors noted the assumptions and methods of allocation used by the Adviser in preparing fund-specific profitability data and understood that there are a number of potentially acceptable allocation methodologies for information of this type. The directors noted that the profitability information reflected all revenues and expenses of the Adviser’s relationship with the Fund, including those relating to its subsidiaries that provide transfer agency, distribution and brokerage services to the Fund. The directors recognized that it is difficult to make comparisons of the profitability of the Advisory Agreement with the profitability of advisory contracts for unaffiliated funds because comparative information is not generally publicly available and is affected by numerous factors. The directors focused on the profitability of the Adviser’s relationship with the Fund before taxes and distribution expenses. The directors noted that the Fund was not profitable to the Adviser in the periods reviewed.
| | |
| |
| 100 | AB EMERGING MARKETS MULTI-ASSET PORTFOLIO | | abfunds.com |
Fall-Out Benefits
The directors considered the other benefits to the Adviser and its affiliates from their relationships with the Fund and the underlying fund advised by the Adviser in which the Fund invests, including, but not limited to, benefits relating to soft dollar arrangements (whereby investment advisers receive brokerage and research services from brokers that execute agency transactions for their clients); 12b-1 fees and sales charges received by the Fund’s principal underwriter (which is a wholly owned subsidiary of the Adviser) in respect of certain classes of the Fund’s shares; brokerage commissions paid by the Fund to brokers affiliated with the Adviser; and transfer agency fees paid by the Fund to a wholly owned subsidiary of the Adviser. The directors recognized that the Fund’s unprofitability to the Adviser would be exacerbated without these benefits. The directors understood that the Adviser also might derive reputational and other benefits from its association with the Fund.
Investment Results
In addition to the information reviewed by the directors in connection with the Meeting, the directors receive detailed performance information for the Fund at each regular Board meeting during the year.
At the Meeting, the directors reviewed performance information prepared by an independent service provider (the “15(c) service provider”), showing the performance of the Class A Shares of the Fund against a group of similar funds (“peer group”) and a larger group of similar funds (“peer universe”), each selected by the 15(c) service provider, and information prepared by the Adviser showing performance of the Class A Shares against a broad-based securities market index, in each case for the 1-, 3- and5-year periods ended February 28, 2019 and (in the case of comparisons with the broad-based securities market index) for the period from inception. Based on their review, the directors concluded that the Fund’s investment performance was acceptable.
Advisory Fees and Other Expenses
The directors considered the advisory fee rate payable by the Fund to the Adviser and information prepared by the 15(c) service provider concerning advisory fee rates payable by other funds in the same category as the Fund. The directors recognized that it is difficult to make comparisons of advisory fees because there are variations in the services that are included in the fees paid by other funds. The directors compared the Fund’s contractual effective advisory fee rate with a peer group median and noted that it was above the median.
The directors also considered the Adviser’s fee schedule for other clients pursuing an investment strategy similar to the Fund’s. For this purpose, they reviewed the relevant advisory fee information from the Adviser’s Form ADV and in a report from the Fund’s Senior Analyst and noted the
| | |
| |
| abfunds.com | | AB EMERGING MARKETS MULTI-ASSET PORTFOLIO | 101 |
differences between the Fund’s fee schedule, on the one hand, and the Adviser’s institutional fee schedule and the schedule of fees charged by the Adviser to any offshore funds and for services to any sub-advised funds pursuing an investment strategy similar to the Fund’s, on the other. The directors noted that the Adviser may, in some cases, agree to fee rates with large institutional clients that are lower than those reviewed by the directors and that they had previously discussed with the Adviser its policies in respect of such arrangements. The directors previously discussed these matters with an independent fee consultant.
The Adviser reviewed with the directors the significantly greater scope of the services it provides to the Fund relative to institutional, offshore fund and sub-advised fund clients. In this regard, the Adviser noted, among other things, that, compared to institutional and offshore or sub-advisory accounts, the Fund (i) demands considerably more portfolio management, research and trading resources due to significantly higher daily cash flows; (ii) has more tax and regulatory restrictions and compliance obligations; (iii) must prepare and file or distribute regulatory and other communications about fund operations; and (iv) must provide shareholder servicing to retail investors. The Adviser also reviewed the greater legal risks presented by the large and changing population of Fund shareholders who may assert claims against the Adviser in individual or class actions, and the greater entrepreneurial risk in offering new fund products, which require substantial investment to launch, may not succeed, and generally must be priced to compete with larger, more established funds resulting in lack of profitability to the Adviser until a new fund achieves scale. In light of the substantial differences in services rendered by the Adviser to institutional, offshore fund and sub-advised fund clients as compared to the Fund, and the different risk profile, the directors considered these fee comparisons inapt and did not place significant weight on them in their deliberations.
The directors noted that the Fund invests in shares of exchange-traded funds (“ETFs”), subject to the restrictions and limitations of the Investment Company Act of 1940 as these may be varied as a result of exemptive orders issued by the SEC. The directors also noted that ETFs pay advisory fees pursuant to their advisory contracts, and that the Adviser had provided, and they had reviewed, information about the expense ratios of the relevant ETFs. The directors concluded, based on the Adviser’s explanation of how it uses ETFs when they are the most cost-effective way to obtain desired exposures, in some cases pending purchases of underlying securities, that the advisory fee for the Fund is for services that are in addition to, rather than duplicative of, the services provided under the advisory contracts of the ETFs.
In connection with their review of the Fund’s advisory fee, the directors also considered the total expense ratio of the Class A shares of the Fund in comparison to a peer group and a peer universe selected by the 15(c)
| | |
| |
| 102 | AB EMERGING MARKETS MULTI-ASSET PORTFOLIO | | abfunds.com |
service provider. The Class A expense ratio of the Fund was based on the Fund’s latest fiscal year and the directors considered the Adviser’s expense cap for the Fund. The directors noted that it was likely that the expense ratios of some of the other funds in the Fund’s category were lowered by waivers or reimbursements by those funds’ investment advisers, which in some cases might be voluntary or temporary. The directors view expense ratio information as relevant to their evaluation of the Adviser’s services because the Adviser is responsible for coordinating services provided to the Fund by others. Based on their review, the directors concluded that the Fund’s expense ratio was acceptable.
Economies of Scale
The directors noted that the advisory fee schedule for the Fund contains breakpoints that reduce the fee rates on assets above specified levels. The directors took into consideration prior presentations by an independent consultant on economies of scale in the mutual fund industry and for the AB Funds, and presentations from time to time by the Adviser concerning certain of its views on economies of scale. The directors also previously discussed economies of scale with an independent fee consultant. The directors also had requested and received from the Adviser certain updates on economies of scale in advance of the Meeting. The directors believe that economies of scale may be realized (if at all) by the Adviser across a variety of products and services, and not only in respect of a single fund. The directors noted that there is no established methodology for setting breakpoints that give effect to the fund-specific services provided by a fund’s adviser and to the economies of scale that an adviser may realize in its overall mutual fund business or those components of it which directly or indirectly affect a fund’s operations. The directors observed that in the mutual fund industry as a whole, as well as among funds similar to the Fund, there is no uniformity or pattern in the fees and asset levels at which breakpoints (if any) apply. The directors also noted that the advisory agreements for many funds do not have breakpoints at all. Having taken these factors into account, the directors concluded that the Fund’s shareholders would benefit from a sharing of economies of scale in the event the Fund’s net assets exceed a breakpoint in the future.
| | |
| |
| abfunds.com | | AB EMERGING MARKETS MULTI-ASSET PORTFOLIO | 103 |
This page is not part of the Shareholder Report or the Financial Statements.
AB FAMILY OF FUNDS
US EQUITY
CORE
Core Opportunities Fund
FlexFee™ US Thematic Portfolio
Select US Equity Portfolio
GROWTH
Concentrated Growth Fund
Discovery Growth Fund
FlexFee™ Large Cap Growth Portfolio
Growth Fund
Large Cap Growth Fund
Small Cap Growth Portfolio
VALUE
Discovery Value Fund
Equity Income Fund
Relative Value Fund
Small Cap Value Portfolio
Value Fund
INTERNATIONAL/ GLOBAL EQUITY
CORE
FlexFee™ International Strategic Core Portfolio
Global Core Equity Portfolio
International Portfolio
International Strategic Core Portfolio
Sustainable Global Thematic Fund
Tax-Managed International Portfolio
Tax-Managed Wealth Appreciation Strategy
Wealth Appreciation Strategy
GROWTH
Concentrated International Growth Portfolio
FlexFee™ Emerging Markets Growth Portfolio
Sustainable International Thematic Fund
INTERNATIONAL/ GLOBAL EQUITY(continued)
VALUE
All China Equity Portfolio
International Value Fund
FIXED INCOME
MUNICIPAL
High Income Municipal Portfolio
Intermediate California Municipal Portfolio
Intermediate Diversified Municipal Portfolio
Intermediate New York Municipal Portfolio
Municipal Bond Inflation Strategy
Tax-Aware Fixed Income Opportunities Portfolio1
National Portfolio
Arizona Portfolio
California Portfolio
Massachusetts Portfolio
Minnesota Portfolio
New Jersey Portfolio
New York Portfolio
Ohio Portfolio
Pennsylvania Portfolio
Virginia Portfolio
TAXABLE
Bond Inflation Strategy
FlexFee™ High Yield Portfolio
FlexFee™ International Bond Portfolio
Global Bond Fund
High Income Fund
Income Fund
Intermediate Duration Portfolio
Limited Duration High Income Portfolio
Short Duration Income Portfolio
Short Duration Portfolio
Total Return Bond Portfolio1
ALTERNATIVES
All Market Real Return Portfolio
Global Real Estate Investment Fund
Select US Long/Short Portfolio
Unconstrained Bond Fund
MULTI-ASSET
All Market Income Portfolio
All Market Total Return Portfolio
Conservative Wealth Strategy
Emerging Markets Multi-Asset Portfolio
Global Risk Allocation Fund
Tax-Managed All Market Income Portfolio
TARGET-DATE
Multi-Manager Select Retirement Allocation Fund
Multi-Manager Select 2010 Fund
Multi-Manager Select 2015 Fund
Multi-Manager Select 2020 Fund
Multi-Manager Select 2025 Fund
Multi-Manager Select 2030 Fund
Multi-Manager Select 2035 Fund
Multi-Manager Select 2040 Fund
Multi-Manager Select 2045 Fund
Multi-Manager Select 2050 Fund
Multi-Manager Select 2055 Fund
Multi-Manager Select 2060 Fund
CLOSED-END FUNDS
AllianceBernstein Global High Income Fund
AllianceBernstein National Municipal Income Fund
We also offer Government Money Market Portfolio, which serves as the money market fund exchange vehicle for the AB mutual funds. You could lose money by investing in the Fund. Although the Fund seeks to preserve the value of your investment at $1.00 per share, it cannot guarantee it will do so. The Fund may impose a fee upon sale of your shares or may temporarily suspend your ability to sell shares if the Fund’s liquidity falls below required minimums because of market conditions or other factors. An investment in the Fund is not insured or guaranteed by the Federal Deposit Insurance Corporation or any other government agency. The Fund’s sponsor has no legal obligation to provide financial support to the Fund, and you should not expect that the sponsor will provide financial support to the Fund at any time.
Investors should consider the investment objectives, risks, charges and expenses of the Fund carefully before investing. For copies of our prospectus or summary prospectus, which contain this and other information, visit us online at www.abfunds.com or contact your AB representative. Please read the prospectus and/or summary prospectus carefully before investing.
| 1 | Prior to July 12, 2019, Total Return Bond Portfolio was named Intermediate Bond Portfolio; prior to February 5, 2020, Tax-Aware Fixed Income Opportunities Portfolio was named Tax-Aware Fixed Income Portfolio. |
| | |
| |
| 104 | AB EMERGING MARKETS MULTI-ASSET PORTFOLIO | | abfunds.com |
NOTES
| | |
| |
| abfunds.com | | AB EMERGING MARKETS MULTI-ASSET PORTFOLIO | 105 |
NOTES
| | |
| |
| 106 | AB EMERGING MARKETS MULTI-ASSET PORTFOLIO | | abfunds.com |
NOTES
| | |
| |
| abfunds.com | | AB EMERGING MARKETS MULTI-ASSET PORTFOLIO | 107 |
NOTES
| | |
| |
| 108 | AB EMERGING MARKETS MULTI-ASSET PORTFOLIO | | abfunds.com |
AB EMERGING MARKETS MULTI-ASSET PORTFOLIO
1345 Avenue of the Americas
New York, NY 10105
800 221 5672
EMMA-0151-0320 
(a) The registrant has adopted a code of ethics that applies to its principal executive officer, principal financial officer and principal accounting officer. A copy of the registrant’s code of ethics is filed herewith as Exhibit 12(a)(1).
(b) During the period covered by this report, no material amendments were made to the provisions of the code of ethics adopted in 2(a) above.
(c) During the period covered by this report, no implicit or explicit waivers to the provisions of the code of ethics adopted in 2(a) above were granted.
| ITEM 3. | AUDIT COMMITTEE FINANCIAL EXPERT. |
The registrant’s Board of Directors has determined that independent directors Garry L. Moody and Marshall C. Turner, Jr. qualify as audit committee financial experts.
| ITEM 4. | PRINCIPAL ACCOUNTANT FEES AND SERVICES. |
(a) - (c) The following table sets forth the aggregate fees billed by the independent registered public accounting firm Ernst & Young LLP, for the Fund’s last two fiscal years for professional services rendered for: (i) the audit of the Fund’s annual financial statements included in the Fund’s annual report to stockholders; (ii) assurance and related services that are reasonably related to the performance of the audit of the Fund’s financial statements and are not reported under (i), which include advice and education related to accounting and auditing issues and quarterly press release review (for those Funds which issue press releases), and preferred stock maintenance testing (for those Funds that issue preferred stock); and (iii) tax compliance, tax advice and tax return preparation.
| | | | | | | | | | | | | | | | |
| | | | | | Audit Fees | | | Audit-Related
Fees | | | Tax Fees | |
AB Emerging Market Multi-Asset | | | 2019 | | | $ | 57,769 | | | $ | - | | | $ | 46,602 | |
| | | 2020 | | | $ | 57,769 | | | $ | - | | | $ | 28,577 | |
(d) Not applicable.
(e) (1) Beginning with audit andnon-audit service contracts entered into on or after May 6, 2003, the Fund’s Audit Committee policies and procedures require thepre-approval of all audit andnon-audit services provided to the Fund by the Fund’s independent registered public accounting firm. The Fund’s Audit Committee policies and procedures also requirepre-approval of all audit andnon-audit services provided to the Adviser and Service Affiliates to the extent that these services are directly related to the operations or financial reporting of the Fund.
(e) (2) All of the amounts for Audit Fees, Audit-Related Fees and Tax Fees in the table under Item 4 (a) – (c) are for servicespre-approved by the Fund’s Audit Committee.
(f) Not applicable.
(g) The following table sets forth the aggregatenon-audit services provided to the Fund, the Fund’s Adviser and entities that control, are controlled by or under common control with the Adviser that provide ongoing services to the Fund:
| | | | | | | | | | | | |
| | | | | | All Fees for Non-Audit Services Provided to the Portfolio, the Adviser and Service Affiliates | | | Total Amount of
Foregoing Column Pre-approved
by the Audit Committee
(Portion Comprised of Audit
Related Fees)
(Portion Comprised of Tax Fees) | |
AB Emerging Market Multi-Asset | | | 2019 | | | $ | 523,870 | | | $ | 46,602 | |
| | | | | | | | | | $ | - | |
| | | | | | | | | | $ | (46,602 | ) |
| | | 2020 | | | $ | 934,113 | | | $ | 28,577 | |
| | | | | | | | | | $ | - | |
| | | | | | | | | | $ | (28,577 | ) |
(h) The Audit Committee of the Fund has considered whether the provision of anynon-audit services notpre-approved by the Audit Committee provided by the Fund’s independent registered public accounting firm to the Adviser and Service Affiliates is compatible with maintaining the auditor’s independence.
| ITEM 5. | AUDIT COMMITTEE OF LISTED REGISTRANTS. |
Not applicable to the registrant.
Please see Schedule of Investments contained in the Report to Shareholders included under Item 1 of this FormN-CSR.
| ITEM 7. | DISCLOSURE OF PROXY VOTING POLICIES AND PROCEDURES FORCLOSED-END MANAGEMENT INVESTMENT COMPANIES. |
Not applicable to the registrant.
| ITEM 8. | PORTFOLIO MANAGERS OFCLOSED-END MANAGEMENT INVESTMENT COMPANIES. |
Not applicable to the registrant.
| ITEM 9. | PURCHASES OF EQUITY SECURITIES BYCLOSED-END MANAGEMENT INVESTMENT COMPANY AND AFFILIATED PURCHASERS. |
Not applicable to the registrant.
| ITEM 10. | SUBMISSION OF MATTERS TO A VOTE OF SECURITY HOLDERS. |
There have been no material changes to the procedures by which shareholders may recommend nominees to the Fund’s Board of Directors since the Fund last provided disclosure in response to this item.
| ITEM 11. | CONTROLS AND PROCEDURES. |
(a) The registrant’s principal executive officer and principal financial officer have concluded that the registrant’s disclosure controls and procedures (as defined in Rule30a-2(c) under the Investment Company Act of 1940, as amended) are effective at the reasonable assurance level based on their evaluation of these controls and procedures as of a date within 90 days of the filing date of this document.
(b) There were no changes in the registrant’s internal controls over financial reporting that occurred during the second fiscal quarter of the period that has materially affected, or is reasonably likely to materially affect, the registrant’s internal control over financial reporting.
| ITEM 12. | DISCLOSURE OF SECURITIES LENDING ACTIVITIES FORCLOSED-END MANAGEMENT INVESTMENT COMPANIES. |
Not applicable to the registrant.
The following exhibits are attached to this FormN-CSR:
SIGNATURES
Pursuant to the requirements of the Securities Exchange Act of 1934 and the Investment Company Act of 1940, the registrant has duly caused this report to be signed on its behalf by the undersigned, thereunto duly authorized.
| | |
| (Registrant): AB Cap Fund, Inc. |
| |
| By: | | /s/ Robert M. Keith |
| | Robert M. Keith |
| | President |
| |
| Date: | | May 29, 2020 |
Pursuant to the requirements of the Securities Exchange Act of 1934 and the Investment Company Act of 1940, this report has been signed below by the following persons on behalf of the registrant and in the capacities and on the dates indicated.
| | |
| By: | | /s/ Robert M. Keith |
| | Robert M. Keith |
| | President |
| |
| Date: | | May 29, 2020 |
| | |
| By: | | /s/ Joseph J. Mantineo |
| | Joseph J. Mantineo |
| | Treasurer and Chief Financial Officer |
| |
| Date: | | May 29, 2020 |